crop protection programme epidemiology, vector
TRANSCRIPT
CROP PROTECTION PROGRAMME
Epidemiology, vector studies and control of Banana streakvirus in East African highland bananas
R7529 (ZA0365)
FINAL TECHNICAL REPORT
1st February 2000 – 31st March 2003
Natural Resources Institute – University of GreenwichNational Agricultural Research Organisation – Uganda
University of Reading – Reading, UK
Date FTR completed: 15 July 2003
This publication is an output from a research project funded by the UnitedKingdom Department for International Development (DFID) for the benefit ofdeveloping countries. The views expressed are not necessarily those ofDFID. [R7529 Crop Protection Programme]
ii
Project details
Title of project: Epidemiology, vector studies and control of banana streak virus inEast Africa highland bananas.
R Number: R7529
Project leader: Lawrence Kenyon
Institution: Natural Resources Institute
CPP Production System: High Potential
CPP Purpose: HP1. Yields improved and sustainability enhanced in highpotential cropping systems by cost effective reduction inlosses due to pests.
Commodity base: Bananas and Plantains
Beneficiaries: Banana growers and consumers in Uganda/East Africa.
Target Institutions: NARO, Kawanda, Namulonge, INIBAP, BARNESA,IITA/ESARC, Makerere University
Geographic focus: East Africa; Uganda (but findings are likely to be applicablemore widely)
Project Partners
Natural ResourcesInstitute
Lawrence Kenyon, Timothy Chancellor, Richard Lamboll,(Nawshad Joomun MSc Student)
Uganda National BananaResearch Programme
Wilberforce Tushemereirwe, Jerome Kubiriba, CharlesMurekezi, Dezi Ngambeki
University of Reading Tim Wheeler, Ermias Kebreab, Simon Gowen, SavitriAbeyasekera
International Institute ofTropical Agriculture
James Legg (and NRI), Jackie Hughes, Philip Ragama,Suluman Okech
iii
Executive Summary
Before the start of this project, Banana streak virus (BSV) had been reported as being anincreasingly important constraint to the cultivation of East African highland bananas incertain areas of Uganda. However, little was known about the epidemiology of the diseaseor its effect on the growth and productivity of banana plants.
Monitoring virus-indexed plants planted in small plots within areas of relatively high BSVincidence in Ntungamo and Rakai districts confirmed that there is natural, vectored,spread of BSV in the field in Uganda. The rate of spread appeared to be location andseason-dependent, while the pattern of incidence in a larger planting of the local variety“Kisansa” in Rakai suggested that both longer distance primary spread and short-distance secondary spread (to near neighbours) occurred. Mealybugs were identified asthe most likely vector of BSV and several different species were found colonising bananaplants in Uganda; a key to the identification of the mealybugs found on banana plants inAfrica was developed. Controlled transmission experiments have so far indicated thatnymphs of a Planococcus species and Dysmicoccus brevipes cultured from banana onpumpkin fruits are capable of transmitting a strain of BSV (from Kawanda) from bananato banana. Associated work under project R7478 revealed that there are at least 12different strains or species of BSV Badnavirus infecting banana in Uganda, and it ispossible that these have different vector species specificities.
Data collected on the physiology and growth of bananas in trials at Kawanda and Mbararaindicates that even in the mother crop, infection with BSV can cause a significantreduction in photosynthetic ability and a consequent reduction in productivity (yield andquality). In these trials, providing good crop management generally resulted in adecrease in symptom severity in infected plants, and where symptoms were mild, goodmanagement gave a significant increase in yield. The indications are that this trend willbe even more pronounced in subsequent crops (ratoons) from these trials. Thesefindings were supported by observations from farmers' fields in Ntungamo wheresymptoms were generally more severe and bunch weights were generally smaller wherethe plants were less well cared for and under greater stress. Different farmermanagement practices also appeared to have an effect on mealybug abundance(average numbers of colonies per plant), but so far no association has been observedbetween mealybug prevalence and BSV incidence (proportion of plants infected).
Responses to a rapid rural appraisal questionnaire revealed that most banana growers inregions where BSV is present recognise and can accurately describe the symptoms, buttend to associate them with causes such as poor soils, drought and weevil infestationrather than with a viral cause. They thus tend to use inappropriate measures to try tocontrol the symptoms. Most farmers obtained their agricultural information from localextension services, although neighbouring farmers, the radio and the church were alsoregular sources of information. Many farmers said that they would rogue plants with BSVsymptoms, though this appears to be a practice of last resort.
The results from these studies indicate the potential benefit of simple culturalmanagement practices in reducing the spread and mitigating the effects of BSV, andhence of improving banana productivity in parts of Uganda. The conclusions provide afoundation for developing strategies to combat the impact of BSV, but further work isrequired to determine which combinations of the cultural practices are most beneficialand under which circumstances.
iv
Contents
EXECUTIVE SUMMARY..............................................................................................III
BACKGROUND............................................................................................................. 1
PROJECT PURPOSE .................................................................................................. 2
RESEARCH ACTIVITIES ............................................................................................ 2
Activity 1: BSV epidemiology and vectors.............................................................2
Activity 2: Stress and BSV activation and expression.........................................4
Activities 3 & 4: Management Effects on BSV, Physiology and Growth............4
Activities 5 & 6: Benchmark sites and Socio-economic aspects........................5
Activity 7: Strengthening capacity. .........................................................................6
Additional activity: BSV diagnosis and variability..................................................6
OUTPUTS....................................................................................................................... 7
Output 1: BSV epidemiology and vectors ..............................................................7
Output 2: Stress and BSV activation and expression. .........................................8
Outputs 3 & 4: Management Effects on BSV, Physiology and Growth..............8
Output 5 & 6: Benchmark sites and Socio-economic aspects...........................11
Output 7: Strengthening Capacity.........................................................................11
Additional Output: BSV diagnosis and variability................................................12
CONTRIBUTION OF OUTPUTS TO DEVELOPMENTAL IMPACT ..................13
Project publications/outputs..................................................................................14
BIOMETRICIANS SIGNATURE................................................................................15
REFERENCES ............................................................................................................16
Associated Annexes
1. Epidemiology of Banana streak virus (BSV) in East African Highland Bananas(Kubiriba Tushemereirwe and Kenyon)
2. Identification of mealybugs on banana and plantain in Africa (Watson and Kubiriba,2003?)
3. Impact of Banana streak virus on the growth and yield of banana var. CavendishWilliams (Musa AAA) and var. Mbwazirume (Musa AAA-EA) (Wheeler, Murekezi,Gowen, Kebreab and Tushemereirwe.)
4. Effect of farmers’ cultural practices on Banana streak virus (BSV) expression inNtungamo (Murekezi and Kubiriba)
5. Farmer knowledge and perceptions of Banana streak virus on East African highlandbananas in villages with relatively high BSV incidence in south-western Uganda(Ngambeki, Kubiriba, Murekezi, Ragama and Lamboll)
6. Baseline survey report: Banana streak virus on East African Highland bananas insouth and western Uganda (Ngambeki, Kubiriba, Murekezi and Ragama)
7. Detection of BSV in Ugandan bananas (Kubiriba, Joomun and Kenyon)
1
BackgroundInformation should include a description of the importance of the researchable constraint(s) that the project sought toaddress and a summary of any significant research previously carried out. Also, some reference to how the demandfor the project was identified.
At the start of this project, banana streak disease was becoming an important constraintto banana and plantain production in many banana growing regions of the world.Symptoms indicative of the disease had first been described from Côte d’Ivoire in 1979(Lassoudière, 1979), though the causal agent, Banana streak virus (BSV; genusBadnavirus) was only identified in 1986 (Lockhart, 1986).
Banana streak has become an emotive issue in East Africa, and especially in Ugandawhere the disease had been called the ‘AIDS of banana’ in the national press. Anepidemic was reported and studied in the Rakai District in the south of Uganda(Tushemereirwe et al., 1996). The causes of this sudden epidemic were unclear, butone suggestion was that it was associated with very poor plant husbandry as a result ofhigh incidence of HIV/AIDS in the local human population, which had drastically reducedthe labour force able to tend the banana plants.
Badnaviruses had been characterised as having non-enveloped bacilliform particles(120-150 x 30 nm) containing a circular double-stranded DNA genome (Lockhart, 1990)7.4 - 7.8 kb in size. As well as BSV, definitive members of the group then includedCacao swollen shoot virus (CSSV), Rice tungro bacilliform virus (RTBV), Commelinayellow mottle virus (CoYMV), Canna yellow mottle virus (CaYMV), Dioscorea bacilliformvirus (DBV), Sugarcane bacilliform virus (ScBV), Piper yellow mottle virus (PYMV),Kalanchoë top-spotting virus (KTSV) and Schefflera ringspot virus (SRV). It had beenobserved that many of the badnaviruses occurred in clonally propagated tropical cropsand were probably most usually spread in nature by vegetative propagation of the host.However, transmission in a semi-persistent manner by mealybug (Pseudococcidae)vectors had also been demonstrated for several viruses in the group (Lockhart et al.,1997), with the exception of RTBV, which is transmitted by the leafhopper Nephotettixvirescens and some other Neohotettix species (Hibino, 1983). A partial purification ofBSV had been mechanically (sap) transmitted to sugarcane where it induced nosymptoms (Lockhart & Autrey, 1988). BSV had also been transmitted under controlledconditions using the citrus mealybug (Planococcus citri) and the sugarcane mealybug(Saccharicoccus sacchari) in USA (Lockhart & Olszewski, 1993), and the Philippines(Magnaye & Herradura, pers. com.), and in Taiwan by Pseudococcus comstocki (Su,1998). However, vector transmission had not been substantiated with mealybugs inAfrica or in the field.
In their attempt to develop sensitive PCR-based diagnostic tools for BSV (as part of aGatsby Charitable Foundation project) for use in screening IITA’s Black Sigatoka-resistant hybrids, Thottappilly et al (1998) and Harper et al (1999a), had found that WestAfrican BSV-like DNA sequences were detectable in a high proportion of the breedinglines and progeny (LaFleur et al, 1996, Harper et al, 1999b). This severely restrictedIITA’s dissemination of improved germplasm. Subsequently it was shown that BSV-likesequences are integrated into the genomes of most, if not all, Musa genotypes(Ndowora et al, 1999). While integrated, these sequences cause no symptoms in thehost, but it was suspected that some of the integrated forms could be activated(probably by some form of stress) to give rise to episomal BSV that then induced thecharacteristic disease symptoms. Symptom expression of BSV in field plantings wasalso thought to be influenced by climate (temperature, rainfall), plant nutrient status andcrop management. For example, water stress and cool temperatures were suspectedto be the cause of localised outbreaks of BSV. However, there was a lack of

2
information on precisely how symptom expression was related to poor conditions forcrop growth, and whether symptoms could be countered using appropriate cropmanagement. The mechanism of the activation of integrated forms was the subject oflab-based research funded by the Gatsby Charitable Foundation at the John InnesCentre (JIC, Norwich).
The rationale behind this project was that, if the interaction between BSV spread andsymptom expression and crop-growing conditions could be better understood, then low-cost/sustainable technologies that would moderate symptom expression or reduce therate of spread, and hence reduce the losses caused, might be identified. While a lot ofresources were being spent on detailed molecular studies (at JIC and at the Universityof Minnesota), there was a dearth of information on the epidemiology of the disease, itseffect on yield under different management regimes and its interaction with stressesand other pests and diseases.
Project PurposeThe purpose of the project and how it addressed the identified development opportunity or identified constraint todevelopment.
High Potential 1.9: The role of insect vectors in the epidemiology and ecology of bananastreak virus disease determined and integrated disease management strategiesdeveloped and promoted.
High Potential 1.11: Virus diseases of banana, cassava, yam, sweet potato, Solanumpotato and food legumes characterised and improved methods for diagnosis andmanagement of virus diseases developed and promoted.
The purpose of this project was to gain a better understanding of the epidemiology andecology of Banana streak virus disease, and its importance and effect on bananaproduction in Uganda. The role of insect vectors in the spread of the virus in the fieldwas explored, and putative vector species were identified. By focusing on the Ugandanbanana benchmark sites, some of the factors influencing BSV symptom expressionwere determined and yield loss under different conditions was quantified. Using thisinformation, cropping practices that could limit the spread of BSV and reduce the effectof the virus on productivity have been identified.
Research ActivitiesThis section should include detailed descriptions of all the research activities (research studies, surveys etc.)conducted to achieve the outputs of the project. Information on any facilities, expertise and special resources used toimplement the project should also be included. Indicate any modification to the proposed research activities, andwhether planned inputs were achieved.
Activity 1: BSV epidemiology and vectorsA clear understanding of whether BSV spreads naturally under field conditions inUganda and, if it does, an indication of which vector species is/are the most effective attransmitting the disease.Activity 1.1 Determine if there is natural (vectored) spread of BSV, and if so,determine the rate and pattern of spread.Activity 1.2 Assess the rate of spread of BSV in farmers' fields in differentlocations into small blocks of clean plants.
3
By the start of this project, it had been demonstrated under laboratory conditions that aswell as being perpetuated through vegetative propagation of the host plants, BSV couldalso be transmitted between plants in the lab using mealybug nymphs as vectors(Lockhart & Olszewski, 1993). However, there was no evidence that vectored spreadwas regularly occurring in the field since the distribution of infected plants in a field couldhave arisen from the planting of infected suckers, or from the activation of BSVsequences integrated in the host plant genome. Thus, the first two activities for thisoutput were aimed to determine if vectored spread of the virus could be detected in thefield in Uganda. Both activities used the Cavendish dessert banana c.v. “Williams”which had already been shown to be very susceptible to BSV in the laboratory, butwhich was believed not to contain activatable integrated BSV sequences.
Because so little was known about the vectored spread of BSV in Uganda at the start ofthe project, the expectation that “the rate and pattern of spread” could be determinedwas over-ambitious given the financial and time limitations of the project. Thus, activity1.1 was limited to two on-station plantings (one at Kawanda and another at Mbarara) tosee if BSV would spread out from a central block of infected plants into the surroundingplants of BSV-indexed “Williams”. Activity 1.2 consisted of planting a small block (4 x 4plants) of virus-indexed “Williams” in each of four farms with relatively high incidence ofBSV in Kyangara village in Ntungamo district and a similar set of four blocks in Rakaidistrict, and monitoring for spread of BSV into each block from the surrounding plants(Annex 1 [Epidemiology Report]). Because mealybugs are the putative vectors of BSVin the field, their species and number on the plants in the trials were also monitored.
Activity 1.3 Identify the mealybug species present in banana plantings inUganda.Activity 1.4 Test if any of the mealybug species identified in 1.3 can transmit BSVunder controlled conditions.
By the start of this project, other workers had shown that strains of BSV from otherparts of the world could be transmitted between banana plants under laboratoryconditions using several different mealybug species. The aim of activities 1.3 and 1.4was to determine which, if any, of the mealybug species found colonising bananas inUganda might be responsible for transmitting BSV in the field in Uganda.
Samples of mealybugs were collected from banana plants in farms at various locationsin the main banana-growing regions of Uganda. Following clearing and mounting onmicroscope slides, the mealybugs were identified with taxonomic assistance from Dr.Gillian Watson (Natural History Museum, London). The information gained wascombined with previously published records of mealybugs identified from Musaspecies, and a taxonomic key for identifying the more common mealybugs found onbanana in Africa was developed (See Annex 2, Watson & Kubiriba 2003?).
Initial attempts to establish pure (single-species) cultures of mealybugs from banana onyoung banana plants at Kawanda and in controlled environment rooms in UK were notsuccessful. Later, following advice from Dr. John Thomas (QDPI, Brisbane, Australia)colonies were established from individual adult females on pumpkin fruits at Kawanda.Two simple screen-cages were constructed using local materials at the IITA farm atSendusu, near Namulonge. Transmission experiments where mealybug nymphs fromthese ‘pumpkin’ colonies were allowed an acquisition-feeding period on pot-grownbanana plants showing pronounced BSV symptoms, and were then transferred forinoculation feeding on virus-indexed test plants, were undertaken in the screenhouses.

4
Activity 2: Stress and BSV activation and expression.A better understanding of the role of different stresses on the activation of the virus andits symptom expression.
Activity 2.1 Investigate the influence of various stresses on BSV activation andsymptom expression in East African highland bananas.
When this activity was originally proposed, it was thought likely that there wereactivatable forms of BSV DNA sequences integrated in the genomes of East Africahighland (EA-AAA) bananas. There was also circumstantial evidence that the tissueculture procedure, hot-water treatment for nematode/disease control and the use ofnematicides in banana plantations might be sufficient stresses to promote the activationof integrated forms of BSV. The plan was thus to plant replicated trials in associationwith Dr. P. Speijer (IITA/Sendusu) to test the effect of these stresses.
Activities 3 & 4: Management effects on BSV, physiology and growth.Empirical data on the effect of climate on the disease, whether good management canalleviate the effects of the disease and restore yield to near normal and, based on thesefindings, formulation of a strategy for controlling, or at least managing, BSV in Uganda.The effects of BSV on the growth and yield of bananas quantified.
Activity 3.1 Trials at contrasting sites to assess the effect of minimal and good[optimal] crop management practices on BSV incidence and severity, and oncrop productivity.Activity 3.2 Experiments to elucidate the interactions between BSV [climate] andmanagement on crop productivity using modern physiological techniques toquantify resource use by the crops.
Part of the justification for this project was that there was circumstantial evidence thatBSV-infected plants growing under poor or stressed conditions showed more severedisease symptoms than diseased plants growing under better conditions. Thesuggestion was that poor conditions might increase the rate of spread of the diseaseand reduce the yield obtained from diseased plants by a greater proportion than they dofor non BSV-infected plants. Given that there is high prevalence of BSV infection insome areas and that farmers are generally reluctant to remove (rogue) infected plants,the question was then “is it likely to be economical viable (sustainable) not to rogueinfected plants but to improve cultural management to mitigate the effect of the virus?”The aims of the activities for Outputs 3 and 4 were primarily to measure how much BSVaffected yield under good and minimal management and to explore how infection withBSV changes the physiology of the plant to cause that reduction in productivity. BSVcan display a wide range of different symptoms in the different plant parts, at differentstages in the plant growth and in different Musa genotypes (Daniells et al 1999). Since“symptom duration x symptom severity” is likely to be related to extent of yield reduction,these trials were also used to try to develop an easily usable and reliable symptomseverity index (SSI) that might be used to predict likely yield reduction under differentconditions in farmers’ fields.
Although the initial intention was to conduct these trials at three sites with contrastingclimates, the cost and logistics meant that the planned trial at the higher altitude site atMbale on the lower slopes of Mt Elgon (Eastern Uganda) had to be abandoned and thetrials were only planted at Kawanda and Mbarara stock farm (thus excluding the climateeffect). Also, the original plan was to compare the effect of management on plants of
5
c.v. “Mbwazirume” that had tested negative for BSV by ELISA (Mbz-) with plants of thesame variety that had tested positive by ELISA (Mbz+). However, once the trials hadbeen established it became apparent that the ELISA testing had not been reliable (Seeadditional activity below, and Annex 7 [Diagnostics Report]) since similar numbers ofplants from both treatments showed symptoms of being infected with BSV.
4.1 On station field trial to determine the effects of disease incidence andseverity on the growth, development and yield of local landraces and improvedbanana varieties.
Observations from advanced comparative agronomic trials of local landraces with thenew Musa hybrids emanating from the breeding programmes in East and West Africaand Central America indicated that some of these lines were more susceptible toinfection by BSV and developed more severe symptoms than others. This activity wasto be a more systematic study of these apparent differences to see if diseasephenotype could be associated with particular parental genotype or morphological/agronomic characteristics of the banana varieties. It was to be led by Dr Vuylsteke, butfollowing Dr Vuylsteke’s tragic death in January 2000, it was not taken forward asoriginally envisaged. However, discussion between project partners resulted inactivities 3.2 and 4.2 being expanded in order to incorporate some of the objectives ofthis trial.
4.2 Use a benchmark site to obtain more information on the effect of culturalpractices on BSV disease progression and yield.
This activity builds on work already established (by NARO and IITA) at the Ntungamobenchmark site to look at the effect of management practices on banana weevilincidence and damage severity (e.g. Ssali et al., 2003). The aim was to assess if anyassociation between particular farmer crop management practices and incidence orseverity of BSV infection could be demonstrated. Sixty farms in Ntungamo wereassessed for BSV incidence and symptom severity; and each was classified as havinga low, medium or high level of cultural management (using a scoring system adaptedfrom the weevil studies). Thirty farms (10 from each management level) were thenselected, and 40 plants in each farm marked. The variety name of each plant wasrecorded. These plants were assessed at regular intervals for BSV symptom severityand presence of mealybug colonies, and any changes in seven features of themanagement in each farm were also recorded. This activity involved some participationby the farmers, who kept records of bunch weights. (See Annex 4 [Ntungamo report]).
Activities 5 & 6: Benchmark sites and Socio-economic aspects.Benchmark sites maintained and managed, and producing valid/reliable results fromon-farm trials.Base-line data on the socio-economic aspects and consequences of BSV and of theproject.
Activity 5.1 Co-ordination of banana benchmark site activities.Activity 6.0 Socio-economic and biometric study/survey to assess farmers'perceptions of BSV and strategies that might be used to control it.
Drs S Okech and D Ngambeki (both part-funded from this project) were responsible forco-ordination of activities at Mbarara/ Bushenyi/ Ntungamo and Luwero/ Masaka
6
benchmark sites, respectively. As well as benchmark site activities, Dr Okech was alsoinvolved with activities 1.1, 1.2, 3.1 and 6. Dr Ngambeki led activity 6.
A survey questionnaire to determine farmers’ perceptions and understanding of BSVand the measures they might use to control it was developed and tested at 30 farms inRakai district. Based on the findings at Rakai, the questionnaire was modified and usedon 30 farms in Ntungamo and 30 in Masaka. Focus group discussions on the sametheme were also held in Ntungamo and Masaka. (See Annex 4 [Survey Report] andAnnex 5 [Focus Group Discussion Report]). At the same time as the sociologicalsurvey was being carried out, the crop management practices, BSV incidence andseverity and mealybug abundance were also recorded for each farm surveyed.
Activity 7: Strengthening capacity.Strengthening of the Ugandan national programme’s capacity for plant virusepidemiology/vector research and disease management.
Research into combating pest and disease constraints to banana production is a majorpart of the work carried out by the Uganda National Banana Research Programme ofNARO. Because it had only started emerging as an important constraint to bananaproduction relatively recently, and because of its apparent complexity in terms of strainvariability and vector specificity, studies on BSV in the field had been relatively limited.Part of the aim of this project was to build up the capacity within the UNBRP to carry outhigh quality research to understand the ecology of the virus and its vector and todevelop sustainable control practices against it.
Additional activity: BSV diagnosis and variability.
Prior to development of the proposal for this project, antisera had been developed at IITA(Nigeria) that appeared to work reliably in detecting BSV in the Nigerian Musa breedinglines and hybrids (Dahal et al., 1998). Since it was anticipated that these would alsowork in Uganda, IITA were contracted to provide sufficient antiserum and reagents foruse in this project (R7529). However, since it was known that in other areas BSV (andother badnaviruses) are very variable serologically (Lockhart and Olszewski, 1993), asister project (R7478) was established with the John Innes Centre (JIC) to assess themolecular variability of the virus in Uganda. If needed, JIC would develop a diagnosticmethod for use in the epidemiology or transmission studies in Uganda.
It soon became apparent that the IITA antisera were giving inconsistent and unreliableresults when used for virus-indexing Ugandan banana plants. Later, the JIC projectshowed that there are at least 12 different Badnavirus species associated with bananastreak in Uganda and it is this high level of variability that led to the unreliability of the IITA(and other sources of antiserum) for detecting Ugandan BSV strains. Project R7478then developed some protocols based on the Polymerase Chain Reaction (PCR) formore reliably detecting Badnavirus species/strains (Hull and Harper, 2001). However,these protocols required further development and adaptation to be useful in theUgandan situation (See Annex 7 [Diagnostics report]).
7
OutputsThe research results and products achieved by the project. Were all the anticipated outputs achieved and if not whatwere the reasons? Research results should be presented as tables, graphs or sketches rather than lengthy writing,and provided in as quantitative a form as far as is possible.
Output 1: BSV epidemiology and vectorsA clear understanding of whether BSV spreads naturally under field conditions inUganda and, if it does, an indication of which vector species is/are the most effective attransmitting the disease.
As yet, no movement of BSV has been observed in the on-station BSV-spread trials atKawanda and Mbarara (See Annex 1 [Epidemiology report]). However, in Ntungamo, 11of the 16 plants in one of the small blocks of virus-indexed c.v. “Williams” was infectedwith BSV within about 6 months of planting, while in the same period in the other threesmall blocks 1, 2 and 2 plants are now showing symptoms of infection. In Rakai, justone plant in one of the four blocks is now infected. These results indicate that there isvectored spread of BSV at some locations in Uganda. The observation that therehas been a gradual increase in the number of BSV-infected plants in the block of 23 x23 c.v. “Kisansa” planted in Rakai in 1998 further supports this. The first infection in thisblock was not observed until three years after planting and the incidence is now still onlyabout 7%; while in Kyangera village, Ntungamo, infection was seen within six months.This indicates that the rate of spread is location-specific and probably depends onseveral factors. These factors could include: how much disease is already present atthe location, the climatic conditions present and cultivation practices employed, thevarieties of banana grown, the numbers and species of mealybug present and whatstrains/species of BSV are present.
The four mealybug genera most often collected from banana plants in Uganda were aDysmicoccus sp. (identified as a putative vector of BSV by Kubiriba et al 2001a), aPlanococcus sp. (Pl. citri was identified as a vector of BSV in the laboratory by Lockhartand Olszewski (1993)) a Paracoccus sp. and a Pseudococcus sp. (Ps. comstocki wasidentified as a vector of BSV in the lab in Taiwan by Su (1998)). In all, twenty mealybugspecies were included in the identification key as having been collected from Musaplants in Uganda, or from there being reference to their collection from Musa plantselsewhere in Africa. A manuscript on this has been prepared and submitted to theJournal African Entomology (See Annex 2 [Watson and Kubiriba 2003?]).
A culture of each of Dysmicoccus brevipes, a Planococcus sp. and a Pseudococcussp., originally collected from banana plants, were established on pumpkin fruits atKawanda Research Institute towards the end of this project. Second instar nymphsfrom these colonies were used in preliminary transmission experiments to test if theycould transmit BSV from infected c.v. “Mbwazirume” plants to healthy c.v. "Williams"test plants. So far, transmission has only been observed in one experiment usingnymphs of the Planococcus sp. and in one experiment using Dysmicoccus brevipesnymphs (See Annex 1 [Epidemiology Report]). These experiments should be repeatedwith these two mealybug species and the Pseudococcus sp. to obtain more conclusiveinformation. During the course of this project, the sister project R7478 (Hull and Harper2001) showed that there are at least 12 different quasi-species of Badnavirus infectingbanana in Uganda (Harper et al., 2002), and it may be that these have different vectorspecies specificities. It would be interesting to test the ability of each of the mealybugcultures to transmit each of these Badnavirus species.
8
Output 2: Stress and BSV activation and expression.A better understanding of the role of different stresses on the activation of the virus andits symptom expression.
The trials to investigate the role of stress in virus activation and symptom expressionwere not set up owing to the tragic death of Dr Speijer in January 2000. However, morerecent results from the sister project (R7478, John Innes Centre) indicated that thoughthere are Badnavirus-like sequences integrated into the Musa acuminata genome (EAHighland bananas are triploid M. acuminata [AAA]), the sequences cannot be activated(excised and recombined) to give rise to infective episomal forms of the virus. Thus,the research question had been answered and this activity was not taken forward. (NB.This finding makes us more confident that the infections observed in the block of c.v.“Kisansa” in Rakai (Activity 1.2 above) are due to spread of the virus by a vector).
Outputs 3 & 4: Management Effects on BSV, Physiology and Growth.Empirical data on the effect of (climate on) the disease, whether good management canalleviate the effects of the disease and restore yield to near normal and, based on thesefindings, formulation of a strategy for controlling, or at least managing, BSV in Uganda.The effects of BSV on the growth and yield of bananas quantified.
In the on-station trials at Kawanda and Mbarara to explore the effect of cropmanagement on BSV and banana productivity (See Annex 3 [Physiology Report]), BSVsymptoms in the local East African Highland c.v. “Mbwazirume” growing under optimalmanagement (with mulch and fertiliser) were less frequent and less severe comparedto those found in plants grown under a minimal management regime (infrequentweeding and pruning). BSV disease development (measured as area under thedisease symptom progression curve) for infected plants was reduced by between 25 –58% under optimal management in the mother crop and first ratoon crop. Optimalmanagement increased bunch weights by 62% and 51% in the mother plant crop atKawanda and Mbarara, respectively. In the first ratoon crop, at Kawanda, bunchweights were increased by 106%. BSV reduced bunch weights by 1.2 % under optimalmanagement and by 13.5% under minimal management in the mother plant crop atMbarara. At Kawanda, BSV reduced bunch weights by 16.6% under optimalmanagement compared with 22.8% under minimal management in the mother plantcrop. In the first ratoon crop, BSV reduced bunch weights under optimal managementby almost the same magnitude as in the mother crop. Under minimal management,however, bunch weights were reduced by 29%, a further reduction compared to themother plant crop. This indicated that the effects of BSV on crop productivity and thedifference between optimal and minimal management could increase with successivecrop cycles.
The effects of BSV on important growth and development processes were alsoassessed (See Annex 3 [Physiology Report]). Results showed that BSV reduced therate of leaf photosynthesis, biomass accumulation and growth, and increased theduration of development stages of East African Highland bananas. Therefore, BSVreduced the productivity of banana grown under Ugandan conditions. The negativeimpact of BSV on bunch yield reported here is greater than previously reported for well-fertilised and irrigated conditions in Australia (Daniells et al. 2001), and tended to begreater under minimal compared with optimal management.
The effect of farmers’ cultural practices on BSV symptom expression, mealybugabundance and BSV effects on growth and bunch weight was also explored in farmers’banana fields at Ntungamo, southwestern Uganda (See Annex 4 [Ntungamo Report]).Farmers commonly used one or a combination of seven different cultural practices intheir management of their banana crops. These practices were 1) provision of soil and
9
water conservation structures (water bunds), 2) application of an organic mulch, regulardesuckering, regular detrashing, manure application, regular weeding and intercroppingor monocropping.
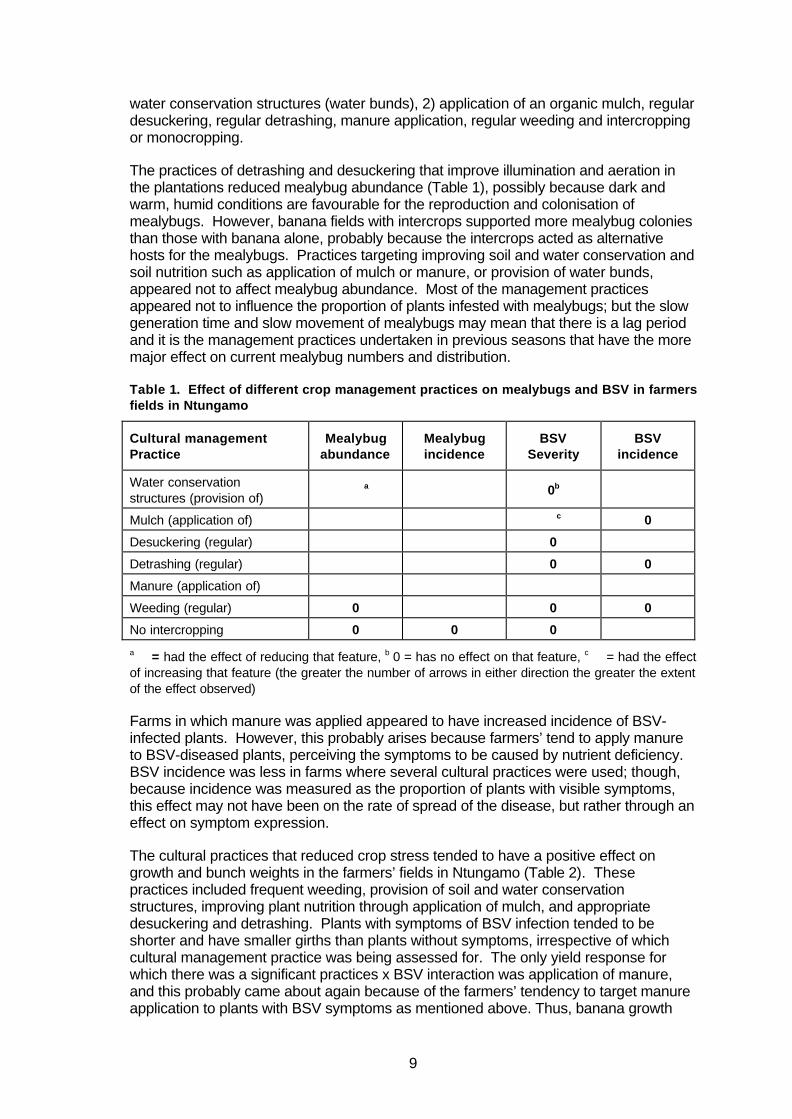
The practices of detrashing and desuckering that improve illumination and aeration inthe plantations reduced mealybug abundance (Table 1), possibly because dark andwarm, humid conditions are favourable for the reproduction and colonisation ofmealybugs. However, banana fields with intercrops supported more mealybug coloniesthan those with banana alone, probably because the intercrops acted as alternativehosts for the mealybugs. Practices targeting improving soil and water conservation andsoil nutrition such as application of mulch or manure, or provision of water bunds,appeared not to affect mealybug abundance. Most of the management practicesappeared not to influence the proportion of plants infested with mealybugs; but the slowgeneration time and slow movement of mealybugs may mean that there is a lag periodand it is the management practices undertaken in previous seasons that have the moremajor effect on current mealybug numbers and distribution.
Table 1. Effect of different crop management practices on mealybugs and BSV in farmersfields in Ntungamo
Cultural managementPractice
Mealybugabundance
Mealybugincidence
BSVSeverity
BSVincidence
Water conservationstructures (provision of)
��a � 0b �
Mulch (application of) � �� �c 0
Desuckering (regular) � � 0 �
Detrashing (regular) �� �� 0 0
Manure (application of) � �� � ��
Weeding (regular) 0 ��� 0 0
No intercropping 0 0 0 ��
a � = had the effect of reducing that feature, b 0 = has no effect on that feature, c � = had the effectof increasing that feature (the greater the number of arrows in either direction the greater the extentof the effect observed)
Farms in which manure was applied appeared to have increased incidence of BSV-infected plants. However, this probably arises because farmers’ tend to apply manureto BSV-diseased plants, perceiving the symptoms to be caused by nutrient deficiency.BSV incidence was less in farms where several cultural practices were used; though,because incidence was measured as the proportion of plants with visible symptoms,this effect may not have been on the rate of spread of the disease, but rather through aneffect on symptom expression.
The cultural practices that reduced crop stress tended to have a positive effect ongrowth and bunch weights in the farmers’ fields in Ntungamo (Table 2). Thesepractices included frequent weeding, provision of soil and water conservationstructures, improving plant nutrition through application of mulch, and appropriatedesuckering and detrashing. Plants with symptoms of BSV infection tended to beshorter and have smaller girths than plants without symptoms, irrespective of whichcultural management practice was being assessed for. The only yield response forwhich there was a significant practices x BSV interaction was application of manure,and this probably came about again because of the farmers’ tendency to target manureapplication to plants with BSV symptoms as mentioned above. Thus, banana growth

10
and bunch weights were improved and the effects of BSV reduced in relativelyintensively managed farms. However, it was apparent that farmers’ mulching practicedid not reduce BSV disease severity or its effects bunch weight. This is contrary toobservations made of on-station experiments at Kawanda and Mbarara (See Annex 3[Physiology Report]) where application of mulch was a treatment. This disparity isprobably because farmers tend to apply less mulch than recommended. Thus, it maybe that other practices on the study farms in Ntungamo were not carried out sufficientlyfrequently or well for their full potential effect on BSV or productivity to be seen.
Table 2. Effect of cultural management practices and BSV on growth and yield ofbananas in farmers' fields in Ntungamo
Cultural managementPractice
Growthparameter
BSV effectPractice
effect
Interaction(practice x
BSV)
Height ��a ��b 0c
Girth �� �� 0Water conservationstructures (provision of)
Bunch wt. �� � 0
Heighta �� �� +d
Girth �� �� +Mulch (application of)
Bunch wt. 0 � 0
Heighta �� �� ++
Girth �� �� ++Desuckering (regular)
Bunch wt. �� 0 0
Heighta �� 0 0
Girth �� � 0Detrashing (regular)
Bunch wt. 0 � 0
Heighta � 0 +
Girth 0 0 +Manure (application of)
Bunch wt. �� 0 ++
Heighta �� �� +
Girth �� �� 0Weeding (regular)
Bunch wt. � �� 0
Heighta � 0 0
Girth � 0 0No intercropping
Bunch wt. 0 0 0
a � = had the effect of reducing that feature, b 0 = has no effect on that feature, c � = had the effectof increasing that feature (the greater the number of arrows in either direction the greater the extentof the effect observed), d + = significant interaction
Nonetheless, the results from these studies indicate the potential benefit of alteredcultural practices in mitigating the effects of BSV and improving banana productivity inparts of Uganda. The conclusions provide a foundation for developing strategies tocombat the impact of BSV; but further work is required to determine which
11
combinations of the cultural practices are most beneficial and under whichcircumstances. For example, at which level of BSV severity do crop managementpractices cease to be beneficial; and under what circumstances would roguing ofinfected plants be the most beneficial and cost-effective option for control?
Output 5 & 6: Benchmark sites and Socio-economic aspectsBenchmark sites maintained and managed, and producing valid/reliable results fromon-farm trials.Base-line data on the socio-economic aspects and consequences of BSV and of theproject.
In the socio-economic survey in Rakai, Masaka and Ntungamo (See Annex 5 & 6),weevils were ranked by the farmers questioned as the most important constraint tobanana production. This was followed by "Yellowing of leaves/black spots on fruit/ heartof plant rotting" which was interpreted by the scientists on the survey team as being themanifestation of disease caused by BSV. The group discussions and questionnaireresponses showed that many farmers are aware of the most characteristic symptomsassociated with BSV infection and associate them with reduced yields. However, mostfarmers do not know the cause and often attribute the symptoms to weevil damage,drought or decline in soil fertility. Knowledge of BSV was greatest in areas of highestdisease incidence. The extension services were ranked as the most usual source ofcrop protection and banana cultivation information. However, there were significantdifferences between districts in ranking of other information sources; for example, fellowfarmers and family ranked as unimportant in Rakai but relatively important in Ntungamoand Masaka. This may be a result of the impact of the HIV/AIDS epidemic that hasremoved much of the working-aged adult population from Rakai. Radio ranked highlyacross all districts. In both the questionnaire survey and the focus group discussions,the farmers often cited roguing as a useful means for managing the disease signalledby BSV symptoms, although it was unclear how many were using this in practice.
The farms included in the survey were chosen because they had plants showingsymptoms of BSV infection present either in the farm or very close to the farm.Generally, the incidence of BSV was lower in the farms classed as having high levels ofmanagement. Although the incidence of plants with observable mealybugs and theaverage number of mealybugs observed on each plant were different for each farm,there was no obvious relationship between these numbers and farm management level.Similarly there was no obvious correlation between BSV incidence or severity andmealybug numbers or incidence.
Output 7: Strengthening CapacityStrengthening of the Ugandan national programme’s capacity for plant virusepidemiology/vector research and disease management.
Two Uganda banana research programme staff members, Jerome Kubiriba andCharles Murekezi, undertook the bulk of the epidemiology/vector studies and plantphysiology/crop management components of this project respectively, with guidanceand training from NRI, the University of Reading and IITA staff. They were registered forsplit-PhD programmes at University of Greenwich and University of Readingrespectively. They in turn trained banana programme technicians in a range ofprocedures including mealybug handling and identification, BSV symptom recognition,

12
and use of photosynthesis measurement equipment. Moses Ekwaro, a NARO plantpathology technician, received some training in molecular plant virus diagnostics whenthe immunocapture- polymerase chain reaction test for BSV (developed by the JohnInnes Centre project [R7478]) was adapted and transferred to Uganda.
Mr Nawshad Joomun, a University of Greenwich MSc (Natural Resources) student fromMauritius, conducted his research project on further developing and adapting thediagnostic tools for BSV in association with this project (Joomun, 2002).
Additional Output: BSV diagnosis and variability
Initial attempts to transfer the diagnostic procedures developed by project R7478 toUganda were not successful, probably because the PCR primers specified were notsufficiently universal and did not detect many of the strains of BSV Badnavirus presentin Uganda (See annex 7 [Diagnostics report]). Later a different pair of PCR primerswere developed (Yang et al. 2003) which were shown to be less Badnavirusstrain/species-specific and thus capable of detecting a much wider range of the BSVstrains in Uganda. However, these had the problem that they would detect bothepisomal (true) virus sequences, and the Badnavirus sequences integrated into thebanana plant genome and so would show a positive response when used with DNAfrom any banana plant whether infected or not.
To develop a PCR-based test that would only detect true episomal virus, animmunocapture step was re-introduced to the procedure. However, as had beenshown previously, the Badnavirus strains in Uganda are serologically veryheterogeneous (Harper et al., 2002) and so IC-PCR using just one antiserum to capturethe virus particles was very strain specific. To try to make the IC-PCR less strainspecific, different combinations of antiserum were tested. By the end of this phase ofthe project, the most reliable diagnostic for Badnavirus in Banana was to use a mixtureof three antisera (Agdia-BSV, Agdia ScBV and PMx R2-2C) to capture any virusparticles from banana sap extracts, and then to amplify a portion of the DNA from theseparticles using PCR with the universal primers (Badna FP and Badna RP). Thissystem appears to work well for many Ugandan BSV strains, though it should be testedon a wider range of strains/species from Uganda and elsewhere. This procedure andthe equipment and reagents to perform it were transferred to Uganda, initially toNamulonge and Sendusu-IITA farm, and then to the biotechnology laboratory atKawanda. Attempts are now under way to see if the procedure can be further extendedby addition of restriction fragment polymorphism profiling of the PCR amplicons in orderto differentiate between different strains of BSV and mixtures of strains.
13
Contribution of Outputs to developmental impactInclude how the outputs will contribute towards DFID’s developmental goals. The identified promotion pathways totarget institutions and beneficiaries. What follow up action/research is necessary to promote the findings of the workto achieve their development benefit? This should include a list of publications, plans for further dissemination, asappropriate. For projects aimed at developing a device, material or process specify:
a. What further market studies need to be done?b. How the outputs will be made available to intended users?c. What further stages will be needed to develop, test and establish manufacture of a product?
d. How and by whom, will the further stages be carried out and paid for?
HP1.9: The role of insect vectors in the epidemiology and ecology of banana streakvirus disease determined and integrated disease management strategies developedand promoted. HP1.11: Virus diseases of banana, cassava, yam, sweet potato, Solanum potato andfood legumes characterised and improved methods for diagnosis and management ofvirus diseases developed and promoted.
East African Highland bananas are a major food crop and source of income for over70% of farmers in Uganda (IITA, 1995), and they are estimated to provide 30% of thecalories for the entire population. Probably more than 90% of production, covering 30%of utilized agricultural land, is by peasant farming communities for food security andincome generation. In recent years, the productivity of banana plantations, particularly incentral, eastern and parts of western Uganda has been in rapid decline. The causes ofthis reduction in yield are believed to be declining soil fertility, less intensivemanagement through reduced availability of labour, and a complex of pests anddiseases. Results and observation from this project and sister project R7478 indicatethat increasing incidence of Banana streak virus (BSV) throughout the banana-growingregions of Uganda, and specifically in certain districts such as Rakai and Ntungamo,may constitute one of the constraints leading to the decline in productivity. Through thejoint effort of these two projects, there is a better understanding of how genetically andserologically variable the strains or species of Badnavirus infecting banana in Ugandaare, more reliable diagnostic tools have been developed, and the capacity andtechnology to perform these procedures has been transferred to NARO staff in Uganda.
This project has confirmed that natural, vectored, spread is a component of theepidemiology of BSV in Uganda, and that several mealybug species may be implicatedas vectors. A key to the identification of the mealybugs found on banana plants in Africahas been developed, and this will be a useful tool for technicians and researchersstudying the epidemiology of the virus in other banana growing areas of Africa. Datacollected on the effect of BSV infection on the physiology and growth of bananasindicates that even in the mother crop there can be a significant reduction inphotosynthetic ability and a consequent reduction in productivity, and this effect is likelyto increase in subsequent ratoon crops. Thus it is important to detect the disease earlyin its onset and to implement measures to eliminate it or reduce its effect on productivityas soon as possible.
The results also confirm that improved crop management can reduce both BSVdisease severity and some of the negative effects of BSV on growth and yield of plantswith symptoms. This conclusion provides a foundation for developing strategies tocombat the impact of BSV. However, future work needs to address several issues:-
• The effect of BSV on growth and productivity in further ratoon crops in relation tocrop management and nutrition practices needs to be defined. It is suspectedthat both symptoms and their impact on bunch yield will increase in further cropcycles.
14
• Now that the effects of BSV alone on banana productivity are becoming clearer,the impact of BSV in the presence of other pests and diseases found in Ugandashould be studied.
• Strategies for farmers to mitigate the effects of BSV through the bettermanagement of their plantations need to be explored through farmerparticipation.
With this knowledge it will be possible to better formulate integrated diseasemanagement practices for controlling the spread and/or impact of the disease.Participatory rural appraisal should be used to assess the feasibility and sustainability ofimplementing these management practices. Pathways for disseminating andpromoting to banana growers and other concerned agencies those practices identifiedas being most appropriate and beneficial should also be explored.
A proposal for a follow-on project, joint with the Integrated Banana Crop Managementproject, is being developed for submission to CPP. It will include aspects of theresearch and dissemination activities outlined above.
Project publications/outputs.
CHANCELLOR, T.C.B. (2000): Managing Banana Streak Virus. CABI-Biocontrol Newsand Information 21(3) September 2000(http://pest.cabweb.org/Journals/BNI/Bni21-3/IPM.htm)
JOOMUN, N. (2002): Development of Diagnostic Techniques for reliable detection ofBanana streak virus. MSc Thesis Natural Resources Institute, University ofGreenwich, Chatham pp. 73.
KENYON, L., KUBIRIBA, J., MUREKEZI, C., RAGAMA, P., WHEELER, T.,CHANCELLOR, T.C.B., TUSHEMEREIRWE, W. and GOWEN, S (2003):Banana streak virus disease in Uganda. Poster No 1449 (Abstract 23.34)presented at the 8th International Congress of Plant Pathology (ICPP2003),Christchurch, New Zealand 2-7 February 2003.
KUBIRIBA, J. TUSHEMEREIRWE. W. and KENYON, L. (2003): Epidemiology ofBanana streak virus (BSV) in East African Highland Bananas (Annex 1 of thisreport)
KUBIRIBA, J., JOOMUN, N. and KENYON, L. (2003): Detection of BSV in Ugandanbananas (Annex 7 of this report)
MUREKEZI, C. and KUBIRIBA, J. (2003): Effect of farmers’ cultural practices onbanana streak virus (BSV) expression in Ntungamo (Annex 4 of this report)
NGAMBEKI, D., KUBIRIBA, J., MUREKEZI, C., and RAGAMA, P., (2002): Baselinesurvey report: Banana streak virus on East African Highland bananas in southand western Uganda (Annex 6 of this report)
NGAMBEKI, D., KUBIRIBA, J., MUREKEZI, c., RAGAMA, P. and LAMBOLL, R. (2002):Farmer knowledge and perceptions of Banana streak virus on East Africanhighland bananas in villages with relatively high BSV incidence in south-westernUganda (Annex 5 of this report)
WATSON, G. and KUBIRIBA, J. (Submitted): Identification of Mealybugs on Bananasand Plantain in Africa. African Entomology. (Annex 2 of this report)
WHEELER, T., MUREKEZI, C., GOWEN, S., KEBREAB, E. and TUSHEMEREIRWE.W. (2003): Impact of Banana streak virus on the growth and yield of banana var.Cavendish Williams (Musa AAA) and var. Mbwazirume (Musa AAA-EA) (Annex 3of this report)
15
Biometricians Signature
The projects named biometrician must sign off the Final Technical Report before it issubmitted to CPP. This can either be done by the projects named biometrician signingin the space provided below, or by a letter or email from the named biometricianaccompanying the Final Technical Report submitted to CPP. (Please note that NRInternational reserves the right to retain the final quarter’s payment pending NRInternational’s receipt and approval of the Final Technical Report, duly signed by theproject’s biometrician)
I confirm that the biometric issues have been adequately addressed in the FinalTechnical Report:
Signature:Name (typed):Position:Date:
16
References
DAHAL, G., PASBERG-GAUHL, C., GAUHL, F., THOTTAPPILLY, G., and HUGHES,J.D. (1998) Studies on a Nigerian isolate of banana streak badnavirus: II. Effectof intraplant variation on virus accumulation and reliability of diagnosis by ELISA.Annals Of Applied Biology 132(2): 263-275.
DANIELLS, J.W., GEERING, A.D.W., BRYDE, N.J. and THOMAS, J.E. (2001) Theeffect of Banana streak virus on the growth and yield of dessert bananas intropical Australia. Annals of Applied Biology 139(1): 51-60.
DANIELLS, J.W., THOMAS J.E. and GEERING, A.D.W. (1999) Banana StreakDisease: An Illustrated Field Guide. Queensland Department of PrimaryIndustries, Information Series QI99018, Brisbane Australia. Pp17
HARPER, G. and HULL, R. (1998) Cloning and sequence analysis of banana streakvirus DNA. Virus Genes 17(3): 271-278.
HARPER, G., DAHAL, G., THOTTAPPILLY, G., and HULL, R. (1999a) Detection ofepisomal banana streak badnavirus by IC-PCR. Journal of Virological Methods79(1): 1-8.
HARPER, G., OSUJI, J.O., HESLOP-HARRISON, J.S., and HULL, R. (1999b)Integration of banana streak badnavirus into the Musa genome: Molecular andcytogenetic evidence. Virology 255(2): 207-213.
HARPER, G., HART, D., MOULT, S., and HULL, R. (2002) Detection of Banana streakvirus in field samples of bananas from Uganda. Annals of Applied Biology 141:247-257.
HIBINO, H. (1983) Transmission of 2 rice tungro-associated viruses and rice waikavirus from doubly or singly infected source plants by leafhopper vectors. PlantDisease 67: 774-777
HULL, R. and HARPER, G. (2001) Management strategies for Banana streak virus:Variation of BSV in Uganda as an adjunct to diagnosis and epidemiology. FinalTechnical report of DFID Crop Protection Programme project R7478/Za0342,John Innes Centre, Norwich September 2001.
JOOMUN, N. (2002) Development of Diagnostic Techniques for reliable detection ofBanana streak virus., pp. 73: MSc Thesis Natural Resources Institute, Universityof Greenwich, Chatham.
KUBIRIBA J, LEGG J.P, TUSHEMEREIRWE W, and ADIPALA E. (2001a) .Vectortransmission of Banana streak virus in the screenhouse in Uganda. Annals ofApplied Biology 139: 37-43
LAFLEUR, D.A., LOCKHART, B.E.L., and OLSZEWSKI, N.E. (1996) Portions ofbanana streak badnavirus genome are integrated in the genome of its hostsMusa spp. Phytopathology 86:(S100-S101).
LASSOUDIÈRE A, (1979). La mosaïque dite “à tirets” du bananier Poyo en Côted’Ivoire. Fruits 29: 349-357.
LOCKHART, B.E.L. (1986) Purification and serology of a bacilliform virus associatedwith banana streak disease. Phytopathology 76(10): 995-999.
LOCKHART, B.E.L (1990) Evidence for a double-stranded circular DNA genome in asecond group of plant viruses Phytopathology 80: 127-131.
LOCKHART, B.E.L., and AUTREY, L.J.C. (1988). Occurrence in sugarcane of abacilliform virus related serologically to banana streak virus. Plant Disease 72(3):230-233.
17
LOCKHART, B.E.L., and OLSZEWSKI, N.E. (1993) Serological and genomicheterogeneity of banana streak badnavirus: implementation for virus detection inMusa germplasm. In “Breeding banana and plantain for resistance to diseasesand pests” (J. Ganry, Ed.), pp. 105-114. CIRAD & INIBAP, Montpellier, France.
LOCKHART, B.E.L., KIRATIYA ANGUL, K., JONES, P., ENG, L., SILVA, P. DE,OLSZEWSKI, N.E., LOCKHART, N., DEEMA, N., SANGALANG, J., DE SILVA, P.(1997) Identification of Piper yellow mottle virus, a mealybug-transmittedbadnavirus infecting Piper spp. in Southeast Asia. European Journal of PlantPathology 103(4): 303-311
NDOWORA, T., DAHAL, G., LAFLEUR, D., HARPER, G., HULL, R., OLSZEWSKI, N.E.,and LOCKHART, B. (1999) Evidence that badnavirus infection in Musa canoriginate from integrated pararetroviral sequences. Virology 255(2), 214-220.
NDOWORA, T., LOCKHART, B.E.L. and OLSZEWSKI, N.E. (1997) Relationshipbetween integrated and episomal badnavirus genomic sequences in Musa.Phytopathology 87 (suppl. 6): 69.
SSALI, H., MCINTYRE, B.D., GOLD, C.S., KASHAIJA, I.N., and KIZITO, F. (2003)Effects of mulch and mineral fertilizer on crop, weevil and soil quality parametersin highland banana. Agroecosystems 65: 141-150.
SU, J.S. (1998) First occurrence of banana streak badnavirus and studies in itsvectorship in Taiwan. In Banana streak virus: a unique virus-Musa interaction?Eds. E.A. Frison, and S.L. Sharrock, INIBAP; Montpellier, France. pp 20-25.
THOTTAPPILLY, G., DAHAL, G. and LOCKHART, B.E.L. (1998). Studies on a Nigerianisolate of banana streak badnavirus: I Purification and enzyme-linkedimmunoassay. Annals of Applied Biology. 132: 253-261
TUSHMEREIRWE, W.K., KARAMURA, E.B., and KARYEIJA, R. (1996): Banana streakvirus (BSV) and an associated filamentous virus (unidentified) disease complexof highland bananas in Uganda. Infomusa 5, 9-12.
WATSON, G., and KUBIRIBA, J. (Submitted): Identification of Mealybugs on Bananasand Plantain in Africa. Submitted to African Entomology.
YANG, I. C., HAFNER, G. J., DALE, J. L., and HARDING, R. M. (2003): Genomiccharacterisation of taro bacilliform virus. Archives Of Virology 148: 937-949.
18
Associated Annexes
1. Epidemiology of Banana streak virus (BSV) in East African Highland Bananas(Kubiriba, Tushemereirwe and Kenyon)
2. Identification of mealybugs on banana and plantain in Africa (Watson and Kubiriba,2003?)
3. Impact of Banana streak virus on the growth and yield of banana var. CavendishWilliams (Musa AAA) and var. Mbwazirume (Musa AAA-EA) (Wheeler,Murekezi, Gowen, Kebreab and Tushemereirwe.)
4. Effect of farmers’ cultural practices on banana streak virus (BSV) expression inNtungamo (Murekezi and Kubiriba)
5. Farmer knowledge and perceptions of Banana streak virus on East African highlandbananas in villages with relatively high BSV incidence in south-western Uganda(Ngambeki, Kubiriba, Murekezi, Ragama and Lamboll)
6. Baseline survey report: Banana streak virus on East African Highland bananas insouth and western Uganda (Ngambeki, Kubiriba, Murekezi and Ragama)
7. Detection of BSV in Ugandan bananas (Kubiriba, Joomun and Kenyon)
NATIONAL AGRICULTURAL RESEARCH ORGANISATION (NARO)
REPORT
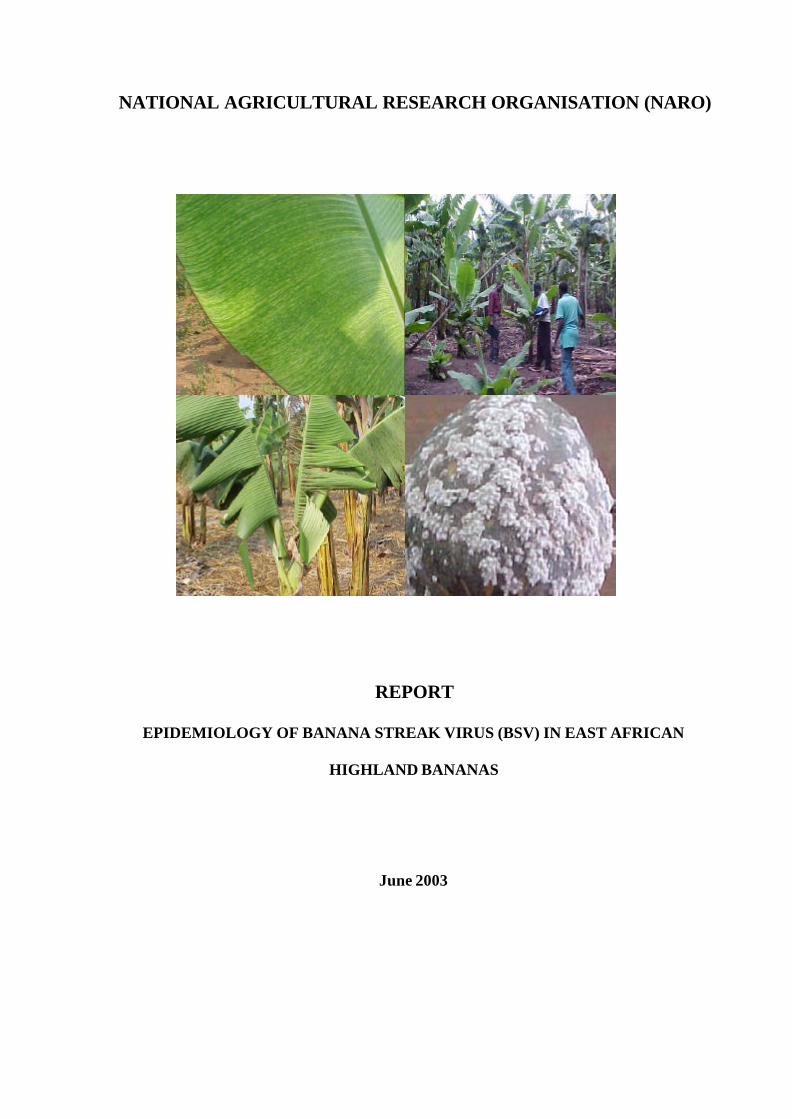
EPIDEMIOLOGY OF BANANA STREAK VIRUS (BSV) IN EAST AFRICAN
HIGHLAND BANANAS
June 2003
CONTENTS
SUMMARY................................................................................................................................2
BACKGROUND ........................................................................................................................3
RESEARCH ACTIVITIES.........................................................................................................4
Mealybugs and Screenhouse Transmission................................................................................... 4Rationale ................................................................................................................................ 4Materials and Methods ............................................................................................................ 4Identification key for mealybugs .............................................................................................. 4Raising mealybug cultures ...................................................................................................... 6Preparation of source plants and test plants for transmission .................................................... 7Transmission of BSV by mealybugs in the screen-house ............................................................ 7Results and Discussion............................................................................................................ 8
Natural field spread of BSV........................................................................................................ 9Rationale ................................................................................................................................ 9Materials and method.............................................................................................................. 9Development of trapping procedures for monitoring mealybug populations ............................... 9On station BSV spread trials ................................................................................................... 9Spread trials on farmers’ fields ............................................................................................. 10Results and Discussion.......................................................................................................... 11
GENERAL DISCUSSION AND CONCLUSIONS ................................................................19
REFERENCES .........................................................................................................................20
2
SUMMARY
The work presented in this report constitutes part of a larger study on the ecology and
epidemiology of Banana streak virus (BSV) and its effect on growth and productivity of
East African Highland bananas (AAA-EA) in Uganda.
Cultures of three different mealybug species (Dysmicoccus brevipes, a Planococcus sp. and a
Pseudococcus sp.) collected from banana were established on pumpkin fruits from single
females. Preliminary results from transmission experiments indicate that nymphs of both the
D. brevipes and the Planococcus sp. are capable of transmitting a Kawanda strain of BSV
from banana to banana.
BSV was not observed to spread from a central block of infected plants to the surrounding
virus-indexed cv “Williams” plants in two on-station field trials at Mbarara and Kawanda.
However, anincrease in mealybug numbers and mealybug movement from the infected
sources plants was observed. Water pan traps were more reliable than sticky traps for
monitoring mealybug nymph numbers in established banana plantations. Pseudostem counts
were the most appropriate method of estimating adult mealybug population size.
BSV was observed to spread to infect plants in small (4x4) plots of virus-indexed cv
“Williams” planted within farms with high incidence of BSV within 6 and 17 months after
planting in Ntungamo and Rakai respectively. This indicates that there is natural vectored
spread of BSV in Uganda. In Rakai, in a larger plot (23x23) of the local variety “Kisansa”
(AAA-EA) established in September 1997, the first BSV infections were observed 38
months after planting, and to date the disease has built up to an incidence of about 7%. The
pattern of infection within this plot suggests that both primary spread into the plot and
secondary spread between near neighbours within the plot is occurring.
BSV spread seems to be slow in some areas, roguing may be effective in reducing the spread
of the disease in farms with low incidence in some areas provided that infected plants can be
identified at an early stage of infection.

3
BACKGROUND
Banana streak virus (BSV; genus Badnavirus) was first reported in Uganda in 1990 (Dabek
and Waller, 1990). A severe outbreak of the disease was reported from the Rakai District in
the early 1990's and later other areas of Uganda (Tushemereirwe, et al., 1996). BSV isolates
are both genetically and serologically very diverse (Lockhart & Olszewski, 1993; Ndowora
& Lockhart, 1997).
BSV was one of the first plant viruses where it was found that parts of the virus DNA
genome could integrate into the host chromosomes, and under certain circumstances these
integrated sequences can be excised and recombine to form active virus (Lockhart et al.,
1998). However, it is believed that it is only the episomal (non-integrated) forms of BSV
that are infectious and can be transmitted by the activity of a vector. Several mealybug
species have been identified colonising bananas (Matile-Ferrero & Williams, 1995), and
three species of mealybug, Planococcus citri (Risso), Dysmicoccus brevipes (Cockerell) and
Saccharicoccus sacchari (Cockerell), have been reported to be capable of transmitting BSV
from plant to plant under screenhouse conditions (Lockhart and Olszewski, 1993; Kubiriba
et al., 2001b). However, the preferred hosts for these mealybugs are citrus, pineapples and
sugarcane respectively. There is a need for more detailed transmission studies to be
conducted with mealybugs found on bananas in order to clearly establish which species are
BSV vectors in Uganda.
The development and implementation of successful disease management strategies
necessitate a more thorough understanding of the factors that contribute to the development
of plant disease epidemics (Campbell and Madden, 1990). Hughes (1998) reported that
there was no conclusive evidence of BSV spread in the field. Kubiriba et al., (2001a)
reported that BSV–infected plants are clustered at disease foci in banana fields in Uganda
and that incidence was lower away from these foci. Little information is available about the
rate of disease spread within or between banana plantations and the role of putative
mealybug vectors remains unclear. Consequently, it has not been possible to develop
strategies to manage BSV effectively.
This study aimed at providing a better understanding of the natural spread of BSV under
field conditions in Uganda, including the vector species that are effective in transmitting the
disease.
4
RESEARCH ACTIVITIES
Mealybugs and Screenhouse Transmission
Rationale
A number of mealybug species have been identified as colonising banana plants in the field
(Dahal, et al., 1998) but only a few have been associated with transmission of BSV, and then
only in the laboratory/screenhouse. Those mealybug species used for transmission
experiments in the laboratory/screenhouse were obtained from hosts other than bananas.
Cocoa swollen shoot virus (CSSV), another Badnavirus closely related to BSV, is reported
to be transmitted by at least nine different mealybug species, though some species appear to
be more efficient vectors than others (Posnette, 1950). It is possible that several different
mealybug species transmit BSV and that some have not been identified under screenhouse
conditions. The study was therefore undertaken to verify the role of different mealybug
species present in banana plantations in Uganda as vectors of BSV.
Materials and Methods
Identification key for mealybugs
The morphological features of all the mealybug species that have been collected and
identified from bananas and plantain in Africa were collated from published papers (e.g.
Cox, 1989; Ezzat and McConnell, 1956; Williams, 1958 & Williams and Granara de
Willink, 1992) (Table 1). Mealybugs were also collected and preserved in 70% alcohol from
banana plants at four farms in each of Rakai, Masaka, Ibanda and Ntungamo districts. They
were then cleaned and cleared in preparation for microscopic examination and identification
by the method described by Watson and Chandler (2000). Based on both the published
morphological features and those observed in the laboratory, a dichotomous key for all the
mealybug species encountered on Musa spp in Africa was constructed (Watson & Kubiriba,
2003 submitted). The key was designed to act as aid to the identification of mealybug
samples collected from banana fields.
5
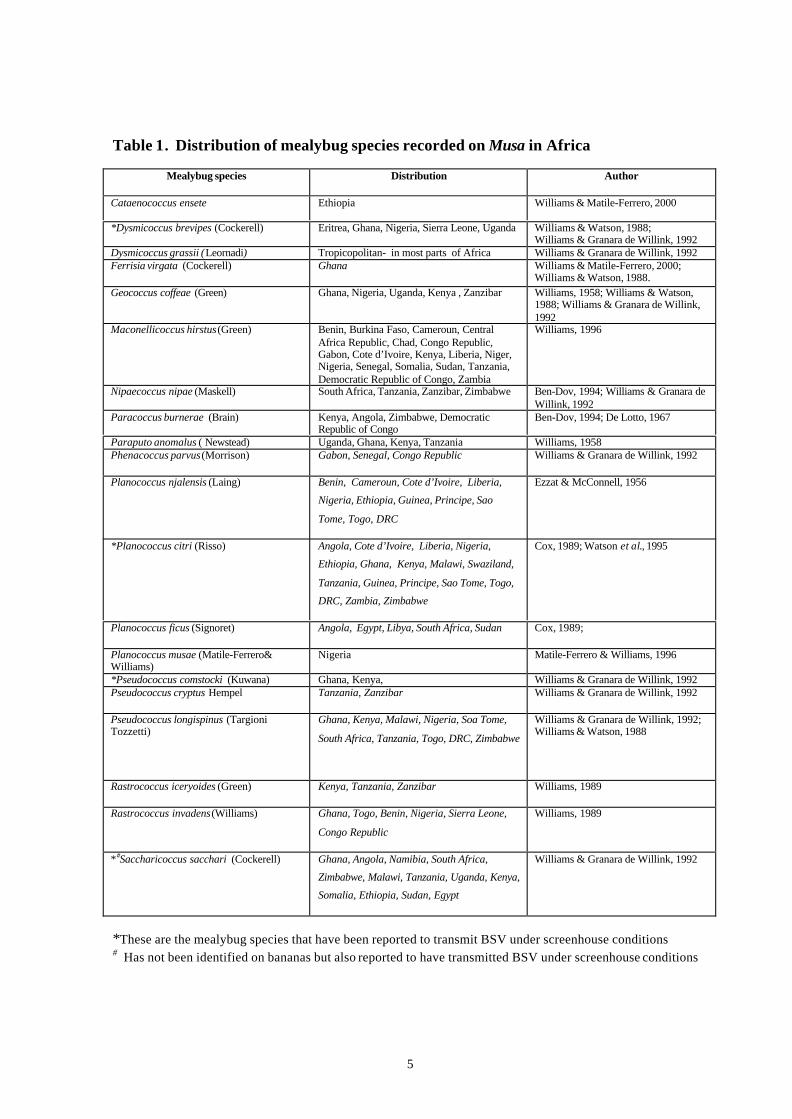
Table 1. Distribution of mealybug species recorded on Musa in Africa
Mealybug species Distribution Author
Cataenococcus ensete Ethiopia Williams & Matile-Ferrero, 2000
*Dysmicoccus brevipes (Cockerell) Eritrea, Ghana, Nigeria, Sierra Leone, Uganda Williams & Watson, 1988;Williams & Granara de Willink, 1992
Dysmicoccus grassii (Leornadi) Tropicopolitan- in most parts of Africa Williams & Granara de Willink, 1992Ferrisia virgata (Cockerell) Ghana Williams & Matile-Ferrero, 2000;
Williams & Watson, 1988.Geococcus coffeae (Green) Ghana, Nigeria, Uganda, Kenya , Zanzibar Williams, 1958; Williams & Watson,
1988; Williams & Granara de Willink,1992
Maconellicoccus hirstus (Green) Benin, Burkina Faso, Cameroun, CentralAfrica Republic, Chad, Congo Republic,Gabon, Cote d’Ivoire, Kenya, Liberia, Niger,Nigeria, Senegal, Somalia, Sudan, Tanzania,Democratic Republic of Congo, Zambia
Williams, 1996
Nipaecoccus nipae (Maskell) South Africa, Tanzania, Zanzibar, Zimbabwe Ben-Dov, 1994; Williams & Granara deWillink, 1992
Paracoccus burnerae (Brain) Kenya, Angola, Zimbabwe, DemocraticRepublic of Congo
Ben-Dov, 1994; De Lotto, 1967
Paraputo anomalus ( Newstead) Uganda, Ghana, Kenya, Tanzania Williams, 1958Phenacoccus parvus (Morrison) Gabon, Senegal, Congo Republic Williams & Granara de Willink, 1992
Planococcus njalensis (Laing) Benin, Cameroun, Cote d’Ivoire, Liberia,
Nigeria, Ethiopia, Guinea, Principe, Sao
Tome, Togo, DRC
Ezzat & McConnell, 1956
*Planococcus citri (Risso) Angola, Cote d’Ivoire, Liberia, Nigeria,
Ethiopia, Ghana, Kenya, Malawi, Swaziland,
Tanzania, Guinea, Principe, Sao Tome, Togo,
DRC, Zambia, Zimbabwe
Cox, 1989; Watson et al., 1995
Planococcus ficus (Signoret) Angola, Egypt, Libya, South Africa, Sudan Cox, 1989;
Planococcus musae (Matile-Ferrero&Williams)
Nigeria Matile-Ferrero & Williams, 1996
*Pseudococcus comstocki (Kuwana) Ghana, Kenya, Williams & Granara de Willink, 1992Pseudococcus cryptus Hempel Tanzania, Zanzibar Williams & Granara de Willink, 1992
Pseudococcus longispinus (TargioniTozzetti)
Ghana, Kenya, Malawi, Nigeria, Soa Tome,
South Africa, Tanzania, Togo, DRC, Zimbabwe
Williams & Granara de Willink, 1992;Williams & Watson, 1988
Rastrococcus iceryoides (Green) Kenya, Tanzania, Zanzibar Williams, 1989
Rastrococcus invadens (Williams) Ghana, Togo, Benin, Nigeria, Sierra Leone,
Congo Republic
Williams, 1989
*#Saccharicoccus sacchari (Cockerell) Ghana, Angola, Namibia, South Africa,
Zimbabwe, Malawi, Tanzania, Uganda, Kenya,
Somalia, Ethiopia, Sudan, Egypt
Williams & Granara de Willink, 1992
*These are the mealybug species that have been reported to transmit BSV under screenhouse conditions# Has not been identified on bananas but also reported to have transmitted BSV under screenhouse conditions
6
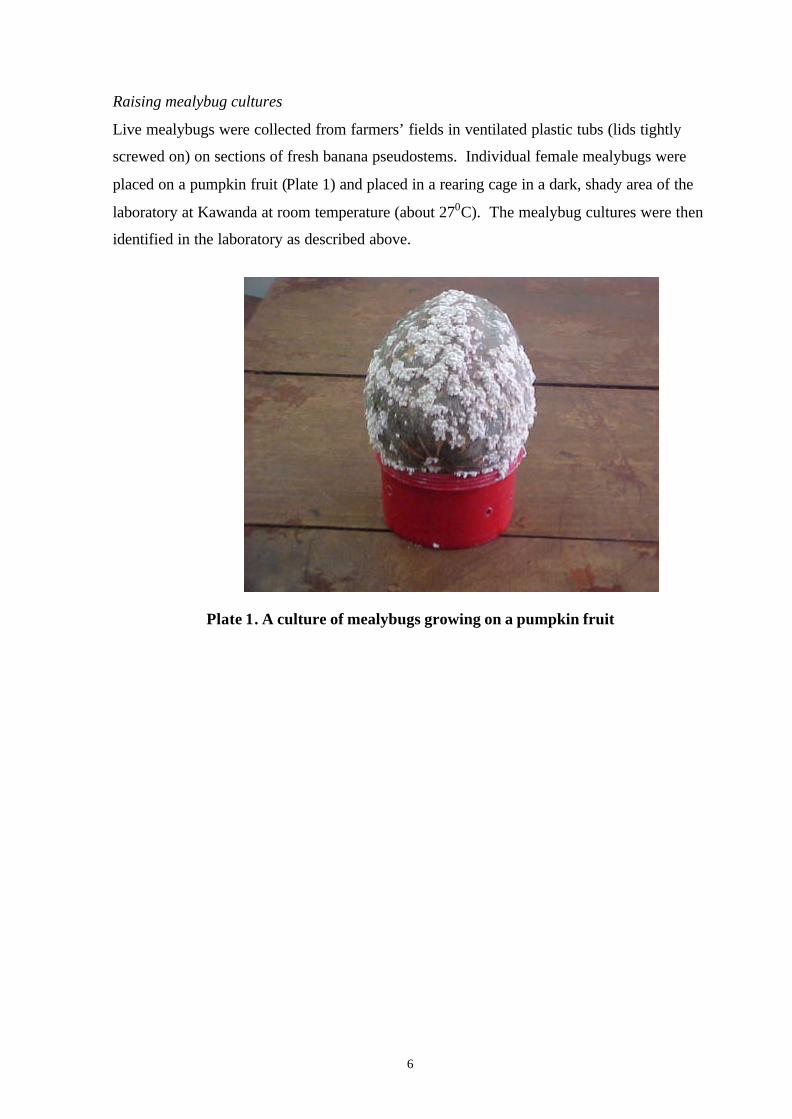
Raising mealybug cultures
Live mealybugs were collected from farmers’ fields in ventilated plastic tubs (lids tightly
screwed on) on sections of fresh banana pseudostems. Individual female mealybugs were
placed on a pumpkin fruit (Plate 1) and placed in a rearing cage in a dark, shady area of the
laboratory at Kawanda at room temperature (about 270C). The mealybug cultures were then
identified in the laboratory as described above.
Plate 1. A culture of mealybugs growing on a pumpkin fruit
7
Preparation of source plants and test plants for transmission
One sucker from a plant of cv. “Mbwazirume” showing clear BSV symptoms was collected
from a BSV-management trial at Kawanda. This was multiplied by the “split-corm” method
and the resulting plantlets grown on in buckets of soil in the screenhouse and used as virus-
source plants in the transmission experiments. Occasionally, when they got too big, these
source plants were cut back and transferred to fresh soil to allow new, tender leaves, suitable
for mealybug feeding, to emerge. Farmyard-manure was also occasionally applied to the
buckets to maintain the vigour of the plants.
Plantlets of virus-indexed cv. “Williams” (imported from South Africa) were micro-
propagated by tissue culture, and then hardened in the weaning sheds at Kawanda before
transplanting in buckets for use as test plants. They were used for transmission when about
20 cm tall with 4 open young tender leaves. The cv. “Williams” (AAA) was used as test
plants because the BSV DNA sequences integrated in the genome appear stable and not
activatable to episomal forms that cause disease. Any BSV symptoms showing on this
variety would therefore be caused by infection due to transmission by a mealybug vector
rather than from within the plant.
Transmission of BSV by mealybugs in the screen-house
Transmission experiments were carried out in the purpose-built screen-houses at the IITA
Namulonge-Sendusu farm. For each experiment, more than 200 second instar mealybug
nymphs from one of the pumpkin cultures were allowed to feed on young leaves of the cv.
“Mbwazirume” virus source plants (contained within clip-cages) for four days. The nymphs
were then transferred to 10 cv. “Williams” test plants; 20 nymphs (in a clip-cage) per plant.
As the control, the procedure was replicated with another 200+ nymphs and 10 test plants,
but here the nymphs were allowed to feed for four days on non-infected leaves of cv.
“Williams” prior to transfer to the test plants. Both sets of test plants were sprayed with
Chloropyrifos 48% E.C 24 hr after introduction of the nymphs for inoculation feeding. To
avoid bias during assessment, each test and control plant was given a concealed label (a
marked piece of polythene buried in the soil of the pot) and the plants were placed in a
randomised pattern in the screenhouse. All plants were scored for appearance and severity
of BSV symptoms at regular intervals for up to 4 months after inoculation feeding.
8
Results and Discussion
Identification of mealybugs on bananas in Uganda
Four mealybug genera, Dysmicoccus sp., Planococcus sp., Paracoccus sp., and
Pseudococcus sp. were identified from the samples collected in Uganda in banana
plantations. Although Planococcus sp. had not been reported on bananas in Uganda before,
Planococcus citri has previously been reported to transmit BSV under screenhouse
conditions in USA (Lockhart and Olszewski, 1993; Su, 1998). Paracoccus sp.,
Pseudococcus sp. and Dysmicoccus sp. had previously been identified on bananas in
Uganda, and Dysmicoccus brevipes was associated with BSV transmission under
screenhouse conditions (Kubiriba et al., 2001b.). D. brevipes and Pseudococcus comstocki
have been reported to transmit BSV in the laboratory in Taiwan (Su, 1999).
Raising cultures of mealybugs
After failure to get mealybug cultures to establish on small banana plants in the screenhouse,
a culture each of the three different mealybug species, Dysmicoccus brevipes, Planococcus
sp. and Pseudococcus sp., was established on pumpkin fruits in screen cages in the
laboratory at Kawanda.
Screenhouse transmission tests
These experiments are still on-going. So far, one out of ten plants inoculated using
Planococcus sp. nymphs has developed symptoms of BSV, and one out of 10 plants
inoculated using Dysmicoccus brevipes nymphs has developed symptoms. The former first
developed symptoms 12 weeks after inoculation and later 8 weeks after inoculation.
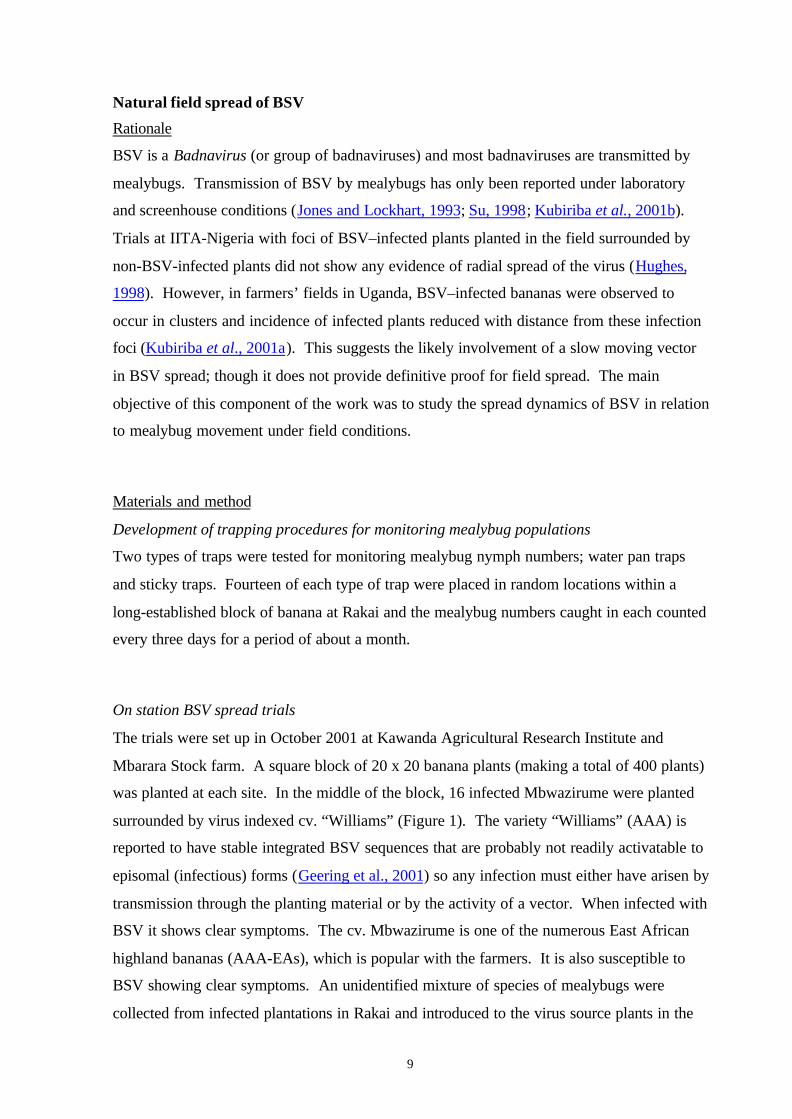
9
Natural field spread of BSV
Rationale
BSV is a Badnavirus (or group of badnaviruses) and most badnaviruses are transmitted by
mealybugs. Transmission of BSV by mealybugs has only been reported under laboratory
and screenhouse conditions (Jones and Lockhart, 1993; Su, 1998; Kubiriba et al., 2001b).
Trials at IITA-Nigeria with foci of BSV–infected plants planted in the field surrounded by
non-BSV-infected plants did not show any evidence of radial spread of the virus (Hughes,
1998). However, in farmers’ fields in Uganda, BSV–infected bananas were observed to
occur in clusters and incidence of infected plants reduced with distance from these infection
foci (Kubiriba et al., 2001a). This suggests the likely involvement of a slow moving vector
in BSV spread; though it does not provide definitive proof for field spread. The main
objective of this component of the work was to study the spread dynamics of BSV in relation
to mealybug movement under field conditions.
Materials and method
Development of trapping procedures for monitoring mealybug populations
Two types of traps were tested for monitoring mealybug nymph numbers; water pan traps
and sticky traps. Fourteen of each type of trap were placed in random locations within a
long-established block of banana at Rakai and the mealybug numbers caught in each counted
every three days for a period of about a month.
On station BSV spread trials
The trials were set up in October 2001 at Kawanda Agricultural Research Institute and
Mbarara Stock farm. A square block of 20 x 20 banana plants (making a total of 400 plants)
was planted at each site. In the middle of the block, 16 infected Mbwazirume were planted
surrounded by virus indexed cv. “Williams” (Figure 1). The variety “Williams” (AAA) is
reported to have stable integrated BSV sequences that are probably not readily activatable to
episomal (infectious) forms (Geering et al., 2001) so any infection must either have arisen by
transmission through the planting material or by the activity of a vector. When infected with
BSV it shows clear symptoms. The cv. Mbwazirume is one of the numerous East African
highland bananas (AAA-EAs), which is popular with the farmers. It is also susceptible to
BSV showing clear symptoms. An unidentified mixture of species of mealybugs were
collected from infected plantations in Rakai and introduced to the virus source plants in the
10
centre of each block 3 months after planting. Disease assessment of all the 384 ‘virus tested’
plants was based only on observation of symptoms since the ELISA using the antiserum
from IITA had been shown not to give reliable results and a more reliable diagnostic method
had not yet been developed. Adult mealybug colonies were counted on the pseudostems
(above ground plant parts up to about 1.8m) of each of the 400 plants at both sites.
Mealybug colonies below the ground and above 1.8m of plant height were not estimated.
Both disease and mealybug assessment was done monthly from the time of first assessment 3
months after planting. Assumed mean distance moved by the mealybugs within the spread
trials starting from the middle point of the trials was estimated by use of the SADIE PC
programme (Perry et al., 1996).
jjjjjjjjjjjjjjjjjjjjjjjjjjjjjjjjjjjjjjjjjjjjjjjjjjjjjjjjjjjjjjjjjjjjjjjjjjjjjjjjjjjjjjjjjjjjjjjjjjjjjjjjjjjjjjjjjjjjjjjjjjjjjjjjjjjjjjjjjjjjjjjjjjjjjjjjjjjjjjjjjjjjjjjjvvvvjjjjjjjjjjjjjjjjvvvvjjjjjjjjjjjjjjjjvvvvjjjjjjjjjjjjjjjjvvvvjjjjjjjjjjjjjjjjjjjjjjjjjjjjjjjjjjjjjjjjjjjjjjjjjjjjjjjjjjjjjjjjjjjjjjjjjjjjjjjjjjjjjjjjjjjjjjjjjjjjjjjjjjjjjjjjjjjjjjjjjjjjjjjjjjjjjjjjjjjjjjjjjjjjjjjjjjjjjjjjjjjjjjjj
Figure 1. Diagrammatic representation of the layout of the BSV spread trials atKawanda and Mbarara
Spread trials on farmers’ fields
Three different sets of trials were set up on farmers’ fields in Ntungamo and Rakai (both
sites with high BSV incidence and assumed well established mealybug populations. The
hypothesis was that the chances of transmission would be higher in farmers’ fields than
under controlled experimental conditions on station.
Key:
j = virus-indexed"Williams" testplants,
v = BSV source plants of"Mbwazirume" withBSV symptoms
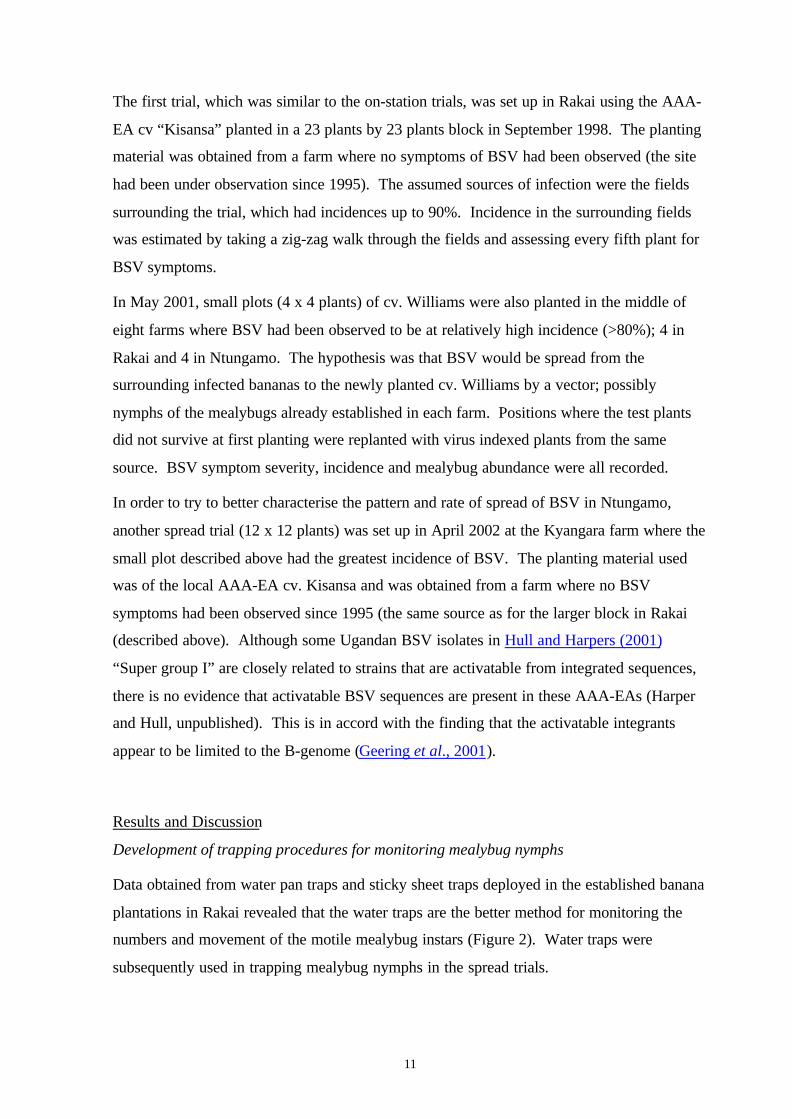
11
The first trial, which was similar to the on-station trials, was set up in Rakai using the AAA-
EA cv “Kisansa” planted in a 23 plants by 23 plants block in September 1998. The planting
material was obtained from a farm where no symptoms of BSV had been observed (the site
had been under observation since 1995). The assumed sources of infection were the fields
surrounding the trial, which had incidences up to 90%. Incidence in the surrounding fields
was estimated by taking a zig-zag walk through the fields and assessing every fifth plant for
BSV symptoms.
In May 2001, small plots (4 x 4 plants) of cv. Williams were also planted in the middle of
eight farms where BSV had been observed to be at relatively high incidence (>80%); 4 in
Rakai and 4 in Ntungamo. The hypothesis was that BSV would be spread from the
surrounding infected bananas to the newly planted cv. Williams by a vector; possibly
nymphs of the mealybugs already established in each farm. Positions where the test plants
did not survive at first planting were replanted with virus indexed plants from the same
source. BSV symptom severity, incidence and mealybug abundance were all recorded.
In order to try to better characterise the pattern and rate of spread of BSV in Ntungamo,
another spread trial (12 x 12 plants) was set up in April 2002 at the Kyangara farm where the
small plot described above had the greatest incidence of BSV. The planting material used
was of the local AAA-EA cv. Kisansa and was obtained from a farm where no BSV
symptoms had been observed since 1995 (the same source as for the larger block in Rakai
(described above). Although some Ugandan BSV isolates in Hull and Harpers (2001)
“Super group I” are closely related to strains that are activatable from integrated sequences,
there is no evidence that activatable BSV sequences are present in these AAA-EAs (Harper
and Hull, unpublished). This is in accord with the finding that the activatable integrants
appear to be limited to the B-genome (Geering et al., 2001).
Results and Discussion
Development of trapping procedures for monitoring mealybug nymphs
Data obtained from water pan traps and sticky sheet traps deployed in the established banana
plantations in Rakai revealed that the water traps are the better method for monitoring the
numbers and movement of the motile mealybug instars (Figure 2). Water traps were
subsequently used in trapping mealybug nymphs in the spread trials.
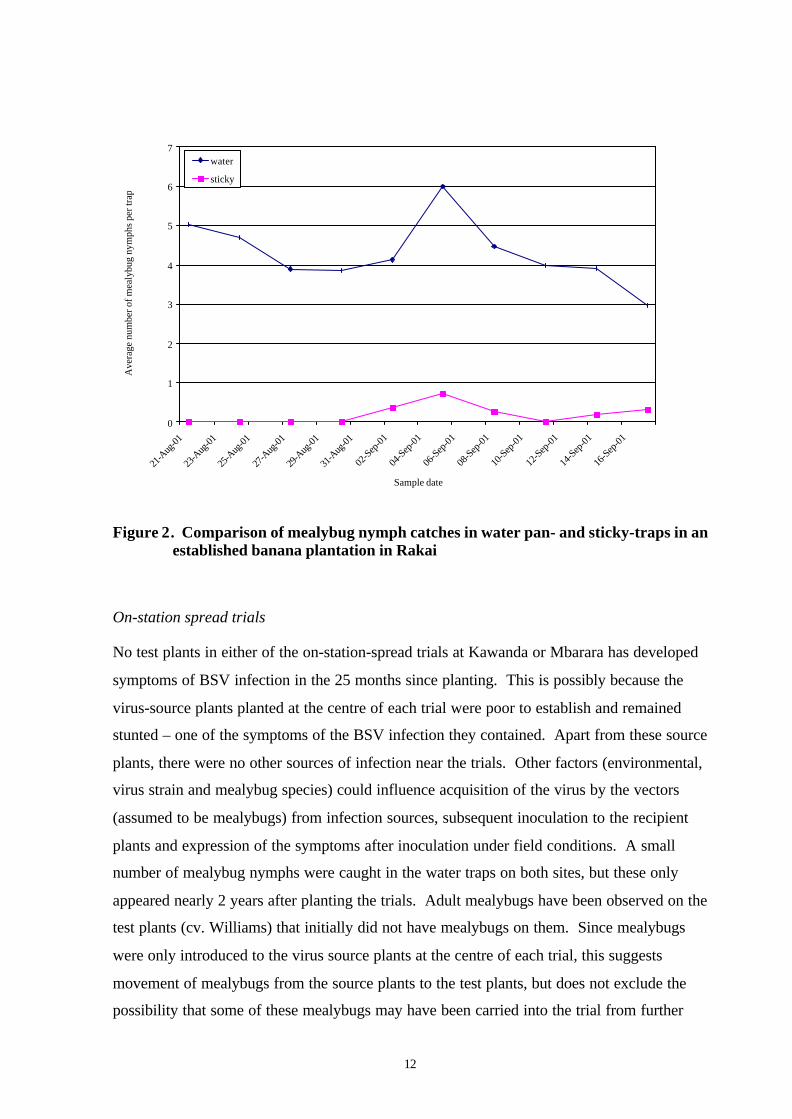
12
0
1
2
3
4
5
6
7
21-A
ug-01
23-A
ug-01
25-A
ug-01
27-A
ug-01
29-A
ug-01
31-A
ug-01
02-S
ep-01
04-S
ep-01
06-S
ep-01
08-S
ep-01
10-S
ep-01
12-S
ep-01
14-S
ep-01
16-S
ep-01
Sample date
Ave
rage
num
ber o
f mea
lybu
g ny
mph
s pe
r tra
p
water
sticky
Figure 2. Comparison of mealybug nymph catches in water pan- and sticky-traps in anestablished banana plantation in Rakai
On-station spread trials
No test plants in either of the on-station-spread trials at Kawanda or Mbarara has developed
symptoms of BSV infection in the 25 months since planting. This is possibly because the
virus-source plants planted at the centre of each trial were poor to establish and remained
stunted – one of the symptoms of the BSV infection they contained. Apart from these source
plants, there were no other sources of infection near the trials. Other factors (environmental,
virus strain and mealybug species) could influence acquisition of the virus by the vectors
(assumed to be mealybugs) from infection sources, subsequent inoculation to the recipient
plants and expression of the symptoms after inoculation under field conditions. A small
number of mealybug nymphs were caught in the water traps on both sites, but these only
appeared nearly 2 years after planting the trials. Adult mealybugs have been observed on the
test plants (cv. Williams) that initially did not have mealybugs on them. Since mealybugs
were only introduced to the virus source plants at the centre of each trial, this suggests
movement of mealybugs from the source plants to the test plants, but does not exclude the
possibility that some of these mealybugs may have been carried into the trial from further

13
afield.. The mealybug counts data from the two sites are being analysed using the Spatial
Analysis by Distance IndicEs (SADIE; IACR Rothamsted) programme. During the first 6-
7 months after introduction to the BSV source plants, the mealybugs multiplied and moved
away from the middle of the trial (point assumed by SADIE programme) a distance of
approximately one plant per month along the row (= total average distance over 6-7months =
21m in Kawanda and 23 m in Mbarara) (Figure 3 and Figure 4).
0
10
20
30
40
50
60
70
80
90
100
Jan-
01
Apr
-01
May
-01
Jun-
01
Jul-
01
Aug
-01
Sep-
01
Oct
-01
Jan-
02
Feb-
02
Apr
-02
May
-02
Jun-
02
Jul-
02
Aug
-02
Sep-
02
Oct
-02
Nov
-02
Sample date
Num
ber
of m
ealy
bug
colo
nies
0
1
2
3
4
5
6
7
8
9
Ave
rage
dis
tanc
e m
oved
(pl
ants
alo
ng a
row
)
Abundance
Mean distance
Figure 3. Mealybug colony numbers and movement in the Mbarara trial
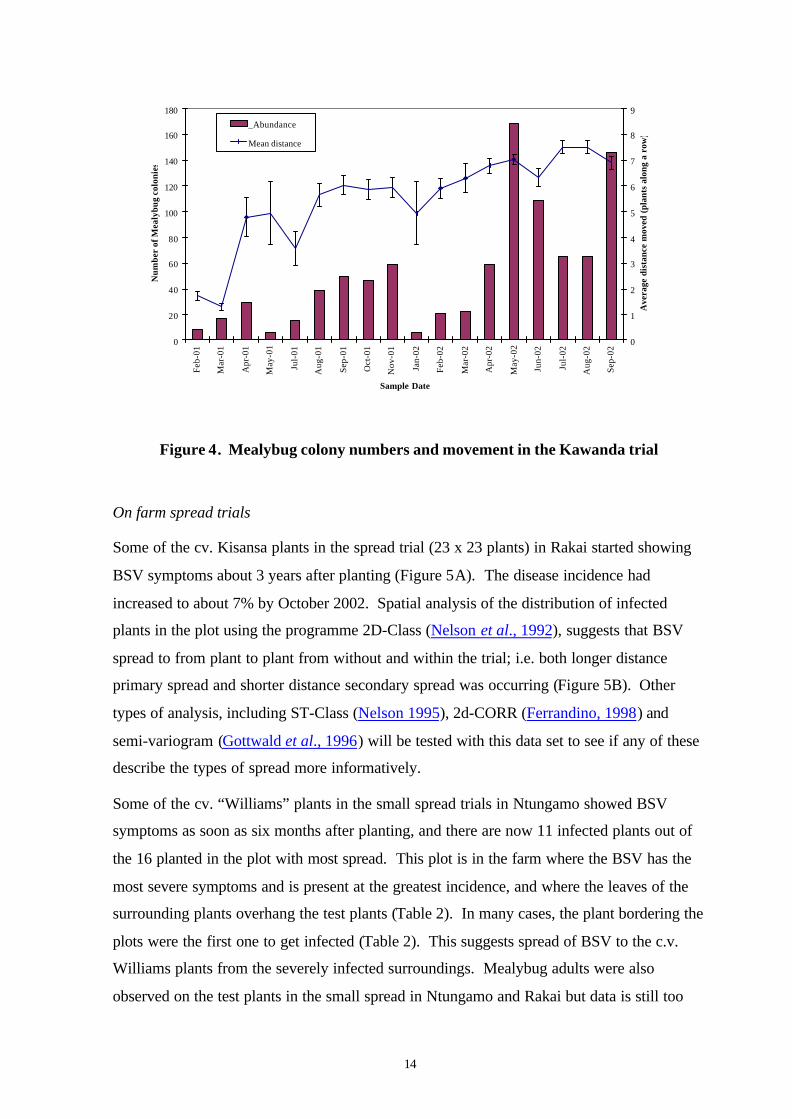
14
0
20
40
60
80
100
120
140
160
180
Feb-
01
Mar
-01
Apr
-01
May
-01
Jul-
01
Aug
-01
Sep-
01
Oct
-01
Nov
-01
Jan-
02
Feb-
02
Mar
-02
Apr
-02
May
-02
Jun-
02
Jul-
02
Aug
-02
Sep-
02
Sample Date
Num
ber
of M
ealy
bug
colo
nies
0
1
2
3
4
5
6
7
8
9
Ave
rage
dis
tanc
e m
oved
(pl
ants
alo
ng a
row
)
_Abundance
Mean distance
Figure 4. Mealybug colony numbers and movement in the Kawanda trial
On farm spread trials
Some of the cv. Kisansa plants in the spread trial (23 x 23 plants) in Rakai started showing
BSV symptoms about 3 years after planting (Figure 5A). The disease incidence had
increased to about 7% by October 2002. Spatial analysis of the distribution of infected
plants in the plot using the programme 2D-Class (Nelson et al., 1992), suggests that BSV
spread to from plant to plant from without and within the trial; i.e. both longer distance
primary spread and shorter distance secondary spread was occurring (Figure 5B). Other
types of analysis, including ST-Class (Nelson 1995), 2d-CORR (Ferrandino, 1998) and
semi-variogram (Gottwald et al., 1996) will be tested with this data set to see if any of these
describe the types of spread more informatively.
Some of the cv. “Williams” plants in the small spread trials in Ntungamo showed BSV
symptoms as soon as six months after planting, and there are now 11 infected plants out of
the 16 planted in the plot with most spread. This plot is in the farm where the BSV has the
most severe symptoms and is present at the greatest incidence, and where the leaves of the
surrounding plants overhang the test plants (Table 2). In many cases, the plant bordering the
plots were the first one to get infected (Table 2). This suggests spread of BSV to the c.v.
Williams plants from the severely infected surroundings. Mealybug adults were also
observed on the test plants in the small spread in Ntungamo and Rakai but data is still too
15
scanty to enable analysis and therefore relating mealybug movement to BSV spread. In
Rakai, however, only 1 plant has been observed to develop symptoms of infection so far, 17
months after planting.
Since the incidence of BSV appears equally high in both Rakai and Ntungamo, the
explanation for this apparent difference in rate of spread in the two areas could be
differences in environmental conditions, differences in virus strains and/or differences in
mealybug species presence. To investigate this further, a new trial has been planted at
Kawanda. This is designed to compare the performance and BSV symptom expression of
BSV-infected banana material obtained from Rakai, Ntungamo and Kawanda in the same
environment (location). If the plants from the different locations continue to exhibit
different disease phenotypes in this trial, it will indicate that there are probably virus
strain/species differences between the locations (This may then be investigated further using
molecular biology techniques). If the virus species/strain composition appears to be similar
at the different locations, then more detailed investigation of the mealybug species
composition and subtle differences in the environmental conditions at the different locations
may be warranted.
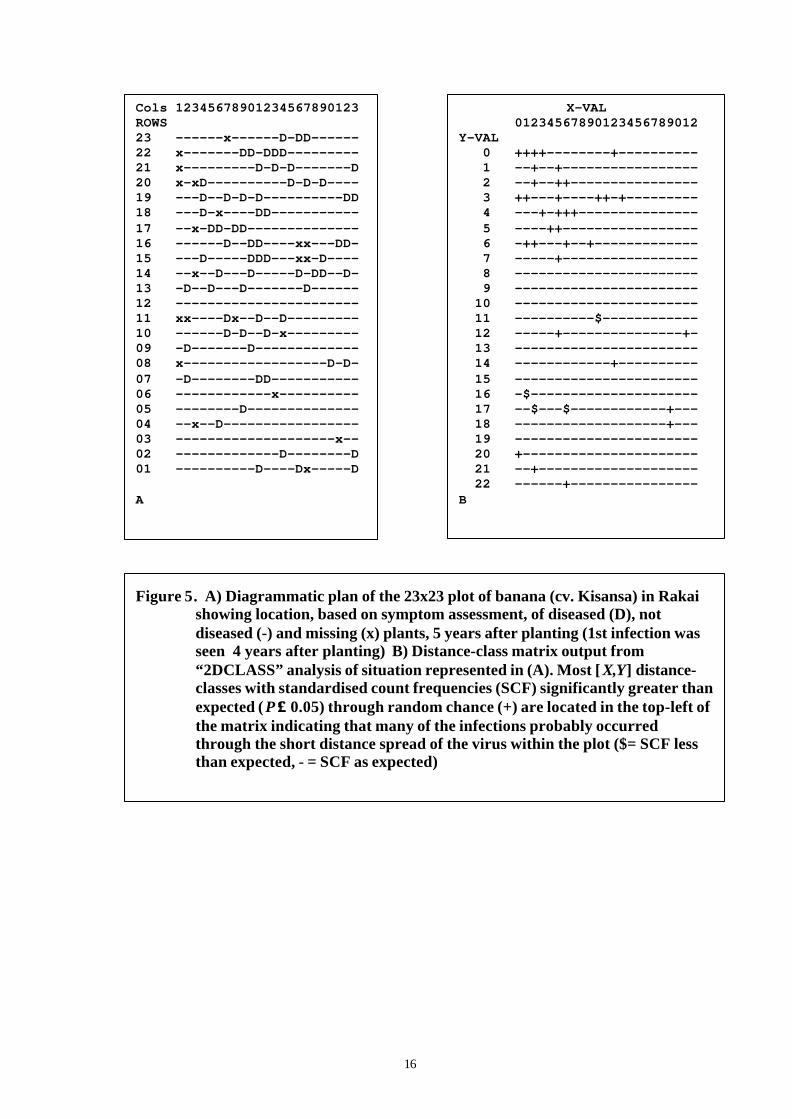
16
Cols 12345678901234567890123ROWS23 ------x------D-DD------22 x-------DD-DDD---------21 x---------D-D-D-------D20 x-xD----------D-D-D----19 ---D--D-D-D----------DD18 ---D-x----DD-----------17 --x-DD-DD--------------16 ------D--DD----xx---DD-15 ---D-----DDD---xx-D----14 --x--D---D-----D-DD--D-13 -D--D---D-------D------12 -----------------------11 xx----Dx--D--D---------10 ------D-D--D-x---------09 -D-------D-------------08 x------------------D-D-07 -D--------DD-----------06 ------------x----------05 --------D--------------04 --x--D-----------------03 --------------------x--02 -------------D--------D01 ----------D----Dx-----D
A
X-VAL 01234567890123456789012Y-VAL 0 ++++--------+---------- 1 --+--+----------------- 2 --+--++---------------- 3 ++---+----++-+--------- 4 ---+-+++--------------- 5 ----++----------------- 6 -++---+--+------------- 7 -----+----------------- 8 ----------------------- 9 ----------------------- 10 ----------------------- 11 ----------$------------ 12 -----+---------------+- 13 ----------------------- 14 ------------+---------- 15 ----------------------- 16 -$--------------------- 17 --$---$------------+--- 18 -------------------+--- 19 ----------------------- 20 +---------------------- 21 --+-------------------- 22 ------+----------------B
Figure 5. A) Diagrammatic plan of the 23x23 plot of banana (cv. Kisansa) in Rakaishowing location, based on symptom assessment, of diseased (D), notdiseased (-) and missing (x) plants, 5 years after planting (1st infection wasseen 4 years after planting) B) Distance-class matrix output from“2DCLASS” analysis of situation represented in (A). Most [ X,Y] distance-classes with standardised count frequencies (SCF) significantly greater thanexpected ( P ≤≤ 0.05) through random chance (+) are located in the top-left ofthe matrix indicating that many of the infections probably occurredthrough the short distance spread of the virus within the plot ($= SCF lessthan expected, - = SCF as expected)

17
Table 2. Observations on the small plots of cv. Williams planted on farmers’ fields
Site Farmer 2Initial BSVincidence (%) of
surroundingfarm
Initial averageno. of mealybug
colonies perinfested plant in
surroundingfarm
Time (monthsafter planting)taken for the
first symptomsto show
1Max. no. ofmealybug
colonies perinfested plant
in the plot
*1Number of testplants (Williams)
infected
General description Location of infectedplants in each 4x4 plot
XX X X XX X X
Ntungamo Rwamafa 100 10 6 5 *11Close spacing, closedcanopy , leaves hoveringover the test plants
X X XX
XX
Ntungamo Katureebe 95 12 7 4 *3 Spacing not so close,canopy not so closed
X XX
Ntungamo Tumusiime 92 5 8 3 *3 Wide spacing and opencanopy
XNtungamo Kyebitaama 100 2 7 8 *1 Spacing not so close,
canopy not so closed
XRakai Sekyondwa 100 9 17 6 *1 Spacing not so close,
canopy not so closed
Rakai Salongo 82 3 - 2 0 Spacing not so close,canopy not so closed
Rakai Kawalabu 100 6 - 7 0 Spacing not so close,canopy open
Rakai Muyonga 71 5 - 1 0Close spacing, closedcanopy, leaves nothovering over test plants
• *Number of infected plants of the 16 plants in the small spread trials planted in each of the 4 farms in the 2 sites and their location is illustrated in the right most column.• 1Maximum number of mealybug colonies was recorded instead of means because of mobile nature of mealybugs. 2 Percentage BSV incidence was calculated using n/N*
100, where n= number of infected plants and N = 30 total number sampled randomly in an acre of banana field.

19
GENERAL DISCUSSION AND CONCLUSIONS
The distribution/pattern of infected plants in some banana plantations in Uganda suggests
that some relatively slow moving vector is responsible for spreading BSV (Kubiriba et al.,
2001a). This was supported by the findings from the small spread trials at Rakai and
Ntungamo where BSV was observed to spread to the young, virus-indexed plants that had
been planted within the established plantations where there was high incidence of BSV.
One or more mealybug species is/are likely to be the vector of this group of badnaviruses
in the field since transmission previously has been demonstrated in the lab using at least
three different mealybug species, and in this study has so far been demonstrated with
nymphs of Dysmicoccus brevipes and a Planococcus sp. Several different mealybug
species were found colonising banana plants in Uganda and trap counts and stem counts
indicate that there can probably be both long distance movement of nymphs on air currents
and short distance movement of older stages by crawling.
Evidence so far suggests that there is BSV spread by mealybugs in the field. However,
time of first infection appears to be location specific. Reasons behind this specificity
(variation in virus strain, mealybug species, and environmental factors) require further
investigation. The indication is that roguing of infected material from fields with low BSV
incidence is likely to reduce BSV incidence and spread. However, this is only likely to be
effective where farmers are reliably able to identify BSV symptoms at very early stages of
infection. Roguing in fields with high incidence would be prohibitively expensive in terms
on labour (R7529 Final Technical Report Annex 5 &6; Baseline survey data) and would
therefore not be readily acceptable to the farmers. As to at which level of incidence
roguing becomes impractical to manage BSV has not been investigated, but should be
studied to complete the story. The costs (monetary and non-monetary) involved in roguing
are not known.
20
REFERENCES
Campbell C.L. & Madden, L.V. 1990. Introduction to Plant Disease Epidemiology. John Wileyand Sons, New York. 532 pp.
Cox, J.M. 1989. The mealybug genus Planococcus (Homoptera: Pseudococcidae). Bulletin of theBritish Museum (Natural History) (Entomology) 58(1):1-78.
Dabek, A.J., & Waller, J.M. (1990): Black Leaf Streak and Viral Leaf Streak - New BananaDiseases In East-Africa. Tropical Pest Management 36, 157-158.
Dahal, G., Hughes, J.d’A., Thottappilly, G. & Lockhart, B.E.L. 1997. Status of banana streakbadnavirus in Africa: Problems and future research needs. Integrated Pest ManagementReviews 3:1-13.
Dahal, G., Hughes, J.d’A., Thottappilly, G. & Lockhart, B.E.L. (1998). Effect of temperature onsymptom expression and reliability of banana streak badnavirus detection in naturallyinfected plantains and bananas (Musa spp.). Plant Disease 82:16-21.
De Lotto, G. 1967. The mealybugs of South Africa (Homotera: Pseudococcidae. I. Department ofAgricultural Technical services Entomology memoirs 12:1-28.
Ezzat, Y.M. and McConnel, .H.S. (1956). A classification of the mealybug tribe Planoccini(Pseudococcidae: Homoptera). Bulletin of Maryland Agriculture Experiment StationA.84:1-108.
Ferrandino, F. J. (1998): Past nonrandomness and aggregation to spatial correlation: 2DCORR, anew approach for discrete data. Phytopathology 88: 84-91.
Geering, A. D. W., Olszewski, N. E., Dahal, G., Thomas, J. E., and Lockhart, B. E. L. (2001):Analysis of the distribution and structure of integrated Banana streak virus DNA in a rangeof Musa cultivars. Molecular Plant Pathology 2, 207-213.
Gottwald, T. R., Cambra, M., Moreno, P., Camarasa, E., and Piquer , J. (1996): Spatial andtemporal analyses of citrus tristeza virus in eastern Spain. Phytopathology 86: 45-55.
Hughes, J. d'A. (1998). Banana streak Badnavirus research at the International Institute ofAgriculture. In: Banana streak virus: a unique virus-Musa interaction? pp 29-33,Proceedings of a Workshop of the PROMUSA Virology Working Group. Montpellier,France, January 19-21, 1998.
Hull, R., and Harper, G. (2001): Management strategies for banana streak virus: Variation of BSVin Uganda as an adjunct to diagnosis and epidemiology. Final Technical report of DFIDCrop Protection Programme project R7478/Za0342, John Innes Centre, Norwich.
Jones, D. R., and Lockhart, B. E. L. (1993): Banana streak disease. Musa Disease Fact Sheet, 1 p.INIBAP, Montpellier, France.
Kubiriba, J., Legg, J.P., Tushemereirwe, W. & Adipala, E. (2001a). Disease spread patterns ofbanana streak virus in farmers’ fields in Uganda. Annals of Applied Biology 139: 31-36.
Kubiriba, J., Legg, J.P., Tushemereirwe, W. & Adipala, E. (2001b). Vector transmission of bananastreak virus in the screenhouse in Uganda. Annals of Applied Biology 139: 37-49.
Lockhart, B.E.L. & Olszewski, N.E. (1993). Serological and genomic heterogeneity of bananastreak badnavirus: Implications for virus detection in Musa germplasm. In: BreedingBanana and Plantain for Resistance to Diseases and Pests, pp 105-113. Ed. J. Genry.Montpellier, France: INIBAP.
Lockhart, B.E.L., Ndowora, T.C.R., Olszewski, N.E. and Dahal, G. (1998) Studies on integrationof banana streak badnavirus sequences in Musa: Identification of episomally-expressiblebadnaviral integrants in Musa genotypes. In: Banana streak virus: a unique virus-Musainteraction ?, Proceedings of a Workshop of the PROMUSA Virology Working Group.Montpellier, France, January 19-21, 1998 pp. 42-47. Eds. E.A Frison and S. Sharrock,INIBAP, Montpellier (FRA)
21
Matile-Ferrero, D. & Williams, D.J. (1995). Recent outbreaks of mealybugs on plantain (Musaspp.) in Nigeria including a new record for Africa and a description of a new species ofPlanococcus Ferris (Homoptera: Pseudococcidae). Bulletin de la Société Entomologique deFrance 100: 445-449.
Ndowora, T.C.R. & Lockhart, B.E.L., (1997): Improved serological method for detecting bananastreak virus, Musafrica (NGA), 11: 15 (Abs. only)
Nelson, S. C., Marshal, P. L., and Campbell, C. L. (1992): 2DCLASS, A 2-Dimensional Distanceclass analysis software for the personal-computer. Plant Disease 76: 427-432.
Nelson, S. C. (1995): STCLASS – Spatiotemporal distance class analysis software for the personal-computer. Plant Disease 79: 643-648.
Perry, J.N., Bell, E.D., Smith, R.H. and Woiwod, I.P. (1996). SADIE: software to measure andmodel spatial pattern. Aspects of applied Biology, 46, 95-102.
Posnette, A.F. (1950) Virus diseases of cacao in West Africa. VII. Virus transmission by differentvector species. Annals of Applied Biology 37: 378-384.
SAS, Institute, (1989). SAS User’s Guide: Statistics SAS Institute, Cary, NC.Su, H-J (1998). First occurrence of banana streak badnavirus and studies on vectorship in Taiwan.
Pp. 20-25. In: Banana streak virus: a unique virus-Musa interaction? Proceedings of aWorkshop of the PROMUSA Virology Working Group. Montpellier, France, January 19-21,1998.
Su, H.-J. (1999) Development and Application of Molecular Diagnostic Probes for Detection,Characterization, and Management of Banana Viruses. In: A.B. Molina and V.N. Roa(Eds), Advancing banana and plantain R&D in Asia and the Pacific: Proceedings of the 9thINIBAP-ASPNET regional Advisory Committee meeting held at South China AgriculturalUniversity, Guangzhou, China - 2-5 November 1999, pp. 35-51. INIBAP, Montpellier,France.
Tushemereirwe, W.K., Karamura, E.B. and Karyeija, R. (1996). Banana Streak Virus (BSV) andassociated filamentous virus (unidentified) disease complex of highland bananas in Uganda.Infomusa 5:9-12.
Watson, G.W. and Chandler, L.R. (2000). Identification of mealybugs important in the CaribbeanRegion. Second Edition (revised). Commonwealth Science Council and CAB International,Wallingford, UK. 40 pp.
Watson, G. & Kubiriba, J. (submitted 2003) Identification of Mealybugs on Bananas and Plantainin Africa. African Entomology
Williams, D.J. & Granara de Willink, M.C. (1992). Mealybugs of Central and South America.635pp. CAB International, Wallingford, UK.
Williams, D.J. (1958). The mealybugs (Pseudococcidae: Homoptera) described by M.W.Maskell,R.Newstead, T.D.A. Cockerell and E.E.Green from Ethiopian region. Bulletin of the BritishMuseum (Natural History) (Entomology) 6 (8): 205-236.
Williams, D.J. (1989). The mealybug genus Rastrococcus (Homoptera: Pseudococcidae).Systematic Entomology 14: 433-486
Williams, D.J. and Matile–Ferrero, D. (2000). A new species of the mealybug genusCataenococcus Ferris from Ethiopia on Ensete ventricosum, a plant infected by a virus.[Hemiptera, Pseudococcidae; Musaceae]. Revue Francaise d’Entomologie (N.S.) 21(4):145-149.
IDENTIFICATION OF MEALYBUGS ON BANANA AND PLANTAIN IN AFRICA
Watson, G.W.1 & J. Kubiriba2
1Entomology Department, The Natural History Museum, Cromwell Road, London SW7 5BD,UK.2Kawanda Agricultural Research Institute, P.O.Box 7065, Kampala, Uganda.
Banana and plantain are important sources of carbohydrate and small farmer income in partsof Africa, and banana streak virus (BSV) causes serious loss of yield in some areas.Mealybugs (Hemiptera: Pseudococcidae) have been implicated in the transmission of BSV inthe region. The identity of the mealybug vector is not known, and the methods involved inmealybug identification are not widely available in Africa. This paper provides methods ofcollection and preservation, information on mealybug morphology, and an identification key toadult females of 20 species and 14 genera that may be found on Musaceae in Africa. Briefnotes are given on the species, most of which are important pests on other crops.
Key words: Hemiptera, Pseudococcidae, identification, banana, plantain, virus transmission,banana streak virus.
INTRODUCTION
Banana and plantain (Musaceae: Musa spp.) are the world’s fourth most important commodityand are grown in more than 120 countries (Harper and Hull, 1998), providing a significantsource of carbohydrates for over 400 million people in tropical regions (Anon., 1992). In thehumid forest and mid-altitude zones of sub-Saharan Africa, banana and plantain supply over25% of the carbohydrate requirement for about 70 million people (Anon., 1992). These cropsare a major source of income for small-scale farmers; any loss attributable to insect damagecan seriously affect the local economy (Matile-Ferrero & Williams, 1996).
During the last 15 years, plantain and banana production has been intensified and new pestsand diseases have arisen that cause significant yield losses (Wilson, 1988). Banana streakvirus (BSV; Genus Badnavirus ) is one of the most widely distributed viruses of Musa spp.(Lockhart, 1994; Su et al., 1997) and can cause considerable yield loss, especially whenbananas are affected at the early stages of growth. Jones and Lockhart (1993) reported up to90% loss of yield in "Poyo" plants with severe BSV symptoms. In severely infected areas inUganda, plantations suffer almost 100% loss of saleable yield (Tushemereirwe et al., 1996).
All the forms of BSV can be transmitted to daughter plants during vegetative propagation froman infected host, but it is believed that only the episomal forms can be transmitted by a vector.Virus transmission by mealybugs has been little studied but two species, Planococcus citri(Risso) and Saccharicoccus sacchari (Cockerell), have been reported transmitting BSVbetween banana plants under screenhouse conditions (Lockhart and Olszewski, 1993).However, these mealybug species are not found commonly on banana or plantain in the field.More virus transmission studies of mealybugs on Musaceae in Africa are needed.
Little has been published on the identification of mealybugs in Africa in recent years; Millar (inpress) provided a key to the mealybug genera of South Africa. Several mealybug specieshave been identified on Musa spp. in Africa (Matile-Ferrero & Williams, 1995), but themethods involved in their identification are not widely available in the region. It is important tobe able to identify the mealybug vectors of BSV in order to facilitate their control. This paperprovides methods of collection, preservation and an identification key to adult females of 20species of mealybug in Africa that may be found on Musaceae. Many of the speciesdiscussed are important pests on other crops also; brief notes on the species are provided.
METHODS
Mealybug species on plantain mentioned in Matile-Ferrero & Williams (1995), and samplescollected on Musaceae from Africa in The Natural History Museum, London, UK collection
were listed. In addition, samples from Musaceae in Africa (mainly Uganda) were collected,prepared and identified.
Collection of mealybugsMealybugs avoid sunlight and occur on leaf undersides or in crevices, axils, under bark oreven on the roots (Watson and Chandler, 2000), so plants were examined very closely and ingood light. On banana and plantain, mealybugs were found under the pseudo-stem leafsheaths, on the roots and sometimes in banana weevil tunnels in the pseudo-stem. Ants oftenattended the colonies to collect their honeydew, and sooty mould often grew on honeydewdeposits that had accumulated on surfaces below the colony. To ensure collection of adultfemales, specimens of various sizes were collected. Pieces of infested plant were collectedinto polythene bags because picking individual insects off the plant often damaged them.Samples were kept in a well ventilated, shady, cool place for transport back to the laboratory.In the laboratory, the appearance of the mealybugs in life was noted or recorded bymacrophotography, using a dissection microscope and incident illumination. The appearanceof the insects in life was lost once they were immersed in alcohol.
Preservation of mealybugsLive mealybugs are soft and easily damaged with forceps, so small pieces of infested plantwere placed in a tube of 80% ethanol to kill and preserve specimens of a variety of sizes. Thecollection data was written in pencil on paper that was then inserted into the tube with thespecimens. Each tube of newly killed mealybugs was immediately stood in a bowl of recentlyboiled water for 15-20 minutes to speed fixation and denature enzymes that might otherwiseturn the body contents black. Good fixation, and storage in ethanol for 1-3 weeks to partlydissolve the waxy covering and toughen the cuticle, made it easier to produce good slidepreparations.
Selection of specimens for identificationMealybug species are identified using minute details on the cuticle of the adult female (Figure1), because male mealybugs (which are winged) have not been widely studied. The bestspecimens to prepare for identification are young adult females with small bodies, as theycontain few eggs and require less manipulation to clean out the body contents. Each adultfemale is larviform but possesses large legs, a vulva and usually has multilocular disk porespresent. Immature females have smaller legs and fewer antennal segments and pairs ofcerarii than adults; they also lack a vulva or multilocular disk pores, so they cannot beidentified with confidence using keys to the adult females.
Preparation of mealybugs for identificationRecipes of the reagents required for the preparation of slide-mounts of mealybugs are givenin Table 1. The schedule used for preparation of microscope slide mounts of adult femalemealybugs for identification is in Table 2. Specimens were processed in solid glass cavityblocks with lids and were never allowed to dry out, to avoid air becoming trapped in the body.Slide preparation was carried out using a dissection microscope with a glass stage andtransmitted light from below; samples were heated in covered cavity blocks on athermostatically controlled dri-block, or in test-tubes in a water bath.
RESULTS
Nineteen species of mealybug, belonging to 13 genera, have been collected from Musaceae(mainly banana and plantain) in Africa. Adult females of these species may be identified usingthe key below. Another genus and species, Planococcoides njalensis (Laing), is included inthe key even though it has never been collected from Musaceae, because it is a highlypolyphagous species and a known virus vector (on cacao).

Key to mealybug species on Musaceae in Africa (adult females)
1. Anal lobes strongly projecting, heavily sclerotised, each tipped with a spine-like anal seta;circuli numbering 2 or 3; eyes absent; venter of head bearing 2 large, thick setae
Geococcus coffeae (Green)-- Anal lobes only moderately developed, no more than partially sclerotised, each tipped
with a slender anal seta; a single circulus present; eyes present; extra-thick setae absentfrom venter of head ...........................................................................................2
2. Antennae each with 9 segments ........................................................................3-- Antennae each with 6-8 segments .....................................................................6
3. Cerarian setae with truncate tips .........................................genus Rastrococcus 4-- Cerarian setae with sharp tips.............................................................................5
4. Ventral multilocular disc pores present as far forward as thorax; dorsal setae beside analring much longer than on other segments; anterior ostioles present; circulus usuallyabout 7x as wide as long..................................... Rastrococcus iceryoides (Green)
-- Ventral multilocular disc pores only present posterior to circulus; dorsal setae near analring approximately the same length as those on other abdominal segments; anteriorostioles absent; circulus usually about 5x as wide as long..................................................................................................................Rastrococcus invadens Williams
5. Oral rim tubular ducts present in several rows across dorsum of each segment; cerariinumbering 4-6 pairs, situated on posterior segments of abdomen; anal lobe bar present(not always well developed); quinquelocular pores absent .............................................................................................................. Maconellicoccus hirsutus (Green)
-- Oral rim tubular ducts absent; cerarii numbering 18 pairs, distributed around entiremargin; anal lobe bar absent; quinquelocular pores numerous on venter .............................................................................................. Phenacoccus parvus Morrison
6. Antennae each with 6 or 7 segments...................................................................7-- Antennae with 8 segments .................................................................................9
7. Antennae each with 6 segments; legs short and very robust, with tibia + tarsus shorterthan trochanter + femur; cerarii present on head; anus situated more than 1.5x its ownlength from apex of abdomen; anal lobe bar present .........................................................................................................................Paraputo anomalus (Newstead)
-- Antennae each with 7 segments; legs quite slender, with tibia + tarsus longer thantrochanter + femur; cerarii absent from head (although single enlarged setae may bepresent); anus apical or situated no more than 0.5x its length from apex of abdomen;anal lobe bar present .........................................................................................8
8. Cerarii numbering 4-7 pairs, situated on posterior abdominal segments; circulus small,situated within the boundaries of abdominal segment 3; dorsal setae conical; multiloculardisc pores only present posterior to circulus; minute thick-rimmed pores absent fromaround base of hind coxa ......................................... Nipaecoccus nipae (Maskell)
-- A single pair of cerarii present, situated on anal lobes; circulus very large and dumbbell-shaped, situated at the boundary between abdominal segments 3 and 4; dorsal setaerobust flagellate; multilocular disc pores present on all segments; minute thick-rimmedpores present on cuticle around base of hind coxaSaccharicoccus sacchari (Cockerell)
9. Large oral rim ducts present on dorsum, each duct with several setae located within thesclerotised rim ..............................................................Ferrisia virgata (Cockerell)
-- Oral rim ducts, if present, each without any setae located within the rim .............. 10
10. Cerarii forming an almost continuous marginal band, due to the presence of numerousintermediate cerarii; dorsal setae each with a curved tip; anal lobe cerarii each containing3 or more cerarian setae, and venter of anal lobe widely sclerotised Cataenococcusensete Williams & Matile-Ferrero

-- Cerarii distinct, numbering 17 or 18 pairs; dorsal setae not strongly curved at tips; if anallobe with more than 2 cerarian setae, then venter of lobe with an anal lobe bar ... 11
11. Cerarii numbering 18 pairs (with 3 pairs present anterior to the eyes); anal lobe barpresent............................................................................................................ 12
-- Cerarii numbering 17 pairs (with only 2 pairs anterior to the eyes); anal lobe with ventralsclerotisation triangular or oval or bar-shaped.................................................... 15
12. Abdominal cerarii each with 3 or more conical setae; legs short and very robust, with tibia+ tarsus shorter than trochanter + femur; dorsal and ventral setae very long. Notrecorded from Musaceae so far ........................... Planococcoides njalensis (Laing)
-- Abdominal cerarii each with only 2 conical setae; legs moderately robust or slender,each with tibia + tarsus usually as long as or longer than trochanter + femur; dorsal setaeshort ............................................................................... genus Planococcus 13
13. Eye associated with disc pores; circulus small, 40-50 �m wide; disc pores each almostas large as a multilocular disc pore... Planococcus musae Matile-Ferrero & Williams
-- Eye not associated with any disc pores; circulus more than 100 �m wide; disc poreseach same size as or slightly larger than a trilocular pore ................................... 14
14. Oral collar tubular ducts present on margins of head and thorax; small group of discpores present on dorsal midline of anterior abdominal and thoracic segments; hind femurnever with translucent pores ............................................ Planococcus citri (Risso)
-- Oral collar tubular ducts absent from margins of thorax, and scarce or absent from head;disc pores never forming groups on midline of abdominal or thoracic segments; hindfemur sometimes with translucent pores present distallyPlanococcus ficus (Signoret)
15. Oral rim tubular ducts present on dorsum (check head) ...................................... 16-- Oral rim ducts absent from dorsum.................................... genus Dysmicoccus 19
16. Anal lobe bar present; cerarii each without any auxiliary (flagellate) setae; hind femurwithout any translucent pores .................................... Paracoccus burnerae (Brain)
-- Ventral sclerotisation of anal lobe oval or triangular; cerarii each containing auxiliary(flagellate) setae; hind femur always with translucent pores present ................... 17
17. Most cerarii each with 2 or 3 dorsal oral rim tubular ducts present nearby; penultimateand anal lobe cerarii large and sclerotised, other cerarii not sclerotised; multilocular discpores present only immediately next to vulva Pseudococcus longispinus (TargioniTozzetti)
-- Each cerarius with no more than 1 dorsal oral rim duct present nearby; if penultimatecerarius sclerotised, then so are all the other cerarii; multilocular disc pores present atleast as far forward as circulus.......................................................................... 18
18. All cerarii sclerotised to some degree; multilocular disc pores present only posterior tocirculus; dorsal oral rim ducts numbering fewer than 7, never present on midline ofposterior abdominal segments .............................. Pseudococcus cryptus Hempel
-- Only anal lobe cerarii sclerotised; multilocular disc pores present on thorax as well asabdomen; dorsal oral rim ducts numbering more than 7, some present on midline ofsome posterior abdominal segments ............... Pseudococcus comstocki (Kuwana)
19. Eye associated with disc pores; dorsum of abdominal segment 8 (just anterior to analring) bearing setae much longer than on preceding segments, and numerous disc pores,each larger than a trilocular pore ........................Dysmicoccus brevipes (Cockerell)
-- Eye not associated with disc pores; dorsum of abdominal segment 8 with setae notsignificantly longer than those on preceding segments; any disc pores present onsegment 8 each not larger than a trilocular pore ......Dysmicoccus grassii (Leonardi)
Notes on the mealybug speciesCataenococcus ensete Williams & Matile-Ferrero is a morphologically variable species thatwas described by Williams & Matile-Ferrero (2000) on Ensete ventriculosum from Ethiopia.The species was found on trees infected with ensete streak virus, a badnavirus that is thoughtlikely to be related to BSV and sugarcane streak virus. There is no direct evidence yet thatthis mealybug species transmits the virus. It has not been recorded from any other host plant.Williams & Matile-Ferrero (2000) illustrated C. ensete and discussed its separation from otherspecies of Cataenococcus.
Dysmicoccus brevipes (Cockerell) is a polyphagous and tropicopolitan species that iscommon and widespread throughout Africa (Ben-Dov, 1994; Matile-Ferrero & Williams, 1996).It occurs on both aerial and subterranean parts of its host-plants, and shows a preference forsweetness, often causing problems on pineapple, fruit trees and sugarcane (Watson &Chandler, 2000). Dysmicoccus brevipes was recorded on plantain and Musa sp. from Eritrea,Ghana, Nigeria, Sierra Leone and Uganda by Williams & Matile-Ferrero (2000); at least someof these samples were collected from plants showing banana streak virus symptoms. Thespecies was illustrated and discussed by Williams & Watson, 1988, and Williams & Granarade Willink (1992).
Dysmicoccus grassii (Leonardi) (synonym D. alazon Williams) is a fairly polyphagousmealybug from Central and South America that often feeds on fruit and beverage trees andon vegetables. It is injurious to bananas in the Canary Islands, where heavy infestations ofthe axis and fruit bunches causes premature ripening and reduced productivity. The specieswas recorded from Nigeria on false horn plantain, on the pseudostem under the dead leafsheaths, by Matile-Ferrero & Williams (1966); some of the host-plants were dying of viralinfection. The species was illustrated and discussed (as D. alazon) by Williams & Granara deWillink (1992). There is a risk that this damaging mealybug may spread to other parts of sub-Saharan Africa.
Ferrisia virgata (Cockerell) is one of the commonest, most tropicopolitan species and iswidespread in most of Africa; it is highly polyphagous, occurring on aerial parts of mainlywoody hosts. The species is quite distinctive in life, with two long, white wax pencils at theposterior end and paired dark grey, longitudinal streaks on the dorsum (Watson et al., 1995,provided a photograph). It was recorded on Musa paradisiaca from Ghana by Williams &Matile-Ferrero (2000). Williams & Watson (1988) illustrated F. virgata and the similar speciesF. malvastra McDaniel (under the synonym F. consobrina Williams & Watson). Ferrisiamalvastra has been recorded from Ghana, Somalia and Sudan; Williams (1996) provided akey to all the known species of Ferrisia.
Geococcus coffeae Green is a small, root-feeding mealybug with distinctive, prominent anallobes and setae, giving it a pincer-like appearance at the posterior end. The species ispolyphagous and has been recorded from the roots of beverage and fruit trees (includingMusa sp.), vegetables (including sweet potato), tobacco and grapes. Geococcus coffeae hasbeen recorded from Ghana, Nigeria, Uganda, Kenya and Zanzibar (Ben-Dov, 1994), but noton Musacaeae. It was illustrated and discussed by Williams (1958), Williams & Watson (1988)and Williams & Granara de Willink (1992).
Maconellicoccus hirsutus (Green) is a highly polyphagous, damaging mealybug thatoriginated in southern Asia. Since the early 1990s it has spread to the Caribbean, Central andnorthern South America, California, Florida, Hawaii and Samoa, causing concern. The salivaof this insect causes severe distortion of young growth, defoliation and even plant death insensitive host-plants (e.g. species of Albizzia, Pithecellobium and Hibiscus). Some workershave attributed this damage to transmitted viruses (on cacao in Zanzibar (De Lotto, 1967a)and on mulberry in India (Tewari et al., 1994)), but no evidence of virus transmission hasbeen found. Members of the genus Hibiscus are favourite hosts; Musaceae are not, but M.hirsutus has been recorded feeding on Musa sp. In Africa this mealybug has been recordedfrom Benin, Burkina Faso, Cameroon, Central African Republic, Chad, Congo Republic,Gabon, Côte d'Ivoire, Kenya, Liberia, Niger, Nigeria, Senegal, Somalia, Sudan, Tanzania andZaire, and has been intercepted from Zambia at Chicago, USA (Williams, 1996), but never onMusaceae. Maconellicoccus hirsutus was illustrated and discussed by Williams (1996a), and

characters distinguishing it from M. ugandae (known from Cameroon, Ghana, Sudan andUganda) were given by Williams (1986).
Nipaecoccus nipae (Maskell) is a mealybug native to the Neotropical Region that feeds onfruit trees (especially guava) and palms. In life, it is a small species that feeds on leafundersides and develops a pattern of white or pale yellow wax cushions on the dorsum,suggestive of a quilt. It has been recorded from South Africa, Tanzania (including Zanzibar)and Zimbabwe on palms but not Musaceae; however, it has been recorded feeding on Musasp. elsewhere (Ben-Dov, 1994). Williams & Granara de Willink (1992) illustrated anddiscussed N. nipae.
Paracoccus burnerae (Brain) is a fairly polyphagous species that is native to South Africa,where it is one of the three most important species on citrus (Hattingh, 1993); it has also beenrecorded from Kenya, Angola, Zimbabwe and Zaire on a variety of hosts including Neriumoleander. The species was recorded on Ensete sp. from Kenya by Ben-Dov (1994) andWilliams & Matile-Ferrero (2000), and illustrated and discussed by De Lotto (1967); Ben-Dov(1994) summarized its taxonomy.
Paraputo anomalus (Newstead) (synonyms P. ritchiei Laing and P. multispinosa James) is amorphologically variable species with the anus situated dorsally. It was recorded on the rootsof Musa sp. from Uganda by Williams & Matile-Ferrero (2000) and is also known to occur inGhana, Kenya and Tanzania on the trunks of a variety of trees, sometimes under the barkand attended by ants. Paraputo anomalus was illustrated and discussed by Williams (1958).
Phenacoccus parvus Morrison is a fairly polyphagous, neotropical mealybug that has beenspreading through the Pacific islands, Australia and southern Asia over the last twenty years.It can be damaging to vegetables and herbaceous plants, especially Solanaceae, if itsprincipal host (Lantana camara) is growing nearby (Marohasy, 1994). The species has beencollected from Gabon, Senegal and Congo Republic (Williams & Granara de Willink, 1992)but not on Musaceae; however, it has been recorded on Musa sp. from elsewhere (Ben-Dov,1994). Williams & Granara de Willink (1992) provided an illustration and discussion, andWatson et al. (1995) provided a photograph.
Planococcoides njalensis (Laing) is a highly polyphagous African species, known fromCameroon, Benin, Ghana, Guinea, Côte d'Ivoire, Liberia, Nigeria, Principe, São Tomé, SierraLeone, Togo, Zaire and Ethiopia. The species is the most important vector of swollen shootvirus disease of cocoa (Strickland, 1951a, 1951b). There are no records of this speciesattacking Musaceae so far, but the species is included here because it may yet be found onthese hosts. Ezzat & McConnell (1956) redescribed and illustrated P. njalensis.
Planococcus citri (Risso) is a highly polyphagous, cosmopolitan species of Old World origin;in Africa it is known to occur in Angola, Côte d'Ivoire, Eritrea, Ethiopia, Ghana, Kenya,Malawi, Nigeria, Principe, São Tomé, Senegal, Sierra Leone, South Africa, Sudan, Swaziland,Tanzania (including Zanzibar), Zaire, Zambia and Zimbabwe. It has been recorded on a widevariety of fruit, beverage and vegetable crops and ornamental plants including Musaceae.Planococcus citri was recorded on Musa paradisiaca from Ghana by Williams & Matile-Ferrero, 2000. The species was illustrated and discussed by Cox (1989); Watson et al. (1995)provided a photograph. The species is very difficult to separate from P. minor (Maskell) andP. ficus, so expert identification is recommended.
Planococcus ficus (Signoret) is a fairly polyphagous species of Old World origin, possibly fromthe Middle East or the Indian subcontinent. In Africa, it has been recorded from Angola,Egypt, Ethiopia, Libya, South Africa and Sudan. It was recorded on Ensete ventricosum fromEthiopia by Williams & Matile-Ferrero, 2000. The species was illustrated and discussed byCox (1989), and is very difficult to separate from P. citri and P. minor (Maskell); expertidentification is recommended.
Planococcus musae Matile-Ferrero & Williams was described from Nigeria on false hornplantain showing symptoms of banana streak virus. There was no evidence to show that thismealybug was the virus vector. The species has not been recorded from any other host-plant.
Matile-Ferrero & Williams (1996) illustrated P. musae and discussed its separation from otherspecies of Planococcus in Africa.
Pseudococcus comstocki (Kuwana) is a polyphagous species of Palaearctic origin. In Africa ithas only been identified twice, once from Ghana (on Irish potato) and once, tentatively, fromKenya (on coffee); however, it has been recorded feeding on Musa sp. elsewhere (Ben-Dov,1994). This species is a serious pest of deciduous fruit trees in the eastern USA and Japan.Williams & Granara de Willink (1992) illustrated and discussed P. comstocki and how todistinguish it from the similar P. cryptus.
Pseudococcus cryptus Hempel (P. citriculus Green is a synonym) is a polyphagous speciesthat is fairly widespread in the tropics. In Africa it has been recorded only from Tanzania(Zanzibar and possibly Dar es Salaam), on Citrus and Cocos nucifera; however, it has beenrecorded on Musa sp. elsewhere (Ben-Dov, 1994). It is often found on citrus and palms,which it can damage. In life this species resembles P. longispinus, but the wax pencils areshorter and the posterior pair are divergent and always shorter than the body (Watson et al.,1995, provided a photograph). Williams & Granara de Willink (1992) illustrated and discussedP. cryptus and how to distinguish it from the similar P. comstocki.
Pseudococcus longispinus (Targioni Tozzetti) is a highly polyphagous, cosmopolitan speciesof Old World origin, that feeds on a wide variety of woody and herbaceous hosts includingfruit trees, vegetable crops and ornamental plants. First-instar P. longispinus on grapevinesare vectors of grapevine leafroll-associated (?) closterovirus, GLRaV-3 (Peterson & Charles,1997) and grapevine trichovirus A (GAV) (Notte et al., 1997). The species is also associatedwith pitting of grapevine stems (Rosciglione and Gugerli, 1986) and is an important pest onthis crop in European and Mediterranean countries, Australia and New Zealand. In Africa ithas been recorded from Ghana, Kenya, Malawi, Nigeria, São Tomé, South Africa, Tanzania(including Zanzibar), Togo, Zaire and Zimbabwe. There is no record of P. longispinus onMusaceae in Africa, but it has been recorded on Musa sapientum elsewhere (Ben-Dov,1994). In life, undisturbed mature females develop parallel white wax pencils at the posteriorend that are up to three times as long as the body, and shorter pencils around the rest of thebody margin. The species was illustrated and discussed in Williams & Watson (1988) andWilliams & Granara de Willink (1992).
Rastrococcus iceryoides (Green) is a species native to southern Asia that has been longestablished on the east coast of Africa (Kenya, Tanzania including Zanzibar) (Williams, 1989);it spread inland during the early 1990s to the Tanzania/Malawi boarder, where it causedserious damage to mango. In life, the species resembles rather small cottony cushion scale(Icerya purchasi Maskell, Hemiptera: Margarodidae). It is quite polyphagous and attacks theleaf mid-veins and flowers of fruit trees; it was recorded on Musa sp. from Tanzania(Zanzibar) by Williams & Matile-Ferrero (2000). Williams (1989) illustrated and discussed R.iceryoides.
Rastrococcus invadens Williams is native to southern Asia but was accidentally introduced toGhana and Togo in 1981-2 and has since spread to Benin, Nigeria, Sierra Leone and CongoRepublic. Like R. iceryoides, it feeds along the leaf veins and attacks a wide range of fruittrees; it can be very damaging to mango (Williams, 1989). In life, R. invadens develops verylong, slender white wax pencils from the body margins; Williams (1989) provided aphotograph, an illustration and discussion. It was recorded on Musa sp. and M. paradisiacafrom Congo Republic, Ghana and Togo by Williams & Matile-Ferrero (2000).
Saccharicoccus sacchari (Cockerell) is normally found feeding on aerial parts of sugarcane,although it has been recorded moving (with the aid of ants) to the stem just below the soilsurface after harvest (Williams & Granara de Willink, 1992). This species has not beencollected from Musaceae in the field, but has been reported transmitting BSV betweenbanana plants under screenhouse conditions (Lockhart and Olszewski, 1993). It is knownfrom Ghana, Angola, Namibia, South Africa, Zimbabwe, Malawi, Tanzania, Uganda, Kenya,Somalia, Ethiopia, Sudan and Egypt. Williams (1970; 1985), Williams & Watson (1988) andWilliams & Granara de Willink (1992) illustrated and discussed S. sacchari.
CONCLUSION
Mealybugs have been little studied as vectors of virus diseases, although there is evidencethat they can be important vectors of viruses in plantation crops and vineyards. Studies areneeded to identify the species responsible for transmission of important plant virus diseases,as once the vector's identity is known there may be good potential for vector control by host-specific natural enemies. Mealybugs have relatively host-specific hymenopteran parasitoidsthat have been used very successfully in classical biological control programmes, e.g. ofPhenacoccus manihoti on cassava across equatorial Africa (Zeddies et al., 2001), andRastrococcus invadens on mango and other fruit trees in West Africa (Vögele et al., 1991).
Little has been published on the identification of mealybugs in Africa in recent years; Millar (inpress) provided a key to the mealybug genera of South Africa. Several mealybug specieshave been identified on Musa spp. in Africa (Matile-Ferrero & Williams, 1995), but themethods involved in their identification are not widely available in the region. It is important tobe able to identify the mealybug vectors of BSV in order to facilitate their control.
ACKNOWLEDGEMENTS
The authors would like to thank Dr Richard Vane-Wright, Keeper of Entomology, The NaturalHistory Museum, for making the Museum collection and Library freely available for this work.Figure 1 is reproduced with the kind permission of the Trustees of The Natural HistoryMuseum, London, UK.This publication is in part an output from a project funded by the United Kingdom Departmentfor International Development (DFID) for the benefit of developing countries. The viewsexpressed are not necessarily those of DFID. (R7529/Za0365; Crop Protection Programme).
REFERENCES
ANON. 1992. Plantain and bananas. Pp. 86--91 in: Sustainable Food Production and sub-Saharan Africa. International Institute of Tropical Agriculture, Ibadan, Nigeria. 186 pp.BEN-DOV, Y. 1994. A systematic catalogue of the mealybugs of the world. Intercept Ltd.,Andover, UK. 686 pp.COX, J.M. 1989. The mealybug genus Planococcus (Homoptera: Pseudococcidae). Bulletinof the British Museum (Natural History) (Entomology) 58 (1): 1--78.DE LOTTO, G. 1967. The mealybugs of South Africa (Homoptera: Pseudococcidae), I.Department of Agricultural Technical Services Entomology Memoirs 12: 1--28.DE LOTTO, G. 1967a. A contribution to the knowledge of the African Coccoidea (Homoptera).Journal of the Entomological Society of Southern Africa 29: 109--120.EZZAT, Y.M. & McCONNELL, H.S. 1956. The mealybug tribe Planococcini (Pseudococcidae:Homoptera). Bulletin of the Maryland Agriculture Experiment Station A 84: 1--108.HARPER, G. & HULL, R. 1998. Cloning and sequence analysis of banana streak virus DNA.Virus Genes 17: 271--278.HATTINGH, V. 1993. Mealybugs and cottony cushion scale on citrus in Southern Africa.Citrus Journal 3 (2): 20--22.JONES, D.R. & LOCKHART, B.E.L. 1993. Banana Streak Disease. Musa fact sheet No.1.International Network for the Improvement of Banana and Plantain, Montpellier, France. 2 pp.LOCKHART, B.E.L. 1994. Banana streak virus. Pp. 19-20 in: R.C.Ploetz, G.Gentymer, W.T.,Nishijima, K.G., Rohrbach & Ohr, H.D (Eds) Compedium of plant diseases. St. Paul MN: APS.Press, Philadephia, USA. 264 pp.LOCKHART, B.E.L. & OLSZEWSKI, N.E. 1993. Serological and genomic heterogeneity ofbanana streak badnavirus: implications for virus detection in Musa germplasm. Pp 105--113in: GENRY, J. (Ed.) Breeding Banana and Plantain for Resistance to Diseases and Pests.International Network for the Improvement of Banana and Plantain, Montpellier, France. 393pp.MAROHASY, J. 1994. The pest status of Phenacoccus parvus Morrison (Homoptera:Pseudococcidae). International Journal of Pest Management 40 (4): 337--340.MATILE-FERRERO, D. & WILLIAMS, D.J. 1996. Recent outbreaks of mealybugs on plantain(Musa spp.) in Nigeria including a new record for Africa and a description of a new species of
Planococcus Ferris (Homoptera, Pseudococcidae). Bulletin de la Société Entomologique deFrance (1995) 100: 445--449.MILLAR, I.M. (in press). Mealybug genera (Hemiptera: Pseudococcidae) of South Africa:identification and review. African Entomology 10 (2).NOTTE, P. LA, BUZKAN, N., CHOUEIRI, E., MINAFRA, A. AND MARTELLI, G.P. 1997.Acquisition and transmission of grapevine virus A by the mealybug Pseudococcuslongispinus. Journal of Plant Pathology 78 (1): 79--85.PETERSEN, C.L. & CHARLES, J.G. 1997. Transmission of grapevine leafroll-associatedclosteroviruses by Pseudococcus longispinus and P. calceolariae. Plant Pathology 46 (4):509--515.ROSCIGLIONE, B. & GUGERLI, P. 1986. Leaf roll and stem pitting diseases of grapevine:microscopic and serological analysis. Revue Suisse de Viticulture, d'Arboriculture etd'Horticulture 18 (4): 207--211.STRICKLAND, A.H. 1951a. The entomology of swollen shoot of cacao. - I. The insect speciesinvolved, with notes on their biology. Bulletin of Entomological Research 41: 525--748.STRICKLAND, A.H. 1951b. The entomology of swollen shoot of cacao. - II. Bionomics andecology of the species involved. Bulletin of Entomological Research 42: 65--103.SU, H.J., HUNG, T.H. & WU, M.L. 1997. First report of banana streak virus infecting bananacultivars (Musa sp.) in Taiwan. Plant Disease 81: 550.TEWARI, S.K., KUMAR, V. & DATTA, R.K. 1994. Scanning electron microscope observationson the mealybug, Maconellicoccus hirsutus (Green), a major pest of mulberry (Homoptera:Pseudococcidae). Giornale Italiano di Entomologia 7 (38): 157--164.TUSHEMEREIRWE, W.K., KARAMURA, E.B. & KARYEIJA, R. 1996. Banana streak virus(BSV) and associated filamentous virus (unidentified) disease complex of highland bananasin Uganda. InfoMusa 5: 9--12 .VÖGELE, J.M., AGOUNKE, D. & MOORE, D. 1991. Biological control of the fruit treemealybug Rastrococcus invadens Williams in Togo: a preliminary sociological and economicevaluation. Tropical Pest Management 37 (4): 379--382.WATSON, G.W. & CHANDLER, L.R. 2000. Identification of mealybugs important in theCaribbean region. Second edition (revised). Commonwealth Science Council and CABInternational, Wallingford, UK. 40 pp.WATSON, G.W., OOI, P.A.C. & GIRLING, D.J. 1995. Insects on plants in the Maldives andtheir management. International Institute of Biological Control, Ascot, UK. 128 pp.WILLIAMS, D.J. 1958. The mealybugs (Pseudococcidae: Homoptera) described by M.W.Maskell, R. Newstead, T.D.A. Cockerell and E.E. Green from the Ethiopian region. Bulletin ofthe British Museum (Natural History) (Entomology) 6 (8): 205--236.WILLIAMS, D.J. 1970. The mealybugs (Homoptera, Coccoidea, Pseudococcidae) of sugar-cane, rice and sorghum. Bulletin of Entomological Research 60: 109--188.WILLIAMS, D.J. 1985. Australian mealybugs. British Museum (Natural History), Dorchester,UK. 431 pp.WILLIAMS, D.J. 1989. The mealybug genus Rastrococcus (Homoptera: Pseudococcidae).Systematic Entomology 14: 433--486.WILLIAMS, D.J. 1996. A synoptic account of the mealybug genus Ferrisia Fullaway (Hem.,Pseudococcidae). Entomologist's Monthly Magazine 132: 1--10.WILLIAMS, D.J. 1996a. A brief account of the hibiscus mealybug Maconellicoccus hirsutus(Hemiptera: Pseudococcidae), a pest of agriculture and horticulture, with descriptions of tworelated species from southern Asia. Bulletin of Entomological Research 86: 617--628.WILLIAMS, D.J. & GRANARA DE WILLINK, M.C. 1992. Mealybugs of Central and SouthAmerica. CAB International, Wallingford, UK. 635 pp.WILLIAMS, D.J. & MATILE-FERRERO, D. 2000. A new species of the mealybug genusCataenococcus Ferris from Ethiopia on Ensete ventricosum, a plant infected by a virus[Hemiptera, Pseudococcidae; Musaceae]. Revue francaise d’Entomologie (N.S.) 21(4): 145--149.WILLIAMS, D.J. & WATSON, G.W. 1988. The scale insects of the tropical South Pacific region.Part 2. The mealybugs (Pseudococcidae). CAB International, Wallingford, UK. 260 pp.WILSON, G.F. (Ed.) 1988. Plantain in western Africa: report of a mission organized byINIBAP and sponsored by IFAD, IITA and IRFA-CIRAD. International Network for theImprovement of Banana and Plantain, Montpellier, France. Pagination?ZEDDIES, J., SCHAAB, R.P., NEUENSCHWANDER, P. & HERREN, H.R. 2001. Economicsof biological control of cassava mealybug in Africa. Agricultural Economics 24 (2): 209--219.
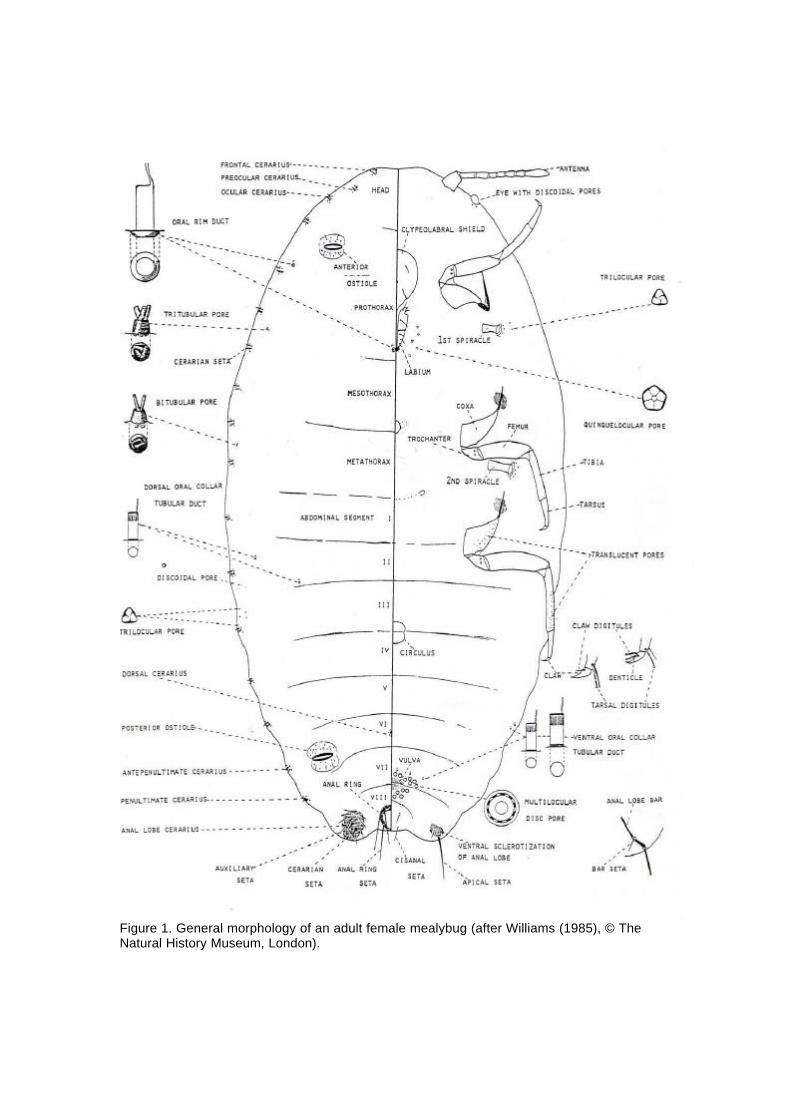
Figure 1. General morphology of an adult female mealybug (after Williams (1985), © TheNatural History Museum, London).
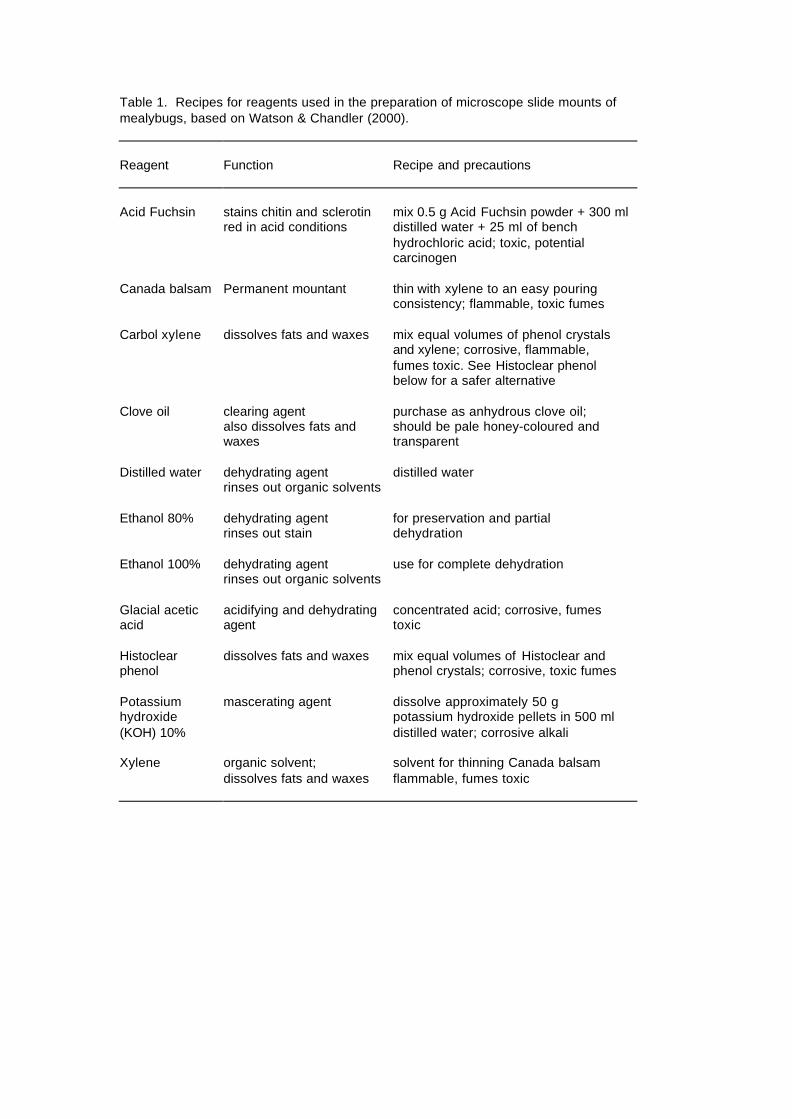
Table 1. Recipes for reagents used in the preparation of microscope slide mounts ofmealybugs, based on Watson & Chandler (2000).
Reagent Function Recipe and precautions
Acid Fuchsin stains chitin and sclerotinred in acid conditions
mix 0.5 g Acid Fuchsin powder + 300 mldistilled water + 25 ml of benchhydrochloric acid; toxic, potentialcarcinogen
Canada balsam Permanent mountant thin with xylene to an easy pouringconsistency; flammable, toxic fumes
Carbol xylene dissolves fats and waxes mix equal volumes of phenol crystalsand xylene; corrosive, flammable,fumes toxic. See Histoclear phenolbelow for a safer alternative
Clove oil clearing agentalso dissolves fats andwaxes
purchase as anhydrous clove oil;should be pale honey-coloured andtransparent
Distilled water dehydrating agentrinses out organic solvents
distilled water
Ethanol 80% dehydrating agentrinses out stain
for preservation and partialdehydration
Ethanol 100% dehydrating agentrinses out organic solvents
use for complete dehydration
Glacial aceticacid
acidifying and dehydratingagent
concentrated acid; corrosive, fumestoxic
Histoclearphenol
dissolves fats and waxes mix equal volumes of Histoclear andphenol crystals; corrosive, toxic fumes
Potassiumhydroxide(KOH) 10%
mascerating agent dissolve approximately 50 gpotassium hydroxide pellets in 500 mldistilled water; corrosive alkali
Xylene organic solvent;dissolves fats and waxes
solvent for thinning Canada balsamflammable, fumes toxic
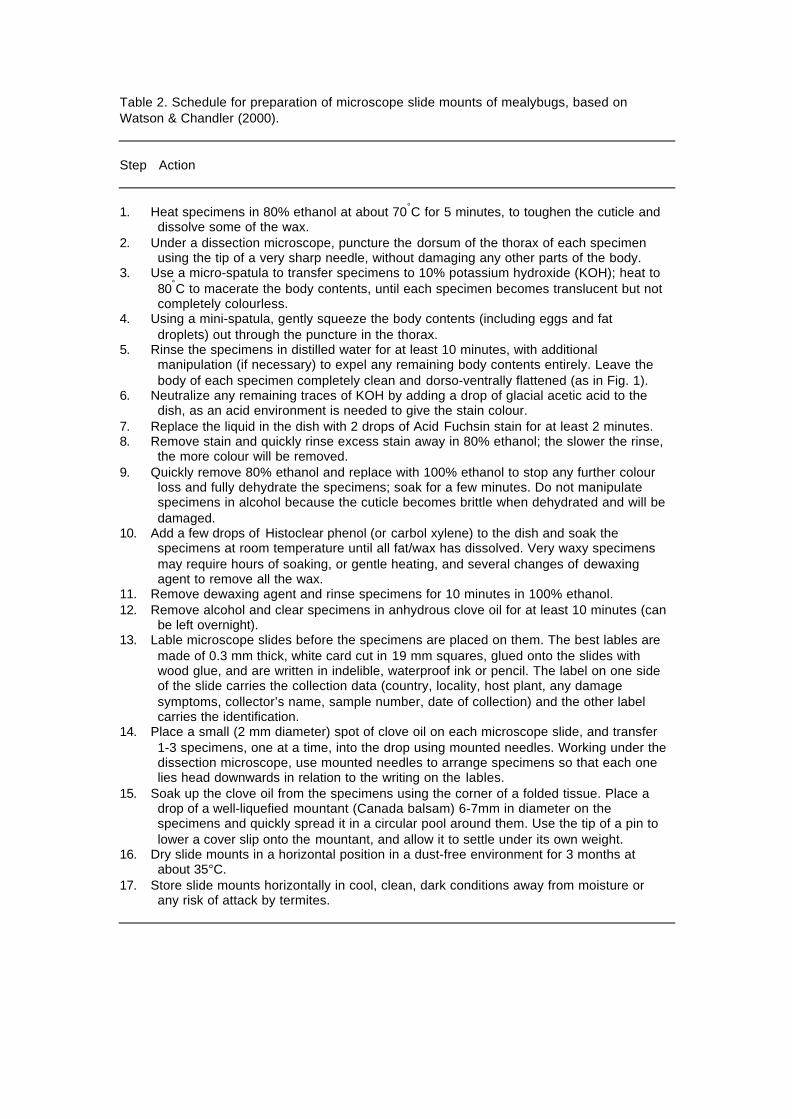
Table 2. Schedule for preparation of microscope slide mounts of mealybugs, based onWatson & Chandler (2000).
Step Action
1. Heat specimens in 80% ethanol at about 70°C for 5 minutes, to toughen the cuticle anddissolve some of the wax.
2. Under a dissection microscope, puncture the dorsum of the thorax of each specimenusing the tip of a very sharp needle, without damaging any other parts of the body.
3. Use a micro-spatula to transfer specimens to 10% potassium hydroxide (KOH); heat to80°C to macerate the body contents, until each specimen becomes translucent but notcompletely colourless.
4. Using a mini-spatula, gently squeeze the body contents (including eggs and fatdroplets) out through the puncture in the thorax.
5. Rinse the specimens in distilled water for at least 10 minutes, with additionalmanipulation (if necessary) to expel any remaining body contents entirely. Leave thebody of each specimen completely clean and dorso-ventrally flattened (as in Fig. 1).
6. Neutralize any remaining traces of KOH by adding a drop of glacial acetic acid to thedish, as an acid environment is needed to give the stain colour.
7. Replace the liquid in the dish with 2 drops of Acid Fuchsin stain for at least 2 minutes.8. Remove stain and quickly rinse excess stain away in 80% ethanol; the slower the rinse,
the more colour will be removed.9. Quickly remove 80% ethanol and replace with 100% ethanol to stop any further colour
loss and fully dehydrate the specimens; soak for a few minutes. Do not manipulatespecimens in alcohol because the cuticle becomes brittle when dehydrated and will bedamaged.
10. Add a few drops of Histoclear phenol (or carbol xylene) to the dish and soak thespecimens at room temperature until all fat/wax has dissolved. Very waxy specimensmay require hours of soaking, or gentle heating, and several changes of dewaxingagent to remove all the wax.
11. Remove dewaxing agent and rinse specimens for 10 minutes in 100% ethanol.12. Remove alcohol and clear specimens in anhydrous clove oil for at least 10 minutes (can
be left overnight).13. Lable microscope slides before the specimens are placed on them. The best lables are
made of 0.3 mm thick, white card cut in 19 mm squares, glued onto the slides withwood glue, and are written in indelible, waterproof ink or pencil. The label on one sideof the slide carries the collection data (country, locality, host plant, any damagesymptoms, collector’s name, sample number, date of collection) and the other labelcarries the identification.
14. Place a small (2 mm diameter) spot of clove oil on each microscope slide, and transfer1-3 specimens, one at a time, into the drop using mounted needles. Working under thedissection microscope, use mounted needles to arrange specimens so that each onelies head downwards in relation to the writing on the lables.
15. Soak up the clove oil from the specimens using the corner of a folded tissue. Place adrop of a well-liquefied mountant (Canada balsam) 6-7mm in diameter on thespecimens and quickly spread it in a circular pool around them. Use the tip of a pin tolower a cover slip onto the mountant, and allow it to settle under its own weight.
16. Dry slide mounts in a horizontal position in a dust-free environment for 3 months atabout 35°C.
17. Store slide mounts horizontally in cool, clean, dark conditions away from moisture orany risk of attack by termites.
IMPACT OF BANANA STREAK VIRUS ON THE GROWTH AND YIELD OFBANANA var. Cavendish Williams ( Musa AAA) and var. Mbwazirume (Musa
AAA – EA)
Tim Wheeler, Charles Murekezi, Simon Gowen, Ermias Kebreaband W. Tushemereirwe
Interim Technical Report for the University of Reading, UK / National AgriculturalResearch Organisation (NARO), Uganda component of:
Project R7529. Management strategies for banana streak virus: Epidemiology,vector studies and control of banana streak virus in East Africa highlandbananas
March 2003
Correspondence to: Tim Wheeler, Department of Agriculture, The University ofReading, Earley Gate, Reading RG6 6AT, UK. Email [email protected]
2
CONTENTS
SUMMARY 3
INTRODUCTION 4
RESEARCH ACTIVITIES 4
Activity 3.1. Trials at three contrasting sites to assess the effect ofminimal and optimal crop management practices on BSV incidenceand severity, and on crop productivity
5
3.1.1 Experimental design and treatment structure 5
3.1.2 Data collection and statistical analyses 6
3.1.3 Results and discussion 9
BSV symptomsCrop yieldGrowth characteristicsLeaf photosynthesisLight-saturated rate of leaf photosynthesis
Activity 3.2 Experiments to elucidate the interactions between BSV,climate and management on crop productivity using modernphysiological techniques to quantify resource use by the crops
38
3.2.1 Experimental design and treatment structure 38
3.2.2 Data collection and statistical analyses 39
3.2.3 Results and discussion 40
Activity 6.0 Socio-economic and biometric study/survey to assessfarmers' perceptions of BSV and strategies that might be used tocontrol it
45
CONCLUSIONS 45
REFERENCES CITED 46
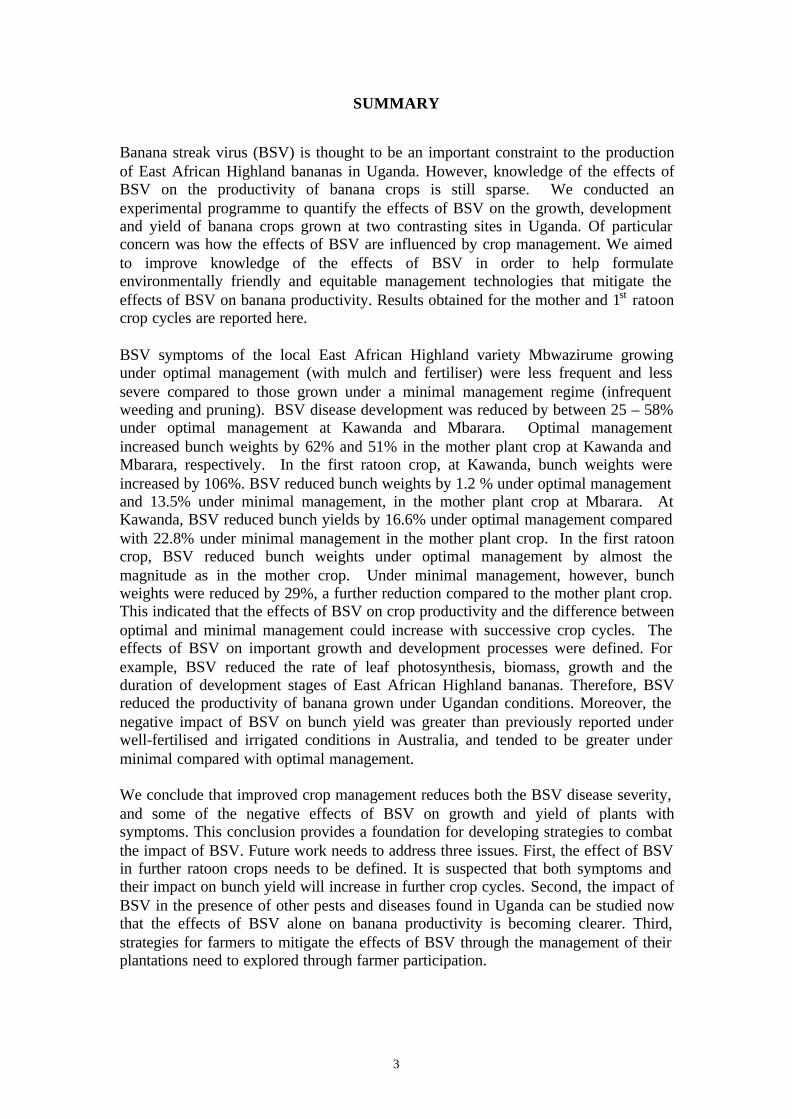
3
SUMMARY
Banana streak virus (BSV) is thought to be an important constraint to the productionof East African Highland bananas in Uganda. However, knowledge of the effects ofBSV on the productivity of banana crops is still sparse. We conducted anexperimental programme to quantify the effects of BSV on the growth, developmentand yield of banana crops grown at two contrasting sites in Uganda. Of particularconcern was how the effects of BSV are influenced by crop management. We aimedto improve knowledge of the effects of BSV in order to help formulateenvironmentally friendly and equitable management technologies that mitigate theeffects of BSV on banana productivity. Results obtained for the mother and 1st ratooncrop cycles are reported here.
BSV symptoms of the local East African Highland variety Mbwazirume growingunder optimal management (with mulch and fertiliser) were less frequent and lesssevere compared to those grown under a minimal management regime (infrequentweeding and pruning). BSV disease development was reduced by between 25 – 58%under optimal management at Kawanda and Mbarara. Optimal managementincreased bunch weights by 62% and 51% in the mother plant crop at Kawanda andMbarara, respectively. In the first ratoon crop, at Kawanda, bunch weights wereincreased by 106%. BSV reduced bunch weights by 1.2 % under optimal managementand 13.5% under minimal management, in the mother plant crop at Mbarara. AtKawanda, BSV reduced bunch yields by 16.6% under optimal management comparedwith 22.8% under minimal management in the mother plant crop. In the first ratooncrop, BSV reduced bunch weights under optimal management by almost themagnitude as in the mother crop. Under minimal management, however, bunchweights were reduced by 29%, a further reduction compared to the mother plant crop.This indicated that the effects of BSV on crop productivity and the difference betweenoptimal and minimal management could increase with successive crop cycles. Theeffects of BSV on important growth and development processes were defined. Forexample, BSV reduced the rate of leaf photosynthesis, biomass, growth and theduration of development stages of East African Highland bananas. Therefore, BSVreduced the productivity of banana grown under Ugandan conditions. Moreover, thenegative impact of BSV on bunch yield was greater than previously reported underwell-fertilised and irrigated conditions in Australia, and tended to be greater underminimal compared with optimal management.
We conclude that improved crop management reduces both the BSV disease severity,and some of the negative effects of BSV on growth and yield of plants withsymptoms. This conclusion provides a foundation for developing strategies to combatthe impact of BSV. Future work needs to address three issues. First, the effect of BSVin further ratoon crops needs to be defined. It is suspected that both symptoms andtheir impact on bunch yield will increase in further crop cycles. Second, the impact ofBSV in the presence of other pests and diseases found in Uganda can be studied nowthat the effects of BSV alone on banana productivity is becoming clearer. Third,strategies for farmers to mitigate the effects of BSV through the management of theirplantations need to explored through farmer participation.

4
INTRODUCTION
Highland cooking banana (Musa genome AAA – EA) is an important staple inUganda, Tanzania, Burundi, Rwanda, Eastern Congo and Western Kenya (INIBAP,1986). It is grown mainly on smallholdings by resource poor farmers (Gold et al.,1998) for food although surplus is sold for cash income. However, the presence ofbanana streak virus (BSV) has become an important constraint to the production ofthe East African Highland banana in the region (Debek and Waller, 1990). Surveysconducted in Uganda in the mid 1990s showed that BSV incidence was mainlyconfined to the southern region of the country (Tushemereirwe et al., 1996). Today,BSV disease occurs throughout the country.
Banana streak virus is an economically important disease. For example, in the IvoryCoast yield losses of up to 90% have been reported on “Poyo” plants with severesymptoms (Jones and Lockhart, 1993). BSV has also been observed to causesignificant yield losses when bananas are affected during the early stages of growth.Tushemereirwe et al. (1996) reported that in Uganda, losses of up to 100% ofsaleable yield occurred in bananas infected with BSV during their early stages.
Plants infected with BSV exhibit a wide range of symptoms (Lockhart, 1986; Dahal etal., 1998; Lockhart, 1994; Gauhl and Pasberg-Gauhl, 1995) which are normallyassociated with yield loss. However, there is much uncertainty concerning themagnitude of effects of BSV symptoms on banana yields. A recent study in Australia(Daniells et al. 2001) showed that under well-fertilised and irrigated conditions, theyield loss attributable to BSV infection was 8-11% in the first ratoon crop. BSVsymptoms are thought to be influenced by climate (temperature and rainfall), andpossibly by the vigour of the banana plant. Again, however, no clear relationshipshave been demonstrated.
This component of Project R7529 aims to gain a better understanding of the role ofbanana variety and crop management conditions on the expression of BSV diseasesymptoms and to quantify their effects on banana physiology and yield. Theconclusions reached will lead to the formulation of environmentally friendly andequitable management technologies that mitigate the effects of BSV on bananaproductivity.
RESEARCH ACTIVITIES
The activities are numbered in accordance with the Project R7529 ProjectMemorandum
Output 3. Empirical data on the effect of climate on the disease, whether goodmanagement can alleviate the effects of the disease and restore yield to nearnormal and, based on these findings, formulation of a strategy for controlling, orat least managing, BSV in Uganda

5
Activity 3.1. Trials at three contrasting sites to assess the effect of minimal andoptimal crop management practices on BSV incidence and severity, and on cropproductivity.
Experiments for this activity are being conducted at Kawanda Research Institute(0.42N 32.5E) and Mbarara Stock Farm (0.4S 30.4E). These are sites withcontrasting weather and with local incidence of BSV. The experiments were plantedin October 2001 (Kawanda) and November 2001 (Mbarara).
3.1.1 Experimental design and treatment structureThe design of these experiments was split-plot with 4 replicate blocks (Figure 1).Each block consisted of main plots of a management treatment (Mgt in Figure 1) andsub-plots of banana varieties (Var in Figure 1). The management treatment levelswere randomly assigned in each block. Each of the management plots was then sub-divided into subplots to which each of the banana varieties were randomly assigned.Each subplot consisted of 20 plants.
Figure 1. Field plan of experiments at Kawanda and Mbarara for Activity 3.1. In thefield the blocks are arranged in a line, and the management and variety treatments arerandomly assigned.
Block 1 Block 2
Var 1 Var 1 Var 1 Var 1
Mgt
1
Var 2 Var 2
Mgt
2
Mgt
1
Var 2 Var 2M
gt 2
Var 3 Var 3 Var 3 Var 3
Block 3 Block 4
Var 1 Var 1 Var 1 Var 1
Mgt
1
Var 2 Var 2
Mgt
2
Mgt
1
Var 2 Var 2
Mgt
2
Var 3 Var 3 Var 3 Var 3
The two management treatments were optimal and minimal management. Optimalmanagement comprised the application of mulch (10 cm thickness) and fertilisers(150 kg N, 25 kg P and 200 kg K ha-1 yr-1; McIntyre, per. comm.), and routineweeding, pruning and crop sanitation. Minimal management had no mulch orfertiliser, but had 2 episodes of weeding, pruning and crop sanitation during a singlecrop cycle.
The three banana varieties/ types treatments consisted of 2 varieties; one exoticvariety and one local variety. The exotic variety was banana Cavendish “Williams”
6
(Musa AAA) and the local variety was banana Mbwazirume (Musa AAA-EA). Forthe local variety, tissue culture plants were derived from mother plants of twodifferent BSV status, var. Mbwazirume BSV ELISA negative (ELISA -) and var.Mbwazirume BSV ELISA positive (ELISA +). Subplot size was 15 x 18m withborder rows of FHIA 01 from conventional suckers. Plant density was 1111 plants ha-
1 which gave a plant spacing of 3 x 3m.
3.1.2 Data collection and statistical analysesThe following data/ observations are being collected at the two sites:
Weather rainfall, air temperature, relative humidity,windspeed and solar radiation using meteorologicalstations. Air and soil temperature and relativehumidity in each management treatment usingdataloggers.
Soil Soil gravimetric moisture content, soil N, P, K, Ca,Mg and bulk density
Plant yield Bunch weight, number of hands per bunch
Plant development Time of planting, sucker selection, flowering andbunch maturity. Leaf appearance
Plant growth Light interception, rate of photosynthesis,pseudostem girth at 1m and height at the time offlowering
BSV symptoms Presence and severity of symptoms (using theseverity index of Dahal et al., 1998). Symptomdevelopment as area under disease progression curve(AUDPC) derived from severity over timedetermined using the mid point rule of areaestimation (Campbell and Madden, 1990).
Plant measurements were taken on each plant. BSV symptoms were assessed on eachleaf of all plants on a monthly basis. Observations will be taken on the mother plants,and most of the first ratoon crop within the timeframe of Project R7529.
Only the major results of these experiments are reported here. By March 2003, thebunches of all mother plants at Mbarara, and the first ratoon plants in Kawanda hadbeen harvested. The first ratoon plants at Mbarara had flowered and data collection isin progress. Hence, the following results are presented here:

7
Kawanda RainfallBSV symptom frequency and severityBunch yieldsPseudostem girth at floweringDuration from planting/sucker selection to floweringand to harvestLeaf photosynthesis
Mbarara RainfallBSV symptom frequency and severityBunch yieldsPseudostem girth at floweringDuration from planting/sucker selection to floweringand harvestLeaf photosynthesis
Most of the results presented here were analysed using either ANOVA in Genstat 3.2or mixed model procedure in SAS (SAS Inst. Inc., 1997) assuming a split plot designwith 4 blocks. Each site was analysed separately. Several modifications in analysiswere made. For example, since var. Cavendish showed no symptoms during theentire experimental period it was excluded from analyses for BSV effects. Inaddition, Mbwazirume classed as either ELISA + or ELISA – had plants with andwithout symptoms and therefore will be considered as repeats of the same variety insome instances.
(i) Symptom expression
Descriptors of symptom expression (incidence and severity) were analysed by Genstat3.2, in two ways: Observations of the incidence (number of plants showingsymptoms) were analysed with var. Mbwazirume classed as either ELISA + orELISA –, for the mother crop (example given in Table 1).
Table 1. General form of the ANOVA table of the split plot design with var. Mbwazirume classed as either ELISA + or ELISA –.
Source of variation Degrees offreedom
Sum ofsquares
Meansquares
F ratio
Block 3Management 1Main plot residual 3
Variety 1Management x variety 1Sub-plot residual 6
Total 15
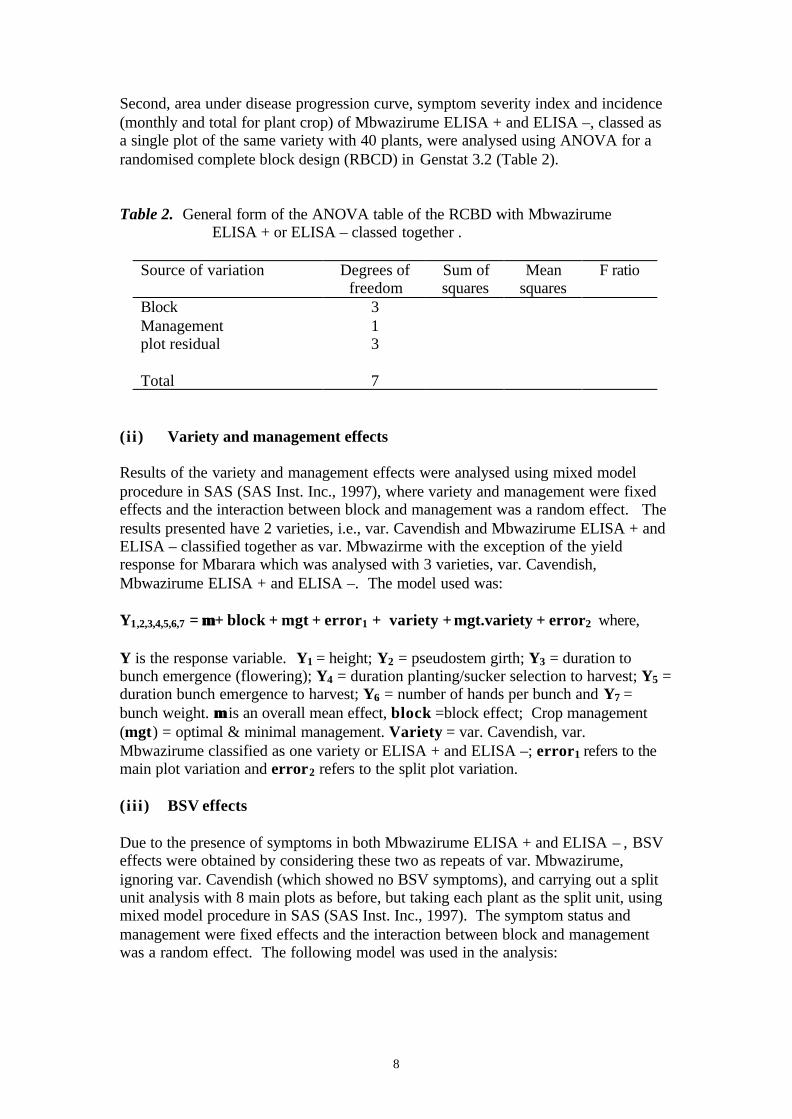
8
Second, area under disease progression curve, symptom severity index and incidence(monthly and total for plant crop) of Mbwazirume ELISA + and ELISA –, classed asa single plot of the same variety with 40 plants, were analysed using ANOVA for arandomised complete block design (RBCD) in Genstat 3.2 (Table 2).
Table 2. General form of the ANOVA table of the RCBD with Mbwazirume ELISA + or ELISA – classed together .
Source of variation Degrees offreedom
Sum ofsquares
Meansquares
F ratio
Block 3Management 1plot residual 3
Total 7
(ii) Variety and management effects
Results of the variety and management effects were analysed using mixed modelprocedure in SAS (SAS Inst. Inc., 1997), where variety and management were fixedeffects and the interaction between block and management was a random effect. Theresults presented have 2 varieties, i.e., var. Cavendish and Mbwazirume ELISA + andELISA – classified together as var. Mbwazirme with the exception of the yieldresponse for Mbarara which was analysed with 3 varieties, var. Cavendish,Mbwazirume ELISA + and ELISA –. The model used was:
Y1,2,3,4,5,6,7 = µµ + block + mgt + error1 + variety + mgt.variety + error2 where,
Y is the response variable. Y1 = height; Y2 = pseudostem girth; Y3 = duration tobunch emergence (flowering); Y4 = duration planting/sucker selection to harvest; Y5 =duration bunch emergence to harvest; Y6 = number of hands per bunch and Y7 =bunch weight. µµ is an overall mean effect, block =block effect; Crop management(mgt) = optimal & minimal management. Variety = var. Cavendish, var.Mbwazirume classified as one variety or ELISA + and ELISA –; error1 refers to themain plot variation and error2 refers to the split plot variation.
(ii i) BSV effects
Due to the presence of symptoms in both Mbwazirume ELISA + and ELISA – , BSVeffects were obtained by considering these two as repeats of var. Mbwazirume,ignoring var. Cavendish (which showed no BSV symptoms), and carrying out a splitunit analysis with 8 main plots as before, but taking each plant as the split unit, usingmixed model procedure in SAS (SAS Inst. Inc., 1997). The symptom status andmanagement were fixed effects and the interaction between block and managementwas a random effect. The following model was used in the analysis:
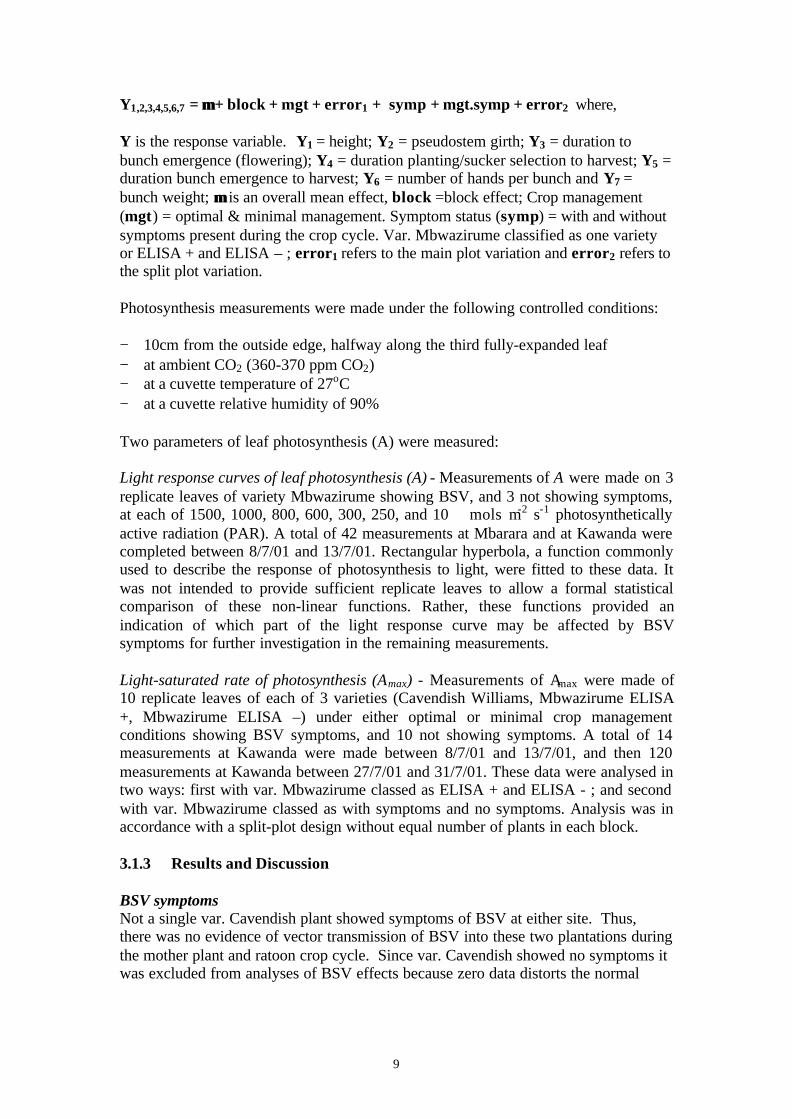
9
Y1,2,3,4,5,6,7 = µµ + block + mgt + error1 + symp + mgt.symp + error2 where,
Y is the response variable. Y1 = height; Y2 = pseudostem girth; Y3 = duration tobunch emergence (flowering); Y4 = duration planting/sucker selection to harvest; Y5 =duration bunch emergence to harvest; Y6 = number of hands per bunch and Y7 =bunch weight; µµ is an overall mean effect, block =block effect; Crop management(mgt) = optimal & minimal management. Symptom status (symp) = with and withoutsymptoms present during the crop cycle. Var. Mbwazirume classified as one varietyor ELISA + and ELISA – ; error1 refers to the main plot variation and error2 refers tothe split plot variation.
Photosynthesis measurements were made under the following controlled conditions:
− 10cm from the outside edge, halfway along the third fully-expanded leaf− at ambient CO2 (360-370 ppm CO2)− at a cuvette temperature of 27oC− at a cuvette relative humidity of 90%
Two parameters of leaf photosynthesis (A) were measured:
Light response curves of leaf photosynthesis (A) - Measurements of A were made on 3replicate leaves of variety Mbwazirume showing BSV, and 3 not showing symptoms,at each of 1500, 1000, 800, 600, 300, 250, and 10 �mols m-2 s-1 photosyntheticallyactive radiation (PAR). A total of 42 measurements at Mbarara and at Kawanda werecompleted between 8/7/01 and 13/7/01. Rectangular hyperbola, a function commonlyused to describe the response of photosynthesis to light, were fitted to these data. Itwas not intended to provide sufficient replicate leaves to allow a formal statisticalcomparison of these non-linear functions. Rather, these functions provided anindication of which part of the light response curve may be affected by BSVsymptoms for further investigation in the remaining measurements.
Light-saturated rate of photosynthesis (Amax) - Measurements of Amax were made of10 replicate leaves of each of 3 varieties (Cavendish Williams, Mbwazirume ELISA+, Mbwazirume ELISA –) under either optimal or minimal crop managementconditions showing BSV symptoms, and 10 not showing symptoms. A total of 14measurements at Kawanda were made between 8/7/01 and 13/7/01, and then 120measurements at Kawanda between 27/7/01 and 31/7/01. These data were analysed intwo ways: first with var. Mbwazirume classed as ELISA + and ELISA - ; and secondwith var. Mbwazirume classed as with symptoms and no symptoms. Analysis was inaccordance with a split-plot design without equal number of plants in each block.
3.1.3 Results and Discussion
BSV symptomsNot a single var. Cavendish plant showed symptoms of BSV at either site. Thus,there was no evidence of vector transmission of BSV into these two plantations duringthe mother plant and ratoon crop cycle. Since var. Cavendish showed no symptoms itwas excluded from analyses of BSV effects because zero data distorts the normal

10
distribution and therefore makes analysis invalid. Symptoms of BSV were prevalentin both var. Mbwazirume ELISA - and ELISA + plants at both sites. There were nosignificant differences (P>0.05) in the number of plants showing symptoms betweenELISA + and ELISA - plants in the mother plant crop at Kawanda and Mbarara(Table 3a & 3b). It is concluded that the initial classification of var. Mbwazirume onthe basis of the ELISA diagnostic tests is questionable. Therefore, the rest of the
analyses involving var. Mbwazirume reports: (i) combined ELISA + and ELISA –plants as repeats of the same variety; (ii) grouped plants according to whether or noteach showed symptoms.
Table 3a. Effect of management and variety on the number of plants withsymptoms (per plot of 20 plants) at Kawanda with the varieties classed by ELISA
Number ofplants withsymptoms 1
MbwELISA +
MbwELISA -
Mean Mgts.e.d. = 0.13
(3 df)
Minimalmanagement
12.75 9.25 11.00
Optimalmanagement
9.25 9.00 9.13
Mean Vars.e.d = 1.85(6 df)
11.00 9.13
1 Mgt P<0.001, Var P=0.35, Mgt x Var P=0.41
Table 3b. Effect of management and variety on the number of plants with symptoms(per plot of 20 plants) at Mbarara with the varieties classed by ELISA
Number ofplants withsymptoms 1
MbwELISA +
MbwELISA -
Mean Mgts.e.d. = 1.18
(3 df)
Minimalmanagement
13.50 14.25 13.88
Optimalmanagement
12.50 11.75 12.13
Mean Vars.e.d = 1.54(6df)
13.13 12.00
1 Mgt P=0.23, Var P = 1.00, Mgt x Var P=0.64
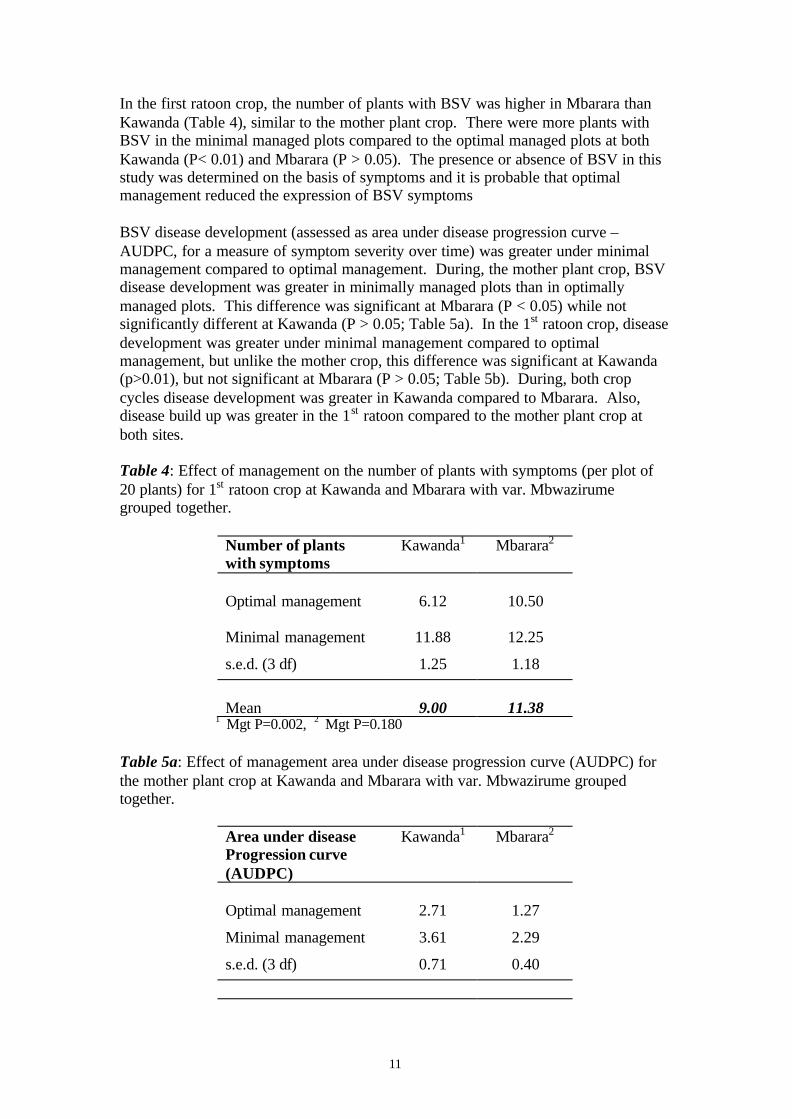
11
In the first ratoon crop, the number of plants with BSV was higher in Mbarara thanKawanda (Table 4), similar to the mother plant crop. There were more plants withBSV in the minimal managed plots compared to the optimal managed plots at bothKawanda (P< 0.01) and Mbarara (P > 0.05). The presence or absence of BSV in thisstudy was determined on the basis of symptoms and it is probable that optimalmanagement reduced the expression of BSV symptoms
BSV disease development (assessed as area under disease progression curve –AUDPC, for a measure of symptom severity over time) was greater under minimalmanagement compared to optimal management. During, the mother plant crop, BSVdisease development was greater in minimally managed plots than in optimallymanaged plots. This difference was significant at Mbarara (P < 0.05) while notsignificantly different at Kawanda (P > 0.05; Table 5a). In the 1st ratoon crop, diseasedevelopment was greater under minimal management compared to optimalmanagement, but unlike the mother crop, this difference was significant at Kawanda(p>0.01), but not significant at Mbarara (P > 0.05; Table 5b). During, both cropcycles disease development was greater in Kawanda compared to Mbarara. Also,disease build up was greater in the 1st ratoon compared to the mother plant crop atboth sites.
Table 4: Effect of management on the number of plants with symptoms (per plot of20 plants) for 1st ratoon crop at Kawanda and Mbarara with var. Mbwazirumegrouped together.
Number of plantswith symptoms
Kawanda1 Mbarara2
Optimal management 6.12 10.50
Minimal management 11.88 12.25
s.e.d. (3 df) 1.25 1.18
Mean 9.00 11.381 Mgt P=0.002, 2 Mgt P=0.180
Table 5a: Effect of management area under disease progression curve (AUDPC) forthe mother plant crop at Kawanda and Mbarara with var. Mbwazirume groupedtogether.
Area under diseaseProgression curve(AUDPC)
Kawanda1 Mbarara2
Optimal management 2.71 1.27
Minimal management 3.61 2.29
s.e.d. (3 df) 0.71 0.40

12
Mean 3.16 1.781 Mgt P=0.257, 2 Mgt P=0.04
Table 5b: Effect of management area under disease progression curve (AUDPC) forthe 1st ratoon crop at Kawanda and Mbarara with var. Mbwazirume grouped together.
Area under diseaseProgression curve(AUDPC)
Kawanda1 Mbarara2
Optimal management 3.05 3.04
Minimal management 7.19 4.11
s.e.d. (3 df) 1.09 0.87
Mean 5.12 3.581 Mgt P=0.009, 2 Mgt P=0.257
Figure 2. Seasonal trends in rainfall, BSV symptom frequency and BSV symptomseverity (on the mother plants) from planting at Kawanda and Mbarara. The rainfalldata for Mbarara are either observations (solid bars) or the climatological monthlymean from the FAO ClimWat database www.fao.org/ag/agl/aglw/climwat.html (open bars).
Month
Nov
00
Dec
00
Jan
01F
eb 0
1M
ar 0
1A
pr 0
1M
ay 0
1Ju
n 01
Jly
01A
ug 0
1S
ep 0
1O
ct 0
1N
ov 0
1D
ec 0
1Ja
n 02
Feb
02
Mar
02
Apr
02
May
02
Jun
02
Rai
nfal
l (m
m)
0
50
100
150
200
Pla
nts
with
sym
ptom
s (%
)
0
10
15
20
25
30
35P
lant
s w
ith s
ympt
oms
(%)
0
10
15
20
25
30
35
Kawanda
Sym
ptom
sev
erity
inde
x
0.0
0.4
0.6
0.8
1.0
1.2
Mbarara
Sym
ptom
sev
erity
inde
x0.0
0.4
0.6
0.8
1.0
1.2
Month
Nov
00
Dec
00
Jan
01F
eb 0
1M
ar 0
1A
pr 0
1M
ay 0
1Ju
n 01
Jly
01A
ug 0
1S
ep 0
1O
ct 0
1N
ov 0
1D
ec 0
1Ja
n 02
Feb
02
Mar
02
Apr
02
May
02
Jun
02
Rai
nfal
l (m
m)
0
50
100
150
200
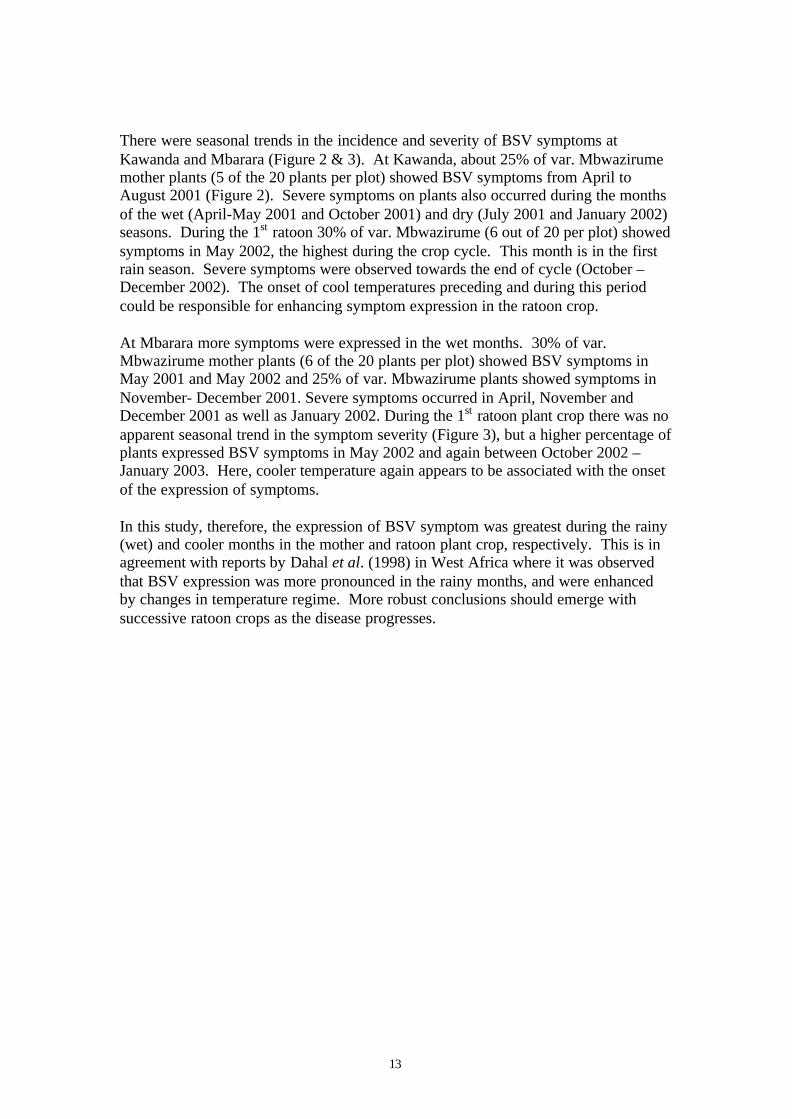
13
There were seasonal trends in the incidence and severity of BSV symptoms atKawanda and Mbarara (Figure 2 & 3). At Kawanda, about 25% of var. Mbwazirumemother plants (5 of the 20 plants per plot) showed BSV symptoms from April toAugust 2001 (Figure 2). Severe symptoms on plants also occurred during the monthsof the wet (April-May 2001 and October 2001) and dry (July 2001 and January 2002)seasons. During the 1st ratoon 30% of var. Mbwazirume (6 out of 20 per plot) showedsymptoms in May 2002, the highest during the crop cycle. This month is in the firstrain season. Severe symptoms were observed towards the end of cycle (October –December 2002). The onset of cool temperatures preceding and during this periodcould be responsible for enhancing symptom expression in the ratoon crop.
At Mbarara more symptoms were expressed in the wet months. 30% of var.Mbwazirume mother plants (6 of the 20 plants per plot) showed BSV symptoms inMay 2001 and May 2002 and 25% of var. Mbwazirume plants showed symptoms inNovember- December 2001. Severe symptoms occurred in April, November andDecember 2001 as well as January 2002. During the 1st ratoon plant crop there was noapparent seasonal trend in the symptom severity (Figure 3), but a higher percentage ofplants expressed BSV symptoms in May 2002 and again between October 2002 –January 2003. Here, cooler temperature again appears to be associated with the onsetof the expression of symptoms.
In this study, therefore, the expression of BSV symptom was greatest during the rainy(wet) and cooler months in the mother and ratoon plant crop, respectively. This is inagreement with reports by Dahal et al. (1998) in West Africa where it was observedthat BSV expression was more pronounced in the rainy months, and were enhancedby changes in temperature regime. More robust conclusions should emerge withsuccessive ratoon crops as the disease progresses.
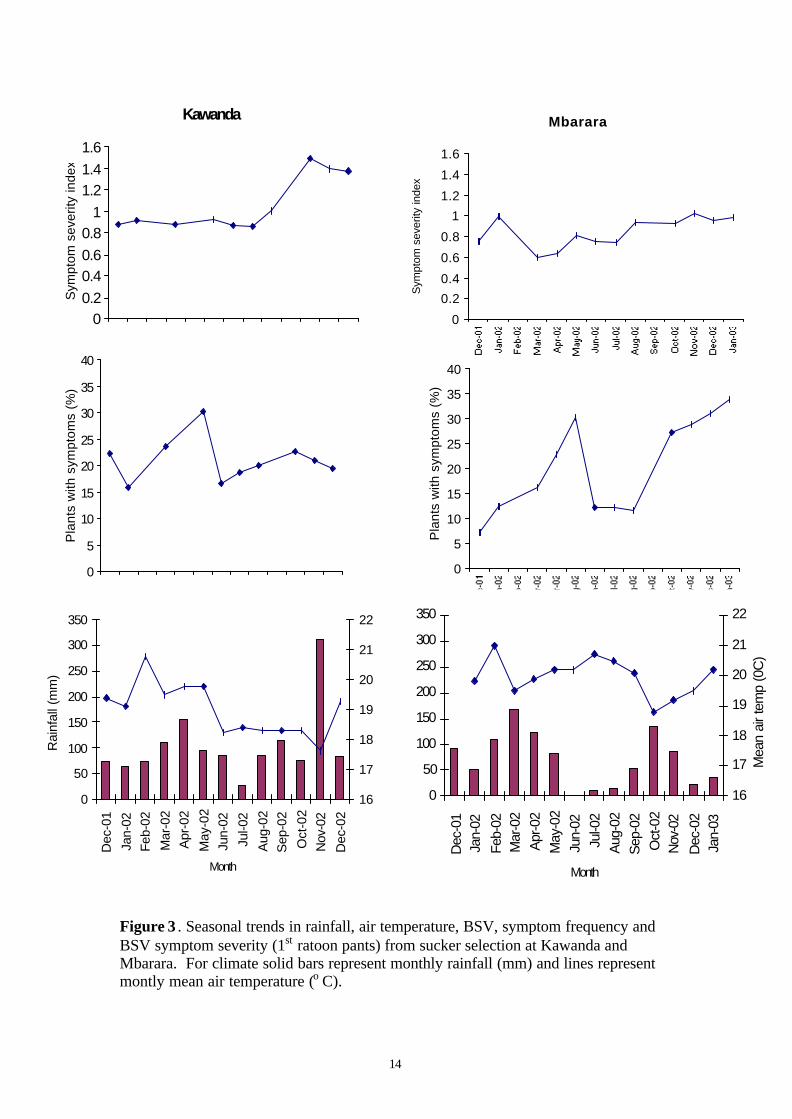
14
Figure 3 . Seasonal trends in rainfall, air temperature, BSV, symptom frequency andBSV symptom severity (1st ratoon pants) from sucker selection at Kawanda andMbarara. For climate solid bars represent monthly rainfall (mm) and lines representmontly mean air temperature (o C).
Kawanda
00.2
0.40.6
0.81
1.21.4
1.6
Dec
-01
Jan-
02
Feb-
02
Mar
-02
Apr
-02
May
-02
Jun-
02
Jul-0
2
Aug
-02
Sep
-02
Oct
-02
Nov
-02
Dec
-02
Month
Sym
ptom
sev
erity
inde
x
Mbarara
0
0.2
0.4
0.6
0.8
1
1.2
1.4
1.6
Month
Sym
ptom
sev
erity
inde
x
0
5
10
15
20
25
30
35
40
Dec
-01
Jan-
02
Feb
-02
Mar
-02
Apr
-02
May
-02
Jun-
02
Jul-0
2
Aug
-02
Sep
-02
Oct
-02
Nov
-02
Dec
-02
Month
Pla
nts
with
sym
ptom
s (%
)
0
5
10
15
20
25
30
35
40
Month
Pla
nts
with
sym
ptom
s (%
)
0
50
100
150
200
250
300
350
Dec
-01
Jan-
02
Feb
-02
Mar
-02
Apr
-02
May
-02
Jun-
02
Jul-0
2
Aug
-02
Sep
-02
Oct
-02
Nov
-02
Dec
-02
Month
Rai
nfal
l (m
m)
16
17
18
19
20
21
22
0
50
100
150
200
250
300
350
Dec
-01
Jan-
02
Feb-
02M
ar-0
2A
pr-0
2M
ay-0
2Ju
n-02
Jul-0
2A
ug-0
2S
ep-0
2O
ct-0
2N
ov-0
2
Dec
-02
Jan-
03
Month
16
17
18
19
20
21
22
Mea
n ai
r tem
p (0
C)
15
Effect of BSV, variety and management on crop yield at Kawanda and Mbarara
At Kawanda, the mean bunch weight of var. Mbwazirume mother plants with BSVsymptoms was less (by 18.9%; P<0.001) than those without symptoms. This overalldifference was due to the reduction in the number of hands per bunch (P<0.05). BSVdid not have a significant effect on the duration of bunch development (bunchemergence to harvest) (P>0.05). These effects of BSV symptoms were not subject toan interaction with crop management (P>0.05). However, comparison of meansreveal that BSV symptoms reduced bunch weight by 16.6% under optimalmanagement and 22.8 % under minimal management (Table 6a). Similarly, BSVreduced the number of hands per bunch by 1.6% under optimal management and 6.2%under minimal management.
The effects of BSV during the 1st ratoon crop were similar to those of the mother cropat Kawanda. The mean bunch weight of var. Mbwazirume with BSV symptoms wasreduced by 20.3% (P< 0.001) compared with those without symptoms which was dueto the reduction in the number of hands (P < 0.001) (Table 6b). Also, BSV symptomsdid not significantly affect the duration of bunch development (P > 0.05). The effectsof BSV were not subject to an interaction with crop management (P > 0.05), but, BSVsymptoms reduced bunch weight by 16.1% under optimal management and 28.9%under minimal management (Table 6b). Further, BSV reduced the number of handsper bunch by 4.5 and 7.6% under optimal and minimal management, respectively.
At Mbarara, mean bunch weight for var. Mbwazirume mother plants with BSVsymptoms was 6.7% less but not significantly different (P>0.05) from those withoutsymptoms. BSV also had no effect (P>0.05) on the number of hands per bunch anddays from bunch emergence to harvest (Table 6c). Similar to Kawanda, there was nosignificant interaction effect between BSV and crop management (P>0.05).Comparison of means showed that BSV reduced bunch weight by 1.2% under optimalmanagement and 13.5% under minimal management (Table 6c).
Therefore, we conclude that BSV reduces the yield of bananas grown under Ugandanconditions. It is possible that improved crop management in the mother crop(Kawanda and Mbarara) and 1st ratoon crop cycle (Kawanda) reduced the effects ofBSV symptoms. The effects of BSV at Kawanda were greater than those reported byDaniells et al. (2001) for crops grown in well-fertilised and irrigated Australia.However, Daniells et al.(2001) studied the effects of BSV on var. Cavendish with theBSV-CAV isolate. How BSV-CAV compares to virus isolates in East AfricanHighland bananas is not known at this point.
It is noteworthy that at Kawanda, BSV reduced bunch weight by a similar magnitudeunder optimal management in the mother and 1st ratoon crop cycles. In minimallymanaged plots, however, bunch weight was reduced more in the 1st ratoon cropcompared to the mother plant crop. Therefore, we suspect that the effects of BSV oncrop productivity, and the differences between the two management regimes willincrease with subsequent ratoon crops. This is exemplified where bunch weights areplotted against disease development over time (Area under disease progression curve– AUDPC) for the mother and 1st ratoon crop. At Kawanda, bunch weights ofdiseased plants under optimal management, formed more definite clusters above the
16
minimally managed plants, in the 1st ratoon (Figure 4c), compared to the mother plantcrop (Figure 4a). This is attributed to differences in BSV disease between the twomanagement regimes during the crop cycles. There was only a slight higher diseasedevelopment, under minimal compared to optimal management in the mother plants(Table 5a) and optimally managed mother plants exhibited the same range of diseaseprogression as those under minimal management (Figure 4a). In contrast, in the 1st
ratoon, BSV disease under minimal management was more than double that underoptimal management (Table 5b). Additionally, optimally managed diseased ratoonplants exhibited a shorter range of disease development as those under minimalmanagement (Figure 4c).
In this study the effects of BSV at Kawanda were greater than at Mbarara. Diseaseseverity tended to be greater at Kawanda than at Mbarara (Figure 2 & 3).Environmental conditions are thought to affect disease severity (Gauhl and Pasberg-Gauhl, 1995). Kawanda was wetter than Mbarara (Figure 2 & 3). Thus, our resultsare in accordance with a previous study that showed that BSV symptoms were morepronounced under wetter and cooler conditions as compared to drier ones (Dahal etal., 1998).
Optimal crop management increased bunch weight (by 61.7%; P < 0.001) and thenumber of hands per bunch (by 20%; P< 0.001) compared to minimal management inthe mother crop at Kawanda. Var. Cavendish produced more hands (P< 0.001) andhad heavier bunches (P < 0.001) compared with var. Mbwazirume (Table 7a).Bunches of var. Cavendish took a further 44 days from bunch emergence to harvest(P< 0.001) compared to var. Mbwazirume.
In the first ratoon crop, optimal management increased bunch weight (by 105.8%; P <0.001) and number of hands by per bunch (by 33.7%; P < 0.001) compared tominimal management at Kawanda. As in the mother crop, var Cavendish ratoonplants produced heavier bunches (P < 0.001) and more hands per bunch (P < 0.001)compared with var. Mbwazirume (Table 7b). Bunches of var. Cavendish took 53more days to develop (P < 0.001) compared to Mbwazirume. Bunches of the 1st
ratoon, particularly in the optimal managed plots, were heavier and had more handsthat those in the mother plant crop (Tables 7a & b).
At Mbarara, mean bunch weight of var. Mbwazirume plants in optimal managementwere not significantly different from those in minimally managed plots (P>0.05).However, bunch weights of var. Cavendish and var. Mbwazirume ELISA+ in optimalmanagement were heavier compared to those in minimal managed plots by 38 and82%, respectively (Table 7c). Plants in optimal managed plots of var. MbwazirumeELISA- registered a 3 % increase in bunch weight compared to those in minimalmanaged plots. The number of hands per bunch under optimal management weremore (11.2%) compared to minimal management (P<0.05). There was a significantinteraction effect between management regime and variety for duration from bunchemergence to harvest. This due to a delay in this duration of 14 days (P<0.01) for var.Cavendish compared to a 5 day (P>0.05) for var. Mbwazirume under minimalcompared to optimal management (Table 7d).
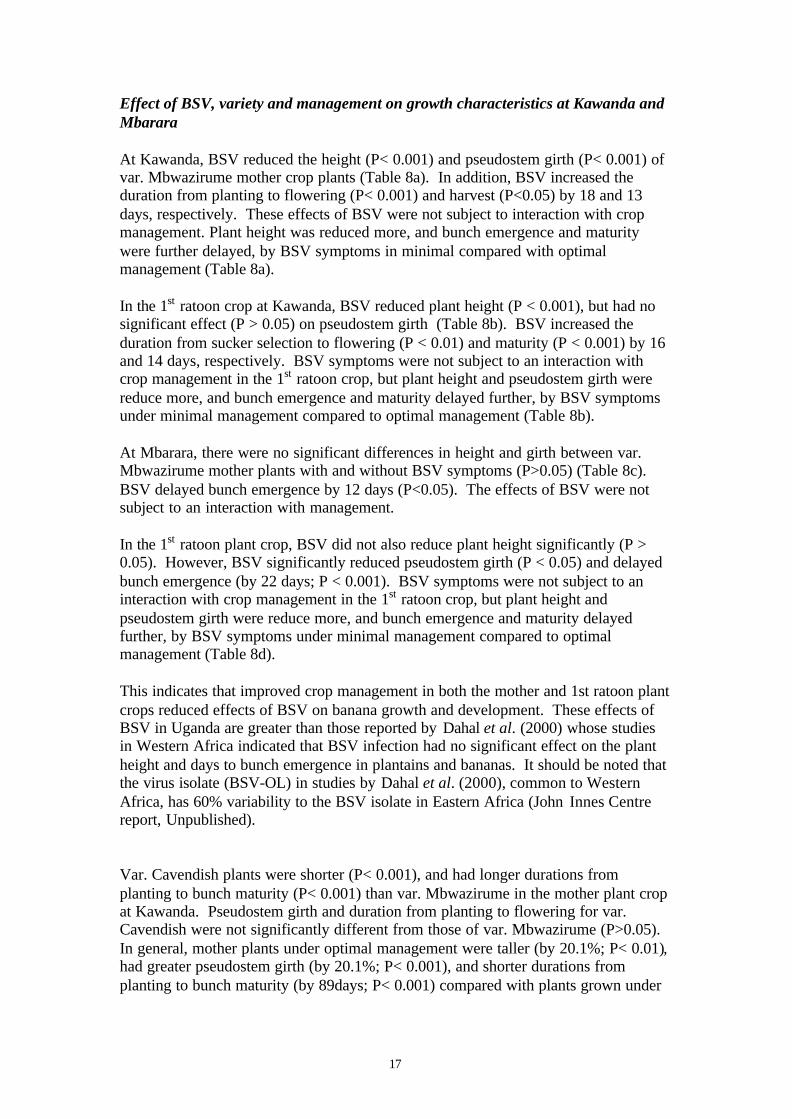
17
Effect of BSV, variety and management on growth characteristics at Kawanda andMbarara
At Kawanda, BSV reduced the height (P< 0.001) and pseudostem girth (P< 0.001) ofvar. Mbwazirume mother crop plants (Table 8a). In addition, BSV increased theduration from planting to flowering (P< 0.001) and harvest (P<0.05) by 18 and 13days, respectively. These effects of BSV were not subject to interaction with cropmanagement. Plant height was reduced more, and bunch emergence and maturitywere further delayed, by BSV symptoms in minimal compared with optimalmanagement (Table 8a).
In the 1st ratoon crop at Kawanda, BSV reduced plant height (P < 0.001), but had nosignificant effect (P > 0.05) on pseudostem girth (Table 8b). BSV increased theduration from sucker selection to flowering (P < 0.01) and maturity (P < 0.001) by 16and 14 days, respectively. BSV symptoms were not subject to an interaction withcrop management in the 1st ratoon crop, but plant height and pseudostem girth werereduce more, and bunch emergence and maturity delayed further, by BSV symptomsunder minimal management compared to optimal management (Table 8b).
At Mbarara, there were no significant differences in height and girth between var.Mbwazirume mother plants with and without BSV symptoms (P>0.05) (Table 8c).BSV delayed bunch emergence by 12 days (P<0.05). The effects of BSV were notsubject to an interaction with management.
In the 1st ratoon plant crop, BSV did not also reduce plant height significantly (P >0.05). However, BSV significantly reduced pseudostem girth (P < 0.05) and delayedbunch emergence (by 22 days; P < 0.001). BSV symptoms were not subject to aninteraction with crop management in the 1st ratoon crop, but plant height andpseudostem girth were reduce more, and bunch emergence and maturity delayedfurther, by BSV symptoms under minimal management compared to optimalmanagement (Table 8d).
This indicates that improved crop management in both the mother and 1st ratoon plantcrops reduced effects of BSV on banana growth and development. These effects ofBSV in Uganda are greater than those reported by Dahal et al. (2000) whose studiesin Western Africa indicated that BSV infection had no significant effect on the plantheight and days to bunch emergence in plantains and bananas. It should be noted thatthe virus isolate (BSV-OL) in studies by Dahal et al. (2000), common to WesternAfrica, has 60% variability to the BSV isolate in Eastern Africa (John Innes Centrereport, Unpublished).
Var. Cavendish plants were shorter (P< 0.001), and had longer durations fromplanting to bunch maturity (P< 0.001) than var. Mbwazirume in the mother plant cropat Kawanda. Pseudostem girth and duration from planting to flowering for var.Cavendish were not significantly different from those of var. Mbwazirume (P>0.05).In general, mother plants under optimal management were taller (by 20.1%; P< 0.01),had greater pseudostem girth (by 20.1%; P< 0.001), and shorter durations fromplanting to bunch maturity (by 89days; P< 0.001) compared with plants grown under
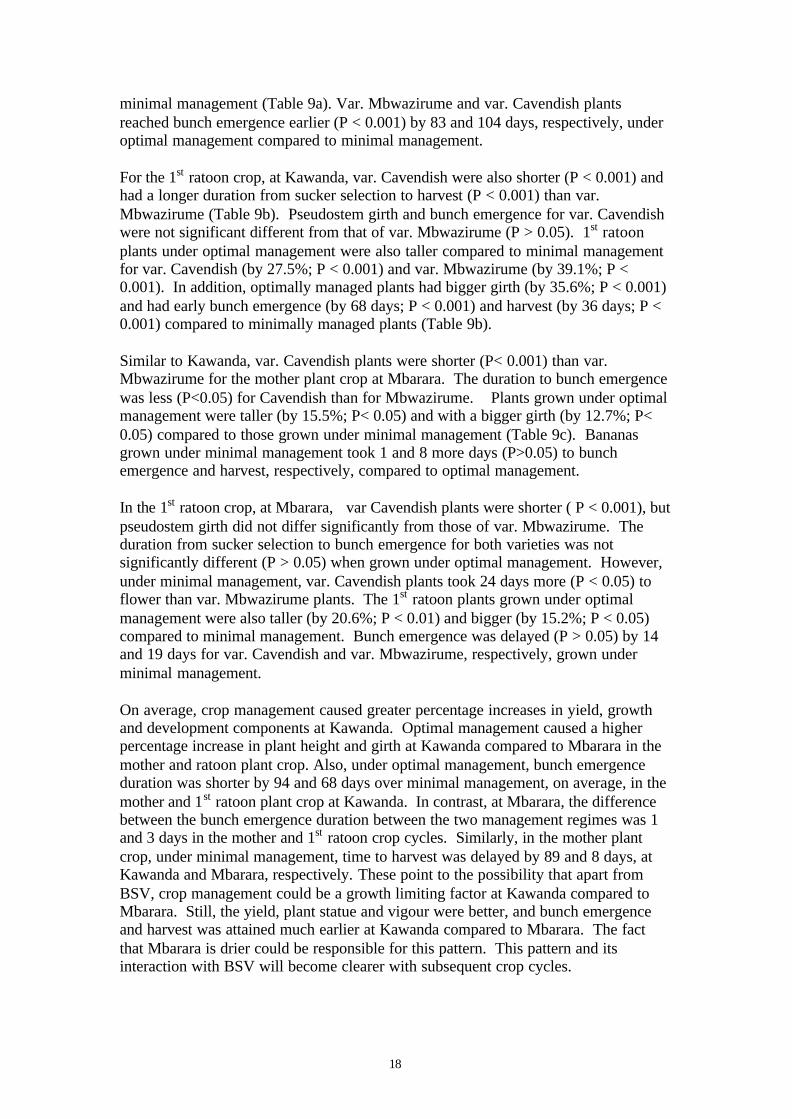
18
minimal management (Table 9a). Var. Mbwazirume and var. Cavendish plantsreached bunch emergence earlier (P < 0.001) by 83 and 104 days, respectively, underoptimal management compared to minimal management.
For the 1st ratoon crop, at Kawanda, var. Cavendish were also shorter (P < 0.001) andhad a longer duration from sucker selection to harvest (P < 0.001) than var.Mbwazirume (Table 9b). Pseudostem girth and bunch emergence for var. Cavendishwere not significant different from that of var. Mbwazirume (P > 0.05). 1st ratoonplants under optimal management were also taller compared to minimal managementfor var. Cavendish (by 27.5%; P < 0.001) and var. Mbwazirume (by 39.1%; P <0.001). In addition, optimally managed plants had bigger girth (by 35.6%; P < 0.001)and had early bunch emergence (by 68 days; P < 0.001) and harvest (by 36 days; P <0.001) compared to minimally managed plants (Table 9b).
Similar to Kawanda, var. Cavendish plants were shorter (P< 0.001) than var.Mbwazirume for the mother plant crop at Mbarara. The duration to bunch emergencewas less (P<0.05) for Cavendish than for Mbwazirume. Plants grown under optimalmanagement were taller (by 15.5%; P< 0.05) and with a bigger girth (by 12.7%; P<0.05) compared to those grown under minimal management (Table 9c). Bananasgrown under minimal management took 1 and 8 more days (P>0.05) to bunchemergence and harvest, respectively, compared to optimal management.
In the 1st ratoon crop, at Mbarara, var Cavendish plants were shorter ( P < 0.001), butpseudostem girth did not differ significantly from those of var. Mbwazirume. Theduration from sucker selection to bunch emergence for both varieties was notsignificantly different (P > 0.05) when grown under optimal management. However,under minimal management, var. Cavendish plants took 24 days more (P < 0.05) toflower than var. Mbwazirume plants. The 1st ratoon plants grown under optimalmanagement were also taller (by 20.6%; P < 0.01) and bigger (by 15.2%; P < 0.05)compared to minimal management. Bunch emergence was delayed (P > 0.05) by 14and 19 days for var. Cavendish and var. Mbwazirume, respectively, grown underminimal management.
On average, crop management caused greater percentage increases in yield, growthand development components at Kawanda. Optimal management caused a higherpercentage increase in plant height and girth at Kawanda compared to Mbarara in themother and ratoon plant crop. Also, under optimal management, bunch emergenceduration was shorter by 94 and 68 days over minimal management, on average, in themother and 1st ratoon plant crop at Kawanda. In contrast, at Mbarara, the differencebetween the bunch emergence duration between the two management regimes was 1and 3 days in the mother and 1st ratoon crop cycles. Similarly, in the mother plantcrop, under minimal management, time to harvest was delayed by 89 and 8 days, atKawanda and Mbarara, respectively. These point to the possibility that apart fromBSV, crop management could be a growth limiting factor at Kawanda compared toMbarara. Still, the yield, plant statue and vigour were better, and bunch emergenceand harvest was attained much earlier at Kawanda compared to Mbarara. The factthat Mbarara is drier could be responsible for this pattern. This pattern and itsinteraction with BSV will become clearer with subsequent crop cycles.
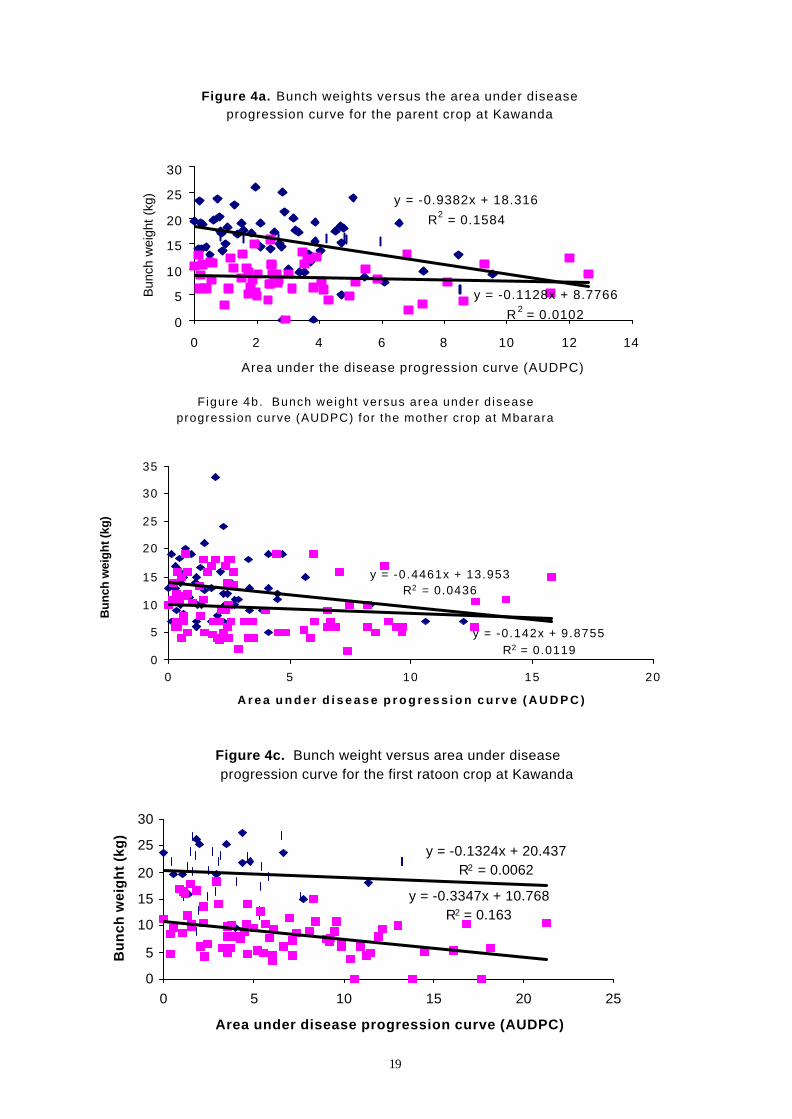
19
Figure 4a. Bunch weights versus the area under disease progression curve for the parent crop at Kawanda
y = -0.9382x + 18.316
R2 = 0.1584
y = -0.1128x + 8.7766
R 2 = 0.01020
5
10
15
20
25
30
0 2 4 6 8 10 12 14
Area under the disease progression curve (AUDPC)
Bun
ch w
eigh
t (k
g)
Figure 4b. Bunch weight versus area under d isease progression curve (AUDPC) for the mother crop at Mbarara
y = -0.4461x + 13.953R2 = 0.0436
y = -0.142x + 9.8755R2 = 0.0119
0
5
10
15
20
25
30
35
0 5 10 15 20
A r e a u n d e r d i s e a s e p r o g r e s s i o n c u r v e ( A U D P C )
Bu
nch
wei
gh
t (kg
)
Figure 4c. Bunch weight versus area under disease progression curve for the first ratoon crop at Kawanda
y = -0.1324x + 20.437R2 = 0.0062
y = -0.3347x + 10.768R2 = 0.163
0
5
10
15
20
25
30
0 5 10 15 20 25
Area under disease progression curve (AUDPC)
Bu
nc
h w
eig
ht
(kg
)
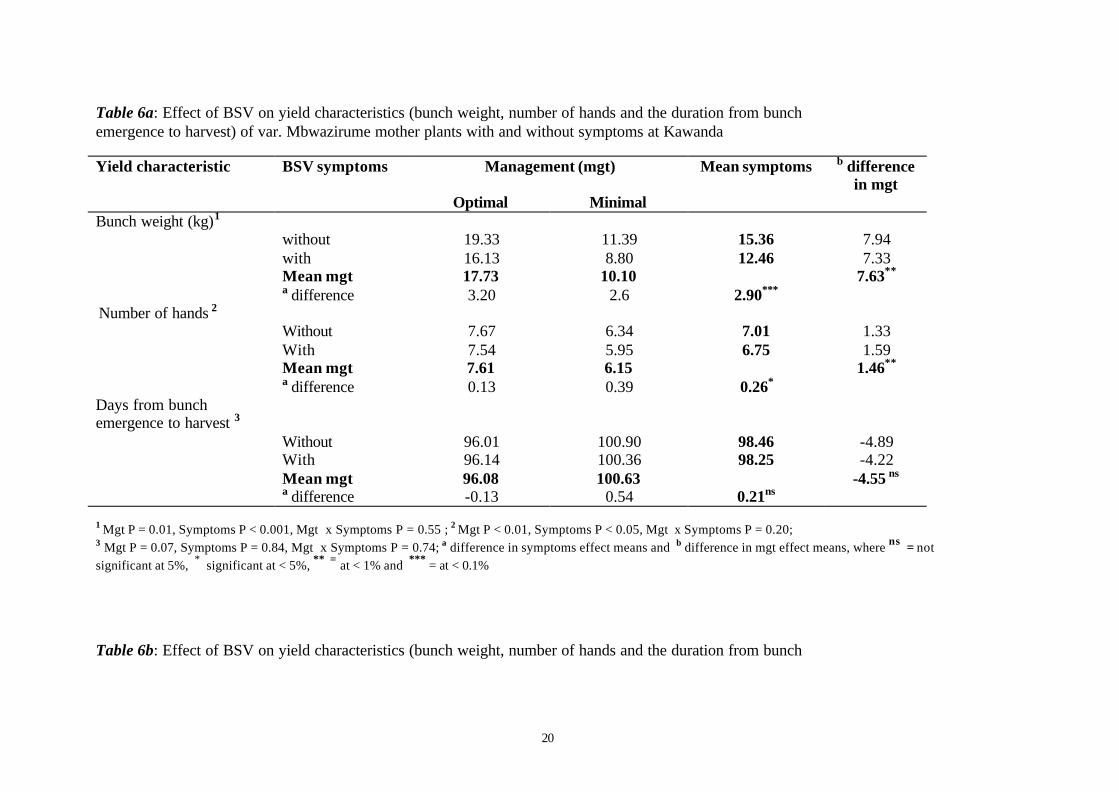
20
Table 6a: Effect of BSV on yield characteristics (bunch weight, number of hands and the duration from bunchemergence to harvest) of var. Mbwazirume mother plants with and without symptoms at Kawanda
Yield characteristic Management (mgt) Mean symptoms b differencein mgt
BSV symptoms
Optimal MinimalBunch weight (kg)1
without 19.33 11.39 15.36 7.94with 16.13 8.80 12.46 7.33Mean mgt 17.73 10.10 7.63**
a difference 3.20 2.6 2.90***
Number of hands 2
Without 7.67 6.34 7.01 1.33With 7.54 5.95 6.75 1.59Mean mgt 7.61 6.15 1.46**
a difference 0.13 0.39 0.26*
Days from bunchemergence to harvest 3
Without 96.01 100.90 98.46 -4.89With 96.14 100.36 98.25 -4.22Mean mgt 96.08 100.63 -4.55 ns
a difference -0.13 0.54 0.21ns
1 Mgt P = 0.01, Symptoms P < 0.001, Mgt x Symptoms P = 0.55 ; 2 Mgt P < 0.01, Symptoms P < 0.05, Mgt x Symptoms P = 0.20;3 Mgt P = 0.07, Symptoms P = 0.84, Mgt x Symptoms P = 0.74; a difference in symptoms effect means and b difference in mgt effect means, where ns = notsignificant at 5%, * significant at < 5%, ** = at < 1% and *** = at < 0.1%
Table 6b: Effect of BSV on yield characteristics (bunch weight, number of hands and the duration from bunch
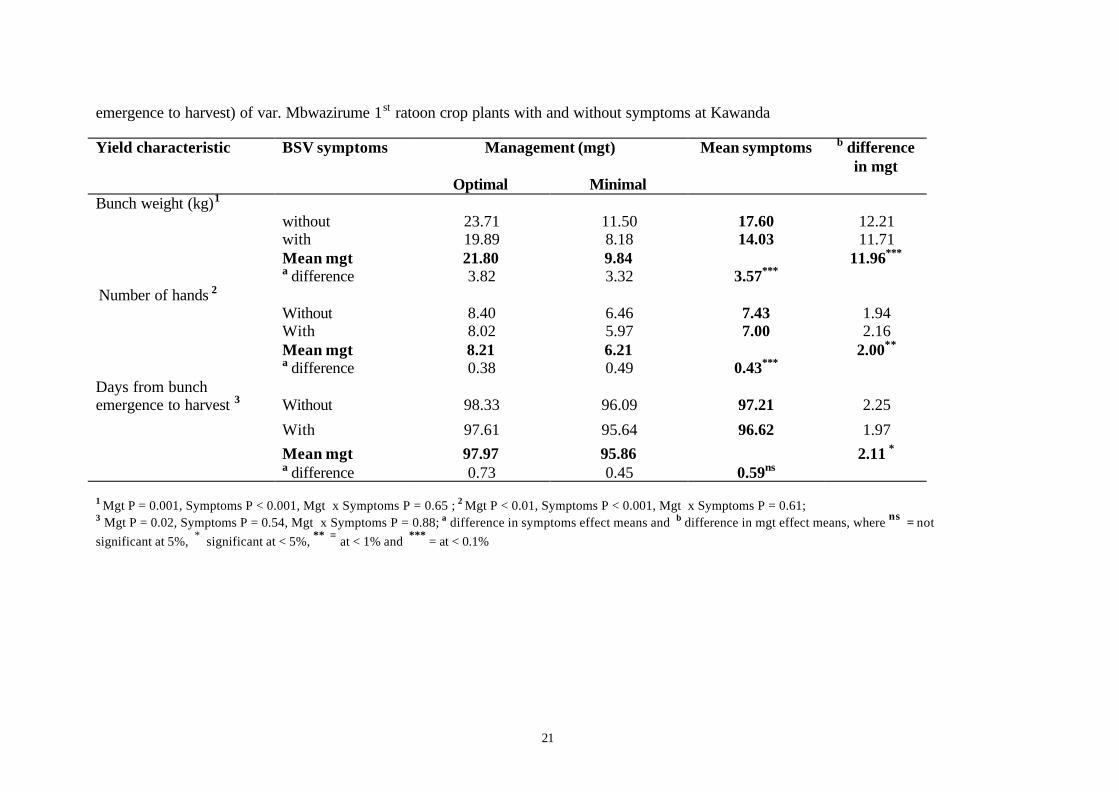
21
emergence to harvest) of var. Mbwazirume 1st ratoon crop plants with and without symptoms at Kawanda
Yield characteristic Management (mgt) Mean symptoms b differencein mgt
BSV symptoms
Optimal MinimalBunch weight (kg)1
without 23.71 11.50 17.60 12.21with 19.89 8.18 14.03 11.71Mean mgt 21.80 9.84 11.96***
a difference 3.82 3.32 3.57***
Number of hands 2
Without 8.40 6.46 7.43 1.94With 8.02 5.97 7.00 2.16Mean mgt 8.21 6.21 2.00**
a difference 0.38 0.49 0.43***
Without 98.33 96.09 97.21 2.25
With 97.61 95.64 96.62 1.97
Mean mgt 97.97 95.86 2.11 *
Days from bunchemergence to harvest 3
a difference 0.73 0.45 0.59ns
1 Mgt P = 0.001, Symptoms P < 0.001, Mgt x Symptoms P = 0.65 ; 2 Mgt P < 0.01, Symptoms P < 0.001, Mgt x Symptoms P = 0.61;3 Mgt P = 0.02, Symptoms P = 0.54, Mgt x Symptoms P = 0.88; a difference in symptoms effect means and b difference in mgt effect means, where ns = notsignificant at 5%, * significant at < 5%, ** = at < 1% and *** = at < 0.1%

22
Table 6c: Effect of BSV on yield characteristics (bunch weight, number of hands and duration from bunchemergence to harvest) of var. Mbwazirume mother plants with and without symptoms at Mbarara
Yield characteristic Management (mgt) Meansymptoms
b differencein mgt
BSV symptoms
Optimal MinimalBunch weight (kg)1
without 12.99 10.52 11.75 2.47with 12.83 9.10 10.96 3.73Mean mgt 12.91 9.81 3.09 ns
a difference 0.16 1.42 0.79ns
Number of hands 2
Without 7.70 6.86 7.28 0.84With 7.57 6.80 7.19 0.77Mean mgt 7.63 6.83 0.80 ns
a difference 0.13 0.06 0.09ns
Days from bunchemergence to harvest 3
Without 119.38 127.98 123.68 -8.60With 120.90 124.40 122.65 -3.50Mean mgt 120.14 126.19 -6.05 *
a difference -1.52 3.58 1.03ns
1 Mgt P = 0.07, Symptoms P = 0.20, Mgt x Symptoms P = 0.31 ; 2 Mgt P = 0.07, Symptoms P = 0.45, Mgt x Symptoms P = 0.76;3 Mgt P = 0.05, Symptoms P = 0.66, Mgt x Symptoms P = 0.28; a difference in symptoms effect means and b difference in mgt effect means, where ns = not significantat 5%, * significant at < 5%.
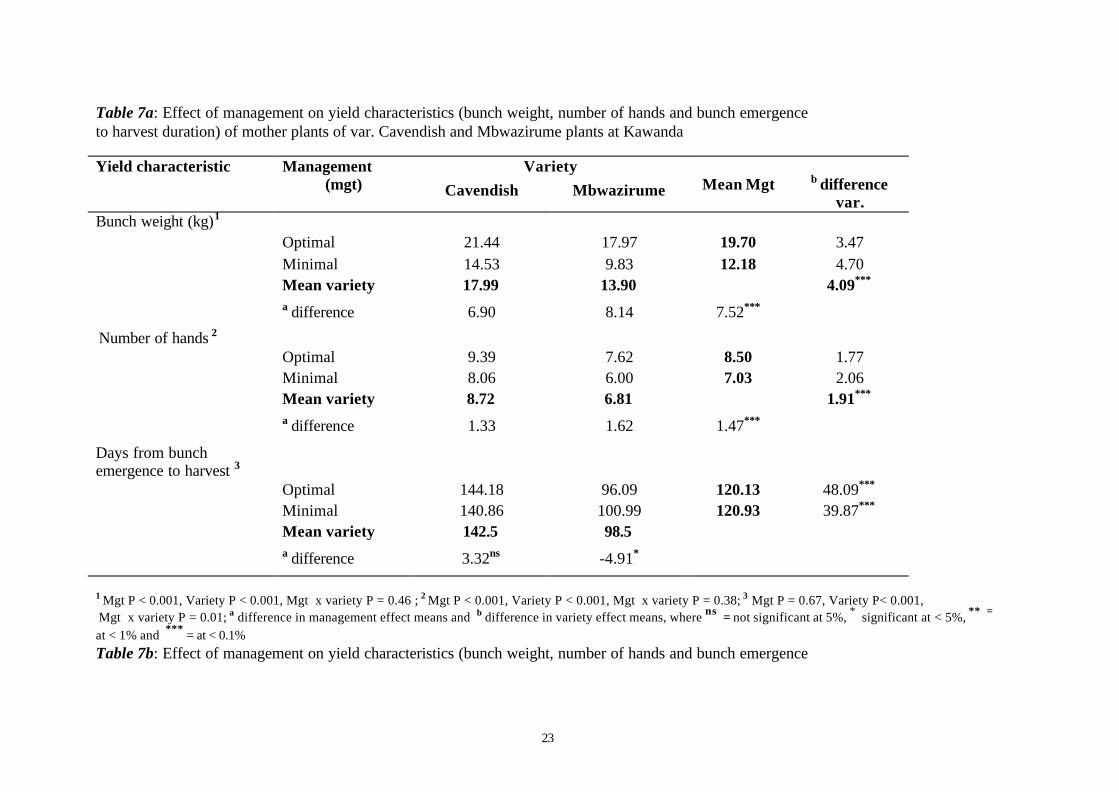
23
Table 7a: Effect of management on yield characteristics (bunch weight, number of hands and bunch emergenceto harvest duration) of mother plants of var. Cavendish and Mbwazirume plants at Kawanda
Yield characteristic VarietyManagement(mgt) Cavendish Mbwazirume Mean Mgt b difference
var.Bunch weight (kg)1
Optimal 21.44 17.97 19.70 3.47Minimal 14.53 9.83 12.18 4.70Mean variety 17.99 13.90 4.09***
a difference 6.90 8.14 7.52***
Number of hands 2
Optimal 9.39 7.62 8.50 1.77Minimal 8.06 6.00 7.03 2.06Mean variety 8.72 6.81 1.91***
a difference 1.33 1.62 1.47***
Days from bunchemergence to harvest 3
Optimal 144.18 96.09 120.13 48.09***
Minimal 140.86 100.99 120.93 39.87***
Mean variety 142.5 98.5a difference 3.32ns -4.91*
1 Mgt P < 0.001, Variety P < 0.001, Mgt x variety P = 0.46 ; 2 Mgt P < 0.001, Variety P < 0.001, Mgt x variety P = 0.38; 3 Mgt P = 0.67, Variety P< 0.001, Mgt x variety P = 0.01; a difference in management effect means and b difference in variety effect means, where ns = not significant at 5%, * significant at < 5%, ** =
at < 1% and *** = at < 0.1%Table 7b: Effect of management on yield characteristics (bunch weight, number of hands and bunch emergence
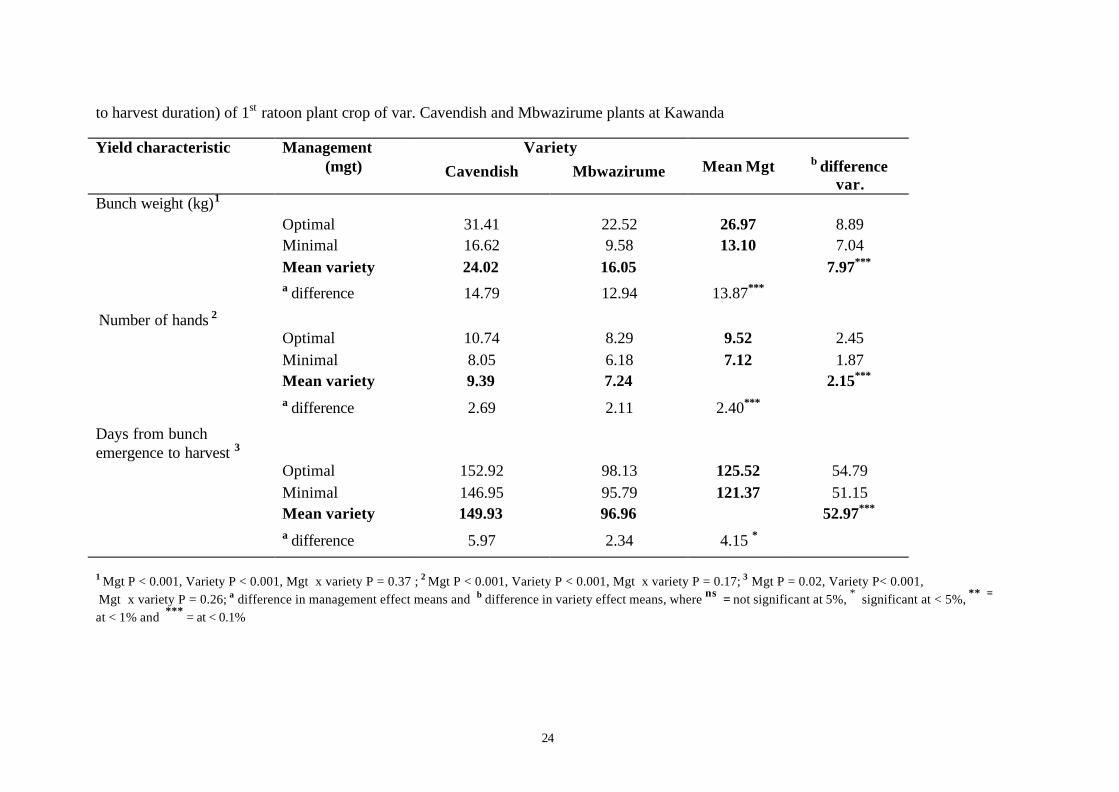
24
to harvest duration) of 1st ratoon plant crop of var. Cavendish and Mbwazirume plants at Kawanda
Yield characteristic VarietyManagement(mgt) Cavendish Mbwazirume Mean Mgt b difference
var.Bunch weight (kg)1
Optimal 31.41 22.52 26.97 8.89Minimal 16.62 9.58 13.10 7.04Mean variety 24.02 16.05 7.97***
a difference 14.79 12.94 13.87***
Number of hands 2
Optimal 10.74 8.29 9.52 2.45Minimal 8.05 6.18 7.12 1.87Mean variety 9.39 7.24 2.15***
a difference 2.69 2.11 2.40***
Days from bunchemergence to harvest 3
Optimal 152.92 98.13 125.52 54.79Minimal 146.95 95.79 121.37 51.15Mean variety 149.93 96.96 52.97***
a difference 5.97 2.34 4.15 *
1 Mgt P < 0.001, Variety P < 0.001, Mgt x variety P = 0.37 ; 2 Mgt P < 0.001, Variety P < 0.001, Mgt x variety P = 0.17; 3 Mgt P = 0.02, Variety P< 0.001, Mgt x variety P = 0.26; a difference in management effect means and b difference in variety effect means, where ns = not significant at 5%, * significant at < 5%, ** =
at < 1% and *** = at < 0.1%
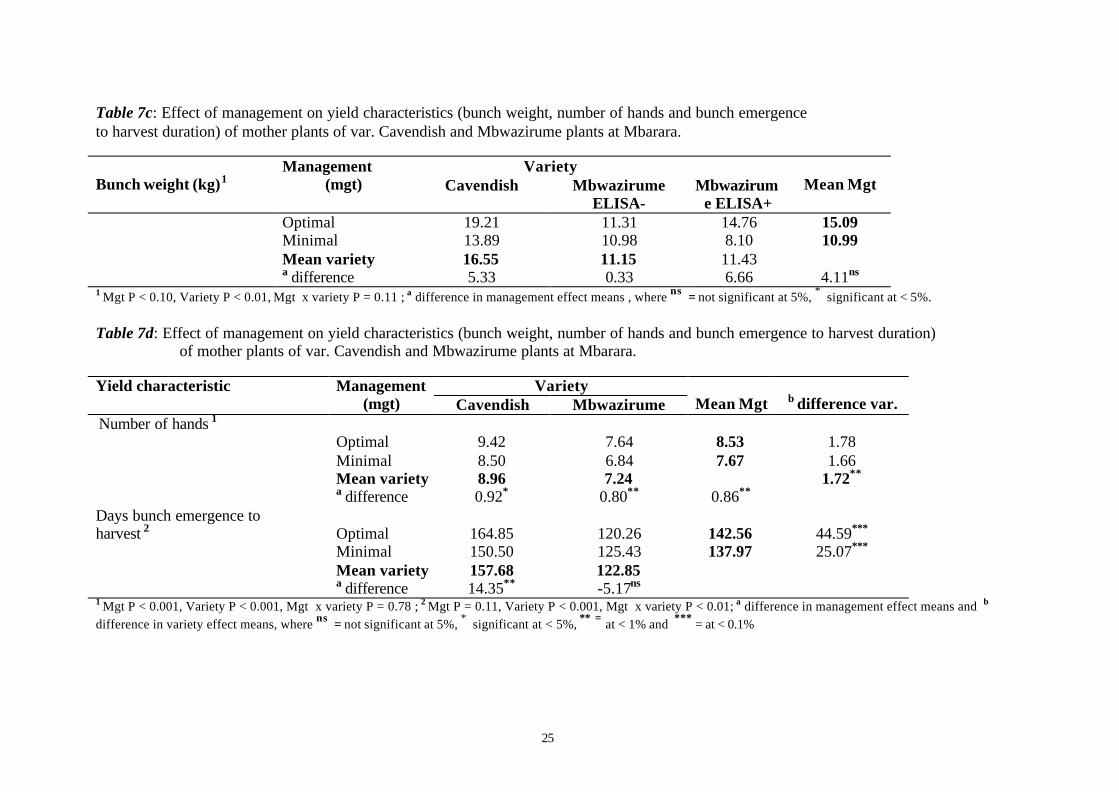
25
Table 7c: Effect of management on yield characteristics (bunch weight, number of hands and bunch emergenceto harvest duration) of mother plants of var. Cavendish and Mbwazirume plants at Mbarara.
VarietyBunch weight (kg)1
Management(mgt) Cavendish Mbwazirume
ELISA-Mbwazirum
e ELISA+Mean Mgt
Optimal 19.21 11.31 14.76 15.09Minimal 13.89 10.98 8.10 10.99Mean variety 16.55 11.15 11.43a difference 5.33 0.33 6.66 4.11ns
1 Mgt P < 0.10, Variety P < 0.01, Mgt x variety P = 0.11 ; a difference in management effect means , where ns = not significant at 5%, * significant at < 5%.
Table 7d: Effect of management on yield characteristics (bunch weight, number of hands and bunch emergence to harvest duration) of mother plants of var. Cavendish and Mbwazirume plants at Mbarara.
Yield characteristic VarietyManagement(mgt) Cavendish Mbwazirume Mean Mgt b difference var.
Number of hands 1
Optimal 9.42 7.64 8.53 1.78Minimal 8.50 6.84 7.67 1.66Mean variety 8.96 7.24 1.72**
a difference 0.92* 0.80** 0.86**
Days bunch emergence toharvest 2 Optimal 164.85 120.26 142.56 44.59***
Minimal 150.50 125.43 137.97 25.07***
Mean variety 157.68 122.85a difference 14.35** -5.17ns
1 Mgt P < 0.001, Variety P < 0.001, Mgt x variety P = 0.78 ; 2 Mgt P = 0.11, Variety P < 0.001, Mgt x variety P < 0.01; a difference in management effect means and b
difference in variety effect means, where ns = not significant at 5%, * significant at < 5%, ** = at < 1% and *** = at < 0.1%
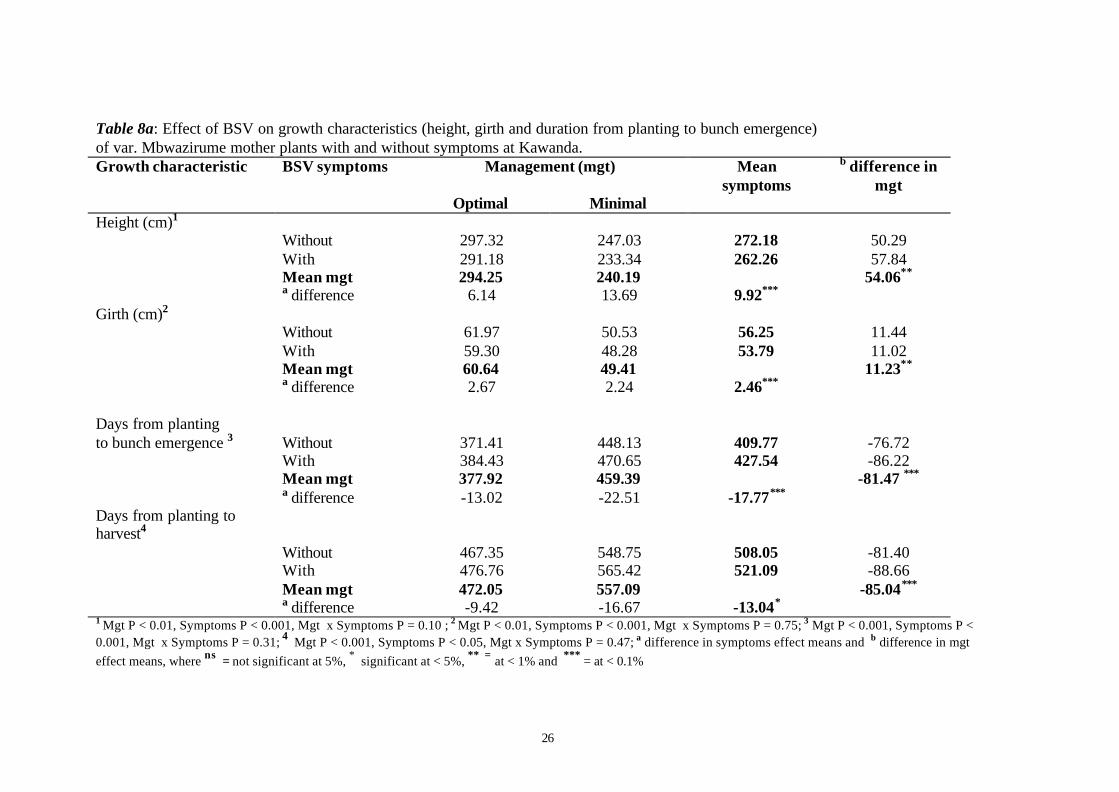
26
Table 8a: Effect of BSV on growth characteristics (height, girth and duration from planting to bunch emergence)of var. Mbwazirume mother plants with and without symptoms at Kawanda.Growth characteristic Management (mgt) Mean
symptoms
b difference inmgt
BSV symptoms
Optimal MinimalHeight (cm)1
Without 297.32 247.03 272.18 50.29With 291.18 233.34 262.26 57.84Mean mgt 294.25 240.19 54.06**
a difference 6.14 13.69 9.92***
Girth (cm)2
Without 61.97 50.53 56.25 11.44With 59.30 48.28 53.79 11.02Mean mgt 60.64 49.41 11.23**
a difference 2.67 2.24 2.46***
Days from plantingto bunch emergence 3 Without 371.41 448.13 409.77 -76.72
With 384.43 470.65 427.54 -86.22Mean mgt 377.92 459.39 -81.47 ***
a difference -13.02 -22.51 -17.77***
Days from planting toharvest4
Without 467.35 548.75 508.05 -81.40With 476.76 565.42 521.09 -88.66Mean mgt 472.05 557.09 -85.04***
a difference -9.42 -16.67 -13.04*
1 Mgt P < 0.01, Symptoms P < 0.001, Mgt x Symptoms P = 0.10 ; 2 Mgt P < 0.01, Symptoms P < 0.001, Mgt x Symptoms P = 0.75; 3 Mgt P < 0.001, Symptoms P <0.001, Mgt x Symptoms P = 0.31; 4 Mgt P < 0.001, Symptoms P < 0.05, Mgt x Symptoms P = 0.47; a difference in symptoms effect means and b difference in mgteffect means, where ns = not significant at 5%, * significant at < 5%, ** = at < 1% and *** = at < 0.1%
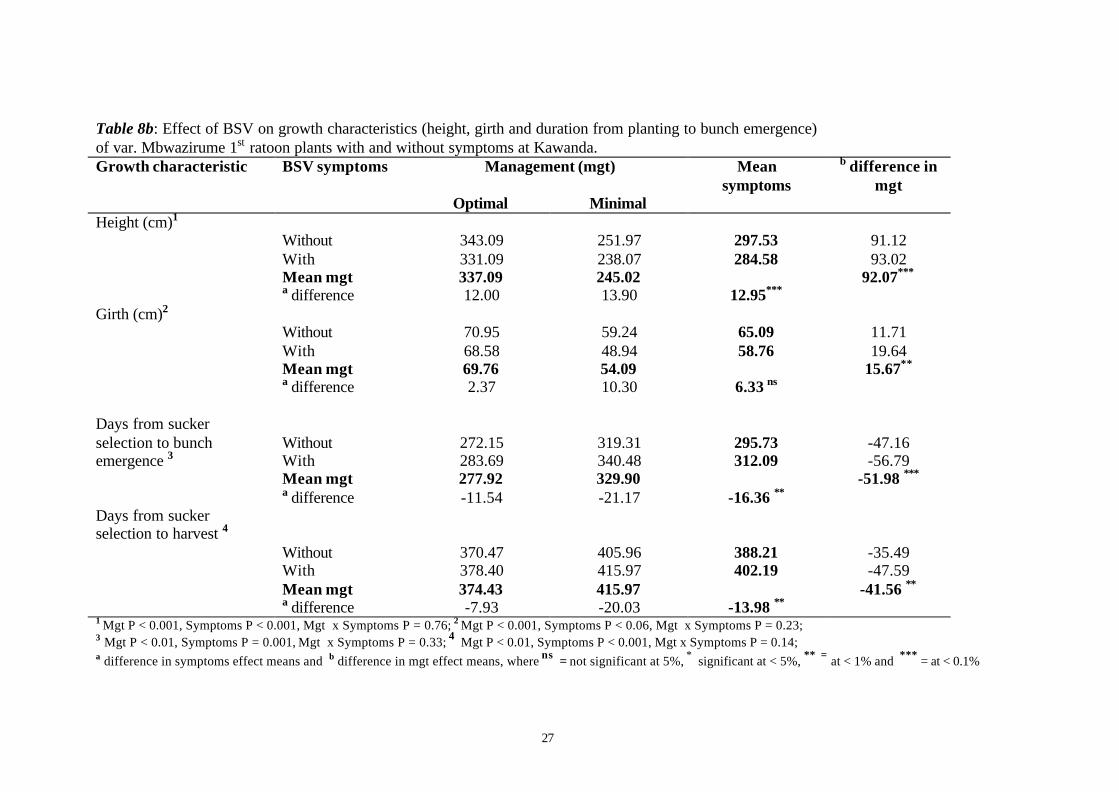
27
Table 8b: Effect of BSV on growth characteristics (height, girth and duration from planting to bunch emergence)of var. Mbwazirume 1st ratoon plants with and without symptoms at Kawanda.Growth characteristic Management (mgt) Mean
symptoms
b difference inmgt
BSV symptoms
Optimal MinimalHeight (cm)1
Without 343.09 251.97 297.53 91.12With 331.09 238.07 284.58 93.02Mean mgt 337.09 245.02 92.07***
a difference 12.00 13.90 12.95***
Girth (cm)2
Without 70.95 59.24 65.09 11.71With 68.58 48.94 58.76 19.64Mean mgt 69.76 54.09 15.67**
a difference 2.37 10.30 6.33 ns
Days from suckerselection to bunch Without 272.15 319.31 295.73 -47.16emergence 3 With 283.69 340.48 312.09 -56.79
Mean mgt 277.92 329.90 -51.98 ***
a difference -11.54 -21.17 -16.36 **
Days from suckerselection to harvest 4
Without 370.47 405.96 388.21 -35.49With 378.40 415.97 402.19 -47.59Mean mgt 374.43 415.97 -41.56 **
a difference -7.93 -20.03 -13.98 **
1 Mgt P < 0.001, Symptoms P < 0.001, Mgt x Symptoms P = 0.76; 2 Mgt P < 0.001, Symptoms P < 0.06, Mgt x Symptoms P = 0.23;3 Mgt P < 0.01, Symptoms P = 0.001, Mgt x Symptoms P = 0.33; 4 Mgt P < 0.01, Symptoms P < 0.001, Mgt x Symptoms P = 0.14;a difference in symptoms effect means and b difference in mgt effect means, where ns = not significant at 5%, * significant at < 5%, ** = at < 1% and *** = at < 0.1%
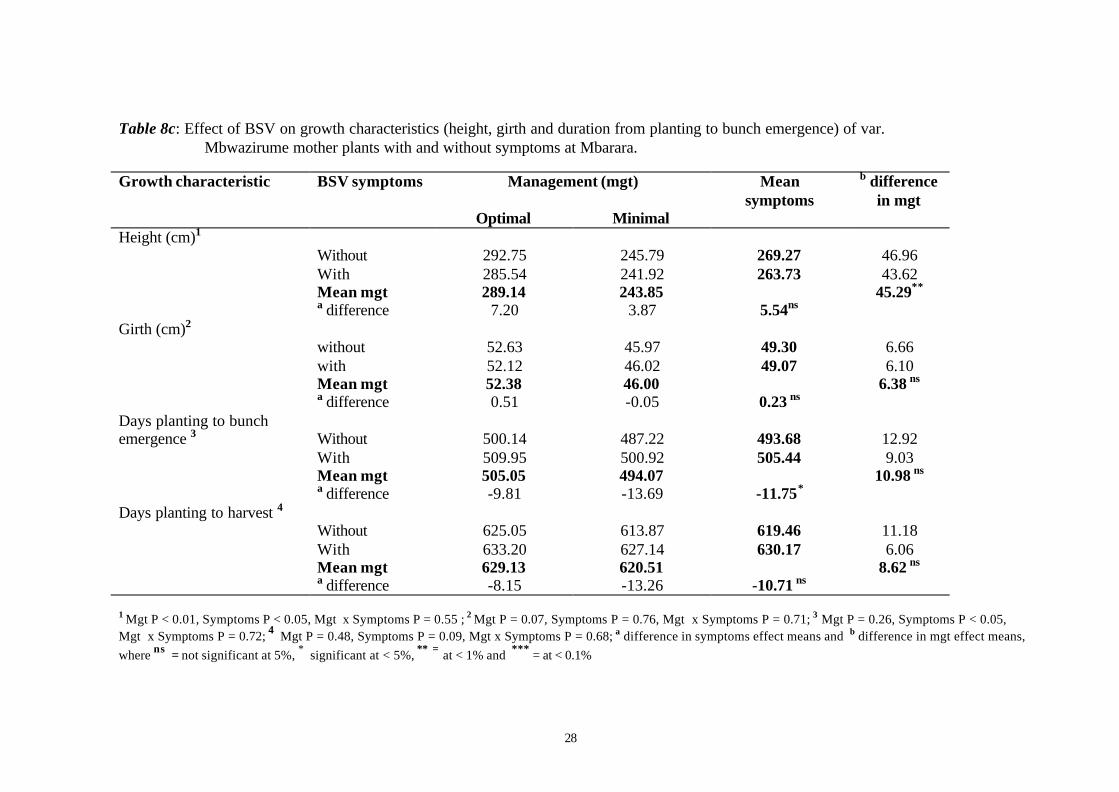
28
Table 8c: Effect of BSV on growth characteristics (height, girth and duration from planting to bunch emergence) of var. Mbwazirume mother plants with and without symptoms at Mbarara.
Growth characteristic Management (mgt) Meansymptoms
b differencein mgt
BSV symptoms
Optimal MinimalHeight (cm)1
Without 292.75 245.79 269.27 46.96With 285.54 241.92 263.73 43.62Mean mgt 289.14 243.85 45.29**
a difference 7.20 3.87 5.54ns
Girth (cm)2
without 52.63 45.97 49.30 6.66with 52.12 46.02 49.07 6.10Mean mgt 52.38 46.00 6.38 ns
a difference 0.51 -0.05 0.23 ns
Days planting to bunchemergence 3 Without 500.14 487.22 493.68 12.92
With 509.95 500.92 505.44 9.03Mean mgt 505.05 494.07 10.98 ns
a difference -9.81 -13.69 -11.75*
Days planting to harvest 4 Without 625.05 613.87 619.46 11.18With 633.20 627.14 630.17 6.06Mean mgt 629.13 620.51 8.62 ns
a difference -8.15 -13.26 -10.71 ns
1 Mgt P < 0.01, Symptoms P < 0.05, Mgt x Symptoms P = 0.55 ; 2 Mgt P = 0.07, Symptoms P = 0.76, Mgt x Symptoms P = 0.71; 3 Mgt P = 0.26, Symptoms P < 0.05,Mgt x Symptoms P = 0.72; 4 Mgt P = 0.48, Symptoms P = 0.09, Mgt x Symptoms P = 0.68; a difference in symptoms effect means and b difference in mgt effect means,where ns = not significant at 5%, * significant at < 5%, ** = at < 1% and *** = at < 0.1%
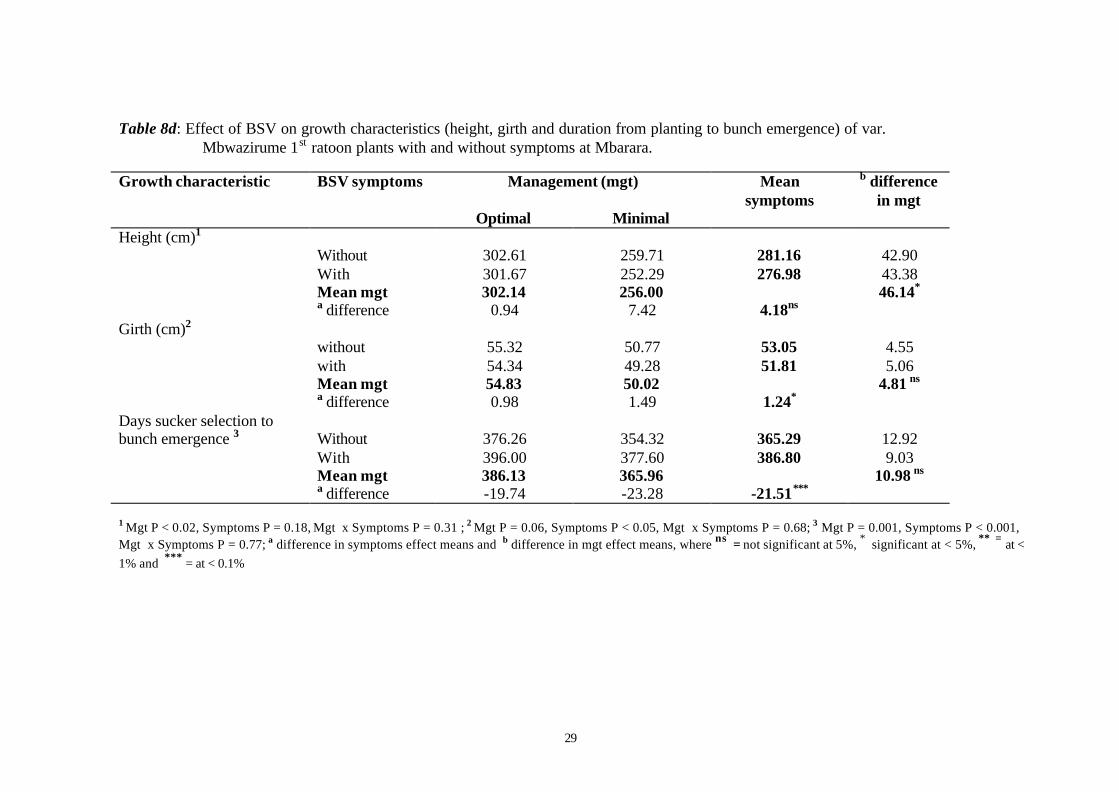
29
Table 8d: Effect of BSV on growth characteristics (height, girth and duration from planting to bunch emergence) of var. Mbwazirume 1st ratoon plants with and without symptoms at Mbarara.
Growth characteristic Management (mgt) Meansymptoms
b differencein mgt
BSV symptoms
Optimal MinimalHeight (cm)1
Without 302.61 259.71 281.16 42.90With 301.67 252.29 276.98 43.38Mean mgt 302.14 256.00 46.14*
a difference 0.94 7.42 4.18ns
Girth (cm)2
without 55.32 50.77 53.05 4.55with 54.34 49.28 51.81 5.06Mean mgt 54.83 50.02 4.81 ns
a difference 0.98 1.49 1.24*
Days sucker selection tobunch emergence 3 Without 376.26 354.32 365.29 12.92
With 396.00 377.60 386.80 9.03Mean mgt 386.13 365.96 10.98 ns
a difference -19.74 -23.28 -21.51***
1 Mgt P < 0.02, Symptoms P = 0.18, Mgt x Symptoms P = 0.31 ; 2 Mgt P = 0.06, Symptoms P < 0.05, Mgt x Symptoms P = 0.68; 3 Mgt P = 0.001, Symptoms P < 0.001,Mgt x Symptoms P = 0.77; a difference in symptoms effect means and b difference in mgt effect means, where ns = not significant at 5%, * significant at < 5%, ** = at <1% and *** = at < 0.1%
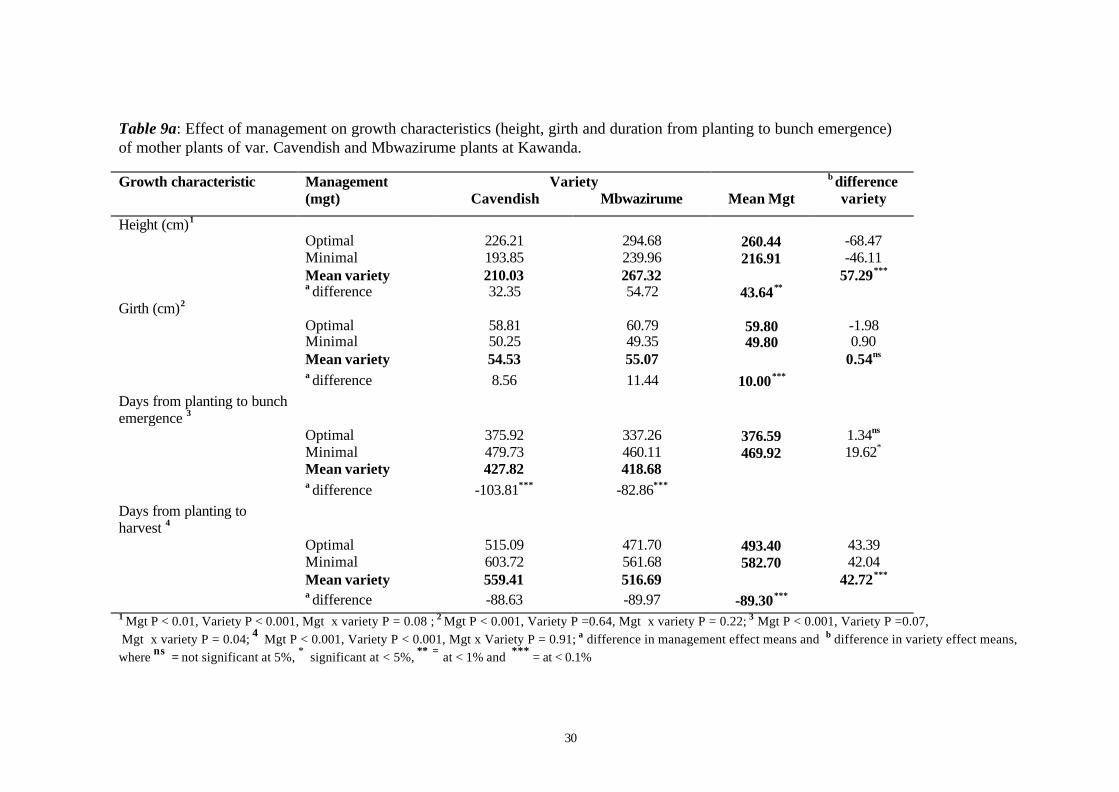
30
Table 9a: Effect of management on growth characteristics (height, girth and duration from planting to bunch emergence)of mother plants of var. Cavendish and Mbwazirume plants at Kawanda.
Growth characteristic VarietyManagement(mgt) Cavendish Mbwazirume Mean Mgt
b differencevariety
Height (cm)1
Optimal 226.21 294.68 260.44 -68.47Minimal 193.85 239.96 216.91 -46.11Mean variety 210.03 267.32 57.29***
a difference 32.35 54.72 43.64**
Girth (cm)2
Optimal 58.81 60.79 59.80 -1.98Minimal 50.25 49.35 49.80 0.90Mean variety 54.53 55.07 0.54ns
a difference 8.56 11.44 10.00***
Days from planting to bunchemergence 3
Optimal 375.92 337.26 376.59 1.34ns
Minimal 479.73 460.11 469.92 19.62*
Mean variety 427.82 418.68a difference -103.81*** -82.86***
Days from planting toharvest 4
Optimal 515.09 471.70 493.40 43.39Minimal 603.72 561.68 582.70 42.04Mean variety 559.41 516.69 42.72***
a difference -88.63 -89.97 -89.30***
1 Mgt P < 0.01, Variety P < 0.001, Mgt x variety P = 0.08 ; 2 Mgt P < 0.001, Variety P =0.64, Mgt x variety P = 0.22; 3 Mgt P < 0.001, Variety P =0.07, Mgt x variety P = 0.04; 4 Mgt P < 0.001, Variety P < 0.001, Mgt x Variety P = 0.91; a difference in management effect means and b difference in variety effect means,where ns = not significant at 5%, * significant at < 5%, ** = at < 1% and *** = at < 0.1%
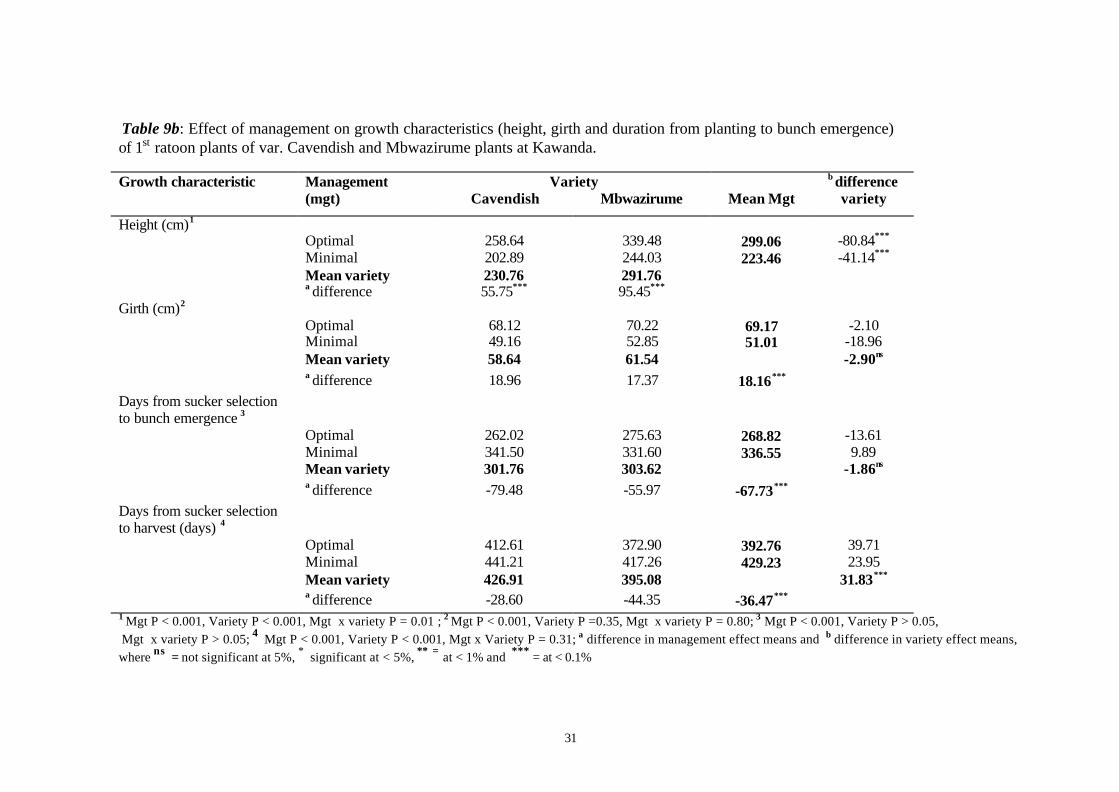
31
Table 9b: Effect of management on growth characteristics (height, girth and duration from planting to bunch emergence)of 1st ratoon plants of var. Cavendish and Mbwazirume plants at Kawanda.
Growth characteristic VarietyManagement(mgt) Cavendish Mbwazirume Mean Mgt
b differencevariety
Height (cm)1
Optimal 258.64 339.48 299.06 -80.84***
Minimal 202.89 244.03 223.46 -41.14***
Mean variety 230.76 291.76a difference 55.75*** 95.45***
Girth (cm)2
Optimal 68.12 70.22 69.17 -2.10Minimal 49.16 52.85 51.01 -18.96Mean variety 58.64 61.54 -2.90ns
a difference 18.96 17.37 18.16***
Days from sucker selectionto bunch emergence 3
Optimal 262.02 275.63 268.82 -13.61Minimal 341.50 331.60 336.55 9.89Mean variety 301.76 303.62 -1.86ns
a difference -79.48 -55.97 -67.73***
Days from sucker selectionto harvest (days) 4
Optimal 412.61 372.90 392.76 39.71Minimal 441.21 417.26 429.23 23.95Mean variety 426.91 395.08 31.83***
a difference -28.60 -44.35 -36.47***
1 Mgt P < 0.001, Variety P < 0.001, Mgt x variety P = 0.01 ; 2 Mgt P < 0.001, Variety P =0.35, Mgt x variety P = 0.80; 3 Mgt P < 0.001, Variety P > 0.05, Mgt x variety P > 0.05; 4 Mgt P < 0.001, Variety P < 0.001, Mgt x Variety P = 0.31; a difference in management effect means and b difference in variety effect means,where ns = not significant at 5%, * significant at < 5%, ** = at < 1% and *** = at < 0.1%
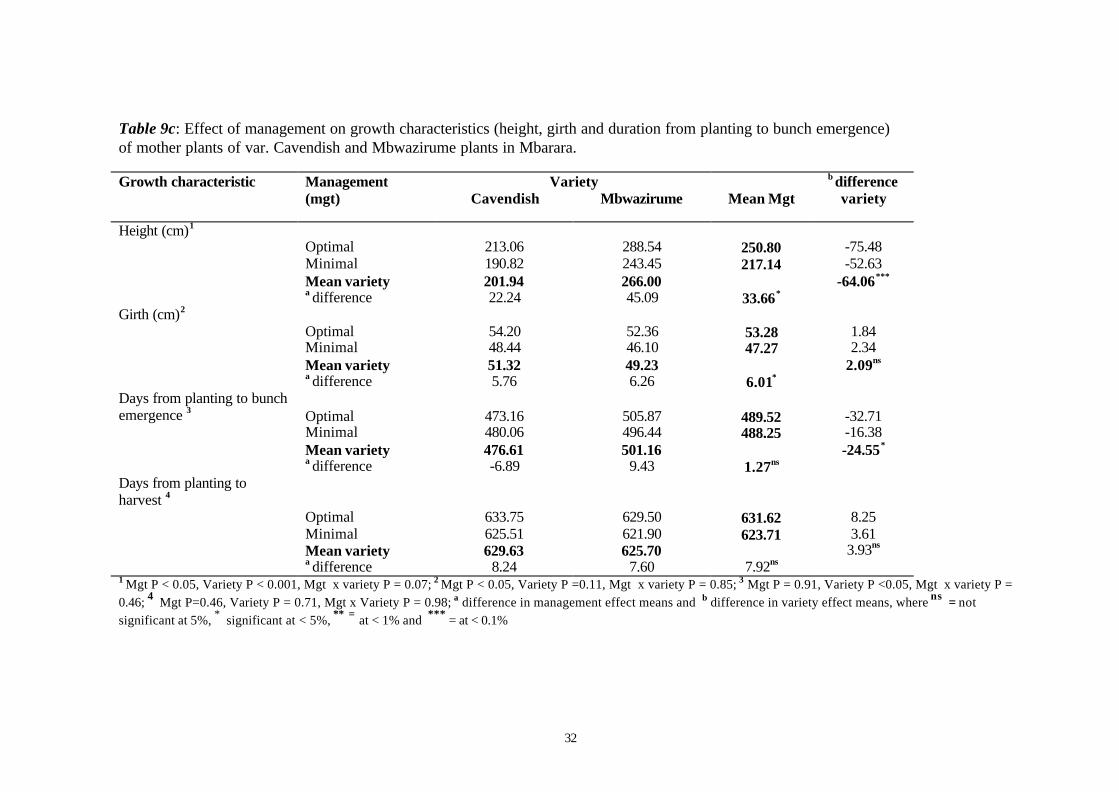
32
Table 9c: Effect of management on growth characteristics (height, girth and duration from planting to bunch emergence)of mother plants of var. Cavendish and Mbwazirume plants in Mbarara.
Growth characteristic VarietyManagement(mgt) Cavendish Mbwazirume Mean Mgt
b differencevariety
Height (cm)1
Optimal 213.06 288.54 250.80 -75.48Minimal 190.82 243.45 217.14 -52.63Mean variety 201.94 266.00 -64.06***
a difference 22.24 45.09 33.66*
Girth (cm)2
Optimal 54.20 52.36 53.28 1.84Minimal 48.44 46.10 47.27 2.34Mean variety 51.32 49.23 2.09ns
a difference 5.76 6.26 6.01*
Days from planting to bunchemergence 3 Optimal 473.16 505.87 489.52 -32.71
Minimal 480.06 496.44 488.25 -16.38Mean variety 476.61 501.16 -24.55*
a difference -6.89 9.43 1.27ns
Days from planting toharvest 4
Optimal 633.75 629.50 631.62 8.25Minimal 625.51 621.90 623.71 3.61Mean variety 629.63 625.70 3.93ns
a difference 8.24 7.60 7.92ns
1 Mgt P < 0.05, Variety P < 0.001, Mgt x variety P = 0.07; 2 Mgt P < 0.05, Variety P =0.11, Mgt x variety P = 0.85; 3 Mgt P = 0.91, Variety P <0.05, Mgt x variety P =0.46; 4 Mgt P=0.46, Variety P = 0.71, Mgt x Variety P = 0.98; a difference in management effect means and b difference in variety effect means, where ns = notsignificant at 5%, * significant at < 5%, ** = at < 1% and *** = at < 0.1%
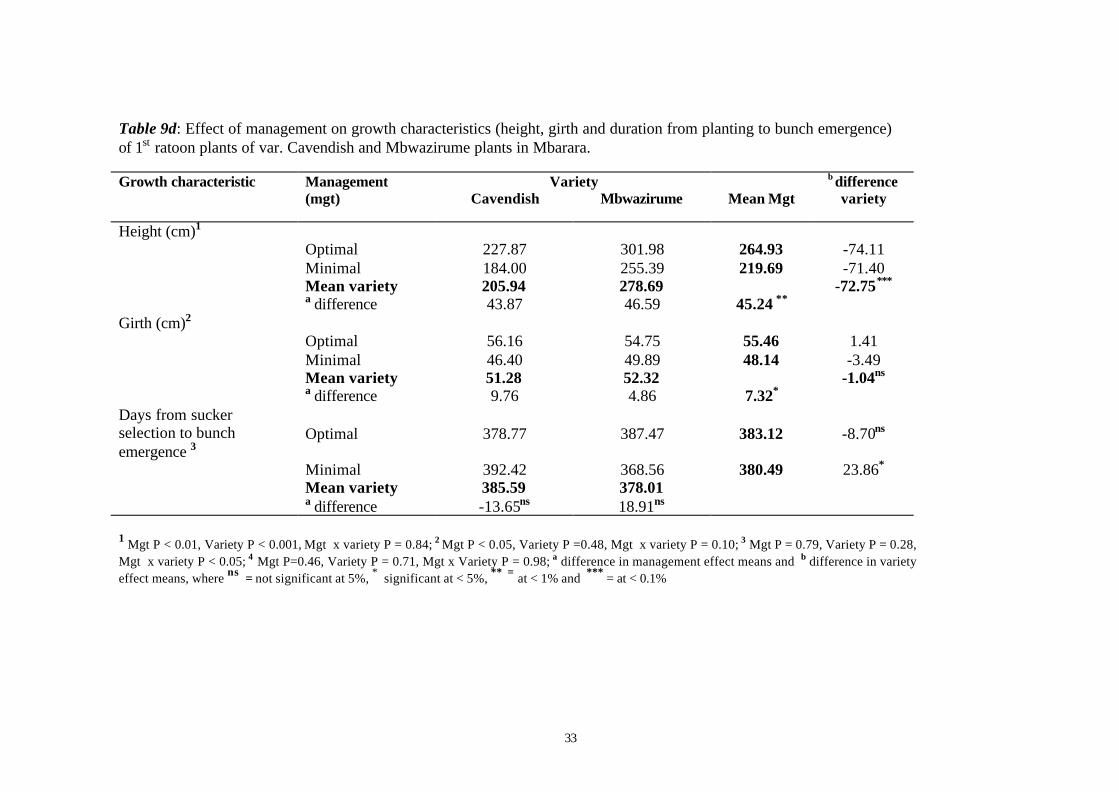
33
Table 9d: Effect of management on growth characteristics (height, girth and duration from planting to bunch emergence)of 1st ratoon plants of var. Cavendish and Mbwazirume plants in Mbarara.
Growth characteristic VarietyManagement(mgt) Cavendish Mbwazirume Mean Mgt
b differencevariety
Height (cm)1
Optimal 227.87 301.98 264.93 -74.11Minimal 184.00 255.39 219.69 -71.40Mean variety 205.94 278.69 -72.75***
a difference 43.87 46.59 45.24 **
Girth (cm)2
Optimal 56.16 54.75 55.46 1.41Minimal 46.40 49.89 48.14 -3.49Mean variety 51.28 52.32 -1.04ns
a difference 9.76 4.86 7.32*
Days from suckerselection to bunchemergence 3
Optimal 378.77 387.47 383.12 -8.70ns
Minimal 392.42 368.56 380.49 23.86*
Mean variety 385.59 378.01a difference -13.65ns 18.91ns
1 Mgt P < 0.01, Variety P < 0.001, Mgt x variety P = 0.84; 2 Mgt P < 0.05, Variety P =0.48, Mgt x variety P = 0.10; 3 Mgt P = 0.79, Variety P = 0.28,Mgt x variety P < 0.05; 4 Mgt P=0.46, Variety P = 0.71, Mgt x Variety P = 0.98; a difference in management effect means and b difference in varietyeffect means, where ns = not significant at 5%, * significant at < 5%, ** = at < 1% and *** = at < 0.1%
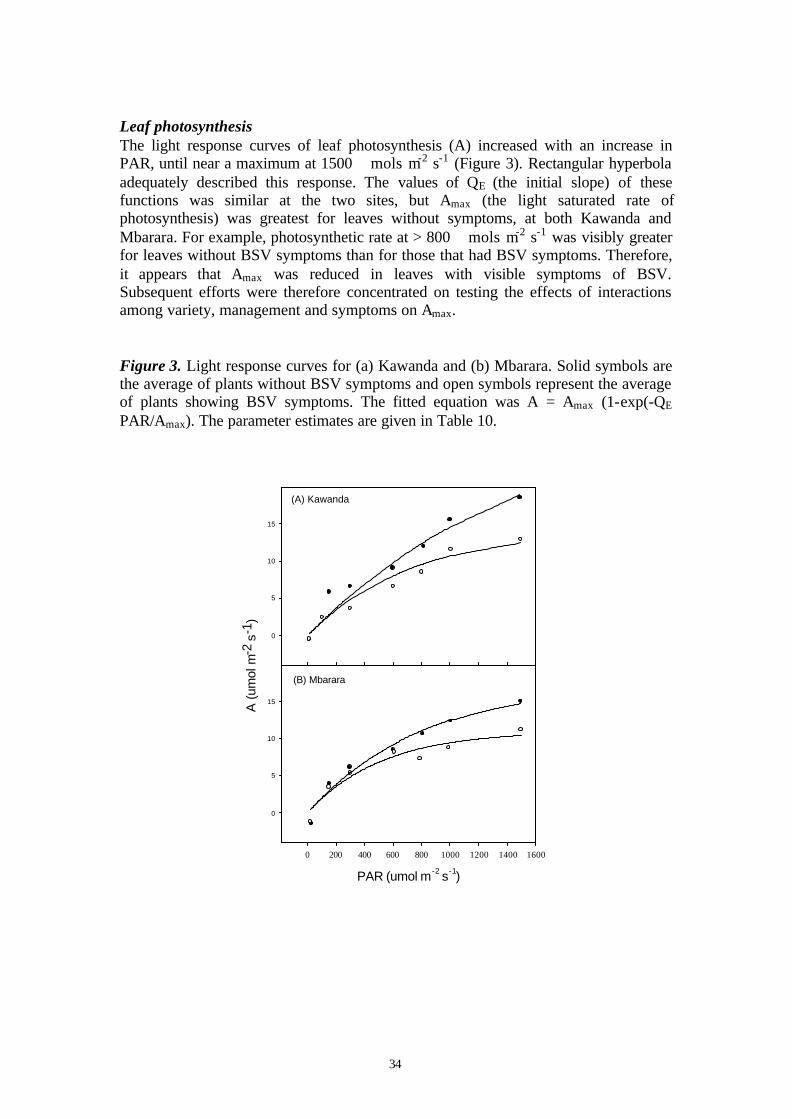
34
Leaf photosynthesisThe light response curves of leaf photosynthesis (A) increased with an increase inPAR, until near a maximum at 1500 �mols m-2 s-1 (Figure 3). Rectangular hyperbolaadequately described this response. The values of QE (the initial slope) of thesefunctions was similar at the two sites, but Amax (the light saturated rate ofphotosynthesis) was greatest for leaves without symptoms, at both Kawanda andMbarara. For example, photosynthetic rate at > 800 �mols m-2 s-1 was visibly greaterfor leaves without BSV symptoms than for those that had BSV symptoms. Therefore,it appears that Amax was reduced in leaves with visible symptoms of BSV.Subsequent efforts were therefore concentrated on testing the effects of interactionsamong variety, management and symptoms on Amax.
Figure 3. Light response curves for (a) Kawanda and (b) Mbarara. Solid symbols arethe average of plants without BSV symptoms and open symbols represent the averageof plants showing BSV symptoms. The fitted equation was A = Amax (1-exp(-QE
PAR/Amax). The parameter estimates are given in Table 10.
0
5
10
15
PAR (umol m-2 s-1)
0 200 400 600 800 1000 1200 1400 1600
0
5
10
15
(B) Mbarara
A (
umol
m-2
s-1
)
(A) Kawanda
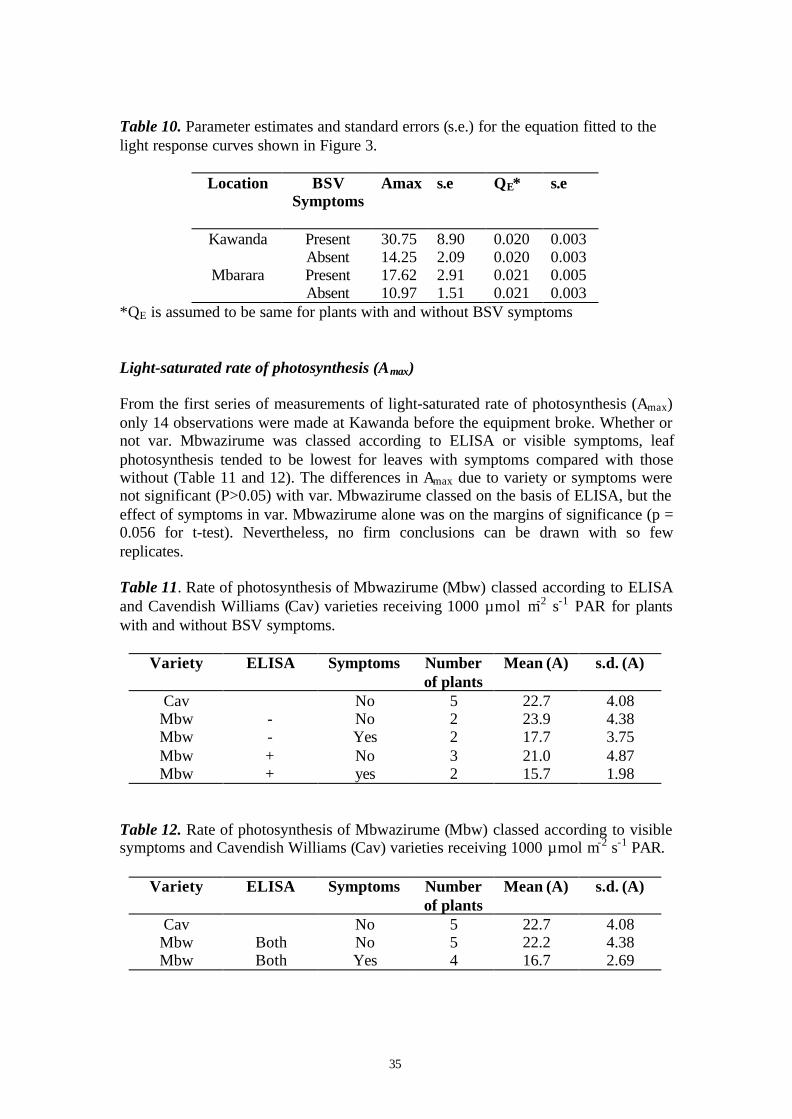
35
Table 10. Parameter estimates and standard errors (s.e.) for the equation fitted to thelight response curves shown in Figure 3.
Location BSVSymptoms
Amax s.e QE* s.e
Kawanda Present 30.75 8.90 0.020 0.003Absent 14.25 2.09 0.020 0.003
Mbarara Present 17.62 2.91 0.021 0.005Absent 10.97 1.51 0.021 0.003
*QE is assumed to be same for plants with and without BSV symptoms
Light-saturated rate of photosynthesis (Amax)
From the first series of measurements of light-saturated rate of photosynthesis (Amax)only 14 observations were made at Kawanda before the equipment broke. Whether ornot var. Mbwazirume was classed according to ELISA or visible symptoms, leafphotosynthesis tended to be lowest for leaves with symptoms compared with thosewithout (Table 11 and 12). The differences in Amax due to variety or symptoms werenot significant (P>0.05) with var. Mbwazirume classed on the basis of ELISA, but theeffect of symptoms in var. Mbwazirume alone was on the margins of significance (p =0.056 for t-test). Nevertheless, no firm conclusions can be drawn with so fewreplicates.
Table 11. Rate of photosynthesis of Mbwazirume (Mbw) classed according to ELISAand Cavendish Williams (Cav) varieties receiving 1000 µmol m-2 s-1 PAR for plantswith and without BSV symptoms.
Variety ELISA Symptoms Numberof plants
Mean (A) s.d. (A)
Cav No 5 22.7 4.08Mbw - No 2 23.9 4.38Mbw - Yes 2 17.7 3.75Mbw + No 3 21.0 4.87Mbw + yes 2 15.7 1.98
Table 12. Rate of photosynthesis of Mbwazirume (Mbw) classed according to visiblesymptoms and Cavendish Williams (Cav) varieties receiving 1000 µmol m-2 s-1 PAR.
Variety ELISA Symptoms Numberof plants
Mean (A) s.d. (A)
Cav No 5 22.7 4.08Mbw Both No 5 22.2 4.38Mbw Both Yes 4 16.7 2.69
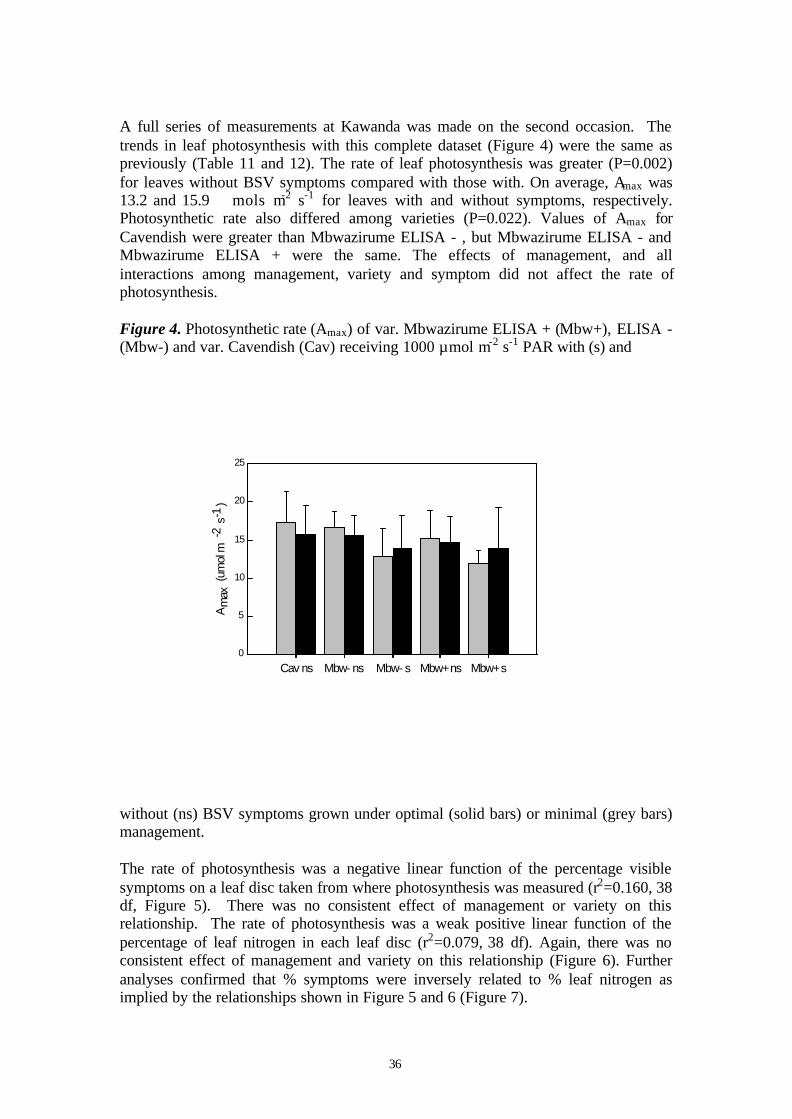
36
A full series of measurements at Kawanda was made on the second occasion. Thetrends in leaf photosynthesis with this complete dataset (Figure 4) were the same aspreviously (Table 11 and 12). The rate of leaf photosynthesis was greater (P=0.002)for leaves without BSV symptoms compared with those with. On average, Amax was13.2 and 15.9 �mols m-2 s-1 for leaves with and without symptoms, respectively.Photosynthetic rate also differed among varieties (P=0.022). Values of Amax forCavendish were greater than Mbwazirume ELISA - , but Mbwazirume ELISA - andMbwazirume ELISA + were the same. The effects of management, and allinteractions among management, variety and symptom did not affect the rate ofphotosynthesis.
Figure 4. Photosynthetic rate (Amax) of var. Mbwazirume ELISA + (Mbw+), ELISA -(Mbw-) and var. Cavendish (Cav) receiving 1000 µmol m-2 s-1 PAR with (s) and
without (ns) BSV symptoms grown under optimal (solid bars) or minimal (grey bars)management.
The rate of photosynthesis was a negative linear function of the percentage visiblesymptoms on a leaf disc taken from where photosynthesis was measured (r2=0.160, 38df, Figure 5). There was no consistent effect of management or variety on thisrelationship. The rate of photosynthesis was a weak positive linear function of thepercentage of leaf nitrogen in each leaf disc (r2=0.079, 38 df). Again, there was noconsistent effect of management and variety on this relationship (Figure 6). Furtheranalyses confirmed that % symptoms were inversely related to % leaf nitrogen asimplied by the relationships shown in Figure 5 and 6 (Figure 7).
Cav ns Mbw- ns Mbw- s Mbw+ ns Mbw+ s
Am
ax (u
mol
m-2
s-1
)
0
5
10
15
20
25
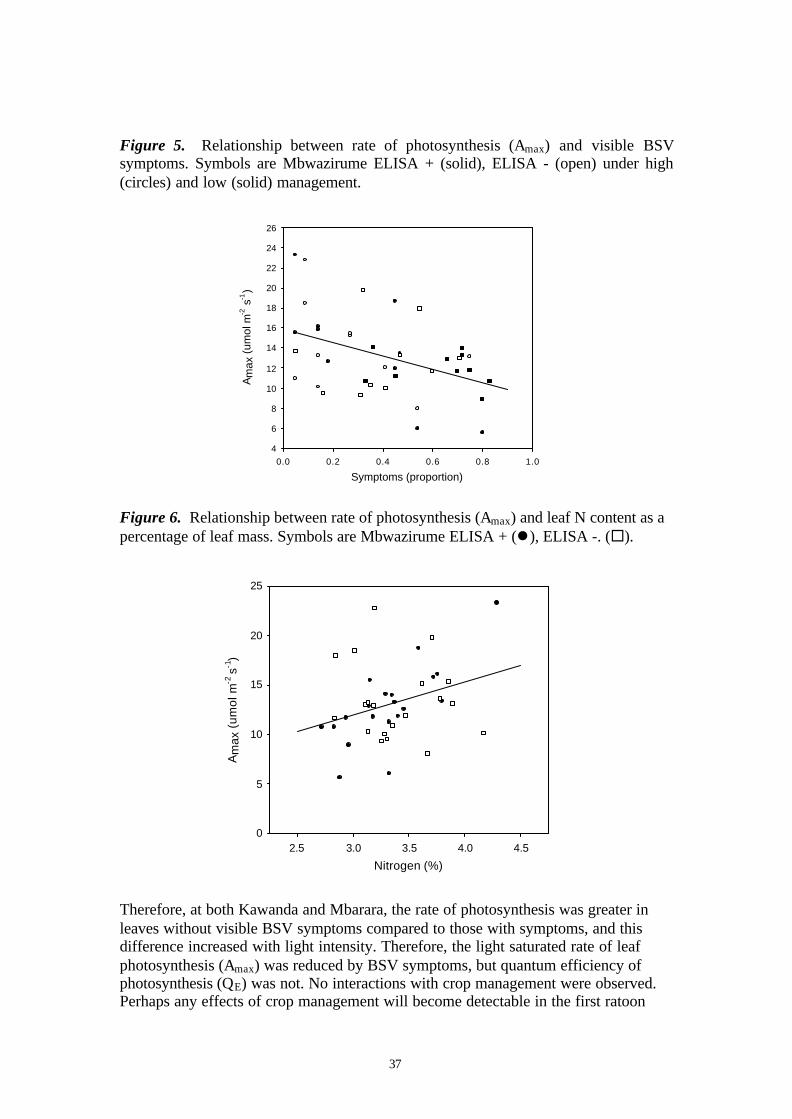
37
Figure 5. Relationship between rate of photosynthesis (Amax) and visible BSVsymptoms. Symbols are Mbwazirume ELISA + (solid), ELISA - (open) under high(circles) and low (solid) management.
Symptoms (proportion)
0.0 0.2 0.4 0.6 0.8 1.0
Am
ax (
umol
m-2
s-1
)
4
6
8
10
12
14
16
18
20
22
24
26
Figure 6. Relationship between rate of photosynthesis (Amax) and leaf N content as apercentage of leaf mass. Symbols are Mbwazirume ELISA + (l), ELISA -. (¨).
Nitrogen (%)
2.5 3.0 3.5 4.0 4.5
Am
ax (
um
ol m
-2 s
-1)
0
5
10
15
20
25
Therefore, at both Kawanda and Mbarara, the rate of photosynthesis was greater inleaves without visible BSV symptoms compared to those with symptoms, and thisdifference increased with light intensity. Therefore, the light saturated rate of leafphotosynthesis (Amax) was reduced by BSV symptoms, but quantum efficiency ofphotosynthesis (QE) was not. No interactions with crop management were observed.Perhaps any effects of crop management will become detectable in the first ratoon
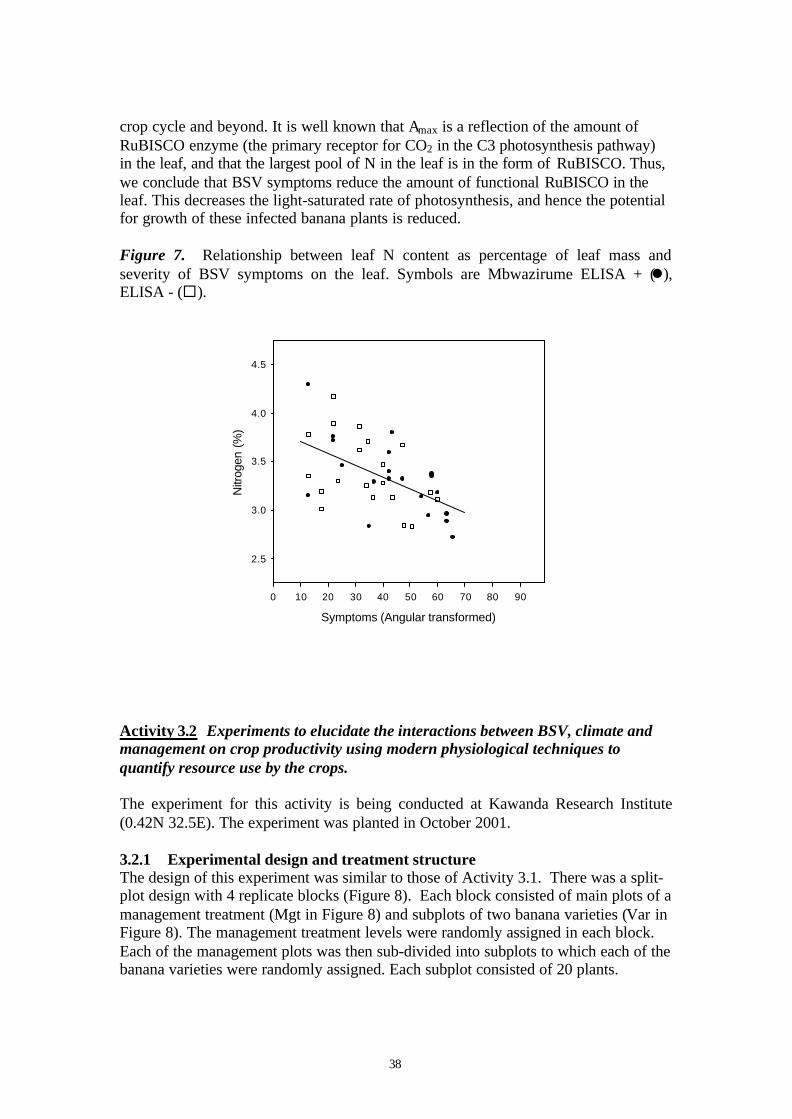
38
crop cycle and beyond. It is well known that Amax is a reflection of the amount ofRuBISCO enzyme (the primary receptor for CO2 in the C3 photosynthesis pathway)in the leaf, and that the largest pool of N in the leaf is in the form of RuBISCO. Thus,we conclude that BSV symptoms reduce the amount of functional RuBISCO in theleaf. This decreases the light-saturated rate of photosynthesis, and hence the potentialfor growth of these infected banana plants is reduced.
Figure 7. Relationship between leaf N content as percentage of leaf mass andseverity of BSV symptoms on the leaf. Symbols are Mbwazirume ELISA + (l),ELISA - (¨).
Symptoms (Angular transformed)
0 10 20 30 40 50 60 70 80 90
Nitr
ogen
(%
)
2.5
3.0
3.5
4.0
4.5
Activity 3.2 Experiments to elucidate the interactions between BSV, climate andmanagement on crop productivity using modern physiological techniques toquantify resource use by the crops.
The experiment for this activity is being conducted at Kawanda Research Institute(0.42N 32.5E). The experiment was planted in October 2001.
3.2.1 Experimental design and treatment structureThe design of this experiment was similar to those of Activity 3.1. There was a split-plot design with 4 replicate blocks (Figure 8). Each block consisted of main plots of amanagement treatment (Mgt in Figure 8) and subplots of two banana varieties (Var inFigure 8). The management treatment levels were randomly assigned in each block.Each of the management plots was then sub-divided into subplots to which each of thebanana varieties were randomly assigned. Each subplot consisted of 20 plants.
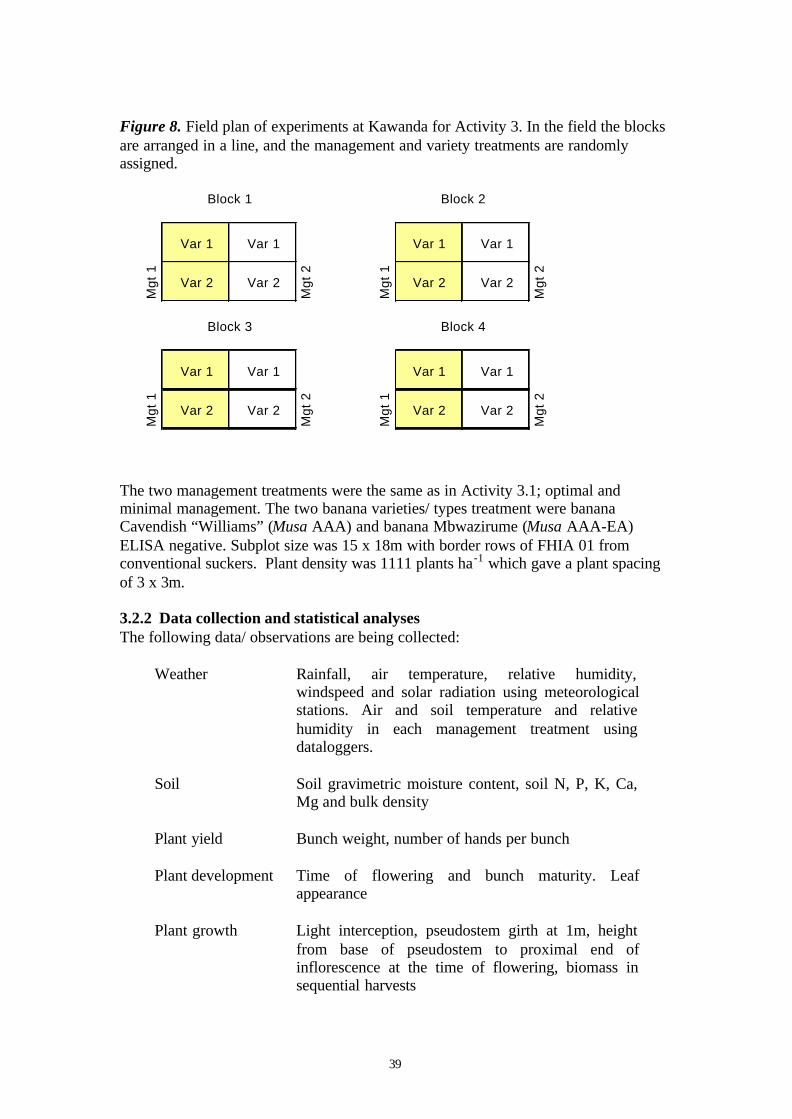
39
Figure 8. Field plan of experiments at Kawanda for Activity 3. In the field the blocksare arranged in a line, and the management and variety treatments are randomlyassigned.
Block 1 Block 2
Var 1 Var 1 Var 1 Var 1
Mgt
1
Var 2 Var 2
Mgt
2
Mgt
1
Var 2 Var 2
Mgt
2
Block 3 Block 4
Var 1 Var 1 Var 1 Var 1
Mgt
1
Var 2 Var 2
Mgt
2
Mgt
1
Var 2 Var 2
Mgt
2
The two management treatments were the same as in Activity 3.1; optimal andminimal management. The two banana varieties/ types treatment were bananaCavendish “Williams” (Musa AAA) and banana Mbwazirume (Musa AAA-EA)ELISA negative. Subplot size was 15 x 18m with border rows of FHIA 01 fromconventional suckers. Plant density was 1111 plants ha-1 which gave a plant spacingof 3 x 3m.
3.2.2 Data collection and statistical analysesThe following data/ observations are being collected:
Weather Rainfall, air temperature, relative humidity,windspeed and solar radiation using meteorologicalstations. Air and soil temperature and relativehumidity in each management treatment usingdataloggers.
Soil Soil gravimetric moisture content, soil N, P, K, Ca,Mg and bulk density
Plant yield Bunch weight, number of hands per bunch
Plant development Time of flowering and bunch maturity. Leafappearance
Plant growth Light interception, pseudostem girth at 1m, heightfrom base of pseudostem to proximal end ofinflorescence at the time of flowering, biomass insequential harvests
40
BSV symptoms Presence and severity of symptoms (using theseverity index of Dahal et al. 1998)
Plant measurements were taken on each plant. BSV symptoms were assessed on eachleaf of all plants on a monthly basis. Observations were taken on the mother plants,and most of the first ratoon crop within the timeframe of Project R7529.
Destructive sampling was done for two plants (one with symptoms and one without)randomly selected in each sub-plot shown in Figure 8. Each plant was separated intoleaves, pseudostem, and fruit, then weighed fresh, and then dried in an oven at 70oCfor 48 hours to provide the dry weight.
By July 2002 the bunches of all mother plants had been harvested.The following results are presented here:
Kawanda Light interception by the leaf canopyBiomass accumulation over timeBunch yield
Results were analysed with a split-split unit analysis using mixed model approach inSAS (SAS Inst. Inc., 1997). Observations made at 4 time intervals in the crop cyclewere combined into a single analysis in which time of destructive sampling wasconsidered as an additional factor and treated as a split plot. Variety and managementeffects considered var. Cavendish and var. Mbwazirume, and BSV effects onlyconsidered var. Mbwazirume at 2 levels of BSV status, i.e., with and withoutsymptoms. The following model was used:
(i) Effect of crop management and variety
Y1,2,3, = µµ + block + mgt + error1 + variety + mgt.variety + error2 where,
(ii) Effect of crop management and symptoms status
Y1,2,3,4,5,6,7 = µµ + block + mgt + error1 + symp + mgt.symp + error2 where,
Y1 = above ground biomass; Y2 = Fraction of light (photosynthetic active radiation)intercepted; Y3 = bunch yield.
Effect of variety, crop management and symptoms on yield in this experiment wereanalysed similar to Section 3.1.2 (ii) and (iii).
3.2.3 Results and discussion
Effect of BSV on biomass accumulation and light interception (PAR) by var.Mbwazirume at Kawanda
BSV symptoms reduced above-ground biomass of var. Mbwazirume by 20% (P<0.01;Figure 9a) while BSV symptoms reduced light interception by 4.7% (P>0.05; Figure9b). In this study, biomass increased (P<0.001) during the crop cycle. In contrast,
41
light intercepted by the banana at different time points of the crop cycle was notsignificantly different (P>0.05). The effects of BSV were not subject to interaction(P>0.05) with month of assessment in crop cycle and management for above-groundbiomass and light intercepted by banana plants. The reduction in the proportion onincident light (photosynthetically active radiation) intercepted and subsequently plantbiomass accumulation, due to BSV is in accordance with the reduction in the rate ofleaf photosynthesis due to BSV (Figure 5).
Effect of management and variety on biomass accumulation and lightinterception (PAR) by var. Mbwazirume at Kawanda
The crop grown under optimal management had greater dry matter (P<0.001) andintercepted a greater fraction of incident light (photosynthetically active radiation)than those grown under minimal management (Figure 10a & b). However, thedifference in light interception for the two management regimes was not significant(P=0.09). Management was subject to an interaction with time of sampling in the cropcycle for biomass accumulation (P<0.001) and light intercepted by plants (P<0.01).Biomass accumulation for the two management regimes was not significantlydifferent in December 2001. Thereafter, biomass of plants under optimalmanagement was consistently higher (P<0.05) than under minimal management. Thefraction of light intercepted by plants was also consistently greater under optimalmanagement compared to minimal management except in December 2001.Differences in the two management levels were only significant (P<0.01) in May2002.
Overall var. Cavendish tended to have more biomass than var. Mbwazirume, althoughthis was not significant (P=0.07). There was an interaction between the effect ofvariety and month of assessement (P<0.01). Earlier in the crop cycle (December 2001and March 2002) var. Cavendish had less biomass than var. Mbwazirume (P>0.05).Later, var. Cavendish had more biomass than var. Mbwazirume, i.e., in May-02(P<0.05) and July-02 (P<0.01). Therefore, var. Mbwazirume grew much faster in theearly stages of development. The interaction between variety, management andmonth in crop cycle was not significant (P>0.05).
In this physiology experiment, the interaction between BSV and crop managementwas not significant (P>0.05) for bunch weight (Table 13a). Var. Cavendish gave aheavier bunch (P<0.001) than var. Mbazirume (Table 13b). Also, plants underoptimal management a gave heavier bunch (P<0.001) than those in minimalmanagement. These results are consistent with those of biomass accumulation(Figure 10a) and fraction of incident light (PAR) intercepted (Figure 10b). Dataanalysis is continuing in order to examine the relationship between the quantity oflight intercepted (crop resource use) and biomass accumulation for plants with andwithout BSV symptoms under each management regime.
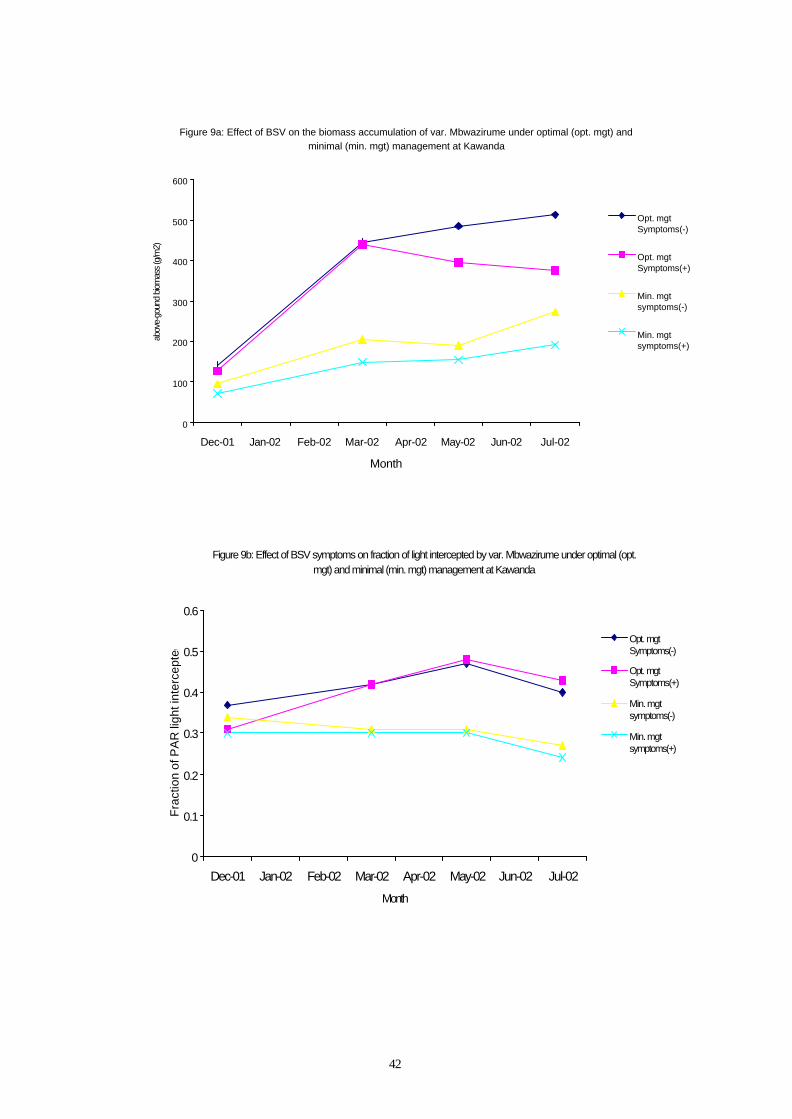
42
Figure 9a: Effect of BSV on the biomass accumulation of var. Mbwazirume under optimal (opt. mgt) and minimal (min. mgt) management at Kawanda
0
100
200
300
400
500
600
Dec-01 Jan-02 Feb-02 Mar-02 Apr-02 May-02 Jun-02 Jul-02
Month
abov
e-go
und
biom
ass
(g/m
2)
Opt. mgtSymptoms(-)
Opt. mgtSymptoms(+)
Min. mgtsymptoms(-)
Min. mgtsymptoms(+)
Figure 9b: Effect of BSV symptoms on fraction of light intercepted by var. Mbwazirume under optimal (opt. mgt) and minimal (min. mgt) management at Kawanda
0
0.1
0.2
0.3
0.4
0.5
0.6
Dec-01 Jan-02 Feb-02 Mar-02 Apr-02 May-02 Jun-02 Jul-02
Month
Fra
ctio
n of
PA
R li
ght i
nter
cept
ed
Opt. mgtSymptoms(-)
Opt. mgtSymptoms(+)
Min. mgtsymptoms(-)
Min. mgtsymptoms(+)
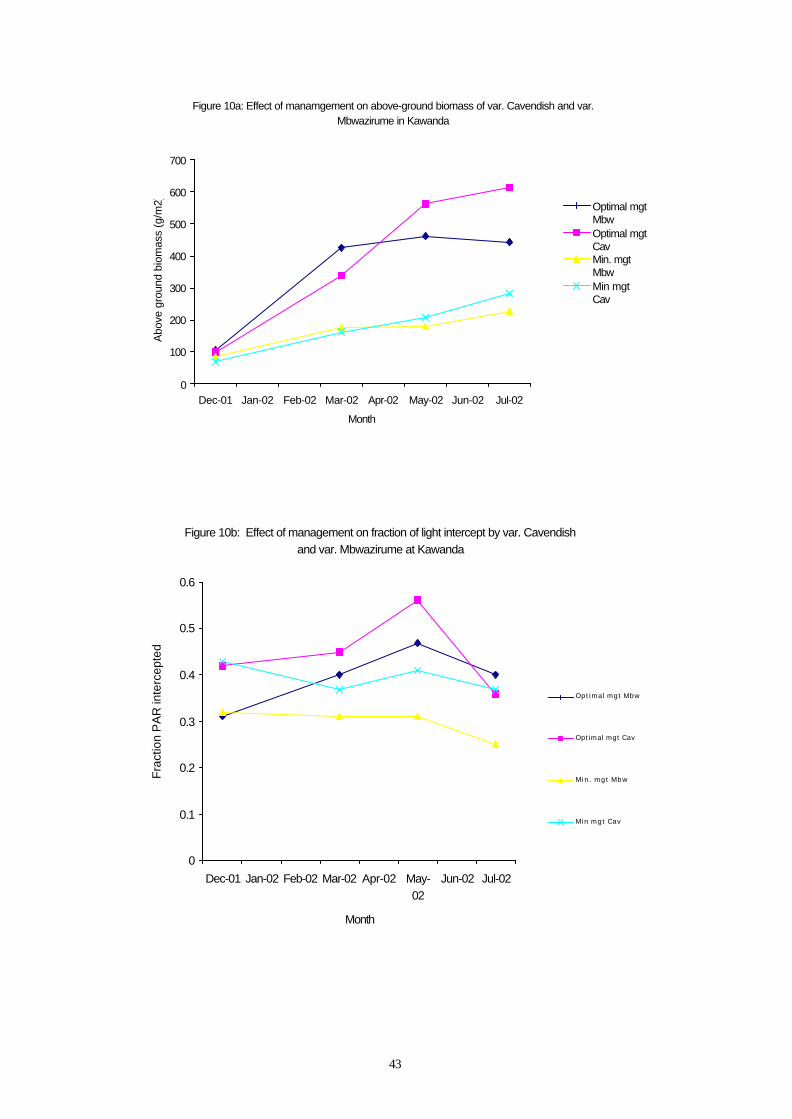
43
Figure 10a: Effect of manamgement on above-ground biomass of var. Cavendish and var. Mbwazirume in Kawanda
0
100
200
300
400
500
600
700
Dec-01 Jan-02 Feb-02 Mar-02 Apr-02 May-02 Jun-02 Jul-02
Month
Abo
ve g
roun
d bi
omas
s (g
/m2) Optimal mgt
MbwOptimal mgtCavMin. mgtMbwMin mgtCav
Figure 10b: Effect of management on fraction of light intercept by var. Cavendish and var. Mbwazirume at Kawanda
0
0.1
0.2
0.3
0.4
0.5
0.6
Dec-01 Jan-02 Feb-02 Mar-02 Apr-02 May-02
Jun-02 Jul-02
Month
Fra
ctio
n P
AR
inte
rcep
ted
Opt imal mgt Mbw
Optimal mgt Cav
M in . mgt Mbw
Min mgt Cav
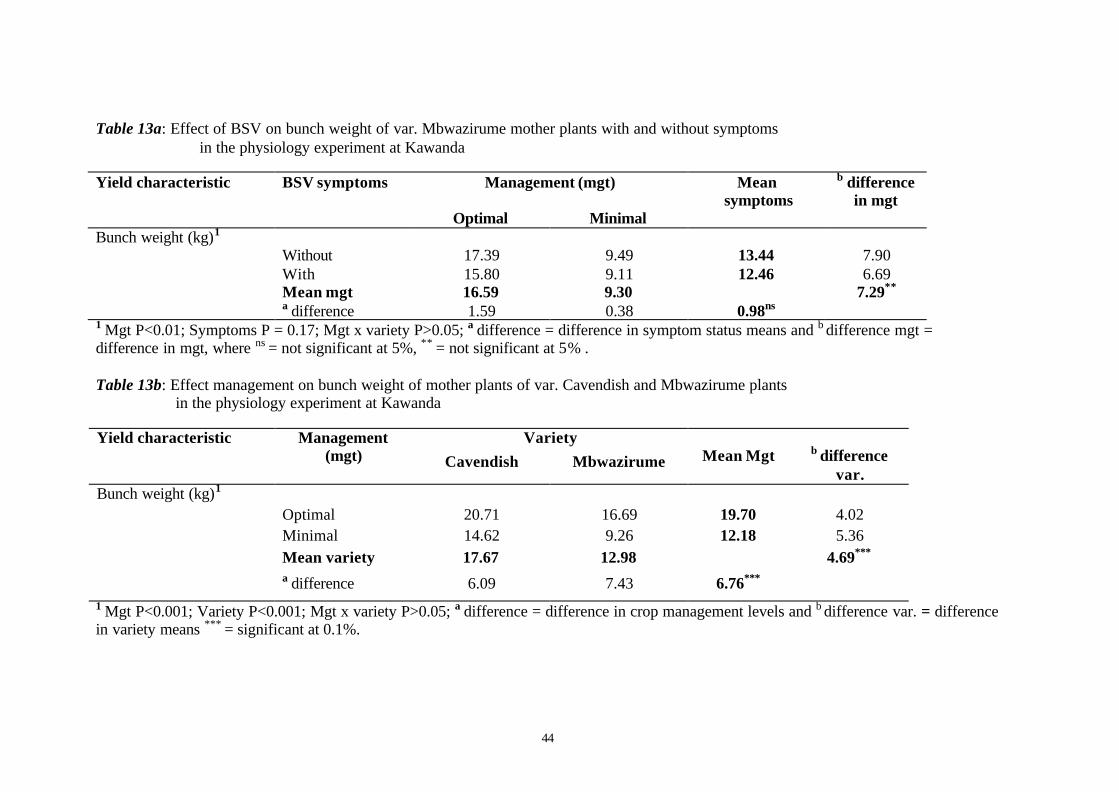
44
Table 13a: Effect of BSV on bunch weight of var. Mbwazirume mother plants with and without symptoms in the physiology experiment at Kawanda
Yield characteristic Management (mgt) Mean symptoms
b differencein mgt
BSV symptoms
Optimal MinimalBunch weight (kg)1
Without 17.39 9.49 13.44 7.90With 15.80 9.11 12.46 6.69Mean mgt 16.59 9.30 7.29**
a difference 1.59 0.38 0.98ns
1 Mgt P<0.01; Symptoms P = 0.17; Mgt x variety P>0.05; a difference = difference in symptom status means and b difference mgt =difference in mgt, where ns = not significant at 5%, ** = not significant at 5% .
Table 13b: Effect management on bunch weight of mother plants of var. Cavendish and Mbwazirume plants in the physiology experiment at Kawanda
Yield characteristic VarietyManagement(mgt) Cavendish Mbwazirume Mean Mgt b difference
var.Bunch weight (kg)1
Optimal 20.71 16.69 19.70 4.02Minimal 14.62 9.26 12.18 5.36Mean variety 17.67 12.98 4.69***
a difference 6.09 7.43 6.76***
1 Mgt P<0.001; Variety P<0.001; Mgt x variety P>0.05; a difference = difference in crop management levels and b difference var. = differencein variety means *** = significant at 0.1%.
45
Activity 6.0 Socio-economic and biometric study/survey to assess farmers'perceptions of BSV and strategies that might be used to control it.
This is a joint activity with the team from NRI / KARI.
An initial survey was conducted to determine farmers’ perceptions and understandingof BSV and the measures they use for its control in order to provide preliminaryinformation on bunch yields on farmer’s field for further investigation beyond ProjectR7529. This survey was done with the help of focus group discussions and astructured questionnaire. The focus group discussions were carried out in Ntungamoand Masaka districts in Southern Uganda while the structure questionnaire wasadministered in Rakai in addition to the other districts. Thirty farmers wereinterviewed in each district. Farmers’ fields were also assessed and crop managementpractices, BSV incidence and severity were recorded for each farm.
The survey revealed that BSV was prevalent in Masaka, Ntungamo and Rakai.Farmers described BSV symptoms accurately and perceived them to cause damage tobananas. Although, most farmers did not know the cause of BSV, some attributed thesymptoms mainly to weevil infestation, infertile soils and drought. Therefore, theycommonly carried out perceived weevil control (removal of corms of harvestedplants, trapping and application of ash, urine and pepper) and soil and water retentionrelated practices (mulching, manuring and application of coffee husks) to manageBSV. Rouging was considered by farmers to be the most effective measure inmanaging BSV. Farmers revealed that rouging was only practical in fields with lowincidence of BSV. In cases, of high incidence of BSV, farmers did not considerrouging as an option because of the perception that they would lose bananas/food andis time consuming as well as labour intensive.
Some farmers used mulch, manure and coffee husks to manage BSV. This isprobably because farmers believed that plants with BSV symptoms performed betterwhen these practices were used and/or believed that BSV symptoms were soil related.Scanty information exists on the role of crop management, like mulching andmanuring as well as other good crop husbandry practices in mitigating the effects ofBSV. These are questions that this research initiative is addressing
CONCLUSIONS
This report provides detailed quantitative information on the effects of BSV on thegrowth, development and yield of banana crops growing in Ugandan conditions. Ofparticular importance to the question of how farmers may mitigate these effects iswhether or not crop management can influence the effects of BSV. The effects ofBSV, and their interaction with crop management, were already apparent in themother and 1st ratoon crop cycle. BSV reduced growth and bunch yields at Kawanda.Reductions in yield tended to be greater under minimal compared with optimalmanagement. Also, more plants with BSV symptoms were found under minimalcompared with optimal management. The results can be summarised in terms ofplantation production; the bunch yield per hectare per year for the mother and ratooncrops together. At Kawanda, production of plants without BSV was 32.9 and 27.3 tha-1 per year under optimal and minimal management, respectively. In contrast,
46
production was 17.5 and 13.2 t ha-1 per year under optimal and minimal management,respectively, for plant with BSV. The average reduction in plantation production dueto BSV was 21%. We expect the severity of symptoms and the effects ofmanagement to increase with each crop cycle. These responses need to be confirmed.Nevertheless, we conclude that BSV has a greater (negative) impact on banana yieldsin Uganda than reported previously, and that improvement in crop management maypartly mitigate these yields losses.
REFERENCES CITED
Campbell, C. L. and Madden, L.V. (1990). Introduction to Plant Epidemiology.John Wiley & Sons, New York.
Dabek, A.J. and Waller, J.M. (1990). Black leaf streak and viral leaf streak: newbanana diseases in East Africa, Tropical Pest Management 36: 157-158.
Dahal, G., Ortiz, R, Tenkouano, A, Hughes, J.d’A., Thottappilly, G., Vuylsteke, D.and Lockhart, B.E.L. (2000) Relationship between natural occurrence ofbanana streak badnavirus and symptom expression, relative concentration ofviral antigen, and yield characteristics of some micropropagated Musa spp.Plant Pathology 49: 68-79.
Dahal, G., Hughes, J.d’A., Thottappilly, G. and Lockhart, B.E.L. (1998) Effect oftemperature on symptom expression and reliability of banana streak virusdetection in naturally infected plantains and bananas (Musa spp.), PlantDiseases 82: 16-21.
Daniells J.W., Geering A.D.W., Bryde N.J. and Thomas J.E. (2001). The effect ofBanana streak virus on the growth and yield of dessert bananas in tropicalAustralia. Annals of Applied Biology, 139: 51-60.
Gauhl, F. and Pasberg-Gauhl, C. (1995) Temporal dynamics of banana streakbadnavirus (BSV) symptoms in Musa clones in southeast Nigeria,Phytomedizin 25: 27
Gold, C.S., Karamura, E.B., Kiggundu, D., Abera, A.M.K., Bagamba, F., Wejuli, M.,Karamura, D., Ssendege, R. and Kalyebara, R. (1998). Geographical shifts inhighland banana production in Uganda, African Crop Science Journal
INIBAP (1986) A preliminary Study of the Needs for Banana Research in EastAfrica. INBAP, Montpellier.
Jones, D.R. and Lockhart, B.E.L. (1993) Banana Streak Virus. Fact Sheet No. 1.Montpellier, France: INIBAP.
Lockhart, B.E.L. (1986) Purification and serology of a bacilliform virus associatedwith banana streak disease. Phytopathology 76: 995-999.

47
Lockhart, B.E.L. (1994) Banana streak virus. pp 19-20 In: R.C. Ploetz, G. Gentmyer,W.T. Nishijima, K.G. Rohrbach and H.D. Ohr (eds) Compendium of tropicalplant diseases, St. Paul, MN, USA: APS Press. 88p.
Robinson, J.C. (1996). Bananas and Plantains CAB International Wallingford, UK.
Tushmereirwe, W.K., Karamura, E.B. and Karyeija, R. (1996). Banana streak virus(BSV) and associated filamentous virus (unidentified) disease complex ofhighland bananas in Uganda, InfoMusa 5 : 9-12.
1
EFFECT OF FARMER CULTURAL PRACTICES ON BANANA STREAK VIRUS(BSV) EXPRESSION
Charles Murekezi and Jerome Kubiriba
Contents
SUMMARY.............................................................................................................................................................................2INTRODUCTION..................................................................................................................................................................3METHODOLGY....................................................................................................................................................................3
Site........................................................................................................................................................................................3Preliminary survey and farm selection...........................................................................................................................3Farmer cultural practices ..................................................................................................................................................4Data collection....................................................................................................................................................................5Data analysis .......................................................................................................................................................................5
RESULTS AND DISCUSSION..........................................................................................................................................7Effect of farmers’ management practice on mealybug abundance and proportion of plants infested withmealybugs...........................................................................................................................................................................7Effect of farmers’ cultural practice on BSV incidence and severity.........................................................................8
BSV severity ...................................................................................................................................................................8BSV incidence ..............................................................................................................................................................11
Growth characteristics and bunch weight....................................................................................................................12Effect of soil and water conservation structures on BSV, growth and bunch weight .....................................12Effect of mulch application on BSV, growth and bunch weight ..........................................................................14Effect of desuckering on BSV, growth and bunch weight ....................................................................................15Effect of detrashing on BSV, growth and bunch weight.......................................................................................16Effect of manure application on BSV, growth and bunch weight.......................................................................16Effect of weeding on BSV, growth and bunch weight ...........................................................................................18Effect of intercropping on BSV, growth and bunch weight .................................................................................19Effect of overall management status on BSV, growth and bunch weight..........................................................20
CONCLUSION.....................................................................................................................................................................22References .............................................................................................................................................................................23
2
SUMMARY
The effect of farmers’ cultural practices on BSV symptom expression, mealybug abundance,and BSV effects on growth and bunch weight of East African Highland bananas (MusaAAA-EA) was examined in farmers’ banana fields at Ntungamo, southwestern Uganda.Farmers commonly used one or more of seven distinct cultural practices. These were soiland water conservation structures (water bunds), application of organic mulch, desuckering,detrashing, application of manure, weeding and cropping pattern (banana alone or with anintercrop).
While only detrashing reduced mealybug abundance (average number of mealybug coloniesper plant), possibly because dark and warm, humid conditions are favourable for thereproduction and colonisation of mealybugs, both detrashing and desuckering tended toincrease the proportion of plants infested with mealybugs (mealybug incidence). Once themealybug colonies are exposed on the pseudostem by detrashing, the chance of nymphsbeing blown by wind to the neighbouring plants is high. Mealybugs may also be spread toneighbouring plants when chopping and laying the chopped trash as a mulch. This,however, was not reflected in increased BSV incidence as detrashing did not influence BSVincidence and desuckering was associated with reduced BSV incidence.
Crop management practices that targeted improving soil and water conservation and soilnutrition, such as application of mulch or manure, or provision of water bunds, appeared notto affect mealybug abundance. They tended to reduce mealybug spread for unclear reasonsthat might have been expected to translate into reduced BSV incidence, but farms in whichmanure was applied had increased BSV incidence. This probably arises from the farmers’practice of applying manure to plants with BSV symptoms, perceiving the symptoms to becaused by a nutrient deficiency. BSV incidence was less in farms where several culturalpractices were used, though because incidence was measured as the proportion of plantswith visible symptoms, this effect may not have been on the rate of spread of the disease,but rather through an effect on symptom expression.
The effects of BSV on growth and bunch weight were reduced in farms that carried outcultural practices that reduced crop stress including frequent weeding, sole cropping,provision of soil and water conservation structures, improving plant nutrition throughapplication of manure and appropriate desuckering and detrashing. Thus, banana growthand bunch weights were improved and the effects of BSV reduced in intensively managedfarms. However it was apparent that the farmers’ mulching practice did not reduce BSVeffects on growth and bunch weights. This is contrary, to observations made of on-stationexperiments at Kawanda and Mbarara where application of mulch was one of thetreatments. This disparity is probably because farmers tend to apply less mulch thanrecommended. This calls into question whether the applications of cultural practices inthese farms were sufficient in terms of frequency and amounts.
Nonetheless, results from this study are indicative of the potential of farmers’ culturalpractices in improving banana productivity and mitigating BSV disease effects. Furtherwork is required to determine the combinations of the cultural practices that are mostbeneficial. This study does not give an indication of at which level of BSV severity cropmanagement ceases to be beneficial. In such a circumstance, roguing would be required.The applicability of roguing in smallholder banana cultivation, however, remains unknown.
3
INTRODUCTION
Banana (Musa sp.) is an important staple for about 7 million people in Uganda (Karamura,1993). Areas producing bananas in Uganda have been categorised into three zones(Anonymous, 1998). These included areas of extreme production decline (most areas ofCentral Uganda), those of relatively high production (Mbarara and Bushenyi) and those ofintermediate banana production levels (Masaka, Rakai and Ntungamo). Although the majorfactors behind this decline are pest/disease complex, soil fertility decline, narrow geneticbase and socio-economic factors (Gold et al., 1993), in the intermediate production zone,Banana streak virus (BSV) is regarded as a prominent constraint to banana production(Kubiriba et al., 1997). BSV has been identified as an important constraint else where in theworld (Diekmann and Putter, 1996) and studies indicate that it can reduce banana yieldssignificantly (Dahal et al, 2000). It is reported that improved crop management amelioratesthe effects of BSV (Dahal et al., 1998; Daniells et al., 2000). Favourable effects ofimproved crop management on diseases have previously been observed. For example,studies on Black Sigatoka disease showed that cultural practices mitigated the impact of thisfungal disease on bananas (Holderness et al, 1999). Such cultural practices are commonlyused by farmers in the management of banana constraints in Uganda because they requirecheap and locally available on/off farm resources. As such, aspects of cultural practicescould form major ingredients in the formulation of environmentally friendly and equitablepractices in the management of BSV.
This study was initiated, therefore, to ascertain the potential of farmers’ cultural practices inmanaging BSV. The specific objective of the study was to investigate the response of theEast African Highland banana to BSV in relation to different farmers’ cultural managementpractices by monitoring the effect of the practices on mealybug abundance and incidence,BSV incidence and symptom expression, and banana growth characteristics and yield.
METHODOLGY
Site
The study was conducted in Kikoni Parish, Ntungamo district in southwestern Ugandawithin the altitude range of 1300-1500 masl and with a bimodal (March-June and October-December) rainfall ranging from 800 mm to 1500mm. Most of the farmers hadsmallholdings of less than two hectares (Gold et al., 2002). The predominant crop at the siteis the East African Highland banana (AAA-EA).
Preliminary survey and farm selection
The study was preceded by a survey conducted in February 2001 in 6 villages in Ntungamodistrict. In the survey, 60 farmers’ fields were randomly selected across the villages ofMutanoga, Muyumbu, Kyangara, Kalegeya, Kamunyiga and Musaana. During the survey,the main farmer cultural practices were noted and the status of BSV on these farms wasassessed. Thereafter, 30 farms where BSV was present were selected to participate in thestudy. In each of the 30 farms four quadrants measuring 15 x 15m were assigned in thebanana fields. Ten plants were then selected and marked with paint (regularly renewed) ineach quadrant making a total of 40 plants per farm that then comprised the data plants. Data
4
collection commenced in August 2001. This report covers period of August 2001 toJanuary 2003.
Farmer cultural practices
The initial survey conducted in February 2001 noted that seven cultural practices werecommonly used by farms in the management of bananas. They were (1) provision of soiland water conservation structures (water bunds), (2) application of an organic mulch, (3)regular desuckering, (4) regular detrashing, (5) manure application, (6) regular weeding and(7) cropping pattern (sole cropping of banana and intercropping banana with beans or otherintercrops). Apart from cropping patterns, the other cultural practices are being carried outby farmers to manage banana plantations. For example intercropping is not a managementpractice, but because of the limitation of land, farmers plant other crops, mainly beans in therainy season to obtain food protein. The 30 farmers’ fields in Ntungamo District wereassessed and records taken every month. Initially management practices were classified asin Table 1 by giving more weight to management practices that, based on the investigators’experience, had a direct impact on both BSV expression and mealybug population.
The total weight of the cultural practices carried out on a field was the sum of the weights ofthe individual practices. This total weighting was used to determine the overallmanagement status of a farm being assessed. The overall management categories were asfollows: Low � 7, Moderate 8-15 and Intensive � 16.
Table 1. Cultural practices and the assigned weightings
Cultural practice Weight1. Soil and water conservation structures (water bunds)
6
2. Application of mulch 53. Desuckering and Detrashing 44. Manure/soil inputs 35. Weeding 26. No Intercropping 1(Maximum score) 21
However, after collecting data for one year (August 2001 to July 2002) these methods wererevised to follow the criteria below:
1. Soil and water conservation structures (water bunds):(0) Minimum 0 –1 water bunds per plantation (gentle/no slope); 0-2 bunds (steepslope)(1) Adequate – more than minimal above
2. Mulch application:(0) Absent - no mulch evident in the banana field(1) Present - mulch cover of > 5 cm for a period ≥ 4 months in a year
5
3. Desuckering (removal of excess suckers):(0) Minimal – ≥ 4 plants per mat for > 5 months a year(1) Adequate - ≤ 3 plants per mat for > 5 months a year
4. Detrashing:(0) Minimal – dead leaves and sheaths present on plants for > 5months a year(1) Adequate – dead leaves and sheath present on plants < 5 months
5. Manure:(0) Minimal (little)– no/trace amounts applied in the banana field(1) Adequate (some) – more than trace amounts of manure applied in the field
6. Weeding:(0) Poor – many weeds in plots for > 5 months a year(1) Adequate/good – no/few weeds in banana plots for > 5 months a year
7. Cropping pattern (Use of intercrops):(0) Sole cropping – no systematic intercrops in the banana field(1) Intercropping – systematic intercrops in banana field
Data collection
Each farm was visited every month, and some times bi-monthly, to record BSV symptomexpression (severity and incidence), mealybug abundance (number of colonies per plant),and proportion of plants infested with mealybugs (mealybug incidence), growthcharacteristics and bunch weights for mature plants. In addition, farmer cultural practiceswere recorded; each marked plant was assessed for noticeable foliar symptoms onindividual leaves, i.e., golden yellow chlorotic streaks. BSV incidence in each farm wastaken as the proportion of data plants with BSV symptoms to the total number of markedplants in the quadrants. BSV severity was determined by scoring individual leaves of theinfected plants using a 0-3 scale and deriving an average symptom severity index (SSI) foreach plant (Dahal et al., 1997). Numbers of mealybug colonies were recorded on thepseudostem of each of the marked plants from ground level to about 2 metres above ground.The proportion of plants infested with mealybugs on each farm was then derived. Plantheight was measured from the base of pseudostem to the emerging inflorescence.Pseudostem circumference (girth) was measured at a height of 100 cm from the base of theplant at flowering. Bunch weights were estimated within 3 weeks of bunch maturity.
Data analysis
The effects of farmer cultural practices on mealybug abundance, proportion of plantsinfested with mealybugs, BSV incidence, BSV severity, growth (plant height and girth) andbunch weights were determined through data analysis using the general and generalizedlinear model procedures in SAS (SAS Inc., 1997). Data on mealybug abundance and BSVseverity was analyzed using a repeated measure approach in general linear model procedure(GLM). Data on proportion of plants, mealybugs and BSV incidence was analyzed ascomposite data sets. The proportions of mealybugs and BSV incidence were analyzed asaverages since they did not alter with time. Proportion of plants infested with mealybugsand BSV incidence per farm per month was analysed by Genmod procedure since the error
6
terms were best described by binomial distribution with logit link function for the individualpractices and those for over all management by Poisson distribution with log link function.
The models used were:
Yij = µ + cultural practiceik + errorij where i=1,2 corresponding to the two levels of thecultural practice under consideration, and j=1,2,….,30 corresponds to the jth farm. Themodel was run for each of the cultural practices k=1,2,…,7.
The Yij in this model were (in turn): Repeated measures for BSV severity, mealybugabundance (number of mealybug colonies per plant), for farm j practicing practice i. In thecase of BSV severity the values of severity for the first month of assessment (August 01)was used as a covariate (Yij = µ + cultural practiceik + covariate + errorij). The error termscorrespond to the unexplained component of variability, assumed be normally andindependently distributed with mean zero and constant variance.
For analysing BSV incidence and mealybug incidence, the model was:
Log(pij/(1-pij) = µ + cultural practiceik + errorij where pij correspond to the incidence (ofmealybugs or BSV) in each farm. The error terms here follow a binomial distribution theindividual practices. Log(pij) = µ + Overall management + errorij for poisson distribution.
The model used for analysing plant height, pseudostem girth and bunch weights was Yijk =µ + cultural practiceil + errorij + symptomsk + symptomsk*cultural practiceil + errorijk, wherei=1,2 corresponding to the two levels of the cultural practice under consideration, andj=1,2,….,30 corresponds to the jth farm, k=1,2 corresponding to with and without BSV. Themodel was run for each of the cultural practices l=1,2,…,7.
The analyses presented in the following tables are for the period August 2001 to December2002. During this period, the numbers of farms where each management practice was beingdone were as presented in Table 2 below:
Table 2: Number of farms represented in each management practice level
Management Practice Number of Farms
Practice level “0” Practice level “1”
1. Soil and water conservation 19 11
2. Mulching 27 3
3. Desuckering 5 25
4. Detrashing 9 21
5. Manure application 24 6
6. Regular weeding 4 26
7. Intercropping 26 4
7
RESULTS AND DISCUSSION
Effect of farmers’ management practice on mealybug abundance and proportion ofplants infested with mealybugs.
The different overall management levels (derived from the sums of the weighted scores forindividual practices) over the period of assessment appeared not to show any effect onmealybug abundance (average number of colonies per plant). However, detrashingsignificantly reduced (P = 0.0038) mealybug abundance (Figure 1). Dark and warm, humidconditions are favourable for the reproduction and colonisation of mealybugs (Watson andChandler, 2000). Detrashing involves removal of both senescent and dry leaves and alsoremoval of leaf sheaths from the pseudostems. Removal of leaves then opens up the canopyand detrashing exposes the mealybug colonies (usually covered by the dry sheaths) to theharsh environment and possibly to predators.
The practices aimed at improving soil and water conservation and soil nutrition such aswater bunds and manuring, did not affect mealybug abundance (P>0.05) (Figure1).Improved availability of nitrogen, however, has been associated with elevated mealybugnumbers in cocoa plantations in Ghana (Bigger, 1981).
The proportion of plants infested with mealybugs (incidence of mealybugs) is indicative ofthe rate of spread of mealybugs in the field. The management practices that influenceproportion of mealybug-infested plants might also be expected to influence BSV incidence.However, farms where detrashing was done had significantly greater proportion of plantsinfested with mealybugs (P < 0.0001) compared to those where detrashing was not done,(Table 3) but detrashing had no significant effect (P = 0.12) on BSV incidence (Table 4).Detrashing exposes mealybug colonies under the leaf sheaths, improves illumination andconsequently aeration in the banana plantation. This environment promotes movement ofthe mobile mealybug nymphs on the pseudostem, which then increases their chances ofbeing blown away to neighbouring plants. If any BSV–infected plants also harbourmealybug nymphs, these may also eventually be blown to neighbouring plants increasingthe chances for BSV spread. Farms where desuckering was done also had greater incidenceof mealybugs (proportion of plants infested) (P = 0.0038) than where it was not done, butthis was not reflected with increased BSV incidence since farms where it was done had alesser incidence of BSV (P < 0.001). If the cut sucker is infected with mealybugs, thechances of spreading mealybugs to the neighbours are increased since it is normallychopped and laid on the ground as mulch, sometimes at some distance from the source mat.BSV incidence is dependent on success of inoculation by mealybugs, incubation period andalso other factors that influence symptom expression, one or many of which may be affectedby desuckering.
Good weed control appeared to have no significant effect on the average number ofmealybug colonies on each banana plant (Figure 1), though the effect was highly significanton the proportion of plants infested with mealybugs (Table 3). This may be because thepresence of weeds allows the mealybugs to crawl between banana plants more readilywithout being predated upon, and thus they are more evenly dispersed across the field. Infield where weeds are not present any mealybugs remain on their original host banana andpopulations on individual bananas build up more than when weeds are present. Where therewere water-bunds, and/or mulch or manure were applied, there were lower proportions ofmealybug-infested plants than where they were absent, but it was not clear why this was the
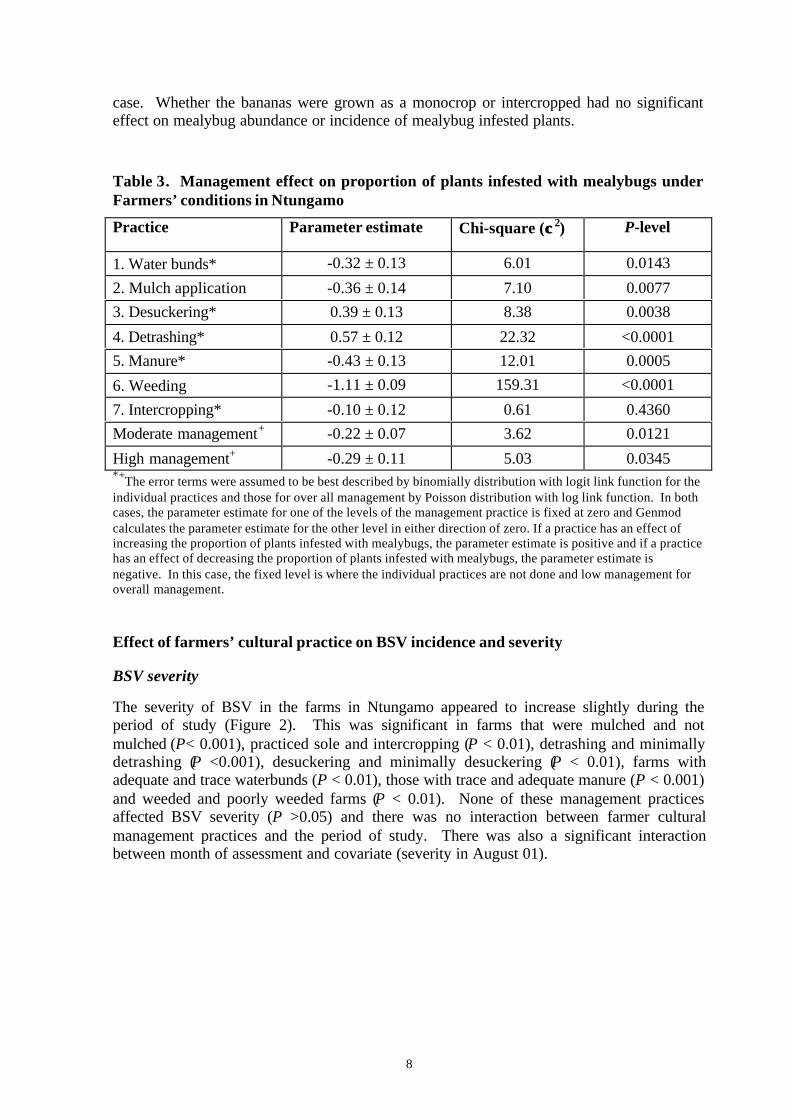
8
case. Whether the bananas were grown as a monocrop or intercropped had no significanteffect on mealybug abundance or incidence of mealybug infested plants.
Table 3. Management effect on proportion of plants infested with mealybugs underFarmers’ conditions in Ntungamo
Practice Parameter estimate Chi-square (χχ2) P-level
1. Water bunds* -0.32 ± 0.13 6.01 0.0143
2. Mulch application -0.36 ± 0.14 7.10 0.0077
3. Desuckering* 0.39 ± 0.13 8.38 0.0038
4. Detrashing* 0.57 ± 0.12 22.32 <0.0001
5. Manure* -0.43 ± 0.13 12.01 0.0005
6. Weeding -1.11 ± 0.09 159.31 <0.0001
7. Intercropping* -0.10 ± 0.12 0.61 0.4360
Moderate management+ -0.22 ± 0.07 3.62 0.0121
High management+ -0.29 ± 0.11 5.03 0.0345*+The error terms were assumed to be best described by binomially distribution with logit link function for theindividual practices and those for over all management by Poisson distribution with log link function. In bothcases, the parameter estimate for one of the levels of the management practice is fixed at zero and Genmodcalculates the parameter estimate for the other level in either direction of zero. If a practice has an effect ofincreasing the proportion of plants infested with mealybugs, the parameter estimate is positive and if a practicehas an effect of decreasing the proportion of plants infested with mealybugs, the parameter estimate isnegative. In this case, the fixed level is where the individual practices are not done and low management foroverall management.
Effect of farmers’ cultural practice on BSV incidence and severity
BSV severity
The severity of BSV in the farms in Ntungamo appeared to increase slightly during theperiod of study (Figure 2). This was significant in farms that were mulched and notmulched (P< 0.001), practiced sole and intercropping (P < 0.01), detrashing and minimallydetrashing (P <0.001), desuckering and minimally desuckering (P < 0.01), farms withadequate and trace waterbunds (P < 0.01), those with trace and adequate manure (P < 0.001)and weeded and poorly weeded farms (P < 0.01). None of these management practicesaffected BSV severity (P >0.05) and there was no interaction between farmer culturalmanagement practices and the period of study. There was also a significant interactionbetween month of assessment and covariate (severity in August 01).
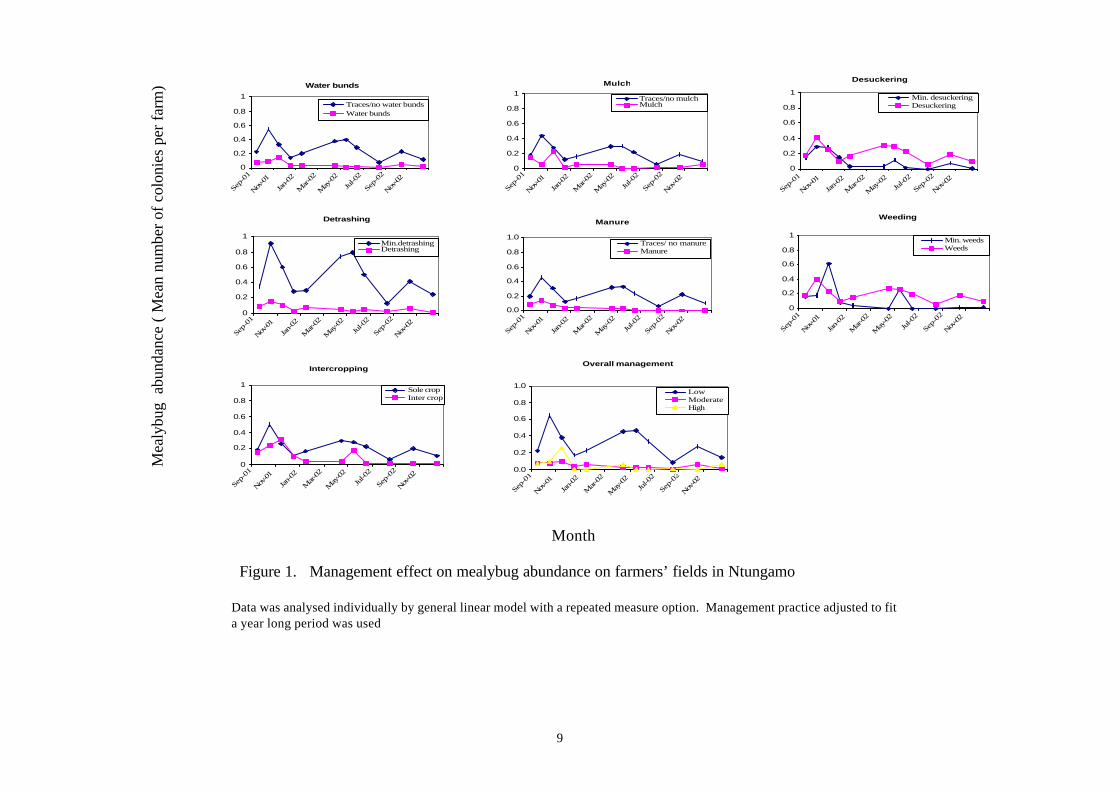
9
Month
Figure 1. Management effect on mealybug abundance on farmers’ fields in Ntungamo
Data was analysed individually by general linear model with a repeated measure option. Management practice adjusted to fita year long period was used
Mea
lybu
g a
bund
ance
( M
ean
num
ber
of c
olon
ies
per
farm
) Water bunds
0
0.2
0.4
0.6
0.8
1
Sep-
01
Nov-01
Jan-02
Mar-
02
May
-02
Jul-0
2
Sep-
02
Nov-02
Traces/no water bunds Water bunds
Mulch
0
0.2
0.4
0.6
0.8
1
Sep-
01
Nov-01
Jan-02
Mar-
02
May
-02
Jul-0
2
Sep-
02
Nov-02
Traces/no mulch Mulch
Desuckering
0
0.2
0.4
0.6
0.8
1
Sep-0
1
Nov-01
Jan-
02
Mar-
02
May
-02Ju
l-02
Sep-0
2
Nov-02
Min. desuckeringDesuckering
Manure
0.0
0.2
0.4
0.6
0.8
1.0
Sep-
01
Nov-01
Jan-02
Mar-
02
May
-02
Jul-0
2
Sep-
02
Nov-02
Traces/ no manureManure
Weeding
0
0.2
0.4
0.6
0.8
1
Sep-
01
Nov-01
Jan-02
Mar-
02
May
-02
Jul-0
2
Sep-
02
Nov-02
Min. weedsWeeds
Detrashing
0
0.2
0.4
0.6
0.8
1
Sep-
01
Nov-01
Jan-02
Mar-
02
May
-02
Jul-0
2
Sep-
02
Nov-02
Min.detrashing Detrashing
Intercropping
0
0.2
0.4
0.6
0.8
1
Sep-
01
Nov-01
Jan-02
Mar-
02
May
-02
Jul-0
2
Sep-
02
Nov-02
Sole cropInter crop
Overall management
0.0
0.2
0.4
0.6
0.8
1.0
Sep-
01
Nov-01
Jan-02
Mar-
02
May
-02
Jul-0
2
Sep-
02
Nov-02
LowModerateHigh
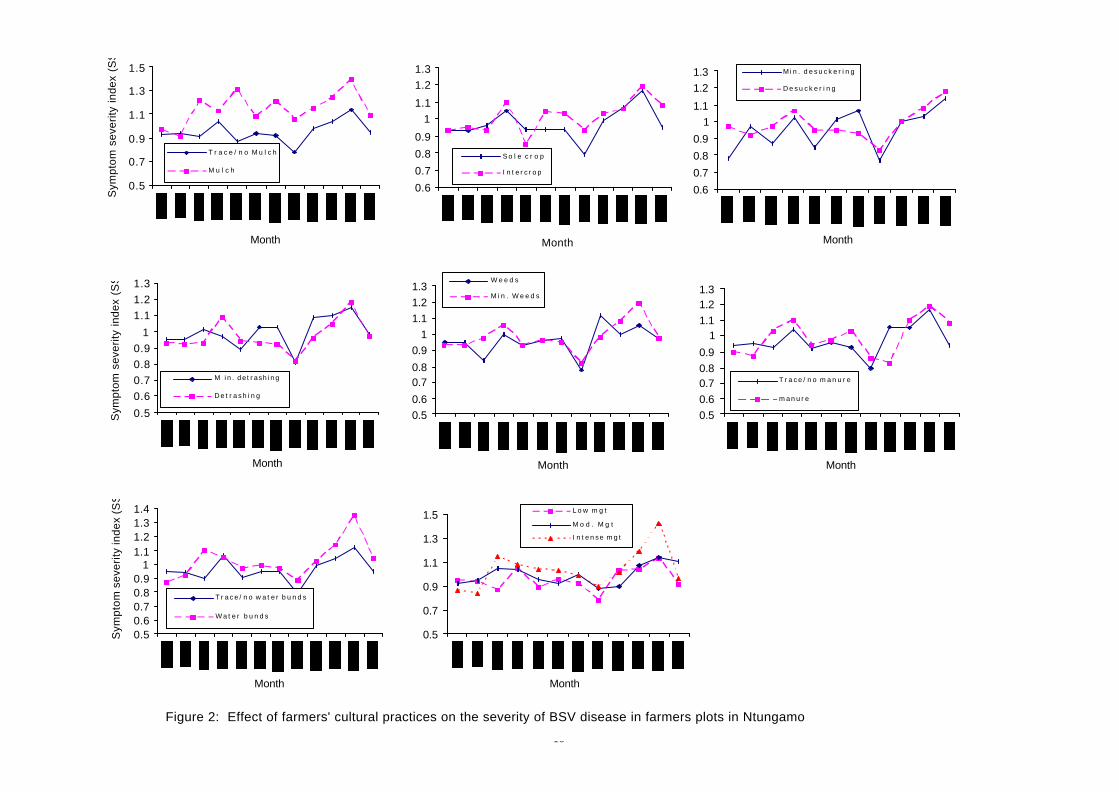
10
Figure 2: Effect of farmers' cultural practices on the severity of BSV disease in farmers plots in Ntungamo
0.5
0.7
0.9
1.1
1.3
1.5
Month
Sym
ptom
sev
erity
inde
x (S
SI)
T r a c e / n o M u l c h
M u l c h
0.6
0.7
0.8
0.9
1
1.1
1.2
1.3
Month
S o l e c r o p
I n t e r c r o p
0.6
0.7
0.8
0.9
1
1.1
1.2
1.3
Month
M i n . d e s u c k e r i n g
D e s u c k e r i n g
0.5
0.6
0.7
0.8
0.9
1
1.1
1.2
1.3
Month
Sym
ptom
sev
erity
inde
x (S
SI)
M in . d e t r a s h i n g
D e t r a s h i n g
0.5
0.6
0.70.8
0.9
1
1.1
1.2
1.3
Month
W e e d s
M i n . W e e d s
0.5
0.6
0.70.8
0.9
11.1
1.21.3
Month
T r a c e / n o m a n u r e
m a n u r e
0.50.60.70.80.9
11.11.21.31.4
Month
Sym
pto
m s
eve
rity
ind
ex
(SS
I)
T r a c e / n o w a t e r b u n d s
W a t e r b u n d s
0.5
0.7
0.9
1.1
1.3
1.5
Month
L o w m g t
M o d . M g t
I n t e n s e m g t
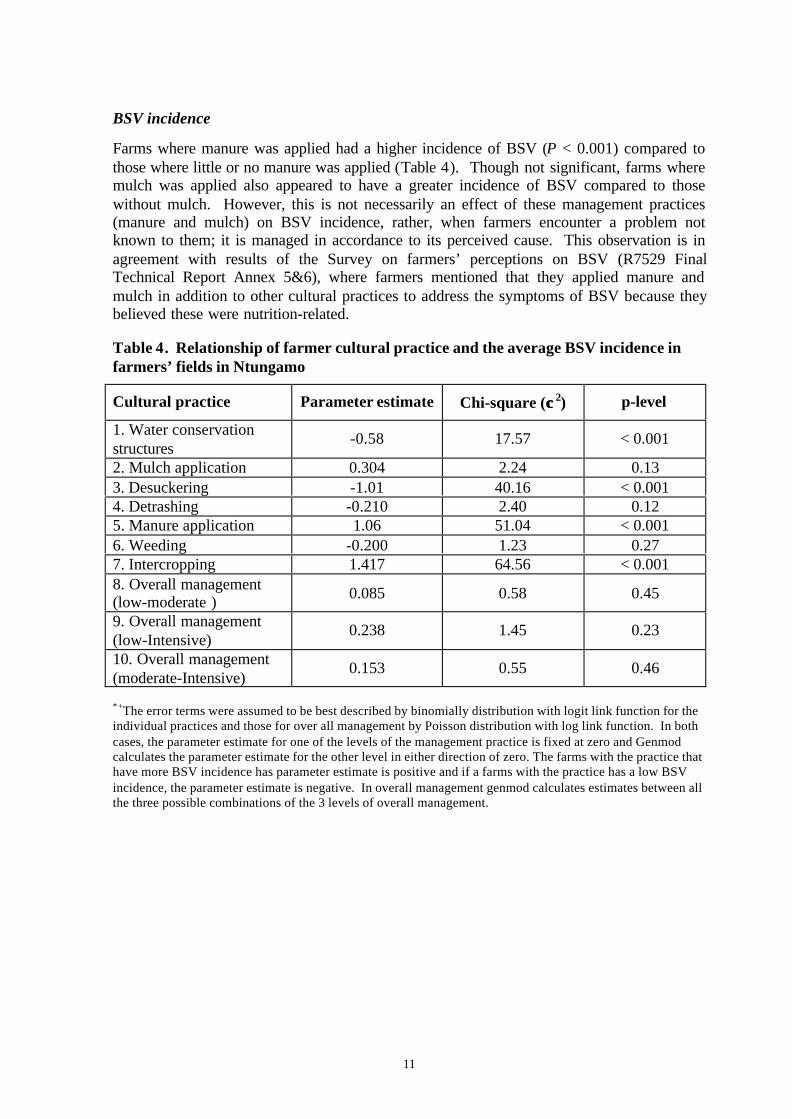
11
BSV incidence
Farms where manure was applied had a higher incidence of BSV (P < 0.001) compared tothose where little or no manure was applied (Table 4). Though not significant, farms wheremulch was applied also appeared to have a greater incidence of BSV compared to thosewithout mulch. However, this is not necessarily an effect of these management practices(manure and mulch) on BSV incidence, rather, when farmers encounter a problem notknown to them; it is managed in accordance to its perceived cause. This observation is inagreement with results of the Survey on farmers’ perceptions on BSV (R7529 FinalTechnical Report Annex 5&6), where farmers mentioned that they applied manure andmulch in addition to other cultural practices to address the symptoms of BSV because theybelieved these were nutrition-related.
Table 4. Relationship of farmer cultural practice and the average BSV incidence infarmers’ fields in Ntungamo
Cultural practice Parameter estimate Chi-square (χχ2) p-level
1. Water conservationstructures
-0.58 17.57 < 0.001
2. Mulch application 0.304 2.24 0.133. Desuckering -1.01 40.16 < 0.0014. Detrashing -0.210 2.40 0.125. Manure application 1.06 51.04 < 0.0016. Weeding -0.200 1.23 0.277. Intercropping 1.417 64.56 < 0.0018. Overall management(low-moderate ) 0.085 0.58 0.45
9. Overall management(low-Intensive)
0.238 1.45 0.23
10. Overall management(moderate-Intensive)
0.153 0.55 0.46
*+The error terms were assumed to be best described by binomially distribution with logit link function for theindividual practices and those for over all management by Poisson distribution with log link function. In bothcases, the parameter estimate for one of the levels of the management practice is fixed at zero and Genmodcalculates the parameter estimate for the other level in either direction of zero. The farms with the practice thathave more BSV incidence has parameter estimate is positive and if a farms with the practice has a low BSVincidence, the parameter estimate is negative. In overall management genmod calculates estimates between allthe three possible combinations of the 3 levels of overall management.
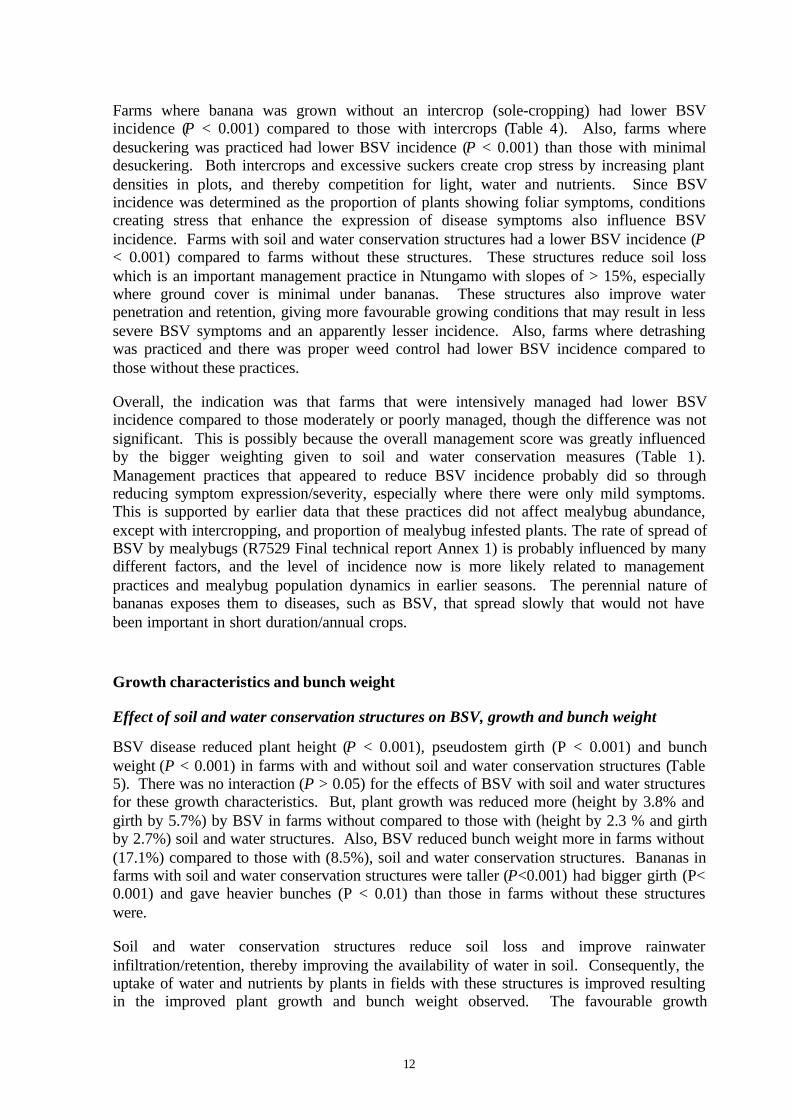
12
Farms where banana was grown without an intercrop (sole-cropping) had lower BSVincidence (P < 0.001) compared to those with intercrops (Table 4). Also, farms wheredesuckering was practiced had lower BSV incidence (P < 0.001) than those with minimaldesuckering. Both intercrops and excessive suckers create crop stress by increasing plantdensities in plots, and thereby competition for light, water and nutrients. Since BSVincidence was determined as the proportion of plants showing foliar symptoms, conditionscreating stress that enhance the expression of disease symptoms also influence BSVincidence. Farms with soil and water conservation structures had a lower BSV incidence (P< 0.001) compared to farms without these structures. These structures reduce soil losswhich is an important management practice in Ntungamo with slopes of > 15%, especiallywhere ground cover is minimal under bananas. These structures also improve waterpenetration and retention, giving more favourable growing conditions that may result in lesssevere BSV symptoms and an apparently lesser incidence. Also, farms where detrashingwas practiced and there was proper weed control had lower BSV incidence compared tothose without these practices.
Overall, the indication was that farms that were intensively managed had lower BSVincidence compared to those moderately or poorly managed, though the difference was notsignificant. This is possibly because the overall management score was greatly influencedby the bigger weighting given to soil and water conservation measures (Table 1).Management practices that appeared to reduce BSV incidence probably did so throughreducing symptom expression/severity, especially where there were only mild symptoms.This is supported by earlier data that these practices did not affect mealybug abundance,except with intercropping, and proportion of mealybug infested plants. The rate of spread ofBSV by mealybugs (R7529 Final technical report Annex 1) is probably influenced by manydifferent factors, and the level of incidence now is more likely related to managementpractices and mealybug population dynamics in earlier seasons. The perennial nature ofbananas exposes them to diseases, such as BSV, that spread slowly that would not havebeen important in short duration/annual crops.
Growth characteristics and bunch weight
Effect of soil and water conservation structures on BSV, growth and bunch weight
BSV disease reduced plant height (P < 0.001), pseudostem girth (P < 0.001) and bunchweight (P < 0.001) in farms with and without soil and water conservation structures (Table5). There was no interaction (P > 0.05) for the effects of BSV with soil and water structuresfor these growth characteristics. But, plant growth was reduced more (height by 3.8% andgirth by 5.7%) by BSV in farms without compared to those with (height by 2.3 % and girthby 2.7%) soil and water structures. Also, BSV reduced bunch weight more in farms without(17.1%) compared to those with (8.5%), soil and water conservation structures. Bananas infarms with soil and water conservation structures were taller (P<0.001) had bigger girth (P<0.001) and gave heavier bunches (P < 0.01) than those in farms without these structureswere.
Soil and water conservation structures reduce soil loss and improve rainwaterinfiltration/retention, thereby improving the availability of water in soil. Consequently, theuptake of water and nutrients by plants in fields with these structures is improved resultingin the improved plant growth and bunch weight observed. The favourable growth
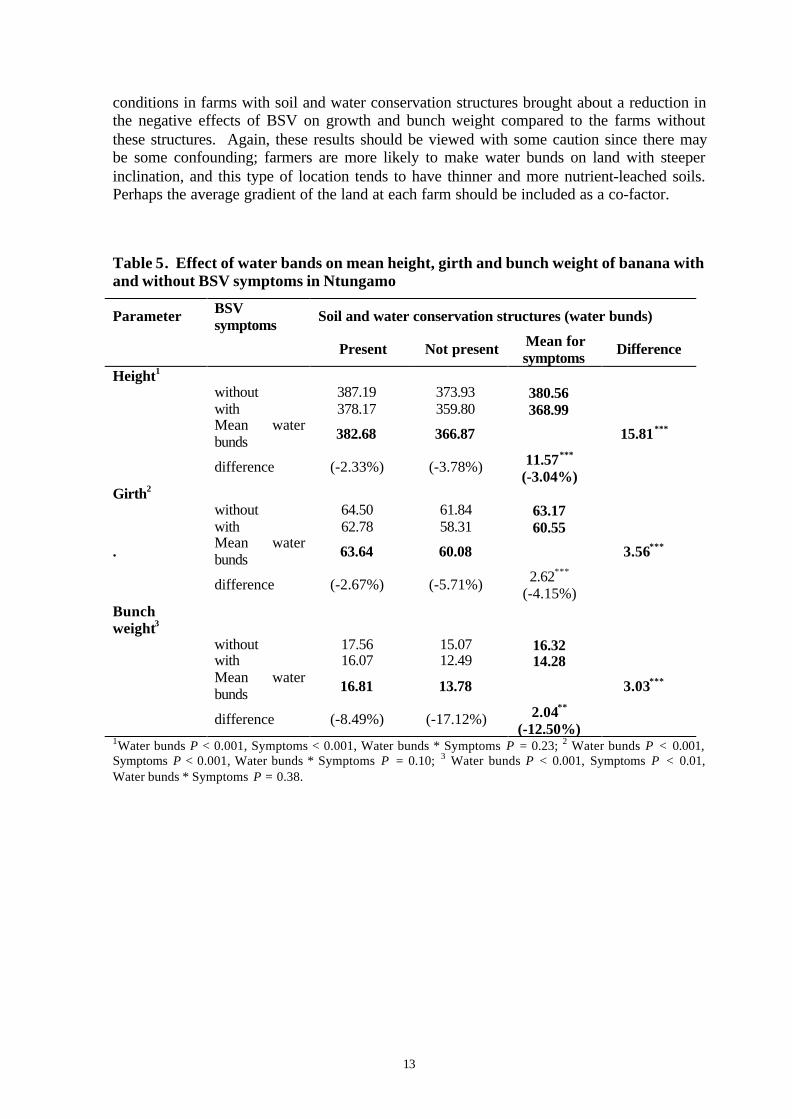
13
conditions in farms with soil and water conservation structures brought about a reduction inthe negative effects of BSV on growth and bunch weight compared to the farms withoutthese structures. Again, these results should be viewed with some caution since there maybe some confounding; farmers are more likely to make water bunds on land with steeperinclination, and this type of location tends to have thinner and more nutrient-leached soils.Perhaps the average gradient of the land at each farm should be included as a co-factor.
Table 5. Effect of water bands on mean height, girth and bunch weight of banana withand without BSV symptoms in Ntungamo
Parameter BSVsymptoms
Soil and water conservation structures (water bunds)
Present Not present Mean forsymptoms
Difference
Height1
without 387.19 373.93 380.56with 378.17 359.80 368.99Mean waterbunds 382.68 366.87 15.81***
difference (-2.33%) (-3.78%) 11.57***
(-3.04%)Girth2
without 64.50 61.84 63.17with 62.78 58.31 60.55
.Mean waterbunds 63.64 60.08 3.56***
difference (-2.67%) (-5.71%) 2.62***
(-4.15%)Bunchweight3
without 17.56 15.07 16.32with 16.07 12.49 14.28Mean waterbunds 16.81 13.78 3.03***
difference (-8.49%) (-17.12%) 2.04**
(-12.50%)1Water bunds P < 0.001, Symptoms < 0.001, Water bunds * Symptoms P = 0.23; 2 Water bunds P < 0.001,Symptoms P < 0.001, Water bunds * Symptoms P = 0.10; 3 Water bunds P < 0.001, Symptoms P < 0.01,Water bunds * Symptoms P = 0.38.
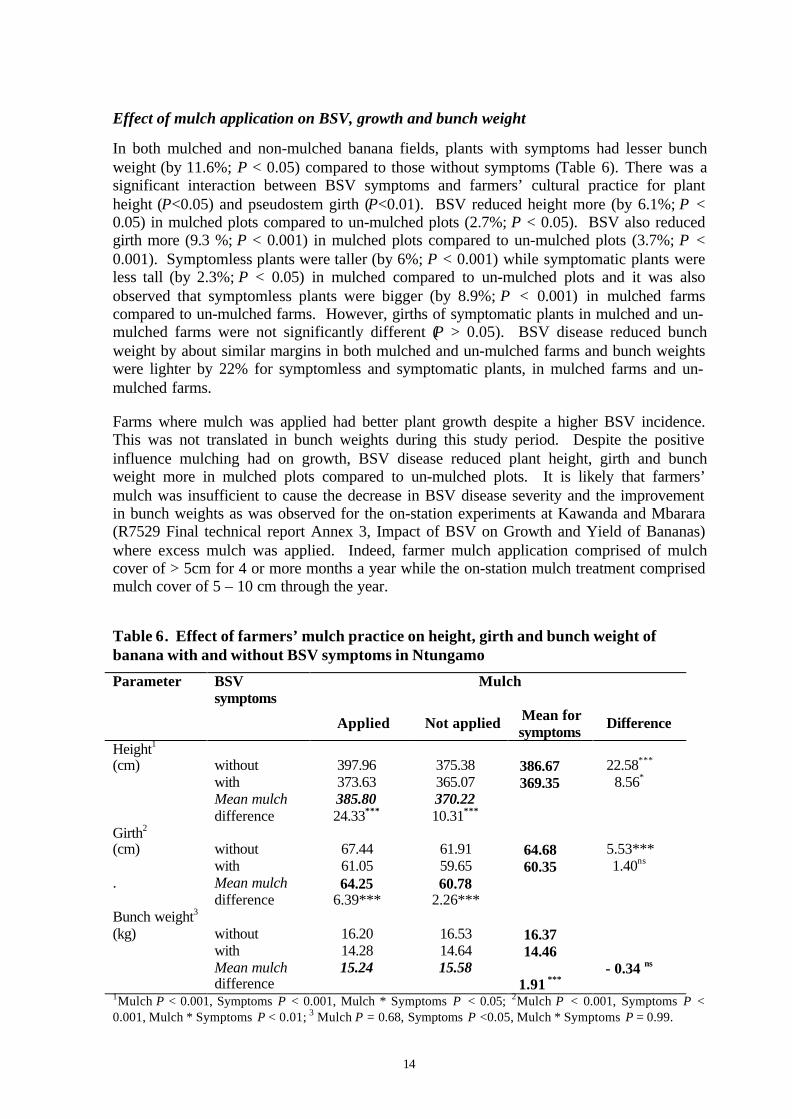
14
Effect of mulch application on BSV, growth and bunch weight
In both mulched and non-mulched banana fields, plants with symptoms had lesser bunchweight (by 11.6%; P < 0.05) compared to those without symptoms (Table 6). There was asignificant interaction between BSV symptoms and farmers’ cultural practice for plantheight (P<0.05) and pseudostem girth (P<0.01). BSV reduced height more (by 6.1%; P <0.05) in mulched plots compared to un-mulched plots (2.7%; P < 0.05). BSV also reducedgirth more (9.3 %; P < 0.001) in mulched plots compared to un-mulched plots (3.7%; P <0.001). Symptomless plants were taller (by 6%; P < 0.001) while symptomatic plants wereless tall (by 2.3%; P < 0.05) in mulched compared to un-mulched plots and it was alsoobserved that symptomless plants were bigger (by 8.9%; P < 0.001) in mulched farmscompared to un-mulched farms. However, girths of symptomatic plants in mulched and un-mulched farms were not significantly different (P > 0.05). BSV disease reduced bunchweight by about similar margins in both mulched and un-mulched farms and bunch weightswere lighter by 22% for symptomless and symptomatic plants, in mulched farms and un-mulched farms.
Farms where mulch was applied had better plant growth despite a higher BSV incidence.This was not translated in bunch weights during this study period. Despite the positiveinfluence mulching had on growth, BSV disease reduced plant height, girth and bunchweight more in mulched plots compared to un-mulched plots. It is likely that farmers’mulch was insufficient to cause the decrease in BSV disease severity and the improvementin bunch weights as was observed for the on-station experiments at Kawanda and Mbarara(R7529 Final technical report Annex 3, Impact of BSV on Growth and Yield of Bananas)where excess mulch was applied. Indeed, farmer mulch application comprised of mulchcover of > 5cm for 4 or more months a year while the on-station mulch treatment comprisedmulch cover of 5 – 10 cm through the year.
Table 6. Effect of farmers’ mulch practice on height, girth and bunch weight ofbanana with and without BSV symptoms in Ntungamo
Parameter BSVsymptoms
Mulch
Applied Not applied Mean forsymptoms
Difference
Height1
(cm) without 397.96 375.38 386.67 22.58***
with 373.63 365.07 369.35 8.56*
Mean mulch 385.80 370.22difference 24.33*** 10.31***
Girth2
(cm) without 67.44 61.91 64.68 5.53***with 61.05 59.65 60.35 1.40ns
. Mean mulch 64.25 60.78difference 6.39*** 2.26***
Bunch weight3
(kg) without 16.20 16.53 16.37with 14.28 14.64 14.46Mean mulch 15.24 15.58 - 0.34 ns
difference 1.91 ***
1Mulch P < 0.001, Symptoms P < 0.001, Mulch * Symptoms P < 0.05; 2Mulch P < 0.001, Symptoms P <0.001, Mulch * Symptoms P < 0.01; 3 Mulch P = 0.68, Symptoms P <0.05, Mulch * Symptoms P = 0.99.
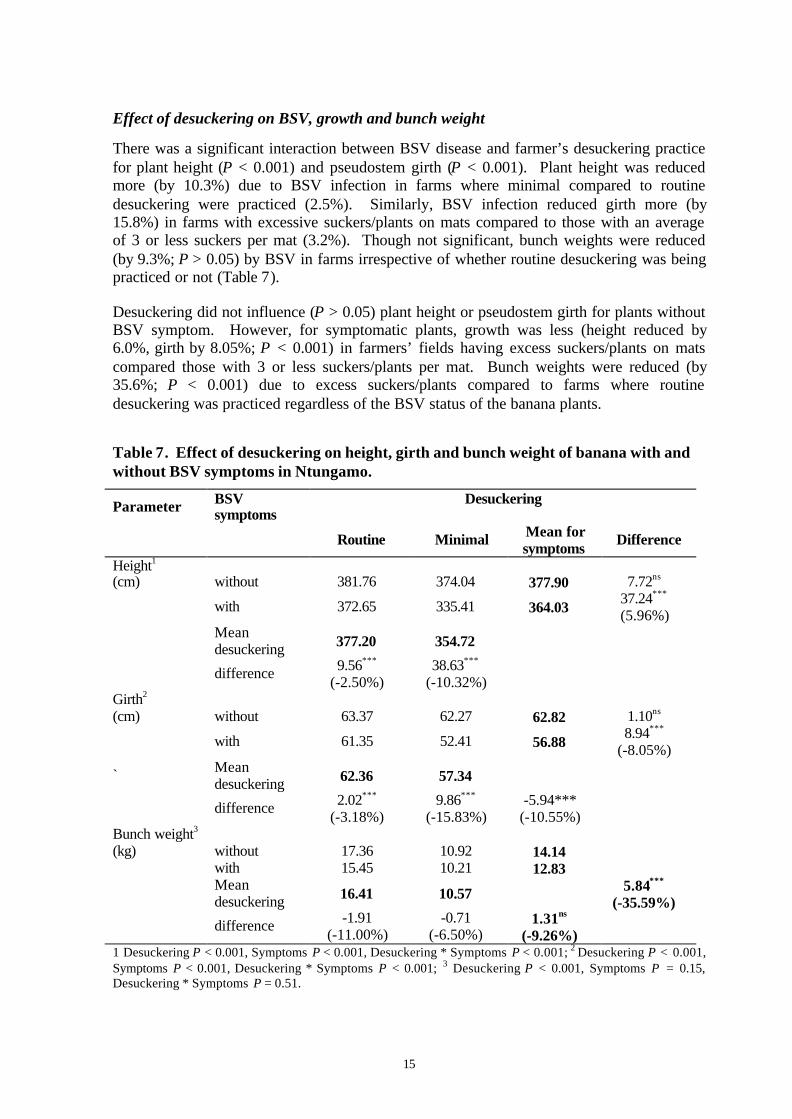
15
Effect of desuckering on BSV, growth and bunch weight
There was a significant interaction between BSV disease and farmer’s desuckering practicefor plant height (P < 0.001) and pseudostem girth (P < 0.001). Plant height was reducedmore (by 10.3%) due to BSV infection in farms where minimal compared to routinedesuckering were practiced (2.5%). Similarly, BSV infection reduced girth more (by15.8%) in farms with excessive suckers/plants on mats compared to those with an averageof 3 or less suckers per mat (3.2%). Though not significant, bunch weights were reduced(by 9.3%; P > 0.05) by BSV in farms irrespective of whether routine desuckering was beingpracticed or not (Table 7).
Desuckering did not influence (P > 0.05) plant height or pseudostem girth for plants withoutBSV symptom. However, for symptomatic plants, growth was less (height reduced by6.0%, girth by 8.05%; P < 0.001) in farmers’ fields having excess suckers/plants on matscompared those with 3 or less suckers/plants per mat. Bunch weights were reduced (by35.6%; P < 0.001) due to excess suckers/plants compared to farms where routinedesuckering was practiced regardless of the BSV status of the banana plants.
Table 7. Effect of desuckering on height, girth and bunch weight of banana with andwithout BSV symptoms in Ntungamo.
Parameter BSVsymptoms
Desuckering
Routine Minimal Mean forsymptoms
Difference
Height1
(cm) without 381.76 374.04 377.90 7.72ns
with 372.65 335.41 364.0337.24***
(5.96%)Meandesuckering 377.20 354.72
difference 9.56***
(-2.50%)38.63***
(-10.32%)Girth2
(cm) without 63.37 62.27 62.82 1.10ns
with 61.35 52.41 56.888.94***
(-8.05%)
` Meandesuckering 62.36 57.34
difference 2.02***
(-3.18%)9.86***
(-15.83%)-5.94***
(-10.55%)Bunch weight3
(kg) without 17.36 10.92 14.14with 15.45 10.21 12.83Meandesuckering 16.41 10.57 5.84***
(-35.59%)
difference -1.91(-11.00%)
-0.71(-6.50%)
1.31ns
(-9.26%)1 Desuckering P < 0.001, Symptoms P < 0.001, Desuckering * Symptoms P < 0.001; 2 Desuckering P < 0.001,Symptoms P < 0.001, Desuckering * Symptoms P < 0.001; 3 Desuckering P < 0.001, Symptoms P = 0.15,Desuckering * Symptoms P = 0.51.

16
Farms where minimal desuckering is practiced normally have excess suckers/plants per mat,giving rise to high plant densities. This results in plants competing for light, water andnutrients. The growth of symptomless plants, however, was not reduced in the farmscategorized as practicing minimal desuckering (≥ 4 plants per mat). The reduction ingrowth occurred in symptomatic plants. This implies crop stress due to excess suckers wassufficient to reduce growth for plants with BSV infection. However, crop stress arisingfrom minimal desuckering in fields reduced bunch weights for both symptomatic andsymptomless plants. Results presented here are for bunch weights per plant. Because of thegreater plant density that results from minimal desuckering, the total yield per unit area isprobably not reduced to the same extent in farms with minimal desuckering compared tothose with optimal desuckering as is suggested by the reduction in individual bunchweights.
Effect of detrashing on BSV, growth and bunch weight
Plant height (P < 0.001), pseudostem girth (P < 0.001) and bunch weight (P < 0.05) werereduced by BSV disease in farms irrespective of whether they practiced routine detrashingor not (Table 8). BSV disease was not subject to an interaction (P > 0.05) with routinedetrashing, and the practice did not have an effect (P > 0.05) on the plant height. However,detrashing increased plant girth (by 3.8%; P < 0.01) and bunch weight (by 16.2%; P < 0.01).Detrashing provides favourable plant growing conditions by improving illumination andplant health.
Effect of manure application on BSV, growth and bunch weight
BSV reduced pseudostem girth (P < 0.05) in farms with substantial and no/trace amounts ofmanure (Table 9). BSV was subject to an interaction with manure for plant height andbunch weight. The disease reduced plant height more (by 3.8%; P < 0.001) in farms thatreceived no/trace amounts of manure compared to those receiving substantial amounts ofmanure. Conversely, BSV reduced bunch weight more (29.5%) in farms where substantialamounts of manure applied compared to those with no/trace amounts of manure (8.7%).Despite BSV not being subject to an interaction with manure for pseudostem girth, girth wasreduced more (5.0%) in farms with trace/no manure compared to those with substantialamounts of manure applied (0.4%).
Application of manure significantly increased (by 2.03%; P < 0.05) pseudostem girth. Plantheight of symptomatic plants was greater (by 2.9%; P < 0.05) in substantially manuredfarms compared to those in no/trace manure applied farms. There was no significant (P >0.05) effect of manure on the plant height for symptomless plants. Bunch weight ofsymptomatic plants were marginally (but not significantly P > 0.05) greater in farms whereno/trace amounts of were applied compared to those with substantial amounts of manureapplied. But, the bunch weights of symptomless plants were significantly less (15.4%; P <0.05) in farms with no/trace amounts of manure compared to those with substantial manureapplied.
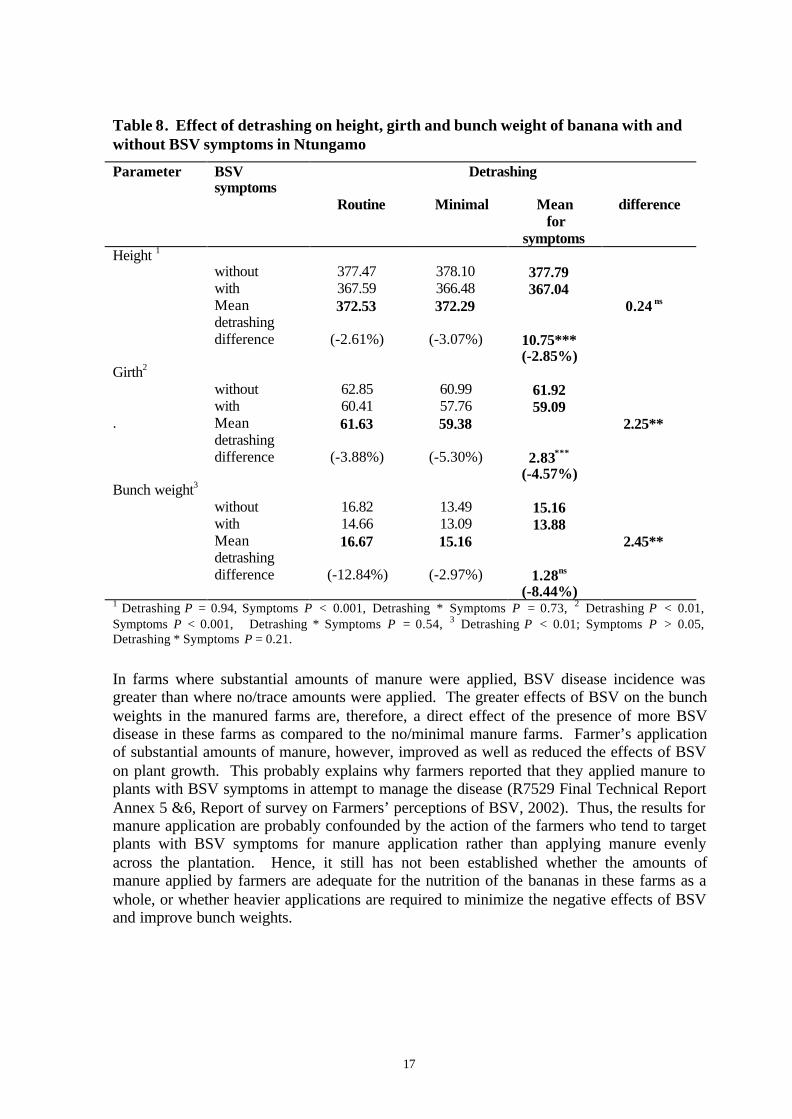
17
Table 8. Effect of detrashing on height, girth and bunch weight of banana with andwithout BSV symptoms in Ntungamo
Parameter BSVsymptoms
Detrashing
Routine Minimal Meanfor
symptoms
difference
Height 1
without 377.47 378.10 377.79with 367.59 366.48 367.04Meandetrashing
372.53 372.29 0.24 ns
difference (-2.61%) (-3.07%) 10.75***(-2.85%)
Girth2
without 62.85 60.99 61.92with 60.41 57.76 59.09
. Meandetrashing
61.63 59.38 2.25**
difference (-3.88%) (-5.30%) 2.83***
(-4.57%)Bunch weight3
without 16.82 13.49 15.16with 14.66 13.09 13.88Meandetrashing
16.67 15.16 2.45**
difference (-12.84%) (-2.97%) 1.28ns
(-8.44%)1 Detrashing P = 0.94, Symptoms P < 0.001, Detrashing * Symptoms P = 0.73, 2 Detrashing P < 0.01,Symptoms P < 0.001, Detrashing * Symptoms P = 0.54, 3 Detrashing P < 0.01; Symptoms P > 0.05,Detrashing * Symptoms P = 0.21.
In farms where substantial amounts of manure were applied, BSV disease incidence wasgreater than where no/trace amounts were applied. The greater effects of BSV on the bunchweights in the manured farms are, therefore, a direct effect of the presence of more BSVdisease in these farms as compared to the no/minimal manure farms. Farmer’s applicationof substantial amounts of manure, however, improved as well as reduced the effects of BSVon plant growth. This probably explains why farmers reported that they applied manure toplants with BSV symptoms in attempt to manage the disease (R7529 Final Technical ReportAnnex 5 &6, Report of survey on Farmers’ perceptions of BSV, 2002). Thus, the results formanure application are probably confounded by the action of the farmers who tend to targetplants with BSV symptoms for manure application rather than applying manure evenlyacross the plantation. Hence, it still has not been established whether the amounts ofmanure applied by farmers are adequate for the nutrition of the bananas in these farms as awhole, or whether heavier applications are required to minimize the negative effects of BSVand improve bunch weights.
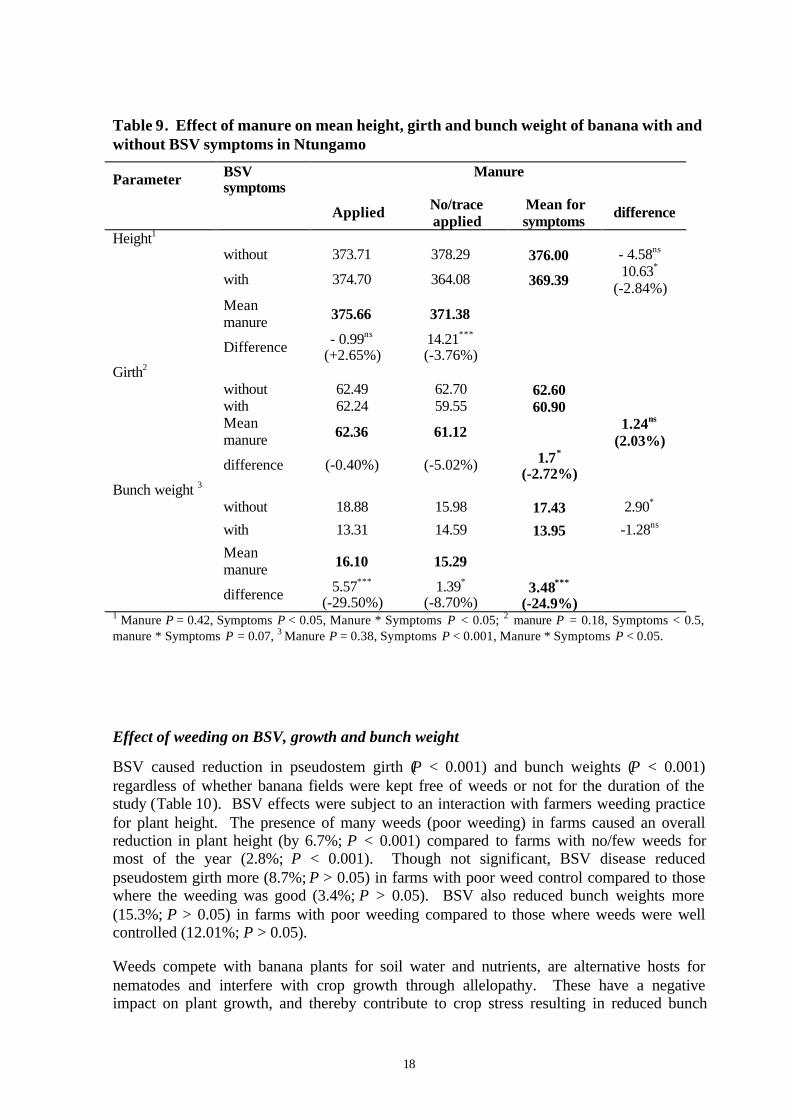
18
Table 9. Effect of manure on mean height, girth and bunch weight of banana with andwithout BSV symptoms in Ntungamo
Parameter BSVsymptoms
Manure
Applied No/traceapplied
Mean forsymptoms
difference
Height1
without 373.71 378.29 376.00 - 4.58ns
with 374.70 364.08 369.3910.63*
(-2.84%)Meanmanure 375.66 371.38
Difference - 0.99ns
(+2.65%)14.21***
(-3.76%)Girth2
without 62.49 62.70 62.60with 62.24 59.55 60.90Meanmanure 62.36 61.12 1.24ns
(2.03%)
difference (-0.40%) (-5.02%) 1.7*
(-2.72%)Bunch weight 3
without 18.88 15.98 17.43 2.90*
with 13.31 14.59 13.95 -1.28ns
Meanmanure 16.10 15.29
difference 5.57***
(-29.50%)1.39*
(-8.70%)3.48***
(-24.9%)1 Manure P = 0.42, Symptoms P < 0.05, Manure * Symptoms P < 0.05; 2 manure P = 0.18, Symptoms < 0.5,manure * Symptoms P = 0.07, 3 Manure P = 0.38, Symptoms P < 0.001, Manure * Symptoms P < 0.05.
Effect of weeding on BSV, growth and bunch weight
BSV caused reduction in pseudostem girth (P < 0.001) and bunch weights (P < 0.001)regardless of whether banana fields were kept free of weeds or not for the duration of thestudy (Table 10). BSV effects were subject to an interaction with farmers weeding practicefor plant height. The presence of many weeds (poor weeding) in farms caused an overallreduction in plant height (by 6.7%; P < 0.001) compared to farms with no/few weeds formost of the year (2.8%; P < 0.001). Though not significant, BSV disease reducedpseudostem girth more (8.7%; P > 0.05) in farms with poor weed control compared to thosewhere the weeding was good (3.4%; P > 0.05). BSV also reduced bunch weights more(15.3%; P > 0.05) in farms with poor weeding compared to those where weeds were wellcontrolled (12.01%; P > 0.05).
Weeds compete with banana plants for soil water and nutrients, are alternative hosts fornematodes and interfere with crop growth through allelopathy. These have a negativeimpact on plant growth, and thereby contribute to crop stress resulting in reduced bunch
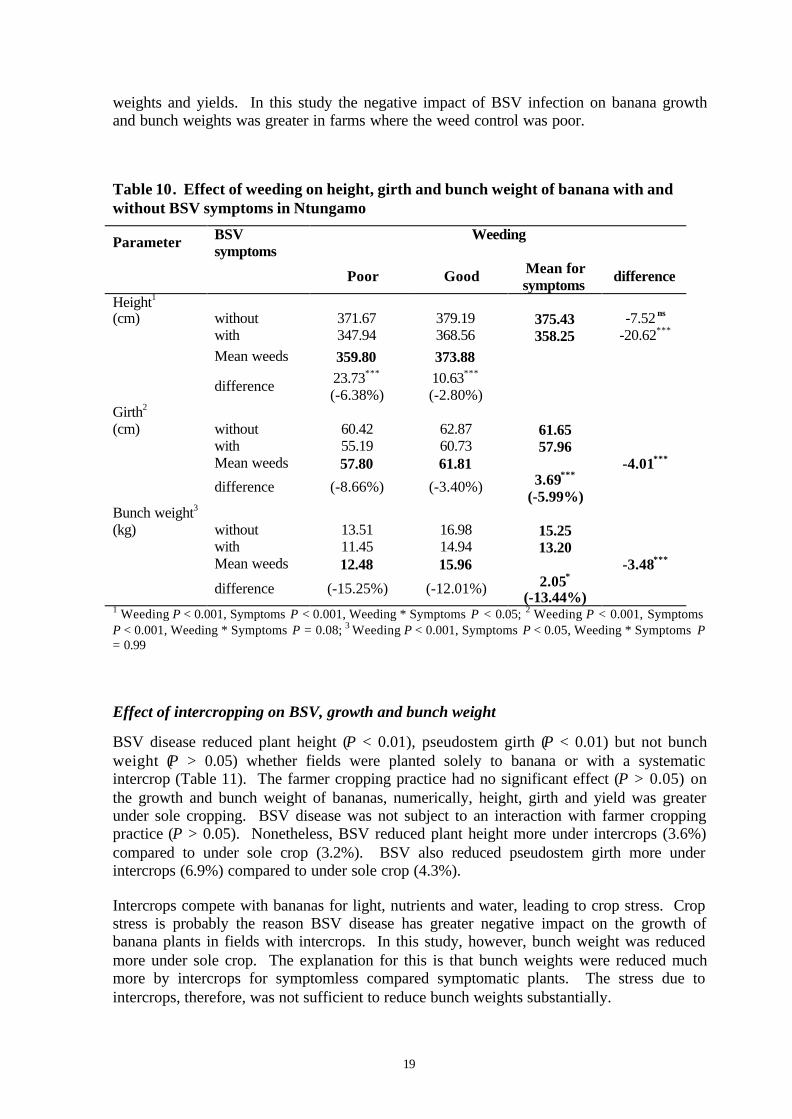
19
weights and yields. In this study the negative impact of BSV infection on banana growthand bunch weights was greater in farms where the weed control was poor.
Table 10. Effect of weeding on height, girth and bunch weight of banana with andwithout BSV symptoms in Ntungamo
Parameter BSVsymptoms
Weeding
Poor Good Mean forsymptoms
difference
Height1
(cm) without 371.67 379.19 375.43 -7.52 ns
with 347.94 368.56 358.25 -20.62***
Mean weeds 359.80 373.88
difference 23.73***
(-6.38%)10.63***
(-2.80%)Girth2
(cm) without 60.42 62.87 61.65with 55.19 60.73 57.96Mean weeds 57.80 61.81 -4.01***
difference (-8.66%) (-3.40%) 3.69***
(-5.99%)Bunch weight3
(kg) without 13.51 16.98 15.25with 11.45 14.94 13.20Mean weeds 12.48 15.96 -3.48***
difference (-15.25%) (-12.01%) 2.05*
(-13.44%)1 Weeding P < 0.001, Symptoms P < 0.001, Weeding * Symptoms P < 0.05; 2 Weeding P < 0.001, SymptomsP < 0.001, Weeding * Symptoms P = 0.08; 3 Weeding P < 0.001, Symptoms P < 0.05, Weeding * Symptoms P= 0.99
Effect of intercropping on BSV, growth and bunch weight
BSV disease reduced plant height (P < 0.01), pseudostem girth (P < 0.01) but not bunchweight (P > 0.05) whether fields were planted solely to banana or with a systematicintercrop (Table 11). The farmer cropping practice had no significant effect (P > 0.05) onthe growth and bunch weight of bananas, numerically, height, girth and yield was greaterunder sole cropping. BSV disease was not subject to an interaction with farmer croppingpractice (P > 0.05). Nonetheless, BSV reduced plant height more under intercrops (3.6%)compared to under sole crop (3.2%). BSV also reduced pseudostem girth more underintercrops (6.9%) compared to under sole crop (4.3%).
Intercrops compete with bananas for light, nutrients and water, leading to crop stress. Cropstress is probably the reason BSV disease has greater negative impact on the growth ofbanana plants in fields with intercrops. In this study, however, bunch weight was reducedmore under sole crop. The explanation for this is that bunch weights were reduced muchmore by intercrops for symptomless compared symptomatic plants. The stress due tointercrops, therefore, was not sufficient to reduce bunch weights substantially.
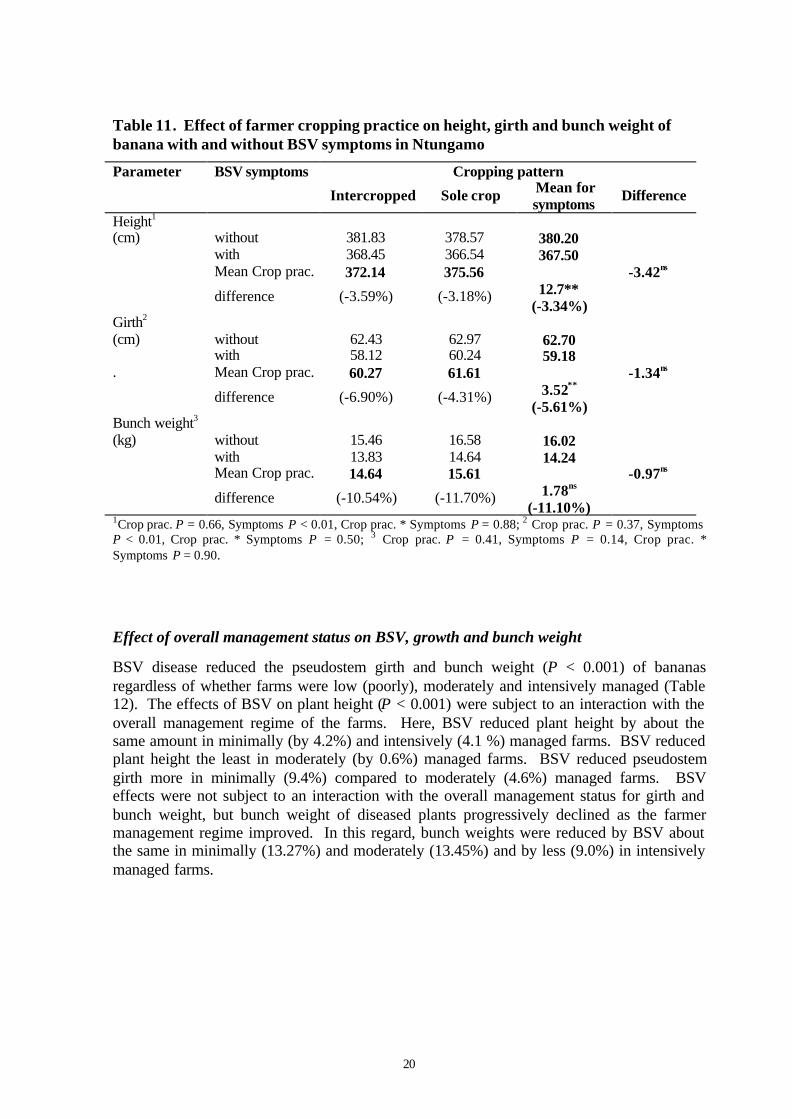
20
Table 11. Effect of farmer cropping practice on height, girth and bunch weight ofbanana with and without BSV symptoms in Ntungamo
Parameter BSV symptoms Cropping pattern
Intercropped Sole crop Mean forsymptoms
Difference
Height1
(cm) without 381.83 378.57 380.20with 368.45 366.54 367.50Mean Crop prac. 372.14 375.56 -3.42ns
difference (-3.59%) (-3.18%) 12.7**(-3.34%)
Girth2
(cm) without 62.43 62.97 62.70with 58.12 60.24 59.18
. Mean Crop prac. 60.27 61.61 -1.34ns
difference (-6.90%) (-4.31%) 3.52**
(-5.61%)Bunch weight3
(kg) without 15.46 16.58 16.02with 13.83 14.64 14.24Mean Crop prac. 14.64 15.61 -0.97ns
difference (-10.54%) (-11.70%) 1.78ns
(-11.10%)1Crop prac. P = 0.66, Symptoms P < 0.01, Crop prac. * Symptoms P = 0.88; 2 Crop prac. P = 0.37, SymptomsP < 0.01, Crop prac. * Symptoms P = 0.50; 3 Crop prac. P = 0.41, Symptoms P = 0.14, Crop prac. *Symptoms P = 0.90.
Effect of overall management status on BSV, growth and bunch weight
BSV disease reduced the pseudostem girth and bunch weight (P < 0.001) of bananasregardless of whether farms were low (poorly), moderately and intensively managed (Table12). The effects of BSV on plant height (P < 0.001) were subject to an interaction with theoverall management regime of the farms. Here, BSV reduced plant height by about thesame amount in minimally (by 4.2%) and intensively (4.1 %) managed farms. BSV reducedplant height the least in moderately (by 0.6%) managed farms. BSV reduced pseudostemgirth more in minimally (9.4%) compared to moderately (4.6%) managed farms. BSVeffects were not subject to an interaction with the overall management status for girth andbunch weight, but bunch weight of diseased plants progressively declined as the farmermanagement regime improved. In this regard, bunch weights were reduced by BSV aboutthe same in minimally (13.27%) and moderately (13.45%) and by less (9.0%) in intensivelymanaged farms.
21
Plants in intensively managed farms compared to those that were moderately and poorlymanaged produced a heavier bunch (P < 0.001). Bunch weights appeared slightly greater inmoderately, compared to lowly managed farms, although the difference was not statisticallysignificant (P > 0.05). Girth in intensively compared to low and moderately managedfarmers was greater (P < 0.001). The intensively managed farms produced the tallest plants.For symptomatic plants the growth descriptors (plant height and girth) were smallest in thepoorly managed farms. Growth of symptomatic plants was improved in moderatelymanaged farms and further so in intensively managed plots.
These results are indicative that farmers’ cultural management practices, individually andcollectively, potentially improve the growth and bunch weight of bananas with BSVinfection in farmers’ banana fields. The overall management regime levels used in thisstudy were based on criteria that gave soil and water conservation structures the greatestweighting (Table 1). Further analysis needs to be carried out to establish whichcombinations of farmer practices are the most beneficial.
Reduced banana growth and the loss in bunch weight due to BSV disease in farmers’ fieldswas also observed in the on-station experiments at Kawanda and Mbarara (R7529 FinalTechnical Report Annex 3). These observations are in agreement with reports that BSVinfection causes stunting (Gauhl and Pasberg-Gauhl., 1995) and significant yield loss (Dahalet al., 2000; Daniells et al., 2001).
BSV infection impedes plant growth and yield through its effect on physiological processesamong others. Viral infections are reported to affect photosynthetic rates and carbohydratemetabolism in plants (Tecsi et al., 1995). In the on-station experiments at Kawanda andMbarara, BSV infection reduced the rate of photosynthesis of banana leaves. This wasattributed to a reduction in the amount of RuBISCO enzyme (the primary receptor of CO2)in the leaves. The effect of BSV on photosynthesis is obvious from chlorosis and necrosisseen on leaves of infected banana plants. BSV infection in farmers’ fields also causednecrosis in pseudostems, and therefore affected uptake of water and nutrients and thetranslocation of assimilates. It is also likely that BSV infection altered carbon metabolismsince viral infections are observed to lead to increased cellular respiration (Tecsi et al.,1995) creating a metabolic sink, and thereby diverting resources from the processes ofgrowth and development.
Farmers’ cultural practices that cause crop stress enhance the negative impact of BSVdisease on growth and development. Farmers’ cultural practices that caused crop stresswere: poor weeding, growing systematic intercrops, minimal desuckering (excessivesuckers/plants) and minimal detrashing (substantial senescent and non functional leaves onplants). These practices cause bananas to compete for light, water and nutrients affectinggrowth and yields. On the other hand, farmer practices that relieved crop stress reduced theimpact of BSV disease. The application of substantial amounts of manure, soil and waterconservation structures, sole cropping, frequent weeding, routine desuckering anddetrashing were observed to reduce the effects of BSV.
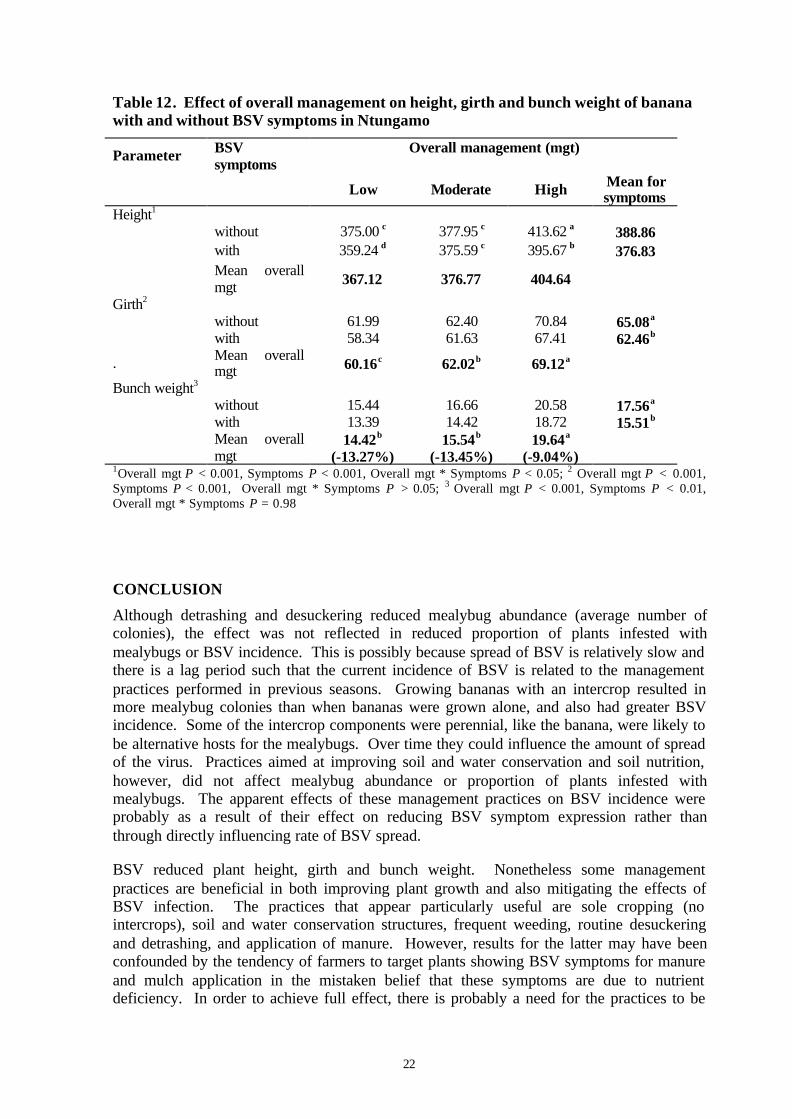
22
Table 12. Effect of overall management on height, girth and bunch weight of bananawith and without BSV symptoms in Ntungamo
Parameter BSVsymptoms
Overall management (mgt)
Low Moderate High Mean forsymptoms
Height1
without 375.00 c 377.95 c 413.62 a 388.86with 359.24 d 375.59 c 395.67 b 376.83Mean overallmgt 367.12 376.77 404.64
Girth2
without 61.99 62.40 70.84 65.08a
with 58.34 61.63 67.41 62.46b
. Mean overallmgt 60.16c 62.02b 69.12a
Bunch weight3
without 15.44 16.66 20.58 17.56a
with 13.39 14.42 18.72 15.51b
Mean overallmgt
14.42b
(-13.27%)15.54b
(-13.45%)19.64a
(-9.04%)1Overall mgt P < 0.001, Symptoms P < 0.001, Overall mgt * Symptoms P < 0.05; 2 Overall mgt P < 0.001,Symptoms P < 0.001, Overall mgt * Symptoms P > 0.05; 3 Overall mgt P < 0.001, Symptoms P < 0.01,Overall mgt * Symptoms P = 0.98
CONCLUSION
Although detrashing and desuckering reduced mealybug abundance (average number ofcolonies), the effect was not reflected in reduced proportion of plants infested withmealybugs or BSV incidence. This is possibly because spread of BSV is relatively slow andthere is a lag period such that the current incidence of BSV is related to the managementpractices performed in previous seasons. Growing bananas with an intercrop resulted inmore mealybug colonies than when bananas were grown alone, and also had greater BSVincidence. Some of the intercrop components were perennial, like the banana, were likely tobe alternative hosts for the mealybugs. Over time they could influence the amount of spreadof the virus. Practices aimed at improving soil and water conservation and soil nutrition,however, did not affect mealybug abundance or proportion of plants infested withmealybugs. The apparent effects of these management practices on BSV incidence wereprobably as a result of their effect on reducing BSV symptom expression rather thanthrough directly influencing rate of BSV spread.
BSV reduced plant height, girth and bunch weight. Nonetheless some managementpractices are beneficial in both improving plant growth and also mitigating the effects ofBSV infection. The practices that appear particularly useful are sole cropping (nointercrops), soil and water conservation structures, frequent weeding, routine desuckeringand detrashing, and application of manure. However, results for the latter may have beenconfounded by the tendency of farmers to target plants showing BSV symptoms for manureand mulch application in the mistaken belief that these symptoms are due to nutrientdeficiency. In order to achieve full effect, there is probably a need for the practices to be
23
applied more frequently and intensively than is currently being done by farmers. The costeffectiveness of these practices against the benefit in terms of yield increase is not knownand must be considered if they are to be promoted. This study does not give an indication ofthe yield increase achievable using the management practices for different levels of BSVincidence and severity. In instances where severity is high and management practices donot mitigate BSV effects, roguing could be the more appropriate measure in controlling thedisease. Its applicability, though, is not known. Roguing may also reduce the spread ofBSV. It is probable that most of these practices may not be fully beneficial individually butwould be in combination.
References
Anonymous, (1998) Project completion Report: Banana based cropping systems project: Phase II.Submitted to Rockfeller Foundation and IDRC.
Bigger, M. (1981) The Relative Abundance Of the Mealybug Vectors (Hemiptera,Coccidae and Pseudococcidae) Of Cocoa Swollen Shoot Disease In Ghana. BulletinOf Entomological Research 71: 435-448.
Dahal, G., Hughes, J.d’A., Thottappilly, G. & Lockhart, B.E.L. (1997) Status of banana streakbadnavirus in Africa: Problems and future research needs. Integrated Pest ManagementReviews 3:1-13
Dahal, G., Hughes J.d’A. and Lockhart, B.E.L (1998) Status of banana streak disease in Africa:problems and future research needs. Integrated Pest Management Reviews 3: 85-97
Dahal, G., Ortiz, R, Tenkouano, A, Hughes J.d’A., Thottappily, G., Vuylsteke, D and Lockhart,B.E.L (2000) Relationship between natural occurrence of banana streak badnavirus andsymptom expression, relative concentration of viral antigen, and yield characteristics of somemicropropagated Musa spp. Plant Pathology 49: 68-79
Daniells J.W., Geering A.D.W., Bryde N.J. and Thomas J.E. (2001) The effect of Banana streakvirus on the growth and yield of dessert bananas in tropical Australia. Annals of AppliedBiology 139: 51-60.
Diekmann, M. & Putter, C.A.J. (1996) FAO/IPGR Technical Guidelines for the Safe Movement ofGermplasm. No.15. Musa. 2nd Edition. Food and Agriculture Organisation of the UnitedNations, International Plant Genetic Resources Institute.
Gauhl, F. & Pasberg-Gauhl, C. (1995) Temporal dynamics of banana streak badnavirus (BSV)symptoms in Musa clones in Southern Nigeria. Phytomedizin 25: 25-27.
Gold, C.S., Ogenga-Latigo, M.W., Tushmereirwe, W.K., Kashaija, I.N. & Nankinga, C. (1993)Farmer perceptions of banana pest constraints in Uganda. In: Proceedings of a Research Co-ordination Meeting for Biological and Integrated Control of Highland Banana Pests andDiseases in Africa, Cotonou, 12-14 November 1991. pp 3-24. Gold, C.S. & Gemmil, B. (Eds.)International Institute of Tropical Agriculture, Ibadan.
Gold, C.S., Okech, S.H. and Nokoe, S. (2002) Evaluation of pseudostem trapping as a controlmeasure against banana weevil, Cosmopolites sordius (Coleoptera: Curculionidae) in Uganda.Bulletin of Entomological Research 92: 35-44.
24
Holderness, M., Tushemereirwe, W.K and Gold, C.S. (1999) Culture controls and habitatmanagement in the integrated management of banana leaf diseases Pages 149 – 163. In:Proceedings of Workshop on Mobilizing IPM for sustainable banana production in Africa,South Africa 12-28 November 1998. Eds. Frison. E.A., Karamura, E.B. and Sikora, R.A.INIBAP, Montpellier, France
Karamura, E.B. (1993) The strategic importance of bananas and plantain in Uganda. Pages 384-387. In: Proceedings of a Research Co-ordination Meeting for Biological and IntegratedControl of Highland Banana Pests and Diseases in Africa, Cotonou, 12-14 November 1991.Eds Gold, C.S. & Gemmil, B. International Institute of Tropical Agriculture, Ibadan
Kubiriba, J., Tushemereirwe, W. & Karamura, E.B. (1997) Distribution of Banana streak virus(BSV) in Uganda, MusAfrica No. 11: 17.
Techi, L. I, Smith, A. M., Maule, A.J. and Leegood, R.C. (1995) Physiological studies of a viralmosaic infection, Aspects of Applied Biology, 42: 133-140.
Watson, G.W. & Chandler, L.R. (2000) Identification of mealybugs important in the Caribbeanregion. Second edition (revised). Commonwealth Science Council and CAB International,Wallingford, UK. 40 pp.
Za0365 FTR: Annex 5. Focus group discussions draft report.
1
FARMER KNOWLEDGE AND PERCEPTIONS OF BANANA STREAK VIRUSON EAST AFRICAN HIGHLAN BANANAS IN VILLAGES WITHRELATIVELY HIGH BSV INCIDENCE IN SOUTHWESTERN UGANDA.
SCIENTISTS: NGAMBEKI D., KUBIRIBA J., MUREKEZI C., RAGAMA P ANDLAMBOLL R.PARTNERS: NARO, IITA, NRI AND UNIVERSITY OF READINGFUNDING: DFID
INTRODUCTION
Banana is a very important dual-purpose crop as source of food and farm cash incomeproviding for 65% of the calorific intake for the population in Uganda (Dept. of Statistics 1998).Banana is also the leading crop in the country, occupying 31% of the total national croppedland, followed by millet (8%), cassava (8%) and sweet potatoes (5%) (Dept. of Statistics1996). Banana, being a perennial crop, has an advantage over annual crops such as millet andmaize because it does not require regular rains for germination of seed. Its canopy providesshade and permanent ground cover making the crop environmentally friendly.
In terms of food tastes and preferences, banana is the most preferred single food security cropin central and western Uganda. Banana is even referred to as “food” in the language of centralUganda. However, in the last 30 years, banana productivity has been declining due to bioticand abiotic constraints such as banana weevils, nematodes, Sigatoka diseases, exhausted soilfertility and socio-economic factors (Gold et al., 1993).
A baseline study of disease caused by Banana streak virus (BSV) using focus groupdiscussions was undertaken in two major banana-producing districts of Masaka and Ntungamoin south-western Uganda respectively. The general objective of the baseline survey was toassess farmers’ perception and knowledge of BSV, together with other biotic and abioticconstraints, which reduce banana yields, and to identify farmers’ preferred control measures forBSV in the study areas.
The specific objectives of this study were:
• To assess farmers’ knowledge and perceptions of symptoms and causes of BSV and otherrelated constraints that reduce banana yields.
• To determine the management practices being used by farmers to reduce the effects of thedisease on banana yields.
• To identify farmers’ knowledge gaps in their interpretations of the symptoms and causes ofBSV.
The research was conducted in two parts: Part one dealt with Farmers’ Focus Groupdiscussions whose results are presented in this report. Parts two dealt with individualhouseholds/group farmers’ interviews, the results of which are presented in the BSV baselinesocio-economic survey report.
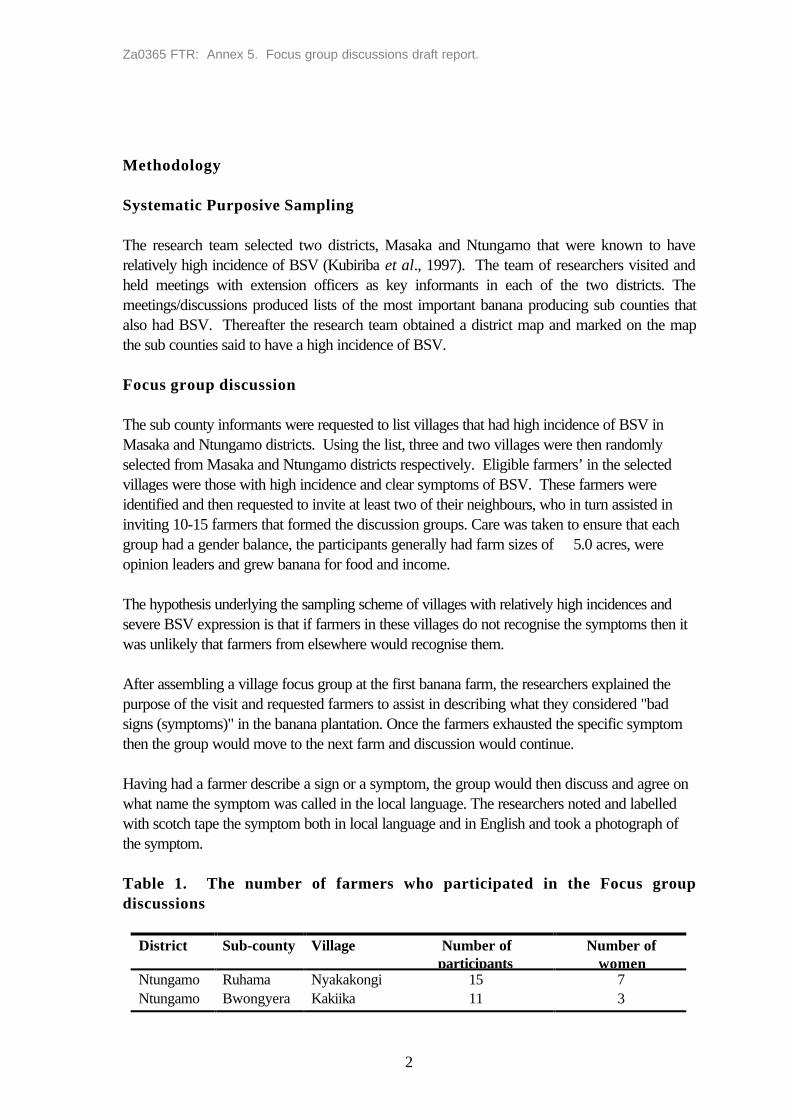
Za0365 FTR: Annex 5. Focus group discussions draft report.
2
Methodology
Systematic Purposive Sampling
The research team selected two districts, Masaka and Ntungamo that were known to haverelatively high incidence of BSV (Kubiriba et al., 1997). The team of researchers visited andheld meetings with extension officers as key informants in each of the two districts. Themeetings/discussions produced lists of the most important banana producing sub counties thatalso had BSV. Thereafter the research team obtained a district map and marked on the mapthe sub counties said to have a high incidence of BSV.
Focus group discussion
The sub county informants were requested to list villages that had high incidence of BSV inMasaka and Ntungamo districts. Using the list, three and two villages were then randomlyselected from Masaka and Ntungamo districts respectively. Eligible farmers’ in the selectedvillages were those with high incidence and clear symptoms of BSV. These farmers wereidentified and then requested to invite at least two of their neighbours, who in turn assisted ininviting 10-15 farmers that formed the discussion groups. Care was taken to ensure that eachgroup had a gender balance, the participants generally had farm sizes of � 5.0 acres, wereopinion leaders and grew banana for food and income.
The hypothesis underlying the sampling scheme of villages with relatively high incidences andsevere BSV expression is that if farmers in these villages do not recognise the symptoms then itwas unlikely that farmers from elsewhere would recognise them.
After assembling a village focus group at the first banana farm, the researchers explained thepurpose of the visit and requested farmers to assist in describing what they considered "badsigns (symptoms)" in the banana plantation. Once the farmers exhausted the specific symptomthen the group would move to the next farm and discussion would continue.
Having had a farmer describe a sign or a symptom, the group would then discuss and agree onwhat name the symptom was called in the local language. The researchers noted and labelledwith scotch tape the symptom both in local language and in English and took a photograph ofthe symptom.
Table 1. The number of farmers who participated in the Focus groupdiscussions
District Sub-county Village Number ofparticipants
Number ofwomen
Ntungamo Ruhama Nyakakongi 15 7Ntungamo Bwongyera Kakiika 11 3
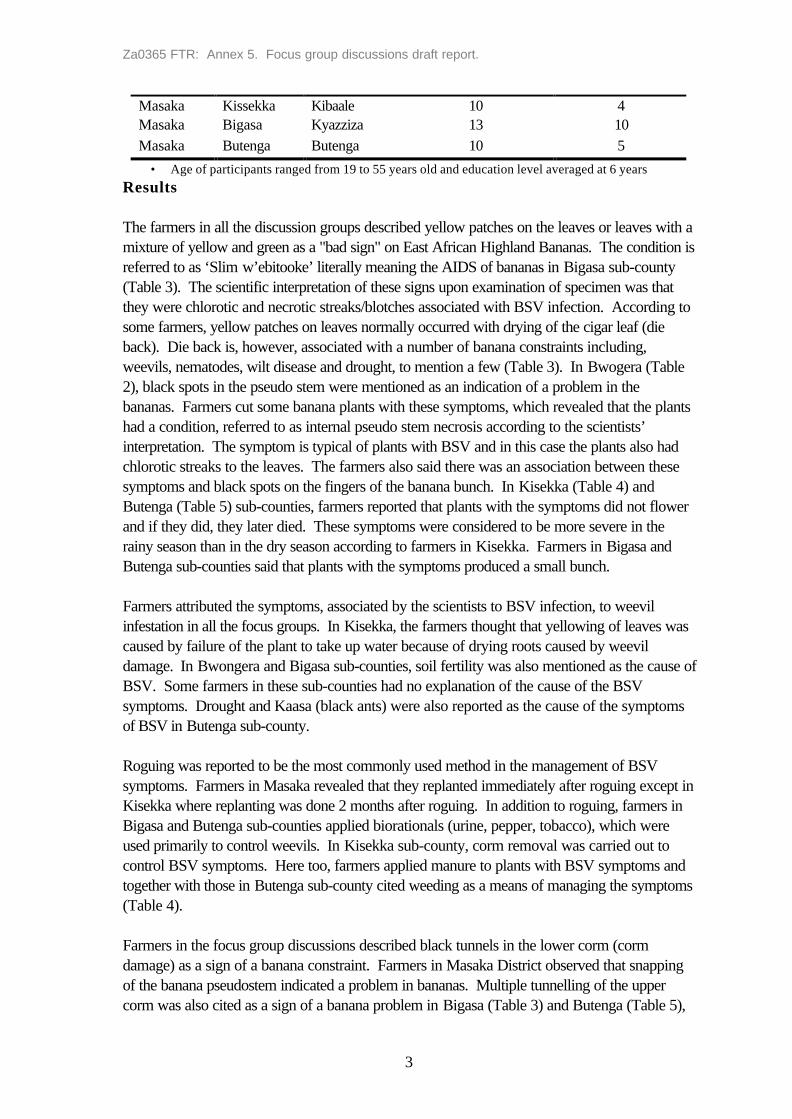
Za0365 FTR: Annex 5. Focus group discussions draft report.
3
Masaka Kissekka Kibaale 10 4Masaka Bigasa Kyazziza 13 10Masaka Butenga Butenga 10 5
• Age of participants ranged from 19 to 55 years old and education level averaged at 6 yearsResults
The farmers in all the discussion groups described yellow patches on the leaves or leaves with amixture of yellow and green as a "bad sign" on East African Highland Bananas. The condition isreferred to as ‘Slim w’ebitooke’ literally meaning the AIDS of bananas in Bigasa sub-county(Table 3). The scientific interpretation of these signs upon examination of specimen was thatthey were chlorotic and necrotic streaks/blotches associated with BSV infection. According tosome farmers, yellow patches on leaves normally occurred with drying of the cigar leaf (dieback). Die back is, however, associated with a number of banana constraints including,weevils, nematodes, wilt disease and drought, to mention a few (Table 3). In Bwogera (Table2), black spots in the pseudo stem were mentioned as an indication of a problem in thebananas. Farmers cut some banana plants with these symptoms, which revealed that the plantshad a condition, referred to as internal pseudo stem necrosis according to the scientists’interpretation. The symptom is typical of plants with BSV and in this case the plants also hadchlorotic streaks to the leaves. The farmers also said there was an association between thesesymptoms and black spots on the fingers of the banana bunch. In Kisekka (Table 4) andButenga (Table 5) sub-counties, farmers reported that plants with the symptoms did not flowerand if they did, they later died. These symptoms were considered to be more severe in therainy season than in the dry season according to farmers in Kisekka. Farmers in Bigasa andButenga sub-counties said that plants with the symptoms produced a small bunch.
Farmers attributed the symptoms, associated by the scientists to BSV infection, to weevilinfestation in all the focus groups. In Kisekka, the farmers thought that yellowing of leaves wascaused by failure of the plant to take up water because of drying roots caused by weevildamage. In Bwongera and Bigasa sub-counties, soil fertility was also mentioned as the cause ofBSV. Some farmers in these sub-counties had no explanation of the cause of the BSVsymptoms. Drought and Kaasa (black ants) were also reported as the cause of the symptomsof BSV in Butenga sub-county.
Roguing was reported to be the most commonly used method in the management of BSVsymptoms. Farmers in Masaka revealed that they replanted immediately after roguing except inKisekka where replanting was done 2 months after roguing. In addition to roguing, farmers inBigasa and Butenga sub-counties applied biorationals (urine, pepper, tobacco), which wereused primarily to control weevils. In Kisekka sub-county, corm removal was carried out tocontrol BSV symptoms. Here too, farmers applied manure to plants with BSV symptoms andtogether with those in Butenga sub-county cited weeding as a means of managing the symptoms(Table 4).
Farmers in the focus group discussions described black tunnels in the lower corm (cormdamage) as a sign of a banana constraint. Farmers in Masaka District observed that snappingof the banana pseudostem indicated a problem in bananas. Multiple tunnelling of the uppercorm was also cited as a sign of a banana problem in Bigasa (Table 3) and Butenga (Table 5),
Za0365 FTR: Annex 5. Focus group discussions draft report.
4
while rotting of the shoot was also considered as a sign of banana weevil infestation in Bigasa(Table 3). In Kisekka (Table 4), it was reported that bananas with these symptoms would notflower or if they did gave small bunches. These signs were correctly attributed to weevils. Whilefarmers clearly differentiated between the adult and larvae stages of weevils, they had variedviews on which stage caused damage to bananas. They reported that the adult weevil causedtunnelling of the corm while snapping and damage to the shoot were attributed to larvae.
Cultural management practices (pseudostem trapping, removal of the corm of harvested plants,de-trashing, applying ash, tobacco, urine and pepper) were widely used to reduce weevilinfestation. In Kisekka (Table 4), farmers mentioned that they applied carbofuran (Furadan) forthe control of weevils.
Yellowing and drying of leaves in Bogoya (Gros Michel), Kayinja (Pisang awak) and Ndizi(Apple banana) were mentioned as a sign of a serious constraint in Ruhama (Table 1), Bigasa(Table 3) and Kisekka (Table 4). The scientists interpreted the symptoms to be those ofFusarium wilt upon the observation of a specimen. Some farmers in the areas who describedthe signs associated them with a condition referred to as “Todula” but were not aware of thecause. However, some farmers attributed the symptoms to drought (Table 1) and weevils(Tables 3 and 4). Farmers generally had no idea of how to manage the disease. Those inBigasa (Table 3), however, rogued infected plants while in Kisekka (Table 4) farmers roguedand cut infected plants.
Some farmers also described rotting of roots (Tables 3 and 4), toppling and drying resulting insmall bunches (Table 3) as signs of a constraint in bananas. The examination of the rootsrevealed that the symptoms were a result of nematode infestation by the scientists. The farmersreported that weevils, black ants, and high mat were the primary causes of these symptoms.Pseudostem trapping, de-trashing and earthing-up were identified as ways of managing theconstraint.
White insects found on banana, pineapples and sugarcane were referred to as constraints tobanana only in Butenga, Masaka (Table 5). But the farmers did not know the cause of theseconstraints nor were control measures for these insects known. The insects were identified asmealybugs on examination.
Several signs, namely, failure to fruit and death (Table 1), die-back (Tables 3 and 5) and smallbunches were considered as those of constraints in bananas. Weevils, high mat, dry roots andsoil infertility were mentioned as causes of these signs. The symptoms could be due to any oneor combination of, nematodes, weevils, poor nutrition, moisture stress and disease from ascientific point of view. Management options known to farmers to counter the constraints wereweed control, loosening of soil, application of ash and manure and removal of dry sheath to thebase of the pseudo stem.
Discussion
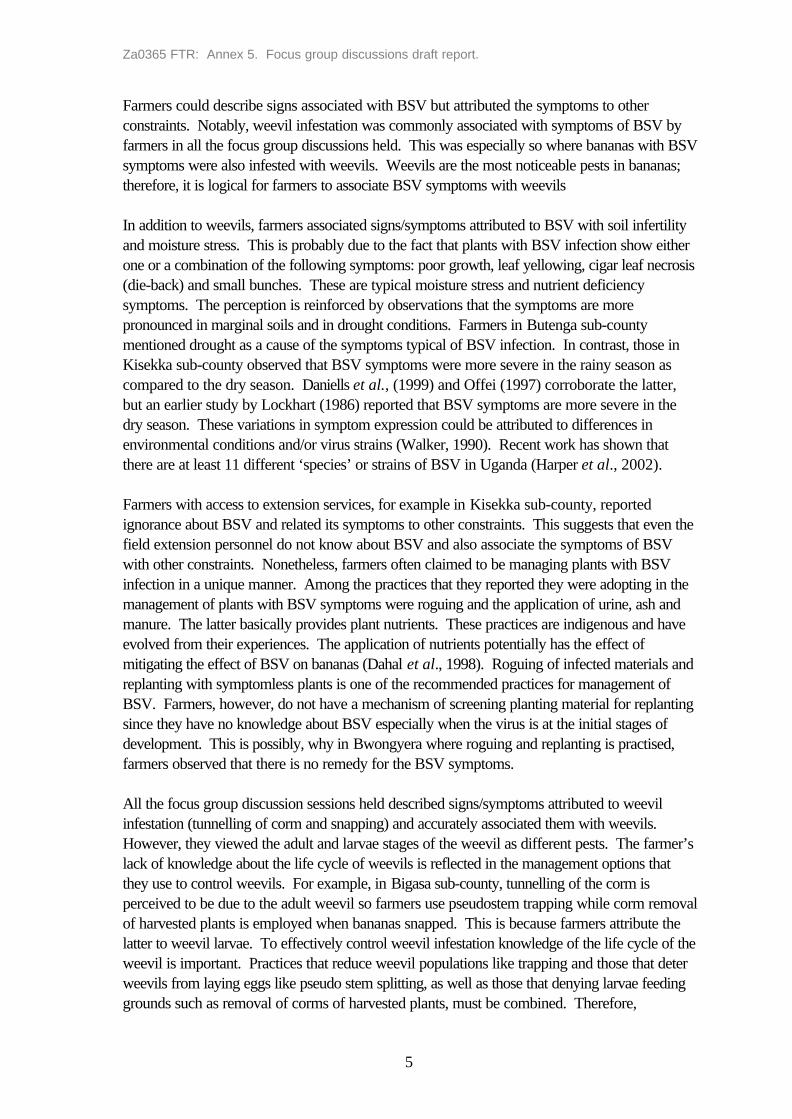
Za0365 FTR: Annex 5. Focus group discussions draft report.
5
Farmers could describe signs associated with BSV but attributed the symptoms to otherconstraints. Notably, weevil infestation was commonly associated with symptoms of BSV byfarmers in all the focus group discussions held. This was especially so where bananas with BSVsymptoms were also infested with weevils. Weevils are the most noticeable pests in bananas;therefore, it is logical for farmers to associate BSV symptoms with weevils
In addition to weevils, farmers associated signs/symptoms attributed to BSV with soil infertilityand moisture stress. This is probably due to the fact that plants with BSV infection show eitherone or a combination of the following symptoms: poor growth, leaf yellowing, cigar leaf necrosis(die-back) and small bunches. These are typical moisture stress and nutrient deficiencysymptoms. The perception is reinforced by observations that the symptoms are morepronounced in marginal soils and in drought conditions. Farmers in Butenga sub-countymentioned drought as a cause of the symptoms typical of BSV infection. In contrast, those inKisekka sub-county observed that BSV symptoms were more severe in the rainy season ascompared to the dry season. Daniells et al., (1999) and Offei (1997) corroborate the latter,but an earlier study by Lockhart (1986) reported that BSV symptoms are more severe in thedry season. These variations in symptom expression could be attributed to differences inenvironmental conditions and/or virus strains (Walker, 1990). Recent work has shown thatthere are at least 11 different ‘species’ or strains of BSV in Uganda (Harper et al., 2002).
Farmers with access to extension services, for example in Kisekka sub-county, reportedignorance about BSV and related its symptoms to other constraints. This suggests that even thefield extension personnel do not know about BSV and also associate the symptoms of BSVwith other constraints. Nonetheless, farmers often claimed to be managing plants with BSVinfection in a unique manner. Among the practices that they reported they were adopting in themanagement of plants with BSV symptoms were roguing and the application of urine, ash andmanure. The latter basically provides plant nutrients. These practices are indigenous and haveevolved from their experiences. The application of nutrients potentially has the effect ofmitigating the effect of BSV on bananas (Dahal et al., 1998). Roguing of infected materials andreplanting with symptomless plants is one of the recommended practices for management ofBSV. Farmers, however, do not have a mechanism of screening planting material for replantingsince they have no knowledge about BSV especially when the virus is at the initial stages ofdevelopment. This is possibly, why in Bwongyera where roguing and replanting is practised,farmers observed that there is no remedy for the BSV symptoms.
All the focus group discussion sessions held described signs/symptoms attributed to weevilinfestation (tunnelling of corm and snapping) and accurately associated them with weevils.However, they viewed the adult and larvae stages of the weevil as different pests. The farmer’slack of knowledge about the life cycle of weevils is reflected in the management options thatthey use to control weevils. For example, in Bigasa sub-county, tunnelling of the corm isperceived to be due to the adult weevil so farmers use pseudostem trapping while corm removalof harvested plants is employed when bananas snapped. This is because farmers attribute thelatter to weevil larvae. To effectively control weevil infestation knowledge of the life cycle of theweevil is important. Practices that reduce weevil populations like trapping and those that deterweevils from laying eggs like pseudo stem splitting, as well as those that denying larvae feedinggrounds such as removal of corms of harvested plants, must be combined. Therefore,

Za0365 FTR: Annex 5. Focus group discussions draft report.
6
dissemination of the cultural control practices, popular with farmers due to their low cost, couldbe more beneficial to farmers if it includes other information such as on the life cycle of theweevil; more so if this information relates to the control measures. To manage weevils, farmerscommonly use a concoction of animal urine, ash, pepper and tobacco. It is only in Kisekkasub-county that farmers mentioned that they used carbofuran (Furadan) to control weevils. Thisis probably because they have access to information through the extension service. However,use of insecticide is limited due to its prohibitively high cost.
Focus group discussions held in Masaka revealed that farmers associate signs of nematodedamage (root necrosis and toppling) with those attributed to weevils. Nematode infestation hasbeen reported as a major constraint of bananas in Masaka (Gold et al., 1993) and farmersconsistently mentioned the signs/symptoms that are generally attributed to nematodes. Inaddition to weevils, farmers in Kisekka sub-county associated nematode infestation withearthworms that they have adopted for nematodes. They are unable to visualise themicroscopic nature of nematodes and therefore perceive nematodes as macroscopic wormsfound in the rhizosphere of the banana plant. As such, farmers use practices for themanagement of weevils to target nematodes as well. In addition, farmers in Bigasa sub-countyreported that earthing-up was a measure used to manage signs due to nematodes because “highmat” was perceived as a cause of the problem. Not only do farmers carry out ineffectivemeasures to control nematodes, they also carry out practices such as intercropping bananaswith beans, which is known to favour nematode build-up in bananas. Beans are an alternativehost for some nematodes and a bean intercrop will increase nematode populations in bananas(Namaganda et al. 2000). The absence of reports about signs of nematode infestation inNtungamo is attributed to the fact that the district generally has a low incidence of nematodedamage. Studies done in the district have reported that it has low populations of burrowingnematodes that are responsible for nematode damage (Okech et al., 2000).
Signs of Fusarium (Panama) wilt were accurately described but were also associated withweevil damage in Masaka and drought in Ntungamo. Several farmers in both districts termed itas an unknown disease of Pisang awak, Gros Michel and Apple bananas. The association ofFusarium wilt to drought is due its similarity to moisture stress symptoms. It is related to weevilsbecause plants with Fusarium wilt are usually also infested with weevils. However, Fusariumwilt is the only constraint that farmers do not manage with weevil control measures despite thefact that it is attributed to weevils. The management option of choice for the farmers is roguing.This is due to the devastating nature of the disease. Through experience farmers have learnt thatit takes only one infected plant to destroy a whole plantation and therefore infected plants arebest rogued quickly. Pisang awak is used for brewing banana wine or gin and Gros Michel andApple bananas are dessert bananas. These bananas are a cash crop for the farmers and theirlivelihoods depends on them. The devastating nature of Fusarium wilt has earned it the name“Todula”, literally meaning do not brag. This is in reference to the fact that once the diseaseattacks a farmer’s plantation he is left without a source of income and a livelihood. Fortunately,several cultivars that are resistant to Fusarium have been tested (Tushemereirwe, et al. 2000)and are available at Research Stations. However, the focus group discussions revealed thatlittle information about Fusarium and its control is available to the farmers.
Za0365 FTR: Annex 5. Focus group discussions draft report.
7
Conclusion
Generally, farmers were aware of the signs of constraints limiting banana production. However,they found it hard to clearly associate causes to signs/symptoms. Farmers described symptomsof BSV, Fusarium wilt and nematodes as causing crop loss, but their symptoms were attributedto other constraints. The only farmers’ descriptive symptoms that were in agreement withscientists’ interpretations are those of weevil infestation.
Farmers said symptoms attributed to BSV by scientists caused poor growth and small bunches.According to the farmers the symptoms were mainly caused by weevils and also by drought andsoil infertility. As a result most of the practices used by farmers to manage BSV symptomsinstead targeted weevils and soil infertility. Although these management practices do not targetBSV, they may mitigate the symptoms since the plants become less stressed by otherpests/diseases or become vigorous as a result of improved nutrition.
Misidentification or management of one constraint for another is understandable since they haveto be associated with what can be visualised to the problems encountered. BSV that is causedby virus, nematodes and Fusarium wilt that cannot easily visualised by farmers seem to be lessimportant and yet could be the major constraint to banana production. There is need for moredissemination of information regarding the symptoms/signs and management practices for BSV(and the other diseases/nematodes) for it to be managed more effectively.
Za0365 FTR: Annex 5. Focus group discussions draft report.
8
References
Agricultural planning Department (1996) Basic Agricultural planning Statistics
Daniells, J.W., Thomas, J.E. and Geering, A.D.W. (1999) Banana streak disease: Anillustrated field guide, Department of Primary Industries, Queensland, Information SeriesQ199018. 17p
Gold, C.S., Ogenga-Latigo, M.W., Tushemereirwe, W.K., Kashaija, I.N. and Nankinga, C.(1993) Farmer perceptions of banana pest constraints in Uganda: results from a rapidrural appraisal. In: Proceedings of a Research Coordination Meeting for Biologicaland Integrated Control of Highland Banana and Plantain Pest and Diseases.Cotonou, 12-14 November 1991, ed. C.S. Gold and B. Gemmil, pp. 3-24. IITA,Cotonou, Benin.
Harper, G., Hart, D., Moult, S., and Hull, R. (2002) Detection of Banana streak virus in fieldsamples of bananas from Uganda. Annals Of Applied Biology 141: 247-257.
Kubiriba J, Tushemereirwe W, Karamura E B. (1997) Distribution of Banana streak virus(BSV) in Uganda. MusAfrica No. 11:17.
Lockhart, B.E.L. (1986) Purification and serology of a bacilliform virus associated with bananastreak disease. Phytopathology 76: 995-999.
Namaganda, J.M., Gowen, S.R., Bridge, J., Karamura, E. & Namanya, P. (2000) Studies onhost range of the banana nematode, Pratylenchus goodeyi. In: Proceedings of theFirst International Conference on Banana and Plantain for Africa. Pp. 355-360.Craenen, K., Ortiz, R., Karamura, E.B. & Vuylsteke, D. (Eds.) . Publ. InternationalSociety of Horticultural Sciences, Leuven, Belgium.
Offei, S.K. (1997) Banana streak disease. Banana streak badnavirus training course,International Institute of Tropical Agriculture Ibadan, Nigeria, 1-5th September, 1997.
Okech, S.H.O., Gold, C.S., Ssali, H. & Karamura, E.B. (2000). Relationship between soilfertility, banana weevil and nematodes in the East African highland cooking banana inNtungamo, Southwestern Uganda. In: Proceedings of the First InternationalConference on Banana and Plantain for Africa. Pp. 355-360. Craenen, K., Ortiz,R., Karamura, E.B. & Vuylsteke, D. (Eds.) . Publ. International Society ofHorticultural Sciences, Leuven, Belgium.
Tushemereirwe, W.K., Kangire, A, Kubiriba, J. and Nowakunda, K. (2000). Fusarium wiltresistant bananas considered appropriate replacements for cultivars susceptible to thedisease in Uganda. Uganda Journal of Agricultural sciences 5(6):62-64.
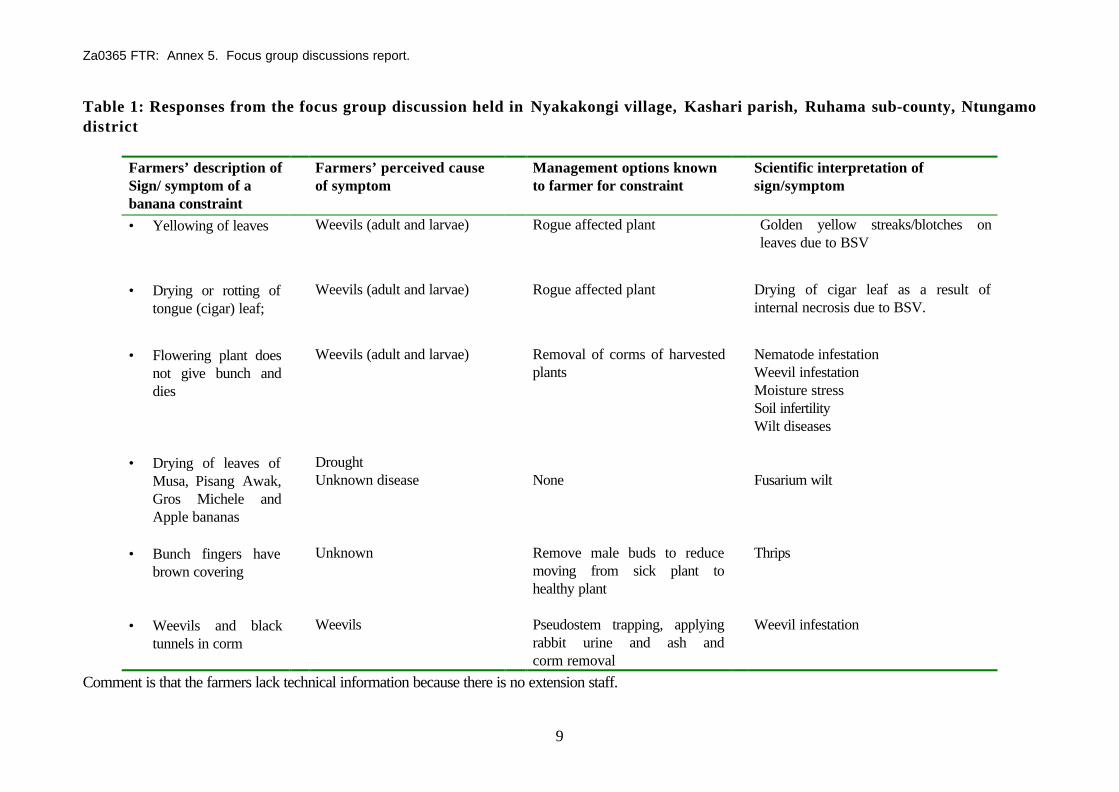
Za0365 FTR: Annex 5. Focus group discussions report.
9
Table 1: Responses from the focus group discussion held in Nyakakongi village, Kashari parish, Ruhama sub-county, Ntungamodistrict
Farmers’ description ofSign/ symptom of abanana constraint
Farmers’ perceived causeof symptom
Management options knownto farmer for constraint
Scientific interpretation ofsign/symptom
• Yellowing of leaves Weevils (adult and larvae) Rogue affected plant Golden yellow streaks/blotches onleaves due to BSV
• Drying or rotting oftongue (cigar) leaf;
Weevils (adult and larvae) Rogue affected plant Drying of cigar leaf as a result ofinternal necrosis due to BSV.
• Flowering plant doesnot give bunch anddies
Weevils (adult and larvae) Removal of corms of harvestedplants
Nematode infestationWeevil infestationMoisture stressSoil infertilityWilt diseases
• Drying of leaves ofMusa, Pisang Awak,Gros Michele andApple bananas
DroughtUnknown disease None Fusarium wilt
• Bunch fingers havebrown covering
Unknown Remove male buds to reducemoving from sick plant tohealthy plant
Thrips
• Weevils and blacktunnels in corm
Weevils Pseudostem trapping, applyingrabbit urine and ash andcorm removal
Weevil infestation
Comment is that the farmers lack technical information because there is no extension staff.
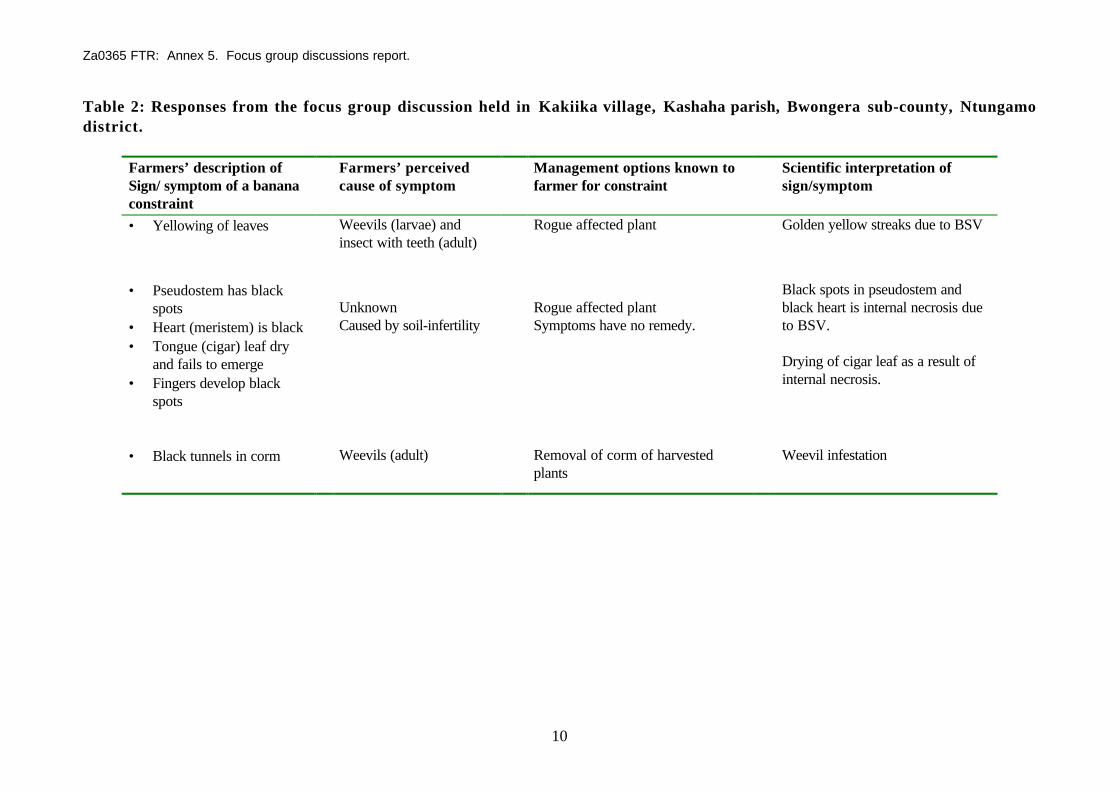
Za0365 FTR: Annex 5. Focus group discussions report.
10
Table 2: Responses from the focus group discussion held in Kakiika village, Kashaha parish, Bwongera sub-county, Ntungamodistrict.
Farmers’ description ofSign/ symptom of a bananaconstraint
Farmers’ perceivedcause of symptom
Management options known tofarmer for constraint
Scientific interpretation ofsign/symptom
• Yellowing of leaves Weevils (larvae) andinsect with teeth (adult)
Rogue affected plant Golden yellow streaks due to BSV
• Pseudostem has blackspots
• Heart (meristem) is black• Tongue (cigar) leaf dry
and fails to emerge• Fingers develop black
spots
UnknownCaused by soil-infertility
Rogue affected plantSymptoms have no remedy.
Black spots in pseudostem andblack heart is internal necrosis dueto BSV.
Drying of cigar leaf as a result ofinternal necrosis.
• Black tunnels in corm Weevils (adult) Removal of corm of harvestedplants
Weevil infestation
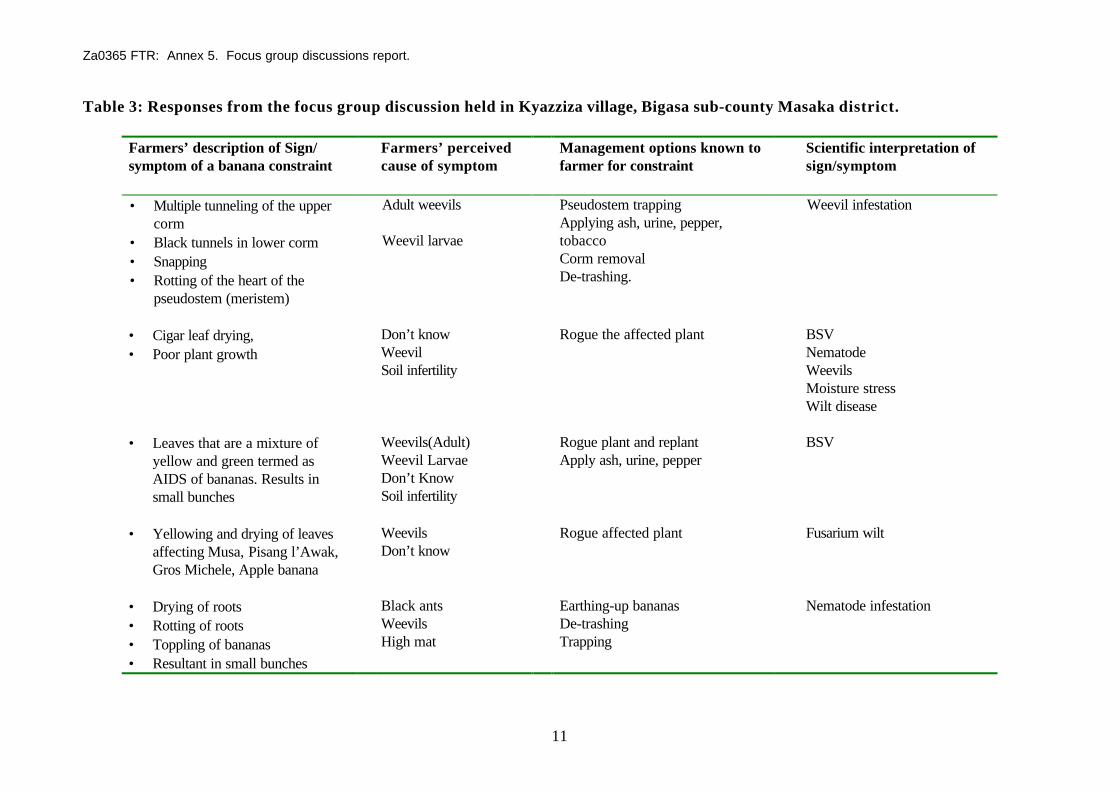
Za0365 FTR: Annex 5. Focus group discussions report.
11
Table 3: Responses from the focus group discussion held in Kyazziza village, Bigasa sub-county Masaka district.
Farmers’ description of Sign/symptom of a banana constraint
Farmers’ perceivedcause of symptom
Management options known tofarmer for constraint
Scientific interpretation ofsign/symptom
• Multiple tunneling of the uppercorm
• Black tunnels in lower corm• Snapping• Rotting of the heart of the
pseudostem (meristem)
Adult weevils
Weevil larvae
Pseudostem trappingApplying ash, urine, pepper,tobaccoCorm removalDe-trashing.
Weevil infestation
• Cigar leaf drying,• Poor plant growth
Don’t knowWeevilSoil infertility
Rogue the affected plant BSVNematodeWeevilsMoisture stressWilt disease
• Leaves that are a mixture ofyellow and green termed asAIDS of bananas. Results insmall bunches
Weevils(Adult)Weevil LarvaeDon’t KnowSoil infertility
Rogue plant and replantApply ash, urine, pepper
BSV
• Yellowing and drying of leavesaffecting Musa, Pisang l’Awak,Gros Michele, Apple banana
WeevilsDon’t know
Rogue affected plant Fusarium wilt
• Drying of roots• Rotting of roots• Toppling of bananas• Resultant in small bunches
Black antsWeevilsHigh mat
Earthing-up bananasDe-trashingTrapping
Nematode infestation
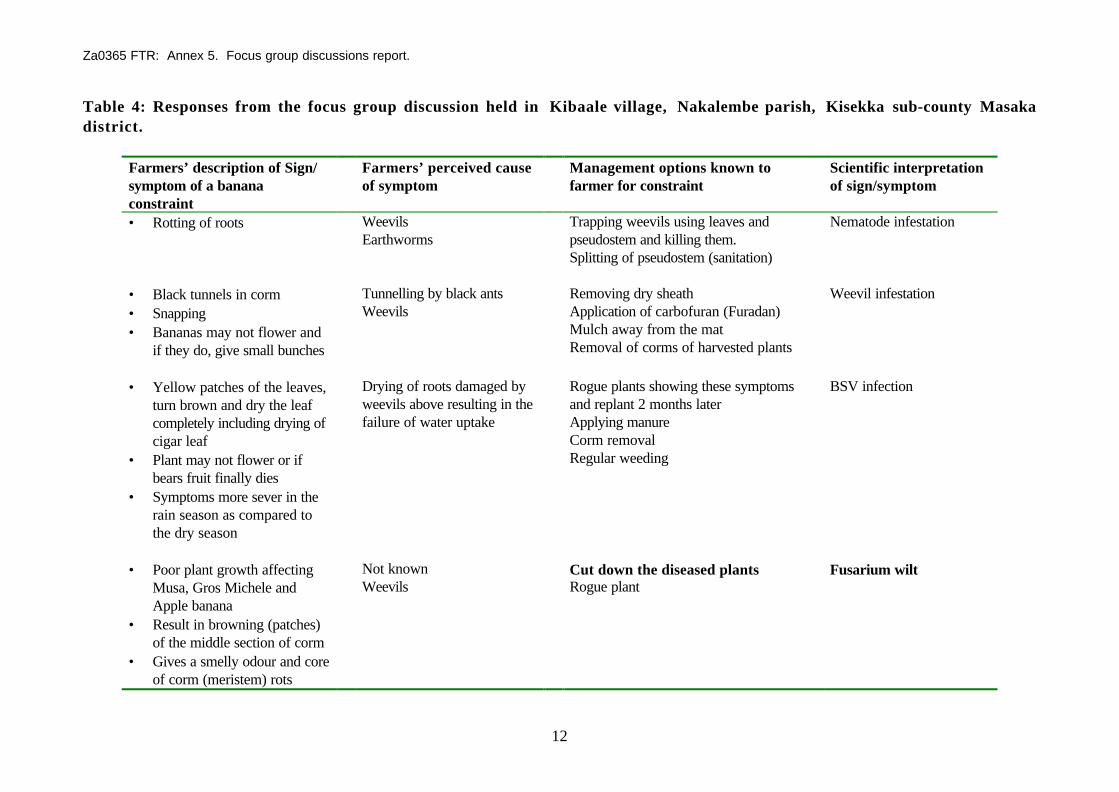
Za0365 FTR: Annex 5. Focus group discussions report.
12
Table 4: Responses from the focus group discussion held in Kibaale village, Nakalembe parish, Kisekka sub-county Masakadistrict.
Farmers’ description of Sign/symptom of a bananaconstraint
Farmers’ perceived causeof symptom
Management options known tofarmer for constraint
Scientific interpretationof sign/symptom
• Rotting of roots WeevilsEarthworms
Trapping weevils using leaves andpseudostem and killing them.Splitting of pseudostem (sanitation)
Nematode infestation
• Black tunnels in corm• Snapping• Bananas may not flower and
if they do, give small bunches
Tunnelling by black antsWeevils
Removing dry sheathApplication of carbofuran (Furadan)Mulch away from the matRemoval of corms of harvested plants
Weevil infestation
• Yellow patches of the leaves,turn brown and dry the leafcompletely including drying ofcigar leaf
• Plant may not flower or ifbears fruit finally dies
• Symptoms more sever in therain season as compared tothe dry season
Drying of roots damaged byweevils above resulting in thefailure of water uptake
Rogue plants showing these symptomsand replant 2 months laterApplying manureCorm removalRegular weeding
BSV infection
• Poor plant growth affectingMusa, Gros Michele andApple banana
• Result in browning (patches)of the middle section of corm
• Gives a smelly odour and coreof corm (meristem) rots
Not knownWeevils
Cut down the diseased plantsRogue plant
Fusarium wilt

Za0365 FTR: Annex 5. Focus group discussions report.
13
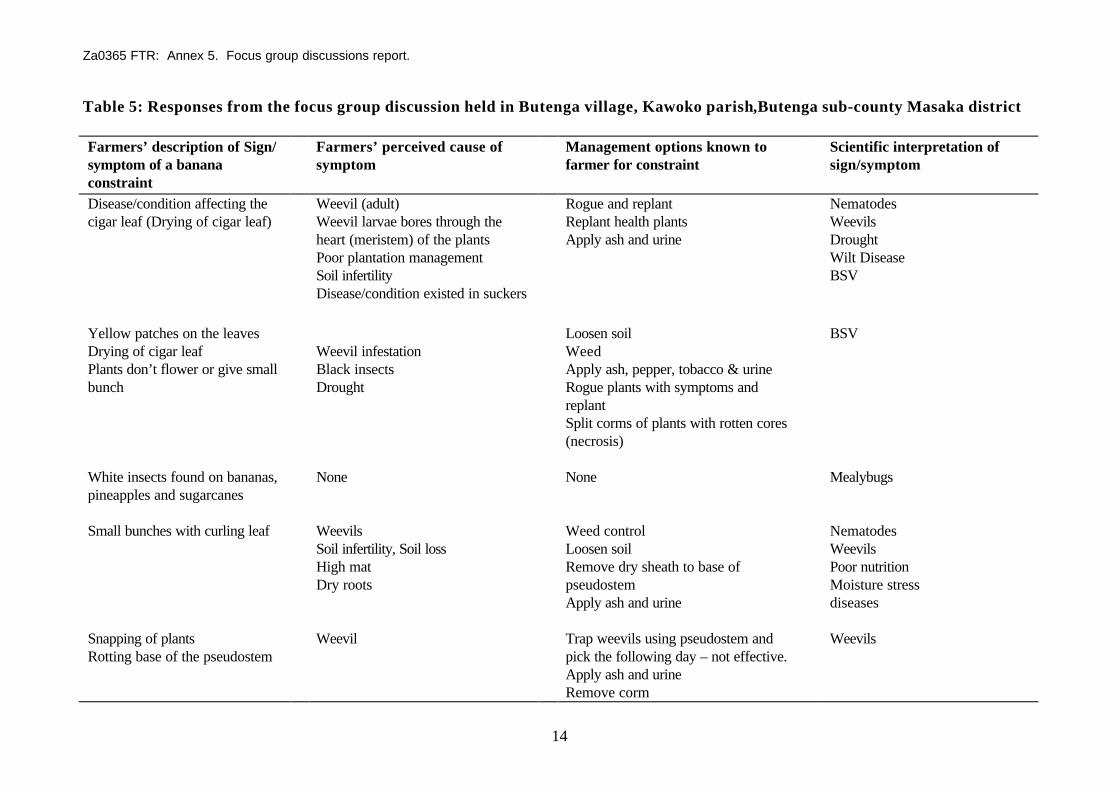
Za0365 FTR: Annex 5. Focus group discussions report.
14
Table 5: Responses from the focus group discussion held in Butenga village, Kawoko parish,Butenga sub-county Masaka district
Farmers’ description of Sign/symptom of a bananaconstraint
Farmers’ perceived cause ofsymptom
Management options known tofarmer for constraint
Scientific interpretation ofsign/symptom
Disease/condition affecting thecigar leaf (Drying of cigar leaf)
Weevil (adult)Weevil larvae bores through theheart (meristem) of the plantsPoor plantation managementSoil infertilityDisease/condition existed in suckers
Rogue and replantReplant health plantsApply ash and urine
NematodesWeevilsDroughtWilt DiseaseBSV
Yellow patches on the leavesDrying of cigar leafPlants don’t flower or give smallbunch
Weevil infestationBlack insectsDrought
Loosen soilWeedApply ash, pepper, tobacco & urineRogue plants with symptoms andreplantSplit corms of plants with rotten cores(necrosis)
BSV
White insects found on bananas,pineapples and sugarcanes
None None Mealybugs
Small bunches with curling leaf WeevilsSoil infertility, Soil lossHigh matDry roots
Weed controlLoosen soilRemove dry sheath to base ofpseudostemApply ash and urine
NematodesWeevilsPoor nutritionMoisture stressdiseases
Snapping of plantsRotting base of the pseudostem
Weevil Trap weevils using pseudostem andpick the following day – not effective.Apply ash and urineRemove corm
Weevils

Za0365 FTR: Annex 5. Focus group discussions report.
15
Table 6: Summary of responses from the focus group discussion
Farmers’ description of Sign/symptom of a bananaconstraint
Farmers’ perceived cause ofsymptom
Management options known tofarmer for constraint
Scientific interpretation ofsign/symptom
- Yellowing of leaves- Leaves have a mixture of
yellow and green termed asSlim w’ebitoke (AIDS ofbananas) dies back
- Yellow patches on leavesturn brown and dry leafcompletely, plant may givesmall bunch, not flower orbear bunch.
- Symptoms more severe inrain season as compared todry season
- Pseudostem has black spots- Fingers develop black spots
- Weevils (adult and larvae)- Soil infertility- Drying of roots damaged by
weevils resulting in the failure ofwater uptake
- Black ants- Drought- Do not know
- Rogue affected plant- Roguing plants showing symptoms
and replanting two months after.- Apply manure, ash, urine and
pepper- Symptoms have no remedy- Corm removal- Regular weeding- Loosen soil- Split corms of rotten cores (internal
necrosis of pseudostem)
BSV infection
- Rotting of the heart ofpseudostem (meristem)
- Poor plant growth- Tongue (cigar) leaf dries- Flowering plant does not give
bunch and dies- Small bunches with curling
leaf
- Weevil larvae- Weevil adult- Soil infertility- Poor plantation management- Disease/condition existed in
suckers- High mat- Dry roots
- Rogue affected plants and replantwith healthy plants
- Apply ash and urine- Weed control- Loosen soil- Remove dry sheaths to base of
pseudostem
- BSV infection- Nematode infestation- Weevil infestation- Soil infertility- Drought/moisture stress- Wilt disease
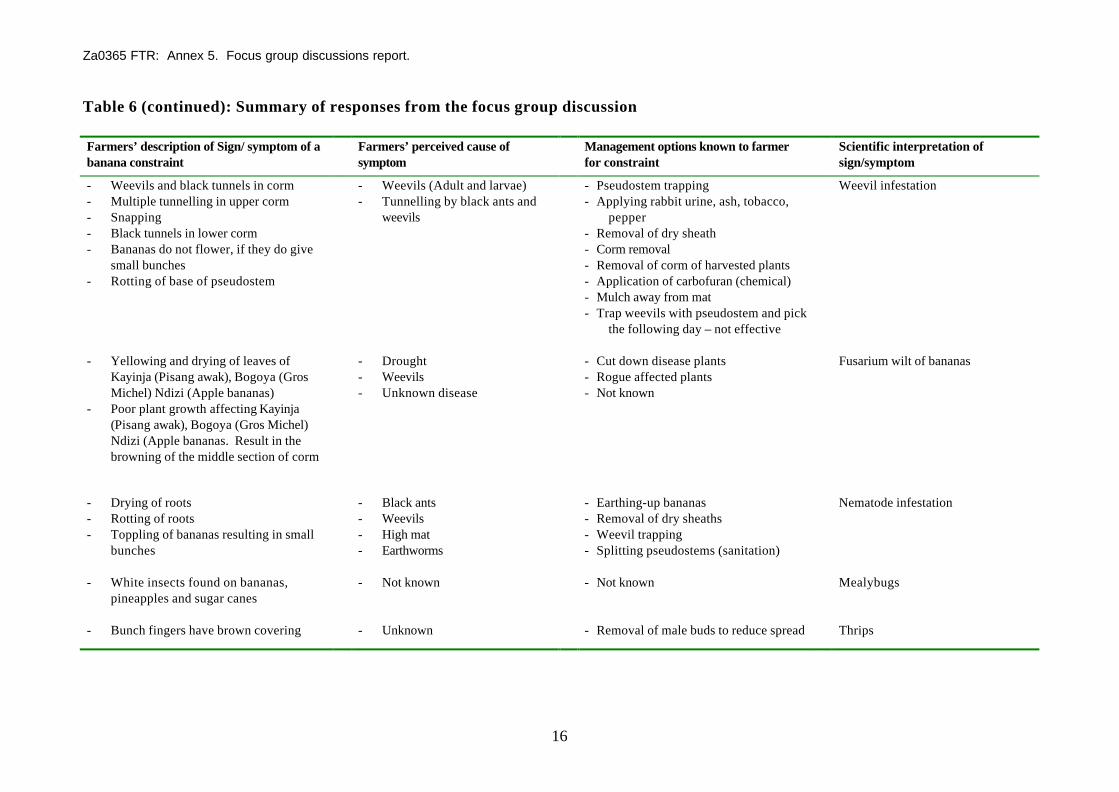
Za0365 FTR: Annex 5. Focus group discussions report.
16
Table 6 (continued): Summary of responses from the focus group discussion
Farmers’ description of Sign/ symptom of abanana constraint
Farmers’ perceived cause ofsymptom
Management options known to farmerfor constraint
Scientific interpretation ofsign/symptom
- Weevils and black tunnels in corm- Multiple tunnelling in upper corm- Snapping- Black tunnels in lower corm- Bananas do not flower, if they do give
small bunches- Rotting of base of pseudostem
- Weevils (Adult and larvae)- Tunnelling by black ants and
weevils
- Pseudostem trapping- Applying rabbit urine, ash, tobacco,
pepper- Removal of dry sheath- Corm removal- Removal of corm of harvested plants- Application of carbofuran (chemical)- Mulch away from mat- Trap weevils with pseudostem and pick
the following day – not effective
Weevil infestation
- Yellowing and drying of leaves ofKayinja (Pisang awak), Bogoya (GrosMichel) Ndizi (Apple bananas)
- Poor plant growth affecting Kayinja(Pisang awak), Bogoya (Gros Michel)Ndizi (Apple bananas. Result in thebrowning of the middle section of corm
- Drought- Weevils- Unknown disease
- Cut down disease plants- Rogue affected plants- Not known
Fusarium wilt of bananas
- Drying of roots- Rotting of roots- Toppling of bananas resulting in small
bunches
- Black ants- Weevils- High mat- Earthworms
- Earthing-up bananas- Removal of dry sheaths- Weevil trapping- Splitting pseudostems (sanitation)
Nematode infestation
- White insects found on bananas,pineapples and sugar canes
- Not known - Not known Mealybugs
- Bunch fingers have brown covering - Unknown - Removal of male buds to reduce spread Thrips

Za0365 FTR: Annex 5. Focus group discussions report.
1
Za0365 FTR: Annex 6. Draft baseline survey report.
1
BASELINE SURVEY REPORT: BANANA STREAK VIRUS ON EAST AFRICANHIGHLAND BANANAS IN SOUTH AND WESTERN UGANDA
INTRODUCTION
Banana is the most important single food security crop grown by the majority of small scale
/resource poor farmers in central, eastern and western regions of Uganda (MAAIF, 1999).
Uganda is the leading banana producer in Africa. In 1989, Uganda produced 44% of the total
production in East Africa and 24% of the total production in Africa (FAO, 1990). Studies from a
diagnostic survey (Rubaihayo, 1993) indicated that most (65%) of the farmers in the banana
producing districts of Uganda ranked bananas as their number one or two preferred food crops.
Other studies have shown that 72% of the farmers in central, eastern and western regions of
Uganda allocated 40% of their farmland to growing bananas (Ngambeki et al., 1992).
However, in Uganda most bananas are consumed locally, with per capita consumption of 300-
500kg/year of edible portion (Ngambeki et al., 1992, Adupa et al., 1993). At the national level,
it has been shown that cooking banana (matoke) is the leading staple food consumed on an
average making 8.67% of the staple consumed per household, per month (integrated household
survey 1993). This level of banana consumption is followed by cassava at 6.22%, sweet
potatoes 5.64%, maize 4.79% and millet 3.7%.
The point price elasticities of demand for bananas in Uganda were estimated to be –0.11 to –
0.13 for urban consumers (Adupa, 1993). In addition, income demand elasticities of major
staple foods were estimated for millet 0.10, cassava 0.13, bananas 0.16 and maize 0.2 (Vanegas,
1990). Both price elasticities of demand and income demand elasticities of bananas suggest a)
that 10% increase in price of bananas will reduce the demand of bananas by a very small margin
of only 1 to 1.3%. b) That 10% change in the levels of income in urban centres will change the
demand for bananas by 1.6%. This implies that bananas is regarded an essential consumer food
and that quantities demanded remains stable irrespective of fluctuations in market prices and/ or
changes in the levels of income.
Za0365 FTR: Annex 6. Draft baseline survey report.
2
Although bananas are very important and have been grown in Uganda for over 100 years
(Simmonds, 1996), yields have steadily declined since the 1970s, while the area under production
increased (MAAIF, 1999). The yield decline has been attributed to a number of factors including
pests, diseases, declining soil fertility and socio-economic problems, among others (Gold et al.,
1993). Banana streak virus is part of the disease complex that limits banana production but its
importance has only been recognised recently (Tushemereirwe et al., 1996). It is therefore
important to find out the perceptions of farmers about the disease in terms of cause, symptom
description and farmers’ preferred management practices. This then could be the basis for the
development of management practices that form part and parcel of the farmers’ social set up and
therefore be more acceptable to them.
Objectives of the study
The study aimed at:
(a) Assessing farmers knowledge or/and perception of BSV in relation to banana production
(b) Determine the management practices being used by farmers to manage the disease.
The area of study
The research team selected three districts (Masaka, Ntungamo and Rakai) in southern and
western Uganda that were identified as having high Banana streak virus incidence (Kubiriba et
al., 1997). Masaka district is located in the Lake Victoria crescent agro-ecological zone, within
longitude 31 0 E to 32 0 E and latitude 0 0 S to 0.35 0 S. it has an altitude of about 1200m.a.s.l.
with moderate temperatures and a bimodal rainfall pattern (March-May and September-
November). The main economic activities are agricultural, focussing on growing perennial crops
such as bananas and coffee followed by annual crops including sweet potatoes beans and maize.
It has a population of about one million people.
Rakai district is adjacent to Masaka, located in the southern-dry-land agro-ecological zone within
longitude 310E to 310 40‘E and latitude 00 00’S and 10 00’S. It has an altitude of about
1200m.a.s.l. with high temperatures and bimodal rainfall similar to Masaka. Its main economic
Za0365 FTR: Annex 6. Draft baseline survey report.
3
activities are agriculture focussing on bananas, coffee, finger millet, maize, beans and sweet
potatoes. It has a population of about 0.5 million people.
Ntungamo district is located in the southern dry land agro-ecological zone within longitude
30000’E and 30032’E and latitude 0030’S and 1030’S with an altitude of about 1500 m.a.s.l. It
has moderate temperatures and a bimodal rainfall similar to Masaka and Rakai. Its main
economic activities are agriculture focussing on growing bananas, sweet potatoes, finger millet and
livestock keeping.
SAMPLING METHODOLOGY
The research team visited and held meetings with the extension officers as key informants in each
of the three districts. The team was informed on the general banana farming over the districts and
possible distribution of BSV within the sub counties. A multistage random sampling scheme was
used to sample farmers for interview and sampling for BSV. Stratification was based on
administrative units. Using the sub-county as a main basis for stratification, each district was
divided into areas or sub counties having predominantly banana based farming systems. The sub
counties were then sub-divided into parishes and then parishes into villages. The sub counties that
had high and low incidence of Banana streak virus were identified. Using stratified, systematic
and purposive sampling procedures, about 36, 39 and 69% of sub-counties of Rakai, Masaka
and Ntungamo districts respectively were selected for the study.
At the selected sub county headquarters, the team was informed of parishes with bananas and
those without. Similarly, an indication of BSV level was communicated to the team. On this basis
two parishes were systematically selected such that they do not border each other. Again on
similar basis two villages were selected in each of the selected parishes. In each village candidate
farmers were those who had more than one acre of banana plantation with BSV symptoms. Lists
of such farms were prepared with the help of extension staff and the key informant in the selected
villages. A farmer was then randomly selected to represent each village for the baseline survey.
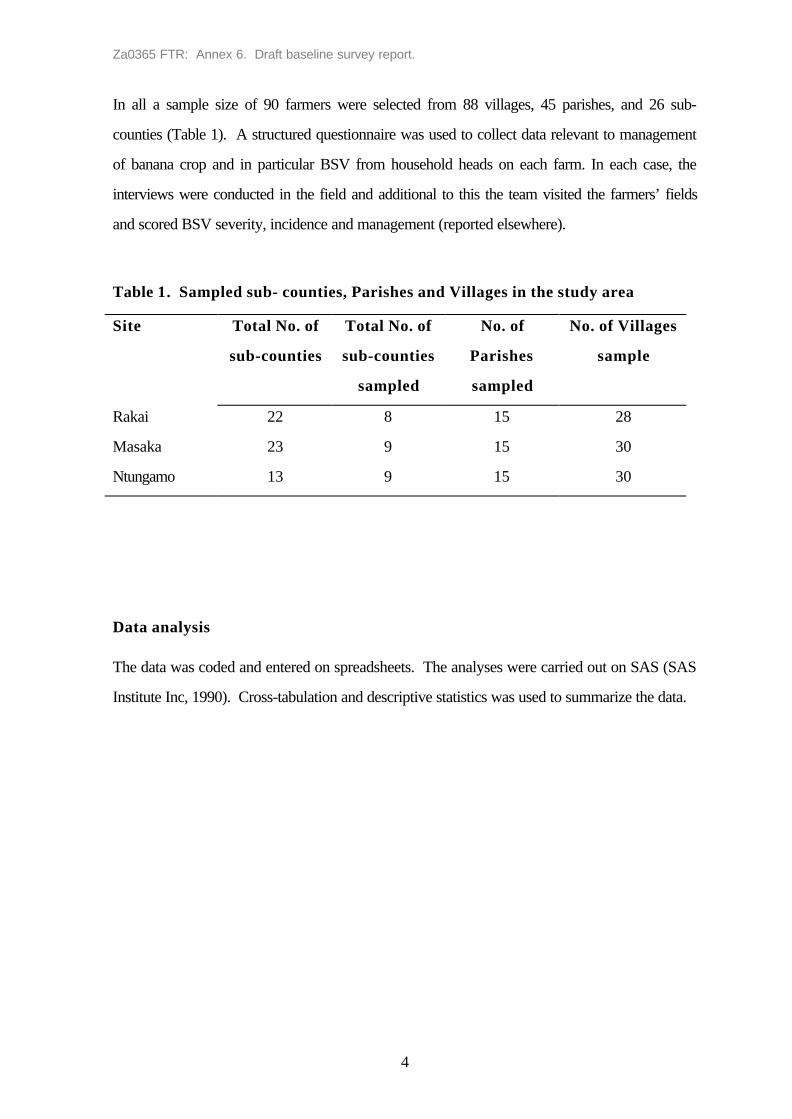
Za0365 FTR: Annex 6. Draft baseline survey report.
4
In all a sample size of 90 farmers were selected from 88 villages, 45 parishes, and 26 sub-
counties (Table 1). A structured questionnaire was used to collect data relevant to management
of banana crop and in particular BSV from household heads on each farm. In each case, the
interviews were conducted in the field and additional to this the team visited the farmers’ fields
and scored BSV severity, incidence and management (reported elsewhere).
Table 1. Sampled sub- counties, Parishes and Villages in the study area
Site Total No. of
sub-counties
Total No. of
sub-counties
sampled
No. of
Parishes
sampled
No. of Villages
sample
Rakai 22 8 15 28
Masaka 23 9 15 30
Ntungamo 13 9 15 30
Data analysis
The data was coded and entered on spreadsheets. The analyses were carried out on SAS (SAS
Institute Inc, 1990). Cross-tabulation and descriptive statistics was used to summarize the data.
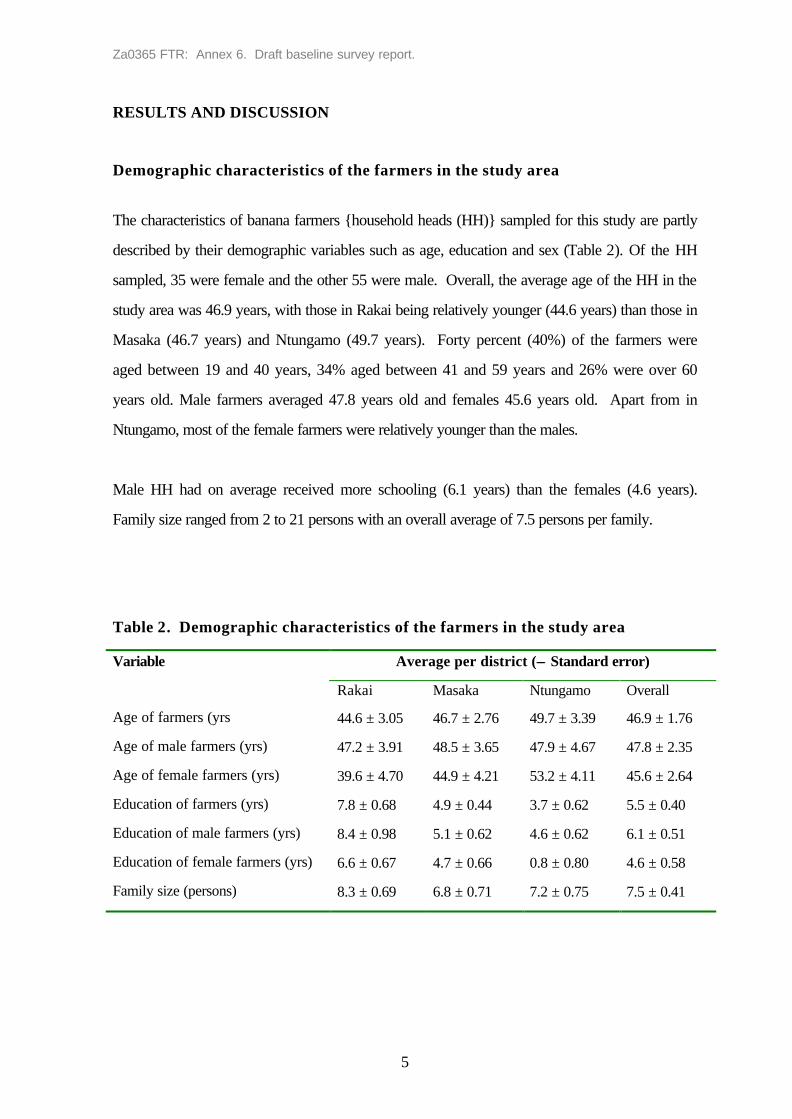
Za0365 FTR: Annex 6. Draft baseline survey report.
5
RESULTS AND DISCUSSION
Demographic characteristics of the farmers in the study area
The characteristics of banana farmers {household heads (HH)} sampled for this study are partly
described by their demographic variables such as age, education and sex (Table 2). Of the HH
sampled, 35 were female and the other 55 were male. Overall, the average age of the HH in the
study area was 46.9 years, with those in Rakai being relatively younger (44.6 years) than those in
Masaka (46.7 years) and Ntungamo (49.7 years). Forty percent (40%) of the farmers were
aged between 19 and 40 years, 34% aged between 41 and 59 years and 26% were over 60
years old. Male farmers averaged 47.8 years old and females 45.6 years old. Apart from in
Ntungamo, most of the female farmers were relatively younger than the males.
Male HH had on average received more schooling (6.1 years) than the females (4.6 years).
Family size ranged from 2 to 21 persons with an overall average of 7.5 persons per family.
Table 2. Demographic characteristics of the farmers in the study area
Average per district (±± Standard error)Variable
Rakai Masaka Ntungamo Overall
Age of farmers (yrs 44.6 ± 3.05 46.7 ± 2.76 49.7 ± 3.39 46.9 ± 1.76
Age of male farmers (yrs) 47.2 ± 3.91 48.5 ± 3.65 47.9 ± 4.67 47.8 ± 2.35
Age of female farmers (yrs) 39.6 ± 4.70 44.9 ± 4.21 53.2 ± 4.11 45.6 ± 2.64
Education of farmers (yrs) 7.8 ± 0.68 4.9 ± 0.44 3.7 ± 0.62 5.5 ± 0.40
Education of male farmers (yrs) 8.4 ± 0.98 5.1 ± 0.62 4.6 ± 0.62 6.1 ± 0.51
Education of female farmers (yrs) 6.6 ± 0.67 4.7 ± 0.66 0.8 ± 0.80 4.6 ± 0.58
Family size (persons) 8.3 ± 0.69 6.8 ± 0.71 7.2 ± 0.75 7.5 ± 0.41
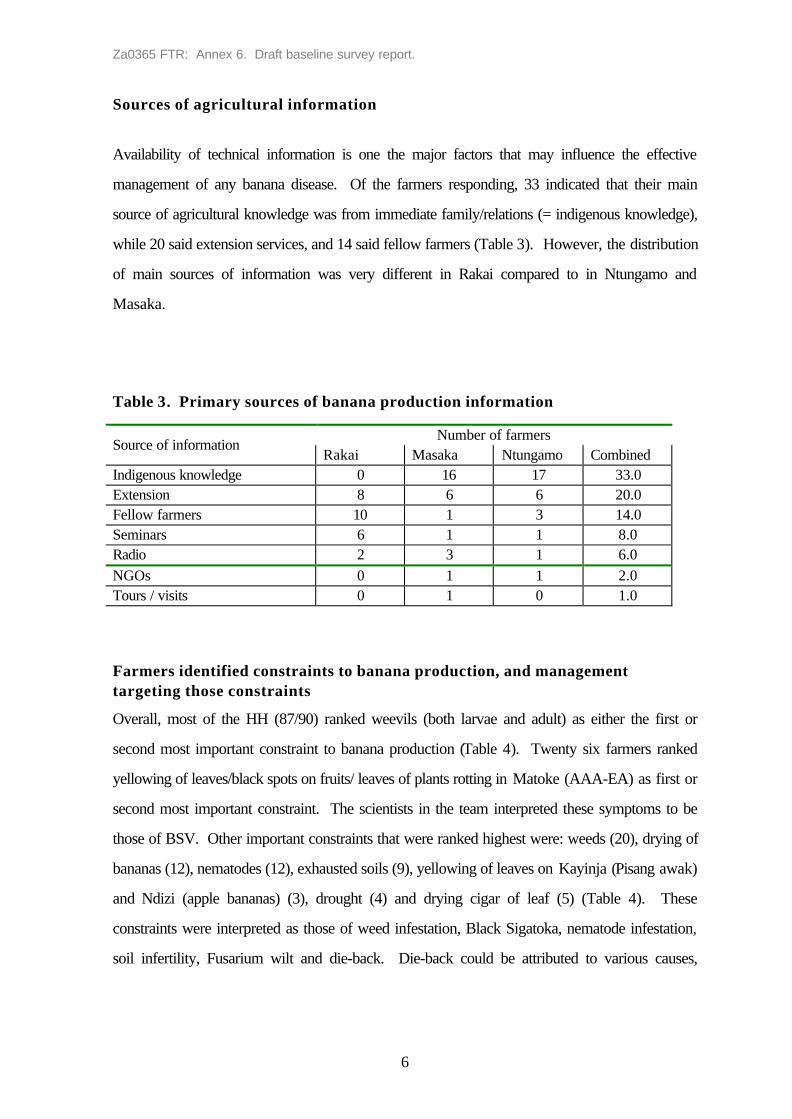
Za0365 FTR: Annex 6. Draft baseline survey report.
6
Sources of agricultural information
Availability of technical information is one the major factors that may influence the effective
management of any banana disease. Of the farmers responding, 33 indicated that their main
source of agricultural knowledge was from immediate family/relations (= indigenous knowledge),
while 20 said extension services, and 14 said fellow farmers (Table 3). However, the distribution
of main sources of information was very different in Rakai compared to in Ntungamo and
Masaka.
Table 3. Primary sources of banana production information
Number of farmersSource of information
Rakai Masaka Ntungamo CombinedIndigenous knowledge 0 16 17 33.0Extension 8 6 6 20.0Fellow farmers 10 1 3 14.0Seminars 6 1 1 8.0Radio 2 3 1 6.0NGOs 0 1 1 2.0Tours / visits 0 1 0 1.0
Farmers identified constraints to banana production, and managementtargeting those constraints
Overall, most of the HH (87/90) ranked weevils (both larvae and adult) as either the first or
second most important constraint to banana production (Table 4). Twenty six farmers ranked
yellowing of leaves/black spots on fruits/ leaves of plants rotting in Matoke (AAA-EA) as first or
second most important constraint. The scientists in the team interpreted these symptoms to be
those of BSV. Other important constraints that were ranked highest were: weeds (20), drying of
bananas (12), nematodes (12), exhausted soils (9), yellowing of leaves on Kayinja (Pisang awak)
and Ndizi (apple bananas) (3), drought (4) and drying cigar of leaf (5) (Table 4). These
constraints were interpreted as those of weed infestation, Black Sigatoka, nematode infestation,
soil infertility, Fusarium wilt and die-back. Die-back could be attributed to various causes,
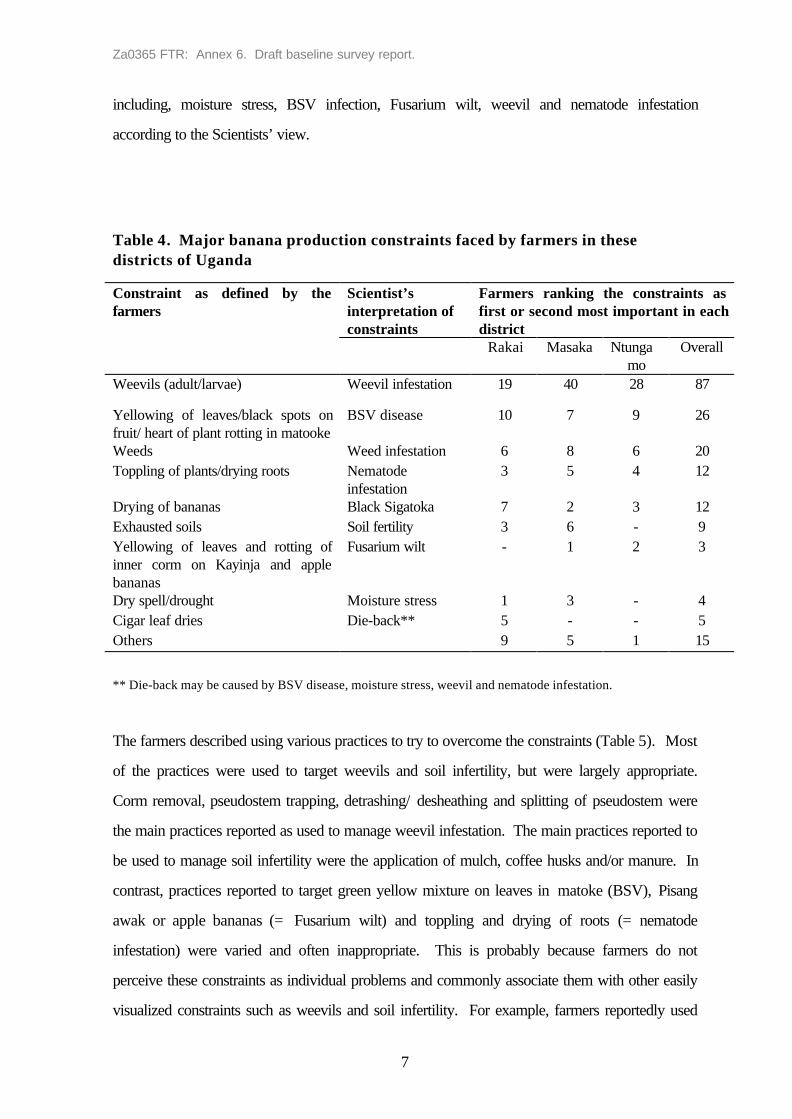
Za0365 FTR: Annex 6. Draft baseline survey report.
7
including, moisture stress, BSV infection, Fusarium wilt, weevil and nematode infestation
according to the Scientists’ view.
Table 4. Major banana production constraints faced by farmers in thesedistricts of Uganda
Constraint as defined by thefarmers
Scientist’sinterpretation ofconstraints
Farmers ranking the constraints asfirst or second most important in eachdistrict
Rakai Masaka Ntungamo
Overall
Weevils (adult/larvae) Weevil infestation 19 40 28 87
Yellowing of leaves/black spots onfruit/ heart of plant rotting in matooke
BSV disease 10 7 9 26
Weeds Weed infestation 6 8 6 20Toppling of plants/drying roots Nematode
infestation3 5 4 12
Drying of bananas Black Sigatoka 7 2 3 12Exhausted soils Soil fertility 3 6 - 9Yellowing of leaves and rotting ofinner corm on Kayinja and applebananas
Fusarium wilt - 1 2 3
Dry spell/drought Moisture stress 1 3 - 4Cigar leaf dries Die-back** 5 - - 5Others 9 5 1 15
** Die-back may be caused by BSV disease, moisture stress, weevil and nematode infestation.
The farmers described using various practices to try to overcome the constraints (Table 5). Most
of the practices were used to target weevils and soil infertility, but were largely appropriate.
Corm removal, pseudostem trapping, detrashing/ desheathing and splitting of pseudostem were
the main practices reported as used to manage weevil infestation. The main practices reported to
be used to manage soil infertility were the application of mulch, coffee husks and/or manure. In
contrast, practices reported to target green yellow mixture on leaves in matoke (BSV), Pisang
awak or apple bananas (= Fusarium wilt) and toppling and drying of roots (= nematode
infestation) were varied and often inappropriate. This is probably because farmers do not
perceive these constraints as individual problems and commonly associate them with other easily
visualized constraints such as weevils and soil infertility. For example, farmers reportedly used
Za0365 FTR: Annex 6. Draft baseline survey report.
8
corm removal, appropriate in weevil management, to control BSV symptoms. Additionally, a few
farmers (a total of only 9 in all sites) responded that they considered managing BSV related
symptoms (Yellow green mixture on leaves in matooke) despite the fact that these
symptoms/constraints were ranked second after weevils.
Most of farmers had modest formal education (5.5 years) and used indigenous knowledge in their
farming activities. As a result, it appears they are more familiar with farming practices passed on
from generation to generation. Therefore, it is likely these farmers were not aware of new
problems and practices targeting them. This could explain why farmers ranked weevils highest as
compared to BSV and Fusarium wilt symptoms. Similarly, management practices targeting
constraints were mainly cultural and often inappropriate because they targeted perceived causes
of constraints.
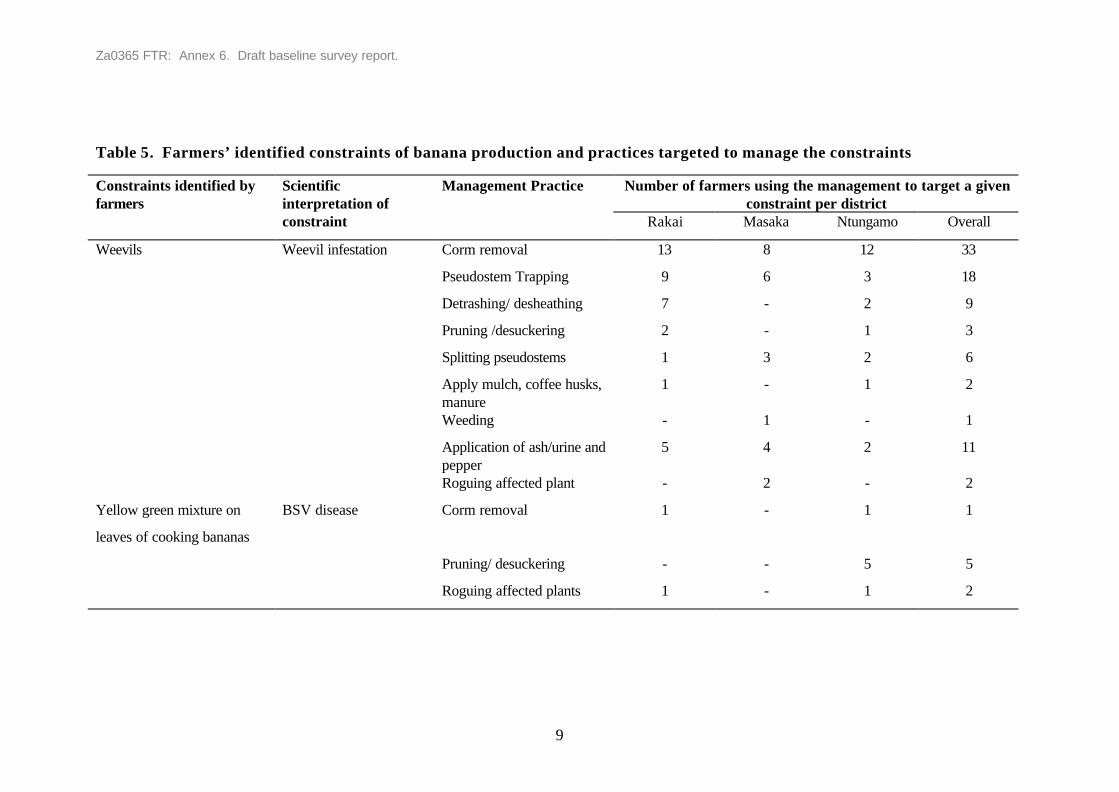
Za0365 FTR: Annex 6. Draft baseline survey report.
9
Table 5. Farmers’ identified constraints of banana production and practices targeted to manage the constraints
Number of farmers using the management to target a givenconstraint per district
Constraints identified byfarmers
Scientificinterpretation ofconstraint
Management Practice
Rakai Masaka Ntungamo Overall
Weevils Weevil infestation Corm removal 13 8 12 33
Pseudostem Trapping 9 6 3 18
Detrashing/ desheathing 7 - 2 9
Pruning /desuckering 2 - 1 3
Splitting pseudostems 1 3 2 6
Apply mulch, coffee husks,manure
1 - 1 2
Weeding - 1 - 1
Application of ash/urine andpepper
5 4 2 11
Roguing affected plant - 2 - 2
Yellow green mixture on
leaves of cooking bananas
BSV disease Corm removal 1 - 1 1
Pruning/ desuckering - - 5 5
Roguing affected plants 1 - 1 2
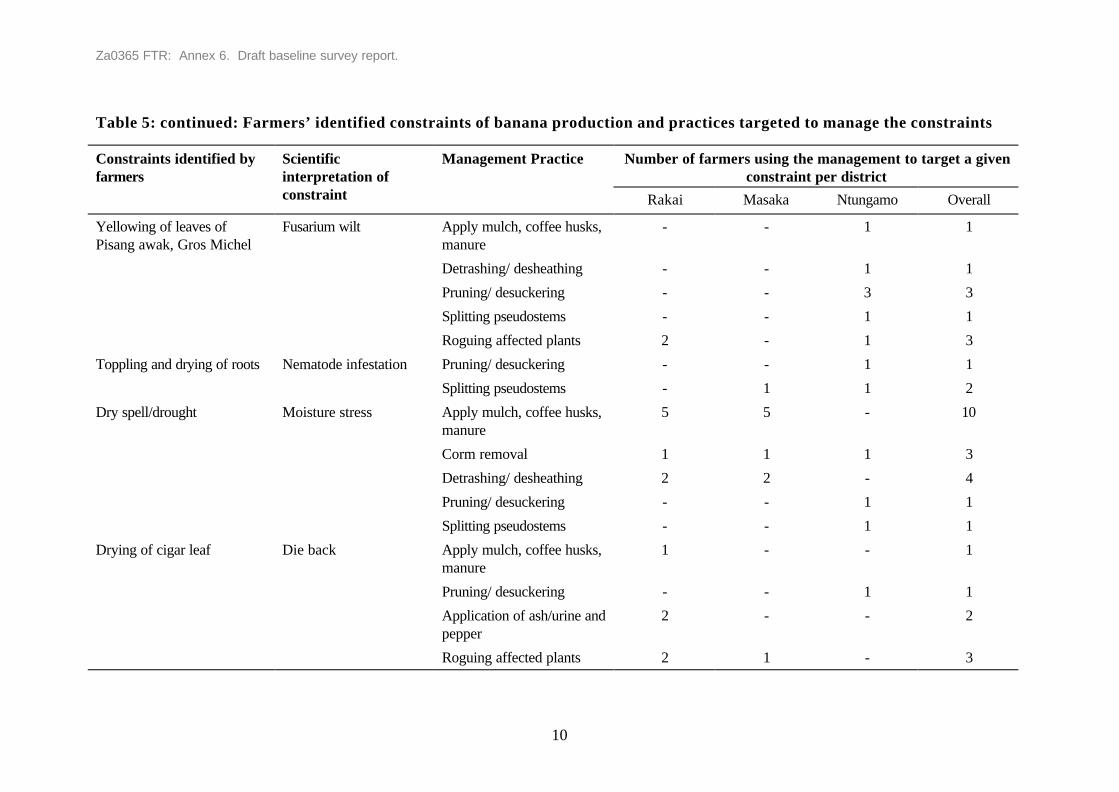
Za0365 FTR: Annex 6. Draft baseline survey report.
10
Table 5: continued: Farmers’ identified constraints of banana production and practices targeted to manage the constraints
Number of farmers using the management to target a givenconstraint per district
Constraints identified byfarmers
Scientificinterpretation ofconstraint
Management Practice
Rakai Masaka Ntungamo Overall
Yellowing of leaves ofPisang awak, Gros Michel
Fusarium wilt Apply mulch, coffee husks,manure
- - 1 1
Detrashing/ desheathing - - 1 1
Pruning/ desuckering - - 3 3
Splitting pseudostems - - 1 1
Roguing affected plants 2 - 1 3
Toppling and drying of roots Nematode infestation Pruning/ desuckering - - 1 1
Splitting pseudostems - 1 1 2
Dry spell/drought Moisture stress Apply mulch, coffee husks,manure
5 5 - 10
Corm removal 1 1 1 3
Detrashing/ desheathing 2 2 - 4
Pruning/ desuckering - - 1 1
Splitting pseudostems - - 1 1
Drying of cigar leaf Die back Apply mulch, coffee husks,manure
1 - - 1
Pruning/ desuckering - - 1 1
Application of ash/urine andpepper
2 - - 2
Roguing affected plants 2 1 - 3
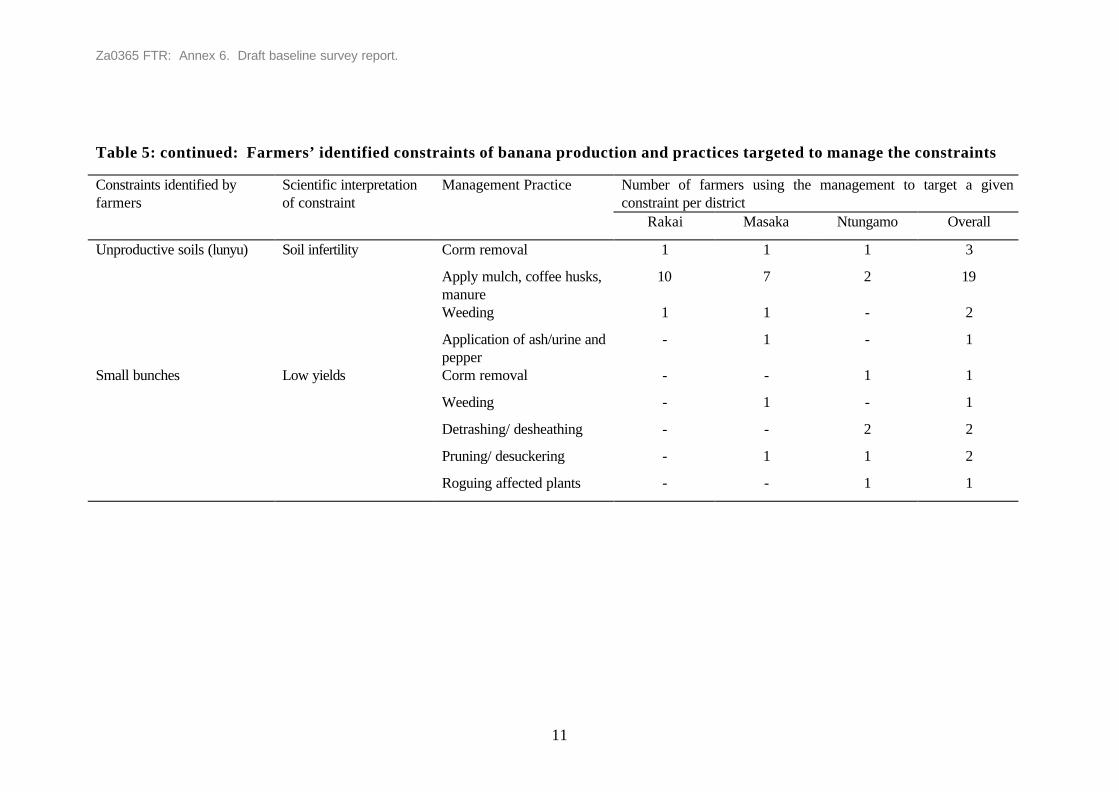
Za0365 FTR: Annex 6. Draft baseline survey report.
11
Table 5: continued: Farmers’ identified constraints of banana production and practices targeted to manage the constraints
Number of farmers using the management to target a givenconstraint per district
Constraints identified byfarmers
Scientific interpretationof constraint
Management Practice
Rakai Masaka Ntungamo Overall
Unproductive soils (lunyu) Soil infertility Corm removal 1 1 1 3
Apply mulch, coffee husks,manure
10 7 2 19
Weeding 1 1 - 2
Application of ash/urine andpepper
- 1 - 1
Small bunches Low yields Corm removal - - 1 1
Weeding - 1 - 1
Detrashing/ desheathing - - 2 2
Pruning/ desuckering - 1 1 2
Roguing affected plants - - 1 1

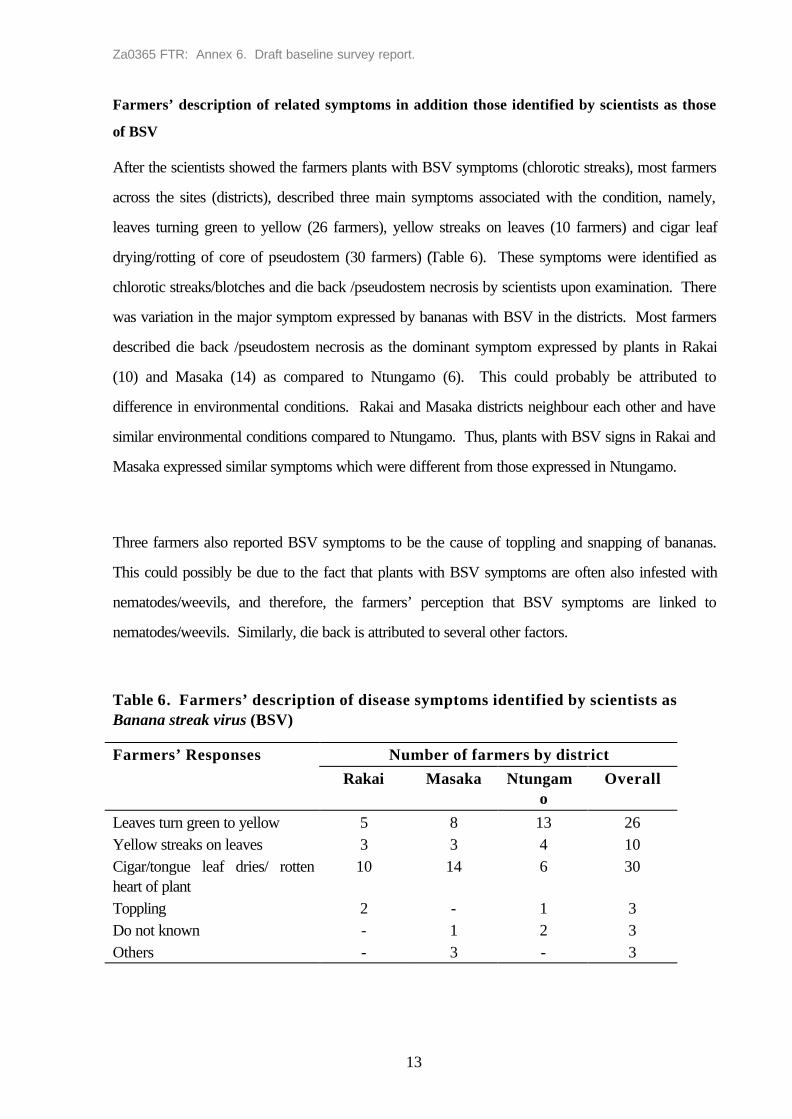
Za0365 FTR: Annex 6. Draft baseline survey report.
13
Farmers’ description of related symptoms in addition those identified by scientists as those
of BSV
After the scientists showed the farmers plants with BSV symptoms (chlorotic streaks), most farmers
across the sites (districts), described three main symptoms associated with the condition, namely,
leaves turning green to yellow (26 farmers), yellow streaks on leaves (10 farmers) and cigar leaf
drying/rotting of core of pseudostem (30 farmers) (Table 6). These symptoms were identified as
chlorotic streaks/blotches and die back /pseudostem necrosis by scientists upon examination. There
was variation in the major symptom expressed by bananas with BSV in the districts. Most farmers
described die back /pseudostem necrosis as the dominant symptom expressed by plants in Rakai
(10) and Masaka (14) as compared to Ntungamo (6). This could probably be attributed to
difference in environmental conditions. Rakai and Masaka districts neighbour each other and have
similar environmental conditions compared to Ntungamo. Thus, plants with BSV signs in Rakai and
Masaka expressed similar symptoms which were different from those expressed in Ntungamo.
Three farmers also reported BSV symptoms to be the cause of toppling and snapping of bananas.
This could possibly be due to the fact that plants with BSV symptoms are often also infested with
nematodes/weevils, and therefore, the farmers’ perception that BSV symptoms are linked to
nematodes/weevils. Similarly, die back is attributed to several other factors.
Table 6. Farmers’ description of disease symptoms identified by scientists asBanana streak virus (BSV)
Number of farmers by districtFarmers’ Responses
Rakai Masaka Ntungamo
Overall
Leaves turn green to yellow 5 8 13 26Yellow streaks on leaves 3 3 4 10Cigar/tongue leaf dries/ rottenheart of plant
10 14 6 30
Toppling 2 - 1 3Do not known - 1 2 3Others - 3 - 3
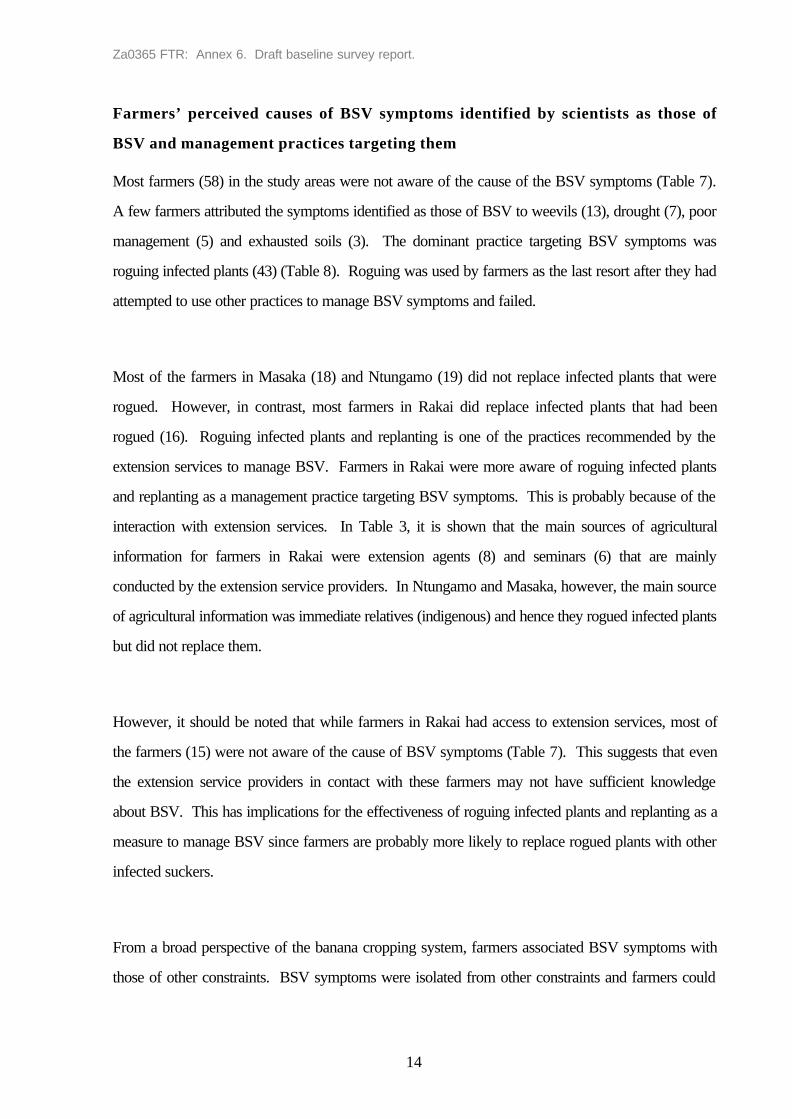
Za0365 FTR: Annex 6. Draft baseline survey report.
14
Farmers’ perceived causes of BSV symptoms identified by scientists as those of
BSV and management practices targeting them
Most farmers (58) in the study areas were not aware of the cause of the BSV symptoms (Table 7).
A few farmers attributed the symptoms identified as those of BSV to weevils (13), drought (7), poor
management (5) and exhausted soils (3). The dominant practice targeting BSV symptoms was
roguing infected plants (43) (Table 8). Roguing was used by farmers as the last resort after they had
attempted to use other practices to manage BSV symptoms and failed.
Most of the farmers in Masaka (18) and Ntungamo (19) did not replace infected plants that were
rogued. However, in contrast, most farmers in Rakai did replace infected plants that had been
rogued (16). Roguing infected plants and replanting is one of the practices recommended by the
extension services to manage BSV. Farmers in Rakai were more aware of roguing infected plants
and replanting as a management practice targeting BSV symptoms. This is probably because of the
interaction with extension services. In Table 3, it is shown that the main sources of agricultural
information for farmers in Rakai were extension agents (8) and seminars (6) that are mainly
conducted by the extension service providers. In Ntungamo and Masaka, however, the main source
of agricultural information was immediate relatives (indigenous) and hence they rogued infected plants
but did not replace them.
However, it should be noted that while farmers in Rakai had access to extension services, most of
the farmers (15) were not aware of the cause of BSV symptoms (Table 7). This suggests that even
the extension service providers in contact with these farmers may not have sufficient knowledge
about BSV. This has implications for the effectiveness of roguing infected plants and replanting as a
measure to manage BSV since farmers are probably more likely to replace rogued plants with other
infected suckers.
From a broad perspective of the banana cropping system, farmers associated BSV symptoms with
those of other constraints. BSV symptoms were isolated from other constraints and farmers could
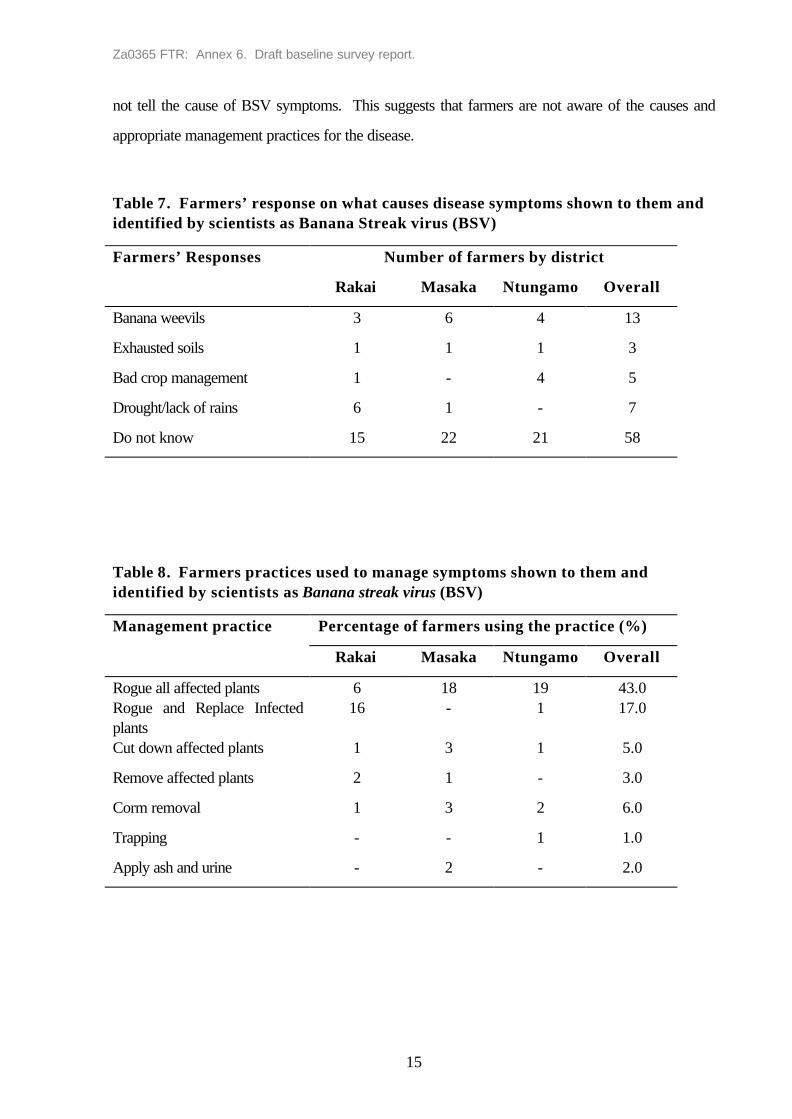
Za0365 FTR: Annex 6. Draft baseline survey report.
15
not tell the cause of BSV symptoms. This suggests that farmers are not aware of the causes and
appropriate management practices for the disease.
Table 7. Farmers’ response on what causes disease symptoms shown to them andidentified by scientists as Banana Streak virus (BSV)
Number of farmers by districtFarmers’ Responses
Rakai Masaka Ntungamo Overall
Banana weevils 3 6 4 13
Exhausted soils 1 1 1 3
Bad crop management 1 - 4 5
Drought/lack of rains 6 1 - 7
Do not know 15 22 21 58
Table 8. Farmers practices used to manage symptoms shown to them andidentified by scientists as Banana streak virus (BSV)
Management practice Percentage of farmers using the practice (%)
Rakai Masaka Ntungamo Overall
Rogue all affected plants 6 18 19 43.0Rogue and Replace Infectedplants
16 - 1 17.0
Cut down affected plants 1 3 1 5.0
Remove affected plants 2 1 - 3.0
Corm removal 1 3 2 6.0
Trapping - - 1 1.0
Apply ash and urine - 2 - 2.0
Za0365 FTR: Annex 6. Draft baseline survey report.
16
Conclusion
In conclusion plants with symptoms of BSV infection were found in the three districts included in the
study, Rakai, Masaka and Ntungamo. Generally, farmers in the three districts recognised the
symptoms of BSV infection (as identified and described by the scientists in the study team) as
constraints to banana production, but did not know the cause and they tended to attribute them to
weevil infestation and declining soil fertility. Because of this lack of knowledge and understanding of
banana streak virus disease, and the difficulty in visualising the cause, the farmers did not rank BSV
as a high priority constraint. The lack of knowledge and understanding of the causes of the
symptoms also meant that the farmers tended to use management practices that targeted poor soils
and weevils to try to control the BSV symptoms. However, the farmers claimed that they would
rogue and replant as a final resort if the management practices against weevils or declining soil fertility
did not reduce the severity of symptoms sufficiently. The lack of knowledge concerning BSV by the
farmers is probably a reflection of the relatively recent nature of the disease in Uganda and the lack
of awareness of the disease by extension workers. Since the farmers appeared willing to take on
board the advice offered by the extension services (at least in Rakai), it would seem appropriate to
target the extension services and key informant farmers for any new or revised recommendations of
management practices to control BSV symptoms.
Za0365 FTR: Annex 6. Draft baseline survey report.
17
Bibliography
Adupa and Ngambeki, D.S. (1993). Demand and consumption of bananas in Uganda. Africancrop science conference proceedings 1: 379-383.
FAO, (1990). Production Yearbook for 1990, Food and Agriculture Organisation of the UnitedNations, Rome.
Gold, CS., Ogenga-Latigo, MW., Tushmereirwe, WK., Kashaija, IN. and Nankinga, C. (1993)Farmer perceptions of banana pest constraints in Uganda. In: Proceedings of a ResearchCo-ordination Meeting for Biological and Integrated Control of Highland BananaPests and Diseases in Africa, Cotonou, 12-14 November 1991. pp 3-24. Gold, C.S. &Gemmil, B. (Eds.) International Institute of Tropical Agriculture, Ibadan.
Kubiriba J., Tushemereirwe W. and Karamura EB. (1997). Distribution of Banana streak virus(BSV) in Uganda. MusAfrica No. 11:17.
Ministry of Agriculture, Animal Industry and Fisheries (MAIIF) (1999). Production zones andtargets, MAAIF, Entebbe, Uganda.
Mugisha J. and Ngambeki D.S. (1993). Marketing systems of Uganda banana Industry. Africancrop science conference proceedings 1:384-387
Ngambeki, D.S. (1992). Coffee based farming systems baseline survey in Uganda, Vol. 1.MAAIF, Entebbe, Uganda.
Rubaihayo, P (1993). Banana based cropping systems research. Research Bulletin No.4, MakerereUniversity.
Simmonds, N.W. (1966). Bananas. Second Edition. Longmans. London. UK. 512 PP.
Tushemereirwe, W.K., Karamura, E.B. and Karyeija, R. (1996). Banana Streak Virus (BSV) andassociated filamentous virus (unidentified) disease complex of highland bananas in Uganda.Infomusa 5: 9-12.

Detection of Banana streak virus in banana plants from Uganda
Jerome Kubiriba, Nawshad Joomun and Lawrence Kenyon.
BackgroundWhen CPP-funded project R7529 (Epidemiology, vector studies and control of banana streakvirus in East Africa highland bananas) was being formulated, a good deal of information wasemerging on how BSV sequences can be integrated in certain Musa genomes and how thesemight be activated to give rise to episomal (true) infections and disease. However, nothingwas known about what was driving the BSV epidemic in Uganda, or what effect BSVinfection has on the East African highland bananas that predominate there. Antisera hadrecently been developed at IITA (Nigeria) that appeared to work reliably in detecting thevirus in the Nigerian Musa breeding lines and hybrids (Dahal et al, 1998), and since it wasanticipated that these would also work in Uganda, IITA were contracted to provide sufficientantiserum and reagents for project R7529. However, since it was known that in other areasBSV (and other badnaviruses) are very variable serologically, a sister project (R7478) wasestablished with the John Innes Centre to assess the molecular variability of the virus inUganda. If needed, a diagnostic method for use in the epidemiology or transmission studiesin Uganda would also be developed.
The final report for R7478 was circulated in mid September 2001 (Hull and Harper, 2001).During two missions to Uganda, leaf samples and suckers had been collected from about 60plants showing BSV symptoms from a west - east transect across Uganda covering most ofthe banana growing areas. Virus particles were purified from each sample. When these weretested for affinity with a cocktail of 24 antisera (Lockhart) using ELISA and ISEM, a numbergave very weak readings indicating that many were not reacting strongly with the antiserummixture. Polymerase chain reaction (PCR) was then used to amplify a region of the virusgenome including parts of the reverse transcriptase (RT) and RNase H (RH) genes. The PCRamplification products were cloned and then sequenced. The sequences derived from thedifferent samples were aligned with similar sequences from other badnaviruses. Phylogeneticanalysis showed that there were probably at least 11 different "pseudo species" (<80%sequence homology between species) of Badnavirus present in the bananas of Uganda. Thesespecies are divided between three super clusters of sequences, and one cluster of these isapparently more similar to Sugarcane bacilliform virus (ScBV) than to any of the otherbadnaviruses included in the analysis (Harper et al. 2002).
Once the field trials (Activities 1, 2 and 3 of project R7529) were planted, attempts weremade to use the antisera provided by IITA for routine indexing of the plants and to determineif symptom severity is proportional to virus titre in infected plants. Unfortunately, the resultswere inconsistent and could not be relied upon. This apparent variable reaction with theantiserum is probably due to serological variability as reflected by the wide genetic diversityof strains/species of BSV present in Uganda. Because of this, the JIC group set about tryingto develop a diagnostic method for detecting all non-integrated forms of BSV. They arrivedat two procedures (Hull and Harper 2001):-
1. Direct binding of the virus to the walls of PCR tubes followed by amplification of theviral DNA by PCR using degenerate universal Badnavirus oligonucleotide primers(BADNA-1a + BADNA 4’).
2. Immunocapture PCR where the virus particles are first trapped on the PCR tube wallusing antiserum and then the Badnavirus DNA is amplified by PCR using the sameuniversal primers as above.
Since it was important to many components of project R7529 to have BSV diagnosticsavailable in Uganda, it was agreed that it would be appropriate to transfer funding, originallyintended for antiserum production by IITA-Nigeria, to enhancing the plant virology capacity
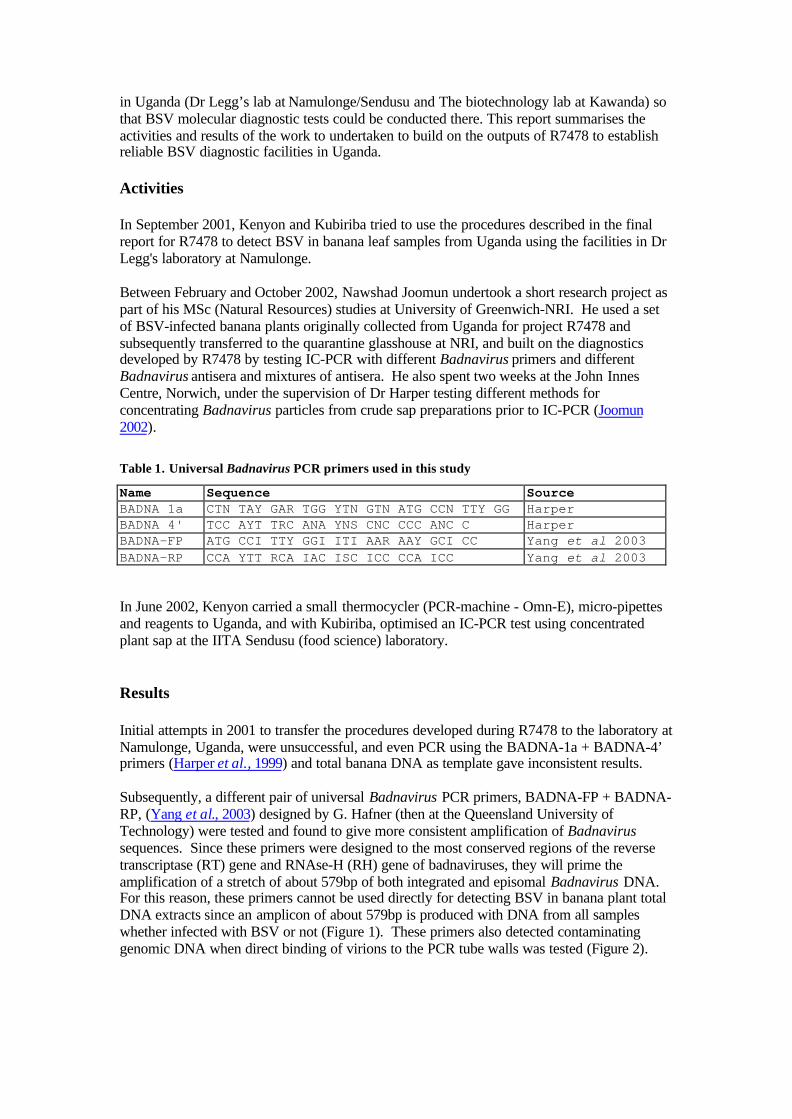
in Uganda (Dr Legg’s lab at Namulonge/Sendusu and The biotechnology lab at Kawanda) sothat BSV molecular diagnostic tests could be conducted there. This report summarises theactivities and results of the work to undertaken to build on the outputs of R7478 to establishreliable BSV diagnostic facilities in Uganda.
Activities
In September 2001, Kenyon and Kubiriba tried to use the procedures described in the finalreport for R7478 to detect BSV in banana leaf samples from Uganda using the facilities in DrLegg's laboratory at Namulonge.
Between February and October 2002, Nawshad Joomun undertook a short research project aspart of his MSc (Natural Resources) studies at University of Greenwich-NRI. He used a setof BSV-infected banana plants originally collected from Uganda for project R7478 andsubsequently transferred to the quarantine glasshouse at NRI, and built on the diagnosticsdeveloped by R7478 by testing IC-PCR with different Badnavirus primers and differentBadnavirus antisera and mixtures of antisera. He also spent two weeks at the John InnesCentre, Norwich, under the supervision of Dr Harper testing different methods forconcentrating Badnavirus particles from crude sap preparations prior to IC-PCR (Joomun2002).
Table 1. Universal Badnavirus PCR primers used in this study
Name Sequence SourceBADNA 1a CTN TAY GAR TGG YTN GTN ATG CCN TTY GG HarperBADNA 4' TCC AYT TRC ANA YNS CNC CCC ANC C HarperBADNA-FP ATG CCI TTY GGI ITI AAR AAY GCI CC Yang et al 2003BADNA-RP CCA YTT RCA IAC ISC ICC CCA ICC Yang et al 2003
In June 2002, Kenyon carried a small thermocycler (PCR-machine - Omn-E), micro-pipettesand reagents to Uganda, and with Kubiriba, optimised an IC-PCR test using concentratedplant sap at the IITA Sendusu (food science) laboratory.
Results
Initial attempts in 2001 to transfer the procedures developed during R7478 to the laboratory atNamulonge, Uganda, were unsuccessful, and even PCR using the BADNA-1a + BADNA-4’primers (Harper et al., 1999) and total banana DNA as template gave inconsistent results.
Subsequently, a different pair of universal Badnavirus PCR primers, BADNA-FP + BADNA-RP, (Yang et al., 2003) designed by G. Hafner (then at the Queensland University ofTechnology) were tested and found to give more consistent amplification of Badnavirussequences. Since these primers were designed to the most conserved regions of the reversetranscriptase (RT) gene and RNAse-H (RH) gene of badnaviruses, they will prime theamplification of a stretch of about 579bp of both integrated and episomal Badnavirus DNA.For this reason, these primers cannot be used directly for detecting BSV in banana plant totalDNA extracts since an amplicon of about 579bp is produced with DNA from all sampleswhether infected with BSV or not (Figure 1). These primers also detected contaminatinggenomic DNA when direct binding of virions to the PCR tube walls was tested (Figure 2).
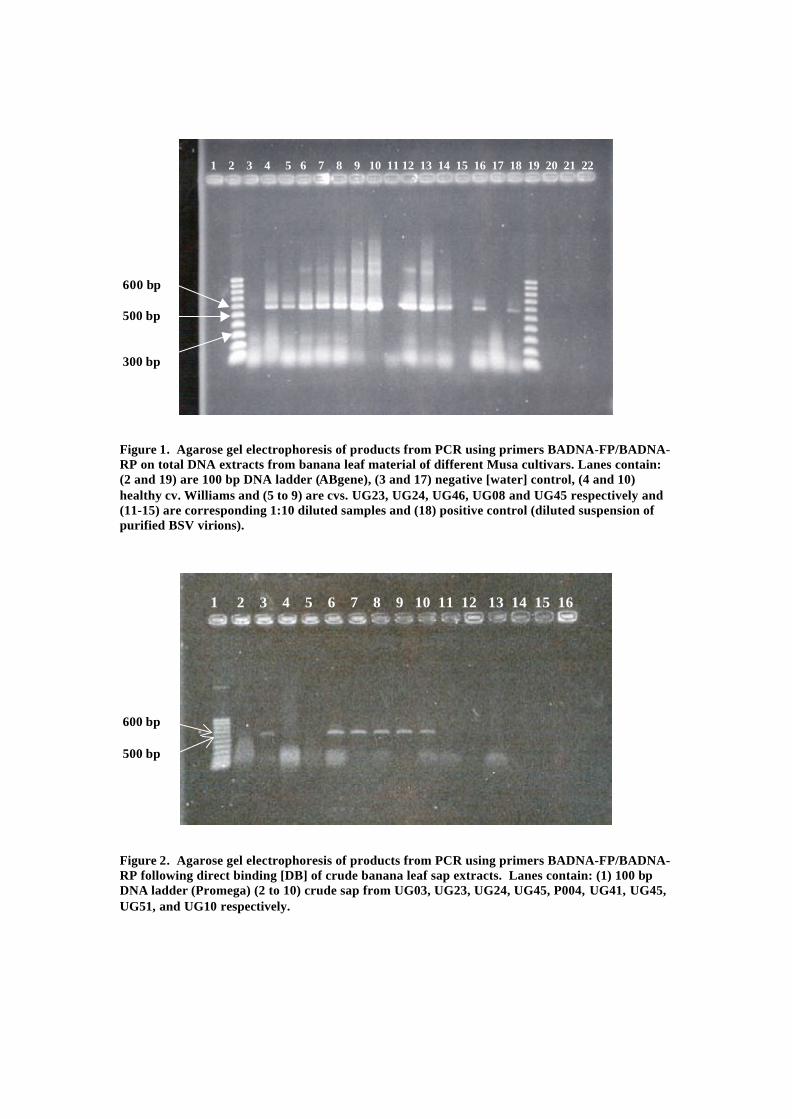
1 2 3 4 5 6 7 8 9 10 11 12 13 14 15 16 17 18 19 20 21 22
Figure 1. Agarose gel electrophoresis of products from PCR using primers BADNA-FP/BADNA-RP on total DNA extracts from banana leaf material of different Musa cultivars. Lanes contain:(2 and 19) are 100 bp DNA ladder (ABgene), (3 and 17) negative [water] control, (4 and 10)healthy cv. Williams and (5 to 9) are cvs. UG23, UG24, UG46, UG08 and UG45 respectively and(11-15) are corresponding 1:10 diluted samples and (18) positive control (diluted suspension ofpurified BSV virions).
1 2 3 4 5 6 7 8 9 10 11 12 13 14 15 16
Figure 2. Agarose gel electrophoresis of products from PCR using primers BADNA-FP/BADNA-RP following direct binding [DB] of crude banana leaf sap extracts. Lanes contain: (1) 100 bpDNA ladder (Promega) (2 to 10) crude sap from UG03, UG23, UG24, UG45, P004, UG41, UG45,UG51, and UG10 respectively.
600 bp
500 bp
300 bp
600 bp
500 bp
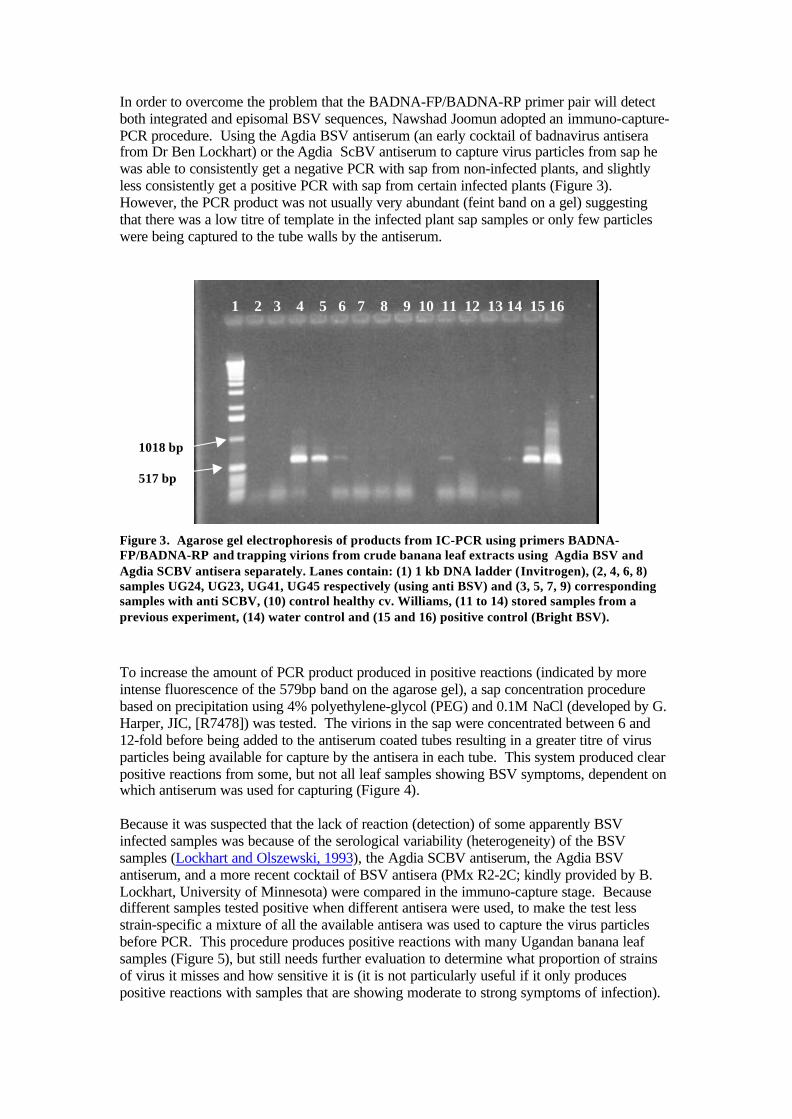
In order to overcome the problem that the BADNA-FP/BADNA-RP primer pair will detectboth integrated and episomal BSV sequences, Nawshad Joomun adopted an immuno-capture-PCR procedure. Using the Agdia BSV antiserum (an early cocktail of badnavirus antiserafrom Dr Ben Lockhart) or the Agdia ScBV antiserum to capture virus particles from sap hewas able to consistently get a negative PCR with sap from non-infected plants, and slightlyless consistently get a positive PCR with sap from certain infected plants (Figure 3).However, the PCR product was not usually very abundant (feint band on a gel) suggestingthat there was a low titre of template in the infected plant sap samples or only few particleswere being captured to the tube walls by the antiserum.
1 2 3 4 5 6 7 8 9 10 11 12 13 14 15 16
Figure 3. Agarose gel electrophoresis of products from IC-PCR using primers BADNA-FP/BADNA-RP and trapping virions from crude banana leaf extracts using Agdia BSV andAgdia SCBV antisera separately. Lanes contain: (1) 1 kb DNA ladder (Invitrogen), (2, 4, 6, 8)samples UG24, UG23, UG41, UG45 respectively (using anti BSV) and (3, 5, 7, 9) correspondingsamples with anti SCBV, (10) control healthy cv. Williams, (11 to 14) stored samples from aprevious experiment, (14) water control and (15 and 16) positive control (Bright BSV).
To increase the amount of PCR product produced in positive reactions (indicated by moreintense fluorescence of the 579bp band on the agarose gel), a sap concentration procedurebased on precipitation using 4% polyethylene-glycol (PEG) and 0.1M NaCl (developed by G.Harper, JIC, [R7478]) was tested. The virions in the sap were concentrated between 6 and12-fold before being added to the antiserum coated tubes resulting in a greater titre of virusparticles being available for capture by the antisera in each tube. This system produced clearpositive reactions from some, but not all leaf samples showing BSV symptoms, dependent onwhich antiserum was used for capturing (Figure 4).
Because it was suspected that the lack of reaction (detection) of some apparently BSVinfected samples was because of the serological variability (heterogeneity) of the BSVsamples (Lockhart and Olszewski, 1993), the Agdia SCBV antiserum, the Agdia BSVantiserum, and a more recent cocktail of BSV antisera (PMx R2-2C; kindly provided by B.Lockhart, University of Minnesota) were compared in the immuno-capture stage. Becausedifferent samples tested positive when different antisera were used, to make the test lessstrain-specific a mixture of all the available antisera was used to capture the virus particlesbefore PCR. This procedure produces positive reactions with many Ugandan banana leafsamples (Figure 5), but still needs further evaluation to determine what proportion of strainsof virus it misses and how sensitive it is (it is not particularly useful if it only producespositive reactions with samples that are showing moderate to strong symptoms of infection).
1018 bp
517 bp

1 2 3 4 5 6 7 8 9 10 11 12 13 14 15 16 CRUDE SAP CONCENTRATED _ +
Figure 4. Agarose gel electrophoresis of products from IC-PCR on crude and concentrated leafsamples trapped with Agdia BSV and Agdia ScBV antisera separately. Lanes contain: (1) 1 kbDNA ladder (Invitrogen), (2, 4, and 6) crude extracts from samples UG03, UG10 and UG46respectively (using anti BSV) and (3, 5 and 7) corresponding samples with anti SCBV, (8-13)concentrated extracts, (14) P006 (crude) using Agdia BSV, (15) positive control (Bright BSV) and(16) negative control.
1 2 3 4 5 6 7 8 9 10 11 12 13 14 15 16 17 18 19 20 21 22
Figure 5. Agarose gel electrophoresis of products from IC-PCR on concentrated leaf samplestrapped with a mixture of Agdia ScBV, Agdia BSV and PMxR2-2C antisera. Lanes contain: (1)1 KB DNA ladder (Invitrogen), (2-20) samples UG41, UG45, UG 46, UG51, UG60, POO4, UG03,UG12, UG04, UG24, UG 53, UG07, UG06, UG08, UG14, UG23, UG28, UG64 and UG01respectively, (21) negative control and (22) positive control (Bright BSV).
1636 bp
1018 bp
517 bp
1636 bp
1018 bp
517 bp
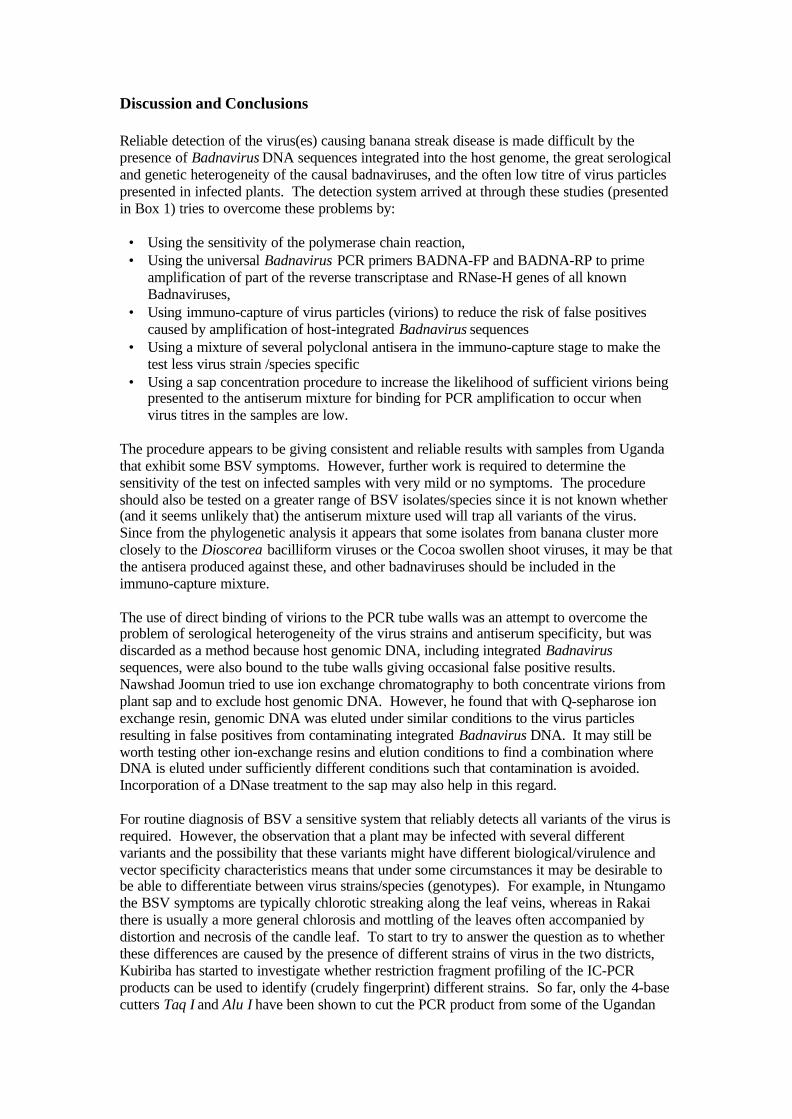
Discussion and Conclusions
Reliable detection of the virus(es) causing banana streak disease is made difficult by thepresence of Badnavirus DNA sequences integrated into the host genome, the great serologicaland genetic heterogeneity of the causal badnaviruses, and the often low titre of virus particlespresented in infected plants. The detection system arrived at through these studies (presentedin Box 1) tries to overcome these problems by:
• Using the sensitivity of the polymerase chain reaction,• Using the universal Badnavirus PCR primers BADNA-FP and BADNA-RP to prime
amplification of part of the reverse transcriptase and RNase-H genes of all knownBadnaviruses,
• Using immuno-capture of virus particles (virions) to reduce the risk of false positivescaused by amplification of host-integrated Badnavirus sequences
• Using a mixture of several polyclonal antisera in the immuno-capture stage to make thetest less virus strain /species specific
• Using a sap concentration procedure to increase the likelihood of sufficient virions beingpresented to the antiserum mixture for binding for PCR amplification to occur whenvirus titres in the samples are low.
The procedure appears to be giving consistent and reliable results with samples from Ugandathat exhibit some BSV symptoms. However, further work is required to determine thesensitivity of the test on infected samples with very mild or no symptoms. The procedureshould also be tested on a greater range of BSV isolates/species since it is not known whether(and it seems unlikely that) the antiserum mixture used will trap all variants of the virus.Since from the phylogenetic analysis it appears that some isolates from banana cluster moreclosely to the Dioscorea bacilliform viruses or the Cocoa swollen shoot viruses, it may be thatthe antisera produced against these, and other badnaviruses should be included in theimmuno-capture mixture.
The use of direct binding of virions to the PCR tube walls was an attempt to overcome theproblem of serological heterogeneity of the virus strains and antiserum specificity, but wasdiscarded as a method because host genomic DNA, including integrated Badnavirussequences, were also bound to the tube walls giving occasional false positive results.Nawshad Joomun tried to use ion exchange chromatography to both concentrate virions fromplant sap and to exclude host genomic DNA. However, he found that with Q-sepharose ionexchange resin, genomic DNA was eluted under similar conditions to the virus particlesresulting in false positives from contaminating integrated Badnavirus DNA. It may still beworth testing other ion-exchange resins and elution conditions to find a combination whereDNA is eluted under sufficiently different conditions such that contamination is avoided.Incorporation of a DNase treatment to the sap may also help in this regard.
For routine diagnosis of BSV a sensitive system that reliably detects all variants of the virus isrequired. However, the observation that a plant may be infected with several differentvariants and the possibility that these variants might have different biological/virulence andvector specificity characteristics means that under some circumstances it may be desirable tobe able to differentiate between virus strains/species (genotypes). For example, in Ntungamothe BSV symptoms are typically chlorotic streaking along the leaf veins, whereas in Rakaithere is usually a more general chlorosis and mottling of the leaves often accompanied bydistortion and necrosis of the candle leaf. To start to try to answer the question as to whetherthese differences are caused by the presence of different strains of virus in the two districts,Kubiriba has started to investigate whether restriction fragment profiling of the IC-PCRproducts can be used to identify (crudely fingerprint) different strains. So far, only the 4-basecutters Taq I and Alu I have been shown to cut the PCR product from some of the Ugandan
strains, but more work is required to determine if these are sufficient to discriminate betweenthe different strain groups.
With the findings presented here, and the transfer of materials and information to Uganda, thefacilities and capability are now in place for detection of many BSV strains to be carried outin Uganda in support of epidemiology and virus management research. However, the highcost of the test, both in terms of reagents and skilled technicians time, means that for now thetest is only likely to be used for research purposes and will not be used for routine screeningof germplasm or as part of a disease control strategy.
References
DAHAL, G., HUGHES, J.D’A., THOTTAPPILLY, G. & LOCKHART, B.E.L. 1998. Effectof temperature on symptom expression and reliability of banana streak badnavirusdetection in naturally infected plantains and bananas (Musa spp.). Plant Disease82:16-21.
HARPER, G., DAHAL, G., THOTTAPPILLY, G. & HULL, R. (1999). Detection ofepisomal banana streak badnavirus by IC-PCR. Journal of Viorological Methods 79:1-8.
HARPER, G., HART, D., MOULT, S., and HULL, R. (2002) Detection of Banana streakvirus in field samples of bananas from Uganda. Annals of Applied Biology 141: 247-257.
HULL, R. and HARPER, G. (2001) Management strategies for Banana streak virus:Variation of BSV in Uganda as an adjunct to diagnosis and epidemiology. FinalTechnical report of DFID Crop Protection Programme project R7478/Za0342, JohnInnes Centre, Norwich September 2001.
JOOMUN, N. (2002) Development of Diagnostic Techniques for reliable detection ofBanana streak virus., pp. 73: MSc Thesis Natural Resources Institute, University ofGreenwich, Chatham.
LOCKHART, B.E.L. & OLSZEWSKI, N.E. (1993). Serological and genomic heterogeneityof banana streak badnavirus: Implications for virus detection in Musa germplasm. In:Breeding Banana and Plantain for Resistance to Diseases and Pests, pp 105-113. Ed.J. Genry. Montpellier, France: INIBAP.
YANG, I. C., HAFNER, G. J., DALE, J. L., and Harding, R. M. (2003): Genomiccharacterisation of taro bacilliform virus. Archives Of Virology 148: 937-949.
Acknowledgements:
We gratefully acknowledge the help and guidance provided by Dr Glyn Harper and Prof.Roger Hull (John Innes Centre, Project R7478), and for their hosting of Nawshad Joomun atthe John Innes Centre during part of his MSc research project. We also thank Dr James Leggand his team for allowing us to use the facilities of the plant virology laboratory atNamulonge and Sendusu, Uganda, and Dr Greg Hafner (QUT, Brisbane) for revealing thesequences of the BADNA-FP and BADNA-RP PCR primers to us before publication.
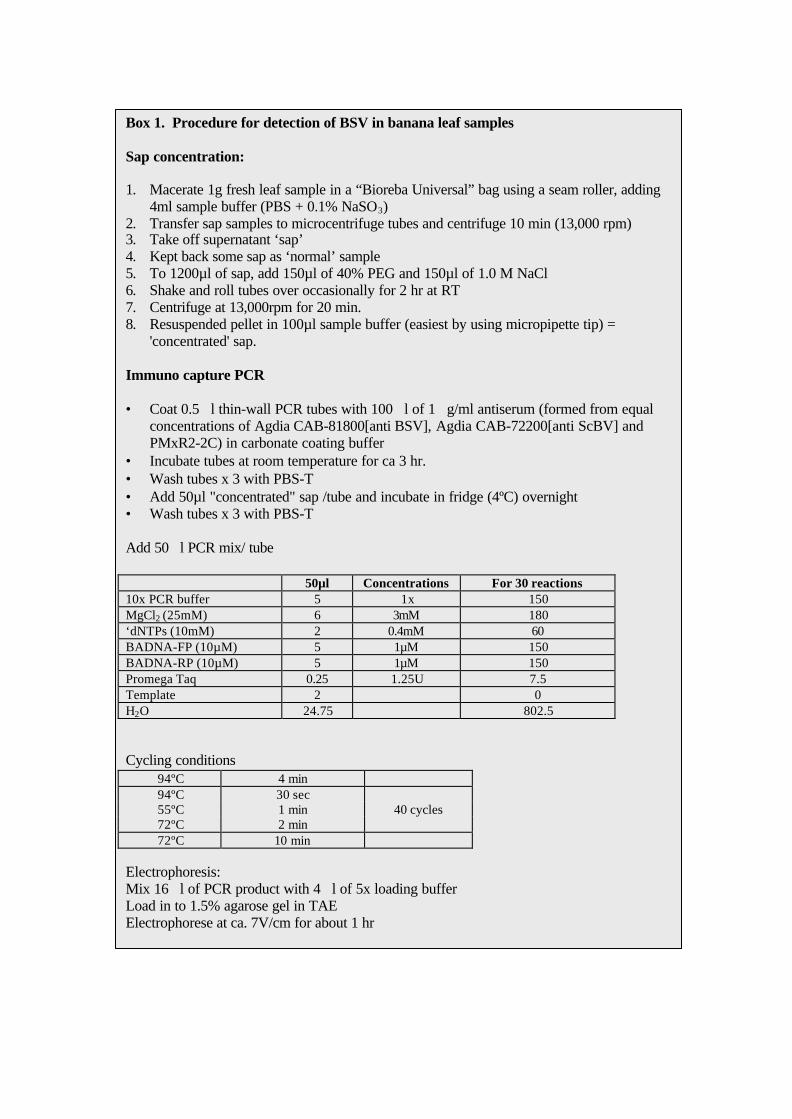
Box 1. Procedure for detection of BSV in banana leaf samples
Sap concentration:
1. Macerate 1g fresh leaf sample in a “Bioreba Universal” bag using a seam roller, adding4ml sample buffer (PBS + 0.1% NaSO3)
2. Transfer sap samples to microcentrifuge tubes and centrifuge 10 min (13,000 rpm)3. Take off supernatant ‘sap’4. Kept back some sap as ‘normal’ sample5. To 1200µl of sap, add 150µl of 40% PEG and 150µl of 1.0 M NaCl6. Shake and roll tubes over occasionally for 2 hr at RT7. Centrifuge at 13,000rpm for 20 min.8. Resuspended pellet in 100µl sample buffer (easiest by using micropipette tip) =
'concentrated' sap.
Immuno capture PCR
• Coat 0.5�l thin-wall PCR tubes with 100�l of 1�g/ml antiserum (formed from equalconcentrations of Agdia CAB-81800[anti BSV], Agdia CAB-72200[anti ScBV] andPMxR2-2C) in carbonate coating buffer
• Incubate tubes at room temperature for ca 3 hr.• Wash tubes x 3 with PBS-T• Add 50µl "concentrated" sap /tube and incubate in fridge (4ºC) overnight• Wash tubes x 3 with PBS-T
Add 50�l PCR mix/ tube
50µl Concentrations For 30 reactions10x PCR buffer 5 1x 150MgCl2 (25mM) 6 3mM 180‘dNTPs (10mM) 2 0.4mM 60BADNA-FP (10µM) 5 1µM 150BADNA-RP (10µM) 5 1µM 150Promega Taq 0.25 1.25U 7.5Template 2 0H2O 24.75 802.5
Cycling conditions94ºC 4 min94ºC 30 sec55ºC 1 min 40 cycles72ºC 2 min72ºC 10 min
Electrophoresis:Mix 16�l of PCR product with 4�l of 5x loading bufferLoad in to 1.5% agarose gel in TAEElectrophorese at ca. 7V/cm for about 1 hr