critical drivers of change for child-sensitive development ... - odi
TRANSCRIPT
Critical drivers of change for child-sensitive development
Report commissioned by Save the Children UK and UNICEF
Rachel Marcus, Paola Pereznieto, Erin Cullen and Patrick Carter
April 2012
Acknowledgements
The authors would like to thank Andrea Locatelli, Hanna Alder, Evie Browne and Chloe Brett for
their research assistance during the development of this report and Nicola Jones for very
helpful peer review comments.
Overseas Development Institute
111 Westminster Bridge Road
London SE1 7JD, UK
Tel: +44 (0)20 7922 0300
Fax: +44 (0)20 7922 0399
www.odi.org.uk
Disclaimer: The views presented in this paper
are those of the authors and do not necessarily
represent the views of ODI or our partners.
Critical drivers of change for child-sensitive development – Report commissioned by Save the Children UK and UNICEF
i
Contents
Contents i Tables, figures & boxes ii Abbreviations iv Executive summary vii
1 Introduction 1 1.1 The context 1 1.2 Why invest in children? 1 1.3 Methodology and focus of report 2 2 Global overview 3 3 Progress on key child-sensitive sectors 5 3.1 Child survival 5 3.2 Nutrition 14 3.3 Preventing mother-to-child transmission of HIV/AIDS 23 3.4 Water, sanitation and hygiene 30 3.5 Early childhood development 37 3.6 Education 44 3.7 Child protection 54 3.8 Multidimensional poverty reduction and progress across different dimensions of child
wellbeing 61 4 Drivers of progress 65 4.1 A supportive political and policy environment 65 4.2 Well-planned and implemented programmes 66 4.3 Resourcing 66 4.4 Role of growth 69 4.5 Social change 70 4.6 Increased availability of key technology and dissemination of ideas 70 5 Conclusions and recommendations 71
References 74
Critical drivers of change for child-sensitive development - Report commissioned by Save the Children UK and UNICEF
ii
Tables, figures & boxes
Tables
Table 1: Trends in primary school enrolment by region, 1998-2008 .................................... 44
Table 2: Changes in secondary gross enrolment rates and reductions in numbers of out-of-
school adolescents by region, 1999-2008 ........................................................................ 45
Figures
Figure 1: Proportion of people living on less than $1.25 a day, 1990 and 2005 (%) ............... 3 Figure 2: Under-five mortality rate, by MDG region, 1990 and 2010 (deaths per 1,000 live
births) .......................................................................................................................... 5 Figure 3: Official development assistance to child health and to maternal and newborn health,
Countdown countries, 2007 (2005 $ billions) .................................................................... 8 Figure 4: Global trends in nutrition-related aid, 1999-2009 (2009 constant $ millions) ......... 18 Figure 5: Aid for basic nutrition by region. ...................................................................... 19 Figure 6: Regional trends in aid for HIV/AIDS, 2000–2010 (constant 2009 $ millions) .......... 25 Figure 7: Commitments to HIV/AIDS as a share of social sector aid, 2000-2010 (%) ........... 25 Figure 8: Relationship between aid and rates of HIV among children in sub-Saharan Africa,
1995-2010 (population-weighted means per 1,000 population) ......................................... 26 Figure 9: Population using an improved, shared or unimproved sanitation facility, by MDG
region, 1990 and 2008 (%) .......................................................................................... 31 Figure 10: Population using piped drinking water on premises, other improved water source or
an unimproved source, by MDG region, 1990 and 2008 (%) ............................................. 32 Figure 11: Trends in school water and sanitation coverage, 2008-2010 (%) ....................... 33 Figure 12: Sanitation and drinking water aid commitments in relation to all other ODA
commitments, 2008 ($ billion) ...................................................................................... 34 Figure 13: Aid to ECD as a proportion of education aid, 2000-2010 (%) ............................. 40 Figure 14: Aid to ECD by region (constant 2009 $ million) ................................................ 40 Figure 15: Total bilateral and multilateral aid disbursements to education, 2002-2009
(constant 2009 $ billion) .............................................................................................. 47 Figure 16: Women aged 20–24 married or in union before age 18 by region (1987–2006) (%)
................................................................................................................................. 55 Figure 17: ODA to social sectors by sector, 2005-2008 (%) .............................................. 67
Boxes
Box 1: Progress in immunisation 6 Box 2: What is the relationship between aid and infant mortality? 9 Box 3: What is the relationship between aid and child malnutrition? 18 Box 4: Aid to HIV/AIDS – countries that have been effective in reducing HIV rates among
children are high aid recipients 26 Box 5: Some trends in water and sanitation 31 Box 6: Reducing primary school dropout in Tanzania 48 Box 7: Education and conflict in Afghanistan 49 Box 8: Universal birth registration 56
Case studies
Case Study 1: Improvements in mother and child health in Bangladesh ............................. 11
Case Study 2: Brazil – a multifaceted approach to improving children‘s nutrition ................. 20
Case Study 3: Preventing mother–to-child transmission of HIV/AIDS in Botswana ............... 27
Case Study 4: Fit for School in the Philippines – a model for simple, scalable and sustainable
school health to promote child wellbeing ........................................................................ 35
Case Study 5: Reducing inequalities – ECD programmes in Chile ....................................... 41
Critical drivers of change for child-sensitive development – Report commissioned by Save the Children UK and UNICEF
iii
Case Study 6: Rapid and equitable expansion in primary and secondary education in Ethiopia
................................................................................................................................. 51
Case Study 7: Post-conflict child protection in Sierra Leone .............................................. 56
Case Study 8: Child labour in India ................................................................................ 58
Case Study 9: Exceptional poverty reduction and multi-sectoral development with positive
impacts on children in Vietnam ..................................................................................... 61
Critical drivers of change for child-sensitive development - Report commissioned by Save the Children UK and UNICEF
iv
Abbreviations
3iE International Initiative for Impact Evaluation
AfDB African Development Bank
AIDS Acquired Immune Deficiency Syndrome
ALC Accelerated Learning Class
ARV Antiretroviral AusAID Australian Agency for International Development
BRAC Building Resources Across Communities CASH Know Your Child Programme CCT Conditional Cash Transfer
CDC Centres for Disease Control CEmOC Comprehensive Emergency Obstetric Care
CPN Child Protection Network
CPRC Chronic Poverty Research Centre CRS Creditor Reporting System
CSUCS Coalition to Stop the Use of Child Soldiers DAC Development Assistance Committee
DDR Disarmament, Demobilisation and Reintegration DFID UK Department for International Development DHS Demographic Health Survey
EC European Commission
ECLAC Economic and Social Commission for Latin America and the Caribbean
ECD Early Childhood Development EHCP Essential Health Care Programme EPI Expanded Programme on Immunisation
EU European Union
FDI Foreign Direct Investment
FGM/C Female Genital Mutilation/Cutting FIT Fit for School GAVI Global Alliance for Vaccines and Immunization
GDP Gross Domestic Product GIZ German Agency for International Cooperation
GoB Government of Bangladesh HAART Highly Active Antiretroviral Therapy HCFP Health Care Fund for the Poor
HIV Human Immunodeficiency Virus
HRRAC Human Rights Research and Advocacy Consortium
IDA International Development Association IFSN International Food Security Network
ILO International Labour Organization IMCI Integrated Management of Childhood Illness IMF International Monetary Fund
INDUS Indo-US Child Labour Project
IPEC International Programme for the Elimination of Child Labour
IRC International Rescue Committee JUNJI National Nursery Schools Council Programme MDG Millennium Development Goal
MICS Multiple Indicator Cluster Survey
MMWR Morbidity and Mortality Weekly Report
MNCH Maternal, Newborn and Child Health
Critical drivers of change for child-sensitive development – Report commissioned by Save the Children UK and UNICEF
v
MoFED Ministry of Finance and Economic Development MoH Ministry of Health
MOLISA Ministry of Labour, Invalids and Social Affairs NCLP National Child Labour Project
NCPCR National Commission for the Protection of Child Rights
NGO Non-governmental Organisation ODA Official Development Assistance
ODI Overseas Development Institute
OECD Organisation for Economic Development ORT Oral Rehydration Therapy
PBS Protecting Basic Services
PMNCH Partnership for Maternal, Newborn and Child Health
PMTCT Prevention of Mother-to-child Transmission PPP Purchasing Power Parity SLTRC Sierra Leone Truth and Reconciliation Commission
SRV Socialist Republic of Vietnam SWAp Sector-wide Approach
UCW Understanding Child Work UK United Kingdom
UN United Nations
UNAIDS Joint UN Programme on HIV/AIDS
UNCRC UN Convention on the Rights of the Child
UNDP UN Development Programme
UNESCO UN Educational, Scientific and Cultural Organization UNFPA UN Population Fund
UNHCR UN High Commissioner for Refugees UNIAGCME UN Inter-Agency Group on Child Mortality Estimation
UNICEF UN Children‘s Fund
UNSCN UN Standing Committee on Nutrition
US United States
USAID US Agency for International Development USDoL US Department of Labor
VASS Vietnamese Academy of Social Sciences WFP World Food Programme
WHO World Health Organization

Critical drivers of change for child-sensitive development – Report commissioned by Save the Children UK and UNICEF
vii
Executive summary
Introduction
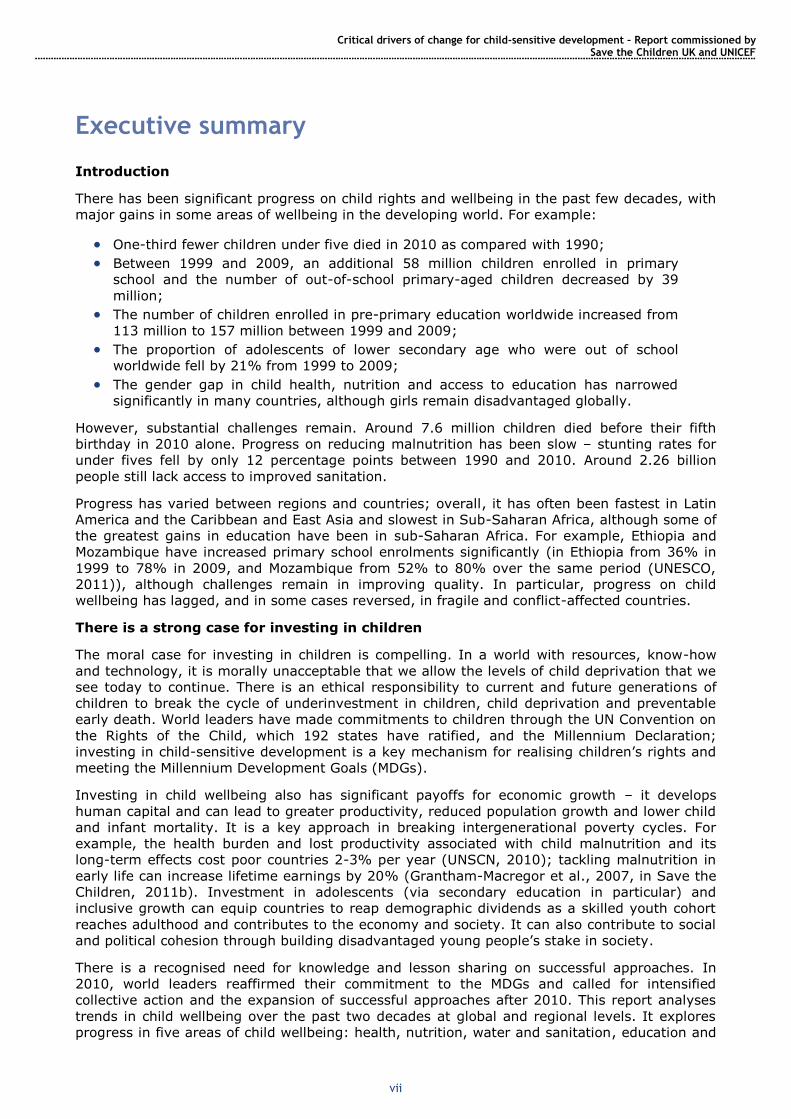
There has been significant progress on child rights and wellbeing in the past few decades, with
major gains in some areas of wellbeing in the developing world. For example:
One-third fewer children under five died in 2010 as compared with 1990;
Between 1999 and 2009, an additional 58 million children enrolled in primary
school and the number of out-of-school primary-aged children decreased by 39
million;
The number of children enrolled in pre-primary education worldwide increased from
113 million to 157 million between 1999 and 2009;
The proportion of adolescents of lower secondary age who were out of school
worldwide fell by 21% from 1999 to 2009;
The gender gap in child health, nutrition and access to education has narrowed
significantly in many countries, although girls remain disadvantaged globally.
However, substantial challenges remain. Around 7.6 million children died before their fifth
birthday in 2010 alone. Progress on reducing malnutrition has been slow – stunting rates for
under fives fell by only 12 percentage points between 1990 and 2010. Around 2.26 billion
people still lack access to improved sanitation.
Progress has varied between regions and countries; overall, it has often been fastest in Latin
America and the Caribbean and East Asia and slowest in Sub-Saharan Africa, although some of
the greatest gains in education have been in sub-Saharan Africa. For example, Ethiopia and
Mozambique have increased primary school enrolments significantly (in Ethiopia from 36% in
1999 to 78% in 2009, and Mozambique from 52% to 80% over the same period (UNESCO,
2011)), although challenges remain in improving quality. In particular, progress on child
wellbeing has lagged, and in some cases reversed, in fragile and conflict-affected countries.
There is a strong case for investing in children
The moral case for investing in children is compelling. In a world with resources, know-how
and technology, it is morally unacceptable that we allow the levels of child deprivation that we
see today to continue. There is an ethical responsibility to current and future generations of
children to break the cycle of underinvestment in children, child deprivation and preventable
early death. World leaders have made commitments to children through the UN Convention on
the Rights of the Child, which 192 states have ratified, and the Millennium Declaration;
investing in child-sensitive development is a key mechanism for realising children‘s rights and
meeting the Millennium Development Goals (MDGs).
Investing in child wellbeing also has significant payoffs for economic growth – it develops
human capital and can lead to greater productivity, reduced population growth and lower child
and infant mortality. It is a key approach in breaking intergenerational poverty cycles. For
example, the health burden and lost productivity associated with child malnutrition and its
long-term effects cost poor countries 2-3% per year (UNSCN, 2010); tackling malnutrition in
early life can increase lifetime earnings by 20% (Grantham-Macregor et al., 2007, in Save the
Children, 2011b). Investment in adolescents (via secondary education in particular) and
inclusive growth can equip countries to reap demographic dividends as a skilled youth cohort
reaches adulthood and contributes to the economy and society. It can also contribute to social
and political cohesion through building disadvantaged young people‘s stake in society.
There is a recognised need for knowledge and lesson sharing on successful approaches. In
2010, world leaders reaffirmed their commitment to the MDGs and called for intensified
collective action and the expansion of successful approaches after 2010. This report analyses
trends in child wellbeing over the past two decades at global and regional levels. It explores
progress in five areas of child wellbeing: health, nutrition, water and sanitation, education and
Critical drivers of change for child-sensitive development - Report commissioned by Save the Children UK and UNICEF
viii
child protection, presents case studies of progress in each of these areas and examines the key
drivers that have underpinned successes, with a particular focus on resourcing and the role of
aid. It aims to present only an overview of these five areas, and the discussion on each area is
necessarily brief.1 Considering what can be achieved through child-sensitive policies and
programmes, this report aims to encourage governments and donors to strengthen their
support to child-sensitive development.
Drivers of progress
A number of factors lie behind the significant progress in child wellbeing documented in the
report. Our analysis identifies the following as most critical:
Supportive policy environments with effective sector programmes
High-level political leadership, institutionalised into adequately resourced programmes that
have sustained momentum even through changes of government, has been vital (see Case
Studies 1 and 2 on Bangladesh and Brazil). Progress for children has occurred where
governments have translated ambitious policy commitments into detailed programmes that
make linkages between sectors, and have invested in the capacity to implement them (see
Case Studies 2, 5, 6 and 9 on Brazil, Chile, Ethiopia and Vietnam). In aid-recipient countries,
donor alignment behind these strategies has provided vital resources and avoided
overburdening governments with competing donor demands.
Acceptance that non-governmental organisations (NGOs) and donors can play an important
role in filling gaps in government provision, where they work collaboratively with government
structures, is another key piece of the jigsaw (see Box 7 on Afghanistan and Case Studies 7
and 8 on Sierra Leone and India). Developing a supportive policy environment is particularly
challenging in fragile states and conflict-affected countries; the report identifies some positive
examples, such as ceasefires to allow immunisation of infants and collaborative working
between parties in Sierra Leone and Afghanistan.
Resourcing
Domestic (government) funding has generally led improvements, but aid has played an
important role, particularly in low-income countries. Our primary data analysis suggests that,
in sub-Saharan Africa, high-aid countries have experienced greater reductions in infant
mortality, malnutrition and the numbers of children living with HIV/AIDS than low-aid
countries.2 This is based on a correlation and is not proof that aid caused these improvements;
it is, however, clear that there is an association between aid and improved child wellbeing.
The significance of aid varies considerably across the sectors and contexts studied. For
example, in some low-income African countries, aid provides as much as 25% of the education
budget; in many middle-income countries, its effect is essentially catalytic, helping to promote
knowledge sharing on good practices. In both contexts, aid is most effective for children where
national commitments to child wellbeing already exist and aid can strengthen and facilitate the
implementation of effective programmes and services. No analysis could be found as to how
far greater alignment of aid with sector strategies and budget support have affected progress
on child wellbeing, although some of our case studies indicate that donor support to sector
plans has been important in particular areas (e.g. health in Bangladesh, education in Ethiopia).
Social change and technological innovation
Progress on gender equality has played an important role in improving child survival, nutrition
and educational outcomes. The rapid growth of telecommunications, in particular, has
facilitated the dissemination of key ideas (such as the value of investing in children) and
specific information, such as health information, and contributed to improved livelihoods.
1 Given the short timeframe for this report (30 person days) it was not possible to examine all possible drivers of progress in depth; the report focuses on the role of resourcing and aid, as these were of particular interest to the 2 Our quantitative analysis was conducted only for sub-Saharan Africa, because the large number of countries with available data made cross-country analysis possible, unlike other regions. See Annex 2 for full details.
Critical drivers of change for child-sensitive development – Report commissioned by Save the Children UK and UNICEF
ix
Economic growth
The role of economic growth in social development continues to be debated: although high
levels of growth are neither necessary nor sufficient for improvements in child wellbeing,
stagnation and economic decline are associated with declining child wellbeing. Our case studies
(Bangladesh (1), Brazil (2), Ethiopia (6) and Vietnam (9)) and sectoral analysis indicate that,
where growth has expanded resource envelopes and enabled social investment, it has been an
important driver of improvements. However, it is ambitious sector policies, with adequately
resourced programmes and capacity to implement them, that have been critical in converting
growth into improved child wellbeing.
Ongoing gaps and challenges
Progress has been limited in some areas of child wellbeing. In particular, it has lagged on
nutrition, water and sanitation and protecting children from abuse and exploitation. Globally,
the rate of child stunting reduced by only 0.65 percentage points annually between 1990 and
2010 (Save the Children, 2011b). The number of child labourers fell only 3% between 2004
and 2008, meaning that 215 million children are still at risk of hazardous and/or exploitative
work (Diallo et al., 2010).
The scale of the problem is still huge. Global levels of child mortality remain extremely high,
with 7.6 million children under five dying in 2010 alone (UIAGCME, 2011). In 2009, only 35%
of babies with HIV/AIDS received life-saving antiretroviral drugs (ARVs) (UNAIDS, 2010b). A
total of 68 million primary school-age children worldwide were not in school in 2008, and, if
current trends continue, with population growth, there could be 72 million children3 out of
school in 2015 (UNESCO, 2011). In sub-Saharan Africa and the Middle East and North Africa,
gross enrolment rates for pre-primary education remain extremely low – 14% and 17%,
respectively, in 2005 (UNESCO, 2008).
Progress has been particularly slow in conflict-affected countries. These are home to 18% of
the world‘s primary school-age children, but 42% of the world‘s out-of-school primary school-
age children (UNESCO, 2011). Almost 70% of the countries with the highest burden of child
mortality have experienced conflict in the past two decades (Save the Children, 2010a).
Recommendations
Further progress on child wellbeing depends on multifaceted action. Our thematic and case
study analysis clearly shows a need for a combination of action on underlying causes (e.g.
poverty, inequality, gender inequality) and actions specific to particular sectors. For example,
improving child survival rates depends on action on underlying social determinants of ill health,
such as poverty and gender inequality, and simultaneous strengthening of health systems, to
improve their accessibility to disadvantaged families and the quality of the health care they
provide to children and mothers.
Child wellbeing indicators have often improved most where there has been simultaneous
investment in education, health, poverty reduction and water and sanitation; the combined
effect can be significantly more than the effect of interventions in individual sectors (Mehrotra,
2004). Sequencing of investment can be important; typically, early investment in education
underpins later gains in health and nutrition (Mehrotra, 2004; Case Study 2 on Brazil). Social
protection programmes – particularly cash transfers – are an example of a single type of
intervention that can contribute to improved child wellbeing on several fronts simultaneously –
reducing rates of income poverty, improving school attendance rates and contributing to
reduced child labour and improved health and nutrition. However, social protection
programmes should not be considered a magic bullet – their effectiveness in terms of child
wellbeing depends on there being adequate health and education services.
3 Out-of-school children refers to children of primary school age not enrolled in either primary or secondary school. The ages of children concerned vary from country to country depending on different ages for entry and lengths of the primary cycle.
Critical drivers of change for child-sensitive development - Report commissioned by Save the Children UK and UNICEF
x
Sustained progress on child wellbeing is dependent on filling resourcing gaps
Significant financing gaps remain to meet the child-related MDGs in health, nutrition, education
and sanitation. Varied methodologies for estimating these gaps have generated different
results, so precise gaps are best identified at country level. Financing gaps must be filled by a
combination of increased aid and increased mobilisation of domestic resources. For low- and
lower-income countries in particular, it is challenging and in many cases unaffordable to
allocate the necessary level of resources to make significant progress across different sectors
simultaneously while maintaining adequate levels of quality. Aid resources should continue to
support governments to finance some of these investments, in modalities that can maximise
their effectiveness (e.g. budget or sector support). In middle-income countries, a combination
of increased resource mobilisation and a greater focusing of resources on the most
disadvantaged children is critical both to meet the MDGs and for long-term social and
economic development.
A greater focus on addressing inequalities is needed
The poorest children are at most risk of early death, malnutrition, school non-attendance and
violations of rights. Gender inequalities in access to education, child survival and, in some
countries, nutrition remain. Globally, girls are more likely to be missing out on school,
although boys are at greater risk of involvement in hazardous labour, and adolescent boys and
young men are at the greatest risk of violent death. Although investing in the most
disadvantaged children can be resource-intensive (e.g. in terms of extending services to
remote rural areas or underserved slums), given that levels of wellbeing are often substantially
lower among disadvantaged groups it can simultaneously be most cost-effective in terms of
overall development impact and increase the likelihood of meeting the MDGs. Two key
approaches are needed:
Reducing inequalities involves focusing aid more tightly on countries with high
prevalence of child ill-being
Many of the worst child wellbeing indicators, such as high child mortality or malnutrition rates
are concentrated in low-income countries. Analysis indicates that an approach to reducing child
mortality focused on low-income, high-mortality countries has the potential to avert 60% more
deaths than current approaches (UNICEF, 2010c); aid to safe water and sanitation also needs
to be focused more narrowly on poorer countries. Where middle-income countries have a
significant burden of child ill-being and lack the resources to address it, such as high HIV
prevalence in middle-income countries of Southern Africa, strategies need to be tailored
accordingly.
Much greater investment is necessary in disadvantaged groups within both middle-
income and poor countries
This is particularly important for addressing social exclusion. Vietnam‘s efforts to target
programmes to disadvantaged ethnic minorities, Bangladesh‘s experience in reducing sex
differentials in child mortality and Brazil‘s experience in reducing malnutrition and child
mortality among the poorest quintiles and parts of the country are instructive.
Critical drivers of change for child-sensitive development – Report commissioned by Save the Children UK and UNICEF
1
1 Introduction
1.1 The context There has been significant progress on child rights and wellbeing in developing countries in the
past few decades, with major gains in some areas of wellbeing. For example:
One-third fewer children under five died in 2010 as compared with 1990;
Between 1999 and 2009, an additional 58 million children enrolled in primary
school and the number of out-of-school primary-aged children decreased by 39
million;
The number of children enrolled in pre-primary education worldwide increased from
113 million to 157 million between 1999 and 2009;
The proportion of adolescents of lower secondary age who were out of school
worldwide fell by 21% from 1999 to 2009.
In 2010, at the Millennium Development Goals (MDGs) Summit world leaders reaffirmed their
commitment to the MDGs and called for intensified collective action, a reaffirmed global
partnership, and the continuation of proven successful approaches after 2010 (United Nations,
2010). This report synthesises approaches that could be adopted or expanded to achieve
greater progress on child wellbeing. Given how much can be achieved through child-sensitive
policies and programmes, the report aims to encourage governments and donors to strengthen
their support to child-sensitive development.
1.2 Why invest in children?
Economic arguments
Expenditure on policies and programmes that foster universal and quality education and health
services, boost nutrition and increase access to improved water and sanitation represents an
investment in human capital. It increases individuals‘ productive capacities and therefore their
potential income (Becker, 1993) and their contribution to overall development. Social
investment underpins economic development and productivity (as in East Asia‘s rapid growth
in the 1970s and 1980s, for example). Educated, qualified and healthy workers can better
contribute to economic growth, since they are better equipped to assimilate the new
knowledge and skills required by a rapidly changing economic environment. In turn, economic
growth – when distributed equitably – widens the resource base of a society, enabling a
virtuous cycle of sustained investments in people and increases in productivity, which feed
back into economic growth (Mehrotra and Jolly, 1997; see also Case Study 9 on Vietnam for a
discussion). Mutually supportive economic and social policy can reduce inequality, which has
been proven to facilitate economic growth and leads to greater poverty reduction.
Investment in children – via social services and via ensuring households have adequate
livelihoods – can play a particular role in breaking intergenerational poverty cycles (Harper et
al., 2003). For example, ensuring adequate nutrition for children under two can have major
economic spinoffs in terms of health gains, greater education completion rates and greater
earnings in later life. Experimental evidence suggests that tackling malnutrition in early life can
increase adult earnings by an average of 20% (Grantham-Macgregor et al., 2007, in Save the
Children, 2011b); and the health burden and poor productivity associated with malnutrition are
estimated to cost poor countries 2-3% of gross domestic product (GDP) per year (UNSCN,
2010). World Bank analysis indicates that, if Ugandan girls who currently complete only
primary school completed secondary school, they would contribute an additional 34% of GDP
over their working lives (Hempel and Cunningham, 2010).
Ethical arguments
It is simply morally unacceptable that, in a world with the money, know-how and technology
we have at our disposal, 7.6 million children under five die a year of largely preventable
Critical drivers of change for child-sensitive development - Report commissioned by Save the Children UK and UNICEF
2
diseases and 67 million children miss out on their right to basic education and millions more
endure schooling of such poor quality it does not equip them with basic literacy and numeracy.
Investment in key social sectors should be an ethical imperative for any country that upholds
human rights, since it is a key instrument in the implementation of social and economic rights.
Moreover, 192 states have ratified the UN Convention on the Rights of the Child (UNCRC),
Article 4 of which establishes that ‗States Parties have the obligation of undertaking measures
to the maximum extent of their available resources and, where needed, within the framework
of international cooperation‘ to ensure the fulfilment of children‘s rights (UN, 1989). This
statement obligates both governments and the international community to contribute to the
achievement of children‘s rights, by incorporating provisions related to these rights into
national legal and policy frameworks and programme and expenditure plans.
Political arguments
Inadequate social investment, high levels of inequality and severe poverty together hinder
development and can undermine social cohesion, as has been seen in popular protests in
several Arab countries in 2011/12. Social investment and sustained human development, on
the other hand, widen opportunities for broad sectors of the population, opening up channels
for social mobility and generating stable processes of social integration.
To accelerate the progress already achieved, as documented in Sections 2 and 4, investing in
children should be upheld as an essential priority, to achieve the rights of children today and to
contribute to more stable and prosperous countries in the near future.
1.3 Methodology and focus of report
This report is based on a desk review and analysis of primary and secondary data carried out
through 30 person-days between August and October 2011. It was motivated by a desire to
identify trends in child wellbeing in the past two decades, document successes and identify the
factors that contributed to this, with a particular emphasis on resourcing and the role of aid.
The research involved collation of existing evidence on trends in child wellbeing, identification
of case studies of significant improvements in child wellbeing and analysis of the factors
underpinning successes based on secondary sources. This was complemented by analysis of
primary data on trends in aid to particular sectors and countries and on the relationship
between aid and aspects of child wellbeing.
Given the short time available for this project, the report is intended to paint a ‗broad
brushstroke‘ picture of research findings on all the above areas. Some areas, such as
governance, where there is a large literature, cannot be discussed in depth, despite their
importance to child wellbeing.
The report provides an overview of trends in income poverty globally (Section 2). It then
explores progress achieved in five areas that are linked closely to child wellbeing: health
(focusing on child survival and prevention of maternal to child transmission of HIV/AIDS);
nutrition; water and sanitation; education (including early childhood development); and child
protection (Section 3). For each area, we present an overview of progress in the developing
world, highlight the factors that have contributed to progress and outline some of the
challenges that remain. One or more case studies of achievements in child wellbeing are
discussed in relation to each area. These were selected to reflect a diversity of contexts (low-
income, middle-income, fragile state and regions of the world). An additional case study
illustrates a multidimensional child development policy approach to show the benefits of
employing a comprehensive policy framework that promotes synergies between different
aspects of child development. Section 4 consolidates the analysis of the key drivers of
improvements in child wellbeing and Section 5 outlines conclusions and recommendations for
policy and programming. Annex 1 presents a number of graphs on trends in child wellbeing
and Annex 2 outlines the methodology used for the primary quantitative analysis.
Critical drivers of change for child-sensitive development – Report commissioned by Save the Children UK and UNICEF
3
2 Global overview
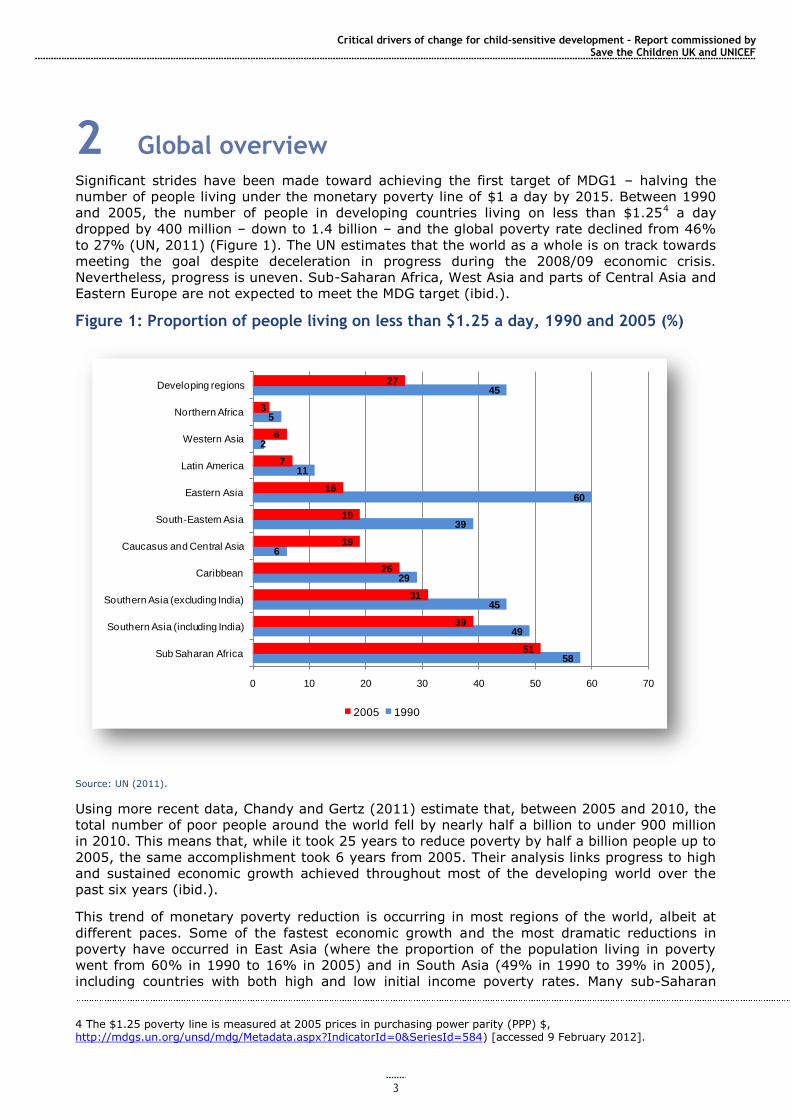
Significant strides have been made toward achieving the first target of MDG1 – halving the
number of people living under the monetary poverty line of $1 a day by 2015. Between 1990
and 2005, the number of people in developing countries living on less than $1.254 a day
dropped by 400 million – down to 1.4 billion – and the global poverty rate declined from 46%
to 27% (UN, 2011) (Figure 1). The UN estimates that the world as a whole is on track towards
meeting the goal despite deceleration in progress during the 2008/09 economic crisis.
Nevertheless, progress is uneven. Sub-Saharan Africa, West Asia and parts of Central Asia and
Eastern Europe are not expected to meet the MDG target (ibid.).
Figure 1: Proportion of people living on less than $1.25 a day, 1990 and 2005 (%)
Source: UN (2011).
Using more recent data, Chandy and Gertz (2011) estimate that, between 2005 and 2010, the
total number of poor people around the world fell by nearly half a billion to under 900 million
in 2010. This means that, while it took 25 years to reduce poverty by half a billion people up to
2005, the same accomplishment took 6 years from 2005. Their analysis links progress to high
and sustained economic growth achieved throughout most of the developing world over the
past six years (ibid.).
This trend of monetary poverty reduction is occurring in most regions of the world, albeit at
different paces. Some of the fastest economic growth and the most dramatic reductions in
poverty have occurred in East Asia (where the proportion of the population living in poverty
went from 60% in 1990 to 16% in 2005) and in South Asia (49% in 1990 to 39% in 2005),
including countries with both high and low initial income poverty rates. Many sub-Saharan
4 The $1.25 poverty line is measured at 2005 prices in purchasing power parity (PPP) $, http://mdgs.un.org/unsd/mdg/Metadata.aspx?IndicatorId=0&SeriesId=584) [accessed 9 February 2012].
58
49
45
29
6
39
60
11
2
5
45
51
39
31
26
19
19
16
7
6
3
27
0 10 20 30 40 50 60 70
Sub Saharan Africa
Southern Asia (including India)
Southern Asia (excluding India)
Caribbean
Caucasus and Central Asia
South-Eastern Asia
Eastern Asia
Latin America
Western Asia
Northern Africa
Developing regions
2005 1990
Critical drivers of change for child-sensitive development - Report commissioned by Save the Children UK and UNICEF
4
African countries have also made significant progress (UN, 2011). In 2008, the region as a
whole moved below the 50% poverty rate, and its number of poor has been falling for the first
time on record (Chandy and Gertz, 2011). The global extreme poverty rate is expected to fall
below 36% by 2015 (UN, 2011).
China and India alone are responsible for the reduction by three-quarters in the world‘s poor
expected to take place over the period 2005-2015. Other countries home to large poor
populations, many of them now classed as lower-middle-income countries – Bangladesh,
Brazil, Indonesia, Pakistan and Vietnam, and Ethiopia (a low-income country) have also
experienced significant reductions in their poverty rates. However, because most countries
with large poor populations are considered middle-income as a result of growth in recent
years, 72% of the world‘s poor are now living in middle-income countries, as are 71% of
malnourished children and 56% of primary-age children out of school (Sumner, 2010).
Progress has not been uniform: there have been limited improvements on monetary poverty in
one-third of countries (ODI, 2010a) and an increase in the number of people living in chronic
poverty. There is a danger that successes in poverty reduction may be achieved largely by
addressing the needs of those closest to the poverty line, who are comparatively easier and
less expensive to reach (CPRC, 2009). This would explain worsening levels of chronic poverty
amid a reduction in overall poverty levels. Meanwhile, income inequality is growing. Poor
countries have been growing more slowly than rich ones, which has left global income
considerably skewed (Kenny, 2011). Furthermore, while stable countries are showing progress,
poverty and child deprivation are becoming increasingly concentrated in fragile and conflict-
afflicted states.5
In addition to reductions in monetary poverty, every region of the world, including both those
with stagnant economies and those with vibrant economies, has seen improvements in
average levels of health and education over the past half century (see Section 3). Similarly,
most countries, regardless of economic performance, have seen progress on gender equality
and civil and political rights. Progress on quality of life has been particularly rapid in some of
the countries previously the furthest behind (Kenny, 2011), indicating that, with commitment,
rapid advances are possible. Despite this, there are some concerns: for example, global
violence is widespread and education quality has remained extremely low in many developing
countries. Nevertheless, a growing number of people live a better quality of life compared with
50 or more years ago (ibid.).
Children are disproportionately likely to be living in poverty (since poor households tend to
have more children than non-poor households) and, as such, are likely to have benefited from
the reduction in overall poverty rates noted above. However, monetary poverty measures do
not capture the actual deprivations children may face6 (such as poor health, malnutrition, lack
of access to safe water or sanitation, etc.), which are affected by a range of factors beyond
income and wealth. Trends in these different aspects of child wellbeing, and the factors
underlying those trends, are the focus of the next section.
5 Estimates of the population living in fragile and conflict-affected states are contested. Chandy and Gertz (2011) estimate that 40% of the world‘s poor live in fragile states, and that the proportion will exceed 50% by 2015. Sumner (2010) estimates that 23% of the world‘s poor live in fragile states, evenly split between fragile low- and middle-income countries.
6 A number of other measures and analyses have been developed in recent years to document and analyse trends in the different components of child wellbeing, either separately or in aggregate. These include the UN Children‘s Fund (UNICEF)/Bristol University measure of child poverty developed by Gordon et al. (2003), which has informed UNICEF‘s Global Child Poverty Study and takes into account deprivations in education, health, nutrition, water, sanitation, shelter, information and income/consumption; and Save the Children UK‘s Child Development Index, which involves analysis of nutrition, child mortality and education (Hague, 2008). Other relevant measures include those focused on human development more broadly, such as the UN Development Programme‘s (UNDP‘s) Multidimensional Poverty Index, which, though not child-specific, incorporates dimensions such as nutrition, child mortality, education and living standards (http://hdr.undp.org/en/statistics/mpi/ [accessed 11 February 2012]) or MDG Progress Charts, such as http://mdgs.un.org/unsd/mdg/Resources/Static/Products/Progress2011/11-31330%20%28E%29%20MDG%20Report%202011_Progress%20Chart%20LR.pdf [accessed 11 February 2012].
Critical drivers of change for child-sensitive development – Report commissioned by Save the Children UK and UNICEF
5
3 Progress on key child-sensitive sectors
This section presents an overview of progress in five key sectors for child wellbeing, illustrated
by case studies which identify promising practices that have contributed to positive
achievements for children.
3.1 Child survival
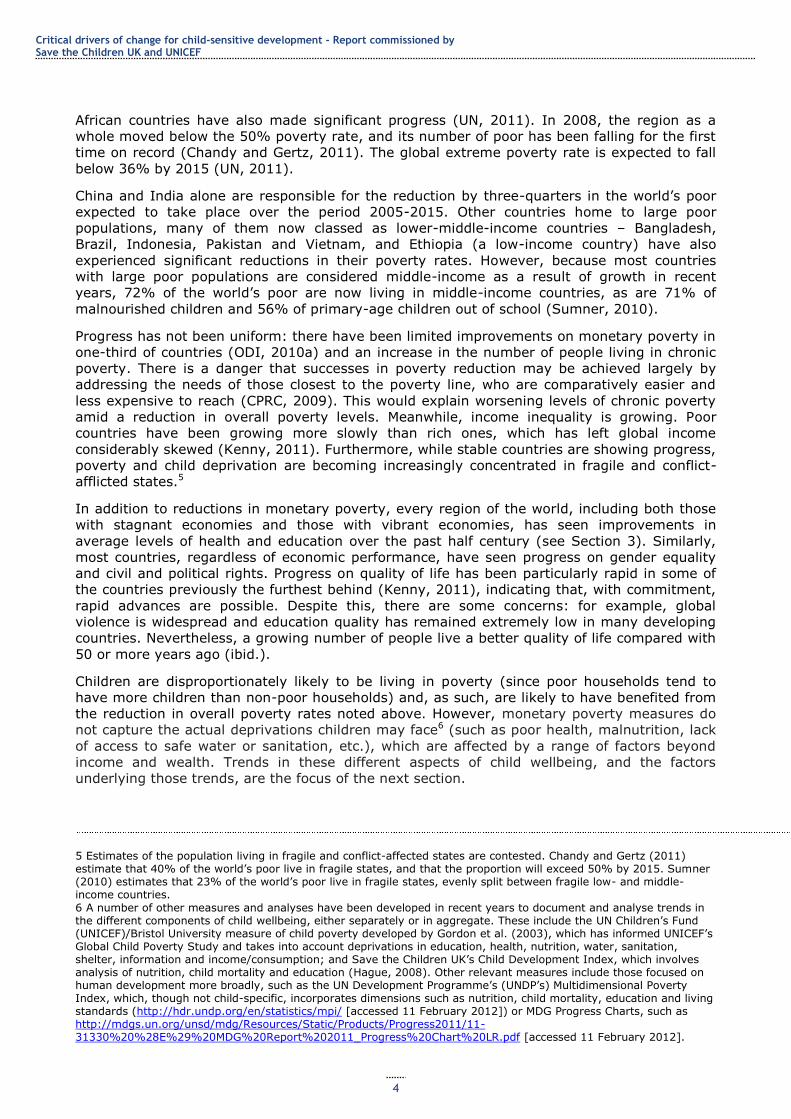
Child mortality rates have fallen substantially since 1990, when 12.4 million children under five
died (UNIAGCME, 2010). In 2009, nearly 12,000 fewer children died every day than in 1990.
Globally, the annual rate of reduction doubled from 1.4% annually in the 1990s to 2.8% in the
2000s (ibid.). It also doubled in sub-Saharan Africa over this period (UNIAGCME, 2011). Figure
2 shows progress by region (see also Figure A.1, Annex 1).
Ten of the countries with the highest child mortality rates have managed to cut child deaths by
half. One of these, Bangladesh, achieved a 65% reduction in child mortality between 1990 and
2009. How this was achieved is discussed in Case Study 1 below.
Although there has been significant progress in reducing child mortality, there is an extremely
long way to go: 7.6 million children under five died in 2010, half of whom were in sub-Saharan
Africa and another third in South Asia (UNIAGCME, 2011). The sub-section on ongoing
challenges below discusses some ways that progress towards reducing child mortality could be
achieved.
Figure 2: Under-five mortality rate, by MDG region, 1990 and 2010 (deaths per 1,000 live births)
Source: UNIAGCME (2011).
How has progress in reducing child mortality been achieved?
Achievements in child mortality have been underpinned by action on both health systems and
structural/social causes of ill-health.
Critical drivers of change for child-sensitive development - Report commissioned by Save the Children UK and UNICEF
6
Health system-related progress
Equitable investment in health care systems to improve the quality and increase the
accessibility of health care is critical. Investing in provision in remote rural areas and making
health care free to all, as in Brazil (Victora et al, 2011a), or to key groups such as pregnant
women and children, as in Ghana and Niger (Save the Children, 2010a), has played an
important role in extending access to care, both for antenatal, delivery and postnatal care and
for other illnesses, to geographically remote and socially disadvantaged communities.
Typically, this has involved investment in expanding the numbers and improving the training
and skills of health workers and ensuring that as much key health care as possible can be
provided at community level.7
Integrated management of childhood illness (IMCI) at community level (including improved
health worker skills in treating childhood illness, sensitisation or public education on prevention
of childhood illness and promotion of greater community awareness on which types of illness
need medical attention and how to treat less serious illnesses effectively at home) is another
key factor. For example, in Madagascar, in the areas where IMCI has been introduced,
exclusive breastfeeding increased from 22% to 58.5%; 78% of all households began using
mosquito nets and immunisation coverage leapt from 31% to 97%.8
Use of effective preventative approaches, often driven by improvements in the
availability or affordability of medical technologies: 131 countries now have over 90%
immunisation coverage for diphtheria, tetanus and pertussis (major preventable childhood
diseases), as compared with 63 countries in 1990 (MMWR, 2011) (see Box 1). There has also
been significant progress in vitamin A supplementation which, by boosting children‘s immunity,
can reduce their risk of death from all causes by about 23% (UNSCN, 2010). In malaria-
affected countries, use of insecticide-treated bed nets has been shown to effectively prevent
malaria, which is responsible for 15% of deaths of children under five worldwide (Black et al.,
2010).
Box 1: Progress in immunisation
Immunisation coverage for six major vaccine-preventable diseases – pertussis, childhood tuberculosis, tetanus, polio, measles and diphtheria – has risen significantly since the World Health Organization
(WHO)‘s Expanded Programme on Immunisation (EPI) began in 1974. In 1974, only 5% of the world‘s children were immunised against the six key vaccine-preventable diseases. By 1980, DTP3 (three doses of vaccinations against diphtheria, tetanus and polio) coverage in the first year of life was estimated at 20% of the world's children; it had increased to an estimated 85% by the end of 2010. Polio is on the verge of eradication. Deaths from measles, a major killer of children under five, declined by 78% worldwide and by 92% in sub-Saharan Africa between 2000 and 2008 (CDC, 2009). Immunisation against tetanus has saved hundreds of thousands of mothers and newborns, and 20 low- and middle-
income countries have eliminated maternal and neonatal tetanus.9
New immunisations have been introduced in recent years, protecting children against pneumococcal disease and rotavirus (the cause of 50% of diarrhoea, the foremost killer of young children). Provision of these vaccines in 40 low-income countries should avert up to 7 million deaths.10
Donors have played a significant role in progress on immunisation: WHO and UNICEF have been major funders of national immunisation programmes, typically with increasing contributions of developing country governments over time. Since the formation of the GAVI Alliance (formerly Global Alliance for
Vaccines and Immunization)11
(a public–private partnership dedicated to increasing levels of
7 www.who.int/pmnch/topics/part_publications/essential_interventions_18_01_2012_executive_summary.pdf [accessed 4 February 2012]. 8 www.unicef.org/health/index_imcd.html [accessed 4 February 2012]. 9 www.childinfo.org/immunization.html [accessed 28 September 2011]. 10 www.gavialliance.org/advocacy-statistics/ [accessed 29 September 2011]. 11 In the 1990s, there was a severe withdrawal of donor funding for immunisations after UNICEF announced the successful achievement of the 80% coverage target of the Universal Childhood Immunisation campaign. Due to a change in WHO leadership, new diseases such as HIV/AIDS and donor fatigue, global coverage of the six traditional vaccines dropped to 75% by 2000, and in some places DTP3 coverage dropped to below 50% (Hardon, 2001). GAVI has played a large role in reversing this, and many countries are heavily dependent on GAVI funding. For the first five years of GAVI, existing donor and government funding for immunisations did not change significantly, but spending on
Critical drivers of change for child-sensitive development – Report commissioned by Save the Children UK and UNICEF
7
immunisation against vaccine-preventable diseases) in 2000, substantially greater donor funds have been mobilised for immunisation, which have funded the introduction of new vaccines and increased coverage of longer-standing vaccination programmes.12 The private sector has also played a key role in both developing vaccines and extending access. Partially catalysed by GAVI and by non-governmental organisation (NGO) advocacy for reduced prices, in 2011 major drug companies agreed to cut prices for key vaccines in developing countries, such as rotavirus and pentavalent vaccines, which protect against
diphtheria, tetanus, pertussis, hepatitis B and Haemophilus influenzae type B.13
Ongoing challenges: 1.7 million children still die from vaccine-preventable illnesses a year – mostly poor children in remote areas or conflict-affected countries, or those whose mothers have limited education.14 Further funding and efforts are needed to achieve 90% vaccination levels for key diseases. As of the end of 2010, 23.2 million children under 12 months had not received all three recommended
doses of the DTP3 vaccine and 23.7 million children in the same age group had not received a single dose of the measles vaccine.15
Other important factors have been action on HIV/AIDS (see Section 3.3), and progress
on social factors underlying child mortality including increasing gender equality, such as
the proven positive link between mothers‘ education and their provision of healthcare for their
children (World Bank, 2011), which has increased women‘s capacity to direct resources
towards child wellbeing, and to make decisions about seeking treatment for children‘s
illnesses, including preferences for modern types of treatment over traditional (UNICEF 2007);
women‘s increased participation in household decision making, which is shown to improve
children‘s nutrition (UNICEF 2007); increasing levels of girls‘ education which have contributed
to both women‘s empowerment and improved child care practices; governments adopting
family-friendly social protection policies which provide equitable incomes for both men and
women, or which allow women to work on an equal footing with men (WHO Commission on
Social Determinants of Health, 2008); enhanced access to safe water and sanitation and
improved hygienic practices (section 3.4), and broader poverty reduction (Section 2).
How have these reductions been financed?
Both expenditures on maternal, newborn and child health (MNCH) and broader health sector
investments are vital for child health; however, aggregate data on these expenditures are not
consistently available. Approximately 85% of MNCH expenditure in Countdown16 countries (the
60 countries which account for 90% of child mortality) comes from domestic sources (Pitt et
al., 2010). However, government resources are often tied up with financing recurrent health
sector costs (including salaries), making reprioritisation difficult. As a result, aid to MNCH
provides resources that can be used for specific programmes or initiatives (ibid.).
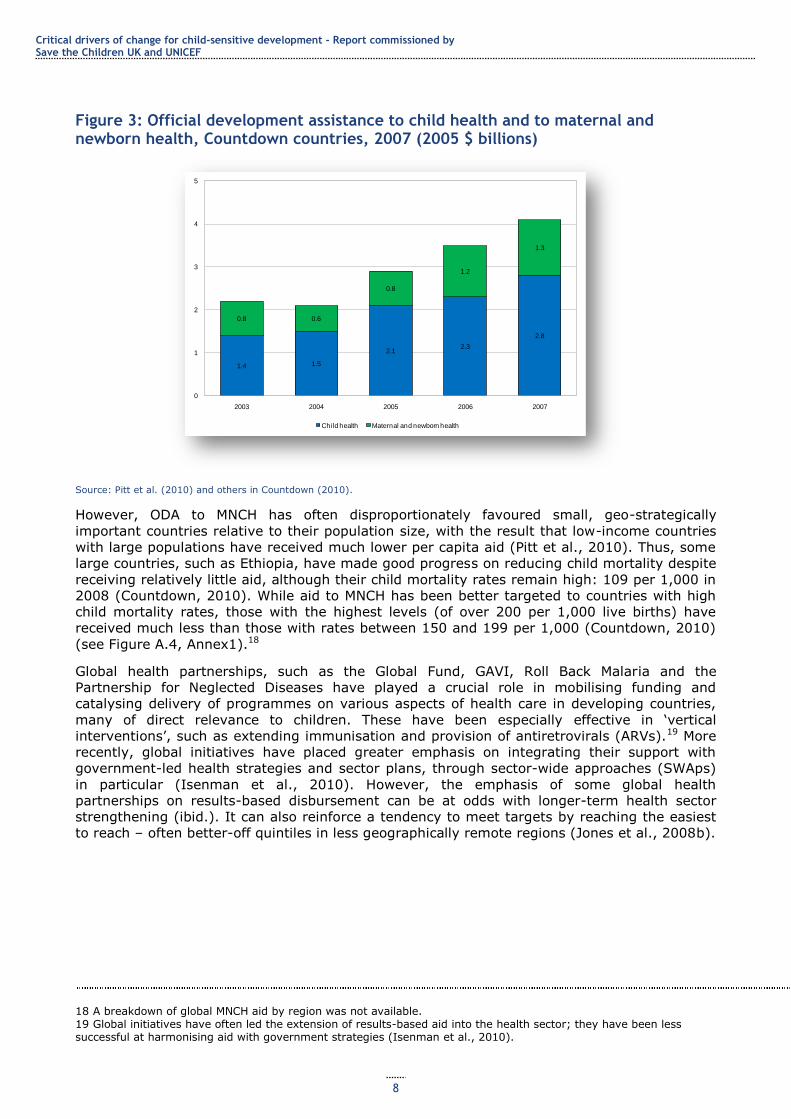
The late 2000s (before the onset of the global economic crisis)17 saw an increase in the volume
of aid committed to both MNCH and the health sector overall. Total official development
assistance (ODA) to MNCH in 2007 was $4.1 billion, up 16% on 2006 and nearly double the
$2.1 billion in 2003. This constituted 31% of ODA to health in 2007 (Countdown, 2010). Figure
3 outlines trends between 2003 and 2007. In particular, the contributions of two bilateral
donors (the UK and the US) and two multilaterals – the Global Fund and the GAVI Alliance
have increased dramatically (Pitt et al., 2010).
routine immunisations increased by 52%, implying that GAVI is largely responsible for a major increase in vaccination
coverage (Chee et al, 2007). GAVI currently plans a large-scale increase in its programme but faces funding constraints due to the economic crisis, creating funding gaps which may jeopardise children‘s lives (Usher, 2010). 12 www.childinfo.org/immunization.html [accessed 5 October 2011]. 13 www.bbc.co.uk/news/business-13665501 [accessed 4 February 2012]. 14 www.gavialliance.org/advocacy-statistics/ [accessed 29 September 2011]. 15 www.childinfo.org/immunization.html [accessed 29 September 2011]. 16 Countdown to 2015: Tracking Progress in Maternal, Newborn and Child Survival is a global movement of academics, governments, international agencies, health care professional associations, donors and NGOs, with The Lancet as a key partner. It uses country-specific data to stimulate and support country progress towards achieving the health-related MDGs (in the 68 countries where 95% of child and maternal deaths occur) (Countdown, 2010). 17 Data for the period after 2007 were not available.
Critical drivers of change for child-sensitive development - Report commissioned by Save the Children UK and UNICEF
8
Figure 3: Official development assistance to child health and to maternal and newborn health, Countdown countries, 2007 (2005 $ billions)
Source: Pitt et al. (2010) and others in Countdown (2010).
However, ODA to MNCH has often disproportionately favoured small, geo-strategically
important countries relative to their population size, with the result that low-income countries
with large populations have received much lower per capita aid (Pitt et al., 2010). Thus, some
large countries, such as Ethiopia, have made good progress on reducing child mortality despite
receiving relatively little aid, although their child mortality rates remain high: 109 per 1,000 in
2008 (Countdown, 2010). While aid to MNCH has been better targeted to countries with high
child mortality rates, those with the highest levels (of over 200 per 1,000 live births) have
received much less than those with rates between 150 and 199 per 1,000 (Countdown, 2010)
(see Figure A.4, Annex1).18
Global health partnerships, such as the Global Fund, GAVI, Roll Back Malaria and the
Partnership for Neglected Diseases have played a crucial role in mobilising funding and
catalysing delivery of programmes on various aspects of health care in developing countries,
many of direct relevance to children. These have been especially effective in ‗vertical
interventions‘, such as extending immunisation and provision of antiretrovirals (ARVs).19 More
recently, global initiatives have placed greater emphasis on integrating their support with
government-led health strategies and sector plans, through sector-wide approaches (SWAps)
in particular (Isenman et al., 2010). However, the emphasis of some global health
partnerships on results-based disbursement can be at odds with longer-term health sector
strengthening (ibid.). It can also reinforce a tendency to meet targets by reaching the easiest
to reach – often better-off quintiles in less geographically remote regions (Jones et al., 2008b).
18 A breakdown of global MNCH aid by region was not available. 19 Global initiatives have often led the extension of results-based aid into the health sector; they have been less successful at harmonising aid with government strategies (Isenman et al., 2010).
1.4 1.5
2.12.3
2.8
0.8 0.6
0.8
1.2
1.3
0
1
2
3
4
5
2003 2004 2005 2006 2007
Child health Maternal and newborn health
Critical drivers of change for child-sensitive development – Report commissioned by Save the Children UK and UNICEF
9
Box 2: What is the relationship between aid and infant mortality?
Our analysis of data from sub-Saharan Africa suggests that a typical high-aid country, receiving an
additional $20 per capita of aid per year (roughly the difference between a high-aid and a low-aid country) reduced infant mortality each year by approximately an additional 0.4 deaths per 1,000 births.20 So over the course of a decade the average high-aid country reduced infant mortality by an additional 4 deaths per 1000,
in comparison to the average low-aid country. In 2009, there were roughly 15.7 million births in sub-Saharan
Africa (UNICEF data in UNICEF (2011b)), and the average rate of infant mortality was 46 deaths per
1,000 (our analysis). If the rate of infant mortality fell by an additional 4 per 1,000 across the region, that would save 63,000 infant lives each year.
See Annex 2 for full details, particularly Figures A2.2 and A2.3. These are descriptive statistics not an attempt
to estimate a causal relationship, and there is a lot of variation around these averages, but the data are, certainly
consistent with aid having helped to reduce infant mortality.
Ongoing challenges Around 7.6 million children under five still die every year, two-thirds of them from preventable
diseases, with the poorest children most at risk (Save the Children, 2010a). The current pace
of reduction is too slow to meet MDG4 – halving child mortality by 2015 – particularly in sub-
Saharan Africa, South Asia and Oceania (UNIAGCME, 2011). The major killers of children –
pneumonia and diarrhoea (responsible for 18% and 15% of child deaths worldwide,
respectively) and measles, HIV/AIDS and malaria (together responsible for another 15%)
(Black et al, 2010)) – are largely preventable and can easily be targeted. Another third of child
deaths worldwide are related to underlying malnutrition (Countdown, 2010) which undermines
children‘s growth and weakens their ability to fight infections, but which can largely be
eliminated through extension of a set of nutritional/health interventions and poverty reduction
(see Section 3.2).
Key areas of action include the following:
Focusing on children at most risk of early death
Poor children with uneducated mothers, who live in rural areas (see Figure A.2, Annex 1) or
are from marginalised social and ethnic groups are at greatest risk of early death (UNICEF,
2008). Children in conflict-affected countries are particularly vulnerable – almost 70% of the
countries with the highest child mortality burden have experienced armed conflict over the
past two decades (Save the Children, 2010a).
To date, in 60% of countries making progress on child survival, improvements have been
concentrated among well-off groups (Save the Children, 2010a). Some countries, such as
Bangladesh, have narrowed the gap between rich and poor households and between boys and
girls (ODI, 2010a); Brazil has cut child deaths in the poorest regions and households faster
than in better-off households and regions (Victora et al., 2011). If the 42 developing countries
that account for over 90% of child deaths made progress across all income groups at the same
rate as they did for the fastest-improving income group, an additional 4 million child deaths
could be averted over a 10-year period (Save the Children, 2010a). UNICEF has calculated that
an equity-focused approach to child survival would avert 60% more child deaths per $1 million
invested than the current approach (UNICEF, 2010c).
Achieving this would require:
Continued investment in health systems to increase the accessibility and
affordability of health care and to improve the quality of care provided
through health worker up-skilling. Data from Countdown countries show that a
median of 42% of children are correctly treated with oral rehydration therapy (ORT)
and 27% with antibiotics, and 30% of malaria cases among children are correctly
treated (Bhutta et al., 2010).
20 The relationship between aid and reductions in infant mortality is statistically significant at the 1% level, either when the data are not weighted by population or when the two most populous countries, Ethiopia and Nigeria, are excluded from the analysis .
Critical drivers of change for child-sensitive development - Report commissioned by Save the Children UK and UNICEF
10
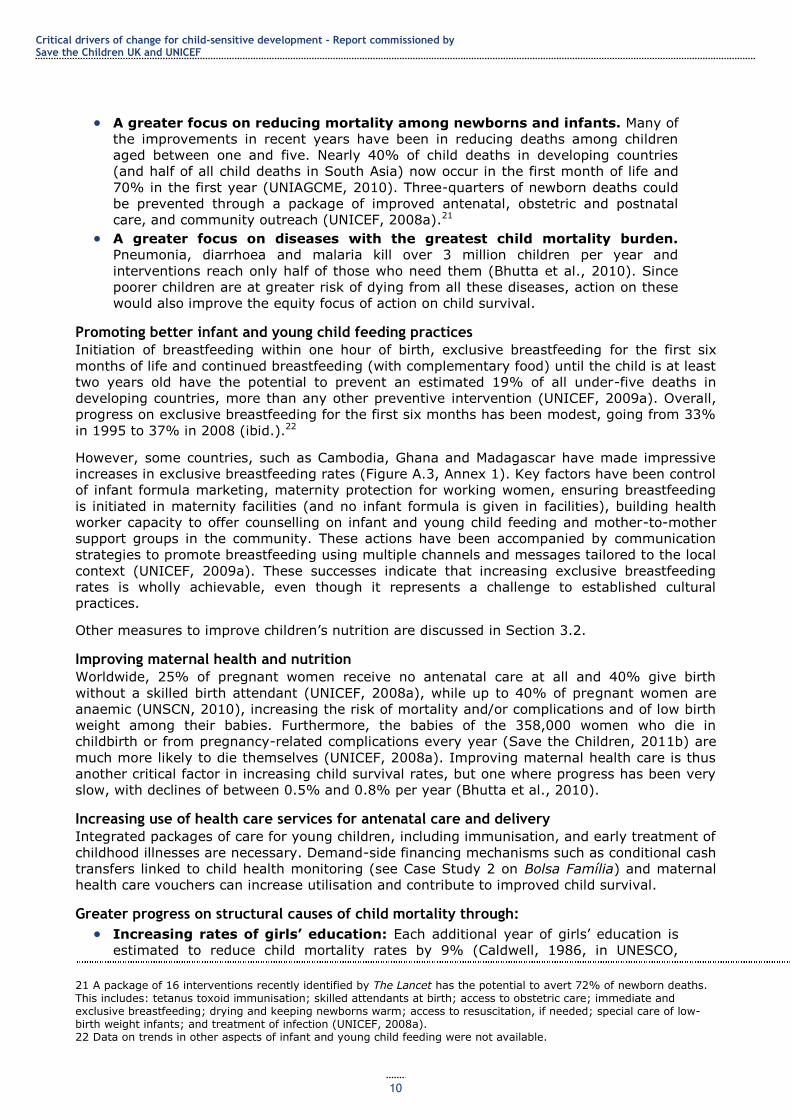
A greater focus on reducing mortality among newborns and infants. Many of
the improvements in recent years have been in reducing deaths among children
aged between one and five. Nearly 40% of child deaths in developing countries
(and half of all child deaths in South Asia) now occur in the first month of life and
70% in the first year (UNIAGCME, 2010). Three-quarters of newborn deaths could
be prevented through a package of improved antenatal, obstetric and postnatal
care, and community outreach (UNICEF, 2008a).21
A greater focus on diseases with the greatest child mortality burden.
Pneumonia, diarrhoea and malaria kill over 3 million children per year and
interventions reach only half of those who need them (Bhutta et al., 2010). Since
poorer children are at greater risk of dying from all these diseases, action on these
would also improve the equity focus of action on child survival.
Promoting better infant and young child feeding practices
Initiation of breastfeeding within one hour of birth, exclusive breastfeeding for the first six
months of life and continued breastfeeding (with complementary food) until the child is at least
two years old have the potential to prevent an estimated 19% of all under-five deaths in
developing countries, more than any other preventive intervention (UNICEF, 2009a). Overall,
progress on exclusive breastfeeding for the first six months has been modest, going from 33%
in 1995 to 37% in 2008 (ibid.).22
However, some countries, such as Cambodia, Ghana and Madagascar have made impressive
increases in exclusive breastfeeding rates (Figure A.3, Annex 1). Key factors have been control
of infant formula marketing, maternity protection for working women, ensuring breastfeeding
is initiated in maternity facilities (and no infant formula is given in facilities), building health
worker capacity to offer counselling on infant and young child feeding and mother-to-mother
support groups in the community. These actions have been accompanied by communication
strategies to promote breastfeeding using multiple channels and messages tailored to the local
context (UNICEF, 2009a). These successes indicate that increasing exclusive breastfeeding
rates is wholly achievable, even though it represents a challenge to established cultural
practices.
Other measures to improve children‘s nutrition are discussed in Section 3.2.
Improving maternal health and nutrition
Worldwide, 25% of pregnant women receive no antenatal care at all and 40% give birth
without a skilled birth attendant (UNICEF, 2008a), while up to 40% of pregnant women are
anaemic (UNSCN, 2010), increasing the risk of mortality and/or complications and of low birth
weight among their babies. Furthermore, the babies of the 358,000 women who die in
childbirth or from pregnancy-related complications every year (Save the Children, 2011b) are
much more likely to die themselves (UNICEF, 2008a). Improving maternal health care is thus
another critical factor in increasing child survival rates, but one where progress has been very
slow, with declines of between 0.5% and 0.8% per year (Bhutta et al., 2010).
Increasing use of health care services for antenatal care and delivery
Integrated packages of care for young children, including immunisation, and early treatment of
childhood illnesses are necessary. Demand-side financing mechanisms such as conditional cash
transfers linked to child health monitoring (see Case Study 2 on Bolsa Família) and maternal
health care vouchers can increase utilisation and contribute to improved child survival.
Greater progress on structural causes of child mortality through:
Increasing rates of girls’ education: Each additional year of girls‘ education is
estimated to reduce child mortality rates by 9% (Caldwell, 1986, in UNESCO,
21 A package of 16 interventions recently identified by The Lancet has the potential to avert 72% of newborn deaths. This includes: tetanus toxoid immunisation; skilled attendants at birth; access to obstetric care; immediate and exclusive breastfeeding; drying and keeping newborns warm; access to resuscitation, if needed; special care of low-birth weight infants; and treatment of infection (UNICEF, 2008a). 22 Data on trends in other aspects of infant and young child feeding were not available.
Critical drivers of change for child-sensitive development – Report commissioned by Save the Children UK and UNICEF
11
2011). A recent analysis attributes half of the reduction in child deaths to
improvements in girls‘ education between 1990 and 2010 (Gakidou et al., 2010, in
UNESCO, 2011). Universal secondary education could save an estimated 1.8 million
children‘s lives in sub-Saharan Africa (UNESCO, 2011) through increasing mothers‘
knowledge about child care practices, health and nutrition, and their capacity to act
on this knowledge.
Women’s empowerment: This can increase women‘s autonomy and ability to
make independent decisions about child health care (ODI, 2010a).
Poverty reduction: See the discussion on cash transfers (Case Study 2) and
multi-sectoral poverty reduction (Section 3.8).
Improved access to water and sanitation: This has the potential to prevent up
to 2 million deaths of young children every year (Section 3.4).23
Financing
Only five MDG Countdown countries currently devote over 15% of their national budget to
health,24 and only five have out-of-pocket expenditure of less than 15% (Bhutta et al., 2010),
meaning that public contributions are relatively low and private contributions high. Although
high levels of spending are no guarantee of good health outcomes, very low levels of per
capita health spending in some countries (an average of $13 across sub-Saharan Africa, up
from $9 in 2001 (WHO, 2011b)) are a critical constraint to improving child health outcomes.
An estimated additional $60 billion is needed between 2009 and 2015 to implement a full
package of MNCH interventions in the 68 countries with the highest child and maternal
mortality levels. If both donors and governments meet financial commitments already made,
the funding gap will still be $22 billion (Countdown, 2010), so greater efforts by both
governments and development partners are needed.
Case Study 1: Improvements in mother and child health in Bangladesh
Life expectancy at birth in Bangladesh has improved significantly: a baby born in 1970 could expect to
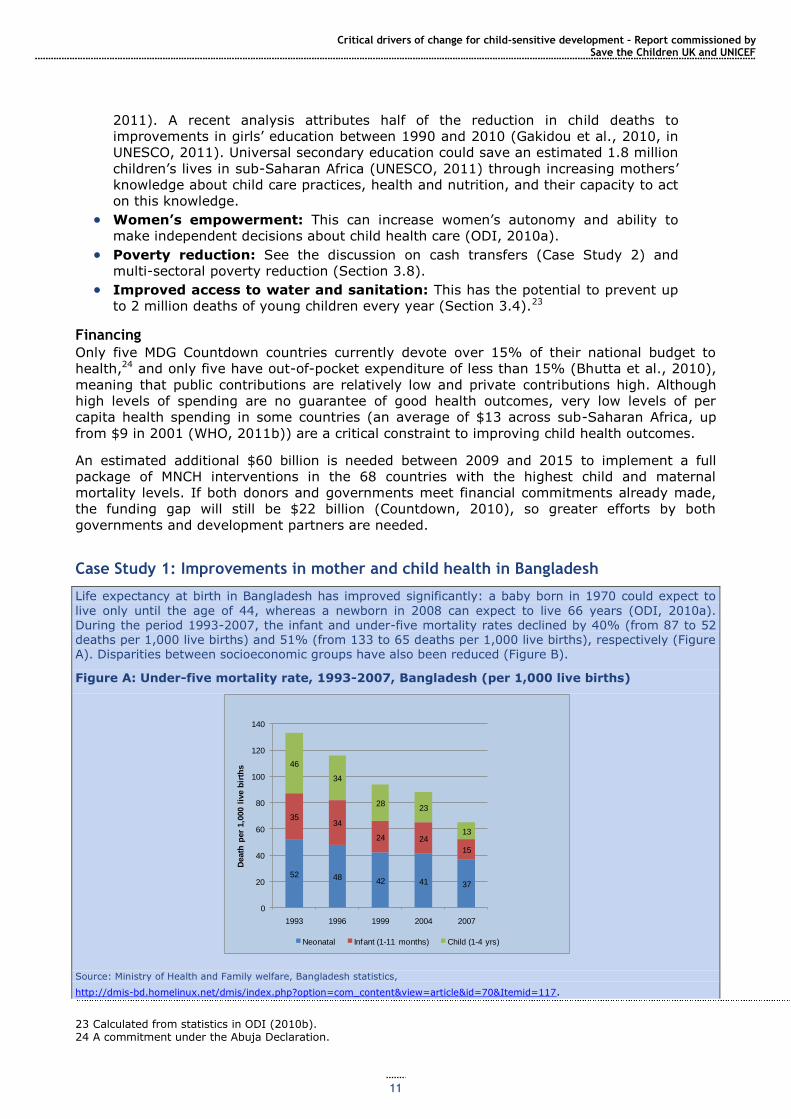
live only until the age of 44, whereas a newborn in 2008 can expect to live 66 years (ODI, 2010a). During the period 1993-2007, the infant and under-five mortality rates declined by 40% (from 87 to 52 deaths per 1,000 live births) and 51% (from 133 to 65 deaths per 1,000 live births), respectively (Figure A). Disparities between socioeconomic groups have also been reduced (Figure B).
Figure A: Under-five mortality rate, 1993-2007, Bangladesh (per 1,000 live births)
Source: Ministry of Health and Family welfare, Bangladesh statistics,
http://dmis-bd.homelinux.net/dmis/index.php?option=com_content&view=article&id=70&Itemid=117.
23 Calculated from statistics in ODI (2010b). 24 A commitment under the Abuja Declaration.
52 4842 41 37
3534
24 24
15
46
34
2823
13
0
20
40
60
80
100
120
140
1993 1996 1999 2004 2007
Death
per
1,0
00 l
ive b
irth
s
Neonatal Infant (1-11 months) Child (1-4 yrs)
Critical drivers of change for child-sensitive development - Report commissioned by Save the Children UK and UNICEF
12
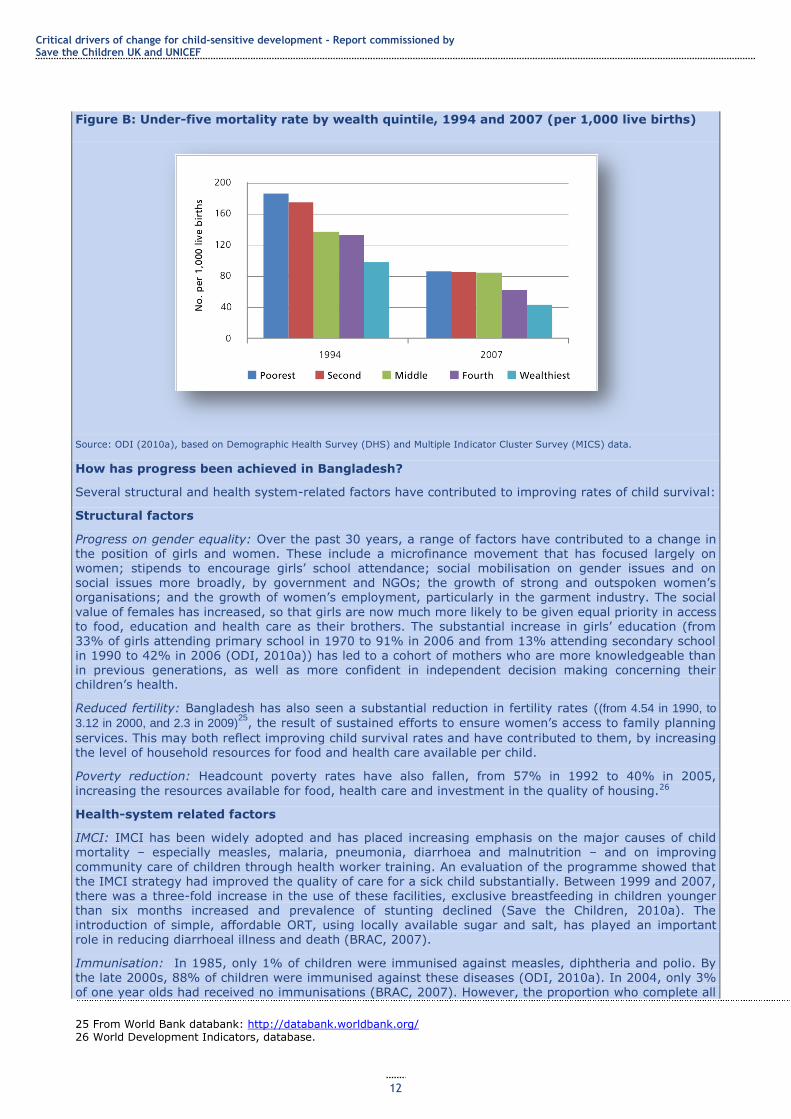
Figure B: Under-five mortality rate by wealth quintile, 1994 and 2007 (per 1,000 live births)
Source: ODI (2010a), based on Demographic Health Survey (DHS) and Multiple Indicator Cluster Survey (MICS) data.
How has progress been achieved in Bangladesh?
Several structural and health system-related factors have contributed to improving rates of child survival:
Structural factors
Progress on gender equality: Over the past 30 years, a range of factors have contributed to a change in
the position of girls and women. These include a microfinance movement that has focused largely on women; stipends to encourage girls‘ school attendance; social mobilisation on gender issues and on social issues more broadly, by government and NGOs; the growth of strong and outspoken women‘s organisations; and the growth of women‘s employment, particularly in the garment industry. The social
value of females has increased, so that girls are now much more likely to be given equal priority in access to food, education and health care as their brothers. The substantial increase in girls‘ education (from 33% of girls attending primary school in 1970 to 91% in 2006 and from 13% attending secondary school in 1990 to 42% in 2006 (ODI, 2010a)) has led to a cohort of mothers who are more knowledgeable than in previous generations, as well as more confident in independent decision making concerning their children‘s health.
Reduced fertility: Bangladesh has also seen a substantial reduction in fertility rates ((from 4.54 in 1990, to
3.12 in 2000, and 2.3 in 2009)25
, the result of sustained efforts to ensure women‘s access to family planning
services. This may both reflect improving child survival rates and have contributed to them, by increasing the level of household resources for food and health care available per child.
Poverty reduction: Headcount poverty rates have also fallen, from 57% in 1992 to 40% in 2005,
increasing the resources available for food, health care and investment in the quality of housing.26
Health-system related factors
IMCI: IMCI has been widely adopted and has placed increasing emphasis on the major causes of child mortality – especially measles, malaria, pneumonia, diarrhoea and malnutrition – and on improving
community care of children through health worker training. An evaluation of the programme showed that the IMCI strategy had improved the quality of care for a sick child substantially. Between 1999 and 2007, there was a three-fold increase in the use of these facilities, exclusive breastfeeding in children younger than six months increased and prevalence of stunting declined (Save the Children, 2010a). The introduction of simple, affordable ORT, using locally available sugar and salt, has played an important role in reducing diarrhoeal illness and death (BRAC, 2007).
Immunisation: In 1985, only 1% of children were immunised against measles, diphtheria and polio. By the late 2000s, 88% of children were immunised against these diseases (ODI, 2010a). In 2004, only 3%
of one year olds had received no immunisations (BRAC, 2007). However, the proportion who complete all
25 From World Bank databank: http://databank.worldbank.org/ 26 World Development Indicators, database.
Critical drivers of change for child-sensitive development – Report commissioned by Save the Children UK and UNICEF
13
three doses of diphtheria, tetanus and polio injections is substantially lower than that of those who start the course.
Nutrition: Nutritional improvements have also contributed to child survival. The proportion of children under five who are severely stunted fell from 71% in 1983 to 43% in 2007.27 Vitamin A supplementation
now covers 88% of children (Saymen et al., 2011). However, wasting among children under five has increased recently (from 10% in 2000 to 17% in 2007). The government is attempting to reduce malnutrition through its Area-based Community Nutrition programme but, as this covered only just over a fifth of the country in 2009, Bangladesh is unlikely to meet the MDG target in this area (GoB, 2009).
Maternal mortality: This has also declined significantly, from 650 per 100,000 to 320 per 100,000
between 1985 and 2005. However, this is still an extremely high level, and means that 12,000 women die from pregnancy-related causes every year in Bangladesh. Additionally, 75% of these mothers‘ babies die within the first week of life (BRAC, 2007).
In 2009, only 29% of births were assisted by a skilled attendant. Current policy focuses on improving
access to public sector health facilities for maternal care, to increase the proportion of institutional
deliveries (currently only 20% (GoB, 2011)) and establishing Comprehensive Emergency Obstetric Care (CEmOC) services at district and sub-district levels, through provision of skilled staff and the necessary drugs and equipment. Between 2004 and 2007, the number of births attended by medically trained personnel increased from 13% to 18% (GoB, 2008). The pilot Maternal Health Voucher programme has contributed to increased uptake of antenatal care and use of institutional deliveries in areas where it is operational. Only 18% of women received any postnatal care in 2004 (BRAC, 2007).
Financing of interventions and the role of aid
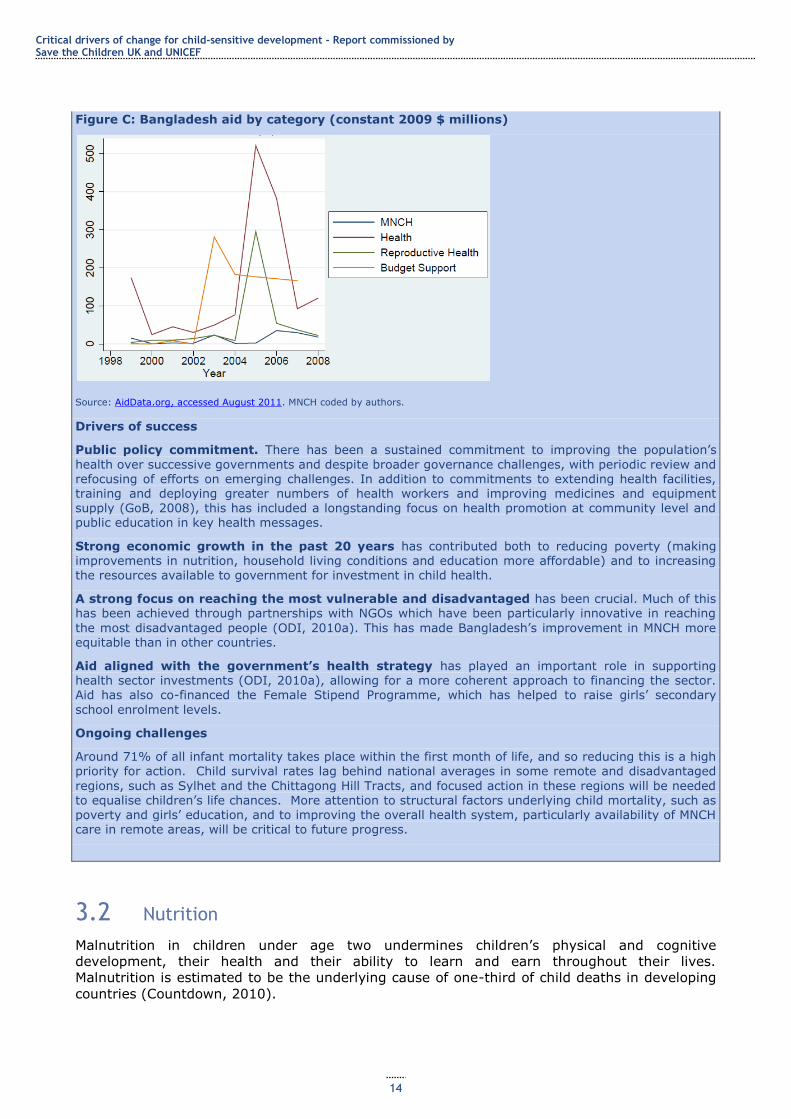
The proportions of GDP and of government expenditure devoted to health have stayed relatively constant since 1995 at around 1% and 8%, respectively, although the latter figure declined to 7.5% in 2008/09. External resources for health climbed from just 3% of total health expenditure in 1995 to peak at 8.8% in
2004 and declined thereafter until 2009, when they rose again to 8% of health expenditure. Figure C indicates the volume of aid to MNCH in comparison with general health aid, and also budget support, which is likely to have contributed to domestic spending on MNCH. On average, commitments to MNCH
constituted approximately 8% of aid for health over the period 1999-2009 (authors‘ calculations), although of course wider health and education sector investments have synergies with and have contributed to better MNCH care and outcomes. Aid to the health sector in Bangladesh has been aligned with the government‘s health strategy, making it more effective in tackling problems of child mortality.
Various donors, including the World Bank, the Gates Foundation, the UK Department for International Development (DFID), the US Agency for International Development (USAID) and UNICEF have contributed to financing the implementation of government health strategies, with specific projects including Saving Newborn Lives, maternal health vouchers and introducing kangaroo care for pre-term infants. Given the significant role of NGOs in Bangladesh‘s health sector, financial assistance to NGOs has
also contributed to improvements in child survival.28
27 http://data.worldbank.org. We have found at least three different estimates of trends in child malnutrition over the past 20 years. ODI (2010a) reports a fall in the proportion of children who are severely malnourished from 74% in 1985 to 4.1% in 2005, but that 4% of children under five were stunted in 2005. An evaluation of the government‘s Health, Population and Nutrition Strategy suggests 10.9% of children were severely underweight in 2007. 28 No information could be found on the scale of financial flows to Bangladeshi NGOs for MNCH activities.
Critical drivers of change for child-sensitive development - Report commissioned by Save the Children UK and UNICEF
14
Figure C: Bangladesh aid by category (constant 2009 $ millions)
Source: AidData.org, accessed August 2011. MNCH coded by authors.
Drivers of success
Public policy commitment. There has been a sustained commitment to improving the population‘s
health over successive governments and despite broader governance challenges, with periodic review and refocusing of efforts on emerging challenges. In addition to commitments to extending health facilities, training and deploying greater numbers of health workers and improving medicines and equipment supply (GoB, 2008), this has included a longstanding focus on health promotion at community level and public education in key health messages.
Strong economic growth in the past 20 years has contributed both to reducing poverty (making improvements in nutrition, household living conditions and education more affordable) and to increasing the resources available to government for investment in child health.
A strong focus on reaching the most vulnerable and disadvantaged has been crucial. Much of this has been achieved through partnerships with NGOs which have been particularly innovative in reaching
the most disadvantaged people (ODI, 2010a). This has made Bangladesh‘s improvement in MNCH more equitable than in other countries.
Aid aligned with the government’s health strategy has played an important role in supporting health sector investments (ODI, 2010a), allowing for a more coherent approach to financing the sector. Aid has also co-financed the Female Stipend Programme, which has helped to raise girls‘ secondary
school enrolment levels.
Ongoing challenges
Around 71% of all infant mortality takes place within the first month of life, and so reducing this is a high
priority for action. Child survival rates lag behind national averages in some remote and disadvantaged
regions, such as Sylhet and the Chittagong Hill Tracts, and focused action in these regions will be needed to equalise children‘s life chances. More attention to structural factors underlying child mortality, such as poverty and girls‘ education, and to improving the overall health system, particularly availability of MNCH care in remote areas, will be critical to future progress.
3.2 Nutrition
Malnutrition in children under age two undermines children‘s physical and cognitive
development, their health and their ability to learn and earn throughout their lives.
Malnutrition is estimated to be the underlying cause of one-third of child deaths in developing
countries (Countdown, 2010).
Critical drivers of change for child-sensitive development – Report commissioned by Save the Children UK and UNICEF
15
Globally, there have been some reductions in child malnutrition over the past 20 years, but
improvements have been slower than in other key areas of child wellbeing, such as child
survival and education. However, some countries, such as Bangladesh, Brazil and Ghana, have
reduced child malnutrition rates considerably (Save the Children, 2011b), and others have
made major progress on particular aspects of malnutrition: in Mozambique, the percentage of
children aged 6-59 months receiving two doses of vitamin A during a calendar year increased
from 16% in 2005 to 83% in 2008 (UNICEF, 2009a). Overall, however, this is an area where
much greater efforts are needed to sustain progress. This section outlines trends in stunting
(shortened height for age) and underweight (low weight for age), low birth weight and key
micronutrient deficiency-related diseases.
Stunting Stunting prevalence in developing countries declined from 40% to 29% between 1990 and
2008, equivalent to 0.65 percentage points per year (Save the Children, 2011b).29 Progress
has been concentrated in some Asian countries, where prevalence dropped from 44% around
1990 to 30% around 2008, with particular declines in Bangladesh, China and Vietnam
(UNICEF, 2009a).
The decline in sub-Saharan Africa has been smaller, from 38% of under fives stunted in 1990
to 34% in 2008. Moreover, because of population growth, the overall number of African
children under five years old who are stunted has increased, from an estimated 43 million in
1990 to 52 million in 2008. However, some countries, such as Eritrea and Mauritania, have
significantly reduced stunting rates (UNICEF, 2009ad).
Stunting continues to be a significant problem in some South and Central American countries,
with prevalence of 30-50% (e.g. Bolivia, Guatemala, Haiti, Honduras and Peru). Overall,
stunting prevalence in the region is falling, but there has been little change in high prevalence
countries (UNSCN, 2010). Figure A.5, Annex 1 shows reductions in stunting in sub-Saharan
Africa, Asia and selected countries that have made particular progress.
Underweight In 2006, an estimated 129 million children under five years old in the developing world were
underweight30 – nearly one in four – and 10% were severely underweight (UNICEF, 2006).
Reductions in underweight prevalence among children under five were fastest in Latin America
and the Caribbean, going from 11% in 1990 to 6% in 2008 (by an average of 3.8% every
year). Currently, 4% of the region‘s children are underweight (Sanchez-Montero and Salse-
Ubach, 2010).
For Africa, where 21% of children under five were underweight in 2008 (UNICEF, 2009d), rates
of improvement have been slower. Underweight prevalence declined by 0.1 percentage points
per year over the continent as a whole. This rate of progress is insufficient to meet MDG1
except in North Africa, where underweight prevalence is relatively low and improvement rates
have been faster (UNSCN, 2010). There are exceptions: countries that have achieved
impressive reductions in underweight prevalence over the period 1990-200831 include
Mauritania (57% down to 27%), Malawi (29.9% to 21%), Ghana (27% to 9%) and
Mozambique (27% to 18%) (UNICEF, 2009a).
In South Asia, underweight prevalence fell from 37% to 31% between 1990 and 2008.
However, the absolute numbers of underweight children are the highest in the world: together
Bangladesh, India and Pakistan (with 29% of the world‘s child population) account for half the
world‘s underweight children (UNICEF, 2009a). Bangladesh, however, has made significant
progress, with the proportion of underweight children falling from 67% to 43% between 1990
and 2008 (UNICEF, 2008a).
29 Moderate or severe stunting is defined as height-for-age two standard deviations or more below WHO reference norms (UNICEF, 2009a). 30 Underweight is defined as lower than average weight for height as a result of malnutrition. 31 The period for each country varies slightly because of the timing of key surveys.
Critical drivers of change for child-sensitive development - Report commissioned by Save the Children UK and UNICEF
16
Despite significant falls in some countries, the overall rate of reduction is insufficient to meet
the MDG target of 16.5% of children underweight worldwide (Roadmap, 2010b). See Figure
A.6, Annex 1 for further detail on trends in underweight prevalence by region.
Low birthweight
Low birthweight renders babies more vulnerable to infections and asphyxia, which together
account for 60% of neonatal deaths. An infant born weighing between 1.5 kg and 2 kg is eight
times more likely to die than an infant born with an adequate weight of at least 2.5 kg. Low
birthweight causes an estimated 3.3% of overall child deaths (UNICEF, 2009a).
Incidence of low birthweight (under 2.5 kg) has fallen from 34% to 27% in South Asia and
from 18% to 12% in South-East Asia. East Asia (mainly China) already had a low incidence of
low birthweight in the 1980s, and the rate has now fallen to about 6%. Incidence has risen in
West Asia, however. Despite overall improvements, Asia still has the highest percentage of low
birthweight babies. In Latin America and the Caribbean, incidence of low birthweight fell to
10% in the 2000s from 13% in the 1980s, with the greatest decline in Central America. In
sub-Saharan Africa, incidence of low birthweight has remained static over the past 20 years,
with some improvement in East Africa (UNSCN, 2010).
Micronutrient deficiencies Micronutrient deficiencies are estimated to account for one-third of malnutrition-related child
deaths and 10% of all child deaths (Save the Children, 2011b).
Vitamin A deficiency
An estimated 163 million children worldwide are vitamin A-deficient (around 30-40% in Africa
and Asia and 10-20% in Latin America and the Caribbean), significantly increasing their risk of
early death: vitamin A deficiency accounted for 6.5% of child mortality in 2004 (Save the
Children, 2011b). Globally, despite some significant successes, reducing vitamin A deficiency
has been relatively slow, particularly in sub-Saharan Africa and South and Central Asia
(UNSCN, 2010).
Iodine deficiency
Iodine deficiency, which can lead to brain damage in newborns and goitre in older children and
adults, can be easily prevented by iodising salt. Thirty-six countries have reached the target of
at least 90% of households using adequately iodised salt, up from 21 in 2002, when the world
community made a commitment to universal salt iodisation by 2005. Despite this significant
progress, about 41 million newborns a year remain unprotected from the enduring
consequences of brain damage associated with iodine deficiency (UNICEF, 2009a).
Iron deficiency anaemia
Unlike other nutritional problems, which are showing slow improvements over time, in about
half the countries for which there are data (16/33) there has been an increase in the numbers
of women and children affected by iron deficiency anaemia (UNSCN, 2010). Around 60% of
children under five in sub-Saharan Africa are estimated to be anaemic (UNSCN, 2010), as are
29% in Latin America and the Caribbean (Sanchez-Montero and Salse-Ubach, 2010). Maternal
anaemia is estimated to contribute to over 115,000 maternal deaths and 591,000 perinatal
deaths a year (Save the Children, 2011b).
How has progress in improving nutrition been achieved? As with improvements in child survival, improvements in children‘s nutrition reflect a
combination of action on root causes of malnutrition, which underpin poor health and nutrition
outcomes, and focused action on specific nutrition and health issues.
Focused action on health and nutrition
This includes targeted programmes to provide vitamin A supplements, increase exclusive
breastfeeding for six months (see Section 3.1) and improved community-level health and
nutrition programmes, such as Mozambique‘s Integrated Child Health Weeks, which offer
vitamin A supplements, de-worming, measles vaccinations, nutrition screening, nutrition
Critical drivers of change for child-sensitive development – Report commissioned by Save the Children UK and UNICEF
17
messages on breastfeeding and distribution of iodised oil supplements, with a particular focus
on disadvantaged areas (UNICEF, 2009a).
Action on underlying causes has included:
Poverty reduction, in particular through social protection programmes that have
transferred income to poor households and enabled households to afford more
food, more nutritious food and better access to health care.
Action on food security and livelihoods, as in Bangladesh, Brazil, Malawi and
Mozambique (IFSN, 2011; Sanchez-Montero and Salse-Ubach, 2010), to address
underlying problems of food availability and poor people‘s access to food. Often,
this has involved support to smallholder agriculture and specific programmes
targeting women farmers.
Increased access to health care and to safe water and sanitation sources
(see Section 3.1 and Section 3.4).
Increased gender equality
In particular, increasing levels of maternal education have been critical in reducing child
malnutrition and improving child health (see Case Studies 1 and 2 on Bangladesh and Brazil).
Preventing childbearing until young women are fully grown, through incentives for them to
stay in school (as in Bangladesh and Ethiopia), implementation of minimum marriage age laws
and communication and social mobilisation in favour of education and against early marriage
can play a crucial role in improving maternal nutrition and reducing low birthweight (UNSCN,
2010).
Political will and well-planned and resourced programmes
Although political prioritisation of nutrition has been relatively rare, where it has occurred, it
has given important momentum to efforts to improve nutrition. One example is of salt
iodisation in Nigeria: a decision was made in 2007 to iodise factory-produced salt, which led to
97% of households using iodised salt (UNICEF, 2009a).
India provides an example of the importance of strong political structures to nutritional
improvements: little progress has been made on nutrition despite excellent growth. Much of
this is attributed to poor programme governance; child-focused programmes such as the
Integrated Child Development Services have few consequences for poor performance, weak
incentives, and poor monitoring and evaluation with few links to outcomes (Haddad, 2009).
Malnutrition in India is linked to unequal structures and institutions, especially official
clientelism which favours certain groups (often ethnic or caste-based) over others in order to
seek political support, rather than seeing the state as a duty bearer of service delivery,
highlighting the need for institutional robustness to deliver programmes effectively (Walton,
2009). By contrast, Brazil‘s Zero Hunger programme (See Case study 2) has strong monitoring
and evaluation, high political visibility resulting in civil society monitoring, a rights-based
approach coupled with a national law on food security, and strong political will resulting in a
coherent policy approach, which has been highly effective in reducing malnutrition (Sanchez-
Montero and Salse-Ubach, 2010).
How have these reductions been financed? Overall, a small proportion of aid has historically been dedicated to ‗basic nutrition‘ (3% of
health aid in 2006 (Roadmap, 2010a); $522 million in 2009 (as compared with over $11 billion
for education and $8 billion for health)32 (see Figure A.7, Annex 1.) However, when aid to
areas with significant linkages with nutrition is considered, such as agriculture and food
security, water and sanitation, education, poverty reduction and broader health services, the
volume likely to affect nutrition is significantly higher. Figure 4 shows that global nutrition-
related aid has risen significantly since 2007, particularly in agriculture, possibly reflecting a
32 Based on author analysis of Organisation for Economic Development (OECD) Development Assistance Committee (DAC) data.
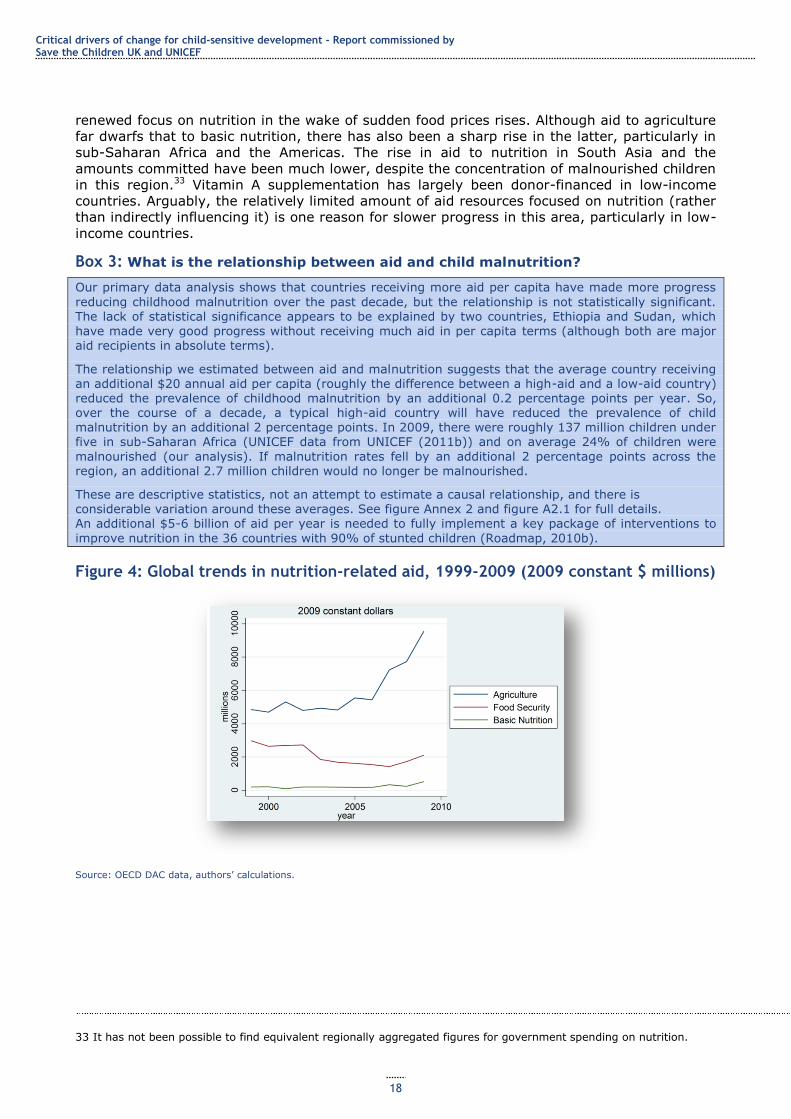
Critical drivers of change for child-sensitive development - Report commissioned by Save the Children UK and UNICEF
18
renewed focus on nutrition in the wake of sudden food prices rises. Although aid to agriculture
far dwarfs that to basic nutrition, there has also been a sharp rise in the latter, particularly in
sub-Saharan Africa and the Americas. The rise in aid to nutrition in South Asia and the
amounts committed have been much lower, despite the concentration of malnourished children
in this region.33 Vitamin A supplementation has largely been donor-financed in low-income
countries. Arguably, the relatively limited amount of aid resources focused on nutrition (rather
than indirectly influencing it) is one reason for slower progress in this area, particularly in low-
income countries.
Box 3: What is the relationship between aid and child malnutrition?
Our primary data analysis shows that countries receiving more aid per capita have made more progress
reducing childhood malnutrition over the past decade, but the relationship is not statistically significant. The lack of statistical significance appears to be explained by two countries, Ethiopia and Sudan, which
have made very good progress without receiving much aid in per capita terms (although both are major aid recipients in absolute terms).
The relationship we estimated between aid and malnutrition suggests that the average country receiving an additional $20 annual aid per capita (roughly the difference between a high-aid and a low-aid country) reduced the prevalence of childhood malnutrition by an additional 0.2 percentage points per year. So, over the course of a decade, a typical high-aid country will have reduced the prevalence of child malnutrition by an additional 2 percentage points. In 2009, there were roughly 137 million children under five in sub-Saharan Africa (UNICEF data from UNICEF (2011b)) and on average 24% of children were
malnourished (our analysis). If malnutrition rates fell by an additional 2 percentage points across the region, an additional 2.7 million children would no longer be malnourished.
These are descriptive statistics, not an attempt to estimate a causal relationship, and there is considerable variation around these averages. See figure Annex 2 and figure A2.1 for full details. An additional $5-6 billion of aid per year is needed to fully implement a key package of interventions to
improve nutrition in the 36 countries with 90% of stunted children (Roadmap, 2010b).
Figure 4: Global trends in nutrition-related aid, 1999-2009 (2009 constant $ millions)
Source: OECD DAC data, authors‘ calculations.
33 It has not been possible to find equivalent regionally aggregated figures for government spending on nutrition.
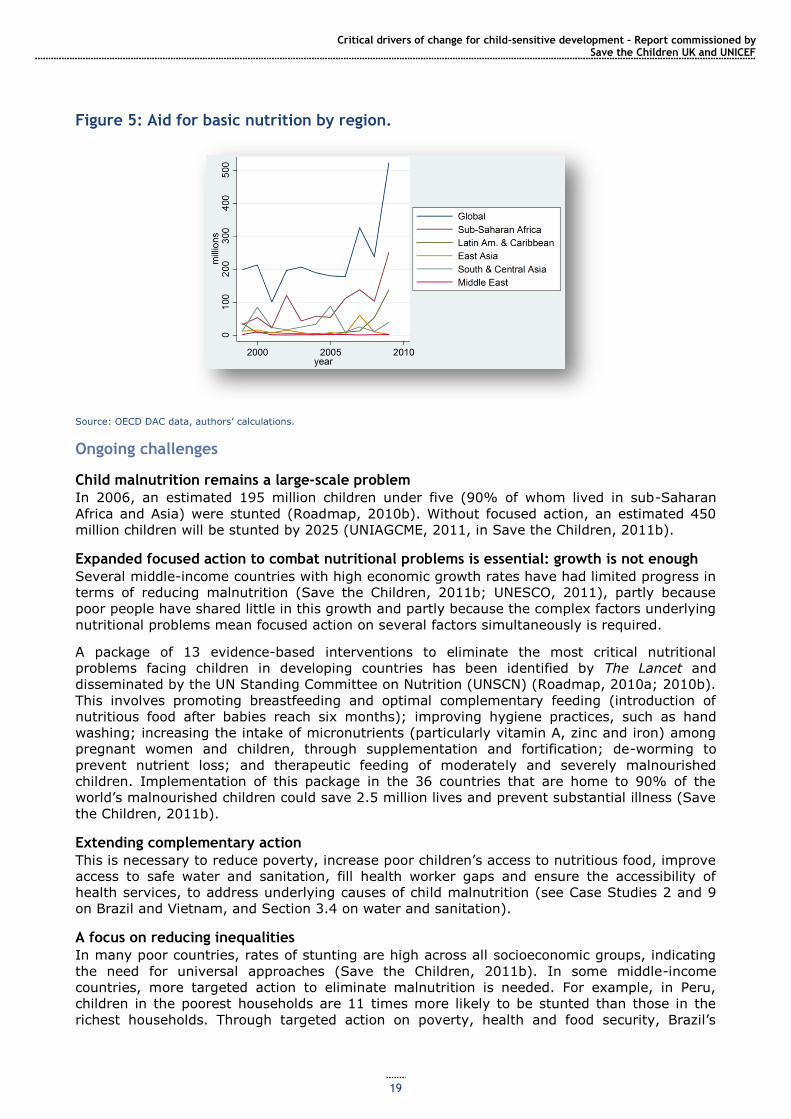
Critical drivers of change for child-sensitive development – Report commissioned by Save the Children UK and UNICEF
19
Figure 5: Aid for basic nutrition by region.
Source: OECD DAC data, authors‘ calculations.
Ongoing challenges
Child malnutrition remains a large-scale problem
In 2006, an estimated 195 million children under five (90% of whom lived in sub-Saharan
Africa and Asia) were stunted (Roadmap, 2010b). Without focused action, an estimated 450
million children will be stunted by 2025 (UNIAGCME, 2011, in Save the Children, 2011b).
Expanded focused action to combat nutritional problems is essential: growth is not enough
Several middle-income countries with high economic growth rates have had limited progress in
terms of reducing malnutrition (Save the Children, 2011b; UNESCO, 2011), partly because
poor people have shared little in this growth and partly because the complex factors underlying
nutritional problems mean focused action on several factors simultaneously is required.
A package of 13 evidence-based interventions to eliminate the most critical nutritional
problems facing children in developing countries has been identified by The Lancet and
disseminated by the UN Standing Committee on Nutrition (UNSCN) (Roadmap, 2010a; 2010b).
This involves promoting breastfeeding and optimal complementary feeding (introduction of
nutritious food after babies reach six months); improving hygiene practices, such as hand
washing; increasing the intake of micronutrients (particularly vitamin A, zinc and iron) among
pregnant women and children, through supplementation and fortification; de-worming to
prevent nutrient loss; and therapeutic feeding of moderately and severely malnourished
children. Implementation of this package in the 36 countries that are home to 90% of the
world‘s malnourished children could save 2.5 million lives and prevent substantial illness (Save
the Children, 2011b).
Extending complementary action
This is necessary to reduce poverty, increase poor children‘s access to nutritious food, improve
access to safe water and sanitation, fill health worker gaps and ensure the accessibility of
health services, to address underlying causes of child malnutrition (see Case Studies 2 and 9
on Brazil and Vietnam, and Section 3.4 on water and sanitation).
A focus on reducing inequalities
In many poor countries, rates of stunting are high across all socioeconomic groups, indicating
the need for universal approaches (Save the Children, 2011b). In some middle-income
countries, more targeted action to eliminate malnutrition is needed. For example, in Peru,
children in the poorest households are 11 times more likely to be stunted than those in the
richest households. Through targeted action on poverty, health and food security, Brazil‘s
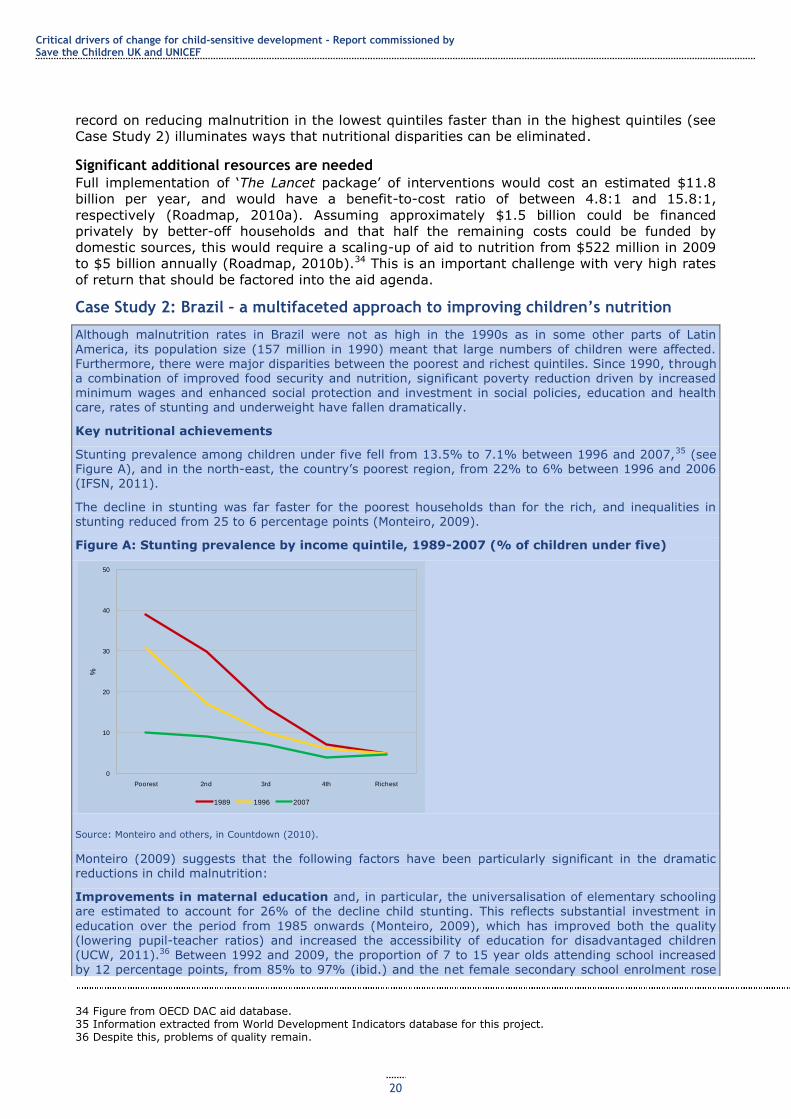
Critical drivers of change for child-sensitive development - Report commissioned by Save the Children UK and UNICEF
20
record on reducing malnutrition in the lowest quintiles faster than in the highest quintiles (see
Case Study 2) illuminates ways that nutritional disparities can be eliminated.
Significant additional resources are needed
Full implementation of ‗The Lancet package‘ of interventions would cost an estimated $11.8
billion per year, and would have a benefit-to-cost ratio of between 4.8:1 and 15.8:1,
respectively (Roadmap, 2010a). Assuming approximately $1.5 billion could be financed
privately by better-off households and that half the remaining costs could be funded by
domestic sources, this would require a scaling-up of aid to nutrition from $522 million in 2009
to $5 billion annually (Roadmap, 2010b).34 This is an important challenge with very high rates
of return that should be factored into the aid agenda.
Case Study 2: Brazil – a multifaceted approach to improving children’s nutrition
Although malnutrition rates in Brazil were not as high in the 1990s as in some other parts of Latin
America, its population size (157 million in 1990) meant that large numbers of children were affected. Furthermore, there were major disparities between the poorest and richest quintiles. Since 1990, through a combination of improved food security and nutrition, significant poverty reduction driven by increased minimum wages and enhanced social protection and investment in social policies, education and health care, rates of stunting and underweight have fallen dramatically.
Key nutritional achievements
Stunting prevalence among children under five fell from 13.5% to 7.1% between 1996 and 2007,35 (see Figure A), and in the north-east, the country‘s poorest region, from 22% to 6% between 1996 and 2006 (IFSN, 2011).
The decline in stunting was far faster for the poorest households than for the rich, and inequalities in stunting reduced from 25 to 6 percentage points (Monteiro, 2009).
Figure A: Stunting prevalence by income quintile, 1989-2007 (% of children under five)
Source: Monteiro and others, in Countdown (2010).
Monteiro (2009) suggests that the following factors have been particularly significant in the dramatic reductions in child malnutrition:
Improvements in maternal education and, in particular, the universalisation of elementary schooling are estimated to account for 26% of the decline child stunting. This reflects substantial investment in
education over the period from 1985 onwards (Monteiro, 2009), which has improved both the quality (lowering pupil-teacher ratios) and increased the accessibility of education for disadvantaged children (UCW, 2011).36 Between 1992 and 2009, the proportion of 7 to 15 year olds attending school increased by 12 percentage points, from 85% to 97% (ibid.) and the net female secondary school enrolment rose
34 Figure from OECD DAC aid database. 35 Information extracted from World Development Indicators database for this project. 36 Despite this, problems of quality remain.
0
10
20
30
40
50
Poorest 2nd 3rd 4th Richest
%
1989 1996 2007
Critical drivers of change for child-sensitive development – Report commissioned by Save the Children UK and UNICEF
21
from 68% in 1999 to 85% in 2008.37 This increase was largely linked to education sector investment; cash transfers such as Bolsa Família played an important but more minor role (ibid.).
Increased purchasing power among poor families is estimated to account for 22% of the decline in child stunting. Specifically, a combination of economic growth and redistribution of income to poor
families, via programmes such as Bolsa Família and other social transfers (see below) has increased the purchasing power of poor households. From 1990 to 2008, the population living on less than $1 per day decreased from 16% to 5% (Sanchez-Montero and Salse-Ubach, 2010).
Increased coverage of child and maternal health care is estimated to account for 12% of the decline in stunting. This is linked to expansion of the Family Health Programme, emphasising prevention,
education and equal access to services, which focuses on rural areas and small cities remote from large metropolitan areas. Overall coverage was 54% in 2010, but in the north and north-east, the most
disadvantaged regions, where the programme is targeted, coverage is 73% and 95%, respectively ().38
Increased coverage of water and sanitation services accounts for another 4% of the reduction in
stunting. Overall, the population with access to improved water sources rose from 71% to 83% between 1990 and 2010; the percentage of the population with access to adequate sanitation rose from 54% to 67% .39
Fome Zero
Part of the credit for Brazil‘s success in improving children‘s nutrition goes to Fome Zero (Zero Hunger), a package of 53 interventions in different sectors (Sanchez-Montero and Salse-Ubach, 2010), which has significantly increased attention to hunger in public policy. Fome Zero is structured around four axes:
Access to food, via Bolsa Família (household cash transfers), low-cost restaurants, school feeding, the
food and nutritional surveillance system, vitamin A distribution and tax incentives for food production (Sanchez-Montero and Salse-Ubach, 2010).
Income-generating activities, which include training, promotion of sustainable economic activity, production-oriented microcredit, productive organisation and support to cooperatives.
Social mobilisation and citizenship education, mobilisation of private and public partnerships and public participation in monitoring the Fome Zero programme.
Strengthening smallholder agriculture, through the National Family Agriculture Programme, Harvest Guarantee, Family Agriculture Insurance and the Food Purchase Programme. A smallholder credit programme facilitates access to investment capital, and a food acquisition programme ensures state
purchases for public institutions (hospitals, schools and prisons) or for the creation of national food reserves (Sanchez-Montero and Salse-Ubach, 2010).
Bolsa Família
Of the different elements of Fome Zero, the Bolsa Família conditional cash transfer (CCT) programme has been the most rigorously evaluated in terms of its impact on children‘s nutrition. Launched in 2003 (from an amalgamation of disparate programmes), it reached 12.5 million families in 2009 (Veras Soares and Silva, 2010, in ODI, 2011a). Bolsa Família is means-tested and is targeted to the poor and extreme poor. Children in recipient households up to the age of seven must be taken to health clinics at regular
intervals to be monitored and to receive vaccinations. Mothers must attend pre and postnatal check-ups at health clinics and participate in nutrition seminars. All children between the ages of 6 and 15 must be
enrolled in schools and attend at least 85% of classes; 16 to 17 year olds enrolled in school must attend 75% of classes (ILO, 2009). Compliance is monitored by school and health centres and is registered in a central database – the single registry system. Unlike other CCT programmes, Bolsa Família has a system of ‗gradual repercussion‘ in the case of non-compliance, allowing the family an opportunity to get back on track before benefits are eventually cut off (ODI, 2011a).
Evaluations have shown positive effects of Bolsa Família on children‘s nutrition, although some studies have contradictory findings (see below). Bolsa Família has also contributed to reducing school dropout and increasing attendance among vulnerable children (Sanchez-Montero and Salse-Ubach, 2010), and
37 Information extracted from World Development Indicators database for this project. 38 Data from SIAB-Datasus (http://www2.datasus.gov.br/SIAB/index.php). 39 Instituto Brasiliero de Geografia e Estatistica data (http://www.ibge.gov.br/english/). These aggregate figures mask substantial regional disparities, with the north and north-east of the country well below these averages, particularly in terms of sanitation.
Critical drivers of change for child-sensitive development - Report commissioned by Save the Children UK and UNICEF
22
some studies find it has led to increased vaccination rates (e.g. Modesto, in IFSN, 2011),40 both of which are associated with nutritional improvements.
Bolsa Família: evidence of impacts on nutrition
The 2005 Nutritional Call found stunting among beneficiary children aged 6-11 months was 3.3% lower than among non-beneficiary children (5.3% vs. 2%). It found no significant impact on children aged 12-36 months, possibly because of weaker monitoring of their growth (IFSN, 2011). Some studies in isolated
areas, such as the arid north-west and parts of the Amazon, have found children 26% more likely to achieve appropriate weight- and height-for-age in Bolsa Família recipient families as compared with non-recipients (ILO, 2009). However, some studies, such as that by Brazil‘s Center for Regional Economic Development and Planning, have not found any positive effects on child malnutrition as a result of Bolsa Família (e.g. Veras Soares and Silva, 2010, in ODI, 2011a). Veras Soares and Silva suggest this may be because, unlike programmes in Mexico and Chile, Bolsa Família does not involve provision of food
supplements, or because health sector infrastructure for monitoring children‘s growth and putting in place
remedial measures is inadequately developed.
Other elements of Fome Zero with a likely impact on child malnutrition include the following:
The National School Meals Programme provides 47 million free meals a day to public school students
aged 6-18 years (Sanchez-Montero and Salse-Ubach, 2010), normally one meal per school day, but two in the poorest areas (Evans, 2011). These are intended to supply 15% of children‘s daily food needs. This has the potential to improve the nutritional status of school children, to ensure better learning and to help insure that the next generation of mothers are better nourished.
The Food Acquisition Programme is a national scheme that buys food from smallholder farmers'
organisations at market prices and distributes it to hospitals, schools and families in need. Law 11.947 stipulates that at least 30% of resources provided for school food must be used to purchase food from family farmers. This enhances the access of small farmers, particularly those in isolated areas, to markets at guaranteed fair prices. The programme has stimulated increased food production (IFSN, 2011).
Drivers of success
High-level political commitment: Fome Zero builds on a personal commitment by former President Luiz Inácio Lula da Silva that he would consider his life‘s mission accomplished if every Brazilian were able to have three meals a day by the time he left office (Graziano da Silva, 2009). The programme‘s planning, coordination and implementation have been led by the president (Sanchez-Montero and Salse-Ubach, 2010).41 This political commitment has also been translated into the Food and Nutritional Security
Organic Law (September 2006), which makes the government‘s commitments on food security legally binding (ibid.). The political impetus behind Fome Zero has promoted policy coherence (social, educational and agriculture policies), resource allocation and stakeholder participation (ibid.).
Social and political changes conducive to social development led to transformations which provided the foundation for progress. Democratisation from the mid-1980s led to space for vibrant civil
society engagement on public policy issues, including on gender equality. Greater urbanisation and falling fertility rates also provided a supportive environment for social policy investments (Victora et al., 2011b).
Synergies between different sectors: Synergies between income poverty reduction, improvements to smallholder agriculture and food security, education, health care and, to a lesser extent, water and sanitation have contributed to improving children‘s nutritional status (Sanchez-Montero and Salse-Ubach,
2010). The dual emphasis in Fome Zero on strengthening food production and improving access has strengthened food security among small farmers and urban consumers simultaneously (Evans, 2011).
Engaged civil society: The legally binding nature of government commitments on food security has provided a focus for civil society mobilisation and strengthened mechanisms for holding the government to account. One such arena is the National Council for Food and Nutrition Security, which has promoted
participatory budgets, has local implementation committees and has institutionalised social monitoring of its actions (Sanchez-Montero and Salse-Ubach, 2010). An engaged and politicised health workforce in combination with broader progressive social movements has been a key advocate for progressive health policies (Victora et al., 2011b).
40 Other studies, such as Veras Soares and Silva (in ODI, 2011) have found no impacts on vaccination rates. 41 It could not be verified for this case study whether this is still the case following the change of president earlier this year.
Critical drivers of change for child-sensitive development – Report commissioned by Save the Children UK and UNICEF
23
A positive economic environment: Between 1998 and 2008, annual economic growth rates increased from 1.9% to 5.1% (ODI, 2011a). This has both increased the resource envelope for programmes such as Fome Zero and contributed to poverty reduction, which in turn may well have contributed to falling malnutrition rates.
Well-chosen evidence-based policies and systems for managing their implementation: Brazil has incorporated best practices on CCTs into the design of Bolsa Família (Belik and del Grossi, 2003; Sanchez-Montero and Salse-Ubach, 2010). It has also refined systems for managing policy implementation, such as through the Unified Register of Households, which contains data on all Bolsa Família recipients (ILO, 2009; ODI, 2011a), and which enables continued monitoring of child wellbeing in recipient households.
Resourcing: In 2008/09, Bolsa Família cost approximately $15.2 billion, 0.4% of GDP (ILO, 2009) and close to 1% of government expenses (IFSN, 2011), which implies the programme is cost-effective.42 The contribution of external financial support to Fome Zero and its associated programmes has been minimal.
In 2009, ODA represented a small proportion of GDP (around 0.745%), targeted principally at environmental and governance issues. Some donors, such as the German Agency for International Cooperation (GIZ) have chosen to support Fome Zero, and the World Bank has supported Bolsa Família
(in 2003 it provided a loan for $572 million and in 2010 a loan for $200 million) and youth employment schemes through loans (IFSN, 2011).
Challenges
Problems of food insecurity remain significant: Despite Brazil‘s success in reducing poverty and child malnutrition, and its status as a major food producer and exporter, hunger and food insecurity are still widespread. Official data indicate that 35% of all households – over 72 million people – suffer from food insecurity (IFSN, 2011). Among the rural population, 51% – who comprise 36% of the total population – live below the poverty line (Sanchez-Montero and Salse-Ubach, 2010).
Reducing tax inequalities which undermine redistribution: Families with an income of less than twice the minimum wage pay an average of 46% of their income in indirect taxes, whereas families earning over 30 times the minimum wage pay 16% in indirect taxes. The UN Special Rapporteur on the
Right to Food has concluded that ‗while the various Zero Hunger programmes are impressive, ―they are essentially funded by the very persons whom they seek to benefit, as the regressive system of taxation seriously limits the redistributive impact of the programmes‖‘ (in IFSN, 2011).
Some nutritional problems persist: Rates of exclusive breastfeeding for the first six months are low (40% in 2006 (Countdown, 2010)), though increasing (Victora et al., 2011b), and anaemia prevalence is over 40% among children (de Novaes Oliveira et al., 2010). Being overweight is also becoming a major nutritional problem, with around 14% of children overweight in the 1990s (ibid.). Low levels of enrolment in preschools (around one-third of the eligible population) mean significant numbers of children are missing out on entitlements to food provided through the education system.
3.3 Preventing mother-to-child transmission of HIV/AIDS
Thirty years of investment in preventing and treating HIV has paid off. Fewer people are now
becoming infected with HIV and fewer people are dying of AIDS than at the height of the
pandemic in the 1990s and early 2000s (UNAIDS, 2010a). Prevention and treatment
programmes have meant the pandemic has now peaked in many countries (ibid.), so HIV
prevalence is falling, leading to fewer infections and deaths. In 33 countries, including some of
the most severely affected countries in sub-Saharan Africa, HIV incidence fell by over 25%
between 2001 and 2009 (ibid.), though these gains are at risk of being undone by the ongoing
effects of economic crisis (Jones et al., 2010).
More than 5 million people are receiving life-saving ARVs, millions of orphans have received
basic education and health care and more tolerant and enabling social environments have been
established in many countries through campaigns to reduce HIV-related stigma and
discrimination. This would not have been possible without strong mobilisation by the global
community and unprecedented levels of funding provided collectively by donors, governments,
42 Equivalent figures for Fome Zero are not available as some of the resources per programme are part of the operational budgets of specific sectors
Critical drivers of change for child-sensitive development - Report commissioned by Save the Children UK and UNICEF
24
the private sector, philanthropic organisations and individuals to address HIV (UNAIDS,
2010a).
In countries with high HIV prevalence, HIV still constitutes a major threat to child survival
(Countdown, 2010). For example, in Southern Africa, up to half of child and maternal mortality
is related to HIV.43 An untreated baby is likely to die before he or she is two years old
(UNAIDS, 2010b). There has been significant progress in preventing HIV among children –
globally there was a 24% decline in newly infected infants and a 19% decline in children dying
from AIDS between 2004 and 2009 (UNAIDS, 2010a). The numbers of HIV-positive pregnant
women in low- and middle-income countries taking ARVs to prevent transmission of the virus
to their babies rose from 15% in 2005 to 53% in 2009 (UNAIDS, 2010b).
However, in 2009 an estimated 370,000 infants worldwide were infected with HIV, indicating
that more concerted action is needed to prevent HIV-positive mothers passing their infection
on to their babies (UNAIDS, 2010a), and only 35% of infected babies received ARVs (UNAIDS,
2010b). Moreover, the number of children living with HIV continues to rise – to 2.5 million in
2009 and, in some countries, such as South Africa, so does mother-to-child transmission and
child and maternal mortality from HIV/AIDS (UNAIDS, 2010a). In many countries, the
numbers of children orphaned by HIV/AIDS are still increasing – from an estimated total of
14.4 million in 2005 to 16.6 million in 2009 (ibid.). This reflects the fact that, in many
countries, ARV coverage is far from universal and young adults are still dying from AIDS on a
large scale; furthermore, even people taking ARVs are vulnerable to a range of other diseases.
Botswana is an example of a country with high HIV prevalence (24.9% overall and 33% among
pregnant women in 2010)44 that has pioneered an effective approach to prevention of mother-
to-child transmission (PMTCT) of HIV. Case Study 3 below discusses how the country has
achieved impressive reductions in PMTCT – from 20.7% of infants of HIV-positive mothers
infected in 2003 to 4.8% in 2008 (Baleta, 2010).
How has progress in PMTCT been achieved?
Political will and leadership
The fight against HIV/AIDS has mobilised political will and leadership globally – until recently,
much more than for other diseases. This, in turn, has led to significant resources for
prevention and treatment, and to technical innovations, such as the new generation of highly
effective drugs that cut mortality and prevent mother-to-child transmission of HIV.
Significant resources from governments and donors
In 2009, $15.9 billion was spent on responding to HIV/AIDS, half of which came from
governments of low- and middle-income countries. In low-income countries, 88% of funding
for HIV/AIDS programmes is provided by donors. Despite the growth of multilateral funders
such as the Global Fund to Fight AIDS, Tuberculosis and Malaria and UNITAID, the vast
majority of funding for HIV/AIDS programme continues to be provided directly by bilateral
donors (77% of all HIV/AIDS funding in 2009). The US is by a considerable margin the biggest
donor to HIV/AIDS programmes (UNAIDS, 2010a). On average, middle-income countries
finance 54% of HIV programmes domestically (ibid.).
Over the period 2000-2010, global aid to HIV programmes rose by a factor of 10, from $719
million in 1999 to $7.8 billion in 2009. Funding is concentrated in sub-Saharan Africa,
reflecting the geographical concentration and distribution of the epidemic. Donor funding to
HIV/AIDS rose in sub-Saharan Africa for almost all this period, although commitments have
fallen since 2008. Figure 6 shows regional trends in aid for HIV/AIDS.
43 www.unicef.org/media/media_58026.html [accessed 4 September 2011] 44 UNICEF (2010)
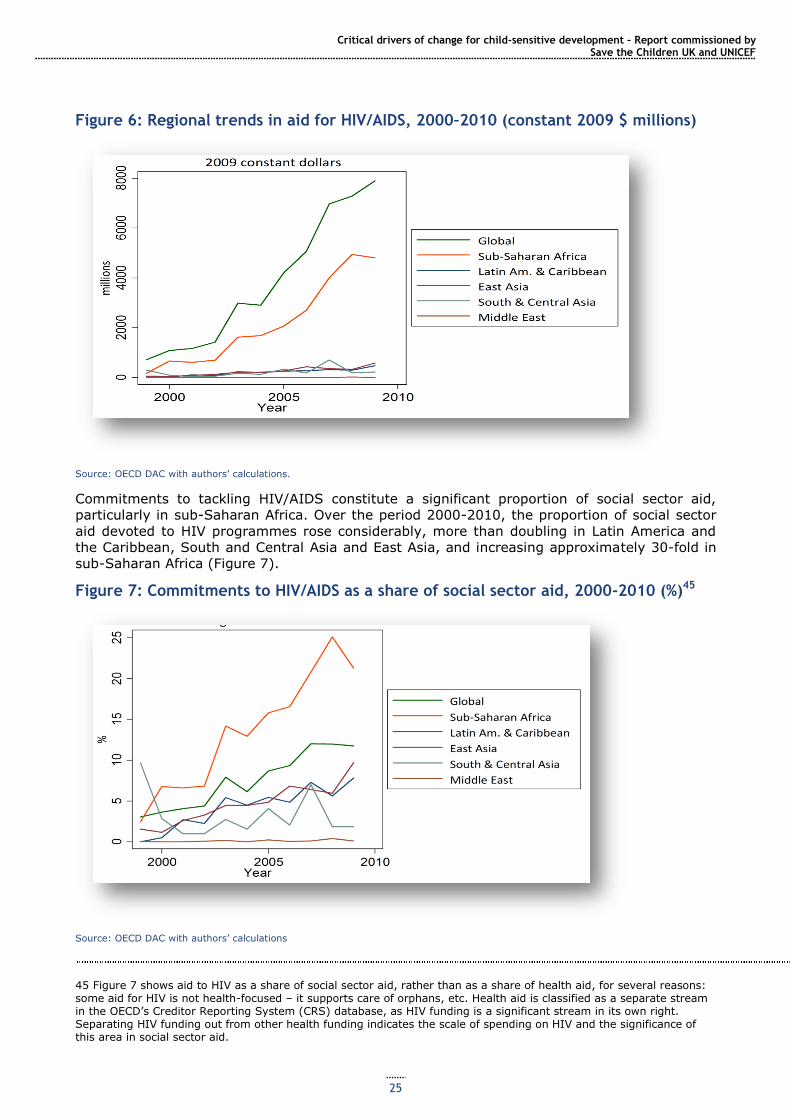
Critical drivers of change for child-sensitive development – Report commissioned by Save the Children UK and UNICEF
25
Figure 6: Regional trends in aid for HIV/AIDS, 2000–2010 (constant 2009 $ millions)
Source: OECD DAC with authors‘ calculations.
Commitments to tackling HIV/AIDS constitute a significant proportion of social sector aid,
particularly in sub-Saharan Africa. Over the period 2000-2010, the proportion of social sector
aid devoted to HIV programmes rose considerably, more than doubling in Latin America and
the Caribbean, South and Central Asia and East Asia, and increasing approximately 30-fold in
sub-Saharan Africa (Figure 7).
Figure 7: Commitments to HIV/AIDS as a share of social sector aid, 2000-2010 (%)45
Source: OECD DAC with authors‘ calculations
45 Figure 7 shows aid to HIV as a share of social sector aid, rather than as a share of health aid, for several reasons: some aid for HIV is not health-focused – it supports care of orphans, etc. Health aid is classified as a separate stream in the OECD‘s Creditor Reporting System (CRS) database, as HIV funding is a significant stream in its own right. Separating HIV funding out from other health funding indicates the scale of spending on HIV and the significance of this area in social sector aid.
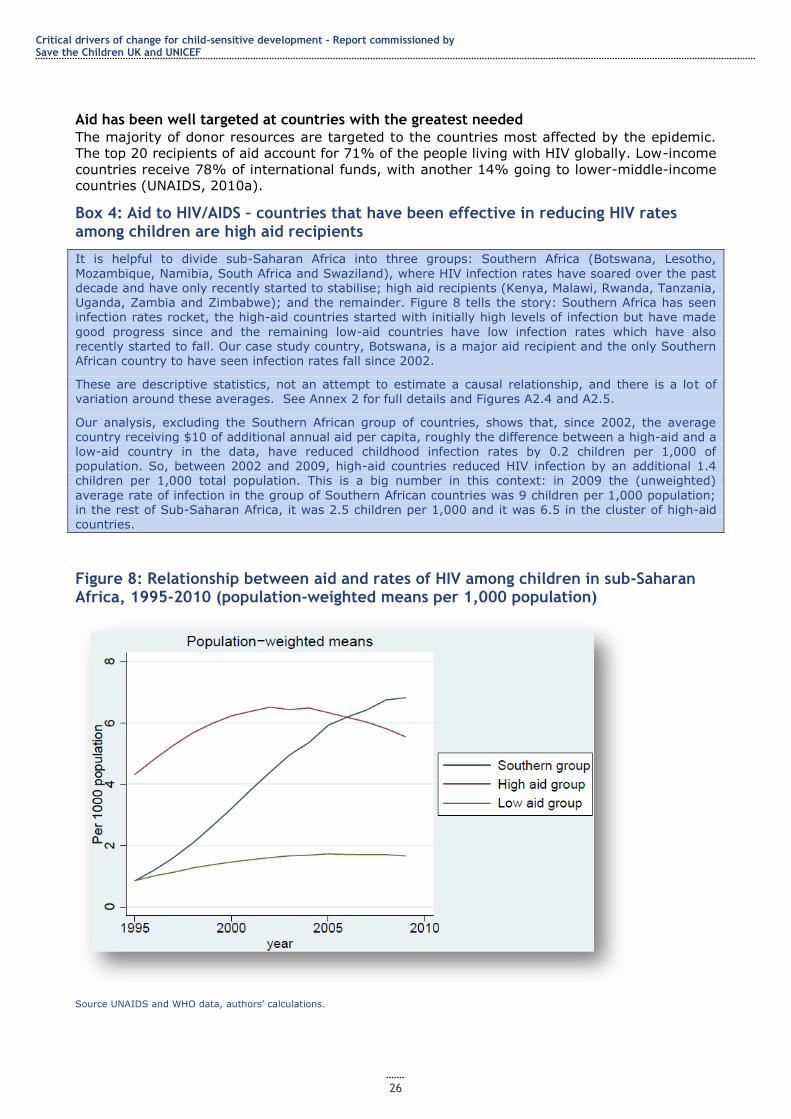
Critical drivers of change for child-sensitive development - Report commissioned by Save the Children UK and UNICEF
26
Aid has been well targeted at countries with the greatest needed
The majority of donor resources are targeted to the countries most affected by the epidemic.
The top 20 recipients of aid account for 71% of the people living with HIV globally. Low-income
countries receive 78% of international funds, with another 14% going to lower-middle-income
countries (UNAIDS, 2010a).
Box 4: Aid to HIV/AIDS – countries that have been effective in reducing HIV rates among children are high aid recipients
It is helpful to divide sub-Saharan Africa into three groups: Southern Africa (Botswana, Lesotho,
Mozambique, Namibia, South Africa and Swaziland), where HIV infection rates have soared over the past decade and have only recently started to stabilise; high aid recipients (Kenya, Malawi, Rwanda, Tanzania, Uganda, Zambia and Zimbabwe); and the remainder. Figure 8 tells the story: Southern Africa has seen infection rates rocket, the high-aid countries started with initially high levels of infection but have made
good progress since and the remaining low-aid countries have low infection rates which have also recently started to fall. Our case study country, Botswana, is a major aid recipient and the only Southern African country to have seen infection rates fall since 2002.
These are descriptive statistics, not an attempt to estimate a causal relationship, and there is a lot of variation around these averages. See Annex 2 for full details and Figures A2.4 and A2.5.
Our analysis, excluding the Southern African group of countries, shows that, since 2002, the average country receiving $10 of additional annual aid per capita, roughly the difference between a high-aid and a low-aid country in the data, have reduced childhood infection rates by 0.2 children per 1,000 of population. So, between 2002 and 2009, high-aid countries reduced HIV infection by an additional 1.4 children per 1,000 total population. This is a big number in this context: in 2009 the (unweighted)
average rate of infection in the group of Southern African countries was 9 children per 1,000 population; in the rest of Sub-Saharan Africa, it was 2.5 children per 1,000 and it was 6.5 in the cluster of high-aid countries.
Figure 8: Relationship between aid and rates of HIV among children in sub-Saharan Africa, 1995-2010 (population-weighted means per 1,000 population)
Source UNAIDS and WHO data, authors‘ calculations.
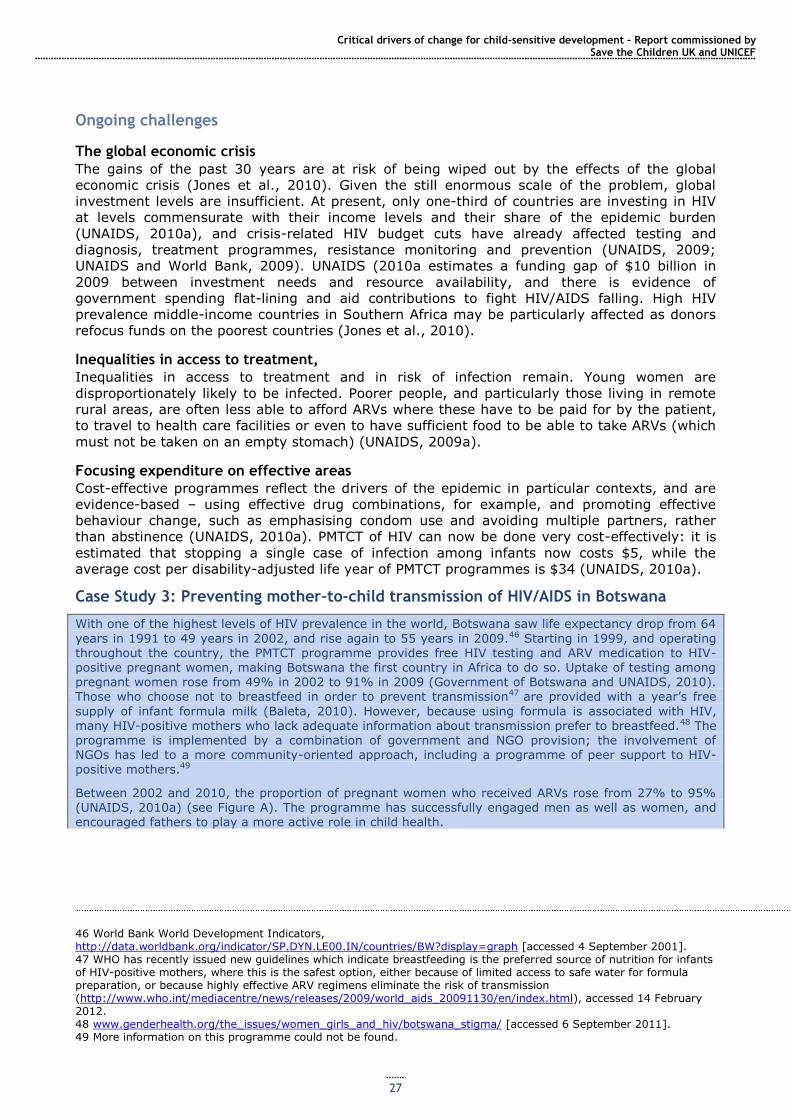
Critical drivers of change for child-sensitive development – Report commissioned by Save the Children UK and UNICEF
27
Ongoing challenges
The global economic crisis
The gains of the past 30 years are at risk of being wiped out by the effects of the global
economic crisis (Jones et al., 2010). Given the still enormous scale of the problem, global
investment levels are insufficient. At present, only one-third of countries are investing in HIV
at levels commensurate with their income levels and their share of the epidemic burden
(UNAIDS, 2010a), and crisis-related HIV budget cuts have already affected testing and
diagnosis, treatment programmes, resistance monitoring and prevention (UNAIDS, 2009;
UNAIDS and World Bank, 2009). UNAIDS (2010a estimates a funding gap of $10 billion in
2009 between investment needs and resource availability, and there is evidence of
government spending flat-lining and aid contributions to fight HIV/AIDS falling. High HIV
prevalence middle-income countries in Southern Africa may be particularly affected as donors
refocus funds on the poorest countries (Jones et al., 2010).
Inequalities in access to treatment,
Inequalities in access to treatment and in risk of infection remain. Young women are
disproportionately likely to be infected. Poorer people, and particularly those living in remote
rural areas, are often less able to afford ARVs where these have to be paid for by the patient,
to travel to health care facilities or even to have sufficient food to be able to take ARVs (which
must not be taken on an empty stomach) (UNAIDS, 2009a).
Focusing expenditure on effective areas
Cost-effective programmes reflect the drivers of the epidemic in particular contexts, and are
evidence-based – using effective drug combinations, for example, and promoting effective
behaviour change, such as emphasising condom use and avoiding multiple partners, rather
than abstinence (UNAIDS, 2010a). PMTCT of HIV can now be done very cost-effectively: it is
estimated that stopping a single case of infection among infants now costs $5, while the
average cost per disability-adjusted life year of PMTCT programmes is $34 (UNAIDS, 2010a).
Case Study 3: Preventing mother–to-child transmission of HIV/AIDS in Botswana
With one of the highest levels of HIV prevalence in the world, Botswana saw life expectancy drop from 64
years in 1991 to 49 years in 2002, and rise again to 55 years in 2009.46 Starting in 1999, and operating throughout the country, the PMTCT programme provides free HIV testing and ARV medication to HIV-positive pregnant women, making Botswana the first country in Africa to do so. Uptake of testing among pregnant women rose from 49% in 2002 to 91% in 2009 (Government of Botswana and UNAIDS, 2010). Those who choose not to breastfeed in order to prevent transmission47 are provided with a year‘s free
supply of infant formula milk (Baleta, 2010). However, because using formula is associated with HIV, many HIV-positive mothers who lack adequate information about transmission prefer to breastfeed.48 The programme is implemented by a combination of government and NGO provision; the involvement of NGOs has led to a more community-oriented approach, including a programme of peer support to HIV-
positive mothers.49
Between 2002 and 2010, the proportion of pregnant women who received ARVs rose from 27% to 95% (UNAIDS, 2010a) (see Figure A). The programme has successfully engaged men as well as women, and encouraged fathers to play a more active role in child health.
46 World Bank World Development Indicators, http://data.worldbank.org/indicator/SP.DYN.LE00.IN/countries/BW?display=graph [accessed 4 September 2001]. 47 WHO has recently issued new guidelines which indicate breastfeeding is the preferred source of nutrition for infants of HIV-positive mothers, where this is the safest option, either because of limited access to safe water for formula preparation, or because highly effective ARV regimens eliminate the risk of transmission (http://www.who.int/mediacentre/news/releases/2009/world_aids_20091130/en/index.html), accessed 14 February 2012. 48 www.genderhealth.org/the_issues/women_girls_and_hiv/botswana_stigma/ [accessed 6 September 2011]. 49 More information on this programme could not be found.
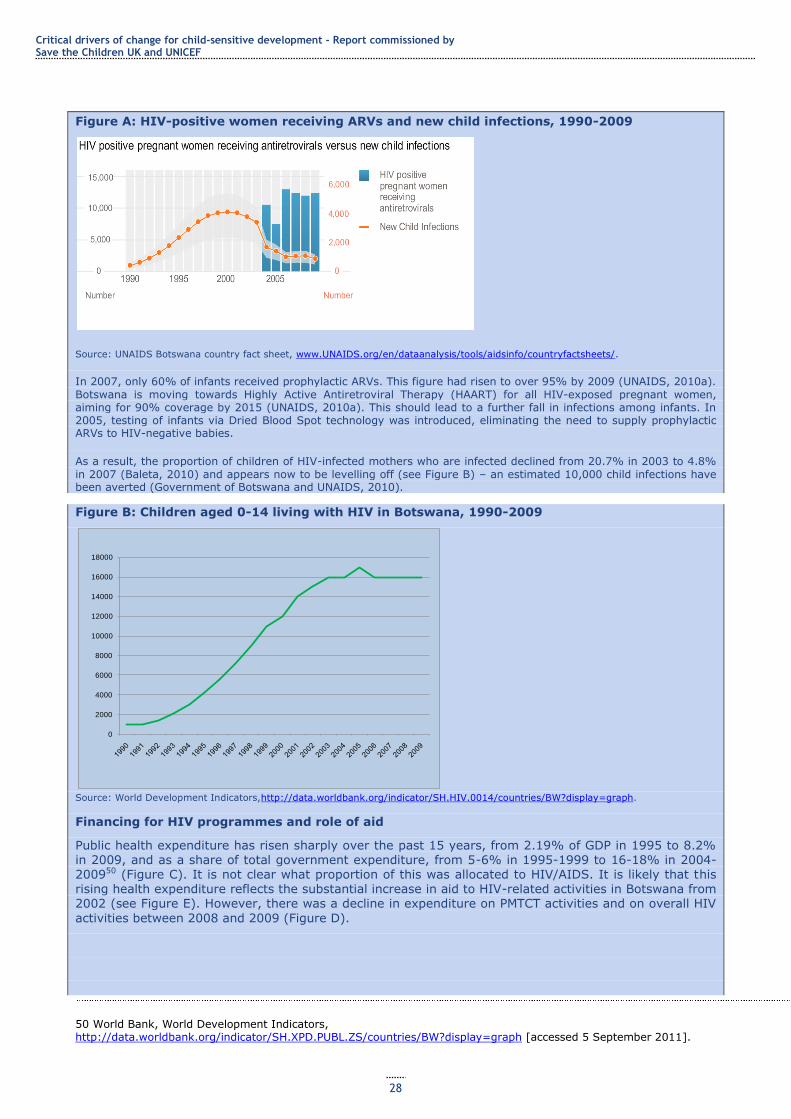
Critical drivers of change for child-sensitive development - Report commissioned by Save the Children UK and UNICEF
28
Figure A: HIV-positive women receiving ARVs and new child infections, 1990-2009
Source: UNAIDS Botswana country fact sheet, www.UNAIDS.org/en/dataanalysis/tools/aidsinfo/countryfactsheets/.
In 2007, only 60% of infants received prophylactic ARVs. This figure had risen to over 95% by 2009 (UNAIDS, 2010a).
Botswana is moving towards Highly Active Antiretroviral Therapy (HAART) for all HIV-exposed pregnant women, aiming for 90% coverage by 2015 (UNAIDS, 2010a). This should lead to a further fall in infections among infants. In 2005, testing of infants via Dried Blood Spot technology was introduced, eliminating the need to supply prophylactic ARVs to HIV-negative babies.
As a result, the proportion of children of HIV-infected mothers who are infected declined from 20.7% in 2003 to 4.8%
in 2007 (Baleta, 2010) and appears now to be levelling off (see Figure B) – an estimated 10,000 child infections have been averted (Government of Botswana and UNAIDS, 2010).
Figure B: Children aged 0-14 living with HIV in Botswana, 1990-2009
Source: World Development Indicators,http://data.worldbank.org/indicator/SH.HIV.0014/countries/BW?display=graph.
Financing for HIV programmes and role of aid
Public health expenditure has risen sharply over the past 15 years, from 2.19% of GDP in 1995 to 8.2% in 2009, and as a share of total government expenditure, from 5-6% in 1995-1999 to 16-18% in 2004-200950 (Figure C). It is not clear what proportion of this was allocated to HIV/AIDS. It is likely that this rising health expenditure reflects the substantial increase in aid to HIV-related activities in Botswana from 2002 (see Figure E). However, there was a decline in expenditure on PMTCT activities and on overall HIV
activities between 2008 and 2009 (Figure D).
50 World Bank, World Development Indicators, http://data.worldbank.org/indicator/SH.XPD.PUBL.ZS/countries/BW?display=graph [accessed 5 September 2011].
0
2000
4000
6000
8000
10000
12000
14000
16000
18000
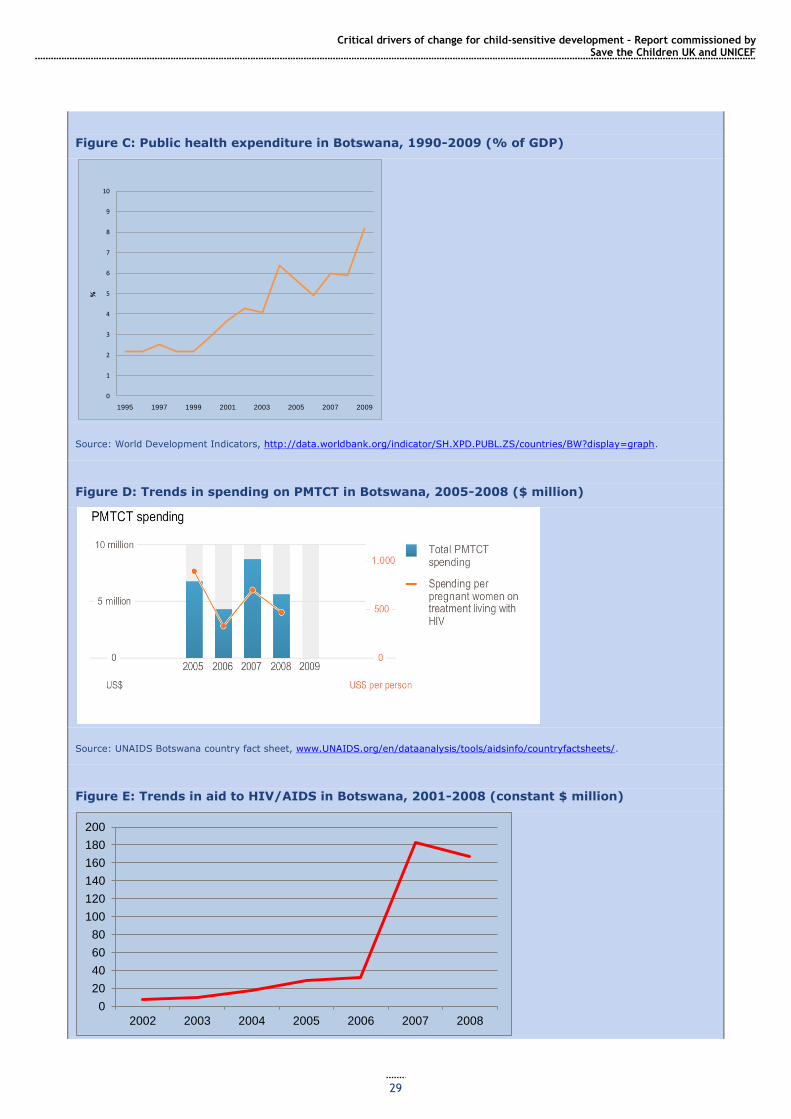
Critical drivers of change for child-sensitive development – Report commissioned by Save the Children UK and UNICEF
29
Figure C: Public health expenditure in Botswana, 1990-2009 (% of GDP)
Source: World Development Indicators, http://data.worldbank.org/indicator/SH.XPD.PUBL.ZS/countries/BW?display=graph.
Figure D: Trends in spending on PMTCT in Botswana, 2005-2008 ($ million)
Source: UNAIDS Botswana country fact sheet, www.UNAIDS.org/en/dataanalysis/tools/aidsinfo/countryfactsheets/.
Figure E: Trends in aid to HIV/AIDS in Botswana, 2001-2008 (constant $ million)
0
1
2
3
4
5
6
7
8
9
10
1995 1997 1999 2001 2003 2005 2007 2009
%
0
20
40
60
80
100
120
140
160
180
200
2002 2003 2004 2005 2006 2007 2008
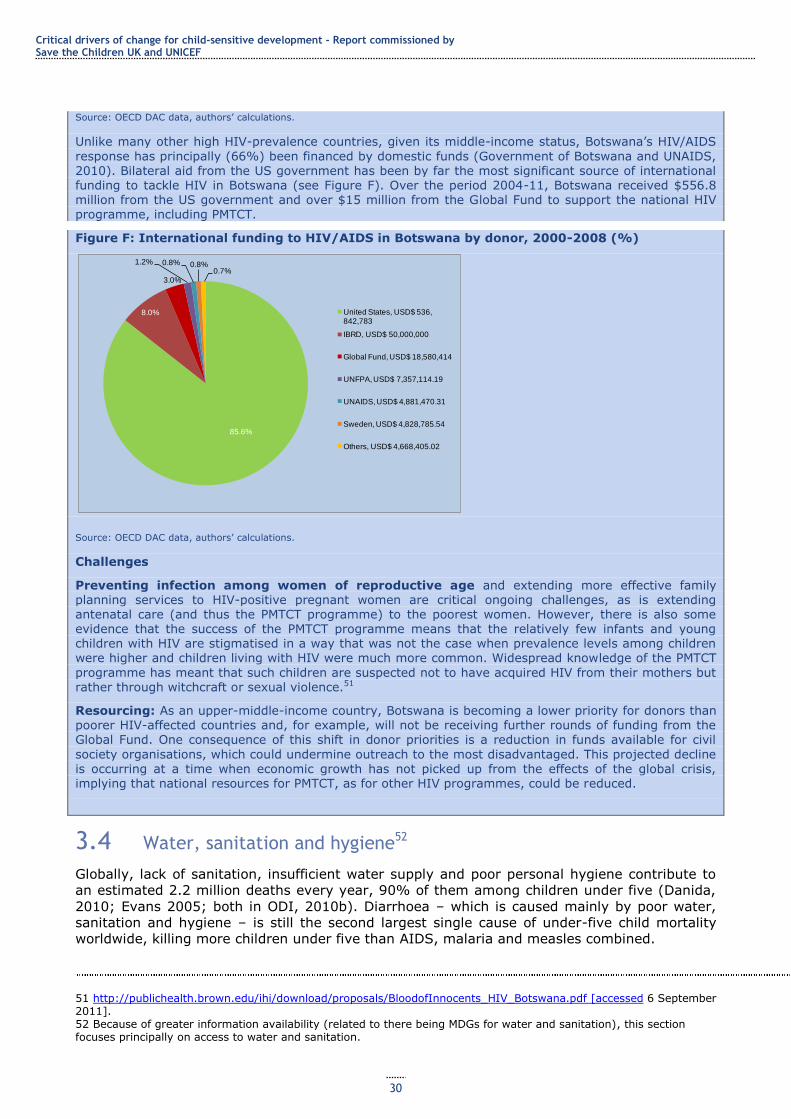
Critical drivers of change for child-sensitive development - Report commissioned by Save the Children UK and UNICEF
30
Source: OECD DAC data, authors‘ calculations.
Unlike many other high HIV-prevalence countries, given its middle-income status, Botswana‘s HIV/AIDS
response has principally (66%) been financed by domestic funds (Government of Botswana and UNAIDS, 2010). Bilateral aid from the US government has been by far the most significant source of international funding to tackle HIV in Botswana (see Figure F). Over the period 2004-11, Botswana received $556.8 million from the US government and over $15 million from the Global Fund to support the national HIV programme, including PMTCT.
Figure F: International funding to HIV/AIDS in Botswana by donor, 2000-2008 (%)
Source: OECD DAC data, authors‘ calculations.
Challenges
Preventing infection among women of reproductive age and extending more effective family planning services to HIV-positive pregnant women are critical ongoing challenges, as is extending antenatal care (and thus the PMTCT programme) to the poorest women. However, there is also some evidence that the success of the PMTCT programme means that the relatively few infants and young children with HIV are stigmatised in a way that was not the case when prevalence levels among children were higher and children living with HIV were much more common. Widespread knowledge of the PMTCT
programme has meant that such children are suspected not to have acquired HIV from their mothers but rather through witchcraft or sexual violence.51
Resourcing: As an upper-middle-income country, Botswana is becoming a lower priority for donors than poorer HIV-affected countries and, for example, will not be receiving further rounds of funding from the Global Fund. One consequence of this shift in donor priorities is a reduction in funds available for civil
society organisations, which could undermine outreach to the most disadvantaged. This projected decline
is occurring at a time when economic growth has not picked up from the effects of the global crisis, implying that national resources for PMTCT, as for other HIV programmes, could be reduced.
3.4 Water, sanitation and hygiene52
Globally, lack of sanitation, insufficient water supply and poor personal hygiene contribute to
an estimated 2.2 million deaths every year, 90% of them among children under five (Danida,
2010; Evans 2005; both in ODI, 2010b). Diarrhoea – which is caused mainly by poor water,
sanitation and hygiene – is still the second largest single cause of under-five child mortality
worldwide, killing more children under five than AIDS, malaria and measles combined.
51 http://publichealth.brown.edu/ihi/download/proposals/BloodofInnocents_HIV_Botswana.pdf [accessed 6 September 2011]. 52 Because of greater information availability (related to there being MDGs for water and sanitation), this section focuses principally on access to water and sanitation.
85.6%
8.0%
3.0%
1.2% 0.8% 0.8%0.7%
United States, USD$ 536, 842,783
IBRD, USD$ 50,000,000
Global Fund, USD$ 18,580,414
UNFPA, USD$ 7,357,114.19
UNAIDS, USD$ 4,881,470.31
Sweden, USD$ 4,828,785.54
Others, USD$ 4,668,405.02
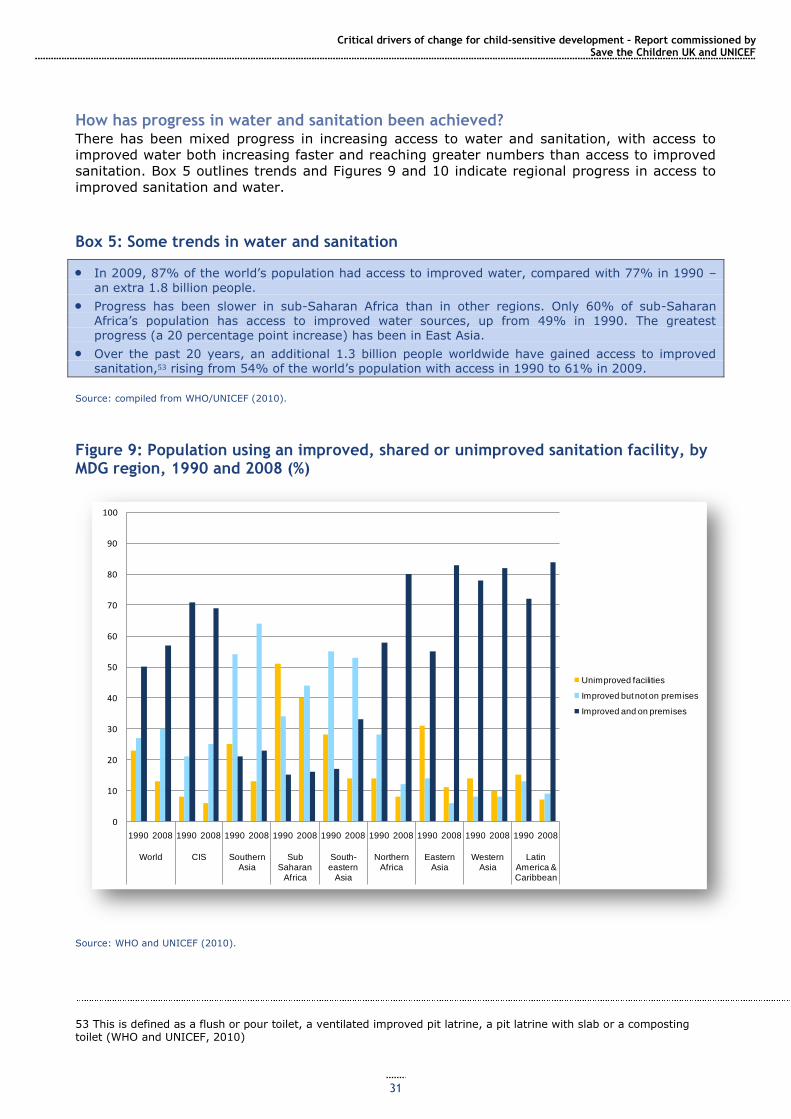
Critical drivers of change for child-sensitive development – Report commissioned by Save the Children UK and UNICEF
31
How has progress in water and sanitation been achieved? There has been mixed progress in increasing access to water and sanitation, with access to
improved water both increasing faster and reaching greater numbers than access to improved
sanitation. Box 5 outlines trends and Figures 9 and 10 indicate regional progress in access to
improved sanitation and water.
Box 5: Some trends in water and sanitation
In 2009, 87% of the world‘s population had access to improved water, compared with 77% in 1990 –
an extra 1.8 billion people.
Progress has been slower in sub-Saharan Africa than in other regions. Only 60% of sub-Saharan Africa‘s population has access to improved water sources, up from 49% in 1990. The greatest
progress (a 20 percentage point increase) has been in East Asia.
Over the past 20 years, an additional 1.3 billion people worldwide have gained access to improved sanitation,53 rising from 54% of the world‘s population with access in 1990 to 61% in 2009.
Source: compiled from WHO/UNICEF (2010).
Figure 9: Population using an improved, shared or unimproved sanitation facility, by MDG region, 1990 and 2008 (%)
Source: WHO and UNICEF (2010).
53 This is defined as a flush or pour toilet, a ventilated improved pit latrine, a pit latrine with slab or a composting toilet (WHO and UNICEF, 2010)
0
10
20
30
40
50
60
70
80
90
100
1990 2008 1990 2008 1990 2008 1990 2008 1990 2008 1990 2008 1990 2008 1990 2008 1990 2008
World CIS Southern Asia
Sub Saharan
Africa
South-eastern
Asia
Northern Africa
Eastern Asia
Western Asia
Latin America & Caribbean
Unimproved facilities
Improved but not on premises
Improved and on premises
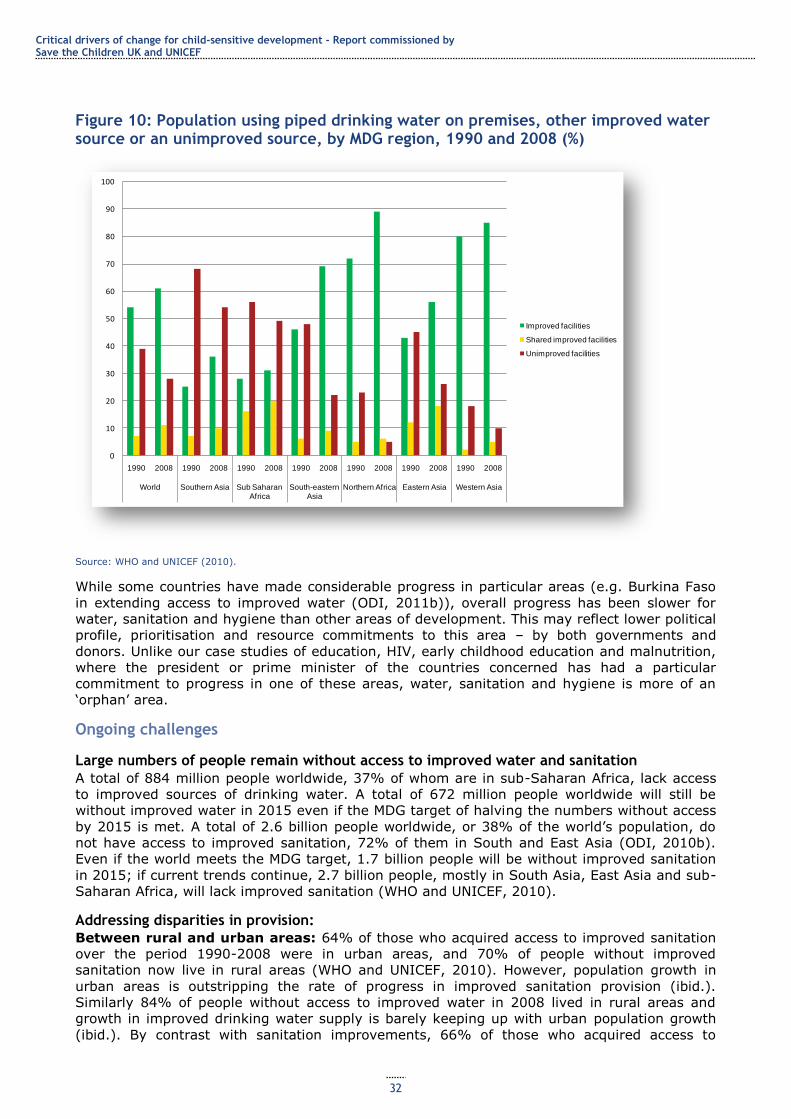
Critical drivers of change for child-sensitive development - Report commissioned by Save the Children UK and UNICEF
32
Figure 10: Population using piped drinking water on premises, other improved water source or an unimproved source, by MDG region, 1990 and 2008 (%)
Source: WHO and UNICEF (2010).
While some countries have made considerable progress in particular areas (e.g. Burkina Faso
in extending access to improved water (ODI, 2011b)), overall progress has been slower for
water, sanitation and hygiene than other areas of development. This may reflect lower political
profile, prioritisation and resource commitments to this area – by both governments and
donors. Unlike our case studies of education, HIV, early childhood education and malnutrition,
where the president or prime minister of the countries concerned has had a particular
commitment to progress in one of these areas, water, sanitation and hygiene is more of an
‗orphan‘ area.
Ongoing challenges
Large numbers of people remain without access to improved water and sanitation
A total of 884 million people worldwide, 37% of whom are in sub-Saharan Africa, lack access
to improved sources of drinking water. A total of 672 million people worldwide will still be
without improved water in 2015 even if the MDG target of halving the numbers without access
by 2015 is met. A total of 2.6 billion people worldwide, or 38% of the world‘s population, do
not have access to improved sanitation, 72% of them in South and East Asia (ODI, 2010b).
Even if the world meets the MDG target, 1.7 billion people will be without improved sanitation
in 2015; if current trends continue, 2.7 billion people, mostly in South Asia, East Asia and sub-
Saharan Africa, will lack improved sanitation (WHO and UNICEF, 2010).
Addressing disparities in provision:
Between rural and urban areas: 64% of those who acquired access to improved sanitation
over the period 1990-2008 were in urban areas, and 70% of people without improved
sanitation now live in rural areas (WHO and UNICEF, 2010). However, population growth in
urban areas is outstripping the rate of progress in improved sanitation provision (ibid.).
Similarly 84% of people without access to improved water in 2008 lived in rural areas and
growth in improved drinking water supply is barely keeping up with urban population growth
(ibid.). By contrast with sanitation improvements, 66% of those who acquired access to
0
10
20
30
40
50
60
70
80
90
100
1990 2008 1990 2008 1990 2008 1990 2008 1990 2008 1990 2008 1990 2008
World Southern Asia Sub Saharan Africa
South-eastern Asia
Northern Africa Eastern Asia Western Asia
Improved facilities
Shared improved facilities
Unimproved facilities
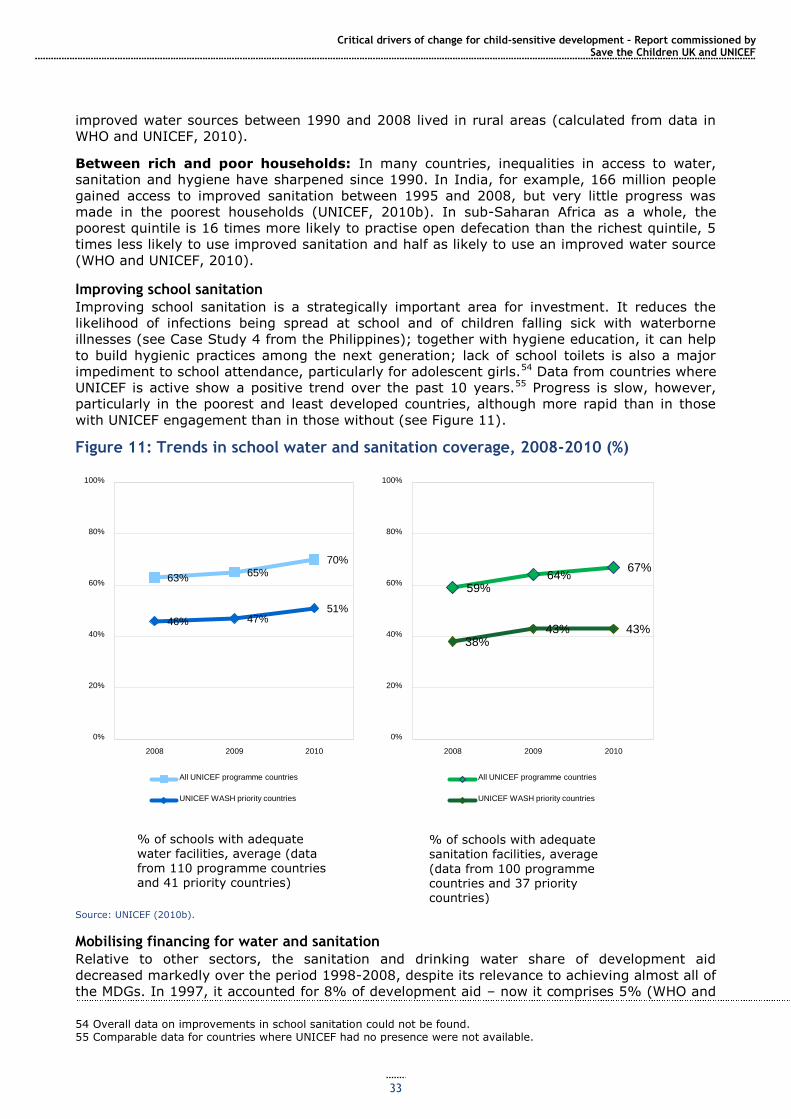
Critical drivers of change for child-sensitive development – Report commissioned by Save the Children UK and UNICEF
33
improved water sources between 1990 and 2008 lived in rural areas (calculated from data in
WHO and UNICEF, 2010).
Between rich and poor households: In many countries, inequalities in access to water,
sanitation and hygiene have sharpened since 1990. In India, for example, 166 million people
gained access to improved sanitation between 1995 and 2008, but very little progress was
made in the poorest households (UNICEF, 2010b). In sub-Saharan Africa as a whole, the
poorest quintile is 16 times more likely to practise open defecation than the richest quintile, 5
times less likely to use improved sanitation and half as likely to use an improved water source
(WHO and UNICEF, 2010).
Improving school sanitation
Improving school sanitation is a strategically important area for investment. It reduces the
likelihood of infections being spread at school and of children falling sick with waterborne
illnesses (see Case Study 4 from the Philippines); together with hygiene education, it can help
to build hygienic practices among the next generation; lack of school toilets is also a major
impediment to school attendance, particularly for adolescent girls.54 Data from countries where
UNICEF is active show a positive trend over the past 10 years.55 Progress is slow, however,
particularly in the poorest and least developed countries, although more rapid than in those
with UNICEF engagement than in those without (see Figure 11).
Figure 11: Trends in school water and sanitation coverage, 2008-2010 (%)
Source: UNICEF (2010b).
Mobilising financing for water and sanitation
Relative to other sectors, the sanitation and drinking water share of development aid
decreased markedly over the period 1998-2008, despite its relevance to achieving almost all of
the MDGs. In 1997, it accounted for 8% of development aid – now it comprises 5% (WHO and
54 Overall data on improvements in school sanitation could not be found. 55 Comparable data for countries where UNICEF had no presence were not available.
63% 65%
70%
46% 47% 51%
0%
20%
40%
60%
80%
100%
2008 2009 2010
All UNICEF programme countries
UNICEF WASH priority countries
59% 64%
67%
38% 43% 43%
0%
20%
40%
60%
80%
100%
2008 2009 2010
All UNICEF programme countries
UNICEF WASH priority countries
% of schools with adequate water facilities, average (data from 110 programme countries and 41 priority countries)
% of schools with adequate sanitation facilities, average
(data from 100 programme countries and 37 priority countries)
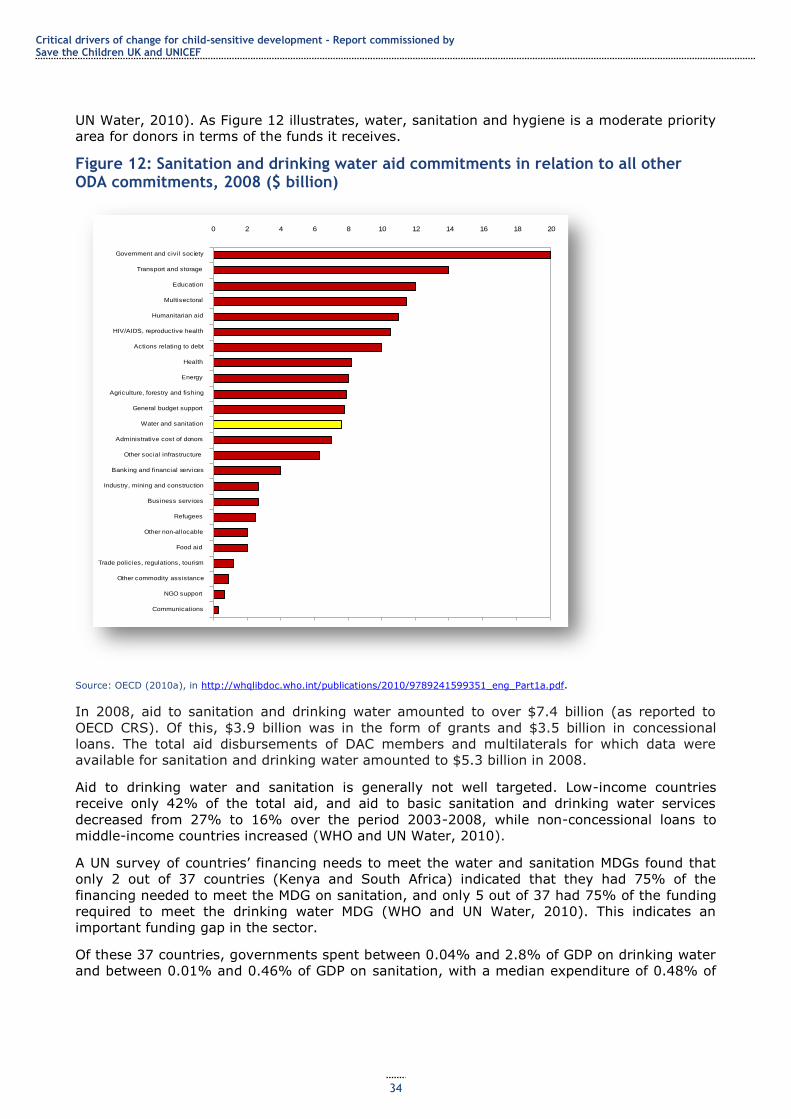
Critical drivers of change for child-sensitive development - Report commissioned by Save the Children UK and UNICEF
34
UN Water, 2010). As Figure 12 illustrates, water, sanitation and hygiene is a moderate priority
area for donors in terms of the funds it receives.
Figure 12: Sanitation and drinking water aid commitments in relation to all other ODA commitments, 2008 ($ billion)
Source: OECD (2010a), in http://whqlibdoc.who.int/publications/2010/9789241599351_eng_Part1a.pdf.
In 2008, aid to sanitation and drinking water amounted to over $7.4 billion (as reported to
OECD CRS). Of this, $3.9 billion was in the form of grants and $3.5 billion in concessional
loans. The total aid disbursements of DAC members and multilaterals for which data were
available for sanitation and drinking water amounted to $5.3 billion in 2008.
Aid to drinking water and sanitation is generally not well targeted. Low-income countries
receive only 42% of the total aid, and aid to basic sanitation and drinking water services
decreased from 27% to 16% over the period 2003-2008, while non-concessional loans to
middle-income countries increased (WHO and UN Water, 2010).
A UN survey of countries‘ financing needs to meet the water and sanitation MDGs found that
only 2 out of 37 countries (Kenya and South Africa) indicated that they had 75% of the
financing needed to meet the MDG on sanitation, and only 5 out of 37 had 75% of the funding
required to meet the drinking water MDG (WHO and UN Water, 2010). This indicates an
important funding gap in the sector.
Of these 37 countries, governments spent between 0.04% and 2.8% of GDP on drinking water
and between 0.01% and 0.46% of GDP on sanitation, with a median expenditure of 0.48% of
0 2 4 6 8 10 12 14 16 18 20
Government and civil society
Transport and storage
Education
Multisectoral
Humanitarian aid
HIV/AIDS, reproductive health
Actions relating to debt
Health
Energy
Agriculture, forestry and fishing
General budget support
Water and sanitation
Administrative cost of donors
Other social infrastructure
Banking and financial services
Industry, mining and construction
Business services
Refugees
Other non-allocable
Food aid
Trade policies, regulations, tourism
Other commodity assistance
NGO support
Communications
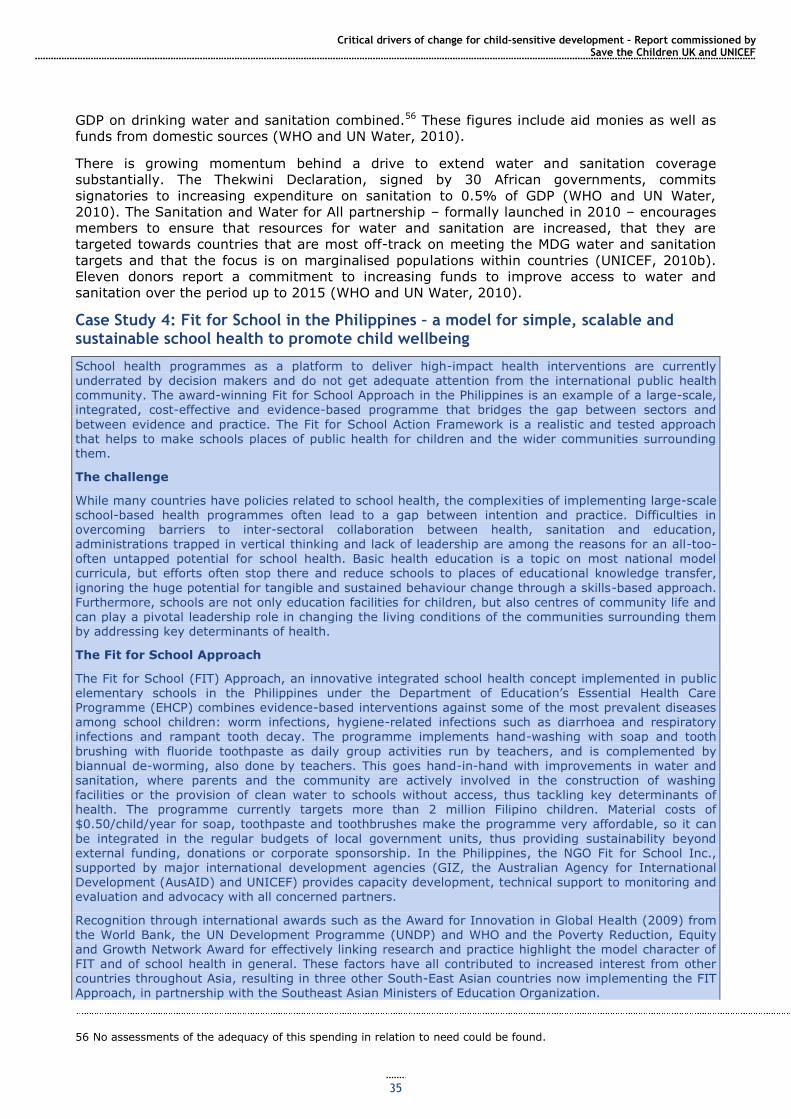
Critical drivers of change for child-sensitive development – Report commissioned by Save the Children UK and UNICEF
35
GDP on drinking water and sanitation combined.56 These figures include aid monies as well as
funds from domestic sources (WHO and UN Water, 2010).
There is growing momentum behind a drive to extend water and sanitation coverage
substantially. The Thekwini Declaration, signed by 30 African governments, commits
signatories to increasing expenditure on sanitation to 0.5% of GDP (WHO and UN Water,
2010). The Sanitation and Water for All partnership – formally launched in 2010 – encourages
members to ensure that resources for water and sanitation are increased, that they are
targeted towards countries that are most off-track on meeting the MDG water and sanitation
targets and that the focus is on marginalised populations within countries (UNICEF, 2010b).
Eleven donors report a commitment to increasing funds to improve access to water and
sanitation over the period up to 2015 (WHO and UN Water, 2010).
Case Study 4: Fit for School in the Philippines – a model for simple, scalable and sustainable school health to promote child wellbeing
School health programmes as a platform to deliver high-impact health interventions are currently underrated by decision makers and do not get adequate attention from the international public health community. The award-winning Fit for School Approach in the Philippines is an example of a large-scale, integrated, cost-effective and evidence-based programme that bridges the gap between sectors and
between evidence and practice. The Fit for School Action Framework is a realistic and tested approach that helps to make schools places of public health for children and the wider communities surrounding them.
The challenge
While many countries have policies related to school health, the complexities of implementing large-scale school-based health programmes often lead to a gap between intention and practice. Difficulties in overcoming barriers to inter-sectoral collaboration between health, sanitation and education, administrations trapped in vertical thinking and lack of leadership are among the reasons for an all-too-
often untapped potential for school health. Basic health education is a topic on most national model curricula, but efforts often stop there and reduce schools to places of educational knowledge transfer,
ignoring the huge potential for tangible and sustained behaviour change through a skills-based approach. Furthermore, schools are not only education facilities for children, but also centres of community life and can play a pivotal leadership role in changing the living conditions of the communities surrounding them by addressing key determinants of health.
The Fit for School Approach
The Fit for School (FIT) Approach, an innovative integrated school health concept implemented in public elementary schools in the Philippines under the Department of Education‘s Essential Health Care Programme (EHCP) combines evidence-based interventions against some of the most prevalent diseases among school children: worm infections, hygiene-related infections such as diarrhoea and respiratory infections and rampant tooth decay. The programme implements hand-washing with soap and tooth
brushing with fluoride toothpaste as daily group activities run by teachers, and is complemented by
biannual de-worming, also done by teachers. This goes hand-in-hand with improvements in water and sanitation, where parents and the community are actively involved in the construction of washing facilities or the provision of clean water to schools without access, thus tackling key determinants of health. The programme currently targets more than 2 million Filipino children. Material costs of $0.50/child/year for soap, toothpaste and toothbrushes make the programme very affordable, so it can
be integrated in the regular budgets of local government units, thus providing sustainability beyond external funding, donations or corporate sponsorship. In the Philippines, the NGO Fit for School Inc., supported by major international development agencies (GIZ, the Australian Agency for International Development (AusAID) and UNICEF) provides capacity development, technical support to monitoring and evaluation and advocacy with all concerned partners.
Recognition through international awards such as the Award for Innovation in Global Health (2009) from the World Bank, the UN Development Programme (UNDP) and WHO and the Poverty Reduction, Equity and Growth Network Award for effectively linking research and practice highlight the model character of FIT and of school health in general. These factors have all contributed to increased interest from other countries throughout Asia, resulting in three other South-East Asian countries now implementing the FIT
Approach, in partnership with the Southeast Asian Ministers of Education Organization.
56 No assessments of the adequacy of this spending in relation to need could be found.
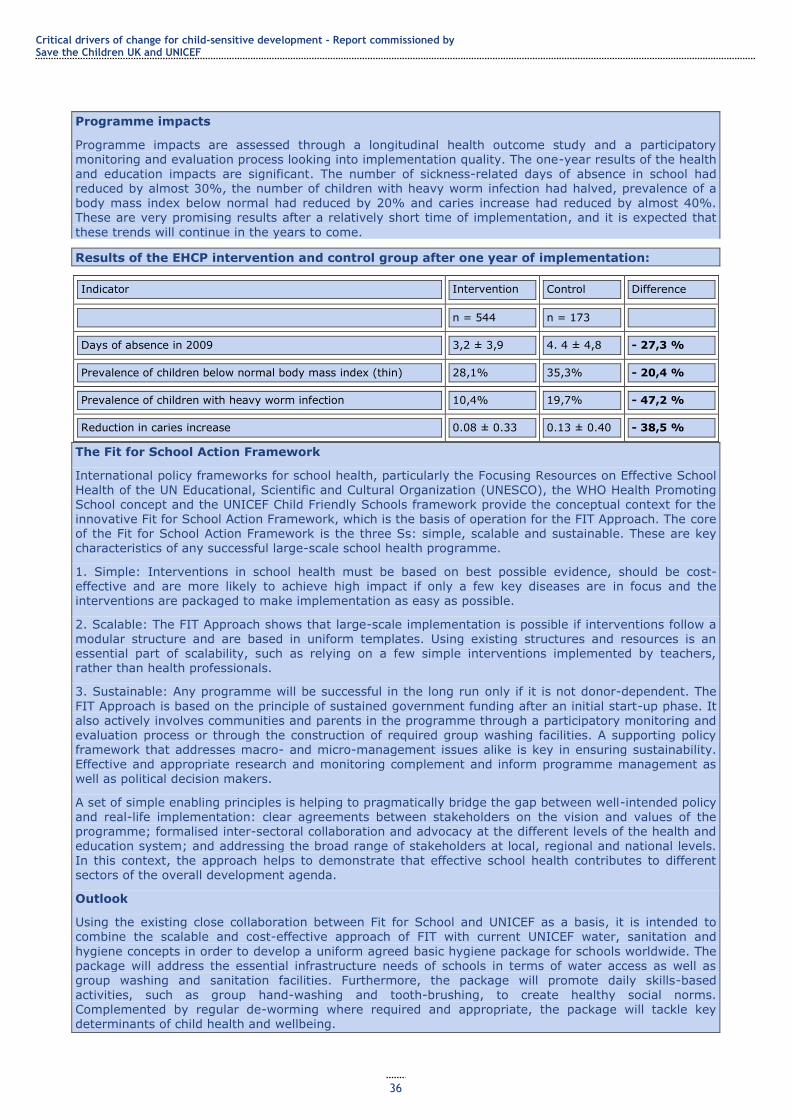
Critical drivers of change for child-sensitive development - Report commissioned by Save the Children UK and UNICEF
36
Programme impacts
Programme impacts are assessed through a longitudinal health outcome study and a participatory monitoring and evaluation process looking into implementation quality. The one-year results of the health and education impacts are significant. The number of sickness-related days of absence in school had reduced by almost 30%, the number of children with heavy worm infection had halved, prevalence of a body mass index below normal had reduced by 20% and caries increase had reduced by almost 40%. These are very promising results after a relatively short time of implementation, and it is expected that
these trends will continue in the years to come.
Results of the EHCP intervention and control group after one year of implementation:
Indicator Intervention Control Difference
n = 544 n = 173
Days of absence in 2009 3,2 ± 3,9 4. 4 ± 4,8 - 27,3 %
Prevalence of children below normal body mass index (thin) 28,1% 35,3% - 20,4 %
Prevalence of children with heavy worm infection 10,4% 19,7% - 47,2 %
Reduction in caries increase 0.08 ± 0.33 0.13 ± 0.40 - 38,5 %
The Fit for School Action Framework
International policy frameworks for school health, particularly the Focusing Resources on Effective School Health of the UN Educational, Scientific and Cultural Organization (UNESCO), the WHO Health Promoting School concept and the UNICEF Child Friendly Schools framework provide the conceptual context for the innovative Fit for School Action Framework, which is the basis of operation for the FIT Approach. The core of the Fit for School Action Framework is the three Ss: simple, scalable and sustainable. These are key
characteristics of any successful large-scale school health programme.
1. Simple: Interventions in school health must be based on best possible evidence, should be cost-effective and are more likely to achieve high impact if only a few key diseases are in focus and the interventions are packaged to make implementation as easy as possible.
2. Scalable: The FIT Approach shows that large-scale implementation is possible if interventions follow a modular structure and are based in uniform templates. Using existing structures and resources is an essential part of scalability, such as relying on a few simple interventions implemented by teachers, rather than health professionals.
3. Sustainable: Any programme will be successful in the long run only if it is not donor-dependent. The
FIT Approach is based on the principle of sustained government funding after an initial start-up phase. It also actively involves communities and parents in the programme through a participatory monitoring and evaluation process or through the construction of required group washing facilities. A supporting policy framework that addresses macro- and micro-management issues alike is key in ensuring sustainability. Effective and appropriate research and monitoring complement and inform programme management as
well as political decision makers.
A set of simple enabling principles is helping to pragmatically bridge the gap between well-intended policy and real-life implementation: clear agreements between stakeholders on the vision and values of the programme; formalised inter-sectoral collaboration and advocacy at the different levels of the health and education system; and addressing the broad range of stakeholders at local, regional and national levels. In this context, the approach helps to demonstrate that effective school health contributes to different sectors of the overall development agenda.
Outlook
Using the existing close collaboration between Fit for School and UNICEF as a basis, it is intended to combine the scalable and cost-effective approach of FIT with current UNICEF water, sanitation and
hygiene concepts in order to develop a uniform agreed basic hygiene package for schools worldwide. The package will address the essential infrastructure needs of schools in terms of water access as well as group washing and sanitation facilities. Furthermore, the package will promote daily skills-based
activities, such as group hand-washing and tooth-brushing, to create healthy social norms. Complemented by regular de-worming where required and appropriate, the package will tackle key determinants of child health and wellbeing.

Critical drivers of change for child-sensitive development – Report commissioned by Save the Children UK and UNICEF
37
Effective school health, embedded in a community context, driven by the education sector and supported by the health and sanitation sectors, produces benefits across many areas, makes schools healthier
places and thus tackles determinants of health and contributes to greater health equity – all at exceptionally low cost. Preventing diseases at an early age and promoting healthy life skills promises huge long-term returns. Healthy children have better self-esteem, perform better at school, grow and develop better and stand higher chances of reaching their full potential. Effective school health can be a key contributor to better child wellbeing in the largest sense.
3.5 Early childhood development
Good quality early childhood development (ECD) programmes can enhance physical wellbeing
(health and nutrition) and motor development, social and emotional development, language
development and basic cognitive skills.57 There is also strong evidence that preschool
experience increases school readiness, timely enrolment rates in the first grade of primary
school, and primary school completion and reduces school dropout and repetition, (UNESCO,
2007). These benefits can be long-lasting – for example, longitudinal evidence from Turkey
indicates that children supported by the Early Enrichment Project in low-income suburbs of
Istanbul were significantly more likely to complete primary school (by a difference of 19
percentage points), began working later, were more likely to attend university and had higher
occupational status than children who had not taken part in the project (Kagitcibasi et al.,
2001, in UNESCO, 2007). Evidence from the US and Brazil shows that low-income urban
children who attended preschool or received home-based support were significantly less likely
to commit crimes in later life (World Bank, 2010). The opportunity to help disadvantaged
children have a more equal start in schooling arises in the earliest years of life, when children‘s
brains are developing most rapidly and the basis for their cognitive, social and emotional
development is being formed (UNICEF, 2006).
In that such programmes help disadvantaged children, who are typically more likely to be
lagging in key areas of development than their wealthier counterparts, ECD programmes have
the potential to help reduce educational and later employment inequalities, if disadvantaged
children can be guaranteed access. However, it is important to underline that much ECD
provision – in both developed and developing countries – is not of good quality and is
principally custodial, that is, it provides a safe place for young children while parents are
working (Penn, 2004) rather than being developmental. ECD programmes typically involve
centre-based education and care, such as kindergartens or day nurseries; home visits and/or
parenting classes; and monitoring through the public health system, particularly for nutrition-
based inputs.
How has progress in ECD been achieved?
Most data available concerns young children‘s attendance at preschool educational institutions,
such as kindergartens, and so we focus on this area. The number of children enrolled in pre-
primary schools worldwide increased by close to 21%, or 25.6 million, between 1999 and
2008, to 148 million, mostly because of gains in South and West Asia, sub-Saharan Africa and,
to a lesser extent, Latin America and the Caribbean (UNESCO, 2008).
In much of the world, these increases have been from a very low starting point. The gross
enrolment rate for pre-primary education in sub-Saharan Africa and the Middle East and North
Africa remains extremely low – 14% and 17%, respectively (UNESCO, 2008). There are
exceptions, such as Ghana, where pre-primary enrolment jumped from 40% to 55% in 2005
following the introduction of two years of free kindergarten education in public schools,
whereby the schools received a grant for every child enrolled (ibid.; Garcia et al., 2008).
Similarly, in other middle-income African countries such as South Africa and São Tomé and
Príncipe, enrolments have risen significantly to 40-50% (UNESCO, 2011). In the poorest
countries, such as Burundi, Chad, Mali and Niger, pre-primary enrolment rates are below 5%
(ibid.).
57 Nadeau et al. (2010) summarise the evidence on the contribution of ECD programmes to children‘s wellbeing in each of these areas.
Critical drivers of change for child-sensitive development - Report commissioned by Save the Children UK and UNICEF
38
In middle-income Latin American countries, increases in enrolment reflect a trend towards
making universal one year of preschool education. In some countries, particularly in Central
Asia and the Caucasus, gross enrolment ratios declined between 1999 and 2004 in the
aftermath of transition but have subsequently started to increase (UNESCO, 2011).
Worldwide, there has been an improvement in pupil-teacher ratios in pre-primary education in
recent years, with a worldwide average of 22:1 in 2005 (UNESCO, 2008).58 This reflects
increasing investment in provision of pre-primary teachers, often as part of the general
expansion of the education system, as in Ethiopia (see Section 3.6).
How have these reductions been financed? Data on trends in government expenditure in ECD provision are not consistently available;
however, as the discussion below on challenges in financing indicates, overall expenditure
levels are extremely low. Aid has played an important role in extending provision in some
countries, such as Ghana,59 and has increased in recent years after falling in the early part of
the decade (see Figure 13). A significant proportion of the increases in enrolment that have
occurred may have been driven by private sector and NGO investments, but this could not be
verified from the available data.60
Some countries, such as Ghana, Mauritius and Namibia, have developed – and then
implemented – sector development plans for ECD. This has been part of an integrated process
that has increased financing levels with the objective of meeting agreed goals for ECD (Boakye
et al., 2008). Political will and technical capacity to drive forward and implement these plans
have been key.
Ongoing challenges
Increasing overall levels of access to and enrolment in ECD programmes
This is a major challenge, particularly in the poorest countries, where less than 5% of the
population has any pre-primary education.
Significant rural-urban differentials in enrolment
At between 10 and 30 percentage points in most countries, with rural children much less likely
to attend (UNESCO, 2007), these differentials reflect the lack of both public and private
preschool provision in many (particularly lower-income) countries, leading to a lack of or
insufficient access for many children in more marginalised contexts. A few countries, such as
Chile (see Case Study 5), Colombia (Vargas-Baron, 2009) and Cuba (Tinajero, 2010) have
either universalised services or developed special initiatives to provide ECD programmes in
remote rural areas.
Significant rich-poor differentials
Overall, poorer children are much less likely to take part in preschool education programmes
than their better-off counterparts. For example, in Ghana, which has the highest pre-primary
enrolment levels in sub-Saharan Africa, the wealthiest children are four times as likely to be
enrolled as the poorest children (UNESCO, 2011). However, these inequalities are not
universal (UNESCO, 2007). Some countries, such as India, principally provide publicly
subsidised ECD programmes to poorer children – through the Integrated Child Development
System, whereas children from wealthier families attend private preschools. Others, such as
Chile, are making significant efforts to close gaps in provision and uptake among different
socioeconomic groups (see Case Study 5). Many NGO ECD programmes also cater principally
to disadvantaged children. Data on numbers served or trends in NGO provision are not
available.
58 The policy on free kindergarten in Ghanaian public schools was accompanied by a rise in the pupil-trained teacher ratio to 155:1, from an already high 103:1 (UNESCO, 2008). 59 Donor spending on pre-primary education in Ghana rose from 0.7% of total education allocations in 2004 to 5% in 2006 (Akwetey, 2007). 60 A total of 64% of pre-primary enrolment in sub-Saharan Africa in 2004 was accounted for by private, NGO and religious provision (Garcia et al., 2008).
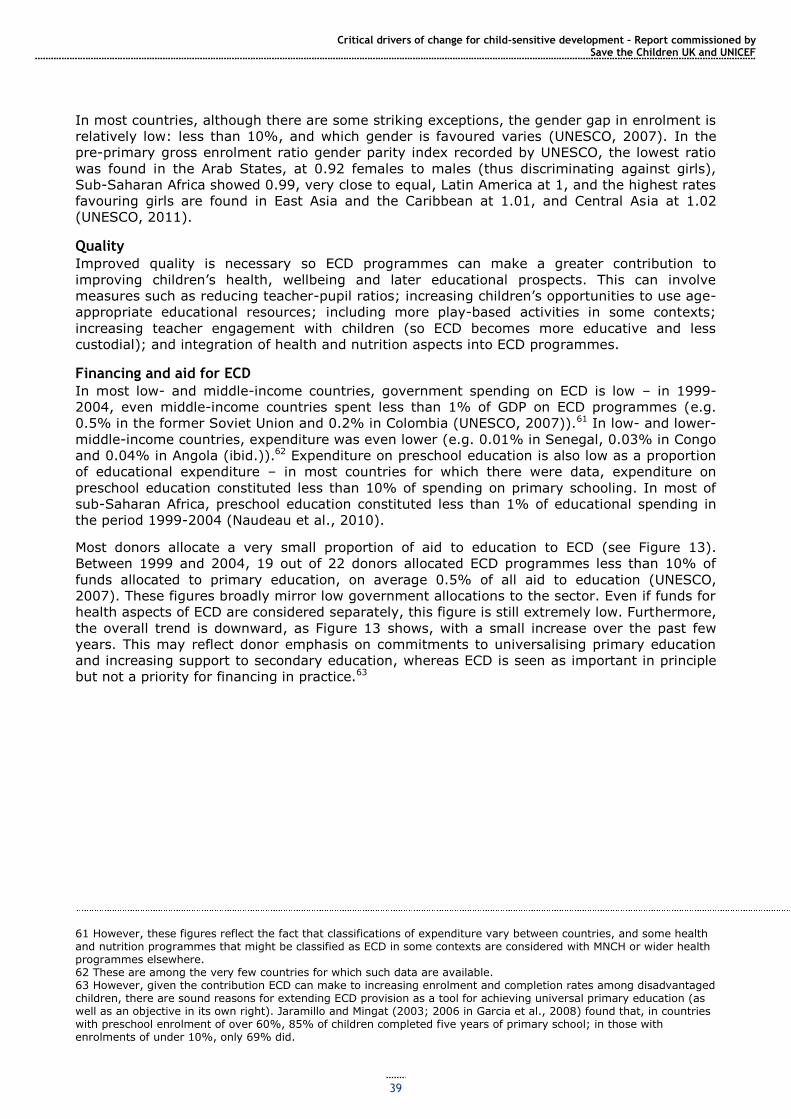
Critical drivers of change for child-sensitive development – Report commissioned by Save the Children UK and UNICEF
39
In most countries, although there are some striking exceptions, the gender gap in enrolment is
relatively low: less than 10%, and which gender is favoured varies (UNESCO, 2007). In the
pre-primary gross enrolment ratio gender parity index recorded by UNESCO, the lowest ratio
was found in the Arab States, at 0.92 females to males (thus discriminating against girls),
Sub-Saharan Africa showed 0.99, very close to equal, Latin America at 1, and the highest rates
favouring girls are found in East Asia and the Caribbean at 1.01, and Central Asia at 1.02
(UNESCO, 2011).
Quality
Improved quality is necessary so ECD programmes can make a greater contribution to
improving children‘s health, wellbeing and later educational prospects. This can involve
measures such as reducing teacher-pupil ratios; increasing children‘s opportunities to use age-
appropriate educational resources; including more play-based activities in some contexts;
increasing teacher engagement with children (so ECD becomes more educative and less
custodial); and integration of health and nutrition aspects into ECD programmes.
Financing and aid for ECD
In most low- and middle-income countries, government spending on ECD is low – in 1999-
2004, even middle-income countries spent less than 1% of GDP on ECD programmes (e.g.
0.5% in the former Soviet Union and 0.2% in Colombia (UNESCO, 2007)).61 In low- and lower-
middle-income countries, expenditure was even lower (e.g. 0.01% in Senegal, 0.03% in Congo
and 0.04% in Angola (ibid.)).62 Expenditure on preschool education is also low as a proportion
of educational expenditure – in most countries for which there were data, expenditure on
preschool education constituted less than 10% of spending on primary schooling. In most of
sub-Saharan Africa, preschool education constituted less than 1% of educational spending in
the period 1999-2004 (Naudeau et al., 2010).
Most donors allocate a very small proportion of aid to education to ECD (see Figure 13).
Between 1999 and 2004, 19 out of 22 donors allocated ECD programmes less than 10% of
funds allocated to primary education, on average 0.5% of all aid to education (UNESCO,
2007). These figures broadly mirror low government allocations to the sector. Even if funds for
health aspects of ECD are considered separately, this figure is still extremely low. Furthermore,
the overall trend is downward, as Figure 13 shows, with a small increase over the past few
years. This may reflect donor emphasis on commitments to universalising primary education
and increasing support to secondary education, whereas ECD is seen as important in principle
but not a priority for financing in practice.63
61 However, these figures reflect the fact that classifications of expenditure vary between countries, and some health and nutrition programmes that might be classified as ECD in some contexts are considered with MNCH or wider health programmes elsewhere. 62 These are among the very few countries for which such data are available. 63 However, given the contribution ECD can make to increasing enrolment and completion rates among disadvantaged children, there are sound reasons for extending ECD provision as a tool for achieving universal primary education (as well as an objective in its own right). Jaramillo and Mingat (2003; 2006 in Garcia et al., 2008) found that, in countries with preschool enrolment of over 60%, 85% of children completed five years of primary school; in those with enrolments of under 10%, only 69% did.
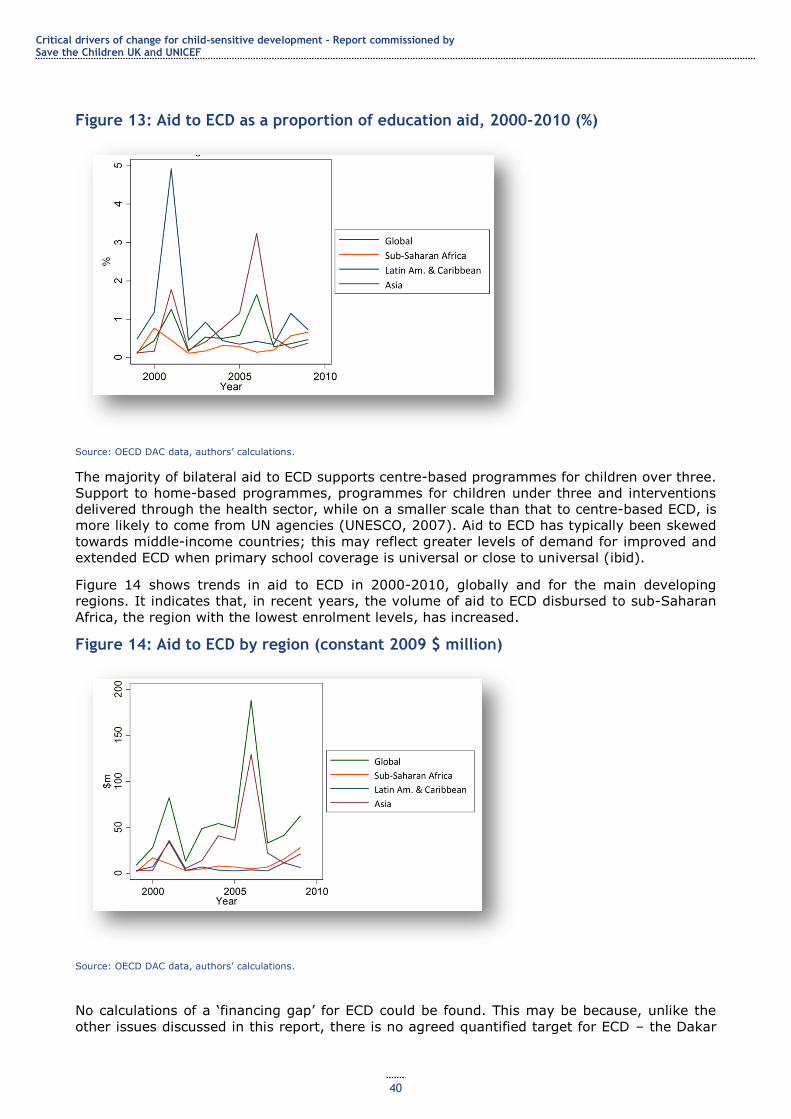
Critical drivers of change for child-sensitive development - Report commissioned by Save the Children UK and UNICEF
40
Figure 13: Aid to ECD as a proportion of education aid, 2000-2010 (%)
Source: OECD DAC data, authors‘ calculations.
The majority of bilateral aid to ECD supports centre-based programmes for children over three.
Support to home-based programmes, programmes for children under three and interventions
delivered through the health sector, while on a smaller scale than that to centre-based ECD, is
more likely to come from UN agencies (UNESCO, 2007). Aid to ECD has typically been skewed
towards middle-income countries; this may reflect greater levels of demand for improved and
extended ECD when primary school coverage is universal or close to universal (ibid).
Figure 14 shows trends in aid to ECD in 2000-2010, globally and for the main developing
regions. It indicates that, in recent years, the volume of aid to ECD disbursed to sub-Saharan
Africa, the region with the lowest enrolment levels, has increased.
Figure 14: Aid to ECD by region (constant 2009 $ million)
Source: OECD DAC data, authors‘ calculations.
No calculations of a ‗financing gap‘ for ECD could be found. This may be because, unlike the
other issues discussed in this report, there is no agreed quantified target for ECD – the Dakar
Critical drivers of change for child-sensitive development – Report commissioned by Save the Children UK and UNICEF
41
Framework on Education for All simply mandates ‗expanding and improving comprehensive
early childhood care and education, especially for the most vulnerable and disadvantaged
children‘.64
Case Study 5: Reducing inequalities – ECD programmes in Chile
Chile has a long history of pre-school education (Peralta, 2011). This was small in scale and mostly
private sector until the 1970s. There has been sustained investment in preschool education under both the Pinochet dictatorship and subsequent democratic governments, with the Bachelet government putting particular emphasis on investment in ECD. While private and NGO provision continues, 83% of ECD
provision in Chile is publicly funded. The two main agencies providing preschool education in Chile are the National Nursery Schools Council Programme (JUNJI) – part of the Ministry of Education – which runs and oversees state nurseries and kindergartens, and INTEGRA, a non-profit private agency which receives public funding and which is regulated by the state and provides 15% of places (Peralta, 2011; Umayahara, 2006). Over the 1980s, there were increasing efforts to reach the geographically
disadvantaged, such as indigenous families and families in remote rural areas (Vargas-Baron, 2009), through seasonal and mobile nursery schools. INTEGRA was set up in 1990 to fill gaps in JUNJI‘s
provision, with a particular focus on children from birth to age four living in poverty (91% of families served were in the lowest income quintiles) and home visits and parenting support for disadvantaged families. There is a particular focus on adolescent mothers, mothers who work or are looking for work, female heads of household and socially vulnerable families (Umayahara, 2006).
ECD provision in Chile is notable for its holistic focus and the provision of parent education, nutrition
services, child assessments and interventions for children with developmental delays as well as kindergartens (Vargas-Baron, 2009). It is seen as a key building block for primary education; hence, JUNJI and INTEGRA facilities were included in a six-year programme to improve the quality of education in Chile between 1990 and 1996 (Umayahara, 2006).
A third pillar of Chile‘s ECD programme has been the Know Your Child Programme (CASH), which
provides parent support, nutrition and early education in remote rural areas and since 2007 has been
folded into a new umbrella programme for young children – Chile Crece Contigo. The evolution of the ECD strategy has thus reflected a need to work on complementary areas to ensure a more comprehensive system to support the different ECD needs of children in different contexts.
In addition to these programmes which have a particular focus on poor, indigenous and geographically
remote households, there is also municipal preschool provision; private/voluntary provision which is subsidised by the state through vouchers which parents can use at establishments of their choice; and private fee-paying provision (Umayahara, 2006). Evidence suggests that NGO ECD provision in the 1980s helped to reduce child mortality and improve children‘s nutrition (Umayahara, 2006).
Chile Crece Contigo
Chile Crece Contigo is part of Chile‘s social protection system and provides integrated financial, educational and health support to children‘s development from before birth until they enter the school system at four to five years of age. It was designed in explicit recognition of the fact that children‘s development is multidimensional and links a series of initiatives, services and programmes focused on early childhood to develop a support network that responds to children‘s developmental needs at different
stages of their childhood.65 One of the main objectives of the programme is to equalise children‘s development opportunities and to erase the effects of socioeconomic inequalities by the time children finish primary school. Chile Crece Contigo was a presidential priority of President Michelle Bachelet and continues to be a priority programme under the new president.
Chile Crece Contigo’s programme offers differentiated support to different groups of children:
1. All young children are offered free pre-primary education through the programmes run by JUNJI, INTEGRA and CASH; their parents are offered parenting classes. TV and radio programmes aimed at engaging young children are part of this programme.
2. All young children in the public health system (75% of Chile‘s children) are offered antenatal care and subsequent growth monitoring and child health surveillance.
3. Children aged under two of the 60% most vulnerable households are eligible for free day nursery places (UNDP, 2008), and children of low-income non-working parents are eligible for free part-time
nursery places. Children of adolescent mothers and in single-parent families or with unemployed parents
64 www.unesco.org/education/efa/ed_for_all/dakfram_eng.shtml [accessed 1 October 2011]. 65 See www.crececontigo.gob.cl/sobre-chile-crece-contigo/que-es/.
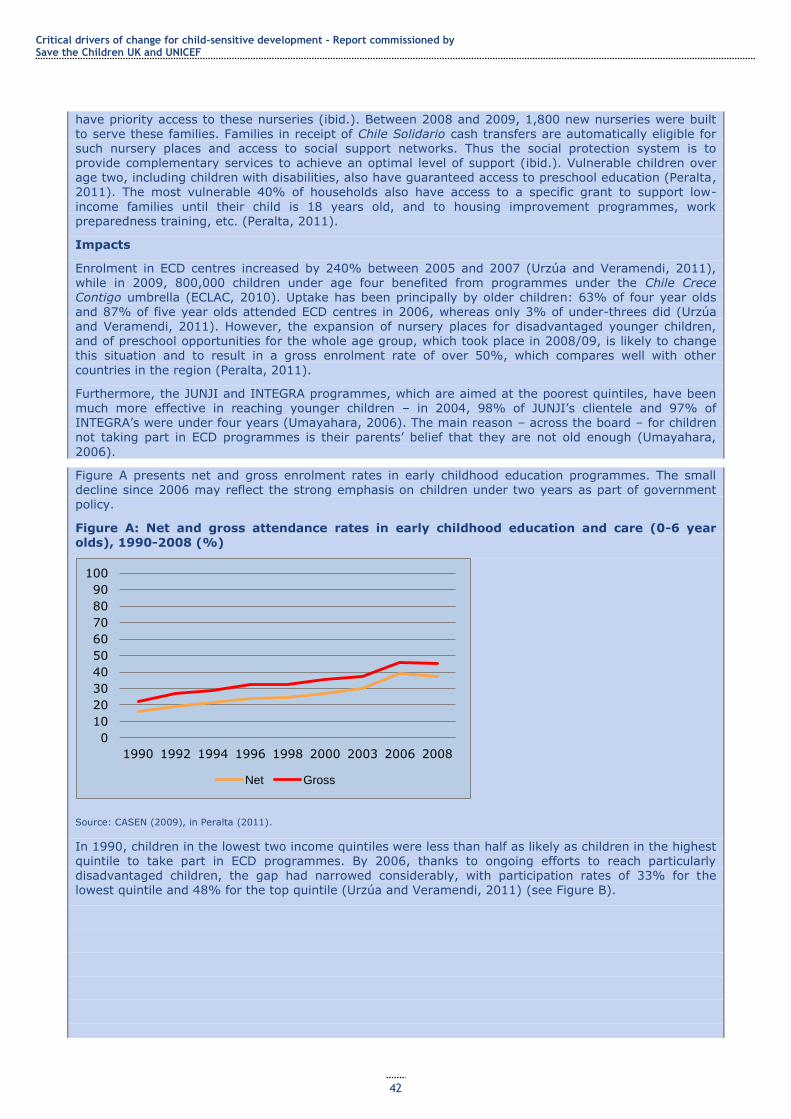
Critical drivers of change for child-sensitive development - Report commissioned by Save the Children UK and UNICEF
42
have priority access to these nurseries (ibid.). Between 2008 and 2009, 1,800 new nurseries were built to serve these families. Families in receipt of Chile Solidario cash transfers are automatically eligible for such nursery places and access to social support networks. Thus the social protection system is to provide complementary services to achieve an optimal level of support (ibid.). Vulnerable children over age two, including children with disabilities, also have guaranteed access to preschool education (Peralta, 2011). The most vulnerable 40% of households also have access to a specific grant to support low-
income families until their child is 18 years old, and to housing improvement programmes, work preparedness training, etc. (Peralta, 2011).
Impacts
Enrolment in ECD centres increased by 240% between 2005 and 2007 (Urzúa and Veramendi, 2011), while in 2009, 800,000 children under age four benefited from programmes under the Chile Crece Contigo umbrella (ECLAC, 2010). Uptake has been principally by older children: 63% of four year olds and 87% of five year olds attended ECD centres in 2006, whereas only 3% of under-threes did (Urzúa
and Veramendi, 2011). However, the expansion of nursery places for disadvantaged younger children, and of preschool opportunities for the whole age group, which took place in 2008/09, is likely to change this situation and to result in a gross enrolment rate of over 50%, which compares well with other
countries in the region (Peralta, 2011).
Furthermore, the JUNJI and INTEGRA programmes, which are aimed at the poorest quintiles, have been much more effective in reaching younger children – in 2004, 98% of JUNJI‘s clientele and 97% of INTEGRA‘s were under four years (Umayahara, 2006). The main reason – across the board – for children not taking part in ECD programmes is their parents‘ belief that they are not old enough (Umayahara,
2006).
Figure A presents net and gross enrolment rates in early childhood education programmes. The small decline since 2006 may reflect the strong emphasis on children under two years as part of government policy.
Figure A: Net and gross attendance rates in early childhood education and care (0-6 year olds), 1990-2008 (%)
Source: CASEN (2009), in Peralta (2011).
In 1990, children in the lowest two income quintiles were less than half as likely as children in the highest quintile to take part in ECD programmes. By 2006, thanks to ongoing efforts to reach particularly disadvantaged children, the gap had narrowed considerably, with participation rates of 33% for the lowest quintile and 48% for the top quintile (Urzúa and Veramendi, 2011) (see Figure B).
0
10
20
30
40
50
60
70
80
90
100
1990 1992 1994 1996 1998 2000 2003 2006 2008
Net Gross
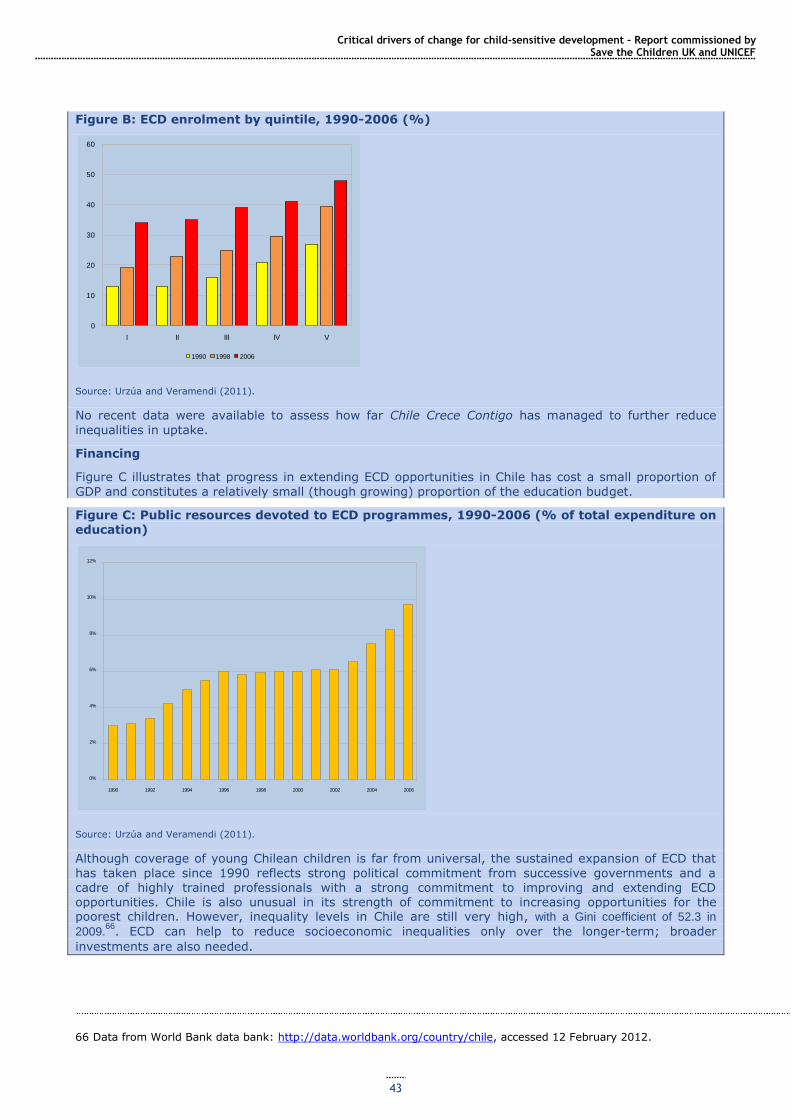
Critical drivers of change for child-sensitive development – Report commissioned by Save the Children UK and UNICEF
43
Figure B: ECD enrolment by quintile, 1990-2006 (%)
Source: Urzúa and Veramendi (2011).
No recent data were available to assess how far Chile Crece Contigo has managed to further reduce
inequalities in uptake.
Financing
Figure C illustrates that progress in extending ECD opportunities in Chile has cost a small proportion of
GDP and constitutes a relatively small (though growing) proportion of the education budget.
Figure C: Public resources devoted to ECD programmes, 1990-2006 (% of total expenditure on education)
Source: Urzúa and Veramendi (2011).
Although coverage of young Chilean children is far from universal, the sustained expansion of ECD that
has taken place since 1990 reflects strong political commitment from successive governments and a cadre of highly trained professionals with a strong commitment to improving and extending ECD opportunities. Chile is also unusual in its strength of commitment to increasing opportunities for the poorest children. However, inequality levels in Chile are still very high, with a Gini coefficient of 52.3 in
2009.66
. ECD can help to reduce socioeconomic inequalities only over the longer-term; broader
investments are also needed.
66 Data from World Bank data bank: http://data.worldbank.org/country/chile, accessed 12 February 2012.
0
10
20
30
40
50
60
I II III IV V
1990 1998 2006
0%
2%
4%
6%
8%
10%
12%
1990 1992 1994 1996 1998 2000 2002 2004 2006
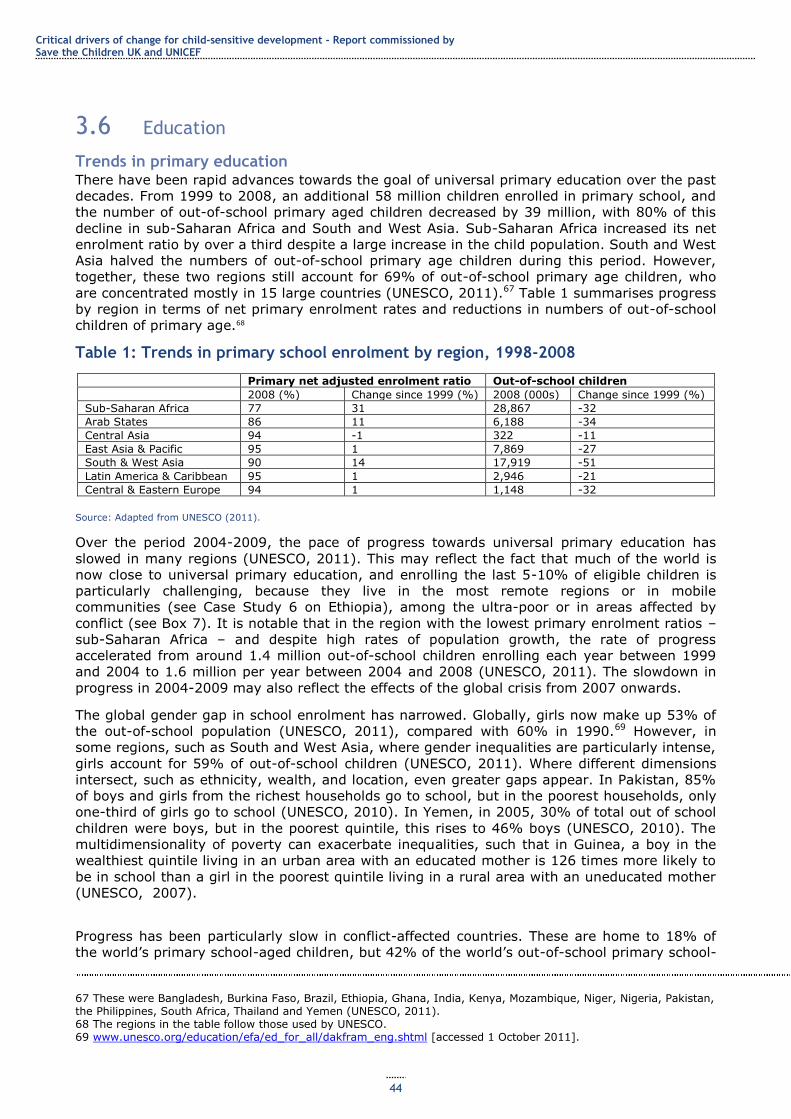
Critical drivers of change for child-sensitive development - Report commissioned by Save the Children UK and UNICEF
44
3.6 Education
Trends in primary education There have been rapid advances towards the goal of universal primary education over the past
decades. From 1999 to 2008, an additional 58 million children enrolled in primary school, and
the number of out-of-school primary aged children decreased by 39 million, with 80% of this
decline in sub-Saharan Africa and South and West Asia. Sub-Saharan Africa increased its net
enrolment ratio by over a third despite a large increase in the child population. South and West
Asia halved the numbers of out-of-school primary age children during this period. However,
together, these two regions still account for 69% of out-of-school primary age children, who
are concentrated mostly in 15 large countries (UNESCO, 2011).67 Table 1 summarises progress
by region in terms of net primary enrolment rates and reductions in numbers of out-of-school
children of primary age.68
Table 1: Trends in primary school enrolment by region, 1998-2008
Primary net adjusted enrolment ratio Out-of-school children
2008 (%) Change since 1999 (%) 2008 (000s) Change since 1999 (%)
Sub-Saharan Africa 77 31 28,867 -32
Arab States 86 11 6,188 -34
Central Asia 94 -1 322 -11
East Asia & Pacific 95 1 7,869 -27
South & West Asia 90 14 17,919 -51
Latin America & Caribbean 95 1 2,946 -21
Central & Eastern Europe 94 1 1,148 -32
Source: Adapted from UNESCO (2011).
Over the period 2004-2009, the pace of progress towards universal primary education has
slowed in many regions (UNESCO, 2011). This may reflect the fact that much of the world is
now close to universal primary education, and enrolling the last 5-10% of eligible children is
particularly challenging, because they live in the most remote regions or in mobile
communities (see Case Study 6 on Ethiopia), among the ultra-poor or in areas affected by
conflict (see Box 7). It is notable that in the region with the lowest primary enrolment ratios –
sub-Saharan Africa – and despite high rates of population growth, the rate of progress
accelerated from around 1.4 million out-of-school children enrolling each year between 1999
and 2004 to 1.6 million per year between 2004 and 2008 (UNESCO, 2011). The slowdown in
progress in 2004-2009 may also reflect the effects of the global crisis from 2007 onwards.
The global gender gap in school enrolment has narrowed. Globally, girls now make up 53% of
the out-of-school population (UNESCO, 2011), compared with 60% in 1990.69 However, in
some regions, such as South and West Asia, where gender inequalities are particularly intense,
girls account for 59% of out-of-school children (UNESCO, 2011). Where different dimensions
intersect, such as ethnicity, wealth, and location, even greater gaps appear. In Pakistan, 85%
of boys and girls from the richest households go to school, but in the poorest households, only
one-third of girls go to school (UNESCO, 2010). In Yemen, in 2005, 30% of total out of school
children were boys, but in the poorest quintile, this rises to 46% boys (UNESCO, 2010). The
multidimensionality of poverty can exacerbate inequalities, such that in Guinea, a boy in the
wealthiest quintile living in an urban area with an educated mother is 126 times more likely to
be in school than a girl in the poorest quintile living in a rural area with an uneducated mother
(UNESCO, 2007).
Progress has been particularly slow in conflict-affected countries. These are home to 18% of
the world‘s primary school-aged children, but 42% of the world‘s out-of-school primary school-
67 These were Bangladesh, Burkina Faso, Brazil, Ethiopia, Ghana, India, Kenya, Mozambique, Niger, Nigeria, Pakistan, the Philippines, South Africa, Thailand and Yemen (UNESCO, 2011). 68 The regions in the table follow those used by UNESCO. 69 www.unesco.org/education/efa/ed_for_all/dakfram_eng.shtml [accessed 1 October 2011].
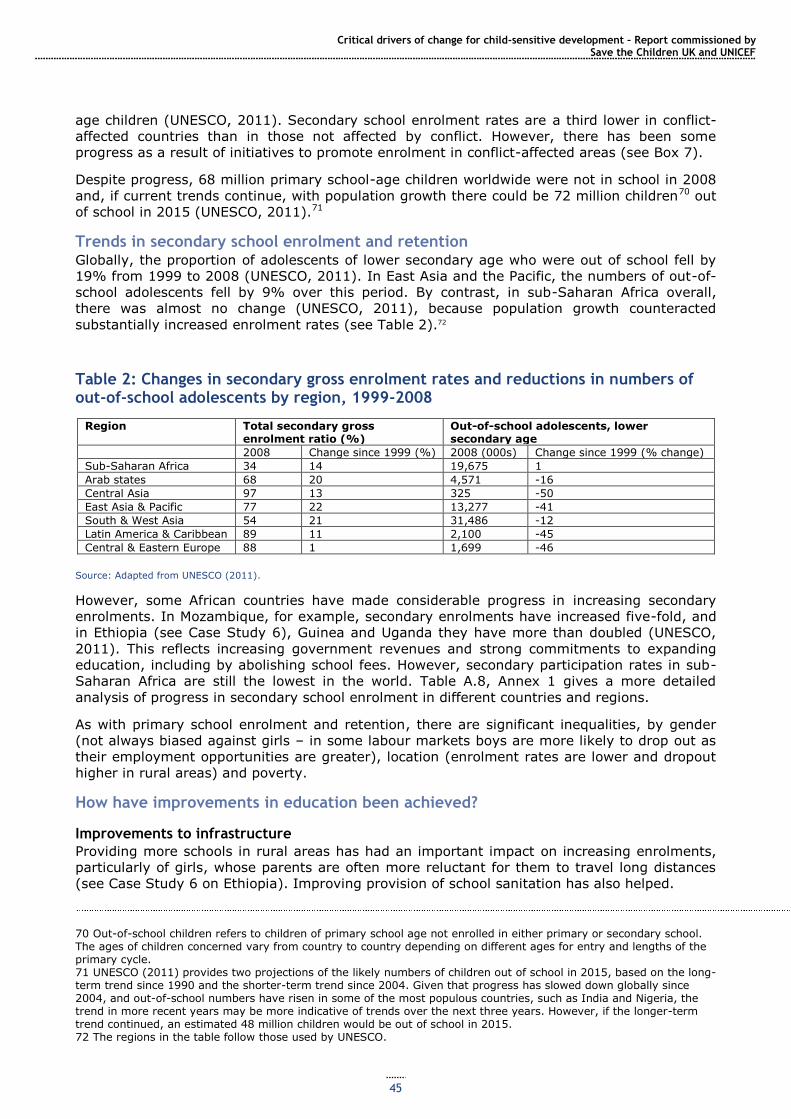
Critical drivers of change for child-sensitive development – Report commissioned by Save the Children UK and UNICEF
45
age children (UNESCO, 2011). Secondary school enrolment rates are a third lower in conflict-
affected countries than in those not affected by conflict. However, there has been some
progress as a result of initiatives to promote enrolment in conflict-affected areas (see Box 7).
Despite progress, 68 million primary school-age children worldwide were not in school in 2008
and, if current trends continue, with population growth there could be 72 million children70 out
of school in 2015 (UNESCO, 2011).71
Trends in secondary school enrolment and retention Globally, the proportion of adolescents of lower secondary age who were out of school fell by
19% from 1999 to 2008 (UNESCO, 2011). In East Asia and the Pacific, the numbers of out-of-
school adolescents fell by 9% over this period. By contrast, in sub-Saharan Africa overall,
there was almost no change (UNESCO, 2011), because population growth counteracted
substantially increased enrolment rates (see Table 2).72
Table 2: Changes in secondary gross enrolment rates and reductions in numbers of out-of-school adolescents by region, 1999-2008
Region Total secondary gross enrolment ratio (%)
Out-of-school adolescents, lower secondary age
2008 Change since 1999 (%) 2008 (000s) Change since 1999 (% change)
Sub-Saharan Africa 34 14 19,675 1
Arab states 68 20 4,571 -16
Central Asia 97 13 325 -50
East Asia & Pacific 77 22 13,277 -41
South & West Asia 54 21 31,486 -12
Latin America & Caribbean 89 11 2,100 -45
Central & Eastern Europe 88 1 1,699 -46
Source: Adapted from UNESCO (2011).
However, some African countries have made considerable progress in increasing secondary
enrolments. In Mozambique, for example, secondary enrolments have increased five-fold, and
in Ethiopia (see Case Study 6), Guinea and Uganda they have more than doubled (UNESCO,
2011). This reflects increasing government revenues and strong commitments to expanding
education, including by abolishing school fees. However, secondary participation rates in sub-
Saharan Africa are still the lowest in the world. Table A.8, Annex 1 gives a more detailed
analysis of progress in secondary school enrolment in different countries and regions.
As with primary school enrolment and retention, there are significant inequalities, by gender
(not always biased against girls – in some labour markets boys are more likely to drop out as
their employment opportunities are greater), location (enrolment rates are lower and dropout
higher in rural areas) and poverty.
How have improvements in education been achieved?
Improvements to infrastructure
Providing more schools in rural areas has had an important impact on increasing enrolments,
particularly of girls, whose parents are often more reluctant for them to travel long distances
(see Case Study 6 on Ethiopia). Improving provision of school sanitation has also helped.
70 Out-of-school children refers to children of primary school age not enrolled in either primary or secondary school. The ages of children concerned vary from country to country depending on different ages for entry and lengths of the primary cycle. 71 UNESCO (2011) provides two projections of the likely numbers of children out of school in 2015, based on the long-term trend since 1990 and the shorter-term trend since 2004. Given that progress has slowed down globally since 2004, and out-of-school numbers have risen in some of the most populous countries, such as India and Nigeria, the trend in more recent years may be more indicative of trends over the next three years. However, if the longer-term trend continued, an estimated 48 million children would be out of school in 2015. 72 The regions in the table follow those used by UNESCO.
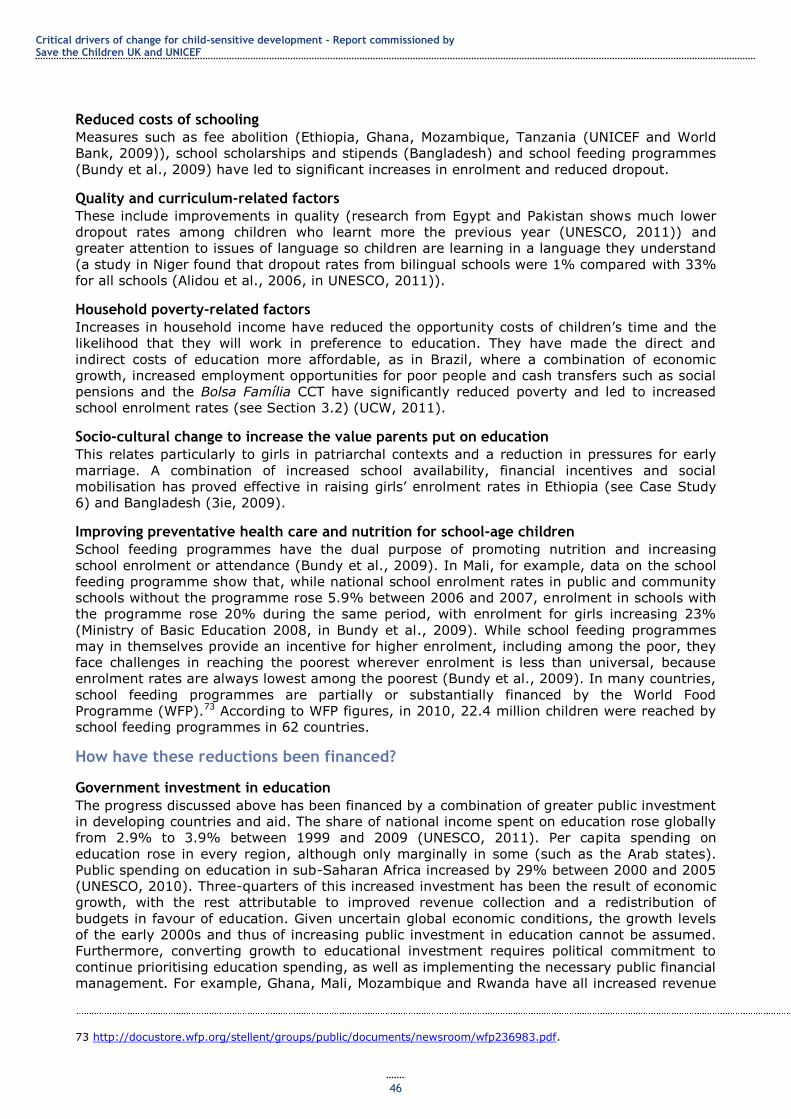
Critical drivers of change for child-sensitive development - Report commissioned by Save the Children UK and UNICEF
46
Reduced costs of schooling
Measures such as fee abolition (Ethiopia, Ghana, Mozambique, Tanzania (UNICEF and World
Bank, 2009)), school scholarships and stipends (Bangladesh) and school feeding programmes
(Bundy et al., 2009) have led to significant increases in enrolment and reduced dropout.
Quality and curriculum-related factors
These include improvements in quality (research from Egypt and Pakistan shows much lower
dropout rates among children who learnt more the previous year (UNESCO, 2011)) and
greater attention to issues of language so children are learning in a language they understand
(a study in Niger found that dropout rates from bilingual schools were 1% compared with 33%
for all schools (Alidou et al., 2006, in UNESCO, 2011)).
Household poverty-related factors
Increases in household income have reduced the opportunity costs of children‘s time and the
likelihood that they will work in preference to education. They have made the direct and
indirect costs of education more affordable, as in Brazil, where a combination of economic
growth, increased employment opportunities for poor people and cash transfers such as social
pensions and the Bolsa Família CCT have significantly reduced poverty and led to increased
school enrolment rates (see Section 3.2) (UCW, 2011).
Socio-cultural change to increase the value parents put on education
This relates particularly to girls in patriarchal contexts and a reduction in pressures for early
marriage. A combination of increased school availability, financial incentives and social
mobilisation has proved effective in raising girls‘ enrolment rates in Ethiopia (see Case Study
6) and Bangladesh (3ie, 2009).
Improving preventative health care and nutrition for school-age children
School feeding programmes have the dual purpose of promoting nutrition and increasing
school enrolment or attendance (Bundy et al., 2009). In Mali, for example, data on the school
feeding programme show that, while national school enrolment rates in public and community
schools without the programme rose 5.9% between 2006 and 2007, enrolment in schools with
the programme rose 20% during the same period, with enrolment for girls increasing 23%
(Ministry of Basic Education 2008, in Bundy et al., 2009). While school feeding programmes
may in themselves provide an incentive for higher enrolment, including among the poor, they
face challenges in reaching the poorest wherever enrolment is less than universal, because
enrolment rates are always lowest among the poorest (Bundy et al., 2009). In many countries,
school feeding programmes are partially or substantially financed by the World Food
Programme (WFP).73 According to WFP figures, in 2010, 22.4 million children were reached by
school feeding programmes in 62 countries.
How have these reductions been financed?
Government investment in education
The progress discussed above has been financed by a combination of greater public investment
in developing countries and aid. The share of national income spent on education rose globally
from 2.9% to 3.9% between 1999 and 2009 (UNESCO, 2011). Per capita spending on
education rose in every region, although only marginally in some (such as the Arab states).
Public spending on education in sub-Saharan Africa increased by 29% between 2000 and 2005
(UNESCO, 2010). Three-quarters of this increased investment has been the result of economic
growth, with the rest attributable to improved revenue collection and a redistribution of
budgets in favour of education. Given uncertain global economic conditions, the growth levels
of the early 2000s and thus of increasing public investment in education cannot be assumed.
Furthermore, converting growth to educational investment requires political commitment to
continue prioritising education spending, as well as implementing the necessary public financial
management. For example, Ghana, Mali, Mozambique and Rwanda have all increased revenue
73 http://docustore.wfp.org/stellent/groups/public/documents/newsroom/wfp236983.pdf.
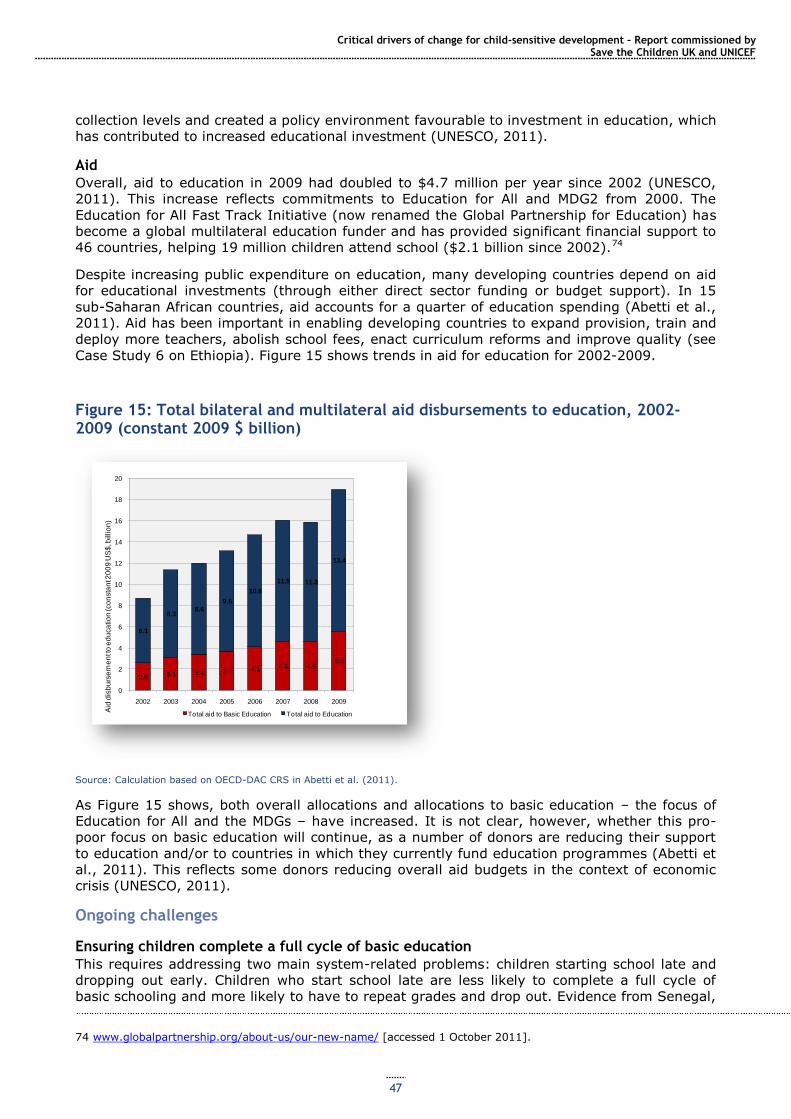
Critical drivers of change for child-sensitive development – Report commissioned by Save the Children UK and UNICEF
47
collection levels and created a policy environment favourable to investment in education, which
has contributed to increased educational investment (UNESCO, 2011).
Aid
Overall, aid to education in 2009 had doubled to $4.7 million per year since 2002 (UNESCO,
2011). This increase reflects commitments to Education for All and MDG2 from 2000. The
Education for All Fast Track Initiative (now renamed the Global Partnership for Education) has
become a global multilateral education funder and has provided significant financial support to
46 countries, helping 19 million children attend school ($2.1 billion since 2002).74
Despite increasing public expenditure on education, many developing countries depend on aid
for educational investments (through either direct sector funding or budget support). In 15
sub-Saharan African countries, aid accounts for a quarter of education spending (Abetti et al.,
2011). Aid has been important in enabling developing countries to expand provision, train and
deploy more teachers, abolish school fees, enact curriculum reforms and improve quality (see
Case Study 6 on Ethiopia). Figure 15 shows trends in aid for education for 2002-2009.
Figure 15: Total bilateral and multilateral aid disbursements to education, 2002-2009 (constant 2009 $ billion)
Source: Calculation based on OECD-DAC CRS in Abetti et al. (2011).
As Figure 15 shows, both overall allocations and allocations to basic education – the focus of
Education for All and the MDGs – have increased. It is not clear, however, whether this pro-
poor focus on basic education will continue, as a number of donors are reducing their support
to education and/or to countries in which they currently fund education programmes (Abetti et
al., 2011). This reflects some donors reducing overall aid budgets in the context of economic
crisis (UNESCO, 2011).
Ongoing challenges
Ensuring children complete a full cycle of basic education
This requires addressing two main system-related problems: children starting school late and
dropping out early. Children who start school late are less likely to complete a full cycle of
basic schooling and more likely to have to repeat grades and drop out. Evidence from Senegal,
74 www.globalpartnership.org/about-us/our-new-name/ [accessed 1 October 2011].
2.6 3.1 3.4 3.7 4.1 4.6 4.65.6
6.1
8.38.6
9.5
10.6
11.5 11.3
13.4
0
2
4
6
8
10
12
14
16
18
20
2002 2003 2004 2005 2006 2007 2008 2009
Aid
dis
bu
rse
me
nt t
o e
du
ca
tio
n (co
nsta
nt 2
00
9 U
S$
, billio
n)
Total aid to Basic Education Total aid to Education
Critical drivers of change for child-sensitive development - Report commissioned by Save the Children UK and UNICEF
48
for example, suggests that children who start up to two years late are 10% less likely to
complete five years of schooling (UNESCO, 2011). In 2007, only 56% of children in sub-
Saharan Africa started primary school on time (ibid). However, some countries have made
major progress in this area. In Tanzania, for example, the share of children starting school at
the official age increased from 14% in 1997 to 87% in 2007. The main factors behind this
enormous increase were fee abolition, more stringent enforcement of age regulations and the
development of alternative provision for ‗overage‘ children (UNESCO, 2011) (see Box 6).
Box 6: Reducing primary school dropout in Tanzania
After primary school fees were abolished, the Tanzanian government in 2001 put a ceiling of seven years as the maximum age to start primary school, recognising that a surge of overage children could undermine school retention. It also developed the Complementary Basic Education in Tanzania project,
which provides informal education to overage children, allowing them to re-enter the formal education
system in Grade 5. By 2006, 8% of the primary school-age population had enrolled in these centres. Teachers in the early grades were given additional training to reduce dropout related to poor learning outcomes. Finally, the Grade 4 examination was reformed to be used as a diagnostic tool for identifying areas where students needed further support, rather than as a barrier to progression into later primary grades. As a result of these measures, the number of out-of-school children in Tanzania fell from 3.2 million in 1999 to 33,000 in 2008. From 2001 to 2006, the dropout rate fell from 26% to 17%.
Source: UNESCO (2011).
Overall, only 70% of children who enrol in school in sub-Saharan Africa and South and West
Asia complete the final primary grade, and 10 million primary school-age children drop out of
school in sub-Saharan Africa every year (UNESCO, 2011). Half of all out-of-school children in
South and West Asia drop out (ibid.). Data constraints make global conclusions about progress
in this area difficult. However, of 50 low- and middle-income countries for which there are
data, survival rates until the last year of primary school have increased in half (26/50),
remained stable in just under a third (15/50) and decreased in approximately a fifth (9/50).
Addressing financial, cultural and infrastructure barriers
Despite the progress made in abolishing school fees and charges and/or poverty reduction that
has made schooling costs more affordable, poverty remains a significant barrier, to both entry
and school completion. In Afghanistan, 70% of out-of-school primary children were not in
school because they needed to work (Save the Children, 2010c). In Burkina Faso, completion
rates for the richest 20% of the population are 10 times higher than for the poorest 20%
(UNESCO, 2011). Lack of schools or long journeys to school continue to deter children,
particularly girls and their families, who are concerned about security, as does lack of toilets.
Additional funding to address these barriers is crucial.
Corporal punishment and sexual abuse at school are other major causes of dropout (Plan
International, 2008; UNESCO, 2011). This, and discriminatory treatment of minority children,
can be addressed through teacher sensitisation; the general undervaluing of girls‘ education
may be addressed by gender-specific stipends and sensitisation of parents and communities.
Addressing quality problems
Poor-quality education wastes children‘s time and families‘ resources; it also increases the
chance that children will drop out of school (UNESCO, 2011). Despite progress, the quality of
education remains low in most developing countries, particularly in rural areas and in schools
serving poor communities (ibid).
Solutions include increasing the number of teachers – 1.9 million additional teachers are
needed to universalise primary education (UNESCO, 2011), reducing pupil-teacher ratios and
reducing teacher absenteeism. Major training programmes to improve teacher knowledge and
instruction quality are also vital, as is extending teaching in languages children understand and
the provision of textbooks and other educational equipment. The relatively unacknowledged
but widespread physical and sexual violence against children perpetrated by both teachers and
other school staff and students in schools must also be addressed (Plan International, 2010).
Critical drivers of change for child-sensitive development – Report commissioned by Save the Children UK and UNICEF
49
Special challenges in conflict-affected countries
The 30 low-income and lower middle-income countries that experienced armed conflict during
1999-2008 are home to 116 million children (UNESCO, 2011). Among poorer developing
countries, they account for around a quarter of the primary school-age population but nearly
half of the out-of-school population. Further, survival to the last grade of primary in poorer
conflict-affected countries is 65% compared with 86% in other poor countries. Gross
enrolment ratios in secondary school are nearly 30% lower in conflict-affected countries than
in countries not affected by conflict (ibid.).
Development assistance has a vital role to play in conflict-affected countries. It has the
potential to maintain basic services during episodes of violence and support strategies for post-
conflict reconstruction. More effective aid to education in conflict-affected countries is crucial
for more rapid progress to meet the Education for All goals, such as universal primary
education, and to achieve children‘s rights to education. Humanitarian aid can help to maintain
education during emergencies, and long-term development assistance can support the efforts
of post-conflict governments to reconstruct education. More continuity between different types
of funding stream is vital.
Although levels of aid to countries in armed conflict have increased markedly in recent years,
aggregate aid data hide a highly skewed pattern of distribution across countries (UNESCO,
2011). Most ODA to conflict-affected states goes to Iraq which, together with Afghanistan,
accounted for 38% of the aid received by the 27 low-income and lower-middle-income
countries affected by conflict. Recently, the 16 poorest conflict-affected countries have seen
their share of overall aid rise. Aid to education in these countries has increased faster than
overall aid and faster than the increase in global aid to education. Still, given the large number
of out-of-school children, low levels of literacy and costs associated with classroom
construction and teacher recruitment, low-income conflict-affected countries face far higher
costs than other low-income countries. On average, their estimated per pupil financing gap is
around $69, compared with $55 for all low-income countries. Yet low-income conflict-affected
countries receive $16 per pupil in aid to basic education, compared with the $22 average for
other low-income countries, with large variations around the global average (ibid.).
In the recent past, the international community has made important commitments to
supporting education for children affected by conflict. Organisations such as Save the Children
and UNICEF have advocated for prioritising education for these children as part of development
and humanitarian policies included in peace agreements. Following a UN General Assembly
debate on education in emergency and post-crisis situations in 2009, the G8 promised to pay
special attention to conflict-affected countries in order to reach the Education for All goal.
Efforts by governments, donors and UN agencies have led to increased accessibility and quality
of education (Save the Children, 2010c), although continued efforts are needed.
Box 7: Education and conflict in Afghanistan
Afghanistan has experienced conflict since the 1970s. Education opportunities, particularly for girls, have historically been limited and restricted by conflict. In 1970, 14% of Afghan students were girls, and the numbers of girls enrolled in school increased steadily until the Mujahideen government policies of the 1990s, which limited girls‘ participation in education. In 1995, the Taliban began closing all girls‘ schools
such that, by 2001, girls‘ enrolment in many provinces was almost zero (Samady, 2001). Since the overthrow of the Taliban there has been huge progress in the expansion of the education system, with primary enrolment increasing from 770,000 in 2001 to over 6 million in 200775, with girls‘ enrolment reaching 42% compared with 60% for boys. In 2009, the ratio of female to male primary enrolment was 67% (up from 42% in 2002), meaning that around a third of primary school children are girls.76
The damage to the education system caused by the conflict has slowed progress. Only 25% of schools in the country are categorised as having useable buildings, so that around half of schooling occurs in tents or open spaces, and the long distances between homes and schools is a key barrier to enrolment,
75 Data from Ministry of Education enrolment statistics, as reported in Save the Children (2009). 76 World Development Indicator data, and data from Government of Afghanistan Central Statistics Organization (2008) as reported in Save the Children (2010d).
Critical drivers of change for child-sensitive development - Report commissioned by Save the Children UK and UNICEF
50
especially for girls. Other barriers include parents‘ unwillingness to allow their daughters to be taught in mixed schools and to be taught by male teachers beyond a certain age (around 11 years old) (HRRAC, 2007). Nationally, only 28% of teachers are female, with stark regional variations: while 64% of teachers in Kabul are female, this figure is less than 1% in Uruzgan (Islamic Republic of Afghanistan Ministry of Education, 2007). A study in Baghlan province demonstrated that, in schools where female teachers are available, girls‘ enrolment is much higher: 15% of girls complete Grade 6 in schools with female
teachers, but only 4% do so in schools without female teachers (Jones, 2008, in Save the Children, 2010d). Schools are often victims of threats and attacks by extremists who oppose girls‘ education.
Example: supporting girls’ education through community-based education in Afghanistan
In 2006, Save the Children launched the Better Education Better Future campaign in Afghanistan. One of its components – community-based education – has focused particularly on increasing girls‘ and boys‘ access in remote areas. Community-based classes are usually held in local homes or mosques and taught by a mentor selected from the local community. Some follow the normal school curriculum and school
year and others deliver an accelerated curriculum covering two years‘ content in one year (accelerated learning classes (ALCs)). Between 2008 and 2010, Save the Children worked with local partners in Kabul and five provinces – Balkh, Jawzjan, Sar-i-pul, Kandahar and Uruzgan – to set up 455 ALCs (Save the
Children, 2009).
These classes do not specifically target girls, but are more appealing to girls and their families than formal schools because they have confidence in the small community-based structure and they avoid long journeys to schools. Save the Children supports these classes through training of mentors, providing carpets and textbooks for the teachers and learners and paying the mentors‘ salaries. The mentors are
also provided with ongoing support visits from Save the Children staff and their partners (Save the Children, 2010d). Save the Children also works with the community to establish community education councils or parents‘ councils. These are responsible for finding a learning space, appointing a teacher (or mentor) from the local community and identifying the students.
A mid-term evaluation of this strategy (Save the Children, 2010d) found that there was a much higher
proportion of female teachers in community-based schools than in formal schools, partly because there
are fewer cultural barriers to women working in community-based classes, as these are often held in homes or mosques and are less public than schools. The ALCs visited during the mid-term evaluation were found to be providing education to a level at least as good as school education. As such, they could be used more widely to provide access to education for difficult-to-reach groups.
This example provides an interesting model of how an NGO, working closely with government authorities and local communities, with financial support from donors, is able to contribute significantly to transforming the educational situation of children in a conflict-affected country, enabling greater equity in access.
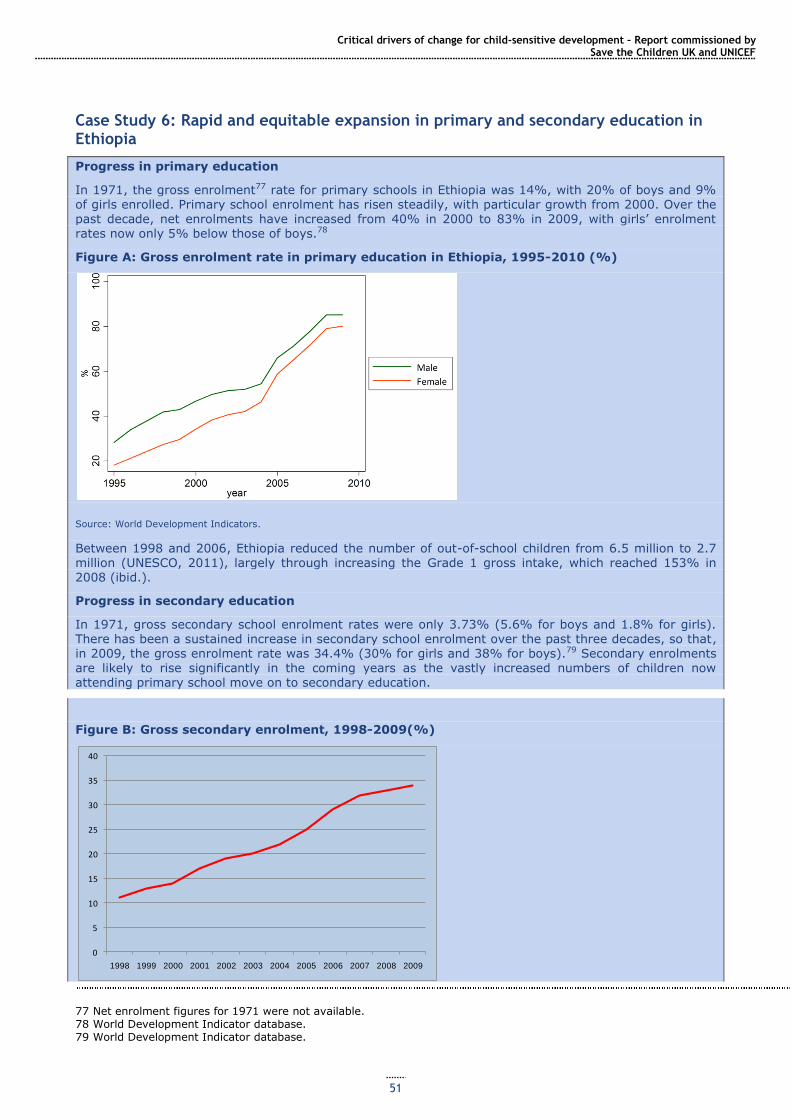
Critical drivers of change for child-sensitive development – Report commissioned by Save the Children UK and UNICEF
51
Case Study 6: Rapid and equitable expansion in primary and secondary education in Ethiopia
Progress in primary education
In 1971, the gross enrolment77 rate for primary schools in Ethiopia was 14%, with 20% of boys and 9% of girls enrolled. Primary school enrolment has risen steadily, with particular growth from 2000. Over the past decade, net enrolments have increased from 40% in 2000 to 83% in 2009, with girls‘ enrolment rates now only 5% below those of boys.78
Figure A: Gross enrolment rate in primary education in Ethiopia, 1995-2010 (%)
Source: World Development Indicators.
Between 1998 and 2006, Ethiopia reduced the number of out-of-school children from 6.5 million to 2.7 million (UNESCO, 2011), largely through increasing the Grade 1 gross intake, which reached 153% in 2008 (ibid.).
Progress in secondary education
In 1971, gross secondary school enrolment rates were only 3.73% (5.6% for boys and 1.8% for girls). There has been a sustained increase in secondary school enrolment over the past three decades, so that, in 2009, the gross enrolment rate was 34.4% (30% for girls and 38% for boys).79 Secondary enrolments are likely to rise significantly in the coming years as the vastly increased numbers of children now attending primary school move on to secondary education.
Figure B: Gross secondary enrolment, 1998-2009(%)
77 Net enrolment figures for 1971 were not available. 78 World Development Indicator database. 79 World Development Indicator database.
0
5
10
15
20
25
30
35
40
1998 1999 2000 2001 2002 2003 2004 2005 2006 2007 2008 2009
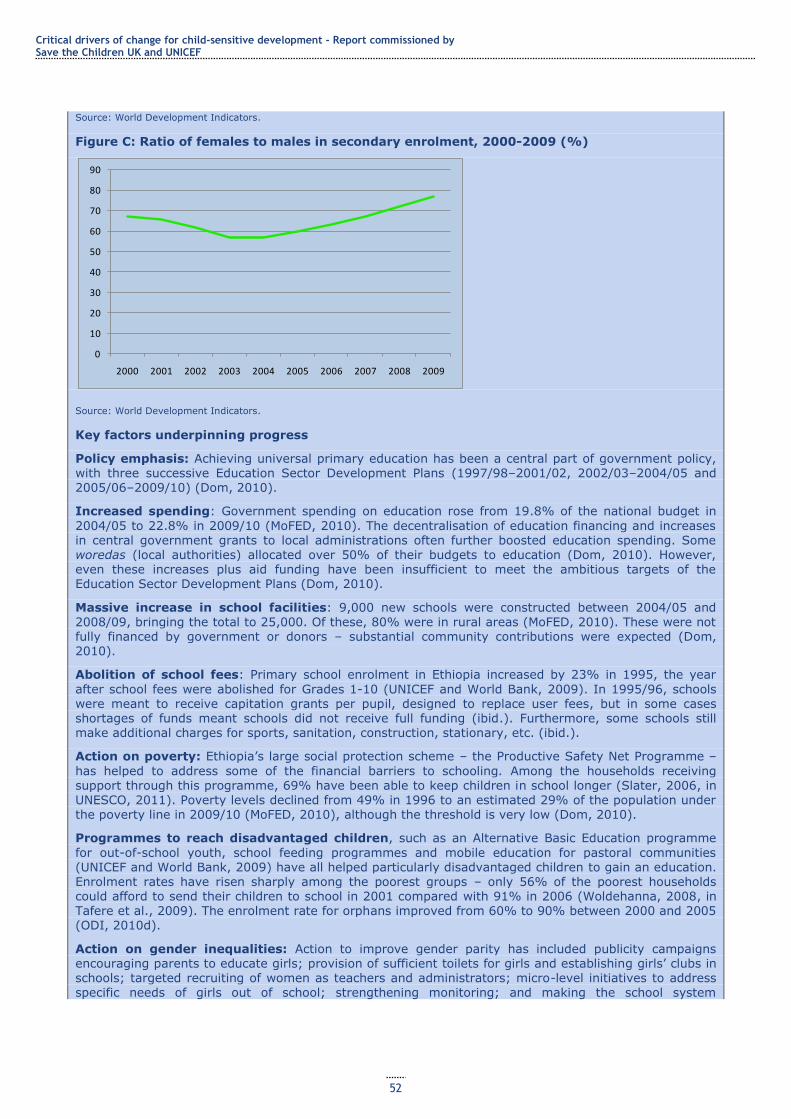
Critical drivers of change for child-sensitive development - Report commissioned by Save the Children UK and UNICEF
52
Source: World Development Indicators.
Figure C: Ratio of females to males in secondary enrolment, 2000-2009 (%)
Source: World Development Indicators.
Key factors underpinning progress
Policy emphasis: Achieving universal primary education has been a central part of government policy, with three successive Education Sector Development Plans (1997/98–2001/02, 2002/03–2004/05 and 2005/06–2009/10) (Dom, 2010).
Increased spending: Government spending on education rose from 19.8% of the national budget in
2004/05 to 22.8% in 2009/10 (MoFED, 2010). The decentralisation of education financing and increases in central government grants to local administrations often further boosted education spending. Some
woredas (local authorities) allocated over 50% of their budgets to education (Dom, 2010). However, even these increases plus aid funding have been insufficient to meet the ambitious targets of the Education Sector Development Plans (Dom, 2010).
Massive increase in school facilities: 9,000 new schools were constructed between 2004/05 and 2008/09, bringing the total to 25,000. Of these, 80% were in rural areas (MoFED, 2010). These were not fully financed by government or donors – substantial community contributions were expected (Dom, 2010).
Abolition of school fees: Primary school enrolment in Ethiopia increased by 23% in 1995, the year
after school fees were abolished for Grades 1-10 (UNICEF and World Bank, 2009). In 1995/96, schools were meant to receive capitation grants per pupil, designed to replace user fees, but in some cases shortages of funds meant schools did not receive full funding (ibid.). Furthermore, some schools still make additional charges for sports, sanitation, construction, stationary, etc. (ibid.).
Action on poverty: Ethiopia‘s large social protection scheme – the Productive Safety Net Programme –
has helped to address some of the financial barriers to schooling. Among the households receiving support through this programme, 69% have been able to keep children in school longer (Slater, 2006, in UNESCO, 2011). Poverty levels declined from 49% in 1996 to an estimated 29% of the population under the poverty line in 2009/10 (MoFED, 2010), although the threshold is very low (Dom, 2010).
Programmes to reach disadvantaged children, such as an Alternative Basic Education programme
for out-of-school youth, school feeding programmes and mobile education for pastoral communities (UNICEF and World Bank, 2009) have all helped particularly disadvantaged children to gain an education. Enrolment rates have risen sharply among the poorest groups – only 56% of the poorest households could afford to send their children to school in 2001 compared with 91% in 2006 (Woldehanna, 2008, in Tafere et al., 2009). The enrolment rate for orphans improved from 60% to 90% between 2000 and 2005 (ODI, 2010d).
Action on gender inequalities: Action to improve gender parity has included publicity campaigns encouraging parents to educate girls; provision of sufficient toilets for girls and establishing girls‘ clubs in schools; targeted recruiting of women as teachers and administrators; micro-level initiatives to address
specific needs of girls out of school; strengthening monitoring; and making the school system
0
10
20
30
40
50
60
70
80
90
2000 2001 2002 2003 2004 2005 2006 2007 2008 2009
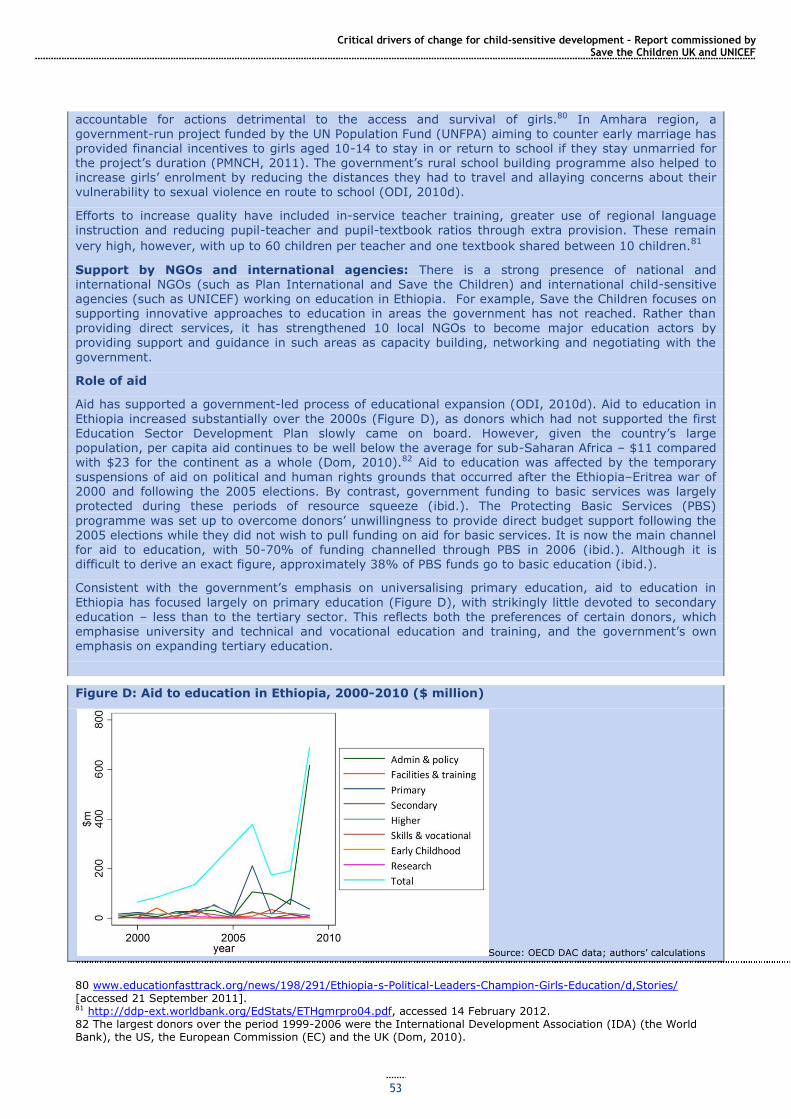
Critical drivers of change for child-sensitive development – Report commissioned by Save the Children UK and UNICEF
53
accountable for actions detrimental to the access and survival of girls.80 In Amhara region, a government-run project funded by the UN Population Fund (UNFPA) aiming to counter early marriage has provided financial incentives to girls aged 10-14 to stay in or return to school if they stay unmarried for the project‘s duration (PMNCH, 2011). The government‘s rural school building programme also helped to increase girls‘ enrolment by reducing the distances they had to travel and allaying concerns about their vulnerability to sexual violence en route to school (ODI, 2010d).
Efforts to increase quality have included in-service teacher training, greater use of regional language instruction and reducing pupil-teacher and pupil-textbook ratios through extra provision. These remain
very high, however, with up to 60 children per teacher and one textbook shared between 10 children.81
Support by NGOs and international agencies: There is a strong presence of national and international NGOs (such as Plan International and Save the Children) and international child-sensitive agencies (such as UNICEF) working on education in Ethiopia. For example, Save the Children focuses on supporting innovative approaches to education in areas the government has not reached. Rather than
providing direct services, it has strengthened 10 local NGOs to become major education actors by providing support and guidance in such areas as capacity building, networking and negotiating with the
government.
Role of aid
Aid has supported a government-led process of educational expansion (ODI, 2010d). Aid to education in
Ethiopia increased substantially over the 2000s (Figure D), as donors which had not supported the first Education Sector Development Plan slowly came on board. However, given the country‘s large population, per capita aid continues to be well below the average for sub-Saharan Africa – $11 compared with $23 for the continent as a whole (Dom, 2010).82 Aid to education was affected by the temporary suspensions of aid on political and human rights grounds that occurred after the Ethiopia–Eritrea war of 2000 and following the 2005 elections. By contrast, government funding to basic services was largely protected during these periods of resource squeeze (ibid.). The Protecting Basic Services (PBS)
programme was set up to overcome donors‘ unwillingness to provide direct budget support following the 2005 elections while they did not wish to pull funding on aid for basic services. It is now the main channel
for aid to education, with 50-70% of funding channelled through PBS in 2006 (ibid.). Although it is difficult to derive an exact figure, approximately 38% of PBS funds go to basic education (ibid.).
Consistent with the government‘s emphasis on universalising primary education, aid to education in
Ethiopia has focused largely on primary education (Figure D), with strikingly little devoted to secondary education – less than to the tertiary sector. This reflects both the preferences of certain donors, which emphasise university and technical and vocational education and training, and the government‘s own emphasis on expanding tertiary education.
Figure D: Aid to education in Ethiopia, 2000-2010 ($ million)
Source: OECD DAC data; authors‘ calculations
80 www.educationfasttrack.org/news/198/291/Ethiopia-s-Political-Leaders-Champion-Girls-Education/d,Stories/ [accessed 21 September 2011]. 81 http://ddp-ext.worldbank.org/EdStats/ETHgmrpro04.pdf, accessed 14 February 2012. 82 The largest donors over the period 1999-2006 were the International Development Association (IDA) (the World Bank), the US, the European Commission (EC) and the UK (Dom, 2010).
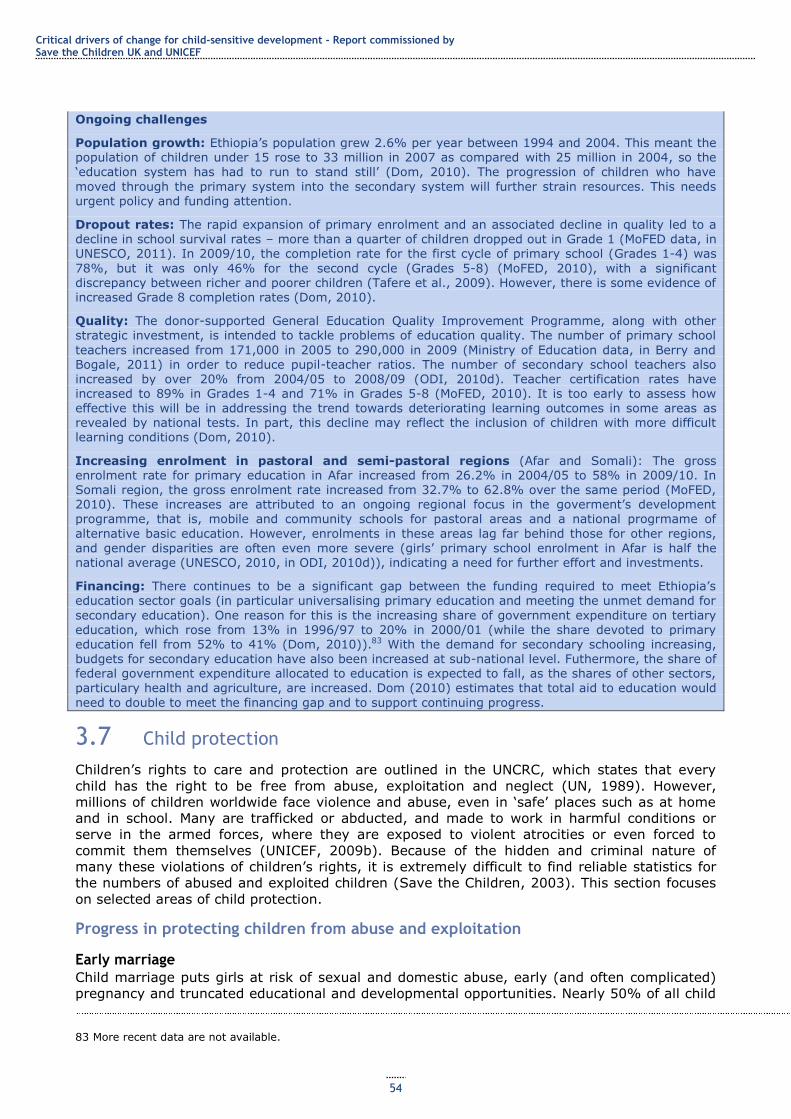
Critical drivers of change for child-sensitive development - Report commissioned by Save the Children UK and UNICEF
54
Ongoing challenges
Population growth: Ethiopia‘s population grew 2.6% per year between 1994 and 2004. This meant the population of children under 15 rose to 33 million in 2007 as compared with 25 million in 2004, so the ‗education system has had to run to stand still‘ (Dom, 2010). The progression of children who have
moved through the primary system into the secondary system will further strain resources. This needs urgent policy and funding attention.
Dropout rates: The rapid expansion of primary enrolment and an associated decline in quality led to a decline in school survival rates – more than a quarter of children dropped out in Grade 1 (MoFED data, in UNESCO, 2011). In 2009/10, the completion rate for the first cycle of primary school (Grades 1-4) was
78%, but it was only 46% for the second cycle (Grades 5-8) (MoFED, 2010), with a significant discrepancy between richer and poorer children (Tafere et al., 2009). However, there is some evidence of increased Grade 8 completion rates (Dom, 2010).
Quality: The donor-supported General Education Quality Improvement Programme, along with other
strategic investment, is intended to tackle problems of education quality. The number of primary school
teachers increased from 171,000 in 2005 to 290,000 in 2009 (Ministry of Education data, in Berry and Bogale, 2011) in order to reduce pupil-teacher ratios. The number of secondary school teachers also increased by over 20% from 2004/05 to 2008/09 (ODI, 2010d). Teacher certification rates have increased to 89% in Grades 1-4 and 71% in Grades 5-8 (MoFED, 2010). It is too early to assess how effective this will be in addressing the trend towards deteriorating learning outcomes in some areas as revealed by national tests. In part, this decline may reflect the inclusion of children with more difficult learning conditions (Dom, 2010).
Increasing enrolment in pastoral and semi-pastoral regions (Afar and Somali): The gross enrolment rate for primary education in Afar increased from 26.2% in 2004/05 to 58% in 2009/10. In Somali region, the gross enrolment rate increased from 32.7% to 62.8% over the same period (MoFED, 2010). These increases are attributed to an ongoing regional focus in the goverment‘s development programme, that is, mobile and community schools for pastoral areas and a national progrmame of
alternative basic education. However, enrolments in these areas lag far behind those for other regions,
and gender disparities are often even more severe (girls‘ primary school enrolment in Afar is half the national average (UNESCO, 2010, in ODI, 2010d)), indicating a need for further effort and investments.
Financing: There continues to be a significant gap between the funding required to meet Ethiopia‘s education sector goals (in particular universalising primary education and meeting the unmet demand for
secondary education). One reason for this is the increasing share of government expenditure on tertiary education, which rose from 13% in 1996/97 to 20% in 2000/01 (while the share devoted to primary education fell from 52% to 41% (Dom, 2010)).83 With the demand for secondary schooling increasing, budgets for secondary education have also been increased at sub-national level. Futhermore, the share of federal government expenditure allocated to education is expected to fall, as the shares of other sectors, particulary health and agriculture, are increased. Dom (2010) estimates that total aid to education would
need to double to meet the financing gap and to support continuing progress.
3.7 Child protection
Children‘s rights to care and protection are outlined in the UNCRC, which states that every
child has the right to be free from abuse, exploitation and neglect (UN, 1989). However,
millions of children worldwide face violence and abuse, even in ‗safe‘ places such as at home
and in school. Many are trafficked or abducted, and made to work in harmful conditions or
serve in the armed forces, where they are exposed to violent atrocities or even forced to
commit them themselves (UNICEF, 2009b). Because of the hidden and criminal nature of
many these violations of children‘s rights, it is extremely difficult to find reliable statistics for
the numbers of abused and exploited children (Save the Children, 2003). This section focuses
on selected areas of child protection.
Progress in protecting children from abuse and exploitation
Early marriage
Child marriage puts girls at risk of sexual and domestic abuse, early (and often complicated)
pregnancy and truncated educational and developmental opportunities. Nearly 50% of all child
83 More recent data are not available.
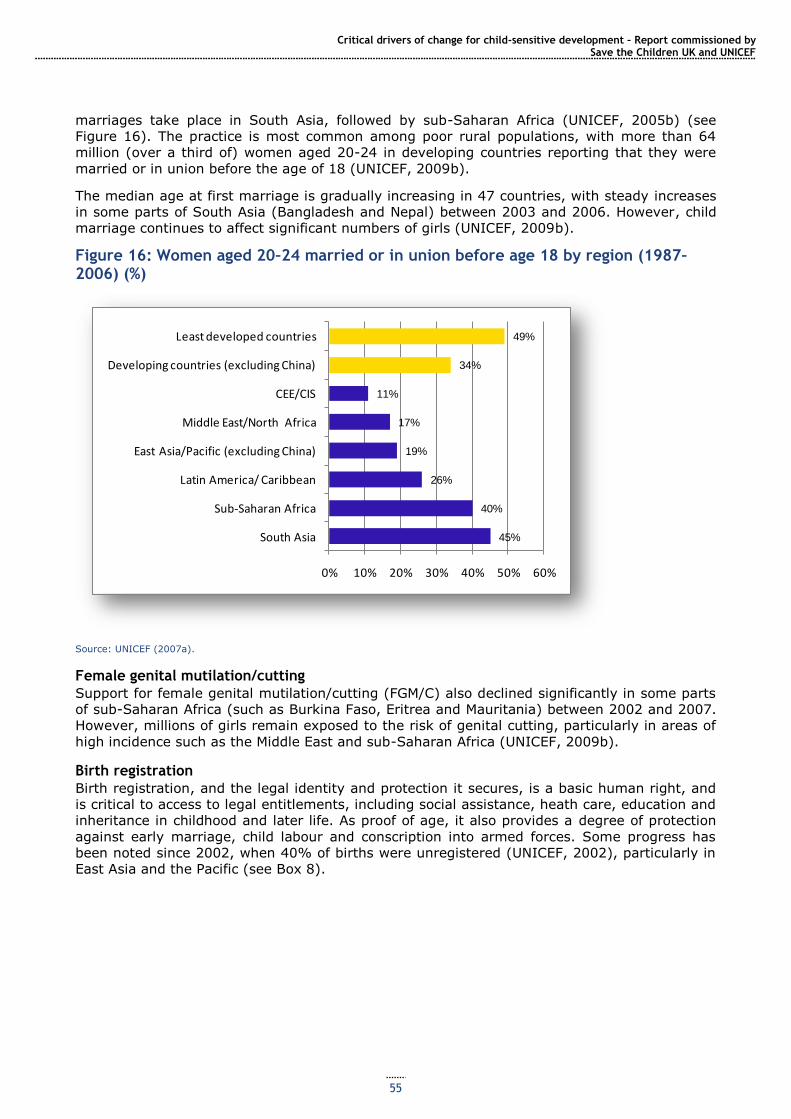
Critical drivers of change for child-sensitive development – Report commissioned by Save the Children UK and UNICEF
55
marriages take place in South Asia, followed by sub-Saharan Africa (UNICEF, 2005b) (see
Figure 16). The practice is most common among poor rural populations, with more than 64
million (over a third of) women aged 20-24 in developing countries reporting that they were
married or in union before the age of 18 (UNICEF, 2009b).
The median age at first marriage is gradually increasing in 47 countries, with steady increases
in some parts of South Asia (Bangladesh and Nepal) between 2003 and 2006. However, child
marriage continues to affect significant numbers of girls (UNICEF, 2009b).
Figure 16: Women aged 20–24 married or in union before age 18 by region (1987–2006) (%)
Source: UNICEF (2007a).
Female genital mutilation/cutting
Support for female genital mutilation/cutting (FGM/C) also declined significantly in some parts
of sub-Saharan Africa (such as Burkina Faso, Eritrea and Mauritania) between 2002 and 2007.
However, millions of girls remain exposed to the risk of genital cutting, particularly in areas of
high incidence such as the Middle East and sub-Saharan Africa (UNICEF, 2009b).
Birth registration
Birth registration, and the legal identity and protection it secures, is a basic human right, and
is critical to access to legal entitlements, including social assistance, heath care, education and
inheritance in childhood and later life. As proof of age, it also provides a degree of protection
against early marriage, child labour and conscription into armed forces. Some progress has
been noted since 2002, when 40% of births were unregistered (UNICEF, 2002), particularly in
East Asia and the Pacific (see Box 8).
45%
40%
26%
19%
17%
11%
34%
49%
0% 10% 20% 30% 40% 50% 60%
South Asia
Sub-Saharan Africa
Latin America/ Caribbean
East Asia/Pacific (excluding China)
Middle East/North Africa
CEE/CIS
Developing countries (excluding China)
Least developed countries
Critical drivers of change for child-sensitive development - Report commissioned by Save the Children UK and UNICEF
56
Box 8: Universal birth registration
Through its Universal Birth Registration campaign, Plan International, alongside partner NGOs and
governments, has facilitated the registration of over 40 million people – mainly children – in 32 countries, including:
Bangladesh: Nearly 6 million children and adults have acquired official identities since 2003. Through work with the government, Plan also mobilised NGOs to record nearly 50,000 street children in Dhaka – over half of whom received birth certificates in 2008.
Cambodia: Over 7 million children and adults received birth certificates within 10 months of the programme‘s commencement.
Tanzania: Over 1 million new registrations of children and adults were achieved between 2005 and 2009.
Uganda: The Revitalisation of Births and Deaths Registration project resulted in an almost 25% increase in registrations, including over 550,000 children under eight, from 2006 and 2007.
Vietnam: A focus on specific groups led to registration of 19,000 children from 66 ethnic communities in
Quang Ngai province and 10,000 children in Lang Son and Lai Chau mountainous provinces in 2007/08.
Source: Cody (2009).
Child labour
Between 2004 and 2008, the overall number of child labourers worldwide declined by 3%
(from 222 million to 215 million), and the number of girls and boys aged 5-14 in hazardous
work decreased by 15% and 10%, respectively. The reduction in labour among 5-14 year olds
between 2000 and 2008 was greatest in the Asia Pacific region (from 19% to 14.8%) and in
Latin America and the Caribbean (from 16% to 9%) (Diallo et al., 2010).
Children affected by armed conflict
Between 2002 and 2006, two-thirds of the world‘s child population – some 1.5 billion children
– lived in countries affected by violent, high-intensity conflict. It is estimated that more than
8.8 million children were internally displaced by conflict, and another 5.8 million sought refuge
outside their country‘s borders (UNICEF, 2007a). The use of children under 18 in hostilities
continues to take place in one form or another in over 86 countries and territories worldwide
(CSUCS, 2008), while armed groups in at least 24 countries have recruited or kidnapped
children, many of whom are forced to take part in hostilities as fighters or spies or used as
porters, cooks or sex slaves. Such children are most often found in the armed forces of sub-
Saharan Africa (Save the Children, 2010b).
Against this background, there has been some progress. More than 100,000 children have
been demobilised and reintegrated since 1998 (UNICEF, 2007a) (see Case Study 7 on Sierra
Leone), and international and community pressure has led some armed groups to commit to
ending child recruitment, such as in Côte d‘Ivoire, Myanmar and Sri Lanka. However,
significant gaps in implementation remain, and tens of thousands more children either remain
in or have been newly recruited into armed conflicts (CSUCS, 2008).
Case Study 7: Post-conflict child protection in Sierra Leone
The 1991-2002 conflict in Sierra Leone was characterised by extreme violence, with children singled out
for ‗some of the most brutal violations of human rights recorded in any conflict‘ (SLTRC, 2004). Children between the ages of 10 and 14 were widely targeted for rape and sexual slavery, and between 5,000 and 10,000 were forcibly conscripted into the armed forces, where they were often made to witness and commit terrible atrocities – at times in their own communities (ibid.). Nearly 30% of all people forced into
recruitment were under the age of 12 – often children who were already abused, exploited or neglected and were easily targeted by recruiters. By 1998, children comprised 25% of the fighting forces. Since the cessation of hostilities, much progress has been made in rehabilitating and reintegrating children formerly associated with the armed forces.
Critical drivers of change for child-sensitive development – Report commissioned by Save the Children UK and UNICEF
57
The Child Protection Network (CPN)84 – managed by the Ministry of Social Welfare, Gender and Children‘s Affairs and supported by UNICEF – coordinated activities in the disarmament, demobilisation and
reintegration (DDR) process (including family tracing and reunification, interim and alternative care, education and employment programmes) among various NGOs, international organisations, government agencies and peacekeeping forces. A key objective was community mediation – working to overcome the stigma facing children involved in armed conflict and to reintegrate them peacefully into their communities. By 2002, a total of 7,141 children under 15 (70% were demobilised ex-combatants and 30% separated children) were sent to interim care centres under the care of UNICEF and child protection NGOs. By 2003, 6,977 of these children were reunified with their families through the Family Tracing and
Reunification Programme (Brooks, 2005), which was supported by key stakeholders including the police, the Red Cross and the UN High Commissioner for Refugees (UNHCR). Children orphaned by the conflict or whose parents/guardians could not be traced were placed in foster care. One of the community-based structures set up the CPN – child welfare committees – was so successful that it became part of the formal child protection system in Sierra Leone under the Child Rights Law of 2007.85
In order to better integrate children into their communities, child protection and specialist education agencies helped to fund and coordinate the Community Education Investment Programme, which provided accelerated education for 2,788 former child soldiers and expanded to include children who had not been soldiers. In addition, 1,441 former child soldiers aged 15-17 years entered the National Committee for DDR Training and Employment Programme, which provided skills training and business start-up kits (Brooks, 2005). NGOs such as the Forum for African Women Educationalists also provided medical assistance for child victims of drug abuse, sex-related diseases or early/forced pregnancies. To
ensure full integration into the community, community-level child welfare committees and children‘ clubs were also set up, with periodic follow-up visits by NGO social workers focused on strengthening community capacity to enable children to readjust to their new social roles. War Child and other CPN partners provided recreation and psychosocial healing for affected children. UNICEF, as the focal partner of the Ministry for Social Welfare, provided school items and fee payment for over 3,000 children and reintegrated 1,414 girls who had not been included in the original DDR programme (Committee on the
Rights of the Child, 2006).
Aid
Foreign aid was critical to Sierra Leone‘s post-conflict recovery: from 2002 to 2004, it encompassed 94% of the country‘s development budget, and nearly a quarter of this budget went towards reintegration,
rehabilitation and recovery programmes (World Bank, 2003).86
Challenges
Sierra Leone‘s DDR process was largely seen as a success and has served as a model for other post-
conflict regions (Solomon and Ginifer, 2008). However, it provided insufficient support to girls associated with the armed forces. A quarter of girls abducted by soldiers and targeted for sexual slavery were 12 years or under, and an estimated 30% of child soldiers were girls. However, their complex situations (as servants and captive ‗bush wives‘ as well as fighters) within the armed forces went largely unrecognised, and only 8% of DDR participants were female (CSUCS, 2008). In response, UNICEF established the Girls Left Behind Project, supporting girls overlooked by the DDR process; similar projects were set up by NGOs such as Save the Children, Caritas and the International Rescue Committee (IRC). Other issues
such as drug use and psychological problems stemming from the conflict have also been addressed only
on a small scale, although some of these problems have led to increases in the number of street children and young girls engaged in sex work (CSUCS, 2008).
How has progress in reducing child mortality been achieved?
Legal reform
Legal reform has set a framework for action on child protection, and particular forms of child
maltreatment have been banned, such as corporal punishment in schools (Jones et al., 2008a)
and marriage under age 18 in many countries. There has been near-universal ratification of
the Worst Forms of Child Labour Convention. The Minimum Age Convention is among the
International Labour Organization (ILO)‘s most ratified Conventions.
84 An organisation coordinated by UNICEF and comprising 40 members from UN agencies, NGOs and government ministries. 85 Thanks to Save the Children Sierra Leone for this observation. 86 Bilateral and multilateral aid (administered by the World Bank and government of Sierra Leone through a Multi-donor Trust Fund) were provided primarily by the World Bank, the European Union (EU), the African Development Bank (AfDB), DFID, USAID and UN agencies (World Bank, 2003).
Critical drivers of change for child-sensitive development - Report commissioned by Save the Children UK and UNICEF
58
Over three-quarters of states have signed, ratified or acceded to the Optional Protocol to the
Convention on the Rights of the Child on the Involvement of Children in Armed Conflict and
more than 100 countries have signed and ratified the Optional Protocol on the Sale of Children,
Child Prostitution and Child Pornography. Global efforts to end impunity for crimes against
children – including implementation of a monitoring and reporting mechanism on child rights
violations during armed conflict and the adoption by many states of the Paris Commitments
and Paris Principles to prevent the unlawful recruitment of children – have led to legal reforms
in many countries (UNICEF, 2009c). However, implementation of many child protection laws
has been patchy.
Focused action
Where there has been a consensus between government, donors and civil society concerning
the importance of particular problems, focused action has played an important role. Examples
include programmes to eradicate child labour (see Case Study 8 on India) and to demobilise
former child soldiers (see Case Study 7 on Sierra Leone).
Case Study 8: Child labour in India
India is home to the largest population of child labourers under 14 in the world – over 12.6 million
(NCPCR, 2007a, 2007b), or nearly 7% of the global population of working children (ILO, 2006b). Two million of these children are employed in hazardous industries, and the majority are engaged in exploitative and hazardous occupations that are detrimental to their development and undermine their basic human rights. The numbers involved may be considerably higher: NGOs have estimated there to be between 25 and 115 million working children in India (ILO, 2007b).
In addition to action on factors underlying child labour, such as poverty and education, the government and its partners, including NGOs, ILO and US Department of Labour, have committed substantial resources to tackling child labour in the past 20 years. India was the first country to join the International Programme for the Elimination of Child Labour (IPEC), in 1992, and has since launched various anti-child
labour programmes, including the National Child Labour Project (NCLP) and the Indo-US Child Labour Project (INDUS).
The NCLP is India‘s largest programme aimed at eradicating child labour. It is implemented through the Ministry of Labour and Employment across 266 of the most child labour endemic districts (Department of Labour, 2011), and works to withdraw and rehabilitate children from hazardous occupations (ILO, 2004). The projects focus primarily on non-formal education. Special schools provide former child workers with formal and non-formal education, vocational training, supplementary nutrition, monthly stipends and
health exams, and children are eventually mainstreamed into ordinary schools or employment.
Impacts
In 2010, approximately 280,000 former child labourers (100,000 from hazardous occupations) were enrolled in the project,87 and 486,000 children have progressed into mainstream education (respectively,
2% of child labourers and 4% of children working in hazardous occupations in India) since the project‘s inception in 1988, the majority of which has taken place between 2008 and 2011 (Satpathy et al., 2010).
Around 52% of enrolled children have progressed from non-formal to mainstream education (ibid.). Targeting has not been entirely successful, as only 79% of sampled children are of the targeted age range (9-14), and at the national level enrolment of children who are not child labourers in the programme is around 30% (ibid.).
The government plans to extend the NCLP to all 602 districts in the country by 2012 (USDoL, 2009). Under the 10th five-year plan, 90% of funding for child labour schemes went to the NCLP (Satpathy et al., 2010). However, expenditure on the scheme has been declining in recent years, from Rs 1.57 billion in 2008/09 to Rs 927.1 million in 2010/11, despite the ongoing scale of the problem.
The six-year INDUS (co-financed by the government of India, the US Department of Labour (USDoL) and ILO-IPEC), initiated in 2004, aimed to eliminate the worst forms of child labour in India by addressing gaps in the NCLP and other national initiatives and piloting additional components. Examples of the focus of INDUS were income generation activities for parents, capacity building of government departments and civil society partners and beneficiary tracking and monitoring. It also worked to strengthen the public education system and formal schools in the project areas (ILO, 2006a). Other activities included the
withdrawal of children from hazardous occupations and provision of transitional education, nutritional supplementation, primary health care, monthly stipends, vocational training and awareness raising/social
87 The following data were collected when only 250 districts were participating in the NCLP.
Critical drivers of change for child-sensitive development – Report commissioned by Save the Children UK and UNICEF
59
mobilisation (USDoL, 2009). It sought to build on and complement the NCLP and other national initiatives by bringing together the Departments of Labour and Education in 21 districts across 5 major states; in 6 of these districts the NCLP was previously operating but handed work over to INDUS (ILO, 2006a).
Impacts
By 2009, the $40 million initiative had withdrawn more than 100,000 children from hazardous work (USDoL, 2009) (20,000 more than the target figure). Around 57% of adolescents who graduated from vocational training are now ‗gainfully employed‘ (against a target of 40%), with gender parity in transitional education centres achieved (ILO, 2007a).
Challenges
India has not yet ratified ILO Convention 182 on the Worst Forms of Child Labour. Its 1987 Child Labour Prohibition and Regulation Act addresses hazardous industrial child labour; however, this covers only organised sectors of production, whereas over 90% of the labour force is employed in unorganised
sectors (NCPCR, 2007a). Supplementary bans on children under 14 working as domestic servants or in the hospitality trade were appended to the Child Labour Act in 2006. However, child domestic labour (as well as work in hazardous conditions) continues to be culturally accepted and widely prevalent, reflecting
family dependence on children‘s income.88
Active role of civil society
More so than in other areas, progress on child protection has often been spearheaded by civil
society organisations, partly reflecting gaps in governmental capacity or motivation. For
example, progress on birth registration is largely a result of wide-scale registration campaigns
by the international NGO Plan International (Cody, 2009) (see Box 8). Civil society has often
been instrumental in changing attitudes, for example with respect to early marriage and
FGM/C (Mackie and LeJeune, 2009).
Social mobilisation
Awareness raising on children‘s rights and social mobilisation against particular practices have
contributed to some improvements in child protection, particularly reductions in FGM/C and
early marriage (Mackie and LeJeune, 2009).
Poverty reduction
Poverty reduction has contributed to progress on some issues, in particular child labour and
early marriage, which are particularly responsive to improvements in household incomes,
although other factors, such as social mobilisation, have also been important. Improvements in
social welfare, employment and education levels have been associated with later marriage age
in the Republic of Korea, Sri Lanka, Taiwan and Thailand (Mathur et al., 2003).
Aid
Although aggregated data on levels of aid to promoting child protection could not be found, it
is likely to be lower than for the other areas of child wellbeing examined, reflecting generally
low donor allocations to social welfare. However, aid has contributed to some of the
improvements witnessed (see Case Studies 7 and 8 on Sierra Leone and India). More broadly,
aid to poverty and education has contributed to the decline in child labour, as has dedicated
funding from ILO-IPEC.
Ongoing challenges
Birth registration
An estimated 48 million children – 36% of all births worldwide – remain unregistered. The
majority come from poor populations in South Asia and sub-Saharan Africa (UNICEF, 2005a),
where 64% and 63% respectively go unregistered (Cody, 2009).
Child labour
Despite progress on child labour, about 215 million children worldwide work in some capacity,
the majority concentrated in sub-Saharan Africa (where 25.3% of all children are labourers)
88 www.unicef.org/india/child_protection_2053.htm [accessed 14 February 2012].
Critical drivers of change for child-sensitive development - Report commissioned by Save the Children UK and UNICEF
60
and Asia Pacific (where 13.3% of children are labourers). Around 70% – 153 million – are aged
5-14 years, and 91 million are under 11. More than half (115 million) are involved in
hazardous work situations such as dangerous or unhealthy environments, or are vulnerable to
physical, psychological or sexual abuse, forced labour or slavery, with some children engaged
in illicit activities such as drug trafficking or sex work. Furthermore, there has been an increase
in the overall involvement of boys in labour (by 7%) and of older children (aged 15-17) in
hazardous work (by 16%) (Diallo et al, 2010).
Violence against children in schools
School violence, including corporal punishment, sexual abuse by teachers, school authorities
and other pupils and bullying, is a pervasive problem for children all over the world (Plan
International, 2008).89 Only 93 countries have banned corporal punishment in schools, and the
law is often not effectively enforced (Jones et al., 2008a). Research conducted between 2003
and 2005 in a range of developing countries found that between one-fifth (China) and two-
thirds (Zambia) of children reported being verbally or physically bullied in the previous 30 days
(Plan International, 2008).
Greater progress in protecting children requires action numerous fronts:
Greater visibility for and understanding of the necessity of enhanced child protection
Much child maltreatment is simply invisible to policymakers and donors. Without reliable data
and understanding of its causes and consequences, it can often be dismissed as a relatively
small-scale problem and/or insignificant to overall development. However, without a greater
focus on child protection, global progress towards achieving the MDGs will be hindered
(EveryChild, 2010). For example, achieving the education MDGs (2 and 3) requires the
educational inclusion of all children (including young married girls and children in extended
family care, prison or work) and addressing violence in schools. For progress towards the
health MDGs (4, 5 and 6), more effective action on sexual abuse and exploitation of children
and preventing early marriage is vital (ibid).
Greater policy emphasis on and resources for child protection
Government ministries and agencies working on child protection are often grossly
underfunded, and their allocations minimal compared with other sectors. For example, one
review found that only 4% of social protection budgets in the Asia Pacific region were
dedicated to child protection (ADB, 2007, in EveryChild, 2010). Among many donors, child
protection is also a lower priority than concerns such as food and health care. For example, a
recent UNICEF report found that child protection continues to be significantly underfunded in
emergencies. In 2009, $129 million was required to respond to child protection in emergencies
by the UN Central Emergency Fund, but less than a third of this was received (Lilley et al.,
2011).90 Donor funding to ILO-IPEC has been cut in recent years, including a 20% reduction
from 2008 to 2009 (from $60 million to $53.7 million) (ILO, 2010b).
Donor responses to child protection concerns have often involved the important area of codes
of conduct for their staff, rather than an enhanced focus on programming. Successes have
been driven by a few key agencies active on child protection, which accounts for their
relatively small scale.
Strengthening child protection systems Much action on child protection is fragmented, focused on individual forms of child
maltreatment, ignoring the fact that abused and exploited children often need support in
several areas simultaneously. Further action is needed to strengthen child protection systems
so that abused and exploitation can be prevented more effectively and more holistic support
offered to affected children (Wulczyn et al., 2010).
89 In 2002, an estimated 150 million girls and 73 million boys under 18 had been raped or suffered other forms of sexual violence (Krug et al., 2002, in Plan International, 2008). 90 This is compared with $7 billion received for all sectors.
Critical drivers of change for child-sensitive development – Report commissioned by Save the Children UK and UNICEF
61
Action on entrenched cultural norms
Entrenched cultural norms often condone violence against children, child labour, child marriage
or FGM/C (Pinheiro, 2006; UNICEF, 2005b; 2009b). Child maltreatment – particularly physical
and sexual abuse – is often seen as a family matter, one in which it is beyond the power of the
state or NGOs to intervene. Awareness-raising campaigns have, however, been successful in
mobilising social change, even on these entrenched and sensitive issues (Mackie and LeJeune,
2009).
Action on poverty
Poverty underpins many child protection problems, including child labour (ILO, 2010a) and
early marriage (e.g. Mathur et al., 2003), and anti-poverty action must be better integrated
into action to protect children, potentially through stronger linkages between social protection
programmes, such as cash transfers and child protection initiatives (Jones and Holmes, 2011).
Addressing powerful interests
Powerful interests, such as those of militias or organised crime rings, are involved in some
forms of child rights abuse, such as enlistment into armed forces (UNICEF, 2009c) and child
trafficking (Skinner and Maher, n.d.). Tackling these requires enhanced capacity in the police
and criminal justice system, with attention to problems of corruption if necessary.
3.8 Multidimensional poverty reduction and progress across different dimensions of child wellbeing
Having analysed progress in specific sectors that are important to children, we now focus on
the importance of maximising synergies between sectors to improve child wellbeing in a
comprehensive and holistic manner. This reflects the multi-dimensionality of child wellbeing
and the fact that effective action to enhance child wellbeing requires investment of resources
and focused policy attention on the different contributory elements simultaneously.
Some of the case studies presented earlier have shown how some sector-specific interventions
have been strengthened through synergies with progress in other sectors. For example,
improvements in child mortality have been linked to improvements in education (particularly
girls‘ education) and better nutritional outcomes in Brazil have been achieved by reducing
household monetary poverty, improving education and hygiene, among other improvements.
This last case study focuses on Vietnam, one of the countries that have made the most
impressive progress across most child wellbeing indicators except nutrition, fuelled by a
planned approach to work on different areas of social wellbeing for households, and
particularly for children. However, progress has been concentrated among the Kinh majority,
despite programmes to improve the situation of ethnic minorities.
Case Study 9: Exceptional poverty reduction and multi-sectoral development with positive impacts on children in Vietnam
Vietnam has exhibited one of the sharpest declines in absolute poverty in the world in recent decades and, despite the global economic slowdown, poverty levels continue to decline (World Bank, 2009a). The country has far exceeded the MDG goal of halving the proportion of those living on less than $1 per day, reducing it from 40% in 1993 to 4% in 2008. The population living below the national poverty line has decreased by over 80% – from 58% in 1993 to 14.5% in 2008 (SRV, 2010), and by 2010 the proportion was estimated to have fallen to 9.4% (AEF, 2010). The child poverty rate has reduced dramatically in
recent years: from 65% in 1993 to 26.7% in 2004 (Nguyen, 2008) (see Figure A).
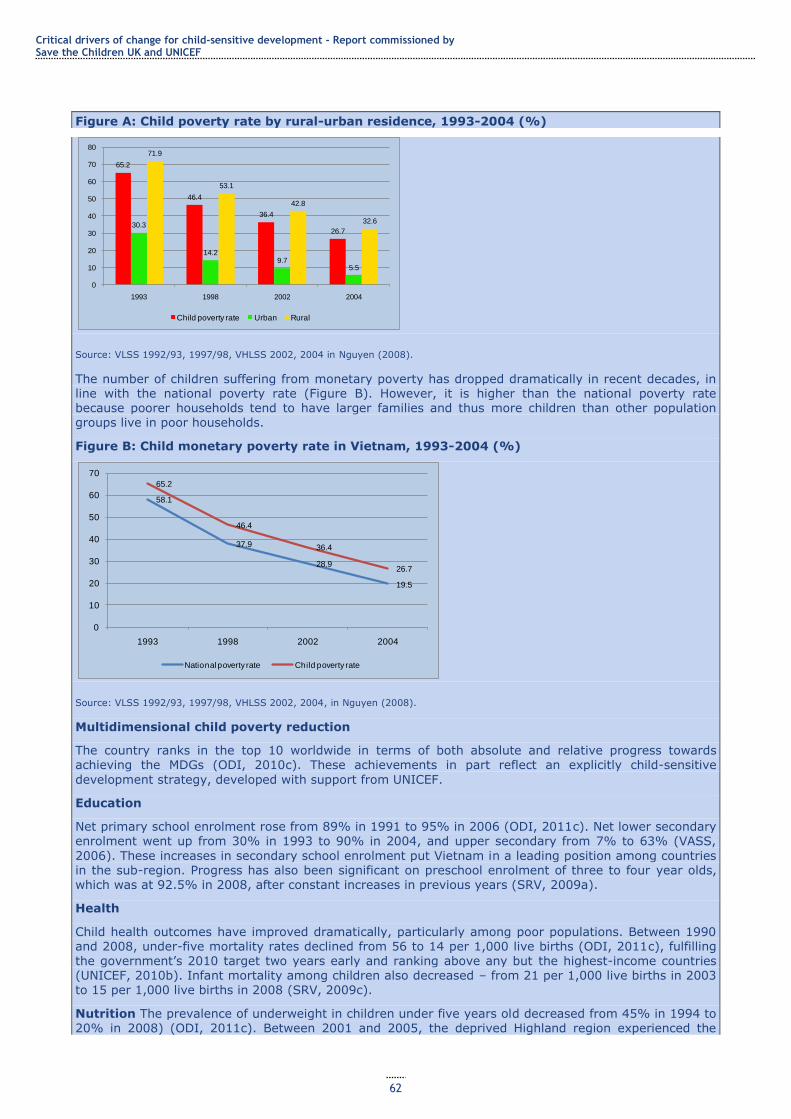
Critical drivers of change for child-sensitive development - Report commissioned by Save the Children UK and UNICEF
62
Figure A: Child poverty rate by rural-urban residence, 1993-2004 (%)
Source: VLSS 1992/93, 1997/98, VHLSS 2002, 2004 in Nguyen (2008).
The number of children suffering from monetary poverty has dropped dramatically in recent decades, in line with the national poverty rate (Figure B). However, it is higher than the national poverty rate because poorer households tend to have larger families and thus more children than other population groups live in poor households.
Figure B: Child monetary poverty rate in Vietnam, 1993-2004 (%)
Source: VLSS 1992/93, 1997/98, VHLSS 2002, 2004, in Nguyen (2008).
Multidimensional child poverty reduction
The country ranks in the top 10 worldwide in terms of both absolute and relative progress towards achieving the MDGs (ODI, 2010c). These achievements in part reflect an explicitly child-sensitive
development strategy, developed with support from UNICEF.
Education
Net primary school enrolment rose from 89% in 1991 to 95% in 2006 (ODI, 2011c). Net lower secondary enrolment went up from 30% in 1993 to 90% in 2004, and upper secondary from 7% to 63% (VASS,
2006). These increases in secondary school enrolment put Vietnam in a leading position among countries in the sub-region. Progress has also been significant on preschool enrolment of three to four year olds, which was at 92.5% in 2008, after constant increases in previous years (SRV, 2009a).
Health
Child health outcomes have improved dramatically, particularly among poor populations. Between 1990 and 2008, under-five mortality rates declined from 56 to 14 per 1,000 live births (ODI, 2011c), fulfilling the government‘s 2010 target two years early and ranking above any but the highest-income countries (UNICEF, 2010b). Infant mortality among children also decreased – from 21 per 1,000 live births in 2003
to 15 per 1,000 live births in 2008 (SRV, 2009c).
Nutrition The prevalence of underweight in children under five years old decreased from 45% in 1994 to 20% in 2008) (ODI, 2011c). Between 2001 and 2005, the deprived Highland region experienced the
65.2
46.4
36.4
26.730.3
14.29.7
5.5
71.9
53.1
42.8
32.6
0
10
20
30
40
50
60
70
80
1993 1998 2002 2004
Child poverty rate Urban Rural
58.1
37.9
28.9
19.5
65.2
46.4
36.4
26.7
0
10
20
30
40
50
60
70
1993 1998 2002 2004
National poverty rate Child poverty rate
Critical drivers of change for child-sensitive development – Report commissioned by Save the Children UK and UNICEF
63
greatest decline in underweight: from 49.1% to 34% (Nguyen, 2009). The country has also reduced the male-female ratio of underweight children under five – from 1.13 to 0.91 (1997-2006) (ODI, 2010c). However Vietnam remains one of the 10 most-affected countries worldwide for underweight children (Jones and Thi Van Anh, 2011) and stunting continues to affect one third of Vietnamese children, a very high rate, with ethnic minorities in remote rural areas most affected (UNICEF, 2010b).
Water, sanitation and hygiene
Vietnam was one of the world‘s top 10 countries with regard to progress on securing access to improved water sources between 1995 and 2008, with a 38% increase (to 94%) in the proportion of the population using improved drinking water (ODI, 2010c). Access to sanitation also improved over this period: the
percentage of population with access to hygienic latrines91 rose from 10% in 1993 to 32% in 2004 (VASS, 2006). Most schools now have improved water sources and latrines (80% and 73%, respectively), although many do not yet meet national standards (UNICEF and MoH, 2007). By 2005, 58% of clinics in poor rural areas had improved water and sanitation facilities (SRV, 2005).
How has this progress been achieved?
There has been strong government commitment to social investment, with policy commitments translated into concrete programmes. For example, the Comprehensive Poverty Reduction and Growth Strategy, the Secondary Education Master Plan, the Education Strategic Development Plan (2001-2010) and the National Education for All campaign have all emphasised universalising primary and secondary education.
In addition to major investments in the health system, such as the Health Care Fund for the Poor (HCFP), Vietnam has a worked with international organisations such as UNICEF to improve specific health indicators. In the past 15 years, the EPI has vaccinated over 90% of the population against tuberculosis, measles and diphtheria (UNICEF, 2009b). Polio and maternal and neonatal tetanus have been eradicated (Le, 2008), and Vietnam has also begun to control micronutrient deficiency diseases (World Bank,
2005).The National Nutrition Strategy (2001-2010) has focused on improving child and maternal nutrition through enhancing food security and reducing nutrition-related disease, particularly among ethnic minorities. An anti-malnutrition programme for children under five has been implemented in every
province (IMF, 2006). The 2001-2005 programme on child malnutrition prevention was ranked the most effective among all the National Health Target Programmes, with relatively consistent achievements throughout Vietnam (Nguyen, 2009). However, as with much public sector spending in Vietnam, nutritional
programmes are heavily dependent on donor funding (see below), creating a limited agenda, a lack of
coordination across ministries, and are generally underfunded (Jones and Thi Van Anh, 2011).
Clean water and sanitation are addressed in the Comprehensive Poverty Reduction and Growth Strategy and the National Rural Clean Water Supply and Sanitation Strategy, which aims to achieve universal
access to safe water and sanitation services in rural areas by 2020. Vietnam‘s five-year Rural Water Supply and Sanitation National Target Programmes have been effective in meeting targets.
A focus on children has been integrated into national development strategies and sector-specific plans and targets: Three National Programmes of Action for Children have been implemented since 1991. These establish time-bound objectives for children‘s health, nutrition, education and access
to clean water and hygiene, and for reductions in the numbers of children with specific vulnerabilities such as street children and those affected by HIV/AIDS, sexual abuse and trafficking (UNICEF, 2007a).
These child-sensitive plans are integrated with National Target Programmes, the main implementation vehicles for government policy, such as the National Target Programme for Poverty Reduction, which supports access to basic services, including through school fee exemption and reduction (MOLISA et al., 2009). These are complemented by a range of specific programmes aimed at improving the situation of
particularly disadvantaged children.
A strong and longstanding orientation towards income equity: The pre-1990 government invested substantially in education.92 Equitable land and agricultural sector reforms in recent decades have underpinned growth,93 financing government investment in education, health care and general poverty reduction (ODI, 2011c).
91 That is, double-vault composting latrines, ventilated pit latrines, pour/flush-water sealed latrines and septic tank latrines used in the household (MoH Decision No. 08/2005/QD-BYT). 92 High education levels have in turn contributed to sustained economic progress and helped to attract large volumes of foreign direct investment (FDI). FDI projects employed 730,000 people (although this accounted for only 1.5% of workers) by 2006, and by 2002 contributed $480 million towards state revenue. 93 This has, however, been concentrated among the Kinh majority, with ethnic minorities benefiting little from poverty reduction (World Bank, 2009c).
Critical drivers of change for child-sensitive development - Report commissioned by Save the Children UK and UNICEF
64
The fiscal decentralisation process has also been equitable and pro-poor: since 2006, provinces with higher poverty headcount ratios, lower levels of local revenue, higher presence of ethnic minorities and more geographically disadvantaged districts receive larger per capita fiscal transfers from the central government. Provinces which cannot meet minimum expenditure needs are also exempted from sharing tax proceeds nationally (World Bank, 2009b).
A strong policy focus on securing poor and disadvantaged children‘s access to services has been reflected in budgets and concrete programmes. For example:
1. Three of Vietnam‘s key development strategies commit to ensuring educational access for disadvantaged and ethnic minority children, including early childhood education. The Ministry of
Education and Training has experimented with alternative primary schools for difficult-to-access regions
2. A total of 95% of beneficiaries of the National Targeted Programme for Poverty Reduction received complete exemption from primary school tuition fees, as did 60% for lower secondary; more than 50% and 30%, respectively, reported exemptions from school contributions (which are often the most
expensive component of education.
3. In 2004, 84% of the poor population (among whom children are overrepresented) benefited from the government‘s HCFP, which provides free access to health services and essential drugs through health care cards or insurance (Nguyen, 2009; SRV, 2008). By 2006, 96% of children under six had been granted free medical cards, and many sick children from economically disadvantaged families are now entitled to free medical services (UNICEF, 2010d).
Financing: There have been significant increases in expenditure on key social sectors over the past decade. For example,
1. The education budget increased 10-fold from 2002 to 2006 (VND 15 billion to 150 billion) (SRV,
2009a), with most spending on primary education. Between 1999 and 2002, spending on primary school teacher salaries nearly doubled (World Bank, 2005).
2. Health expenditure (as a percentage of total government expenditure) rose from 6.6% to 9.3%
between 2000 and 2008 (WHO, 2011b). Further, between 2005 and 2006, the government put $25 million towards health insurance cards for children under six (UNICEF, 2010d) to support its commitment
to expanding health coverage for children.
3. The state budget allocation to child malnutrition prevention programmes increased from $1.87 million in 2000 to $2.67 million in 2004 (Nguyen, 2009).
Aid has played an important role in bridging financing gaps in some sectors. 60 per cent of the national AIDS response is funded by international development aid, and in 2006, the state only contributed 27 per cent of the total
money spent on social health care (UNICEF, 2010b). For example, 30% of the National Targeted Programme
for the Socio-economic Development of Extremely Difficult Communes in Ethnic Minority and Mountainous Areas (Programme 135-II) is provided by donors, as is 8.5% of funding for the National Targeted Programme for Poverty Reduction (2006-2010) (SRV, 2009b). Vietnam’s social protection system is fragmented, ad hoc and generally poorly funded from the state, which contributes to donor dependency and unsustainability of some programmes (Jones and Thi Van Anh, 2010).
Ongoing challenges
Concentration of poverty in disadvantaged areas: As overall poverty rates of fallen, poverty has become increasingly concentrated among remote rural and ethnic minority communities. There are significant persistent disparities between rural and urban areas on all child wellbeing indicators (Le et al.,
2008) and, although ethnic minorities comprise only 12.6% of the population, they account for 39% of Vietnam‘s poor (Nguyen, 2008). The costs of reaching such geographically isolated communities are generally higher and the infrastructural challenges greater, so continued commitment is needed to extend social services and other development programmes to these hard-to-reach areas.
Reducing disparities between poor and better-off households: Household income is a critical
determinant of child outcomes. Those from the poorest households are two to three times more likely to die before the age of five than children from the richest households (Le et al., 2008; UN, 2011). In recent years, disparities in child mortality and malnutrition rates between the poorest and richest socioeconomic groups have increased (ODI, 2010c), underlining the need for continued focused attention to particularly disadvantaged households and areas.
Critical drivers of change for child-sensitive development – Report commissioned by Save the Children UK and UNICEF
65
4 Drivers of progress
This section explores the critical economic, political, socio-cultural and technological drivers of
progress identified through our analysis of progress in different areas of child wellbeing, the
wider literature on development progress and the country case studies. For an aggregated
analysis of progress in different areas of child wellbeing such as this, it is difficult to make
quantitative estimates of the contributions of different drivers of progress, such as aid, growth,
the political economy, etc. Our quantitative analysis analysed the role of aid, rather than
comparing its role with that of other factors (see Annex 2). As such, our analyses rely
principally on qualitative assessments of the roles of different factors in the achievements
discussed in Section 3.
4.1 A supportive political and policy environment
A supportive political environment is one of the most important factors underpinning progress
for children. In most cases where sustained progress has been achieved at a significant scale,
the leading role of the state has been crucial, providing direct policy support, creating an
enabling environment, financing initiatives or allowing the space for NGOs and donors to fill
government gaps. Mehrotra and Jolly‘s (1997) analysis of 10 ‗well-performing‘ countries on
human development found that the state had played a critical role in ensuring that the vast
majority of the population had access to basic services. Our sectoral and case study analysis in
Section 3 bears this out.
Progress has often been driven by high-level political commitment to a particular area (e.g.
health, nutrition and poverty reduction in Brazil; education in Ethiopia), with the development
of adequately resourced sectoral strategies, in both human and financial terms, mobilising
donor support where necessary.94 Sustained policy commitment in the medium term through
changes of government and dedicated civil service capacity have underpinned improvements,
as they reduce the risks of programme discontinuation and capacity gaps that arise with
political change. This is critical to child wellbeing as change takes time – particularly among
the poorest children, where disadvantage is entrenched. Among our case studies, continued
commitment to reducing child mortality in Bangladesh across several governments stands out.
The space civil society organisations have to act can also be critical to child wellbeing. In some
sectors, for example child protection, NGOs have helped to extend provision, particularly in
geographically isolated areas and to socially marginalised groups. They have frequently
developed innovative approaches to provision that address social or financial barriers to
service use (see Box 7 on education in Afghanistan) and found ways to better protect
extremely vulnerable children (such as child workers or former child soldiers – see Case Study
7 on Sierra Leone). NGO advocacy also has an important role to play in helping to build
accountability of both public and private service providers. Success has, however, been driven
principally by a state that is strong both as a provider and a regulator (as in Chile‘s ECD
programmes), reflecting state capacity to provide services on a large scale; NGOs can often
only fill gaps in state or private sector provision.
Where service delivery is decentralised, local governance structures are sufficiently strong and
adequate implementation capacity exists, devolution of resources and decision-making power
has contributed to regional-/state-level improvements in child wellbeing (Mehrotra, 2004; Case
Studies 6 and 9 on Ethiopia and Vietnam, respectively). The rise of a social accountability
movement, embodied in right to information, budget monitoring and advocacy and citizen
scorecard initiatives, has also helped to improve the quality and accessibility of public services
in some places (World Bank, 2004; see Case Study 2 on Brazil).
94 This contrasts with a common situation where leaders express their support to the MDG agenda or to child wellbeing without putting in place policies, strategies and programmes to articulate this support.
Critical drivers of change for child-sensitive development - Report commissioned by Save the Children UK and UNICEF
66
In fragile states and conflict-affected countries, achieving sufficient political stability to initiate
and sustain policy commitments to social sector investment is an additional challenge.
Incentives for the delivery of social services may be impaired by lack of government capacity,
lack of government willingness or the breakdown of social order through conflict. The resulting
problem of diminished central resources, exacerbated by poor continuity between
humanitarian and development financing and declining control of services, gives greater
prominence to local government solutions and to alternative, non-state provision (OECD,
2008). As such, interventions to benefit children have to be developed in a way that
circumvents challenges linked to weak governance. Some inroads have been made, such as
through work with different political stakeholders to garner multi-actor support for initiatives in
the case of a quick-changing regime or by NGOs and civil society with local authorities (see the
Afghanistan example in Box 7) to deliver services and programmes. In conflict-affected states,
for instance, innovative approaches such as Immunisation Days have been based on
agreements between all parties in conflict to cease hostilities so infants can be immunised.
4.2 Well-planned and implemented programmes
At an aggregate level, recent analysis (e.g. ODI, 2010c; UNICEF, 2011a) suggests that
countries that have a range of policies in place to support children – both within and outside
families – generally have lower severe child deprivation rates than those that do not. Our
Brazil (Case Study 2) and Vietnam (Case Study 9) examples bear this out. Coherent policy
frameworks lead to progress in child wellbeing only when implemented in the form of effective
programmes and interventions. Effectiveness encompasses issues around design, financing,
capacity for effective implementation, reach and coverage. The case studies in Section 3
looked at both policies and programmes, stressing the importance of successful programme
implementation for achievements in child wellbeing.
Further, as illustrated by sector analyses and the associated case studies, ambitious, detailed,
and properly resourced sector plans to articulate policies and bridge are crucial (see Sections
3.5 and 3.6 for examples on education and Case Study 9 for an example of converting policy
commitments into effective programmes in Vietnam). Resourcing has comprised both
administrative/managerial support and an increase in the number of front-line staff providing
services at local level, as well as increased funding to infrastructure. However, critical
challenges remain, such as increasing numbers of teachers and health workers – globally, an
additional 1.9 million primary school teachers (UNESCO, 2011) and 3.5 million heath workers
are needed (Save the Children, 2011c).
4.3 Resourcing
The political traction and resource mobilisation associated with the MDGs have led to
considerable investment in some MDGs and targets (e.g. poverty reduction, primary education,
HIV/AIDS, reducing child mortality and, to a lesser extent, water and sanitation) (UN, 2011).
In addition, high-level commitment to some areas, such as the fight against HIV/AIDS backed
by donors, individual countries, multilateral funds and NGOs, or the promotion of universal
primary education through initiatives such as Education for All, have generated momentum to
channel financial and human resources, knowledge sharing and the establishment of concrete
commitments by countries, with the support of the international community.
Even in the poorest countries, the majority of funding for improving child wellbeing has been
provided by governments. A key exception is in child protection, where government funding is
often so low, in low- and middle-income countries alike, that, where NGOs are active on child
protection issues, they are often reaching larger numbers of children and with greater
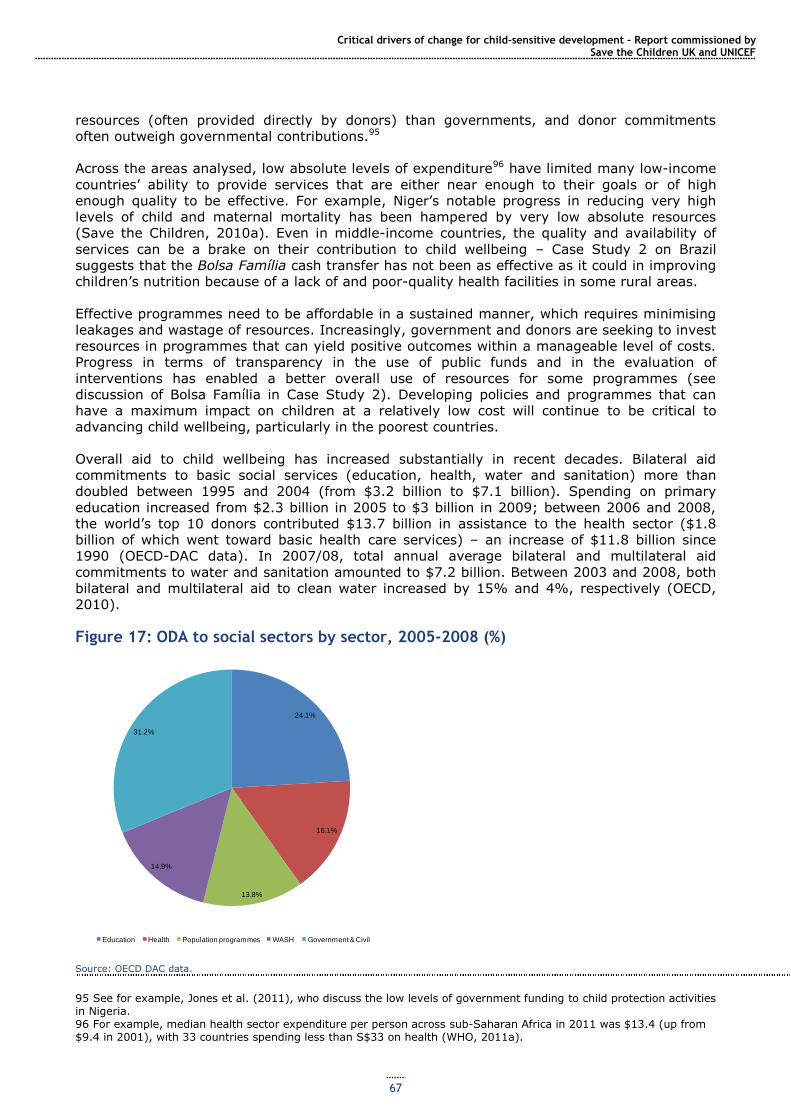
Critical drivers of change for child-sensitive development – Report commissioned by Save the Children UK and UNICEF
67
resources (often provided directly by donors) than governments, and donor commitments
often outweigh governmental contributions.95
Across the areas analysed, low absolute levels of expenditure96 have limited many low-income
countries‘ ability to provide services that are either near enough to their goals or of high
enough quality to be effective. For example, Niger‘s notable progress in reducing very high
levels of child and maternal mortality has been hampered by very low absolute resources
(Save the Children, 2010a). Even in middle-income countries, the quality and availability of
services can be a brake on their contribution to child wellbeing – Case Study 2 on Brazil
suggests that the Bolsa Família cash transfer has not been as effective as it could in improving
children‘s nutrition because of a lack of and poor-quality health facilities in some rural areas.
Effective programmes need to be affordable in a sustained manner, which requires minimising
leakages and wastage of resources. Increasingly, government and donors are seeking to invest
resources in programmes that can yield positive outcomes within a manageable level of costs.
Progress in terms of transparency in the use of public funds and in the evaluation of
interventions has enabled a better overall use of resources for some programmes (see
discussion of Bolsa Família in Case Study 2). Developing policies and programmes that can
have a maximum impact on children at a relatively low cost will continue to be critical to
advancing child wellbeing, particularly in the poorest countries.
Overall aid to child wellbeing has increased substantially in recent decades. Bilateral aid
commitments to basic social services (education, health, water and sanitation) more than
doubled between 1995 and 2004 (from $3.2 billion to $7.1 billion). Spending on primary
education increased from $2.3 billion in 2005 to $3 billion in 2009; between 2006 and 2008,
the world‘s top 10 donors contributed $13.7 billion in assistance to the health sector ($1.8
billion of which went toward basic health care services) – an increase of $11.8 billion since
1990 (OECD-DAC data). In 2007/08, total annual average bilateral and multilateral aid
commitments to water and sanitation amounted to $7.2 billion. Between 2003 and 2008, both
bilateral and multilateral aid to clean water increased by 15% and 4%, respectively (OECD,
2010).
Figure 17: ODA to social sectors by sector, 2005-2008 (%)
Source: OECD DAC data.
95 See for example, Jones et al. (2011), who discuss the low levels of government funding to child protection activities in Nigeria. 96 For example, median health sector expenditure per person across sub-Saharan Africa in 2011 was $13.4 (up from $9.4 in 2001), with 33 countries spending less than S$33 on health (WHO, 2011a).
24.1%
16.1%
13.8%
14.9%
31.2%
Education Health Population programmes WASH Government & Civil
Critical drivers of change for child-sensitive development - Report commissioned by Save the Children UK and UNICEF
68
The literature on the contribution of aid to improvements in social wellbeing is surprisingly
limited, and our review of the literature did not find compelling evidence demonstrating a
causal link between aid and positive outcomes for children.97 However, our primary data
analysis demonstrates that countries that received the most aid over the past decade also
made the most progress improving the lives of children. Key insights are summarised in Box 9,
and the literature does suggest that there is aggregate evidence for a positive effect of aid on
social wellbeing indicators, whether through promoting economic growth or through financing
social expenditure (Gomanee et al., 2003). See Annex 2 for full methodological details and a
more in-depth
Box 9: Key insights from primary data analysis: have countries that received the most aid also made the most progress in improving children’s lives?
To answer this question, we have estimated the relationship between the average annual quantity of aid
per capita received by each country, over the last decade for which data are available, and the average annual improvement in childhood outcomes over the same period. These are descriptive statistics, not an attempt to estimate a causal relationship, and thus must be treated with appropriate caution. Moreover, there is considerable variation around these averages. Our
analysis was restricted to Sub-Saharan Africa. See Annex 2 for full details. We found that the average high-aid country reduced childhood malnutrition98 by an additional 2 percentage points over the course of the decade, compared to the average low-aid country. If malnutrition rates fell by an additional 2 percentage points across all of Sub-Saharan Africa, 2.7m children would no longer be malnourished.
The average high-aid country reduced infant mortality by an additional 4 deaths per 1000 over the course of the decade, compared to the average low-aid country. If the rate of infant mortality fell by an
additional 4 per 1000 across all of Sub-Saharan Africa that would save 63,000 infant lives each year.
The case of childhood HIV is more nuanced. In Southern Africa, child infection rates have recently stabilised after a sharp rise. Aid has been particularly important in Botswana (see Case Study 3).
Comparing high- and low-aid countries in the rest of sub-Saharan Africa, we found that the typical high-aid country reduced the number of children living with HIV by 1.4 children by 1,000 population over the past seven years, as a result of good progress by a group of high-aid countries with initially high infection rates. The average rate of child HIV infection in this high-aid group of countries was 6.5 children per 1,000 population.
Our case studies illustrate that the contribution of aid has been significant in individual
countries and in particular sectors (see Case Studies 1, 3, 6 and 7). In some sub-Saharan
African countries, such as Ethiopia, aid funds constitute 25% of the education budget (see
Section 3.6). In others (such as Bangladesh‘s health sector), it has provided additional funding
that has enabled quality improvements in service delivery to contribute to better policy
outcomes, as has also been the case in Ethiopia.
In many middle-income countries, the role of aid is essentially catalytic, helping to promote
knowledge sharing on good practices. One example is the dissemination of experiences of
CCTs which originated in Latin America (see Case Study 2) and which have contributed
significantly to improving monetary poverty reduction and child development outcomes
(Barrientos and de Jong, 2006. Some of these initiatives have been scaled up with financial
support and technical support to design and impact evaluations from donors, who have also
provided support to establish CCTs in other developing countries (e.g. Malawi, Morocco and
Uganda).
97 Exceptions include: Mishra and Newhouse‘s 2009 study which finds that doubling per capita health aid produces a 2% reduction in infant mortality, and a 7% increase in health spending per capita, which is small but significant. 98 The prevalence of underweight in children under 5 was used as an indicator of child malnutrition.
Critical drivers of change for child-sensitive development – Report commissioned by Save the Children UK and UNICEF
69
In both contexts, aid is most effective for children where national commitments to child
wellbeing already exist and can strengthen and facilitate the implementation of effective
programmes and services (see Case Studies 1, 6, 8 and 9).
4.4 Role of growth
Economic growth can play an important role in both reducing income poverty and financing
greater investment in social services, which can result in important progress for children.
However, for growth to reduce poverty, it must also avoid increasing inequality. In countries
with less income-inequality, a 10% rise in economic growth reduced those below the poverty
line by 9%, but in high income-inequality countries, the same growth only produced a 3%
reduction (Hanmer et al, 2000). Growth must therefore be pro-poor; achieving this requires
active management by governments. Economic growth is expected to empower governments
with a sustainable source of financing, which can be directed at social investment if
government policy is pro-poor, increasing social welfare (Durairaj and Evans, 2010).The role of
economic growth and its relationship with human development is thus complex and contested,
99 but most agree that pro-poor policy is at least as important as growth. Economic growth has
been an important driving force for progress in most of the thematic areas analysed and in our
case studies. In the main, improvements in child wellbeing have occurred during or following
periods of economic growth (see Case Studies 1, 2, 6 and 9). However, in all cases, growth
has been accompanied by planned, often multifaceted programmes, which have dedicated both
financial resources and human resources to achieving goals. Growth has expanded the
resource envelope and facilitated these programmes but, without active policies to make use of
the fruits of growth, the same level of progress would not have been achieved. Suri et al
(2011) argue that human development is necessary to reach sustained growth – without
investment in human development policies aiming to increase economic growth will fail. In
Mauritius, for example, which has achieved high and sustained economic growth since
independence, the government has also managed to keep inequality and poverty low through
redistribution and effective spending on social welfare provision, which in turn has helped
maintain a healthy, educated population and underpinned continued growth (ODI, 2011d).As
discussed in Section 3.5, improved revenue collection, in tandem with growth, has contributed
to major increases in school enrolment in Ghana, Mali, Mozambique and Rwanda, for example
(UNESCO, 2011). Critically, in all these cases, growth has been used to stimulate social
progress.
However, much progress can take place without rapid economic growth, particularly in health,
where economic growth is estimated to explain less than half the improvements in healthcare
in developing countries over the last fifty years (Mishra and Newhouse, 2009). A 1997 study of
progress in human development found that 10 high-performing countries (Barbados,
Botswana, Costa Rica, Cuba, Kerala state (India), Malaysia, Mauritius, the Republic of Korea,
Sri Lanka and Zimbabwe) made advances in health and education over 50 years that took
nearly 200 years in the industrialised world. Although their levels of economic growth and
success in reducing income poverty varied considerably, these countries made significant
progress on child and infant mortality and basic education for almost the entire population
(Mehrotra, 2004). Similarly, in Latin America more generally, increased public sector social
spending has resulted in positive human development indicators, but no parallel increase in
growth, due to a stagnating labour market and economic volatility (Ocampo and Vallejo,
2012). Furthermore, some countries with high growth rates have seen relatively little progress
on some social indicators (e.g. in Nigeria the numbers of out-of-school children have grown, in
the absence of effective programmes to convert growth into social investment, particularly in
the context of high population growth).
99 For example Filmer and Pritchett (1997) argued that public spending has little effect on child mortality99, and that health outcomes can be explained entirely by each country‘s particular combination of per capita income, distribution of income, women‘s education, level of ethnic fragmentation and religion, while Masud and Yontcheva, (2005,) argue that health expenditure per capita is directly related to reduced infant mortality and better overall health outcomes.
Critical drivers of change for child-sensitive development - Report commissioned by Save the Children UK and UNICEF
70
Finally, some areas of child wellbeing, such as malnutrition, are less responsive to growth than
others. Several middle-income countries (e.g. Egypt, Guatemala, Libya, Peru) have high levels
of stunting (UNICEF, 2009c; UNESCO, 2011). Likewise, after two decades of growth, India is
still home to half the world‘s malnourished children and has been reducing its rate more slowly
than countries with economic growth rates half of India‘s (UNESCO, 2011). This highlights the
importance of planned interventions that combine medical-nutritional measures with action on
the underlying causes of malnutrition, such as poverty, food insecurity and gender inequality.
While the role of growth in development progress continues to be debated (and it is clear that
stagnation or economic decline are likely to undermine progress), the evidence suggests that,
as far as child wellbeing is concerned, a commitment to evidence-based policies and
programmes is equally critical (Save the Children, 2011b).
4.5 Social change
Increased gender equality has had a strong positive effect across different areas of child
wellbeing. For example, improvements in girls‘ education rates have been critical to
improvements in child health, nutrition and child protection (e.g. Brazil, Bangladesh). Indeed,
each additional year of girls‘ education can reduce child mortality by 9% (Caldwell, 1986, in
UNESCO, 2011). Empowerment of women can also contribute to reducing sex differentials in
child wellbeing, as shown in Case Study 1 on Bangladesh.
Broader social change has also facilitated progress in some contexts. For example, Victora et
al. (2011b) attribute part of Brazil‘s notable improvements in health outcomes, nutrition and
poverty reduction to underlying processes of urbanisation and fertility reduction that have
made reaching the majority of the population easier.
4.6 Increased availability of key technology and dissemination of ideas
Finally, in some areas, the spread of technology and ideas has played an important role. Very
cheap health technologies that can dramatically reduce mortality have spread rapidly across
the world (Kenny, 2011) and have played a critical role in reducing HIV/AIDS, mortality from
malaria and immunisation-preventable diseases. Increasing access to information and capacity
to use it through increased levels of education have also been vital (ibid.). Technological
advances have contributed to extending services to remote areas, such as banking via mobile
phone (pioneered by the Grameen Bank) and biometric smartcards for cash transfer delivery in
Southern Africa improving programme efficiency by eliminating corruption.
Critical drivers of change for child-sensitive development – Report commissioned by Save the Children UK and UNICEF
71
5 Conclusions and recommendations
Key areas of progress There has been much progress in child wellbeing globally over the past 20 years. Child
mortality rates have fallen by over a third and there has been a significant decline in the
numbers of children affected by HIV and a major increase in the numbers of children receiving
at least primary education and, in many countries, also junior secondary education. There has
also been some progress in reducing severe and moderate malnutrition, extending access to
water and sanitation and reducing children‘s risk of abuse and exploitation. The scale of
progress has varied considerably from region to region, country to country.
Main drivers of progress Significant progress has usually been driven by several factors simultaneously. Strong
political leadership (often from the president) has been crucial. This has led to a particular
issue being institutionalised as a policy priority, and to governments being given mandates and
resources (financial and human) to achieve clear goals. Clear, widely accepted sector
strategies, behind which donors have aligned (in aid-recipient countries), have been crucial.
Our case studies of reducing child mortality in Bangladesh (1), expanding access to and quality
of education in Ethiopia (6), eliminating hunger in Brazil (2) and extending ECD provision,
particularly for disadvantaged young children, in Chile (5) exemplify this confluence of factors.
Progress has required significant financial investment, usually through a combination of
increased investment by national governments, and more aid. Increased government
commitments have been facilitated by economic growth (Bangladesh, Brazil), and by
prioritising particular areas within government expenditure (e.g. education in Ethiopia received
an increasing share of the budget over a key period). Aid has been important in lower-income
and lower middle-income countries, and also in some upper middle-income countries for
specific issues (e.g. in helping to address the particularly high HIV rates in Botswana). Our
quantitative analysis found some evidence of the potential contribution of aid to improving
nutrition, reducing child mortality and tackling HIV. Effective aid has often been aligned with
government-led sector development (e.g. in Bangladesh and Ethiopia).
Investment in several aspects of child wellbeing, either in sequence or
simultaneously, has had strong payoffs. For example, Brazil‘s progress in nutrition was
facilitated by its prior investment in education, which led to an educated cohort of mothers
able to act on nutritional and child health advice, and contributed to poverty reduction.
Vietnam shows the payoffs from simultaneous investment in education, health care and water
and sanitation. These cross-cutting investments are optimal for progress in the multiple
dimensions of child wellbeing and for the achievement of many rights simultaneously.
Investing in child wellbeing has significant payoffs in terms of economic growth. It
develops human capital and can lead to greater productivity among the population, which is a
critical component of stronger economies. Indirect impacts on economic growth include
reduced population growth through women‘s education and lower child and infant mortality.
Well-designed investment in child wellbeing – one which focuses resources on the most
marginalised – can also contribute to reducing inequality and foster greater social cohesion. It
can also help break intergenerational poverty cycles.
Policy and programmatic innovations have the potential to continue contributing to
monetary poverty reduction and improvement across other areas of wellbeing, particularly
education, health and nutrition. These innovations include wider coverage of better-designed
social protection policies, such as the scaling-up of cash transfer programmes focused on
promoting human development, particularly of women and children.
Ongoing challenges
Critical drivers of change for child-sensitive development - Report commissioned by Save the Children UK and UNICEF
72
There is still a long way to go. Child mortality rates globally remain very high – 7.6 million
children under five died in 2009. There are 67 million primary school-age children still out of
school. Progress on reducing malnutrition has been slow. A total of 1.7 billion people still lack
access to improved sanitation, with major implications for child health. The world as a whole is
not on track to meet most of the child-related MDGs, although certain regions and countries
are on track to meet particular goals.
Child ‘ill-being’ is becoming increasingly concentrated among the most
disadvantaged. For example, as many countries have made major strides in increasing
primary enrolment, children not attending primary school are increasingly concentrated in
conflict-affected countries or live in remote rural areas, sometimes among mobile or ethnic
minority populations. In many countries, urban slum children are also notoriously underserved
by all social services. The gender gap in child health, nutrition and access to education has
narrowed significantly in many countries, although girls remain disadvantaged globally,
particularly with respect to education, and in some countries (particularly in South Asia) are
still at a notably greater risk of dying before the age of five. Worldwide, the poorest children
are at the most risk of early death, malnutrition and not attending school, and in many
countries they have been left behind by progress among middle-income and better-off groups.
Finally, the poorest children are often at the greatest risk of severe violations of the rights to
protection, such as abuse and exploitation.
A greater focus on the most disadvantaged children is not only a moral imperative: it
can also be cost-effective. For example, UNICEF analysis indicates that an approach to
reducing child mortality focused on low-income, high-mortality countries has the potential to
avert 60% more child deaths for every $1 million invested than current approaches (UNICEF,
2010c), since 1) poor and excluded populations within countries generally have a larger
proportion of children than other groups owing to higher fertility rates, so reaching such
households means reaching more children; 2) in poor and excluded populations, a higher
proportion of children die of preventable or treatable infectious diseases or conditions; and 3)
poor and excluded groups have a much lower coverage of effective interventions. As a result,
these groups have the greatest potential for child survival gains over the next five years.
Priorities for achieving an equity focus will shift over time. Where the majority lack a
basic service, investment in extending that service is critical (as in the example of education in
Ethiopia). Once the vast majority of children are served, the focus is likely to need to shift to
particularly disadvantaged children who require additional support, such as children in the
remotest areas or marginalised ethnic groups. Our case studies of Bangladesh (1) and Brazil
(2) provide concrete examples of equitable development strategies, where improvements have
been concentrated among the poorest; our Vietnam case study (9) outlines some targeted
approaches to improving educational participation among ethnic minorities.
Significant financing gaps remain to meet the child-related MDGs in health, nutrition,
education and sanitation. Varied methodologies for estimating these gaps have generated
different results, so figures are best ascertained by country. Financing gaps need to be filled by
a combination of increased aid and increased mobilisation of domestic resources. For low- and
lower-income countries in particular, it is challenging and in many cases unaffordable to
allocate the necessary level of resources to make significant progress across different sectors
simultaneously while maintaining adequate levels of quality. Policy planning has often not
accounted for synergies across sectors, which improve outcomes; budgets are also needed to
support coordination between sectoral action plans. Aid resources can continue to finance
governments to make some of these investments, in modalities that have been shown to be
most effective (e.g. budget or sector support). Well-designed policies and budget plans with a
strong child focus can contribute to making investments more manageable and to maximising
the use of aid.
Because the MDGs are in many ways modest (e.g. aiming only to halve child mortality
rather than for a more ambitious target), a greater mobilisation of resources and action is
needed beyond that required for the MDGs, both from an ethical standpoint – a child rights
Critical drivers of change for child-sensitive development – Report commissioned by Save the Children UK and UNICEF
73
perspective – and because the economic payoffs are enormous. The goal should not be to
reduce the problems faced by children ‗by half‘ but rather to work to ensure that achievements
reach all children.
Continued commitment and enhanced actions by governments, NGOs, communities,
international agencies and multilateral and bilateral donors can lead to positive
outcomes, drawing on good practice lessons of how achievements have been made, and
evidence-based consensuses on priorities for action (as in the health and nutrition fields,
where the WHO and The Lancet have identified packages of interventions) are widely accepted
as critical ways forward. In some areas, such as child protection, better lesson learning and
sharing and enhanced capacity to act on emerging knowledge are crucial.
Critical drivers of change for child-sensitive development - Report commissioned by Save the Children UK and UNICEF
74
References
Abetti, P. et al. (2011) Prospects for Bilateral Aid to Basic Education Puts Students at Risk. Washington, DC: Fast Track Initiative.
Aid Effectiveness Forum (2010) ‗AEF Report to Consultative Group‘.
Akwetey, E. (2007) The Paris Declaration and Aid Effectiveness. Impact on Civil Society Funding and Policy Space in Ghana. Accra: IDEG/ Alliance 2015.
Baleta, A. (2010) ‗Botswana Reduces Mother-to-child Transmission of HIV‘. The Lancet 375(9730: 1954.
Barrientos, A. And de Jong, J. (2006) ‗Reducing child poverty with cash transfers: a sure thing?‘ Development Policy Review, 24 (5): 537-552
Becker, G. 1973. ‗A Theory of Marriage: Part I.‘ Journal of Political Economy 81:813-846.
Belik, W. and del Grossi, M. (2003) ‗Brazil‘s Zero Hunger Policy in the Context of Social Policy‘. 25th International Conference of Agricultural Economists. Durban, 16–22 August.
Berry, C. and Bogale, S. (2011) ‗Quality Education Reform and Aid Effectiveness: Some Reflections from Ethiopia‘. International Education, Spring.
Black, R.E. et al. (2010) ‗Global, Regional, and National Causes of Child Mortality in 2008: A Systematic Analysis‘. The Lancet 375(9730): 1969–87.Boakye, J. et al. (2008) ‗ECD Policy. A Comparative Analysis of Ghana, Mauritius and Namibia‘, in M. Garcia, A. Pence and J. Evans Africa‘s Challenge. Africa‘s Future. Early Childhood Development and Care in Sub-Saharan Africa. Directions in Human Development 47200. Washington, DC: World Bank.
Bhutta, Z. Et al (2010) ‗Countdown to 2015 decade report (2000—10): taking stock of maternal, newborn, and child survival‘, The Lancet, Volume 375 (9730): 2032-44Building Resources Across Communities (2007) ‗Maternal, Neo-natal and Child Health Programmes in Bangladesh. Review of Good Practices and Lessons Learnt‘. Research Monograph Series 32. Dhaka: BRAC.
Brooks, A. (2005) The Disarmament, Demobilization and Reintegration of Children Associated with Fighting Forces: Lessons Learned in Sierra Leone 1998-2002. New York: UNICEF.
Bundy, D., Burbano, C., Grosh, M., Gelli, A., Jukes, M. and Drake, L. (2009) Rethinking School Feeding: Social Safety Nets, Child Development, and the Education Sector. Rome and Washington, DC: World Food Programme and World Bank.
Centres for Disease Control (2009) ‗Global Measles Mortality, 2000-2008‘. Morbidity and Mortality Weekly Report 4:58(47): 1321–6.
Coalition to Stop the Use of Child Soldiers (2008) Global Report 2008. London: CSUCS.
Chandy, L. and Gertz, G. (2011) ‗Poverty in Numbers: The Changing State of Global Poverty from 2005 to 2015‘. Global Views 18. Washington, DC: The Brookings Institution.
Chee G., His N., Carlson K., Chankova, S., Taylor, P. (2007). Evaluation of the First Five Years‘ of GAVI Immunization Services Support Funding. Bethesda, MD: Abt Associates Inc
Chronic Poverty Research Centre (2009) Chronic Poverty Report 2008-09. Manchester: CPRC.
Clemens, M., Radelet, S., Bhavnani, R. and Bazzi, S. (2011) ‗Counting Chickens When They Hatch: Timing and the Effects of Aid on Growth‘. Working Paper 44. Washington, DC: CGD.
Cody, C. (2009) Count Every Child: The Right to Birth Registration. Woking: Plan International.
Committee on the Rights of the Child (2006) UN Committee on the Rights of the Child: Second Periodic Report of States Parties Due in 1997, Sierra Leone. 8 September 2006 CRC/C/SLE/2.
Countdown (2010) Decade Report (2000–2010) with Country Profiles. Taking Stock of Maternal, Newborn and Child Survival. Geneva: WHO and UNICEF.
de Novaes Oliveira, M., Martorell, R. and Nguyen, P. (2010) ‗Risk Factors Associated with Haemoglobin Levels and Nutritional Status among Brazilian Children Attending Day Care Centres in Sao Paolo City, Brazil‘. Archivos Latinoamericanos de Nutricion 60(1): 23–9.
Department of Labour (2011) ‗Child Labour Project‘. Press Release, 2 August.
Critical drivers of change for child-sensitive development – Report commissioned by Save the Children UK and UNICEF
75
Diallo, Y., Hagemann, F., Etienne, A., Gurbuzer, Y. and Mehran, F. (2010) Global Child Labour Developments: Measuring Trends from 2004-2008. Geneva: ILO.
Dom, C. (2010) ‗Mid-term Evaluation of the EFA Fast Track Initiative. Country Desk Study: Ethiopia‘. Cambridge Education, Mokoro and Oxford Policy Management.
Durairaj, V and Evans, D.B. (2010) Fiscal space for health in resource-poor countries. World Health Report Background Paper, No 41. WHO.
Economic and Social Commission for Latin America and the Caribbean (2010) ‗Chile Crece Contigo: Providing Equal Opportunities Beginning in Early Childhood‘. Challenges, May. Santiago de Chile: ECLAC.
Erulkar. A. and Ab Mekbib, T. (2007): Invisible and vulnerable: Adolescent domestic workers in Addis Ababa, Ethiopia. Vulnerable Children and Youth Studies: An International Interdisciplinary Journal for Research, Policy and Care, 2:3, 246-256
Evans, A. (2011) Governance for a Resilient Food System. Oxford: Oxfam International.
EveryChild (2010) Protect for the Future: Placing Children‘s Protection and Care at the Heart of Achieving the MDGs. London: EveryChild.
Filmer, D., and Pritchett, L. (1997) Child mortality and public spending on health : how much does money matter? Policy Research Working Paper 1864. World Bank Development Research Group.
Garcia, M., Pence, A. and Evans, J. (2008) Africa‘s Challenge. Africa‘s Future. Early Childhood Development and Care in Sub-Saharan Africa. Directions in Human Development 47200. Washington, DC: World Bank.
Gordon, D. Et al (2003) Child Poverty in the Developing World. Bristol: Policy Press
Gomanee, K., Girma, S., and Morrissey, O. (2003) Aid, Public Spending And Human Welfare: Evidence from Quantile Regressions. Paper for a session on ‗Poverty and Human Development‘ organised by Dr Noorbakhsh at the DSA Annual Conference, Glasgow, 10-12 September 2003.
Government of Bangladesh (2008) ‗Bangladesh Health, Population and Nutrition Sector Programme (HNPSP), Mid-term Review‘. Vol. 1. Dhaka: GoB.
Government of Bangladesh (2009) ‗Bangladesh Health, Population and Nutrition Sector Programme (HNPSP), Annual Programme Review (APR)‘. Vol. 1. Dhaka: GoB.
Government of Bangladesh (2011) Maternal Health Programmes in Bangladesh. Dhaka: GoB.
Government of Botswana and Joint UN Programme on HIV/AIDS (2010) Progress Report of the National Response to the 2001 Declaration of Commitment on HIV and AIDS. Botswana Country Report, 2009-2010. Gaborone: Government of Botswana.
Graziano da Silva, J. (2009) ‗Zero Hunger and Territories of Citizenship: Promoting Food Security in Brazil‘s Rural
Areas‘, in J. Braun, R. Vargas Valente and R. Pandya-Corch (eds) The Poorest and the Hungry. Washington, DC: IFPRI.
Haddad, L. (2009), Lifting the Curse: Overcoming Persistent Undernutrition in India. IDS Bulletin, 40: 1–8
Hague, S. (2008) The Child Development Index: Holding Governments to Account for Children‘s Wellbeing. London: Save the Children.
Hanmer, L., Healey, J. and Naschold, F. (2000) Will Growth Halve Global Poverty by 2015? ODI Poverty Briefing. London: ODI
Hardon, A., (2001) ‗Immunisation for All? A critical look at the first GAVI partners meeting‘. HAI Europe, Vol.6, No. 1
Harper, C., Marcus, R. And Moore, K. (2003) ‗Enduring Poverty and the Conditions of Childhood: Lifecourse and Intergenerational Transmission of Poverty‘, World Development 31 (3): 535-54
Hempel, K. and Cunningham, W. (2010) Children and Youth Development Notes 4(1), August.
Human Rights Research and Advocacy Consortium (2007) ‗Parents and Children Speak out: Is Government-provided Basic education Fulfilling Afghan Children‘s Rights?‘ Kabul: HRRAC.
International Center on Child Labor and Education (2006) Review of Child Labour, Education and Poverty Agenda: India Country Report. Washington, DC: ICCLE.
Critical drivers of change for child-sensitive development - Report commissioned by Save the Children UK and UNICEF
76
International Food Security Network (2011) Successes in Reducing Hunger. Lessons from India, Malawi and Brazil. Rio de Janeiro: IFSN.
International Initiative for Impact Evaluation (2009) ‗Getting Girls into School: A development Benefit for All‘. Enduring Questions Brief 8. New Delhi: 3ie.
International Labour Organization (2004) ‗India: Child Labour and Responses‘. Overview Note. Geneva: ILO.
International Labour Organization (2006a) ‗INDUS Project Operational Guidelines‘. New Delhi: ILO.
International Labour Organization (2006b) The End of Child Labour: Within Reach. Global Report under the follow-up to the ILO Declaration on Fundamental Principles and Rights at Work. Geneva: ILO.
International Labour Organization (2007a) ‗Preventing and Eliminating Child Labour in Identified Hazardous Sectors in India (Child Labour Component)‘. INDUS: Mid-term Evaluation Part I, Summary. Geneva: ILO.
International Labour Organization (2007b) ‗Preventing and Eliminating Child Labour in Identified Hazardous Sectors in India (Child Labour Component)‘. INDUS: Mid-term Evaluation Part II, Detailed Report. Geneva: ILO.
International Labour Organization (2008) Action against Trafficking in Human Beings. Geneva: ILO.
International Labour Organization (2009), Bolsa Família in Brazil: Context, Concepts and Impact. Geneva: ILO.
International Labour Organization (2010a) Accelerating Action against Child Labour. Geneva: ILO.
International Labour Organization (2010b) Action against Child Labour 2008-2009: IPEC Progress and Future Priorities. Geneva: ILO.
International Monetary Fund (2006) Vietnam: Poverty Reduction Strategy Paper—Annual Progress Report. Washington, DC: IMF.
International Organization for Migration (2000) Combating Trafficking in South-East Asia: A Review of Policy and Programme Responses. Geneva: IOM.
Isenman, P., Wathne, C. And Baudienville, G. (2010) Global Funds: Allocation Strategies and Aid Effectiveness, London: ODI
Islamic Republic of Afghanistan Ministry of Education (2007) ‗National Education Strategic Plan 1385-1389‘. Kabul: Islamic Republic of Afghanistan, Ministry of Education.
Joint UN Programme on HIV/AIDS (2009) Update on the Impact of the Economic Crisis: HIV Prevention and Treatment Programmes. Geneva: UNAIDS.
Joint UN Programme on HIV/AIDS (2010a) Global Report on the Global AIDS Epidemic. Geneva: UNAIDS.
Joint UN Programme on HIV/AIDS (2010b) Children and AIDS. Fifth Stocktaking Report 2010. Geneva: UNAIDS.
Joint UN Programme on HIV/AIDS and World Bank (2009) The Global Economic Crisis and HIV Prevention and Treatment Programmes: Vulnerabilities and Impact. Geneva: UNAIDS.
Jones, A. (2008) ‗Afghanistan on the Educational Road to Access and Equity‘. Asia Pacific Journal of Education 28(3): 277–90.
Jones, N., Moore, K., and Villar-Marquez, E. (2008a) ‗Painful Lessons: The Politics of Preventing Sexual Violence and
Bullying at School‘. London: ODI.
Jones, N., Walsh. C. and Buse, K. (2008b) ‗Gender and Immunisation Abridged Report: A Knowledge Stocktaking Exercise and Independent Assessment of the GAVI Alliance‘. London: ODI.
Jones, N. With Harper, C. And Legins, K. (2010), Turning Crisis into Opportunity for Children Affected by HIV/AIDS: Responding to the Financial, Fuel and Food Crises, London: ODI
Jones, N. and Thi Van Anh, T. (2010) Gendered Risks, Poverty and Vulnerability in Viet Nam: A Case Study of the
National Targeted Programme for Poverty Reduction. London: ODI Jones, N. and Thi Van Anh, T. (2011) The role of social protection in tackling food insecurity and under-nutrition in Viet
Nam, and its gendered dimensions. Overseas Development Institute, London, and Institute of Family and Gender Studies, Hanoi
,Jones, N. and Holmes, R. (2011) ‗After 2015: Developing Social Protection Systems to Promote Child Wellbeing‘.
Thinkpiece, London: ODI
Critical drivers of change for child-sensitive development – Report commissioned by Save the Children UK and UNICEF
77
Jones, N. and Sumner, A, (2011) Child Poverty, Evidence and Policy: Mainstreaming Children in International Development. Bristol: Policy Press.
Jones, N., Presler-Marshall, E., Cooke, N. And Akriminisi, B. 2011, Promoting synergies between child protection and
social protection in Nigeria, London: ODI
Kenny, C. (2011) ‗Getting Better in Pictures‘. Essay, February. Washington, DC: CGD.
Le, T.D., Nguyen, P.N., Tran, M.C., Nguyen, V.T. and Vo, T.S. (2008) ‗Young Lives: Vietnam Round Two Survey‘. Oxford: Young Lives.
Lilley, S., MacVeigh, J., McCormick, C. and Buswell, M. (2011) Too Little, Too Late: Child Protection Funding in Emergencies. Global Protection Cluster on Child Protection Funding in Emergencies. New York: UNICEF.
Mackie, G. and LeJeune, J. (2009) ‗Social Dynamics of Abandonment of Harmful Practices: A New Look at the Theory‘. Special Series on Social Norms and Harmful Practices. Innocenti Working Paper 2009-06. Florence: UNICEF Innocenti Research Centre.
Masud, N. and Yontcheva, B. (2005) Does Foreign Aid Reduce Poverty? Empirical Evidence from Nongovernmental and Bilateral Aid. IMF Working Paper. IMF Institute
Mathur, S., Greene, M. and Malhotra, A. (2003) ‗Too Young to Wed: The Lives, Rights and Health of Young Married Girls‘. New York: ICRW.
Morbidity and Mortality Weekly Report (2010) ‗Global Vaccination Coverage 2010‘. 60(44):1520–22.
Ministry of Finance and Economic Development (2010) Ethiopia 2010 MDGs Report: Trends and Prospects for Meeting MDGs by 2015. Addis Ababa, Government of Ethiopia.
Mehrotra, S. (2004) ‗Improving Child Wellbeing in Developing Countries: What Do We Know? What Can Be Done?‘ Report 9. London: CHIP.
Mehrotra, S. And Jolly, R. (1997) Development with a Human Face. Experiences in Social Achievement and Economic Growth, Oxford: OUP
Meuwese, S. (2003) Kids behind Bars: A Study on Children in Conflict with the Law. Amsterdam: Defence for Children International.
Ministry of Labour, Invalids and Social Affairs, Committee of Ethnic Minorities Affairs and UN Vietnam (2009) ‗Reviewing the Past, Responding to New Challenges: A Mid-term Review of the National Targeted Programme for Poverty Reduction and Programme 135-II, 2006-2008‘. Hanoi: MOLISA.
Mishra, P. and Newhouse, D. (2009) ‗Does health aid matter?‘ Journal of Health Economics 28 (2009) 855–872
Monteiro, C. (2009) ‗The Spectacular Fall of Child Undernutrition in Brazil‘. SCN News 37. www.unscn.org.
Naudeau, S., Kataoka, N., Valerio, A., Neuman, M. and Kennedy Elder, L. (2010) Investing in Young Children. An Early Childhood Development Guide for Policy Dialogue and Project Preparation. Washington DC: World Bank
National Commission for the Protection of Child Rights (2007a) Abolition of Child Labour in India: Strategies for the Eleventh Five Year Plan. New Delhi: NCPCR.
National Commission for the Protection of Child Rights (2007b) ‗Magnitude of Child Labour in India‘. Draft report. New Delhi: NCPCR.
Nguyen, N.P. (2008) ‗Childhood Poverty in Vietnam: A Review‘. Oxford: Young Lives.
Nguyen, P.K. (2009) ‗Viet Nam: Review of Financing of Healthcare, Including Health Promotion‘, in Promoting Sustainable Strategies to Improve Access to Health Care in the Asian and Pacific Region. Bangkok: ESCAP.
Nour, N. (2009) ‗Child Marriage: A Silent Health and Human Rights Issue‘. Obstetrics and Gynecology 2(1): 51–6.
Ocampo, J.A., and Vallejo, J. (2012). ‗Economic Growth, Equity and Human Development in Latin America‘ Journal of Human Development and Capabilities: A Multi-Disciplinary Journal for People-Centered Development, 13:1, 107-133
Organisation for Economic Co-operation and Development (2008) ‗Service Delivery in Fragile Situations: Key Concepts, Findings and Lessons‘. Offprint of Journal on Development 9(3).
Overseas Development Institute (2010a) ‗Bangladesh‘s Progress in Health: Healthy Partnerships and Effective Pro-poor Targeting‘. Development Progress Story. London: ODI.
Critical drivers of change for child-sensitive development - Report commissioned by Save the Children UK and UNICEF
78
Overseas Development Institute (2010b) ‗Lao PDR‘s Progress in Water and Sanitation‘. Development Progress Story. London: ODI.
Overseas Development Institute (2010c) Millennium Development Goals Report Card: Measuring Progress across Countries. London: ODI.
Overseas Development Institute (2010d) ‗Ethiopia‘s Progress in Education: A Rapid and Equitable Expansion of Access‘. Development Progress Story. London: ODI.
Overseas Development Institute (2011a) ‗Social Protection in Brazil: Impacts on Poverty, Inequality and Growth‘. Development Progress Story. London: ODI.
Overseas Development Institute (2011b) ‗Burkina Faso‘s Story: Pipes and People: Progress in Water Supply in Burkina Faso‘s Cities‘. Development Progress Story. London: ODI.
Overseas Development Institute (2011c) ‗Viet Nam‘s Progress on Economic Growth and Poverty Reduction‘. Development Progress Story. London: ODI.
Overseas Development Institute (2011d). Progress in economic conditions: Sustained success against the odds in
Mauritius. London: ODI
Penn, H. (2004) ‗Childcare and Early Childhood Development Programmes and Policies: Their Relationship to Eradicating Child Poverty‘. Working Paper 8. London: CHIP.
Peralta, M.V. (2011) ‗Early Childhood Education and Public Care Policies in Chile: A Historical Perspective to Analyze the Present‘. International Journal of Child Care and Education Policy 5(1): 17–27.
Pinheiro, P.S. (2006) World Report on Violence against Children, United Nations Secretary-General‘s Study on Violence against Children. Geneva: UN.
Pitt, C., Greco, G., Powell-Jackson, A. and Mills, A. (2010) ‗Countdown to 2015: Assessment of Official Development Assistance to Maternal, Newborn, and Child Health, 2003—08‘. The Lancet 376(9751): 1485–96.
Partnership for Maternal, Newborn and Child Health (2011) ‗Kindling Hope in Northern Ethiopia by Keeping Adolescent Girls in School‘. http://www.who.int/pmnch/topics/maternal/ethiopiangirls/en/index.html.
Plan International (2008) Learn without Fear: The Campaign to End Violence in Schools. Woking: Plan International.
Roadmap (2010a) ‗A Road Map for Scaling Up Nutrition (SUN)‘. First Edition, SUN Task Team. www.unscn.org.
Roadmap (2010b) ‗Scaling Up Nutrition: A Framework for Action‘. September. www.unscn.org.
Samady, S.R. (2001) ‗Modern Education in Afghanistan‘. Prospects 31(4): 587–602.
Sanchez-Montero, M. and Salse-Ubach, N. (2010) Undernutrition: What Works? A Review of Policy and Practice. Zero Hunger Phase 1. ACF International Network and Tripode.
Satpathy, A., Sekar, H. and Karan, A. (2010) Rehabilitation of Child Labour: Lessons Learnt from the Evaluation of NCLPs. Noida: V.V. Giri National Labour institute.
Save the Children (2003) Save the Children Policy on Protecting Children from Sexual Abuse and Exploitation. London: Save the Children.
Save the Children (2007) Child Protection in Emergencies: Priorities, Principles and Practices. Stockholm: International Save the Children Alliance.
Save the Children (2009) ‗Rewrite the Future Global Evaluation‘. Afghanistan Mid-term Country Report. Kabul: Save the Children.
Save the Children. (2010a) A Fair Chance at Life: Why Equity Matters for Child Mortality. London: International Save the Children Alliance.
Save the Children (2010b) ‗Child Soldiers – and Other Children Used by Armed forces and Groups‘. Policy Brief. London: Save the Children.
Save the Children (2010c) The Future is Now: Education for Children in Countries Affected by Conflict. London: Save the Children.
Save the Children (2010d) ‗Barriers to Accessing Education in Conflict-Affected Fragile States. Case Study: Afghanistan‘. London: Save the Children.
Critical drivers of change for child-sensitive development – Report commissioned by Save the Children UK and UNICEF
79
Save the Children (2011a) An Equal Start: Why Gender Equality Matters for Child Survival and Maternal Health. London: Save the Children.
Save the Children (2011b) A Life Free From Hunger: Tackling Child Malnutrition. London: Save the Children.
Save the Children (2011c) No Child Out of Reach: Time to End the Health Worker Crisis. London: Save the Children.
Saymen, A.M., Nury, A.T.M.S and Hossain, M.D. (2011) ‗Achieving the Millennium Development Goal for Under-five Mortality in Bangladesh: Current Status and Lessons for Issues and Challenges for Further Improvements‘. Journal of Health, Population and Nutrition 29(2): 92–102.
Skinner, R., and Maher, C. (n.d‘) Child Trafficking and Organized Crime: Where have all the Young Girls Gone?‘ YAPI Resource Paper. www.yapi.org/rpchildtrafficking.pdf.
Socialist Republic of Vietnam (2005) ‗National Target Programme for Rural Water Supply and Sanitation (2006-2010)‘. Hanoi: SRV.
Socialist Republic of Vietnam (2006) ‗The Five-year Socio-Economic Development plan 2006-2010‘. Hanoi: SRV.
Socialist Republic of Vietnam, Australian Agency for International Development, Danish Agency for International Development and Directorate General for International Cooperation, The Netherlands. (2006) ‗Sector Programme Support to Water, Sanitation and Hygiene Promotion Vietnam‘. Hanoi: SRV.
Socialist Republic of Vietnam (2008) ‗Joint Annual Health Review 2008‘. Hanoi: SRV.
Socialist Republic of Vietnam (2009a) ‗Results-based Mid-term Review for Implementation of the Five-year Socio-economic Development Plan 2006-2010‘. Hanoi: SRV.
Socialist Republic of Vietnam (2009b) ‗A Mid-term Review of the National Targeted Programme for Poverty Reduction and Programme 135-II, 2006-2008‘. Hanoi: SRV.
Socialist Republic of Vietnam (2009c) ‗Joint Annual Health Review 2009‘. Hanoi: SRV.
Socialist Republic of Vietnam (2010) ‗Millennium Development Goals 2010 National Report‘. Hanoi: SRV.
Sierra Leone Truth and Reconciliation Commission (2004) Final Report. Freetown: SLTRC.
Solomon, C. and Ginifer, J. (2008) Disarmament, Demobilisation and Reintegration in Sierra Leone. Bradford: Centre for International Cooperation and Security.
Sumner, A. (2010) 'Global Poverty and the New Bottom Billion: Three-quarters of the World's Poor Live in Middle-income Countries'. Working Paper 349, Brighton: IDS.
Suri, T. Boozer, M.A., Ranis, G., Stewart, F., (2011) ‗Paths to Success: The Relationship Between Human Development and Economic Growth‘. World Development, Volume 39, Issue 4, Pages 506-522
Tafere, Y., Abebe, W. and Assazinew, A. (2009) ‗Key Transitions and Welfare of Children in Ethiopia: Country Context Literature Review‘. Technical Note 17. Oxford: Young Lives.
Tinajero, A.R. (2010) ‗Scaling Up Early Childhood Development in Cuba; Cuba‘s Educate Your Child Program, Strategies and Lessons for the Expansion Process‘. Working Paper 16. Washington, DC: Wolfensohn Centre for
Development.
Umayahara, M. (2006) ‗Early Childhood Education Policies in Chile: From Pre-Jomtien to Post-Dakar‘. Background Paper for the Education for All Global Monitoring Report 2007.
Understanding Child Work (2011) Understanding the Brazilian Success in Reducing Child Labour: Empirical Evidence and Policy Lessons. Rome: UCW.
United Nations (1989) United Nations Convention on the Rights of the Child. New York: UN.
United Nations (2010) Resolution adopted by the General Assembly 65/1. Keeping the promise: united to achieve the Millennium Development Goals. United Nations. Retrieved from http://www.un.org/en/mdg/summit2010/documents.shtml, on 12 February 2012.
United Nations (2011) The Millennium Development Goals Report 2011. New York: UN.
UN Children‘s Fund (2002) ‗Birth Registration: Right from the Start‘. Innocenti Digest 9. Florence: UNICEF Innocenti Research Centre.
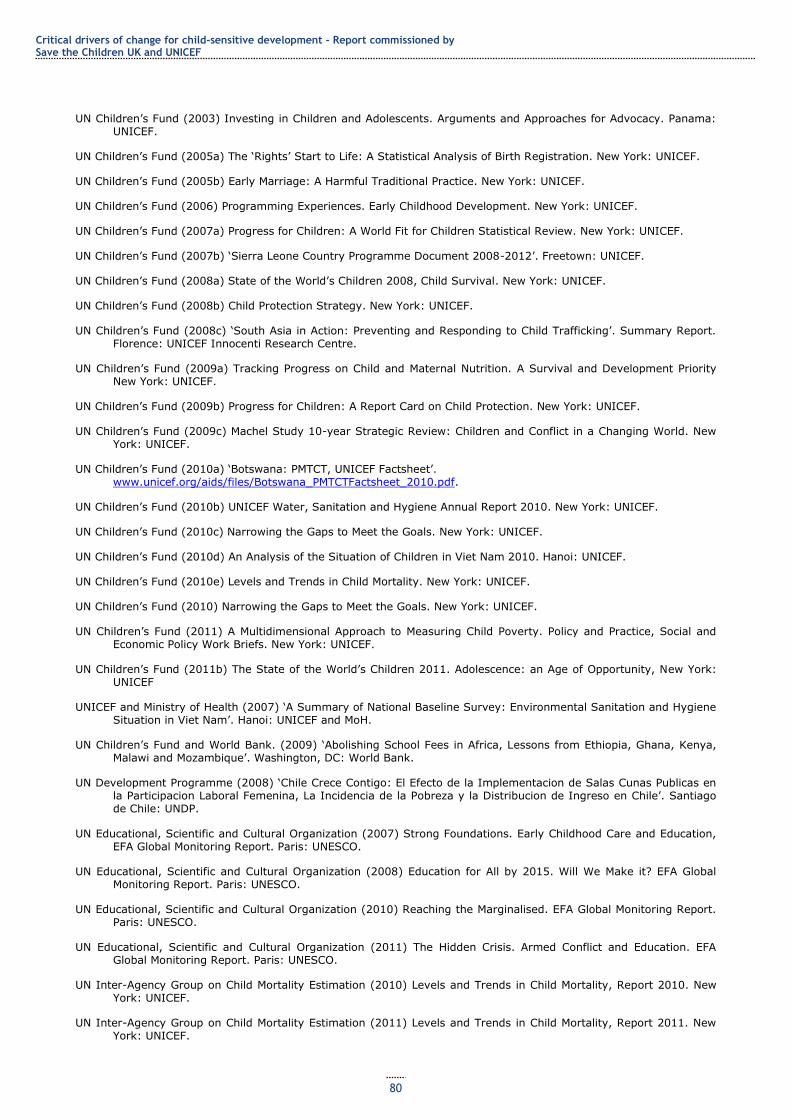
Critical drivers of change for child-sensitive development - Report commissioned by Save the Children UK and UNICEF
80
UN Children‘s Fund (2003) Investing in Children and Adolescents. Arguments and Approaches for Advocacy. Panama: UNICEF.
UN Children‘s Fund (2005a) The ‗Rights‘ Start to Life: A Statistical Analysis of Birth Registration. New York: UNICEF.
UN Children‘s Fund (2005b) Early Marriage: A Harmful Traditional Practice. New York: UNICEF.
UN Children‘s Fund (2006) Programming Experiences. Early Childhood Development. New York: UNICEF.
UN Children‘s Fund (2007a) Progress for Children: A World Fit for Children Statistical Review. New York: UNICEF.
UN Children‘s Fund (2007b) ‗Sierra Leone Country Programme Document 2008-2012‘. Freetown: UNICEF.
UN Children‘s Fund (2008a) State of the World‘s Children 2008, Child Survival. New York: UNICEF.
UN Children‘s Fund (2008b) Child Protection Strategy. New York: UNICEF.
UN Children‘s Fund (2008c) ‗South Asia in Action: Preventing and Responding to Child Trafficking‘. Summary Report. Florence: UNICEF Innocenti Research Centre.
UN Children‘s Fund (2009a) Tracking Progress on Child and Maternal Nutrition. A Survival and Development Priority New York: UNICEF.
UN Children‘s Fund (2009b) Progress for Children: A Report Card on Child Protection. New York: UNICEF.
UN Children‘s Fund (2009c) Machel Study 10-year Strategic Review: Children and Conflict in a Changing World. New York: UNICEF.
UN Children‘s Fund (2010a) ‗Botswana: PMTCT, UNICEF Factsheet‘. www.unicef.org/aids/files/Botswana_PMTCTFactsheet_2010.pdf.
UN Children‘s Fund (2010b) UNICEF Water, Sanitation and Hygiene Annual Report 2010. New York: UNICEF.
UN Children‘s Fund (2010c) Narrowing the Gaps to Meet the Goals. New York: UNICEF.
UN Children‘s Fund (2010d) An Analysis of the Situation of Children in Viet Nam 2010. Hanoi: UNICEF.
UN Children‘s Fund (2010e) Levels and Trends in Child Mortality. New York: UNICEF.
UN Children‘s Fund (2010) Narrowing the Gaps to Meet the Goals. New York: UNICEF.
UN Children‘s Fund (2011) A Multidimensional Approach to Measuring Child Poverty. Policy and Practice, Social and Economic Policy Work Briefs. New York: UNICEF.
UN Children‘s Fund (2011b) The State of the World‘s Children 2011. Adolescence: an Age of Opportunity, New York: UNICEF
UNICEF and Ministry of Health (2007) ‗A Summary of National Baseline Survey: Environmental Sanitation and Hygiene Situation in Viet Nam‘. Hanoi: UNICEF and MoH.
UN Children‘s Fund and World Bank. (2009) ‗Abolishing School Fees in Africa, Lessons from Ethiopia, Ghana, Kenya, Malawi and Mozambique‘. Washington, DC: World Bank.
UN Development Programme (2008) ‗Chile Crece Contigo: El Efecto de la Implementacion de Salas Cunas Publicas en la Participacion Laboral Femenina, La Incidencia de la Pobreza y la Distribucion de Ingreso en Chile‘. Santiago de Chile: UNDP.
UN Educational, Scientific and Cultural Organization (2007) Strong Foundations. Early Childhood Care and Education, EFA Global Monitoring Report. Paris: UNESCO.
UN Educational, Scientific and Cultural Organization (2008) Education for All by 2015. Will We Make it? EFA Global Monitoring Report. Paris: UNESCO.
UN Educational, Scientific and Cultural Organization (2010) Reaching the Marginalised. EFA Global Monitoring Report. Paris: UNESCO.
UN Educational, Scientific and Cultural Organization (2011) The Hidden Crisis. Armed Conflict and Education. EFA Global Monitoring Report. Paris: UNESCO.
UN Inter-Agency Group on Child Mortality Estimation (2010) Levels and Trends in Child Mortality, Report 2010. New York: UNICEF.
UN Inter-Agency Group on Child Mortality Estimation (2011) Levels and Trends in Child Mortality, Report 2011. New York: UNICEF.

Critical drivers of change for child-sensitive development – Report commissioned by Save the Children UK and UNICEF
81
UN Standing Committee on Nutrition (2010) Progress in Nutrition. 6th Report on the World Nutrition Situation. New York: UNSCN.
Urzúa, S. and Veramendi, G. (2011) ‗The Impact of Out-of-home Childcare Centers on Early Childhood Development‘. Working Paper 240. Washington, DC: IADB.
US Department of Labor (2009) 2009 Findings on the Worst Forms of Child Labour: India Country Profile. Washington, DC: US Department of Labor.
Usher, A.D., (2010) ‗GAVI enters its second decade with massive funding gap‘.The Lancet. Volume 375 Issue 9717 Page 791
Vargas-Baron, E. (2009) Going to Scale. Early Childhood Development in Latin America. Washington, DC: RISE Institute.
Veras Soares, F.V. and Silva, E. (2010) ‗Conditional Cash Transfer Programmes and Gender Vulnerabilities, Case Studies of Brazil, Chile and Colombia‘. Working Paper 69. Brasilia: IPC-IG.
Victora, C.G. et al. (2011a) ‗Maternal and Child Health in Brazil: Progress and Challenges‘. The Lancet 377(9780): 1863–76.
Victora, C.G. et al, (2011b) ‗Health Conditions and Health Policy Innovations in Brazil: The Way Forward‘. The Lancet 377(9782): 2042–53.
Vietnamese Academy of Social Sciences (2006) Vietnam Poverty Update Report 2006: Poverty and Poverty Reduction in Vietnam 1993-2004. Hanoi: VASS.
Walton, M. (2009), The Political Economy of India's Malnutrition Puzzle. IDS Bulletin, 40: 16–24
World Bank (2003) ‗Sierra Leone: Strategic Options for Public Sector Reform‘. Report 25110-SL. Washington, DC: World Bank.
World Bank (2005) ‗Vietnam: Managing Public Expenditure for Poverty Reduction and Growth‘. Public Expenditure Review and Integrated Fiduciary Assessment. Hanoi: World Bank.
World Bank (2009a) ‗Country Partnership Strategy Progress Report with the Socialist Republic of Vietnam for the Period FY07–FY11‘. Hanoi: World Bank.
World Bank (2009b) ‗Vietnam Development Report 2010‘. Joint Donor Report to the Vietnam Consultative Group Meeting. Hanoi, 3–4 December.
World Bank (2009c) Country Social Analysis. Ethnicity and Development in Vietnam, Washington DC: World Bank
World Bank (2010) Child & Youth Development Notes IV(1), August.
World Bank (2011) World Development Report 2012: Gender Equality and Development. The International Bank for Reconstruction and Development / The World Bank: Washington DC
World Health Organization (2011a) ‗World Health Statistics‘. Geneva: WHO.
World Health Organization (2011b) The Abuja Declaration: Ten Years On. Geneva: WHO.
World Health Organization (2011c) ‗An Update on WHO‘s Work on Female Genital Mutilation: Progress Report‘. Geneva: WHO.
World Health Organization and UN Children‘s Fund (2010) Progress on Sanitation and Drinking Water, 2010 Update. Geneva: WHO.
World Health Organization and UN Water (2010) UN Water Global Annual Assessment of Sanitation and Drinking Water, Targeting Resources for Better Results. Geneva: WHO.
WHO Commission on Social Determinants of Health (2008) Closing the gap in a generation: health equity through action on the social determinants of health: Final Report of the Commission on Social Determinants of Health. Geneva: World Health Organisation.
Wulczyn, F. Et al (2010) Adapting a Systems Approach to Child Protection: Key Concepts and Considerations, New York: UNICEF
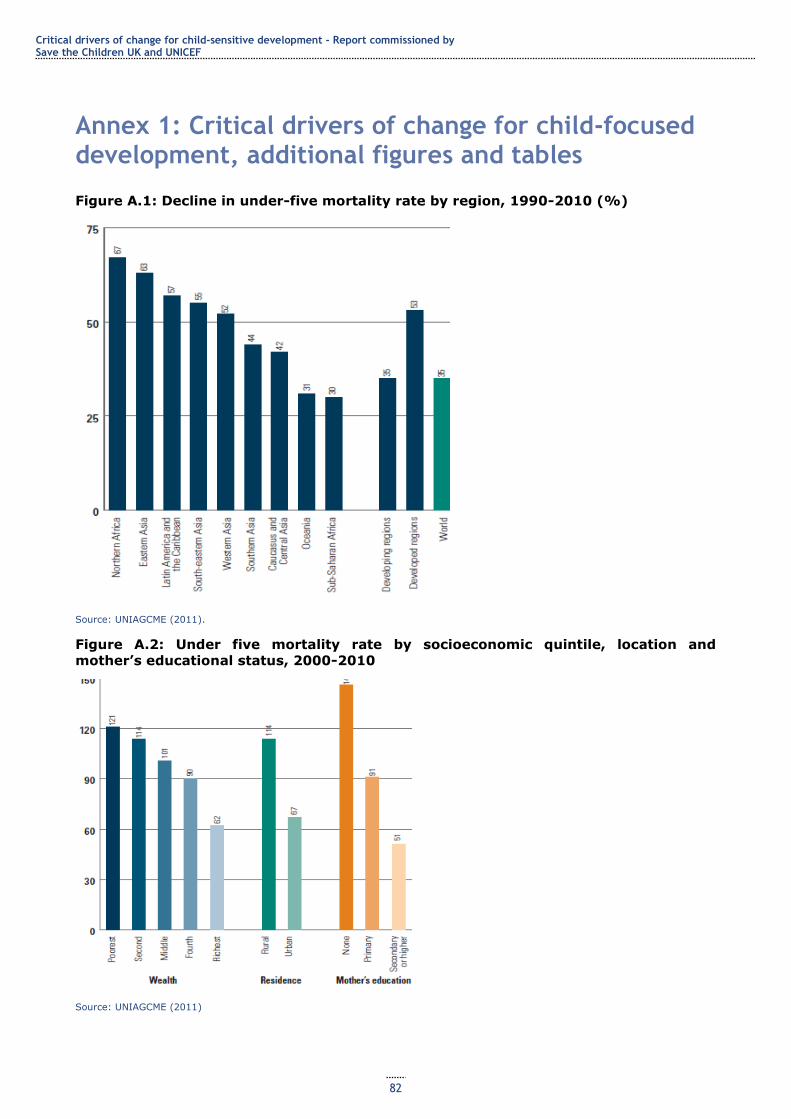
Critical drivers of change for child-sensitive development - Report commissioned by Save the Children UK and UNICEF
82
Annex 1: Critical drivers of change for child-focused development, additional figures and tables
Figure A.1: Decline in under-five mortality rate by region, 1990-2010 (%)
Source: UNIAGCME (2011).
Figure A.2: Under five mortality rate by socioeconomic quintile, location and
mother’s educational status, 2000-2010
Source: UNIAGCME (2011)
Critical drivers of change for child-sensitive development – Report commissioned by Save the Children UK and UNICEF
83
Figure A.3: Countries with significant increases in exclusive breastfeeding of infants
under six months (%)
Source: UNICEF (2009a).
Figure A.4: Targeting of aid for MNCH by income and under-five mortality rate
Source: Greco et al (2010) in Countdown (2010).
Figure A.5: Trends in stunting prevalence in Africa and Asia, and examples of
countries where prevalence has decreased by over 20 percentage points
Source: UNICEF (2009a).
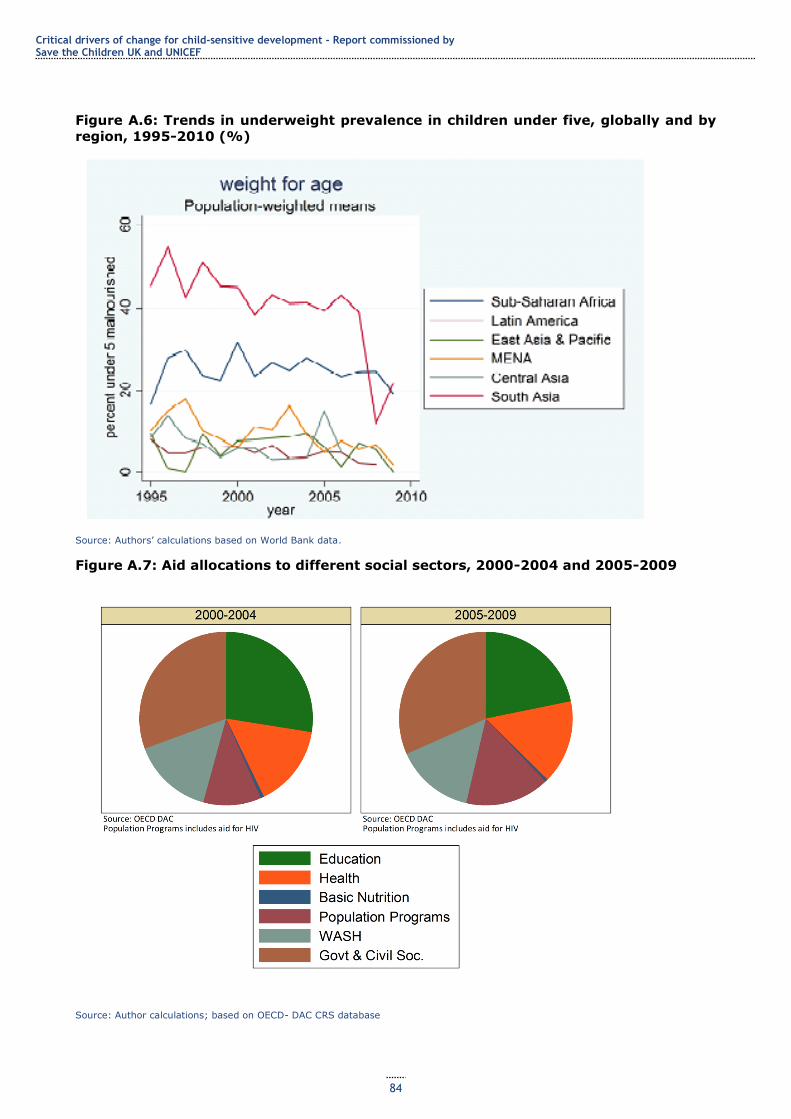
Critical drivers of change for child-sensitive development - Report commissioned by Save the Children UK and UNICEF
84
Figure A.6: Trends in underweight prevalence in children under five, globally and by
region, 1995-2010 (%)
Source: Authors‘ calculations based on World Bank data.
Figure A.7: Aid allocations to different social sectors, 2000-2004 and 2005-2009
Source: Author calculations; based on OECD- DAC CRS database

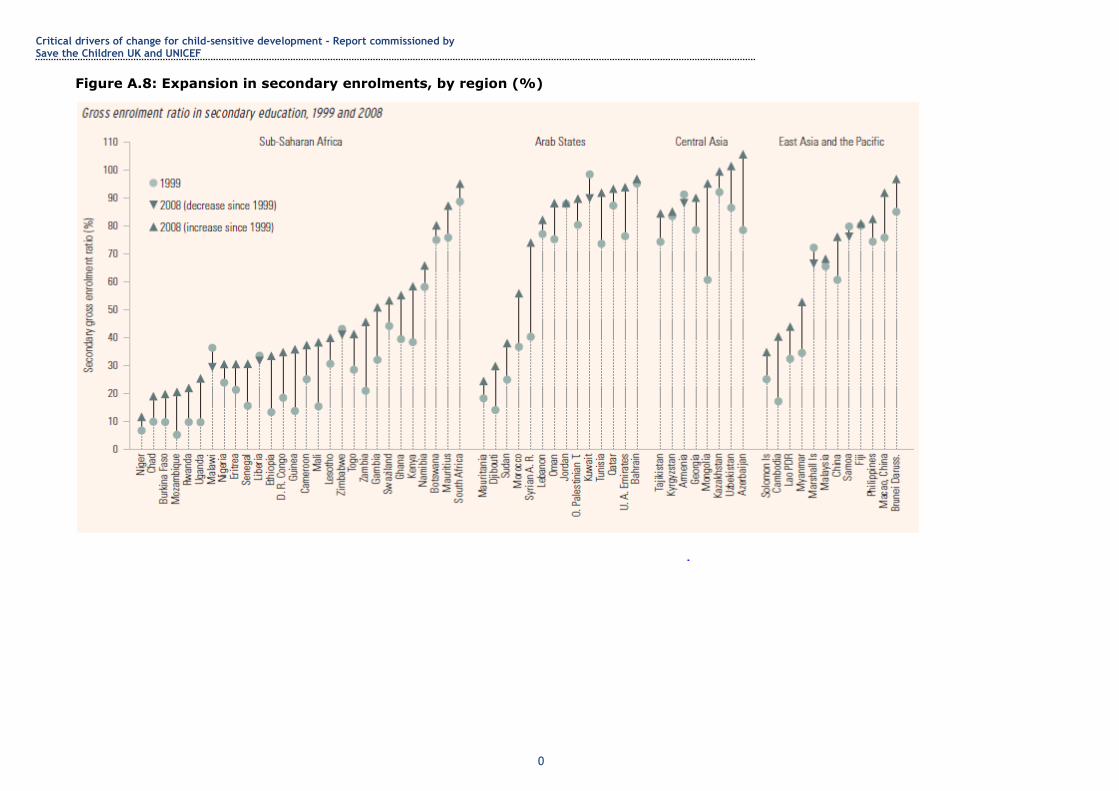
Critical drivers of change for child-sensitive development - Report commissioned by Save the Children UK and UNICEF
0
Figure A.8: Expansion in secondary enrolments, by region (%)
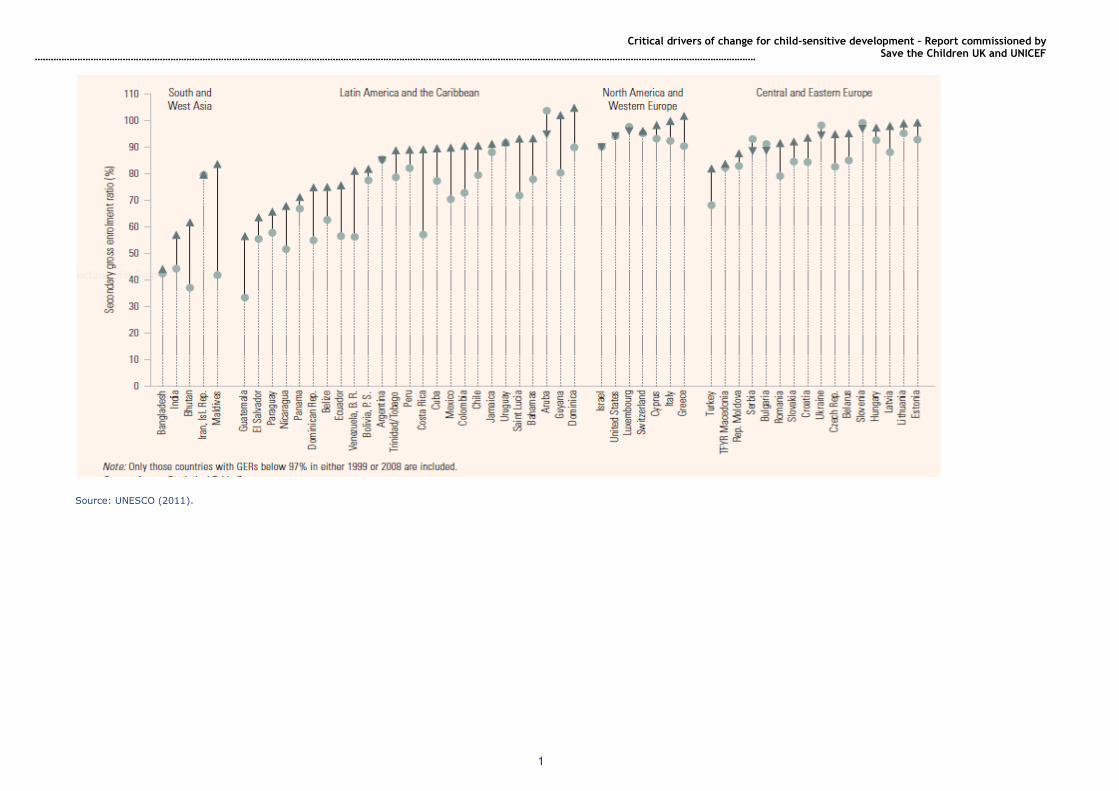
Critical drivers of change for child-sensitive development – Report commissioned by Save the Children UK and UNICEF
1
Source: UNESCO (2011).
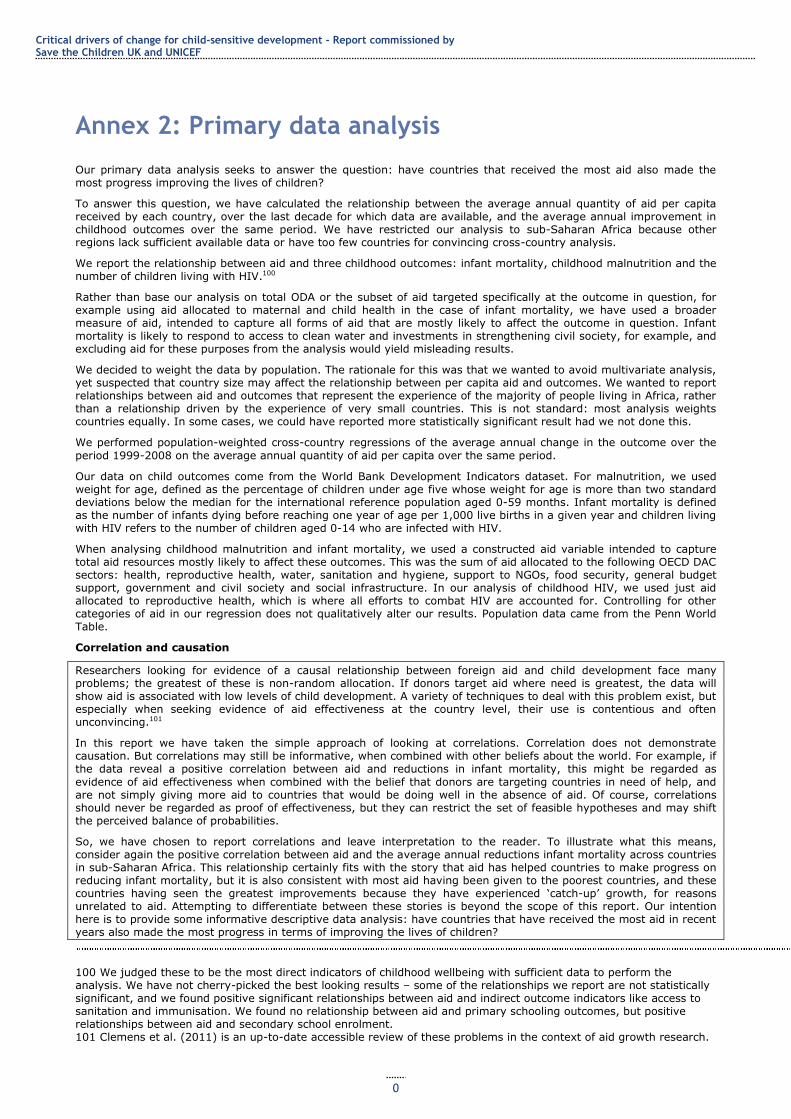
Critical drivers of change for child-sensitive development - Report commissioned by Save the Children UK and UNICEF
0
Annex 2: Primary data analysis
Our primary data analysis seeks to answer the question: have countries that received the most aid also made the most progress improving the lives of children?
To answer this question, we have calculated the relationship between the average annual quantity of aid per capita received by each country, over the last decade for which data are available, and the average annual improvement in childhood outcomes over the same period. We have restricted our analysis to sub-Saharan Africa because other regions lack sufficient available data or have too few countries for convincing cross-country analysis.
We report the relationship between aid and three childhood outcomes: infant mortality, childhood malnutrition and the number of children living with HIV.100
Rather than base our analysis on total ODA or the subset of aid targeted specifically at the outcome in question, for example using aid allocated to maternal and child health in the case of infant mortality, we have used a broader measure of aid, intended to capture all forms of aid that are mostly likely to affect the outcome in question. Infant mortality is likely to respond to access to clean water and investments in strengthening civil society, for example, and excluding aid for these purposes from the analysis would yield misleading results.
We decided to weight the data by population. The rationale for this was that we wanted to avoid multivariate analysis, yet suspected that country size may affect the relationship between per capita aid and outcomes. We wanted to report relationships between aid and outcomes that represent the experience of the majority of people living in Africa, rather than a relationship driven by the experience of very small countries. This is not standard: most analysis weights countries equally. In some cases, we could have reported more statistically significant result had we not done this.
We performed population-weighted cross-country regressions of the average annual change in the outcome over the
period 1999-2008 on the average annual quantity of aid per capita over the same period.
Our data on child outcomes come from the World Bank Development Indicators dataset. For malnutrition, we used weight for age, defined as the percentage of children under age five whose weight for age is more than two standard deviations below the median for the international reference population aged 0-59 months. Infant mortality is defined as the number of infants dying before reaching one year of age per 1,000 live births in a given year and children living with HIV refers to the number of children aged 0-14 who are infected with HIV.
When analysing childhood malnutrition and infant mortality, we used a constructed aid variable intended to capture total aid resources mostly likely to affect these outcomes. This was the sum of aid allocated to the following OECD DAC sectors: health, reproductive health, water, sanitation and hygiene, support to NGOs, food security, general budget support, government and civil society and social infrastructure. In our analysis of childhood HIV, we used just aid allocated to reproductive health, which is where all efforts to combat HIV are accounted for. Controlling for other categories of aid in our regression does not qualitatively alter our results. Population data came from the Penn World Table.
Correlation and causation
Researchers looking for evidence of a causal relationship between foreign aid and child development face many problems; the greatest of these is non-random allocation. If donors target aid where need is greatest, the data will show aid is associated with low levels of child development. A variety of techniques to deal with this problem exist, but especially when seeking evidence of aid effectiveness at the country level, their use is contentious and often unconvincing.101
In this report we have taken the simple approach of looking at correlations. Correlation does not demonstrate causation. But correlations may still be informative, when combined with other beliefs about the world. For example, if the data reveal a positive correlation between aid and reductions in infant mortality, this might be regarded as
evidence of aid effectiveness when combined with the belief that donors are targeting countries in need of help, and are not simply giving more aid to countries that would be doing well in the absence of aid. Of course, correlations should never be regarded as proof of effectiveness, but they can restrict the set of feasible hypotheses and may shift the perceived balance of probabilities.
So, we have chosen to report correlations and leave interpretation to the reader. To illustrate what this means, consider again the positive correlation between aid and the average annual reductions infant mortality across countries in sub-Saharan Africa. This relationship certainly fits with the story that aid has helped countries to make progress on reducing infant mortality, but it is also consistent with most aid having been given to the poorest countries, and these countries having seen the greatest improvements because they have experienced ‗catch-up‘ growth, for reasons unrelated to aid. Attempting to differentiate between these stories is beyond the scope of this report. Our intention here is to provide some informative descriptive data analysis: have countries that have received the most aid in recent years also made the most progress in terms of improving the lives of children?
100 We judged these to be the most direct indicators of childhood wellbeing with sufficient data to perform the analysis. We have not cherry-picked the best looking results – some of the relationships we report are not statistically significant, and we found positive significant relationships between aid and indirect outcome indicators like access to sanitation and immunisation. We found no relationship between aid and primary schooling outcomes, but positive relationships between aid and secondary school enrolment. 101 Clemens et al. (2011) is an up-to-date accessible review of these problems in the context of aid growth research.
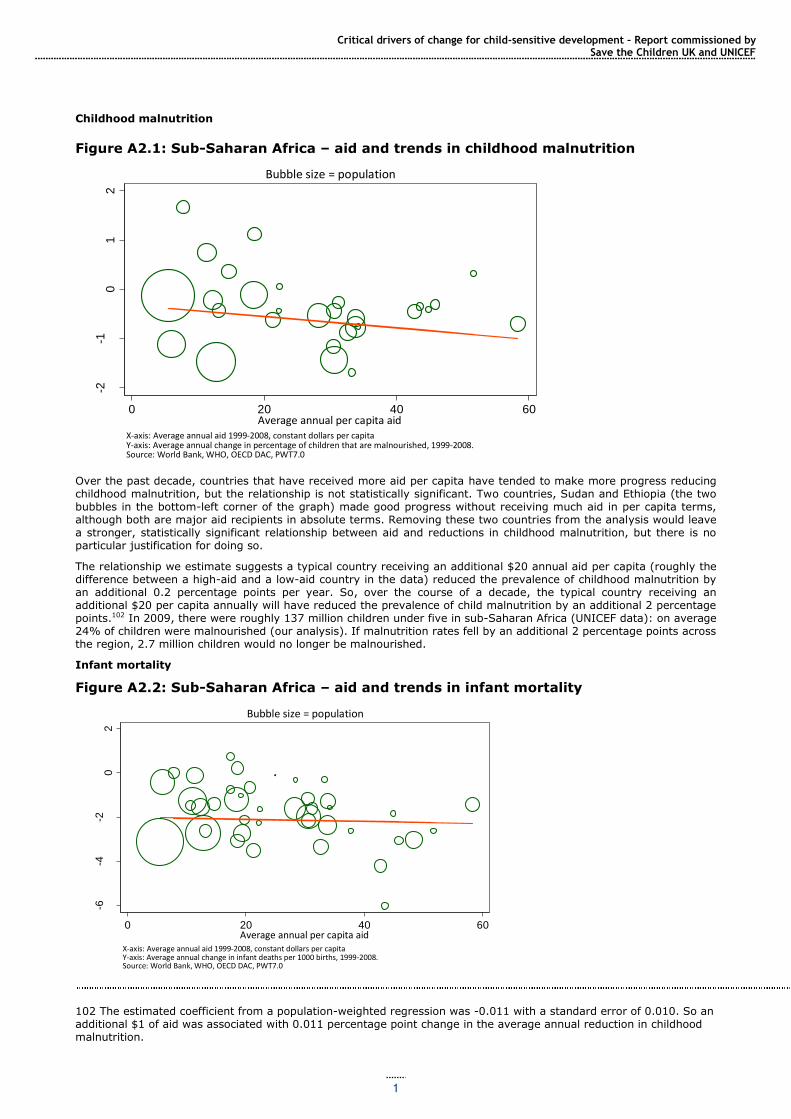
Critical drivers of change for child-sensitive development – Report commissioned by Save the Children UK and UNICEF
1
Childhood malnutrition
Figure A2.1: Sub-Saharan Africa – aid and trends in childhood malnutrition
Over the past decade, countries that have received more aid per capita have tended to make more progress reducing childhood malnutrition, but the relationship is not statistically significant. Two countries, Sudan and Ethiopia (the two bubbles in the bottom-left corner of the graph) made good progress without receiving much aid in per capita terms, although both are major aid recipients in absolute terms. Removing these two countries from the analysis would leave a stronger, statistically significant relationship between aid and reductions in childhood malnutrition, but there is no particular justification for doing so.
The relationship we estimate suggests a typical country receiving an additional $20 annual aid per capita (roughly the difference between a high-aid and a low-aid country in the data) reduced the prevalence of childhood malnutrition by an additional 0.2 percentage points per year. So, over the course of a decade, the typical country receiving an additional $20 per capita annually will have reduced the prevalence of child malnutrition by an additional 2 percentage points.102 In 2009, there were roughly 137 million children under five in sub-Saharan Africa (UNICEF data): on average 24% of children were malnourished (our analysis). If malnutrition rates fell by an additional 2 percentage points across the region, 2.7 million children would no longer be malnourished.
Infant mortality
Figure A2.2: Sub-Saharan Africa – aid and trends in infant mortality
102 The estimated coefficient from a population-weighted regression was -0.011 with a standard error of 0.010. So an additional $1 of aid was associated with 0.011 percentage point change in the average annual reduction in childhood malnutrition.
-2-1
01
2
Ave
rage
An
nu
al C
han
ge
0 20 40 60Average annual per capita aid
X-axis: Average annual aid 1999-2008, constant dollars per capitaY-axis: Average annual change in percentage of children that are malnourished, 1999-2008.Source: World Bank, WHO, OECD DAC, PWT7.0
Bubble size = population
Sub-Saharan Africa: Aid and trends in childhood malnutrition
-6-4
-20
2
Ave
rage
An
nu
al C
han
ge
0 20 40 60Average annual per capita aid
X-axis: Average annual aid 1999-2008, constant dollars per capitaY-axis: Average annual change in infant deaths per 1000 births, 1999-2008.Source: World Bank, WHO, OECD DAC, PWT7.0
Bubble size = population
Sub-Saharan Africa: Aid and trends in infant mortality
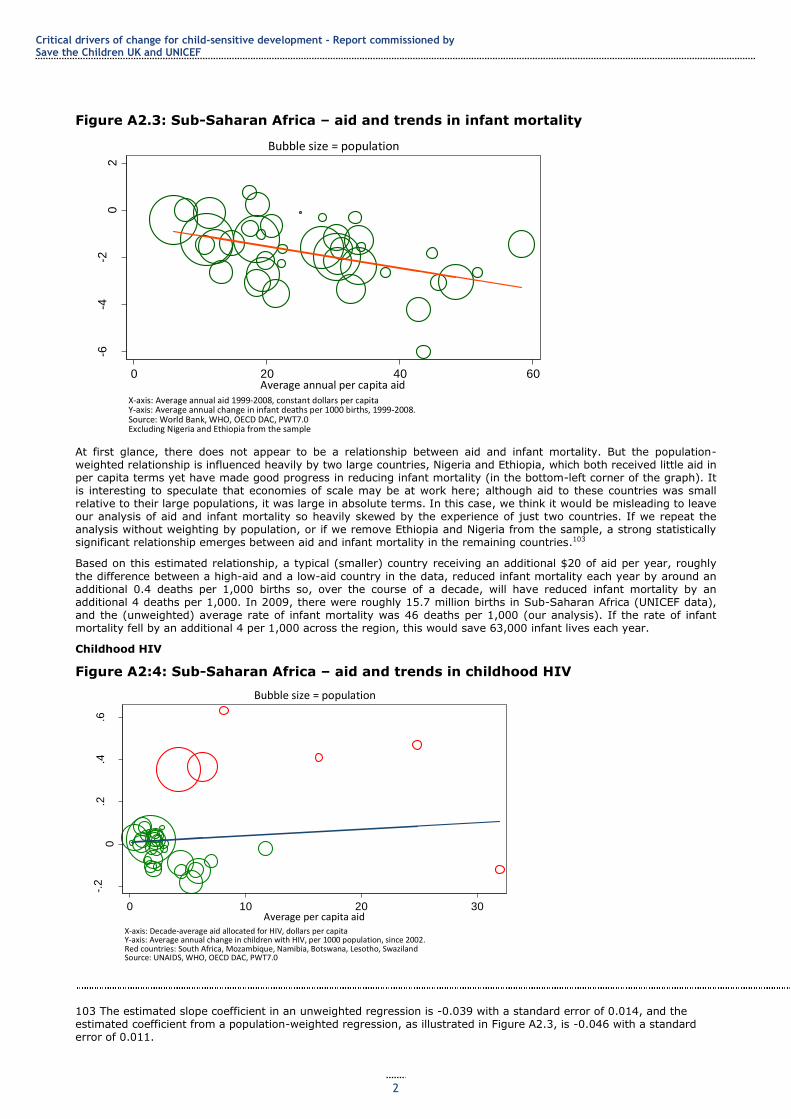
Critical drivers of change for child-sensitive development - Report commissioned by Save the Children UK and UNICEF
2
Figure A2.3: Sub-Saharan Africa – aid and trends in infant mortality
At first glance, there does not appear to be a relationship between aid and infant mortality. But the population-weighted relationship is influenced heavily by two large countries, Nigeria and Ethiopia, which both received little aid in per capita terms yet have made good progress in reducing infant mortality (in the bottom-left corner of the graph). It is interesting to speculate that economies of scale may be at work here; although aid to these countries was small relative to their large populations, it was large in absolute terms. In this case, we think it would be misleading to leave our analysis of aid and infant mortality so heavily skewed by the experience of just two countries. If we repeat the analysis without weighting by population, or if we remove Ethiopia and Nigeria from the sample, a strong statistically significant relationship emerges between aid and infant mortality in the remaining countries.103
Based on this estimated relationship, a typical (smaller) country receiving an additional $20 of aid per year, roughly
the difference between a high-aid and a low-aid country in the data, reduced infant mortality each year by around an additional 0.4 deaths per 1,000 births so, over the course of a decade, will have reduced infant mortality by an additional 4 deaths per 1,000. In 2009, there were roughly 15.7 million births in Sub-Saharan Africa (UNICEF data), and the (unweighted) average rate of infant mortality was 46 deaths per 1,000 (our analysis). If the rate of infant mortality fell by an additional 4 per 1,000 across the region, this would save 63,000 infant lives each year.
Childhood HIV
Figure A2:4: Sub-Saharan Africa – aid and trends in childhood HIV
103 The estimated slope coefficient in an unweighted regression is -0.039 with a standard error of 0.014, and the estimated coefficient from a population-weighted regression, as illustrated in Figure A2.3, is -0.046 with a standard error of 0.011.
-6-4
-20
2
Ave
rage
An
nu
al C
han
ge
0 20 40 60Average annual per capita aid
X-axis: Average annual aid 1999-2008, constant dollars per capitaY-axis: Average annual change in infant deaths per 1000 births, 1999-2008.Source: World Bank, WHO, OECD DAC, PWT7.0Excluding Nigeria and Ethiopia from the sample
Bubble size = population
Sub-Saharan Africa: Aid and trends in infant mortality
-.2
0.2
.4.6
Ave
rage
An
nu
al C
han
ge
0 10 20 30Average per capita aid
X-axis: Decade-average aid allocated for HIV, dollars per capitaY-axis: Average annual change in children with HIV, per 1000 population, since 2002.Red countries: South Africa, Mozambique, Namibia, Botswana, Lesotho, SwazilandSource: UNAIDS, WHO, OECD DAC, PWT7.0
Bubble size = population
Sub-Saharan Africa: Aid and trends in childhood HIV
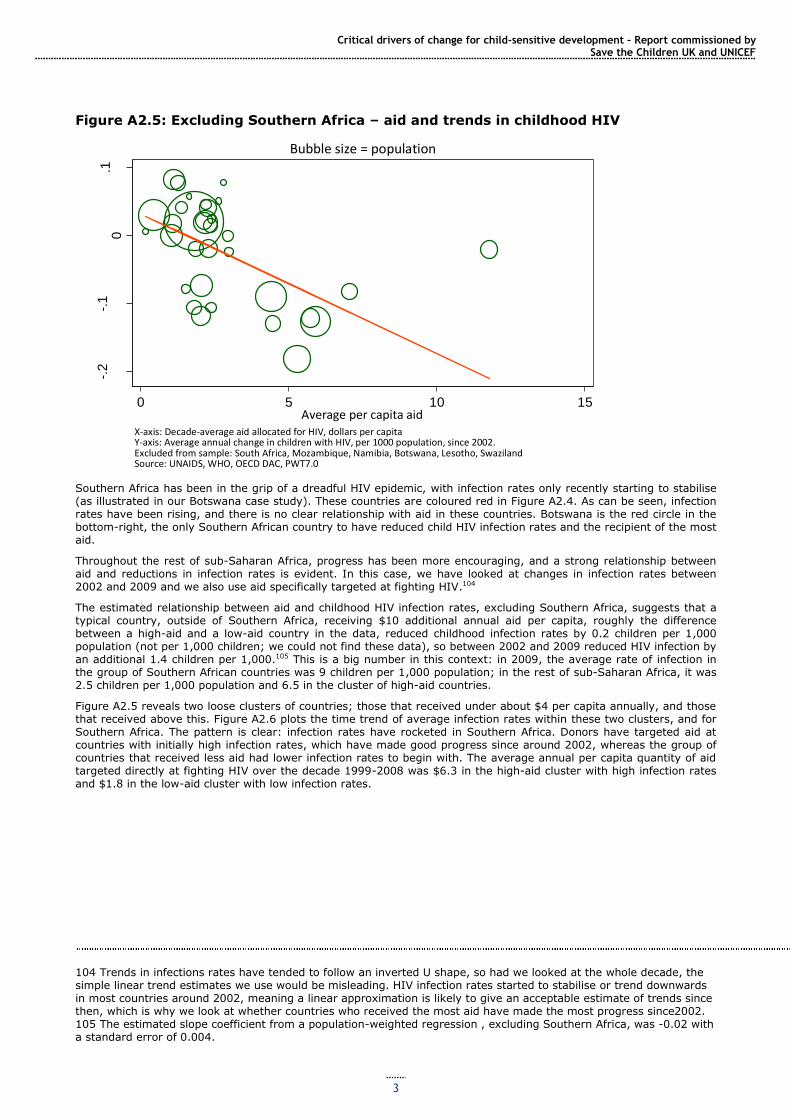
Critical drivers of change for child-sensitive development – Report commissioned by Save the Children UK and UNICEF
3
Figure A2.5: Excluding Southern Africa – aid and trends in childhood HIV
Southern Africa has been in the grip of a dreadful HIV epidemic, with infection rates only recently starting to stabilise (as illustrated in our Botswana case study). These countries are coloured red in Figure A2.4. As can be seen, infection rates have been rising, and there is no clear relationship with aid in these countries. Botswana is the red circle in the bottom-right, the only Southern African country to have reduced child HIV infection rates and the recipient of the most aid.
Throughout the rest of sub-Saharan Africa, progress has been more encouraging, and a strong relationship between aid and reductions in infection rates is evident. In this case, we have looked at changes in infection rates between 2002 and 2009 and we also use aid specifically targeted at fighting HIV.104
The estimated relationship between aid and childhood HIV infection rates, excluding Southern Africa, suggests that a typical country, outside of Southern Africa, receiving $10 additional annual aid per capita, roughly the difference between a high-aid and a low-aid country in the data, reduced childhood infection rates by 0.2 children per 1,000 population (not per 1,000 children; we could not find these data), so between 2002 and 2009 reduced HIV infection by an additional 1.4 children per 1,000.105 This is a big number in this context: in 2009, the average rate of infection in the group of Southern African countries was 9 children per 1,000 population; in the rest of sub-Saharan Africa, it was 2.5 children per 1,000 population and 6.5 in the cluster of high-aid countries.
Figure A2.5 reveals two loose clusters of countries; those that received under about $4 per capita annually, and those that received above this. Figure A2.6 plots the time trend of average infection rates within these two clusters, and for Southern Africa. The pattern is clear: infection rates have rocketed in Southern Africa. Donors have targeted aid at countries with initially high infection rates, which have made good progress since around 2002, whereas the group of countries that received less aid had lower infection rates to begin with. The average annual per capita quantity of aid targeted directly at fighting HIV over the decade 1999-2008 was $6.3 in the high-aid cluster with high infection rates and $1.8 in the low-aid cluster with low infection rates.
104 Trends in infections rates have tended to follow an inverted U shape, so had we looked at the whole decade, the simple linear trend estimates we use would be misleading. HIV infection rates started to stabilise or trend downwards in most countries around 2002, meaning a linear approximation is likely to give an acceptable estimate of trends since then, which is why we look at whether countries who received the most aid have made the most progress since2002. 105 The estimated slope coefficient from a population-weighted regression , excluding Southern Africa, was -0.02 with a standard error of 0.004.
-.2
-.1
0.1
Ave
rage
An
nu
al C
han
ge
0 5 10 15Average per capita aid
X-axis: Decade-average aid allocated for HIV, dollars per capitaY-axis: Average annual change in children with HIV, per 1000 population, since 2002.Excluded from sample: South Africa, Mozambique, Namibia, Botswana, Lesotho, SwazilandSource: UNAIDS, WHO, OECD DAC, PWT7.0
Bubble size = population
Exluding Southern Africa: Aid and trends in childhood HIV
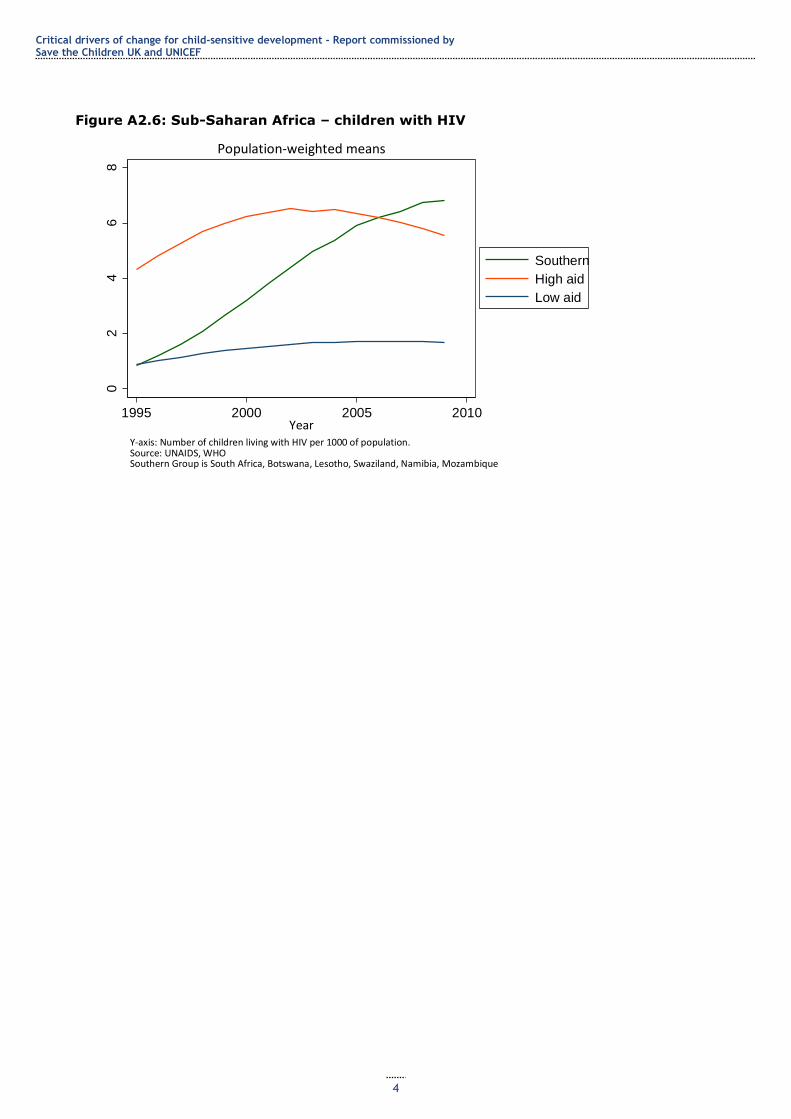
Critical drivers of change for child-sensitive development - Report commissioned by Save the Children UK and UNICEF
4
Figure A2.6: Sub-Saharan Africa – children with HIV
02
46
8
Per
10
00 p
op
ula
tio
n
1995 2000 2005 2010Year
Southern
High aid
Low aid
Y-axis: Number of children living with HIV per 1000 of population.Source: UNAIDS, WHOSouthern Group is South Africa, Botswana, Lesotho, Swaziland, Namibia, Mozambique
Population-weighted means
Sub-Saharan Africa: children with HIV