creation of a new senior gold producer
TRANSCRIPT

CREATION OF A NEW SENIOR GOLD PRODUCER
November 16, 2020
TSX:EDV TSX:TGZ

DISCLAIMER AND FORWARD LOOKING STATEMENTS
This presentation has been prepared solely for information purposes and for use in connection with thecombination (the “Combination”) of Endeavour Mining Corporation (“Endeavour”) and Teranga GoldCorporation (“Teranga”) and does not purport to contain all the information that may be necessary or desirableto fully and accurately evaluate Endeavour, Teranga or the business prospects of the Combination. For thepurposes of this notice, “presentation” includes this document, any oral presentation, any question and answersessions and any written or oral material discussed or distributed by Endeavour or Teranga during any suchpresentation. By attending this presentation or accepting, reading or accessing a copy of this document, youagree to be bound by the limitations, terms and conditions set out below and, in particular, will be taken to haverepresented, warranted and undertaken that you have read and agreed to comply with the contents of thisnotice. Nothing in this presentation should be construed as constituting legal, business, tax or financial advice.Other than in accordance with their respective legal and regulatory obligations, Endeavour and Teranga are notunder any obligation, and they expressly disclaim any intention or obligation, to amend, correct or update thispresentation or to provide the recipient with access to any additional information that may arise in connectionwith it. All information presented or contained in this presentation is subject to verification, correction,completion and change without notice.The presentation contains industry, market and competitive position data which has come from third partysources. Third party industry publications, studies and surveys generally state that the data contained thereinhave been obtained from sources believe to be reliable, but that there is no guarantee of the accuracy orcompleteness of such data. While Endeavour and Teranga believe that each of these publications, studies andsurveys has been prepared by a reliable source, neither Endeavour nor Teranga has independently verified thedata contained therein. Accordingly, undue reliance should not be placed on the industry, market or competitiveposition data contained in this presentation.
FORWARD LOOKING INFORMATION
This document contains statements which constitute “forward-looking information” within the meaning ofapplicable securities laws, including statements regarding the plans, intentions, beliefs and current expectationsof Endeavour and Teranga with respect to future business activities and operating performance. Forward-looking information is often identified by the words “may”, “would”, “could”, “should”, “will”, “intend”, “plan”,“anticipate”, “believe”, “estimate”, “expect” or similar expressions and include information regarding: (i)expectations regarding whether the proposed Combination will be consummated, including whether conditionsto the consummation of the Combination will be satisfied, or the timing for completing the Combination, (ii)expectations regarding the initial dividend and the Company’s future dividend policy and the effects thereof, (iii)expectations for the effects of the Combination or the ability of the combined company to successfully achievebusiness objectives, including integrating the companies or the effects of unexpected costs, liabilities or delays,(iv) the potential benefits and synergies of the Combination and (v) expectations for other economic, business,and/or competitive factors.Investors are cautioned that forward-looking information is not based on historical facts but instead reflectEndeavour’s and Teranga’s respective management’s expectations, estimates or projections concerning futureresults or events based on the opinions, assumptions and estimates of management considered reasonable atthe date the statements are made. Although Endeavour and Teranga believe that the expectations reflected insuch forward-looking information are reasonable, such information involves risks and uncertainties, and unduereliance should not be placed on such information, as unknown or unpredictable factors could have materialadverse effects on future results, performance or achievements of the combined company. Among the keyfactors that could cause actual results to differ materially from those projected in the forward-lookinginformation are the following: the ability to consummate the Combination; the ability to obtain requisiteregulatory and shareholder approvals and the satisfaction of other conditions to the consummation of theCombination on the proposed terms and schedule; the ability of Endeavour and Teranga to successfullyintegrate their respective operations and employees and realize synergies and cost savings at the times, and to
the extent, anticipated; the potential impact on exploration activities; the potential impact of theannouncement or consummation of the Combination on relationships, including with regulatory bodies,employees, suppliers, customers and competitors; the re-rating potential following the consummation of theCombination; changes in general economic, business and political conditions, including changes in the financialmarkets; changes in applicable laws; compliance with extensive government regulation; and the diversion ofmanagement time on the Combination. This forward-looking information may be affected by risks anduncertainties in the business of Endeavour and Teranga and market conditions. This information is qualified inits entirety by cautionary statements and risk factor disclosure contained in filings made by Endeavour andTeranga with the Canadian securities regulators, including Endeavour’s and Teranga’s respective annualinformation form, financial statements and related MD&A for the financial year ended December 31, 2019 filedwith the securities regulatory authorities in certain provinces of Canada and available at www.sedar.com.Should one or more of these risks or uncertainties materialize, or should assumptions underlying the forward-looking information prove incorrect, actual results may vary materially from those described herein as intended,planned, anticipated, believed, estimated or expected. Although Endeavour and Teranga have attempted toidentify important risks, uncertainties and factors which could cause actual results to differ materially, theremay be others that cause results not to be as anticipated, estimated or intended. Endeavour and Teranga do notintend, and do not assume any obligation, to update this forward-looking information except as otherwiserequired by applicable law.
ENDEAVOUR QUALIFIED PERSON
Clinton Bennett, Endeavour's Vice-President of Metallurgy and Process Improvement - a Fellow of theAustralasian Institute of Mining and Metallurgy, is a "Qualified Person" as defined by National Instrument 43-101 - Standards of Disclosure for Mineral Projects ("NI 43-101") and has reviewed and approved the technicalinformation in this news release related to Endeavour.
TERANGA QUALIFIED PERSON
Stephen Ling, P.Eng., who is a member of the Professional Engineers Ontario, is Teranga’s Director of TechnicalServices. Mr. Ling is a "Qualified Person" under NI 43-101 Standards of Disclosure for Mineral Projects. Mr. Linghas consented to the inclusion in this document of the matters based on his compiled information in the formand context in which it appears in this document related to Teranga.
NON IFRS MEASURESThe information in this news release includes the following non-IFRS financial measures: all-in sustaining costsper ounce of gold sold (“AISC)”, cash costs per ounce of gold sold, and free cash flow. These financial measuresdo not have any standardized meaning prescribed by IFRS and are therefore unlikely to be comparable to similarmeasures presented by other issuers, even as compared to other issuers who may also be applying the WorldGold Council (“WGC) “ guidelines, which can be found at http://www.gold.org. Management of Endeavour andTeranga believe that the use of these non-IFRS measures will assist analysts, investors and other stakeholders ofthe companies in understanding the costs associated with producing gold, understanding the economics of goldmining, assessing the companies’ operating performance, the combined company’s ability to generate free cashflow from current operations and to generate free cash flow on an overall company basis, and for planning andforecasting of future periods. However, AISC does have limitations as an analytical tool as it may be influencedby the point in the life cycle of a specific mine and the level of additional exploration or expenditures a companyhas to make to fully develop its properties. Accordingly, these non-IFRS measures should not be considered inisolation, or as a substitute for, analysis of the companies; results as reported under IFRS. A reconciliation ofcertain the non-IFRS measures presented in this news release is contained in Endeavour’s most recently filedannual MD&A, which is available on SEDAR at www.sedar.comAll $ amounts in US dollars, unless specified

COMBINATION CREATES A NEW SENIOR GOLD PRODUCER
3
Compelling industrial and capital markets rationale
Compelling
industrial logicCreates a new top 10
senior gold producer
Strong re-rating
potential
Highly complementary assets
Increases quality of portfolio
Potential to realize significant synergies
Diversified across 6 coremines in 3 countries
Industry-leading growth pipeline of 6 projects
Largest West African exploration portfolio
Attractive valuation relative to senior gold peer group
Enhanced capital markets profile, creating largest LSE Premium
listed pure gold producer
Strong cash flow androbust balance sheet
Ability to pay sustainable dividends
Production of +1.5Moz per year with industry-low costsEnhances strategic position

4
COMPELLING INDUSTRIAL LOGICEnhances strategic position with ability to leverage Endeavour operating model
1. Production based on 2021E Street consensus estimates for Endeavour and Teranga2. AISC based on 2021E average Street consensus estimates for Endeavour and Teranga combined3. Reserves & Resources on 100% basis (resources are inclusive of reserves)
18MozP&P Reserves3
33MozM&I Resources3
+1.5MozAnnual Gold Production1
Top 10Global Gold Producer
Diversified across 8 producing mines in
3 countries
<$900/ozAll-in Sustaining Costs2
Combined entity operating mines
Combined entity development projects
Combined entity exploration assets
Birimian Greenstone

HIGHLY COMPLEMENTARY ASSETS
5
Offers potential to realize significant operating and capital synergies
SABODALA-MASSAWA COMPLEX, SENEGAL
GOLDEN HILL PROJECT,BURKINA FASO
WAHGNION MINE, BURKINA FASO
› Potential to become Endeavour’s flagship operation with ~400koz in annual gold production, low costs and long mine life
› Diversification with a new operating platform in Senegal
› Leverages Endeavour’s proven track record of project development to maximize the value of the asset
› Further strengthens the overall portfolio with immediate production and cash flow
› Bolt-on asset benefiting from the established in-country presence in Burkina Faso
› Located within trucking distance of Endeavour’s Houndé mine and infrastructure
› Potential synergies through development as a satellite operation

47%
22%
10%
21%
$550
$600
$650
$700
$750
$800
$850
$900
$950
$1,000
$1,050
$1,100
$1,150
$1,200
0 5 10 15 20
41%
20%
11%
27%
6
Diversified across six core mines in three countries
Karma
Boungou
Combined Entity Producing Portfolio1
Mine life, years
AISC, $/oz
1) Production and AISC based on 2020 guidance (mid-point) except for Sabodala-Massawa based on 5 year average from PFS (July 2020); Ity & Hounde based on 5 year average (2021-2025) from updated LOM plan (November 2020) Mine lives calculated as reserves divided by contained gold produced using 2019 stated recovery per mine except for Ity, Houndé and Sabodala-Massawa; Size of the circle represents annual production 2) Based on 2021 street consensus estimates. 3) Based on Teranga 2020E guidance (mid-point). 4) Reserves & Resources on 100% basis (resources are inclusive of reserves)
Côte d'Ivoire
Mali
Senegal
Burkina Faso
18MozReserves4
Diversified across multiple mines and countries
+1.5Moz2
Production
Mana
Sabodala / Massawa(2020E)3
Ity
Sabodala / Massawa
(2021-2025)
Agbaou
Houndé
Wahgnion
33MozM&I4
56%
22%
22%
CREATES A HIGH QUALITY PORTFOLIO

POTENTIAL FOR SIGNIFICANT SYNERGIES
7
Ability to leverage a strong integration platform already in place
11
7
3 4
2
8
10
9
5
1
6
Mana
Hounde
Creates a world class mining district for Endeavour with three mines and 2 projects
Houndé Belt, Burkina Faso
Yaramoko mine (Roxgold)
Comidok (IAMGOLD)Central Hounde(Barrick, Thor)
Pinarello (Barrick)
Mana (Endeavour) Konkolikan (Barrick) Bondi (Sarama) S. Hounde (Sarama)
Hounde (Endeavour) Golden Hill (Teranga) Bantou (Endeavour) Wahgnion (Teranga)
1
5
6
7
8
9
2
3
4 10
11
Bantou
Golden Hill
Wahgnion12
12
CORPORATE SYNERGIES
› Leverage recent SEMAFO integration
› Team ready to rapidly overlay Endeavour management model
› Clear path to G&A cost savings
REGIONAL / MINE SITE SYNERGIES
› Benefits of being the largest gold producer in Senegal, Burkina Faso and Côte d'Ivoire
› Existing Burkina Faso platform to support Wahgnion and Golden Hill
› Mining fleet and processing flowsheet optimization
› Procurement and supply chain
› Leverage centralized support services
› Golden Hill as Houndé satellite project
INTEGRATION PLATFORM
› Ability to leverage a strong integration platform already in place
› Following SEMAFO acquisition, Endeavour completed a comprehensive evaluation of its organizational structure and capabilities, with a view to ensuring it is well positioned for future growth

Production for Senior Gold Producers
8
CREATES A TOP 10 SENIOR GOLD PRODUCERAbility to meet investment hurdles of larger funds
Top 10Global gold producer
+1.5MozAnnual production
Sources: Company filings, equity research analyst estimates2021E Gold production based on average 2021 fiscal year estimates published by equity research analysts. Combined Entity based on analyst estimates for Endeavour and Teranga.
1Moz
2Moz
4Moz
3Moz
5Moz
6Moz
7Moz
New
mo
nt
Bar
rick
An
glo
Go
ld
Po
lyu
s
Go
ld F
ield
s
Kin
ross
Agn
ico
-Eag
le
New
cres
t
Har
mo
ny
Co
mb
ine
d E
nti
ty
No
rth
ern
Sta
r
Yam
ana
Kir
klan
d
Po
lym
etal
End
eavo
ur
B2
Go
ld
Tera
nga
Based on 2021 estimates as per analyst consensus

9
LOW COSTproducer
<$900/oz
AISC FOR 2021
AISC for Senior Gold Producers
INDUSTRY-LOW PRODUCTION COSTSAmongst the lowest AISC within the senior gold producer peer group
$1,100/oz
$900/oz
$1,300/oz
$200/oz
$800/oz
$1,000/oz
$1,200/oz
Agn
ico
-Eag
le
No
rth
ern
Sta
r
Go
ld F
ield
s
Po
lym
etal
An
glo
Go
ld
Co
mb
ine
d E
nti
ty
New
cres
t
Kir
klan
d
B2
Go
ld
Po
lyu
s
Kin
ross
Yam
ana
Bar
rick
New
mo
nt
Har
mo
ny
Based on 2021 estimates as per analyst consensus
Sources: Company filings, equity research analyst estimates2021E AISC based on average 2021 fiscal year estimates published by equity research analysts. Combined Entity based on analyst estimates for Endeavour and Teranga. Harmony AISC represents fiscal year 2020

10
INDUSTRY-LEADING DEVELOPMENT PIPELINEStrong exposure across the full mining phases
NEAR-TERM GROWTHFROM PROJECTS
LONG-TERM UPSIDEFROM GREENFIELD EXPLORATION
IMMEDIATE CASH FLOWFROM PRODUCTION
Kofi TrendMali
Daoukro ClusterCôte d’Ivoire
Mt. Ba/GueyaCôte d’Ivoire
SiguiriGuinea
LiptakoNiger
TiepleuIty trend
FougadianMali
Deep AgbaouCôte d’Ivoire
LiguidiBurkina Faso
Barrick JVCôte d’Ivoire
Sia/SianikouHoundé Trend
Bondoukou ClusterCôte d’Ivoire Nabanga
Burkina Faso
Golden HillBurkina Faso
BantouBurkina Faso
FetekroCôte d’Ivoire
KalanaMali
Wahgnion Karma
Houndé Mana
Ity Agbaou
Sabodala-Massawa Boungou
AfemaCôte d’Ivoire
MininvestCôte d’Ivoire

INSIGHTS
› The combined entity will benefit from a very robust balance sheet with $279m of net debt and a net debt/LTM EBITDA ratio of 0.3x on a pro forma basis as of September 30, 20201
› The combined entity expects to be in a net cash position by mid-2021 based on current gold prices
› La Mancha commits to invest $200m in support of combination to further strengthen the balance sheet
› As part of the combination, an up to $800m refinancing has been arranged which would materially lower financing costs and offer a clean and simple debt structure
› The refinancing of Endeavour’s existing debt as well as Teranga’s higher cost debt is expected to save the pro forma company approximately $40m per year over the next several years
11
Based on Current Reported Net Debt / LTM EBITDA2
Top Producers Leverage
(1.0x)
0.0x
1.0x
2.0x
New
cres
t
Po
lym
etal
Yam
ana
Kir
klan
d
Agn
ico
-Eag
le
An
glo
Go
ld
Po
lyu
s
Go
ld F
ield
s
Har
mo
ny
Kin
ross
New
mo
nt
Co
mb
ine
d E
nti
ty
No
rth
ern
Sta
r
Bar
rick
B2
Go
ld
Ability to pay attractive dividends and fund growth
STRONG BALANCE SHEET
Sources: Company disclosures, Capital IQ1. Pro forma based on latest available public information, net of the proposed $200M La Mancha investment and gold bullion unsold as of 30 September 2020 at Teranga (valued at $39M as per Teranga Q3-2020 MD&A). Pro forma LTM EBITDA as of 30 September 2020 of $867M 2. Net Debt based on latest available public information / LTM EBITDA as per CapIQ

ATTRACTIVE SUSTAINABLE DIVIDEND POLICY
12
First dividend sets path to sustainable dividend policy from transaction close
Sources: Company Filings, Capital IQ, Equity research estimates1. DPS 2020E figures for peers sourced from CapIQ as at 13 November divided by share price as at 13 November 2020 2. Based on latest quarterly dividend declared and annualised
2020E Annual Dividend Yields of Top Gold Producers1
› The first dividend, declared by Endeavour on November 12, 2020, sets the path to a sustainable dividend policy
› Endeavour’s first dividend of $60m for the 2020 fiscal year, payable in early Q1-2021 to Endeavour shareholders at a record date, to be set before the Transaction close
› Represents a 1.6% yield based on the Endeavour closing price on November 11, 2020
› Following the payment of this first dividend, Endeavour expects to declare future dividends on a semi-annual basis, with the goal of maintaining a similar dividend yield until it has reached a targeted net cash position of $250m
› Once that target is reached, Endeavour will be in a position to re-assess its capital allocation priorities, which may include augmenting its shareholder return program
Sustainable Dividend
5.9
%
3.6
%
2.2
%
2.0
%
1.8
%
1.7
%
1.7
%
1.6
%
1.5
%
1.4
%
1.4
%
1.3
%
1.2
%
1.2
%
1.2
%
Go
ld F
ield
s
Po
lym
etal
B2
Go
ld
Po
lyu
s
Har
mo
ny
Ne
wm
on
t
No
rth
ern
Sta
r
Co
mb
ine
d e
nti
ty
Kin
ross
An
glo
Go
ld
Kir
klan
d
Agn
ico
-Eag
le
Bar
rick
Yam
ana
Ne
wcr
est2

SIGNIFICANT RE-RATING POTENTIAL
13
Attractive valuation compared to senior gold producer peer group
P / NAV EV/ EBITDA 2021E FCF Yield 2021E
Sources: Company Filings, Capital IQ, Broker ResearchFCF 2021, EBITDA 2021, NAV estimates for peers sourced from CapitalIQ as of November 13, 2020. Combined Entity based on average of equity research analyst estimates for both Endeavour and Teranga
29%
19%
14%
12%
12%
11%
11%
9%
8%
8%
8%
6%
6%
4%
4%
Harmony
Gold Fields
Yamana
Combined Entity
AngloGold
Kirkland
B2 Gold
Kinross
Newmont
Polymetal
Polyus
Barrick
Northern Star
Newcrest
Agnico-Eagle
2.2x
3.3x
3.5x
3.8x
3.9x
4.6x
4.9x
5.1x
6.0x
6.0x
6.7x
7.0x
7.1x
7.3x
7.4x
Yamana
Harmony
Combined Entity
Gold Fields
Kirkland
AngloGold
Kinross
B2 Gold
Polymetal
Northern Star
Newmont
Barrick
Agnico-Eagle
Newcrest
Polyus
0.7x
0.8x
0.8x
1.0x
1.0x
1.0x
1.1x
1.1x
1.2x
1.3x
1.4x
1.4x
1.4x
1.5x
1.5x
Yamana
Newcrest
Harmony
B2 Gold
Kinross
AngloGold
Combined Entity
Polymetal
Polyus
Gold Fields
Northern Star
Newmont
Barrick
Kirkland
Agnico-Eagle

Production for London Stock Exchange listed gold producers1
14
POTENTIAL TO CREATE TOP LSE PREMIUM LISTED GOLD PRODUCERTargeting entry into the FTSE-100
STRONG INDEX
DEMAND EXPECTED
Sources: Company filings, equity research analyst estimates1. Precious metals focused producers. Gold and gold equivalent production based on average 2021 fiscal year estimates published by equity research analysts, where available, and 2020 company guidance. Combined Entity based on analyst estimates for Endeavour and Teranga.
0.0Moz
0.5Moz
1.0Moz
1.5Moz
2.0Moz
2.5Moz
3.0Moz
Po
lyu
s
Co
mb
ine
d E
nti
ty
Yam
ana
Silver in gold equivalent
Po
lym
etal
Ho
chsc
hild
Cen
tam
in
Pet
rop
avlo
vsk
Fres
nill
oGold
Res
olu
te
Hig
hla
nd
Go
ld
Pan
Afr
ican
Hu
mm
ingb
ird
Shan
ta G
old
Ch
aara
tG
old
Premium Segment Standard Segment AIMTARGETING
FTSE 100 INDEX

~24%
76%
La Mancha
~33%
67%
Tablo + Barrick Gold
STRONG SUPPORT FROM CORNERSTONE SHAREHOLDERS
(1) Includes $200M La Mancha investment 15
Backed by shareholders with strong track records in West Africa
› The major shareholders of both companies strongly support the transaction
› Voting support agreements have been received from Teranga’s largest shareholders, Tablo Corporation and Barrick Gold and from Endeavour’s largest shareholder, La Mancha
› La Mancha has a long track record of investing successfully in Africa, present across various sectors ranging from construction and fertilizers to real estate and telecommunications, in addition to the gold mining industry
› Mr. Mimran, owner of Tablo, is the president of Groupe Mimran, one of the leading agri-food groups in West Africa. Historically, Groupe Mimran was the largest private sector employer in both Senegal and Côte d’Ivoire. He is also Special Advisor to the government of the Republic of Côte d'Ivoire
CORNERSTONE SHAREHOLDERS
19%
7%4%70%
La Mancha Tablo Barrick Other
Combined Entity1

STRONG BENEFITS FOR BOTH SETS OF SHAREHOLDERS
16
Significant opportunity to create value
BENEFITS FOR TERANGA SHAREHOLDERS
› Increased geographical and operational diversification
› Sabodala-Massawa becomes the flagship mine (>400kozpa at AISC <$700 AISC)
› Immediate cash flow generation from Wahgnion with high exploration potential
› Golden Hill as a potential satellite operation for Houndé
› Strong economic rationale for acquisition
› Lock-in share price appreciation and re-rating since Massawa acquisition
› Operational, geographic and financial diversification during Sabodala-
Massawa ramp-up period
› Significantly enhanced growth optionality
› Stronger cash flows following refinancing of higher cost debt
› Benefits of Endeavour’s strong track record of value creation and project
delivery
› Creates a Top 10 global gold producer with +1.5Moz of gold production
per year at low AISC
› Balanced contribution by both companies to the combined entity’s value
› Strong cash flows and healthy balance sheet to fund attractive dividends
and growth, whilst building a strong net cash position in 2021
› Robust balance sheet targeting a net cash position starting with a maiden
dividend of $60m to Endeavour’s shareholders in Q1 2021
› Scale and liquidity to attract generalist investors with combined market
capitalization of ~$6 billion2 and attractive valuation relative to peer
group
› Both Endeavour and Teranga shareholders to benefit from potential re-
rating driven by attractive valuation metrics versus peers, underpinned
by sustainable dividend policy and 2021 LSE listing, targeting FTSE 100
inclusion
› Strong support from three cornerstone investors: La Mancha, Tablo and
Barrick Gold
BENEFITS FOR ENDEAVOUR SHAREHOLDERS1 BENEFITS FOR BOTH COMPANIES’ SHAREHOLDERS
1. Accretion / dilution as per broker consensus estimates at 0.470 Exchange Ratio and taking into account the initial Endeavour dividend for the purposes of NAV accretion; shares outstanding as per latest disclosure and Teranga’s in-the-money dilutive securities; not taking into account of any synergies
2. Market capitalizations of Endeavour and Teranga using fully diluted in-the-money number of shares, closing share prices on the TSX as at 13 November 2020 and US$/C$ exchange rate of 1.3161 and including the proposed La Mancha investment of $200 million
Accretion / Dilution1
6%0% -1%
18%
0% 3%
17%
NAV CFPS 2021 CFPS 2022 CFPS 2023 EPS 2021 EPS 2022 EPS 2023

Create a resilient business
Reward shareholders
Be thepartner of choice
High Quality Portfolio:
- Operational Excellence
- Project Development
- Unlocking Exploration Value
- Portfolio Management
Disciplined Capital Allocation:
- Balance Sheet Management
- Strong Returns across the Business
- Dividends and Buybacks
- Protecting Equity Dilution
Supporting Host Countries and Communities:
- Employment and Training
- Local Procurement & Economic Development
- Environmental Stewardship
- Transparent Taxes & Govt. Equity Participation
OUR OBJECTIVE
COMBINED PROFILE
To be a best in class senior gold producerOUR COMBINED VISION
1717
18Moz 33MozP&P Reserves M&I Resources4
All-in Sustaining Costs2
Annual production1
<$900/oz
Net Debt/Adj. EBITDA3
0.3x
+1.5Moz
Sources: Company disclosures , Broker notes,1. Production based on 2021E Street consensus estimates for Endeavour and Teranga2. AISC based on 2021 Street consensus estimates for Endeavour and Teranga combined3. Pro forma based on latest available public information, net of the proposed $200M La Mancha investment and gold bullion unsold as at 30 September 2020 at Teranga (valued at $39M as per Teranga Q3-2020 MD&A). Pro forma LTM EBITDA as at 30 September 2020 of $867M 4. Reserves and resources on 100% basis (resources are inclusive of reserves)

APPENDIX 1:TRANSACTION DETAILS

AGREED TERMS OF COMBINATION
19
Proposed Transaction
• Endeavour and Teranga have entered into a definitive agreement whereby Endeavour will acquire all of the issued and outstanding securities of Teranga by way of a Plan of Arrangement under the Business Corporations Act (Canada)
• Values the entire issued share capital of Teranga at approximately CAD2.6 billion or $2.0 billion, based on Endeavour’s share price on November 13, 2020, and CAD:US$ exchange rate of 1.3161
Consideration• Exchange ratio of 0.470 of an Endeavour share for each Teranga share representing a 5.1% and 9.4% premium based on closing and 20-
day VWAP Endeavour and Teranga share prices as at November 13, 2020, respectively
Ownership • Pro forma ownership: approximately 66% Endeavour / 34% Teranga on a fully diluted basis
Board and Management
› Board of Directors to be comprised of 10 directors:› 7 nominated by Endeavour› 3 nominated by Teranga
› Sebastien de Montessus and his executive team will lead the combined group, with the support of key Teranga senior management› Headquarters to be located in London leveraging the established Endeavour regional operating offices
Shareholder Support
› Tablo and Barrick Gold, together representing approximately 33% of the outstanding shares of Teranga, have signed voting support agreements to vote in favour of the transaction
› Voting support agreements from La Mancha and the directors and executive officers of each of Teranga and Endeavour
Other
› Transaction will be effected by a Teranga plan of arrangement, which will require Teranga shareholder approval (66 2/3% present & voting) and a simple majority disinterested shareholder vote (excluding Barrick) as Barrick is a syndicate member in Teranga’s facility with Taurus which is intended to be refinanced on closing of the Combination
› Endeavour shareholder approval required (simple majority) under TSX rules given quantum of share issuance (>25% of current shares) and simple majority approval of the shares to be issued to La Mancha
› La Mancha has committed to invest $200m in the combined entity at a 5% discount to the 5-day VWAP as at November 23, 2020› Closing condition in favour of Endeavour that it shall be provided by Franco-Nevada a waiver and consent in respect of certain change of
control and other requirements under the Sabodala gold purchase and sale agreement› Customary non-solicitation provisions, including right to match› Reciprocal termination fee of $40M, payable in certain circumstances› Other customary and regulatory conditions, including Investment Canada Act and Competition Act (Canada) clearance
Proposed Timing› Joint management information circular mailed by each company to its shareholders by December, 2020› Endeavour and Teranga shareholder meetings and closing of the Combination expected to take place in the first quarter of 2021
Both boards have unanimously approved the transaction

APPENDIX 2:ASSET PORTFOLIO OF COMBINED ENTITY

NAME COUNTRYMINE
PRODUCTION1
(koz)
AISC1
($/oz)RESERVES2,3,4
(Moz)
RESERVEGRADE2,3,4
(g/t)
GOLD M&I RESOURCES2,3,4
(Moz)
M&I RESOURCE GRADE2,3,4
(g/t)
End
eav
ou
r
Houndé Burkina Faso 240 880 2.86 1.86 4.45 1.85
Ity Côte d’Ivoire 245 653 3.29 1.56 4.06 1.55
Agbaou Côte d’Ivoire 120 965 0.32 1.58 0.52 2.14
Karma Burkina Faso 105 1,015 0.29 0.99 2.04 1.21
Boungou Burkina Faso 140 703 1.11 3.76 1.70 4.06
Mana Burkina Faso 195 1,085 1.41 2.91 4.14 2.23
Tera
nga
Sabodala-Massawa
Senegal 230 913 4.82 1.98 6.90 2.05
Wahgnion Burkina Faso 158 950 1.55 1.59 2.37 1.49
Source: Company disclosures1. Based on mid-point of the 2020 guidance2. Endeavour reserves and resources disclosures as at December 31, 2019. Figures for Houndé and Ity have been adjusted for subsequent resource & reserve increases as per press releases dated 22nd July 2020 and 7th July 2020; 3. Teranga reserves and resources as at December 31, 2019 and sourced from Sabodala-Massawa NI 43-101 report and the 2019 Management Discussion & Analysis document for Wahgnion4. Resources inclusive of reserves and exclusive of Inferred resources. Mineral resources that are not mineral reserves do not have demonstrated economic viability
ASSET OVERVIEW
PORTFOLIO OF PRODUCING MINES
21
Diversified across 8 mines

22
6.5MozCombined M&I
resources
4.1MozCombined Inferred
resources
V ENDEAVOUR TERANGA
ASSET Fetekro Kalana Bantou Nabanga Golden Hill Afema JV
COUNTRY Côte d’Ivoire Mali Burkina Faso Burkina Faso Burkina Faso Côte d’Ivoire
STATUS PEA FS in progress Exploration PEAPEA in
progressExploration
RESERVES1 N/A1.96Moz at 2.81g/t
N/A N/A N/A N/A
M&I RESOURCES1
2.47Moz at 2.40g/t
3.25Moz at 3.92g/t
N/A N/A0.75Moz
at 1.85g/t Targeting an initial resource estimate in Q1
2021INFERREDRESOURCES
0.07Moz at 2.52g/t
0.27Moz at 4.41g/t
2.25Moz at 1.37g/t
0.84Moz at 7.69g/t
0.67Moz at 1.81g/t
Source: Company disclosures1. Reserves & Resources on 100% basis (Measured & Indicated Resources are inclusive of reserves)
ATTRACTIVE PIPELINE OF 6 GROWTH PROJECTSAbility to deliver long-term sustainable production at low cost
ASSET OVERVIEW

SABODALA-MASSAWA MINESenegal
Timeline
Overview
Quick Facts(on 100% basis)
23
Ity Mine
Ownership
90% EDV10% Senegal
Processing Rate Mining Type
Open pit /Owner Mining
Underground potential
Royalty Corporate Tax
Production2020 Target
AISC2020 Target
P&P Reserves2Current as at December 31, 2019
M&I ResourcesCurrent as at December 31, 2019
225-235koz $875-950/oz 4.8Moz 6.9Moz
The recently published PFS highlighted a long LOM (17 years) and average production of 384koz1 at low AISC1 of $671/oz.
Resource evaluation and expansion programs were ongoing by previous owners at the three main areas, Sofia, Central and North zones with the aim to sustain 350-400koz production beyond 2027.
The Sabodala-Massawa complex has potential to become a top tier asset with long mine life, high grade, low cost and significant exploration potential.
Existing and well established infrastructure at Sabodala, having produced +2Moz in the last decade, to be upgraded and optimised for Massawa integration
4.0Mtpa CIL plant with potential
further 1.2Mtpa for refractory ore
treatment (ROT)
5% 25%
1. Based on PFS published on July 26, 2020 by Teranga: Production and AISC figures based average 2021-2025 figures2. Reserves and resources estimates as at December 31, 2019 and in accordance with the PFS highlight results published on July 26, 2020
2012 2020
2010 2016 2020
First gold poured
Teranga Gold acquired Sabodalagold mine
First mill expansion completed doubling milling capacity (2-4Mtpa)
Completed second mill expansion, increasing capacity to 4.3-4.5Mtpa
In March 2020, Terangaacquired the neighboring Massawa project from Barrick
In August 2020, Teranga published the PFS for the Sabodala-Massawa project
2009
Dakar
Sabodala-MassawaMine
S E N E G A L

$450
$550
$650
$750
$850
$950
$1,050
$1,150
0 5 10 15 20
SABODALA-MASSAWA
Ranks amongst Africa’s top mines
Sabodala / Massawa4
(2021-2025)
Mine life, years
AISC, $/ozTop Tier African Gold Mines(1)(2)(3)(4)
Akyem (Newmont)(6)
Fekola(B2 Gold) Tasiast
(Kinross)
Ahafo (Newmont)(7)
Loulo(Barrick)
Tarkwa (GFI)
Sukari(Centamin)
Kibali(Barrick/AngloGold)
Obuasi (AngloGold)(5)
Size of the circle represents annual production
Sabodala / Massawa
(2020E)
24
$671/oz2021-2025 Average AISC
4.8Moz2P Reserves
384koz2021-2025 Average Production
17 YearsMine Life
1. Top mines defined as operations with annual gold production of over 350koz2. Production and AISC based on respective company 2020 guidance, unless specified otherwise3. Mine life based on public disclosure and technical reports, unless specified otherwise
4. Production and AISC based on 2021-2025 average; mine life as per PFS5. Disclosed 10 year average production and AISC; 21 year mine life6. Mine life based on 2P Reserves and ~9Mtpa processing as per 1H 2020A7. Mine life as per Company disclosure; Production forecast based on S&P Global Market Intelligence; AISC based on 6M 2020 actual
SABODALA-MASSAWA MINE
ASSET OVERVIEW

245
359 360400 400 400 400
893
652 699 655 715 637558
2020 2021 2022 2023 2024 2025 2026
Sabodala Whole Leach Ore Massawa Whole Leach Ore Massawa Refractory Ore AISC
SABODALA-MASSAWA: SIGNIFICANT GROWTH BUILT IN
25
Phased development plan to incorporate high grade Massawa deposits
Sabodala-Massawa LOM Production and AISC (koz)(1)
1. Production and AISC as per Sabodala-Massawa PFS (July 2020)
2. Estimates as per Sabodala-Massawa PFS (July 2020)
46%
29%
25%
LOM Production (4.3Moz) by Ore Type
1.3g/t
5.8g/t
2.4g/t
• $37M capex including $29M in 20202
• Additions and modifications to the existing 4.2Mtpa Sabodala plant to process higher grade material from Massawa pits
• Existing CIL plant modifications to be completed in 2021 to further increase production capability and efficiencies for processing Massawa’s high-grade oxide ore
• $219M capex2
• A new 1.2Mtpa Refractory Ore Treatment (ROT) plant to treat Massawa refractory ores commencing in 2023
• Separate ROT plant using bacterial oxidation (or BIOX technology) is expected to be installed in parallel to the existing plant to create a second processing stream
ASSET OVERVIEW
Phase 2 Phase 1

26
ASSET OVERVIEW
Ongoing Resources and Reserves Confirmatory Drilling Program
› Initial exploration program at Massawa launched by Teranga in March 2020 with $10M budgeted for 2020
› During Q3 2020 completed 226 drill holes (> 15,000 metres) at Sofia, Central Zone and North Zone deposits and the Samina prospect (sizeable oxide target with 60-70 metres of oxide depth)
› Going forward, campaign will also focus on other priority exploration targets including the Tina prospect, Sofia North extension and the Delyadeposit
Drilling for Further Definition of Refractory Orebodies in Preparation for DFS
› Central Zone is a priority area
› Plan to drill beneath identified oxide portions of satellite deposits and prospects: Tina, Delya and Samina
SABODALA-MASSAWA, SENEGALSignificant exploration upside potential
Source: Endeavour27
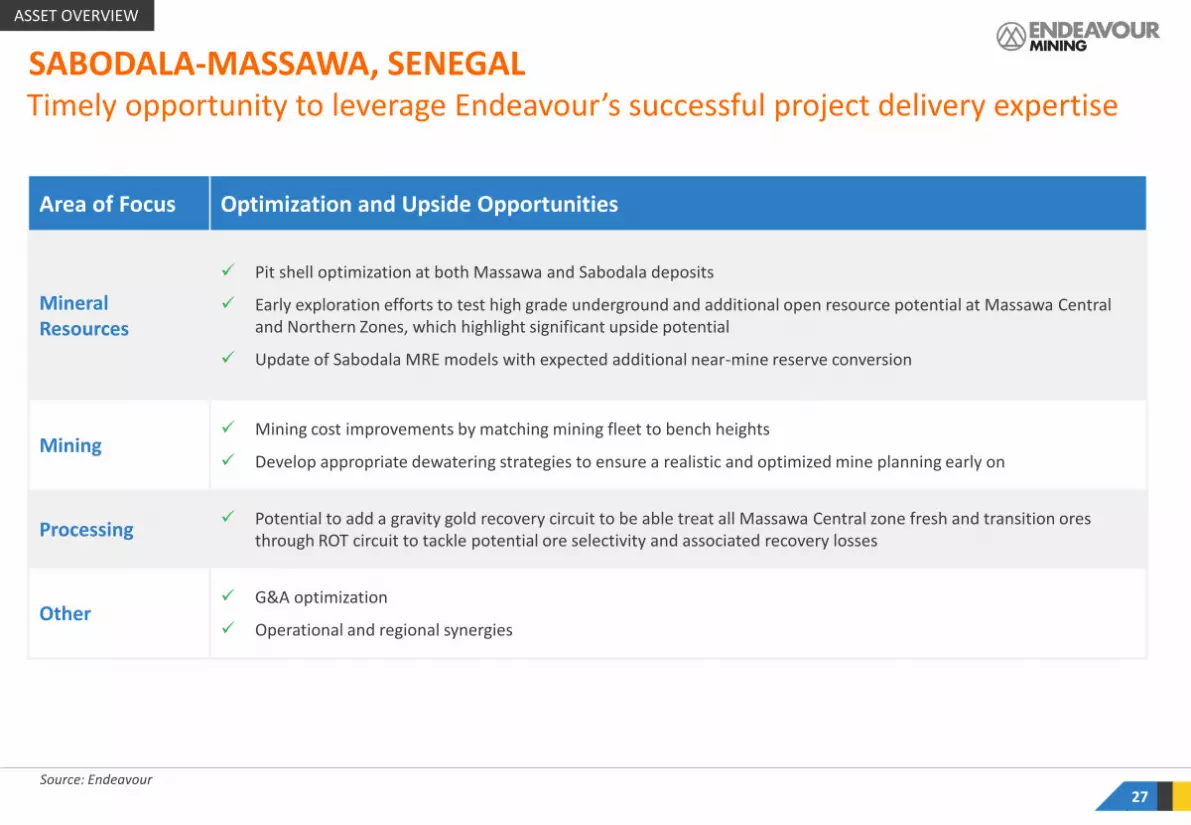
Timely opportunity to leverage Endeavour’s successful project delivery expertise
Area of Focus Optimization and Upside Opportunities
Mineral Resources
✓ Pit shell optimization at both Massawa and Sabodala deposits
✓ Early exploration efforts to test high grade underground and additional open resource potential at Massawa Central and Northern Zones, which highlight significant upside potential
✓ Update of Sabodala MRE models with expected additional near-mine reserve conversion
Mining✓ Mining cost improvements by matching mining fleet to bench heights
✓ Develop appropriate dewatering strategies to ensure a realistic and optimized mine planning early on
Processing✓ Potential to add a gravity gold recovery circuit to be able treat all Massawa Central zone fresh and transition ores
through ROT circuit to tackle potential ore selectivity and associated recovery losses
Other✓ G&A optimization
✓ Operational and regional synergies
ASSET OVERVIEW
SABODALA-MASSAWA, SENEGAL
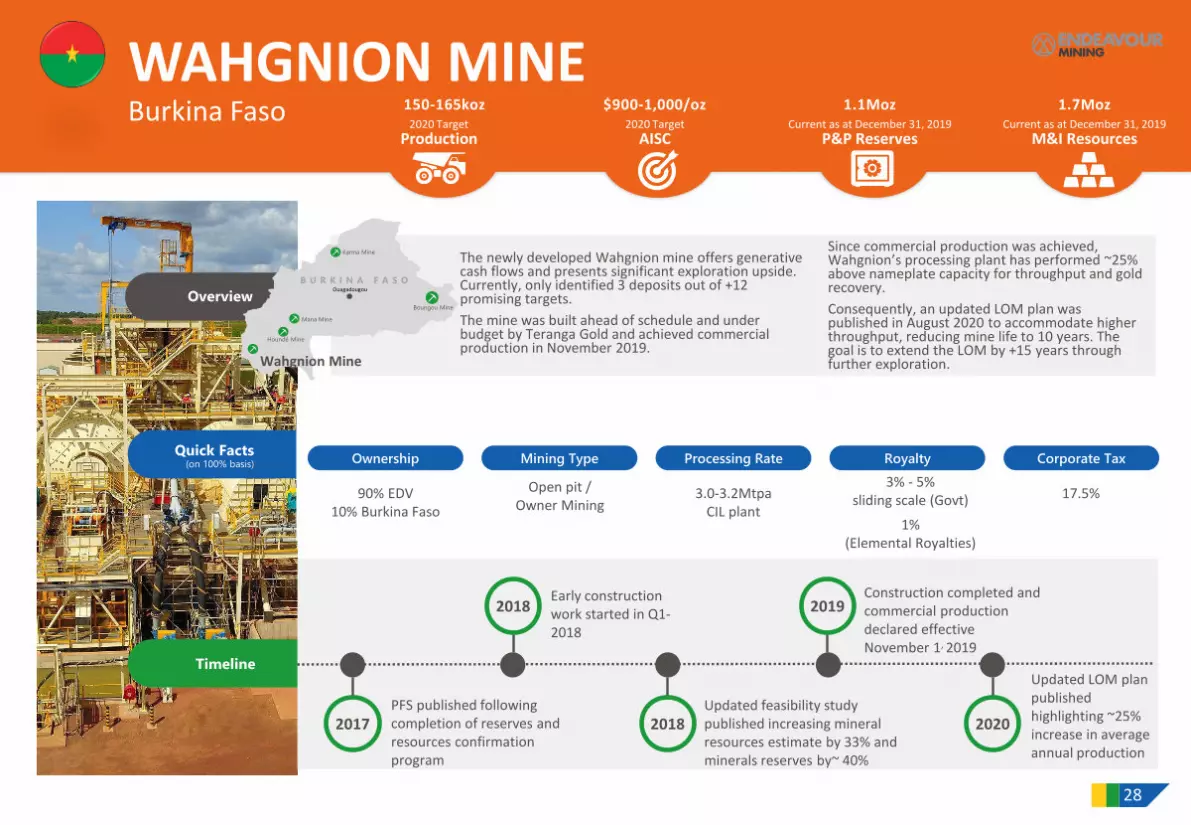
WAHGNION MINEBurkina Faso
Timeline
Overview
Quick Facts(on 100% basis)
28
Ity Mine
Ownership
90% EDV10% Burkina Faso
Processing Rate Mining Type
Open pit /Owner Mining
Royalty Corporate Tax
Production2020 Target
AISC2020 Target
P&P Reserves Current as at December 31, 2019
M&I ResourcesCurrent as at December 31, 2019
150-165koz $900-1,000/oz 1.1Moz 1.7Moz
Since commercial production was achieved, Wahgnion’s processing plant has performed ~25% above nameplate capacity for throughput and gold recovery.
Consequently, an updated LOM plan was published in August 2020 to accommodate higher throughput, reducing mine life to 10 years. The goal is to extend the LOM by +15 years through further exploration.
The newly developed Wahgnion mine offers generative cash flows and presents significant exploration upside. Currently, only identified 3 deposits out of +12 promising targets.
The mine was built ahead of schedule and under budget by Teranga Gold and achieved commercial production in November 2019.
Ouagadougou
Houndé Mine
Karma Mine
Mana Mine
B U R K I N A F A S O
3.0-3.2Mtpa CIL plant
Wahgnion Mine
2018 2020
2018 2019
PFS published following completion of reserves and resources confirmation program
Early construction work started in Q1-2018
2017Updated feasibility study published increasing mineral resources estimate by 33% and minerals reserves by~ 40%
Construction completed and commercial production declared effective November 1, 2019
Updated LOM plan published highlighting ~25% increase in average annual production
Boungou Mine
3% - 5%sliding scale (Govt)
1% (Elemental Royalties)
17.5%

29
Production and AISC Profile1,2,3
(koz and $/oz)
Immediate cash flow generation with significant optimization opportunitiesWAHGNION MINE
Sources: Endeavour and Teranga disclosures1. Q4 2019, Q1 2020, Q2 2020, Q3 2020 based on actuals2. 2020 figures based on updated guidance at midpoint3. 2021-2030 figures based on updated mine plan published August 2020
ASSET OVERVIEW
182158 149
138
$870 $950 $920$1,007
Since Start-Up(Q4'19-Q3'20)
2020E 2021-2025Average
LOM Average
Optimization Opportunities
› Still largely underexplored and promising land package
› Significant exploration upside in deeper areas and along strike
› Potential to reduce mining costs with improved dewatering and through mining fleet optimization
› Cost reductions through use of shared services structure in Burkina Faso

Timeline
Overview
Quick Facts(on 100% basis)
30
Ity Mine
AbidjanAgbaou Mine
C Ô T E D ’ I V O I R E
Ownership
85% EDV10% Côte d’Ivoire
5% SODEMI
Processing Rate
Upsize to5Mtpa completed
Mining Type
Open pit /Owner Mining
Royalty
3% - 5%sliding scale
Corporate Tax
25%
2012 2016 2018
2014 2017 2019
La Mancha purchased by N. Sawiris
La Mancha increased its stake to 55%
Feasibility study on CIL project
Endeavour increased its stake to 80%, published Optimized Feasibility Study and commenced CIL construction
Endeavour increased its stake to 85%
Commercial production achieved ahead of schedule and below budget
Production2020 Target
AISC2020 Target
P&P Reserves 1Current as at December 31, 2019
M&I Resources1Current as at December 31, 2019
230-250koz $630-675/oz 3.3Moz 4.1Moz
ITY MINECÔTE D’IVOIRE
1. Updated for LOM extension dated 12th November 2020. La Plaque area contributions as announced 7th July 2020
The CIL plant was successfully built ahead of schedule and below budget, achieving commercial production in Q2 2019.
The mine has a production potential of 250koz/year over a +10 year life of mine at an attractive AISC.
The Ity mine is one of Endeavour’s cornerstone assets, it has the longest operating history of any gold mine in Côte d’Ivoire, with +1.2Moz of gold produced in its over 20 years of operation.
The recent success of Endeavour’s near-mine exploration program which discovered ~3.5Moz provided the opportunity to upgrade the small-scale, short life heap leach operation with a CIL plant.

AGBAOU MINECÔTE D’IVOIRE
Timeline
Overview
Quick Facts(on 100% basis)
31
Ity Mine
AbidjanAgbaou
Mine
C Ô T E D ’ I V O I R E
Ownership
85% EDV10% Côte d’Ivoire
5% SODEMI
Processing Rate
2.6Mtpa oxides / 1.6Mtpa fresh
Mining Type
Open pit /Contractor Mining
Royalty
3% - 5%sliding scale
Corporate Tax
25%
2008 2012 2016
2010 2014 2017
Feasibility Study Completed
Endeavour acquired Estruscan
Construction commenced
Commercial production launched
Secondary crusher built
Start blending the harder transitional ore
Production2020 Target
AISC2020 Target
P&P Reserves Current as at December 31, 2019
M&I ResourcesCurrent as at December 31, 2019
115-125koz $940-990/oz 0.3Moz 0.5Moz
The plant is able to maintain a sustainable throughput rate averaging more than 30% above nameplate capacity.
Current processing capacity of up to 2.6Mtpa Gravity / CIL plant oxides and 1.6Mtpa fresh.
The low cost Agbaou mine was built ahead of schedule and under budget in 2014 with the secondary crusher successfully built in mid-2016 providing processing flexibility (blending oxide with fresh ore).
The Agbaou mine has been a significant cash flow contributor for Endeavour over the past several years.

HOUNDÉ MINEBurkina Faso
Timeline
Overview
Quick Facts(on 100% basis)
32
Ity Mine
Ownership
90% EDV10% Burkina Faso
Processing Rate
3Mtpa CIL Plant
Mining Type
Open pit /Owner Mining
Royalty Corporate Tax
17.5-27.5%
2012 2015 2018
2013 2016 2019
Endeavour purchased Avion
Feasibility Study published
Mining permit received
Construction started in April
Maiden resource at Kari Pump
Maiden reserve for Kari Pump
Production2020 Target
AISC2020 Target
P&P Reserves1Current as at December 31, 2019
M&I Resources1Current as at December 31, 2019
230-250koz $865-895/oz 2.9Moz 4.4Moz
The goal is to delineate sufficient additional resources through near-mine exploration to sustain production above 250koz/year over a +10-year life of mine at an attractive AISC.
In July 2020, a mining permit was granted and mining commenced at the Kari Pump deposit, part of the Kari Area, which will provide mill feed at significantly higher grades than the current pits.
The Houndé mine is one of Endeavour’s cornerstone assets. The mine was built ahead of schedule and below budget, with commercial production commencing in Q4-2017.
Since then, the CIL plant has consistently performed well and is able to operate at more than 30% above nameplate capacity.
Ouagadougou
HoundéMine
Karma Mine
Mana Mine
Wahgnion
Mine
B U R K I N A F A S O
1. Updated for LOM extension dated 12th November 2020 and Kari are contributions as announced 22nd July 2020
2020
Kari Pump mining permit received
Boungou Mine
3% - 5%sliding scale

MANA MINEBurkina Faso
Timeline
Overview
Quick Facts(on 100% basis)
33
Ity Mine
Ownership
90% EDV10% Burkina Faso
Processing Rate Mining Type
Open pit /Owner Mining
Underground / Contractor Mining
Royalty Corporate Tax
17.5%
1998 2008 2014
2006 2012 2017
Discovery of Mana
Construction began
First production
Mill expansion to 8,000tpd
First production from Siou and Fofina
PFS for Siouunderground
Production2020 Target
AISC2020 Target
P&P Reserves Current as at December 31, 2019
M&I ResourcesCurrent as at December 31, 2019
185-205koz $1,050-1,120/oz 1.4Moz 4.1Moz
Recent discoveries resulted in the development of the Siou underground mine, using the long-hole method, which was completed in Q1-2020.
The Mana mine is located in the northern part of the highly prospective Houndé Greenstone Belt, approximately 60km north of the Houndé mine.
The mine has been in operation for over a decade, producing +2.1Moz gold.
Ouagadougou
Houndé Mine
Karma Mine
Mana
Mine
B U R K I N A F A S O
2018Development started for Siou UG
2.9Mtpa blended2.6Mtpa fresh
2020Siou UG development completed
Wahgnion
Mine
Boungou Mine
3% - 5%sliding scale

Timeline
Overview
Quick Facts(on 100% basis)
34
Ity Mine
Ownership
90% EDV10% Burkina Faso
Processing Rate Mining Type
Open pit /Contractor Mining
Royalty Corporate Tax
27.5%
Production2020 Target
AISC2020 Target
P&P Reserves Current as at December 31, 2019
M&I ResourcesCurrent as at December 31, 2019
130-150koz $680-725/oz 1.1Moz 1.7Moz
The mine was placed on temporary care and maintenance in November 2019 in order to address regional security issues and started processing stockpiles in Q1-2020.
Full mining operations are expected to restart in Q4-2020. The area around the mine is virtually unexplored and significant opportunity exists to identify additional resources.
The Boungou mine is a low cost, high grade operation with significant exploration potential.
The mine was built on time and on budget and achieved commercial production in Q3-2018.
Ouagadougou
Houndé Mine
Karma Mine
Mana Mine
B U R K I N A F A S O
1.5Mtpa Gravity / CIP plant
2019 2020
2018 2020
Construction began in March 2017
First gold pour in June and commercial production achieved in September
2017Placed on care and maintenance in November
Restarted processing stockpiles in February
Mining operation successfully restarted in October
Boungou
Mine
Wahgnion
Mine
3% - 5%sliding scale
BOUNGOU MINEBurkina Faso

KARMA MINEBurkina Faso
Timeline
Overview
Quick Facts(on 100% basis)
35
Ity Mine
Ownership
90% EDV10% Burkina Faso
Processing Rate Mining Type
Shallow Open pit /Contractor Mining
Royalty Corporate Tax
17.5%
Production2020 Target
AISC2020 Target
P&P Reserves Current as at December 31, 2019
M&I ResourcesCurrent as at December 31, 2019
100-110koz $980-1,050/oz 0.3Moz 2.0Moz
In 2017, an optimization project was completed to lift the stacking capacity.
Karma currently hosts six identified gold deposits and has 45 targets.
The Karma mine is a low-grade heap leach operation and consists of several gold deposits which are shallow, open pittable with little blasting required and a low strip ratio.
Mine life was already extended from 8.5- 10 years in 2016, Karma has the potential to be a long life asset.
Ouagadougou
Houndé Mine
Karma Mine
Mana Mine
B U R K I N A F A S O
4.2Mtpa Heap Leach
Wahgnion
Mine
3% - 5%sliding scale
2015 2017
2014 2016
Maiden resources published for Karma Project
Mining permit issued
2008 Construction began
First gold pour in April following Endeavour’s acquisition of Karma
Mine life extended from 8.5 to +10 yearsFront-end optimization project completed
Boungou Mine

Source: Company disclosures1. Golden Hill’s Mineral Resource Estimate as at October 5, 2020 36
Expanded presence in the Houndé Belt to benefit from existing infrastructureGOLDEN HILL PROJECT
GOLDEN HILL PROJECT
› Advanced-stage exploration project on the Houndé Belt within trucking distance (25-30km) from Endeavour’s Houndé mine
› Potential for development as a satellite deposit
› Expansive exploration licenses covering 468km2
› Drilling and preliminary engineering work by Teranga confirms potential for a high grade open pit deposit at Golden Hill
› The structural-stratigraphic mineralization traced for over 32km along trend, of which only 10km have been explored
› Most resource areas remain open to further expansion along trend and depth
M&I Resources1 0.8Moz @ 1.85g/t
Inferred Resources1 0.7Moz @ 1.81g/t
Sources: company disclosures
0.7 Moz Inferred0.8 Moz Indicated
ASSET OVERVIEW

APPENDIX 3:OTHER

› Regional economic zone called the West African Economic and Monetary Union (UEMOA) which is similar to the European Union:
‒ Established with the Treaty signed in Dakar in 1994
‒ Common central bank for the eight francophone nations
‒ Common currency (CFA Franc) which is pegged to the Euro
‒ Fiscal and monetary policies tend to be aligned with guidance from IMF
‒ States have undergone democratic elections in past decade and are closely monitored by the IMF
ATTRACTIVE MINING FRIENDLY JURISDICTIONS
38
BURKINA FASO
CÔTE D'IVOIRE
Population: 20.8M 2018 GDP: $14B
Unemployment: 6.2% 2018 GDP growth: 6.8%
Literacy: 41.2% Corporate Tax: up to 27.5%
Internet users: 16% Mining royalties: up to 5%
Population: 27.5M 2018 GDP: $43B
Unemployment: 2.5% 2018 GDP growth: 7.4%
Literacy: 47.2% Corporate Tax: up to 25%
Internet users: 46.8% Mining royalties: up to 6%
Sources: World Bank and CIA Factbook
Population: 15.7M 2018 GDP: $23B
Unemployment: 6.7% 2018 GDP growth: 6.4%
Literacy: 51.9% Corporate Tax: up to 30%
Internet users: 29.6% Mining royalties: up to 5%
SENEGAL
APPENDIX

Endeavour Teranga Pro Forma
Market Capitalization (FDITM) $M 3,833 1,860 5,8935
% shareholding in Combined Entity % ~66% ~34% -
Cash and equivalents (Sep 30, 2020) $M 523 791 8031
Debt (Sep 30, 2020) $M 698 3841 1,082
Net Debt (Sep 30, 2020) $M 175 3041 2791
EBITDA LTM (Sep 30, 2020) $M 604 263 867
EBITDA Q3 2020 Annualized $M 1,023 405 1,428
EBITDA 2021E (Street Consensus) $M 1,318 655 1,973
Gold Reserves2 Moz 11.2 6.4 17.6
Gold Measured & Indicated Resources2 Moz 22.6 10.0 32.6
2020 Production3 koz 1,045 388 1,433
2020 Production + 5 Year Sabodala-Massawa4 Koz 1,045 542 1,587
2021 Production (Street Consensus) Koz 1,126 494 1,620
2020 AISC3,4 $/oz 890 1,038 930
2020 AISC + 5 Year Sabodala-Massawa4 $/oz 890 752 843
2021 AISC (Street Consensus) $/oz 898 783 8636
PRO FORMA SNAPSHOT
39
Sources: Company disclosures1. Cash for Teranga includes gold bullion valued at $39.2M. Debt adjusted for post 30 Sep 2020 repayment of $17.1M; Combined
entity cash adjusted for La Mancha cash injection of $200M2. 100% basis; resources inclusive of reserves and exclusive of Inferred resources3. Production & AISC based on 2020 guidance at midpoint
4. Sabodala Massawa figures based on 5-Year average (2021-2025) derived from PFS (July 2020) 5. Based on pre-announcement market capitalizations of Endeavour and Teranga, including the $200M La Mancha cash injection6. Pre-synergies
APPENDIX
0.3x

BENEFIT OF COMPREHENSIVE REFINANCING
1. Based on fair value assigned to Wahgnion offtake ($11.4M) and Massawa offtake ($32.1M); values assume 8.75% discount rate; Secured development finance facility adjusted for US$17M repaid post 30/09/20202. Illustrative based on currently applicable RCF interest rate range (margin driven by leverage ratio)3. Excluding implied cost of offtake rights4. Excluding lease liabilities. Combined Entity debt exclude the US$250M RCF, which is expected to be undrawn
40
Simplified and optimized capital structure
Endeavour Liabilities Teranga LiabilitiesCombined Entity Liabilities
Post Refinancing
› $310M RCF‒ 2.95 – 3.95% margin
› $330M Convertible Bond‒ 3% coupon
› Leases
› $225M Massawa Acquisition Facility‒ 7.85% interest
› $149M Secured Development Finance Facility1
‒ 8.75% interest
› Massawa and Wahgnion offtake rights valued at $43M (Q3-2020)1
‒ 0.9Moz at Wahgnion and LOM at Massawa
‒ 8 day lookback
› Leases
› Up-to $550M Bridge Loan‒ New 2-year facility to
refinance Teranga’s existing liabilities and Endeavour RCF
‒ 2.25% starting margin
› Minimum $250M RCF‒ To remain undrawn‒ Roll-over of existing RCF‒ 2.95 – 3.95% margin
› $330M Convertible Bond‒ 3% coupon
› Leases
› Endeavour has arranged an up-to $800 million fully-committed debt refinancing package on a certain funds basis (the “Refinancing”). Citi, HSBC Bank Canada, and ING Bank N.V. have fully underwritten the Refinancing on SunGard terms
› The Refinancing significantly reduces the overall cost of debt of the Combined Entity and ensures adequate liquidity
› The Refinancing has been conservatively sized and may be reduced prior to closing at Endeavour’s discretion
Total Debt4: $640MCost of debt: ~3%2
Total Debt4: $374MCost of debt: ~8.25%3
Total Debt4: ~$0.9BCost of debt: ~3%2
APPENDIX

EDV TGZ30/09/20
Pro forma
US$ million
Cash & Cash Eq. 523 791 602
Undrawn Facilities 120 19 139
La Mancha Cash Injection -- 200
Total liquidity 643 98 942
EDV TGZ30/09/20
Pro forma
US$ million
Cash & Cash Eq. 523 791 602
RCF (310) -- (310)
Convertible Loan (330) -- (330)
Equipment Financing (58) (10) (68)
Wahgnion Tranche -- (133)2 (133)
Golden Hill Tranche -- (16) (16)
Acquisition Facility -- (225) (225)
La Mancha Cash Injection -- 200
Net Cash/(Net Debt) (175) (304) (279)
41
PRO FORMA NET DEBT AND LIQUIDITY
APPENDIX
Net debt
Net debt & liquidity calculation
Liquidity
1. Cash for Teranga includes Gold Bullion valued at $39M,2. Debt adjusted for post Q3-2020 repayment of $17.1M3. Pro-forma assets and liabilities acquired as part of the SEMAFO
transaction
Source: Companies disclosure (9M 2019 and 9M 2020 Financial statements and MD&A), analyst estimates
Return On Capital Employed (ROCE)
EBITDA and EBIT Based on Q3 2020A annualized figures
Endeavour Mining
Teranga Pro forma
US$ million
Adjusted EBITDA Q3 2020A Annualized 1,023 405 1,428
Less: Depreciation and Amortisation (539) (133) (672)
Adjusted EBIT 2020A Annualized (A) 484 273 756
Opening Capital Employed (B) 3,4273 1,454 4,881
Total Assets 3,855 1,711 5,566
Less: Current Liabilities (432) (227) (659)
Closing Capital Employed (C) 3,423 1,483 4,906
Average Capital Employed (D) = (B+C)/2 3,425 1,469 4,894
ROCE (A)/(D) 14% 19% 15%

Endeavour Teranga Pro Forma(ex. synergies)
Accretion/DilutionStreet Consensus
Operating Metrics
Production 2021E koz 1,126 494 1,620
Production 2022E koz 1,063 474 1,537
Production 2023E koz 912 549 1,461
AISC 2021E $/oz 898 783 863
AISC 2022E $/oz 885 836 870
AISC 2023E $/oz 869 785 837
Financials
EBITDA 2021E $M 1,318 655 1,973
EBITDA 2022E $M 1,087 544 1,631
EBITDA 2023E $M 798 647 1,445
FCF 2021E $M 856 366 1,222
FCF 2022E $M 755 220 975
FCF 2023E $M 476 434 910
Per Share (C$)3 Per Share (C$)3 Per Share (C$)3
Net Income 2021E $M 630 $5.09 322 $2.39 952 $5.09 0.0%
Net Income 2022E $M 503 $4.06 279 $2.07 782 $4.18 2.9%
Net Income 2023E $M 334 $2.70 254 $1.89 588 $3.14 16.6%
CFO 2021E $M 1,059 $8.55 541 $4.03 1,600 $8.56 0.1%
CFO 2022E $M 964 $7.78 470 $3.50 1,434 $7.66 (1.5%)
CFO 2023E $M 671 $5.42 528 $3.93 1,199 $6.41 18.4%
NAV $M 4,307 $34.77 2,538 $18.89 6,7851 $36.76 5.7%2
CONSENSUS ESTIMATES AND ILLUSTRATIVE ACCRETION / DILUTION
42
Sources: Analyst research
APPENDIX
1. Net of $60M dividend to Endeavour shareholders2. Accretion / Dilution taking into account the $60M dividend to Endeavour shareholders (C$0.48 per share)3. Based on FDITM shares totalling 177M for Teranga and 163M for Endeavour and exchange ratio of 0.470x. CADUSD of 1.32x as at 13th of November closing