creating reports with tibco webfocus® language
TRANSCRIPT
TIBCO WebFOCUS®
Copyright © 2021. TIBCO Software Inc. All Rights Reserved.
Creating Reports WithTIBCO® WebFOCUS Language
Release 8207November 2021DN4501639.1121


Contents
1. Creating Reports Overview . . . . . . . . . . . . . . . . . . . . . . . . . . . . . . . . . . . . . . . . . . . . . . . . . . . .29
Requirements for Creating a Report . . . . . . . . . . . . . . . . . . . . . . . . . . . . . . . . . . . . . . . . . . . . . . . . . . . . 29
Report Types . . . . . . . . . . . . . . . . . . . . . . . . . . . . . . . . . . . . . . . . . . . . . . . . . . . . . . . . . . . . . . . . . . . . . . . .30
Developing Your Report Request . . . . . . . . . . . . . . . . . . . . . . . . . . . . . . . . . . . . . . . . . . . . . . . . . . . . . . .32
Starting a Report Request. . . . . . . . . . . . . . . . . . . . . . . . . . . . . . . . . . . . . . . . . . . . . . . . . . . . . . . .34
Completing a Report Request. . . . . . . . . . . . . . . . . . . . . . . . . . . . . . . . . . . . . . . . . . . . . . . . . . . . .34
Creating a Report Example. . . . . . . . . . . . . . . . . . . . . . . . . . . . . . . . . . . . . . . . . . . . . . . . . . . . . . . 35
Customizing a Report . . . . . . . . . . . . . . . . . . . . . . . . . . . . . . . . . . . . . . . . . . . . . . . . . . . . . . . . . . . . . . . . 37
Selecting a Report Output Destination . . . . . . . . . . . . . . . . . . . . . . . . . . . . . . . . . . . . . . . . . . . . . . . . . . 38
2. Displaying Report Data . . . . . . . . . . . . . . . . . . . . . . . . . . . . . . . . . . . . . . . . . . . . . . . . . . . . . . . 39
Using Display Commands in a Request . . . . . . . . . . . . . . . . . . . . . . . . . . . . . . . . . . . . . . . . . . . . . . . . . 39
Displaying Individual Values . . . . . . . . . . . . . . . . . . . . . . . . . . . . . . . . . . . . . . . . . . . . . . . . . . . . . . . . . . .41
Displaying All Fields. . . . . . . . . . . . . . . . . . . . . . . . . . . . . . . . . . . . . . . . . . . . . . . . . . . . . . . . . . . . . 42
Displaying All Fields in a Segment. . . . . . . . . . . . . . . . . . . . . . . . . . . . . . . . . . . . . . . . . . . . . . . . . 44
Displaying the Structure and Retrieval Order of a Multi-Path Data Source. . . . . . . . . . . . . . . 45
Adding Values . . . . . . . . . . . . . . . . . . . . . . . . . . . . . . . . . . . . . . . . . . . . . . . . . . . . . . . . . . . . . . . . . . . . . . .50
Counting Values . . . . . . . . . . . . . . . . . . . . . . . . . . . . . . . . . . . . . . . . . . . . . . . . . . . . . . . . . . . . . . . . . . . . .52
Counting Segment Instances. . . . . . . . . . . . . . . . . . . . . . . . . . . . . . . . . . . . . . . . . . . . . . . . . . . . . 53
Expanding Byte Precision for COUNT and LIST . . . . . . . . . . . . . . . . . . . . . . . . . . . . . . . . . . . . . . . . . . . 54
Maximum Number of Display Fields Supported in a Request . . . . . . . . . . . . . . . . . . . . . . . . . . . . . . . 55
Manipulating Display Fields With Prefix Operators . . . . . . . . . . . . . . . . . . . . . . . . . . . . . . . . . . . . . . . . 56
Prefix Operator Basics. . . . . . . . . . . . . . . . . . . . . . . . . . . . . . . . . . . . . . . . . . . . . . . . . . . . . . . . . . . 57
Averaging Values of a Field. . . . . . . . . . . . . . . . . . . . . . . . . . . . . . . . . . . . . . . . . . . . . . . . . . . . . . . 60
Averaging the Sum of Squared Fields. . . . . . . . . . . . . . . . . . . . . . . . . . . . . . . . . . . . . . . . . . . . . . 61
Calculating Maximum and Minimum Field Values. . . . . . . . . . . . . . . . . . . . . . . . . . . . . . . . . . . . 61
Calculating Median and Mode Values for a Field. . . . . . . . . . . . . . . . . . . . . . . . . . . . . . . . . . . . .62
Calculating Column and Row Percentages. . . . . . . . . . . . . . . . . . . . . . . . . . . . . . . . . . . . . . . . . . 63
Producing a Direct Percent of a Count. . . . . . . . . . . . . . . . . . . . . . . . . . . . . . . . . . . . . . . . . . . . . .65
Aggregating and Listing Unique Values. . . . . . . . . . . . . . . . . . . . . . . . . . . . . . . . . . . . . . . . . . . . . 65
Retrieving First and Last Records. . . . . . . . . . . . . . . . . . . . . . . . . . . . . . . . . . . . . . . . . . . . . . . . . 68
Summing and Counting Values. . . . . . . . . . . . . . . . . . . . . . . . . . . . . . . . . . . . . . . . . . . . . . . . . . . .70
Ranking Sort Field Values With RNK.. . . . . . . . . . . . . . . . . . . . . . . . . . . . . . . . . . . . . . . . . . . . . . .72
Creating Reports With TIBCO® WebFOCUS Language 3

Rolling Up Calculations on Summary Rows. . . . . . . . . . . . . . . . . . . . . . . . . . . . . . . . . . . . . . . . . 75
Calculating the Standard Deviation for a Population or a Sample. . . . . . . . . . . . . . . . . . . . . . 80
Using Report-Level Prefix Operators. . . . . . . . . . . . . . . . . . . . . . . . . . . . . . . . . . . . . . . . . . . . . . . .81
Displaying Pop-up Field Descriptions for Column Titles . . . . . . . . . . . . . . . . . . . . . . . . . . . . . . . . . . . . 84
3. Sorting Tabular Reports . . . . . . . . . . . . . . . . . . . . . . . . . . . . . . . . . . . . . . . . . . . . . . . . . . . . . . .87
Sorting Tabular Reports Overview . . . . . . . . . . . . . . . . . . . . . . . . . . . . . . . . . . . . . . . . . . . . . . . . . . . . . . 87
Sorting Rows . . . . . . . . . . . . . . . . . . . . . . . . . . . . . . . . . . . . . . . . . . . . . . . . . . . . . . . . . . . . . . . . . . . . . . . 88
Using Multiple Vertical (BY) Sort Fields. . . . . . . . . . . . . . . . . . . . . . . . . . . . . . . . . . . . . . . . . . . . .90
Displaying a Row for Data Excluded by a Sort Phrase. . . . . . . . . . . . . . . . . . . . . . . . . . . . . . . . 91
Sorting Columns . . . . . . . . . . . . . . . . . . . . . . . . . . . . . . . . . . . . . . . . . . . . . . . . . . . . . . . . . . . . . . . . . . . . .94
Controlling Display of an ACROSS Title for a Single Field. . . . . . . . . . . . . . . . . . . . . . . . . . . . . .96
Positioning ACROSS Titles on Report Output. . . . . . . . . . . . . . . . . . . . . . . . . . . . . . . . . . . . . . . . 99
Using Multiple Horizontal (ACROSS) Sort Fields. . . . . . . . . . . . . . . . . . . . . . . . . . . . . . . . . . . . 107
Collapsing PRINT With ACROSS. . . . . . . . . . . . . . . . . . . . . . . . . . . . . . . . . . . . . . . . . . . . . . . . . . 107
Hiding Null Columns in ACROSS Groups. . . . . . . . . . . . . . . . . . . . . . . . . . . . . . . . . . . . . . . . . . 110
Hiding ACROSS Groups and Columns Within BY Page Breaks. . . . . . . . . . . . . . . . . . . 111
Generating Summary Lines and Hiding Null ACROSS Columns. . . . . . . . . . . . . . . . . . 119
Using Column Styling and Hiding Null ACROSS Columns. . . . . . . . . . . . . . . . . . . . . . . 123
Hiding Null ACROSS Columns in an FML Request. . . . . . . . . . . . . . . . . . . . . . . . . . . . . 129
Controlling Display of Sort Field Values . . . . . . . . . . . . . . . . . . . . . . . . . . . . . . . . . . . . . . . . . . . . . . . . 134
Reformatting Sort Fields . . . . . . . . . . . . . . . . . . . . . . . . . . . . . . . . . . . . . . . . . . . . . . . . . . . . . . . . . . . . .137
Manipulating Display Field Values in a Sort Group . . . . . . . . . . . . . . . . . . . . . . . . . . . . . . . . . . . . . . .139
Creating a Matrix Report . . . . . . . . . . . . . . . . . . . . . . . . . . . . . . . . . . . . . . . . . . . . . . . . . . . . . . . . . . . . 141
Controlling Collation Sequence . . . . . . . . . . . . . . . . . . . . . . . . . . . . . . . . . . . . . . . . . . . . . . . . . . . . . . . 142
Specifying the Sort Order . . . . . . . . . . . . . . . . . . . . . . . . . . . . . . . . . . . . . . . . . . . . . . . . . . . . . . . . . . . . 150
Specifying Your Own Sort Order. . . . . . . . . . . . . . . . . . . . . . . . . . . . . . . . . . . . . . . . . . . . . . . . . . 152
Selecting and Assigning Column Titles to ACROSS Values. . . . . . . . . . . . . . . . . . . . . . 156
Ranking Sort Field Values . . . . . . . . . . . . . . . . . . . . . . . . . . . . . . . . . . . . . . . . . . . . . . . . . . . . . . . . . . . 157
DENSE and SPARSE Ranking. . . . . . . . . . . . . . . . . . . . . . . . . . . . . . . . . . . . . . . . . . . . . . . . . . . . 159
Grouping Numeric Data Into Ranges . . . . . . . . . . . . . . . . . . . . . . . . . . . . . . . . . . . . . . . . . . . . . . . . . . 164
Grouping Numeric Data Into Tiles. . . . . . . . . . . . . . . . . . . . . . . . . . . . . . . . . . . . . . . . . . . . . . . . 168
Restricting Sort Field Values by Highest/Lowest Rank . . . . . . . . . . . . . . . . . . . . . . . . . . . . . . . . . . . 173
Contents
4

Sorting and Aggregating Report Columns . . . . . . . . . . . . . . . . . . . . . . . . . . . . . . . . . . . . . . . . . . . . . . 174
Hiding Sort Values . . . . . . . . . . . . . . . . . . . . . . . . . . . . . . . . . . . . . . . . . . . . . . . . . . . . . . . . . . . . . . . . . .178
Sort Performance Considerations . . . . . . . . . . . . . . . . . . . . . . . . . . . . . . . . . . . . . . . . . . . . . . . . . . . . . 179
Sorting With Multiple Display Commands . . . . . . . . . . . . . . . . . . . . . . . . . . . . . . . . . . . . . . . . . . . . . . 181
Controlling Formatting of Reports With Multiple Display Commands. . . . . . . . . . . . . . . . . . . 182
Improving Efficiency With External Sorts . . . . . . . . . . . . . . . . . . . . . . . . . . . . . . . . . . . . . . . . . . . . . . . 189
Providing an Estimate of Input Records or Report Size for Sorting. . . . . . . . . . . . . . . . . . . . .191
Sort Work Files and Return Codes. . . . . . . . . . . . . . . . . . . . . . . . . . . . . . . . . . . . . . . . . . . . . . . .191
Mainframe External Sort Utilities and Message Options. . . . . . . . . . . . . . . . . . . . . . . . . . . . . 193
Diagnosing External Sort Errors. . . . . . . . . . . . . . . . . . . . . . . . . . . . . . . . . . . . . . . . . . . . .194
Aggregation by External Sort (Mainframe Environments Only). . . . . . . . . . . . . . . . . . . . . . . . .196
Changing Retrieval Order With Aggregation . . . . . . . . . . . . . . . . . . . . . . . . . . . . . . . . . . . . . . . .198
Creating a HOLD File With an External Sort (Mainframe Environments Only) . . . . . . . . . . . .199
Hierarchical Reporting: BY HIERARCHY . . . . . . . . . . . . . . . . . . . . . . . . . . . . . . . . . . . . . . . . . . . . . . . . 200
4. Selecting Records for Your Report . . . . . . . . . . . . . . . . . . . . . . . . . . . . . . . . . . . . . . . . . . . 217
Selecting Records Overview . . . . . . . . . . . . . . . . . . . . . . . . . . . . . . . . . . . . . . . . . . . . . . . . . . . . . . . . . .217
Choosing a Filtering Method . . . . . . . . . . . . . . . . . . . . . . . . . . . . . . . . . . . . . . . . . . . . . . . . . . . . . . . . . 218
Selections Based on Individual Values . . . . . . . . . . . . . . . . . . . . . . . . . . . . . . . . . . . . . . . . . . . . . . . . 218
Controlling Record Selection in Multi-path Data Sources. . . . . . . . . . . . . . . . . . . . . . . . . . . . .221
Selection Based on Aggregate Values . . . . . . . . . . . . . . . . . . . . . . . . . . . . . . . . . . . . . . . . . . . . . . . . . 226
Applying Selection Criteria to the Internal Matrix Prior to COMPUTE Processing . . . . . . . . . . . . . .228
Using Compound Expressions for Record Selection . . . . . . . . . . . . . . . . . . . . . . . . . . . . . . . . . . . . . 235
Using Operators in Record Selection Tests . . . . . . . . . . . . . . . . . . . . . . . . . . . . . . . . . . . . . . . . . . . . .236
Types of Record Selection Tests . . . . . . . . . . . . . . . . . . . . . . . . . . . . . . . . . . . . . . . . . . . . . . . . . . . . . .243
Range Tests With FROM and TO. . . . . . . . . . . . . . . . . . . . . . . . . . . . . . . . . . . . . . . . . . . . . . . . . 243
Range Tests With GE and LE or GT and LT. . . . . . . . . . . . . . . . . . . . . . . . . . . . . . . . . . . . . . . . .245
Missing Data Tests. . . . . . . . . . . . . . . . . . . . . . . . . . . . . . . . . . . . . . . . . . . . . . . . . . . . . . . . . . . . 246
Character String Screening With CONTAINS and OMITS. . . . . . . . . . . . . . . . . . . . . . . . . . . . . 247
Screening on Masked Fields. . . . . . . . . . . . . . . . . . . . . . . . . . . . . . . . . . . . . . . . . . . . . . . . . . . . 248
Using an Escape Character for LIKE. . . . . . . . . . . . . . . . . . . . . . . . . . . . . . . . . . . . . . . . . . . . . . 253
Qualifying Parent Segments Using INCLUDES and EXCLUDES. . . . . . . . . . . . . . . . . . . . . . . . 256
Selections Based on Group Key Values . . . . . . . . . . . . . . . . . . . . . . . . . . . . . . . . . . . . . . . . . . . . . . . .257
Contents
Creating Reports With TIBCO® WebFOCUS Language 5

Setting Limits on the Number of Records Read . . . . . . . . . . . . . . . . . . . . . . . . . . . . . . . . . . . . . . . . . 258
Selecting Records Using IF Phrases . . . . . . . . . . . . . . . . . . . . . . . . . . . . . . . . . . . . . . . . . . . . . . . . . . .259
Reading Selection Values From a File . . . . . . . . . . . . . . . . . . . . . . . . . . . . . . . . . . . . . . . . . . . . . . . . . 260
Assigning Screening Conditions to a File . . . . . . . . . . . . . . . . . . . . . . . . . . . . . . . . . . . . . . . . . . . . . . .265
Preserving Filters Across Joins. . . . . . . . . . . . . . . . . . . . . . . . . . . . . . . . . . . . . . . . . . . . . . . . . . .271
VSAM Record Selection Efficiencies . . . . . . . . . . . . . . . . . . . . . . . . . . . . . . . . . . . . . . . . . . . . . . . . . . .274
Reporting From Files With Alternate Indexes. . . . . . . . . . . . . . . . . . . . . . . . . . . . . . . . . . . . . . . 274
5. Creating Temporary Fields . . . . . . . . . . . . . . . . . . . . . . . . . . . . . . . . . . . . . . . . . . . . . . . . . . . 277
What Is a Temporary Field? . . . . . . . . . . . . . . . . . . . . . . . . . . . . . . . . . . . . . . . . . . . . . . . . . . . . . . . . . . 277
Defining a Virtual Field . . . . . . . . . . . . . . . . . . . . . . . . . . . . . . . . . . . . . . . . . . . . . . . . . . . . . . . . . . . . . . 280
Defining Multiple Virtual Fields. . . . . . . . . . . . . . . . . . . . . . . . . . . . . . . . . . . . . . . . . . . . . . . . . . .286
Displaying Virtual Fields. . . . . . . . . . . . . . . . . . . . . . . . . . . . . . . . . . . . . . . . . . . . . . . . . . . . . . . . 287
Clearing a Virtual Field. . . . . . . . . . . . . . . . . . . . . . . . . . . . . . . . . . . . . . . . . . . . . . . . . . . . . . . . . .288
Establishing a Segment Location for a Virtual Field. . . . . . . . . . . . . . . . . . . . . . . . . . . . . . . . . 289
Defining Virtual Fields Using a Multi-Path Data Source. . . . . . . . . . . . . . . . . . . . . . . . . . . . . . 290
Increasing the Speed of Calculations in Virtual Fields. . . . . . . . . . . . . . . . . . . . . . . . . . . . . . . 290
Preserving Virtual Fields Using DEFINE FILE SAVE and RETURN. . . . . . . . . . . . . . . . . . . . . . .291
Applying Dynamically Formatted Virtual Fields to Report Columns. . . . . . . . . . . . . . . . . . . . . 292
Passing Function Calls Directly to a Relational Engine Using SQL.Function Syntax. . . . . . .295
Creating a Calculated Value . . . . . . . . . . . . . . . . . . . . . . . . . . . . . . . . . . . . . . . . . . . . . . . . . . . . . . . . . .297
Using Positional Column Referencing With Calculated Values. . . . . . . . . . . . . . . . . . . . . . . . 300
Using ACROSS With Calculated Values. . . . . . . . . . . . . . . . . . . . . . . . . . . . . . . . . . . . . . . . . . . .301
Sorting Calculated Values. . . . . . . . . . . . . . . . . . . . . . . . . . . . . . . . . . . . . . . . . . . . . . . . . . . . . . .302
Screening on Calculated Values. . . . . . . . . . . . . . . . . . . . . . . . . . . . . . . . . . . . . . . . . . . . . . . . . 302
Assigning Column Reference Numbers . . . . . . . . . . . . . . . . . . . . . . . . . . . . . . . . . . . . . . . . . . . . . . . . 302
Using Column Notation in a Report Request. . . . . . . . . . . . . . . . . . . . . . . . . . . . . . . . . . . . . . . 303
Using FORECAST in a COMPUTE Command . . . . . . . . . . . . . . . . . . . . . . . . . . . . . . . . . . . . . . . . . . . . 313
Calculating Trends and Predicting Values With FORECAST. . . . . . . . . . . . . . . . . . . . . . . . . . . 313
FORECAST Processing. . . . . . . . . . . . . . . . . . . . . . . . . . . . . . . . . . . . . . . . . . . . . . . . . . . . .314
FORECAST_MOVAVE: Using a Simple Moving Average. . . . . . . . . . . . . . . . . . . . . . . . . .315
FORECAST_EXPAVE: Using Single Exponential Smoothing. . . . . . . . . . . . . . . . . . . . . . 320
FORECAST_DOUBLEXP: Using Double Exponential Smoothing. . . . . . . . . . . . . . . . . . . 324
Contents
6

FORECAST_SEASONAL: Using Triple Exponential Smoothing. . . . . . . . . . . . . . . . . . . . 326
FORECAST_LINEAR: Using a Linear Regression Equation. . . . . . . . . . . . . . . . . . . . . . . 331
Distinguishing Data Rows From Predicted Rows. . . . . . . . . . . . . . . . . . . . . . . . . . . . . . .334
Calculating Trends and Predicting Values With FORECAST . . . . . . . . . . . . . . . . . . . . . . . . . . . . . . . . 336
FORECAST Processing. . . . . . . . . . . . . . . . . . . . . . . . . . . . . . . . . . . . . . . . . . . . . . . . . . . . . . . . . .337
Using a Simple Moving Average. . . . . . . . . . . . . . . . . . . . . . . . . . . . . . . . . . . . . . . . . . . . . . . . . .341
Using Single Exponential Smoothing. . . . . . . . . . . . . . . . . . . . . . . . . . . . . . . . . . . . . . . . . . . . . .345
Using Double Exponential Smoothing. . . . . . . . . . . . . . . . . . . . . . . . . . . . . . . . . . . . . . . . . . . . . 347
Using Triple Exponential Smoothing. . . . . . . . . . . . . . . . . . . . . . . . . . . . . . . . . . . . . . . . . . . . . . 349
Using a Linear Regression Equation. . . . . . . . . . . . . . . . . . . . . . . . . . . . . . . . . . . . . . . . . . . . . . 351
FORECAST Reporting Techniques. . . . . . . . . . . . . . . . . . . . . . . . . . . . . . . . . . . . . . . . . . . . . . . . 354
Calculating Trends and Predicting Values With Multivariate REGRESS . . . . . . . . . . . . . . . . . . . . . .357
Using Text Fields in DEFINE and COMPUTE . . . . . . . . . . . . . . . . . . . . . . . . . . . . . . . . . . . . . . . . . . . . .360
Creating Temporary Fields Independent of a Master File . . . . . . . . . . . . . . . . . . . . . . . . . . . . . . . . . 361
6. Including Totals and Subtotals . . . . . . . . . . . . . . . . . . . . . . . . . . . . . . . . . . . . . . . . . . . . . . . 367
Calculating Row and Column Totals . . . . . . . . . . . . . . . . . . . . . . . . . . . . . . . . . . . . . . . . . . . . . . . . . . . 367
Producing Row Totals for Horizontal (ACROSS) Sort Field Values. . . . . . . . . . . . . . . . . . . . . .374
Including Section Totals and a Grand Total . . . . . . . . . . . . . . . . . . . . . . . . . . . . . . . . . . . . . . . . . . . . .375
Including Subtotals . . . . . . . . . . . . . . . . . . . . . . . . . . . . . . . . . . . . . . . . . . . . . . . . . . . . . . . . . . . . . . . . . 377
Recalculating Values for Subtotal Rows . . . . . . . . . . . . . . . . . . . . . . . . . . . . . . . . . . . . . . . . . . . . . . . 383
Summarizing Alphanumeric Columns . . . . . . . . . . . . . . . . . . . . . . . . . . . . . . . . . . . . . . . . . . . . . . . . . . 386
Manipulating Summary Values With Prefix Operators . . . . . . . . . . . . . . . . . . . . . . . . . . . . . . . . . . . . 388
Controlling Summary Line Processing. . . . . . . . . . . . . . . . . . . . . . . . . . . . . . . . . . . . . . . . . . . . .397
Using Prefix Operators With Calculated Values. . . . . . . . . . . . . . . . . . . . . . . . . . . . . . . . . . . . . 402
Using Multiple SUB-TOTAL or SUMMARIZE Commands With Prefix Operators. . . . . . . . . . . 405
Combinations of Summary Commands . . . . . . . . . . . . . . . . . . . . . . . . . . . . . . . . . . . . . . . . . . . . . . . . 407
Producing Summary Columns for Horizontal Sort Fields . . . . . . . . . . . . . . . . . . . . . . . . . . . . . . . . . . 413
Performing Calculations at Sort Field Breaks . . . . . . . . . . . . . . . . . . . . . . . . . . . . . . . . . . . . . . . . . . . 421
Suppressing Grand Totals . . . . . . . . . . . . . . . . . . . . . . . . . . . . . . . . . . . . . . . . . . . . . . . . . . . . . . . . . . . 425
Conditionally Displaying Summary Lines and Text . . . . . . . . . . . . . . . . . . . . . . . . . . . . . . . . . . . . . . . 427
7. Using Expressions . . . . . . . . . . . . . . . . . . . . . . . . . . . . . . . . . . . . . . . . . . . . . . . . . . . . . . . . . . .429
Using Expressions in Commands and Phrases . . . . . . . . . . . . . . . . . . . . . . . . . . . . . . . . . . . . . . . . . .429
Contents
Creating Reports With TIBCO® WebFOCUS Language 7

Types of Expressions . . . . . . . . . . . . . . . . . . . . . . . . . . . . . . . . . . . . . . . . . . . . . . . . . . . . . . . . . . . . . . . 430
Expressions and Field Formats. . . . . . . . . . . . . . . . . . . . . . . . . . . . . . . . . . . . . . . . . . . . . . . . . . 432
Creating a Numeric Expression . . . . . . . . . . . . . . . . . . . . . . . . . . . . . . . . . . . . . . . . . . . . . . . . . . . . . . . 432
Order of Evaluation. . . . . . . . . . . . . . . . . . . . . . . . . . . . . . . . . . . . . . . . . . . . . . . . . . . . . . . . . . . . 435
Evaluating Numeric Expressions With Native-Mode Arithmetic. . . . . . . . . . . . . . . . . . . . . . . . 437
Using Identical Operand Formats With Native-Mode Arithmetic. . . . . . . . . . . . . . . . . . . . . . . 437
Using Different Operand Formats With Native-Mode Arithmetic. . . . . . . . . . . . . . . . . . . . . . . 438
Creating a Date Expression . . . . . . . . . . . . . . . . . . . . . . . . . . . . . . . . . . . . . . . . . . . . . . . . . . . . . . . . . . 439
Formats for Date Values. . . . . . . . . . . . . . . . . . . . . . . . . . . . . . . . . . . . . . . . . . . . . . . . . . . . . . . . 440
Performing Calculations on Dates. . . . . . . . . . . . . . . . . . . . . . . . . . . . . . . . . . . . . . . . . . . . . . . . 441
Cross-Century Dates With DEFINE and COMPUTE. . . . . . . . . . . . . . . . . . . . . . . . . . . . . . . . . . .442
Returned Field Format Selection. . . . . . . . . . . . . . . . . . . . . . . . . . . . . . . . . . . . . . . . . . . . . . . . . 443
Using a Date Constant in an Expression. . . . . . . . . . . . . . . . . . . . . . . . . . . . . . . . . . . . . . . . . . 443
Extracting a Date Component. . . . . . . . . . . . . . . . . . . . . . . . . . . . . . . . . . . . . . . . . . . . . . . . . . . .444
Combining Fields With Different Formats in an Expression. . . . . . . . . . . . . . . . . . . . . . . . . . . 444
Creating a Date-Time Expression . . . . . . . . . . . . . . . . . . . . . . . . . . . . . . . . . . . . . . . . . . . . . . . . . . . . . 445
Specifying a Date-Time Value. . . . . . . . . . . . . . . . . . . . . . . . . . . . . . . . . . . . . . . . . . . . . . . . . . . . 450
Manipulating Date-Time Values. . . . . . . . . . . . . . . . . . . . . . . . . . . . . . . . . . . . . . . . . . . . . . . . . . 454
Creating a Character Expression . . . . . . . . . . . . . . . . . . . . . . . . . . . . . . . . . . . . . . . . . . . . . . . . . . . . . .456
Embedding a Quotation Mark in a Quote-Delimited Literal String. . . . . . . . . . . . . . . . . . . . . .457
Concatenating Character Strings. . . . . . . . . . . . . . . . . . . . . . . . . . . . . . . . . . . . . . . . . . . . . . . . . 458
Creating a Variable Length Character Expression . . . . . . . . . . . . . . . . . . . . . . . . . . . . . . . . . . . . . . . .460
Using Concatenation With AnV Fields. . . . . . . . . . . . . . . . . . . . . . . . . . . . . . . . . . . . . . . . . . . . . 461
Using the EDIT Function With AnV Fields. . . . . . . . . . . . . . . . . . . . . . . . . . . . . . . . . . . . . . . . . . 461
Using CONTAINS and OMITS With AnV Fields. . . . . . . . . . . . . . . . . . . . . . . . . . . . . . . . . . . . . . 461
Using LIKE With AnV Fields. . . . . . . . . . . . . . . . . . . . . . . . . . . . . . . . . . . . . . . . . . . . . . . . . . . . . .462
Using the EQ, NE, LT, GT, LE, and GE Operators With AnV Fields. . . . . . . . . . . . . . . . . . . . . 462
Using the DECODE Function With AnV Fields. . . . . . . . . . . . . . . . . . . . . . . . . . . . . . . . . . . . . . .463
Using the Assignment Operator With AnV Fields. . . . . . . . . . . . . . . . . . . . . . . . . . . . . . . . . . . . 464
Creating a Logical Expression . . . . . . . . . . . . . . . . . . . . . . . . . . . . . . . . . . . . . . . . . . . . . . . . . . . . . . . . 465
Creating a Conditional Expression . . . . . . . . . . . . . . . . . . . . . . . . . . . . . . . . . . . . . . . . . . . . . . . . . . . . 467
8. Saving and Reusing Your Report Output . . . . . . . . . . . . . . . . . . . . . . . . . . . . . . . . . . . . . . 471
Contents
8

Saving Your Report Output . . . . . . . . . . . . . . . . . . . . . . . . . . . . . . . . . . . . . . . . . . . . . . . . . . . . . . . . . . .472
Naming and Storing Report Output Files. . . . . . . . . . . . . . . . . . . . . . . . . . . . . . . . . . . . . . . . . . 472
Creating a HOLD File . . . . . . . . . . . . . . . . . . . . . . . . . . . . . . . . . . . . . . . . . . . . . . . . . . . . . . . . . . . . . . . .473
Holding Report Output in TIBCO FOCUS Format . . . . . . . . . . . . . . . . . . . . . . . . . . . . . . . . . . . . . . . . . 479
Controlling Attributes in HOLD Master Files . . . . . . . . . . . . . . . . . . . . . . . . . . . . . . . . . . . . . . . . . . . . 484
Controlling Field Names in a HOLD Master File. . . . . . . . . . . . . . . . . . . . . . . . . . . . . . . . . . . . .485
Controlling Fields in a HOLD Master File. . . . . . . . . . . . . . . . . . . . . . . . . . . . . . . . . . . . . . . . . . 490
Controlling Attributes in the HOLD Master File. . . . . . . . . . . . . . . . . . . . . . . . . . . . . . . . . . . . . 495
Keyed Retrieval From HOLD Files . . . . . . . . . . . . . . . . . . . . . . . . . . . . . . . . . . . . . . . . . . . . . . . . . . . . . 496
Saving and Retrieving HOLD Files . . . . . . . . . . . . . . . . . . . . . . . . . . . . . . . . . . . . . . . . . . . . . . . . . . . . .498
Using DBMS Temporary Tables as HOLD Files . . . . . . . . . . . . . . . . . . . . . . . . . . . . . . . . . . . . . . . . . . 500
Column Names in the HOLD File. . . . . . . . . . . . . . . . . . . . . . . . . . . . . . . . . . . . . . . . . . . . . . . . . 505
Primary Keys and Indexes in the HOLD File. . . . . . . . . . . . . . . . . . . . . . . . . . . . . . . . . . . . . . . . 505
Creating SAVE and SAVB Files . . . . . . . . . . . . . . . . . . . . . . . . . . . . . . . . . . . . . . . . . . . . . . . . . . . . . . . 506
Creating a PCHOLD File . . . . . . . . . . . . . . . . . . . . . . . . . . . . . . . . . . . . . . . . . . . . . . . . . . . . . . . . . . . . . 509
Choosing Output File Formats . . . . . . . . . . . . . . . . . . . . . . . . . . . . . . . . . . . . . . . . . . . . . . . . . . . . . . . . 511
Merging Data Into an Existing Data Source With ON TABLE MERGE . . . . . . . . . . . . . . . . . . . . . . . . 534
Using Text Fields in Output Files . . . . . . . . . . . . . . . . . . . . . . . . . . . . . . . . . . . . . . . . . . . . . . . . . . . . . .547
Creating a Delimited Sequential File . . . . . . . . . . . . . . . . . . . . . . . . . . . . . . . . . . . . . . . . . . . . . . . . . . 549
Saving Report Output in INTERNAL Format . . . . . . . . . . . . . . . . . . . . . . . . . . . . . . . . . . . . . . . . . . . . . 558
Creating A Subquery or Sequential File With HOLD FORMAT SQL_SCRIPT . . . . . . . . . . . . . . . . . . . 561
Creating a Structured HOLD File . . . . . . . . . . . . . . . . . . . . . . . . . . . . . . . . . . . . . . . . . . . . . . . . . . . . . . 564
9. Choosing a Display Format . . . . . . . . . . . . . . . . . . . . . . . . . . . . . . . . . . . . . . . . . . . . . . . . . . .575
Report Display Formats . . . . . . . . . . . . . . . . . . . . . . . . . . . . . . . . . . . . . . . . . . . . . . . . . . . . . . . . . . . . . 576
Preserving Leading and Internal Blanks in Report Output . . . . . . . . . . . . . . . . . . . . . . . . . . . . . . . . .579
Using Web Display Format: HTML . . . . . . . . . . . . . . . . . . . . . . . . . . . . . . . . . . . . . . . . . . . . . . . . . . . . .581
Using Print Display Formats: PDF, PS . . . . . . . . . . . . . . . . . . . . . . . . . . . . . . . . . . . . . . . . . . . . . . . . . .584
Using PDF Display Format. . . . . . . . . . . . . . . . . . . . . . . . . . . . . . . . . . . . . . . . . . . . . . . . . . . . . . .585
Displaying Watermarks in PDF Output. . . . . . . . . . . . . . . . . . . . . . . . . . . . . . . . . . . . . . . 586
Features Supported. . . . . . . . . . . . . . . . . . . . . . . . . . . . . . . . . . . . . . . . . . . . . . . . . .590
Limits. . . . . . . . . . . . . . . . . . . . . . . . . . . . . . . . . . . . . . . . . . . . . . . . . . . . . . . . . . . . . 590
Usage Notes. . . . . . . . . . . . . . . . . . . . . . . . . . . . . . . . . . . . . . . . . . . . . . . . . . . . . . . 590
Contents
Creating Reports With TIBCO® WebFOCUS Language 9

Scaling PDF Report Output to Fit the Page Width. . . . . . . . . . . . . . . . . . . . . . . . . . . . . . 590
Aligning a PDF Report Within a Page. . . . . . . . . . . . . . . . . . . . . . . . . . . . . . . . . . . . . . . . .597
WebFOCUS PDF Report Accessibility Support. . . . . . . . . . . . . . . . . . . . . . . . . . . . . . . . . 600
Controlling PDF Code For Accessibility. . . . . . . . . . . . . . . . . . . . . . . . . . . . . . . . . . 601
Aligning Elements in a Page Heading With Column Data. . . . . . . . . . . . . . . . . . 605
Adding Bookmarks. . . . . . . . . . . . . . . . . . . . . . . . . . . . . . . . . . . . . . . . . . . . . . . . . . 609
Adding Descriptive Text to an Image. . . . . . . . . . . . . . . . . . . . . . . . . . . . . . . . . . . 616
Describing Drill Down Information. . . . . . . . . . . . . . . . . . . . . . . . . . . . . . . . . . . . . .618
Accessibility Limitations. . . . . . . . . . . . . . . . . . . . . . . . . . . . . . . . . . . . . . . . . . . . . . 621
Using PostScript (PS) Display Format. . . . . . . . . . . . . . . . . . . . . . . . . . . . . . . . . . . . . . . . . . . . . 621
WebFOCUS Font Support. . . . . . . . . . . . . . . . . . . . . . . . . . . . . . . . . . . . . . . . . . . . . . . . . . . . . . . 624
How WebFOCUS Uses Type 1 Fonts. . . . . . . . . . . . . . . . . . . . . . . . . . . . . . . . . . . . . . . . . 625
Adding PostScript Type 1 Fonts for PS and PDF Formats. . . . . . . . . . . . . . . . . . . . . . . 626
Embedding TrueType Fonts Into WebFOCUS PDF Reports Generated in Windows. . .635
Creating PDF Files on z/OS for Use With UNIX Systems. . . . . . . . . . . . . . . . . . . . . . . . . . . . . 642
Using Word Processing Display Formats: DOC, WP . . . . . . . . . . . . . . . . . . . . . . . . . . . . . . . . . . . . . . 644
Saving Report Output in Excel XLSX Format . . . . . . . . . . . . . . . . . . . . . . . . . . . . . . . . . . . . . . . . . . . . 645
Overview of EXL07/XLSX Format. . . . . . . . . . . . . . . . . . . . . . . . . . . . . . . . . . . . . . . . . . . . . . . . . 646
Building the .xlsx Workbook File. . . . . . . . . . . . . . . . . . . . . . . . . . . . . . . . . . . . . . . . . . . . 647
Opening XLSX Report Output. . . . . . . . . . . . . . . . . . . . . . . . . . . . . . . . . . . . . . . . . . . . . . . 649
Formatting Values Within Cells in XLSX Report Output. . . . . . . . . . . . . . . . . . . . . . . . . . . . . . .652
Displaying Formatted Numeric Values in XLSX Report Output. . . . . . . . . . . . . . . . . . . 652
Using Numeric Formats in Report Headings and Footings. . . . . . . . . . . . . . . . . . . . . . 655
Using Numeric Format Punctuation in Headings and Footings. . . . . . . . . . . . . . . . . . . 655
Passing Dates to XLSX Report Output. . . . . . . . . . . . . . . . . . . . . . . . . . . . . . . . . . . . . . . 658
Passing Dates Without a Day Component. . . . . . . . . . . . . . . . . . . . . . . . . . . . . . . . . . . . 659
Passing Date Components for Use in Excel Formulas. . . . . . . . . . . . . . . . . . . . . . . . . . 660
Passing Quarter Formats. . . . . . . . . . . . . . . . . . . . . . . . . . . . . . . . . . . . . . . . . . . . . . . . . . 661
Passing Date Components Defined as Translated Text. . . . . . . . . . . . . . . . . . . . . . . . .662
Passing Date-Time to XLSX. . . . . . . . . . . . . . . . . . . . . . . . . . . . . . . . . . . . . . . . . . . . . . . . 663
Generating Native Excel Formulas in XLSX Report Output. . . . . . . . . . . . . . . . . . . . . . . . . . . . 664
Understanding Formula Versus Value. . . . . . . . . . . . . . . . . . . . . . . . . . . . . . . . . . . . . . . .664
Using XLSX FORMULA With Prefix Operators. . . . . . . . . . . . . . . . . . . . . . . . . . . . . . . . . . 673
Contents
10

NODATA With Formulas. . . . . . . . . . . . . . . . . . . . . . . . . . . . . . . . . . . . . . . . . . . . . . . . . . . .676
Controlling Column Width and Wrapping in XLSX Report Output. . . . . . . . . . . . . . . . . . . . . . .677
Synchronizing WebFOCUS Page Breaks With Excel Page Breaks. . . . . . . . . . . . . . . . . . . . . . 681
Preserving Leading and Internal Blanks in Report Output. . . . . . . . . . . . . . . . . . . . . . . . . . . . 687
Support for Drill Downs With XLSX Report Output. . . . . . . . . . . . . . . . . . . . . . . . . . . . . . . . . . .691
Redirection and Excel Drill-Down Reports. . . . . . . . . . . . . . . . . . . . . . . . . . . . . . . . . . . . 691
Excel Page Settings. . . . . . . . . . . . . . . . . . . . . . . . . . . . . . . . . . . . . . . . . . . . . . . . . . . . . . . . . . . . 692
Adding an Image to a Report. . . . . . . . . . . . . . . . . . . . . . . . . . . . . . . . . . . . . . . . . . . . . . . . . . . . 693
Inserting Images Into Excel XLSX Reports. . . . . . . . . . . . . . . . . . . . . . . . . . . . . . . . . . . . 693
Inserting Text and Images Into XLSX Workbook Headers and Footers. . . . . . . . . . . . . . . . . .704
Creating Excel XLSX Worksheets Using Templates. . . . . . . . . . . . . . . . . . . . . . . . . . . . . . . . . .710
Creating Excel Table of Contents Reports. . . . . . . . . . . . . . . . . . . . . . . . . . . . . . . . . . . . . . . . . 712
Naming XLSX Worksheets With Case Sensitive Data. . . . . . . . . . . . . . . . . . . . . . . . . . .714
Overcoming the Excel 2007/2010 Row Limit Using Overflow Worksheets. . . . . . . . . . . . . .715
Excel Compound Reports Using XLSX. . . . . . . . . . . . . . . . . . . . . . . . . . . . . . . . . . . . . . . . . . . . .721
Using XLSX FORMULA With Compound Reports. . . . . . . . . . . . . . . . . . . . . . . . . . . . . . . . . . . . 733
WebFOCUS Pivot Support for XLSX. . . . . . . . . . . . . . . . . . . . . . . . . . . . . . . . . . . . . . . . . . . . . . . 735
FORMAT XLSX Limitations. . . . . . . . . . . . . . . . . . . . . . . . . . . . . . . . . . . . . . . . . . . . . . . . . . . . . . .740
Using PowerPoint PPT Display Format . . . . . . . . . . . . . . . . . . . . . . . . . . . . . . . . . . . . . . . . . . . . . . . . . 741
Using PowerPoint PPT Templates. . . . . . . . . . . . . . . . . . . . . . . . . . . . . . . . . . . . . . . . . . . . . . . . 741
Saving Report Output in PPTX Format . . . . . . . . . . . . . . . . . . . . . . . . . . . . . . . . . . . . . . . . . . . . . . . . . 742
Building the .pptx Presentation File. . . . . . . . . . . . . . . . . . . . . . . . . . . . . . . . . . . . . . . . . . . . . . .744
Opening PPTX Report Output. . . . . . . . . . . . . . . . . . . . . . . . . . . . . . . . . . . . . . . . . . . . . . . . . . . . 746
Opening PPTX Report Output in Microsoft PowerPoint 2000/2003. . . . . . . . . . . . . . .746
Viewing PowerPoint Presentations in the Browser vs. the PowerPoint Application. . 747
Grouping Tables and Components in a PowerPoint Slide. . . . . . . . . . . . . . . . . . . . . . . . . . . . 748
Date and Page/Slide Number. . . . . . . . . . . . . . . . . . . . . . . . . . . . . . . . . . . . . . . . . . . . . . . . . . . 753
Text Formatting Markup Tags for a Text Object. . . . . . . . . . . . . . . . . . . . . . . . . . . . . . . . . . . . . 753
Display Unordered Lists With Bullets, Discs, Squares, and Circles. . . . . . . . . . . . . . .764
Inserting Images In Various Elements of PowerPoint PPTX Reports. . . . . . . . . . . . . . . . . . . .766
Displaying PPTX Charts in PNG Image Format. . . . . . . . . . . . . . . . . . . . . . . . . . . . . . . . . . . . . . 774
Drill Down From Microsoft PowerPoint. . . . . . . . . . . . . . . . . . . . . . . . . . . . . . . . . . . . . . . . . . . . 780
PowerPoint PPTX Presentations Using Templates. . . . . . . . . . . . . . . . . . . . . . . . . . . . . . . . . . .783
Contents
Creating Reports With TIBCO® WebFOCUS Language 11
PowerPoint PPTX Compound Syntax. . . . . . . . . . . . . . . . . . . . . . . . . . . . . . . . . . . . . . . . . . . . . . 790
Coordinated Compound Layout Reports. . . . . . . . . . . . . . . . . . . . . . . . . . . . . . . . . . . . . . . . . . . 795
Templates for Compound Reports. . . . . . . . . . . . . . . . . . . . . . . . . . . . . . . . . . . . . . . . . . . . . . . .800
Adding Images to a Compound Request. . . . . . . . . . . . . . . . . . . . . . . . . . . . . . . . . . . . . . . . . . .801
Template Masters and Slide Layouts. . . . . . . . . . . . . . . . . . . . . . . . . . . . . . . . . . . . . . . . . . . . . 805
Identifying Slide Master Attributes in PowerPoint. . . . . . . . . . . . . . . . . . . . . . . . . . . . . . 805
Merging WebFOCUS Content With PowerPoint Template Content. . . . . . . . . . . . . . . . . . . . . .816
ReportCaster Distribution and ReportCaster Bursting. . . . . . . . . . . . . . . . . . . . . . . . . . . . . . . 819
PPTX Limitations. . . . . . . . . . . . . . . . . . . . . . . . . . . . . . . . . . . . . . . . . . . . . . . . . . . . . . . . . . . . . . .819
Related Information. . . . . . . . . . . . . . . . . . . . . . . . . . . . . . . . . . . . . . . . . . . . . . . . . . . . . . . . . . . . 819
10. Linking a Report to Other Resources . . . . . . . . . . . . . . . . . . . . . . . . . . . . . . . . . . . . . . . . 821
Linking Using StyleSheets . . . . . . . . . . . . . . . . . . . . . . . . . . . . . . . . . . . . . . . . . . . . . . . . . . . . . . . . . . . 821
Linking to Another Report . . . . . . . . . . . . . . . . . . . . . . . . . . . . . . . . . . . . . . . . . . . . . . . . . . . . . . . . . . . .822
Linking to a URL . . . . . . . . . . . . . . . . . . . . . . . . . . . . . . . . . . . . . . . . . . . . . . . . . . . . . . . . . . . . . . . . . . . 827
Defining a Hyperlink Color. . . . . . . . . . . . . . . . . . . . . . . . . . . . . . . . . . . . . . . . . . . . . . . . . . . . . . .832
Linking to a JavaScript Function . . . . . . . . . . . . . . . . . . . . . . . . . . . . . . . . . . . . . . . . . . . . . . . . . . . . . . 835
Linking to a Maintain Data Procedure . . . . . . . . . . . . . . . . . . . . . . . . . . . . . . . . . . . . . . . . . . . . . . . . . 838
Multi-Drill Feature With Cascading Menus and User-Defined Styling . . . . . . . . . . . . . . . . . . . . . . . . 844
Accessibility Support. . . . . . . . . . . . . . . . . . . . . . . . . . . . . . . . . . . . . . . . . . . . . . . . . . . . . . . . . . . 844
Creating Multiple Drill-Down Links. . . . . . . . . . . . . . . . . . . . . . . . . . . . . . . . . . . . . . . . . . . . . . . . 845
Global Menu Styling . . . . . . . . . . . . . . . . . . . . . . . . . . . . . . . . . . . . . . . . . . . . . . . . . . . . . . 845
Menu Items Styling . . . . . . . . . . . . . . . . . . . . . . . . . . . . . . . . . . . . . . . . . . . . . . . . . . . . . . .847
Drill-Down Action Options. . . . . . . . . . . . . . . . . . . . . . . . . . . . . . . . . . . . . . . . . . . . . . . . . . 848
Summary of Drill-Down Links. . . . . . . . . . . . . . . . . . . . . . . . . . . . . . . . . . . . . . . . . . . . . . . 849
Sample Drill Menu Stylesheet Code. . . . . . . . . . . . . . . . . . . . . . . . . . . . . . . . . . . . . . . . . 850
Applying Conditional Styling. . . . . . . . . . . . . . . . . . . . . . . . . . . . . . . . . . . . . . . . . . . . . . . . . . . . . 855
Creating Parameters . . . . . . . . . . . . . . . . . . . . . . . . . . . . . . . . . . . . . . . . . . . . . . . . . . . . . . . . . . . . . . . . 856
Linking With Conditions . . . . . . . . . . . . . . . . . . . . . . . . . . . . . . . . . . . . . . . . . . . . . . . . . . . . . . . . . . . . . 867
Linking From a Graphic Image . . . . . . . . . . . . . . . . . . . . . . . . . . . . . . . . . . . . . . . . . . . . . . . . . . . . . . . . 870
Specifying a Base URL . . . . . . . . . . . . . . . . . . . . . . . . . . . . . . . . . . . . . . . . . . . . . . . . . . . . . . . . . . . . . . 874
Specifying a Target Frame . . . . . . . . . . . . . . . . . . . . . . . . . . . . . . . . . . . . . . . . . . . . . . . . . . . . . . . . . . . 875
Creating a Compound Report . . . . . . . . . . . . . . . . . . . . . . . . . . . . . . . . . . . . . . . . . . . . . . . . . . . . . . . . 878
Contents
12
Creating a Compound Layout Report With Document Syntax. . . . . . . . . . . . . . . . . . . . . . . . . 879
Generating a Table of Contents With BY Field Entries for PPTX and PDF Compound
Layout Reports. . . . . . . . . . . . . . . . . . . . . . . . . . . . . . . . . . . . . . . . . . . . . . . . . . . . . . . . . . . . . 926
Table of Contents Features. . . . . . . . . . . . . . . . . . . . . . . . . . . . . . . . . . . . . . . . . . . . . . . . 927
Creating a Compound PDF or PS Report. . . . . . . . . . . . . . . . . . . . . . . . . . . . . . . . . . . . . . . . . . .936
Creating a Compound Excel Report Using EXL2K. . . . . . . . . . . . . . . . . . . . . . . . . . . . . . . . . . . 945
Creating a PDF Compound Report With Drill Through Links . . . . . . . . . . . . . . . . . . . . . . . . . . . . . . . 956
Sample Drill Through PDF Compound Reports. . . . . . . . . . . . . . . . . . . . . . . . . . . . . . . . . . . . . .961
11. Navigating Within an HTML Report . . . . . . . . . . . . . . . . . . . . . . . . . . . . . . . . . . . . . . . . . . 971
Navigating Sort Groups From a Table of Contents . . . . . . . . . . . . . . . . . . . . . . . . . . . . . . . . . . . . . . . 971
Adding the HTML Table of Contents Tree Control to Reports . . . . . . . . . . . . . . . . . . . . . . . . . . . . . . 973
Navigation Behavior in a Multi-Level TOC. . . . . . . . . . . . . . . . . . . . . . . . . . . . . . . . . . . . . . . . . . 979
Controlling the Display of Sorted Data With Accordion Reports . . . . . . . . . . . . . . . . . . . . . . . . . . . . 991
Requirements for Accordion Reports. . . . . . . . . . . . . . . . . . . . . . . . . . . . . . . . . . . . . . . . . . . . . .993
Creating an Accordion By Row Report. . . . . . . . . . . . . . . . . . . . . . . . . . . . . . . . . . . . . . . . . . . . .994
Accordion By Row Tooltips. . . . . . . . . . . . . . . . . . . . . . . . . . . . . . . . . . . . . . . . . . . . . . . . . . . . . 1008
Accordion By Row With NOPRINT. . . . . . . . . . . . . . . . . . . . . . . . . . . . . . . . . . . . . . . . . . . . . . . .1013
Differences Between Reformatted and Redefined BY Fields. . . . . . . . . . . . . . . . . . . . . . . . .1016
Creating an Accordion By Column Report. . . . . . . . . . . . . . . . . . . . . . . . . . . . . . . . . . . . . . . . .1019
Navigating a Multi-Page Report With the WebFOCUS Viewer . . . . . . . . . . . . . . . . . . . . . . . . . . . . . 1021
Using the WebFOCUS Viewer Search Option. . . . . . . . . . . . . . . . . . . . . . . . . . . . . . . . . . . . . . 1023
Linking Report Pages . . . . . . . . . . . . . . . . . . . . . . . . . . . . . . . . . . . . . . . . . . . . . . . . . . . . . . . . . . . . . . 1024
12. Bursting Reports Into Multiple HTML Files . . . . . . . . . . . . . . . . . . . . . . . . . . . . . . . . . . 1031
Bursting Reports Overview . . . . . . . . . . . . . . . . . . . . . . . . . . . . . . . . . . . . . . . . . . . . . . . . . . . . . . . . . .1031
13. Handling Records With Missing Field Values . . . . . . . . . . . . . . . . . . . . . . . . . . . . . . . .1037
Irrelevant Report Data . . . . . . . . . . . . . . . . . . . . . . . . . . . . . . . . . . . . . . . . . . . . . . . . . . . . . . . . . . . . . 1037
Missing Field Values . . . . . . . . . . . . . . . . . . . . . . . . . . . . . . . . . . . . . . . . . . . . . . . . . . . . . . . . . . . . . . .1038
MISSING Attribute in the Master File. . . . . . . . . . . . . . . . . . . . . . . . . . . . . . . . . . . . . . . . . . . . 1040
MISSING Attribute in a DEFINE or COMPUTE Command. . . . . . . . . . . . . . . . . . . . . . . . . . . . 1041
Testing for Missing Values in IF-THEN-ELSE Expressions. . . . . . . . . . . . . . . . . . . . . . 1047
Testing for a Segment With a Missing Field Value. . . . . . . . . . . . . . . . . . . . . . . . . . . . . . . . . 1050
Preserving Missing Data Values in an Output File. . . . . . . . . . . . . . . . . . . . . . . . . . . . . . . . . 1053
Contents
Creating Reports With TIBCO® WebFOCUS Language 13
Propagating Missing Values to Reformatted Fields in a Request. . . . . . . . . . . . . . . . . . . . .1056
Handling a Missing Segment Instance . . . . . . . . . . . . . . . . . . . . . . . . . . . . . . . . . . . . . . . . . . . . . . . 1058
Including Missing Instances in Reports With the ALL. Prefix. . . . . . . . . . . . . . . . . . . . . . . . .1061
Including Missing Instances in Reports With the SET ALL Parameter. . . . . . . . . . . . . . . . . 1061
Testing for Missing Instances in TIBCO FOCUS Data Sources. . . . . . . . . . . . . . . . . . . . . . . 1068
Setting the NODATA Character String . . . . . . . . . . . . . . . . . . . . . . . . . . . . . . . . . . . . . . . . . . . . . . . . 1068
14. Joining Data Sources . . . . . . . . . . . . . . . . . . . . . . . . . . . . . . . . . . . . . . . . . . . . . . . . . . . . . .1071
Types of Joins . . . . . . . . . . . . . . . . . . . . . . . . . . . . . . . . . . . . . . . . . . . . . . . . . . . . . . . . . . . . . . . . . . . . 1071
Unique and Non-Unique Joined Structures. . . . . . . . . . . . . . . . . . . . . . . . . . . . . . . . . . . . . . . .1074
Recursive Joined Structures. . . . . . . . . . . . . . . . . . . . . . . . . . . . . . . . . . . . . . . . . . . . . . . . . . . .1078
How the JOIN Command Works . . . . . . . . . . . . . . . . . . . . . . . . . . . . . . . . . . . . . . . . . . . . . . . . . . . . . 1083
Creating an Equijoin . . . . . . . . . . . . . . . . . . . . . . . . . . . . . . . . . . . . . . . . . . . . . . . . . . . . . . . . . . . . . . . 1084
Joining From a Virtual Field to a Real Field Using an Equijoin. . . . . . . . . . . . . . . . . . . . . . . .1096
Join Modes in an Equijoin. . . . . . . . . . . . . . . . . . . . . . . . . . . . . . . . . . . . . . . . . . . . . . . . . . . . . .1100
Data Formats of Shared Fields. . . . . . . . . . . . . . . . . . . . . . . . . . . . . . . . . . . . . . . . . . . . . . . . . 1101
Joining Fields With Different Numeric Data Types. . . . . . . . . . . . . . . . . . . . . . . . . . . . . . . . . 1102
Using a Conditional Join . . . . . . . . . . . . . . . . . . . . . . . . . . . . . . . . . . . . . . . . . . . . . . . . . . . . . . . . . . . .1103
Full Outer Joins . . . . . . . . . . . . . . . . . . . . . . . . . . . . . . . . . . . . . . . . . . . . . . . . . . . . . . . . . . . . . . . . . . . 1107
Reporting Against a Multi-Fact Cluster Synonym . . . . . . . . . . . . . . . . . . . . . . . . . . . . . . . . . . . . . . . 1115
Adding a New Fact To Multi-Fact Synonyms: JOIN AS_ROOT. . . . . . . . . . . . . . . . . . . . . . . . .1117
Generating Outer Joins of Cluster Synonym Contexts. . . . . . . . . . . . . . . . . . . . . . . . . . . . . . 1122
Joining From a Multi-Fact Synonym. . . . . . . . . . . . . . . . . . . . . . . . . . . . . . . . . . . . . . . . . . . . . . 1126
Navigating Joins Between Cluster Synonyms . . . . . . . . . . . . . . . . . . . . . . . . . . . . . . . . . . . . . . . . . . 1130
Cross Database Join Optimization . . . . . . . . . . . . . . . . . . . . . . . . . . . . . . . . . . . . . . . . . . . . . . . . . . . 1133
Invoking Context Analysis for a Star Schema With a Fan Trap . . . . . . . . . . . . . . . . . . . . . . . . . . . .1141
Adding DBA Restrictions to the Join Condition: SET DBAJOIN . . . . . . . . . . . . . . . . . . . . . . . . . . . . 1142
Preserving Virtual Fields During Join Parsing . . . . . . . . . . . . . . . . . . . . . . . . . . . . . . . . . . . . . . . . . . 1145
Preserving Virtual Fields Using KEEPDEFINES. . . . . . . . . . . . . . . . . . . . . . . . . . . . . . . . . . . . .1146
Preserving Virtual Fields Using DEFINE FILE SAVE and RETURN. . . . . . . . . . . . . . . . . . . . . .1149
Screening Segments With Conditional JOIN Expressions. . . . . . . . . . . . . . . . . . . . . . . . . . . 1151
Parsing WHERE Criteria in a Join. . . . . . . . . . . . . . . . . . . . . . . . . . . . . . . . . . . . . . . . . . . . . . . .1151
Displaying Joined Structures . . . . . . . . . . . . . . . . . . . . . . . . . . . . . . . . . . . . . . . . . . . . . . . . . . . . . . . . 1151
Contents
14
Clearing Joined Structures . . . . . . . . . . . . . . . . . . . . . . . . . . . . . . . . . . . . . . . . . . . . . . . . . . . . . . . . . .1153
Clearing a Conditional Join. . . . . . . . . . . . . . . . . . . . . . . . . . . . . . . . . . . . . . . . . . . . . . . . . . . . .1154
15. Merging Data Sources . . . . . . . . . . . . . . . . . . . . . . . . . . . . . . . . . . . . . . . . . . . . . . . . . . . . .1157
Merging Data . . . . . . . . . . . . . . . . . . . . . . . . . . . . . . . . . . . . . . . . . . . . . . . . . . . . . . . . . . . . . . . . . . . . . 1157
Types of MATCH Processing . . . . . . . . . . . . . . . . . . . . . . . . . . . . . . . . . . . . . . . . . . . . . . . . . . . . . . . . 1159
MATCH Processing With Common High-Order Sort Fields . . . . . . . . . . . . . . . . . . . . . . . . . . . . . . . .1168
Fine-Tuning MATCH Processing . . . . . . . . . . . . . . . . . . . . . . . . . . . . . . . . . . . . . . . . . . . . . . . . . . . . . .1172
Universal Concatenation . . . . . . . . . . . . . . . . . . . . . . . . . . . . . . . . . . . . . . . . . . . . . . . . . . . . . . . . . . . 1175
Field Name and Format Matching. . . . . . . . . . . . . . . . . . . . . . . . . . . . . . . . . . . . . . . . . . . . . . . 1178
Merging Concatenated Data Sources . . . . . . . . . . . . . . . . . . . . . . . . . . . . . . . . . . . . . . . . . . . . . . . . 1180
Using Sort Fields in MATCH Requests. . . . . . . . . . . . . . . . . . . . . . . . . . . . . . . . . . . . . . . . . . . 1182
Cartesian Product . . . . . . . . . . . . . . . . . . . . . . . . . . . . . . . . . . . . . . . . . . . . . . . . . . . . . . . . . . . . . . . . . 1186
16. Formatting Reports: An Overview . . . . . . . . . . . . . . . . . . . . . . . . . . . . . . . . . . . . . . . . . . 1189
What Kinds of Formatting Can I Do? . . . . . . . . . . . . . . . . . . . . . . . . . . . . . . . . . . . . . . . . . . . . . . . . . 1189
How to Specify Formatting in a Report . . . . . . . . . . . . . . . . . . . . . . . . . . . . . . . . . . . . . . . . . . . . . . . .1192
How to Choose a Type of Style Sheet. . . . . . . . . . . . . . . . . . . . . . . . . . . . . . . . . . . . . . . . . . . .1195
Standard and Legacy Formatting . . . . . . . . . . . . . . . . . . . . . . . . . . . . . . . . . . . . . . . . . . . . . . . . . . . . 1196
Techniques for Quick and Easy Formatting . . . . . . . . . . . . . . . . . . . . . . . . . . . . . . . . . . . . . . . . . . . . 1196
Navigating From a Report to Other Resources . . . . . . . . . . . . . . . . . . . . . . . . . . . . . . . . . . . . . . . . . 1197
17. Creating and Managing a WebFOCUS StyleSheet . . . . . . . . . . . . . . . . . . . . . . . . . . . 1199
Creating a WebFOCUS StyleSheet . . . . . . . . . . . . . . . . . . . . . . . . . . . . . . . . . . . . . . . . . . . . . . . . . . . 1199
Creating a WebFOCUS StyleSheet Within a Report Request. . . . . . . . . . . . . . . . . . . . . . . . .1200
Creating and Applying a WebFOCUS StyleSheet File. . . . . . . . . . . . . . . . . . . . . . . . . . . . . . . 1202
General WebFOCUS StyleSheet Syntax . . . . . . . . . . . . . . . . . . . . . . . . . . . . . . . . . . . . . . . . . . . . . . . 1204
Improving WebFOCUS StyleSheet Readability. . . . . . . . . . . . . . . . . . . . . . . . . . . . . . . . . . . . . 1205
Adding a Comment to a WebFOCUS StyleSheet. . . . . . . . . . . . . . . . . . . . . . . . . . . . . . . . . . . 1206
Reusing WebFOCUS StyleSheet Declarations With Macros . . . . . . . . . . . . . . . . . . . . . . . . . . . . . . 1206
Defining a WebFOCUS StyleSheet Macro. . . . . . . . . . . . . . . . . . . . . . . . . . . . . . . . . . . . . . . . .1206
Applying a WebFOCUS StyleSheet Macro. . . . . . . . . . . . . . . . . . . . . . . . . . . . . . . . . . . . . . . . .1207
WebFOCUS StyleSheet Attribute Inheritance . . . . . . . . . . . . . . . . . . . . . . . . . . . . . . . . . . . . . . . . . . 1209
Creating Reports With the ENWarm StyleSheet . . . . . . . . . . . . . . . . . . . . . . . . . . . . . . . . . . . . . . . . 1213
Report Styling. . . . . . . . . . . . . . . . . . . . . . . . . . . . . . . . . . . . . . . . . . . . . . . . . . . . . . . . . . . . . . . . 1214
Contents
Creating Reports With TIBCO® WebFOCUS Language 15

Data, Report, and Title Styling. . . . . . . . . . . . . . . . . . . . . . . . . . . . . . . . . . . . . . . . . . . . .1214
Headings and Footings Styling. . . . . . . . . . . . . . . . . . . . . . . . . . . . . . . . . . . . . . . . . . . . 1215
Subheading and Subfooting Styling. . . . . . . . . . . . . . . . . . . . . . . . . . . . . . . . . . . . . . . . 1216
Across Styling. . . . . . . . . . . . . . . . . . . . . . . . . . . . . . . . . . . . . . . . . . . . . . . . . . . . . . . . . . 1217
Subtotal and Column Total Styling. . . . . . . . . . . . . . . . . . . . . . . . . . . . . . . . . . . . . . . . . 1218
Active Reports. . . . . . . . . . . . . . . . . . . . . . . . . . . . . . . . . . . . . . . . . . . . . . . . . . . . . . . . . . . . . . . 1218
Pagination, Menu, and Hover Text Styling in WebFOCUS Active Reports. . . . . . . . . 1219
Usage Notes for ENWarm.sty. . . . . . . . . . . . . . . . . . . . . . . . . . . . . . . . . . . . . . . . . . . . . . . . . . .1220
18. Controlling Report Formatting . . . . . . . . . . . . . . . . . . . . . . . . . . . . . . . . . . . . . . . . . . . . . 1221
Generating an Internal Cascading Style Sheet for HTML Reports . . . . . . . . . . . . . . . . . . . . . . . . . 1222
Selecting a Unit of Measurement . . . . . . . . . . . . . . . . . . . . . . . . . . . . . . . . . . . . . . . . . . . . . . . . . . . .1223
Conditionally Formatting, Displaying, and Linking in a StyleSheet . . . . . . . . . . . . . . . . . . . . . . . . 1224
Applying Sequential Conditional Formatting. . . . . . . . . . . . . . . . . . . . . . . . . . . . . . . . . . . . . . .1225
Including Summary Lines, Underlines, Skipped Lines, and Page Breaks . . . . . . . . . . . . . . . . . . .1241
Conditionally Including Summary Lines, Underlines, Skipped Lines, and Page Breaks . . . . . . . 1243
Controlling the Display of Empty Reports . . . . . . . . . . . . . . . . . . . . . . . . . . . . . . . . . . . . . . . . . . . . . 1248
Formatting a Report Using Only StyleSheet Defaults . . . . . . . . . . . . . . . . . . . . . . . . . . . . . . . . . . . 1250
19. Identifying a Report Component in a WebFOCUS StyleSheet . . . . . . . . . . . . . . . . 1251
Identifying an Entire Report, Column, or Row . . . . . . . . . . . . . . . . . . . . . . . . . . . . . . . . . . . . . . . . . . 1251
Identifying Tags for SUBTOTAL and GRANDTOTAL Lines . . . . . . . . . . . . . . . . . . . . . . . . . . . . . . . . .1260
Identifying Data . . . . . . . . . . . . . . . . . . . . . . . . . . . . . . . . . . . . . . . . . . . . . . . . . . . . . . . . . . . . . . . . . . . 1263
Identifying Totals and Subtotals. . . . . . . . . . . . . . . . . . . . . . . . . . . . . . . . . . . . . . . . . . . . . . . . 1269
Identifying a Heading, Footing, Title, or FML Free Text . . . . . . . . . . . . . . . . . . . . . . . . . . . . . . . . . . 1275
Identifying a Column or Row Title. . . . . . . . . . . . . . . . . . . . . . . . . . . . . . . . . . . . . . . . . . . . . . . 1275
Identifying a Heading or Footing. . . . . . . . . . . . . . . . . . . . . . . . . . . . . . . . . . . . . . . . . . . . . . . . 1279
Identifying a Page Number, Underline, or Skipped Line . . . . . . . . . . . . . . . . . . . . . . . . . . . . . . . . . 1290
20. Using an External Cascading Style Sheet . . . . . . . . . . . . . . . . . . . . . . . . . . . . . . . . . . .1295
What Is a Cascading Style Sheet? . . . . . . . . . . . . . . . . . . . . . . . . . . . . . . . . . . . . . . . . . . . . . . . . . . . 1295
What Are Cascading Style Sheet Rules and Classes?. . . . . . . . . . . . . . . . . . . . . . . . . . . . . .1296
Why Use an External Cascading Style Sheet? . . . . . . . . . . . . . . . . . . . . . . . . . . . . . . . . . . . . . . . . . 1297
Formatting a Report With an External Cascading Style Sheet . . . . . . . . . . . . . . . . . . . . . . . . . . . . 1298
Working With an External Cascading Style Sheet . . . . . . . . . . . . . . . . . . . . . . . . . . . . . . . . . . . . . . .1304
Contents
16

Choosing an External Cascading Style Sheet. . . . . . . . . . . . . . . . . . . . . . . . . . . . . . . . . . . . . 1305
External Cascading Style Sheet Location. . . . . . . . . . . . . . . . . . . . . . . . . . . . . . . . . . . . . . . . .1305
Using Several External Cascading Style Sheets. . . . . . . . . . . . . . . . . . . . . . . . . . . . . . . . . . . 1305
Editing an External Cascading Style Sheet. . . . . . . . . . . . . . . . . . . . . . . . . . . . . . . . . . . . . . . 1306
Choosing a Cascading Style Sheet Rule. . . . . . . . . . . . . . . . . . . . . . . . . . . . . . . . . . . . . . . . . 1306
Naming a Cascading Style Sheet Class. . . . . . . . . . . . . . . . . . . . . . . . . . . . . . . . . . . . . . . . . . 1307
Applying External Cascading Style Sheet Formatting . . . . . . . . . . . . . . . . . . . . . . . . . . . . . . . . . . . .1308
Combining an External CSS With Other Formatting Methods . . . . . . . . . . . . . . . . . . . . . . . . . . . . . 1310
Combining an External CSS With a WebFOCUS StyleSheet. . . . . . . . . . . . . . . . . . . . . . . . . .1311
Linking to an External Cascading Style Sheet . . . . . . . . . . . . . . . . . . . . . . . . . . . . . . . . . . . . . . . . . 1312
Using the CSSURL Attribute and Parameter. . . . . . . . . . . . . . . . . . . . . . . . . . . . . . . . . . . . . . 1312
Inheritance and External Cascading Style Sheets . . . . . . . . . . . . . . . . . . . . . . . . . . . . . . . . . . . . . . 1316
Using External Cascading Style Sheets With Non-HTML Reports . . . . . . . . . . . . . . . . . . . . . . . . . 1318
Requirements for Using an External Cascading Style Sheet . . . . . . . . . . . . . . . . . . . . . . . . . . . . . 1323
FAQ About Using External Cascading Style Sheets . . . . . . . . . . . . . . . . . . . . . . . . . . . . . . . . . . . . . 1325
Troubleshooting External Cascading Style Sheets . . . . . . . . . . . . . . . . . . . . . . . . . . . . . . . . . . . . . .1329
21. Laying Out the Report Page . . . . . . . . . . . . . . . . . . . . . . . . . . . . . . . . . . . . . . . . . . . . . . . 1333
Selecting Page Size, Orientation, and Color . . . . . . . . . . . . . . . . . . . . . . . . . . . . . . . . . . . . . . . . . . . 1334
Setting Page Margins . . . . . . . . . . . . . . . . . . . . . . . . . . . . . . . . . . . . . . . . . . . . . . . . . . . . . . . . . . . . . . 1339
Positioning a Report Component . . . . . . . . . . . . . . . . . . . . . . . . . . . . . . . . . . . . . . . . . . . . . . . . . . . . 1342
Arranging Columns on a Page . . . . . . . . . . . . . . . . . . . . . . . . . . . . . . . . . . . . . . . . . . . . . . . . . . . . . . . 1348
Determining Column Width. . . . . . . . . . . . . . . . . . . . . . . . . . . . . . . . . . . . . . . . . . . . . . . . . . . . .1349
Controlling Column Spacing. . . . . . . . . . . . . . . . . . . . . . . . . . . . . . . . . . . . . . . . . . . . . . . . . . . . 1354
Changing Column Order. . . . . . . . . . . . . . . . . . . . . . . . . . . . . . . . . . . . . . . . . . . . . . . . . . . . . . . 1355
Stacking Columns. . . . . . . . . . . . . . . . . . . . . . . . . . . . . . . . . . . . . . . . . . . . . . . . . . . . . . . . . . . . 1357
Alignment of Fields in Reports Using OVER in PDF Report Output. . . . . . . . . . . . . . .1360
Positioning a Column. . . . . . . . . . . . . . . . . . . . . . . . . . . . . . . . . . . . . . . . . . . . . . . . . . . . . . . . . 1369
Suppressing Column Display . . . . . . . . . . . . . . . . . . . . . . . . . . . . . . . . . . . . . . . . . . . . . . . . . . . . . . . .1373
Inserting a Page Break . . . . . . . . . . . . . . . . . . . . . . . . . . . . . . . . . . . . . . . . . . . . . . . . . . . . . . . . . . . . .1379
Preventing an Undesirable Split. . . . . . . . . . . . . . . . . . . . . . . . . . . . . . . . . . . . . . . . . . . . . . . . .1385
Inserting Page Numbers . . . . . . . . . . . . . . . . . . . . . . . . . . . . . . . . . . . . . . . . . . . . . . . . . . . . . . . . . . . .1390
Inserting the Total Page Count. . . . . . . . . . . . . . . . . . . . . . . . . . . . . . . . . . . . . . . . . . . . . . . . . 1392
Contents
Creating Reports With TIBCO® WebFOCUS Language 17

Displaying the Total Page Count Within a Sort Group. . . . . . . . . . . . . . . . . . . . . . . . . . . . . . 1394
Assigning Any Page Number to the First Page. . . . . . . . . . . . . . . . . . . . . . . . . . . . . . . . . . . . .1397
Controlling the Display of Page Numbers. . . . . . . . . . . . . . . . . . . . . . . . . . . . . . . . . . . . . . . . .1399
Setting the Number of Data Rows For Each Page in an AHTML Report Request. . . . . . . . 1401
Adding Grids and Borders . . . . . . . . . . . . . . . . . . . . . . . . . . . . . . . . . . . . . . . . . . . . . . . . . . . . . . . . . . 1404
Defining Borders Around Boxes With PPTX and PDF Formats . . . . . . . . . . . . . . . . . . . . . . . . . . . . .1435
Displaying Superscripts On Data, Heading, and Footing Lines . . . . . . . . . . . . . . . . . . . . . . . . . . . 1437
Adding Underlines and Skipped Lines . . . . . . . . . . . . . . . . . . . . . . . . . . . . . . . . . . . . . . . . . . . . . . . . 1442
Removing Blank Lines From a Report . . . . . . . . . . . . . . . . . . . . . . . . . . . . . . . . . . . . . . . . . . . . . . . . 1458
Adding an Image to a Report . . . . . . . . . . . . . . . . . . . . . . . . . . . . . . . . . . . . . . . . . . . . . . . . . . . . . . . .1464
Associating Bar Graphs With Report Data . . . . . . . . . . . . . . . . . . . . . . . . . . . . . . . . . . . . . . . . . . . . .1501
Controlling Bar Graph Scaling in Horizontal (ACROSS) Sort Fields. . . . . . . . . . . . . . . . . . . .1508
Applying Scaling to Data Visualization Bar Graphs. . . . . . . . . . . . . . . . . . . . . . . . . . . . . . . . . 1510
Working With Mailing Labels and Multi-Pane Pages . . . . . . . . . . . . . . . . . . . . . . . . . . . . . . . . . . . . 1512
22. Using Headings, Footings, Titles, and Labels . . . . . . . . . . . . . . . . . . . . . . . . . . . . . . . 1519
Creating Headings and Footings . . . . . . . . . . . . . . . . . . . . . . . . . . . . . . . . . . . . . . . . . . . . . . . . . . . . .1520
Limits for Headings and Footings. . . . . . . . . . . . . . . . . . . . . . . . . . . . . . . . . . . . . . . . . . . . . . . 1521
Extending Heading and Footing Code to Multiple Lines in a Report Request. . . . . . . . . . .1522
Creating a Custom Report or Worksheet Title. . . . . . . . . . . . . . . . . . . . . . . . . . . . . . . . . . . . . 1524
Creating a Report Heading or Footing. . . . . . . . . . . . . . . . . . . . . . . . . . . . . . . . . . . . . . . . . . . .1527
Creating a Page Heading or Footing. . . . . . . . . . . . . . . . . . . . . . . . . . . . . . . . . . . . . . . . . . . . . 1534
Freezing HTML and AHTML Headings, Footings, and Column Titles. . . . . . . . . . . . . . . . . . 1542
Creating a Sort Heading or Footing. . . . . . . . . . . . . . . . . . . . . . . . . . . . . . . . . . . . . . . . . . . . . . 1545
Including an Element in a Heading or Footing . . . . . . . . . . . . . . . . . . . . . . . . . . . . . . . . . . . . . . . . . 1559
Including a Field Value in a Heading or Footing. . . . . . . . . . . . . . . . . . . . . . . . . . . . . . . . . . . .1560
Including a Text Field in a Heading or Footing. . . . . . . . . . . . . . . . . . . . . . . . . . . . . . . . . . . . . 1567
Including a Page Number in a Heading or Footing. . . . . . . . . . . . . . . . . . . . . . . . . . . . . . . . . 1569
Including a Dialogue Manager Variable in a Heading or Footing. . . . . . . . . . . . . . . . . . . . . .1569
Including an Image in a Heading or Footing. . . . . . . . . . . . . . . . . . . . . . . . . . . . . . . . . . . . . . .1571
Displaying Syntax Components in Heading and Footing Objects . . . . . . . . . . . . . . . . . . . . . . . . . . 1572
Repeating Headings and Footings on Panels in PDF Report Output . . . . . . . . . . . . . . . . . . . . . . . 1574
Customizing a Column Title . . . . . . . . . . . . . . . . . . . . . . . . . . . . . . . . . . . . . . . . . . . . . . . . . . . . . . . . .1591
Contents
18

Customizing a Column Title in a Master File. . . . . . . . . . . . . . . . . . . . . . . . . . . . . . . . . . . . . . 1596
Distinguishing Between Duplicate Field Names. . . . . . . . . . . . . . . . . . . . . . . . . . . . . . . . . . . 1596
Controlling Column Title Underlining Using a SET Command . . . . . . . . . . . . . . . . . . . . . . . . . . . . . 1597
Controlling Column Title Underlining Using a StyleSheet Attribute . . . . . . . . . . . . . . . . . . . . . . . . 1599
Creating Labels to Identify Data . . . . . . . . . . . . . . . . . . . . . . . . . . . . . . . . . . . . . . . . . . . . . . . . . . . . . 1602
Creating a Label for a Row or Column Total. . . . . . . . . . . . . . . . . . . . . . . . . . . . . . . . . . . . . . 1602
Creating a Label for a Subtotal and a Grand Total. . . . . . . . . . . . . . . . . . . . . . . . . . . . . . . . . 1604
Creating a Label for a Row in a Financial Report. . . . . . . . . . . . . . . . . . . . . . . . . . . . . . . . . . 1609
Formatting a Heading, Footing, Title, or Label . . . . . . . . . . . . . . . . . . . . . . . . . . . . . . . . . . . . . . . . . 1609
Applying Font Attributes to a Heading, Footing, Title, or Label . . . . . . . . . . . . . . . . . . . . . . . . . . . .1611
Adding Borders and Grid Lines . . . . . . . . . . . . . . . . . . . . . . . . . . . . . . . . . . . . . . . . . . . . . . . . . . . . . . 1615
Justifying a Heading, Footing, Title, or Label . . . . . . . . . . . . . . . . . . . . . . . . . . . . . . . . . . . . . . . . . . 1618
Justifying a Heading or Footing. . . . . . . . . . . . . . . . . . . . . . . . . . . . . . . . . . . . . . . . . . . . . . . . . 1619
Justifying a Column Title. . . . . . . . . . . . . . . . . . . . . . . . . . . . . . . . . . . . . . . . . . . . . . . . . . . . . . .1626
Justifying a Label for a Row or Column Total. . . . . . . . . . . . . . . . . . . . . . . . . . . . . . . . . . . . . .1631
Justifying a Label for a Subtotal or Grand Total. . . . . . . . . . . . . . . . . . . . . . . . . . . . . . . . . . . 1633
Choosing an Alignment Method for Heading and Footing Elements . . . . . . . . . . . . . . . . . . . . . . . 1635
Aligning a Heading or Footing Element in an HTML, XLSX, EXL2K, PDF, PPTX, or DHTML
Report . . . . . . . . . . . . . . . . . . . . . . . . . . . . . . . . . . . . . . . . . . . . . . . . . . . . . . . . . . . . . . . . . . . . . . . . 1637
Aligning a Heading or Footing Element Across Columns in an HTML or PDF Report . . . . . . . . . .1655
Aligning Content in a Multi-Line Heading or Footing . . . . . . . . . . . . . . . . . . . . . . . . . . . . . . . . . . . . .1661
Aligning Decimals in a Multi-Line Heading or Footing. . . . . . . . . . . . . . . . . . . . . . . . . . . . . . .1666
Combining Column and Line Formatting in Headings and Footings. . . . . . . . . . . . . . . . . . . 1668
Positioning Headings, Footings, or Items Within Them . . . . . . . . . . . . . . . . . . . . . . . . . . . . . . . . . . 1673
Using PRINTPLUS. . . . . . . . . . . . . . . . . . . . . . . . . . . . . . . . . . . . . . . . . . . . . . . . . . . . . . . . . . . . .1680
Using Spot Markers to Refine Positioning. . . . . . . . . . . . . . . . . . . . . . . . . . . . . . . . . . . . . . . . 1682
Controlling the Vertical Positioning of a Heading or Footing . . . . . . . . . . . . . . . . . . . . . . . . . . . . . .1687
Placing a Report Heading or Footing on Its Own Page . . . . . . . . . . . . . . . . . . . . . . . . . . . . . . . . . . .1694
23. Formatting Report Data . . . . . . . . . . . . . . . . . . . . . . . . . . . . . . . . . . . . . . . . . . . . . . . . . . . 1699
Specifying Font Format in a Report . . . . . . . . . . . . . . . . . . . . . . . . . . . . . . . . . . . . . . . . . . . . . . . . . . 1699
Specifying Fonts for Reports. . . . . . . . . . . . . . . . . . . . . . . . . . . . . . . . . . . . . . . . . . . . . . . . . . . 1705
Specifying Background Color in a Report . . . . . . . . . . . . . . . . . . . . . . . . . . . . . . . . . . . . . . . . . . . . . .1707
Contents
Creating Reports With TIBCO® WebFOCUS Language 19

Alternating Background Color By Wrapped Line . . . . . . . . . . . . . . . . . . . . . . . . . . . . . . . . . . . . . . . . 1711
Specifying Data Format in a Report . . . . . . . . . . . . . . . . . . . . . . . . . . . . . . . . . . . . . . . . . . . . . . . . . . 1714
Changing the Format of Values in a Report Column. . . . . . . . . . . . . . . . . . . . . . . . . . . . . . . .1715
Controlling Missing Values for a Reformatted Field. . . . . . . . . . . . . . . . . . . . . . . . . . . . . . . . 1717
Using Commas vs. Decimals (Continental Decimal Notation). . . . . . . . . . . . . . . . . . . . . . . .1719
Setting Characters to Represent Null and Missing Values. . . . . . . . . . . . . . . . . . . . . . . . . . 1719
Using Conditional Grid Formatting in a Field. . . . . . . . . . . . . . . . . . . . . . . . . . . . . . . . . . . . . . 1720
Positioning Data in a Report . . . . . . . . . . . . . . . . . . . . . . . . . . . . . . . . . . . . . . . . . . . . . . . . . . . . . . . . 1721
Controlling Wrapping of Report Data. . . . . . . . . . . . . . . . . . . . . . . . . . . . . . . . . . . . . . . . . . . . .1721
Justifying Report Columns. . . . . . . . . . . . . . . . . . . . . . . . . . . . . . . . . . . . . . . . . . . . . . . . . . . . . 1736
Field-Based Reformatting. . . . . . . . . . . . . . . . . . . . . . . . . . . . . . . . . . . . . . . . . . . . . . . . . . . . . . 1738
Displaying Multi-Line An and AnV Fields. . . . . . . . . . . . . . . . . . . . . . . . . . . . . . . . . . . . . . . . . .1741
24. Creating a Graph . . . . . . . . . . . . . . . . . . . . . . . . . . . . . . . . . . . . . . . . . . . . . . . . . . . . . . . . . .1745
Content Analysis: Determining Graphing Objectives . . . . . . . . . . . . . . . . . . . . . . . . . . . . . . . . . . . . 1745
The GRAPH Command . . . . . . . . . . . . . . . . . . . . . . . . . . . . . . . . . . . . . . . . . . . . . . . . . . . . . . . . . . . . . 1746
Similarities Between GRAPH and TABLE. . . . . . . . . . . . . . . . . . . . . . . . . . . . . . . . . . . . . . . . . 1747
Differences Between GRAPH and TABLE. . . . . . . . . . . . . . . . . . . . . . . . . . . . . . . . . . . . . . . . . 1747
Creating an HTML5 Graph . . . . . . . . . . . . . . . . . . . . . . . . . . . . . . . . . . . . . . . . . . . . . . . . . . . . . . . . . . 1749
Selecting a Graph Type . . . . . . . . . . . . . . . . . . . . . . . . . . . . . . . . . . . . . . . . . . . . . . . . . . . . . . . . . . . . 1751
Graph Types. . . . . . . . . . . . . . . . . . . . . . . . . . . . . . . . . . . . . . . . . . . . . . . . . . . . . . . . . . . . . . . . . 1751
Selecting Scales. . . . . . . . . . . . . . . . . . . . . . . . . . . . . . . . . . . . . . . . . . . . . . . . . . . . . . . . . . . . . 1752
Determining Graph Styles With Display Commands and Sort Phrases. . . . . . . . . . . . . . . . 1753
Determining Graph Styles Using LOOKGRAPH. . . . . . . . . . . . . . . . . . . . . . . . . . . . . . . . . . . . .1761
Selecting Values for the X and Y Axes . . . . . . . . . . . . . . . . . . . . . . . . . . . . . . . . . . . . . . . . . . . . . . . .1771
Hiding the Display of a Y-Axis Field. . . . . . . . . . . . . . . . . . . . . . . . . . . . . . . . . . . . . . . . . . . . . . 1773
Interpolating X and Y Axis Values Using Linear Regression. . . . . . . . . . . . . . . . . . . . . . . . . 1773
Creating Multiple Graphs . . . . . . . . . . . . . . . . . . . . . . . . . . . . . . . . . . . . . . . . . . . . . . . . . . . . . . . . . . . 1774
Merging Multiple Graphs. . . . . . . . . . . . . . . . . . . . . . . . . . . . . . . . . . . . . . . . . . . . . . . . . . . . . . .1775
Merging Multiple OLAP Graphs. . . . . . . . . . . . . . . . . . . . . . . . . . . . . . . . . . . . . . . . . . . . . . . . . 1778
Displaying Multiple Graphs in Columns. . . . . . . . . . . . . . . . . . . . . . . . . . . . . . . . . . . . . . . . . . 1780
Plotting Dates in Graphs . . . . . . . . . . . . . . . . . . . . . . . . . . . . . . . . . . . . . . . . . . . . . . . . . . . . . . . . . . . 1781
Basic Date Support for X and Y Axes. . . . . . . . . . . . . . . . . . . . . . . . . . . . . . . . . . . . . . . . . . . . 1782
Contents
20

Formatting Dates for Y-Axis Values. . . . . . . . . . . . . . . . . . . . . . . . . . . . . . . . . . . . . . . . . . . . . . 1783
Refining the Data Set For Your Graph . . . . . . . . . . . . . . . . . . . . . . . . . . . . . . . . . . . . . . . . . . . . . . . . 1783
Displaying Missing Data Values in a Graph . . . . . . . . . . . . . . . . . . . . . . . . . . . . . . . . . . . . . . . . . . . 1784
Applying Conditional Styling to a Graph . . . . . . . . . . . . . . . . . . . . . . . . . . . . . . . . . . . . . . . . . . . . . . . 1789
Linking Graphs to Other Resources . . . . . . . . . . . . . . . . . . . . . . . . . . . . . . . . . . . . . . . . . . . . . . . . . . 1792
Creating Parameters. . . . . . . . . . . . . . . . . . . . . . . . . . . . . . . . . . . . . . . . . . . . . . . . . . . . . . . . . . 1800
Adding Labels to a Graph . . . . . . . . . . . . . . . . . . . . . . . . . . . . . . . . . . . . . . . . . . . . . . . . . . . . . . . . . . .1800
Adding Vertical (Y-axis) and Horizontal (X-axis) Labels to a Graph. . . . . . . . . . . . . . . . . . . . 1801
Applying Custom Styling to a Graph . . . . . . . . . . . . . . . . . . . . . . . . . . . . . . . . . . . . . . . . . . . . . . . . . . 1801
Setting the Graph Height and Width. . . . . . . . . . . . . . . . . . . . . . . . . . . . . . . . . . . . . . . . . . . . . 1802
Customizing Graphs Using SET Parameters. . . . . . . . . . . . . . . . . . . . . . . . . . . . . . . . . . . . . . 1802
Setting Fixed Scales for the X-Axis. . . . . . . . . . . . . . . . . . . . . . . . . . . . . . . . . . . . . . . . . . . . . . 1807
Setting Fixed Scales for the Y-Axis. . . . . . . . . . . . . . . . . . . . . . . . . . . . . . . . . . . . . . . . . . . . . . 1808
Customizing Graphs Using the Graph API and HTML5 JSON Properties. . . . . . . . . . . . . . . 1808
Saving a Graph as an Image File . . . . . . . . . . . . . . . . . . . . . . . . . . . . . . . . . . . . . . . . . . . . . . . . . . . . 1811
Saving a Graph as an Image File Using GRAPHSERVURL. . . . . . . . . . . . . . . . . . . . . . . . . . . 1811
Printing a Graph . . . . . . . . . . . . . . . . . . . . . . . . . . . . . . . . . . . . . . . . . . . . . . . . . . . . . . . . . . . . . . . . . . .1816
25. Creating Financial Reports With Financial Modeling Language (FML) . . . . . . . . . 1817
Reporting With FML . . . . . . . . . . . . . . . . . . . . . . . . . . . . . . . . . . . . . . . . . . . . . . . . . . . . . . . . . . . . . . . .1817
Creating Rows From Data . . . . . . . . . . . . . . . . . . . . . . . . . . . . . . . . . . . . . . . . . . . . . . . . . . . . . . . . . . 1820
Creating Rows From Multiple Records. . . . . . . . . . . . . . . . . . . . . . . . . . . . . . . . . . . . . . . . . . . 1823
Using the BY Phrase in FML Requests. . . . . . . . . . . . . . . . . . . . . . . . . . . . . . . . . . . . . . . . . . . 1828
Combining BY and FOR Phrases in an FML Request. . . . . . . . . . . . . . . . . . . . . . . . . . . . . . . 1829
Supplying Data Directly in a Request . . . . . . . . . . . . . . . . . . . . . . . . . . . . . . . . . . . . . . . . . . . . . . . . .1829
Performing Inter-Row Calculations . . . . . . . . . . . . . . . . . . . . . . . . . . . . . . . . . . . . . . . . . . . . . . . . . . . 1831
Referring to Rows in Calculations . . . . . . . . . . . . . . . . . . . . . . . . . . . . . . . . . . . . . . . . . . . . . . . . . . . .1832
Referring to Columns in Calculations . . . . . . . . . . . . . . . . . . . . . . . . . . . . . . . . . . . . . . . . . . . . . . . . .1835
Referring to Column Numbers in Calculations. . . . . . . . . . . . . . . . . . . . . . . . . . . . . . . . . . . . .1836
Referring to Contiguous Columns in Calculations. . . . . . . . . . . . . . . . . . . . . . . . . . . . . . . . . .1837
Referring to Column Addresses in Calculations. . . . . . . . . . . . . . . . . . . . . . . . . . . . . . . . . . . 1838
Referring to Relative Column Addresses in Calculations. . . . . . . . . . . . . . . . . . . . . . . . . . . .1839
Applying Relative Column Addressing in a RECAP Expression. . . . . . . . . . . . . . . . . . . . . . . 1840
Contents
Creating Reports With TIBCO® WebFOCUS Language 21
Controlling the Creation of Column Reference Numbers. . . . . . . . . . . . . . . . . . . . . . . . . . . . 1840
Referring to Column Values in Calculations. . . . . . . . . . . . . . . . . . . . . . . . . . . . . . . . . . . . . . .1841
Referring to Rows and Columns in Calculations . . . . . . . . . . . . . . . . . . . . . . . . . . . . . . . . . . . . . . . 1842
Referring to Cells in Calculations . . . . . . . . . . . . . . . . . . . . . . . . . . . . . . . . . . . . . . . . . . . . . . . . . . . . 1843
Using Functions in RECAP Calculations . . . . . . . . . . . . . . . . . . . . . . . . . . . . . . . . . . . . . . . . . . . . . . .1845
Inserting Rows of Free Text . . . . . . . . . . . . . . . . . . . . . . . . . . . . . . . . . . . . . . . . . . . . . . . . . . . . . . . . . 1847
Adding a Column to an FML Report . . . . . . . . . . . . . . . . . . . . . . . . . . . . . . . . . . . . . . . . . . . . . . . . . . 1849
Creating a Recursive Model . . . . . . . . . . . . . . . . . . . . . . . . . . . . . . . . . . . . . . . . . . . . . . . . . . . . . . . . .1852
Reporting Dynamically From a Hierarchy . . . . . . . . . . . . . . . . . . . . . . . . . . . . . . . . . . . . . . . . . . . . . . 1853
Requirements for FML Hierarchies. . . . . . . . . . . . . . . . . . . . . . . . . . . . . . . . . . . . . . . . . . . . . . 1854
Displaying an FML Hierarchy. . . . . . . . . . . . . . . . . . . . . . . . . . . . . . . . . . . . . . . . . . . . . . . . . . . 1856
Consolidating an FML Hierarchy. . . . . . . . . . . . . . . . . . . . . . . . . . . . . . . . . . . . . . . . . . . . . . . . 1859
Loading a Hierarchy Manually. . . . . . . . . . . . . . . . . . . . . . . . . . . . . . . . . . . . . . . . . . . . . . . . . . 1867
Customizing a Row Title . . . . . . . . . . . . . . . . . . . . . . . . . . . . . . . . . . . . . . . . . . . . . . . . . . . . . . . . . . . .1870
Formatting an FML Report . . . . . . . . . . . . . . . . . . . . . . . . . . . . . . . . . . . . . . . . . . . . . . . . . . . . . . . . . . 1871
Indenting Row Titles in an FML Hierarchy. . . . . . . . . . . . . . . . . . . . . . . . . . . . . . . . . . . . . . . . 1889
Suppressing the Display of Rows . . . . . . . . . . . . . . . . . . . . . . . . . . . . . . . . . . . . . . . . . . . . . . . . . . . . 1892
Suppressing Rows With No Data. . . . . . . . . . . . . . . . . . . . . . . . . . . . . . . . . . . . . . . . . . . . . . . .1893
Saving and Retrieving Intermediate Report Results . . . . . . . . . . . . . . . . . . . . . . . . . . . . . . . . . . . . .1894
Posting Data. . . . . . . . . . . . . . . . . . . . . . . . . . . . . . . . . . . . . . . . . . . . . . . . . . . . . . . . . . . . . . . . .1894
Creating HOLD Files From FML Reports . . . . . . . . . . . . . . . . . . . . . . . . . . . . . . . . . . . . . . . . . . . . . . .1897
26. Creating a Free-Form Report . . . . . . . . . . . . . . . . . . . . . . . . . . . . . . . . . . . . . . . . . . . . . . .1899
Creating a Free-Form Report . . . . . . . . . . . . . . . . . . . . . . . . . . . . . . . . . . . . . . . . . . . . . . . . . . . . . . . . 1899
Designing a Free-Form Report . . . . . . . . . . . . . . . . . . . . . . . . . . . . . . . . . . . . . . . . . . . . . . . . . . . . . . . 1903
Incorporating Text in a Free-Form Report. . . . . . . . . . . . . . . . . . . . . . . . . . . . . . . . . . . . . . . . . 1904
Incorporating Data Fields in a Free-Form Report. . . . . . . . . . . . . . . . . . . . . . . . . . . . . . . . . . . 1904
Incorporating Graphic Characters in a Free-Form Report. . . . . . . . . . . . . . . . . . . . . . . . . . . . 1905
Laying Out a Free-Form Report. . . . . . . . . . . . . . . . . . . . . . . . . . . . . . . . . . . . . . . . . . . . . . . . . .1905
Sorting and Selecting Records in a Free-Form Report. . . . . . . . . . . . . . . . . . . . . . . . . . . . . . 1906
27. Using SQL to Create Reports . . . . . . . . . . . . . . . . . . . . . . . . . . . . . . . . . . . . . . . . . . . . . . 1907
Supported and Unsupported SQL Statements . . . . . . . . . . . . . . . . . . . . . . . . . . . . . . . . . . . . . . . . . 1907
Using SQL Translator Commands . . . . . . . . . . . . . . . . . . . . . . . . . . . . . . . . . . . . . . . . . . . . . . . . . . . .1910
Contents
22

The SQL SELECT Statement. . . . . . . . . . . . . . . . . . . . . . . . . . . . . . . . . . . . . . . . . . . . . . . . . . . .1912
Using the SQL SELECT Statement Without a FROM Clause. . . . . . . . . . . . . . . . . . . . 1913
SQL Joins. . . . . . . . . . . . . . . . . . . . . . . . . . . . . . . . . . . . . . . . . . . . . . . . . . . . . . . . . . . . . . . . . . . 1913
SQL CREATE TABLE and INSERT INTO Commands. . . . . . . . . . . . . . . . . . . . . . . . . . . . . . . . .1917
SQL CREATE VIEW and DROP VIEW Commands. . . . . . . . . . . . . . . . . . . . . . . . . . . . . . . . . . . 1918
Cartesian Product Style Answer Sets. . . . . . . . . . . . . . . . . . . . . . . . . . . . . . . . . . . . . . . . . . . . 1920
Continental Decimal Notation (CDN). . . . . . . . . . . . . . . . . . . . . . . . . . . . . . . . . . . . . . . . . . . . .1920
Specifying Field Names in SQL Requests. . . . . . . . . . . . . . . . . . . . . . . . . . . . . . . . . . . . . . . . 1920
SQL UNION, INTERSECT, and EXCEPT Operators. . . . . . . . . . . . . . . . . . . . . . . . . . . . . . . . . . 1921
Numeric Constants, Literals, Expressions, and Functions. . . . . . . . . . . . . . . . . . . . . . . . . . 1921
SQL Translator Support for Date, Time, and Timestamp Fields . . . . . . . . . . . . . . . . . . . . . . . . . . .1921
Extracting Date-Time Components Using the SQL Translator. . . . . . . . . . . . . . . . . . . . . . . . 1923
Index Optimized Retrieval . . . . . . . . . . . . . . . . . . . . . . . . . . . . . . . . . . . . . . . . . . . . . . . . . . . . . . . . . . 1926
Optimized Joins. . . . . . . . . . . . . . . . . . . . . . . . . . . . . . . . . . . . . . . . . . . . . . . . . . . . . . . . . . . . . . 1926
TABLEF Optimization . . . . . . . . . . . . . . . . . . . . . . . . . . . . . . . . . . . . . . . . . . . . . . . . . . . . . . . . . . . . . . .1927
SQL INSERT, UPDATE, and DELETE Commands . . . . . . . . . . . . . . . . . . . . . . . . . . . . . . . . . . . . . . . .1927
28. Improving Report Processing . . . . . . . . . . . . . . . . . . . . . . . . . . . . . . . . . . . . . . . . . . . . . . 1929
Rotating a Data Structure for Enhanced Retrieval . . . . . . . . . . . . . . . . . . . . . . . . . . . . . . . . . . . . . . 1929
Optimizing Retrieval Speed for TIBCO FOCUS Data Sources . . . . . . . . . . . . . . . . . . . . . . . . . . . . . 1932
Automatic Indexed Retrieval . . . . . . . . . . . . . . . . . . . . . . . . . . . . . . . . . . . . . . . . . . . . . . . . . . . . . . . . 1932
Data Retrieval Using TABLEF . . . . . . . . . . . . . . . . . . . . . . . . . . . . . . . . . . . . . . . . . . . . . . . . . . . . . . . .1935
Compiling Expressions . . . . . . . . . . . . . . . . . . . . . . . . . . . . . . . . . . . . . . . . . . . . . . . . . . . . . . . . . . . . . 1936
Compiling Expressions Using the DEFINES Parameter. . . . . . . . . . . . . . . . . . . . . . . . . . . . . .1936
A. Master Files and Diagrams . . . . . . . . . . . . . . . . . . . . . . . . . . . . . . . . . . . . . . . . . . . . . . . . . 1937
EMPLOYEE Data Source . . . . . . . . . . . . . . . . . . . . . . . . . . . . . . . . . . . . . . . . . . . . . . . . . . . . . . . . . . . .1937
EMPLOYEE Master File. . . . . . . . . . . . . . . . . . . . . . . . . . . . . . . . . . . . . . . . . . . . . . . . . . . . . . . . 1939
EMPLOYEE Structure Diagram. . . . . . . . . . . . . . . . . . . . . . . . . . . . . . . . . . . . . . . . . . . . . . . . . . 1940
JOBFILE Data Source . . . . . . . . . . . . . . . . . . . . . . . . . . . . . . . . . . . . . . . . . . . . . . . . . . . . . . . . . . . . . . 1940
JOBFILE Master File. . . . . . . . . . . . . . . . . . . . . . . . . . . . . . . . . . . . . . . . . . . . . . . . . . . . . . . . . . .1941
JOBFILE Structure Diagram. . . . . . . . . . . . . . . . . . . . . . . . . . . . . . . . . . . . . . . . . . . . . . . . . . . . .1941
EDUCFILE Data Source . . . . . . . . . . . . . . . . . . . . . . . . . . . . . . . . . . . . . . . . . . . . . . . . . . . . . . . . . . . . .1942
EDUCFILE Master File. . . . . . . . . . . . . . . . . . . . . . . . . . . . . . . . . . . . . . . . . . . . . . . . . . . . . . . . . 1942
Contents
Creating Reports With TIBCO® WebFOCUS Language 23

EDUCFILE Structure Diagram. . . . . . . . . . . . . . . . . . . . . . . . . . . . . . . . . . . . . . . . . . . . . . . . . . . 1943
SALES Data Source . . . . . . . . . . . . . . . . . . . . . . . . . . . . . . . . . . . . . . . . . . . . . . . . . . . . . . . . . . . . . . . 1943
SALES Master File. . . . . . . . . . . . . . . . . . . . . . . . . . . . . . . . . . . . . . . . . . . . . . . . . . . . . . . . . . . . 1944
SALES Structure Diagram. . . . . . . . . . . . . . . . . . . . . . . . . . . . . . . . . . . . . . . . . . . . . . . . . . . . . .1945
CAR Data Source . . . . . . . . . . . . . . . . . . . . . . . . . . . . . . . . . . . . . . . . . . . . . . . . . . . . . . . . . . . . . . . . . .1945
CAR Master File. . . . . . . . . . . . . . . . . . . . . . . . . . . . . . . . . . . . . . . . . . . . . . . . . . . . . . . . . . . . . . 1947
CAR Structure Diagram. . . . . . . . . . . . . . . . . . . . . . . . . . . . . . . . . . . . . . . . . . . . . . . . . . . . . . . . 1948
LEDGER Data Source . . . . . . . . . . . . . . . . . . . . . . . . . . . . . . . . . . . . . . . . . . . . . . . . . . . . . . . . . . . . . . 1948
LEDGER Master File. . . . . . . . . . . . . . . . . . . . . . . . . . . . . . . . . . . . . . . . . . . . . . . . . . . . . . . . . . 1949
LEDGER Structure Diagram. . . . . . . . . . . . . . . . . . . . . . . . . . . . . . . . . . . . . . . . . . . . . . . . . . . . 1949
FINANCE Data Source . . . . . . . . . . . . . . . . . . . . . . . . . . . . . . . . . . . . . . . . . . . . . . . . . . . . . . . . . . . . . .1949
FINANCE Master File. . . . . . . . . . . . . . . . . . . . . . . . . . . . . . . . . . . . . . . . . . . . . . . . . . . . . . . . . . 1949
FINANCE Structure Diagram. . . . . . . . . . . . . . . . . . . . . . . . . . . . . . . . . . . . . . . . . . . . . . . . . . . . 1950
REGION Data Source . . . . . . . . . . . . . . . . . . . . . . . . . . . . . . . . . . . . . . . . . . . . . . . . . . . . . . . . . . . . . . 1950
REGION Master File. . . . . . . . . . . . . . . . . . . . . . . . . . . . . . . . . . . . . . . . . . . . . . . . . . . . . . . . . . .1950
REGION Structure Diagram. . . . . . . . . . . . . . . . . . . . . . . . . . . . . . . . . . . . . . . . . . . . . . . . . . . . .1950
EMPDATA Data Source . . . . . . . . . . . . . . . . . . . . . . . . . . . . . . . . . . . . . . . . . . . . . . . . . . . . . . . . . . . . .1951
EMPDATA Master File. . . . . . . . . . . . . . . . . . . . . . . . . . . . . . . . . . . . . . . . . . . . . . . . . . . . . . . . . 1951
EMPDATA Structure Diagram. . . . . . . . . . . . . . . . . . . . . . . . . . . . . . . . . . . . . . . . . . . . . . . . . . . 1951
TRAINING Data Source . . . . . . . . . . . . . . . . . . . . . . . . . . . . . . . . . . . . . . . . . . . . . . . . . . . . . . . . . . . . .1951
TRAINING Master File. . . . . . . . . . . . . . . . . . . . . . . . . . . . . . . . . . . . . . . . . . . . . . . . . . . . . . . . . 1952
TRAINING Structure Diagram. . . . . . . . . . . . . . . . . . . . . . . . . . . . . . . . . . . . . . . . . . . . . . . . . . . 1952
COURSE Data Source . . . . . . . . . . . . . . . . . . . . . . . . . . . . . . . . . . . . . . . . . . . . . . . . . . . . . . . . . . . . . .1952
COURSE Master File. . . . . . . . . . . . . . . . . . . . . . . . . . . . . . . . . . . . . . . . . . . . . . . . . . . . . . . . . . 1952
COURSE Structure Diagram. . . . . . . . . . . . . . . . . . . . . . . . . . . . . . . . . . . . . . . . . . . . . . . . . . . . 1953
JOBHIST Data Source . . . . . . . . . . . . . . . . . . . . . . . . . . . . . . . . . . . . . . . . . . . . . . . . . . . . . . . . . . . . . .1953
JOBHIST Master File. . . . . . . . . . . . . . . . . . . . . . . . . . . . . . . . . . . . . . . . . . . . . . . . . . . . . . . . . . 1953
JOBHIST Structure Diagram. . . . . . . . . . . . . . . . . . . . . . . . . . . . . . . . . . . . . . . . . . . . . . . . . . . . 1953
JOBLIST Data Source . . . . . . . . . . . . . . . . . . . . . . . . . . . . . . . . . . . . . . . . . . . . . . . . . . . . . . . . . . . . . . 1953
JOBLIST Master File. . . . . . . . . . . . . . . . . . . . . . . . . . . . . . . . . . . . . . . . . . . . . . . . . . . . . . . . . . 1954
JOBLIST Structure Diagram. . . . . . . . . . . . . . . . . . . . . . . . . . . . . . . . . . . . . . . . . . . . . . . . . . . . 1954
LOCATOR Data Source . . . . . . . . . . . . . . . . . . . . . . . . . . . . . . . . . . . . . . . . . . . . . . . . . . . . . . . . . . . . . 1954
LOCATOR Master File. . . . . . . . . . . . . . . . . . . . . . . . . . . . . . . . . . . . . . . . . . . . . . . . . . . . . . . . . 1954
Contents
24

LOCATOR Structure Diagram. . . . . . . . . . . . . . . . . . . . . . . . . . . . . . . . . . . . . . . . . . . . . . . . . . . 1955
PERSINFO Data Source . . . . . . . . . . . . . . . . . . . . . . . . . . . . . . . . . . . . . . . . . . . . . . . . . . . . . . . . . . . . 1955
PERSINFO Master File. . . . . . . . . . . . . . . . . . . . . . . . . . . . . . . . . . . . . . . . . . . . . . . . . . . . . . . . .1955
PERSINFO Structure Diagram. . . . . . . . . . . . . . . . . . . . . . . . . . . . . . . . . . . . . . . . . . . . . . . . . . .1955
SALHIST Data Source . . . . . . . . . . . . . . . . . . . . . . . . . . . . . . . . . . . . . . . . . . . . . . . . . . . . . . . . . . . . . .1956
SALHIST Master File. . . . . . . . . . . . . . . . . . . . . . . . . . . . . . . . . . . . . . . . . . . . . . . . . . . . . . . . . . 1956
SALHIST Structure Diagram. . . . . . . . . . . . . . . . . . . . . . . . . . . . . . . . . . . . . . . . . . . . . . . . . . . . 1956
VIDEOTRK, MOVIES, and ITEMS Data Sources . . . . . . . . . . . . . . . . . . . . . . . . . . . . . . . . . . . . . . . . 1956
VIDEOTRK Master File. . . . . . . . . . . . . . . . . . . . . . . . . . . . . . . . . . . . . . . . . . . . . . . . . . . . . . . . .1957
VIDEOTRK Structure Diagram. . . . . . . . . . . . . . . . . . . . . . . . . . . . . . . . . . . . . . . . . . . . . . . . . . .1958
MOVIES Master File. . . . . . . . . . . . . . . . . . . . . . . . . . . . . . . . . . . . . . . . . . . . . . . . . . . . . . . . . . .1959
MOVIES Structure Diagram. . . . . . . . . . . . . . . . . . . . . . . . . . . . . . . . . . . . . . . . . . . . . . . . . . . . .1959
ITEMS Master File. . . . . . . . . . . . . . . . . . . . . . . . . . . . . . . . . . . . . . . . . . . . . . . . . . . . . . . . . . . . 1959
ITEMS Structure Diagram. . . . . . . . . . . . . . . . . . . . . . . . . . . . . . . . . . . . . . . . . . . . . . . . . . . . . . 1960
VIDEOTR2 Data Source . . . . . . . . . . . . . . . . . . . . . . . . . . . . . . . . . . . . . . . . . . . . . . . . . . . . . . . . . . . . 1960
VIDEOTR2 Master File. . . . . . . . . . . . . . . . . . . . . . . . . . . . . . . . . . . . . . . . . . . . . . . . . . . . . . . . .1960
VIDEOTR2 Structure Diagram. . . . . . . . . . . . . . . . . . . . . . . . . . . . . . . . . . . . . . . . . . . . . . . . . . .1961
Gotham Grinds Data Sources . . . . . . . . . . . . . . . . . . . . . . . . . . . . . . . . . . . . . . . . . . . . . . . . . . . . . . . 1961
GGDEMOG Master File. . . . . . . . . . . . . . . . . . . . . . . . . . . . . . . . . . . . . . . . . . . . . . . . . . . . . . . . 1962
GGDEMOG Structure Diagram. . . . . . . . . . . . . . . . . . . . . . . . . . . . . . . . . . . . . . . . . . . . . . . . . . 1963
GGORDER Master File. . . . . . . . . . . . . . . . . . . . . . . . . . . . . . . . . . . . . . . . . . . . . . . . . . . . . . . . .1963
GGORDER Structure Diagram. . . . . . . . . . . . . . . . . . . . . . . . . . . . . . . . . . . . . . . . . . . . . . . . . . .1964
GGPRODS Master File. . . . . . . . . . . . . . . . . . . . . . . . . . . . . . . . . . . . . . . . . . . . . . . . . . . . . . . . .1964
GGPRODS Structure Diagram. . . . . . . . . . . . . . . . . . . . . . . . . . . . . . . . . . . . . . . . . . . . . . . . . . .1965
GGSALES Master File. . . . . . . . . . . . . . . . . . . . . . . . . . . . . . . . . . . . . . . . . . . . . . . . . . . . . . . . . 1965
GGSALES Structure Diagram. . . . . . . . . . . . . . . . . . . . . . . . . . . . . . . . . . . . . . . . . . . . . . . . . . . 1966
GGSTORES Master File. . . . . . . . . . . . . . . . . . . . . . . . . . . . . . . . . . . . . . . . . . . . . . . . . . . . . . . . 1966
GGSTORES Structure Diagram. . . . . . . . . . . . . . . . . . . . . . . . . . . . . . . . . . . . . . . . . . . . . . . . . .1966
Century Corp Data Sources . . . . . . . . . . . . . . . . . . . . . . . . . . . . . . . . . . . . . . . . . . . . . . . . . . . . . . . . . 1967
CENTCOMP Master File. . . . . . . . . . . . . . . . . . . . . . . . . . . . . . . . . . . . . . . . . . . . . . . . . . . . . . . .1968
CENTCOMP Structure Diagram. . . . . . . . . . . . . . . . . . . . . . . . . . . . . . . . . . . . . . . . . . . . . . . . . 1968
CENTFIN Master File. . . . . . . . . . . . . . . . . . . . . . . . . . . . . . . . . . . . . . . . . . . . . . . . . . . . . . . . . . 1969
CENTFIN Structure Diagram. . . . . . . . . . . . . . . . . . . . . . . . . . . . . . . . . . . . . . . . . . . . . . . . . . . . 1969
Contents
Creating Reports With TIBCO® WebFOCUS Language 25

CENTHR Master File. . . . . . . . . . . . . . . . . . . . . . . . . . . . . . . . . . . . . . . . . . . . . . . . . . . . . . . . . . 1970
CENTHR Structure Diagram. . . . . . . . . . . . . . . . . . . . . . . . . . . . . . . . . . . . . . . . . . . . . . . . . . . . 1972
CENTINV Master File. . . . . . . . . . . . . . . . . . . . . . . . . . . . . . . . . . . . . . . . . . . . . . . . . . . . . . . . . . 1973
CENTINV Structure Diagram. . . . . . . . . . . . . . . . . . . . . . . . . . . . . . . . . . . . . . . . . . . . . . . . . . . . 1973
CENTORD Master File. . . . . . . . . . . . . . . . . . . . . . . . . . . . . . . . . . . . . . . . . . . . . . . . . . . . . . . . . 1974
CENTORD Structure Diagram. . . . . . . . . . . . . . . . . . . . . . . . . . . . . . . . . . . . . . . . . . . . . . . . . . . 1975
CENTQA Master File. . . . . . . . . . . . . . . . . . . . . . . . . . . . . . . . . . . . . . . . . . . . . . . . . . . . . . . . . . 1976
CENTQA Structure Diagram. . . . . . . . . . . . . . . . . . . . . . . . . . . . . . . . . . . . . . . . . . . . . . . . . . . . 1977
CENTGL Master File. . . . . . . . . . . . . . . . . . . . . . . . . . . . . . . . . . . . . . . . . . . . . . . . . . . . . . . . . . .1977
CENTGL Structure Diagram. . . . . . . . . . . . . . . . . . . . . . . . . . . . . . . . . . . . . . . . . . . . . . . . . . . . 1978
CENTSYSF Master File. . . . . . . . . . . . . . . . . . . . . . . . . . . . . . . . . . . . . . . . . . . . . . . . . . . . . . . . 1978
CENTSYSF Structure Diagram. . . . . . . . . . . . . . . . . . . . . . . . . . . . . . . . . . . . . . . . . . . . . . . . . . 1978
CENTSTMT Master File. . . . . . . . . . . . . . . . . . . . . . . . . . . . . . . . . . . . . . . . . . . . . . . . . . . . . . . . 1979
CENTSTMT Structure Diagram. . . . . . . . . . . . . . . . . . . . . . . . . . . . . . . . . . . . . . . . . . . . . . . . . . 1980
CENTGLL Master File. . . . . . . . . . . . . . . . . . . . . . . . . . . . . . . . . . . . . . . . . . . . . . . . . . . . . . . . . .1980
CENTGLL Structure Diagram. . . . . . . . . . . . . . . . . . . . . . . . . . . . . . . . . . . . . . . . . . . . . . . . . . . 1981
B. Error Messages . . . . . . . . . . . . . . . . . . . . . . . . . . . . . . . . . . . . . . . . . . . . . . . . . . . . . . . . . . . . 1983
Displaying Messages . . . . . . . . . . . . . . . . . . . . . . . . . . . . . . . . . . . . . . . . . . . . . . . . . . . . . . . . . . . . . . 1983
C. Table Syntax Summary and Limits . . . . . . . . . . . . . . . . . . . . . . . . . . . . . . . . . . . . . . . . . . 1985
TABLE Syntax Summary . . . . . . . . . . . . . . . . . . . . . . . . . . . . . . . . . . . . . . . . . . . . . . . . . . . . . . . . . . . . 1986
Hierarchical Reporting Syntax Summary. . . . . . . . . . . . . . . . . . . . . . . . . . . . . . . . . . . . . . . . . .1987
TABLEF Syntax Summary . . . . . . . . . . . . . . . . . . . . . . . . . . . . . . . . . . . . . . . . . . . . . . . . . . . . . . . . . . . 1988
MATCH Syntax Summary . . . . . . . . . . . . . . . . . . . . . . . . . . . . . . . . . . . . . . . . . . . . . . . . . . . . . . . . . . . 1989
FOR Syntax Summary . . . . . . . . . . . . . . . . . . . . . . . . . . . . . . . . . . . . . . . . . . . . . . . . . . . . . . . . . . . . . . 1990
TABLE Limits . . . . . . . . . . . . . . . . . . . . . . . . . . . . . . . . . . . . . . . . . . . . . . . . . . . . . . . . . . . . . . . . . . . . . 1991
D. Referring to Fields in a Report Request . . . . . . . . . . . . . . . . . . . . . . . . . . . . . . . . . . . . . 1993
Referring to an Individual Field . . . . . . . . . . . . . . . . . . . . . . . . . . . . . . . . . . . . . . . . . . . . . . . . . . . . . . 1993
Referring to Fields Using Qualified Field Names . . . . . . . . . . . . . . . . . . . . . . . . . . . . . . . . . . . . . . . 1994
Referring to All of the Fields in a Segment . . . . . . . . . . . . . . . . . . . . . . . . . . . . . . . . . . . . . . . . . . . . 1995
Displaying a List of Field Names . . . . . . . . . . . . . . . . . . . . . . . . . . . . . . . . . . . . . . . . . . . . . . . . . . . . 1996
Listing Field Names, Aliases, and Format Information. . . . . . . . . . . . . . . . . . . . . . . . . . . . . .1996
Contents
26

Legal and Third-Party Notices . . . . . . . . . . . . . . . . . . . . . . . . . . . . . . . . . . . . . . . . . . . . . . . . . 1997
Contents
Creating Reports With TIBCO® WebFOCUS Language 27

Contents
28

Chapter1Creating Reports Overview
WebFOCUS is a complete information control system with comprehensive features forretrieving and analyzing data that enables you to create reports quickly and easily. Itprovides facilities for creating highly complex reports, but its strength lies in thesimplicity of the request language. You can begin with simple queries and progress tocomplex reports as you learn about additional facilities.
WebFOCUS serves the needs of both end users with no formal training in dataprocessing, and data processing professionals who need powerful tools for developingcomplete applications. A variety of tools are available that enable you to create reportsand charts even if you do not know HTML or WebFOCUS reporting language commandsand syntax.
In this chapter:
Requirements for Creating a Report
Report Types
Developing Your Report Request
Customizing a Report
Selecting a Report Output Destination
Requirements for Creating a Report
To create a report, only two things are required:
Data. You need data from which to report. If the data is protected by an underlying securitysystem, you may need permission to report from the data source. In addition, the servermust be able to locate the data source. For more information on data source locations, seethe TIBCO WebFOCUS® Developing Reporting Applications manual.
You can report from many different types of data sources (with variations for differentoperating environments), including the following:
Relational data sources, such as DB2, Teradata, Oracle, and Sybase.
Hierarchical data sources, such as IMS and FOCUS.
Creating Reports With TIBCO® WebFOCUS Language 29

Indexed data sources, such as ISAM and VSAM.
Network data sources, such as CA-IDMS.
Sequential data sources, both fixed-format and delimited format.
Multi-dimensional data sources, such as SAP BW and Essbase.
XML data sources.
For a complete list, see the Describing Data With TIBCO WebFOCUS® Language manual.
A data description. You need a Master File, which describes the data source from whichyou are reporting. The Master File is a map of the segments in the data source and all ofthe fields in each segment. For some types of data sources, the Master File issupplemented by an Access File. For more information on Master Files and Access Files,see the Describing Data With TIBCO WebFOCUS® Language manual.
By looking at the Master File, you can determine what fields are in the data source, whatthey are named, and how they are formatted. You can also determine how the segments inthe data source relate to each other. Although you can create a very simple report withoutthis information, knowing the structure of the data source enables you to generate creativeand sophisticated reports.
You can supplement the information in the Master File by generating a picture of the datasource structure (that is, of how the data source segments relate to each other). Use thefollowing command:
CHECK FILE filename PICTURE RETRIEVE
In the picture, segments are shown in the order in which they are retrieved. Four fields ofeach segment appear. For details see Displaying Report Data on page 39.
Report Types
With WebFOCUS, you can create the following basic report types using graphical tools:
Tabular reports. Displays information in rows and columns. This is the basic report type,incorporating the fundamental reporting concepts. Most of the other report formats build onthese concepts. You can display these reports in formats such as HTML, Excel®, and PDF.
Report Types
30

Financial reports. Specifically designed to handle the task of creating, calculating, andpresenting financially oriented data, such as balance sheets, consolidations, and budgets.You can build these reports with the Report canvas. The Matrix Report canvas enables youto define the content of the report on a row-by-row basis. This organization provides anumber of advantages. You can:
Identify and display a title for each row of the report.
Perform row-based calculations and include the results at any point on the report.
Include the same record in multiple categories.
Include many types of formatting enhancements on a cell-by-cell basis.
Save individual rows and row titles in extract files.
Free-form reports. Presents detailed information about a single record in a form-like contextthat is often used with letters and forms. If your goal is to present a detailed picture of onerecord per report page, you can use free-form reports to:
Position headers, footers, free text, and fields precisely on a page.
Customize your headers and footers by including fields as display variables.
Incorporate prefix operators in your headers and footers to perform calculations on theaggregated values of a single field.
Use vertical (BY) sorting to put one or more report records on each page.
For details about free-form reports, see Creating a Free-Form Report on page 1899.
Graphs, which can present the same kinds of information as tabular reports, but in a widevariety of two-dimensional and three-dimensional graph types.
For details, see Creating a Graph on page 1745.
SQL requests, which retrieve information using the SQL reporting language, and can directlyincorporate WebFOCUS formatting commands. For details, see Using SQL to Create Reportson page 1907.
1. Creating Reports Overview
Creating Reports With TIBCO® WebFOCUS Language 31

Drill Through reports. Allow users to create a PDF document that contains a summaryreport plus a detail report, where the detail report contains all the detail data fordesignated fields in the summary report. Clicking a Drill Through hyperlink navigatesinternally in the PDF file and no additional reports are run. Drill Through reports are static.You can save the PDF file to disk or distribute it using ReportCaster. When opened withAcrobat® Reader, it retains its full Drill Through functionality. For more information aboutthe Drill Through feature, see Creating a PDF Compound Report With Drill Through Links onpage 956. For more information about Compound Reports, see Creating a CompoundReport on page 878.
Excel Compound reports. Provides a way to generate multiple worksheet reports using theEXL2K output format. By default, each of the component reports from the compound reportis placed in a new Excel worksheet. If the NOBREAK keyword is used, the next reportfollows the current report on the same worksheet.
For more information, see Creating a Compound Excel Report Using EXL2K on page 945.
Excel Table of Contents reports. Provides a way to generate a multiple worksheet reportwhere a separate worksheet is generated for each value of the first BY field in theWebFOCUS report.
For more information, see Choosing a Display Format on page 575.
Developing Your Report Request
The only requirement for reporting is identifying a data source. Beyond that, the structure of areport request is very flexible and you only need to include the report elements you want. Forexample, you only need to include sorting instructions if you want your report to be sorted, orselection criteria if you want to report on a subset of your data.
A report request begins with the TABLE FILE command and ends with the END command. Thecommands and phrases between the beginning and end of a request define the contents andformat of a report. These parts of the request are optional; you only need to include thecommands and phrases that produce the report functions you want.
The following are the most frequently used options for structuring a report request.
Specifying fields and columns. Each column in your report represents a field. You canspecify which fields you want to display, which fields you want to use to sort the report,which fields you want to use to select records, and which data source fields you want touse in creating temporary fields. Therefore, specifying the fields you want in a report isfundamentally tied to how you want to use those fields in your report.
Developing Your Report Request
32
Displaying data. You can display data in your report by listing all the records for a field(detailed presentation), or by totaling the records for a field (summary presentation). Youcan also perform calculations and other operations on fields, such as finding the highestvalue of a field or calculating the average sum of squares of all the values of a field, andpresent the results of the operation in your report.
Sorting a report column. Sorting a report enables you to organize column information.WebFOCUS displays the sort field, which is the field that controls the sorting order, at theleft of the report if you are sorting vertically, or at the top, if you are sorting horizontally.Sort fields appear when their values change. You can also choose not to display sort fields.
You can sort information vertically, down a column, or horizontally, across a row. You canalso combine vertical sorting and horizontal sorting to create a simple matrix.
Selecting records. When you generate a report, you may not want to include every record.Selecting records enables you to define a subset of the data source based on your criteriaand then report on that subset. Your selection criteria can be as simple or complex as youwish.
Showing subtotals and totals. You can display column and row totals, grand totals, andsection subtotals in your report.
Customizing the presentation. A successful report depends upon the informationpresented and how it is presented. A report that identifies related groups of informationand draws attention to important facts will be more effective than one that simply showscolumns of data. For example, you can:
Give column titles more meaningful names.
Control the display of columns in your report.
Create headings and footings for different levels of the report (including each sort group,each page, and the entire report), and dynamically control the display of headings andfootings based on conditions you set.
Add fonts, colors, grids, and images.
Highlight a group of related information and separate it from other groups by insertingblank lines, underlines, and page breaks.
Creating temporary fields. When you create a report, you are not limited to the fields thatalready exist in the data source. You can create temporary fields, deriving their values fromreal data source fields, and include them in your report.
For details see, Creating Temporary Fields on page 277.
1. Creating Reports Overview
Creating Reports With TIBCO® WebFOCUS Language 33

Joining data sources. You can join two or more data sources to create a larger integrateddata structure from which you can report in a single request.
For details, see Joining Data Sources on page 1071.
Storing and reusing the results. You can store your report data as a data source againstwhich you can make additional queries. This is especially helpful for creating a subset ofyour data source and for generating two-step reports. You can also format the new datasource for use by other data processing tools, such as spreadsheets and word processors.
For details, see Saving and Reusing Your Report Output on page 471.
You can run the request as an ad hoc query or save it as a procedure. Saving a report requestas a procedure enables you to run or edit it at any time.
Starting a Report Request
A report request begins with the designation of a data source. You can then specify the detailsof your report request. A data source can be specified in the following ways:
The TABLE FILE filename command sets the data source for a single request.
The FILE SET parameter sets a data source for all requests within a procedure.
For details on the FILE SET parameter, see the TIBCO WebFOCUS® Developing ReportingApplications manual.
Syntax: How to Begin a Report Request
To begin a report request, use the command
TABLE FILE filename
where:
filename
Is the data source for the report.
Completing a Report Request
To complete a report request, use the END or RUN command. These commands must be typedon a line by themselves. To discontinue a report request without executing it, enter the QUITcommand.
Developing Your Report Request
34

If you plan to issue consecutive report requests against the same data source during onesession, you have the option of using the RUN command. RUN keeps the TABLE facility andthe data source active for the duration of the TABLE session. After viewing one report you donot need to repeat the TABLE command to produce another report. You terminate the TABLEsession by issuing the END command after the last request.
Creating a Report Example
The example in this topic is a simple report request that illustrates some of the basicfunctions of WebFOCUS. However, there are many more functions not shown here that you canfind information on throughout this documentation.
Example: Creating a Simple Report
The following annotated example illustrates some of the basic functions of WebFOCUS. Thenumbered explanation in this example corresponds with the code in this request. This requestcan be generated by typing the commands into a text editor.
1. JOIN PIN IN EMPDATA TO ALL PIN IN TRAINING AS J1 2. DEFINE FILE EMPDATA YEAR/YY=COURSESTART; 3. END 4. TABLE FILE EMPDATA 5. HEADING CENTER "Education Cost vs. Salary" 6. SUM EXPENSES AS 'Education,Cost' SALARY AS 'Current,Salary' 7. AND COMPUTE PERCENT/D8.2=EXPENSES/SALARY * 100; AS 'Percent' 8. BY DIV BY DEPT 9. WHERE YEAR EQ 1991 10. ON TABLE SUMMARIZE 11. ON TABLE SET STYLE * TYPE=HEADING, STYLE=BOLD, COLOR=BLUE,$ TYPE=REPORT, FONT=TIMES, SIZE=8,$ TYPE=REPORT, GRID=OFF,$ ENDSTYLE 12. END
1. Creating Reports Overview
Creating Reports With TIBCO® WebFOCUS Language 35

The output is:
The request processes in the following way:
1. The JOIN command joins the EMPDATA and TRAINING data sources, allowing the request toaccess information from both data sources as if it were a single structure.
2. The DEFINE command creates a virtual field which extracts the year from theCOURSESTART field in the TRAINING data source.
3. The END command ends the DEFINE command.
4. The TABLE command begins the report request.
5. The HEADING command adds the heading, Education Cost vs. Salary to the report output.
6. The SUM command adds the values within both the EXPENSES field and the SALARY field.The AS phrase changes the name of the column headings.
7. The COMPUTE command creates a calculated value using the values that have beenaggregated in the SUM command and sorted with the BY command.
8. The BY phrase sorts the data in the report by the DIV field, and then by the DEPT field.
9. The WHERE command includes only the data that falls in the year 1991.
10.The ON TABLE SUMMARIZE command adds all values in both the EXPENSES and SALARYcolumns, and recalculates the Percent column.
11.The StyleSheet information formats the report heading and content.
12.The END command ends the report request.
Developing Your Report Request
36

Customizing a Report
A successful report depends on the information presented and how it is presented. A reportthat identifies related groups of information and draws attention to important facts will bemore effective than one that simply shows columns of data.
When you have selected the data that is going to be included in your report and how you wantit to appear, you can then continue developing your report with custom formatting. There aremany things you can add to your request in order to make your report more effective. You can:
Add titles, headings, and footings. You can also change column titles with the AS phrase,and create headings and footings for different levels of the report (including each sortgroup, each page, and the entire report).
Change the format of a field and the justification of a column title. For details, see Formatting Report Data on page 1699.
Determine the width of a report column. For details, see Formatting Report Data on page1699.
Dynamically control the display of subtotals, headings, and footings based on conditionsyou define. For details, see Controlling Report Formatting on page 1221.
Highlight a group of related information and separate it from other groups by inserting blanklines or underlines between each group.
Emphasize data using color to highlight certain values in your report based on conditionsyou define. For details, see Formatting Report Data on page 1699.
Format your report using external cascading style sheets. For details, see Using an ExternalCascading Style Sheet on page 1295.
Add drill-down capability to your report. This adds extra value by linking your report to otherreports or URLs that provide more detail. For details, see Linking a Report to OtherResources on page 821.
1. Creating Reports Overview
Creating Reports With TIBCO® WebFOCUS Language 37

Selecting a Report Output Destination
After you create a report, you can send it:
To the screen. When you run a report, the default output destination is the screen. Reportsrun in WebFOCUS usually appear in a web browser, or in a helper application (such as,Adobe® Reader® or Microsoft® Excel), within a web browser.
You can also view reports outside of the browser in a standalone helper application suchas Adobe Reader or Microsoft Excel. In Windows Folder Options, File Types (AdvancedSettings), uncheck the Browse in same window option for the file type; such as .pdf or .xls.When the Browse in same window option is not selected, the browser window created byWebFOCUS is blank because the report output is displayed in the helper applicationwindow.
Note that if you selected the Save Report check box in the configuration pane of theWebFOCUS Administration Console (under Redirection Settings), you will be promptedwhether to save or open the output file. If the procedure contained a PCHOLD commandthat specified an AS name for the output file, the name is retained if you choose to savethe file. If no AS name was specified, a random filename is generated.
If the output is produced as a result of a GRAPH request, the returned HTML file contains alink to the actual graph output, which is stored as a temporary image file (for example, as aJPEG, GIF, or SVG file). The image file will eventually expire and be deleted from the server.For information about saving the graph output, see Creating a Graph on page 1745.
To a file. You can store the results of your report for reuse using the HOLD, SAVE, or SAVBcommands. For details see Saving and Reusing Your Report Output on page 471.
To a printer. If you wish to print a report using a format such as PDF or HTML, first displaythe report using the desired format, and then print the report from the display application(for example, from Adobe Reader or from the web browser).
You cannot send a report directly to a printer in WebFOCUS.
Selecting a Report Output Destination
38

Chapter2Displaying Report Data
Reporting, at the simplest level, retrieves field values from a data source and displaysthose values. There are three ways to do this:
List each field value (PRINT and LIST commands).
Add all the values and display the sum (SUM command).
Count all the values and display the quantity (COUNT command).
In this chapter:
Using Display Commands in a Request
Displaying Individual Values
Adding Values
Counting Values
Expanding Byte Precision for COUNT and LIST
Maximum Number of Display Fields Supported in a Request
Manipulating Display Fields With Prefix Operators
Displaying Pop-up Field Descriptions for Column Titles
Using Display Commands in a Request
The four display commands (PRINT, LIST, SUM, and COUNT) are also known as verbs. Thesecommands are flexible; you can report from several fields using a single command, andinclude several different display commands in a single report request.
Creating Reports With TIBCO® WebFOCUS Language 39

Syntax: How to Use Display Commands in a Request
display [THE] [SEG.]fieldname1 [AND] [THE] fieldname2 ...
or
display *
where:
displayIs the PRINT, LIST, SUM, or COUNT command. WRITE and ADD are synonyms of SUMand can be substituted for it.
SEG.
Displays all fields in a segment (a group of related fields in a Master File). The fieldname you specify can be any field in the segment.
fieldnameIs the name of the field to be displayed in the report.
The maximum number of display fields your report can contain is determined by acombination of factors. For details, see Maximum Number of Display Fields Supported in aRequest on page 55.
The fields appear in the report in the same order in which they are specified in the reportrequest. For example, the report column for fieldname1 appears first, followed by thereport column for fieldname2.
The field to be displayed is also known as the display field.
AND
Is optional and is used to enhance readability. It can be used between any two fieldnames, and does not affect the report.
THE
Is optional and is used to enhance readability. It can be used before any field name,and does not affect the report.
*
Applies the display command to every field in the left path of the data source.
Note: The SEG. and * options do not display virtual fields. To print virtual fields, explicitlyreference them in the PRINT statement (PRINT * virtual field name). This is true even if thevirtual field name redefines a real field.
Using Display Commands in a Request
40

Displaying Individual Values
The display commands LIST and PRINT list the individual values of the fields you specify inyour report request. LIST numbers the items in the report. PRINT does not number the items.
You can easily display all of the fields in the data source by specifying an asterisk (*) wildcardinstead of a specific field name, as described in Displaying All Fields on page 42.
For all PRINT and LIST requests, the number of records retrieved and the number of linesdisplayed are the same. In addition, there is no order to the report rows. The PRINT and LISTcommands display all the values of the selected fields found in the data source in the order inwhich they are accessed. The order in which data is displayed may be affected by theAUTOPATH setting. For more information, see Optimizing Retrieval Speed for TIBCO FOCUS DataSources on page 1932, and the documentation on SET parameters in the TIBCO WebFOCUS®
Developing Reporting Applications manual.
In general, when using PRINT or LIST, the order of the values displayed in the report dependson whether or not the field is a key field, as described in the Describing Data With TIBCOWebFOCUS® Language manual.
Alternatively, you can sort the values using the BY or ACROSS sort phrases. When LIST is usedin a request that includes a sort phrase, the list counter is reset to 1 every time the value inthe outermost sort field changes. For more information on sorting, see Sorting Tabular Reportson page 87.
PRINT * or PRINT SEG.* prints only the real fields in the Master File. To print virtual fields,explicitly reference them in the PRINT statement (PRINT * virtual field name). This is true evenif the virtual field name is a re-defines of a real field.
For PRINT and LIST syntax, see Using Display Commands in a Request on page 39.
Example: Displaying Individual Field Values
To display the values of individual fields, use the PRINT command. The following requestdisplays the values of two fields, LAST_NAME and FIRST_NAME, for all employees.
TABLE FILE EMPLOYEEPRINT LAST_NAME AND FIRST_NAMEEND
The following shows the report output.
2. Displaying Report Data
Creating Reports With TIBCO® WebFOCUS Language 41

LAST_NAME ---------
FIRST_NAME----------
STEVENS SMITH JONES SMITH BANNING IRVING ROMANS MCCOY BLACKWOOD MCKNIGHT GREENSPAN CROSS
ALFREDMARYDIANERICHARDJOHNJOANANTHONYJOHNROSEMARIEROGERMARYBARBARA
Example: Listing Records
To number the records in a report, use the LIST command.
TABLE FILE EMPLOYEELIST LAST_NAME AND FIRST_NAMEEND
The following shows the report output.
LIST---- 1 2 3 4 5 6 7 8 9 10 11 12
LAST_NAME --------- STEVENS SMITH JONES SMITH BANNING IRVING ROMANS MCCOY BLACKWOOD MCKNIGHT GREENSPAN CROSS
FIRST_NAME---------- ALFREDMARYDIANERICHARDJOHNJOANANTHONYJOHNROSEMARIEROGERMARYBARBARA
Displaying All Fields
You can easily display all of the fields in the left path of the data source by specifying anasterisk (*) wildcard instead of a specific field name. For additional information about MasterFile structures and segment paths, including left paths and short paths, see the DescribingData With TIBCO WebFOCUS® Language manual.
Displaying Individual Values
42

Example: Displaying All Fields
The following request produces a report displaying all of the fields in the EDUCFILE datasource.
TABLE FILE EDUCFILELIST *END
The following shows the report output.
LIST----
COURSE_CODE-----------
COURSE_NAME-----------
DATE_ATTEND-----------
EMP_ID------
1 101 FILE DESCRPT & MAINT 83/01/04 212289111
2 101 FILE DESCRPT & MAINT 82/05/25 117593129
3 101 FILE DESCRPT & MAINT 82/05/25 071382660
4 101 FILE DESCRPT & MAINT 81/11/15 451123478
5 101 FILE DESCRPT & MAINT 81/11/15 112847612
6 102 BASIC REPORT PREP NON-PROG
82/07/12 326179357
7 103 BASIC REPORT PREP NON-PROG
83/01/05 212289111
8 103 BASIC REPORT PREP NON-PROG
82/05/26 117593129
9 103 BASIC REPORT PREP NON-PROG
81/11/16 112847612
10 104 FILE DESC & MAINT NON-PROG
82/07/14 326179357
11 106 TIMESHARING WORKSHOP 82/07/15 326179357
12 202 WHAT'S NEW IN FOCUS 82/10/28 326179357
13 301 DECISION SUPPORT WORKSHOP
82/09/03 326179357
14 107 BASIC REPORT PREP DP MGRS
82/08/02 818692173
15 302 HOST LANGUAGE INTERFACE 82/10/21 818692173
16 108 BASIC RPT NON-DP MGRS 82/10/10 315548712
17 108 BASIC RPT NON-DP MGRS 82/08/24 119265415
18 201 ADVANCED TECHNIQUES 82/07/26 117593129
2. Displaying Report Data
Creating Reports With TIBCO® WebFOCUS Language 43

19 203 FOCUS INTERNALS 82/10/28 117593129
Displaying All Fields in a Segment
You can easily display all fields in a segment by adding the prefix "SEG." to any field in thedesired segment.
Syntax: How to Display All Fields in a Segment
seg.anyfield
where:
anyfield
Is any field that is in the desired segment.
Example: Displaying All Fields in a Segment
The following request produces a report displaying all of the fields in the segment thatcontains the QTY_IN_STOCK field.
TABLE FILE CENTINVPRINT SEG.QTY_IN_STOCKBY PRODNAME NOPRINTEND
Displaying Individual Values
44

The following shows the report output.
Displaying the Structure and Retrieval Order of a Multi-Path Data Source
When using display commands, it is important to understand the structure of the data sourceand the relationship between segments, since these factors affect your results. You can usethe CHECK command PICTURE option to display a diagram of the data source structure definedby the Master File.
You can also display the retrieval order of a data source using the CHECK command PICTURERETRIEVE option. It should be noted that retrieval is controlled by the minimum referencedsubtree. For more information, see Understanding the Efficiency of the Minimum ReferencedSubtree in the Describing a Group of Fields chapter in the Describing Data With TIBCOWebFOCUS® Language manual.
2. Displaying Report Data
Creating Reports With TIBCO® WebFOCUS Language 45

Example: Displaying the Structure of a Multi-Path Data Source
To display the structure diagram of the CENTORD data source, which is joined to the CENTINVand CENTCOMP data sources, issue the following command:
CHECK FILE CENTORD PICTURE
Displaying Individual Values
46
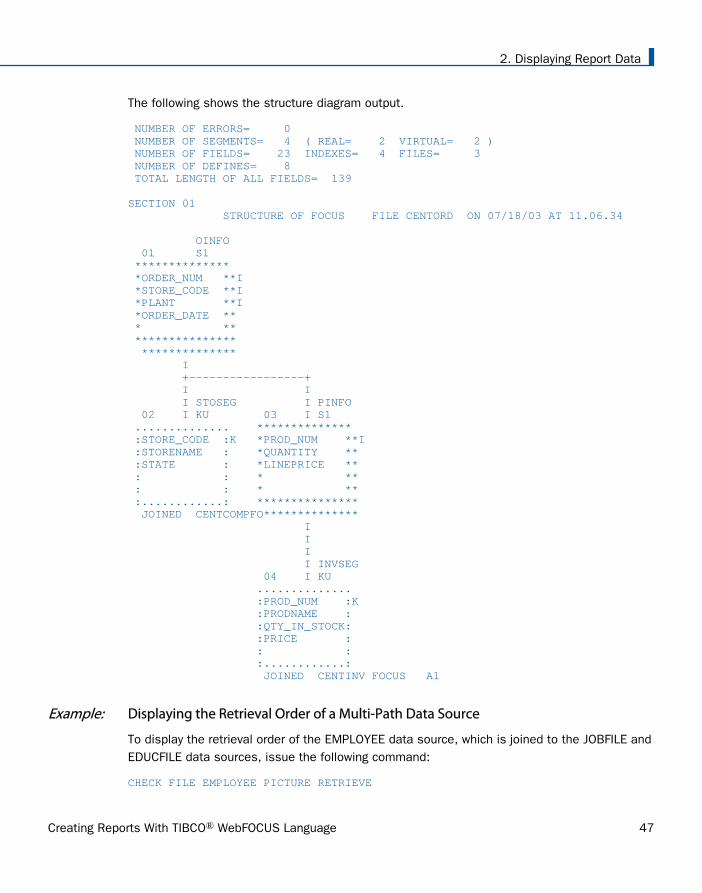
The following shows the structure diagram output.
NUMBER OF ERRORS= 0 NUMBER OF SEGMENTS= 4 ( REAL= 2 VIRTUAL= 2 ) NUMBER OF FIELDS= 23 INDEXES= 4 FILES= 3 NUMBER OF DEFINES= 8 TOTAL LENGTH OF ALL FIELDS= 139 SECTION 01 STRUCTURE OF FOCUS FILE CENTORD ON 07/18/03 AT 11.06.34 OINFO 01 S1 ************** *ORDER_NUM **I *STORE_CODE **I *PLANT **I *ORDER_DATE ** * ** *************** ************** I +-----------------+ I I I STOSEG I PINFO 02 I KU 03 I S1 .............. ************** :STORE_CODE :K *PROD_NUM **I :STORENAME : *QUANTITY ** :STATE : *LINEPRICE ** : : * ** : : * ** :............: *************** JOINED CENTCOMPFO************** I I I I INVSEG 04 I KU .............. :PROD_NUM :K :PRODNAME : :QTY_IN_STOCK: :PRICE : : : :............: JOINED CENTINV FOCUS A1
Example: Displaying the Retrieval Order of a Multi-Path Data Source
To display the retrieval order of the EMPLOYEE data source, which is joined to the JOBFILE andEDUCFILE data sources, issue the following command:
CHECK FILE EMPLOYEE PICTURE RETRIEVE
2. Displaying Report Data
Creating Reports With TIBCO® WebFOCUS Language 47

The following shows the command output that adds the numbers that display at the top left ofeach segment, indicating the retrieval order of the segments. A unique segment such asFUNDTRAN is treated as a logical addition to the parent segment for retrieval. FUNDTRAN andSECSEG are unique segments, and are therefore treated as part of their parents.
Displaying Individual Values
48

The following shows the retrieval order:
2. Displaying Report Data
Creating Reports With TIBCO® WebFOCUS Language 49

Example: Displaying Fields From a Multi-Path Data Source
The following request produces a report displaying all of the fields on the left path of theEMPLOYEE data source.
TABLE FILE EMPLOYEEPRINT *END
The following shows a list of the output fields the previous request produces. Due to the sizeof the report, only the fields for which all instances will be printed are listed here. In the report,these fields would be displayed from left to right, starting with EMP_ID.
EMP_IDLAST_NAMEFIRST_NAMEHIRE_DATEDEPARTMENTCURR_SALCURR_JOBCODEED_HRSBANK_NAMEBANK_CODEBANK_ACCTEFFECT_DATEDAT_INCPCT_INCSALARYJOBCODEJOBCODEJOB_DESCSEC_CLEARSKILLSSKILL_DESC
Each field in this list appears in segments on the left path of the EMPLOYEE data source. Toview the retrieval order structure of the EMPLOYEE data source, see Displaying the RetrievalOrder of a Multi-Path Data Source on page 47.
Tip: In some environments, the following warning is displayed whenever you use PRINT * witha multi-path data source, to remind you that PRINT * only displays the left path:
(FOC757) WARNING. YOU REQUESTED PRINT * OR COUNT * FOR A MULTI-PATH FILE
Adding Values
SUM, WRITE, and ADD sum the values of a numeric field. The three commands are synonyms;they can be used interchangeably, and every reference to SUM in this documentation alsorefers to WRITE and ADD.
Adding Values
50

When you use SUM, multiple records are read from the data source, but only one summary lineis produced. If you use SUM with a non-numeric field—such as an alphanumeric, text, or datefield—SUM does not add the values. Instead, by default, it displays the last value retrievedfrom the data source. You can change this to the first value, minimum value, or maximumvalue using the SUMPREFIX parameter.
For SUM, WRITE, and ADD syntax, see Using Display Commands in a Request on page 39.
Example: Adding Values
This request adds all the values of the field CURR_SAL:
TABLE FILE EMPLOYEESUM CURR_SALEND
The following shows the output of the request.
CURR_SAL
--------
$222,284.00
Example: Adding Non-Numeric Values
This request attempts to add non-numeric fields. Any request for aggregation on non-numericdata returns the last record retrieved from the data source.
TABLE FILE EMPLOYEESUM LAST_NAME AND FIRST_NAMEEND
The following shows the output of the request.
LAST_NAME FIRST_NAME
--------- ----------
CROSS BARBARA
Note that any request for aggregation on all date format fields also returns the last recordretrieved from the data source.
Tip: You can set the SUMPREFIX parameter to FST, MIN, MAX, or LST to control the sort order.For details, see Sorting Tabular Reports on page 87.
2. Displaying Report Data
Creating Reports With TIBCO® WebFOCUS Language 51

Counting Values
The COUNT command counts the number of instances that exist for a specified field. TheCOUNT command is particularly useful combined with the BY phrase, which is discussed in Sorting Tabular Reports on page 87.
COUNT counts the instances of data contained in a report, not the data values.
For COUNT syntax, see Using Display Commands in a Request on page 39.
By default, a COUNT field is a five-digit integer. You can reformat it using the COMPUTEcommand, and change its field length using the SET COUNTWIDTH parameter. For detailsabout the COMPUTE command, see Creating Temporary Fields on page 277. For informationabout SET COUNTWIDTH, see the TIBCO WebFOCUS® Developing Reporting Applicationsmanual.
When COUNT is used in a request, the word COUNT is appended to the default column title,unless the column title is changed with an AS phrase.
Example: Counting Values
To determine how many employees are in the EMPLOYEE data source, you can count theinstances of EMP_ID, the employee identification number.
TABLE FILE EMPLOYEECOUNT EMP_IDEND
The following shows the output of the request.
EMP_ID
COUNT
------
12
Example: Counting Values With a Sort Phrase
To count the instances of EMP_ID for each department, use this request:
TABLE FILE EMPLOYEECOUNT EMP_IDBY DEPARTMENTEND
Counting Values
52

The following shows the output of the request indicating that of the 12 EMP_IDs in the datasource, six are from the MIS department and six are from the PRODUCTION department:
EMP_IDDEPARTMENT COUNT ---------- ------MIS 6PRODUCTION 6
Example: Counting Instances of Data
The following example counts the instances of data in the LAST_NAME, DEPARTMENT, andJOBCODE fields in the EMPLOYEE data source.
TABLE FILE EMPLOYEECOUNT LAST_NAME AND DEPARTMENT AND JOBCODEEND
The following shows the output of the request.
LAST_NAME DEPARTMENT JOBCODECOUNT COUNT COUNT --------- ---------- ------- 12 12 19
The EMPLOYEE data source contains data on 12 employees, with one instance for eachLAST_NAME. While there are only two values for DEPARTMENT, there are 12 instances of theDEPARTMENT field because each employee works for one of the two departments. Similarly,there are 19 instances of the JOBCODE field because employees can have more than one jobcode during their employment.
Counting Segment Instances
You can easily count the instances of the lowest segment in the left path of a data source byspecifying an asterisk (*) wildcard instead of a specific field name. In a single-segment datasource, this effectively counts all instances in the data source.
COUNT * accomplishes this by counting the values of the first field in the segment. Instanceswith a missing value in the first field are not counted (when SET MISSING=ON).
Segment instances in short paths are not counted by COUNT *, regardless of the value of theALL parameter of the SET command.
For more information about missing values, short paths, and the SET ALL parameter, see Handling Records With Missing Field Values on page 1037.
2. Displaying Report Data
Creating Reports With TIBCO® WebFOCUS Language 53

Example: Counting Segments From a Multi-Path Data Source
The following request counts the number of instances of the SKILLSEG segment of theEMPLOYEE data source.
TABLE FILE EMPLOYEECOUNT *END
The following shows the output of the request.
COUNT *
COUNT
-------
19
COUNT * counts the number of instances of the SKILLSEG segment, which is the lowestsegment in the left path of the EMPLOYEE data source structure (that is, the EMPLOYEE datasource joined to the JOBFILE and EDUCFILE data sources). You can see a picture of the pathstructure in Displaying the Structure and Retrieval Order of a Multi-Path Data Source on page45.
Tip: In some environments, the following warning is displayed if you use COUNT * with a multi-path data source (such as EMPLOYEE in the above example):
(FOC757) WARNING. YOU REQUESTED PRINT * OR COUNT * FOR A MULTI-PATH FILE
Expanding Byte Precision for COUNT and LIST
By default, the number of characters that display for counter values retrieved using the COUNTand LIST commands is five. You can increase the number of characters to nine.
For example, if the number of records retrieved for a field exceeds 99,999 (5 bytes), asterisksappear in the report to indicate an overflow condition. You can increase the display to allow aslarge a count as 999,999,999 (9 bytes) using SET COUNTWIDTH.
Note: You can change the overflow character by issuing the SET OVERFLOWCHAR command.
Expanding Byte Precision for COUNT and LIST
54

Syntax: How to Set the Precision for COUNT and LIST
SET COUNTWIDTH = {OFF|ON}
where:
OFF
Displays five characters (bytes) for COUNT and LIST counter values. Asterisks aredisplayed if the number of records retrieved for a field exceeds five characters. OFF isthe default.
ON
Displays up to nine characters (bytes) for COUNT and LIST counter values. Asterisksare displayed if the value exceeds nine characters.
Example: Setting Precision for COUNT and LIST
The following example shows the COUNT command with SET COUNTWIDTH = OFF:
TABLE FILE filename COUNT Fldxx BY FldyyEND
Fldxx
Fldyy COUNT
value *****
The following example shows the COUNT command with SET COUNTWIDTH = ON:
TABLE FILE filename COUNT FldxxBY FldyyEND
Fldxx
Fldyy COUNT
value 999999999
Note: This feature affects the width of a report when COUNTWIDTH is set to ON. Calculatingthe width of a report now requires an additional four display positions for each COUNT or LISTcolumn.
Maximum Number of Display Fields Supported in a Request
There is no limit to the number of verb objects in a TABLE or MATCH request.
2. Displaying Report Data
Creating Reports With TIBCO® WebFOCUS Language 55

However, an error can occur under the following conditions:
The report output format has a limit to the number of columns supported. For example,Excel, FOCUS, and XFOCUS formats have limits on the number of columns.
The operating system has a maximum record length that cannot fit all of the columns.
The amount of memory needed to store the output is not available.
If the combined length of the display fields in the data area exceeds the maximum capacity, anerror message displays. To correct the problem, adjust the number or lengths of the fields inthe request.
Manipulating Display Fields With Prefix Operators
You can use prefix operators to perform calculations directly on the values of fields.
Note: Unless you change a column or ACROSS title with an AS phrase, the prefix operator isautomatically added to the title. Without an AS phrase, the column title is constructed usingthe prefix operator and either the field name or the TITLE attribute in the Master File (if there isone):
If there is no TITLE attribute, the field name is used.
If there is a TITLE attribute in the Master File, the choice between using the field name orthe TITLE attribute depends on the value of the TITLES parameter:
If SET TITLES = ON, the TITLE attribute is used.
If SET TITLES = OFF or NOPREFIX, the field name is used.
You can use the SET PRFTITLE command to create descriptive and translatable column titlesfor prefixed fields. For example, the following request sets PRFTITLE to LONG.
SET PRFTITLE = LONGTABLE FILE WF_RETAIL_LITESUM COGS_US CNT.COGS_US AVE.COGS_US CNT.DST.COGS_US MIN.COGS_US MAX.COGS_US MDN.COGS_US BY PRODUCT_CATEGORYON TABLE SET PAGE NOLEADON TABLE SET STYLE *GRID=OFF,$ENDSTYLEEND
Manipulating Display Fields With Prefix Operators
56
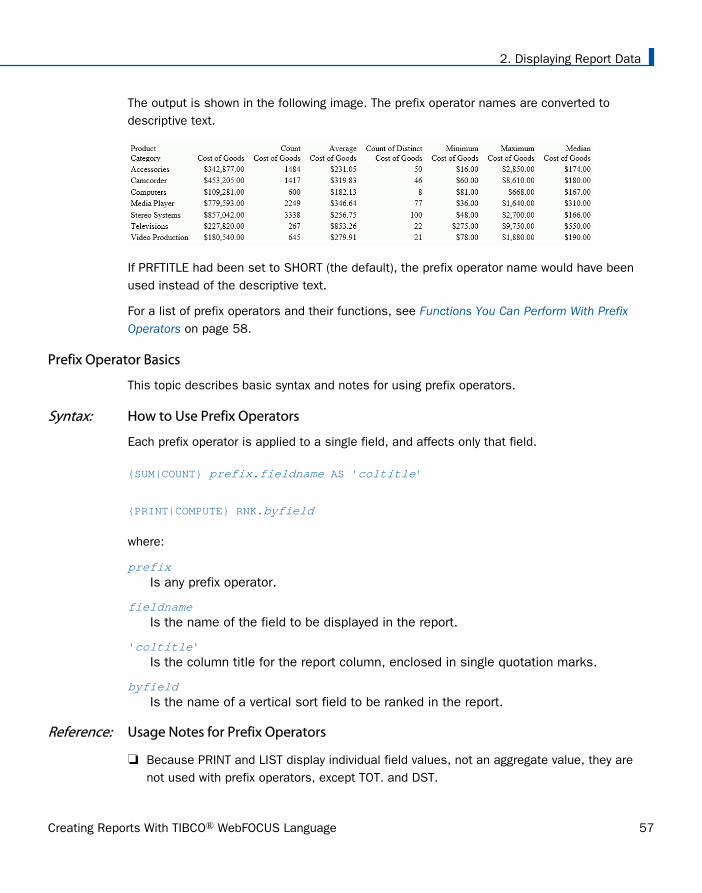
The output is shown in the following image. The prefix operator names are converted todescriptive text.
If PRFTITLE had been set to SHORT (the default), the prefix operator name would have beenused instead of the descriptive text.
For a list of prefix operators and their functions, see Functions You Can Perform With PrefixOperators on page 58.
Prefix Operator Basics
This topic describes basic syntax and notes for using prefix operators.
Syntax: How to Use Prefix Operators
Each prefix operator is applied to a single field, and affects only that field.
{SUM|COUNT} prefix.fieldname AS 'coltitle'
{PRINT|COMPUTE} RNK.byfield
where:
prefixIs any prefix operator.
fieldnameIs the name of the field to be displayed in the report.
'coltitle'Is the column title for the report column, enclosed in single quotation marks.
byfieldIs the name of a vertical sort field to be ranked in the report.
Reference: Usage Notes for Prefix Operators
Because PRINT and LIST display individual field values, not an aggregate value, they arenot used with prefix operators, except TOT. and DST.
2. Displaying Report Data
Creating Reports With TIBCO® WebFOCUS Language 57

To sort by the results of a prefix command, use the phrase BY TOTAL to aggregate and sortnumeric columns simultaneously. For details, see Sorting Tabular Reports on page 87.
The WITHIN phrase is very useful when using prefixes. The WITHIN phrase is not supportedwith the MDN., MDE., DST., CNT.DST., AVE.DST., or SUM.DST. prefix operators in anaggregation display command, such as SUM. The WITHIN phrase is supported with theDST. operator with the PRINT display command.
You can use the results of prefix operators in COMPUTE commands.
With the exception of PCT., RPCT., CNT. and PCT.CNT., resulting values have the sameformat as the field against which the prefix operation was performed.
For percent-based prefix operators PCT. and RPCT., if you set the PCTFORMAT parameter toOLD, resulting values have the same format as the field against which the prefix operationwas performed. By default, PCTFORMAT is set to PERCENT, which displays the prefixedcolumn with a percent sign and removes other options, such as currency symbols, althoughyou can reformat it. PCT.CNT.field will always display with two decimal places and a percentsign, unless reformatted. With PCTFORMAT = PERCENT, the format of the output columnmay depend on the format of the original field. For a field with a:
Precision-based format (F, D, M, X), the column will display with length 7 and twodecimal places.
Packed format, the column will display with its original number of decimal places.
Integer format, the column will display with no decimal places.
Text fields can only be used with the FST., LST., and CNT. prefix operators.
PCT., TOT., PCT.CNT., RNK., and RPCT. are not supported with TABLEF and should not beused with TABLEF.
Reference: Functions You Can Perform With Prefix Operators
The following table lists prefix operators and describes the function of each.
Prefix Function
ASQ. Computes the average sum of squares for standard deviation instatistical analysis.
AVE. Computes the average value of the field.
Manipulating Display Fields With Prefix Operators
58
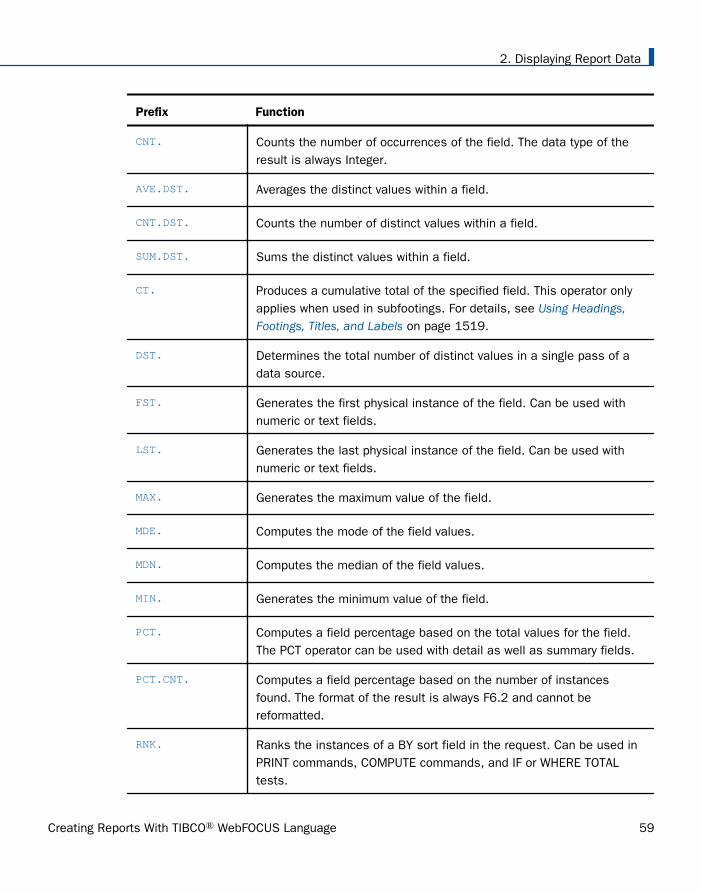
Prefix Function
CNT. Counts the number of occurrences of the field. The data type of theresult is always Integer.
AVE.DST. Averages the distinct values within a field.
CNT.DST. Counts the number of distinct values within a field.
SUM.DST. Sums the distinct values within a field.
CT. Produces a cumulative total of the specified field. This operator onlyapplies when used in subfootings. For details, see Using Headings,Footings, Titles, and Labels on page 1519.
DST. Determines the total number of distinct values in a single pass of adata source.
FST. Generates the first physical instance of the field. Can be used withnumeric or text fields.
LST. Generates the last physical instance of the field. Can be used withnumeric or text fields.
MAX. Generates the maximum value of the field.
MDE. Computes the mode of the field values.
MDN. Computes the median of the field values.
MIN. Generates the minimum value of the field.
PCT. Computes a field percentage based on the total values for the field.The PCT operator can be used with detail as well as summary fields.
PCT.CNT. Computes a field percentage based on the number of instancesfound. The format of the result is always F6.2 and cannot bereformatted.
RNK. Ranks the instances of a BY sort field in the request. Can be used inPRINT commands, COMPUTE commands, and IF or WHERE TOTALtests.
2. Displaying Report Data
Creating Reports With TIBCO® WebFOCUS Language 59

Prefix Function
ROLL. Recalculates values on summary lines using the aggregated valuesfrom lower level summary lines.
RPCT. Computes a field percentage based on the total values for the fieldacross a row.
ST. Produces a subtotal value of the specified field at a sort break in thereport. This operator only applies when used in subfootings. Fordetails, see Using Headings, Footings, Titles, and Labels on page 1519.
STDP. Computes the standard deviation for a population.
STDS. Computes the standard deviation for a sample.
SUM. Sums the field values.
TOT. Totals the field values for use in a heading (includes footings,subheads, and subfoots).
Averaging Values of a Field
The AVE. prefix computes the average value of a particular field. The computation is performedat the lowest sort level of the display command. It is computed as the sum of the field valueswithin a sort group divided by the number of records in that sort group. If the request does notinclude a sort phrase, AVE. calculates the average for the entire report.
Example: Averaging Values of a Field
This request calculates the average number of education hours spent in each department.
TABLE FILE EMPLOYEESUM AVE.ED_HRS BY DEPARTMENTEND
The following shows the output of the request.
AVE DEPARTMENT ED_HRS---------- ------MIS 38.50PRODUCTION 20.00
Manipulating Display Fields With Prefix Operators
60

Averaging the Sum of Squared Fields
The ASQ. prefix computes the average sum of squares, which is a component of the standarddeviation in statistical analysis (shown as a formula in the following image).
Note: If the field format is integer and you get a large set of numbers, the ASQ. result mayexceed the limit of the I4 field, which is 2,147,483,647. The display of any number larger thanthis will generate a negative number or an incorrect positive number. For this reason, werecommend that you do not use Integer fields if this result could occur.
Example: Averaging the Sum of Squared Fields
This request calculates the sum and the sum of squared fields for the DELIVER_AMT field.
TABLE FILE SALESSUM DELIVER_AMT AND ASQ.DELIVER_AMTBY CITYEND
The following shows the output of the request.
ASQ CITY DELIVER_AMT DELIVER_AMT---- ----------- -----------NEW YORK 300 980NEWARK 60 900STAMFORD 430 3637UNIONDALE 80 1600
Calculating Maximum and Minimum Field Values
The prefixes MAX. and MIN. produce the maximum and minimum values, respectively, within asort group. If the request does not include a sort phrase, MAX. and MIN. produce themaximum and minimum values for the entire report.
Example: Calculating Maximum and Minimum Field Values
This report request calculates the maximum and minimum values of SALARY.
TABLE FILE EMPLOYEESUM MAX.SALARY AND MIN.SALARYEND
2. Displaying Report Data
Creating Reports With TIBCO® WebFOCUS Language 61
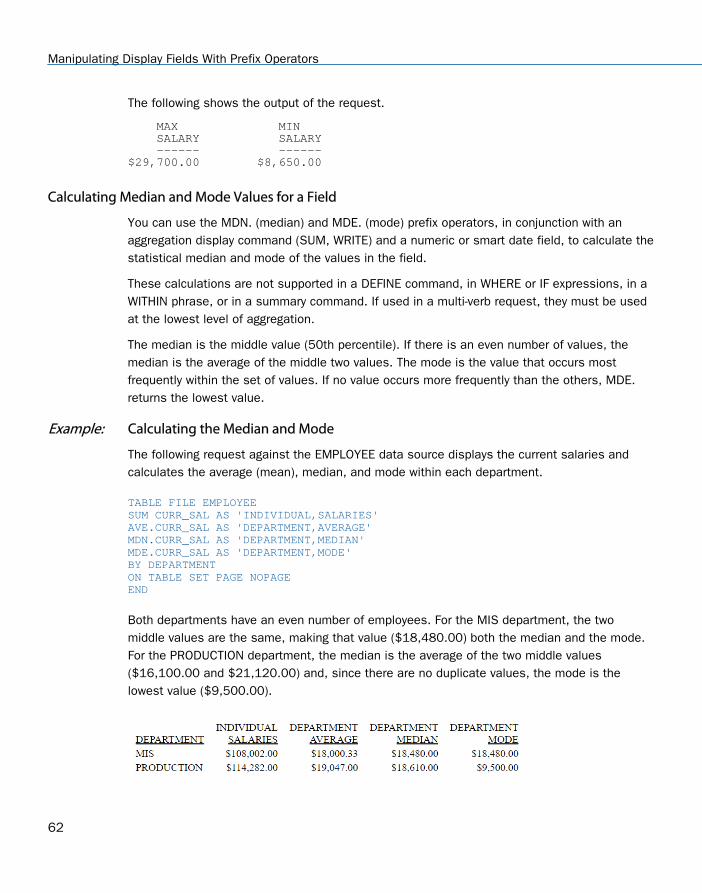
The following shows the output of the request.
MAX MIN SALARY SALARY ------ ------$29,700.00 $8,650.00
Calculating Median and Mode Values for a Field
You can use the MDN. (median) and MDE. (mode) prefix operators, in conjunction with anaggregation display command (SUM, WRITE) and a numeric or smart date field, to calculate thestatistical median and mode of the values in the field.
These calculations are not supported in a DEFINE command, in WHERE or IF expressions, in aWITHIN phrase, or in a summary command. If used in a multi-verb request, they must be usedat the lowest level of aggregation.
The median is the middle value (50th percentile). If there is an even number of values, themedian is the average of the middle two values. The mode is the value that occurs mostfrequently within the set of values. If no value occurs more frequently than the others, MDE.returns the lowest value.
Example: Calculating the Median and Mode
The following request against the EMPLOYEE data source displays the current salaries andcalculates the average (mean), median, and mode within each department.
TABLE FILE EMPLOYEESUM CURR_SAL AS 'INDIVIDUAL,SALARIES'AVE.CURR_SAL AS 'DEPARTMENT,AVERAGE'MDN.CURR_SAL AS 'DEPARTMENT,MEDIAN'MDE.CURR_SAL AS 'DEPARTMENT,MODE'BY DEPARTMENTON TABLE SET PAGE NOPAGEEND
Both departments have an even number of employees. For the MIS department, the twomiddle values are the same, making that value ($18,480.00) both the median and the mode.For the PRODUCTION department, the median is the average of the two middle values($16,100.00 and $21,120.00) and, since there are no duplicate values, the mode is thelowest value ($9,500.00).
Manipulating Display Fields With Prefix Operators
62

Calculating Column and Row Percentages
For each individual value in a column, PCT. calculates what percentage that field makes up ofthe column total value. You can control how values are distributed down the column by sortingthe column using the BY phrase.
You can also determine percentages for row values. For each individual value in a row that hasbeen sorted using the ACROSS phrase, the RPCT. operator calculates what percentage itmakes up for the total value of the row.
Example: Calculating Column Percentages
To calculate each employee share of education hours, issue the following request:
TABLE FILE EMPLOYEESUM ED_HRS PCT.ED_HRS BY LAST_NAMEON TABLE COLUMN-TOTALON TABLE SET PAGE NOPAGEON TABLE SET STYLE *GRID=OFF,$ENDSTYLEEND
The output is shown in the following image:
2. Displaying Report Data
Creating Reports With TIBCO® WebFOCUS Language 63

If you set PCFORMAT to OLD, PCT. and RPCT. WILL take the same format as the field, and thecolumn may not always total exactly 100 because of the nature of floating-point arithmetic.
Example: Calculating Row Percentages
The following request calculates the total units sold for each product (UNIT_SOLD column), andthe percentage that total makes up in relation to the sum of all products sold(RPCT.UNIT_SOLD column) in each city.
TABLE FILE SALESSUM UNIT_SOLD RPCT.UNIT_SOLD ROW-TOTALBY PROD_CODEACROSS CITY WHERECITY EQ 'NEW YORK' OR 'STAMFORD'ON TABLE SET PAGE NOPAGEON TABLE SET STYLE *GRID=OFF,$ENDSTYLEEND
The output is shown in the following image.
Because UNIT_SOLD has an integer format, the columns created by RPCT. also have integer (I)formats. Therefore, individual percentages may be truncated and the total percentage may beless than 100%. If you require precise totals, redefine the field with a format that declaresdecimal places (D, F).
Manipulating Display Fields With Prefix Operators
64

Producing a Direct Percent of a Count
When counting occurrences in a file, a common reporting need is determining the relativepercentages of each row’s count within the total number of instances. You can do this, forcolumns only, with the following syntax:
PCT.CNT.fieldname
The format is a decimal value of length seven, with two decimal places and a percent sign.
Example: Producing a Direct Percent of a Count
This request illustrates the relative percentage of the values in the EMP_ID field for eachdepartment.
TABLE FILE EMPLOYEESUM PCT.CNT.EMP_IDBY DEPARTMENTON TABLE SET PAGE NOPAGEON TABLE SET STYLE *GRID=OFF,$ENDSTYLEEND
The output is shown in the following image:
Aggregating and Listing Unique Values
The distinct prefix operator (DST.) may be used to aggregate and list unique values of any datasource field. Similar in function to the SQL COUNT, SUM, and AVG(DISTINCT col) columnfunctions, it permits you to determine the total number of distinct values in a single pass ofthe data source.
The DST. operator can be used with the SUM, PRINT or COUNT commands, and also inconjunction with the aggregate prefix operators SUM., CNT., and AVE. Multiple DST. operatorsare supported in TABLE and TABLEF requests. They are supported in requests that use the BY,ACROSS, and FOR phrases.
2. Displaying Report Data
Creating Reports With TIBCO® WebFOCUS Language 65

Note that in a request using the PRINT command and multiple DST operators, you should issuethe command SET PRINTDST=NEW. For more information, see the TIBCO WebFOCUS®
Developing Reporting Applications manual.
Syntax: How to Use the Distinct Operator
command DST.fieldname
or
SUM [operator].DST.fieldname
where:
commandIs SUM, PRINT, or COUNT.
DST.
Indicates the distinct operator.
fieldnameIndicates the display-field object or field name.
operatorIndicates SUM., CNT., or AVE.
Example: Using the Distinct Operator
The procedure requesting a count of unique ED_HRS values is either:
TABLE FILE EMPLOYEESUM CNT.DST.ED_HRSEND
or
TABLE FILE EMPLOYEECOUNT DST.ED_HRSEND
The output is:
COUNT DISTINCTED_HRS -------- 9
Manipulating Display Fields With Prefix Operators
66

Notice that the count includes records for both employees with the last name SMITH, butexcludes the second records for values 50.00, 25.00, and .0, resulting in nine unique ED_HRSvalues.
Example: Counting Distinct Field Values With Multiple Display Commands
The following request against the GGSALES data source counts the total number of records byregion, then the number of records, distinct categories, and distinct products by region and bystate. The DST or CNT.DST operator can be used only with the last display command:
TABLE FILE GGSALES COUNT CATEGORY AS 'TOTAL,COUNT' BY REGION SUM CNT.CATEGORY AS 'STATE,COUNT' CNT.DST.CATEGORY CNT.DST.PRODUCT BY REGION BY ST END
The output is:
COUNT COUNT TOTAL STATE DISTINCT DISTINCTRegion COUNT State COUNT CATEGORY PRODUCT ------ ----- ----- ----- -------- --------Midwest 1085 IL 362 3 9 MO 361 3 9 TX 362 3 9Northeast 1084 CT 361 3 10 MA 360 3 10 NY 363 3 10Southeast 1082 FL 361 3 10 GA 361 3 10 TN 360 3 10West 1080 CA 721 3 10 WA 359 3 10
Reference: Distinct Operator Limitations
If you reformat a column created using COUNT DST. or the CNT.DST operator, you mustreformat it to an integer (I) data type. If you specify another data type, the following erroroccurs:
(FOC950) INVALID REFORMAT OPTION WITH COUNT OR CNT.
The following error occurs if you use the prefix operators CNT., SUM., and AVE. with anyother display command:
(FOC1853) CNT/SUM/AVE.DST CAN ONLY BE USED WITH AGGREGATION VERBS
2. Displaying Report Data
Creating Reports With TIBCO® WebFOCUS Language 67

The following error occurs if you use DST. in a MATCH command:
(FOC1854) THE DST OPERATOR IS ONLY SUPPORTED IN TABLE REQUESTS
The following error occurs if you reformat a BY field (when used with the PRINT command,the DST.fieldname becomes a BY field):
(FOC1862) REFORMAT DST.FIELD IS NOT SUPPORTED WITH PRINT
The following error occurs if you use the DST. operator with NOSPLIT:
(FOC1864) THE DST OPERATOR IS NOT SUPPORTED WITH NOSPLIT
The following error occurs if you use a multi-verb request, SUM DST.fieldname BY fieldPRINT fld BY fld (a verb object operator used with the SUM command must be at the lowestlevel of aggregation):
(FOC1867) DST OPERATOR MUST BE AT THE LOWEST LEVEL OF AGGREGATION
The DST. operator may not be used as part of a HEADING or a FOOTING.
The DST., AVE.DST, CNT.DST., and SUM.DST. operators are not supported with WITHIN in arequest that uses an aggregation display command, such as SUM. The DST. operator issupported with WITHIN when the request uses the PRINT display command.
Retrieving First and Last Records
FST. is a prefix that displays the first retrieved record selected for a given field. LST. displaysthe last retrieved record selected for a given field.
When using the FST. and LST. prefix operators, it is important to understand how your datasource is structured.
If the record is in a segment with values organized from lowest to highest (segment typeS1), the first logical record that the FST. prefix operator retrieves is the lowest value in theset of values. The LST. prefix operator would, therefore, retrieve the highest value in the setof values.
If the record is in a segment with values organized from highest to lowest (segment typeSH1), the first logical record that the FST. prefix operator retrieves is the highest value inthe set of values. The LST. prefix operator would, therefore, retrieve the lowest value in theset of values.
Manipulating Display Fields With Prefix Operators
68

For more information on segment types and file design, see the Describing Data With TIBCOWebFOCUS® Language manual. If you wish to reorganize the data in the data source orrestructure the data source while reporting, see Improving Report Processing on page 1929.
Example: Retrieving the First Record
The following request retrieves the first logical record in the EMP_ID field:
TABLE FILE EMPLOYEESUM FST.EMP_IDEND
The output is:
FST EMP_ID ------ 071382660
Example: Segment Types and Retrieving Records
The EMPLOYEE data source contains the DEDUCT segment, which orders the fields DED_CODEand DED_AMT from lowest value to highest value (segment type of S1). The DED_CODE fieldindicates the type of deduction, such as CITY, STATE, FED, and FICA. The following requestretrieves the first logical record for DED_CODE for each employee:
TABLE FILE EMPLOYEESUM FST.DED_CODEBY EMP_IDEND
The output is:
FST EMP_ID DED_CODE------ --------071382660 CITY 112847612 CITY 117593129 CITY 119265415 CITY 119329144 CITY 123764317 CITY 126724188 CITY 219984371 CITY 326179357 CITY 451123478 CITY 543729165 CITY 818692173 CITY
Note, however, the command SUM LST.DED_CODE would have retrieved the last logical recordfor DED_CODE for each employee.
2. Displaying Report Data
Creating Reports With TIBCO® WebFOCUS Language 69

If the record is in a segment with values organized from highest to lowest (segment type SH1),the first logical record that the FST. prefix operator retrieves is the highest value in the set ofvalues. The LST. prefix operator would therefore retrieve the lowest value in the set of values.
For example, the EMPLOYEE data source contains the PAYINFO segment, which orders thefields JOBCODE, SALARY, PCT_INC, and DAT_INC from highest value to lowest value (segmenttype SH1). The following request retrieves the first logical record for SALARY for eachemployee:
TABLEF FILE EMPLOYEESUM FST.SALARYBY EMP_IDEND
The output is:
FST EMP_ID SALARY------ ------071382660 $11,000.00112847612 $13,200.00117593129 $18,480.00119265415 $9,500.00119329144 $29,700.00123764317 $26,862.00126724188 $21,120.00219984371 $18,480.00326179357 $21,780.00451123478 $16,100.00543729165 $9,000.00818692173 $27,062.00
However, the command SUM LST.SALARY would have retrieved the last logical record forSALARY for each employee.
Summing and Counting Values
You can count occurrences and summarize values with one display command using the prefixoperators CNT., SUM., and TOT. Just like the COUNT command, CNT. counts the occurrencesof the field it prefixes. Just like the SUM command, SUM. sums the values of the field itprefixes. TOT. sums the values of the field it prefixes when used in a heading (includingfootings, subheads, and subfoots).
Manipulating Display Fields With Prefix Operators
70
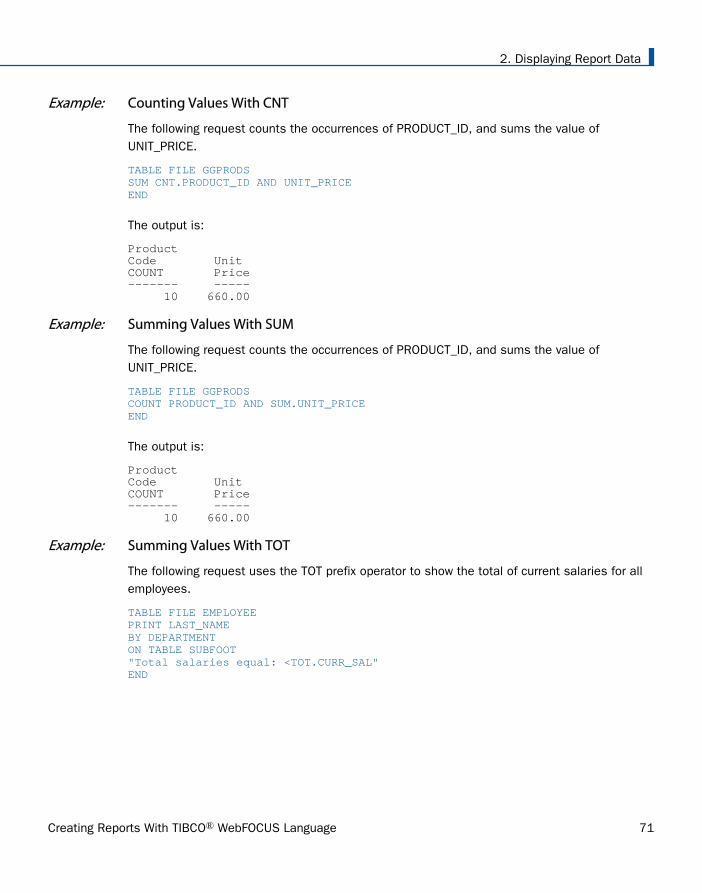
Example: Counting Values With CNT
The following request counts the occurrences of PRODUCT_ID, and sums the value ofUNIT_PRICE.
TABLE FILE GGPRODSSUM CNT.PRODUCT_ID AND UNIT_PRICEEND
The output is:
Product Code Unit COUNT Price------- ----- 10 660.00
Example: Summing Values With SUM
The following request counts the occurrences of PRODUCT_ID, and sums the value ofUNIT_PRICE.
TABLE FILE GGPRODSCOUNT PRODUCT_ID AND SUM.UNIT_PRICEEND
The output is:
Product Code Unit COUNT Price------- ----- 10 660.00
Example: Summing Values With TOT
The following request uses the TOT prefix operator to show the total of current salaries for allemployees.
TABLE FILE EMPLOYEEPRINT LAST_NAMEBY DEPARTMENTON TABLE SUBFOOT"Total salaries equal: <TOT.CURR_SAL"END
2. Displaying Report Data
Creating Reports With TIBCO® WebFOCUS Language 71
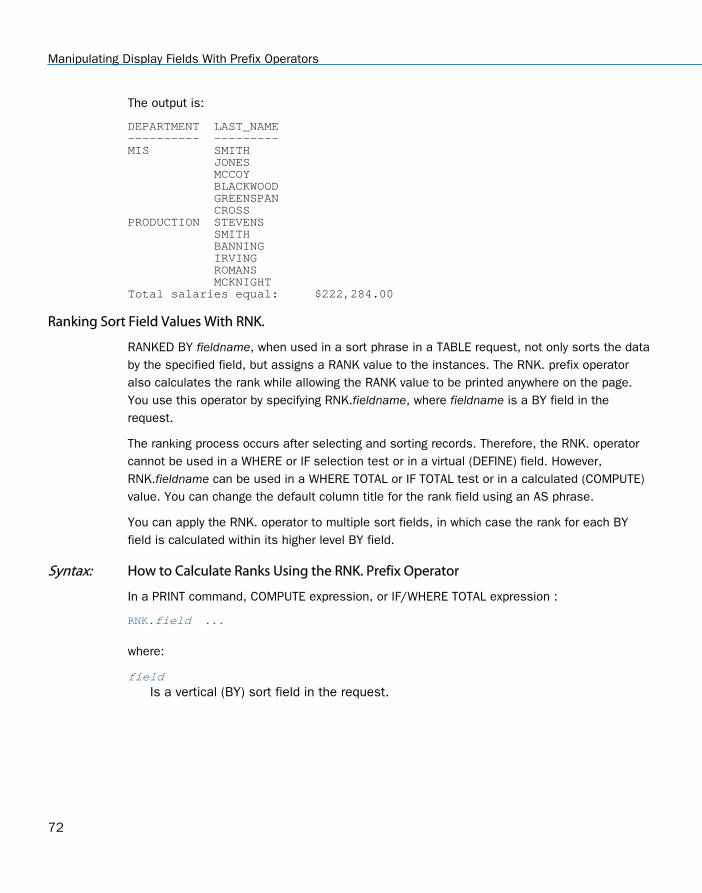
The output is:
DEPARTMENT LAST_NAME ---------- --------- MIS SMITH JONES MCCOY BLACKWOOD GREENSPAN CROSS PRODUCTION STEVENS SMITH BANNING IRVING ROMANS MCKNIGHT Total salaries equal: $222,284.00
Ranking Sort Field Values With RNK.
RANKED BY fieldname, when used in a sort phrase in a TABLE request, not only sorts the databy the specified field, but assigns a RANK value to the instances. The RNK. prefix operatoralso calculates the rank while allowing the RANK value to be printed anywhere on the page.You use this operator by specifying RNK.fieldname, where fieldname is a BY field in therequest.
The ranking process occurs after selecting and sorting records. Therefore, the RNK. operatorcannot be used in a WHERE or IF selection test or in a virtual (DEFINE) field. However,RNK.fieldname can be used in a WHERE TOTAL or IF TOTAL test or in a calculated (COMPUTE)value. You can change the default column title for the rank field using an AS phrase.
You can apply the RNK. operator to multiple sort fields, in which case the rank for each BYfield is calculated within its higher level BY field.
Syntax: How to Calculate Ranks Using the RNK. Prefix Operator
In a PRINT command, COMPUTE expression, or IF/WHERE TOTAL expression :
RNK.field ...
where:
fieldIs a vertical (BY) sort field in the request.
Manipulating Display Fields With Prefix Operators
72

Example: Ranking Within Sort Groups
The following request ranks years of service within department and ranks salary within years ofservice and department. Note that years of service depends on the value of TODAY. The outputfor this example was valid when run in September, 2006:
DEFINE FILE EMPDATA TODAY/YYMD = &YYMD; YRS_SERVICE/I9 = DATEDIF(HIREDATE,TODAY,'Y');ENDTABLE FILE EMPDATAPRINT SALARY RNK.YRS_SERVICE AS 'RANKING,BY,SERVICE' RNK.SALARY AS 'SALARY,RANK' BY DEPT BY HIGHEST YRS_SERVICE BY HIGHEST SALARY NOPRINTWHERE DEPT EQ 'MARKETING' OR 'SALES'ON TABLE SET PAGE NOPAGEEND
The output is:
RANKING BY SALARYDEPT YRS_SERVICE SALARY SERVICE RANK---- ----------- ------ ------- ------MARKETING 17 $55,500.00 1 1 $55,500.00 1 1 16 $62,500.00 2 1 $62,500.00 2 1 $62,500.00 2 1 $58,800.00 2 2 $52,000.00 2 3 $35,200.00 2 4 $32,300.00 2 5 15 $50,500.00 3 1 $43,400.00 3 2SALES 17 $115,000.00 1 1 $54,100.00 1 2 16 $70,000.00 2 1 $43,000.00 2 2 15 $43,600.00 3 1 $39,000.00 3 2 15 $30,500.00 3 3
2. Displaying Report Data
Creating Reports With TIBCO® WebFOCUS Language 73

Example: Using RNK. in a WHERE TOTAL Test
The following request displays only those rows in the highest two salary ranks within the yearsof service category. Note that years of service depends on the value of TODAY. The output forthis example was valid when run in September, 2006:
DEFINE FILE EMPDATA TODAY/YYMD = &YYMD; YRS_SERVICE/I9 = DATEDIF(HIREDATE,TODAY,'Y');ENDTABLE FILE EMPDATAPRINT LASTNAME FIRSTNAME RNK.SALARYBY HIGHEST YRS_SERVICE BY HIGHEST SALARYWHERE TOTAL RNK.SALARY LE 2END
The output is:
RANKYRS_SERVICE SALARY LASTNAME FIRSTNAME SALARY----------- ------ -------- --------- ------ 17 $115,000.00 LASTRA KAREN 1 $80,500.00 NOZAWA JIM 2 16 $83,000.00 SANCHEZ EVELYN 1 $70,000.00 CASSANOVA LOIS 2 15 $62,500.00 HIRSCHMAN ROSE 1 WANG JOHN 1 $50,500.00 LEWIS CASSANDRA 2
Example: Using RNK. in a COMPUTE Command
The following request sets a flag to Y for records in which the salary rank within department isless than or equal to 5 and the rank of years of service within salary and department is lessthan or equal to 6. Otherwise, the flag has the value N. Note that the years of service dependson the value of TODAY. The output for this example was valid when run in September, 2006:
DEFINE FILE EMPDATA TODAY/YYMD = &YYMD; YRS_SERVICE/I9 = DATEDIF(HIREDATE,TODAY,'Y');ENDTABLE FILE EMPDATAPRINT RNK.SALARY RNK.YRS_SERVICECOMPUTE FLAG/A1 = IF RNK.SALARY LE 5 AND RNK.YRS_SERVICE LE 6 THEN 'Y' ELSE 'N';BY DEPT BY SALARY BY YRS_SERVICEWHERE DEPT EQ 'MARKETING' OR 'SALES'ON TABLE SET PAGE NOPAGEEND
Manipulating Display Fields With Prefix Operators
74

The output is:
RANK RANKDEPT SALARY YRS_SERVICE SALARY YRS_SERVICE FLAG---- ------ ----------- ------ ----------- ----MARKETING $32,300.00 16 1 1 Y $35,200.00 16 2 1 Y $43,400.00 15 3 1 Y $50,500.00 15 4 1 Y $52,000.00 16 5 1 Y $55,500.00 17 6 1 N 6 1 N $58,800.00 16 7 1 N $62,500.00 16 8 1 N 8 1 N 8 1 NSALES $30,500.00 15 1 1 Y $39,000.00 15 2 1 Y $43,000.00 16 3 1 Y $43,600.00 15 4 1 Y $54,100.00 17 5 1 Y $70,000.00 16 6 1 N $115,000.00 17 7 1 N
Rolling Up Calculations on Summary Rows
Using SUMMARIZE and RECOMPUTE, you can recalculate values at sort field breaks, but thesecalculations use the detail data to calculate the value for the summary line.
Using the ROLL. operator in conjunction with another prefix operator on a summary linerecalculates the sort break values using the values from summary lines generated for thelower level sort break.
The operator combinations supported are:
ROLL.SUM. (same as ROLL.). Alphanumeric fields are supported with SUM. This returnseither the first, minimum, maximum, or last value according to the SUMPREFIX parameter.
ROLL.AVE.
ROLL.MAX. (supported with alphanumeric fields as well as numeric fields)
ROLL.MIN. (supported with alphanumeric fields as well as numeric fields)
ROLL.FST. (supported with alphanumeric fields as well as numeric fields)
ROLL.LST. (supported with alphanumeric fields as well as numeric fields)
ROLL.CNT.
ROLL.ASQ.
2. Displaying Report Data
Creating Reports With TIBCO® WebFOCUS Language 75

ROLL.prefix on a summary line indicates that the prefix operation will be performed on thesummary values from the next lowest level of summary command.
If the ROLL. operator is used without another prefix operator, it is treated as a SUM. Therefore,if the summary command for the lowest BY field specifies AVE., and the next higher specifiesROLL., the result will be the sum of the averages. To get the average of the averages, youwould use ROLL.AVE at the higher level.
Note: With SUMMARIZE and SUB-TOTAL, the same calculations are propagated to all higherlevel sort breaks.
Syntax: How to Roll Up Summary Values
BY field {SUMMARIZE|SUBTOTAL|SUB-TOTAL|RECOMPUTE} [ROLL.][prefix1.][field1 field2 ...|*] [ROLL.][prefix2.] [fieldn ...]
Or:
BY field
ON field {SUMMARIZE|SUBTOTAL|SUB-TOTAL|RECOMPUTE} ROLL.[prefix.][field1 field2 ...|*]
where:
ROLL.
Indicates that the summary values should be calculated using the summary values fromthe next lowest level summary command.
field
Is a BY field in the request.
prefix1, prefix2
Are prefix operators to use for the summary values. It can be one of the followingoperators: SUM. (the default operator if none is specified), AVE., MAX., MIN., FST., LST.,CNT., ASQ.
field1 field2 fieldn
Are fields to be summarized.
*
Indicates that all fields, numeric and alphanumeric, should be included on the summarylines. You can either use the asterisk to display all columns or reference the specificcolumns you want to display.
Manipulating Display Fields With Prefix Operators
76

Example: Rolling Up an Average Calculation
The following request against the GGSALES data source contains two sort fields, REGION andST. The summary command for REGION applies the AVE. operator to the sum of the unitsvalue for each state.
TABLE FILE GGSALES SUM UNITS AS 'Inventory ' BY REGION BY ST ON REGION SUBTOTAL AVE. AS 'Average' WHERE DATE GE 19971001 WHERE REGION EQ 'West' OR 'Northeast' ON TABLE SET PAGE NOPAGE END
On the output, the UNITS values for each state are averaged to calculate the subtotal for eachregion. The UNITS values for each state are also used to calculate the average for the grandtotal row.
Region State Inventory------ ----- ----------Northeast CT 37234 MA 35720 NY 36248
Average Northeast 36400
West CA 75553 WA 40969
Average West 58261
TOTAL 45144
The following version of the request adds a summary command for the grand total line thatincludes the ROLL. operator:
TABLE FILE GGSALES SUM UNITS AS 'Inventory ' BY REGION BY ST ON REGION SUBTOTAL AVE. AS 'Average' WHERE DATE GE 19971001 WHERE REGION EQ 'West' OR 'Northeast' ON TABLE SUBTOTAL ROLL.AVE. AS ROLL.AVE ON TABLE SET PAGE NOPAGE END
2. Displaying Report Data
Creating Reports With TIBCO® WebFOCUS Language 77

On the output, the UNITS values for each state are averaged to calculate the subtotal for eachregion, and those region subtotal values are used to calculate the average for the grand totalrow:
Region State Inventory ------ ----- ---------- Northeast CT 37234 MA 35720 NY 36248 Average Northeast 36400 West CA 75553 WA 40969 Average West 58261 ROLL.AVE 47330
Example: Propagating Rollups to Higher Level Sort Breaks
The following request against the GGSALES data source has three BY fields. The SUBTOTALcommand for the PRODUCT sort field specifies AVE., and the SUMMARIZE command for thehigher level sort field, REGION, specifies ROLL.AVE.
TABLE FILE GGSALESSUM UNITSBY REGIONBY PRODUCTBY HIGHEST DATEWHERE DATE GE 19971001 WHERE REGION EQ 'Midwest' OR 'Northeast' WHERE PRODUCT LIKE 'C%' ON PRODUCT SUBTOTAL AVE. ON REGION SUMMARIZE ROLL.AVE. AS ROLL.AVEON TABLE SET PAGE NOPAGEEND
Manipulating Display Fields With Prefix Operators
78

On the output, the detail rows for each date are used to calculate the average for eachproduct. Because of the ROLL.AVE. at the region level, the averages for each product are usedto calculate the averages for each region, and the region averages are used to calculate theaverage for the grand total line:
Region Product Date Unit Sales ------ ------- ---- ---------- Midwest Coffee Grinder 1997/12/01 4648 1997/11/01 3144 1997/10/01 1597 *TOTAL PRODUCT Coffee Grinder 3129 Coffee Pot 1997/12/01 1769 1997/11/01 1462 1997/10/01 2346 *TOTAL PRODUCT Coffee Pot 1859 Croissant 1997/12/01 7436 1997/11/01 5528 1997/10/01 6060 *TOTAL PRODUCT Croissant 6341 ROLL.AVE Midwest 3776 Northeast Capuccino 1997/12/01 1188 1997/11/01 2282 1997/10/01 3675 *TOTAL PRODUCT Capuccino 2381 Coffee Grinder 1997/12/01 1536 1997/11/01 1399 1997/10/01 1315 *TOTAL PRODUCT Coffee Grinder 1416 Coffee Pot 1997/12/01 1442 1997/11/01 2129 1997/10/01 2082 *TOTAL PRODUCT Coffee Pot 1884 Croissant 1997/12/01 4291 1997/11/01 6978 1997/10/01 4741 *TOTAL PRODUCT Croissant 5336 ROLL.AVE Northeast 2754 TOTAL 3265
2. Displaying Report Data
Creating Reports With TIBCO® WebFOCUS Language 79

Reference: Usage Notes for ROLL.
ROLL.prefix on a summary line indicates that the prefix operation will be performed on thesummary values from the next lowest level of summary command.
If no summary command was issued at the level below the ROLL., and no other operatorwas used in conjunction with the ROLL., a SUM. will be calculated. If the lower level had nosummary command and ROLL. was used with another prefix operator (for example,ROLL.AVE.), the specified prefix operator will be used. For example, ROLL.AVE. will becomeAVE.
CNT. prefix shows the number of data lines displayed, which is not affected by MULTILINES.
ROLL.CNT. prefix shows the number of summary lines displayed, which is affected byMULTILINES.
Calculating the Standard Deviation for a Population or a Sample
The standard deviation prefix operators return a numeric value that represents the amount ofdispersion in the data. The set of data can be specified as the entire population (STDP.) or asample (STDS.). The standard deviation is the square root of the variance, which is a measureof how observations deviate from their expected value (mean). If specified as a population, thedivisor in the standard deviation calculation (also called degrees of freedom) will be the totalnumber of data points, N. If specified as a sample, the divisor will be N-1.
If x¡ is an observation, N is the number of observations, and µ is the mean of all of theobservations, the formula for calculating the standard deviation for a population is:
To calculate the standard deviation for a sample, the mean is calculated using the sampleobservations, and the divisor is N-1 instead of N.
To calculate the standard deviation for a population, the syntax is:
STDP.field
To calculate the standard deviation for a sample, the syntax is:
STDS.field
Manipulating Display Fields With Prefix Operators
80

where:
fieldNumeric
Is the set of observations for the standard deviation calculation.Example: Calculating the Standard Deviation of a Population
The following request calculates the standard deviation of the population of the DOLLARS fieldconverted to double precision.
DEFINE FILE ibisamp/ggsalesDOLLARS/D12.2 = DOLLARS;ENDTABLE FILE ibisamp/ggsalesSUM DOLLARS STDP.DOLLARS ON TABLE SET PAGE NOLEADON TABLE SET STYLE *GRID=OFF,$ENDSTYLEEND
The output is shown in the following image.
Using Report-Level Prefix Operators
Report level prefix operators are available for headings, footings, subheadings, subfootings,verb objects, and calculated values (COMPUTEs) that calculate the average, maximum,minimum, and count for the entire report. They are based on the TOT. operator, whichcalculates total values to include in a heading.
These operators cannot be referenced in WHERE or WHERE TOTAL tests. However, they can beused in a COMPUTE command to generate a calculated value that can be used in a WHERETOTAL test.
Syntax: How to Calculate Report-Level Average, Maximum, Minimum, and Count Values
operator.field
2. Displaying Report Data
Creating Reports With TIBCO® WebFOCUS Language 81

where:
operator
Can be one of the following prefix operators.
TOTAVE. Calculates the average value of the field for the entire table.
TOTMAX. Calculates the maximum value of the field for the entire table.
TOTMIN. Calculates the minimum value of the field for the entire table.
TOTCNT. Calculates the count of the field instances for the entire table.
field
Is a verb object or calculated value in the request.
Example: Using Prefix Operators in a Heading
The following request uses prefix operators in the heading.
TABLE WF_RETAIL_LITEHEADING"Heading Calculations:""Total: <TOT.COGS_US""Count: <TOTCNT.COGS_US""Average: <TOTAVE.COGS_US""Minimum: <TOTMIN.COGS_US""Maximum: <TOTMAX.COGS_US"SUM COGS_US CNT.COGS_US AS Count AVE.COGS_US AS Average MIN.COGS_US AS Minimum MAX.COGS_US AS MaximumBY BUSINESS_REGION AS RegionBY PRODUCT_CATEGORY AS CategoryWHERE BUSINESS_REGION NE 'Oceania'ON TABLE SUBTOTAL COGS_US CNT.COGS_US AS TotalON TABLE SET PAGE NOPAGEON TABLE SET SHOWBLANKS ONON TABLE SET STYLE *type=report,grid=off, size=11,$ENDSTYLEEND
Manipulating Display Fields With Prefix Operators
82

The output is shown in the following image.
Reference: Usage Notes for Report-Level Prefix Operators
These operators can be used on a field in a heading or footing without being referenced ina display command in the request.
2. Displaying Report Data
Creating Reports With TIBCO® WebFOCUS Language 83

They work in a heading or footing for real or virtual (DEFINE) fields. They work in a displaycommand field list on real fields, virtual (DEFINE) fields, and calculated (COMPUTE) valuesthat are calculated prior to their use in the request.
They can be used in subheadings and subfootings to reference the total value for the entirereport.
Displaying Pop-up Field Descriptions for Column Titles
You can have pop-up field descriptions display in an HTML report when the mouse pointer ispositioned over column titles. Field description text displays in a pop-up box near the columntitle using the default font for the report. Pop-up text appears for report column titles includingtitles created with ACROSS phrases and stacked column titles created with OVER phrases.
The pop-up text displayed for a column title is defined by the Description attribute in theMaster File for the corresponding field. If a column title has no Description entry in the MasterFile, then no pop-up box is generated when your mouse is positioned over the title.
For more information about the Description attribute, see Null or MISSING Values: MISSING inthe Describing Data With TIBCO WebFOCUS® Languagemanual.
Syntax: How to Use the POPUPDESC Command
SET POPUPDESC = {ON|OFF}
where:
ON
Enables pop-up field descriptions when your mouse pointer is positioned over columntitles.
OFF
Disables pop-up field descriptions when your mouse pointer is positioned over columntitles. OFF is the default value.
Example: Using the POPUPDESC Command
The Master File referenced by the report contains the following:
FIELD=UNITS, ALIAS=E10, FORMAT=I08, TITLE='Unit Sales', DESC='Number of units sold',$
Displaying Pop-up Field Descriptions for Column Titles
84

The code used to create the report is:
TABLE FILE GGSALESSUM UNITSBY REGIONBY PRODUCTWHERE REGION EQ 'Midwest'ON TABLE SET POPUPDESC ONEND
The following image shows the report output and the pop-up field description text that displayswhen your mouse pointer is positioned over the Unit Sales column title.
Reference: Distributing Reports With Pop-up Field Descriptions Using ReportCaster
Distributing an HTML report containing pop-up field descriptions with ReportCaster requires theuse of JavaScript components located on the WebFOCUS Client. To access these componentsfrom a report distributed by ReportCaster, the scheduled procedure must contain the SETFOCHTMLURL command, which must be set to an absolute URL, instead of the default value.For example,
SET FOCHTMLURL = http://hostname[:port]/ibi_apps/ibi_html
where:
hostname[:port]
Is the host name and optional port number (specified only if you are not using the defaultport number) where the WebFOCUS Web application is deployed.
2. Displaying Report Data
Creating Reports With TIBCO® WebFOCUS Language 85

ibi_apps/ibi_html
ibi_apps is the site-customized web server alias pointing to the WEBFOCUS82/ibi_appsdirectory (where ibi_apps is the default value). ibi_html is a directory within the path to theJavaScript files that are required to be accessible.
For more information about coding reports for use with ReportCaster, see the Tips andTechniques for Coding a ReportCaster Report appendix in the TIBCO WebFOCUS® ReportCastermanual.
Displaying Pop-up Field Descriptions for Column Titles
86

Chapter3Sorting Tabular Reports
Sorting enables you to group or organize report information vertically and horizontally, inrows and columns, and specify a desired sequence of data items in the report.
Any field in the data source can be the sort field. If you wish, you can select several sortfields, nesting one within another. Sort fields appear only when their values change.
In this chapter:
Sorting Tabular Reports Overview
Sorting Rows
Sorting Columns
Controlling Display of Sort Field Values
Reformatting Sort Fields
Manipulating Display Field Values in aSort Group
Creating a Matrix Report
Controlling Collation Sequence
Specifying the Sort Order
Ranking Sort Field Values
Grouping Numeric Data Into Ranges
Restricting Sort Field Values by Highest/Lowest Rank
Sorting and Aggregating Report Columns
Hiding Sort Values
Sort Performance Considerations
Sorting With Multiple Display Commands
Improving Efficiency With External Sorts
Hierarchical Reporting: BY HIERARCHY
Sorting Tabular Reports Overview
You sort a report using vertical (BY) and horizontal (ACROSS) phrases:
BY displays the sort field values vertically, creating rows. Vertical sort fields are displayedin the left-most columns of the report.
ACROSS displays the sort field values horizontally, creating columns. Horizontal sort fieldsare displayed across the top of the report.
BY and ACROSS phrases used in the same report create rows and columns, producing agrid or matrix.
A request can include up to 128 sort phrases consisting of any combination of BY andACROSS phrases.
Creating Reports With TIBCO® WebFOCUS Language 87
Additional sorting options include:
Sorting from low to high values or from high to low values, and defining your own sortingsequence.
Sorting based on case-sensitive or case-insensitive collation sequence.
Leaving the value of the sort field out of the report.
Grouping numeric data into tiles such as percentiles or deciles.
Aggregating and sorting numeric columns simultaneously.
Grouping numeric data into ranges.
Ranking data, and selecting data based on rank.
Reference: Sorting and Displaying Data
There are two ways that you can sort information, depending on the type of display commandyou use:
You can sort and display individual values of a field using the PRINT or LIST command.
You can group and aggregate information. For example, you can show the number of fieldoccurrences per sort value using the COUNT command, or summing the field values usingthe SUM command.
When you use the display commands PRINT and LIST, the report may generate several rowsper sort value; specifically, one row for each occurrence of the display field. When you use thecommands SUM and COUNT, the report generates one row for each unique set of sort values.For related information, see Sorting With Multiple Display Commands on page 181.
For details on all display commands, see Displaying Report Data on page 39.
Sorting Rows
You can sort report information vertically using the BY phrase. This creates rows in your report.You can include up to 128 sort phrases (BY phrases plus ACROSS phrases) per report request(127 if using PRINT or LIST display commands).
Sort fields appear when their value changes. However, you can display every sort value usingthe BYDISPLAY parameter. For an example, see Controlling Display of Sort Field Values on page134.
Sorting Rows
88

Syntax: How to Sort by Rows
BY {HIGHEST|LOWEST} [n] sortfield [AS 'text']
where:
HIGHEST
Sorts in descending order.
LOWEST
Sorts in ascending order. LOWEST is the default value.
n
Specifies that only n sort field values are included in the report.
sortfield
Is the name of the sort field.
text
Is the column heading to use for the sort field column on the report output.
Reference: Usage Notes for Sorting Rows
When using the display command LIST with a BY phrase, the LIST counter is reset to 1each time the major sort value changes.
The default sort sequence is low-to-high, with the following variations for different operatingsystems. In z/OS the sequence is a-z, A-Z, 0-9 for alphanumeric fields; 0-9 for numericfields. In UNIX and Windows the sequence is 0-9, A-Z, a-z for alphanumeric fields; 0-9 fornumeric. You can specify other sorting sequences, as described in Specifying the Sort Orderon page 150.
You cannot use text fields as sort fields. Text fields are those described in the Master Filewith a FORMAT value of TX.
You can use a temporary field created by a DEFINE command, or by the DEFINE attribute ina Master File, as a sort field. In order to use a temporary field created by a COMPUTEcommand as a sort field, you must use the BY TOTAL phrase instead of the BY phrase.
If you specify several sort fields when reporting from a multi-path data source, all the sortfields must be in the same path.
Sort phrases cannot contain format information for fields.
3. Sorting Tabular Reports
Creating Reports With TIBCO® WebFOCUS Language 89

Each sort field value appears only once in the report. For example, if there are sixemployees in the MIS department, a request that declares
PRINT LAST_NAME BY DEPARTMENT
prints MIS once, followed by six employee names. You can populate every vertical sortcolumn cell with a value, even if the value is repeating, using the SET BYDISPLAYparameter. For details, see Controlling Display of Sort Field Values on page 134.
Example: Sorting Rows With BY
The following illustrates how to display all employee IDs by department.
TABLE FILE EMPLOYEEPRINT EMP_IDBY DEPARTMENTEND
The output displays a row for each EMP_ID in each department:
Using Multiple Vertical (BY) Sort Fields
You can organize information in a report by using more than one sort field. When you specifyseveral sort fields, the sequence of the BY phrases determines the sort order. The first BYphrase sets the major sort break, the second BY phrase sets the second sort break, and soon. Each successive sort is nested within the previous one.
Sorting Rows
90

Example: Sorting With Multiple Vertical (BY) Sort Fields
The following request uses multiple vertical (BY) sort fields.
TABLE FILE EMPLOYEEPRINT CURR_SALBY DEPARTMENT BY LAST_NAMEWHERE CURR_SAL GT 21500END
The output is:
DEPARTMENT LAST_NAME CURR_SAL---------- --------- --------MIS BLACKWOOD $21,780.00 CROSS $27,062.00PRODUCTION BANNING $29,700.00 IRVING $26,862.00
Displaying a Row for Data Excluded by a Sort Phrase
In a sort phrase, you can restrict the number of sort values displayed. With the PLUS OTHERSphrase, you can aggregate all other values to a separate group and display this group as anadditional report row.
Syntax: How to Display Data Excluded by a Sort Phrase
[RANKED] BY {HIGHEST|LOWEST|TOP|BOTTOM} n srtfield [AS 'text'] [PLUS OTHERS AS 'othertext'] [IN-GROUPS-OF m1 [TOP n2]] [IN-RANGES-OF m3 [TOP n4]
where:
LOWEST
Sorts in ascending order, beginning with the lowest value and continuing to the highestvalue (a-z, A-Z, 0-9 for alphanumeric fields; 0-9 for numeric fields). BOTTOM is a synonymfor LOWEST.
HIGHEST
Sorts in descending order, beginning with the highest value and continuing to the lowestvalue. TOP is a synonym for HIGHEST.
n
Specifies that only n sort field values are included in the report.
srtfield
Is the name of the sort field.
3. Sorting Tabular Reports
Creating Reports With TIBCO® WebFOCUS Language 91

text
Is the text to be used as the column heading for the sort field values.
othertext
Is the text to be used as the row title for the "others" grouping. This AS phrase must bethe AS phrase immediately following the PLUS OTHERS phrase.
m1
Is the incremental value between sort field groups.
n2
Is an optional number that defines the highest group label to be included in the report.
m3
Is an integer greater than zero indicating the range by which sort field values are grouped.
n4
Is an optional number that defines the highest range label to be included in the report. Therange is extended to include all data values higher than this value.
Reference: Usage Notes for PLUS OTHERS
Alphanumeric group keys are not supported.
Only one PLUS OTHERS phrase is supported in a request.
In a request with multiple display commands, the BY field that has the PLUS OTHERSphrase must be the lowest level BY field in the request. If it is not, a message will displayand the request will not be processed.
The BY ROWS OVER, TILES, ACROSS, and BY TOTAL phrases are not supported with PLUSOTHERS.
PLUS OTHERS is not supported in a MATCH FILE request. However, MORE in a TABLErequest is supported.
HOLD is supported for formats PDF, PS, HTML, DOC, and WP.
Sorting Rows
92

Example: Displaying a Row Representing Sort Field Values Excluded by a Sort Phrase
The following request displays the top two ED_HRS values and aggregates the values notincluded in a row labeled Others:
TABLE FILE EMPLOYEEPRINT CURR_SAL LAST_NAME BY HIGHEST 2 ED_HRS PLUS OTHERS AS 'Others'END
The output is:
ED_HRS CURR_SAL LAST_NAME------ -------- --------- 75.00 $21,780.00 BLACKWOOD 50.00 $18,480.00 JONES $16,100.00 MCKNIGHTOthers $165,924.00
Example: Displaying a Row Representing Data Not Included in Any Sort Field Grouping
The following request sorts by highest 2 ED_HRS and groups the sort field values byincrements of 25 ED_HRS. Values that fall below the lowest group label are included in theOthers category. All values above the top group label are included in the top group:
TABLE FILE EMPLOYEEPRINT CURR_SAL LAST_NAME BY HIGHEST 2 ED_HRS PLUS OTHERS AS 'Others'IN-GROUPS-OF 25 TOP 50END
The output is:
ED_HRS CURR_SAL LAST_NAME------ -------- --------- 50.00 $18,480.00 JONES $21,780.00 BLACKWOOD $16,100.00 MCKNIGHT 25.00 $11,000.00 STEVENS $13,200.00 SMITH $26,862.00 IRVING $9,000.00 GREENSPAN $27,062.00 CROSSOthers $78,800.00
3. Sorting Tabular Reports
Creating Reports With TIBCO® WebFOCUS Language 93

If the BY HIGHEST phrase is changed to BY LOWEST, all values above the top grouping (50ED_HRS and above) are included in the Others category:
TABLE FILE EMPLOYEEPRINT CURR_SAL LAST_NAME BY LOWEST 2 ED_HRS PLUS OTHERS AS 'Others'IN-GROUPS-OF 25 TOP 50END
The output is:
ED_HRS CURR_SAL LAST_NAME------ -------- --------- .00 $9,500.00 SMITH $29,700.00 BANNING $21,120.00 ROMANS $18,480.00 MCCOY 25.00 $11,000.00 STEVENS $13,200.00 SMITH $26,862.00 IRVING $9,000.00 GREENSPAN $27,062.00 CROSSOthers $56,360.00
Sorting Columns
You can sort report information horizontally using the ACROSS phrase. This creates columns inyour report. The total number of ACROSS columns is equal to the total number of ACROSS sortfield values multiplied by the total number of display fields.
A request can include up to 128 sort phrases consisting of any combination of BY andACROSS phrases.
The maximum number of display fields your report can contain is determined by a combinationof factors. In general, if a horizontal (ACROSS) sort field contains many data values, you mayexceed the allowed width for reports, or create a report that is difficult to read. For details, see Displaying Report Data on page 39.
You can produce column totals or summaries for ACROSS sort field values using ACROSS-TOTAL, SUBTOTAL, SUB-TOTAL, RECOMPUTE, and SUMMARIZE. For details, see IncludingTotals and Subtotals on page 367.
Sorting Columns
94

Syntax: How to Sort Columns
ACROSS sortfield
where:
sortfield
Is the name of the sort field.
Reference: Usage Notes for Sorting Columns
You cannot use text fields as sort fields. Text fields are those described in the Master Filewith a FORMAT value of TX.
You can use a temporary field created by a DEFINE command, or by the DEFINE attribute ina Master File, as a sort field. However, you cannot use a temporary field created by aCOMPUTE command as a sort field. You can accomplish this using the BY TOTAL phrase orindirectly by first creating a HOLD file that includes the field, and then reporting from theHOLD file. HOLD files are described in Saving and Reusing Your Report Output on page471.
For an ACROSS phrase, the SET SPACES parameter controls the distance between ACROSSsets. For more information, see Laying Out the Report Page on page 1333.
If you specify several sort fields when reporting from a multipath data source, all the sortfields must be in the same path.
In styled output formats (PDF, HTML, DHTML, PPT, PPTX, and XLSX), the width of ACROSStitles and ACROSS values above the data columns is defined as the largest width of alldata columns, and associated column titles, within the ACROSS groups. To change the sizeof the ACROSS groups, apply SQUEEZE, WRAP, or WIDTH definitions to the data columnswithin each group.
Each sort field value is displayed only once in the report unless you change this defaultusing the SET BYDISPLAY command. For example, if there are six employees in the MISdepartment, a report that declares
PRINT LAST_NAME ACROSS DEPARTMENT
prints MIS once, followed by six employee names.
3. Sorting Tabular Reports
Creating Reports With TIBCO® WebFOCUS Language 95

Example: Sorting Columns With ACROSS
The following illustrates how to show the total salary outlay for each department. This requestis sorted horizontally with an ACROSS phrase.
TABLE FILE EMPLOYEESUM CURR_SAL ACROSS DEPARTMENTEND
The output is:
DEPARTMENTMIS PRODUCTION---------------------------------$108,002.00 $114,282.00
Notice that the horizontal sort displays a column for each sort field (department).
Controlling Display of an ACROSS Title for a Single Field
Using the SET ACRSVRBTITL command, you can control the display of an ACROSS column titlein an ACROSS group. The behavior of the title is determined by the number of verb columns inthe ACROSS group. The field count is affected by the following features, which add internalmatrix columns to the report:
Fields in a heading or footing.
Fields whose display is suppressed with the NOPRINT phrase.
Reformatted fields (which are normally counted twice).
A COMPUTE command referencing multiple fields.
Syntax: How to Control Display of an ACROSS Title for a Single Field
SET ACRSVRBTITL = {HIDEONE|ON|OFF}ON TABLE SET ACRSVRBTITL {HIDEONE|ON|OFF}
where:
HIDEONE
Suppresses the title when there is only one display field, or there is only one display fieldand the request contains one or more of the features that add internal matrix columns tothe report. This value is the default.
ON
Always displays the title even if there is only one display field.
Sorting Columns
96

OFF
Suppresses the title when there is only one display field. Displays the title when there isonly one display field and the request contains one or more of the features that addinternal matrix columns to the report. This is legacy behavior.
Example: Hiding an ACROSS Title With ACRSVRBTITL
The following request against the GGSALES data source has a display field in the heading:
SET ACRSVRBTITL=HIDEONETABLE FILE GGSALESHEADING"Sales Report for <CATEGORY with ACRSVRBTITL=HIDEONE"" "SUM DOLLARS AS SalesBY CATEGORYACROSS REGIONWHERE CATEGORY EQ 'Food'ON TABLE SET PAGE NOPAGEON TABLE SET ACROSSTITLE SIDEON TABLE SET ACROSSLINE SKIP
ON TABLE SET STYLE *TYPE=REPORT, GRID=OFF, FONT='ARIAL', SIZE=9, SQUEEZE=ON,$TYPE=TITLE,JUSTIFY=LEFT,BACKCOLOR=RGB(102 102 102),COLOR=RGB(255 255 255),STYLE=BOLD,$TYPE=HEADING, SIZE=11, STYLE=BOLD,JUSTIFY=CENTER, $TYPE=ACROSSTITLE,STYLE=BOLD,$TYPE=ACROSSVALUE,BACKCOLOR=RGB(218 225 232),$END
Using the default value for ACRSVRBTITL, HIDEONE, suppresses the ACROSS title Sales, eventhough the heading displays a field value that adds a report column to the internal matrix.
The report output is shown in the following image:
If you change the SUM command to the following:
SUM DOLLARS/D12CM
3. Sorting Tabular Reports
Creating Reports With TIBCO® WebFOCUS Language 97

the field in the heading and the reformatted dollar sales values add report columns to theinternal matrix, but the ACROSS title Sales is still suppressed.
The report output is shown in the following image:
Using the ACRSVRBTITL value ON, without reformatting the dollar sales column, does notsuppress the ACROSS title Sales because the heading displays a field value that adds a reportcolumn to the internal matrix.
The report output is shown in the following image:
If you change the SUM command to the following:
SUM DOLLARS/D12CMC
the field in the heading and the reformatted dollar sales values add report columns to theinternal matrix, so the ACROSS title Sales is not suppressed.
The report output is shown in the following image:
Sorting Columns
98

With the setting ACRSVRBTITL=OFF, the field in the heading adds a report column to theinternal matrix, and the ACROSS title Sales is not suppressed.
The report output is shown in the following image:
If you change the SUM command to the following:
SUM DOLLARS/D12CM
the field in the heading and the reformatted dollar sales values add report columns to theinternal matrix, and the ACROSS title Sales is not suppressed.
The report output is shown in the following image:
Positioning ACROSS Titles on Report Output
In a report that uses the ACROSS sort phrase to sort values horizontally across the page, bydefault, two lines are generated on the report output for the ACROSS columns. The first linedisplays the name of the sort field (ACROSS title), and the second line displays the values forthat sort field (ACROSS value). The ACROSS field name is left justified above the first ACROSSvalue.
3. Sorting Tabular Reports
Creating Reports With TIBCO® WebFOCUS Language 99

If you want to display both the ACROSS title and the ACROSS values on one line in the PDF,HTML, EXL2K, or XLSX report output, you can issue the SET ACROSSTITLE = SIDE command.This command places ACROSS titles to the left of the ACROSS values. By default, the titles areright justified in the space above the BY field titles. You can change the justification of theACROSS title by adding the JUSTIFY attribute to the StyleSheet declaration for theACROSSTITLE component. If there are no BY fields, the heading line that is created by defaultto display the ACROSS title will not be generated.
This feature is designed for use in requests that have both ACROSS fields and BY fields. Forrequests with ACROSS fields but no BY fields, the set command is ignored, and the ACROSStitles are not moved.
Note that for certain output formats, you can control whether column titles are underlinedusing the SET TITLELINE command. SET ACROSSLINE is a synonym for SET TITLELINE. Forinformation, see Using Headings, Footings, Titles, and Labels on page 1519.
Syntax: How to Control the Position of ACROSS Field Names
SET ACROSSTITLE = {ABOVE|SIDE}
where:
ABOVE
Displays ACROSS titles above their ACROSS values. ABOVE is the default value.
SIDE
Displays ACROSS titles to the left of their ACROSS values, above the BY columns.
Reference: Usage Notes for SET ACROSSTITLE
When the ACROSS value wraps, the ACROSS title aligns with the top line of the wrappedACROSS values.
The ACROSS title spans the width of the BY columns. If the ACROSS title value is largerthan the width of the BY columns on the current page, the value is truncated. The firstpanel may have more BY fields than subsequent panels, if SET BYPANEL is set to a valuesmaller than the total number of BY fields.
This setting will not create a new column within the report for the title placement.
If the request does not have any BY fields, the ACROSS title is not moved.
With BYPANEL=OFF, the ACROSS title is not displayed on subsequent panels.
Sorting Columns
100

WRAP is not supported for ACROSSTITLE with SET ACROSSTITLE=SIDE.
Example: Placing the ACROSS Title on the Same Line as the ACROSS Values
The following example against the GGSALES data source has two ACROSS sort fields,CATEGORY and PRODUCT. SET ACROSSTITLE=SIDE moves the ACROSS title to the left of theACROSS values. With BYPANEL=ON the ACROSS titles are repeated in the same location oneach subsequent panel.
SET ACROSSTITLE=SIDESET BYPANEL=ONTABLE FILE GGSALESSUM DOLLARS/I8M AS ''BY REGIONBY STBY CITYACROSS CATEGORYACROSS PRODUCTWHERE PRODUCT NE 'Capuccino';ON TABLE SET PAGE-NUM ON ON TABLE NOTOTALON TABLE PCHOLD FORMAT PDFON TABLE SET HTMLCSS ONON TABLE SET STYLE * UNITS=IN, SQUEEZE=ON, ORIENTATION=PORTRAIT,$TYPE=REPORT, FONT='ARIAL', SIZE=10, BORDER=LIGHT,$TYPE=ACROSSVALUE, WRAP=ON,$ENDSTYLEEND
3. Sorting Tabular Reports
Creating Reports With TIBCO® WebFOCUS Language 101

The ACROSS title Category displays to the left of the ACROSS values Coffee, Food, and Gifts.The ACROSS title Product displays to the left of the ACROSS values Espresso, Latte, Biscotti,and so on. The ACROSS titles are right-justified above the space occupied by the BY fieldnames Region, State, and City. Notice that the ACROSS value Croissant wraps onto a secondline, and the ACROSS title is aligned with the top line. The following shows panel 1:
Sorting Columns
102

The following shows panel 2:
3. Sorting Tabular Reports
Creating Reports With TIBCO® WebFOCUS Language 103

Example: ACROSS Title Spacing
The following example against the GGSALES data source has two BY fields and two ACROSSfields. This example does not set borders on and does not enable wrapping of the ACROSSvalues. SET ACROSSTITLE=SIDE moves the ACROSS title to the left of the ACROSS values. TheSET BYPANEL=1 command repeats only the first BY field on the second panel. To prevent theACROSS titles from being truncated to fit above the BY field on the second panel, the first BYfield has an AS name that is longer than the default name:
SET ACROSSTITLE=SIDESET BYPANEL=1TABLE FILE GGSALESSUM DOLLARS/I8M AS ''BY ST AS 'State Code'BY CITYACROSS CATEGORY AS 'Categories'ACROSS PRODUCT AS 'Products'WHERE PRODUCT NE 'Capuccino';ON TABLE SET PAGE-NUM ON ON TABLE NOTOTALON TABLE PCHOLD FORMAT PDFON TABLE SET HTMLCSS ONON TABLE SET STYLE * UNITS=IN, SQUEEZE=ON, ORIENTATION=PORTRAIT,$TYPE=REPORT, FONT='ARIAL', SIZE=10, $ENDSTYLEEND
Sorting Columns
104

The first panel follows:
Because of the SET BYPANEL=1 command, the space available above the BY fields on thesecond panel is smaller than the space on the initial panel. The AS name State Code addsspace for the ACROSS titles, so the titles are not truncated on the second panel:
3. Sorting Tabular Reports
Creating Reports With TIBCO® WebFOCUS Language 105
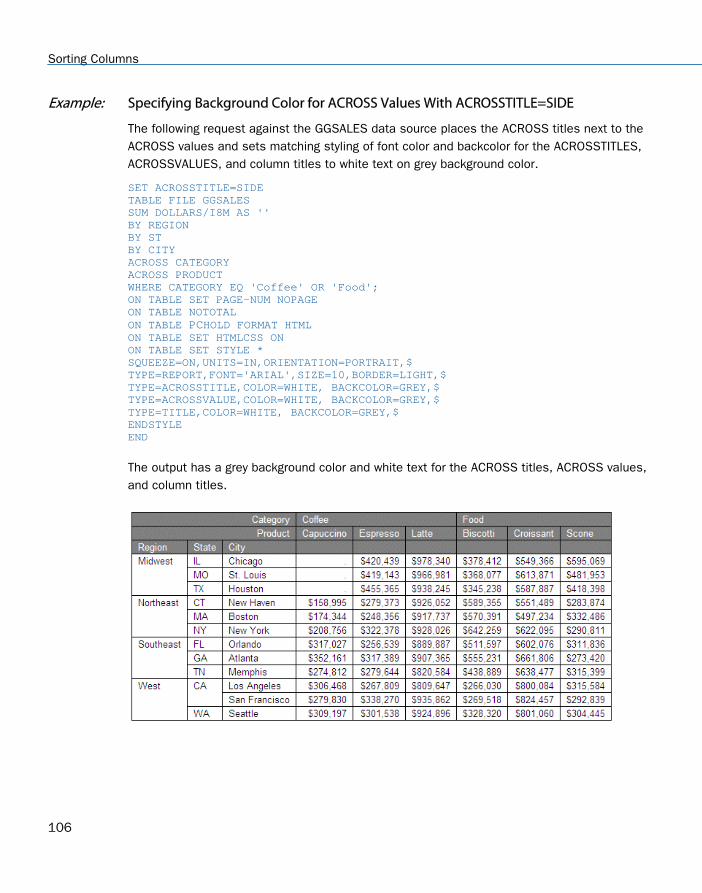
Example: Specifying Background Color for ACROSS Values With ACROSSTITLE=SIDE
The following request against the GGSALES data source places the ACROSS titles next to theACROSS values and sets matching styling of font color and backcolor for the ACROSSTITLES,ACROSSVALUES, and column titles to white text on grey background color.
SET ACROSSTITLE=SIDETABLE FILE GGSALESSUM DOLLARS/I8M AS ''BY REGIONBY STBY CITYACROSS CATEGORYACROSS PRODUCTWHERE CATEGORY EQ 'Coffee' OR 'Food';ON TABLE SET PAGE-NUM NOPAGEON TABLE NOTOTALON TABLE PCHOLD FORMAT HTMLON TABLE SET HTMLCSS ONON TABLE SET STYLE *SQUEEZE=ON,UNITS=IN,ORIENTATION=PORTRAIT,$TYPE=REPORT,FONT='ARIAL',SIZE=10,BORDER=LIGHT,$TYPE=ACROSSTITLE,COLOR=WHITE, BACKCOLOR=GREY,$TYPE=ACROSSVALUE,COLOR=WHITE, BACKCOLOR=GREY,$ TYPE=TITLE,COLOR=WHITE, BACKCOLOR=GREY,$ENDSTYLEEND
The output has a grey background color and white text for the ACROSS titles, ACROSS values,and column titles.
Sorting Columns
106

Using Multiple Horizontal (ACROSS) Sort Fields
You can sort a report using more than one sort field. When several sort fields are used, theACROSS phrase order determines the sorting order. The first ACROSS phrase sets the firstsort break, the second ACROSS phrase sets the second sort break, and so on. Eachsuccessive sort is nested within the previous one.
Example: Sorting With Multiple Horizontal (ACROSS) Phrases
The following request sorts the sum of current salaries, first by department and then by jobcode.
TABLE FILE EMPLOYEESUM CURR_SALACROSS DEPARTMENT ACROSS CURR_JOBCODEWHERE CURR_SAL GT 21500END
The output is:
DEPARTMENT MIS PRODUCTION CURR_JOBCODE A17 B04 A15 A17 ------------------------------------------------------------------------ $27,062.00 $21,780.00 $26,862.00 $29,700.00
Collapsing PRINT With ACROSS
The PRINT command generates a report that has a single line for each record retrieved fromthe data source after screening out those that fail IF or WHERE tests. When PRINT is used inconjunction with an ACROSS phrase, many of the generated columns may be empty. Thosecolumns display the missing data symbol.
To avoid printing such a sparse report, you can use the SET ACROSSPRT command tocompress the lines in the report. The number of lines is reduced within each sort group byswapping non-missing values from lower lines with missing values from higher lines, and theneliminating any lines whose columns all have missing values.
Because data may be moved to different report lines, row-based calculations such as ROW-TOTAL and ACROSS-TOTAL in a compressed report are different from those in a non-compressed report. Column calculations are not affected by compressing the report lines.
Syntax: How to Compress Report Lines
SET ACROSSPRT = {NORMAL|COMPRESS}
3. Sorting Tabular Reports
Creating Reports With TIBCO® WebFOCUS Language 107
ON TABLE SET ACROSSPRT{NORMAL|COMPRESS}
where:
NORMAL
Does not compress report lines. NORMAL is the default value.
COMPRESS
Compresses report lines by promoting data values up to replace missing values within asort group.
Reference: Usage Notes for SET ACROSSPRT
Compression applies only to ACROSS fields, including ACROSS … COLUMNS. It has noeffect on BY fields.
The only data values that are subject to compression are true missing values. If the valueof the stored data is either 0 or blank and the metadata indicates that MISSING is ON, thatvalue is not subject to compression.
Example: Compressing Report Output With SET ACROSSPRT
The following request against the GGSALES data source prints unit sales by product acrossregion:
TABLE FILE GGSALES PRINT UNITS/I5 BY PRODUCT ACROSS REGION WHERE DATE FROM '19971201' TO '19971231'; WHERE PRODUCT EQ 'Capuccino' OR 'Espresso'; ON TABLE SET ACROSSPRT NORMAL ON TABLE SET PAGE NOPAGEEND
Sorting Columns
108

Each line of the report represents one sale in one region, so at most one column in each rowhas a non-missing value when ACROSSPRT is set to NORMAL.
Region Midwest Northeast Southeast West Product Unit Sales Unit Sales Unit Sales Unit Sales -----------------------------------------------------------------Capuccino . 936 . . . 116 . . . 136 . . . . 1616 . . . 1118 . . . 774 . . . . 1696 . . . 1519 . . . 836 Espresso 1333 . . . 280 . . . 139 . . . . 1363 . . . 634 . . . 406 . . . . 1028 . . . 1014 . . . 885 . . . . 1782 . . . 1399 . . . 551
Setting ACROSSPRT to COMPRESS promotes non-missing values up to replace missing valueswithin the same BY group and then eliminates lines consisting of all missing values.
TABLE FILE GGSALES PRINT UNITS/I5 BY PRODUCT ACROSS REGION WHERE DATE FROM '19971201' TO '19971231'; WHERE PRODUCT EQ 'Capuccino' OR 'Espresso'; ON TABLE SET ACROSSPRT COMPRESS ON TABLE SET PAGE NOPAGE END
3. Sorting Tabular Reports
Creating Reports With TIBCO® WebFOCUS Language 109

The output is:
Region Midwest Northeast Southeast West Product Unit Sales Unit Sales Unit Sales Unit Sales----------------------------------------------------------------Capuccino . 936 1616 1696 . 116 1118 1519 . 136 774 836Espresso 1333 1363 1028 1782 280 634 1014 1399 139 406 885 551
Hiding Null Columns in ACROSS Groups
Report requests that use the ACROSS sort phrase generate a group of columns (one for eachdisplay field in the request) under each value of the ACROSS field. In many cases, some ofthese columns have only missing or null values. You can use the HIDENULLACRS parameter tohide the display of ACROSS groups containing only null columns in styled output formats. Ifthere is a BY field with a PAGE-BREAK option, columns are hidden on each page of outputgenerated by that PAGE-BREAK option. If the request contains no BY page breaks, ACROSSgroups that are missing for the entire report are hidden.
Hiding null ACROSS columns is supported for all styled output formats except for the EXL2KPIVOT and EXL2K FORMULA options.
Syntax: How to Hide Null ACROSS Columns
SET HIDENULLACRS = {ON|OFF}
ON TABLE SET HIDENULLACRS {ON|OFF}
where:
ON
Hides columns with missing data in ACROSS groups within a BY-generated page break.
OFF
Does not hide columns. OFF is the default value.
Reference: Usage Notes for Hiding Null Columns Within ACROSS Groups
Aligning items in headings with the associated data columns (HEADALIGN) is not supportedfor ACROSS reports.
Sorting Columns
110

Hiding ACROSS columns will not affect items placed in heading elements with spot markersor explicit positioning. This means that after ACROSS group columns are hidden, items mayalign with the ACROSS columns differently than expected.
Reference: Features Not Supported For Hiding Null ACROSS Columns
EXL2K FORMULA.
EXL2K PIVOT.
OVER.
HIDENULLACRS is only supported with page breaks specified in ON byfieldname PAGE-BREAK phrases or BY fieldname PAGE-BREAK phrases. It is not supported with:
BY field ROWS value OVER.
FML FOR fields (FOR fieldvalue OVER PAGE-BREAK).
Hiding ACROSS Groups and Columns Within BY Page Breaks
Hiding null columns is most useful when a BY sort field has the PAGE-BREAK option, either onthe BY phrase itself or in an ON phrase. The change in value of the BY field determines when apage break is generated for that BY field. The change in BY field value defines the limits withinwhich the ACROSS columns will be hidden, even if the BY field value spans multiple physicalpages.
There is no way to specify a particular BY field with this setting, so if the request has multipleBY fields with page breaks, the setting applies to all of them. If there are no BY fields withpage breaks, an ACROSS column must be missing for the entire report in order to be hidden.
The entire ACROSS group will be hidden either when the ACROSS value is missing or when allof the rows for all of the display columns under that ACROSS value contain null or missingvalues within the given BY field value.
The set of pages generated for a BY field value with a page break will be hidden if all ACROSSgroups within that BY field value are hidden.
When columns are removed from a page or a panel, the existing columns are resituated to fillthe missing space.
3. Sorting Tabular Reports
Creating Reports With TIBCO® WebFOCUS Language 111

Example: Hiding Null ACROSS Groups
The following request against the GGSALES data source has a page break on the BY fieldnamed REGION and an ACROSS phrase on the CITY field. The display fields in each ACROSSgroup are UNITS and DOLLARS:
SET HIDENULLACRS=OFFTABLE FILE GGSALESSUM UNITS DOLLARSBY REGION PAGE-BREAKBY STACROSS CITYWHERE CITY LE 'Memphis'ON TABLE SET HTMLCSS ONON TABLE PCHOLD FORMAT HTMLON TABLE SET STYLE *TYPE=REPORT, FONT=ARIAL, SIZE=9,$ENDSTYLEEND
With SET HIDENULLACRS=OFF, all columns display:
Sorting Columns
112

Running the request with SET HIDENULLACRS=ON eliminates the ACROSS groups for citieswith missing data within each region. For example, the Midwest region has no columns forAtlanta or Boston:
3. Sorting Tabular Reports
Creating Reports With TIBCO® WebFOCUS Language 113

Example: Hiding Columns Within ACROSS Groups
In the following request against the GGSALES data source, REGION is a BY field with a PAGE-BREAK, and PRODUCT is the ACROSS field. The DEFINE command creates a field namedSHOWDOLLARS that has missing values for the Espresso column within the ACROSS groupCoffee:
SET HIDENULLACRS=OFFSET BYPANEL=2DEFINE FILE GGSALESSHOWDOLLARS/I8M MISSING ON = IF (PRODUCT EQ 'Espresso') THEN MISSING ELSE DOLLARS;ENDTABLE FILE GGSALESHEADING"Page <TABPAGENO "SUM SHOWDOLLARS AS ''BY REGIONBY STBY CITYACROSS PRODUCTWHERE REGION EQ 'Midwest' OR 'Northeast'WHERE CATEGORY EQ 'Coffee';ON REGION PAGE-BREAKON TABLE SET PAGE-NUM ONON TABLE NOTOTALON TABLE SET HTMLCSS ONON TABLE PCHOLD FORMAT HTMLON TABLE SET STYLE * UNITS=IN, SQUEEZE=ON, ORIENTATION=PORTRAIT,$TYPE=REPORT, GRID=OFF, FONT='ARIAL', SIZE=9,$ENDSTYLEEND
Sorting Columns
114

Running the request with SET HIDENULLACRS=OFF displays the Espresso column and anyother column containing missing values within the Coffee group:
3. Sorting Tabular Reports
Creating Reports With TIBCO® WebFOCUS Language 115

Running the request with SET HIDENULLACRS=ON hides columns with missing data withineach region. On page 1 (Midwest), both the Capuccino and Espresso columns are hidden,while on page 2 (Northeast), only the Espresso column is hidden:
Sorting Columns
116

Example: Hiding Null Columns With Multiple ACROSS Fields
The following request against the GGSALES data source has two ACROSS fields, PRODUCT andCATEGORY. The BY field with the page break is REGION. The DEFINE command creates a fieldnamed SHOWDOLLARS that has missing values for the Espresso column within the ACROSSgroup Coffee and for the entire ACROSS group Gifts.
SET HIDENULLACRS=OFFDEFINE FILE GGSALESSHOWDOLLARS/I8M MISSING ON = IF (PRODUCT EQ 'Espresso' OR CATEGORY EQ 'Gifts') THEN MISSING ELSE DOLLARS;ENDTABLE FILE GGSALESSUM SHOWDOLLARS AS ''BY REGIONBY STBY CITYACROSS CATEGORYACROSS PRODUCTWHERE REGION EQ 'Midwest' OR 'Northeast'ON REGION PAGE-BREAKHEADING"Page <TABPAGENO /<TABLASTPAGE "ON TABLE SET PAGE-NUM OFFON TABLE SET BYPANEL ONON TABLE NOTOTALON TABLE PCHOLD FORMAT HTMLON TABLE SET HTMLCSS ONON TABLE SET STYLE * UNITS=IN, PAGESIZE='Letter', SQUEEZE=ON, ORIENTATION=PORTRAIT,$TYPE=REPORT, HEADPANEL=ON, GRID=OFF, FONT='ARIAL', SIZE=8,$ENDSTYLEEND
3. Sorting Tabular Reports
Creating Reports With TIBCO® WebFOCUS Language 117

Running the request with SET HIDENULLACRS=OFF displays all of the columns:
Sorting Columns
118

Running the request with SET HIDENULLACRS=ON hides the Espresso product and the entireGifts category within each region. On page 1 (Midwest), the Gifts group and the Espresso andCapuccino columns are hidden, while on page 2 (Northeast), the Gifts group and the Espressocolumn are hidden:
Generating Summary Lines and Hiding Null ACROSS Columns
If an entire ACROSS group is hidden, so are the totals generated for the associated BY fieldvalue. If any of the columns for the ACROSS value contain non-missing data, the ACROSSgroup will display with the non-missing columns.
Summary elements remain tied to their ACROSS group columns. If an ACROSS group ishidden, the associated summary value will be hidden, and subsequent values will realign withtheir ACROSS columns.
Summary lines generated at BY field breaks display at the end of the final page for that BYfield value. All ACROSS groups that contain any non-null data within the entire BY value (even ifthey were hidden on some pages within the BY value) will display on the summary lines so thatassociated summary values can be displayed.
3. Sorting Tabular Reports
Creating Reports With TIBCO® WebFOCUS Language 119

Grand totals can contain ACROSS columns that have been hidden on some pages within a BYfield value. Therefore, they are always placed on a new page and presented for all ACROSSgroups and columns that displayed on any page within the report, regardless of what washidden on other pages.
Summary lines defined for BY fields outside of the innermost BY page break may also containACROSS columns that have been hidden for some of the internal BY fields. For this reason,these summary lines will always present all available ACROSS columns and will be presentedon a new page.
All totals calculated in columns (ACROSSTOTAL, ROWTOTAL) will be hidden if all of the columntotals are missing.
Sorting Columns
120

Example: Generating Column Totals and Hiding Null ACROSS Columns
In the following request against the GGSALES data source, REGION is a BY field with a PAGE-BREAK, and PRODUCT is the ACROSS field. The DEFINE command creates a field namedSHOWDOLLARS that has missing values for the Espresso column within the ACROSS groupCoffee. Column totals are generated at the end of the report:
SET HIDENULLACRS=ONDEFINE FILE GGSALESSHOWDOLLARS/I8M MISSING ON = IF (PRODUCT EQ 'Espresso') THEN MISSING ELSE DOLLARS;ENDTABLE FILE GGSALESSUM SHOWDOLLARS AS ''BY REGIONBY STBY CITYACROSS PRODUCTON REGION PAGE-BREAKHEADING"Page <TABPAGENO /<TABLASTPAGE "WHERE CATEGORY EQ 'Coffee';ON TABLE SET PAGE-NUM OFFON TABLE SET BYPANEL ONON TABLE COLUMN-TOTAL AS 'TOTAL'ON TABLE PCHOLD FORMAT HTMLON TABLE SET HTMLCSS ONON TABLE SET STYLE * UNITS=IN, PAGESIZE='Letter', SQUEEZE=ON, ORIENTATION=PORTRAIT,$TYPE=REPORT, HEADPANEL=ON, GRID=OFF, FONT='ARIAL', SIZE=9,$ENDSTYLEEND
Running the request hides the null columns within each REGION page break and generates aseparate page for the column totals.
3. Sorting Tabular Reports
Creating Reports With TIBCO® WebFOCUS Language 121

The following shows pages one through three. On page 1, the Espresso and Capuccinocolumns are hidden. On pages 2 and 3, the Espresso column is hidden:
Sorting Columns
122

The following shows pages four and five. On page 4, the Espresso column is hidden. Page 5 isthe totals page. The Espresso column is hidden since it was hidden on every detail page.However, Capuccino is not hidden since it appeared on some pages:
Using Column Styling and Hiding Null ACROSS Columns
Column styling remains attached to the original column, regardless of whether the columnremains in the same place on the report output because of hiding null columns. In particular:
BORDERS and BACKCOLOR will readjust to fit the resulting panel or page layout after thecolumns are hidden.
Styling specified for a designated column will remain attached to the designated columnand be unaffected by the hidden columns. For example, if the third ACROSS column isdefined with conditional styling, and the second ACROSS column is hidden, the formattingwill remain on the column that was initially third, even though it becomes the secondcolumn on the output.
For information about styling columns, see Identifying a Report Component in a WebFOCUSStyleSheet on page 1251.
3. Sorting Tabular Reports
Creating Reports With TIBCO® WebFOCUS Language 123

Example: Using Column Styling and Hiding Null ACROSS Columns
In the following request against the GGSALES data source, REGION is a BY field with a PAGE-BREAK and PRODUCT is the ACROSS field. The DEFINE command creates a field namedSHOWDOLLARS that has missing values for the Capuccino column in the Midwest region, theThermos column in the Northeast region, the Scone column in the Southeast region, and theentire West region. Column totals, row totals, and a subtotal for each region are generated.
Some of the columns are assigned background colors:
Column C5 has BACKCOLOR=WHEAT. C5 is the fifth column counting display fields fromleft to right, but not counting BY fields or ROW-TOTAL fields. Column C5 corresponds to theCroissant column in the Coffee group.
Column P5 has BACKCOLOR=THISTLE. P5 is the fifth column counting display fields, BYfields, and ROW-TOTAL fields, but not NOPRINT fields. Column P5 corresponds to theEspresso column in the Coffee group.
Column N7 has BACKCOLOR=MEDIUM GOLDENROD. N7 is the seventh column countingdisplay fields, BY fields, ROW-TOTAL fields, and NOPRINT fields. Column N7 corresponds tothe Biscotti column in the Food group.
Column B3 has BACKCOLOR=GOLDENROD. B3 is the third BY field, counting all BY fields,even if not printed. Column B3 corresponds to the CITY sort field.
Column SHOWDOLLARS(6) has BACKCOLOR=SILVER. SHOWDOLLARS(6) is the sixthoccurrence of the SHOWDOLLARS field and corresponds to the Scone column in the Foodgroup.
The request follows:
Sorting Columns
124

SET HIDENULLACRS=OFFDEFINE FILE GGSALESSHOWDOLLARS/I8M MISSING ON =IF ((PRODUCT EQ 'Capuccino' AND REGION EQ 'Midwest') OR(PRODUCT EQ 'Coffee Grinder' AND REGION EQ 'Northeast') OR(PRODUCT EQ 'Scone' AND REGION EQ 'Southeast') OR(REGION EQ 'West')) THEN MISSING ELSE DOLLARS;ENDTABLE FILE GGSALESSUM SHOWDOLLARS AS ''BY REGIONBY STBY CITYACROSS CATEGORYACROSS PRODUCTON REGION SUBTOTAL AS '*TOTAL'ON REGION PAGE-BREAKHEADING" Page <TABPAGENO "HEADING" Capuccino Missing in Coffee Group "WHEN REGION EQ 'Midwest';HEADING" Coffee Grinder Missing in Gifts Group "WHEN REGION EQ 'Northeast';HEADING" Scone Missing in Food Group "WHEN REGION EQ 'Southeast';WHERE CATEGORY EQ 'Coffee' OR 'Food'ON TABLE SET PAGE-NUM OFFON TABLE SET BYPANEL ONON TABLE ROW-TOTAL AS 'TOTAL'ON TABLE COLUMN-TOTAL AS 'TOTAL'ON TABLE SET HTMLCSS ONON TABLE PCHOLD FORMAT HTMLON TABLE SET STYLE *UNITS=IN,PAGESIZE='Letter',SQUEEZE=ON,ORIENTATION=PORTRAIT,$TYPE=REPORT,HEADPANEL=ON,GRID=OFF,FONT='ARIAL',SIZE=6,$TYPE=HEADING, style=bold, size=8,$TYPE=DATA, COLUMN = C5, BACKCOLOR=WHEAT,$TYPE=DATA, COLUMN = P5, BACKCOLOR=THISTLE,$TYPE=DATA, COLUMN = N7, BACKCOLOR=MEDIUM GOLDENROD,$TYPE=DATA, COLUMN = B3, BACKCOLOR=GOLDENROD,$TYPE=DATA, COLUMN = SHOWDOLLARS(6), BACKCOLOR=silver,$ENDSTYLEEND
3. Sorting Tabular Reports
Creating Reports With TIBCO® WebFOCUS Language 125

Running the report with SET HIDENULLACRS=OFF shows all columns. A page is generated forthe West region and subtotals are calculated, even though all of the values are missing:
Sorting Columns
126

3. Sorting Tabular Reports
Creating Reports With TIBCO® WebFOCUS Language 127

Running the report with SET HIDENULLACRS=ON, shows:
On page 1, the Capuccino column is hidden and, therefore, the Espresso column is nolonger P5 on the report, but it still has BACKCOLOR=THISTLE. Similarly, the Biscotti columnhas MEDIUM, GOLDENROD, the Croissant column has WHEAT, and the Scone column hasSILVER.
The subtotals for each region are calculated only for columns that display for that region.
No page is generated for the West region since all of its values are missing.
Every column is represented on the page with the grand totals.
The output is:
Sorting Columns
128

Hiding Null ACROSS Columns in an FML Request
An FML request always has a FOR field that defines the order of specific rows. The FOR fieldcannot be used to trigger hiding of null ACROSS columns. However, the request can also havea BY field with a PAGE-BREAK option and this can be used to hide null ACROSS columns.
3. Sorting Tabular Reports
Creating Reports With TIBCO® WebFOCUS Language 129

Example: Hiding Null ACROSS Columns in an FML Request
The following FML request against the GGSALES data source has a BY field named REGIONwith the PAGE-BREAK option and an ACROSS field named QTR. The FOR field is PRODUCT. TheDEFINE command creates the QTR field and contains missing values for Q4 in the Midwestregion, Q2 in the Northeast region, and for all quarters in the Southeast region.
SET HIDENULLACRS=ONDEFINE FILE GGSALESQTR/Q=DATE;SHOWDOLLARS/D12CM MISSING ON = IF REGION EQ 'Midwest' AND QTR EQ 'Q4' THEN MISSING ELSE IF REGION EQ 'Northeast' AND QTR EQ 'Q2' THEN MISSING ELSE IF REGION EQ 'Southeast' THEN MISSING ELSE DOLLARS;ENDTABLE FILE GGSALESSUM SHOWDOLLARSBY REGIONACROSS QTRFOR PRODUCT'Biscotti' AS 'Biscotti' LABEL R1 OVER'Capuccino' AS 'Capuccino' LABEL R2 OVER'Latte' AS 'Latte' LABEL R3 OVER'Mug' AS 'Mug' LABEL R4 OVER'Coffee Pot' AS 'Coffee Pot' LABEL R5 OVERRECAP R6/D12.2=R1+R2+R3+R4+R5; AS ''ON REGION PAGE-BREAKON TABLE SET PAGE-NUM OFFON TABLE NOTOTALON TABLE PCHOLD FORMAT HTMLON TABLE SET HTMLCSS ON
ON TABLE SET STYLE * UNITS=IN, SQUEEZE=ON, ORIENTATION=PORTRAIT,$TYPE=REPORT, GRID=OFF, FONT='ARIAL', SIZE=9,$TYPE=TITLE, STYLE=BOLD,$TYPE=ACROSSTITLE, STYLE=BOLD,$ENDSTYLEEND
Sorting Columns
130

Running the request with SET HIDENULLACRS=OFF generates all columns and a page for allregions, including the Southeast regions where all values are missing:
3. Sorting Tabular Reports
Creating Reports With TIBCO® WebFOCUS Language 131

Sorting Columns
132

Running the request with SET HIDENULLACRS=ON hides column Q4 for the Midwest region, Q2for the Northeast region, and the entire page for the Southeast region:
3. Sorting Tabular Reports
Creating Reports With TIBCO® WebFOCUS Language 133
Controlling Display of Sort Field Values
By default, a sort field value displays only on the first row or column of the set of detail rows orcolumns generated for that sort field value. You can control this behavior using the BYDISPLAYparameter. BYDISPLAY is supported for all output formats and can control display of ACROSSvalues as well as BY values.
This feature enables you to avoid specifying the sort field twice, once as a display field andonce for sorting (with the NOPRINT option). For example:
PRINT FIRST_NAME LAST_NAMEBY FIRST_NAME NOPRINT
Syntax: How to Control Display of Sort Field Values
SET BYDISPLAY = {OFF|ON|BY|ACROSS|ALL}
ON TABLE SET BYDISPLAY {OFF|ON|BY|ACROSS|ALL}
where:
OFF
Displays a sort field value only on the first line or column of the report output for the sortgroup and on the first line or column of a page. OFF is the default value.
ON or BY
Displays the relevant BY field value on every line of report output produced. BY is asynonym for ON.
ACROSS
Displays the relevant ACROSS field value on every column of report output produced.
ALL
Displays the relevant BY field value on every line of report output and the relevant ACROSSfield value on every column of report output.
Controlling Display of Sort Field Values
134

Example: Controlling Display of Sort Field Values on Report Output
The following request generates a report on which sort field values only display when theychange (BYDISPLAY OFF).
-SET &BYDISP = OFF;SET BYDISPLAY = &BYDISPTABLE FILE WF_RETAIL_LITEHEADING CENTER" BYDISPLAY = &BYDISP"" "SUM QUANTITY_SOLD DAYSDELAYEDBY PRODUCT_CATEGORY BY PRODUCT_SUBCATEGACROSS BUSINESS_REGION ON TABLE SET PAGE NOLEADON TABLE SET STYLE *GRID=OFF,$ENDSTYLEEND
The output is shown in the following image.
3. Sorting Tabular Reports
Creating Reports With TIBCO® WebFOCUS Language 135
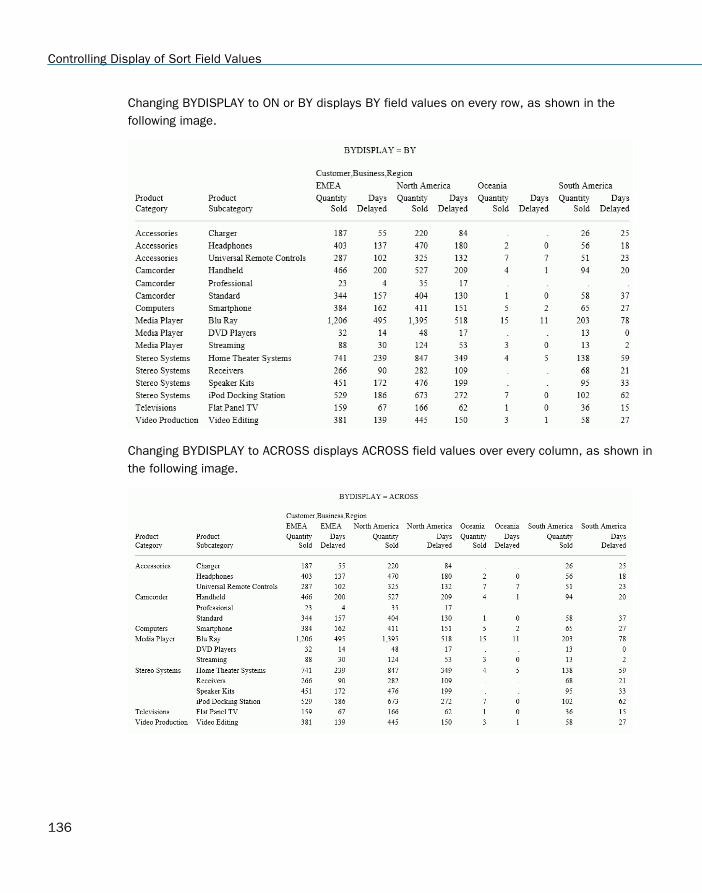
Changing BYDISPLAY to ON or BY displays BY field values on every row, as shown in thefollowing image.
Changing BYDISPLAY to ACROSS displays ACROSS field values over every column, as shown inthe following image.
Controlling Display of Sort Field Values
136

Changing BYDISPLAY to ALL displays BY field values on every row and ACROSS field valuesover every column, as shown in the following image.
Reformatting Sort Fields
When displaying a vertical (BY) sort column or horizontal (ACROSS) sort row on report output,you can reformat the sort field values by specifying the new format in the sort phrase. Thereformatting affects only the sort field value as displayed on the sort row or column. That is, ifthe field used as a sort field is referenced in a heading, subheading, footing, subfooting, orsummary line, it displays with its original format.
Syntax: How to Reformat a Sort Field
{BY [TOTAL]|ACROSS [TOTAL]} sortfield/fmt ...
where:
sortfield
Is the sort field.
fmt
Is the new display format.
Reference: Usage Notes for Reformatting Sort Fields
Reformatting is not supported in an ON phrase.
Reformatting is only applied to the row or column generated by the sort phrase, not tosubheading, subfooting, or summary rows that reference the sort field.
3. Sorting Tabular Reports
Creating Reports With TIBCO® WebFOCUS Language 137

Field-based reformatting (the format is stored in a field) is not supported for sort fields. Forinformation on field-based reformatting, see Field-Based Reformatting on page 1738.
BY field reformatting is propagated to HOLD files. ACROSS field reformatting is notpropagated to HOLD files.
The following features issue a warning, ignore the reformatting, and proceed with therequest:
IN-GROUPS/RANGES-OF
ROWS
COLUMNS
FOR field/reformat
All decisions are made based on an original field, therefore any option on a reformattedsort field should be placed on an original sort field break point. As a consequence,whenever the sort field value should appear (for example, in SUBTOTALS) an original fieldvalue displays.
Example: Reformatting Sort Fields
The following request against the GGSALES data source includes the following reformatted sortfields:
BY CATEGORY, with CATEGORY reformatted as A3.
BY PRODUCT, with PRODUCT reformatted as A4.
ACROSS REGION, with region reformatted as A6.
TABLE FILE GGSALESSUM UNITBY CATEGORY/A3BY PRODUCT/A4ACROSS REGION/A6ON CATEGORY SUBTOTALON CATEGORY SUBHEAD"CATEGORY IS <CATEGORY "" "ON TABLE SET PAGE NOPAGE END
Reformatting Sort Fields
138

On the output, the reformatting displays on the BY and ACROSS rows but is not propagated tothe subheading and subtotal rows:
REGION Midwes Northe Southe WestCATEGORY PRODUCT-----------------------------------------------------------------------CATEGORY IS Coffee
Cof Capu . 44785 73264 72831 Espr 101154 68127 68030 71675 Latt 231623 226243 211063 213920
*TOTAL CATEGORY Coffee 332777 339155 352357 358426
CATEGORY IS Food
Foo Bisc 90413 149793 119594 70569 Croi 139881 137394 156456 197022 Scon 116127 70732 73779 72776*TOTAL CATEGORY Food 346421 357919 349829 340367
CATEGORY IS Gifts
Gif Coff 54002 40977 50556 48081 Coff 47156 46185 49922 47432 Mug 86718 91497 88474 93881 Ther 46587 48870 48976 45648*TOTAL CATEGORY Gifts 234463 227529 237928 235042
TOTAL 913661 924603 940114 933835
Manipulating Display Field Values in a Sort Group
You can use the WITHIN phrase to manipulate a display field values as they are aggregatedwithin a sort group. This technique can be used with a prefix operator to perform calculationson a specific aggregate field rather than a report column. In contrast, the SUM and COUNTcommands aggregate an entire column.
The WITHIN phrase requires a BY phrase and/or an ACROSS phrase. A maximum of twoWITHIN phrases can be used per display field. If one WITHIN phrase is used, it must act on aBY phrase. If two WITHIN phrases are used, the first must act on a BY phrase and the secondon an ACROSS phrase.
3. Sorting Tabular Reports
Creating Reports With TIBCO® WebFOCUS Language 139
You can also use WITHIN TABLE, which allows you to return the original value within a requestcommand. The WITHIN TABLE command can also be used when an ACROSS phrase is neededwithout a BY phrase. Otherwise, a single WITHIN phrase requires a BY phrase.
Syntax: How to Use WITHIN to Manipulate Display Fields
{SUM|COUNT} display_field WITHIN by_sort_field [WITHIN across_sort_field] BY by_sort_field [ACROSS across_sort_field]
where:
display_field
Is the object of a SUM or COUNT display command.
by_sort_field
Is the object of a BY phrase.
across_sort_field
Is the object of an ACROSS phrase.
Example: Summing Values Within Sort Groups
The following report shows the units sold and the percent of units sold for each product withinstore and within the table:
TABLE FILE SALESSUM UNIT_SOLD AS 'UNITS'AND PCT.UNIT_SOLD AS 'PCT,SOLD,WITHIN,TABLE'AND PCT.UNIT_SOLD WITHIN STORE_CODE AS 'PCT,SOLD,WITHIN,STORE'BY STORE_CODE SKIP-LINE BY PROD_CODEEND
Manipulating Display Field Values in a Sort Group
140

The output is:
Creating a Matrix Report
You can create a matrix report by sorting both rows and columns. When you include both BYand ACROSS phrases in a report request, information is sorted vertically and horizontally,turning the report into a matrix of information that you read like a grid. A matrix report can havemultiple BY and ACROSS sort fields.
Example: Creating a Simple Matrix
The following request displays total salary outlay across departments and by job codes,creating a matrix report.
TABLE FILE EMPLOYEESUM CURR_SALACROSS DEPARTMENTBY CURR_JOBCODEEND
3. Sorting Tabular Reports
Creating Reports With TIBCO® WebFOCUS Language 141

The output is:
DEPARTMENT MIS PRODUCTION CURR_JOBCODE ------------------------------------------------A01 . $9,500.00 A07 $9,000.00 $11,000.00 A15 . $26,862.00 A17 $27,062.00 $29,700.00 B02 $18,480.00 $16,100.00 B03 $18,480.00 . B04 $21,780.00 $21,120.00 B14 $13,200.00 .
Example: Creating a Matrix With Several Sort Fields
The following request uses several BY and ACROSS sort fields to create a matrix report.
TABLE FILE EMPLOYEESUM CURR_SALACROSS DEPARTMENT ACROSS LAST_NAMEBY CURR_JOBCODE BY ED_HRSWHERE DEPARTMENT EQ 'MIS'WHERE CURR_SAL GT 21500END
The output is:
DEPARTMENT MIS LAST_NAME BLACKWOOD CROSS CURR_JOBCODE ED_HRS ------------------------------------------------------A17 45.00 . $27,062.00 B04 75.00 $21,780.00 .
Controlling Collation Sequence
Collation is defined as a set of rules that apply to the ordering and matching of all languageelements that involve comparison of two values. A wide variety of elements are affected by thisfeature. Among these features are sorting, aggregation, WHERE conditions, and StyleSheets.By default, items are sorted based on their binary values. The COLLATION settings SRV_CI andSRV_CS, case-insensitive and case-sensitive collation, implement collation based on theLANGUAGE setting. Case-insensitive collation means that all WHERE clauses and sorts ignorethe case of the elements being compared. COLLATION is a session level setting (it is notsupported in an ON TABLE phrase and should be set in the edasprof server profile).
The collation setting applies only to alphanumeric values.
Controlling Collation Sequence
142

Syntax: How to Establish Binary or Case-Insensitive Collation Sequence
Add the following command to the server edasprof.prf profile:
SET COLLATION = {BINARY|SRV_CI|SRV_CS|CODEPAGE}
where:
BINARY
Bases the collation sequence on binary values.
SRV_CI
Bases collation sequence on the LANGUAGE setting, and is case-insensitive.
SRV_CS
Bases collation sequence on the LANGUAGE setting, and is case-sensitive.
CODEPAGE
Bases collation sequence on the code page in effect, and is case-sensitive. CODEPAGE isthe default value.
In most cases, CODEPAGE is the same as BINARY. The only differences are for Danish,Finnish, German, Norwegian, and Swedish in an EBCDIC environment.
Reference: Usage Notes for SET COLLATION
SUFFIX=FIX or SUFFIX=FOCUS/XFOCUS HOLD files created in one mode may not be usableas targets for a JOIN in another mode if the join field is on alphanumeric data with mixed-cases.
FIXRETRIEVE is supported only for binary data, so setting COLLATION to anything other thanBINARY will turn FIXRETRIEVE OFF, which may affect join performance.
Rules for Sorting and Aggregation
Records with the same characters in the same order, but with variations in case, areconsidered to be identical. If multiple input records have these variations, the value used isfrom the first such record.
In a detail level report, the sort value is the same for each output record. That value will bethe one for the input record that had the lowest value (collated first).
3. Sorting Tabular Reports
Creating Reports With TIBCO® WebFOCUS Language 143
When the MIN (or the MAX) value for two or more alphanumeric display fields having a giveninstance of the sort field values is the same by case-insensitive collation, but the twovalues vary by case in some positions, the one retained is the last one in the input file(highest input record number) when SUMPREF=LST and the first (lowest record number)when SUMPREF=FST.
Example: Using Binary and Case-Insensitive Collation Sequence for Sorting
The following request creates a TIBCO FOCUS® data source named COLLATE that has somerecords with product names that differ only by the case of one letter:
CREATE FILE COLLATE -RUN MODIFY FILE COLLATE FIXFORM PROD_NUM/C4 PRODNAME/C30 QTY_IN_STOCK/C7 PRICE/C12 COST/C12CHECK OFF DATA 10042 Hd VCR LCD Menu 43068 179.00 129.00 10052 HD VCR LCD Menu 43068 179.00 129.00 1006Combo Player - 4 HD VCR + DVD 13527 399.00 289.00 1007Combo Player - 4 Hd VCR + DVD 13527 399.00 289.00 1008DVD Upgrade Unit for Cent. VCR 199 199.00 139.00 1010750SL Digital Camcorder 300 X 10758 999.00 750.00 1012650DL Digital Camcorder 150 X 2972 899.00 710.00 1014340SX Digital Camera 65K P 990 249.00 199.00 1015340SX digital Camera 65K P 990 249.00 199.001016330DX Digital Camera 1024K P 12707 279.00 199.001018250 8MM Camcorder 40 X 60073 399.00 320.001019250 8mm Camcorder 40 X 60073 399.00 320.001020150 8MM Camcorder 20 X 5961 319.00 240.001022120 VHS-C Camcorder 40 X 2300 399.00 259.001024110 VHS-C Camcorder 20 X 4000 349.00 249.001026AR2 35mm Camera 8 X 12444 129.00 95.001029AR2 35MM Camera 8 X 11499 109.00 79.001028AR3 35MM Camera 10 X 11499 109.00 79.001030QX Portable CD Player 22000 169.00 99.001032R5 Micro Digital Tape Recorder 1990 89.00 69.001034ZT Digital PDA - Commercial 21000 499.00 349.001036ZC Digital PDA - Standard 33000 299.00 249.00END
The following request prints the values of PRODNAME in the order in which they areencountered in the input stream:
TABLE FILE COLLATEPRINT PROD_NUM PRODNAMEEND
Controlling Collation Sequence
144

On the output, the rows with product numbers 1004 and 1005 differ only in the case of theletter d in HD. The record with the lowercase d is before the record with the uppercase D. Therows with record numbers 1006 and 1007 also differ only in the case of the letter d in HD. Inthis case, the record with the uppercase D is before the record with the lowercase d:
Product Product Number: Name: ------- ------- 1004 2 Hd VCR LCD Menu 1005 2 HD VCR LCD Menu 1006 Combo Player - 4 HD VCR + DVD 1007 Combo Player - 4 Hd VCR + DVD 1008 DVD Upgrade Unit for Cent. VCR1010 750SL Digital Camcorder 300 X 1012 650DL Digital Camcorder 150 X 1014 340SX Digital Camera 65K P 1015 340SX digital Camera 65K P 1016 330DX Digital Camera 1024K P 1018 250 8MM Camcorder 40 X 1019 250 8mm Camcorder 40 X 1020 150 8MM Camcorder 20 X 1022 120 VHS-C Camcorder 40 X 1024 110 VHS-C Camcorder 20 X 1026 AR2 35mm Camera 8 X 1029 AR2 35MM Camera 8 X 1028 AR3 35MM Camera 10 X 1030 QX Portable CD Player 1032 R5 Micro Digital Tape Recorder1034 ZT Digital PDA - Commercial 1036 ZC Digital PDA - Standard
The next request sorts the output in BINARY order. The setting COLLATION = BINARY is ineffect:
TABLE FILE COLLATE PRINT PROD_NUM BY PRODNAME END
3. Sorting Tabular Reports
Creating Reports With TIBCO® WebFOCUS Language 145

In an EBCDIC environment, the records with the lowercase letters sort in front of the recordswith the uppercase letters, so the row with product number 1007 sorts in front of the row withproduct number 1006:
Product ProductName: Number:------- -------AR2 35mm Camera 8 X 1026 AR2 35MM Camera 8 X 1029 AR3 35MM Camera 10 X 1028 Combo Player - 4 Hd VCR + DVD 1007 Combo Player - 4 HD VCR + DVD 1006 DVD Upgrade Unit for Cent. VCR 1008 QX Portable CD Player 1030 R5 Micro Digital Tape Recorder 1032 ZC Digital PDA - Standard 1036 ZT Digital PDA - Commercial 1034 110 VHS-C Camcorder 20 X 1024 120 VHS-C Camcorder 40 X 1022 150 8MM Camcorder 20 X 1020 2 Hd VCR LCD Menu 1004 2 HD VCR LCD Menu 1005 250 8mm Camcorder 40 X 1019 250 8MM Camcorder 40 X 1018 330DX Digital Camera 1024K P 1016 340SX digital Camera 65K P 1015 340SX Digital Camera 65K P 1014 650DL Digital Camcorder 150 X 1012 750SL Digital Camcorder 300 X 1010
Controlling Collation Sequence
146

In an ASCII environment, the records with the uppercase letters sort in front of the records withthe lowercase letters, so the row with product number 1005 sorts in front of the row withproduct number 1004:
Product Product Name: Number:------- ------- 110 VHS-C Camcorder 20 X 1024 120 VHS-C Camcorder 40 X 1022 150 8MM Camcorder 20 X 1020 2 HD VCR LCD Menu 1005 2 Hd VCR LCD Menu 1004 250 8MM Camcorder 40 X 1018 250 8mm Camcorder 40 X 1019 330DX Digital Camera 1024K P 1016 340SX Digital Camera 65K P 1014 340SX digital Camera 65K P 1015 650DL Digital Camcorder 150 X 1012 750SL Digital Camcorder 300 X 1010 AR2 35MM Camera 8 X 1029 AR2 35mm Camera 8 X 1026 AR3 35MM Camera 10 X 1028 Combo Player - 4 HD VCR + DVD 1006 Combo Player - 4 Hd VCR + DVD 1007 DVD Upgrade Unit for Cent. VCR 1008 QX Portable CD Player 1030 R5 Micro Digital Tape Recorder 1032 ZC Digital PDA - Standard 1036 ZT Digital PDA - Commercial 1034
With COLLATION set to SRV_CI and a sort on the PRODNAME field, the uppercase andlowercase letters have the same value, so the row displays only once for multiple recordnumbers. For example, the rows with product numbers 1004 and 1005 display with the samePRODNAME value and the sort field value for the display is the first one in the input stream.
3. Sorting Tabular Reports
Creating Reports With TIBCO® WebFOCUS Language 147

The following shows the output in an EBCDIC environment:
Product ProductName: Number:------- -------AR2 35mm Camera 8 X 1026 1029 AR3 35MM Camera 10 X 1028 Combo Player - 4 HD VCR + DVD 1006 1007 DVD Upgrade Unit for Cent. VCR 1008 QX Portable CD Player 1030 R5 Micro Digital Tape Recorder 1032 ZC Digital PDA - Standard 1036 ZT Digital PDA - Commercial 1034 110 VHS-C Camcorder 20 X 1024 120 VHS-C Camcorder 40 X 1022 150 8MM Camcorder 20 X 1020 2 Hd VCR LCD Menu 1004 1005 250 8MM Camcorder 40 X 1018 250 8MM Camcorder 40 X 1019330DX Digital Camera 1024K P 1016340SX Digital Camera 65K P 1014 1015650DL Digital Camcorder 150 X 1012750SL Digital Camcorder 300 X 1010
Controlling Collation Sequence
148

The following shows the output in an ASCII environment:
Product Product Name: Number: ------- ------- 110 VHS-C Camcorder 20 X 1024 120 VHS-C Camcorder 40 X 1022 150 8MM Camcorder 20 X 1020 2 Hd VCR LCD Menu 1004 1005 250 8MM Camcorder 40 X 1018 1019 330DX Digital Camera 1024K P 1016 340SX Digital Camera 65K P 1014 1015 650DL Digital Camcorder 150 X 1012 750SL Digital Camcorder 300 X 1010 AR2 35mm Camera 8 X 1026 1029 AR3 35MM Camera 10 X 1028 Combo Player - 4 HD VCR + DVD 1006 1007 DVD Upgrade Unit for Cent. VCR 1008 QX Portable CD Player 1030 R5 Micro Digital Tape Recorder 1032 ZC Digital PDA - Standard 1036 ZT Digital PDA - Commercial 1034
Example: Using Binary and Case-Insensitive Collation Sequence for Selection
The following request against the COLLATE data source selects records in which thePRODNAME contains the characters 'HD':
TABLE FILE COLLATE PRINT PROD_NUM PRODNAME WHERE PRODNAME CONTAINS 'HD'END
With COLLATION set to BINARY, only the records with an exact match (uppercase HD) areselected. The output is:
Product Product Number: Name: ------- ------- 1005 2 HD VCR LCD Menu 1006 Combo Player - 4 HD VCR + DVD
Running the same request but changing the COLLATION parameter to SRV_CI selects allrecords with any combination of uppercase and lowercase values for H and D. The rows aredisplayed in the order in which they appeared in the data source:
3. Sorting Tabular Reports
Creating Reports With TIBCO® WebFOCUS Language 149

Product Product Number: Name: ------- ------- 1004 2 Hd VCR LCD Menu 1005 2 HD VCR LCD Menu 1006 Combo Player - 4 HD VCR + DVD1007 Combo Player - 4 Hd VCR + DVD
Specifying the Sort Order
Sort field values are automatically displayed in ascending order, beginning with the lowestvalue and continuing to the highest. The default sorting sequence varies for operating systems.On z/OS it is a-z, A-Z, 0-9 for alphanumeric fields; 0-9 for numeric fields. On UNIX and Windowsit is 0-9, A-Z, a-z for alphanumeric fields; 0-9 for numeric fields.
You have the option of overriding this default and displaying values in descending order,ranging from the highest value to the lowest value, by including HIGHEST in the sort phrase.
Syntax: How to Specify the Sort Order
{BY|ACROSS} {LOWEST|HIGHEST} sortfield
where:
LOWEST
Sorts in ascending order, beginning with the lowest value and continuing to the highestvalue (a-z, A-Z, 0-9 for alphanumeric fields; 0-9 for numeric fields). This option is thedefault.
HIGHEST
Sorts in descending order, beginning with the highest value and continuing to the lowestvalue. You can also use TOP as a synonym for HIGHEST.
sortfield
Is the name of the sort field.
Example: Sorting in Ascending Order
The following report request does not specify a particular sorting order, and so, by default, itlists salaries ranging from the lowest to the highest.
TABLE FILE EMPLOYEEPRINT LAST_NAMEBY CURR_SALEND
Specifying the Sort Order
150

You can specify this same ascending order explicitly by including LOWEST in the sort phrase.
TABLE FILE EMPLOYEEPRINT LAST_NAMEBY LOWEST CURR_SALEND
The output is:
Example: Sorting in Descending Order
The following request lists salaries ranging from the highest to lowest.
TABLE FILE EMPLOYEEPRINT LAST_NAMEBY HIGHEST CURR_SALEND
3. Sorting Tabular Reports
Creating Reports With TIBCO® WebFOCUS Language 151

The output is:
Specifying Your Own Sort Order
Sort field values are automatically displayed in ascending order, beginning with the lowestvalue and continuing to the highest.
You can override the default order and display values in your own user-defined sortingsequence. To do this, you need to decide the following:
1. Which sort field values you want to allow. You can specify every sort field value, or a subsetof values. When you issue your report request, only records containing those values areincluded in the report.
2. The order in which you want the values to appear. You can specify any order. For example,you could specify that an A1 sort field containing a single-letter code be sorted in the orderA, Z, B, C, Y, and so on.
There are two ways to specify your own sorting order, depending on whether you are sortingrows with BY, or sorting columns with ACROSS:
The BY ROWS OVER phrase, for defining your own row sort sequence.
The ACROSS COLUMNS AND phrase, for defining your own column sort sequence.
Syntax: How to Define Your Own Sort Order
BY sortfield AS 'coltitle' ROWS value1 [AS 'text1'] OVER value2 [AS 'text2'][... OVER valuen [ AS 'textn']]END
Specifying the Sort Order
152

where:
sortfield
Is the last BY field in the report.
coltitle
Is the column title for the BY field on the report output.
value1
Is the sort field value that is first in the sorting sequence.
AS 'text1'
Enables you to assign alternate text for the first row, which replaces the field value in theoutput. Enclose the text in single quotation marks.
value2
Is the sort field value that is second in the sorting sequence.
AS 'text2'
Enables you to assign alternate text for the second row, which replaces the field value inthe output. Enclose the text in single quotation marks.
valuen
Is the sort field value that is last in the sorting sequence.
AS 'textn'
Enables you to assign alternate text for the last row, which replaces the field value in theoutput. Enclose the text in single quotation marks.
An alternative syntax is
FOR sortfieldvalue1 OVER value2 [... OVER valuen]
which uses the row-based reporting phrase FOR, described in Creating Financial Reports WithFinancial Modeling Language (FML) on page 1817.
Reference: Usage Notes for Defining Your Sort Order
Any sort field value that you do not specify in the BY ROWS OVER phrase is not included inthe sorting sequence, and does not appear in the report.
Sort field values that contain embedded blank spaces should be enclosed in singlequotation marks (').
3. Sorting Tabular Reports
Creating Reports With TIBCO® WebFOCUS Language 153

Any sort field value that you do specify in the BY ROWS OVER phrase is included in thereport, whether or not there is data.
If missing data is included in the report, it must be inserted at the lowest sort level.
The name of the sort field is not included in the report.
Each report request can contain only one BY ROWS OVER phrase. BY ROWS OVER is notsupported with the FOR phrase. For information about the FOR phrase, see CreatingFinancial Reports With Financial Modeling Language (FML) on page 1817.
Example: Defining Your Row Sort Order
The following illustrates how to sort employees by the banks at which their paychecks areautomatically deposited, and how to define your own label in the sorting sequence for the bankfield.
TABLE FILE EMPLOYEEPRINT LAST_NAMEBY BANK_NAME ROWS 'BEST BANK' OVER STATE OVER ASSOCIATED OVER 'BANK ASSOCIATION'END
The output is:
Syntax: How to Define Column Sort Sequence
ACROSS sortfield COLUMNS value1 AND value2 [... AND valuen]
where:
sortfield
Is the name of the sort field.
value1
Is the sort field value that is first in the sorting sequence.
Specifying the Sort Order
154

value2
Is the sort field value that is second in the sorting sequence.
valuen
Is the sort field value that is last in the sorting sequence.
Reference: ACROSS COLUMNS AND phrase
Any sort field value that you do not specify in the ACROSS COLUMNS AND phrase is notincluded in the label within the sorting sequence, and does not appear in the report.
Sort field values that contain embedded blank spaces should be enclosed in singlequotation marks.
Any sort field value that you do specify in the ACROSS COLUMNS AND phrase is included inthe report, whether or not there is data.
When using a COMPUTE with an ACROSS COLUMNS phrase, the COLUMNS should bespecified last:
ACROSS acrossfield [AND] COMPUTE compute_expression; COLUMNS values
Each report request may contain only one ACROSS COLUMNS AND phrase.
Example: Defining Column Sort Sequence
The following illustrates how to sum employee salaries by the bank at which they areautomatically deposited, and to define your own label within the sorting sequence for the bankfield.
TABLE FILE EMPLOYEESUM CURR_SALACROSS BANK_NAME COLUMNS 'BEST BANK' AND STATE AND ASSOCIATED AND 'BANK ASSOCIATION'END
The output is:
BANK_NAME BEST BANK STATE ASSOCIATED BANK ASSOCIATION------------------------------------------------------------------------- $29,700.00 $18,480.00 $64,742.00 $27,062.00
3. Sorting Tabular Reports
Creating Reports With TIBCO® WebFOCUS Language 155

Selecting and Assigning Column Titles to ACROSS Values
When you use the ACROSS COLUMNS phrase to select and order the columns that display onthe report output for an ACROSS sort field, you can assign each selected column a newcolumn title using an AS phrase.
Syntax: How to Assign Column Titles To ACROSS Values
ACROSS sortfield [AS title] COLUMNS aval1 [AS val1title] [{AND|OR} aval2 [AS val2title] [... {AND|OR} avaln [AS valntitle]]]
where:
sortfield
Is the ACROSS field name.
title
Is the title for the ACROSS field name.
AND|OR
Is required to separate the selected ACROSS values. AND and OR are synonyms for thispurpose.
aval1, aval2,... avaln
Are the selected ACROSS values to display on the report output.
val1title, val2title ...valntitle
Are the column titles for the selected ACROSS values.
Reference: Usage Notes for Assigning Column Titles to ACROSS Values
Any value you specify as an ACROSS value in the sort phrase will appear on the reportoutput, even if the value is screened out by an IF or WHERE test, or if the value does notexist at all in the data source.
Note: For styled output formats, SET HIDENULLACRS=ON removes empty columns inACROSS groups from the report output.
Column titles for ACROSS fields appear on a single line of the report output.
Support for AS names for ACROSS values is limited to the TABLE FILE command.
Specifying the Sort Order
156

When you create a HOLD file with SET ASNAMES = ON, the original field name ispropagated to the output Master File, not the AS name.
Example: Selecting and Assigning Column Titles to ACROSS Values
The following request against the GGSALES data source selects the columns Coffee Grinder,Latte, and Coffee Pot for the ACROSS field PRODUCT, and assigns each of them a new columntitle:
TABLE FILE GGSALES SUM DOLLARS/I8M AS '' BY REGION ACROSS PRODUCT AS 'Products' COLUMNS 'Coffee Grinder' AS 'Grinder' OR Latte AS 'caffellatte' AND 'Coffee Pot' AS 'Carafe'ON TABLE SET PAGE NOPAGEEND
The output is:
Products Grinder caffellatte CarafeRegion----------------------------------------------------------------Midwest $666,622 $2,883,566 $599,878Northeast $509,200 $2,808,855 $590,780Southeast $656,957 $2,637,562 $645,303West $603,436 $2,670,405 $613,624
Ranking Sort Field Values
When you sort report rows using the BY phrase, you can indicate the numeric rank of each row.Ranking sort field values is frequently combined with restricting sort field values by rank.
Note that it is possible for several report rows to have the same rank if they have identical sortfield values.
The default column title for RANKED BY is RANK. You can change the title using an AS phrase.The RANK field has format I7. Therefore, the RANK column in a report can be up to sevendigits. For more information, see Using Headings, Footings, Titles, and Labels on page 1519.
You can rank aggregated values using the syntax RANKED BY TOTAL. For details, see Sortingand Aggregating Report Columns on page 174.
3. Sorting Tabular Reports
Creating Reports With TIBCO® WebFOCUS Language 157

Syntax: How to Rank Sort Field Values
RANKED [AS 'name'] BY {HIGHEST|LOWEST} [n] sortfield [AS 'text']
where:
name
Is the new name for the RANK column title.
sortfield
Is the name of the sort field. The field can be numeric or alphanumeric.
n
Is the number of rank categories to display on the report output.
text
Is the column heading to use for the sort field column on the report output.
Example: Ranking Sort Field Values
Issue the following request to display a list of employee names in salary order, indicating therank of each employee by salary. Note that employees Jones and McCoy have the same ranksince their current salary is the same.
TABLE FILE EMPLOYEEPRINT LAST_NAMERANKED AS 'Sequence' BY CURR_SALEND
Ranking Sort Field Values
158

The output is:
Example: Ranking and Restricting Sort Field Values
Ranking sort field values is frequently combined with restricting sort field values by rank, as inthe following example.
TABLE FILE EMPLOYEEPRINT LAST_NAMERANKED BY HIGHEST 5 CURR_SALEND
The output is:
RANK CURR_SAL LAST_NAME---- -------- --------- 1 $29,700.00 BANNING 2 $27,062.00 CROSS 3 $26,862.00 IRVING 4 $21,780.00 BLACKWOOD 5 $21,120.00 ROMANS
DENSE and SPARSE Ranking
The WebFOCUS sort phrases RANK BY and BY {HIGHEST|LOWEST} n sort the report output andassign rank numbers to the sequence of data values. When assigning a rank to a data value,by default WebFOCUS does not skip rank numbers. This means that even when multiple datavalues are assigned the same rank, the rank number for the next group of values is the nextsequential integer. This method of assigning rank numbers is called dense.
3. Sorting Tabular Reports
Creating Reports With TIBCO® WebFOCUS Language 159

Some of the relational engines assign rank numbers using a method called sparse. Withsparse ranking, if multiple data values are assigned the same rank number, the next ranknumber will be the previous rank number plus the number of multiples.
You can use the WebFOCUS RANK parameter to control the type of ranking done byWebFOCUS. In addition, if you are accessing a relational data source, you can set the rankingmethod to the type of ranking done by your relational engine so that the rank calculation canbe optimized. Some relational engines have functions for both dense and sparse ranking. Inthis case, either setting can be optimized.
Reference: Optimizing Ranking
In order to pass rank processing to a relational engine your request must:
Use the SUM (or WRITE or ADD) command to aggregate values.
Specify the number of rank categories to be displayed. That is, you must specify a value forn:
[RANKED] BY [HIGHEST] n
Syntax: How to Control the Ranking Method
SET RANK={DENSE|SPARSE}
where:
DENSE
Specifies dense ranking. With this method, each rank number is the next sequentialinteger, even when the same rank is assigned to multiple data values. DENSE is thedefault value.
SPARSE
Specifies sparse ranking. With this method, if the same rank number is assigned tomultiple data values, the next rank number will be the previous rank number plus thenumber of multiples.
Then, in your request, use one of the following forms of the BY phrase:
RANKED BY {HIGHEST|LOWEST} [n] sortfield [AS 'text']
or
BY {HIGHEST|LOWEST} n sortfield [AS 'text']
Ranking Sort Field Values
160

where:
n
Is the highest rank number to display on the report output when the RANKED BY phrase isused. When RANKED is not used, it is the number of distinct sort field values to display onthe report output when SET RANK=DENSE, and the total number of lines of output for thesort field when SET RANK=SPARSE.
sortfield
Is the name of the sort field.
text
Is the column heading to be used for the sort field column on the report output.
Reference: Usage Notes for SET RANK
The RNK. prefix operator is not affected by the RANK parameter.
The rank numbers propagated to a HOLD file depend on the RANK parameter setting.
Example: Ranking Values in a TIBCO FOCUS Data Source
The following request against the EMPDATA data source ranks salaries in descending order bydivision. The RANK parameter is set to DENSE (the default).
SET RANK = DENSE TABLE FILE EMPDATA PRINT LASTNAME FIRSTNAME RANKED BY HIGHEST 12 SALARYBY DIV ON TABLE SET PAGE NOPAGE END
3. Sorting Tabular Reports
Creating Reports With TIBCO® WebFOCUS Language 161

On the output, six employees are included in rank number 6. With dense ranking, the next ranknumber is the next highest integer, 7.
RANK SALARY DIV LASTNAME FIRSTNAME---- ------ --- -------- --------- 1 $115,000.00 CE LASTRA KAREN 2 $83,000.00 CORP SANCHEZ EVELYN 3 $80,500.00 SE NOZAWA JIM 4 $79,000.00 CORP SOPENA BEN 5 $70,000.00 WE CASSANOVA LOIS 6 $62,500.00 CE ADAMS RUTH CORP CVEK MARCUS WANG JOHN NE WHITE VERONICA SE BELLA MICHAEL HIRSCHMAN ROSE 7 $58,800.00 WE GOTLIEB CHRIS 8 $55,500.00 CORP VALINO DANIEL NE PATEL DORINA 9 $54,100.00 CE ADDAMS PETER WE FERNSTEIN ERWIN 10 $52,000.00 NE LIEBER JEFF 11 $50,500.00 SE LEWIS CASSANDRA 12 $49,500.00 CE ROSENTHAL KATRINA SE WANG KATE
Running the same request with SET RANK=SPARSE produces the following output. Since rankcategory 6 includes six employees, the next rank number is 6 + 6.
RANK SALARY DIV LASTNAME FIRSTNAME---- ------ --- -------- --------- 1 $115,000.00 CE LASTRA KAREN 2 $83,000.00 CORP SANCHEZ EVELYN 3 $80,500.00 SE NOZAWA JIM 4 $79,000.00 CORP SOPENA BEN 5 $70,000.00 WE CASSANOVA LOIS 6 $62,500.00 CE ADAMS RUTH CORP CVEK MARCUS WANG JOHN NE WHITE VERONICA SE BELLA MICHAEL HIRSCHMAN ROSE 12 $58,800.00 WE GOTLIEB CHRIS
Ranking Sort Field Values
162

Example: Limiting the Number of Sort Field Values
The following request against the EMPDATA data source sorts salaries in descending order bydivision and prints the 12 highest salaries. The RANK parameter is set to DENSE (the default).
SET RANK = DENSETABLE FILE EMPDATAPRINT LASTNAME FIRSTNAMEBY HIGHEST 12 SALARYBY DIVON TABLE SET PAGE NOPAGEEND
On the output, 12 distinct salary values are displayed, even though some of the employeeshave the same salaries.
SALARY DIV LASTNAME FIRSTNAME ------ --- -------- ---------$115,000.00 CE LASTRA KAREN $83,000.00 CORP SANCHEZ EVELYN $80,500.00 SE NOZAWA JIM $79,000.00 CORP SOPENA BEN $70,000.00 WE CASSANOVA LOIS $62,500.00 CE ADAMS RUTH CORP CVEK MARCUS WANG JOHN NE WHITE VERONICA SE BELLA MICHAEL HIRSCHMAN ROSE $58,800.00 WE GOTLIEB CHRIS $55,500.00 CORP VALINO DANIEL NE PATEL DORINA $54,100.00 CE ADDAMS PETER WE FERNSTEIN ERWIN $52,000.00 NE LIEBER JEFF $50,500.00 SE LEWIS CASSANDRA $49,500.00 CE ROSENTHAL KATRINA SE WANG KATE
3. Sorting Tabular Reports
Creating Reports With TIBCO® WebFOCUS Language 163

Running the same request with SET RANK=SPARSE produces the following output. Since sixemployees have salary $62,500, that value is counted 6 times so that only 12 lines (sevendistinct salary values) display on the output.
SALARY DIV LASTNAME FIRSTNAME ------ --- -------- ---------$115,000.00 CE LASTRA KAREN $83,000.00 CORP SANCHEZ EVELYN $80,500.00 SE NOZAWA JIM $79,000.00 CORP SOPENA BEN $70,000.00 WE CASSANOVA LOIS $62,500.00 CE ADAMS RUTH CORP CVEK MARCUS WANG JOHN NE WHITE VERONICA SE BELLA MICHAEL HIRSCHMAN ROSE $58,800.00 WE GOTLIEB CHRIS
Grouping Numeric Data Into Ranges
When you sort a report using a numeric sort field, you can group the sort field values togetherand define the range of each group.
There are several ways of defining groups. You can define groups of:
Equal range using the IN-GROUPS-OF phrase.
Each report request can contain a total of five IN-GROUPS-OF phrases plus IN-RANGES-OFphrases. The IN-GROUPS-OF phrase can only be used once per BY field. The first sort fieldrange starts from the lowest value of a multiple of the IN-GROUPS-OF value, and the valuedisplayed is the start point of each range.
Equal range using the IN-RANGES-OF phrase.
Each report request can contain a total of five IN-GROUPS-OF phrases plus IN-RANGES-OFphrases. The IN-RANGES-OF phrase can only be used once per BY field, and it generates anadditional internal sort phrase that must be counted in the total number of sort phrases.The first sort field range starts from the lowest value of a multiple of the IN-GROUPS-OFvalue. No message is generated if you specify a range of zero, but the values displayed onthe report are unpredictable.
Unequal range using the FOR phrase.
Tiles. These include percentiles, quartiles, or deciles. For details, see Grouping NumericData Into Tiles on page 168.
Grouping Numeric Data Into Ranges
164

The FOR phrase is usually used to produce matrix reports and is part of the Financial ModelingLanguage (FML). However, you can also use it to create columnar reports that group sort fieldvalues in unequal ranges.
The FOR phrase displays the sort value for each individual row. The ranges do not have to becontiguous, that is, you can define your ranges with gaps between them. The FOR phrase isdescribed in more detail in Creating Financial Reports With Financial Modeling Language (FML)on page 1817.
Note: If there is not any data for a group, a row for the group still appears in the report.
Syntax: How to Define Groups of Equal Range
{BY|ACROSS} sortfield IN-GROUPS-OF value [TOP limit]
where:
sortfield
Is the name of the sort field. The sort field must be numeric: its format must be I (integer),F (floating-point number), D (decimal number), or P (packed number).
value
Is a positive integer that specifies the range by which sort field values are grouped.
limit
Is an optional number that defines the highest group label to be included in the report.
Example: Defining Groups of Equal Ranges
The following illustrates how to show which employees fall into which salary ranges, and todefine the ranges by $5,000 increments.
TABLE FILE EMPLOYEEPRINT LAST_NAMEBY CURR_SAL IN-GROUPS-OF 5000END
3. Sorting Tabular Reports
Creating Reports With TIBCO® WebFOCUS Language 165

The output is:
CURR_SAL LAST_NAME -------- --------- $5,000.00 SMITH GREENSPAN$10,000.00 STEVENS SMITH$15,000.00 JONES MCCOY MCKNIGHT$20,000.00 ROMANS BLACKWOOD$25,000.00 BANNING IRVING CROSS
Syntax: How to Define Equal Ranges
{BY|ACROSS} sortfield IN-RANGES-OF value [TOP limit]
where:
sortfield
Is the name of the sort field. The sort field must be numeric: its format must be I (Integer),F (floating-point), D (double-precision), or P (packed).
value
Is an integer greater than zero indicating the range by which sort field values are grouped.
limit
Is an optional number that defines the highest range label to be included in the report. Therange is extended to include all data values higher than this value.
Note: IN-RANGES-OF generates an internal sort phrase that must be counted in the totalnumber of sort phrases.
Example: Defining Equal Ranges
TABLE FILE EMPLOYEEPRINT LAST_NAMEBY CURR_SAL IN-RANGES-OF 5000END
Grouping Numeric Data Into Ranges
166

The output is:
Syntax: How to Define Custom Groups of Data Values
FOR sortfieldbegin1 TO end1 [OVER begin2 TO end2 ... ]
where:
sortfield
Is the name of the sort field.
begin
Is a value that identifies the beginning of a range.
end
Is a value that identifies the end of a range.
3. Sorting Tabular Reports
Creating Reports With TIBCO® WebFOCUS Language 167

Example: Defining Custom Groups of Data Values
The following request displays employee salaries, but it groups them in an arbitrary way. Noticethat the starting value of each range prints in the report.
TABLE FILE EMPLOYEEPRINT LAST_NAMEFOR CURR_SAL9000 TO 13500 OVER14000 TO 19700 OVER19800 TO 30000END
The output is:
Grouping Numeric Data Into Tiles
You can group numeric data into any number of tiles (percentiles, deciles, quartiles, etc.) intabular reports. For example, you can group student test scores into deciles to determinewhich students are in the top ten percent of the class, or determine which salesrepresentatives are in the top half of all sales representatives based on total sales.
Grouping is based on the values in the selected vertical (BY) field, and data is apportioned asequally as possible into the number of tile groups you specify.
The following occurs when you group data into tiles:
A new column, labeled TILE by default, is added to the report output and displays the tilenumber assigned to each instance of the tile field. You can change the column headingwith an AS phrase. For details on the AS phrase, see Using Headings, Footings, Titles, andLabels on page 1519.
Grouping Numeric Data Into Ranges
168
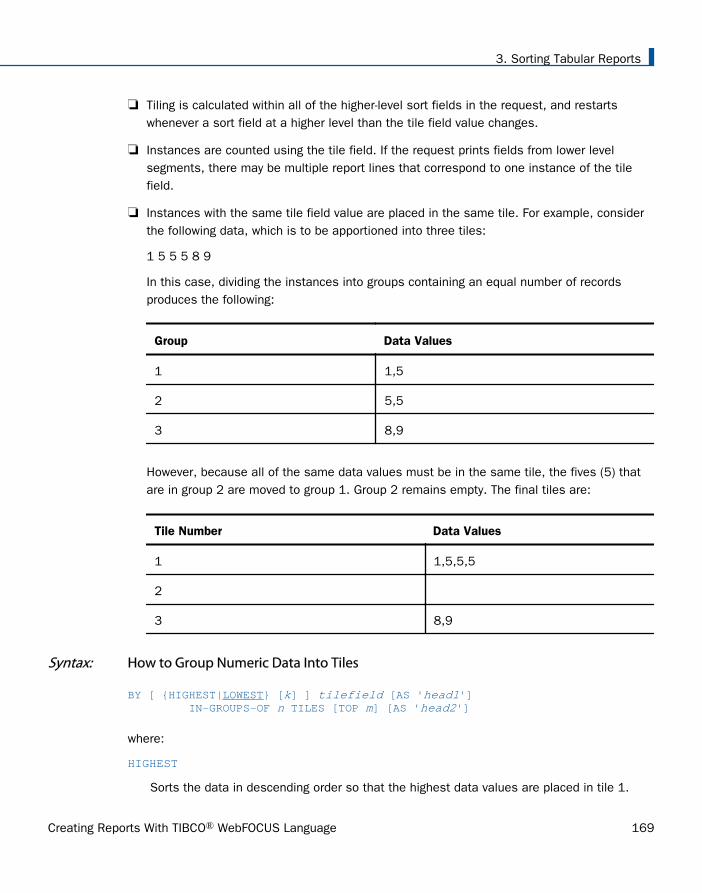
Tiling is calculated within all of the higher-level sort fields in the request, and restartswhenever a sort field at a higher level than the tile field value changes.
Instances are counted using the tile field. If the request prints fields from lower levelsegments, there may be multiple report lines that correspond to one instance of the tilefield.
Instances with the same tile field value are placed in the same tile. For example, considerthe following data, which is to be apportioned into three tiles:
1 5 5 5 8 9
In this case, dividing the instances into groups containing an equal number of recordsproduces the following:
Group Data Values
1 1,5
2 5,5
3 8,9
However, because all of the same data values must be in the same tile, the fives (5) thatare in group 2 are moved to group 1. Group 2 remains empty. The final tiles are:
Tile Number Data Values
1 1,5,5,5
2
3 8,9
Syntax: How to Group Numeric Data Into Tiles
BY [ {HIGHEST|LOWEST} [k] ] tilefield [AS 'head1'] IN-GROUPS-OF n TILES [TOP m] [AS 'head2']
where:
HIGHEST
Sorts the data in descending order so that the highest data values are placed in tile 1.
3. Sorting Tabular Reports
Creating Reports With TIBCO® WebFOCUS Language 169
LOWEST
Sorts the data in ascending order so that the lowest data values are placed in tile 1. Thisis the default sort order.
k
Is a positive integer representing the number of tile groups to display in the report. Forexample, BY HIGHEST 2 displays the two non-empty tiles with the highest data values.
tilefield
Is the field whose values are used to assign the tile numbers.
head1
Is a heading for the column that displays the values of the tile sort field.
n
Is a positive integer not greater than 32,767, specifying the number of tiles to be used ingrouping the data. For example, 100 tiles produces percentiles, while 10 tiles producesdeciles.
m
Is a positive integer indicating the highest tile value to display in the report. For example,TOP 3 does not display any data row that is assigned a tile number greater than 3.
head2
Is a new heading for the column that displays the tile numbers.
Note:
The syntax accepts numbers that are not integers for k, n, and m. On z/OS, values withdecimals are rounded to integers; on UNIX and Windows they are truncated. If the numberssupplied are negative or zero, an error message is generated.
Both k and m limit the number of rows displayed within each sort break in the report. If youspecify both, the more restrictive value controls the display. If k and m are both greaterthan n (the number of tiles), n is used.
Grouping Numeric Data Into Ranges
170

Example: Grouping Data Into Five Tiles
The following illustrates how to group data into five tiles.
TABLE FILE EMPLOYEEPRINT LAST_NAME FIRST_NAMEBY DEPARTMENTBY CURR_SAL IN-GROUPS-OF 5 TILESEND
The output is:
Note that the tiles are assigned within the higher-level sort field DEPARTMENT. The MIScategory does not have any data assigned to tile 3. The PRODUCTION category has all fivetiles.
Example: Displaying the First Three Tile Groups
In this example, the employees with the three lowest salaries are grouped into five tiles.
TABLE FILE EMPLOYEEPRINT LAST_NAME FIRST_NAMEBY DEPARTMENTBY LOWEST 3 CURR_SAL IN-GROUPS-OF 5 TILESEND
3. Sorting Tabular Reports
Creating Reports With TIBCO® WebFOCUS Language 171

The output is:
Note that the request displays three tile groups in each category. Because no data wasassigned to tile 3 in the MIS category, tiles 1, 2, and 4 display for that category.
Example: Displaying Tiles With a Value of Three or Less
In this example, the employees with the three lowest salaries are listed and grouped into fivetiles, but only the tiles that are in the top 3 (tiles 1, 2, or 3) are displayed in the report. Also,the heading for the TILES field has been renamed (using the AS phrase) to DECILES.
TABLE FILE EMPLOYEEPRINT LAST_NAME FIRST_NAMEBY DEPARTMENTBY LOWEST 3 CURR_SAL IN-GROUPS-OF 5 TILES TOP 3 AS DECILESEND
The output is:
Because no data was assigned to tile 3 in the MIS category, only tiles 1 and 2 display for thatcategory.
Grouping Numeric Data Into Ranges
172
Reference: Usage Notes for Tiles
If a request retrieves data from segments that are descendants of the segment containingthe tile field, multiple report rows may correspond to one instance of the tile field. Theseadditional report rows do not affect the number of instances used to assign the tile values.However, if you retrieve fields from multiple segments and create a single-segment outputfile, this flat file will have multiple instances of the tile field, and this increased number ofinstances may affect the tile values assigned. Therefore, when you run the same requestagainst the multi-level file and the single-segment file, different tile assignments mayresult.
Tiles are always calculated on a BY sort field in the request.
Only one tiles calculation is supported per request. However, the request can contain up tofive (the maximum allowed) non-tile IN-GROUP-OF phrases in addition to the TILES phrase.
Comparisons for the purpose of assigning tile numbers use exact data values regardless oftheir display format. Therefore, if you display a floating-point value as D7, you may not beshowing enough significant digits to indicate why values are placed in separate tiles.
The tile field can be a real field or a virtual field created with a DEFINE command or aDEFINE in the Master File. The COMPUTE command cannot be used to create a tile field.
Empty tiles do not display in the report output.
In requests with multiple sort fields, tiles are supported only at the lowest level and onlywith the BY LOWEST phrase.
Tiles are supported with output files. However, the field used to calculate the tilespropagates three fields to a HOLD file (the actual field value, the tile, and a ranking field)unless you set HOLDLIST to PRINTONLY.
Tiles are not supported with BY TOTAL, TABLEF, FML, and GRAPH.
Restricting Sort Field Values by Highest/Lowest Rank
When you sort report rows using the BY phrase, you can restrict the sort field values to a groupof high or low values. You choose the number of fields to include in the report. For example,you can choose to display only the 10 highest (or lowest) sort field values in your report byusing BY HIGHEST (or LOWEST).
You can have up to five sort fields with BY HIGHEST or BY LOWEST.
3. Sorting Tabular Reports
Creating Reports With TIBCO® WebFOCUS Language 173

Syntax: How to Restrict Sort Field Values by Highest/Lowest Rank
BY {HIGHEST n|LOWEST n} sortfield
where:
HIGHEST n
Specifies that only the highest n sort field values are included in the report. TOP is asynonym for HIGHEST.
LOWEST n
Specifies that only the lowest n sort field values are included in the report.
sortfield
Is the name of the sort field. The sort field can be numeric or alphanumeric.
Note: HIGHEST/LOWEST n refers to the number of sort field values, not the number of reportrows. If several records have the same sort field value that satisfies the HIGHEST/LOWEST ncriteria, all of them are included in the report.
Example: Restricting Sort Field Values to a Group
The following request displays the names of the employees earning the five highest salaries.
TABLE FILE EMPLOYEEPRINT LAST_NAMEBY HIGHEST 5 CURR_SALEND
The output is:
Sorting and Aggregating Report Columns
Using the BY TOTAL phrase, you can apply aggregation and sorting simultaneously to numericcolumns in your report in one pass of the data. For BY TOTAL to work correctly, you must havean aggregating display command such as SUM. A non-aggregating display command, such asPRINT, simply retrieves the data without aggregating it. Records are sorted in either ascendingor descending sequence, based on your query. Ascending order is the default.
Sorting and Aggregating Report Columns
174

You can also use the BY TOTAL phrase to sort based on temporary values calculated by theCOMPUTE command.
Note: On z/OS, the sort on the aggregated value is calculated using an external sort package,even if EXTSORT = OFF.
Syntax: How to Sort and Aggregate a Report Column
[RANKED] BY [HIGHEST|LOWEST [n] ] TOTAL {display_field|COMPUTE name/format=expression;}
or
[RANKED] BY TOTAL {[HIGHEST|LOWEST [n] ] display_field|COMPUTE name/format=expression;}
where:
RANKED
Adds a column to the report in which a rank number is assigned to each aggregated sortvalue in the report output. If multiple rows have the same ranking, the rank number onlyappears in the first row.
n
Is the number of sort field values you wish to display in the report. If n is omitted, allvalues of the calculated sort field are displayed. The default order is from lowest tohighest.
display_field
Can be a field name, a field name preceded by an operator (that is,prefixoperator.fieldname), or a calculated value.
A BY TOTAL field is treated as a display field when the internal matrix is created. After thematrix is created, the output lines are aggregated and re-sorted based on all of the sortfields.
Example: Sorting and Aggregating Report Columns
In this example, the salary average is calculated and used as a sort field. The two highestsalaries are displayed in the report.
TABLE FILE EMPLOYEESUM SALARY CNT.SALARYBY DEPARTMENTBY HIGHEST 2 TOTAL AVE.SALARY AS 'HIGHEST,AVERAGE,SALARIES'BY CURR_JOBCODEEND
3. Sorting Tabular Reports
Creating Reports With TIBCO® WebFOCUS Language 175
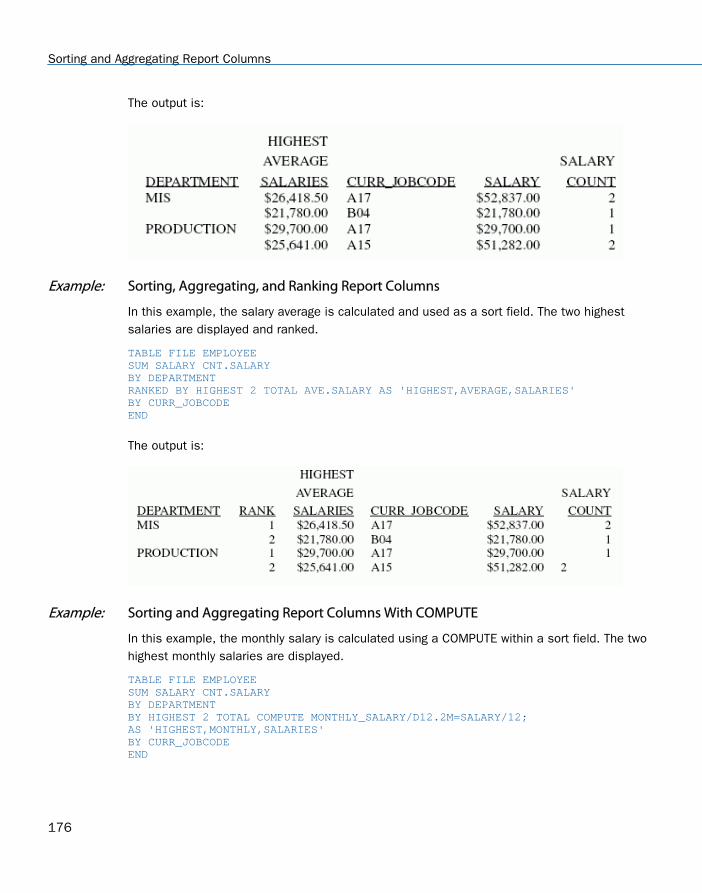
The output is:
Example: Sorting, Aggregating, and Ranking Report Columns
In this example, the salary average is calculated and used as a sort field. The two highestsalaries are displayed and ranked.
TABLE FILE EMPLOYEESUM SALARY CNT.SALARYBY DEPARTMENTRANKED BY HIGHEST 2 TOTAL AVE.SALARY AS 'HIGHEST,AVERAGE,SALARIES'BY CURR_JOBCODEEND
The output is:
Example: Sorting and Aggregating Report Columns With COMPUTE
In this example, the monthly salary is calculated using a COMPUTE within a sort field. The twohighest monthly salaries are displayed.
TABLE FILE EMPLOYEESUM SALARY CNT.SALARYBY DEPARTMENTBY HIGHEST 2 TOTAL COMPUTE MONTHLY_SALARY/D12.2M=SALARY/12;AS 'HIGHEST,MONTHLY,SALARIES'BY CURR_JOBCODEEND
Sorting and Aggregating Report Columns
176

The output is:
Example: Using BY TOTAL on a Calculated Value With an ACROSS Phrase
The following request creates the calculated value PROFIT and uses it in the BY TOTAL phrase.The request also has an ACROSS RATING phrase.
TABLE FILE MOVIESSUM LISTPR WHOLESALEPRCOMPUTE PROFIT = LISTPR - WHOLESALEPR; BY CATEGORYBY TOTAL PROFITACROSS RATINGWHERE RATING NE 'NR' OR 'R'ON TABLE SET PAGE NOLEADON TABLE SET STYLE *GRID = OFF,$ENDSTYLEEND
The output is shown in the following image.
Reference: Usage Notes for BY TOTAL
When you use BY HIGHEST/LOWEST n with BY TOTAL HIGHEST/LOWEST n, the BY TOTALphrase works on the result of the BY phrase (that is, on the n rows that result from the BYphrase).
3. Sorting Tabular Reports
Creating Reports With TIBCO® WebFOCUS Language 177

Hiding Sort Values
When you sort a report, you can omit the sort field value itself from the report by using thephrase NOPRINT. This can be helpful in several situations; for instance, when you use thesame field as a sort field and a display field, or when you want to sort by a field but not displayits values in the report output.
Syntax: How to Hide Sort Values
{BY|ACROSS} sortfield {NOPRINT|SUP-PRINT}
where:
sortfield
Is the name of the sort field.
You can use SUP-PRINT as a synonym for NOPRINT.
Example: Hiding Sort Values
If you want to display a list of employees sorted by the date on which they were hired, but youwant the report to contain last name, first name, and then the hire date in the third column,the following request is insufficient.
TABLE FILE EMPLOYEEPRINT LAST_NAME FIRST_NAME HIRE_DATEEND
The output is:
Hiding Sort Values
178
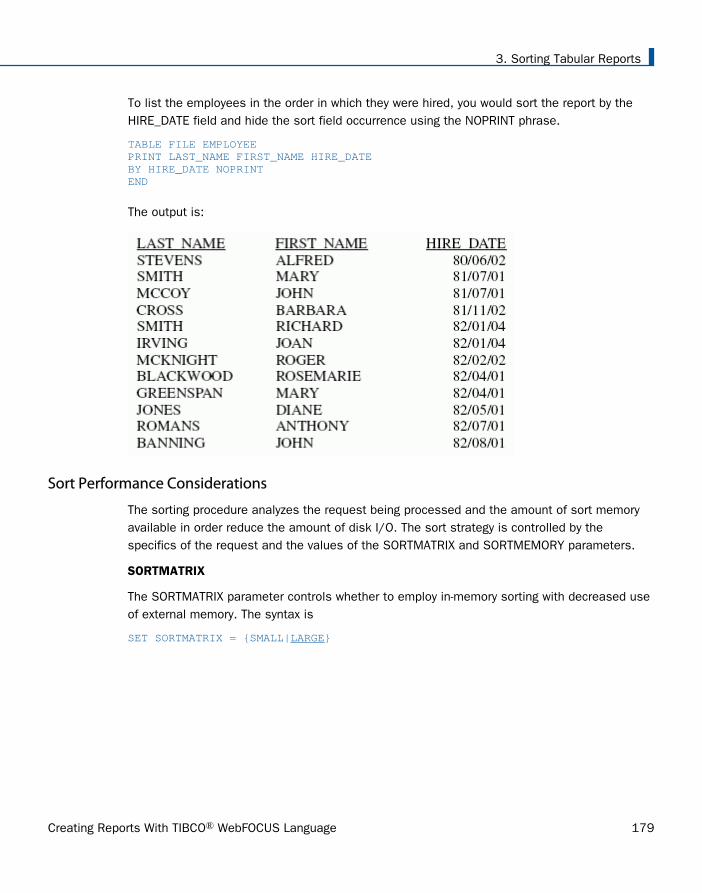
To list the employees in the order in which they were hired, you would sort the report by theHIRE_DATE field and hide the sort field occurrence using the NOPRINT phrase.
TABLE FILE EMPLOYEEPRINT LAST_NAME FIRST_NAME HIRE_DATEBY HIRE_DATE NOPRINTEND
The output is:
Sort Performance Considerations
The sorting procedure analyzes the request being processed and the amount of sort memoryavailable in order reduce the amount of disk I/O. The sort strategy is controlled by thespecifics of the request and the values of the SORTMATRIX and SORTMEMORY parameters.
SORTMATRIX
The SORTMATRIX parameter controls whether to employ in-memory sorting with decreased useof external memory. The syntax is
SET SORTMATRIX = {SMALL|LARGE}
3. Sorting Tabular Reports
Creating Reports With TIBCO® WebFOCUS Language 179

where:
SMALL
Creates a single sort matrix of up to 2048 rows, and uses a binary search based insertionsort with aggregation during retrieval. The maximum number of rows in this matrix hasbeen determined to provide the best performance for this type of sort. If the sort matrixbecomes full, it is written to a file called FOCSORT on disk, the in-memory matrix isemptied, and retrieval continues, writing to FOCSORT as many times as necessary. Whenthe end of data is detected, the remaining rows are written to FOCSORT and the mergeroutine merges all of the sort strings in FOCSORT (which, in extreme cases, may requiremultiple merge phases), while also completing the aggregation.
LARGE
Creates a large matrix or multiple small matrices in memory, when adequate memory isavailable as determined by the SORTMEMORY parameter. LARGE is the default value. Thegoal of this strategy is to do as much sorting as possible in internal memory before writingany records to disk. Whether disk I/O is necessary at all in the sorting process depends onthe amount of memory allocated for sorting and the size of the request output. If theamount of SORTMEMORY is not large enough to meaningfully make use of the LARGEstrategy, the sort will default to the SMALL strategy. The LARGE strategy greatly reducesthe need for disk I/O and, if disk I/O is required after all (for very large output), it virtuallyeliminates the need for multiple merge phases.
SORTMEMORY
The SORTMEMORY parameter controls the amount of internal memory available for sorting.The syntax is
SET SORTMEMORY = {n|512}
where:
nIs the positive number of megabytes of memory available for sorting. The default value is512.
Sort Performance Considerations
180

Sorting With Multiple Display Commands
A request can consist of up to 64 sets of separate display commands (also known as verbphrases), each with its own sort conditions. In order to display all of the information, ameaningful relationship has to exist among the separate sort condition sets. The followingrules apply:
Up to 64 display commands and their associated sort conditions can be used. The firstdisplay command does not have to have any sort condition. Only the last display commandmay be a detail command, such as PRINT or LIST. Other preceding display commands mustbe aggregating commands.
WHERE and IF criteria apply to the records selected for the report as a whole. WHERE andIF criteria are explained in Selecting Records for Your Report on page 217.
When a sort phrase is used with a display command, the display commands following itmust use the same sorting condition in the same order. For example:
TABLE FILE EMPLOYEESUM ED_HRSSUM CURR_SAL CNT.CURR_SAL BY DEPARTMENTPRINT FIRST_NAME BY DEPARTMENT BY LAST_NAMEEND
The first SUM does not have a sort condition. The second SUM has a sort condition: BYDEPARTMENT. Because of this sort condition, the PRINT command must have BYDEPARTMENT as the first sort condition, and other sort conditions may be added asneeded.
Example: Using Multiple Display and Sort Fields
The following request summarizes several levels of detail in the data source.
TABLE FILE EMPLOYEESUM CURR_SALSUM CURR_SAL BY DEPARTMENTSUM CURR_SAL BY DEPARTMENT BY LAST_NAMEEND
The command SUM CURR_SAL calculates the total amount of current salaries; SUMCURR_SAL BY DEPARTMENT calculates the total amounts of current salaries in eachdepartment; SUM CURR_SAL BY DEPARTMENT BY LAST_NAME calculates the total amounts ofcurrent salaries for each employee name.
3. Sorting Tabular Reports
Creating Reports With TIBCO® WebFOCUS Language 181

The output is:
Controlling Formatting of Reports With Multiple Display Commands
You can use the SET DUPLICATECOL command to reformat report requests that use multipledisplay commands, placing aggregated fields in the same column above the displayed field.
By default, each new display command in a request generates additional sort field and displayfield columns. With DUPLICATECOL set to OFF, each field occupies only one column in therequest, with the values from each display command stacked under the values for the previousdisplay command.
Syntax: How to Control the Format of Reports With Multiple Display Commands
SET DUPLICATECOL={ON|OFF}
where:
ON
Displays the report with each field as a column. This is the default value.
OFF
Displays the report with common fields as a row.
Example: Displaying Reports With Multiple Display Commands
The following request sums current salaries and education hours for the entire EMPLOYEE datasource and for each department:
TABLE FILE EMPLOYEESUM CURR_SAL ED_HRS SUM CURR_SAL ED_HRS BY DEPARTMENT END
Sorting With Multiple Display Commands
182
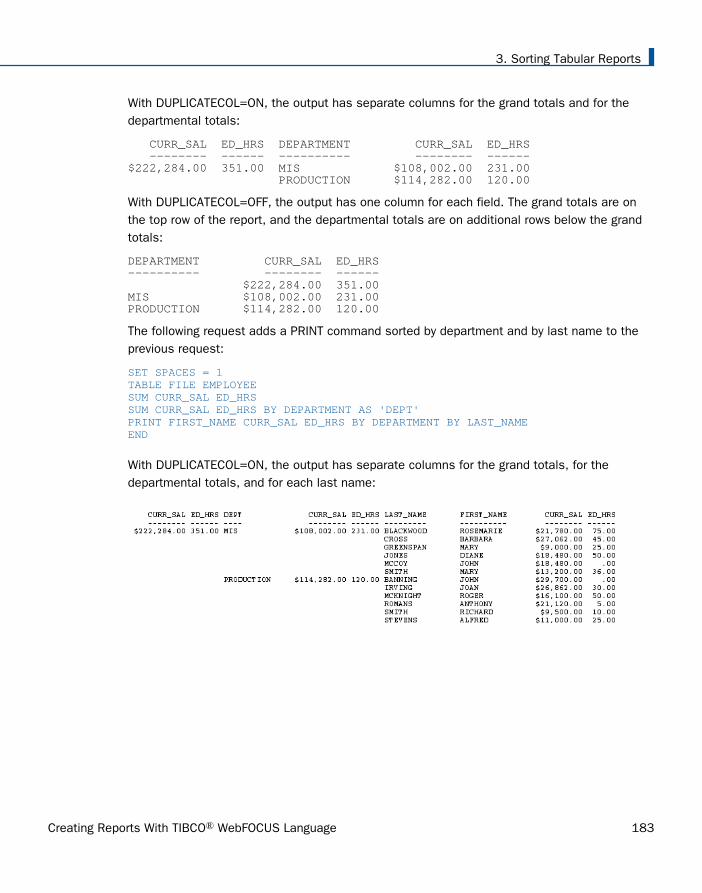
With DUPLICATECOL=ON, the output has separate columns for the grand totals and for thedepartmental totals:
CURR_SAL ED_HRS DEPARTMENT CURR_SAL ED_HRS -------- ------ ---------- -------- ------$222,284.00 351.00 MIS $108,002.00 231.00 PRODUCTION $114,282.00 120.00
With DUPLICATECOL=OFF, the output has one column for each field. The grand totals are onthe top row of the report, and the departmental totals are on additional rows below the grandtotals:
DEPARTMENT CURR_SAL ED_HRS ---------- -------- ------ $222,284.00 351.00 MIS $108,002.00 231.00 PRODUCTION $114,282.00 120.00
The following request adds a PRINT command sorted by department and by last name to theprevious request:
SET SPACES = 1TABLE FILE EMPLOYEE SUM CURR_SAL ED_HRS SUM CURR_SAL ED_HRS BY DEPARTMENT AS 'DEPT' PRINT FIRST_NAME CURR_SAL ED_HRS BY DEPARTMENT BY LAST_NAMEEND
With DUPLICATECOL=ON, the output has separate columns for the grand totals, for thedepartmental totals, and for each last name:
3. Sorting Tabular Reports
Creating Reports With TIBCO® WebFOCUS Language 183

With DUPLICATECOL=OFF, the output has one column for each field. The grand totals are onthe top row of the report, the departmental totals are on additional rows below the grandtotals, and the values for each last name are on additional rows below their departmentaltotals:
DEPT LAST_NAME FIRST_NAME CURR_SAL ED_HRS---- --------- ---------- -------- ------ $222,284.00 351.00MIS $108,002.00 231.00 BLACKWOOD ROSEMARIE $21,780.00 75.00 CROSS BARBARA $27,062.00 45.00 GREENSPAN MARY $9,000.00 25.00 JONES DIANE $18,480.00 50.00 MCCOY JOHN $18,480.00 .00 SMITH MARY $13,200.00 36.00PRODUCTION $114,282.00 120.00 BANNING JOHN $29,700.00 .00 IRVING JOAN $26,862.00 30.00 MCKNIGHT ROGER $16,100.00 50.00 ROMANS ANTHONY $21,120.00 5.00 SMITH RICHARD $9,500.00 10.00 STEVENS ALFRED $11,000.00 25.00
Syntax: How to Style a Report With SET DUPLICATECOL=ON
In a StyleSheet, you can identify the rows you want to style by specifying which displaycommand created those rows:
VERBSET = n
where:
n
Is the ordinal number of the display command in the report request.
Example: Styling Rows Associated With a Specific Display Command
The following request has two display commands:
1. SUM CURR_SAL ED_HRS BY DEPARTMENT (totals by department).
2. PRINT FIRST_NAME CURR_SAL ED_HRS BY DEPARTMENT BY LAST_NAME (values byemployee by department).
Sorting With Multiple Display Commands
184
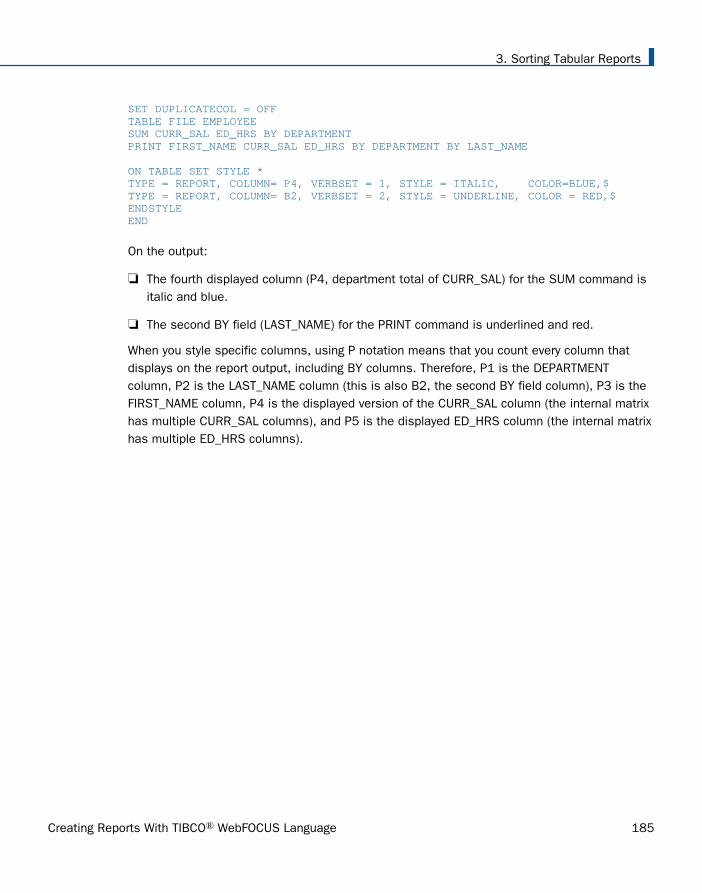
SET DUPLICATECOL = OFFTABLE FILE EMPLOYEESUM CURR_SAL ED_HRS BY DEPARTMENTPRINT FIRST_NAME CURR_SAL ED_HRS BY DEPARTMENT BY LAST_NAME
ON TABLE SET STYLE *TYPE = REPORT, COLUMN= P4, VERBSET = 1, STYLE = ITALIC, COLOR=BLUE,$TYPE = REPORT, COLUMN= B2, VERBSET = 2, STYLE = UNDERLINE, COLOR = RED,$ENDSTYLEEND
On the output:
The fourth displayed column (P4, department total of CURR_SAL) for the SUM command isitalic and blue.
The second BY field (LAST_NAME) for the PRINT command is underlined and red.
When you style specific columns, using P notation means that you count every column thatdisplays on the report output, including BY columns. Therefore, P1 is the DEPARTMENTcolumn, P2 is the LAST_NAME column (this is also B2, the second BY field column), P3 is theFIRST_NAME column, P4 is the displayed version of the CURR_SAL column (the internal matrixhas multiple CURR_SAL columns), and P5 is the displayed ED_HRS column (the internal matrixhas multiple ED_HRS columns).
3. Sorting Tabular Reports
Creating Reports With TIBCO® WebFOCUS Language 185
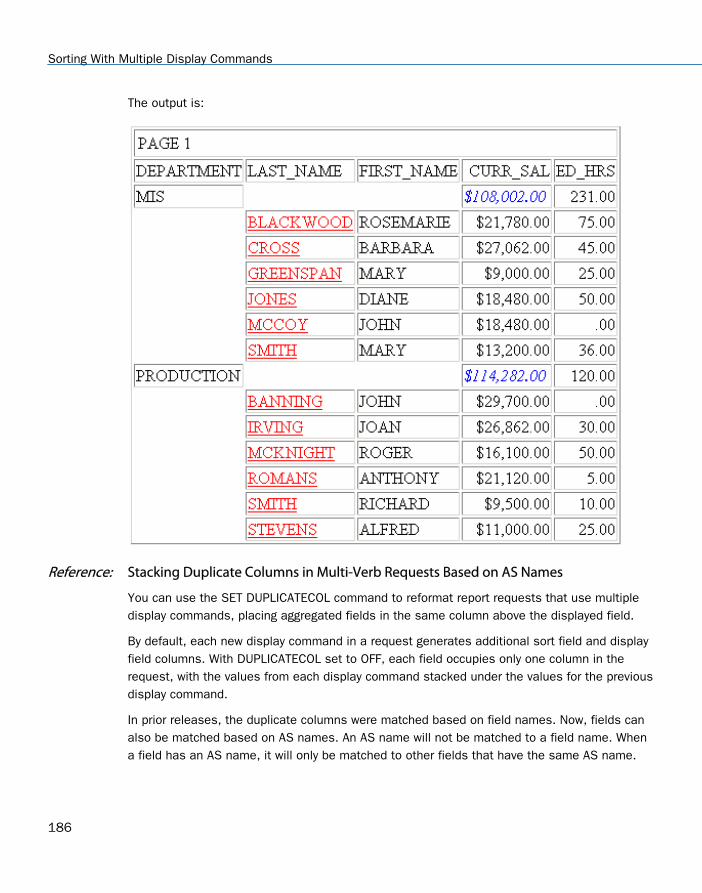
The output is:
Reference: Stacking Duplicate Columns in Multi-Verb Requests Based on AS Names
You can use the SET DUPLICATECOL command to reformat report requests that use multipledisplay commands, placing aggregated fields in the same column above the displayed field.
By default, each new display command in a request generates additional sort field and displayfield columns. With DUPLICATECOL set to OFF, each field occupies only one column in therequest, with the values from each display command stacked under the values for the previousdisplay command.
In prior releases, the duplicate columns were matched based on field names. Now, fields canalso be matched based on AS names. An AS name will not be matched to a field name. Whena field has an AS name, it will only be matched to other fields that have the same AS name.
Sorting With Multiple Display Commands
186

Example: Stacking Duplicate Columns in Multi-Verb Requests Based on AS Names
The following request has three display commands. The first sums the CURR_SAL field. Thesecond sums the SALARY field by department. The third prints the GROSS field by departmentand last name. Each field is assigned the same AS name, even the CURR_SAL field.
TABLE FILE EMPLOYEESUM CURR_SAL AS CURR_SAL ED_HRSSUM SALARY AS CURR_SAL ED_HRS BY DEPARTMENT AS 'DEPT'PRINT FIRST_NAME GROSS AS CURR_SAL ED_HRS BY DEPARTMENT BY LAST_NAMEON TABLE SET DUPLICATECOL OFFON TABLE SET PAGE NOLEADON TABLE SET STYLE *GRID=OFF, SIZE=10, $VERBSET=1, COLOR=RED,$VERBSET=2, COLOR=BLUE,$VERBSET=3,COLOR=BLACK,$ENDSTYLEEND
3. Sorting Tabular Reports
Creating Reports With TIBCO® WebFOCUS Language 187

The partial output is shown in the following image.
Sorting With Multiple Display Commands
188

Improving Efficiency With External Sorts
When a report is generated, by default it is sorted using an internal sorting procedure. Thissorting procedure is optimized for reports of up to approximately 180 to 200K, although manyfactors affect the size of the data that can be handled by the internal sort.
The FOCSORT file used for the internal sort can grow to any size allowed by the operatingsystem running and the available disk space. The user does not have to break a request up toaccommodate massive files. In previous releases, the FOCSORT file was limited to 2 GB andthe user received a FOC298 message when the WebFOCUS limit was exceeded. With no limitenforced by WebFOCUS, the operating system provides whatever warning and error handling ithas for the management of a FOCSORT file that exceeds its limits.
You can generate larger reports somewhat faster by using dedicated sorting products, such asSyncSort, DFSORT, or, in non-Mainframe environments, the WebFOCUS external sort routines.
To use an external sort, the EXTSORT parameter must be ON. Use of a StyleSheet turns offexternal sorting.
Note that in Mainframe environments, external sorting is supported with the French, Spanish,German, and Scandinavian National Languages (Swedish, Danish, Finnish, and Norwegian). Tospecify the National Language Support Environment, use the LANG parameter as described inthe TIBCO WebFOCUS® Developing Reporting Applications manual.
Reference: Requirements for External Sorting
You can use the DFSORT and SyncSort external sort products with any TABLE, FML, GRAPH, orMATCH request in all WebFOCUS Mainframe environments. In other operating environments,WebFOCUS has its own external sort routines.
Reference: Usage Notes for External Sorting in Non-Mainframe Environments
It is probably best not to use external sort if:
Your request requires a matrix (cannot be converted to a TABLEF request). If your requestneeds a matrix and uses external sort, it will go through two sorts, both external andinternal, and it will be hard to realize any performance gains.
To tell if your report is convertible to TABLEF, use ? STAT (as described in How to Query theSort Type on page 190) or run an abbreviated version of the request with a low record limitand external sort on. If the report statistics are printed after the TABLE output, it wasperformed as TABLEF; if the statistics are printed before the first screen of TABLE output, itwent through TABLE processing because it was not convertible to TABLEF.
3. Sorting Tabular Reports
Creating Reports With TIBCO® WebFOCUS Language 189

Your input is sorted or almost sorted.
Your system cannot support a large number of work files (for information, see Sort WorkFiles and Return Codes on page 191). In this case the internal sort may do a better jobsince internally it implements about 60 logical work files, all sharing space in FOCSORT.
Procedure: How to Determine the Type of Sort Used
To determine which sort is used, the following criteria are evaluated, in this sequence:
1. BINS. If an entire report can be sorted within the work area (BINS), the external sort is notinvoked, even if EXTSORT is set ON.
2. EXTERNAL. If BINS is not large enough to sort the entire report and EXTSORT is set ON,the external sort utility will be invoked.
Syntax: How to Control External Sorting
You can turn the external sorting feature on and off using the SET EXTSORT command.
SET EXTSORT = {ON|OFF}
where:
ON
Enables the selective use of a dedicated external sorting product to sort reports. Thisvalue is the default in all Mainframe environments.
OFF
Uses the internal sorting procedure to sort all reports. This value is the default in all non-Mainframe environments.
Syntax: How to Query the Sort Type
To determine which sort is being used for a given report, issue the following command afterthe report request:
? STAT
The command displays the following values for the SORT USED parameter:
FOCUS
The internal sorting procedure was used to sort the entire report.
Improving Efficiency With External Sorts
190

SQL
You are using a relational data source and the RDBMS supplied data already in order.
EXTERNAL
An external sorting product sorted the report.
NONE
The report did not require sorting.
Providing an Estimate of Input Records or Report Size for Sorting
There are two advantages to providing an estimate for the input size (ESTRECORDS) or thereport size (ESTLINES):
If the request cannot be converted to a TABLEF request and the file size estimate showsthat the external sort will be needed, FOCUS® initiates the external sort immediately, whichmakes a FOCUS merge unnecessary. Without the estimate, such a request alwaysperforms this merge.
In Mainframe environments, FOCUS passes the file size to the external sort, which enablesit to allocate work files of the appropriate size.
Syntax: How to Provide an Estimate of Input Records or Report Size for Sorting
ON TABLE SET ESTRECORDS nON TABLE SET ESTLINES n
where:
n
Is the estimated number of records or lines to be sorted.
Sort Work Files and Return Codes
In non-Mainframe environments, external sorts use temporary work files to hold intermediatesorting results. For each type of external sort, you must be aware of how sort work files arecreated and used.
Reference: Sort Work Files on UNIX, Windows, and OpenVMS
While internal sorting uses only one work file, FOCSORT (allocated in the EDATEMP directory),external sort allows up to 31 work files, allocated on one or more disk drives (spindles) ordirectories.
3. Sorting Tabular Reports
Creating Reports With TIBCO® WebFOCUS Language 191

Warning: Any one or more of these work files may become very large. Count on using manytimes the total disk space required by FOCSORT.
By default, five work files are allocated in the /tmp directory on UNIX, or in the directorypointed to by the TMP environment variable in Windows. This may not be enough sort workspace and, even if the files fit in the directory, five files are probably not enough for optimalperformance. Also, having all of the sort work files on the same disk may further degradeperformance.
You have two other options:
Define the TMPDIR shell variable (UNIX) or TMP environment variable (Windows) to point tosome suitable writable directory. For best results, this directory should be on a disk with alot of available space, and not the same disk as the data source or the EDATEMP directory.Again, you will get five temporary work files allocated on the same spindle, with consequentperformance degradation.
Define 1 to 31 shell variables of the form IBITMPDIR01 ... IBITMPDIR31 to point to one ormore writable directories.
If the UNIX TMPDIR or Windows TMP variable is set, it must be "unset" in order to makeuse of the IBITMPDIRnn variables. The UNIX command for unsetting the TMPDIR variable is:
unset TMPDIR
The Windows command for unsetting the TMP variable is:
SET TMP=
Different variables may point to the same directory, if desired. If you wish to allocate n workfiles, you must define variables 01 through n. The first variable missing from theenvironment determines the number of work files that will be used. (If you define fewer thanfive, additional files will be allocated using the system default location to make up thedifference.) The more work files you allocate, and the more separated they are acrossdifferent spindles, the better performance you should achieve. The major constraint is thetotal disk space available.
The work file names are generated by the ANSI tempnam function, however, the names allbegin with the characters srtwk. If the sorting process ends normally or terminates because ofa detectable error (typically, disk space overflow), all of the allocated work files are deleted.There is no explicit way to save them. If there is another type of abnormal termination, srtwkfiles may be left on the disk. You can and should erase them.
Improving Efficiency With External Sorts
192
Reference: Sort Work Files on IBM i
On IBM i (formerly i5/OS), the number of work files is fixed at 9. They are virtual files.
Reference: WebFOCUS External Sort Return Codes
The WebFOCUS error message FOC909 is issued for all errors from external sort. An additionalthree-digit code is supplied, of which the last two digits are of interest. If you get an errornumber ending in:
16, external sort did not have enough memory allocated. You can try reducing the numberof work files.
20, an I/O error occurred; in most cases, this means that one of the disks is not writableor has overflowed. Allocate the work files differently or reduce their number.
28, one of the work files could not be opened. Check to make sure the pathname wasspecified correctly and that protections allow writing and reading.
32, an internal logical error was detected in the sort processing. Report this problem toTechnical Support Services.
Mainframe External Sort Utilities and Message Options
By default, error messages created by a Mainframe external sort product are not displayed.However, you may wish to display these messages on your screen for diagnostic purposes.
Procedure: How to Select a Sort Utility and Message Options
You use the SET SORTLIB command to both specify the sort utility used at your site and, forDFSORT and SYNCSORT on z/OS, to display sort messages.
1. Issue the SET SORTLIB command to specify the sort utility being used:
SET SORTLIB = {sortutility|DEFAULT}
where:
sortutility
Can be one of the following:
DFSORT for DFSORT without messages.
MVSMSGDF for DFSORT with messages.
SYNCSORT for SyncSort without messages.
3. Sorting Tabular Reports
Creating Reports With TIBCO® WebFOCUS Language 193

MVSMSGSS for SyncSort with standard messages.
MVSMSGSD for SyncSort with debug (verbose) messages.
DEFAULT for DFSORT. However, It is more efficient and highly recommended thatyou explicitly specify the sort utility using one of the other values.
2. If you specified a sort option that produces sort messages on z/OS, you must direct thesort messages to the batch output stream or a file.
Allocate DDNAME SYSOUT to the batch output stream or a file on z/OS by inserting theappropriate following DD card into your server batch JCL, if it is not already there. Forexample, the following DD card allocates DDNAME SYSOUT to the batch output stream:
//SYSOUT DD SYSOUT=*
Diagnosing External Sort Errors
When an external sort generates an error, you can generate a trace of sort processing andexamine the FOCUS return codes and messages to diagnose the problem.
Procedure: How to Trace Sort Processing
When an external sort problem occurs, one of the following messages is generated:
(FOC909) CRITICAL ERROR IN EXTERNAL SORT. RETURN CODE IS: xxxx(FOC1810) External sort not found(FOC1899) Load of %1 (external-sort module) under %2 failed
In response to these messages, as well as for any other problem with sorting, it is useful totrace sort processing. For information on diagnosing external sort problems, see DiagnosingExternal Sort Errors on page 194.
1. Allocate DDNAME FSTRACE to the terminal or a file. The following example sends traceoutput to the terminal:
//FSTRACE DD SYSOUT=*,DCB=(RECFM=FA,LRECL=133,BLKSIZE=133)
2. Activate the trace by adding the following commands in any supported profile or aFOCEXEC:
SET TRACEUSER = ONSET TRACEON = SORT/1/FSTRACE
Reference: External Sort Messages and Return Codes
When you receive a FOC909 message, it includes a return code:
(FOC909) CRITICAL ERROR IN EXTERNAL SORT. RETURN CODE IS: xxxx
Improving Efficiency With External Sorts
194

You may also receive one of the following messages:
(FOC1810) External sort not found(FOC1899) Load of %1 (external-sort module) under %2 failed
The following notes apply when this message or a FOC1800 or FOC1899 message isgenerated by a TABLE request:
The most common value for xxxx is 16. However, return code 16 is issued for a number ofproblems, including but not limited to the following:
Syntax errors.
Memory shortage.
I/O errors (depending on installation options).
Space problems with output.
Space problems with work files.
In order to diagnose the error, you must generate external sort messages (using theinstructions in How to Select a Sort Utility and Message Options on page 193 and How toTrace Sort Processing on page 194) and then reproduce the failure.
For return codes not described below, follow the same procedure described for return code16.
Return code 20 is issued by DFSORT under z/OS if messages were requested (using theMVSMSGDJ option of the SET SORTLIB command), but the SYSOUT DD card is missing.DFSORT terminates after issuing the return code. Under the same conditions, SyncSortattempts to open SYSOUT, producing the following message, and then continues withmessages written to the operator or terminal:
IEC130I SYSOUT DD STATEMENT MISSING.
Return code 36 or a FOC1899 message under z/OS means that the external sort modulecould not be found; check the STEPLIBs allocated.
When REBUILD INDEX invokes an external sort that fails, it generates a message similar to thefollowing:
ERROR OCCURRED IN THE SORT yyyyyyyyzzzzzzzz
In this case, the return code is yyyyyyyy and it is expressed in hex. The final eight digits(zzzzzzzz) should be ignored.
3. Sorting Tabular Reports
Creating Reports With TIBCO® WebFOCUS Language 195

Translate the return code into decimal and follow the instructions for return codes in a TABLErequest.
Note also that when a TABLE request generates a non-zero return code from an external sort,FOCUS is terminated. By contrast, when REBUILD INDEX gets a non-zero return code from anexternal sort, the REBUILD command is terminated but FOCUS continues.
Reference: Responding to an Indication of Inadequate Sort Work Space
Before following these instructions, make sure that external sort messages were generated(for information, see How to Select a Sort Utility and Message Options on page 193) and thatthey clearly show that the reason for failure was inadequate sort work space.
1. Make an estimate of the number of lines of output the request will produce.
2. Set the ESTLINES parameter in the request or FOCEXEC. For information, see Providing anEstimate of Input Records or Report Size for Sorting on page 191.
WebFOCUS will pass this estimate to the external sort utility through the parameter list.
Do not override the DD cards for SORTWKnn, S001WKnn, DFSPARM, or $SORTPARMwithout direct instructions from technical support. The instructions in How to Select a SortUtility and Message Options on page 193, How to Trace Sort Processing on page 194, and Providing an Estimate of Input Records or Report Size for Sorting on page 191 shouldprovide equivalent capabilities.
Aggregation by External Sort (Mainframe Environments Only)
External sorts can be used to perform aggregation with a significant decrease in processingtime in comparison to using the internal sort facility. The gains are most notable with relativelysimple requests against large data sources.
When aggregation is performed by an external sort, the statistical variables &RECORDS and&LINES are equal because the external sort products do not return a line count for the answerset. This is a behavior change, and affects any code that checks the value of &LINES. (If youmust test &LINES, do not use this feature.)
Syntax: How to Use Aggregation in Your External Sort
SET EXTAGGR = aggropt
where:
aggropt
Can be one of the following:
Improving Efficiency With External Sorts
196

OFF disallows aggregation by an external sort.
NOFLOAT allows aggregation if there are no floating point data fields present.
ON allows aggregation by an external sort. This value is the default.
Reference: Usage Notes for Aggregating With an External Sort
You must use SyncSort or DFSORT.
Your query should be simple (that is, it should be able to take advantage of the TABLEFfacility). For related information, see Data Retrieval Using TABLEF on page 1935.
The PRINT display command may not be used in the query.
SET ALL must be equal to OFF.
Only the following column prefixes are allowed: SUM, AVG, CNT, FST.
Columns can be calculated values or have a row total.
When SET EXTAGGR = NOFLOAT and your query aggregates numeric data, the external sortis not called, and aggregation is performed through the internal sorting procedure.
Example: Changing Output by Using an External Sort for Aggregation
If you use SUM on an alphanumeric field in your report request without using an external sort,the last instance of the sorted fields is displayed in the output, by default. Turning onaggregation in the external sort displays the first record instead. However, you can control theorder of display using the SUMPREFIX parameter. For information about the SUMPREFIXparameter, see Changing Retrieval Order With Aggregation on page 198.
The following command turns aggregation ON and leaves SUMPREFIX set to LST (the default)and, therefore, displays the last record:
SET EXTAGGR = ONSET SUMPREFIX = LSTTABLE FILE CARSUM CAR BY COUNTRYEND
The output is:
COUNTRY CAR ------- --- ENGLAND TRIUMPH FRANCE PEUGEOT ITALY MASERATIJAPAN TOYOTA W GERMANY BMW
3. Sorting Tabular Reports
Creating Reports With TIBCO® WebFOCUS Language 197
Note: SUMPREFIX is described in Changing Retrieval Order With Aggregation on page 198.
With SUMPREFIX = FST, the output is:
COUNTRY CAR ------- --- ENGLAND JAGUAR FRANCE PEUGEOT ITALY ALFA ROMEOJAPAN DATSUN W GERMANY AUDI
Changing Retrieval Order With Aggregation
The SUMPREFIX parameter allows you to specify which value will be displayed whenaggregating an alphanumeric or smart date field in the absence of any prefix operator. Thedefault value is LST, which will return the physical last value within the sort group. FST willreturn the first physical value in the sort group. MIN and MAX return either the minimum valueor maximum value within the sort group.
The SUMPREFIX command allows users to choose the answer set display order.
Syntax: How to Set Retrieval Order
SET SUMPREFIX = {FST|LST|MIN|MAX}
where:
FST
Displays the first value when alphanumeric or smart date data types are aggregated.
LST
Displays the last value when alphanumeric or smart date data types are aggregated. LST isthe default value.
MIN
Displays the minimum value in the sort order set by your server code page andconfiguration when alphanumeric or smart date data types are aggregated.
MAX
Displays the maximum value in the sort order set by your server code page andconfiguration when alphanumeric or smart date data types are aggregated.
Improving Efficiency With External Sorts
198

Example: Displaying the Minimum Value for an Aggregated Alphanumeric Field
The following request sets SUMPREFIX to MIN and displays the aggregatedPRODUCT_CATEGORY and DAYSDELAYED values as well as the minimum, maximum, first, andlast PRODUCT_CATEGORY values. In each row, the aggregated PRODUCT_CATEGORY valuematches the MIN.PRODUCT_CATEGORY value. The DAYSDELAYED numeric field is not affectedby the SUMPREFIX value and is aggregated.
SET SUMPREFIX = MINTABLE FILE WF_RETAIL_LITESUM PRODUCT_CATEGORY DAYSDELAYED MIN.PRODUCT_CATEGORY MAX.PRODUCT_CATEGORY FST.PRODUCT_CATEGORY LST.PRODUCT_CATEGORYBY BRANDWHERE BRAND GT 'K' AND BRAND LT 'U'ON TABLE SET PAGE NOLEADON TABLE SET STYLE *GRID=OFF,$ENDSTYLEEND
The output is shown in the following image.
Creating a HOLD File With an External Sort (Mainframe Environments Only)
You can use Mainframe external sort packages to create HOLD files, producing substantialsavings in processing time. The gains are most notable with relatively simple requests againstlarge data sources.
3. Sorting Tabular Reports
Creating Reports With TIBCO® WebFOCUS Language 199
Syntax: How to Create HOLD Files With an External Sort
SET EXTHOLD = {OFF|ON}
where:
OFF
Disables HOLD files by an external sort.
ON
Enables HOLD files by an external sort. This value is the default.
Reference: Usage Notes for Creating a HOLD File With an External Sort
The default setting of EXTSORT=ON must be in effect.
EXTHOLD must be ON.
The request must contain a BY field.
The type of HOLD file created must be a FOCUS, XFOCUS, ALPHA, or BINARY file.
Your query should be simple. AUTOTABLEF analyzes a query and determines whether thecombination of display commands and formatting options requires the internal matrix. Incases where it is determined that a matrix is not necessary to satisfy the query, you mayavoid the extra internal costs associated with creating the matrix. The internal matrix isstored in a file or data set named FOCSORT. The AUTOTABLEF default is ON, in order torealize performance gains.
SET ALL must be OFF.
There cannot be an IF/WHERE TOTAL or BY TOTAL in the request.
If a request contains a SUM command, EXTAGGR must be set ON, and the only columnprefixes allowed are SUM. and FST.
Hierarchical Reporting: BY HIERARCHY
Cube data sources such as Essbase or SAP BW are organized into dimensions and facts.Dimensions are often organized into hierarchies. The synonyms for cube data sources haveattributes that describe the dimension hierarchies, and WebFOCUS has hierarchical reportingsyntax that can automatically report against these hierarchies and display the results indentedto show the hierarchical relationships.
Hierarchical Reporting: BY HIERARCHY
200

WebFOCUS also supports defining dimension hierarchies in synonyms for non-cube datasources that have hierarchical data. Once hierarchical dimensions are defined in a synonym,you can issue hierarchical reporting requests against them. Non-cube synonyms withhierarchical attributes are called virtual cubes.
Dimensions are categories of data, such as Region or Time, that you use to analyze andcompare business performance. Dimensions consist of data elements that are calledmembers. For example, a Region dimension could have members England and France.
Dimension members are usually organized into hierarchies. Hierarchies can be viewed as tree-like structures where members are the nodes. For example, the Region dimension may havethe element World at its top level (the root node). The World element may have children nodes(members) representing continents. Continents, in turn, can have children nodes thatrepresent countries, and countries can have children nodes representing states or cities.Nodes with no children are called leaf nodes.
Measures are numeric values, such as Sales Volume or Net Income, that are used to quantifyhow your business is performing.
A cube consists of data derived from facts, which are records about individual businesstransactions. For example, an individual fact record reflects a sales transaction of a certainnumber of items of a certain product at a certain price, which occurred in a certain store at acertain moment in time. The cube contains summarized fact values for all combinations ofmeasures and members of different dimensions.
A synonym describes a hierarchy using a set of fields that define the hierarchical structure andthe relationships between the hierarchy members. WebFOCUS has special hierarchicalreporting syntax for reporting on hierarchies.
Hierarchical reporting requests have several phases:
Phase 1, selecting hierarchy members to display.
The hierarchical reporting phrase BY or ON HIERARCHY automatically sorts and formats ahierarchy with appropriate indentations that show the parent/child relationships. It alsoautomatically rolls up the measure values for child members to generate the measurevalues for the parent members.
If you do not want to see the entire hierarchy, you can use the WHEN phrase to selecthierarchy members for display. The expression in this WHEN phrase must reference onlyhierarchy fields, not dimension properties or measures.
Phase 2, screening the retrieved dimension data.
3. Sorting Tabular Reports
Creating Reports With TIBCO® WebFOCUS Language 201

WHERE criteria are applied to the leaf nodes of the members selected during phase 1.Therefore, dimension properties can be used in WHERE tests. These tests can alsoreference hierarchy fields. However, since the selection criteria are always applied to thevalues at the leaf nodes, they cannot select data based on values that occur at higherlevels. For example, in a dimension with Continents, Countries, and Cities, your request willnot display any rows if you use WHERE to select at the Country level, but it may if you use itto select at the City level. WHERE tests can also reference measures.
Phase 3, screening based on aggregated values.
Measures, being summarized values, can be referenced in WHERE TOTAL tests andCOMPUTE commands because those commands are processed after the hierarchyselection and aggregation phases of the request.
Syntax: How to Specify a Hierarchy in a Master File
The data source must have at least one dimension that is organized hierarchically. Thedeclaration for a dimension is:
DIMENSION=dimname,CAPTION=dimcaption, $
where:
dimname
Is a name for the dimension.
dimcaption
Is a label for the dimension.
The declaration for a hierarchy within the dimension is:
HIERARCHY=hname,CAPTION='hcaption',HRY_DIMENSION=dimname,HRY_STRUCTURE=RECURSIVE, $
where:
hname
Is a name for the hierarchy.
hcaption
Is a label for the hierarchy.
dimname
Is the name of the dimension for which this hierarchy is defined.
Hierarchical Reporting: BY HIERARCHY
202

Several fields are used to define a parent/child hierarchy. Each has a PROPERTY attribute thatdescribes which hierarchy property it represents. Each hierarchy must have a unique identifierfield. This field is called the hierarchy field. If the synonym represents a FOCUS data source,this field must be indexed (FIELDTYPE=I). The declaration for the hierarchy field is:
FIELD=hfield,ALIAS=halias,USAGE= An, [ACTUAL=Am,] WITHIN='*hierarchy',PROPERTY=UID, [TITLE='title1',] [FIELDTYPE=I,] $
where:
hfield
Is the field name for the hierarchy field.
halias
Is the alias for the hierarchy field. If the data source is relational, this must be the name ofthe column in the Relational DBMS.
hierarchy
Is the name of the hierarchy to which this field belongs.
USAGE= An, [ACTUAL=Am,]
Are the USAGE format and, if the data source is not a FOCUS data source, the ACTUALformat of the field.
title1
Is an optional title for the field.
Other fields defined for the hierarchy include the parent field and the caption field. Each ofthese fields has the same name as the hierarchy field with a suffix added. Each has aPROPERTY attribute that specifies its role in the hierarchy and a REFERENCE attribute thatpoints to the corresponding hierarchy field.
The following is the declaration for the parent field. The parent field is needed to define theparent/child relationships in the hierarchy:
FIELD=hfield_PARENT,ALIAS=parentalias,USAGE=An,[ACTUAL=Am,] [TITLE=ptitle,] PROPERTY=PARENT_OF, REFERENCE=hfield, $
where:
hfield
Is the hierarchy field.
3. Sorting Tabular Reports
Creating Reports With TIBCO® WebFOCUS Language 203
parentalias
Is the alias for the parent field. If the data source is relational, this must be the name ofthe column in the relational DBMS.
USAGE= An, [ACTUAL=Am,]
Are the USAGE format and, if the data source is not a FOCUS data source, the ACTUALformat of the field.
ptitle
Is a column title for the parent field.
The following is the declaration for the caption field. A caption is a descriptive title for eachvalue of the hierarchy field. It is part of the data and, therefore, is different from a TITLEattribute in the Master File, which is a literal title for the column on the report output.
FIELD=hfield_CAPTION,ALIAS=capalias,USAGE=Ann,[ACTUAL=Amm,] [TITLE=captitle,] PROPERTY=CAPTION, REFERENCE=hfield, $
where:
hfield
Is the hierarchy field.
capalias
Is the alias for the caption field. If the data source is relational, this must be the name ofthe column in the relational DBMS.
USAGE= Ann, [ACTUAL=Amm,]
Are the USAGE format and, if the data source is not a FOCUS data source, the ACTUALformat of the field.
captitle
Is a column title for the caption field.
Hierarchical Reporting: BY HIERARCHY
204

Example: Sample Master File With a Dimension Hierarchy
The following Master File is based on the CENTGL Master File, which has an FML hierarchydefined. This version is named NEWGL and it has a dimension hierarchy of accounts in whichGL_ACCOUNT is the hierarchy field, GL_ACCOUNT_PARENT is the parent field, andGL_ACCOUNT_CAPTION is the caption field. There are other fields based on the hierarchy(GL_ACCOUNT_LEVEL, GL_ROLLUP_OP, and GL_ACCOUNT_TYPE). In addition, there is ameasure field (GL_ACCOUNT_AMOUNT):
FILE=NEWGL ,SUFFIX=FOC,$SEGNAME=ACCOUNTS ,SEGTYPE=S01DIMENSION=Accnt,CAPTION=Accnt, $HIERARCHY=Accnt,CAPTION='Accnt',HRY_DIMENSION=Accnt,HRY_STRUCTURE=RECURSIVE, $FIELD=GL_ACCOUNT,GLACCT,A7,WITHIN='*Accnt',PROPERTY=UID, TITLE='Ledger,Account', FIELDTYPE=I, $FIELD=GL_ACCOUNT_PARENT,GLPAR,A7, TITLE=Parent, PROPERTY=PARENT_OF, REFERENCE=GL_ACCOUNT, $FIELD=GL_ACCOUNT_TYPE,GLTYPE,A1, TITLE=Type,$FIELD=GL_ROLLUP_OP,ROLL,A1, TITLE=Op, $FIELD=GL_ACCOUNT_LEVEL,GLLEVEL,I3, TITLE=Lev, $FIELDNAME=GL_ACCOUNT_AMOUNT,GLAMT,D12.2, TITLE=Amount, $FIELD=GL_ACCOUNT_CAPTION,GLCAP,A30, TITLE=Caption, PROPERTY=CAPTION, REFERENCE=GL_ACCOUNT, $FIELD=SYS_ACCOUNT,ALINE,A6, TITLE='System,Account,Line', MISSING=ON, $
The following procedure loads data into this data source, as long as the Master File isavailable to WebFOCUS (on the path or allocated):
CREATE FILE NEWGL NOMSG-RUNMODIFY FILE NEWGLCOMPUTE TGL_ACCOUNT_LEVEL/A3=;COMPUTE TGL_ACCOUNT_AMOUNT/A12=;FIXFORM GL_ACCOUNT/A4B X3 GL_ACCOUNT_PARENT/A4B X3 GL_ACCOUNT_TYPE/A1BFIXFORM SYS_ACCOUNT/A4B GL_ROLLUP_OP/A1BFIXFORM TGL_ACCOUNT_LEVEL/A3B GL_ACCOUNT_CAPTION/A30BFIXFORM TGL_ACCOUNT_AMOUNT/A12BCOMPUTE GL_ACCOUNT_LEVEL = EDIT(TGL_ACCOUNT_LEVEL);COMPUTE GL_ACCOUNT_AMOUNT = ATODBL(TGL_ACCOUNT_AMOUNT , '12', GL_ACCOUNT_AMOUNT); MATCH GL_ACCOUNT ON MATCH REJECT ON NOMATCH INCLUDE
3. Sorting Tabular Reports
Creating Reports With TIBCO® WebFOCUS Language 205

DATA1000 R. + 1Profit Before Tax 2000 1000 R. + 2Gross Margin 2100 2000 R. + 3Sales Revenue 2200 2100 R. + 4Retail Sales 2210 2200 R7001+ 5Retail - Television 505.002220 2200 R7002+ 5Retail - Stereo 505.002230 2200 R7003+ 5Retail - Video Player 505.002240 2200 R7004+ 5Retail - Computer 505.002250 2200 R7005+ 5Retail - Video Camera 505.002300 2100 R. + 4Mail Order Sales 2310 2300 R7011+ 5Mail Order - Television 505.002320 2300 R7012+ 5Mail Order - Stereo 505.002330 2300 R7013+ 5Mail Order - Video Player 505.002340 2300 R7014+ 5Mail Order - Computer 505.002350 2300 R7015+ 5Mail Order - Video Camera 505.002400 2100 R. + 4Internet Sales 2410 2400 R7021+ 5Internet - Television 505.002420 2400 R7022+ 5Internet - Stereo 505.002430 2400 R7023+ 5Internet - Video Player 505.002440 2400 R7024+ 5Internet - Computer 505.002450 2400 R7025+ 5Internet - Video Camera 505.002500 2000 E. - 3Cost Of Goods Sold 2600 2500 E. + 4Variable Material Costs 2610 2600 E7101+ 5Television COGS 505.002620 2600 E7102+ 5Stereo COGS 505.002630 2600 E7103+ 5Video COGS 505.002640 2600 E7104+ 5Computer COGS 505.002650 2600 E7105+ 5Video Camera COGS 505.002700 2500 E7111+ 4Direct Labor 404.002800 2500 E7112+ 4Fixed Costs 404.003000 1000 E. - 2Total Operating Expenses 3100 3000 E. + 3Selling Expenses 3110 3100 E. + 4Advertising 3112 3110 E7202+ 5TV/Radio 505.003114 3110 E7203+ 5Print Media 505.003116 3110 E7206+ 5Internet Advertising 505.003120 3100 E7212+ 4Promotional Expenses 404.003130 3100 E7213+ 4Joint Marketing 404.003140 3100 E7214+ 4Bonuses/Commisions 404.003200 3000 E. + 3General + Admin Expenses 3300 3200 E. + 4Salaries-Corporate
Hierarchical Reporting: BY HIERARCHY
206

3310 3300 E7301+ 5Salaries-Corp Mgmt 505.003320 3300 E7302+ 5Salaries-Administration 505.003330 3300 E7303+ 5IT Contractors 505.003400 3200 E. + 4Company Benefits 3410 3400 E7311+ 5Social Security 505.003420 3400 E7312+ 5Unemployment 505.003430 3400 E7313+ 5Vacation Pay 505.003440 3400 E7314+ 5Sick Pay 505.003450 3400 E. + 5Insurances3451 3450 E7321+ 6Medical Insurance 606.003452 3450 E7322+ 6Dental Insurance 606.003453 3450 E7323+ 6Pharmacy Insurance 606.003454 3450 E7324+ 6Disability Insurance 606.003455 3450 E7325+ 6Life Insurance 606.003500 3200 E. + 4Depreciation Expenses 3510 3500 E7411+ 5Equipment 505.003520 3500 E7412+ 5Building 505.003530 3500 E7413+ 5Vehicles 505.003600 3200 R7414- 4Gain/(Loss) Sale of Equipment 404.003700 3200 E. + 4Leasehold Expenses 3710 3700 E7421+ 5Equipment 505.003720 3700 E7422+ 5Buildings 505.003730 3700 R7429- 5Sub-Lease Income 505.003800 3200 E7440+ 4Interest Expenses 404.003900 3200 E. + 4Utilities 3910 3900 E7451+ 5Electric 505.003920 3900 E7452+ 5Gas 505.003930 3900 E7453+ 5Telephone 505.003940 3900 E7454+ 5Water 505.003950 3900 E7455+ 5Internet Access 505.005000 1000 E. - 2Total R+D Costs5100 5000 E7511+ 3Salaries 303.005200 5000 E7521+ 3Misc. Equipment 303.00END
Syntax: How to Report on a Hierarchy
In hierarchical reporting, measure values for child dimension members will be rolled up togenerate the parent values. In the data source, the parent members should not have valuesfor the measures.
SUM measure_field ...BY hierarchy_field [HIERARCHY [WHEN expression_using_hierarchy_fields;][SHOW [TOP|UP n] [TO {BOTTOM|DOWN m}] [byoption [WHEN condition] ...] ][WHERE expression_using_dimension_data][ON hierarchy_field HIERARCHY [WHEN expression_using_hierarchy_fields;][SHOW [TOP|UP n] [TO BOTTOM|DOWN m] [byoption [WHEN condition] ...]]
where:
measure_field
Is the field name of a measure.
3. Sorting Tabular Reports
Creating Reports With TIBCO® WebFOCUS Language 207

BY hierarchy_field HIERARCHY
Identifies the hierarchy used for sorting. The field must be a hierarchy field.
ON hierarchy_field HIERARCHY
Identifies the hierarchy used for sorting. The field must be a hierarchy field. The requestmust include either a BY phrase or a BY HIERARCHY phrase for this field name.
WHEN expression_using_hierarchy_fields;
Selects hierarchy members. The WHEN phrase must immediately follow the wordHIERARCHY to distinguish it from a WHEN phrase associated with a BY option (such asSUBFOOT). Any expression using only hierarchy fields is supported. The WHEN phrase canbe on the BY HIERARCHY command or the ON HIERARCHY command, but not both.
SHOW
Specifies which levels to show on the report output relative to the levels selected by theWHEN phrase. If there is no WHEN phrase, the SHOW option is applied to the root node ofthe hierarchy. The SHOW option can be specified on the BY HIERARCHY phrase or the ONHIERARCHY phrase, but not both.
n
Is the number of ascendants above the set of selected members that will have measurevalues. All ascendants appear on the report to show the hierarchical context of theselected members. However, ascendants that are not included in the SHOW phraseappear on the report with missing data symbols in the report columns that displaymeasures. The default for n is 0.
TOP
Specifies that ascendant levels to the root node of the hierarchy will be populated withmeasure values.
TO
Is required when specifying a SHOW option for descendant levels.
BOTTOM
Specifies all descendants to the leaf nodes of the hierarchy will be populated withmeasure values. This is the default value.
m
Is the number of descendants of each selected level that will display. The default for m isBOTTOM, which displays all descendants.
Hierarchical Reporting: BY HIERARCHY
208

byoption
Is one of the following sort-based options: PAGE-BREAK, REPAGE, RECAP, RECOMPUTE,SKIP-LINE, SUBFOOT, SUBHEAD, SUBTOTAL, SUB-TOTAL, SUMMARIZE, UNDER-LINE. If youspecify SUBHEAD or SUBFOOT, you must place the WHEN phrase on the line following theheading or footing text.
condition
Is a logical expression.
expression_using_dimension_data
Screens the rows selected in the BY/ON HIERARCHY and WHEN phrases based ondimension data. The expression can use dimension properties and hierarchy fields.However, the selection criteria are always applied to the values at the leaf nodes.Therefore, you cannot use WHERE to select rows based on hierarchy field values thatoccur at higher levels. For example, in a dimension with Continents, Countries, and Cities,your request will not display any rows if you use WHERE to select a Country name, but itmay if you use it to select a City name.
Example: Reporting on a Dimension HIerarchy
The following request reports on the entire GL_ACCOUNT hierarchy for the CENTGL2 datasource created in the Describing Data With TIBCO WebFOCUS® Language manual.
TABLE FILE NEWGLSUM GL_ACCOUNT_AMOUNT BY GL_ACCOUNT HIERARCHY ON TABLE SET PAGE NOPAGEON TABLE SET STYLE *TYPE=REPORT,GRID=OFF,$ENDSTYLEEND
3. Sorting Tabular Reports
Creating Reports With TIBCO® WebFOCUS Language 209

Partial output is shown in the following image. The accounts are indented to show thehierarchical relationships:
Hierarchical Reporting: BY HIERARCHY
210

The following is the same request using the GL_ACCOUNT_CAPTION field:
TABLE FILE NEWGLSUM GL_ACCOUNT_AMOUNTBY GL_ACCOUNT_CAPTION HIERARCHYON TABLE SET PAGE NOPAGEON TABLE SET STYLE *TYPE=REPORT,GRID=OFF,$ENDSTYLEEND
3. Sorting Tabular Reports
Creating Reports With TIBCO® WebFOCUS Language 211
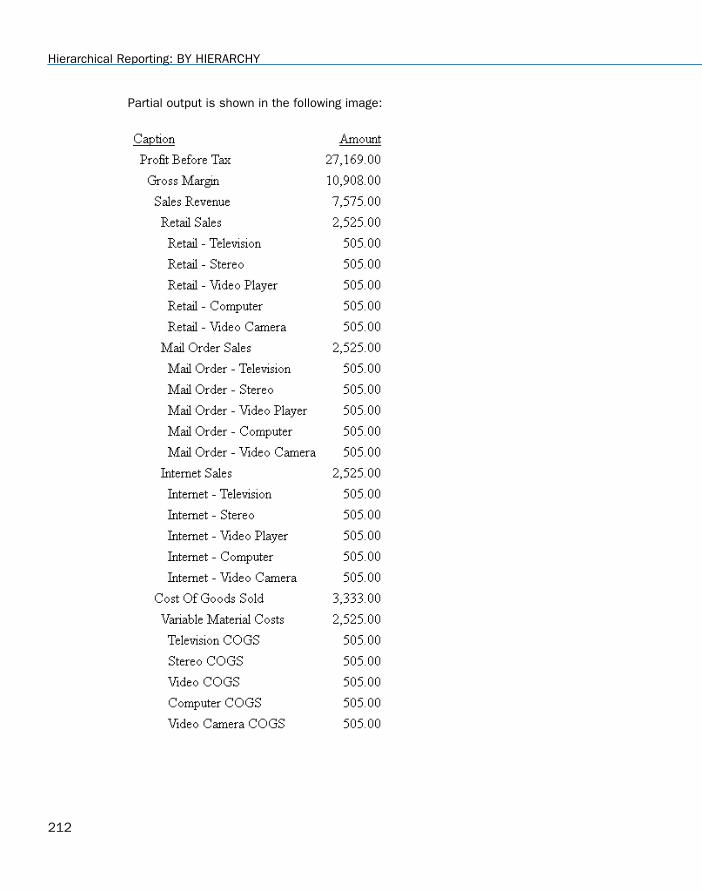
Partial output is shown in the following image:
Hierarchical Reporting: BY HIERARCHY
212

Example: Using WHEN to Select Hierarchy Members
The following request selects certain accounts using the WHEN phrase and populates onelevel up and one level down from the selected nodes with values. Note that all levels to theroot node display on the output for context, but if they are not in the members selected, theyare not populated with measure values:
TABLE FILE NEWGLSUM GL_ACCOUNT_AMOUNTBY GL_ACCOUNT_CAPTION HIERARCHYWHEN GL_ACCOUNT GT '2000' AND GL_ACCOUNT LT '3000'; SHOW UP 1 TO DOWN 1 ON TABLE SET PAGE NOPAGEON TABLE SET STYLE *TYPE=REPORT,GRID=OFF,$ENDSTYLEEND
3. Sorting Tabular Reports
Creating Reports With TIBCO® WebFOCUS Language 213

The output is shown in the following image:
Hierarchical Reporting: BY HIERARCHY
214
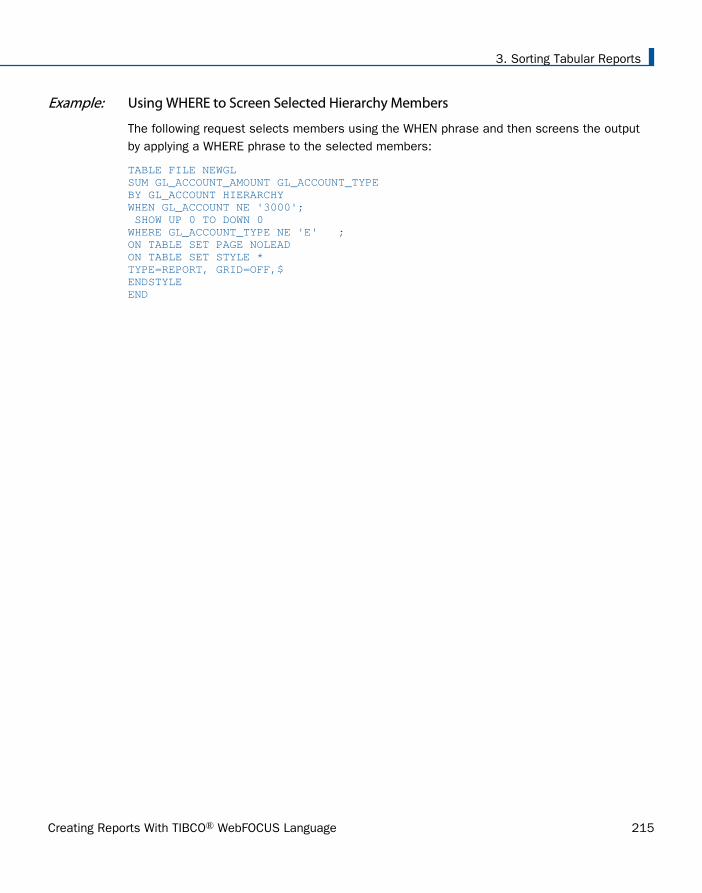
Example: Using WHERE to Screen Selected Hierarchy Members
The following request selects members using the WHEN phrase and then screens the outputby applying a WHERE phrase to the selected members:
TABLE FILE NEWGLSUM GL_ACCOUNT_AMOUNT GL_ACCOUNT_TYPEBY GL_ACCOUNT HIERARCHYWHEN GL_ACCOUNT NE '3000'; SHOW UP 0 TO DOWN 0WHERE GL_ACCOUNT_TYPE NE 'E' ;ON TABLE SET PAGE NOLEADON TABLE SET STYLE *TYPE=REPORT, GRID=OFF,$ENDSTYLEEND
3. Sorting Tabular Reports
Creating Reports With TIBCO® WebFOCUS Language 215

The output is shown in the following image:
Hierarchical Reporting: BY HIERARCHY
216

Chapter4Selecting Records for Your Report
When generating a report and selecting fields, you may not want to include everyinstance of a field. By including selection criteria, you can display only those field valuesthat meet your needs. In effect, you can select a subset of data that you can easilyredefine each time you issue the report request.
In this chapter:
Selecting Records Overview
Choosing a Filtering Method
Selections Based on Individual Values
Selection Based on Aggregate Values
Applying Selection Criteria to the InternalMatrix Prior to COMPUTE Processing
Using Compound Expressions for RecordSelection
Using Operators in Record SelectionTests
Types of Record Selection Tests
Selections Based on Group Key Values
Setting Limits on the Number of RecordsRead
Selecting Records Using IF Phrases
Reading Selection Values From a File
Assigning Screening Conditions to a File
VSAM Record Selection Efficiencies
Selecting Records Overview
When developing a report request, you can define criteria that select records based on avariety of factors:
The values of an individual field. See Selections Based on Individual Values on page 218.
The aggregate value of a field (for example, the sum or average of field values). See Selection Based on Aggregate Values on page 226.
The existence of missing values for a field, whether field values fall within a range, orwhether a field does not contain a certain value. See Types of Record Selection Tests onpage 243.
The number of records that exist for a field (for example, the first 50 records), rather thanon the field values. See Setting Limits on the Number of Records Read on page 258.
Creating Reports With TIBCO® WebFOCUS Language 217

For non-FOCUS data sources that have group keys, you can select records based on groupkey values. See Selections Based on Group Key Values on page 257.
In addition, you can take advantage of a variety of record selection efficiencies, includingassigning filtering criteria to a data source and reading selection values from a file.
Choosing a Filtering Method
There are two phrases for selecting records: WHERE and IF. It is recommended that you useWHERE to select records. IF offers a subset of the functionality of WHERE. Everything that youcan accomplish with IF, you can also accomplish with WHERE. WHERE can accomplish thingsthat IF cannot.
If you used IF to select records in the past, remember that WHERE and IF are two differentphrases, and may require different syntax to achieve the same result.
WHERE syntax is described and illustrated throughout this topic. For details on IF syntax, see Selecting Records Using IF Phrases on page 259.
Selections Based on Individual Values
The WHERE phrase selects records from the data source to be included in a report. The data isevaluated according to the selection criteria before it is retrieved from the data source.
You can use as many WHERE phrases as necessary to define your selection criteria. For anillustration, see Using Multiple WHERE Phrases on page 220. For additional information, see Using Compound Expressions for Record Selection on page 235.
Note: Multiple selection tests on fields that reside on separate paths of a multi-path datasource are processed as though connected by either AND or OR operators, based on thesetting of a parameter called MULTIPATH. For details, see Controlling Record Selection in Multi-path Data Sources on page 221.
Syntax: How to Select Records With WHERE
WHERE criteria [;]
where:
criteriaAre the criteria for selecting records to include in the report. The criteria must bedefined in a valid expression that evaluates as true or false (that is, a Booleanexpression). Expressions are described in detail in Using Expressions on page 429.Operators that can be used in WHERE expressions (such as, CONTAINS, IS, and GT),are described in Operators Supported for WHERE and IF Tests on page 236.
Choosing a Filtering Method
218

;
Is an optional semicolon that can be used to enhance the readability of the request. Itdoes not affect the report.
Reference: Usage Notes for WHERE Phrases
The WHERE phrase can include:
Most expressions that would be valid on the right-hand side of a DEFINE expression.However, the logical expression IF ... THEN ... ELSE cannot be used.
Real fields, temporary fields, and fields in joined files. If a field name is enclosed in singleor double quotation marks, it is treated as a literal string, not a field reference.
The operators EQ, NE, GE, GT, LT, LE, CONTAINS, OMITS, FROM ... TO, NOT-FROM ... TO,INCLUDES, EXCLUDES, LIKE, and NOT LIKE.
All arithmetic operators (+, -, *, /, **), as well as, functions (MIN, MAX, ABS, and SQRT).
An alphanumeric expression, which can be a literal, or a function yielding an alphanumericor numeric result using EDIT or DECODE.
Note that files used with DECODE expressions can contain two columns, one for fieldvalues and one for numeric decode values.
Alphanumeric and date literals enclosed in single quotation marks and date-time literals inthe form DT (date-time literal).
A date literal used in a selection test against a date field cannot contain the day of theweek value.
Text fields. However, the only operators supported for use with text fields are CONTAINSand OMITS.
All functions.
You can build complex selection criteria by joining simple expressions with AND and OR logicaloperators and, optionally, adding parentheses to specify explicitly the order of evaluation. Thisis easier than trying to achieve the same effect with the IF phrase, which may require the useof a separate DEFINE command. For details, see Using Compound Expressions for RecordSelection on page 235.
4. Selecting Records for Your Report
Creating Reports With TIBCO® WebFOCUS Language 219
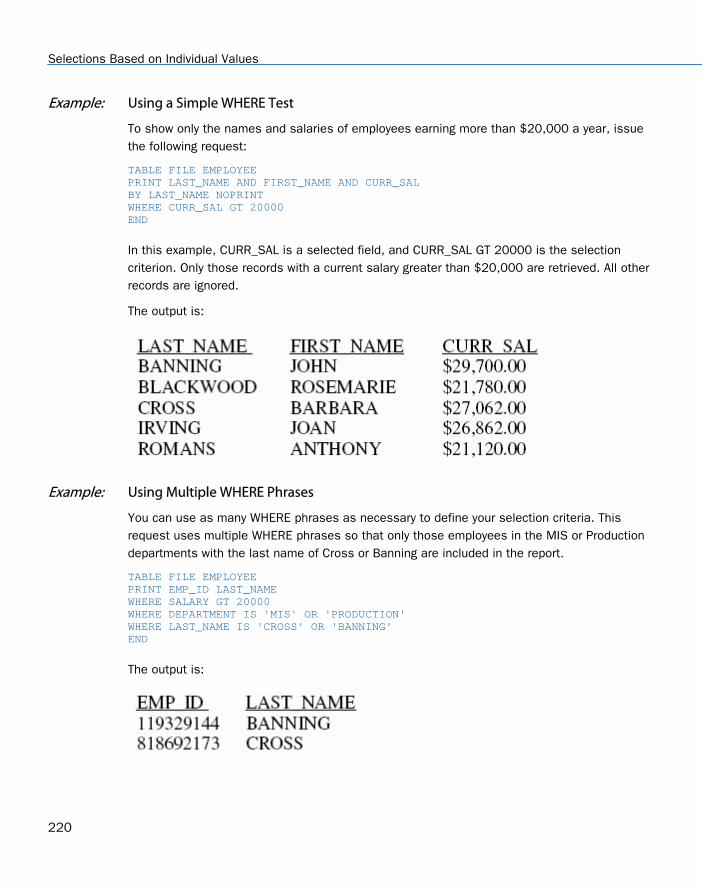
Example: Using a Simple WHERE Test
To show only the names and salaries of employees earning more than $20,000 a year, issuethe following request:
TABLE FILE EMPLOYEEPRINT LAST_NAME AND FIRST_NAME AND CURR_SALBY LAST_NAME NOPRINTWHERE CURR_SAL GT 20000END
In this example, CURR_SAL is a selected field, and CURR_SAL GT 20000 is the selectioncriterion. Only those records with a current salary greater than $20,000 are retrieved. All otherrecords are ignored.
The output is:
Example: Using Multiple WHERE Phrases
You can use as many WHERE phrases as necessary to define your selection criteria. Thisrequest uses multiple WHERE phrases so that only those employees in the MIS or Productiondepartments with the last name of Cross or Banning are included in the report.
TABLE FILE EMPLOYEEPRINT EMP_ID LAST_NAMEWHERE SALARY GT 20000WHERE DEPARTMENT IS 'MIS' OR 'PRODUCTION'WHERE LAST_NAME IS 'CROSS' OR 'BANNING'END
The output is:
Selections Based on Individual Values
220

For related information, see Using Compound Expressions for Record Selection on page 235.
Controlling Record Selection in Multi-path Data Sources
When you report from a multi-path data source, a parent segment may have children downsome paths, but not others. The MULTIPATH parameter allows you to control whether such aparent segment is omitted from the report output.
The MULTIPATH setting also affects the processing of selection tests on independent paths. IfMULTIPATH is set to:
COMPOUND, WHERE or IF tests on separate paths are treated as if they are connected byan AND operator. That is, all paths must pass the screening tests in order for the parent tobe included in the report output.
SIMPLE, WHERE or IF tests on separate paths are considered independently, as if an ORoperator connected them. Therefore, a parent instance is included in the report if at leastone of the paths passes its screening test. A warning message is produced, indicating thatif the request contains a test on one path, data is also retrieved from another, independentpath. Records on the independent path are retrieved regardless of whether the condition issatisfied on the tested path.
The MULTIPATH settings apply in all types of data sources and in all reporting environments(TABLE, TABLEF, MATCH, GRAPH, and requests with multiple display commands). MULTIPATHalso works with alternate views, indexed views, filters, DBA, and joined structures.
Syntax: How to Control Record Selection in Multi-path Data Sources
To set MULTIPATH from the command level or in a stored procedure, use
SET MULTIPATH = {SIMPLE|COMPOUND}
To set MULTIPATH in a report request, use
ON TABLE SET MULTIPATH {SIMPLE|COMPOUND}
where:
SIMPLE
Includes a parent segment in the report output if:
It has at least one child that passes its screening conditions.
Note: A unique segment is considered a part of its parent segment, and therefore doesnot invoke independent path processing.
4. Selecting Records for Your Report
Creating Reports With TIBCO® WebFOCUS Language 221

It lacks any referenced child on a path, but the child is optional.
The (FOC144) warning message is generated when a request screens data in a multi-path report:
(FOC144) WARNING. TESTING IN INDEPENDENT SETS OF DATA
COMPOUND
Includes a parent in the report output if it has all of its required children. WHERE or IFtests on separate paths are treated as if they are connected by an AND operator. Thatis, all paths must pass the screening tests in order for the parent to be included inthe report output. COMPOUND is the default value.
For related information, see MULTIPATH and SET ALL Combinations on page 224 and Rules forDetermining If a Segment Is Required on page 226.
Reference: Requirements and Usage Notes for MULTIPATH = COMPOUND
The minimum memory requirement for the MULTIPATH = COMPOUND setting is 4K peractive segment. If there is insufficient memory, the SIMPLE setting is implemented and amessage is returned.
There is no limit to the number of segment instances (rows). However, no single segmentinstance can have more than 4K of active fields (referenced fields or fields needed forretrieving referenced fields). If this limit is exceeded, the SIMPLE setting is implementedand a message is returned.
WHERE criteria that screen on more than one path with the OR operator are not supported.
Selections Based on Individual Values
222

Example: Retrieving Data From Multiple Paths
This example uses the following segments from the EMPLOYEE data source:
The request that follows retrieves data from both paths with MULTIPATH = SIMPLE, anddisplays data if either criterion is met:
SET ALL = OFFSET MULTIPATH = SIMPLETABLE FILE EMPLOYEE PRINT GROSS DATE_ATTEND COURSE_NAMEBY LAST_NAME BY FIRST_NAMEWHERE PAY_DATE EQ 820730WHERE COURSE_CODE EQ '103'END
The following warning message is generated:
(FOC144) WARNING. TESTING IN INDEPENDENT SETS OF DATA
Although several employees have not taken any courses, they are included in the report outputsince they have instances on one of the two paths.
4. Selecting Records for Your Report
Creating Reports With TIBCO® WebFOCUS Language 223

The output is:
If you run the same request with MULTIPATH = COMPOUND, the employees without instancesfor COURSE_NAME are omitted from the report output, and the warning message is notgenerated.
The output is:
LAST_NAME FIRST_NAME GROSS DATE_ATTEND COURSE_NAME --------- ---------- ----- ----------- ----------- JONES DIANE $1,540.00 82/05/26 BASIC REPORT PREP FOR PROGSMITH MARY $1,100.00 81/11/16 BASIC REPORT PREP FOR PROG
Reference: MULTIPATH and SET ALL Combinations
The ALL parameter affects independent path processing. The following table uses examplesfrom the EMPLOYEE data source to explain the interaction of ALL and MULTIPATH.
Request MULTIPATH=SIMPLE MULTIPATH=COMPOUND
SET ALL = OFFPRINT EMP_ID PAY_DATE DATE_ATTEND
Shows employees whohave either SALINFO dataor ATTNDSEG data.
Shows employees who have bothSALINFO and ATTNDSEG data.
SET ALL = ONPRINT EMP_ID PAY_DATE DATE_ATTEND
Shows employees whohave SALINFO data orATTNDSEG data or no childdata at all.
Same as SIMPLE.
Selections Based on Individual Values
224

Request MULTIPATH=SIMPLE MULTIPATH=COMPOUND
SET ALL = OFFPRINT EMP_ID PAY_DATE DATE_ATTENDWHERE PAY_DATE EQ 980115
Shows employees whohave either SALINFO datafor 980115 or anyATTNDSEG data.
Produces (FOC144)message.
Shows employees who have bothSALINFO data for 980115 andATTNDSEG data.
SET ALL = ONPRINT EMP_ID PAY_DATE DATE_ATTENDWHERE PAY_DATE EQ 980115
Shows employees whohave either SALINFO datafor 980115 or anyATTNDSEG data.
Produces (FOC144)message.
Shows employees who haveSALINFO data for 980115. AnyDATE_ATTEND data is alsoshown.
SET ALL = OFF PRINT ALL.EMP_ID DATE_ATTENDWHERE PAY_DATE EQ 980115
Shows employees whohave either SALINFO datafor 980115 or anyATTNDSEG data.
Produces (FOC144)message.
Shows employees who haveSALINFO data for 980115. AnyDATE_ATTEND data is alsoshown.
SET ALL = ON or OFFPRINT EMP_ID PAY_DATE DATE_ATTENDWHERE PAY_DATE EQ 980115 AND COURSE_CODE EQ '103'
Shows employees whohave either SALINFO datafor 980115 or COURSE103.
Note: SIMPLE treats ANDin the WHERE clause asOR.
Produces (FOC144)message.
Shows employees who have bothSALINFO data for 980115 andCOURSE 103.
Note: SET ALL = PASS is not supported with MULTIPATH = COMPOUND.
For related information about the ALL parameter, see Handling Records With Missing FieldValues on page 1037.
4. Selecting Records for Your Report
Creating Reports With TIBCO® WebFOCUS Language 225

Reference: Rules for Determining If a Segment Is Required
The segment rule is applied level by level, descending through the data source/view hierarchy.That is, a parent segment existence depends on the child segment existence, and the childsegment depends on the grandchild existence, and so on, for the full data source tree.
The following rules are used to determine if a segment is required or optional:
When SET ALL is ON or OFF, a segment with WHERE or IF criteria is required for its parent,and all segments up to the root segment are required for their parents.
When SET ALL = PASS, a segment with WHERE or IF criteria is optional.
IF SET ALL = ON or PASS, all referenced segments with no WHERE or IF criteria are optionalfor their parents (outer join).
IF SET ALL = OFF, all referenced segments are required (inner join).
A referenced segment can become optional if its parent segment uses the ALL. field prefixoperator.
Note: ALL = PASS is not supported for all data adapters and, if it is supported, it may behaveslightly differently. Check your specific data adapter documentation for detailed information.
For related information about the ALL parameter, see Handling Records With Missing FieldValues on page 1037, and the Describing Data With TIBCO WebFOCUS® Language manual.
Selection Based on Aggregate Values
You can select records based on the aggregate value of a field. For example, on the sum offield values, or on the average of field values, by using the WHERE TOTAL phrase. WHERETOTAL is very helpful when you employ the aggregate display commands SUM and COUNT, andis required for fields with a prefix operator, such as AVE. and PCT.
In WHERE tests, data is evaluated before it is retrieved. In WHERE TOTAL tests, however, datais selected after all the data has been retrieved and processed. For an example, see UsingWHERE TOTAL for Record Selection on page 227.
Syntax: How to Select Records With WHERE TOTAL
WHERE TOTAL criteria[;]
where:
criteriaAre the criteria for selecting records to include in the report. The criteria must bedefined in a valid expression that evaluates as true or false (that is, a Boolean
Selection Based on Aggregate Values
226

expression). Expressions are described in detail in Using Expressions on page 429.Operators that can be used in WHERE expressions (such as, IS and GT) are describedin Operators Supported for WHERE and IF Tests on page 236.
;
Is an optional semicolon that can be used to enhance the readability of the request. Itdoes not affect the report.
Reference: Usage Notes for WHERE TOTAL
Any reference to a calculated value, or use of a feature that aggregates values, such asTOT.field, AVE.field, requires the use of WHERE TOTAL.
Fields with prefix operators require the use of WHERE TOTAL.
WHERE TOTAL tests are performed at the lowest sort level.
Alphanumeric and date literals must be enclosed in single quotation marks. Date-timeliterals must be in the form DT (date-time literal).
When you use ACROSS with WHERE TOTAL, data that does not satisfy the selection criteriais represented in the report with the NODATA character.
If you save the output from your report request in a HOLD file, the WHERE TOTAL testcreates a field called WH$$$T1, which contains its internal computations. If there is morethan one WHERE TOTAL test, each TOTAL test creates a corresponding WH$$$T field andthe fields are numbered consecutively.
Example: Using WHERE TOTAL for Record Selection
The following example sums current salaries by department.
TABLE FILE EMPLOYEESUM CURR_SALBY DEPARTMENTEND
The output is:
DEPARTMENT CURR_SAL---------- --------MIS $108,002.00PRODUCTION $114,282.00
4. Selecting Records for Your Report
Creating Reports With TIBCO® WebFOCUS Language 227
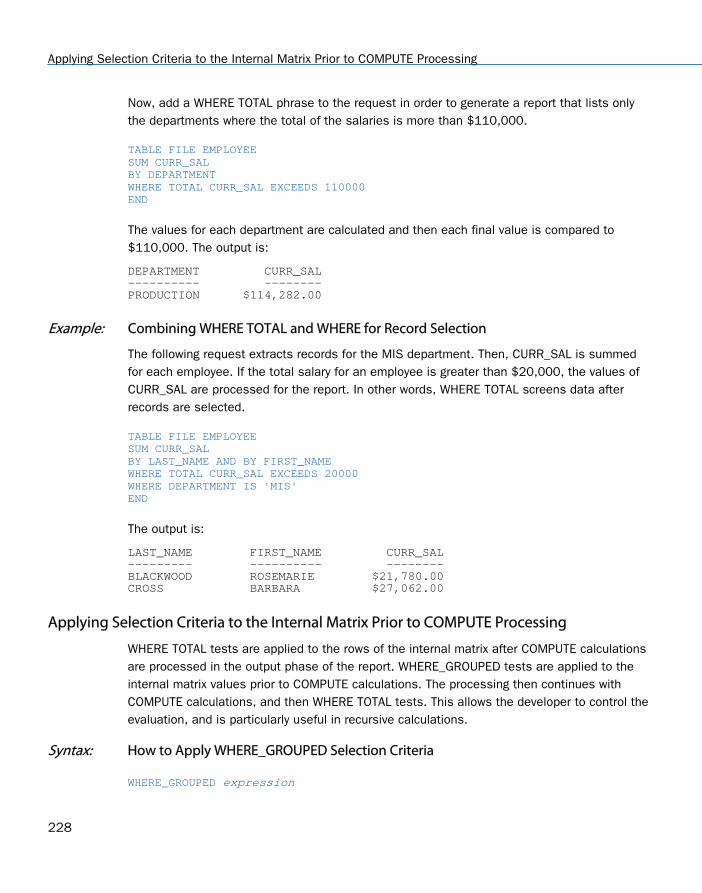
Now, add a WHERE TOTAL phrase to the request in order to generate a report that lists onlythe departments where the total of the salaries is more than $110,000.
TABLE FILE EMPLOYEESUM CURR_SALBY DEPARTMENTWHERE TOTAL CURR_SAL EXCEEDS 110000END
The values for each department are calculated and then each final value is compared to$110,000. The output is:
DEPARTMENT CURR_SAL---------- --------PRODUCTION $114,282.00
Example: Combining WHERE TOTAL and WHERE for Record Selection
The following request extracts records for the MIS department. Then, CURR_SAL is summedfor each employee. If the total salary for an employee is greater than $20,000, the values ofCURR_SAL are processed for the report. In other words, WHERE TOTAL screens data afterrecords are selected.
TABLE FILE EMPLOYEESUM CURR_SALBY LAST_NAME AND BY FIRST_NAMEWHERE TOTAL CURR_SAL EXCEEDS 20000WHERE DEPARTMENT IS 'MIS'END
The output is:
LAST_NAME FIRST_NAME CURR_SAL--------- ---------- --------BLACKWOOD ROSEMARIE $21,780.00CROSS BARBARA $27,062.00
Applying Selection Criteria to the Internal Matrix Prior to COMPUTE Processing
WHERE TOTAL tests are applied to the rows of the internal matrix after COMPUTE calculationsare processed in the output phase of the report. WHERE_GROUPED tests are applied to theinternal matrix values prior to COMPUTE calculations. The processing then continues withCOMPUTE calculations, and then WHERE TOTAL tests. This allows the developer to control theevaluation, and is particularly useful in recursive calculations.
Syntax: How to Apply WHERE_GROUPED Selection Criteria
WHERE_GROUPED expression
Applying Selection Criteria to the Internal Matrix Prior to COMPUTE Processing
228
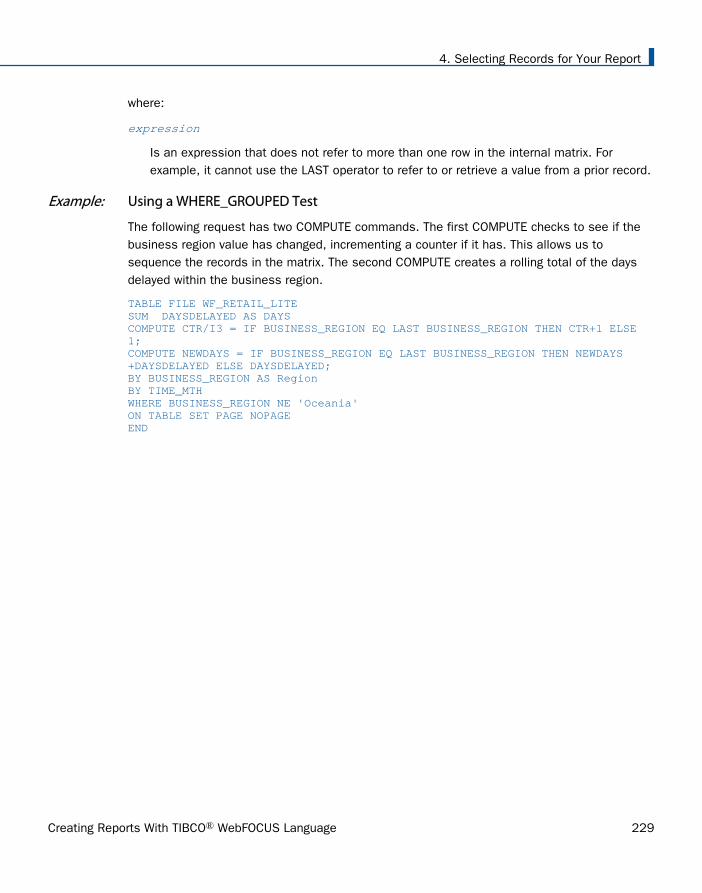
where:
expression
Is an expression that does not refer to more than one row in the internal matrix. Forexample, it cannot use the LAST operator to refer to or retrieve a value from a prior record.
Example: Using a WHERE_GROUPED Test
The following request has two COMPUTE commands. The first COMPUTE checks to see if thebusiness region value has changed, incrementing a counter if it has. This allows us tosequence the records in the matrix. The second COMPUTE creates a rolling total of the daysdelayed within the business region.
TABLE FILE WF_RETAIL_LITESUM DAYSDELAYED AS DAYSCOMPUTE CTR/I3 = IF BUSINESS_REGION EQ LAST BUSINESS_REGION THEN CTR+1 ELSE 1;COMPUTE NEWDAYS = IF BUSINESS_REGION EQ LAST BUSINESS_REGION THEN NEWDAYS+DAYSDELAYED ELSE DAYSDELAYED;BY BUSINESS_REGION AS RegionBY TIME_MTHWHERE BUSINESS_REGION NE 'Oceania'ON TABLE SET PAGE NOPAGEEND
4. Selecting Records for Your Report
Creating Reports With TIBCO® WebFOCUS Language 229

The output is shown in the following image.
Applying Selection Criteria to the Internal Matrix Prior to COMPUTE Processing
230

The following version of the request adds a WHERE TOTAL test to select only those monthswhere DAYSDELAYED exceeded 200 days.
TABLE FILE WF_RETAIL_LITESUM DAYSDELAYED AS DAYSCOMPUTE CTR/I3 = IF BUSINESS_REGION EQ LAST BUSINESS_REGION THEN CTR+1 ELSE 1;COMPUTE NEWDAYS= IF BUSINESS_REGION EQ LAST BUSINESS_REGION THEN NEWDAYS+DAYSDELAYED ELSE DAYSDELAYED;BY BUSINESS_REGION AS RegionBY TIME_MTHWHERE BUSINESS_REGION NE 'Oceania'WHERE TOTAL DAYSDELAYED GT 200ON TABLE SET PAGE NOPAGEEND
4. Selecting Records for Your Report
Creating Reports With TIBCO® WebFOCUS Language 231
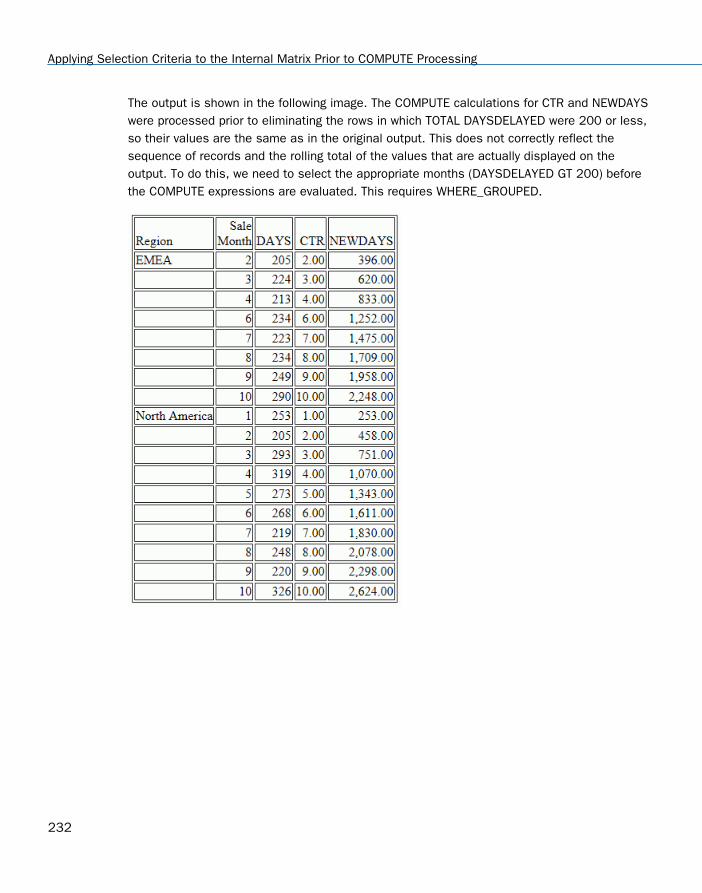
The output is shown in the following image. The COMPUTE calculations for CTR and NEWDAYSwere processed prior to eliminating the rows in which TOTAL DAYSDELAYED were 200 or less,so their values are the same as in the original output. This does not correctly reflect thesequence of records and the rolling total of the values that are actually displayed on theoutput. To do this, we need to select the appropriate months (DAYSDELAYED GT 200) beforethe COMPUTE expressions are evaluated. This requires WHERE_GROUPED.
Applying Selection Criteria to the Internal Matrix Prior to COMPUTE Processing
232

The following version of the request replaces the WHERE TOTAL test with a WHERE_GROUPEDtest.
TABLE FILE WF_RETAIL_LITESUM DAYSDELAYED AS DAYSCOMPUTE CTR/I3 = IF BUSINESS_REGION EQ LAST BUSINESS_REGION THEN CTR+1 ELSE 1;COMPUTE NEWDAYS= IF BUSINESS_REGION EQ LAST BUSINESS_REGION THEN NEWDAYS+DAYSDELAYED ELSE DAYSDELAYED;BY BUSINESS_REGION AS RegionBY TIME_MTHWHERE BUSINESS_REGION NE 'Oceania'WHERE_GROUPED DAYSDELAYED GT 200ON TABLE SET PAGE NOPAGEEND
4. Selecting Records for Your Report
Creating Reports With TIBCO® WebFOCUS Language 233

The output is shown in the following image. The COMPUTE calculation for NEWDAYS wasprocessed after eliminating the rows in which TOTAL DAYSDELAYED were 200 or less, so itsvalues are based on fewer rows than the calculations in the original request. This is verified bythe CTR values, which are now in a continuous sequence. The rolling total now reflects thevalues that are actually displayed on the report output.
Reference: Usage Notes for WHERE_GROUPED
If the expression refers to multiple rows in the internal matrix, the following message isgenerated and processing stops.
(FOC32692) WHERE_GROUPED CANNOT REFER TO OTHER LINES OF REPORT
A COMPUTE that does not reference multiple lines will be evaluated prior toWHERE_GROUPED tests, and may, therefore, be used in an expression and evaluated aspart of a WHERE_GROUPED test.
Applying Selection Criteria to the Internal Matrix Prior to COMPUTE Processing
234
WHERE_GROUPED can be optimized for SQL data sources by creating a GROUP BYfieldname HAVING expression clause, where the expression is the WHERE_GROUPEDselection criteria.
Using Compound Expressions for Record Selection
You can combine two or more simple WHERE expressions, connected by AND and/or ORoperators, to create a compound expression.
By default, when multiple WHERE phrases are evaluated, logical ANDs are processed beforelogical ORs. In compound expressions, you can use parentheses to change the order ofevaluation. All AND and OR operators enclosed in parentheses are evaluated first, followed byAND and OR operators outside of parentheses.
You should always use parentheses in complex expressions to ensure that the expression isevaluated correctly. For example:
WHERE (SEATS EQ 2) AND (SEATS NOT-FROM 3 TO 4)
This is especially useful when mixing literal OR tests with logical AND and OR tests:
In a logical AND or OR test, all field names, test relations, and test values are explicitlyreferenced and connected by the words OR or AND. For example:
WHERE (LAST_NAME EQ 'CROSS') OR (LAST_NAME EQ 'JONES')
or
WHERE (CURR_SAL GT 20000) AND (DEPARTMENT IS 'MIS') AND (CURR_JOBCODE CONTAINS 'A')
In a literal OR test, the word OR is repeated between test values of a field name, but thefield name itself and the connecting relational operator are not repeated. For example:
WHERE (LAST_NAME EQ 'CROSS' OR 'JONES')
Example: Mixing AND and OR Record Selection Tests
This example illustrates the impact of parentheses on the evaluation of literal ORs and logicalANDs.
In this request, each expression enclosed in parentheses is evaluated first in the order inwhich it appears. Notice that the first expression contains a literal OR. The result of eachexpression is then evaluated using the logical AND.
4. Selecting Records for Your Report
Creating Reports With TIBCO® WebFOCUS Language 235

If parentheses are excluded, the logical AND is evaluated before the literal OR.
TABLE FILE EMPLOYEEPRINT CURR_SAL BY LAST_NAMEWHERE (LAST_NAME EQ 'CROSS' OR 'JONES')AND (CURR_SAL GT 22000)END
The output is:
LAST_NAME CURR_SAL--------- --------CROSS $27,062.00
Using Operators in Record Selection Tests
You can include a variety of operators in your WHERE and IF selection tests. Many of theoperators are common for WHERE and IF. However, several are supported only for WHEREtests.
Reference: Operators Supported for WHERE and IF Tests
You can define WHERE and IF selection criteria using the following operators.
WHERE Operator IF Operator Meaning
EQIS
EQIS
Tests for and selects values equal tothe test expression.
NEIS-NOT
NEIS-NOT
Tests for and selects values notequal to the test expression.
GE GEFROMIS-FROM
Tests for and selects values greaterthan or equal to the test value(based on the characters 0 to 9 fornumeric values, A to Z and a to z foralphanumeric values).
The test value can be a field value orthe result of an expression.
GT EXCEEDS IS-MORE-THAN
GT EXCEEDS IS-MORE-THAN
Tests for and selects values greaterthan the test value.
LT IS-LESS-THAN
LT IS-LESS-THAN
Tests for and selects values lessthan the test value.
Using Operators in Record Selection Tests
236

WHERE Operator IF Operator Meaning
LE LE TO
Tests for and selects values lessthan or equal to the test value.
GE lower AND ... LE upper
Tests for and selects values within arange of values.
LT lower OR ... GT upper
Tests for and selects values outsideof a range of values.
FROM lower TO upper
Tests for and selects values within arange of values.
IS-FROM lower TO upper
IS-FROM lower TO upper
Tests for and selects values within arange of values. For WHERE, this isalternate syntax for FROM lower toUPPER. Both operators produceidentical results.
NOT-FROM lower TO upper
NOT-FROM lower TO upper
Tests for and selects values that areoutside a range of values.
IS MISSING IS-NOT MISSING NE MISSING
IS MISSING IS-NOT MISSING NE MISSING
Tests whether a field containsmissing values. If some instances ofthe field contain no data, they havemissing data. For information onmissing data, see Handling RecordsWith Missing Field Values on page1037.
CONTAINS LIKE
CONTAINS LIKE
Tests for and selects values thatinclude a character string matchingtest value. The string can occur inany position in the value beingtested. When used with WHERE,CONTAINS can test alphanumericfields. When used with IF, it can testboth alphanumeric and text fields.
4. Selecting Records for Your Report
Creating Reports With TIBCO® WebFOCUS Language 237

WHERE Operator IF Operator Meaning
OMITS NOT LIKE
OMITS UNLIKE
Tests for and selects values that donot include a character stringmatching test value. The stringcannot occur in any position in thevalue being tested. When used withWHERE, OMITS can testalphanumeric fields. When used withIF, it can test both alphanumeric andtext fields.
INCLUDES INCLUDES Tests whether a chain of values of agiven field in a child segmentincludes all of a list of literals.
EXCLUDES EXCLUDES Tests whether a chain of values of agiven field in a child segmentexcludes all of a list of literals.
IN (z,x,y) Selects records based on valuesfound in an unordered list.
NOT ... IN (z,x,y)
Selects records based on values notfound in an unordered list.
IN FILE Selects records based on valuesstored in a sequential file.
NOT ... IN FILE Selects records with field values notfound in a sequential file.
IF-THEN-ELSE Selects records based on the logicalconditions listed in the IF-THEN-ELSEphrase.
Using Operators in Record Selection Tests
238
Example: Using Operators to Compare a Field to One or More Values
The following examples illustrate field selection criteria that use one or more values. You mayuse the operators: EQ, IS, IS-NOT, EXCEEDS, IS-LESS-THAN, and IN.
Example 1: The field LAST_NAME must equal the value JONES:
WHERE LAST_NAME EQ 'JONES'
Example 2: The field LAST_NAME begins with 'CR' or 'MC:'
WHERE EDIT (LAST_NAME, '99') EQ 'CR' OR 'MC'
Example 3: The field AREA must not equal the value EAST or WEST:
WHERE AREA IS-NOT 'EAST' OR 'WEST'
Example 4: The value of the field AREA must equal the value of the field REGION:
WHERE AREA EQ REGION
Note that you cannot compare one field to another in an IF test.
Example 5: The ratio between retail cost and dealer cost must be greater than 1.25:
WHERE RETAIL_COST/DEALER_COST GT 1.25
Example 6: The field UNITS must be equal to or less than the value 50, and AREA must not beequal to either NORTH EAST or WEST. Note the use of single quotation marks around NORTHEAST. All alphanumeric strings must be enclosed within single quotation marks.
WHERE UNITS LE 50 WHERE AREA IS-NOT 'NORTH EAST' OR 'WEST'
Example 7: The value of AMOUNT must be greater than 40:
WHERE AMOUNT EXCEEDS 40
Example 8: The value of AMOUNT must be less than 50:
WHERE AMOUNT IS-LESS-THAN 50
Example 9: The value of SALES must be equal to one of the numeric values in the unorderedlist. Use commas or blanks to separate the list values.
WHERE SALES IN (43000,12000,13000)
4. Selecting Records for Your Report
Creating Reports With TIBCO® WebFOCUS Language 239

Example 10: The value of CAR must be equal to one of the alphanumeric values in theunordered list. Single quotation marks must enclose alphanumeric list values.
WHERE CAR IN ('JENSEN','JAGUAR')
Example: Using IF-THEN-ELSE Logic in a WHERE Clause
The following request uses IF-THEN-ELSE logic in a WHERE clause to select records based onvalues of WHOLESALEPR where the values used for selection vary depending on the value ofLISTPR in that record.
TABLE FILE MOVIESPRINT COPIESLISTPRWHOLESALEPRBY CATEGORYWHERE WHOLESALEPR GT (IF LISTPR GT 20.00 THEN 15.00 ELSE 11.00)ON TABLE SET PAGE NOLEADON TABLE SET STYLE *GRID=OFF,$ENDSTYLEEND
Using Operators in Record Selection Tests
240
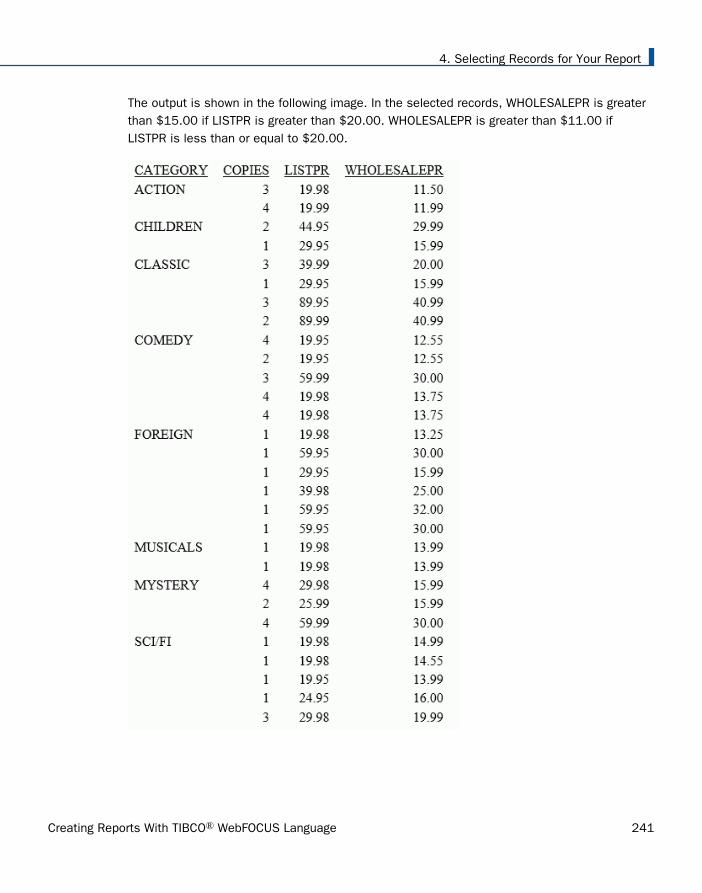
The output is shown in the following image. In the selected records, WHOLESALEPR is greaterthan $15.00 if LISTPR is greater than $20.00. WHOLESALEPR is greater than $11.00 ifLISTPR is less than or equal to $20.00.
4. Selecting Records for Your Report
Creating Reports With TIBCO® WebFOCUS Language 241

Example: Using Variables in Record Selection Tests
In this example, the field REGION is used in the WHERE test as a variable so that when thereport is executed, the user is prompted to select one of the listed values (CE, CORP, NE, SEor WE) of the REGION field. The text that appears after the values is what appears before thedrop-down list in the output.
TABLE FILE EMPDATASUM SALARYBY DIVBY DEPTHEADING"Current Salary Report""for the ®ION Division"" "WHERE ( DIV EQ'®ION.(CE,CORP,NE,SE,WE).Please select a Region.');END
The output is:
Select a region from the drop-down list and click Submit. The output for the NE region is:
Using Operators in Record Selection Tests
242

Types of Record Selection Tests
You can select records for your reports using a variety of tests that are implemented using theoperators described in Operators Supported for WHERE and IF Tests on page 236. You can testfor:
Values that lie within or outside of a range. See Range Tests With FROM and TO on page243 and Range Tests With GE and LE or GT and LT on page 245.
Missing or existing data. See Missing Data Tests on page 246.
The existence or absence of a character string. See Character String Screening WithCONTAINS and OMITS on page 247.
Partially defined character strings in a data field. See Screening on Masked Fields on page248.
Literals in a parent segment. See Qualifying Parent Segments Using INCLUDES andEXCLUDES on page 256.
Range Tests With FROM and TO
Use the operators FROM ... TO and NOT-FROM ... TO in order to determine whether field valuesfall within or outside of a given range. You can use either values or expressions to specify thelower and upper boundaries. Range tests can also be applied on the sort control fields. Therange test is specified immediately after the sort phrase.
You can also test whether an expression falls within or outside the boundaries.
Syntax: How to Specify a Range Test (FROM and TO)
WHERE [TOTAL] {fieldname|expression} {FROM|IS-FROM} lower TO upper WHERE [TOTAL] fieldname NOT-FROM lower TO upper
where:
fieldnameIs any valid field name or alias.
expressionIs any valid expression.
lowerAre numeric or alphanumeric values or expressions that indicate lower boundaries.You may add parentheses around expressions for readability.
4. Selecting Records for Your Report
Creating Reports With TIBCO® WebFOCUS Language 243

upperAre numeric or alphanumeric values or expressions that indicate upper boundaries.You may add parentheses around expressions for readability.
Example: Range Test With FROM ... TO
An example of a range test using expressions as boundaries follows:
WHERE SALES FROM (DEALER_COST * 1.4) TO (DEALER_COST * 2.0)
The following is an example of a range test using expressions as the comparison value and theboundaries:
WHERE SALES * 1.5 FROM (DEALER_COST * 1.4) TO (DEALER_COST * 2.0)
Example: Range Test With NOT-FROM ... TO
The following illustrates how you can use the range test NOT-FROM ... TO to display only thoserecords that fall outside of the specified range. In this example, it is all employees whosesalaries do not fall in the range between $12,000 and $22,000.
TABLE FILE EMPLOYEEPRINT CURR_SALBY LAST_NAMEWHERE CURR_SAL NOT-FROM 12000 TO 22000END
The output is:
LAST_NAME CURR_SAL--------- --------BANNING $29,700.00CROSS $27,062.00GREENSPAN $9,000.00IRVING $26,862.00SMITH $9,500.00STEVENS $11,000.00
Example: Range Tests on Sort Fields With FROM ... TO
The following examples demonstrate how to perform range tests when sorting a field using theBY or ACROSS sort phrases:
BY MONTH FROM 4 TO 8
or
ACROSS MONTH FROM 6 TO 10
Types of Record Selection Tests
244
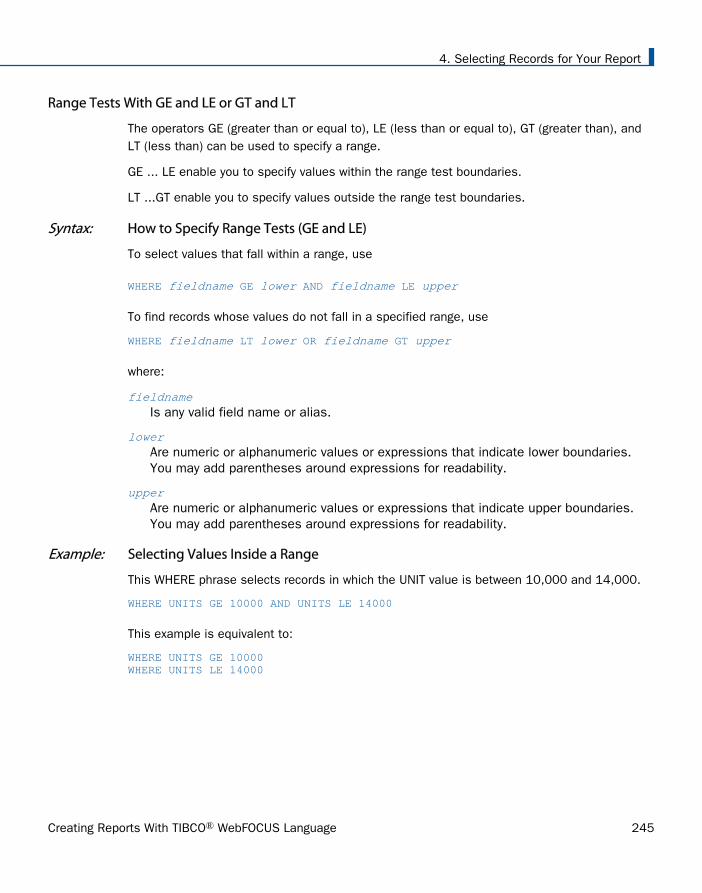
Range Tests With GE and LE or GT and LT
The operators GE (greater than or equal to), LE (less than or equal to), GT (greater than), andLT (less than) can be used to specify a range.
GE ... LE enable you to specify values within the range test boundaries.
LT ...GT enable you to specify values outside the range test boundaries.
Syntax: How to Specify Range Tests (GE and LE)
To select values that fall within a range, use
WHERE fieldname GE lower AND fieldname LE upper
To find records whose values do not fall in a specified range, use
WHERE fieldname LT lower OR fieldname GT upper
where:
fieldnameIs any valid field name or alias.
lowerAre numeric or alphanumeric values or expressions that indicate lower boundaries.You may add parentheses around expressions for readability.
upperAre numeric or alphanumeric values or expressions that indicate upper boundaries.You may add parentheses around expressions for readability.
Example: Selecting Values Inside a Range
This WHERE phrase selects records in which the UNIT value is between 10,000 and 14,000.
WHERE UNITS GE 10000 AND UNITS LE 14000
This example is equivalent to:
WHERE UNITS GE 10000WHERE UNITS LE 14000
4. Selecting Records for Your Report
Creating Reports With TIBCO® WebFOCUS Language 245

Example: Selecting Values Outside a Range
The following illustrates how you can select values that are outside a range of values using theLT and GT operators. In this example, only those employees whose salaries are less than$12,000 and greater than $22,000 are included in the output.
TABLE FILE EMPLOYEEPRINT CURR_SALBY LAST_NAMEWHERE CURR_SAL LT 12000 OR CURR_SAL GT 22000END
The output is:
LAST_NAME CURR_SAL--------- --------BANNING $29,700.00CROSS $27,062.00GREENSPAN $9,000.00IRVING $26,862.00SMITH $9,500.00STEVENS $11,000.00
Missing Data Tests
When creating report requests, you may want to test for missing data. This type of test is mostuseful when fields that have missing data also have the MISSING attribute set to ON in theMaster File. For information on missing data, see Handling Records With Missing Field Valueson page 1037, and the Describing Data With TIBCO WebFOCUS® Language manual.
Note: If a test value to screen on an alphanumeric field is a variable and you want to look formissing instances, you must use _FOC_MISSING, instead of MISSING, as an alphanumericliteral value in a test must be in single quotation marks, and 'MISSING' is the literal valueMISSING, not the MISSING value. The value _FOC_MISSING represents the MISSING valuewhether it is in single quotation marks or not.
Syntax: How to Test for Missing Data
{WHERE|IF} fieldname {EQ|IS} MISSING
where:
fieldnameIs any valid field name or alias.
EQ|IS
Are record selection operators. EQ and IS are synonyms.
Types of Record Selection Tests
246

Syntax: How to Test for Existing Data
{WHERE|IF} fieldname {NE|IS-NOT} MISSING
where:
fieldnameIs any valid field name or alias.
NE|IS-NOT
Are record selection operators. NE and IS-NOT are synonyms.
Character String Screening With CONTAINS and OMITS
The CONTAINS and OMITS operators test alphanumeric fields when used with WHERE, andboth alphanumeric and text fields when used with IF. With CONTAINS, if the characters in thegiven literal or literals appear anywhere within the characters of the field value, the test ispassed.
OMITS is the opposite of CONTAINS; if the characters of the given literal or literals appearanywhere within the characters of the field's value, the test fails.
CONTAINS and OMITS tests are useful when you do not know the exact spelling of a value. Aslong as you know that a specific string appears within the value, you can retrieve the desireddata.
Example: Selecting Records With CONTAINS and OMITS
The following examples illustrate several ways to use the CONTAINS and OMITS operators. Thefield name that is being tested must appear on the left side of the CONTAINS or OMITSoperator.
In this example, the characters JOHN are contained in JOHNSON, and are selected by thefollowing phrase:
WHERE LAST_NAME CONTAINS 'JOHN'
The LAST_NAME field may contain the characters JOHN anywhere in the field.
In this example, any last name without the string JOHN is selected:
WHERE LAST_NAME OMITS 'JOHN'
In this example, all names that contain the letters ING are retrieved.
TABLE FILE EMPLOYEELIST LAST_NAME AND FIRST_NAMEWHERE LAST_NAME CONTAINS 'ING'END
4. Selecting Records for Your Report
Creating Reports With TIBCO® WebFOCUS Language 247
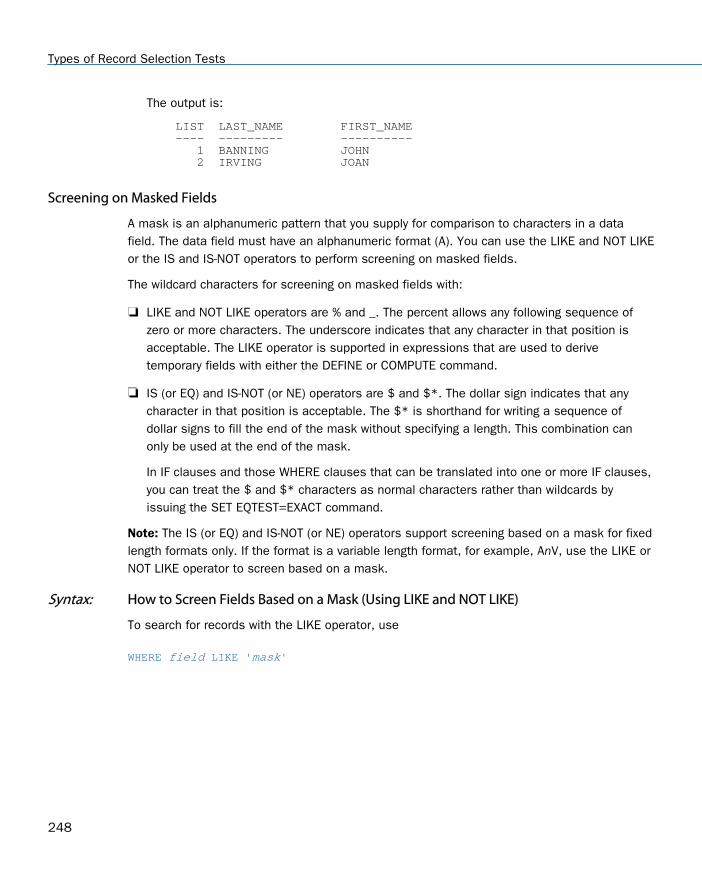
The output is:
LIST LAST_NAME FIRST_NAME ---- --------- ---------- 1 BANNING JOHN 2 IRVING JOAN
Screening on Masked Fields
A mask is an alphanumeric pattern that you supply for comparison to characters in a datafield. The data field must have an alphanumeric format (A). You can use the LIKE and NOT LIKEor the IS and IS-NOT operators to perform screening on masked fields.
The wildcard characters for screening on masked fields with:
LIKE and NOT LIKE operators are % and _. The percent allows any following sequence ofzero or more characters. The underscore indicates that any character in that position isacceptable. The LIKE operator is supported in expressions that are used to derivetemporary fields with either the DEFINE or COMPUTE command.
IS (or EQ) and IS-NOT (or NE) operators are $ and $*. The dollar sign indicates that anycharacter in that position is acceptable. The $* is shorthand for writing a sequence ofdollar signs to fill the end of the mask without specifying a length. This combination canonly be used at the end of the mask.
In IF clauses and those WHERE clauses that can be translated into one or more IF clauses,you can treat the $ and $* characters as normal characters rather than wildcards byissuing the SET EQTEST=EXACT command.
Note: The IS (or EQ) and IS-NOT (or NE) operators support screening based on a mask for fixedlength formats only. If the format is a variable length format, for example, AnV, use the LIKE orNOT LIKE operator to screen based on a mask.
Syntax: How to Screen Fields Based on a Mask (Using LIKE and NOT LIKE)
To search for records with the LIKE operator, use
WHERE field LIKE 'mask'
Types of Record Selection Tests
248

To reject records based on the mask value, use either
WHERE field NOT LIKE 'mask'
or
WHERE NOT field LIKE 'mask'
where:
fieldIs any valid field name or alias.
maskIs an alphanumeric or text character string you supply. There are two wildcardcharacters that you can use in the mask. The underscore (_) indicates that anycharacter in that position is acceptable, and the percent sign (%) allows any followingsequence of zero or more characters.
For related information, see Restrictions on Masking Characters on page 250.
Syntax: How to Screen Using LIKE and UNLIKE in an IF Phrase
To search for records with the LIKE operator, use
IF field LIKE 'mask1' [OR 'mask2'...]
To reject records based on the mask value, use
IF field UNLIKE 'mask1' [OR 'mask2' ...]
where:
fieldIs any valid field name or alias.
mask1, mask2Are the alphanumeric patterns you want to use for comparison. The single quotationmarks are required if the mask contains blanks. There are two wildcard charactersthat you can use in a mask. The underscore (_) indicates that any character in thatposition is acceptable, and the percent sign (%) allows any following sequence of zeroor more characters. Every other character in the mask accepts only itself in thatposition as a match to the pattern.
Syntax: How to Screen Fields Based on a Mask (Using IS and IS-NOT)
To search for records with the IS operator, use
{WHERE|IF} field {IS|EQ} 'mask'
4. Selecting Records for Your Report
Creating Reports With TIBCO® WebFOCUS Language 249
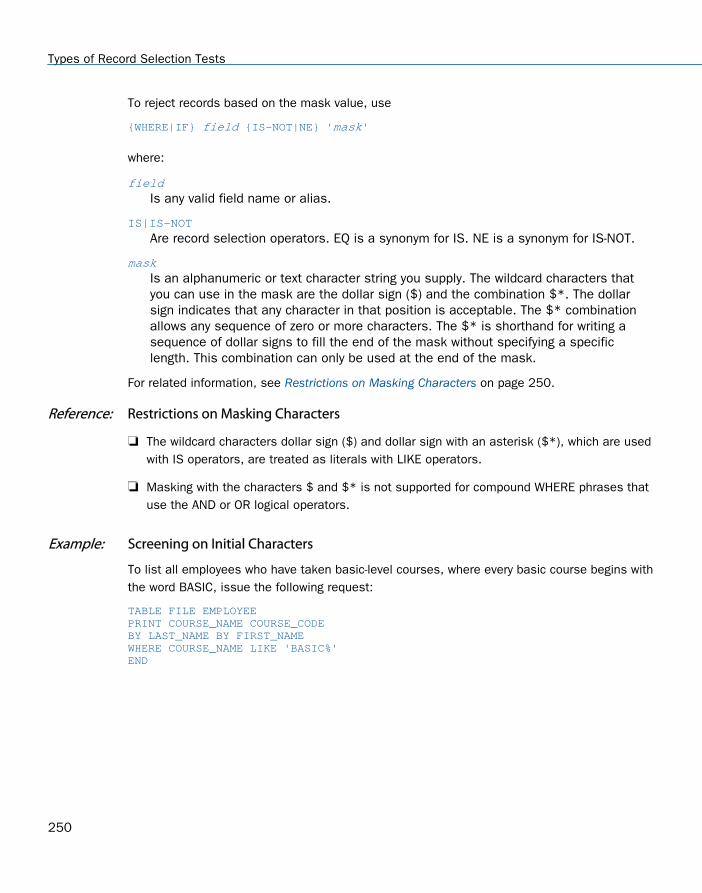
To reject records based on the mask value, use
{WHERE|IF} field {IS-NOT|NE} 'mask'
where:
fieldIs any valid field name or alias.
IS|IS-NOT
Are record selection operators. EQ is a synonym for IS. NE is a synonym for IS-NOT.
maskIs an alphanumeric or text character string you supply. The wildcard characters thatyou can use in the mask are the dollar sign ($) and the combination $*. The dollarsign indicates that any character in that position is acceptable. The $* combinationallows any sequence of zero or more characters. The $* is shorthand for writing asequence of dollar signs to fill the end of the mask without specifying a specificlength. This combination can only be used at the end of the mask.
For related information, see Restrictions on Masking Characters on page 250.
Reference: Restrictions on Masking Characters
The wildcard characters dollar sign ($) and dollar sign with an asterisk ($*), which are usedwith IS operators, are treated as literals with LIKE operators.
Masking with the characters $ and $* is not supported for compound WHERE phrases thatuse the AND or OR logical operators.
Example: Screening on Initial Characters
To list all employees who have taken basic-level courses, where every basic course begins withthe word BASIC, issue the following request:
TABLE FILE EMPLOYEEPRINT COURSE_NAME COURSE_CODEBY LAST_NAME BY FIRST_NAMEWHERE COURSE_NAME LIKE 'BASIC%'END
Types of Record Selection Tests
250

The output is:
Example: Screening on Characters Anywhere in a Field
If you want to see which employees have taken a FOCUS course, but you do not know wherethe word FOCUS appears in the title, bracket the word FOCUS with wildcards (which isequivalent to using the CONTAINS operator):
TABLE FILE EMPLOYEEPRINT COURSE_NAME COURSE_CODEBY LAST_NAME BY FIRST_NAMEWHERE COURSE_NAME LIKE '%FOCUS%'END
The output is:
LAST_NAME FIRST_NAME COURSE_NAME COURSE_CODE--------- ---------- ----------- -----------BLACKWOOD ROSEMARIE WHAT'S NEW IN FOCUS 202 JONES DIANE FOCUS INTERNALS 203
If you want to list all employees who have taken a 20x-series course, and you know that all ofthese courses have the same code except for the final character, issue the following request:
TABLE FILE EMPLOYEEPRINT COURSE_NAME COURSE_CODEBY LAST_NAME BY FIRST_NAMEWHERE COURSE_CODE LIKE '20_'END
The output is:
LAST_NAME FIRST_NAME COURSE_NAME COURSE_CODE--------- ---------- ----------- -----------BLACKWOOD ROSEMARIE WHAT'S NEW IN FOCUS 202 JONES DIANE FOCUS INTERNALS 203 ADVANCED TECHNIQUES 201
4. Selecting Records for Your Report
Creating Reports With TIBCO® WebFOCUS Language 251

Example: Screening on Initial Characters and Specific Length
The following example illustrates how to screen on initial characters and specify the length ofthe field value you are searching for. In this example, the WHERE phrase states that the lastname must begin with BAN and be seven characters in length (the three initial characters BANand the four placeholders, in this case, the dollar sign). The remaining characters in the field(positions 8 through 15) must be blank.
TABLE FILE EMPLOYEEPRINT LAST_NAMEWHERE LAST_NAME IS 'BAN$$$$'END
The output is:
LAST_NAME---------BANNING
Example: Screening on Records of Unspecified Length
To retrieve records with unspecified lengths, use the dollar sign followed by an asterisk ($*):
WHERE LAST_NAME IS 'BAN$*'
This phrase searches for last names that start with the letters BAN, regardless of the namelength. The characters $* reduce typing, and enable you to define a screen mask withoutknowing the exact length of the field you wish to retrieve.
Syntax: How to Deactivate Wildcard Characters
SET EQTEST = {WILDCARD|EXACT}
where:
WILDCARD
Treats the $ and $* characters as wildcard characters. WILDCARD is the defaultvalue.
EXACT
Treats the $ and $* characters as normal characters, not wildcards, in IF tests and inWHERE tests that can be translated to IF tests.
Example: Selecting Records With SET EQTEST
The following request against the VIDEOTR2 data source creates two similar email addresses:
[email protected], which has a dollar sign.
Types of Record Selection Tests
252

[email protected], which has the letter i in the same position as the $ character in theother email address.
DEFINE FILE VIDEOTR2 SMAIL/A18= IF EMAIL EQ '[email protected]' THEN '[email protected]' ELSE EMAIL; SMAIL/A18 = STRREP(18,SMAIL,1,'_',1,'$',18,SMAIL);ENDTABLE FILE VIDEOTR2 PRINT SMAIL BY LASTNAME BY FIRSTNAME WHERE SMAIL EQ '[email protected]' ON TABLE SET EQTEST WILDCARDEND
With SET EQTEST=WILDCARD (the default), the WHERE test WHERE SMAIL IS '[email protected]' returns both the record with the $ in the address and the record with theletter i in the address because the $ is treated as a wildcard character, and any character inthat position causes the record to pass the screening test:
LASTNAME FIRSTNAME SMAIL -------- --------- ----- HANDLER EVAN [email protected] [email protected]
Changing the ON TABLE SET command to ON TABLE SET EQTEST EXACT returns just the ONEemail address with the $ character because the dollar sign is now treated as a normalcharacter and only passes the test if there is an exact match:
LASTNAME FIRSTNAME SMAIL -------- --------- ----- HANDLER EVAN [email protected]
Using an Escape Character for LIKE
You can use an escape character in the LIKE syntax to treat the masking characters (% and _)as literals within the search pattern, rather than as wildcards. This technique enables you tosearch for these characters in the data. For related information, see Screening on MaskedFields on page 248.
4. Selecting Records for Your Report
Creating Reports With TIBCO® WebFOCUS Language 253

Syntax: How to Use an Escape Character in a WHERE Phrase
Any single character can be used as an escape character, if prefaced with the word ESCAPE
WHERE fieldname LIKE 'mask' ESCAPE 'c'
where:
fieldnameIs any valid field name or alias to be evaluated in the selection test.
maskIs the search pattern that you supply. The single quotation marks are required.
cIs any single character that you identify as the escape character. If you embed theescape character in the mask, before a % or _, the % or _ character is treated as aliteral, rather than as a wildcard. The single quotation marks are required.
Syntax: How to Specify an Escape Character for a Mask in an IF Phrase
You can assign any single character as an escape character by prefacing it with the wordESCAPE in the LIKE or UNLIKE syntax
IF field {LIKE|UNLIKE} 'mask1' ESCAPE 'a' [OR 'mask2' ESCAPE 'b' ...
where:
fieldIs any valid field name or alias to be evaluated in the selection test.
mask1, mask2Are search patterns that you supply. The single quotation marks are required.
a, b ...Are single characters that you identify as escape characters. Each mask can specifyits own escape character or use the same character as other masks. If you embed theescape character in the mask, before a % or _, the % or _ character is treated as aliteral, rather than as a wildcard. The single quotation marks are required if the maskcontains blanks.
Reference: Usage Notes for Escape Characters
The use of an escape character in front of any character other than %, _, and itself isignored.
The escape character itself can be escaped, thus becoming a normal character in a string(for example, 'abc\%\\').
Types of Record Selection Tests
254

Only one escape character can be used per LIKE phrase in a WHERE phrase.
The escape character is only in effect when the ESCAPE syntax is included in the LIKEphrase.
Every LIKE phrase can provide its own escape character.
If a WHERE criterion is used with literal OR phrases, the ESCAPE must be on the first ORphrase, and applies to all subsequent phrases in that WHERE expression. For example:
WHERE field LIKE 'ABCg_' ESCAPE 'g' OR 'ABCg%' OR 'g%ABC'
Example: Using the Escape Character in a WHERE Phrase
The VIDEOTR2 data source contains an email address field. To search for the email addresswith the characters 'handy_' you can issue the following request:
TABLE FILE VIDEOTR2PRINT CUSTID LASTNAME FIRSTNAME EMAILWHERE EMAIL LIKE 'handy_%'END
Because the underscore character functions as a wildcard character, this request returns twoinstances, only one of which contains the underscore character.
The output is:
CUSTID LASTNAME FIRSTNAME EMAIL ------ -------- --------- ----- 0944 HANDLER EVAN [email protected] HANDLER EVAN [email protected]
To retrieve only the instance that contains the underscore character, you must indicate thatthe underscore should be treated as a normal character, not a wildcard. The following requestretrieves only the instance with the underscore character in the email field:
TABLE FILE VIDEOTR2PRINT CUSTID LASTNAME FIRSTNAME EMAILWHERE EMAIL LIKE 'handy\_%' ESCAPE '\'END
The output is:
CUSTID LASTNAME FIRSTNAME EMAIL ------ -------- --------- ----- 0944 HANDLER EVAN [email protected]
4. Selecting Records for Your Report
Creating Reports With TIBCO® WebFOCUS Language 255

Example: Using an Escape Character in an IF Phrase
The VIDEOTR2 data source contains an email address field. To search for email addresseswith the characters 'handy_' you can issue the following request:
TABLE FILE VIDEOTR2PRINT CUSTID LASTNAME FIRSTNAME EMAIIF EMAIL LIKE 'handy_%'END
Because the underscore character functions as a wildcard character, this request returns twoinstances, only one of which contains the underscore character.
The output is:
CUSTID LASTNAME FIRSTNAME EMAIL------ -------- --------- -----0944 HANDLER EVAN [email protected] HANDLER EVAN [email protected]
To retrieve only the instance that contains the underscore character, you must indicate thatthe underscore should be treated as a normal character, not a wildcard. The following requestretrieves only the instance with the underscore character in the email field:
TABLE FILE VIDEOTR2PRINT CUSTID LASTNAME FIRSTNAME EMAIIF EMAIL LIKE 'handy\_%' ESCAPE '\'END
The output is:
CUSTID LASTNAME FIRSTNAME EMAIL------ -------- --------- -----0944 HANDLER EVAN [email protected]
Qualifying Parent Segments Using INCLUDES and EXCLUDES
You can test whether instances of a given field in a child segment include or exclude all literalsin a list using the INCLUDES and EXCLUDES operators. INCLUDES and EXCLUDES retrieve onlyparent records. You cannot print or list any field in the same segment as the field specified forthe INCLUDES or EXCLUDES test.
Note: INCLUDES and EXCLUDES work only with multi-segment FOCUS data sources.
Reference: Usage Notes for INCLUDES and EXCLUDES
Literals containing embedded blanks must be enclosed in single quotation marks.
The total number of literals must be 31 or less.
To use more than one INCLUDES or EXCLUDES phrase in a request, begin each phrase ona separate line.
Types of Record Selection Tests
256

You can connect the literals you are testing for with ANDs and ORs; however, the ORs arechanged to ANDs.
Example: Selecting Records With INCLUDES and EXCLUDES
A request that contains the phrase
WHERE JOBCODE INCLUDES A01 OR B01
returns employee records with JOBCODE instances for both A01 and B01, as if you had usedAND.
In the following example, for a record to be selected, its JOBCODE field must have values ofboth A01 and B01:
WHERE JOBCODE INCLUDES A01 AND B01
If either one is missing, the record is not selected for the report.
If the selection criterion is
WHERE JOBCODE EXCLUDES A01 AND B01
every record that does not have both values is selected for the report.
In the CAR data source, only England produces Jaguars and Jensens, and so the request
TABLE FILE CARPRINT COUNTRYWHERE CAR INCLUDES JAGUAR AND JENSENEND
generates this output:
COUNTRY-------ENGLAND
Selections Based on Group Key Values
Some data sources use group keys. A group key is a single key composed of several fields.You can use a group name to refer to group key fields.
To select records based on a group key value, you need to supply the value of each field. Thevalues must be separated by the slash character (/).
Note that a WHERE phrase that refers to a group field cannot be used in conjunction with ANDor OR. For related information, see Using Compound Expressions for Record Selection on page235.
4. Selecting Records for Your Report
Creating Reports With TIBCO® WebFOCUS Language 257
Example: Selecting Records Using Group Keys
Suppose that a data source has a group key named PRODNO, which contains three separatefields. The first is stored in alphanumeric format, the second as a packed decimal, and thethird as an integer. A screening phrase on this group might be:
WHERE PRODNO EQ 'RS/62/83'
Setting Limits on the Number of Records Read
For some reports, a limited number of records is satisfactory. When the specified number ofrecords is retrieved, record retrieval can stop. This is useful when:
You are designing a new report, and you need only a few records from the actual datasource to test your design.
The database administrator needs to limit the size of reports by placing an upper limit onretrieval from very large data sources. This limit is attached to the user password.
You know the number of records that meet the test criteria. You can specify that number sothat the search does not continue beyond the last record that meets the criteria. Forexample, suppose only ten employees use electronic transfer of funds, and you want toretrieve only those records. The record limit would be ten, and retrieval would stop whenthe tenth record is retrieved. The data source would not be searched any further.
Syntax: How to Limit the Number of Records Read
There are two ways to limit the number of records retrieved. You can use
WHERE RECORDLIMIT EQ n
where:
nIs a number greater than 0, and indicates the number of records to be retrieved. Thissyntax can be used with FOCUS and non-FOCUS data sources.
For all non-FOCUS data sources, you can also use
WHERE READLIMIT EQ n
where:
nIs a number greater than 0, and indicates the number of read operations (not records)to be performed. For details, see the appropriate data adapter manual.
Setting Limits on the Number of Records Read
258

Tip: If an attempt is made to apply the READLIMIT test to a FOCUS data source, the request isprocessed correctly, but the READLIMIT phrase is ignored.
Note: Using SET RECORDLIMIT disables AUTOINDEX.
Example: Limiting the Number of Records Read
The following request retrieves four records, generating a four-line report:
TABLE FILE EMPLOYEEPRINT LAST_NAME AND FIRST_NAME AND EMP_IDWHERE RECORDLIMIT EQ 4END
The output is:
LAST_NAME FIRST_NAME EMP_ID --------- ---------- ------ STEVENS ALFRED 071382660SMITH MARY 112847612JONES DIANE 117593129SMITH RICHARD 119265415
Selecting Records Using IF Phrases
The IF phrase selects records to be included in a report, and offers a subset of thefunctionality of WHERE. For a list of supported IF operators, see Operators Supported forWHERE and IF Tests on page 236.
Tip: Unless you specifically require IF syntax (for example, to support legacy applications), werecommend using WHERE.
Syntax: How to Select Records Using the IF Phrase
IF fieldname operator literal [OR literal]
where:
fieldnameIs the field you want to test (the test value).
operatorIs the type of selection operator you want. Valid operators are described in OperatorsSupported for WHERE and IF Tests on page 236.
literalCan be the MISSING keyword (as described in Missing Data Tests on page 246) oralphanumeric or numeric values that are in your data source, with the word ORbetween values.
4. Selecting Records for Your Report
Creating Reports With TIBCO® WebFOCUS Language 259

Note that all literals that contain blanks (for example, New York City) and all date and date-time literals must be enclosed within single quotation marks.
Note: The IF phrase alone cannot be used to create compound expressions by connectingsimple expressions with AND and OR logical operators. Compound logic requires that the IFphrase be used with the DEFINE command, as described in Using Expressions on page 429.You can accomplish this more easily with WHERE. See Using Compound Expressions for RecordSelection on page 235.
Example: Using Multiple IF Phrases
You can use as many IF phrases as necessary to define all your selection criteria, asillustrated in the following example:
TABLE FILE EMPLOYEEPRINT EMP_ID LAST_NAMEIF SALARY GT 20000IF DEPARTMENT IS MISIF LAST_NAME IS CROSS OR BANNINGEND
All of these criteria must be satisfied in order for a record to be included in a report. Theoutput is:
EMP_ID LAST_NAME------ ---------818692173 CROSS
Reading Selection Values From a File
Instead of typing literal test values in a WHERE or IF phrase, you can store them in a file andrefer to the file in the report request. You can then select records based on equality orinequality tests on values stored in the file.
This method has the following advantages:
You can save time by coding a large set of selection values once, then using these valuesas a set in as many report requests as you wish. You also ensure consistency bymaintaining the criteria in just one location.
Reading Selection Values From a File
260

If the selection values already exist in a data source, you can quickly create a file ofselection values by generating a report and saving the output in a HOLD or SAVE file. Youcan then read selection values from that file.
Values from a HOLD file (with a data description) can be in either BINARY format (thedefault) or ALPHA (simple character) format. If you use a SAVE file, it must be in ALPHAformat (the default). Using a SAVB file is only valid for alphanumeric values. For informationon HOLD and SAVE files, see Saving and Reusing Your Report Output on page 471.
Note that in z/OS, a HOLD file in BINARY format that is used for selection values must beallocated to ddname HOLD (the default). The other extract files used for this purpose canbe allocated to any ddname.
You can include entries with mixed-case and special characters.
Syntax: How to Read Selection Values From a File: WHERE field IN file
WHERE [NOT] fieldname IN FILE file
where:
fieldnameIs the name of the selection field. It can be any real or temporary field in the datasource.
file
Is the name of the file.
Two-part names (app/file) are not supported. The file name is the ddname assigned by aDYNAM or TSO ALLOCATE command for z/OS, or a FILEDEF command for otherenvironments.
For related information, see Usage Notes for Reading Values From a File on page 262.
Syntax: How to Read Selection Values From a File: WHERE field operator (file)
WHERE field1 operator1 (file1) [{OR|AND} field2 operator2 (file2) ... ]
where:
field1, field2
Are any valid field names or aliases.
operator1, operator2
Can be the EQ, IS, NE, or IS-NOT operator.
4. Selecting Records for Your Report
Creating Reports With TIBCO® WebFOCUS Language 261
file1, file1
Are the names of the files.
Two-part names (app/file) are not supported. The file name is the ddname assigned by aDYNAM or TSO ALLOCATE command for z/OS, or a FILEDEF command for otherenvironments.
Syntax: How to Read Selection Values From a File: IF
IF fieldname operator (file) [OR (file) ... ]
where:
fieldnameIs any valid field name or alias.
operatorIs the EQ, IS, NE, or IS-NOT operator (see Operators Supported for WHERE and IF Testson page 236).
file
Is the name of the file.
Two-part names (app/file) are not supported. The file name is the ddname assigned by aDYNAM or TSO ALLOCATE command for z/OS, or a FILEDEF command for otherenvironments.
Reference: Usage Notes for Reading Values From a File
In order to read selection criteria from a file, the file must comply with the following rules:
Each value in the file must be on a separate line.
For IF, more information can appear on a line, but only the first data value encountered onthe line is used.
The selection value must start in column one.
The values are assumed to be in character format, unless the file name is HOLD, andnumeric digits are converted to internal computational numbers where needed (forexample, binary integer).
The maximum number of values is 32,767.
For WHERE, alphanumeric values with embedded blanks or any mathematical operator (-, +,*, /) must be enclosed in single quotation marks.
Reading Selection Values From a File
262
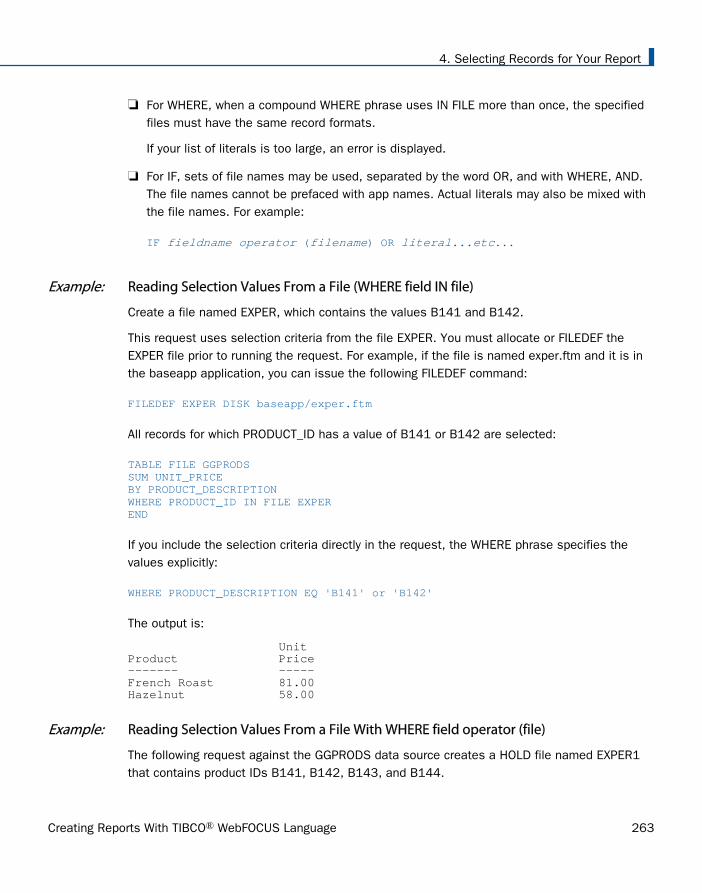
For WHERE, when a compound WHERE phrase uses IN FILE more than once, the specifiedfiles must have the same record formats.
If your list of literals is too large, an error is displayed.
For IF, sets of file names may be used, separated by the word OR, and with WHERE, AND.The file names cannot be prefaced with app names. Actual literals may also be mixed withthe file names. For example:
IF fieldname operator (filename) OR literal...etc...
Example: Reading Selection Values From a File (WHERE field IN file)
Create a file named EXPER, which contains the values B141 and B142.
This request uses selection criteria from the file EXPER. You must allocate or FILEDEF theEXPER file prior to running the request. For example, if the file is named exper.ftm and it is inthe baseapp application, you can issue the following FILEDEF command:
FILEDEF EXPER DISK baseapp/exper.ftm
All records for which PRODUCT_ID has a value of B141 or B142 are selected:
TABLE FILE GGPRODSSUM UNIT_PRICEBY PRODUCT_DESCRIPTIONWHERE PRODUCT_ID IN FILE EXPEREND
If you include the selection criteria directly in the request, the WHERE phrase specifies thevalues explicitly:
WHERE PRODUCT_DESCRIPTION EQ 'B141' or 'B142'
The output is:
Unit Product Price------- -----French Roast 81.00Hazelnut 58.00
Example: Reading Selection Values From a File With WHERE field operator (file)
The following request against the GGPRODS data source creates a HOLD file named EXPER1that contains product IDs B141, B142, B143, and B144.
4. Selecting Records for Your Report
Creating Reports With TIBCO® WebFOCUS Language 263

TABLE FILE GGPRODSBY PRODUCT_ID BY PRODUCT_DESCRIPTIONWHERE PRODUCT_ID EQ 'B141' OR 'B142' OR 'B143' OR 'B144'ON TABLE HOLD AS EXPER1 FORMAT ALPHAEND
The following request against the GGPRODS data source creates a HOLD file named EXPER2that contains product IDs B144, F101, and F102.
TABLE FILE GGPRODSBY PRODUCT_ID BY PRODUCT_DESCRIPTIONWHERE PRODUCT_ID EQ 'B144' OR 'F101' OR 'F102'ON TABLE HOLD AS EXPER2 FORMAT ALPHAEND
The following request selects the values that exist in both EXPER1 AND EXPER2.
TABLE FILE GGPRODSSUM PRODUCT_DESCRIPTIONBY PRODUCT_IDWHERE PRODUCT_ID EQ (EXPER1) AND PRODUCT_ID IS (EXPER2)ON TABLE SET PAGE NOPAGEEND
The output is:
ProductCode Product------- -------B144 Kona
Example: Reading Selection Values From a File (IF)
Create a file named EXPER, which contains the values B141 and B142.
This request uses selection criteria from the file EXPER. All records for which PRODUCT_ID hasa value of B141 or B142 are selected:
TABLE FILE GGPRODSSUM UNIT_PRICEBY PRODUCT_DESCRIPTIONIF PRODUCT_ID IS (EXPER)END
If you include the selection criteria directly in the request, the IF phrase specifies the valuesexplicitly:
IF PRODUCT_DESCRIPTION EQ 'B141' or 'B142'
Reading Selection Values From a File
264

The output is:
Unit Product Price------- -----French Roast 81.00Hazelnut 58.00
Assigning Screening Conditions to a File
You can assign screening conditions to a data source, independent of a request, and activatethese screening conditions for use in report requests against the data source.
A filter is a packet of definitions that resides at the file level, containing WHERE and/or IFcriteria. Whenever a report request is issued against a data source, all filters that have beenactivated for that data source are in effect. WHERE or IF syntax that is valid in a report requestis also valid in a filter.
A filter can be declared at any time before the report request is run. The filters are available tosubsequent requests during the session in which the filters have been run. For details, see How to Declare a Filter on page 266.
Filters allow you to:
Declare a common set of screening conditions that apply each time you retrieve data froma data source. You can declare one or more filters for a data source.
Declare a set of screening conditions and dynamically turn them on and off.
Limit access to data without specifying rules in the Master File.
In an interactive environment, filters also reduce repetitive ad hoc typing.
Note: Simply declaring a filter for a data source does not make it active. A filter must beactivated with a SET command. For details, see How to Activate or Deactivate Filters on page268.
4. Selecting Records for Your Report
Creating Reports With TIBCO® WebFOCUS Language 265

Syntax: How to Declare a Filter
A filter can be described by the following declaration
FILTER FILE filename [CLEAR|ADD] [filter-defines;] NAME=filtername1 [,DESC=text] where-if phrases . . . NAME=filternamen [,DESC=text] where-if phrases END
where:
filenameIs the name of the Master File to which the filters apply.
CLEAR
Deletes any existing filter phrases, including any previously defined virtual fields.
ADD
Enables you to add new filter phrases to an existing filter declaration without clearingpreviously defined filters.
filter-definesAre virtual fields declared for use in filters. For more information, see Usage Notes forVirtual Fields Used in Filters on page 266.
filtername1...filternamenIs the name by which the filter is referenced in subsequent SET FILTER commands.This name may be up to 66 characters long and must be unique for a particular filename.
textDescribes the filter for documentation purposes. Text must fit on one line.
where-if phrasesAre screening conditions that can include all valid syntax. They may refer to datasource fields and virtual fields in the Master File. They may not refer to virtual fieldsdeclared using a DEFINE command, or to other filter names.
Reference: Usage Notes for Virtual Fields Used in Filters
Virtual fields used in filters:
Are exclusively local to (or usable by) filters in a specific filter declaration.
Cannot be referenced in a DEFINE or TABLE command.
Assigning Screening Conditions to a File
266

Support any syntax valid for virtual fields in a DEFINE command.
Cannot reference virtual fields in a DEFINE command, but can reference virtual fields in theMaster File.
Do not count toward the display field limit, unlike virtual fields in DEFINE commands.
Must all be declared before the first named filter.
Must each end with a semi-colon.
Cannot be enclosed between the DEFINE FILE and END commands.
Cannot reuse a virtual field name for a the same file.
Example: Declaring Filters
The first example creates the filter named UK, which consists of one WHERE condition. It alsoadds a definition for the virtual field MARK_UP to the set of virtual fields already being used infilters for the CAR data source.
When a report request is issued for CAR, with UK activated, the condition WHERE MARK_UP isgreater than 1000 is automatically added to the request.
Note: The virtual field MARK_UP cannot be explicitly displayed or referenced in the TABLErequest.
FILTER FILE CAR ADDMARK_UP/D7=RCOST-DCOST;NAME=UKWHERE MARK_UP GT 1000END
The second example declares three named filters for the CAR data source: ASIA, UK, andLUXURY. The filter ASIA contains a textual description, for documentation purposes only.CLEAR, on the first line, erases any previously existing filters for CAR, as well any previouslydefined virtual fields used in filters for CAR, before it processes the new definitions.
FILTER FILE CAR CLEARNAME=ASIA,DESC=Asian cars onlyIF COUNTRY EQ JAPANNAME=UKIF COUNTRY EQ ENGLANDNAME=LUXURYIF RETAIL_COST GT 50000END
4. Selecting Records for Your Report
Creating Reports With TIBCO® WebFOCUS Language 267

Syntax: How to Activate or Deactivate Filters
Filters can be activated and deactivated with the command
SET FILTER= {*|xx[yy zz]} IN {file|*} {ON|OFF}
where:
*
Denotes all declared filters. This is the default value.
xx, yy, zzAre the names of filters as declared in the NAME = syntax of the FILTER FILEcommand.
fileIs the name of the data source to which you are assigning screening conditions. *denotes all data sources.
ON
Activates all (*) or specifically named filters for the data source or all data sources(*). The maximum number of filters you can activate for a data source is limited by thenumber of WHERE/IF phrases that the filters contain, not to exceed the limit ofWHERE/IF criteria in any single report request.
OFF
Deactivates all (*) or specifically named filters for the data source or all data sources(*). OFF is the default value.
Note: The SET FILTER command is limited to one line. To activate more filters than fit on oneline, issue additional SET FILTER commands. As long as you specify ON, the effect iscumulative.
Example: Activating and Deactivating Filters
The following commands activate A, B, C, D, E, F, and deactivate G (assuming that it was setON, previously):
SET FILTER = A B C IN CAR ONSET FILTER = D E F IN CAR ONSET FILTER = G IN CAR OFF
Assigning Screening Conditions to a File
268

The following commands activate some filters and deactivate others:
SET FILTER = UK LUXURY IN CAR ON...TABLE FILE CARPRINT COUNTRY MODEL RETAIL_COSTEND...SET FILTER = LUXURY IN CAR OFFTABLE FILE CARPRINT COUNTRY MODEL RETAIL_COSTEND
The first SET FILTER command activates the filters UK and LUXURY, assigned to the CAR datasource, and applies their screening conditions to any subsequent report request against theCAR data source.
The second SET FILTER command deactivates the filter LUXURY for the CAR data source.Unless LUXURY is reactivated, any subsequent report request against CAR will not apply theconditions in LUXURY, but will continue to apply UK.
Syntax: How to Query the Status of Filters
To determine the status of existing filters, use
? FILTER [{file|*}] [SET] [ALL]]
where:
fileIs the name of a Master File.
*
Displays filters for all Master Files for which filters have been declared.
SET
Displays only active filters.
ALL
Displays all information about the filter, including its description and the exactWHERE/IF definition.
4. Selecting Records for Your Report
Creating Reports With TIBCO® WebFOCUS Language 269

Example: Querying Filters
To query filters, issue the following command:
FILTER FILE CAR CLEARNAME=BOTH, DESC=Asian and British cars onlyIF COUNTRY EQ JAPAN AND ENGLANDENDSET FILTER =BOTH IN CAR ONTABLE FILE CARPRINT CAR RETAIL_COSTBY COUNTRYEND
The output is:
COUNTRY CAR RETAIL_COST------- --- -----------ENGLAND JAGUAR 8,878 JAGUAR 13,491 JENSEN 17,850 TRIUMPH 5,100JAPAN DATSUN 3,139 TOYOTA 3,339
The following example queries filters for all data sources:
? FILTER
If no filters are defined, the following message displays:
NO FILTERS DEFINED
If filters are defined, the following screen displays:
Set File Filter name Description--- -------- ----------- ----------------------------------- CAR ROB Rob's selections* CAR PETER Peter's selections for CAR* EMPLOYEE DAVE Dave's tests EMPLOYEE BRAD Brad's tests
To query filters for the CAR data source, issue:
? FILTER CAR
If no filters are defined for the CAR data source, the following message displays:
NO FILTERS DEFINED FOR FILE NAMED CAR
Assigning Screening Conditions to a File
270

If filters are defined for the CAR data source, the following screen displays:
Set File Filter name Description--- -------- ----------- ----------------------------------- CAR ROB Rob's selections* CAR PETER Peter's selections for CAR
To see all active filters, issue the following command:
? FILTER * SET
The output is:
Set File Filter name Description--- -------- ----------- -----------------------------------* CAR PETER Peter's selections for CAR* EMPLOYEE DAVE Dave's tests
The asterisk in the first column indicates that a filter is activated.
Preserving Filters Across Joins
By default, filters defined on the host data source are cleared by a JOIN command. However,filters can be maintained when a JOIN command is issued, by issuing the SETKEEPFILTERS=ON command.
Setting KEEPFILTERS to ON reinstates filter definitions and their individual declared statusafter a JOIN command. The set of filters and virtual fields defined prior to each join is called acontext (see your documentation on SET KEEPDEFINES and on DEFINE FILE SAVE forinformation about contexts as they relate to virtual fields). Each new JOIN or DEFINE FILEcommand creates a new context.
If a new filter is defined after a JOIN command, it cannot have the same name as anypreviously defined filter unless you issue the FILTER FILE command with the CLEAR option. TheCLEAR option clears all filter definitions for that data source in all contexts.
When a JOIN is cleared, each filter definition that was in effect prior to the JOIN command andthat was not cleared, is reinstated with its original status. Clearing a join by issuing the JOINCLEAR join_name command removes all of the contexts and filter definitions that were createdafter the JOIN join_name command was issued.
Note: When an error occurs because of a reference to field that does not exist in the originalFILTER FILE, the filter is disabled even though KEEPFILTERs is set to ON.
4. Selecting Records for Your Report
Creating Reports With TIBCO® WebFOCUS Language 271

Syntax: How to Preserve Filter Definitions With KEEPFILTERS
SET KEEPFILTERS = {OFF|ON}
where:
OFF
Does not preserve filters issued prior to a join. OFF is the default value.
ON
Preserves filters across joins.
Example: Preserving Filters With KEEPFILTERS
The first filter, UNITPR, is defined prior to issuing any joins, but after setting KEEPFILTERS toON:
SET KEEPFILTERS = ONFILTER FILE VIDEOTRKPERUNIT/F5 = TRANSTOT/QUANTITY;NAME=UNITPRWHERE PERUNIT GT 2WHERE LASTNAME LE 'CRUZ'END
The ? FILTER command shows that the filter named UNITPR was created but not activated(activation is indicated by an asterisk in the SET column of the display:
? FILTER SET FILE FILTER NAME DESCRIPTION--- -------- ----------- --------------------------------- VIDEOTRK UNITPR
Next, the filter is activated:
SET FILTER= UNITPR IN VIDEOTRK ON
The ? FILTER query shows that the filter is now activated:
? FILTER SET FILE FILTER NAME DESCRIPTION--- -------- ----------- --------------------------------- * VIDEOTRK UNITPR
The following TABLE request is issued against the filtered data source:
TABLE FILE VIDEOTRKSUM QUANTITY TRANSTOT BY LASTNAMEEND
Assigning Screening Conditions to a File
272

The output shows that the TABLE request retrieved only the data that satisfies the UNITPRfilter:
NUMBER OF RECORDS IN TABLE= 6 LINES= 3ACCESS LIMITED BY FILTERS PAUSE.. PLEASE ISSUE CARRIAGE RETURN WHEN READY LASTNAME QUANTITY TRANSTOT-------- -------- --------CHANG 3 31.00COLE 2 18.98CRUZ 2 16.00
Now, the VIDEOTRK data source is joined to the MOVIES data source. The ? FILTER queryshows that the join did not clear the UNITPR filter:
JOIN MOVIECODE IN VIDEOTRK TO ALL MOVIECODE IN MOVIES AS J1
The ? FILTER command shows that the UNITPR filter still exists and is still activated:
? FILTER SET FILE FILTER NAME DESCRIPTION--- -------- ----------- --------------------------------- * VIDEOTRK UNITPR
Next a new filter, YEARS1, is created and activated for the join between VIDEOTRK andMOVIES:
FILTER FILE VIDEOTRKYEARS/I5 = (EXPDATE - TRANSDATE)/365;NAME=YEARS1WHERE YEARS GT 1ENDSET FILTER= YEARS1 IN VIDEOTRK ON
The ? FILTER query shows that both the UNITPR and YEARS1 filters exist and are activated:
? FILTER SET FILE FILTER NAME DESCRIPTION--- -------- ----------- ---------------------------------* VIDEOTRK UNITPR* VIDEOTRK YEARS1
4. Selecting Records for Your Report
Creating Reports With TIBCO® WebFOCUS Language 273

Now, J1 is cleared. The output of the ? FILTER command shows that the YEARS1 filter thatwas created after the JOIN command was issued no longer exists. The UNITPR filter createdprior to the JOIN command still exists with its original status:
JOIN CLEAR J1? FILTER SET FILE FILTER NAME DESCRIPTION--- -------- ----------- ---------------------------------* VIDEOTRK UNITPR
VSAM Record Selection Efficiencies
The most efficient way to retrieve selected records from a VSAM KSDS data source is byapplying an IF screening test against the primary key. This results in a direct reading of thedata using the data source's index. Only those records that you request are retrieved from thefile. The alternative method of retrieval, the sequential read, forces the data adapter to retrieveall the records into storage.
Selection criteria that are based on the entire primary key, or on a subset of the primary key,cause direct reads using the index. A partial key is any contiguous part of the primary keybeginning with the first byte.
IF selection tests performed against virtual fields can take advantage of these efficiencies aswell, if the full or partial key is embedded in the virtual field.
The EQ and IS relations realize the greatest performance improvement over sequential reads.When testing on a partial key, equality logic is used to retrieve only the first segment instanceof the screening value. To retrieve subsequent instances, NEXT logic is used.
Screening relations GE, FROM, FROM-TO, GT, EXCEEDS, IS-MORE-THAN, and NOT-FROM-TO allobtain some benefit from direct reads. The following example uses the index to find the recordcontaining primary key value 66:
IF keyfield GE 66
It then continues to retrieve records by sequential processing, because VSAM stores records inascending key sequence. The direct read is not attempted when the IF screening conditionsNE, IS-NOT, CONTAINS, OMITS, LT, IS-LESS-THAN, LE, and NOT-FROM are used in the reportrequest.
Reporting From Files With Alternate Indexes
Similar performance improvement is available for ESDS and KSDS files that use alternateindexes. An alternate index provides access to records in a key sequenced data set based ona key other than the primary key.
VSAM Record Selection Efficiencies
274

All benefits and limitations inherent with screening on the primary or partial key are applicableto screening on the alternate index or partial alternate index.
Note: It is not necessary to take an explicit indexed view to use the index.
4. Selecting Records for Your Report
Creating Reports With TIBCO® WebFOCUS Language 275

VSAM Record Selection Efficiencies
276

Chapter5Creating Temporary Fields
When you create a report, you are not restricted to the fields that exist in your datasource. If you can generate the information you want from the existing data, you cancreate a temporary field to evaluate and display it. A temporary field takes up no storagespace in the data source. It is created only when needed.
In this chapter:
What Is a Temporary Field?
Defining a Virtual Field
Creating a Calculated Value
Assigning Column Reference Numbers
Using FORECAST in a COMPUTE Command
Calculating Trends and Predicting Values With FORECAST
Calculating Trends and Predicting Values With Multivariate REGRESS
Using Text Fields in DEFINE and COMPUTE
Creating Temporary Fields Independent of a Master File
What Is a Temporary Field?
A temporary field is a field whose value is not stored in the data source, but can be calculatedfrom the data that is there, or assigned an absolute value. A temporary field takes up nostorage space in the data source, and is created only when needed.
When you create a temporary field, you determine its value by writing an expression. You cancombine fields, constants, and operators in an expression to produce a single value. Forexample, if your data contains salary and deduction amounts, you can calculate the ratio ofdeductions to salaries using the following expression:
deduction / salary
Creating Reports With TIBCO® WebFOCUS Language 277

You can specify the expression yourself, or you can use one of the many supplied functionsthat perform specific calculations or manipulations. In addition, you can use expressions andfunctions as building blocks for more complex expressions, as well as use one temporary fieldto evaluate another.
Reference: Types of Temporary Fields
You can use two types of temporary fields (a virtual field and a calculated value), which differ inhow they are evaluated:
A virtual field (DEFINE) is evaluated as each record that meets the selection criteria is retrievedfrom the data source. The result of the expression is treated as though it were a real fieldstored in the data source.
A calculated value (COMPUTE) is evaluated after all the data that meets the selection criteriais retrieved, sorted, and summed. Therefore, the calculation is performed using the aggregatedvalues of the fields.
What Is a Temporary Field?
278

Reference: Evaluation of Temporary Fields
The following illustration shows how a request processes, and when each type of temporaryfield is evaluated:
Example: Distinguishing Between Virtual Fields and Calculated Values
In the following example, both the DRATIO field (virtual field) and the CRATIO (calculated value)use the same expression DELIVER_AMT/OPENING_AMT, but do not return the same result.The value for CRATIO is calculated after all records have been selected, sorted, andaggregated. The virtual field DRATIO is calculated for each retrieved record.
DEFINE FILE SALESDRATIO = DELIVER_AMT/OPENING_AMT;ENDTABLE FILE SALESSUM DELIVER_AMT AND OPENING_AMT AND DRATIOCOMPUTE CRATIO = DELIVER_AMT/OPENING_AMT;END
5. Creating Temporary Fields
Creating Reports With TIBCO® WebFOCUS Language 279
The output is:
Reference: Selecting a Temporary Field
The following is to help you choose the kind of temporary field you need.
Choose a virtual field when you want to:
Use the temporary field to select data for your report. You cannot use a calculated value,since it is evaluated after data selection takes place.
Use the temporary field to sort on data values. A calculated value is evaluated after thedata is sorted. With the BY TOTAL phrase, you can sort on this type of field.
Choose a calculated value when you want to:
Evaluate the temporary field using total values or prefix operators (which operate on totalvalues). You cannot use a virtual field, since it is evaluated before any totaling takes place.
Evaluate the temporary field using fields from different paths in the data structure. Youcannot use a virtual field, since it is evaluated before the relationship between data in thedifferent paths is established.
Defining a Virtual Field
A virtual field can be used in a request as though it is a real data source field. The calculationthat determines the value of a virtual field is performed on each retrieved record that passesany screening conditions on real fields. The result of the expression is treated as though itwere a real field stored in the data source.
You can define a virtual field in the following ways:
In a Master File. These virtual fields are available whenever the data source is used forreporting. These fields cannot be cleared by JOIN or DEFINE FILE commands.
For more information, see the Describing Data With TIBCO WebFOCUS® Language manual.
In a procedure. A virtual field created in a procedure lasts only for that procedure.
Tip: If your environment supports the KEEPDEFINES parameter, you can set KEEPDEFINES toON or ALL to protect virtual fields from being cleared by a subsequent JOIN command. Fordetails, see Joining Data Sources on page 1071.
Defining a Virtual Field
280

Reference: Usage Notes for Creating Virtual Fields
If you do not use the KEEPDEFINES parameter, when a JOIN is issued, all pre-existingvirtual fields for that data source are cleared except those defined in the Master File.
To join structures using a virtual field with the source, make sure the DEFINE follows theJOIN command. Otherwise, the JOIN command clears the temporary field. For anexplanation of reporting on joined data sources, see Joining Data Sources on page 1071.
If no field in the expression is in the Master File or has been defined, use the WITHcommand to identify the logical home of the defined calculation. See Establishing aSegment Location for a Virtual Field on page 289.
WITH can be used to move the logical home for the virtual field to a segment lower thanthat to which it would otherwise be assigned (for example, to count instances in a lowersegment).
You may define fields simultaneously (in addition to fields defined in the Master File) for asmany data sources as desired. The total length of all virtual fields and real fields cannotexceed 32,000 characters.
When you specify virtual fields in a request, they count toward the display field limit. Fordetails on determining the maximum number of display fields that can be used in arequest, see Displaying Report Data on page 39.
Virtual fields are only available when the data source is used for reporting. Virtual fieldscannot be used with MODIFY.
A DEFINE command may not contain qualified field names on the left-hand side of theexpression. If the same field name exists in more than one segment, and that field mustbe redefined or recomputed, use the REDEFINES command.
Using a self-referencing DEFINE such as x=x+1 disables AUTOPATH (see the TIBCOWebFOCUS® Developing Reporting Applications manual).
Field names used in the expression that defines the virtual field cannot be enclosed insingle or double quotation marks. Any character string enclosed in quotation marks istreated as a literal string, not a field reference.
A DEFINE FILE command overwrites a DEFINE in the Master File with same name as long asyou do not redefine the format (which is not allowed).
5. Creating Temporary Fields
Creating Reports With TIBCO® WebFOCUS Language 281

Syntax: How to Create a Virtual Field
Before you begin a report request, include
DEFINE FILE filename[.view_fieldname] [CLEAR|ADD] fieldname[/format] [(GEOGRAPHIC_ROLE = georole] [,TITLE = 'line1[,line2 ...']] [,DESCRIPTION = 'description'])] = expression; fieldname[/format][WITH realfield] = expression; fieldname[/format] REDEFINES qualifier.fieldname = expression;...END
where:
filenameIs the name of the data source for which you are defining the virtual field.
If the report request specifies an alternate view, use filename in conjunction withview_fieldname.
All fields used to define the virtual field must lie on a single path in the data source. If theydo not, you can use an alternate view, which requires alternate view DEFINE commands.For an alternate view, virtual fields cannot have qualified field names. For information onalternate views, see Rotating a Data Structure for Enhanced Retrieval on page 1929.
The DEFINE FILE command line must be on a separate line from its virtual field definitions.
view_fieldnameIs the field on which an alternate view is based in the corresponding request. You mayneed to use an alternate view if the fields used do not lie on a single path in thenormal view.
CLEAR
Clears previously defined virtual fields associated with the specified data source.CLEAR is the default value.
ADD
Enables you to specify additional virtual fields for a data source without releasing anyexisting virtual fields. Omitting ADD produces the same results as the CLEAR option.
fieldnameIs a name that complies with WebFOCUS field naming rules. Indexed field names inFOCUS data sources must be less than or equal to 12 characters. It can be the nameof a new virtual field that you are defining, or an existing field declared in the MasterFile, which you want to redefine.
Defining a Virtual Field
282

The name can include any combination of letters, digits, and underscores (_), and shouldbegin with a letter.
Do not use field names of the type Cn, En, or Xn (where n is any sequence of one or twodigits), because they are reserved for other uses.
formatIs the format of the field. The default value is D12.2. For information on field formats,see the Describing Data With TIBCO WebFOCUS® Language manual.
georoleIs a valid geographic role. The following is a list of default geographic roles.
ADDRESS_FULL. Full address.
ADDRESS_LINE. Number and street name.
CITY. City name.
CONTINENT. Continent name.
COUNTY. County name.
COUNTRY. Country name.
GEOMETRY_AREA. Geometry area.
GEOMETRY_LINE. Geometry line.
GEOMETRY_POINT. Geometry point.
LATITUDE. Latitude.
LONGITUDE. Longitude.
POSTAL_CODE. Postal code.
STATE. State name.
WITH realfieldAssociates a virtual field with a data source segment containing a real field. For moreinformation, see Usage Notes for Creating Virtual Fields on page 281.
line1, line2...Are the lines of default column title to be displayed for the virtual field unlessoverridden by an AS phrase.
descriptionIs the description to be associated with the virtual field, enclosed in single quotationmarks. The description displays in the tools that browse Master Files.
5. Creating Temporary Fields
Creating Reports With TIBCO® WebFOCUS Language 283

REDEFINES qualifier.fieldnameEnables you to redefine or recompute a field whose name exists in more than onesegment. If you change the format of the field when redefining it, the length in the newformat must be the same as or shorter than the original. In addition, conversionbetween alphanumeric and numeric data types is not supported.
expressionCan be an arithmetic or logical expression or function, evaluated to establish thevalue of fieldname (see Using Expressions on page 429). You must end eachexpression with a semicolon except for the last one, where the semicolon is optional.
Fields in the expression can be real data fields, data fields in data sources that are cross-referenced or joined, or previously defined virtual fields. For related information, see UsageNotes for Creating Virtual Fields on page 281.
END
Is required to end the DEFINE FILE command. END must be on its own line in theprocedure.
Note: For information about missing attributes for virtual fields, see MISSING Attribute in aDEFINE or COMPUTE Command on page 1041.
Example: Defining a Virtual Field
In the following request, the value of RATIO is calculated by dividing the value of DELIVER_AMTby OPENING_AMT. The DEFINE command creates RATIO as a virtual field, which is used in therequest as though it were a real field in the data source.
DEFINE FILE SALESRATIO = DELIVER_AMT/OPENING_AMT;ENDTABLE FILE SALESPRINT DELIVER_AMT AND OPENING_AMT AND RATIOWHERE DELIVER_AMT GT 50END
The output is:
DELIVER_AMT OPENING_AMT RATIO----------- ----------- ----- 80 65 1.23 100 100 1.00 80 90 .89
Defining a Virtual Field
284

Example: Redefining a Field
The following request redefines the salary field in the EMPDATA data source to print asterisksfor job titles that contain the word EXECUTIVE:
SET EXTENDNUM=OFFDEFINE FILE EMPDATA SALARY REDEFINES EMPDATA.SALARY = IF TITLE CONTAINS 'EXECUTIVE' THEN ELSE EMPDATA.SALARY; END TABLE FILE EMPDATA SUM SALARY BY TITLE WHERE TITLE CONTAINS 'MANAGER' OR 'MARKETING' OR 'SALES' ON TABLE SET PAGE OFFEND
The output is:
TITLE SALARY----- ------EXEC MANAGER $54,100.00EXECUTIVE MANAGER ***************MANAGER $270,500.00MARKETING DIRECTOR $176,800.00MARKETING EXECUTIVE ***************MARKETING SUPERVISOR $50,500.00SALES EXECUTIVE ***************SALES MANAGER $70,000.00SALES SPECIALIST $82,000.00SENIOR SALES EXEC. $43,400.00
5. Creating Temporary Fields
Creating Reports With TIBCO® WebFOCUS Language 285

Example: Redefining a Field That Has the Same Name in Multiple Segments
The following request joins the EMPDATA data source to itself. This creates a two-segmentstructure in which the names are the same in both segments. The request then redefines thesalary field in the top segment (tag name ORIG) so that all names starting with the letter L arereplaced by asterisks, and redefines the salary field in the child segment (tag name NEW) sothat all names starting with the letter M are replace by asterisks:
SET EXTENDNUM=OFFJOIN PIN IN EMPDATA TAG ORIG TO PIN IN EMPDATA TAG NEW AS AJ DEFINE FILE EMPDATA SALARY/D12.2M REDEFINES ORIG.SALARY = IF LASTNAME LIKE 'L%' THEN 999999999999 ELSE ORIG.SALARY;SALARY/D12.2M REDEFINES NEW.SALARY = IF LASTNAME LIKE 'M%' THEN 999999999999 ELSE NEW.SALARY * 1.2;END TABLE FILE EMPDATA PRINT ORIG.SALARY AS 'ORIGINAL' NEW.SALARY AS 'NEW' BY LASTNAME WHERE LASTNAME FROM 'HIRSCHMAN' TO 'OLSON' ON TABLE SET PAGE NOPAGE END
The output is:
LASTNAME ORIGINAL NEW -------- -------- --- HIRSCHMAN $62,500.00 $75,000.00 KASHMAN $33,300.00 $39,960.00 LASTRA *************** $138,000.00 LEWIS *************** $60,600.00 LIEBER *************** $62,400.00 LOPEZ *************** $31,680.00 MARTIN $49,000.00 *************** MEDINA $39,000.00 *************** MORAN $30,800.00 *************** NOZAWA $80,500.00 $96,600.00 OLSON $30,500.00 $36,600.00
Defining Multiple Virtual Fields
You may wish to have more than one set of virtual fields for the same data source, and to usesome or all of the virtual fields in the request. The ADD option enables you to specifyadditional virtual fields without clearing existing ones. If you omit the ADD option, previouslydefined virtual fields in that data source are cleared.
If you want to clear a virtual field for a particular data source, use the CLEAR option.
Defining a Virtual Field
286

Syntax: How to Add a Virtual Field to Existing Virtual Fields
DEFINE FILE filename ADD
where:
filenameIs the data source.
Example: Adding Virtual Fields
The following annotated example illustrates the use of the ADD and CLEAR options for virtualfields:
1. DEFINE FILE CAR ETYPE/A2=DECODE STANDARD (OHV O OHC O ELSE L); END 2. DEFINE FILE CAR ADD TAX/D8.2=IF MPG LT 15 THEN .06*RCOST ELSE .04*RCOST; FCOST = RCOST+TAX; END
1. The first DEFINE command creates the TYPE virtual field for the CAR data source. Forinformation about the DECODE function, see the TIBCO WebFOCUS® Using Functionsmanual.
2. Two or more virtual fields, TAX and FCOST, are created for the CAR data source. The ADDoption allows you to reference ETYPE, TAX, and FCOST in future requests.
Displaying Virtual Fields
You can display all virtual fields with the ? DEFINE command.
Syntax: How to Display Virtual Fields
? DEFINE
For more information, see the TIBCO WebFOCUS® Developing Reporting Applications manual.
Procedure: How to Display Virtual Fields
Click the Defined Fields tab in the Define tool.
5. Creating Temporary Fields
Creating Reports With TIBCO® WebFOCUS Language 287
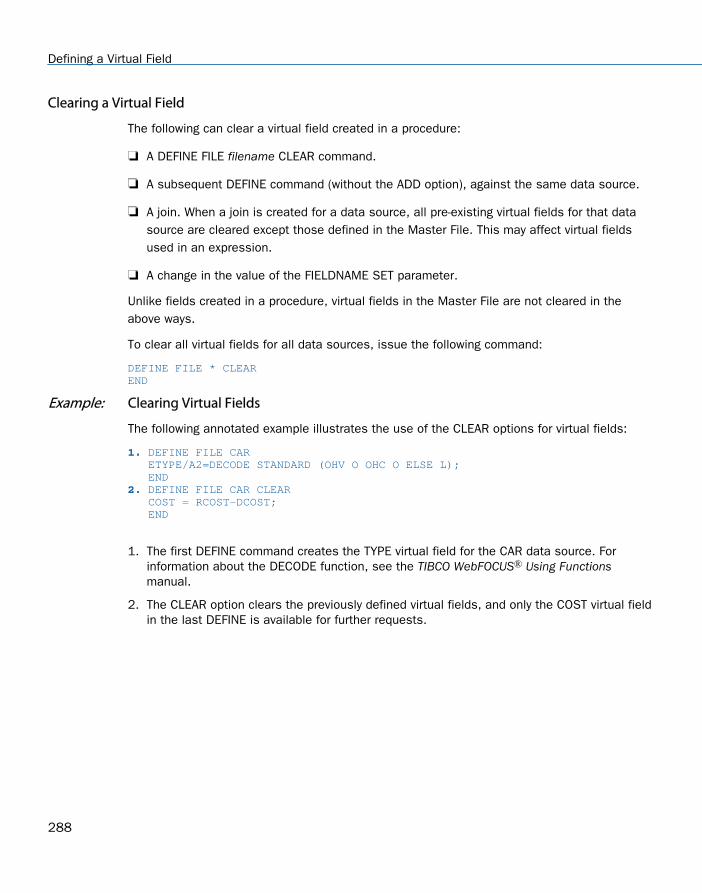
Clearing a Virtual Field
The following can clear a virtual field created in a procedure:
A DEFINE FILE filename CLEAR command.
A subsequent DEFINE command (without the ADD option), against the same data source.
A join. When a join is created for a data source, all pre-existing virtual fields for that datasource are cleared except those defined in the Master File. This may affect virtual fieldsused in an expression.
A change in the value of the FIELDNAME SET parameter.
Unlike fields created in a procedure, virtual fields in the Master File are not cleared in theabove ways.
To clear all virtual fields for all data sources, issue the following command:
DEFINE FILE * CLEAREND
Example: Clearing Virtual Fields
The following annotated example illustrates the use of the CLEAR options for virtual fields:
1. DEFINE FILE CAR ETYPE/A2=DECODE STANDARD (OHV O OHC O ELSE L); END 2. DEFINE FILE CAR CLEAR COST = RCOST-DCOST; END
1. The first DEFINE command creates the TYPE virtual field for the CAR data source. Forinformation about the DECODE function, see the TIBCO WebFOCUS® Using Functionsmanual.
2. The CLEAR option clears the previously defined virtual fields, and only the COST virtual fieldin the last DEFINE is available for further requests.
Defining a Virtual Field
288

Establishing a Segment Location for a Virtual Field
Virtual fields have a logical location in the data source structure, just like permanent datasource fields. The logical home of a virtual field is on the lowest segment that has to beaccessed in order to evaluate the expression, and determines the time of execution for thatfield. Consider the following data source structure and DEFINE command:
DEFINE RATIO = DELIVER_AMT/RETAIL_PRICE ;
The expression for RATIO includes at least one real data source field. As far as reportcapabilities are concerned, the field RATIO is just like a real field in the Master File, and islocated in the lowest segment.
In some applications, you can have a virtual field evaluated by an expression that contains noreal data source fields. Such an expression might refer only to temporary fields or literals. Forexample,
NCOUNT/I5 = NCOUNT+1;
or
DATE/YMD = '19990101';
Since neither expression contains a data source field (NCOUNT and the literal do not exist inthe Master File), their logical positions in the data source cannot be determined. You have tospecify in which segment you want the expression to be placed. To associate a virtual fieldwith a specific segment, use the WITH phrase. The field name following WITH may be any realfield in the Master File.
5. Creating Temporary Fields
Creating Reports With TIBCO® WebFOCUS Language 289

For FOCUS data sources, you may be able to increase the retrieval speed with an externalindex on the virtual field. In this case, you can associate the index with a target segmentoutside of the segment containing the virtual field. See the TIBCO WebFOCUS® DevelopingReporting Applications manual for more information on external indexes.
Example: Establishing a Segment Location
The field NCOUNT is placed in the same segment as the UNITS field. NCOUNT is calculatedeach time a new segment instance is retrieved.
DEFINE FILE GGSALESNCOUNT/I5 WITH UNITS = NCOUNT+1;END
Defining Virtual Fields Using a Multi-Path Data Source
Calculations of a virtual field may include fields from all segments of a data source, but theymust lie in a unique top-to-bottom path. Different virtual fields may, of course, lie alongdifferent paths. For example, consider the following data source structure:
This data source structure does not permit you to write the following expression:
NEWAMT = SALARY+GROSS;
The expression is invalid because the structure implies that there can be several SALARYsegments for a given EMPLOYEE, and it is not clear which SALARY to associate with whichGROSS.
To accomplish such an operation, you can use the alternate view option explained in ImprovingReport Processing on page 1929.
Increasing the Speed of Calculations in Virtual Fields
Virtual fields are compiled into machine code in order to increase the speed of calculations.
Defining a Virtual Field
290

Preserving Virtual Fields Using DEFINE FILE SAVE and RETURN
Occasionally, new code needs to be added to an existing application. When adding code, thereis always the possibility of over-writing existing virtual fields by reusing their namesinadvertently.
The DEFINE FILE SAVE command forms a new context for virtual fields. Each new contextcreates a new layer or command environment. When you first enter the new environment, all ofthe virtual fields defined in the previous layer are available in the new layer. Overwriting orclearing a virtual field definition affects only the current layer. You can return to the defaultcontext with the DEFINE FILE RETURN command, and the virtual field definitions remain intact.
Therefore, all the virtual fields that are created in the new application can be removed beforereturning to the calling application, without affecting existing virtual fields in that application.
For an example of DEFINE FILE SAVE and DEFINE FILE RETURN, see Joining Data Sources onpage 1071.
Note: A JOIN command can be issued after a DEFINE FILE SAVE command. However, in orderto clear the join context, you must issue a JOIN CLEAR command if the join is still in effect. Ifonly virtual fields and DEFINE FILE ADD were issued after a DEFINE FILE SAVE command, youcan clear them by issuing a DEFINE FILE RETURN command.
Syntax: How to Protect Virtual Fields From Being Overwritten
DEFINE FILE filename SAVE fld1/format1=expression1; fld2/format2=expression2;ENDTABLE FILE filename ...MODIFY FILE filename ...DEFINE FILE filename RETURNEND
where:
SAVE
Creates a new context for virtual fields.
filenameIs the name of the Master File that gets a new context and has the subsequent virtualfields applied before the DEFINE FILE RETURN command is issued.
RETURN
Clears the current context if it was created by DEFINE FILE SAVE, and restores theprevious context.
5. Creating Temporary Fields
Creating Reports With TIBCO® WebFOCUS Language 291

Applying Dynamically Formatted Virtual Fields to Report Columns
Dynamic formatting enables you to apply different formats to specific data in a column by usinga temporary field that contains dynamic data settings.
Before you can format a report column using the dynamic format, you must create the report,then apply the temporary field to a column in the report. For example, you can create atemporary field that contains different decimal currency formats for countries like Japan (whichuses no decimal places) and England (which uses 2 decimal places). These currency formatsare considered dynamic formats. You can then apply the temporary field containing thedynamic formatting to a Sales column. In a report, the Sales column reflects the differentcurrency formats for each country.
The field that contains the format specifications can be:
A real field in the data source.
A temporary field created with a DEFINE command.
A DEFINE in the Master File.
A COMPUTE command. If the field is created with a COMPUTE command, the commandmust appear in the request prior to using the calculated field for reformatting.
The field that contains the formats must be alphanumeric, and at least eight characters inlength. Only the first eight characters are used for formatting.
The field-based format may specify a length longer than the length of the original field.However, if the new length is more than one-third larger than the original length, the reportcolumn width may not be large enough to hold the value (indicated by asterisks in the field).
You can apply a field-based format to any type of field. However, the new format must becompatible with the original format:
A numeric field can be reformatted to any other numeric format with any edit formatoptions.
An alphanumeric field can be reformatted to a different length.
Any date field can be reformatted to any other date format type.
Any date-time field can be reformatted to any other date-time format.
If the field-based format is invalid or specifies an impermissible type of conversion, the fielddisplays with plus signs (++++) on the report output.
Defining a Virtual Field
292

Syntax: How to Define and Apply a Format Field
With a DEFINE command:
DEFINE FILE filename format_field/A8 = expression;END
In a Master File:
DEFINE format_field/A8 = expression; $
In a request:
COMPUTE format_field/A8 = expression;
where:
format_field
Is the name of the field that contains the format for each row.
expression
Is the expression that assigns the format values to the format field.
After the format field is defined, you can apply it in a report request:
TABLE FILE filename display fieldname/format_field[/just]END
where:
displayIs any valid display command.
fieldnameIs a field in the request to be reformatted.
format_fieldIs the name of the field that contains the formats. If the name of the format field isthe same as an explicit format, the explicit format is used. For example, a field namedI8 cannot be used for field-based reformatting, because it is interpreted as the explicitformat I8.
justIs a justification option: L, R, or C. The justification option can be placed before orafter the format field, separated from the format by a slash.
5. Creating Temporary Fields
Creating Reports With TIBCO® WebFOCUS Language 293

Reference: Usage Notes for Field-Based Reformatting
Field-based reformatting is supported for TABLE and TABLEF. It works with StyleSheets,joins, and any type of data source.
Field-based reformatting is not supported for MODIFY, Maintain, MATCH, GRAPH, RECAP,FOOTING, HEADING, or text fields.
Although you can use a DEFINE or COMPUTE command to create the format field, youcannot apply a field-based format to a calculated or virtual field.
Field-based reformatting cannot be used on a BY sort field. It does work with an ACROSSfield.
If a report column is produced using field-based reformatting, the format used for a total orsubtotal of the column is taken from the previous detail line.
Explicit reformatting creates two display fields internally for each field that is reformatted.Field-based reformatting creates three display fields.
Field-based formats are applied at the final output phase of report processing, whilespecific formats are applied at the final output phase of report processing, while specificformats are applied prior to performing calculations. Therefore, the dynamically reformattedfield will perform calculations, including summation, using the original format, while a fieldreformatted using a specific format will use the new format for calculations. Thus, theremay be numeric differences in the final output because of rounding when using packedfields that reduce the precision.
Field-based reformatting works for alphanumeric fields in a HOLD file, although three fieldsare stored in the file for each field that is reformatted. To prevent the extra fields frombeing propagated to the HOLD file, specify SET HOLDLIST=PRINTONLY.
If the number of decimal places varies between rows, the decimal points are not aligned inthe report output.
Example: Creating Dynamically Formatted Fields
The following request formats the DOLLARS2 field according to the value of the CATEGORYfield and shows the numeric differences in sums using dynamic and static reformatting:
DEFINE FILE GGSALESMYFORMAT/A8=DECODE CATEGORY ('Coffee' 'P15.3' 'Gifts' 'P15.0' ELSE 'P15.2');DOLLARS2/P15.2 = DOLLARS + .5;END
Defining a Virtual Field
294

TABLE FILE GGSALESSUM DOLLARS2/MYFORMAT AS 'Dynamic' DOLLARS2/P10.2 AS 'Specific'BY CATEGORYON TABLE SUBTOTALON TABLE SET PAGE NOLEADON TABLE SET STYLE *GRID=OFF,$END
The output is shown in the following image:
Passing Function Calls Directly to a Relational Engine Using SQL.Function Syntax
The SQL adapters can pass virtual fields that call certain SQL scalar functions to the relationalengine for processing. This enables you to use SQL functions in a request even when theyhave no equivalent in the WebFOCUS language. The function must be row-based and have aparameter list that consists of a comma-delimited list of column names or constants. In orderto reference the function in an expression, prefix the function name with SQL.
If the virtual field is in the Master File, both TABLE requests and those SQL requests thatqualify for Automatic Passthru (APT) can access the field. If the virtual field is created by aDEFINE FILE command, TABLE requests can access the field. The function name andparameters are passed without translation to the relational engine. Therefore, the expressionthat creates the DEFINE field must be optimized, or the request will fail.
Reference: Usage Notes for Direct SQL Function Calls
The expression containing the SQL.function call must be optimized or the request will failwith the following message:
(FOC32605) NON OPTIMIZABLE EXPRESSION WITH SQL. SYNTAX
The function must be a row-based scalar function and have a parameter list that consistsof a comma-delimited list of column names or constants. If the function uses anythingother than a list of comma separated values, the SQL. syntax cannot be used to pass it.
5. Creating Temporary Fields
Creating Reports With TIBCO® WebFOCUS Language 295

Constant DEFINE fields must be assigned a segment location using the WITH phrase.
Expressions should be declared as DEFINE fields, which are supported as parameters to anSQL function.
Data types are not supported as parameters to an SQL function. Examples of data typearguments are CHAR and INT for the CONVERT function and ISO, EUR, JIS, and USA for theCHAR function.
Example: Calling the SQL CONCAT Function in a Request
This example uses the WebFOCUS Retail demo sample. You can create this sample datasource for a relational adapter by right-clicking the application in which you want to place thissample, and selecting New and then Samples from the context menu. Then, select WebFOCUS- Retail Demo from the Sample procedures and data for drop-down list and click Create.
The following request against the WebFOCUS Retail demo data source uses the SQL CONCATfunction to concatenate the product category with the product subcategory.
SET TRACEUSER = ONSET TRACEOFF = ALLSET TRACEON = STMTRACE//CLIENTSET TRACESTAMP=OFFSET XRETRIEVAL = OFF DEFINE FILE WF_RETAILCAT_SUBCAT/A50 = SQL.CONCAT(PRODUCT_CATEGORY, PRODUCT_SUBCATEG);END TABLE FILE WF_RETAILPRINT CAT_SUBCATBY PRODUCT_CATEGORY NOPRINTEND
The trace output shows that the SQL function call was passed to the RDBMS.
SELECT CONCAT(T2."PRODUCT_CATEGORY",T2."PRODUCT_SUBCATEG"), T2."PRODUCT_CATEGORY", T2."PRODUCT_SUBCATEG" FROM wfr_product T2 ORDER BY T2."PRODUCT_CATEGORY" FOR FETCH ONLY;
Defining a Virtual Field
296

Creating a Calculated Value
A calculated value is a temporary field that is evaluated after all the data that meets theselection criteria is retrieved, sorted, and summed. Calculated values are available only for thespecified report request.
You specify the COMPUTE command in the body of the report request, following the displaycommand and optionally introduced by AND. You can compute more than one field with asingle COMPUTE command.
Reference: Usage Notes for Calculated Field Values
The following apply to the use of calculated values:
If you specify any optional COMPUTE phrases (such as, AS, IN, or NORPINT), and youcompute additional fields following these phrases, you must repeat the commandsCOMPUTE or AND COMPUTE before specifying the additional fields.
You can rename and justify column totals and row totals. For information, see theexamples in Including Totals and Subtotals on page 367.
Expressions in a COMPUTE command can include fields with prefix operators (see Manipulating Display Fields With Prefix Operators on page 56). For more information on validexpressions, see Using Expressions on page 429.
Fields referred to in a COMPUTE command are counted toward the display field limit, andappear in the internal matrix. For details on determining the maximum number of displayfields that can be used in a request, see Displaying Report Data on page 39.
Field names used in the expression that defines the calculated field cannot be enclosed insingle or double quotation marks. Any character string enclosed in quotation marks istreated as a literal string, not a field reference.
When using a COMPUTE with an ACROSS COLUMNS phrase, the COLUMNS should bespecified last:
ACROSS acrossfield [AND] COMPUTE compute_expression; COLUMNS values
5. Creating Temporary Fields
Creating Reports With TIBCO® WebFOCUS Language 297

Syntax: How to Create a Calculated Value
COMPUTE fld [/format] [(GEOGRAPHIC_ROLE = georole)] = expression; [AS 'title'] [NOPRINT] [IN [+n]]
where:
fldIs the name of the calculated value.
The name can be any name that complies with WebFOCUS field naming rules.
Do not use field names of the type Cn, En, and Xn (where n is any sequence of one or twodigits), because they are reserved for other uses.
formatIs the format of the field. The default is D12.2. For information on formats, see theDescribing Data With TIBCO WebFOCUS® Language manual.
georoleIs a valid geographic role. The following is a list of default geographic roles.
ADDRESS_FULL. Full address.
ADDRESS_LINE. Number and street name.
CITY. City name.
CONTINENT. Continent name.
COUNTY. County name.
COUNTRY. Country name.
GEOMETRY_AREA. Geometry area.
GEOMETRY_LINE. Geometry line.
GEOMETRY_POINT. Geometry point.
LATITUDE. Latitude.
LONGITUDE. Longitude.
POSTAL_CODE. Postal code.
STATE. State name.
Creating a Calculated Value
298

expressionCan be an arithmetic and/or logical expression or function (see Using Expressions onpage 429). Each field used in the expression must be part of the request. Eachexpression must end with a semicolon (;).
NOPRINT
Suppresses printing of the field. For more information, see Laying Out the Report Pageon page 1333.
AS 'title' Changes the name of the calculated value. For more information, see Using Headings,Footings, Titles, and Labels on page 1519.
IN [+n]Specifies the location of the column. For more information, see Using Headings,Footings, Titles, and Labels on page 1519. IN only works in an HTML report when theSTYLEMODE SET parameter is set to FIXED or OFF.
Syntax: How to Create a Calculated Value Without a Calculation
COMPUTE fld [/format]= ;
where:
fldIs the name of the calculated value.
The name can be any name that complies with WebFOCUS field naming rules.
Do not use field names of the type Cn, En, and Xn (where n is any sequence of one or twodigits), because they are reserved for other uses.
formatIs the format of the field. The default is D12.2. For information on formats, see theDescribing Data With TIBCO WebFOCUS® Language manual.
5. Creating Temporary Fields
Creating Reports With TIBCO® WebFOCUS Language 299

Example: Calculating a Field Value
In the following example, the COMPUTE command creates a temporary field REVENUE basedon the product of UNIT_SOLD and RETAIL_PRICE, and displays this information for New YorkCity. The format D12.2M indicates the field format for REVENUE and the AS command changesthe default column headings for UNIT_SOLD and RETAIL_PRICE. REVENUE is only available forthis report request.
TABLE FILE SALESHEADING CENTER"NEW YORK PROFIT REPORT"" "SUM UNIT_SOLD AS 'UNITS,SOLD' RETAIL_PRICE AS 'RETAIL,PRICE'COMPUTE REVENUE/D12.2M = UNIT_SOLD * RETAIL_PRICE;BY PROD_CODE AS 'PROD,CODE'WHERE CITY EQ 'NEW YORK'END
The output is:
NEW YORK PROFIT REPORT PROD UNITS RETAIL CODE SOLD PRICE REVENUE---- ----- ------ -------B10 30 $.85 $25.50B17 20 $1.89 $37.80B20 15 $1.99 $29.85C13 15 $1.99 $29.85C14 18 $2.05 $36.90C17 12 $2.09 $25.08D12 20 $2.09 $41.80E1 30 $.89 $26.70E2 33 $.99 $32.67E3 35 $1.09 $38.15
Using Positional Column Referencing With Calculated Values
In a COMPUTE command, it is sometimes convenient to refer to a field by its report columnposition, rather than its name. This option is especially useful when the same field is specifiedfor several report columns.
Column referencing becomes essential when you are using the same field name in a variety ofways. The following image shows that columns produced by display commands (whetherdisplayed or not) can be referred to as C1 for the first column, C2 for the second column, andso forth. The BY field columns are not counted.
For additional information about column reference numbers, see Assigning Column ReferenceNumbers on page 302.
Creating a Calculated Value
300
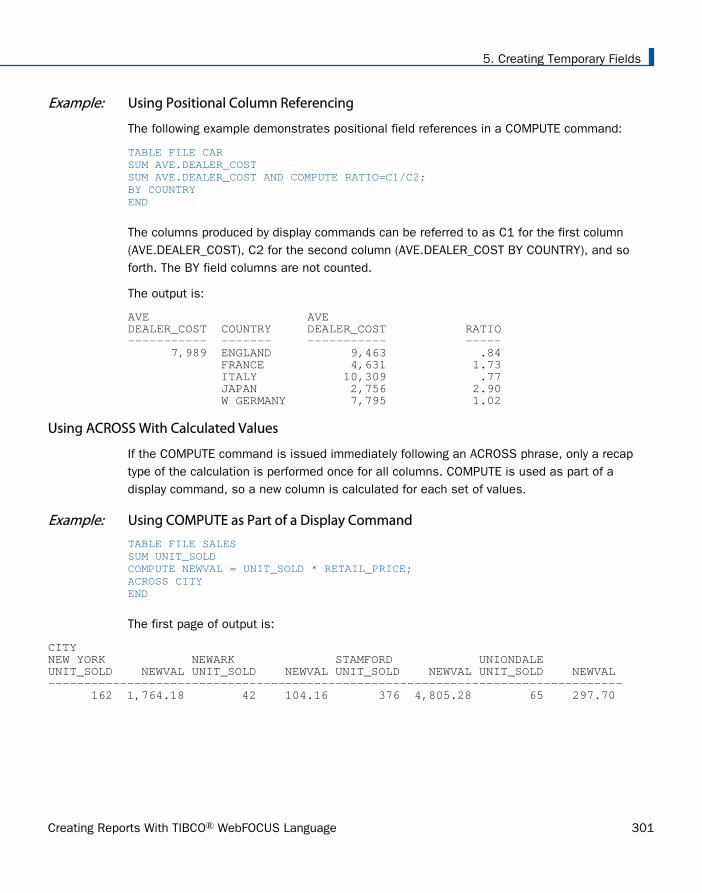
Example: Using Positional Column Referencing
The following example demonstrates positional field references in a COMPUTE command:
TABLE FILE CARSUM AVE.DEALER_COSTSUM AVE.DEALER_COST AND COMPUTE RATIO=C1/C2;BY COUNTRYEND
The columns produced by display commands can be referred to as C1 for the first column(AVE.DEALER_COST), C2 for the second column (AVE.DEALER_COST BY COUNTRY), and soforth. The BY field columns are not counted.
The output is:
AVE AVE DEALER_COST COUNTRY DEALER_COST RATIO----------- ------- ----------- ----- 7,989 ENGLAND 9,463 .84 FRANCE 4,631 1.73 ITALY 10,309 .77 JAPAN 2,756 2.90 W GERMANY 7,795 1.02
Using ACROSS With Calculated Values
If the COMPUTE command is issued immediately following an ACROSS phrase, only a recaptype of the calculation is performed once for all columns. COMPUTE is used as part of adisplay command, so a new column is calculated for each set of values.
Example: Using COMPUTE as Part of a Display Command
TABLE FILE SALESSUM UNIT_SOLD COMPUTE NEWVAL = UNIT_SOLD * RETAIL_PRICE;ACROSS CITYEND
The first page of output is:
CITY NEW YORK NEWARK STAMFORD UNIONDALEUNIT_SOLD NEWVAL UNIT_SOLD NEWVAL UNIT_SOLD NEWVAL UNIT_SOLD NEWVAL-------------------------------------------------------------------------------- 162 1,764.18 42 104.16 376 4,805.28 65 297.70
5. Creating Temporary Fields
Creating Reports With TIBCO® WebFOCUS Language 301

Example: Using ACROSS With Calculated Values
In the following COMPUTE command, C1, C2, C3, C4, C5, and C6 are positional columnreferences, and the COMPUTE command follows the ACROSS phrase. The COMPUTE isperformed once for the report, and the results are displayed to the right of all sort groups.
TABLE FILE SALESSUM UNIT_SOLD AND RETURNSWHERE DATE GE '010' AND DATE LE '1031'ACROSS DATECOMPUTETOT_UNITS/D5=C1 + C3 + C5;TOT_RETURNS = C2 + C4 + C6;END
The output is:
DATE 10/17 10/18 10/19 TOT_UNITS TOT_RETURNS TOT_UNITS TOT_RETURNSUNIT_SOLD RETURNS UNIT_SOLD RETURNS UNIT_SOLD RETURNS----------------------------------------------------------------------------------------------162 15 78 2 29 1 269 18.00
Sorting Calculated Values
You can sort a report by a virtual field or a calculated value. To sort by a calculated value, youmust use the BY TOTAL phrase in your request. For details, see Sorting and Aggregating ReportColumns on page 174.
Screening on Calculated Values
You can screen on values produced by COMPUTE commands by using the WHERE TOTAL orWHERE_GROUPED test, as described in Selecting Records for Your Report on page 217.
If you use a WHERE test, it will automatically be changed to WHERE_GROUPED, if the test iseligible for WHERE_GROUPED processing, or to WHERE TOTAL, if it is not.
Assigning Column Reference Numbers
Column notation assigns a sequential column number to each column in the internal matrixcreated for a report request. If you want to control the creation of column reference numbersfor the columns that are used in your report, use the CNOTATION column notation command.
Assigning Column Reference Numbers
302

Because column numbers refer to columns in the internal matrix, they are assigned afterretrieval and aggregation of data are completed. Columns created and displayed in a report arestored in the internal matrix, and columns that are not displayed in a report may also begenerated and stored in the internal matrix. Columns stored in the internal matrix includecalculated values, reformatted field values, BY fields, fields with the NOPRINT option, andcertain RECAP calculations such as FORECAST and REGRESS. Every other column in theinternal matrix is assigned a column number by default which means you have to account forall internally generated columns if you want to refer to the appropriate column value in yourrequest.
You can change the default assignment of column reference numbers by using the SETCNOTATION command which can assign column numbers only to columns that display in thereport output or to all fields referenced in the report request. You can use column notation inCOMPUTE and RECAP commands to refer to these columns in your request.
Syntax: How to Control the Creation of Column Reference Numbers
SET CNOTATION={ALL|PRINTONLY|EXPLICIT}
where:
ALL
Assigns column reference numbers to every column in the internal matrix. ALL is thedefault value.
PRINTONLY
Assigns column reference numbers only to columns that display in the report output.
EXPLICIT
Assigns column reference numbers to all fields referenced in the request, whetherdisplayed or not.
Using Column Notation in a Report Request
To create a column reference in a request, you can:
Preface the column number with a C in a non-FML request.
Use the column number as an index in conjunction with a row label in an FML request. Withthis type of notation, you can specify a specific column, a relative column number, or asequence or series of columns.
Refer to a particular cell in an FML request using the notation E(r,c), where r is a rownumber and c is a column number.
5. Creating Temporary Fields
Creating Reports With TIBCO® WebFOCUS Language 303

Example: Using Column Notation in a Non-FML Request With CNOTATION=ALL
In the following request with CNOTATION=ALL, the product of C1 and C2 does not calculateTRANSTOT times QUANTITY because the reformatting generates additional columns.
SET CNOTATION = ALLTABLE FILE VIDEOTRKSUM TRANSTOT/D12.2 QUANTITY/D12.2 AND COMPUTEPRODUCT = C1 * C2;BY TRANSDATEEND
The output is:
TRANSDATE TRANSTOT QUANTITY PRODUCT--------- -------- -------- ------- 91/06/17 57.03 12.00 3,252.42 91/06/18 21.25 2.00 451.56 91/06/19 38.17 5.00 1,456.95 91/06/20 14.23 3.00 202.49 91/06/21 44.72 7.00 1,999.88 91/06/24 126.28 12.00 15,946.63 91/06/25 47.74 8.00 2,279.11 91/06/26 40.97 2.00 1,678.54 91/06/27 60.24 9.00 3,628.85 91/06/28 31.00 3.00 961.00
BY fields do not get a column reference, so the first column reference is for TRANSTOT with itsoriginal format, then the reformatted version. Next is QUANTITY with its original format andthen the reformatted version. Last is the calculated value, PRODUCT.
Example: Using Column Notation in a Non-FML Request With CNOTATION=PRINTONLY
Setting CNOTATION=PRINTONLY assigns column references to the output columns only. In thiscase, the product of C1 and C2 does calculate TRANSTOT times QUANTITY.
SET CNOTATION = PRINTONLY TABLE FILE VIDEOTRKSUM TRANSTOT/D12.2 QUANTITY/D12.2AND COMPUTEPRODUCT = C1 * C2;BY TRANSDATEEND
Assigning Column Reference Numbers
304

The output is:
TRANSDATE TRANSTOT QUANTITY PRODUCT--------- -------- -------- ------- 91/06/17 57.03 12.00 684.36 91/06/18 21.25 2.00 42.50 91/06/19 38.17 5.00 190.85 91/06/20 14.23 3.00 42.69 91/06/21 44.72 7.00 313.04 91/06/24 126.28 12.00 1,515.36 91/06/25 47.74 8.00 381.92 91/06/26 40.97 2.00 81.94 91/06/27 60.24 9.00 542.16 91/06/28 31.00 3.00 93.00
Example: Using CNOTATION=PRINTONLY With Column Numbers in an FML Request
In the following request, the reformatting of fields generates additional columns in the internalmatrix. In the second RECAP expression, note that because of the CNOTATION setting:
TOTCASH(1) refers to total cash in displayed column 1.
TOTCASH(2) refers to total cash in displayed column 2.
The resulting calculation is displayed in column 2 of the row labeled CASH GROWTH(%).
The RECAP value is only calculated for the column specified.
SET CNOTATION=PRINTONLYDEFINE FILE LEDGERCUR_YR/I5C=AMOUNT;LAST_YR/I5C=.87*CUR_YR - 142;ENDTABLE FILE LEDGERSUM CUR_YR/F9.2 AS 'CURRENT,YEAR'LAST_YR/F9.2 AS 'LAST,YEAR' FOR ACCOUNT1010 AS 'CASH ON HAND' OVER1020 AS 'DEMAND DEPOSITS' OVER1030 AS 'TIME DEPOSITS' OVERBAR OVERRECAP TOTCASH/F9.2C= R1 + R2 + R3; AS 'TOTAL CASH' OVER" " OVERRECAP GROCASH(2)/F9.2C=100*TOTCASH(1)/TOTCASH(2) - 100;AS 'CASH GROWTH(%)'END
The output is:
CURRENT YEAR
LAST YEAR
5. Creating Temporary Fields
Creating Reports With TIBCO® WebFOCUS Language 305

CASH ON HAND 8784.00 7216.00
DEMAND DEPOSITS 4494.00 3483.00
TIME DEPOSITS 7961.00 6499.00
-------- --------
TOTAL CASH 21239.00 17198.00
CASH GROWTH(%) 23.50
Example: Using CNOTATION=PRINTONLY to RECAP Over Contiguous Columns in an FMLRequest
In this example, the RECAP calculation for ATOT occurs only for displayed columns 2 and 3, asspecified in the request. No calculation is performed for displayed column 1.
SET CNOTATION=PRINTONLYDEFINE FILE LEDGERCUR_YR/I5C=AMOUNT;LAST_YR/I5C=.87*CUR_YR - 142;NEXT_YR/I5C=1.13*CUR_YR + 222;ENDTABLE FILE LEDGERSUM NEXT_YR/F9.2 CUR_YR/F9.2 LAST_YR/F9.2FOR ACCOUNT10$$ AS 'CASH' OVER 1100 AS 'ACCOUNTS RECEIVABLE' OVER 1200 AS 'INVENTORY' OVER BAR OVER RECAP ATOT(2,3)/I5C = R1 + R2 + R3;AS 'ASSETS ACTUAL'END
The output is:
NEXT_YR CUR_YR LAST_YR
CASH 25992.00 21239.00 17198.00
ACCOUNTS RECEIVABLE
21941.00 18829.00 15954.00
INVENTORY 31522.00 27307.00 23329.00
Assigning Column Reference Numbers
306
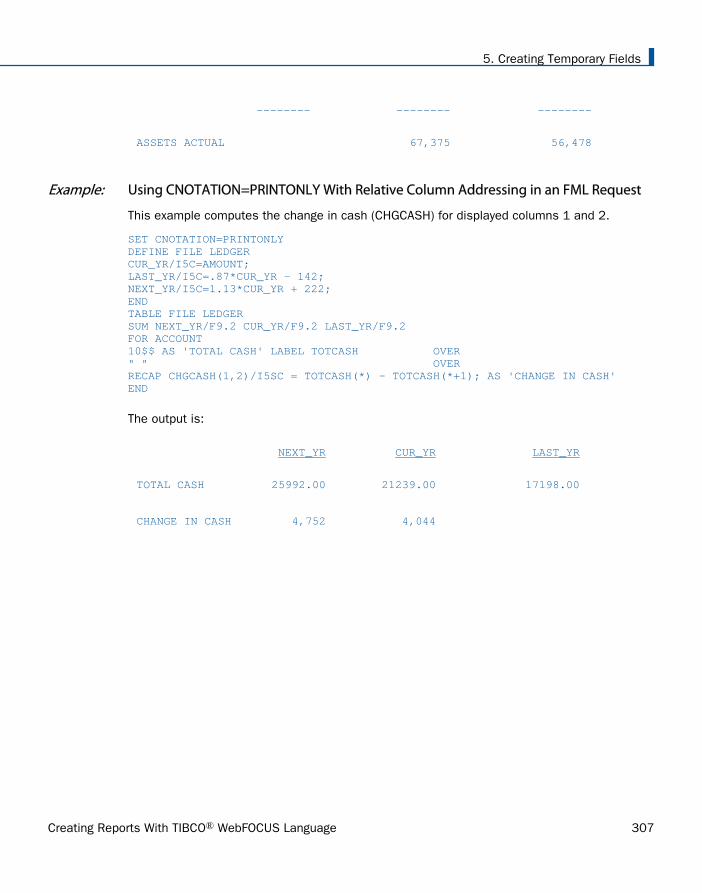
-------- -------- --------
ASSETS ACTUAL 67,375 56,478
Example: Using CNOTATION=PRINTONLY With Relative Column Addressing in an FML Request
This example computes the change in cash (CHGCASH) for displayed columns 1 and 2.
SET CNOTATION=PRINTONLYDEFINE FILE LEDGERCUR_YR/I5C=AMOUNT;LAST_YR/I5C=.87*CUR_YR - 142;NEXT_YR/I5C=1.13*CUR_YR + 222;ENDTABLE FILE LEDGERSUM NEXT_YR/F9.2 CUR_YR/F9.2 LAST_YR/F9.2FOR ACCOUNT10$$ AS 'TOTAL CASH' LABEL TOTCASH OVER" " OVERRECAP CHGCASH(1,2)/I5SC = TOTCASH(*) - TOTCASH(*+1); AS 'CHANGE IN CASH'END
The output is:
NEXT_YR CUR_YR LAST_YR
TOTAL CASH 25992.00 21239.00 17198.00
CHANGE IN CASH 4,752 4,044
5. Creating Temporary Fields
Creating Reports With TIBCO® WebFOCUS Language 307

Example: Using CNOTATION=PRINTONLY With Cell Notation in an FML Request
In this request, two RECAP expressions derive VARIANCEs (EVAR and WVAR) by subtractingvalues in four displayed columns (1, 2, 3, 4) in row three (PROFIT); these values are identifiedusing cell notation (r,c).
SET CNOTATION=PRINTONLYTABLE FILE REGIONSUM E_ACTUAL/F9.2 E_BUDGET/F9.2 W_ACTUAL/F9.2 W_BUDGET/F9.2FOR ACCOUNT3000 AS 'SALES' OVER3100 AS 'COST' OVERBAR OVERRECAP PROFIT/I5C = R1 - R2; OVER" " OVERRECAP EVAR(1)/I5C = E(3,1) - E(3,2);AS 'EAST VARIANCE' OVERRECAP WVAR(3)/I5C = E(3,3) - E(3,4);AS 'WEST VARIANCE'END
The output is:
Assigning Column Reference Numbers
308

Example: Using NOPRINT, Field Reformatting, and COMPUTE With Column Notation
The following request has a field that is not printed, several reformatted fields and threecalculated values. With SET CNOTATION=PRINTONLY, the column references result in correctoutput.
SET CNOTATION = PRINTONLYDEFINE FILE LEDGERCUR_YR/I5C=AMOUNT;LAST_YR/I5C=.87*CUR_YR - 142;NEXT_YR/I5C=1.13*CUR_YR + 222;ENDTABLE FILE LEDGERSUM NEXT_YR NOPRINT CUR_YRCOMPUTE AMT2/D6 = AMOUNT *2;LAST_YR/D5 AMOUNT NEXT_YRCOMPUTE AMT3/D6 = AMOUNT*3;COMPUTE AMT4/D6 = AMOUNT*4;FOR ACCOUNT10$$ AS 'CASH' OVER1100 AS 'ACCTS. REC.' OVER1200 AS 'INVENTORY' OVERBAR OVERRECAP ATOT/I8C = R1 + R2 + R3; AS 'TOTAL' OVERRECAP DIFF(2,10,2)/D8 = ATOT(*) - ATOT(*-1);END
The output is:
Example: Using Column Notation With NOPRINT in a non-FML Request
The following request, sums TRANSTOT, QUANTITY, and TRANSCODE by TRANSDATE.TRANSTOT has the NOPRINT option, so it is not displayed on the report output. The requestalso calculates the following fields using COMPUTE commands:
TTOT2, which has the same value as TRANSTOT and displays on the report output.
UNIT_COST1, which is calculated by dividing column1 by column2.
UNIT_COST2, which is calculated by dividing column1 by QUANTITY.
5. Creating Temporary Fields
Creating Reports With TIBCO® WebFOCUS Language 309
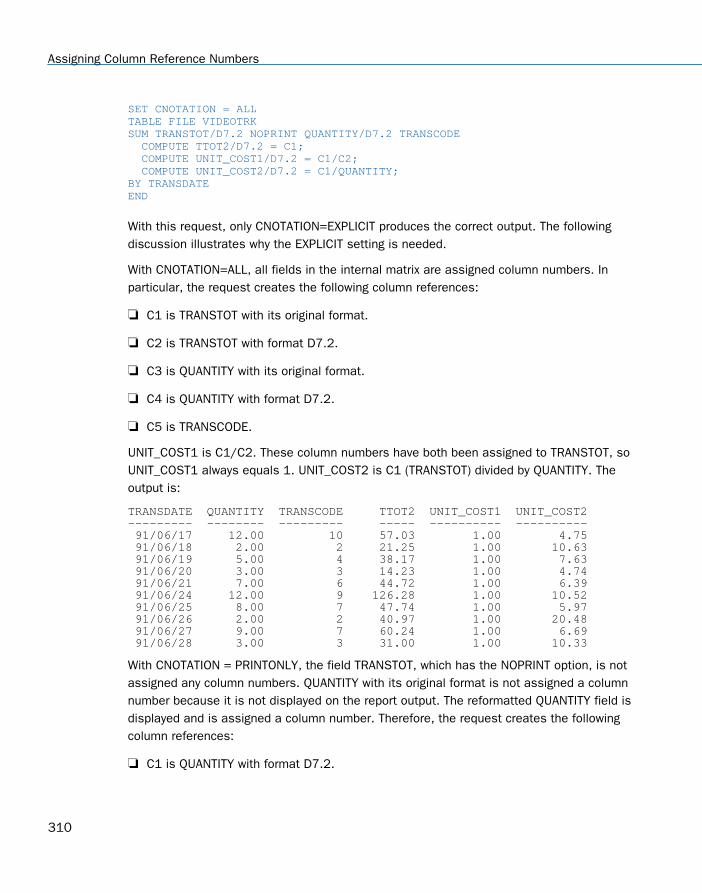
SET CNOTATION = ALLTABLE FILE VIDEOTRKSUM TRANSTOT/D7.2 NOPRINT QUANTITY/D7.2 TRANSCODE COMPUTE TTOT2/D7.2 = C1; COMPUTE UNIT_COST1/D7.2 = C1/C2; COMPUTE UNIT_COST2/D7.2 = C1/QUANTITY;BY TRANSDATEEND
With this request, only CNOTATION=EXPLICIT produces the correct output. The followingdiscussion illustrates why the EXPLICIT setting is needed.
With CNOTATION=ALL, all fields in the internal matrix are assigned column numbers. Inparticular, the request creates the following column references:
C1 is TRANSTOT with its original format.
C2 is TRANSTOT with format D7.2.
C3 is QUANTITY with its original format.
C4 is QUANTITY with format D7.2.
C5 is TRANSCODE.
UNIT_COST1 is C1/C2. These column numbers have both been assigned to TRANSTOT, soUNIT_COST1 always equals 1. UNIT_COST2 is C1 (TRANSTOT) divided by QUANTITY. Theoutput is:
TRANSDATE QUANTITY TRANSCODE TTOT2 UNIT_COST1 UNIT_COST2--------- -------- --------- ----- ---------- ---------- 91/06/17 12.00 10 57.03 1.00 4.75 91/06/18 2.00 2 21.25 1.00 10.63 91/06/19 5.00 4 38.17 1.00 7.63 91/06/20 3.00 3 14.23 1.00 4.74 91/06/21 7.00 6 44.72 1.00 6.39 91/06/24 12.00 9 126.28 1.00 10.52 91/06/25 8.00 7 47.74 1.00 5.97 91/06/26 2.00 2 40.97 1.00 20.48 91/06/27 9.00 7 60.24 1.00 6.69 91/06/28 3.00 3 31.00 1.00 10.33
With CNOTATION = PRINTONLY, the field TRANSTOT, which has the NOPRINT option, is notassigned any column numbers. QUANTITY with its original format is not assigned a columnnumber because it is not displayed on the report output. The reformatted QUANTITY field isdisplayed and is assigned a column number. Therefore, the request creates the followingcolumn references:
C1 is QUANTITY with format D7.2.
Assigning Column Reference Numbers
310

C2 is TRANSCODE.
UNIT_COST1 is C1/C2, QUANTITY/TRANSCODE. UNIT_COST2 is C1 (QUANTITY) divided byQUANTITY. Therefore, UNIT_COST2 always equals 1. The output is:
TRANSDATE QUANTITY TRANSCODE TTOT2 UNIT_COST1 UNIT_COST2--------- -------- --------- ----- ---------- ---------- 91/06/17 12.00 10 12.00 1.20 1.00 91/06/18 2.00 2 2.00 1.00 1.00 91/06/19 5.00 4 5.00 1.25 1.00 91/06/20 3.00 3 3.00 1.00 1.00 91/06/21 7.00 6 7.00 1.17 1.00 91/06/24 12.00 9 12.00 1.33 1.00 91/06/25 8.00 7 8.00 1.14 1.00 91/06/26 2.00 2 2.00 1.00 1.00 91/06/27 9.00 7 9.00 1.29 1.00 91/06/28 3.00 3 3.00 1.00 1.00
With CNOTATION = EXPLICIT, the reformatted TRANSTOT field is explicitly referenced in therequest, so it is assigned a column number even though it is not displayed. However, theTRANSTOT field with its original format is not assigned a column number. The QUANTITY fieldwith its original format is not assigned a column number because it is not explicitly referencedin the request. The reformatted QUANTITY field is assigned a column number. Therefore, therequest creates the following column references:
C1 is TRANSTOT with format D7.2.
C2 is QUANTITY with format D7.2.
C3 is TRANSCODE.
UNIT_COST1 is C1/C2, TRANSTOT/QUANTITY. UNIT_COST2 is C1 (TRANSTOT) divided byQUANTITY. Therefore, UNIT_COST2 always equals UNIT_COST1. The output is:
TRANSDATE QUANTITY TRANSCODE TTOT2 UNIT_COST1 UNIT_COST2--------- -------- --------- ----- ---------- ---------- 91/06/17 12.00 10 57.03 4.75 4.75 91/06/18 2.00 2 21.25 10.63 10.63 91/06/19 5.00 4 38.17 7.63 7.63 91/06/20 3.00 3 14.23 4.74 4.74 91/06/21 7.00 6 44.72 6.39 6.39 91/06/24 12.00 9 126.28 10.52 10.52 91/06/25 8.00 7 47.74 5.97 5.97 91/06/26 2.00 2 40.97 20.48 20.48 91/06/27 9.00 7 60.24 6.69 6.69 91/06/28 3.00 3 31.00 10.33 10.33
5. Creating Temporary Fields
Creating Reports With TIBCO® WebFOCUS Language 311
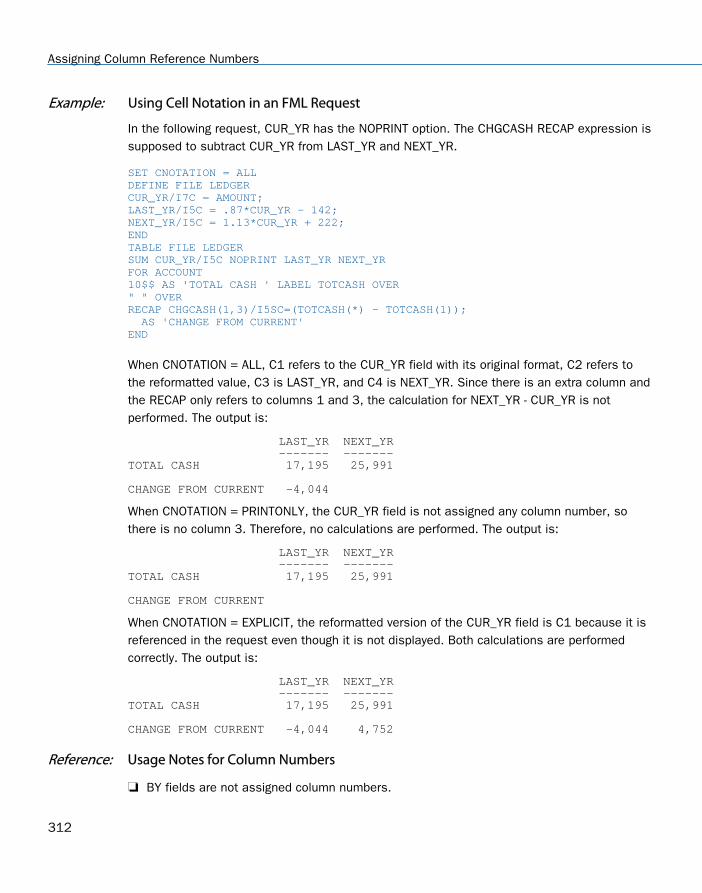
Example: Using Cell Notation in an FML Request
In the following request, CUR_YR has the NOPRINT option. The CHGCASH RECAP expression issupposed to subtract CUR_YR from LAST_YR and NEXT_YR.
SET CNOTATION = ALLDEFINE FILE LEDGERCUR_YR/I7C = AMOUNT;LAST_YR/I5C = .87*CUR_YR - 142;NEXT_YR/I5C = 1.13*CUR_YR + 222;ENDTABLE FILE LEDGERSUM CUR_YR/I5C NOPRINT LAST_YR NEXT_YRFOR ACCOUNT10$$ AS 'TOTAL CASH ' LABEL TOTCASH OVER" " OVERRECAP CHGCASH(1,3)/I5SC=(TOTCASH(*) - TOTCASH(1)); AS 'CHANGE FROM CURRENT'END
When CNOTATION = ALL, C1 refers to the CUR_YR field with its original format, C2 refers tothe reformatted value, C3 is LAST_YR, and C4 is NEXT_YR. Since there is an extra column andthe RECAP only refers to columns 1 and 3, the calculation for NEXT_YR - CUR_YR is notperformed. The output is:
LAST_YR NEXT_YR ------- -------TOTAL CASH 17,195 25,991 CHANGE FROM CURRENT -4,044
When CNOTATION = PRINTONLY, the CUR_YR field is not assigned any column number, sothere is no column 3. Therefore, no calculations are performed. The output is:
LAST_YR NEXT_YR ------- -------TOTAL CASH 17,195 25,991 CHANGE FROM CURRENT
When CNOTATION = EXPLICIT, the reformatted version of the CUR_YR field is C1 because it isreferenced in the request even though it is not displayed. Both calculations are performedcorrectly. The output is:
LAST_YR NEXT_YR ------- -------TOTAL CASH 17,195 25,991 CHANGE FROM CURRENT -4,044 4,752
Reference: Usage Notes for Column Numbers
BY fields are not assigned column numbers.
Assigning Column Reference Numbers
312

ACROSS columns are assigned column numbers.
Calculated fields are assigned column numbers.
Column numbers outside the range of the columns created in the request are allowedunder the following circumstances (and are treated as containing the value zero):
When specified in a COMPUTE command issued after an ACROSS phrase.
In a cell reference in an FML RECAP command.
In those cases, it is not possible to know in advance how many columns will be generatedby the syntax. Using a column number outside of the range in any other context generatesthe following message:
(FOC258) FIELDNAME OR COMPUTATIONAL ELEMENT NOT RECOGNIZED: column
Using FORECAST in a COMPUTE Command
A version of the FORECAST feature was implemented for use in a RECAP command. However,the use of RECAP imposes limitations on placement of the FORECAST field in the output anduse of sort fields.
Using FORECAST in a COMPUTE command eliminates these limitations and enables you toplace the FORECAST calculation in a Master File. For the COMPUTE version of FORECAST, eachtype of calculation has its own version of the FORECAST function.
Calculating Trends and Predicting Values With FORECAST
You can calculate trends in numeric data and predict values beyond the range of those storedin the data source by using the FORECAST feature. FORECAST can be used in a report or graphrequest.
The calculations you can make to identify trends and forecast values are:
Simple moving average (FORECAST_MOVAVE). Calculates a series of arithmetic meansusing a specified number of values from a field. For details, see FORECAST_MOVAVE: Usinga Simple Moving Average on page 315.
Exponential moving average. Calculates a weighted average between the previouslycalculated value of the average and the next data point. There are three methods for usingan exponential moving average:
Single exponential smoothing (FORECAST_EXPAVE). Calculates an average that allowsyou to choose weights to apply to newer and older values. For details, see FORECAST_EXPAVE: Using Single Exponential Smoothing on page 320.
5. Creating Temporary Fields
Creating Reports With TIBCO® WebFOCUS Language 313

Double exponential smoothing (FORECAST_DOUBLEXP). Accounts for the tendency ofdata to either increase or decrease over time without repeating. For details, see FORECAST_DOUBLEXP: Using Double Exponential Smoothing on page 324.
Triple exponential smoothing (FORECAST_SEASONAL). Accounts for the tendency ofdata to repeat itself in intervals over time. For details, see FORECAST_SEASONAL: UsingTriple Exponential Smoothing on page 326.
Linear regression analysis (FORECAST_LINEAR). Derives the coefficients of a straight linethat best fits the data points and uses this linear equation to estimate values. For details,see FORECAST_LINEAR: Using a Linear Regression Equation on page 331.
When predicting values in addition to calculating trends, FORECAST continues the samecalculations beyond the data points by using the generated trend values as new data points.For the linear regression technique, the calculated regression equation is used to derive trendand predicted values.
FORECAST performs the calculations based on the data provided, but decisions about theiruse and reliability are the responsibility of the user. Therefore, the user is responsible fordetermining the reliability of the FORECAST predictions, based on the many factors thatdetermine how accurate a prediction will be.
FORECAST Processing
You invoke FORECAST processing by including one of the FORECAST functions in a COMPUTEcommand. FORECAST performs the specified calculation for all the existing data points andthen continues them to generate the number of predicted values that you request. Theparameters needed for FORECAST include the field to use in the calculations, the number ofpredictions to generate, and whether to display the input field values or the calculated valueson the report output for the rows that represent existing data points.
FORECAST operates on the lowest sort field in the request. This is either the last ACROSS fieldin the request or, if the request does not contain an ACROSS field, it is the last BY field. TheFORECAST calculations start over when the highest-level sort field changes its value. In arequest with multiple display commands, FORECAST operates on the last ACROSS field (or ifthere are no ACROSS fields, the last BY field) of the last display command. When using anACROSS field with FORECAST, the display command must be SUM or COUNT.
Reference: Usage Notes for FORECAST
The sort field used for FORECAST must be in a numeric or date format.
When using simple moving average and exponential moving average methods, data valuesshould be spaced evenly in order to get meaningful results.
Using FORECAST in a COMPUTE Command
314

The use of column notation is not supported in the FORECAST expression. Column notationcontinues to be supported as before outside of this expression. The process of generatingthe FORECAST values creates extra columns that are not printed in the report output. Thenumber and placement of these additional columns varies depending on the specificrequest.
Missing values may lead to unexpected or unusable results and are not recommended foruse with FORECAST_LINEAR.
If you use the ESTRECORDS parameter to enable the external sort to better estimate theamount of sort work space needed, you must take into account that FORECAST withpredictions creates additional records in the output.
In a styled report, you can assign specific attributes to values predicted by FORECAST withthe StyleSheet attribute WHEN=FORECAST. For example, to make the predicted valuesdisplay with the color red, use the following syntax in the TABLE request:
ON TABLE SET STYLE *TYPE=DATA,COLUMN=MYFORECASTSORTFIELD,WHEN=FORECAST,COLOR=RED,$ENDSTYLE
Reference: FORECAST Limits
The following are not supported with a COMPUTE command that uses FORECAST:
BY TOTAL command.
MORE, MATCH, FOR, and OVER phrases.
FORECAST_MOVAVE: Using a Simple Moving Average
A simple moving average is a series of arithmetic means calculated with a specified number ofvalues from a field. Each new mean in the series is calculated by dropping the first value usedin the prior calculation, and adding the next data value to the calculation.
Simple moving averages are sometimes used to analyze trends in stock prices over time. Inthis scenario, the average is calculated using a specified number of periods of stock prices. Adisadvantage to this indicator is that because it drops the oldest values from the calculationas it moves on, it loses its memory over time. Also, mean values are distorted by extremehighs and lows, since this method gives equal weight to each point.
Predicted values beyond the range of the data values are calculated using a moving averagethat treats the calculated trend values as new data points.
5. Creating Temporary Fields
Creating Reports With TIBCO® WebFOCUS Language 315

The first complete moving average occurs at the nth data point because the calculationrequires n values. This is called the lag. The moving average values for the lag rows arecalculated as follows: the first value in the moving average column is equal to the first datavalue, the second value in the moving average column is the average of the first two datavalues, and so on until the nth row, at which point there are enough values to calculate themoving average with the number of values specified.
Syntax: How to Calculate a Simple Moving Average Column
FORECAST_MOVAVE(display, infield, interval, npredict, npoint1)
where:
display
Keyword
Specifies which values to display for rows of output that represent existing data. Validvalues are:
INPUT_FIELD. This displays the original field values for rows that represent existingdata.
MODEL_DATA. This displays the calculated values for rows that represent existingdata.
Note: You can show both types of output for any field by creating two independentCOMPUTE commands in the same request, each with a different display option.
infieldIs any numeric field. It can be the same field as the result field, or a different field. Itcannot be a date-time field or a numeric field with date display options.
intervalIs the increment to add to each sort field value (after the last data point) to create thenext value. This must be a positive integer. To sort in descending order, use the BYHIGHEST phrase. The result of adding this number to the sort field values is convertedto the same format as the sort field.
For date fields, the minimal component in the format determines how the number isinterpreted. For example, if the format is YMD, MDY, or DMY, an interval value of 2 isinterpreted as meaning two days. If the format is YM, the 2 is interpreted as meaning twomonths.
Using FORECAST in a COMPUTE Command
316

npredictIs the number of predictions for FORECAST to calculate. It must be an integer greaterthan or equal to zero. Zero indicates that you do not want predictions, and is onlysupported with a non-recursive FORECAST.
npoint1Is the number of values to average for the MOVAVE method.
Example: Calculating a New Simple Moving Average Column
This request defines an integer value named PERIOD to use as the independent variable forthe moving average. It predicts three periods of values beyond the range of the retrieved data.The MOVAVE column on the report output shows the calculated moving average numbers forexisting data points.
DEFINE FILE GGSALESSDATE/YYM = DATE;SYEAR/Y = SDATE;SMONTH/M = SDATE;PERIOD/I2 = SMONTH;ENDTABLE FILE GGSALESSUM UNITS DOLLARSCOMPUTE MOVAVE/D10.1= FORECAST_MOVAVE(MODEL_DATA, DOLLARS,1,3,3);BY CATEGORY BY PERIODWHERE SYEAR EQ 97 AND CATEGORY NE 'Gifts'ON TABLE SET STYLE *GRID=OFF,$ENDSTYLEEND
5. Creating Temporary Fields
Creating Reports With TIBCO® WebFOCUS Language 317

The output is:
In the report, the number of values to use in the average is 3 and there are no UNITS orDOLLARS values for the generated PERIOD values.
Each average (MOVAVE value) is computed using DOLLARS values where they exist. Thecalculation of the moving average begins in the following way:
The first MOVAVE value (801,123.0) is equal to the first DOLLARS value.
Using FORECAST in a COMPUTE Command
318

The second MOVAVE value (741,731.5) is the mean of DOLLARS values one and two:(801,123 + 682,340) /2.
The third MOVAVE value (749,513.7) is the mean of DOLLARS values one through three:(801,123 + 682,340 + 765,078) / 3.
The fourth MOVAVE value (712,897.3) is the mean of DOLLARS values two through four:(682,340 + 765,078 + 691,274) /3.
For predicted values beyond the supplied values, the calculated MOVAVE values are used asnew data points to continue the moving average. The predicted MOVAVE values (starting with694,975.6 for PERIOD 13) are calculated using the previous MOVAVE values as new datapoints. For example, the first predicted value (694,975.6) is the average of the data pointsfrom periods 11 and 12 (620,264 and 762,328) and the moving average for period 12(702,334.7). The calculation is: 694,975 = (620,264 + 762,328 + 702,334.7)/3.
Example: Displaying Original Field Values in a Simple Moving Average Column
This request defines an integer value named PERIOD to use as the independent variable forthe moving average. It predicts three periods of values beyond the range of the retrieved data.It uses the keyword INPUT_FIELD as the first argument in the FORECAST parameter list. Thetrend values do not display in the report. The actual data values for DOLLARS are followed bythe predicted values in the report column.
DEFINE FILE GGSALESSDATE/YYM = DATE;SYEAR/Y = SDATE;SMONTH/M = SDATE;PERIOD/I2 = SMONTH;ENDTABLE FILE GGSALESSUM UNITS DOLLARSCOMPUTE MOVAVE/D10.1 = FORECAST_MOVAVE(INPUT_FIELD,DOLLARS,1,3,3);BY CATEGORY BY PERIODWHERE SYEAR EQ 97 AND CATEGORY NE 'Gifts'ON TABLE SET STYLE *GRID=OFF,$ENDSTYLEEND
5. Creating Temporary Fields
Creating Reports With TIBCO® WebFOCUS Language 319

The output is shown in the following image:
FORECAST_EXPAVE: Using Single Exponential Smoothing
The single exponential smoothing method calculates an average that allows you to chooseweights to apply to newer and older values.
The following formula determines the weight given to the newest value.
k = 2/(1+n)
where:k
Is the newest value.
Using FORECAST in a COMPUTE Command
320

nIs an integer greater than one. Increasing n increases the weight assigned to the earlierobservations (or data instances), as compared to the later ones.
The next calculation of the exponential moving average (EMA) value is derived by the followingformula:
EMA = (EMA * (1-k)) + (datavalue * k)
This means that the newest value from the data source is multiplied by the factor k and thecurrent moving average is multiplied by the factor (1-k). These quantities are then summed togenerate the new EMA.
Note: When the data values are exhausted, the last data value in the sort group is used as thenext data value.
Syntax: How to Calculate a Single Exponential Smoothing Column
FORECAST_EXPAVE(display, infield, interval, npredict, npoint1)
where:
display
Keyword
Specifies which values to display for rows of output that represent existing data. Validvalues are:
INPUT_FIELD. This displays the original field values for rows that represent existingdata.
MODEL_DATA. This displays the calculated values for rows that represent existingdata.
Note: You can show both types of output for any field by creating two independentCOMPUTE commands in the same request, each with a different display option.
infieldIs any numeric field. It can be the same field as the result field, or a different field. Itcannot be a date-time field or a numeric field with date display options.
intervalIs the increment to add to each sort field value (after the last data point) to create thenext value. This must be a positive integer. To sort in descending order, use the BYHIGHEST phrase. The result of adding this number to the sort field values is convertedto the same format as the sort field.
5. Creating Temporary Fields
Creating Reports With TIBCO® WebFOCUS Language 321

For date fields, the minimal component in the format determines how the number isinterpreted. For example, if the format is YMD, MDY, or DMY, an interval value of 2 isinterpreted as meaning two days. If the format is YM, the 2 is interpreted as meaning twomonths.
npredictIs the number of predictions for FORECAST to calculate. It must be an integer greaterthan or equal to zero. Zero indicates that you do not want predictions, and is onlysupported with a non-recursive FORECAST.
npoint1For EXPAVE, this number is used to calculate the weights for each component in theaverage. This value must be a positive whole number. The weight, k, is calculated bythe following formula:
k=2/(1+npoint1)
Example: Calculating a Single Exponential Smoothing Column
The following defines an integer value named PERIOD to use as the independent variable forthe moving average. It predicts three periods of values beyond the range of retrieved data.
DEFINE FILE GGSALESSDATE/YYM = DATE;SYEAR/Y = SDATE;SMONTH/M = SDATE;PERIOD/I2 = SMONTH;ENDTABLE FILE GGSALESSUM UNITS DOLLARSCOMPUTE EXPAVE/D10.1= FORECAST_EXPAVE(MODEL_DATA,DOLLARS,1,3,3);BY CATEGORY BY PERIODWHERE SYEAR EQ 97 AND CATEGORY NE 'Gifts'ON TABLE SET STYLE *GRID=OFF,$ENDSTYLEEND
Using FORECAST in a COMPUTE Command
322
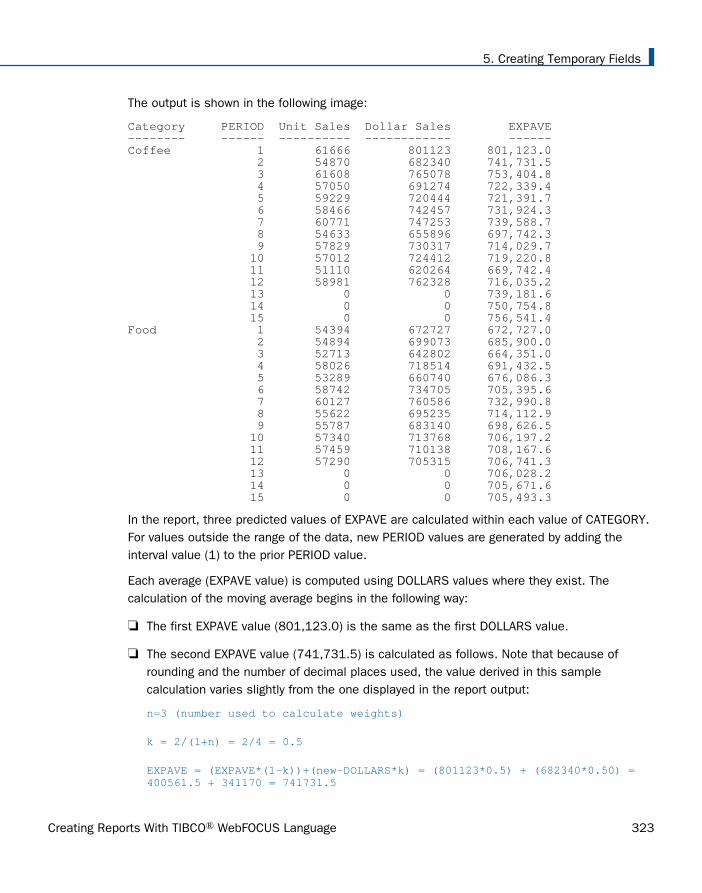
The output is shown in the following image:
Category PERIOD Unit Sales Dollar Sales EXPAVE-------- ------ ---------- ------------ ------Coffee 1 61666 801123 801,123.0 2 54870 682340 741,731.5 3 61608 765078 753,404.8 4 57050 691274 722,339.4 5 59229 720444 721,391.7 6 58466 742457 731,924.3 7 60771 747253 739,588.7 8 54633 655896 697,742.3 9 57829 730317 714,029.7 10 57012 724412 719,220.8 11 51110 620264 669,742.4 12 58981 762328 716,035.2 13 0 0 739,181.6 14 0 0 750,754.8 15 0 0 756,541.4Food 1 54394 672727 672,727.0 2 54894 699073 685,900.0 3 52713 642802 664,351.0 4 58026 718514 691,432.5 5 53289 660740 676,086.3 6 58742 734705 705,395.6 7 60127 760586 732,990.8 8 55622 695235 714,112.9 9 55787 683140 698,626.5 10 57340 713768 706,197.2 11 57459 710138 708,167.6 12 57290 705315 706,741.3 13 0 0 706,028.2 14 0 0 705,671.6 15 0 0 705,493.3
In the report, three predicted values of EXPAVE are calculated within each value of CATEGORY.For values outside the range of the data, new PERIOD values are generated by adding theinterval value (1) to the prior PERIOD value.
Each average (EXPAVE value) is computed using DOLLARS values where they exist. Thecalculation of the moving average begins in the following way:
The first EXPAVE value (801,123.0) is the same as the first DOLLARS value.
The second EXPAVE value (741,731.5) is calculated as follows. Note that because ofrounding and the number of decimal places used, the value derived in this samplecalculation varies slightly from the one displayed in the report output:
n=3 (number used to calculate weights)
k = 2/(1+n) = 2/4 = 0.5
EXPAVE = (EXPAVE*(1-k))+(new-DOLLARS*k) = (801123*0.5) + (682340*0.50) = 400561.5 + 341170 = 741731.5
5. Creating Temporary Fields
Creating Reports With TIBCO® WebFOCUS Language 323

The third EXPAVE value (753,404.8) is calculated as follows:
EXPAVE = (EXPAVE*(1-k))+(new-DOLLARS*k) = (741731.5*0.5)+(765078*0.50) = 370865.75 + 382539 = 753404.75
FORECAST_DOUBLEXP: Using Double Exponential Smoothing
Double exponential smoothing produces an exponential moving average that takes intoaccount the tendency of data to either increase or decrease over time without repeating. Thisis accomplished by using two equations with two constants.
The first equation accounts for the current time period and is a weighted average of thecurrent data value and the prior average, with an added component (b) that represents thetrend for the previous period. The weight constant is k:
DOUBLEXP(t) = k * datavalue(t) + (1-k) * ((DOUBLEXP(t-1) + b(t-1))
The second equation is the calculated trend value, and is a weighted average of thedifference between the current and previous average and the trend for the previous timeperiod. b(t) represents the average trend. The weight constant is g:
b(t) = g * (DOUBLEXP(t)-DOUBLEXP(t-1)) + (1 - g) * (b(t-1))
These two equations are solved to derive the smoothed average. The first smoothed average isset to the first data value. The first trend component is set to zero. For choosing the twoconstants, the best results are usually obtained by minimizing the mean-squared error (MSE)between the data values and the calculated averages. You may need to use nonlinearoptimization techniques to find the optimal constants.
The equation used for forecasting beyond the data points with double exponential smoothing is
forecast(t+m) = DOUBLEXP(t) + m * b(t)
where:
mIs the number of time periods ahead for the forecast.
Syntax: How to Calculate a Double Exponential Smoothing Column
FORECAST_DOUBLEXP(display, infield,interval, npredict, npoint1, npoint2)
Using FORECAST in a COMPUTE Command
324

where:
display
Keyword
Specifies which values to display for rows of output that represent existing data. Validvalues are:
INPUT_FIELD. This displays the original field values for rows that represent existingdata.
MODEL_DATA. This displays the calculated values for rows that represent existingdata.
Note: You can show both types of output for any field by creating two independentCOMPUTE commands in the same request, each with a different display option.
infieldIs any numeric field. It can be the same field as the result field, or a different field. Itcannot be a date-time field or a numeric field with date display options.
intervalIs the increment to add to each sort field value (after the last data point) to create thenext value. This must be a positive integer. To sort in descending order, use the BYHIGHEST phrase. The result of adding this number to the sort field values is convertedto the same format as the sort field.
For date fields, the minimal component in the format determines how the number isinterpreted. For example, if the format is YMD, MDY, or DMY, an interval value of 2 isinterpreted as meaning two days. If the format is YM, the 2 is interpreted as meaning twomonths.
npredictIs the number of predictions for FORECAST to calculate. It must be an integer greaterthan or equal to zero. Zero indicates that you do not want predictions, and is onlysupported with a non-recursive FORECAST.
npoint1For DOUBLEXP, this number is used to calculate the weights for each component inthe average. This value must be a positive whole number. The weight, k, is calculatedby the following formula:
k=2/(1+npoint1)
npoint2For DOUBLEXP, this positive whole number is used to calculate the weights for eachterm in the trend. The weight, g, is calculated by the following formula:
5. Creating Temporary Fields
Creating Reports With TIBCO® WebFOCUS Language 325

g=2/(1+npoint2)
Example: Calculating a Double Exponential Smoothing Column
The following sums the TRANSTOT field of the VIDEOTRK data source by TRANSDATE, andcalculates a single exponential and double exponential moving average. The report columnsshow the calculated values for existing data points.
TABLE FILE VIDEOTRKSUM TRANSTOTCOMPUTE EXP/D15.1 = FORECAST_EXPAVE(MODEL_DATA,TRANSTOT,1,0,3);DOUBLEXP/D15.1 = FORECAST_DOUBLEXP(MODEL_DATA,TRANSTOT,1,0,3,3);BY TRANSDATEWHERE TRANSDATE NE '19910617'ON TABLE SET STYLE *GRID=OFF,$END
The output is shown in the following image:
FORECAST_SEASONAL: Using Triple Exponential Smoothing
Triple exponential smoothing produces an exponential moving average that takes into accountthe tendency of data to repeat itself in intervals over time. For example, sales data that isgrowing and in which 25% of sales always occur during December contains both trend andseasonality. Triple exponential smoothing takes both the trend and seasonality into account byusing three equations with three constants.
Using FORECAST in a COMPUTE Command
326

For triple exponential smoothing you, need to know the number of data points in each timeperiod (designated as L in the following equations). To account for the seasonality, a seasonalindex is calculated. The data is divided by the prior season index and then used in calculatingthe smoothed average.
The first equation accounts for the current time period, and is a weighted average of thecurrent data value divided by the seasonal factor and the prior average adjusted for thetrend for the previous period. The weight constant is k:
SEASONAL(t) = k * (datavalue(t)/I(t-L)) + (1-k) * (SEASONAL(t-1) + b(t-1))
The second equation is the calculated trend value, and is a weighted average of thedifference between the current and previous average and the trend for the previous timeperiod. b(t) represents the average trend. The weight constant is g:
b(t) = g * (SEASONAL(t)-SEASONAL(t-1)) + (1-g) * (b(t-1))
The third equation is the calculated seasonal index, and is a weighted average of thecurrent data value divided by the current average and the seasonal index for the previousseason. I(t) represents the average seasonal coefficient. The weight constant is p:
I(t) = p * (datavalue(t)/SEASONAL(t)) + (1 - p) * I(t-L)
These equations are solved to derive the triple smoothed average. The first smoothed averageis set to the first data value. Initial values for the seasonality factors are calculated based onthe maximum number of full periods of data in the data source, while the initial trend iscalculated based on two periods of data. These values are calculated with the following steps:
1. The initial trend factor is calculated by the following formula:
b(0) = (1/L) ((y(L+1)-y(1))/L + (y(L+2)-y(2))/L + ... + (y(2L) - y(L))/L )
2. The calculation of the initial seasonality factor is based on the average of the data valueswithin each period, A(j) (1<=j<=N):
A(j) = ( y((j-1)L+1) + y((j-1)L+2) + ... + y(jL) ) / L
3. Then, the initial periodicity factor is given by the following formula, where N is the numberof full periods available in the data, L is the number of points per period and n is a pointwithin the period (1<= n <= L):
I(n) = ( y(n)/A(1) + y(L+n)/A(2) + ... + y((N-1)L+n)/A(N) ) / N
5. Creating Temporary Fields
Creating Reports With TIBCO® WebFOCUS Language 327

The three constants must be chosen carefully. The best results are usually obtained bychoosing the constants to minimize the mean-squared error (MSE) between the data valuesand the calculated averages. Varying the values of npoint1 and npoint2 affect the results, andsome values may produce a better approximation. To search for a better approximation, youmay want to find values that minimize the MSE.
The equation used to forecast beyond the last data point with triple exponential smoothing is:
forecast(t+m) = (SEASONAL(t) + m * b(t)) / I(t-L+MOD(m/L))
where:
mIs the number of periods ahead for the forecast.
Syntax: How to Calculate a Triple Exponential Smoothing Column
FORECAST_SEASONAL(display, infield,interval, npredict, nperiod, npoint1, npoint2, npoint3)
where:
display
Keyword
Specifies which values to display for rows of output that represent existing data. Validvalues are:
INPUT_FIELD. This displays the original field values for rows that represent existingdata.
MODEL_DATA. This displays the calculated values for rows that represent existingdata.
Note: You can show both types of output for any field by creating two independentCOMPUTE commands in the same request, each with a different display option.
infieldIs any numeric field. It can be the same field as the result field, or a different field. Itcannot be a date-time field or a numeric field with date display options.
intervalIs the increment to add to each sort field value (after the last data point) to create thenext value. This must be a positive integer. To sort in descending order, use the BYHIGHEST phrase. The result of adding this number to the sort field values is convertedto the same format as the sort field.
Using FORECAST in a COMPUTE Command
328

For date fields, the minimal component in the format determines how the number isinterpreted. For example, if the format is YMD, MDY, or DMY, an interval value of 2 isinterpreted as meaning two days. If the format is YM, the 2 is interpreted as meaning twomonths.
npredictIs the number of predictions for FORECAST to calculate. It must be an integer greaterthan or equal to zero. Zero indicates that you do not want predictions, and is onlysupported with a non-recursive FORECAST. For the SEASONAL method, npredict is thenumber of periods to calculate. The number of points generated is:
nperiod * npredict
nperiodFor the SEASONAL method, is a positive whole number that specifies the number ofdata points in a period.
npoint1For SEASONAL, this number is used to calculate the weights for each component inthe average. This value must be a positive whole number. The weight, k, is calculatedby the following formula:
k=2/(1+npoint1)
npoint2For SEASONAL, this positive whole number is used to calculate the weights for eachterm in the trend. The weight, g, is calculated by the following formula:
g=2/(1+npoint2)
npoint3For SEASONAL, this positive whole number is used to calculate the weights for eachterm in the seasonal adjustment. The weight, p, is calculated by the following formula:
p=2/(1+npoint3)
5. Creating Temporary Fields
Creating Reports With TIBCO® WebFOCUS Language 329

Example: Calculating a Triple Exponential Smoothing Column
In the following, the data has seasonality but no trend. Therefore, npoint2 is set high (1000) tomake the trend factor negligible in the calculation:
TABLE FILE VIDEOTRKSUM TRANSTOTCOMPUTE SEASONAL/D10.1 = FORECAST_SEASONAL(MODEL_DATA,TRANSTOT,1,3,3,3,1000,1);BY TRANSDATEWHERE TRANSDATE NE '19910617'ON TABLE SET STYLE *GRID=OFF,$ENDSTYLEEND
In the output, npredict is 3. Therefore, three periods (nine points, nperiod * npredict) aregenerated.
Using FORECAST in a COMPUTE Command
330

FORECAST_LINEAR: Using a Linear Regression Equation
The linear regression equation estimates values by assuming that the dependent variable (thenew calculated values) and the independent variable (the sort field values) are related by afunction that represents a straight line:
y = mx + b
where:
yIs the dependent variable.
xIs the independent variable.
mIs the slope of the line.
bIs the y-intercept.
FORECAST_LINEAR uses a technique called Ordinary Least Squares to calculate values for mand b that minimize the sum of the squared differences between the data and the resultingline.
The following formulas show how m and b are calculated.
where:
nIs the number of data points.
yIs the data values (dependent variables).
xIs the sort field values (independent variables).
Trend values, as well as predicted values, are calculated using the regression line equation.
5. Creating Temporary Fields
Creating Reports With TIBCO® WebFOCUS Language 331

Syntax: How to Calculate a Linear Regression Column
FORECAST_LINEAR(display, infield, interval, npredict)
where:
display
Keyword
Specifies which values to display for rows of output that represent existing data. Validvalues are:
INPUT_FIELD. This displays the original field values for rows that represent existingdata.
MODEL_DATA. This displays the calculated values for rows that represent existingdata.
Note: You can show both types of output for any field by creating two independentCOMPUTE commands in the same request, each with a different display option.
infieldIs any numeric field. It can be the same field as the result field, or a different field. Itcannot be a date-time field or a numeric field with date display options.
intervalIs the increment to add to each sort field value (after the last data point) to create thenext value. This must be a positive integer. To sort in descending order, use the BYHIGHEST phrase. The result of adding this number to the sort field values is convertedto the same format as the sort field.
For date fields, the minimal component in the format determines how the number isinterpreted. For example, if the format is YMD, MDY, or DMY, an interval value of 2 isinterpreted as meaning two days. If the format is YM, the 2 is interpreted as meaning twomonths.
npredictIs the number of predictions for FORECAST to calculate. It must be an integer greaterthan or equal to zero. Zero indicates that you do not want predictions, and is onlysupported with a non-recursive FORECAST.
Using FORECAST in a COMPUTE Command
332

Example: Calculating a New Linear Regression Field
The following request calculates a regression line using the VIDEOTRK data source ofQUANTITY by TRANSDATE. The interval is one day, and three predicted values are calculated.
TABLE FILE VIDEOTRKSUM QUANTITYCOMPUTE FORTOT=FORECAST_LINEAR(MODEL_DATA,QUANTITY,1,3);BY TRANSDATEON TABLE SET PAGE NOLEADON TABLE SET STYLE *GRID=OFF,$ENDSTYLEEND
The output is shown in the following image:
Note:
Three predicted values of FORTOT are calculated. For values outside the range of the data,new TRANSDATE values are generated by adding the interval value (1) to the priorTRANSDATE value.
There are no QUANTITY values for the generated FORTOT values.
Each FORTOT value is computed using a regression line, calculated using all of the actualdata values for QUANTITY.
5. Creating Temporary Fields
Creating Reports With TIBCO® WebFOCUS Language 333

TRANSDATE is the independent variable (x) and QUANTITY is the dependent variable (y).The equation is used to calculate QUANTITY FORECAST trend and predicted values.
The following version of the request charts the data values and the regression line.
GRAPH FILE VIDEOTRKSUM QUANTITYCOMPUTE FORTOT=FORECAST_LINEAR(MODEL_DATA,QUANTITY,1,3);BY TRANSDATEON GRAPH PCHOLD FORMAT JSCHARTON GRAPH SET LOOKGRAPH VLINEEND
The output is shown in the following image.
Distinguishing Data Rows From Predicted Rows
To make the report output easier to interpret, you can create a field that indicates whether theFORECAST value in each row is a predicted value. To do this, define a virtual field whose valueis a constant other than zero. Rows in the report output that represent actual records in thedata source will appear with a value that is not zero. Rows that represent predicted values willdisplay zero. You can also propagate this field to a HOLD file.
Using FORECAST in a COMPUTE Command
334

Example: Distinguishing Data Rows From Predicted Rows
In the following example, the DATA_ROW virtual field has the value 1 for each row in the datasource. It has the value zero for the predicted rows. The PREDICT field is calculated as YES forpredicted rows, and NO for rows containing data. In addition, the StyleSheet attributeWHEN=FORECAST is used to display the predicted values for the FORTOT field in red.
DEFINE FILE VIDEOTRKDATA_ROW/I1 = 1;ENDTABLE FILE VIDEOTRKSUM TRANSTOT DATA_ROWCOMPUTE PREDICT/A3 = IF DATA_ROW NE 0 THEN 'NO' ELSE 'YES' ;FORTOT/D12.2=FORECAST_LINEAR(MODEL_DATA,TRANSTOT,1,3);BY TRANSDATEON TABLE SET PAGE NOLEADON TABLE SET STYLE *GRID=OFF,$TYPE=DATA, COLUMN=FORTOT, WHEN=FORECAST, COLOR=RED,$ENDSTYLEEND
The output is shown in the following image:
5. Creating Temporary Fields
Creating Reports With TIBCO® WebFOCUS Language 335

Calculating Trends and Predicting Values With FORECAST
You can calculate trends in numeric data and predict values beyond the range of those storedin the data source by using the FORECAST feature. FORECAST can be used in a report or graphrequest.
The calculations you can make to identify trends and forecast values are:
Simple moving average (MOVAVE). Calculates a series of arithmetic means using aspecified number of values from a field. For details, see Using a Simple Moving Average onpage 341.
Exponential moving average. Calculates a weighted average between the previouslycalculated value of the average and the next data point. There are three methods for usingan exponential moving average:
Single exponential smoothing (EXPAVE). Calculates an average that allows you tochoose weights to apply to newer and older values. For details, see Using SingleExponential Smoothing on page 345.
Double exponential smoothing (DOUBLEXP). Accounts for the tendency of data toeither increase or decrease over time without repeating. For details, see Using DoubleExponential Smoothing on page 347.
Triple exponential smoothing (SEASONAL). Accounts for the tendency of data to repeatitself in intervals over time. For details, see Using Triple Exponential Smoothing on page349.
Linear regression analysis (REGRESS). Derives the coefficients of a straight line that bestfits the data points and uses this linear equation to estimate values. For details, see UsageNotes for Creating Virtual Fields on page 281.
When predicting values in addition to calculating trends, FORECAST continues the samecalculations beyond the data points by using the generated trend values as new data points.For the linear regression technique, the calculated regression equation is used to derive trendand predicted values.
FORECAST performs the calculations based on the data provided, but decisions about theiruse and reliability are the responsibility of the user. Therefore, FORECAST predictions are notalways reliable, and many factors determine how accurate a prediction will be.
Calculating Trends and Predicting Values With FORECAST
336

FORECAST Processing
You invoke FORECAST processing by including FORECAST in a RECAP command. In thiscommand, you specify the parameters needed for generating estimated values, including thefield to use in the calculations, the type of calculation to use, and the number of predictions togenerate. The RECAP field that contains the result of FORECAST can be a new field (non-recursive) or the same field used in the FORECAST calculations (recursive):
In a recursive FORECAST, the RECAP field that contains the results is also the field used togenerate the FORECAST calculations. In this case, the original field is not printed even if itwas referenced in the display command, and the RECAP column contains the original fieldvalues followed by the number of predicted values specified in the FORECAST syntax. Notrend values display in the report. However, the original column is stored in an output fileunless you set HOLDLIST to PRINTONLY.
In a non-recursive FORECAST, a new field contains the results of FORECAST calculations.The new field is displayed in the report along with the original field when it is referenced inthe display command. The new field contains trend values and forecast values whenspecified.
FORECAST operates on the last ACROSS field in the request. If the request does not containan ACROSS field, it operates on the last BY field. The FORECAST calculations start over whenthe highest-level sort field changes its value. In a request with multiple display commands,FORECAST operates on the last ACROSS field (or if there are no ACROSS fields, the last BYfield) of the last display command. When using an ACROSS field with FORECAST, the displaycommand must be SUM or COUNT.
Note: Although you pass parameters to FORECAST using an argument list in parentheses,FORECAST is not a function. It can coexist with a function of the same name, as long as thefunction is not specified in a RECAP command.
Syntax: How to Calculate Trends and Predict Values
MOVAVE calculation
ON sortfield RECAP result_field[/fmt] = FORECAST(infield, interval, npredict, 'MOVAVE',npoint1)sendstyle
EXPAVE calculation
ON sortfield RECAP result_field[/fmt] = FORECAST(infield, interval, npredict, 'EXPAVE',npoint1);
5. Creating Temporary Fields
Creating Reports With TIBCO® WebFOCUS Language 337
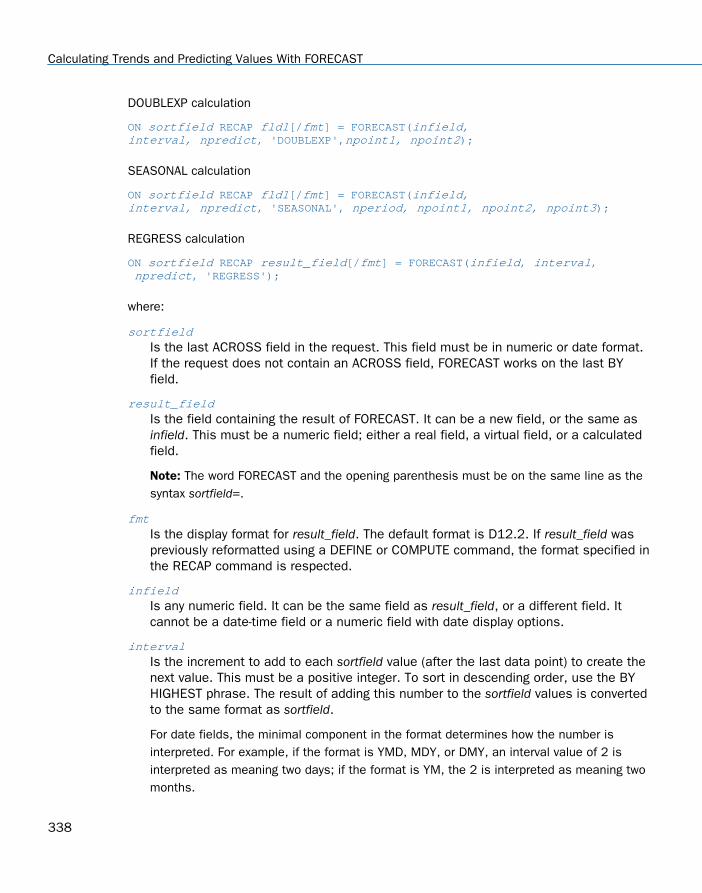
DOUBLEXP calculation
ON sortfield RECAP fld1[/fmt] = FORECAST(infield,interval, npredict, 'DOUBLEXP',npoint1, npoint2);
SEASONAL calculation
ON sortfield RECAP fld1[/fmt] = FORECAST(infield,interval, npredict, 'SEASONAL', nperiod, npoint1, npoint2, npoint3);
REGRESS calculation
ON sortfield RECAP result_field[/fmt] = FORECAST(infield, interval, npredict, 'REGRESS');
where:
sortfieldIs the last ACROSS field in the request. This field must be in numeric or date format.If the request does not contain an ACROSS field, FORECAST works on the last BYfield.
result_fieldIs the field containing the result of FORECAST. It can be a new field, or the same asinfield. This must be a numeric field; either a real field, a virtual field, or a calculatedfield.
Note: The word FORECAST and the opening parenthesis must be on the same line as thesyntax sortfield=.
fmtIs the display format for result_field. The default format is D12.2. If result_field waspreviously reformatted using a DEFINE or COMPUTE command, the format specified inthe RECAP command is respected.
infieldIs any numeric field. It can be the same field as result_field, or a different field. Itcannot be a date-time field or a numeric field with date display options.
intervalIs the increment to add to each sortfield value (after the last data point) to create thenext value. This must be a positive integer. To sort in descending order, use the BYHIGHEST phrase. The result of adding this number to the sortfield values is convertedto the same format as sortfield.
For date fields, the minimal component in the format determines how the number isinterpreted. For example, if the format is YMD, MDY, or DMY, an interval value of 2 isinterpreted as meaning two days; if the format is YM, the 2 is interpreted as meaning twomonths.
Calculating Trends and Predicting Values With FORECAST
338
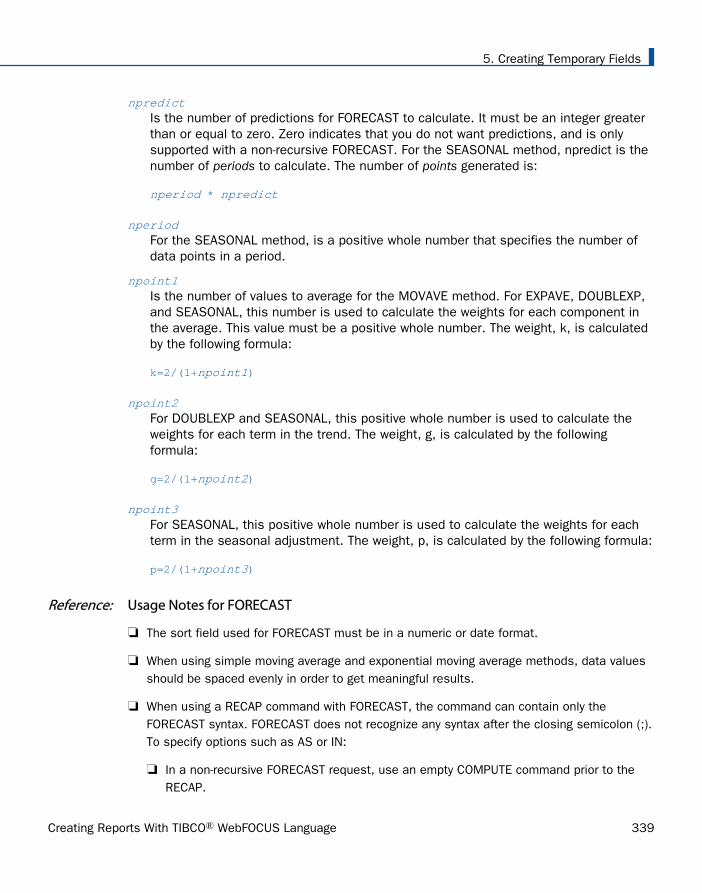
npredictIs the number of predictions for FORECAST to calculate. It must be an integer greaterthan or equal to zero. Zero indicates that you do not want predictions, and is onlysupported with a non-recursive FORECAST. For the SEASONAL method, npredict is thenumber of periods to calculate. The number of points generated is:
nperiod * npredict
nperiodFor the SEASONAL method, is a positive whole number that specifies the number ofdata points in a period.
npoint1Is the number of values to average for the MOVAVE method. For EXPAVE, DOUBLEXP,and SEASONAL, this number is used to calculate the weights for each component inthe average. This value must be a positive whole number. The weight, k, is calculatedby the following formula:
k=2/(1+npoint1)
npoint2For DOUBLEXP and SEASONAL, this positive whole number is used to calculate theweights for each term in the trend. The weight, g, is calculated by the followingformula:
g=2/(1+npoint2)
npoint3For SEASONAL, this positive whole number is used to calculate the weights for eachterm in the seasonal adjustment. The weight, p, is calculated by the following formula:
p=2/(1+npoint3)
Reference: Usage Notes for FORECAST
The sort field used for FORECAST must be in a numeric or date format.
When using simple moving average and exponential moving average methods, data valuesshould be spaced evenly in order to get meaningful results.
When using a RECAP command with FORECAST, the command can contain only theFORECAST syntax. FORECAST does not recognize any syntax after the closing semicolon (;).To specify options such as AS or IN:
In a non-recursive FORECAST request, use an empty COMPUTE command prior to theRECAP.
5. Creating Temporary Fields
Creating Reports With TIBCO® WebFOCUS Language 339

In a recursive FORECAST request, specify the options when the field is first referencedin the report request.
The use of column notation is not supported in a request that includes FORECAST. Theprocess of generating the FORECAST values creates extra columns that are not printed inthe report output. The number and placement of these additional columns varies dependingon the specific request.
A request can contain up to seven non-FORECAST RECAP commands and up to sevenadditional FORECAST RECAP commands.
The left side of a RECAP command used for FORECAST supports the CURR attribute forcreating a currency-denominated field.
Recursive and non-recursive REGRESS are not supported in the same request when thedisplay command is SUM, ADD, or WRITE.
Missing values are not supported with REGRESS.
If you use the ESTRECORDS parameter to enable the external sort to estimate better theamount of sort work space needed, you must take into account that FORECAST withpredictions creates additional records in the output.
In a styled report, you can assign specific attributes to values predicted by FORECAST withthe StyleSheet attribute WHEN=FORECAST. For example, to make the predicted valuesdisplay with the color red, use the following syntax in the TABLE request:
ON TABLE SET STYLE *TYPE=DATA,COLUMN=MYFORECASTSORTFIELD,WHEN=FORECAST,COLOR=RED,$ENDSTYLE
Reference: FORECAST Limits
The following are not supported with a RECAP command that uses FORECAST:
BY TOTAL command.
MORE, MATCH, FOR, and OVER phrases.
SUMMARIZE and RECOMPUTE are not supported for the same sort field used forFORECAST.
MISSING attribute.
Calculating Trends and Predicting Values With FORECAST
340

Using a Simple Moving Average
A simple moving average is a series of arithmetic means calculated with a specified number ofvalues from a field. Each new mean in the series is calculated by dropping the first value usedin the prior calculation, and adding the next data value to the calculation.
Simple moving averages are sometimes used to analyze trends in stock prices over time. Inthis scenario, the average is calculated using a specified number of periods of stock prices. Adisadvantage to this indicator is that because it drops the oldest values from the calculationas it moves on, it loses its memory over time. Also, mean values are distorted by extremehighs and lows, since this method gives equal weight to each point.
Predicted values beyond the range of the data values are calculated using a moving averagethat treats the calculated trend values as new data points.
The first complete moving average occurs at the nth data point because the calculationrequires n values. This is called the lag. The moving average values for the lag rows arecalculated as follows: the first value in the moving average column is equal to the first datavalue, the second value in the moving average column is the average of the first two datavalues, and so on until the nth row, at which point there are enough values to calculate themoving average with the number of values specified.
Example: Calculating a New Simple Moving Average Column
This request defines an integer value named PERIOD to use as the independent variable forthe moving average. It predicts three periods of values beyond the range of the retrieved data.
DEFINE FILE GGSALES SDATE/YYM = DATE; SYEAR/Y = SDATE; SMONTH/M = SDATE; PERIOD/I2 = SMONTH;ENDTABLE FILE GGSALES SUM UNITS DOLLARS BY CATEGORY BY PERIOD WHERE SYEAR EQ 97 AND CATEGORY NE 'Gifts' ON PERIOD RECAP MOVAVE/D10.1= FORECAST(DOLLARS,1,3,'MOVAVE',3);END
5. Creating Temporary Fields
Creating Reports With TIBCO® WebFOCUS Language 341

The output is:
In the report, the number of values to use in the average is 3 and there are no UNITS orDOLLARS values for the generated PERIOD values.
Each average (MOVAVE value) is computed using DOLLARS values where they exist. Thecalculation of the moving average begins in the following way:
The first MOVAVE value (801,123.0) is equal to the first DOLLARS value.
Calculating Trends and Predicting Values With FORECAST
342

The second MOVAVE value (741,731.5) is the mean of DOLLARS values one and two:(801,123 + 682,340) /2.
The third MOVAVE value (749,513.7) is the mean of DOLLARS values one through three:(801,123 + 682,340 + 765,078) / 3.
The fourth MOVAVE value (712,897.3) is the mean of DOLLARS values two through four:(682,340 + 765,078 + 691,274) /3.
For predicted values beyond the supplied values, the calculated MOVAVE values are used asnew data points to continue the moving average. The predicted MOVAVE values (starting with694,975.6 for PERIOD 13) are calculated using the previous MOVAVE values as new datapoints. For example, the first predicted value (694,975.6) is the average of the data pointsfrom periods 11 and 12 (620,264 and 762,328) and the moving average for period 12(702,334.7). The calculation is: 694,975 = (620,264 + 762,328 + 702,334.7)/3.
Example: Using an Existing Field as a Simple Moving Average Column
This request defines an integer value named PERIOD to use as the independent variable forthe moving average. It predicts three periods of values beyond the range of the retrieved data.It uses the same name for the RECAP field as the first argument in the FORECAST parameterlist. The trend values do not display in the report. The actual data values for DOLLARS arefollowed by the predicted values in the report column.
DEFINE FILE GGSALES SDATE/YYM = DATE; SYEAR/Y = SDATE; SMONTH/M = SDATE; PERIOD/I2 = SMONTH;ENDTABLE FILE GGSALES SUM UNITS DOLLARS BY CATEGORY BY PERIOD WHERE SYEAR EQ 97 AND CATEGORY NE 'Gifts' ON PERIOD RECAP DOLLARS/D10.1 = FORECAST(DOLLARS,1,3,'MOVAVE',3);END
5. Creating Temporary Fields
Creating Reports With TIBCO® WebFOCUS Language 343

The output is:
Calculating Trends and Predicting Values With FORECAST
344

Using Single Exponential Smoothing
The single exponential smoothing method calculates an average that allows you to chooseweights to apply to newer and older values.
The following formula determines the weight given to the newest value.
k = 2/(1+n)
where:
kIs the newest value.
nIs an integer greater than one. Increasing n increases the weight assigned to the earlierobservations (or data instances), as compared to the later ones.
The next calculation of the exponential moving average (EMA) value is derived by the followingformula:
EMA = (EMA * (1-k)) + (datavalue * k)
This means that the newest value from the data source is multiplied by the factor k and thecurrent moving average is multiplied by the factor (1-k). These quantities are then summed togenerate the new EMA.
Note: When the data values are exhausted, the last data value in the sort group is used as thenext data value.
Example: Calculating a Single Exponential Smoothing Column
The following defines an integer value named PERIOD to use as the independent variable forthe moving average. It predicts three periods of values beyond the range of retrieved data.
DEFINE FILE GGSALES SDATE/YYM = DATE; SYEAR/Y = SDATE; SMONTH/M = SDATE; PERIOD/I2 = SMONTH;ENDTABLE FILE GGSALES SUM UNITS DOLLARS BY CATEGORY BY PERIOD WHERE SYEAR EQ 97 AND CATEGORY NE 'Gifts' ON PERIOD RECAP EXPAVE/D10.1= FORECAST(DOLLARS,1,3,'EXPAVE',3);END
5. Creating Temporary Fields
Creating Reports With TIBCO® WebFOCUS Language 345

The output is:
In the report, three predicted values of EXPAVE are calculated within each value of CATEGORY.For values outside the range of the data, new PERIOD values are generated by adding theinterval value (1) to the prior PERIOD value.
Each average (EXPAVE value) is computed using DOLLARS values where they exist. Thecalculation of the moving average begins in the following way:
The first EXPAVE value (801,123.0) is the same as the first DOLLARS value.
Calculating Trends and Predicting Values With FORECAST
346

The second EXPAVE value (741,731.5) is calculated as follows. Note that because ofrounding and the number of decimal places used, the value derived in this samplecalculation varies slightly from the one displayed in the report output:
n=3 (number used to calculate weights)
k = 2/(1+n) = 2/4 = 0.5
EXPAVE = (EXPAVE*(1-k))+(new-DOLLARS*k) = (801123*0.5) + (682340*0.50) = 400561.5 + 341170 = 741731.5
The third EXPAVE value (753,404.8) is calculated as follows:
EXPAVE = (EXPAVE*(1-k))+(new-DOLLARS*k) = (741731.5*0.5)+(765078*0.50) = 370865.75 + 382539 = 753404.75
For predicted values beyond those supplied, the last EXPAVE value is used as the new datapoint in the exponential smoothing calculation. The predicted EXPAVE values (starting with706,741.6) are calculated using the previous average and the new data point. Because theprevious average is also used as the new data point, the predicted values are always equal tothe last trend value. For example, the previous average for period 13 is 706,741.6, and this isalso used as the next data point. Therefore, the average is calculated as follows: (706,741.6* 0.5) + (706,741.6 * 0.5) = 706,741.6
EXPAVE = (EXPAVE * (1-k)) + (new-DOLLARS * k) = (706741.6*0.5) + (706741.6*0.50) = 353370.8 + 353370.8 = 706741.6
Using Double Exponential Smoothing
Double exponential smoothing produces an exponential moving average that takes intoaccount the tendency of data to either increase or decrease over time without repeating. Thisis accomplished by using two equations with two constants.
The first equation accounts for the current time period and is a weighted average of thecurrent data value and the prior average, with an added component (b) that represents thetrend for the previous period. The weight constant is k:
DOUBLEXP(t) = k * datavalue(t) + (1-k) * ((DOUBLEXP(t-1) + b(t-1))
The second equation is the calculated trend value, and is a weighted average of thedifference between the current and previous average and the trend for the previous timeperiod. b(t) represents the average trend. The weight constant is g:
b(t) = g * (DOUBLEXP(t)-DOUBLEXP(t-1)) + (1 - g) * (b(t-1))
5. Creating Temporary Fields
Creating Reports With TIBCO® WebFOCUS Language 347

These two equations are solved to derive the smoothed average. The first smoothed average isset to the first data value. The first trend component is set to zero. For choosing the twoconstants, the best results are usually obtained by minimizing the mean-squared error (MSE)between the data values and the calculated averages. You may need to use nonlinearoptimization techniques to find the optimal constants.
The equation used for forecasting beyond the data points with double exponential smoothing is
forecast(t+m) = DOUBLEXP(t) + m * b(t)
where:
mIs the number of time periods ahead for the forecast.
Example: Calculating a Double Exponential Smoothing Column
The following defines an integer value named PERIOD to use as the independent variable forthe moving average. The double exponential smoothing method estimates the trend in the datapoints better than the single smoothing method:
SET HISTOGRAM = OFFTABLE FILE CENTSTMTSUM ACTUAL_YTD BY PERIOD ON PERIOD RECAP EXP/D15.1 = FORECAST(ACTUAL_YTD,1,0,'EXPAVE',3); ON PERIOD RECAP DOUBLEXP/D15.1 = FORECAST(ACTUAL_YTD,1,0, 'DOUBLEXP',3,3);WHERE GL_ACCOUNT LIKE '3%%%'END
The output is:
Calculating Trends and Predicting Values With FORECAST
348

Using Triple Exponential Smoothing
Triple exponential smoothing produces an exponential moving average that takes into accountthe tendency of data to repeat itself in intervals over time. For example, sales data that isgrowing and in which 25% of sales always occur during December contains both trend andseasonality. Triple exponential smoothing takes both the trend and seasonality into account byusing three equations with three constants.
For triple exponential smoothing you, need to know the number of data points in each timeperiod (designated as L in the following equations). To account for the seasonality, a seasonalindex is calculated. The data is divided by the prior season index and then used in calculatingthe smoothed average.
The first equation accounts for the current time period, and is a weighted average of thecurrent data value divided by the seasonal factor and the prior average adjusted for thetrend for the previous period. The weight constant is k:
SEASONAL(t) = k * (datavalue(t)/I(t-L)) + (1-k) * (SEASONAL(t-1) + b(t-1))
The second equation is the calculated trend value, and is a weighted average of thedifference between the current and previous average and the trend for the previous timeperiod. b(t) represents the average trend. The weight constant is g:
b(t) = g * (SEASONAL(t)-SEASONAL(t-1)) + (1-g) * (b(t-1))
The third equation is the calculated seasonal index, and is a weighted average of thecurrent data value divided by the current average and the seasonal index for the previousseason. I(t) represents the average seasonal coefficient. The weight constant is p:
I(t) = p * (datavalue(t)/SEASONAL(t)) + (1 - p) * I(t-L)
These equations are solved to derive the triple smoothed average. The first smoothed averageis set to the first data value. Initial values for the seasonality factors are calculated based onthe maximum number of full periods of data in the data source, while the initial trend iscalculated based on two periods of data. These values are calculated with the following steps:
1. The initial trend factor is calculated by the following formula:
b(0) = (1/L) ((y(L+1)-y(1))/L + (y(L+2)-y(2))/L + ... + (y(2L) - y(L))/L )
2. The calculation of the initial seasonality factor is based on the average of the data valueswithin each period, A(j) (1<=j<=N):
A(j) = ( y((j-1)L+1) + y((j-1)L+2) + ... + y(jL) ) / L
5. Creating Temporary Fields
Creating Reports With TIBCO® WebFOCUS Language 349

3. Then, the initial periodicity factor is given by the following formula, where N is the numberof full periods available in the data, L is the number of points per period and n is a pointwithin the period (1<= n <= L):
I(n) = ( y(n)/A(1) + y(L+n)/A(2) + ... + y((N-1)L+n)/A(N) ) / N
The three constants must be chosen carefully. The best results are usually obtained bychoosing the constants to minimize the mean-squared error (MSE) between the data valuesand the calculated averages. Varying the values of npoint1 and npoint2 affect the results, andsome values may produce a better approximation. To search for a better approximation, youmay want to find values that minimize the MSE.
The equation used to forecast beyond the last data point with triple exponential smoothing is:
forecast(t+m) = (SEASONAL(t) + m * b(t)) / I(t-L+MOD(m/L))
where:
mIs the number of periods ahead for the forecast.
Example: Calculating a Triple Exponential Smoothing Column
In the following, the data has seasonality but no trend. Therefore, npoint2 is set high (1000) tomake the trend factor negligible in the calculation:
SET HISTOGRAM = OFFTABLE FILE VIDEOTRKSUM TRANSTOTBY TRANSDATEON TRANSDATE RECAP SEASONAL/D10.1 = FORECAST(TRANSTOT,1,3,'SEASONAL', 3,3,1000,1);WHERE TRANSDATE NE '19910617'END
Calculating Trends and Predicting Values With FORECAST
350

In the output, npredict is 3. Therefore, three periods (nine points, nperiod * npredict) aregenerated.
Using a Linear Regression Equation
The Linear Regression Equation estimates values by assuming that the dependent variable(the new calculated values) and the independent variable (the sort field values) are related by afunction that represents a straight line:
y = mx + b
where:
yIs the dependent variable.
xIs the independent variable.
mIs the slope of the line.
5. Creating Temporary Fields
Creating Reports With TIBCO® WebFOCUS Language 351
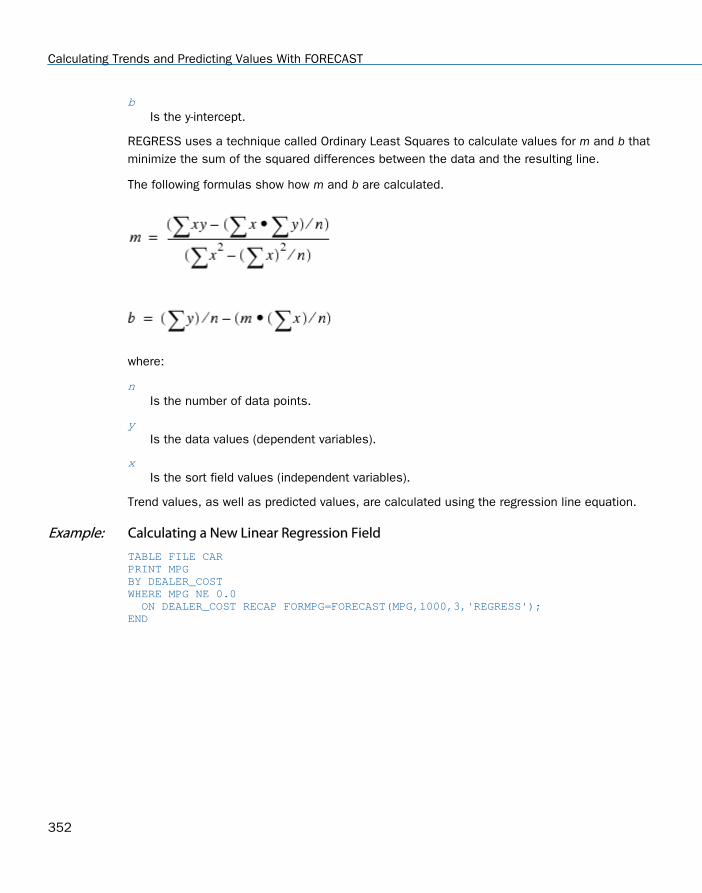
bIs the y-intercept.
REGRESS uses a technique called Ordinary Least Squares to calculate values for m and b thatminimize the sum of the squared differences between the data and the resulting line.
The following formulas show how m and b are calculated.
where:
nIs the number of data points.
yIs the data values (dependent variables).
xIs the sort field values (independent variables).
Trend values, as well as predicted values, are calculated using the regression line equation.
Example: Calculating a New Linear Regression Field
TABLE FILE CARPRINT MPGBY DEALER_COSTWHERE MPG NE 0.0 ON DEALER_COST RECAP FORMPG=FORECAST(MPG,1000,3,'REGRESS');END
Calculating Trends and Predicting Values With FORECAST
352

The output is:
DEALER_COST MPG FORMPG 2,886 27 25.51 4,292 25 23.65 4,631 21 23.20 4,915 21 22.82 5,063 23 22.63 5,660 21 21.83 21 21.83 5,800 24 21.65 6,000 24 21.38 7,427 16 19.49 8,300 18 18.33 8,400 18 18.20 10,000 18 16.08 11,000 18 14.75 11,194 9 14.50 14,940 11 9.53 15,940 0 8.21 16,940 0 6.88 17,940 0 5.55
Note:
Three predicted values of FORMPG are calculated. For values outside the range of the data,new DEALER_COST values are generated by adding the interval value (1,000) to the priorDEALER_COST value.
There are no MPG values for the generated DEALER_COST values.
Each FORMPG value is computed using a regression line, calculated using all of the actualdata values for MPG.
DEALER_COST is the independent variable (x) and MPG is the dependent variable (y). Theequation is used to calculate MPGFORECAST trend and predicted values.
In this case, the equation is approximately as follows:
FORMPG = (-0.001323 * DEALER_COST) + 29.32
The predicted values are (the values are not exactly as calculated by FORECAST because ofrounding, but they show the calculation process).
DEALER_COST Calculation FORMPG
15,940 (-0.001323 * 15,940) + 29.32 8.23
16,940 (-0.001323 * 16,940) + 29.32 6.91
5. Creating Temporary Fields
Creating Reports With TIBCO® WebFOCUS Language 353

DEALER_COST Calculation FORMPG
17,940 (-0.001323 * 17,940) + 29.32 5.59
FORECAST Reporting Techniques
You can use FORECAST multiple times in one request. However, all FORECAST requests mustspecify the same sort field, interval, and number of predictions. The only things that canchange are the RECAP field, method, field used to calculate the FORECAST values, and numberof points to average. If you change any of the other parameters, the new parameters areignored.
If you want to move a FORECAST column in the report output, use an empty COMPUTEcommand for the FORECAST field as a placeholder. The data type (I, F, P, D) must be the samein the COMPUTE command and the RECAP command.
To make the report output easier to interpret, you can create a field that indicates whether theFORECAST value in each row is a predicted value. To do this, define a virtual field whose valueis a constant other than zero. Rows in the report output that represent actual records in thedata source will appear with this constant. Rows that represent predicted values will displayzero. You can also propagate this field to a HOLD file.
Example: Generating Multiple FORECAST Columns in a Request
This example calculates moving averages and exponential averages for both the DOLLARS andBUDDOLLARS fields in the GGSALES data source. The sort field, interval, and number ofpredictions are the same for all of the calculations.
DEFINE FILE GGSALES SDATE/YYM = DATE; SYEAR/Y = SDATE; SMONTH/M = SDATE; PERIOD/I2 = SMONTH;ENDTABLE FILE GGSALES SUM DOLLARS AS 'DOLLARS' BUDDOLLARS AS 'BUDGET' BY CATEGORY NOPRINT BY PERIOD AS 'PER' WHERE SYEAR EQ 97 AND CATEGORY EQ 'Coffee' ON PERIOD RECAP DOLMOVAVE/D10.1= FORECAST(DOLLARS,1,0,'MOVAVE',3); ON PERIOD RECAP DOLEXPAVE/D10.1= FORECAST(DOLLARS,1,0,'EXPAVE',4); ON PERIOD RECAP BUDMOVAVE/D10.1 = FORECAST(BUDDOLLARS,1,0,'MOVAVE',3); ON PERIOD RECAP BUDEXPAVE/D10.1 = FORECAST(BUDDOLLARS,1,0,'EXPAVE',4);END
Calculating Trends and Predicting Values With FORECAST
354

The output is shown in the following image.
Example: Moving the FORECAST Column
The following example places the DOLLARS field after the MOVAVE field by using an emptyCOMPUTE command as a placeholder for the MOVAVE field. Both the COMPUTE command andthe RECAP command specify formats for MOVAVE (of the same data type), but the format ofthe RECAP command takes precedence.
DEFINE FILE GGSALES SDATE/YYM = DATE; SYEAR/Y = SDATE; SMONTH/M = SDATE; PERIOD/I2 = SMONTH;ENDTABLE FILE GGSALESSUM UNITSCOMPUTE MOVAVE/D10.2 = ;DOLLARS BY CATEGORY BY PERIOD WHERE SYEAR EQ 97 AND CATEGORY EQ 'Coffee' ON PERIOD RECAP MOVAVE/D10.1= FORECAST(DOLLARS,1,3,'MOVAVE',3);END
5. Creating Temporary Fields
Creating Reports With TIBCO® WebFOCUS Language 355

The output is shown in the following image.
Category PERIOD Unit Sales MOVAVE Dollar SalesCoffee 1 61666 801,123.0 801123 2 54870 741,731.5 682340 3 61608 749,513.7 765078 4 57050 712,897.3 691274 5 59229 725,598.7 720444 6 58466 718,058.3 742457 7 60771 736,718.0 747253 8 54633 715,202.0 655896 9 57829 711,155.3 730317 10 57012 703,541.7 724412 11 51110 691,664.3 620264 12 58981 702,334.7 762328 13 0 694,975.6 0 14 0 719,879.4 0 15 0 705,729.9 0
Example: Distinguishing Data Rows From Predicted Rows
In the following example, the DATA_ROW virtual field has the value 1 for each row in the datasource. It has the value zero for the predicted rows. The PREDICT field is calculated as YES forpredicted rows, and NO for rows containing data.
DEFINE FILE CARDATA_ROW/I1 = 1;ENDTABLE FILE CAR PRINT DATA_ROWCOMPUTE PREDICT/A3 = IF DATA_ROW EQ 1 THEN 'NO' ELSE 'YES' ;MPGBY DEALER_COSTWHERE MPG GE 20 ON DEALER_COST RECAP FORMPG/D12.2=FORECAST(MPG,1000,3,'REGRESS'); ON DEALER_COST RECAP MPG =FORECAST(MPG,1000,3,'REGRESS');END
The output is:
DEALER_COST DATA_ROW PREDICT MPG FORMPG 2,886 1 NO 27.00 25.65 4,292 1 NO 25.00 23.91 4,631 1 NO 21.00 23.49 4,915 1 NO 21.00 23.14 5,063 1 NO 23.00 22.95 5,660 1 NO 21.00 22.21 1 NO 21.00 22.21 5,800 1 NO 24.20 22.04 6,000 1 NO 24.20 21.79 7,000 0 YES 20.56 20.56 8,000 0 YES 19.32 19.32 9,000 0 YES 18.08 18.08
Calculating Trends and Predicting Values With FORECAST
356

Calculating Trends and Predicting Values With Multivariate REGRESS
The REGRESS method derives a linear equation that best fits a set of numeric data points, anduses this equation to create a new column in the report output. The equation can be based onone to three independent variables.
This method estimates values by assuming that the dependent variable (y, the new calculatedvalues) and the independent variables (x1, x2, x3) are related by the following linear equation:
y = a1*x1 [+ a2*x2 [+ a3*x3]] + b
When there is one independent variable, the equation represents a straight line. This producesthe same values as FORECAST using the REGRESS method. When there are two independentvariables, the equation represents a plane, and with three independent variables, it representsa hyperplane. You should use this technique when you have reason to believe that thedependent variable can be approximated by a linear combination of the independent variables.
REGRESS uses a technique called Ordinary Least Squares to calculate values for thecoefficients (a1, a2, a3, and b) that minimize the sum of the squared differences between thedata and the resulting line, plane, or hyperplane.
Syntax: How to Create a Multivariate Linear Regression Column
ON {sortfield} RECAP y[/fmt] = REGRESS(n, x1, [x2, [x3,]] z);
where:
sortfield
Is a field in the data source. It cannot be the same field as any of the parameters toREGRESS. A new linear regression equation is derived each time the sort field valuechanges.
y
Is the new numeric column calculated by applying the regression equation. You cannotDEFINE or COMPUTE a field with this name.
fmt
Is the display format for y. If it is omitted, the default format is D12.2.
n
Is a whole number from 1 to 3 indicating the number of independent variables.
5. Creating Temporary Fields
Creating Reports With TIBCO® WebFOCUS Language 357

x1, x2, x3
Are the field names to be used as the independent variables. All of these variables mustbe numeric and be independent of each other.
z
Is an existing numeric field that is assumed to be approximately linearly dependent on theindependent variables and is used to derive the regression equation.
Reference: Usage Notes for REGRESS
The (By) sort field used with REGRESS must be in a numeric or date format.
REGRESS cannot operate on an ACROSS field.
If any of the independent variables are also sort fields, they cannot be referenced in therequest prior to the REGRESS sort field.
FORECAST and REGRESS cannot be used in the same request, and only one REGRESS issupported in a request. Non-REGRESS RECAP commands are supported.
The RECAP command used with REGRESS can contain only the REGRESS syntax. REGRESSdoes not recognize any syntax after the closing semicolon (;).
Although you pass parameters to REGRESS using an argument list in parentheses,REGRESS is not a function. It can coexist with a user-written subroutine of the same name,as long as the user-written subroutine is not specified in a RECAP command.
BY TOTAL is not supported.
MORE, MATCH, FOR, and OVER are not supported.
The process of generating the REGRESS values creates extra columns that are not printedin the report output. The number and placement of these additional columns variesdepending on the specific request. Therefore, use of column notation is not supported in arequest that includes REGRESS.
SUMMARIZE and RECOMPUTE are not supported for the same sort field used for REGRESS.
REGRESS is not supported for the FOCUS GRAPH facility.
The left side of a RECAP command used for REGRESS supports the CURR attribute forcreating a currency-denominated field.
Fields with missing values cannot be used in the regression.
Calculating Trends and Predicting Values With Multivariate REGRESS
358

Larger amounts of data produce more useful results.
Example: Creating a Multivariate Linear Regression Column
The following request uses the GGSALES data source to calculate an estimated DOLLARScolumn. The BUDUNITS, UNITS, and BUDDOLLARS fields are the independent variables. TheDOLLARS field provides the actual values to be estimated:
DEFINE FILE GGSALES YEAR/Y = DATE; MONTH/M = DATE; PERIOD/I2 = MONTH;END
TABLE FILE GGSALESPRINT BUDUNITS UNITS BUDDOLLARS DOLLARSBY PERIODON PERIOD RECAP EST_DOLLARS/F8 = REGRESS(3, BUDUNITS, UNITS, BUDDOLLARS, DOLLARS);WHERE CATEGORY EQ 'Coffee'WHERE REGION EQ 'West'WHERE UNITS GT 1600 AND UNITS LT 1700END
5. Creating Temporary Fields
Creating Reports With TIBCO® WebFOCUS Language 359

The output is:
Using Text Fields in DEFINE and COMPUTE
Text fields can be assigned to alphanumeric fields and receive assignment from alphanumericfields. If an alphanumeric field is assigned the value of a text field that is too long for thealphanumeric field, the value is truncated before being assigned to the alphanumeric field.
Note: COMPUTE commands in Maintain do not support text fields.
Using Text Fields in DEFINE and COMPUTE
360

Example: Assigning the Result of an Alphanumeric Expression to a Text Field
This example uses the COURSES data source, which contains a text field, to create analphanumeric field named ADESC, which truncates the text field at 36 characters, and a newtext field named NEWDESC, which is a text version of ADESC:
DEFINE FILE COURSESADESC/A36 = DESCRIPTION;NEWDESC/TX36 = ADESC;END TABLE FILE COURSESPRINT ADESC NEWDESCEND
The output is:
ADESC NEWDESC----- -------This course provides the DP professi This course provides the DP professiAnyone responsible for designing FOC Anyone responsible for designing FOCThis is a course in FOCUS efficienci This is a course in FOCUS efficienci
Creating Temporary Fields Independent of a Master File
The temporary fields you create with the DEFINE and COMPUTE commands are tied to aspecific Master File, and in the case of values calculated with the COMPUTE command, to aspecific request. However, you can create temporary fields that are independent of either aMaster File or a request using the DEFINE FUNCTION command.
A DEFINE function is a named group of calculations that use any number of input values andproduce a return value. When calling a DEFINE function, you must first define the function.
A DEFINE function can be called in most of the same situations that are valid forWebFOCUSFOCUS-supplied functions. Data types are defined with each argument. Whensubstituting values for these arguments, the format must match the defined format.Alphanumeric arguments shorter than the specified format are padded with blanks, whilelonger alphanumeric arguments are truncated.
All calculations within the function are done in double precision. Format conversions occur onlyacross equal signs (=) in the assignments that define temporary fields.
5. Creating Temporary Fields
Creating Reports With TIBCO® WebFOCUS Language 361

Syntax: How to Define a Function
DEFINE FUNCTION name (argument1/format1,..., argumentn/formatn)[tempvariablea/formata [TITLE 'line1[,line2 ...'] [DESCRiption 'description'] = expressiona;] . . .[tempvariablex/formatx = expressionx;] name/format = [result_expression];END
where:
name
Is the name of the function, up to 64 characters. This must be the last field calculated inthe function, and is used to return the value of the function to the calling procedure.
argument1...argumentn
Are the argument names. They can be any names that comply with WebFOCUS fieldnaming rules.
format1...formatn
Are the formats of the function arguments.
If the format of an argument is alphanumeric, the argument value must also bealphanumeric. Shorter arguments are padded on the right with blanks, and longerarguments are truncated.
If the format of an argument is numeric, the argument value must also be numeric. Toprevent unexpected results, you must be consistent in your use of data types.
tempvariablea...tempvariablex
Are temporary fields. Temporary fields hold intermediate values used in the function. Youcan define as many temporary fields as you need.
tempformata...tempformatx
Are the formats of the temporary fields.
line1,line2 ...
Are the lines of default column title to be displayed for the virtual field unless overriddenby an AS phrase.
Creating Temporary Fields Independent of a Master File
362

description
Is the description to be associated with the virtual field, enclosed in single quotationmarks. The description displays in the tools that browse Master Files.
expressiona...expressionx
Are the expressions that calculate the temporary field values. The expressions can useparameters, constants, and other temporary fields defined in the same function.
format
Is the format of the value the function returns.
result_expression
Is the expression that calculates the value returned by the function. The expression canuse parameters, constants, and temporary fields defined in the same function.
All names defined in the body of the function are local to the function. The last field definedbefore the END command in the function definition must have the same name as the function,and represents the return value for the function.
Reference: DEFINE Function Limits and Restrictions
The number of functions you can define and use in a session is virtually unlimited.
A DEFINE function is cleared with the DEFINE FUNCTION CLEAR command. It is not clearedby issuing a join, or by any WebFOCUS command.
When an expression tries to use a cleared function, an error appears.
DEFINE functions can call other DEFINE functions, but cannot call themselves.
If you overwrite or clear a DEFINE function, a subsequent attempt to use a temporary fieldthat refers to the function generates the following warning:
(FOC03665) Error loading external function '%1'
Example: Defining a Function
The following example creates and calls the SUBTRACT function. SUBTRACT performs acalculation with the arguments VAL1 and VAL2.
DEFINE FUNCTION SUBTRACT (VAL1/D8, VAL2/D8) SUBTRACT/D8.2 = VAL1 - VAL2; END
5. Creating Temporary Fields
Creating Reports With TIBCO® WebFOCUS Language 363

TABLE FILE MOVIES PRINT TITLE LISTPR IN 35 WHOLESALEPR AND COMPUTE PROFIT/D8.2 = SUBTRACT(LISTPR,WHOLESALEPR); BY CATEGORY WHERE CATEGORY EQ 'MYSTERY' OR 'ACTION'END
The output is:
CATEGORY TITLE LISTPR
WHOLESALEPR
PROFIT
ACTION JAWS 19.95
10.99
8.96
ROBOCOP 19.98
11.50
8.48
TOTAL RECALL 19.99
11.99
8.00
TOP GUN 14.95
9.99
4.96
RAMBO III 19.95
10.99
8.96
MYSTERY REAR WINDOW 19.98
9.00
10.98
VERTIGO 19.98
9.00
10.98
FATAL ATTRACTION
29.98
15.99
13.99
NORTH BY NORTHWEST
19.98
9.00
10.98
DEAD RINGERS 25.99
15.99
10.00
MORNING AFTER, THE
19.95
9.99
9.96
Creating Temporary Fields Independent of a Master File
364

PSYCHO 19.98
9.00
10.98
BIRDS, THE 19.98
9.00
10.98
SEA OF LOVE 59.99
30.00
29.99
Procedure: How to Display DEFINE Functions
Issue the following command from the Command Console:
? FUNCTION
Example: Displaying DEFINE Functions
Issuing the command
? FUNCTION
displays information similar to the following:
FUNCTIONS CURRENTLY ACTIVE
NAME FORMAT PARAMETER FORMAT
---------- --------- --------- -------
SUBTRACT D8.2 VAL1 D8
VAL2 D8
If you issue the ? FUNCTION command when no functions are defined, the following appears:
NO FUNCTIONS CURRENTLY IN EFFECT
5. Creating Temporary Fields
Creating Reports With TIBCO® WebFOCUS Language 365
Syntax: How to Clear DEFINE Functions
DEFINE FUNCTION {name|*} CLEAR
where:
nameIs the name of the function name to clear.
*
Clears all active DEFINE functions.
Creating Temporary Fields Independent of a Master File
366
Chapter6Including Totals and Subtotals
To help interpret detailed information in a report, you can summarize the informationusing row and column totals, grand totals, and subtotals. You can use these summarylines in a report to clarify or highlight information.
In this chapter:
Calculating Row and Column Totals
Including Section Totals and a Grand Total
Including Subtotals
Recalculating Values for Subtotal Rows
Summarizing Alphanumeric Columns
Manipulating Summary Values With Prefix Operators
Combinations of Summary Commands
Producing Summary Columns for Horizontal Sort Fields
Performing Calculations at Sort Field Breaks
Suppressing Grand Totals
Conditionally Displaying Summary Lines and Text
Calculating Row and Column Totals
You can produce totals for rows or columns of numbers in a report. Use:
ROW-TOTAL to display a new column containing the sum of all numbers in each row.
COLUMN-TOTAL to display a final row on the report, which contains the totals for eachcolumn of numbers.
You can use row totals and column totals in matrix reports (created by using a BY and anACROSS in your report request), rename row and column total titles, and include calculatedvalues in your row or column totals. You can also create row totals using ACROSS-TOTAL.
Creating Reports With TIBCO® WebFOCUS Language 367

Note that when producing totals in a report, if one field is summed, the format of the row totalis the same as the format of the field. For example, if the format of the CURR_SAL field isD12.2M, the format of the row total for CURR_SAL is also D12.2M. When you are summingfields with different formats, the default format of D12.2 is used for the total.
You can rename the default column titles using the AS phrase and align the labels for row andcolumn totals. For details, see Using Headings, Footings, Titles, and Labels on page 1519.
Syntax: How to Calculate Row and Column Totals
display_command fieldname AND ROW-TOTAL [alignment][/format] [AS 'name'] display_command fieldname AND COLUMN-TOTAL [alignment][AS 'name']
where:
display_commandIs one of the following commands: PRINT, LIST, SUM, or COUNT.
fieldnameIs the name of the field for which to calculate row and/or column totals.
alignmentSpecifies the alignment of the ROW-TOTAL or COLUMN-TOTAL label. Possible valuesare:
/R right justifies the label.
/L left justifies the label.
/C centers the label.
Note that these alignment settings are ignored in HTML output. If you are working inWebFOCUS, to take advantage of column alignment features, you can include thecommand SET STYLE=OFF in the report request or generate your output in PDF, or inanother format that supports these features.
formatReformats the ROW-TOTAL.
nameIs the label for the ROW-TOTAL or COLUMN-TOTAL.
You may also specify row or column totals with the ON TABLE command. Field names areoptional with COLUMN-TOTAL, and cannot be listed with ROW-TOTAL. Use the following syntax:
ON TABLE COLUMN-TOTAL [alignment][AS 'name'][field field field] ON TABLE ROW-TOTAL [alignment][/format] [AS 'name']
Calculating Row and Column Totals
368
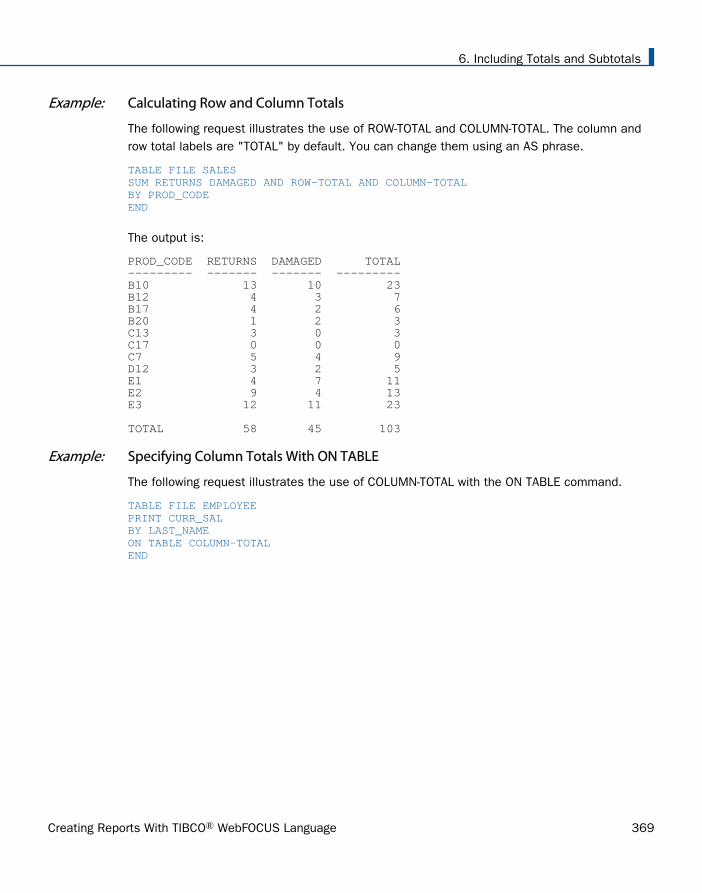
Example: Calculating Row and Column Totals
The following request illustrates the use of ROW-TOTAL and COLUMN-TOTAL. The column androw total labels are "TOTAL" by default. You can change them using an AS phrase.
TABLE FILE SALESSUM RETURNS DAMAGED AND ROW-TOTAL AND COLUMN-TOTALBY PROD_CODEEND
The output is:
PROD_CODE RETURNS DAMAGED TOTAL--------- ------- ------- ---------B10 13 10 23B12 4 3 7B17 4 2 6B20 1 2 3C13 3 0 3C17 0 0 0C7 5 4 9D12 3 2 5E1 4 7 11E2 9 4 13E3 12 11 23 TOTAL 58 45 103
Example: Specifying Column Totals With ON TABLE
The following request illustrates the use of COLUMN-TOTAL with the ON TABLE command.
TABLE FILE EMPLOYEEPRINT CURR_SALBY LAST_NAMEON TABLE COLUMN-TOTALEND
6. Including Totals and Subtotals
Creating Reports With TIBCO® WebFOCUS Language 369

The output is:
LAST_NAME CURR_SAL--------- --------BANNING $29,700.00BLACKWOOD $21,780.00CROSS $27,062.00GREENSPAN $9,000.00IRVING $26,862.00JONES $18,480.00MCCOY $18,480.00MCKNIGHT $16,100.00ROMANS $21,120.00SMITH $13,200.00 $9,500.00STEVENS $11,000.00 TOTAL $222,284.00
Example: Using Row and Column Totals in a Matrix Report
The following request illustrates the use of ROW-TOTAL and COLUMN-TOTAL in a matrix report(created by using the BY and ACROSS phrases together).
TABLE FILE EMPLOYEESUM CURR_SAL AND ROW-TOTAL AND COLUMN-TOTALBY BANK_NAMEACROSS DEPARTMENTEND
The output is:
DEPARTMENT BANK_NAME MIS PRODUCTION TOTAL ----------------------------------------------------------------------- $40,680.00 $41,620.00 $82,300.00 ASSOCIATED $21,780.00 $42,962.00 $64,742.00 BANK ASSOCIATION $27,062.00 . $27,062.00 BEST BANK . $29,700.00 $29,700.00 STATE $18,480.00 . $18,480.00 TOTAL $108,002.00 $114,282.00 $222,284.00
Calculating Row and Column Totals
370

Example: Including Calculated Values in Row and Column Totals
The following request illustrates the inclusion of the calculated value, PROFIT, in row andcolumn totals.
TABLE FILE CARSUM DCOST RCOSTCOMPUTE PROFIT/D12=RCOST-DCOST;ROW-TOTAL/L/D12 AS 'TOTAL_COST'BY COUNTRYON TABLE COLUMN-TOTAL/L AS 'FINAL_TOTAL'END
The output is:
COUNTRY DEALER_COST RETAIL_COST PROFIT TOTAL_COST ------- ----------- ----------- ------ ---------------ENGLAND 37,853 45,319 7,466 90,638FRANCE 4,631 5,610 979 11,220ITALY 41,235 51,065 9,830 102,130JAPAN 5,512 6,478 966 12,956W GERMANY 54,563 64,732 10,169 129,464 FINAL_TOTAL 143,794 173,204 29,410 346,408
Reference: Using ROW-TOTAL With ACROSS and Multiple Display Commands
When a request has an ACROSS sort field, each ACROSS value displays a column for eachfield displayed on the report output. For example, the following request, each state has acolumn for units and a column for dollars:
TABLE FILE GGSALES SUM UNITS AS 'U' DOLLARS AS 'D' BY CITY ACROSS ST IF ST EQ 'CA' IF BUDUNITS NE MISSING END
The output is:
State CA City U D -----------------------------------------Los Angeles 298070 3772014 San Francisco 312500 3870258
6. Including Totals and Subtotals
Creating Reports With TIBCO® WebFOCUS Language 371

When you specify a row total with ACROSS, the row total is calculated separately for eachcolumn in each ACROSS group. For example, in the following request the row total has acolumn for units and a column for dollars:
TABLE FILE GGSALES SUM UNITS AS 'U' DOLLARS AS 'D' BY CITY ACROSS ST IF ST EQ 'CA' IF BUDUNITS NE MISSING ON TABLE ROW-TOTAL END
The output is:
State CA TOTAL City U D U D ---------------------------------------------------------- Los Angeles 298070 3772014 298070 3772014 San Francisco 312500 3870258 312500 3870258
When the request also has multiple display commands, each additional command addsadditional columns to each ACROSS group on the report output.
The first column of the row total group is calculated by adding the first column from eachdisplay command under each ACROSS value, the second column adds the second column fromeach display command, and so on.
For example, the following request has a SUM command for units and dollars and anotherSUM command for budgeted units and budgeted dollars. The row total has a column for thesum of units and budgeted units and another column for the sum of dollars and budgeteddollars:
TABLE FILE GGSALES SUM UNITS AS 'U' DOLLARS AS 'D' BY CITY SUM BUDUNITS AS 'BU' BUDDOLLARS AS 'BD' BY CITYACROSS ST IF ST EQ 'CA' IF BUDUNITS NE MISSING ON TABLE ROW-TOTAL END
The output is:
State CA TOTAL City U D BU BD BU BD------------------------------------------------------------------------Los Angeles 298070 3772014 295637 3669484 593707 7441498San Francisco 312500 3870258 314725 3916863 627225 7787121
Calculating Row and Column Totals
372

If the different display commands do not all specify the same number of fields, some columnswill not be represented in the row total. For example, in the following request, the second SUMcommand has a column for budgeted units but not for budgeted dollars. Therefore, the rowtotal group has no column for dollars:
TABLE FILE GGSALES SUM UNITS AS 'U' DOLLARS AS 'D' BY CITY SUM BUDUNITS AS 'BU' BY CITYACROSS ST IF ST EQ 'CA' IF BUDUNITS NE MISSING ON TABLE ROW-TOTAL END
The output is:
State CA TOTAL City U D BU BU------------------------------------------------------------Los Angeles 298070 3772014 295637 593707San Francisco 312500 3870258 314725 627225
In this case, you can use column notation to calculate the row total properly. For example, thefollowing request calculates the row total column by adding the units, dollars, and budgetedunits columns together:
TABLE FILE GGSALES SUM UNITS AS 'U' DOLLARS AS 'D' BY CITY SUM BUDUNITS AS 'BU' BY CITYACROSS ST COMPUTE TOTAL/I10 = C1 + C2 +C3; AS 'ROW-TOTAL'IF ST EQ 'CA' IF BUDUNITS NE MISSING END
The output is:
State CA ROW-TOTALCity U D BU ---------------------------------------------------------------Los Angeles 298070 3772014 295637 4365721San Francisco 312500 3870258 314725 4497483
6. Including Totals and Subtotals
Creating Reports With TIBCO® WebFOCUS Language 373

Producing Row Totals for Horizontal (ACROSS) Sort Field Values
You can produce row totals for horizontal (ACROSS) sort field values. Row totals for horizontalsort fields, referenced by ACROSS-TOTAL, are different from standard row totals because onlyhorizontal sort field values, referenced by ACROSS, are included in the total. Integer, singleprecision floating point, double precision floating point, packed, and long packed fields can allbe totaled.
Syntax: How to Produce Row Totals for Horizontal (ACROSS) Sort Field Values
ACROSS sortfield ACROSS-TOTAL [AS 'name'] [COLUMNS col1 AND col2 ...]
where:
sortfieldIs the name of the field being sorted across.
nameIs the new name for the ACROSS-TOTAL column title.
col1, col2Are the titles of the ACROSS columns you want to include in the total.
Example: Producing Row Totals for Horizontal (ACROSS) Sort Field Values
The following illustrates how to generate a row total for horizontal (ACROSS) sort field values.Notice that the summed values in the TOTAL TITLE COUNT column only reflect the values in the(RATING) PG and R columns. The values in the COPIES column are not included since they arenot horizontal (ACROSS) sort field values.
TABLE FILE MOVIESSUM COPIES BY CATEGORYCOUNT TITLE BY CATEGORYACROSS RATING ACROSS-TOTALCOLUMNS PG AND REND
The output is:
RATING PG R TOTAL CATEGORY COPIES --------------------------------------- ACTION 14 2 3 5 COMEDY 16 4 1 5 DRAMA 2 0 1 1 FOREIGN 5 2 3 5 MUSICALS 2 1 1 2 MYSTERY 17 2 5 7 SCI/FI 3 0 3 3
Calculating Row and Column Totals
374

Reference: Usage Notes for ACROSS-TOTAL
Stacking headings in ACROSS-TOTAL is not supported.
Attempting to use ACROSS-TOTAL with other types of fields (alphanumeric, text, and dates)produces blank columns.
In cases of multiple ACROSS columns with ACROSS-TOTAL, there are additional columnswith subtotaled values.
The results of ROW-TOTAL and ACROSS-TOTAL are the same if there is only a single displayfield or single display command in the procedure.
The maximum number of ACROSS-TOTAL components is five.
ACROSS-TOTAL populates the ACROSSVALUE component in a StyleSheet. For an exampleof styling an ACROSS-TOTAL component, see Identifying Row Totals (ACROSS-TOTAL) forHorizontal Sort Data on page 1268.
Including Section Totals and a Grand Total
Frequently, reports contain detailed information that is broken down into subsections, forwhich simple column and row totals may not provide adequate summaries. In these instances,it is more useful to look at subtotals for particular sections, and a grand total.
You can add the following commands to your requests to create section subtotals and grandtotals:
SUB-TOTAL and SUBTOTAL
SUMMARIZE and RECOMPUTE (used with calculated values)
RECAP and COMPUTE
Each command produces grand totals and/or subtotals by using different information.Subtotals produce totals every time a specified sort field value changes, and are independentof record selection criteria. You can further control when subtotals are produced by specifyingWHEN criteria (see Conditionally Displaying Summary Lines and Text on page 427). You cancontrol whether subtotals display above or below the data. For information, see How to ControlPlacement of Summary Lines on page 378. You can also suppress grand totals using theNOTOTAL command. For details, see Suppressing Grand Totals on page 425.
By default, a blank line is generated before a subtotal on the report output. You can eliminatethese automatic blank lines by issuing the SET DROPBLNKLINE=ON command.
Note: When the request has a PAGE-BREAK command, the GRANDTOTAL is on a page by itself.
6. Including Totals and Subtotals
Creating Reports With TIBCO® WebFOCUS Language 375

You can use prefix operators with SUBTOTAL, SUB-TOTAL, SUMMARIZE, and RECOMPUTE. Fordetails, see Manipulating Summary Values With Prefix Operators on page 388. In addition, youcan combine different summary operations in a single request. For information, see Combinations of Summary Commands on page 407.
Example: Using Section Totals and Grand Totals
The following request illustrates how to create a subtotal every time the department valuechanges. The grand total is automatically produced when you use the SUBTOTAL command.
TABLE FILE EMPLOYEESUM DED_AMT BY DED_CODE BY DEPARTMENTBY BANK_ACCTWHERE BANK_ACCT NE 0WHERE DED_CODE EQ 'CITY' OR 'FED'ON DEPARTMENT SUBTOTALEND
The first and last portions of the output are:
DED_CODE DEPARTMENT BANK_ACCT DED_AMT-------- ---------- --------- -------CITY MIS 40950036 $14.00 122850108 $31.75 163800144 $82.70 *TOTAL DEPARTMENT MIS $128.45 PRODUCTION 160633 $7.42 136500120 $18.25 819000702 $60.20 *TOTAL DEPARTMENT PRODUCTION $85.87 FED MIS 40950036 $1,190.77 122850108 $2,699.80 163800144 $7,028.30 *TOTAL DEPARTMENT MIS $10,918.87 PRODUCTION 160633 $631.12 136500120 $1,552.10 819000702 $5,120.04 *TOTAL DEPARTMENT PRODUCTION $7,303.26 TOTAL $18,436.45
Including Section Totals and a Grand Total
376
Including Subtotals
You can use the SUBTOTAL and SUB-TOTAL commands to sum individual values, such ascolumns of numbers, each time a named sort field changes value.
SUB-TOTAL displays a subtotal when the sort field changes value, and for any higher-levelsort fields when their values change.
SUBTOTAL displays a subtotal only when the specified sort field changes value. It does notgive subtotals for higher-level fields.
Both SUB-TOTAL and SUBTOTAL produce grand totals. You can suppress grand totals using theNOTOTAL command. See Suppressing Grand Totals on page 425.
The subtotal is calculated every time the sort field value changes or, if WHEN criteria areapplied to the sort field, every time the WHEN conditions are met.
A BY, ACROSS, or ON phrase is required to initialize the syntax.
Syntax: How to Create Subtotals
{BY|ON} fieldname {SUB-TOTAL|SUBTOTAL} [MULTILINES] [field1 [AND] field2...] [AS 'text'][WHEN expression;]
where:
fieldnameMust be the name of a field in a sort phrase. A BY phrase can include a summarycommand. The number of fields to subtotal multiplied by the number of levels ofsubtotals counts in the number of display fields permitted for the request. For detailson determining the maximum number of display fields that can be used in a request,see Displaying Report Data on page 39.
SUB-TOTAL|SUBTOTAL
SUB-TOTAL displays subtotals for numeric values when the BY|ON field changes value,and for any higher-level sort fields when their values change.
SUBTOTAL displays a subtotal only when the specified sort field changes value.
MULTILINES
Suppresses the printing of a subtotal line for every sort break that has only one detailline, since the subtotal value is equal to this one value. Note that MULTI-LINES is asynonym for MULTILINES. MULTILINES is not supported with horizontal (ACROSS) sortfields.
field1, field2, ...Denotes a list of specific fields to subtotal. This list overrides the default, whichincludes all numeric display fields. The list can included numeric and alphanumericfields.
6. Including Totals and Subtotals
Creating Reports With TIBCO® WebFOCUS Language 377

You can use the asterisk (*) wildcard character instead of a field list to indicate that allfields, numeric and alphanumeric, should be included on the summary lines.
AS 'text'Enables you to specify a different label. For related information, see Using Headings,Footings, Titles, and Labels on page 1519.
WHEN expressionSpecifies the conditional display of subtotals as determined by a Boolean expression.You must end the expression with a semicolon.
Syntax: How to Control Placement of Summary Lines
SET SUBTOTALS = {ABOVE|BELOW}
where:
ABOVE
Places summary lines above the detail lines and displays the sort field values on everydetail line of the report output.
BELOW
Places summary lines below the detail lines. BELOW is the default value.
Note: SET SUBTOTALS = ABOVE is not supported with format XLSX, EXL07, or EXL2KFORMULA.
Example: Placing Subtotals Above the Data
The following request against the EMPLOYEE data source sums deduction amounts and grosssalaries by department, deduction code, and last name. It then subtotals the deductionamounts and gross salaries for each department. The following request places the subtotalsbelow the detail lines (the default):
TABLE FILE EMPLOYEESUM DED_AMT GROSSBY DEPARTMENTBY DED_CODE BY LAST_NAMEWHERE BANK_ACCT NE 0WHERE DED_CODE EQ 'FICA' OR 'CITY' ON DEPARTMENT SUBTOTAL ON TABLE SET SUBTOTALS BELOW ON TABLE SET PAGE NOPAGEEND
Including Subtotals
378

The output is:
DEPARTMENT DED_CODE LAST_NAME DED_AMT GROSS---------- -------- --------- ------- -----MIS CITY BLACKWOOD $31.76 $9,075.00 CROSS $82.69 $22,013.77 JONES $14.01 $6,099.50 FICA BLACKWOOD $2,223.37 $9,075.00 CROSS $5,788.01 $22,013.77 JONES $980.64 $6,099.50
*TOTAL DEPARTMENT MIS $9,120.47 $74,376.54
PRODUCTION CITY BANNING $7.42 $2,475.00 IRVING $60.24 $17,094.00 MCKNIGHT $18.26 $9,129.99 FICA BANNING $519.75 $2,475.00 IRVING $4,216.53 $17,094.00 MCKNIGHT $1,278.21 $9,129.99
*TOTAL DEPARTMENT PRODUCTION $6,100.40 $57,397.98
TOTAL $15,220.88 $131,774.52
The following is the same request, but with the subtotals placed above the detail lines:
TABLE FILE EMPLOYEESUM DED_AMT GROSSBY DEPARTMENTBY DED_CODE BY LAST_NAMEWHERE BANK_ACCT NE 0WHERE DED_CODE EQ 'FICA' OR 'CITY' ON DEPARTMENT SUBTOTAL ON TABLE SET SUBTOTALS ABOVE ON TABLE SET PAGE NOPAGEEND
6. Including Totals and Subtotals
Creating Reports With TIBCO® WebFOCUS Language 379
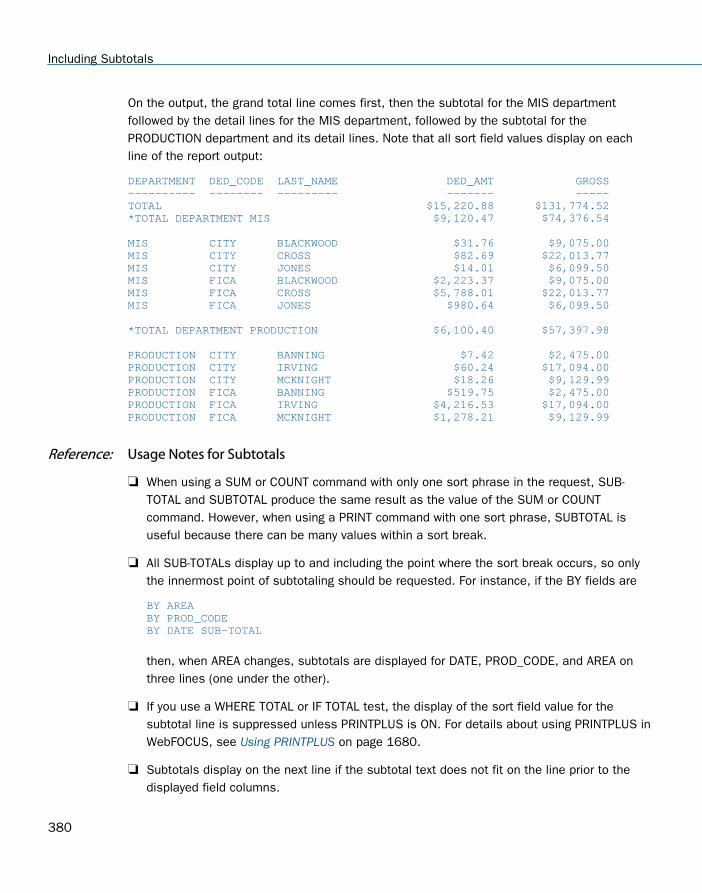
On the output, the grand total line comes first, then the subtotal for the MIS departmentfollowed by the detail lines for the MIS department, followed by the subtotal for thePRODUCTION department and its detail lines. Note that all sort field values display on eachline of the report output:
DEPARTMENT DED_CODE LAST_NAME DED_AMT GROSS---------- -------- --------- ------- -----TOTAL $15,220.88 $131,774.52*TOTAL DEPARTMENT MIS $9,120.47 $74,376.54
MIS CITY BLACKWOOD $31.76 $9,075.00MIS CITY CROSS $82.69 $22,013.77MIS CITY JONES $14.01 $6,099.50MIS FICA BLACKWOOD $2,223.37 $9,075.00MIS FICA CROSS $5,788.01 $22,013.77MIS FICA JONES $980.64 $6,099.50
*TOTAL DEPARTMENT PRODUCTION $6,100.40 $57,397.98
PRODUCTION CITY BANNING $7.42 $2,475.00PRODUCTION CITY IRVING $60.24 $17,094.00PRODUCTION CITY MCKNIGHT $18.26 $9,129.99PRODUCTION FICA BANNING $519.75 $2,475.00PRODUCTION FICA IRVING $4,216.53 $17,094.00PRODUCTION FICA MCKNIGHT $1,278.21 $9,129.99
Reference: Usage Notes for Subtotals
When using a SUM or COUNT command with only one sort phrase in the request, SUB-TOTAL and SUBTOTAL produce the same result as the value of the SUM or COUNTcommand. However, when using a PRINT command with one sort phrase, SUBTOTAL isuseful because there can be many values within a sort break.
All SUB-TOTALs display up to and including the point where the sort break occurs, so onlythe innermost point of subtotaling should be requested. For instance, if the BY fields are
BY AREABY PROD_CODEBY DATE SUB-TOTAL
then, when AREA changes, subtotals are displayed for DATE, PROD_CODE, and AREA onthree lines (one under the other).
If you use a WHERE TOTAL or IF TOTAL test, the display of the sort field value for thesubtotal line is suppressed unless PRINTPLUS is ON. For details about using PRINTPLUS inWebFOCUS, see Using PRINTPLUS on page 1680.
Subtotals display on the next line if the subtotal text does not fit on the line prior to thedisplayed field columns.
Including Subtotals
380

If a report request has multiple BY phrases, with SUBTOTAL/SUMMARIZE/RECOMPUTE/SUB-TOTAL at several levels, and MULTILINES or MULTI-LINES is specified at any one ofthose levels, it applies to all levels.
Note: ON BYfield SUBFOOT applies only to the level specified.
Example: Generating Subtotals
The following request illustrates how to create a subtotal for SALES every time the countryvalue changes.
TABLE FILE CARSUM AVE.MPG AND SALES AND AVE.RETAIL_COSTBY COUNTRY SUB-TOTAL SALESBY BODYTYPEEND
The output is:
AVE AVECOUNTRY BODYTYPE MPG SALES RETAIL_COST------- -------- ---- ----- -----------ENGLAND CONVERTIBLE 16 0 8,878 HARDTOP 25 0 5,100 SEDAN 10 12000 15,671
*TOTAL ENGLAND 12000
FRANCE SEDAN 21 0 5,610
*TOTAL FRANCE 0
ITALY COUPE 11 12400 19,160 ROADSTER 21 13000 6,820 SEDAN 21 4800 5,925*TOTAL ITALY
JAPAN SEDAN 14 78030 3,239
*TOTAL JAPAN 78030
W GERMANY SEDAN 20 88190 9,247
*TOTAL W GERMANY 88190
TOTAL 208420
6. Including Totals and Subtotals
Creating Reports With TIBCO® WebFOCUS Language 381
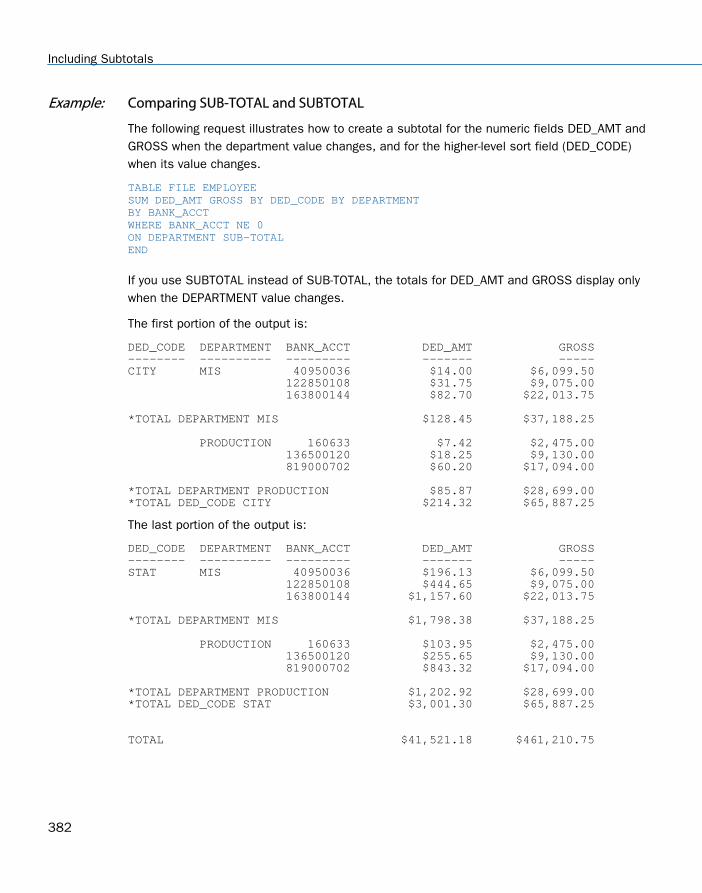
Example: Comparing SUB-TOTAL and SUBTOTAL
The following request illustrates how to create a subtotal for the numeric fields DED_AMT andGROSS when the department value changes, and for the higher-level sort field (DED_CODE)when its value changes.
TABLE FILE EMPLOYEESUM DED_AMT GROSS BY DED_CODE BY DEPARTMENTBY BANK_ACCTWHERE BANK_ACCT NE 0ON DEPARTMENT SUB-TOTALEND
If you use SUBTOTAL instead of SUB-TOTAL, the totals for DED_AMT and GROSS display onlywhen the DEPARTMENT value changes.
The first portion of the output is:
DED_CODE DEPARTMENT BANK_ACCT DED_AMT GROSS-------- ---------- --------- ------- -----CITY MIS 40950036 $14.00 $6,099.50 122850108 $31.75 $9,075.00 163800144 $82.70 $22,013.75
*TOTAL DEPARTMENT MIS $128.45 $37,188.25
PRODUCTION 160633 $7.42 $2,475.00 136500120 $18.25 $9,130.00 819000702 $60.20 $17,094.00
*TOTAL DEPARTMENT PRODUCTION $85.87 $28,699.00*TOTAL DED_CODE CITY $214.32 $65,887.25
The last portion of the output is:
DED_CODE DEPARTMENT BANK_ACCT DED_AMT GROSS-------- ---------- --------- ------- -----STAT MIS 40950036 $196.13 $6,099.50 122850108 $444.65 $9,075.00 163800144 $1,157.60 $22,013.75
*TOTAL DEPARTMENT MIS $1,798.38 $37,188.25
PRODUCTION 160633 $103.95 $2,475.00 136500120 $255.65 $9,130.00 819000702 $843.32 $17,094.00
*TOTAL DEPARTMENT PRODUCTION $1,202.92 $28,699.00*TOTAL DED_CODE STAT $3,001.30 $65,887.25
TOTAL $41,521.18 $461,210.75
Including Subtotals
382

Recalculating Values for Subtotal Rows
You can use the SUMMARIZE and RECOMPUTE commands instead of SUB-TOTAL andSUBTOTAL to recalculate the result of a COMPUTE command. SUMMARIZE is similar to SUB-TOTAL in that it recomputes values at every sort break. RECOMPUTE is similar to SUBTOTAL inthat it recalculates only at the specified sort break.
SUMMARIZE recomputes grand totals for the entire report. If you wish to suppress grandtotals, you can include the NOTOTAL command in your request. See Suppressing Grand Totalson page 425.
Syntax: How to Subtotal Calculated Values
{BY|ON} fieldname {SUMMARIZE|RECOMPUTE} [MULTILINES] [field1 [AND] field2...] [AS 'text'][WHEN expression;]
where:
fieldnameMust be the name of a field in a sort phrase. A BY phrase can include a summarycommand. The number of fields to summarize multiplied by the number of levels ofsummary commands counts in the number of display fields for the request. For detailson determining the maximum number of display fields that can be used in a request,see Displaying Report Data on page 39.
SUMMARIZE
Recomputes values at every sort break.
RECOMPUTE
Recalculates values only at the specified sort break.
MULTILINES
Suppresses the printing of a subtotal line for every sort break that has only one detailline, since the subtotal value is equal to this one value. Note that MULTI-LINES is asynonym for MULTILINES. MULTILINES is not supported with horizontal (ACROSS) sortfields.
You can also suppress grand totals using the NOTOTAL command, as described in Suppressing Grand Totals on page 425.
AS 'text' Enables you to specify a different label. For related information, see Using Headings,Footings, Titles, and Labels on page 1519.
field1, field2, ...Denotes a list of specific fields to be subtotaled after the RECOMPUTE orSUMMARIZE. This list overrides the default, which includes all numeric display fields.
6. Including Totals and Subtotals
Creating Reports With TIBCO® WebFOCUS Language 383

You can use the asterisk (*) wildcard character instead of a field list to indicate that allfields, numeric and alphanumeric, should be included on the summary lines. You caneither use the asterisk to display all columns or reference the specific columns, numericand alphanumeric, you want to display.
WHEN expressionSpecifies the conditional display of subtotals based on a Boolean expression. Youmust end the expression with a semicolon.
You may also generate subtotals for the recalculated values with the ON TABLE command. Usethe following syntax:
ON TABLE SUMMARIZE
Example: Using SUMMARIZE
The following request illustrates the use of SUMMARIZE to recalculate DG_RATIO at thespecified sort break, DEPARTMENT, and for the higher-level sort break, PAY_DATE:
TABLE FILE EMPLOYEESUM GROSS DED_AMT AND COMPUTEDG_RATIO/F4.2=DED_AMT/GROSS;BY HIGHEST PAY_DATE BY DEPARTMENTBY BANK_ACCTWHERE BANK_ACCT NE 0ON DEPARTMENT SUMMARIZEEND
The first portion of the output is:
PAY_DATE DEPARTMENT BANK_ACCT GROSS DED_AMT DG_RATIO-------- ---------- --------- ----- ------- --------82/08/31 MIS 40950036 $1,540.00 $725.34 .47 122850108 $1,815.00 $1,261.40 .69 163800144 $2,255.00 $1,668.69 .74
*TOTAL DEPARTMENT MIS $5,610.00 $3,655.43 .65
PRODUCTION 160633 $2,475.00 $1,427.24 .58 136500120 $1,342.00 $522.28 .39 819000702 $2,238.50 $1,746.03 .78
*TOTAL DEPARTMENT PRODUCTION $6,055.50 $3,695.55 .61*TOTAL PAY_DATE 82/08/31 $11,665.50 $7,350.98 .63
Recalculating Values for Subtotal Rows
384

The last portion of the output is:
PAY_DATE DEPARTMENT BANK_ACCT GROSS DED_AMT DG_RATIO-------- ---------- --------- ----- ------- --------82/01/29 PRODUCTION 819000702 $2,035.00 $1,241.33 .61
*TOTAL DEPARTMENT PRODUCTION $2,035.00 $1,241.33 .61*TOTAL PAY_DATE 82/01/29 $4,182.75 $2,648.12 .63
81/12/31 MIS 163800144 $2,147.75 $1,406.79 .66
*TOTAL DEPARTMENT MIS $2,147.75 $1,406.79 .66*TOTAL PAY_DATE 81/12/31 $2,147.75 $1,406.79 .66
81/11/30 MIS 163800144 $2,147.75 $1,406.79 .66
*TOTAL DEPARTMENT MIS $2,147.75 $1,406.79 .66*TOTAL PAY_DATE 81/11/30 $2,147.75 $1,406.79 .66
TOTAL $65,887.25 $41,521.18 .63
Tip: If you use SUB-TOTAL or SUBTOTAL rather than SUMMARIZE, the values of DG_RATIO areadded.
Example: Using RECOMPUTE
The following request illustrates the use of RECOMPUTE to recalculate DG_RATIO only at thespecified sort break, DEPARTMENT.
TABLE FILE EMPLOYEESUM GROSS DED_AMT AND COMPUTEDG_RATIO/F4.2=DED_AMT/GROSS;BY HIGHEST PAY_DATE BY DEPARTMENTBY BANK_ACCTWHERE BANK_ACCT NE 0ON DEPARTMENT RECOMPUTEEND
6. Including Totals and Subtotals
Creating Reports With TIBCO® WebFOCUS Language 385

The first portion of the output is:
PAY_DATE DEPARTMENT BANK_ACCT GROSS DED_AMT DG_RATIO-------- ---------- --------- ----- ------- --------82/08/31 MIS 40950036 $1,540.00 $725.34 .47 122850108 $1,815.00 $1,261.40 .69 163800144 $2,255.00 $1,668.69 .74
*TOTAL DEPARTMENT MIS $5,610.00 $3,655.43 .65
PRODUCTION 160633 $2,475.00 $1,427.24 .58 136500120 $1,342.00 $522.28 .39 819000702 $2,238.50 $1,746.03 .78
*TOTAL DEPARTMENT PRODUCTION $6,055.50 $3,695.55 .61
82/07/30 MIS 40950036 $1,540.00 $725.34 .47 122850108 $1,815.00 $1,261.40 .69
The last portion of the output is:
PAY_DATE DEPARTMENT BANK_ACCT GROSS DED_AMT DG_RATIO-------- ---------- --------- ----- ------- --------82/01/29 MIS 163800144 $2,147.75 $1,406.79 .66
*TOTAL DEPARTMENT MIS $2,147.75 $1,406.79 .66
PRODUCTION 819000702 $2,035.00 $1,241.33 .61
*TOTAL DEPARTMENT PRODUCTION $2,035.00 $1,241.33 .61
81/12/31 MIS 163800144 $2,147.75 $1,406.79 .66
*TOTAL DEPARTMENT MIS $2,147.75 $1,406.79 .66
81/11/30 MIS 163800144 $2,147.75 $1,406.79 .66
*TOTAL DEPARTMENT MIS $2,147.75 $1,406.79 .66
TOTAL $65,887.25 $41,521.18 .63
Summarizing Alphanumeric Columns
By default, subtotals (using the SUBTOTAL and SUB-TOTAL commands) and recalculations(using the RECOMPUTE and SUMMARIZE commands) only display values for numeric reportcolumns. However, you can include alphanumeric columns on these summary lines by eitherspecifying the columns you want to display on the summary lines or by using the asteriskwildcard character to display all fields on the summary lines.
Summarizing Alphanumeric Columns
386

The alphanumeric value displayed on a SUBTOTAL or SUB-TOTAL line is either the first,minimum, maximum, or last alphanumeric value within the sort group, depending on the valueof the SUMPREFIX parameter. On a RECOMPUTE or SUMMARIZE line, alphanumeric values arerecalculated using the summary values for that line.
Syntax: How to Include All Columns on Summary Lines
ON sortfield summarycommand *
where:
sortfieldIs the sort field for which a change in value triggers the summary line.
summarycommandIs SUBTOTAL, SUB-TOTAL, RECOMPUTE, or SUMMARIZE.
*
Indicates that all fields, numeric and alphanumeric, should be included on thesummary lines. You can either use the asterisk to display all columns or reference thespecific columns you want to display.
Example: Including Alphanumeric Fields on Summary Lines
The following request against the GGSALES data source computes the alphanumericequivalents of the DOLLARS and UNITS fields, creates an alphanumeric version of the formulafor the ratio between DOLLARS and UNITS, and computes the numeric ratio between DOLLARSand UNITS. The RECOMPUTE * command recomputes all values on a change of value for thestate sort field:
SET SUMPREFIX=FSTTABLE FILE GGSALESSUM PRODUCT DOLLARS/I8M AS 'Dollars' IN 22 UNITS AS 'Units'COMPUTE Formula/A19 = EDIT(DOLLARS)|'/'|EDIT(UNITS)|'=';COMPUTE Ratio/F8 = DOLLARS/UNITS;BY STBY CATEGORY NOPRINTWHERE ST EQ 'CA' OR 'IL'ON ST RECOMPUTE *ON TABLE SET PAGE NOPAGEEND
6. Including Totals and Subtotals
Creating Reports With TIBCO® WebFOCUS Language 387

On the output, the alphanumeric formula is recomputed using the summed numeric fields.However, the product value is taken from the first product within each sort value, as that fieldis not recomputed and SUMPREFIX=FST:
State Product Dollars Units Formula Ratio----- ------- ------- ----- ------- -----CA Capuccino $2,957,852 237246 02957852/00237246= 12 Biscotti $2,770,508 222844 02770508/00222844= 12 Coffee Grinder $1,935,863 152276 01935863/00152276= 13
*TOTAL CA Capuccino $7,664,223 612366 07664223/00612366= 13
IL Espresso $1,398,779 109581 01398779/00109581= 13 Biscotti $1,561,904 120976 01561904/00120976= 13 Coffee Grinder $1,050,243 83541 01050243/00083541= 13
*TOTAL IL Espresso $4,010,926 314098 04010926/00314098= 13
TOTAL Capuccino $11,675,149 926464 11675149/00926464= 13
Note that if the SUBTOTAL summary command had been used, the formula would not havebeen recomputed and would have displayed the values from the first line within each sortgroup.
Reference: Usage Notes for Summarizing Alphanumeric Columns
Date fields and numeric and alphanumeric fields with date formatting options are notincluded on summary lines.
Column total lines follow the same rules as summary lines.
Summary values for ACROSS sort fields are supported.
Manipulating Summary Values With Prefix Operators
You can use the SUBTOTAL, SUB-TOTAL, RECOMPUTE, and SUMMARIZE commands at the ONTABLE level to specify the type of summary operation to use to produce the grand total line onthe report.
In addition, prefix operators can be used with the summary options SUBTOTAL, SUB-TOTAL,RECOMPUTE, and SUMMARIZE at both the sort break and grand total levels. If the same fieldwas aggregated using multiple prefix operators in the SUM command, you can use the prefixoperator along with the field name to differentiate between the fields with multiple operators inthe summary command.
Manipulating Summary Values With Prefix Operators
388

Prefix operations on summary lines are performed on the retrieved, selected, and summedvalues that become the detail lines in the report. Unlike field-based prefix operations, they arenot performed on each incoming record.
Each type of summary has its own purpose, and handles the prefix operators appropriately forthe type of summary information to be displayed. For example, using AVE. at a sort field breakproduces the average within the sort group.
Alphanumeric fields can also be displayed on summary lines. In order to do this, you musteither explicitly list the alphanumeric field name on the summary command, or use theasterisk (*) wildcard to display all fields.
Different operations from two ON phrases for the same sort break display on the samesummary line, and allow a mixture of operations on summary lines. The grand total linepopulates all fields populated by any summary command, even fields that are not specified inthe grand total command.
If the same field is referenced in more than one ON phrase for the same sort break, the lastfunction specified is applied.
The following prefix operators are supported for numeric fields:
ASQ.
AVE.
CNT.
FST.
LST.
MAX.
MIN.
SUM.
The following prefix operators are supported for alphanumeric fields:
FST.
LST.
MAX.
MIN.
6. Including Totals and Subtotals
Creating Reports With TIBCO® WebFOCUS Language 389

SUM. (means LST. if SUMPREFIX=LST or FST. if SUMPREFIX=FST)
Syntax: How to Use Prefix Operators With Summary Values
{BY|ON} breakfield [AS 'text1'] sumoption [MULTILINES] [pref. ] [*|[field1 [[pref2. ] field2 ...]]] [AS 'text2'] [WHEN expression;]
To replace the default grand total, use the following syntax
ON TABLE sumoption [pref. ][field1 [[pref2. ]field2 ...]] [AS 'text2']
where:
breakfieldIs the sort field whose change in value triggers the summary operation. A BY phrasecan include a summary command. When the value of the sort field changes, it triggersthe summary operation.
sumoptionCan be one of the following: SUBTOTAL, SUB-TOTAL, RECOMPUTE, or SUMMARIZE.
'text1'Is the column heading to use for the break field on the report output.
MULTILINES
Suppresses the printing of a summary line for every sort break that has only one detailline. Note that MULTILINES suppresses the summary line even if a prefix operator isused to specify a different operation for the summary line. MULTI-LINES is a synonymfor MULTILINES. MULTILINES is not supported with horizontal (ACROSS) sort fields.
pref.Is a prefix operator. When specified without a field list, the prefix operator is appliedto every numeric column in the report output and every numeric column is populatedwith values on the summary row.
*
Includes all display fields on the summary line. If a prefix operator is specified, it isapplied to all fields. If the prefix operator is not supported with alphanumeric fields,alphanumeric fields are not included on the summary line.
[field1 [field2 ... fieldn]]Produces the type of summary specified by sumoption for the listed fields. If no fieldnames are listed, the summary is produced for every numeric column in the reportoutput.
pref. field1 [field2 ... fieldn] [pref2. fieldm ...]The first prefix operator is applied to field1 through fieldn. The second prefix operatoris applied to fieldm. Only the fields specified are populated with values on the
Manipulating Summary Values With Prefix Operators
390

summary row. Each prefix operator must be separated by a blank space from thefollowing field name. For example:
'text2'Is the text that prints on the left of the summary row.
expressionIs an expression that determines whether the summary operation is performed ateach break.
Reference: Usage Notes for Summary Prefix Operators
COLUMN-TOTAL does not support prefix operators.
Prefix operators PCT., RPCT., AND TOT. are not supported.
Double prefix operators (such as PCT.CNT.) are not supported.
When an ACROSS field is used in the request, the same field name displays over multiplecolumns (ACROSS groups) in the report output. A prefix operator applied to such a field ona summary line is applied to all of those columns.
The SUM. prefix operator produces the same summary values as a summary phrase withno prefix operator.
SUMMARIZE and RECOMPUTE apply the calculations defined in the associated COMPUTEcommand to the summary values. Therefore, in order to perform the necessarycalculations, the SUMMARIZE or RECOMPUTE command must calculate all of the fieldsreferenced in the COMPUTE command.
If the same field is referenced by more than one summary operation with different prefixoperators at each level, the default grand total (one produced without an ON TABLEsummaryoption command) applies the operation specified by the first operator used in thereport request (the left-most sort field in the output).
Example: Using Prefix Operators With SUBTOTAL
The following example uses prefix operators to calculate the:
Average list price by rating.
Sum copies by category within the rating field.
6. Including Totals and Subtotals
Creating Reports With TIBCO® WebFOCUS Language 391

Notice that the subtotal row for each rating contains a value only in the LISTPR column, andthe subtotal row for each category contains a value only in the COPIES column. The grand totalline contains values only for the columns that were subtotaled. Note the blank space betweeneach prefix operator and the field name that follows it:
TABLE FILE MOVIESPRINT COPIES LISTPR WHOLESALEPR TITLE/A23 BY RATING BY CATEGORY WHERE CATEGORY EQ 'CHILDREN' OR 'CLASSIC' WHERE RATING EQ 'G' OR 'NR' ON RATING SUBTOTAL AVE. LISTPR AS '*Ave: ' ON CATEGORY SUBTOTAL SUM. COPIES AS '*Sum: 'END
The output is:
RATING CATEGORY COPIES LISTPR WHOLESALEPR TITLE------ -------- ------ ------ ----------- -----G CHILDREN 2 44.95 29.99 SHAGGY DOG, THE 2 29.95 12.50 ALICE IN WONDERLAND 3 26.99 12.00 BAMBI
*Sum: CHILDREN 7
CLASSIC 3 89.95 40.99 GONE WITH THE WIND
*Sum: CLASSIC 3*Ave: G 47.96
NR CHILDREN 1 19.95 10.00 SMURFS, THE 1 19.95 9.75 SCOOBY-DOO-A DOG IN THE 1 14.95 7.65 SESAME STREET-BEDTIME S 1 14.98 7.99 ROMPER ROOM-ASK MISS MO 1 29.95 15.99 SLEEPING BEAUTY
*Sum: CHILDREN 5
CLASSIC 1 24.98 14.99 EAST OF EDEN 3 39.99 20.00 CITIZEN KANE 1 29.95 15.99 CYRANO DE BERGERAC 1 19.99 10.95 MARTY 2 19.99 10.95 MALTESE FALCON, THE 2 19.95 9.99 ON THE WATERFRONT 2 89.99 40.99 MUTINY ON THE BOUNTY 2 19.99 10.95 PHILADELPHIA STORY, THE 2 19.98 10.99 CAT ON A HOT TIN ROOF 2 29.95 15.00 CASABLANCA
*Sum: CLASSIC 18*Ave: NR 27.64
TOTAL 33 31.91
Manipulating Summary Values With Prefix Operators
392

Example: Using SUBTOTAL at the Sort Break and Grand Total Levels
The following example adds the ON TABLE SUBTOTAL command to the request in the previousexample (Using Prefix Operators With SUBTOTAL on page 391) at the sort break level tocalculate the minimum number of copies and maximum list price on the grand total line for theentire report:
TABLE FILE MOVIESPRINT COPIES LISTPR WHOLESALEPR TITLE/A23 BY RATING BY CATEGORY WHERE CATEGORY EQ 'CHILDREN' OR 'CLASSIC' WHERE RATING EQ 'G' OR 'NR' ON RATING SUBTOTAL AVE. LISTPR AS '*Ave: ' ON CATEGORY SUBTOTAL SUM. COPIES AS '*Sum: ' ON TABLE SUBTOTAL MIN. COPIES MAX. LISTPREND
6. Including Totals and Subtotals
Creating Reports With TIBCO® WebFOCUS Language 393

The output is exactly the same as in the previous request, except for the grand total line:
RATING CATEGORY COPIES LISTPR WHOLESALEPR TITLE------ -------- ------ ------ ----------- -----G CHILDREN 2 44.95 29.99 SHAGGY DOG, THE 2 29.95 12.50 ALICE IN WONDERLAND 3 26.99 12.00 BAMBI
*Sum: CHILDREN 7
CLASSIC 3 89.95 40.99 GONE WITH THE WIND
*Sum: CLASSIC 3*Ave: G 47.96
NR CHILDREN 1 19.95 10.00 SMURFS, THE 1 19.95 9.75 SCOOBY-DOO-A DOG IN THE 1 14.95 7.65 SESAME STREET-BEDTIME S 1 14.98 7.99 ROMPER ROOM-ASK MISS MO 1 29.95 15.99 SLEEPING BEAUTY
*Sum: CHILDREN 5
CLASSIC 1 24.98 14.99 EAST OF EDEN 3 39.99 20.00 CITIZEN KANE 1 29.95 15.99 CYRANO DE BERGERAC 1 19.99 10.95 MARTY 2 19.99 10.95 MALTESE FALCON, THE 2 19.95 9.99 ON THE WATERFRONT 2 89.99 40.99 MUTINY ON THE BOUNTY 2 19.99 10.95 PHILADELPHIA STORY, THE 2 19.98 10.99 CAT ON A HOT TIN ROOF 2 29.95 15.00 CASABLANCA
*Sum: CLASSIC 18*Ave: NR 27.64
TOTAL 1 89.99
Example: Differentiating Between Fields With Multiple Prefix Operators
The following request uses both the MAX. and MIN. prefix operators with the UNITS field. Onthe summary commands, these are differentiated by referencing them as MAX.UNITS andMIN.UNITS.
TABLE FILE GGSALES SUM MAX.UNITS MIN.UNITS BY REGION BY ST ON REGION RECOMPUTE MAX. MAX.UNITS MIN. MIN.UNITS WHERE DATE GE 19971001 WHERE REGION EQ 'West' OR 'Northeast' ON TABLE RECOMPUTE MIN. MAX.UNITS MAX. MIN.UNITS ON TABLE SET PAGE NOPAGE END
Manipulating Summary Values With Prefix Operators
394

On the report output, the summary for each region displays the maximum of the statemaximum values and the minimum of the state minimum values. The summary for the entirereport displays the minimum of the state maximum values and the maximum of the stateminimum values. The report output is shown in the following image:
Example: Displaying an Alphanumeric Field on a Summary Line
The following request displays the sum of the list price field and the minimum value of thedirector field by rating:
TABLE FILE MOVIESPRINT COPIES LISTPR WHOLESALEPR DIRECTORBY RATINGBY CATEGORYWHERE CATEGORY EQ 'CHILDREN' OR 'CLASSIC'WHERE RATING EQ 'G' OR 'NR'WHERE DIRECTOR NE ' 'ON RATING SUBTOTAL SUM. LISTPR MIN. DIRECTOR AS '*A/N:'END
6. Including Totals and Subtotals
Creating Reports With TIBCO® WebFOCUS Language 395

The output is:
RATING CATEGORY COPIES LISTPR WHOLESALEPR DIRECTOR------ -------- ------ ------ ----------- --------G CHILDREN 2 44.95 29.99 BARTON C. 2 29.95 12.50 GEROMINI 3 26.99 12.00 DISNEY W. CLASSIC 3 89.95 40.99 FLEMING V
*A/N: G 191.84 BARTON C.
NR CHILDREN 1 29.95 15.99 DISNEY W. CLASSIC 1 24.98 14.99 KAZAN E. 3 39.99 20.00 WELLES O. 1 29.95 15.99 GORDON M. 1 19.99 10.95 MANN D. 2 19.99 10.95 HUSTON J. 2 19.95 9.99 KAZAN E. 2 89.99 40.99 MILESTONE L. 2 19.99 10.95 CUKOR G. 2 19.98 10.99 BROOKS R. 2 29.95 15.00 CURTIZ M.
*A/N: NR 344.71 BROOKS R.
TOTAL 536.55 BARTON C.
Example: Displaying All Fields on a Summary Line
The following request displays the sum of every display field on the subtotal line. The directorfield is alphanumeric, so the last value displays:
TABLE FILE MOVIESPRINT COPIES LISTPR WHOLESALEPR DIRECTORBY RATINGBY CATEGORYWHERE CATEGORY EQ 'CHILDREN' OR 'CLASSIC'WHERE RATING EQ 'G' OR 'NR'WHERE DIRECTOR NE ' 'ON RATING SUBTOTAL SUM. * AS '*All: 'END
Manipulating Summary Values With Prefix Operators
396

The output is:
RATING CATEGORY COPIES LISTPR WHOLESALEPR DIRECTOR------ -------- ------ ------ ----------- --------G CHILDREN 2 44.95 29.99 BARTON C. 2 29.95 12.50 GEROMINI 3 26.99 12.00 DISNEY W. CLASSIC 3 89.95 40.99 FLEMING V
*All: G 10 191.84 95.48 FLEMING V
NR CHILDREN 1 29.95 15.99 DISNEY W. CLASSIC 1 24.98 14.99 KAZAN E. 3 39.99 20.00 WELLES O. 1 29.95 15.99 GORDON M. 1 19.99 10.95 MANN D. 2 19.99 10.95 HUSTON J. 2 19.95 9.99 KAZAN E. 2 89.99 40.99 MILESTONE L. 2 19.99 10.95 CUKOR G. 2 19.98 10.99 BROOKS R. 2 29.95 15.00 CURTIZ M.
*All: NR 19 344.71 176.79 CURTIZ M.
TOTAL 29 536.55 272.27 CURTIZ M.
Controlling Summary Line Processing
When processing summary lines, you can control whether SUBTOTAL and RECOMPUTEcommands are propagated to the grand total row of a report.
If the summary line contains fields with and without prefix operators, those fields without prefixoperators are processed as though they were specified with the operator SUM.
The function of the SET SUMMARYLINES command is to make the processing of SUBTOTAL,SUB-TOTAL, SUMMARIZE, and RECOMPUTE on the grand total line consistent with how theywork for sort field breaks. The setting that invokes this type of processing is SETSUMMARYLINES=EXPLICIT.
When SUBTOTAL and RECOMPUTE are used at a sort break level, they do not propagate toother sort breaks. SUB-TOTAL and SUMMARIZE propagate to all higher level sort breaks.
The grand total can be considered the highest level sort field in a request. However, by default,all of the summary options, not just SUB-TOTAL and SUMMARIZE, propagate to the grand totallevel.
The SET SUMMARYLINES=EXPLICIT command prevents the propagation of SUBTOTAL andRECOMPUTE to the grand total. In addition, if all summary commands in the request specifyfield lists, only the specified fields are aggregated and displayed on the grand total line.
6. Including Totals and Subtotals
Creating Reports With TIBCO® WebFOCUS Language 397
When SUBTOTAL and RECOMPUTE are the only summary commands used in the request, agrand total line is produced only if it is explicitly specified in the request using the ON TABLESUBTOTAL/SUB-TOTAL/RECOMPUTE/SUMMARIZE phrase. If the ON TABLE phrase specifies afield list, only those fields are aggregated and displayed.
Note that you can always suppress the grand total line using the ON TABLE NOTOTALcommand in the request.
Syntax: How to Control Summary Line Processing
SET SUMMARYLINES = {NEW|OLD|EXPLICIT}
where:
NEW
Propagates all summary operations to the grand total line. Fields listed in a summarycommand are populated only on summary lines created by that summary command and onsummary lines created by propagation of that summary command. NEW is the defaultvalue.
The alphanumeric value displayed on a SUBTOTAL or SUB-TOTAL line is either the first orlast alphanumeric value within the sort group, depending on the value of the SUMPREFIXparameter. On a RECOMPUTE or SUMMARIZE line, alphanumeric values are recalculatedusing the summary values for that line.
OLD
This value is no longer supported and is processed as NEW.
EXPLICIT
Does not propagate SUBTOTAL and RECOMPUTE to the grand total line. Fields listedin a summary command are populated only on summary lines created by thatsummary command and on summary lines created by propagation of that summarycommand.
Note: This command is not supported in a request using the ON TABLE SET syntax.
Reference: Usage Notes for SET SUMMARYLINES
SET SUMMARYLINES is not supported within a TABLE request (ON TABLE).
If COLUMN-TOTAL is specified in the request, all numeric fields are totaled on the grandtotal line unless the COLUMN-TOTAL phrase lists specific fields. If the COLUMN-TOTALphrase lists specific fields, those fields and any fields propagated by SUB-TOTAL orSUMMARIZE commands are totaled.
Manipulating Summary Values With Prefix Operators
398

A summary command with a list of field names populates only those columns on theassociated summary line.
For example:
TABLE FILE MOVIES PRINT COPIES LISTPR WHOLESALEPR BY RATING BY CATEGORY WHERE CATEGORY EQ 'CHILDREN' WHERE RATING EQ 'G' ON RATING SUBTOTAL LISTPR AS '*LIST' ON CATEGORY SUBTOTAL COPIES AS '*COPY'END
The output has subtotals for COPIES on the CATEGORY sort break and for LISTPR on theRATING sort break. Both columns are populated on the grand total line. WHOLESALEPR is notreferenced in either SUBTOTAL command and, therefore, is not on any summary line:
RATING CATEGORY COPIES LISTPR WHOLESALEPR------ -------- ------ ------ -----------G CHILDREN 2 44.95 29.99 2 29.95 12.50 3 26.99 12.00
*COPY CHILDREN 7*LIST G 101.89
TOTAL 7 101.89
Example: Using SET SUMMARYLINES With SUBTOTAL
The following request using the MOVIES data source has a sort break for CATEGORY thatsubtotals the COPIES field and a sort break for RATING that subtotals the LISTPR field:
TABLE FILE MOVIESSUM COPIES LISTPR WHOLESALEPRBY RATINGBY CATEGORYWHERE CATEGORY EQ 'CHILDREN'WHERE RATING EQ 'G'ON RATING SUBTOTAL COPIESON CATEGORY SUBTOTAL LISTPREND
6. Including Totals and Subtotals
Creating Reports With TIBCO® WebFOCUS Language 399

Running the request with SUMMARYLINES=NEW subtotals COPIES only for the RATING sortbreak and subtotals LISTPR only for the CATEGORY sort break but propagates both to thegrand total line:
RATING CATEGORY COPIES LISTPR WHOLESALEPR------ -------- ------ ------ -----------G CHILDREN 7 101.89 54.49
*TOTAL CHILDREN 101.89*TOTAL G 7
TOTAL 7 101.89
Running the request with SUMMARYLINES=EXPLICIT subtotals COPIES only for the RATING sortbreak and subtotals LISTPR only for the CATEGORY sort break. It does not produce a grandtotal line:
RATING CATEGORY COPIES LISTPR WHOLESALEPR------ -------- ------ ------ -----------G CHILDREN 7 101.89 54.49
*TOTAL CHILDREN 101.89*TOTAL G 7
Adding the phrase ON TABLE SUBTOTAL WHOLESALEPR with SUMMARYLINES=EXPLICITproduces a grand total line with the WHOLESALEPR field subtotaled:
RATING CATEGORY COPIES LISTPR WHOLESALEPR------ -------- ------ ------ -----------G CHILDREN 7 101.89 54.49
*TOTAL CHILDREN 101.89*TOTAL G 7
TOTAL 54.49
Manipulating Summary Values With Prefix Operators
400

Example: Using COLUMN-TOTAL With SET SUMMARYLINES=EXPLICIT
The following request using the MOVIES data source has a sort break for CATEGORY for whichsubtotals the COPIES field and a sort break for RATING that subtotals the LISTPR field. It alsohas an ON TABLE COLUMN-TOTAL phrase:
SET SUMMARYLINES=EXPLICITTABLE FILE MOVIESSUM COPIES LISTPR WHOLESALEPRBY RATINGBY CATEGORYWHERE CATEGORY EQ 'CHILDREN'WHERE RATING EQ 'G'ON RATING SUBTOTAL COPIESON CATEGORY SUBTOTAL LISTPRON TABLE COLUMN-TOTALEND
The grand total line displays a column total for all numeric columns because of the ON TABLECOLUMN-TOTAL phrase:
RATING CATEGORY COPIES LISTPR WHOLESALEPR------ -------- ------ ------ -----------G CHILDREN 7 101.89 54.49
*TOTAL CHILDREN 101.89*TOTAL G 7
TOTAL 7 101.89 54.49
The following request has an ON TABLE SUBTOTAL WHOLESALEPR command. It also has anON TABLE COLUMN-TOTAL phrase:
SET SUMMARYLINES=EXPLICITTABLE FILE MOVIESSUM COPIES LISTPR WHOLESALEPRBY RATINGBY CATEGORYWHERE CATEGORY EQ 'CHILDREN'WHERE RATING EQ 'G'ON RATING SUBTOTAL COPIESON CATEGORY SUBTOTAL LISTPRON TABLE SUBTOTAL WHOLESALEPRON TABLE COLUMN-TOTALEND
6. Including Totals and Subtotals
Creating Reports With TIBCO® WebFOCUS Language 401

The grand total line displays a column total only for the WHOLESALEPR column because of theON TABLE SUBTOTAL command:
RATING CATEGORY COPIES LISTPR WHOLESALEPR------ -------- ------ ------ -----------G CHILDREN 7 101.89 54.49
*TOTAL CHILDREN 101.89*TOTAL G 7
TOTAL 54.49
Using SUB-TOTAL instead of SUBTOTAL causes COPIES and LISTPR to be aggregated on thegrand total line. WHOLESALEPR is totaled because it is listed in the COLUMN-TOTAL phrase.The subtotal for LISTPR propagates to the RATING sort break as well as to the grand total:
SET SUMMARYLINES=EXPLICITTABLE FILE MOVIESSUM COPIES LISTPR WHOLESALEPRBY RATINGBY CATEGORYWHERE CATEGORY EQ 'CHILDREN'WHERE RATING EQ 'G'ON RATING SUB-TOTAL COPIESON CATEGORY SUB-TOTAL LISTPRON TABLE COLUMN-TOTAL WHOLESALEPREND
The output is:
RATING CATEGORY COPIES LISTPR WHOLESALEPR------ -------- ------ ------ -----------G CHILDREN 7 101.89 54.49
*TOTAL CHILDREN 101.89*TOTAL G 7 101.89
TOTAL 7 101.89 54.49
Using Prefix Operators With Calculated Values
If a request includes the RECOMPUTE or SUMMARIZE command, the expression specified inthe associated COMPUTE command is applied using values from the summary line. Thecolumns used to recompute the expression can have prefix operators. The recomputedcolumn, regardless of the prefix operator specified for it, applies these input values to theexpression specified in the COMPUTE command. Therefore, any supported prefix operator canbe specified for the recomputed report column without affecting the calculated value.
Manipulating Summary Values With Prefix Operators
402

All fields used in the COMPUTE command must be displayed by the RECOMPUTE orSUMMARIZE command in order to be populated. If any field used in the expression is notpopulated, the calculated value returned for the expression is unpredictable.
Example: Using Prefix Operators With RECOMPUTE
The first request creates a calculated field named DIFF, which is the difference betweenDOLLARS and BUDDOLLARS. This value is then recomputed for each region, without usingprefix operators.
TABLE FILE GGSALESSUM UNITS DOLLARS BUDDOLLARSAND COMPUTE DIFF/I10 = DOLLARS-BUDDOLLARS; BY REGION BY CATEGORY WHERE CATEGORY EQ 'Food' OR 'Coffee' WHERE REGION EQ 'West' OR 'Midwest' ON REGION RECOMPUTEEND
The recomputed value is the difference between the totals for DOLLARS and BUDDOLLARS.
Region Category Unit Sales Dollar Sales Budget Dollars DIFF------ -------- ---------- ------------ -------------- ----Midwest Coffee 332777 4178513 4086032 92481 Food 341414 4338271 4220721 117550
*TOTAL Midwest 674191 8516784 8306753 210031
West Coffee 356763 4473517 4523963 -50446 Food 340234 4202337 4183244 19093
*TOTAL West 696997 8675854 8707207 -31353
TOTAL 1371188 17192638 17013960 178678
6. Including Totals and Subtotals
Creating Reports With TIBCO® WebFOCUS Language 403

The following request uses prefix operators in the RECOMPUTE command to calculate themaximum DOLLARS and the minimum BUDDOLLARS and then recompute DIFF. No matterwhich prefix operator we specify for DIFF, it is calculated as the difference between the valuesin the DOLLARS and BUDDOLLARS columns. If any of the fields used in the calculation(DOLLARS, BUDDOLLARS, and DIFF) do not display on the summary row, the calculation cannotbe performed.
TABLE FILE GGSALESSUM UNITS DOLLARS BUDDOLLARSAND COMPUTE DIFF/I10 = DOLLARS-BUDDOLLARS; BY REGION BY CATEGORY WHERE CATEGORY EQ 'Food' OR 'Coffee' WHERE REGION EQ 'West' OR 'Midwest' ON REGION RECOMPUTE MAX. DOLLARS MIN. BUDDOLLARS AVE. DIFFEND
The output is:
Region Category Unit Sales Dollar Sales Budget Dollars DIFF------ -------- ---------- ------------ -------------- ----Midwest Coffee 332777 4178513 4086032 92481 Food 341414 4338271 4220721 117550
*TOTAL Midwest 4338271 4086032 252239
West Coffee 356763 4473517 4523963 -50446 Food 340234 4202337 4183244 19093
*TOTAL West 4473517 4183244 290273
Example: Using RECOMPUTE at the Sort Break and Grand Total Levels
The following example adds the ON TABLE RECOMPUTE command to the previous request(Using Prefix Operators With RECOMPUTE on page 403) to calculate the average values foreach column. Notice that the value of DIFF is calculated as the difference between the valuesin the Dollar Sales and the Budget Dollars columns on the grand total line:
TABLE FILE GGSALESSUM UNITS DOLLARS BUDDOLLARSAND COMPUTE DIFF/I10 = DOLLARS-BUDDOLLARS; BY REGION BY CATEGORY WHERE CATEGORY EQ 'Food' OR 'Coffee' WHERE REGION EQ 'West' OR 'Midwest' ON REGION RECOMPUTE MAX. DOLLARS MIN. BUDDOLLARS DIFF ON TABLE RECOMPUTE AVE.END
Manipulating Summary Values With Prefix Operators
404

The output is:
Region Category Unit Sales Dollar Sales Budget Dollars DIFF------ -------- ---------- ------------ -------------- ----Midwest Coffee 332777 4178513 4086032 92481 Food 341414 4338271 4220721 117550
*TOTAL Midwest 4338271 4086032 252239
West Coffee 356763 4473527 4523963 -50436 Food 340234 4202338 4183244 19094
*TOTAL West 4473527 4183244 290283
TOTAL 342797 4298162 4253490 44672
Using Multiple SUB-TOTAL or SUMMARIZE Commands With Prefix Operators
SUB-TOTAL and SUMMARIZE propagate their operations to all higher-level sort fields. If arequest uses SUB-TOTAL or SUMMARIZE at multiple sort levels, more than one prefix operatormay apply to the same field.
When a SUB-TOTAL or SUMMARIZE command on a lower-level sort field propagates up to thehigher levels, it applies its prefix operators only to those fields that did not already havedifferent prefix operators specified at the higher level. For any field that had a prefix operatorspecified at a higher level, the original prefix operator is applied at the level at which it wasfirst specified and to the grand total line, unless a different operator is specified for the grandtotal line.
Example: Using Multiple SUB-TOTAL Commands With Prefix Operators
The following illustrates prefix operators work in a request that has multiple SUB-TOTALcommands, each with a different prefix operator.
DEFINE FILE GGSALESYEAR/YY = DATE;END TABLE FILE GGSALESSUM UNITS DOLLARS/D10.2 BUDDOLLARS BY YEAR BY ST BY REGION BY CATEGORYWHERE REGION EQ 'West' OR 'Midwest'WHERE ST EQ 'CA' OR 'IL'WHERE YEAR EQ '1996' OR '1997' ON YEAR SUB-TOTAL CNT. UNITS AS '*CNT. UNITS:' ON ST SUB-TOTAL AVE. DOLLARS AS '*AVE. $:' ON REGION SUB-TOTAL MIN. AS '*MIN.:'END
6. Including Totals and Subtotals
Creating Reports With TIBCO® WebFOCUS Language 405

In the following report output, some of the values have been manually italicized or bolded forclarity:
Outlined rows are the rows generated by the SUB-TOTAL commands.
Subtotal values in the normal typeface are the count of unit sales generated by thecommand ON YEAR SUB-TOTAL CNT. UNITS. This is the topmost summary command, andtherefore does not propagate to any other summary lines.
Subtotal values in italic are average dollar sales generated by the command ON ST SUB-TOTAL AVE. DOLLARS. This is the second summary command, and therefore propagates tothe DOLLARS column of summary lines for the YEAR sort field.
Manipulating Summary Values With Prefix Operators
406

Subtotal values in boldface are minimums within their sort groups generated by thecommand ON REGION SUB-TOTAL MIN. This is the last summary command, and thereforepropagates to all other summary lines, but only calculates minimum values for thosecolumns not already populated with a count or an average.
Combinations of Summary Commands
You can specify a different summary operation for each sort break (BY or ACROSS field).
6. Including Totals and Subtotals
Creating Reports With TIBCO® WebFOCUS Language 407
If you have multiple summary commands for the same sort field, the following messagedisplays and the last summary command specified in the request is used:
(FOC36359) MORE THAN 1 SUBTOTAL/SUB-TOTAL/RECOMPUTE/SUMMARIZE
There is more than one SUBTOTAL/SUB-TOTAL/RECOMPUTE/SUMMARIZEon the same key field which is not allowed. The last one specified willoverride the rest.
SUMMARIZE and SUB-TOTAL, which propagate their summary operations to higher level sortbreaks, skip those fields at higher level sort breaks that have their own summary commands.The propagation of summary operations depends on whether prefix operator processing isused for summary lines. If prefix operators are:
Not used on summary lines, if any summary command specifies a field list, only the fieldsspecified on the summary line field lists are populated on the report.
Used on summary lines, SUB-TOTAL and SUMMARIZE propagate to:
All fields at higher level sort breaks that do not have their own summary command.
Fields not specified in the field list at higher level sort breaks that do have their ownsummary commands (columns that would have been empty). Note that this is the onlytechnique that allows different fields at the same sort break to have different summaryoptions.
Prefix operators on summary lines result in the same values whether the command isRECOMPUTE/SUMMARIZE or SUBTOTAL/SUB-TOTAL. For a computed field, the prefix operatoris not applied, and the value is recalculated using the expression in the COMPUTE commandand the values from the summary line.
When you use different summary commands for different sort fields, the default grand total rowinherits the summary command associated with the first sort field in the request. You canchange the operation performed at the grand total level by using the ON TABLE phrase tospecify a specific summary command.
Note: The grand total is considered the highest sort level. Therefore, although you can use theSUMMARIZE or SUB-TOTAL command at the grand total level, these commands apply only tothe grand total and are not propagated to any other line on the report. On the grand total levelSUMMARIZE operates as a RECOMPUTE command, and SUB-TOTAL operates as a SUBTOTALcommand.
Combinations of Summary Commands
408
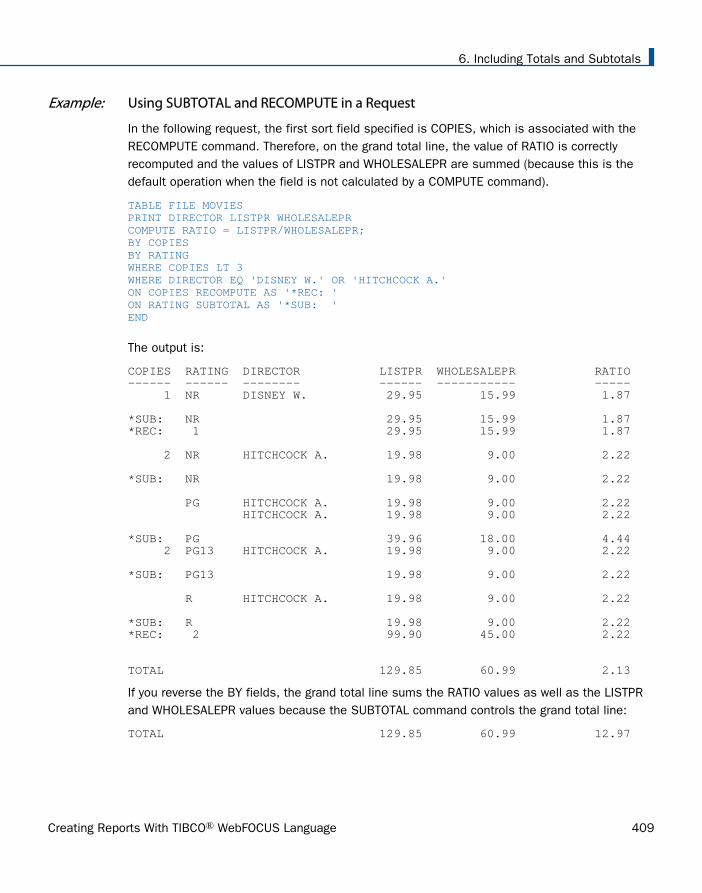
Example: Using SUBTOTAL and RECOMPUTE in a Request
In the following request, the first sort field specified is COPIES, which is associated with theRECOMPUTE command. Therefore, on the grand total line, the value of RATIO is correctlyrecomputed and the values of LISTPR and WHOLESALEPR are summed (because this is thedefault operation when the field is not calculated by a COMPUTE command).
TABLE FILE MOVIESPRINT DIRECTOR LISTPR WHOLESALEPRCOMPUTE RATIO = LISTPR/WHOLESALEPR;BY COPIESBY RATINGWHERE COPIES LT 3WHERE DIRECTOR EQ 'DISNEY W.' OR 'HITCHCOCK A.'ON COPIES RECOMPUTE AS '*REC: 'ON RATING SUBTOTAL AS '*SUB: 'END
The output is:
COPIES RATING DIRECTOR LISTPR WHOLESALEPR RATIO------ ------ -------- ------ ----------- ----- 1 NR DISNEY W. 29.95 15.99 1.87
*SUB: NR 29.95 15.99 1.87*REC: 1 29.95 15.99 1.87
2 NR HITCHCOCK A. 19.98 9.00 2.22
*SUB: NR 19.98 9.00 2.22
PG HITCHCOCK A. 19.98 9.00 2.22 HITCHCOCK A. 19.98 9.00 2.22
*SUB: PG 39.96 18.00 4.44 2 PG13 HITCHCOCK A. 19.98 9.00 2.22
*SUB: PG13 19.98 9.00 2.22
R HITCHCOCK A. 19.98 9.00 2.22
*SUB: R 19.98 9.00 2.22*REC: 2 99.90 45.00 2.22
TOTAL 129.85 60.99 2.13
If you reverse the BY fields, the grand total line sums the RATIO values as well as the LISTPRand WHOLESALEPR values because the SUBTOTAL command controls the grand total line:
TOTAL 129.85 60.99 12.97
6. Including Totals and Subtotals
Creating Reports With TIBCO® WebFOCUS Language 409

You can change the operation performed at the grand total level by adding the followingcommand to the request:
ON TABLE RECOMPUTE
The grand total line then displays the recomputed values:
TOTAL 129.85 60.99 2.13
Example: Using SUB-TOTAL With Multiple Summary Commands
In the following request, the SUB-TOTAL command propagates its operation to the DIRECTORsort field (see the total line for HITCHCOCK, on which the RATIO values are subtotaled, notrecomputed).
SUB-TOTAL is not propagated to the RATING sort field which has its own RECOMPUTEcommand, and for this sort field the RATIO value is recomputed. The grand total line isrecomputed because RECOMPUTE is performed on a higher level sort field than SUB-TOTAL.
TABLE FILE MOVIESPRINT LISTPR WHOLESALEPRCOMPUTE RATIO = LISTPR/WHOLESALEPR;BY DIRECTORBY RATINGBY COPIESWHERE COPIES LT 3WHERE DIRECTOR EQ 'HITCHCOCK A.'ON COPIES SUB-TOTAL AS '*SUB: 'ON RATING RECOMPUTE AS '*REC: 'END
Combinations of Summary Commands
410

The output is:
DIRECTOR RATING COPIES LISTPR WHOLESALEPR RATIO-------- ------ ------ ------ ----------- -----HITCHCOCK A. NR 2 19.98 9.00 2.22
*SUB: 2 19.98 9.00 2.22*REC: NR 19.98 9.00 2.22
PG 2 19.98 9.00 2.22 19.98 9.00 2.22
*SUB: 2 39.96 18.00 4.44*REC: PG 39.96 18.00 2.22
PG13 2 19.98 9.00 2.22*SUB: 2 19.98 9.00 2.2*REC: PG13 19.98 9.00 2.2
HITCHCOCK A. R 2 19.98 9.00 2.2
*SUB: 2 19.98 9.00 2.2*REC: R 19.98 9.00 2.2*TOTAL DIRECTOR HITCHCOCK A. 99.90 45.00 11.1
TOTAL 99.90 45.00 2.2
Example: Using Multiple Summary Commands With Prefix Operators
The following request prints the average value of LISTPR and the recomputed value of RATIOon the lines associated with sort field RATING. The SUB-TOTAL command associated with sortfield COPIES is propagated to all fields on the DIRECTOR sort field lines and to theWHOLESALEPR and RATIO1 columns associated with the RATING sort field. The grand total lineis suppressed for this request.
TABLE FILE MOVIESPRINT LISTPR WHOLESALEPRCOMPUTE RATIO/D6.2 = LISTPR/WHOLESALEPR;COMPUTE RATIO1/D6.2 = LISTPR/WHOLESALEPR;BY DIRECTORBY RATINGBY COPIESWHERE COPIES LT 3 WHERE DIRECTOR EQ 'KAZAN E.' ON RATING RECOMPUTE AVE. LISTPR RATIO AS '*REC: ' ON COPIES SUB-TOTAL AS '*SUB: ' ON TABLE NOTOTALEND
6. Including Totals and Subtotals
Creating Reports With TIBCO® WebFOCUS Language 411

On the output:
The values of WHOLESALEPR and RATIO1 on the row labeled *REC are subtotals becauseof propagation of the SUB-TOTAL command to the fields not specified in the RECOMPUTEcommand.
The LISTPR value is an average and the value of RATIO (which has the same definition asRATIO1) is recomputed because these two fields are specified in the RECOMPUTEcommand.
The SUB-TOTAL command is propagated to the DIRECTOR row.
The output is:
DIRECTOR RATING COPIES LISTPR WHOLESALEPR RATIO RATIO1-------- ------ ------ ------ ----------- ----- ------KAZAN E. NR 1 24.98 14.99 1.67 1.67
*SUB: 1 24.98 14.99 1.67 1.67
2 19.95 9.99 2.00 2.00
*SUB: 2 19.95 9.99 2.00 2.00*REC: NR 22.46 24.98 .90 3.66*TOTAL DIRECTOR KAZAN E. 44.93 24.98 3.66 3.66
Example: Propagation of Summary Commands With Field Lists
In the following request, the RECOMPUTE command has a field list.
TABLE FILE MOVIESPRINT LISTPR WHOLESALEPRCOMPUTE RATIO/D6.2 = LISTPR/WHOLESALEPR;COMPUTE RATIO1/D6.2 = LISTPR/WHOLESALEPR;BY DIRECTORBY RATINGBY COPIESWHERE COPIES LT 3 WHERE DIRECTOR EQ 'KAZAN E.' ON RATING RECOMPUTE LISTPR RATIO AS '*REC: ' ON COPIES SUB-TOTAL AS '*SUB: 'END
Combinations of Summary Commands
412
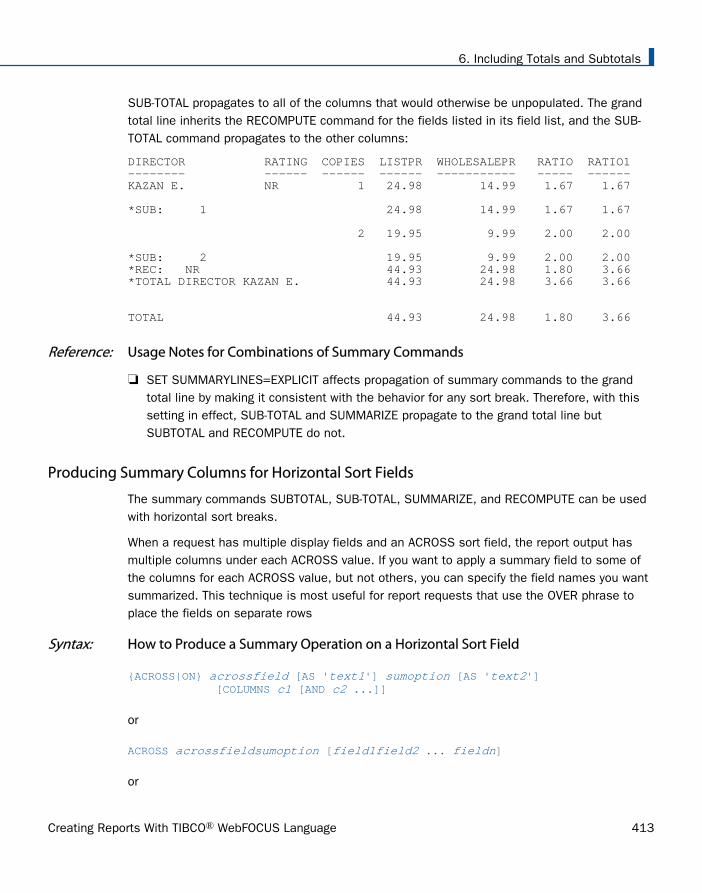
SUB-TOTAL propagates to all of the columns that would otherwise be unpopulated. The grandtotal line inherits the RECOMPUTE command for the fields listed in its field list, and the SUB-TOTAL command propagates to the other columns:
DIRECTOR RATING COPIES LISTPR WHOLESALEPR RATIO RATIO1-------- ------ ------ ------ ----------- ----- ------KAZAN E. NR 1 24.98 14.99 1.67 1.67
*SUB: 1 24.98 14.99 1.67 1.67
2 19.95 9.99 2.00 2.00
*SUB: 2 19.95 9.99 2.00 2.00*REC: NR 44.93 24.98 1.80 3.66*TOTAL DIRECTOR KAZAN E. 44.93 24.98 3.66 3.66
TOTAL 44.93 24.98 1.80 3.66
Reference: Usage Notes for Combinations of Summary Commands
SET SUMMARYLINES=EXPLICIT affects propagation of summary commands to the grandtotal line by making it consistent with the behavior for any sort break. Therefore, with thissetting in effect, SUB-TOTAL and SUMMARIZE propagate to the grand total line butSUBTOTAL and RECOMPUTE do not.
Producing Summary Columns for Horizontal Sort Fields
The summary commands SUBTOTAL, SUB-TOTAL, SUMMARIZE, and RECOMPUTE can be usedwith horizontal sort breaks.
When a request has multiple display fields and an ACROSS sort field, the report output hasmultiple columns under each ACROSS value. If you want to apply a summary field to some ofthe columns for each ACROSS value, but not others, you can specify the field names you wantsummarized. This technique is most useful for report requests that use the OVER phrase toplace the fields on separate rows
Syntax: How to Produce a Summary Operation on a Horizontal Sort Field
{ACROSS|ON} acrossfield [AS 'text1'] sumoption [AS 'text2'] [COLUMNS c1 [AND c2 ...]]
or
ACROSS acrossfieldsumoption [field1field2 ... fieldn]
or
6. Including Totals and Subtotals
Creating Reports With TIBCO® WebFOCUS Language 413
ACROSS acrossfield
ON acrossfieldsumoption [field1field2 ... fieldn]
where:
acrossfieldIs the ACROSS field whose for which you want to generate the summary option. Theend of the values for the ACROSS field triggers the summary operation.
sumoptionCan be one of the following: SUBTOTAL, SUB-TOTAL, RECOMPUTE, or SUMMARIZE.
'text1'Is the column heading to use for the break field on the report output.
'text2'Is the text that prints on the top of the summary column.
COLUMNSc1, c2 ...Lists the specific ACROSS values that you want to display on the report output in theorder in which you want them. This list of values cannot be specified in an ON phrase.If it is specified in an ACROSS phrase, it must be the last option specified in theACROSS phrase.
field1field2 ... fieldn
Are the fields that will have the summary command applied. If no fields are listed, all fieldswill be summarized.
Reference: Usage Notes for Summaries on ACROSS Fields
SUMMARIZE and SUB-TOTAL operate on the ACROSS field for which they are specified andfor all higher level ACROSS fields. They do not operate on BY fields. SUBTOTAL andRECOMPUTE operate only on the ACROSS field for which they are specified. However, thesummary is not produced until the higher level ACROSS field changes value.
SUMMARIZE and SUB-TOTAL commands specified for a BY field operate on that BY and allhigher level BY fields. They do not operate on ACROSS fields.
ROW-TOTAL, ACROSS-TOTAL, SUBTOTAL, and SUB-TOTAL sum the values in the columns.Unlike SUMMARIZE and RECOMPUTE, they do not reapply calculations other than sums.
Summary commands specified in an ON TABLE phrase operate on columns, not rows.
With ACROSS, summary columns only display at the end of the ACROSS group (when thehigher-level ACROSS field changes value).
Producing Summary Columns for Horizontal Sort Fields
414

Different operations from two ON phrases for the same sort break display in the samesummary column, and allow a mixture of operations on summary columns.
If the same field is referenced in more than one ON phrase for the same sort break, thelast summary command specified is applied.
You can specify a different summary operation for each sort break.
The SUMMARYLINES parameter does not affect processing for ACROSS fields.
When used with OVERs, the rows containing fields not to be summarized will be blank.
Prefix operators are supported on summary lines:
The following prefix operators are supported for numeric fields: ASQ., AVE., CNT., FST.,LST., MAX., MIN., SUM.
Prefix operators PCT., RPCT., AND TOT. are not supported.
Double prefix operators (such as PCT.CNT.) are not supported.
The SUM. prefix operator produces the same summary values as a summary phrasewith no prefix operator.
SUMMARIZE and RECOMPUTE apply the calculations defined in the associatedCOMPUTE command to the summary values. Therefore, in order to perform thenecessary calculations, the SUMMARIZE or RECOMPUTE command must specify all ofthe fields referenced in the COMPUTE command.
If the same field has summary operations with different prefix operators at each level,the appropriate calculation is done at each level for the prefix operator specified.
SUB-TOTAL and SUMMARIZE propagate their operations to all higher-level sort fields. Ifa request uses SUB-TOTAL or SUMMARIZE at multiple sort levels, more than one prefixoperator may apply to the same field. When a SUB-TOTAL or SUMMARIZE command ona lower-level sort field propagates up to the higher levels, it applies its prefix operatorsonly to those fields that did not already have a prefix operator specified at the higherlevel. For any field that had a prefix operator specified at a higher level, the originalprefix operator is applied at the level at which it was first specified.
Prefix operators on summary lines result in the same values whether the command isRECOMPUTE/SUMMARIZE or SUBTOTAL/SUB-TOTAL. For a computed field, the prefixoperator is not applied, and the value is recalculated using the expression in theCOMPUTE command and the values from the summary line.
6. Including Totals and Subtotals
Creating Reports With TIBCO® WebFOCUS Language 415

If an ACROSS field has an ACROSS-TOTAL phrase and a summary command with aprefix operator, the prefix operator is applied, not the ACROSS-TOTAL.
Example: Using Summary Commands With ACROSS
The following request sums units and dollars and calculates the unit cost by product andacross region and month. The ACROSS MNTH RECOMPUTE command creates totals of unitsand dollars, and recomputes the calculated value for the selected months within regions. TheACROSS REGION RECOMPUTE command does the same for the selected regions. The ONTABLE SUMMARIZE command creates summary rows. It has no effect on columns:
DEFINE FILE GGSALESMNTH/MTr = DATE;ENDTABLE FILE GGSALESSUM UNITS/I5 AS 'UNITS' OVER DOLLARS/I6 AS 'DOLLARS' OVER COMPUTE DOLLPER/I6 = DOLLARS/UNITS; AS 'UNIT COST'BY PRODUCTACROSS REGION RECOMPUTE AS 'Region Sum' COLUMNS 'Northeast' AND 'West'ACROSS MNTH RECOMPUTE AS 'Month Sum' COLUMNS 'November' AND 'December'WHERE DATE FROM '19971101' TO '19971231';WHERE PRODUCT EQ 'Capuccino' OR 'Espresso';ON TABLE SUMMARIZE AS 'Grand Total'
END
Producing Summary Columns for Horizontal Sort Fields
416

The output is:
Example: Subtotaling One Field Within an ACROSS Group
The following request against the GGSALES data source sums the DOLLARS and UNITS fieldsby CATEGORY and across REGION, but subtotals only the UNITS field.
TABLE FILE GGSALESSUM DOLLARS AS 'Dollars' OVERUNITS AS 'Units' BY CATEGORY ACROSS REGION SUBTOTAL UNITSWHERE REGION EQ 'Midwest' OR 'West'ON TABLE SET PAGE NOPAGEEND
6. Including Totals and Subtotals
Creating Reports With TIBCO® WebFOCUS Language 417

The output shows that only the rows with the UNITS values are subtotaled.
Region Midwest West TOTALCategory-------------------------------------------------------------Coffee Dollars 4178513 4473517 Units 332777 356763 689540Food Dollars 4338271 4202337 Units 341414 340234 681648Gifts Dollars 2883881 2977092 Units 230854 235042 465896
Example: Summarizing a Calculated Value in an ACROSS Group
The following request against the GGSALES data source sums the DOLLARS and UNITS fieldsand calculates DOLLARS PER UNIT across REGION. The request also has a higher-levelACROSS field, CATEGORY, so the SUMMARIZE command propagates to both ACROSS fields.
SET BYPANEL = ONTABLE FILE GGSALESSUM DOLLARS AS 'Dollars' OVERUNITS AS 'Units' OVERAND COMPUTE DPERU/D9.2 = DOLLARS/UNITS; ACROSS CATEGORY ACROSS REGION ON REGION SUMMARIZE DPERU WHERE REGION EQ 'Midwest' OR 'West' WHERE CATEGORY EQ 'Food' OR 'Gifts' ON TABLE PCHOLD FORMAT PDFEND
The first panel of output shows:
The values of DOLLARS, UNITS, and DPERU for the Midwest and West regions under theFood category.
The summary column, which has a value just for the DPERU row. Note that for ACROSS, thesummary column for REGION appears only after the higher-level ACROSS field, CATEGORY,changes value.
The values of DOLLARS, UNITS, and DPERU for the Midwest and West regions under theGifts category.
Producing Summary Columns for Horizontal Sort Fields
418

PAGE 1.1
Category Food Gifts Region Midwest West TOTAL Midwest West-------------------------------------------------------------------------Dollars 4338271 4202337 2883881 2977092Units 341414 340234 230854 235042DPERU 12.71 12.35 12.53 12.49 12.67
The second panel has the total column for the Gifts category and the grand total column. Eachof those only has a value in the DPERU row.
PAGE 1.2
Category TOTAL Region TOTAL ---------------------------------- Dollars Units DPERU 12.58 12.55
Example: Using Prefix Operators in a Summary Command With ACROSS
The following request against the GGSALES data source sums the DOLLARS and UNITS fieldsACROSS CATEGORY and ACROSS REGION, with a SUMMARIZE command on the REGION field.The request also has a higher-level ACROSS field, CATEGORY, so the SUMMARIZE commandpropagates to both ACROSS fields. The SUMMARIZE command specifies the AVE. prefixoperator for the DOLLARS field.
SET BYPANEL = ONTABLE FILE GGSALESSUM DOLLARS AS 'Dollars' OVERUNITS AS 'Units' ACROSS CATEGORY ACROSS REGION ON REGION SUMMARIZE AVE. DOLLARS WHERE REGION EQ 'Midwest' OR 'West' WHERE CATEGORY EQ 'Food' OR 'Gifts' ON TABLE PCHOLD FORMAT PDFEND
The first panel of output shows:
The values of DOLLARS and UNITS for the Midwest and West regions under the Foodcategory.
6. Including Totals and Subtotals
Creating Reports With TIBCO® WebFOCUS Language 419
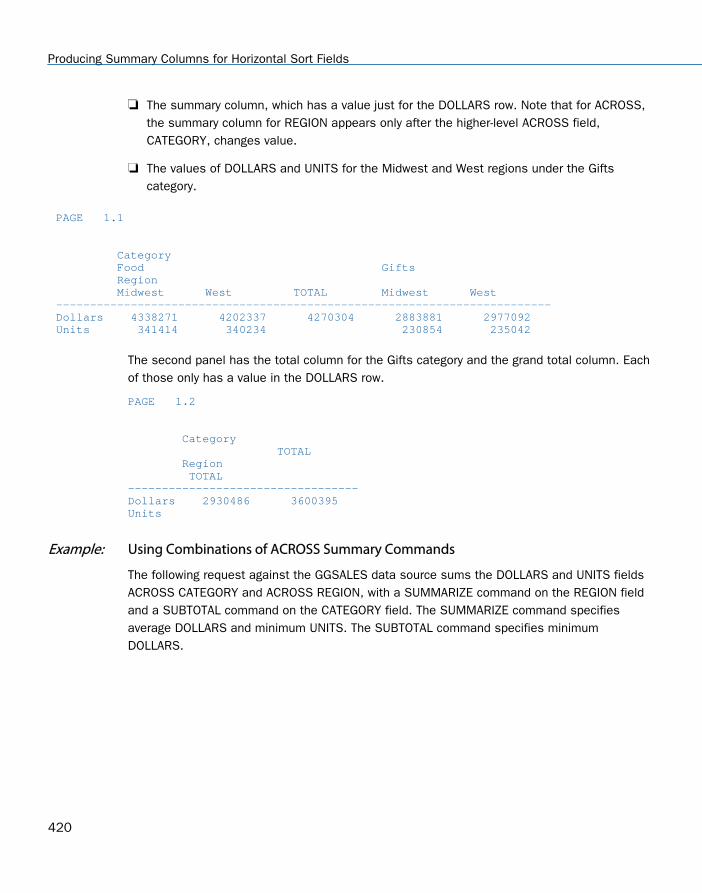
The summary column, which has a value just for the DOLLARS row. Note that for ACROSS,the summary column for REGION appears only after the higher-level ACROSS field,CATEGORY, changes value.
The values of DOLLARS and UNITS for the Midwest and West regions under the Giftscategory.
PAGE 1.1
Category Food Gifts Region Midwest West TOTAL Midwest West-------------------------------------------------------------------------Dollars 4338271 4202337 4270304 2883881 2977092Units 341414 340234 230854 235042
The second panel has the total column for the Gifts category and the grand total column. Eachof those only has a value in the DOLLARS row.
PAGE 1.2
Category TOTAL Region TOTAL----------------------------------Dollars 2930486 3600395Units
Example: Using Combinations of ACROSS Summary Commands
The following request against the GGSALES data source sums the DOLLARS and UNITS fieldsACROSS CATEGORY and ACROSS REGION, with a SUMMARIZE command on the REGION fieldand a SUBTOTAL command on the CATEGORY field. The SUMMARIZE command specifiesaverage DOLLARS and minimum UNITS. The SUBTOTAL command specifies minimumDOLLARS.
Producing Summary Columns for Horizontal Sort Fields
420

SET BYPANEL = ONTABLE FILE GGSALESSUM DOLLARS AS 'Dollars' OVERUNITS AS 'Units' ACROSS CATEGORY ACROSS REGION ON CATEGORY SUBTOTAL MIN. DOLLARS ON REGION SUMMARIZE AVE. DOLLARS MIN. UNITS WHERE REGION EQ 'Midwest' OR 'West' WHERE CATEGORY EQ 'Food' OR 'Gifts' ON TABLE PCHOLD FORMAT PDFEND
On the output, all of the TOTAL columns have the minimum UNITS. The TOTAL columnsassociated with the REGION sort field have the average DOLLARS, but the TOTAL columnassociated with the CATEGORY sort field has the minimum DOLLARS because SUMMARIZEdoes not change the prefix operator associated with a higher-level sort field.
PAGE 1.1
Category Food Gifts Region Midwest West TOTAL Midwest West-------------------------------------------------------------------------Dollars 4338271 4202337 4270304 2883881 2977092Units 341414 340234 340234 230854 235042
PAGE 1.2
Category TOTAL Region TOTAL----------------------------------Dollars 2930486 2883881Units 230854 230854
Performing Calculations at Sort Field Breaks
You can use the RECAP and COMPUTE commands to create subtotal values in a calculation.The subtotal values are not displayed. Only the result of the calculation is shown on the report.
6. Including Totals and Subtotals
Creating Reports With TIBCO® WebFOCUS Language 421

Syntax: How to Use Subtotals in Calculations
Both the RECAP and COMPUTE commands have similar syntax to other total and subtotalcommands.
{BY|ON} fieldname1 {RECAP|COMPUTE} fieldname2[/format] = expression; [WHEN expression;]
where:
fieldname1
Is the field in the BY phrase. Each time the BY field changes value, a new recap value iscalculated.
fieldname2
Is the field name that contains the result of the expression.
/format
Can be any valid format. The default is D12.2.
expression
Can be any valid expression, as described in Using Expressions on page 429. You mustend the expression with a semicolon.
WHEN expression
Is for use with RECAP only. It specifies the conditional display of RECAP lines asdetermined by a Boolean expression (see Conditionally Displaying Summary Lines and Texton page 427). You must end the expression with a semicolon.
Reference: Usage Notes for RECAP and COMPUTE
RECAP uses the current value of the named sort field, the current subtotal values of anycomputational fields that appear as display fields, or the last value for alphanumeric fields.
RECAP reserves space at the bottom of the page to ensure that a RECAP will not be aloneat the top of the next page while the data it is recapping is on the previous page. The sametechnique is used for subtotals and grand totals, but not for subfootings or COMPUTEs.
The field names in the expression must be fields that appear on the report. That is, theymust be display fields or sort control fields.
Performing Calculations at Sort Field Breaks
422

Each RECAP value displays on a separate line. However, if the request contains a RECAPcommand and SUBFOOT text, the RECAP value displays only in the SUBFOOT text and mustbe specified in the text using a spot marker. (For details, see Using Headings, Footings,Titles, and Labels on page 1519.)
The calculations in a RECAP or COMPUTE can appear anywhere under the control break,along with any text. (For details, see Using Headings, Footings, Titles, and Labels on page1519.)
In an ON phrase, a COMPUTE command is the same as a RECAP command.
The limit for ON sortfield RECAP phrases is 64 for each sort field.
You can specify multiple recap calculations in one RECAP phrase. Use the following syntax:
ON sortfield RECAP field1/format= ... ;field2/format= ... ;...
Example: Using RECAP
The following request illustrates the use of RECAP (DEPT_NET) to determine net earnings foreach department:
TABLE FILE EMPLOYEESUM DED_AMT AND GROSSBY DEPARTMENT BY PAY_DATEON DEPARTMENT RECAP DEPT_NET/D8.2M = GROSS-DED_AMT;WHEN PAY_DATE GT 820101END
6. Including Totals and Subtotals
Creating Reports With TIBCO® WebFOCUS Language 423

The output is:
DEPARTMENT PAY_DATE DED_AMT GROSS---------- -------- ------- -----MIS 81/11/30 $1,406.79 $2,147.75 81/12/31 $1,406.79 $2,147.75 82/01/29 $1,740.89 $3,247.75 82/02/26 $1,740.89 $3,247.75 82/03/31 $1,740.89 $3,247.75 82/04/30 $3,386.73 $5,890.84 82/05/28 $3,954.35 $6,649.50 82/06/30 $4,117.03 $7,460.00 82/07/30 $4,117.03 $7,460.00 82/08/31 $4,575.72 $9,000.00
** DEPT_NET $22,311.98
PRODUCTION 81/11/30 $141.66 $833.33 81/12/31 $141.66 $833.33 82/01/29 $1,560.09 $3,705.84 82/02/26 $2,061.69 $4,959.84 82/03/31 $2,061.69 $4,959.84 82/04/30 $2,061.69 $4,959.84 82/05/28 $3,483.88 $7,048.84 82/06/30 $3,483.88 $7,048.84 82/07/30 $3,483.88 $7,048.84 82/08/31 $4,911.12 $9,523.84
** DEPT_NET $27,531.14
Example: Using Multiple RECAP Commands
You can include multiple RECAP or COMPUTE commands in a request. This option enables youto perform different calculations at different control breaks.
The following request illustrates the use of multiple RECAP commands.
TABLE FILE SALESSUM UNIT_SOLD AND RETURNSWHERE AREA EQ 'U' BY DATE BY AREA BY PROD_CODEON DATE RECAPDATE_RATIO=RETURNS/UNIT_SOLD;ON AREA UNDER-LINE RECAPAREA_RATIO=RETURNS/UNIT_SOLD;END
Performing Calculations at Sort Field Breaks
424

The output is:
DATE AREA PROD_CODE UNIT_SOLD RETURNS---- ---- --------- --------- -------10/17 U B10 30 2 B17 20 2 B20 15 0 C17 12 0 D12 20 3 E1 30 4 E3 35 4
** AREA_RATIO .09
** DATE_RATIO .09
------------------------------------------10/18 U B10 13 1
** AREA_RATIO .08
** DATE_RATIO .08
------------------------------------------10/19 U B12 29 1
** AREA_RATIO .03
** DATE_RATIO .03
------------------------------------------
Suppressing Grand Totals
You can use the NOTOTAL command to suppress grand totals in a report.
Suppressing the grand total is useful when there is only one value at a sort break, since thegrand total value is equal to that one value. Using the NOTOTAL command prevents the reportfrom displaying a grand total line for every sort break that has only one detail line. You canalso suppress subtotals using the MULTILINES command. For details, see How to CreateSubtotals on page 377.
Syntax: How to Suppress Grand Totals
To suppress grand totals, add the following syntax to your request:
ON TABLE NOTOTAL
6. Including Totals and Subtotals
Creating Reports With TIBCO® WebFOCUS Language 425

Example: Suppressing Grand Totals
The following request includes the NOTOTAL phrase to suppress grand totals for CURR_SAL,GROSS, and DED_AMT.
TABLE FILE EMPLOYEESUM CURR_SAL AND GROSS AND DED_AMTBY EMP_IDBY BANK_ACCTWHERE BANK_ACCT NE 0ON BANK_ACCT SUB-TOTALON TABLE NOTOTALEND
Suppressing Grand Totals
426

The output is:
Conditionally Displaying Summary Lines and Text
In addition to using summary lines to control the look and content of your report, you canspecify WHEN criteria to control the conditions under which summary lines appear for eachvertical (BY) sort field value. WHEN is supported with SUBFOOT, SUBHEAD, SUBTOTAL, SUB-TOTAL, SUMMARIZE, RECOMPUTE, and RECAP.
6. Including Totals and Subtotals
Creating Reports With TIBCO® WebFOCUS Language 427

Example: Conditionally Displaying Summary Lines and Text
In a sales report that covers four regions (Midwest, Northeast, Southeast, and West), you mayonly want to display a subtotal when total dollar sales are greater than $11,500,000. Thefollowing request accomplishes this by including criteria that trigger the display of a subtotalwhen dollar sales exceed $11,500,000 and subfooting text when dollar sales are less than$11,500,000.
TABLE FILE GGSALESSUM UNITS DOLLARSBY REGIONBY CATEGORYON REGION SUBTOTALWHEN DOLLARS GT 11500000SUBFOOT"The total for the <REGION region is less than 11500000."WHEN DOLLARS LT 11500000END
The output is:
Region Category Unit Sales Dollar Sales ------ -------- ---------- ------------ Midwest Coffee 332777 4178513 Food 341414 4338271 Gifts 230854 2883881
The total for the Midwest region is less than 11500000. Northeast Coffee 335778 4164017 Food 353368 4379994 Gifts 227529 2848289
The total for the Northeast region is less than 11500000.Southeast Coffee 350948 4415408 Food 349829 4308731 Gifts 234455 2986240
*TOTAL Southeast 935232 11710379
West Coffee 356763 4473517 Food 340234 4202337 Gifts 235042 2977092
*TOTAL West 932039 11652946
TOTAL 3688991 46156290
Conditionally Displaying Summary Lines and Text
428
Chapter7Using Expressions
An expression combines field names, constants, and operators in a calculation thatreturns a single value. You can use an expression in a variety of commands to assign avalue to a temporary field or Dialogue Manager amper variable, or use it in screening.You can combine simpler ones to build increasingly complex expressions.
When you write an expression, you can specify the operation yourself, or you can use oneof the many supplied functions that perform specific calculations or data manipulation.These functions operate on one or more arguments, and return a single value as aresult. To use a function, you simply call it. For details about functions, see the TIBCOFOCUS® Describing Data manual.
IF-THEN-ELSE logic is supported as part of an expression, including arithmetic,chararcter, and logical expressions. It is also supported in WHERE clauses.
In this chapter:
Using Expressions in Commands and Phrases
Types of Expressions
Creating a Numeric Expression
Creating a Date Expression
Creating a Date-Time Expression
Creating a Character Expression
Creating a Variable Length Character Expression
Creating a Logical Expression
Creating a Conditional Expression
Using Expressions in Commands and Phrases
You can use an expression in various commands and phrases. An expression may not exceed40 lines and must end with a semicolon, except in WHERE and WHEN phrases, in which thesemicolon is optional.
Creating Reports With TIBCO® WebFOCUS Language 429

The commands that support expressions, and their basic syntax, are summarized here. Forcomplete syntax with an explanation, see the applicable documentation.
You can use an expression when you:
Create a temporary field, and assign a value to that field. The field can be created in aMaster File using the DEFINE attribute, or using a DEFINE or COMPUTE command:
DEFINE command preceding a report request:
DEFINE FILE filename fieldname [/format] = expression; . . .END
DEFINE attribute in a Master File:
DEFINE fieldname [/format] = expression;$
COMPUTE command in a report request:
COMPUTE fieldname [/format] = expression;
Define record selection criteria and criteria that control report formatting.
{WHERE|IF} logical_expression[;] WHEN logical_expression[;]
Determine branching in Dialogue Manager, or assign a value to a Dialogue Manager ampervariable.
-IF logical_expression [THEN] GOTO label1 [ELSE GOTO label2];
-SET &name = expression;
Perform a calculation with the RECAP command in the Financial Modeling Language (FML).
RECAP name [(n)] [/format] = expression;
Types of Expressions
An expression can be one of the following:
Numeric. Use numeric expressions to perform calculations that use numeric constants(integer or decimal) and fields. For example, you can write an expression to compute thebonus for each employee by multiplying the current salary by the desired percentage asfollows:
Types of Expressions
430

COMPUTE BONUS/D12.2 = CURR_SAL * 0.05 ;
A numeric expression returns a numeric value. For details, see Creating a NumericExpression on page 432.
Date. Use date expressions to perform numeric calculations on dates. For example, youcan write an expression to determine when a customer can expect to receive an order byadding the number of days in transit to the date on which you shipped the order as follows:
COMPUTE DELIVERY/MDY = SHIPDATE + 5 ;
There are two types of date expressions:
Date expressions, which return a date, a component of a date, or an integer thatrepresents the number of days, months, quarters, or years between two dates. Fordetails, see Creating a Date Expression on page 439.
Date-time expressions, which you can create using a variety of specialized date-timefunctions, each of which returns a different kind of value. For details on these functions,see the TIBCO WebFOCUS® Using Functions manual.
Character. Use character expressions to manipulate alphanumeric constants or fields. Forexample, you can write an expression to extract the first initial from an alphanumeric fieldas follows:
COMPUTE FIRST_INIT/A1 = EDIT (FIRST_NAME, '9$$$$$$$$$') ;
A character expression returns an alphanumeric value. For details, see Creating a CharacterExpression on page 456.
Note: Text fields can be assigned to alphanumeric fields and receive assignment fromalphanumeric fields. Text fields can also participate in expressions using the operatorsCONTAINS and OMITS.
Logical. Use logical expressions to evaluate the relationship between two values. A logicalexpression returns TRUE or FALSE. For details, see Creating a Logical Expression on page465.
Conditional. Use conditional expressions to assign values based on the result of logicalexpressions. A conditional expression (IF ... THEN ... ELSE) returns a numeric oralphanumeric value. For details, see Creating a Conditional Expression on page 467.
7. Using Expressions
Creating Reports With TIBCO® WebFOCUS Language 431

Expressions and Field Formats
When you use an expression to assign a value to a field, make sure that you give the field aformat that is consistent with the value returned by the expression. For example, if you use acharacter expression to concatenate a first name and last name and assign it to the fieldFULL_NAME, make sure you define the field as character.
Example: Assigning a Field Format of Sufficient Length
The following example contains a character expression that concatenates a first name and lastname to derive the full name. It assigns the field FULL_NAME an alphanumeric format ofsufficient length to accommodate the concatenated name:
DEFINE FILE EMPLOYEEFULL_NAME/A25 = FIRST_NAME | LAST_NAME;ENDTABLE FILE EMPLOYEEPRINT FULL_NAMEWHERE LAST_NAME IS 'BLACKWOOD'END
The output is:
FULL_NAME --------- ROSEMARIE BLACKWOOD
Creating a Numeric Expression
A numeric expression performs a calculation that uses numeric constants, fields, operators,and functions to return a numeric value. When you use a numeric expression to assign a valueto a field, that field must have a numeric format. The default format is D12.2.
A numeric expression can consist of the following components, shown below in bold:
A numeric constant. For example:
COMPUTE COUNT/I2 = 1 ;
A numeric constant in scientific notation. For example:
COMPUTE COST/D12.2 = EXPN(8E+3);
For syntax usage, see How to Express a Number in Scientific Notation on page 433.
A numeric field. For example:
COMPUTE RECOUNT/I2 = COUNT ;
Two numeric constants or fields joined by an arithmetic operator. For example:
Creating a Numeric Expression
432

COMPUTE BONUS/D12.2 = CURR_SAL * 0.05 ;
For a list of arithmetic operators, see Arithmetic Operators on page 435.
A numeric function. For example:
COMPUTE LONGEST_SIDE/D12.2 = MAX (WIDTH, HEIGHT) ;
Two or more numeric expressions joined by an arithmetic operator. For example:
COMPUTE PROFIT/D12.2 = (RETAIL_PRICE - UNIT_COST) * UNIT_SOLD ;
Note the use of parentheses to change the order of evaluation of the expression. Forinformation on the order in which numeric operations are performed, see Order ofEvaluation on page 435.
Before they are used in calculations, numeric values are generally converted to double-precision floating-point format. The result is then converted to the specified field format. Insome cases the conversion may result in a difference in rounding. Note that environments thatsupport native-mode arithmetic handle rounding differently. For details, see Evaluating NumericExpressions With Native-Mode Arithmetic on page 437.
If a number is too large (greater than 1075) or too small (less than 10-75), you receive anOverflow or Underflow warning, and asterisks display for the field value.
Note: You can change the overflow character by issuing the SET OVERFLOWCHAR command.
For detailed information on rounding behavior for numeric data formats, see the DescribingData With TIBCO WebFOCUS® Language manual.
IF-THEN-ELSE logic is supported in numeric expressions.
Syntax: How to Express a Number in Scientific Notation
In an IF clause, use the following:
IF field op n[.nn]{E|D|e|d}[+|-]p
In a WHERE clause, use the following:
WHERE field op EXPN(n[.nn{E|D|e|d}[+|-]p);
In a COMPUTE command, use the following:
COMPUTE field[/format] = EXPN(n[.nn]{{E|D|e|d}[+|-]p);
7. Using Expressions
Creating Reports With TIBCO® WebFOCUS Language 433

In a DEFINE command, use the following:
DEFINE FILE filename field[/format] = EXPN(n[.nn]{E|D|e|d}[+|-]p);END
In a DEFINE in the Master File, use the following:
DEFINE field[/format] = EXPN(n[.nn]{{E|D|e|d}[+|-]p);
where:
fieldIs a field in a request.
/formatIs the optional format of the field. For information on formats, see the Describing DataWith TIBCO WebFOCUS® Language manual.
opIs a relational operator in a request.
n.nnIs a numeric constant that consists of a whole number component, followed by adecimal point, followed by a fractional component.
E, D, e, d
Denotes scientific notation. E, e, d, and D are interchangeable.
+, -
Indicates if p is positive or negative. Positive is the default.
pIs the power of 10 to which to raise the number. The range of values for p is between -78 and +78 on z/OS, -99 to +99 elsewhere.
Note: EXPN is useful for calculations on fields with F and D formats. It is generally not usefulfor calculations on fields with P or I formats.
Example: Evaluating a Number in Scientific Notation
You can use scientific notation in an IF or WHERE clause to express 8000 as 8E+03:
IF RCOST LT 8E+03
WHERE RCOST LT EXPN(8E+03)
Creating a Numeric Expression
434

Reference: Arithmetic Operators
The following list shows the arithmetic operators you can use in an expression:
Addition +
Subtraction -
Multiplication *
Division /
Exponentiation **
Note: If you attempt to divide by 0, the value of the expression is 0. Multiplication andexponentiation are not supported for date expressions of any type. To isolate part of a date,use a simple assignment command.
Order of Evaluation
Numeric expressions are evaluated in the following order:
1. Exponentiation.
2. Division and multiplication.
3. Addition and subtraction.
When operators are at the same level, they are evaluated from left to right. Becauseexpressions in parentheses are evaluated before any other expression, you can useparentheses to change this predefined order. For example, the following expressions yielddifferent results because of parentheses:
COMPUTE PROFIT/D12.2 = RETAIL_PRICE - UNIT_COST * UNIT_SOLD ;COMPUTE PROFIT/D12.2 = (RETAIL_PRICE - UNIT_COST) * UNIT_SOLD ;
In the first expression, UNIT_SOLD is first multiplied by UNIT_COST, and the result issubtracted from RETAIL_PRICE. In the second expression, UNIT_COST is first subtracted fromRETAIL_PRICE, and that result is multiplied by UNIT_SOLD.
Note:Two operators cannot appear consecutively. The following expression is invalid:
a * -1
To make it valid, you must add parentheses:
a* (-1)
7. Using Expressions
Creating Reports With TIBCO® WebFOCUS Language 435

Example: Controlling the Order of Evaluation
The order of evaluation can affect the result of an expression. Suppose you want to determinethe dollar loss in retail sales attributed to the return of damaged items. You could issue thefollowing request:
TABLE FILE SALESPRINT RETAIL_PRICE RETURNS DAMAGEDCOMPUTE RETAIL_LOSS/D12.2 = RETAIL_PRICE * RETURNS + DAMAGED;BY PROD_CODEWHERE PROD_CODE IS 'E1';END
The calculation
COMPUTE RETAIL_LOSS/D12.2 = RETAIL_PRICE * RETURNS + DAMAGED;
gives an incorrect result because RETAIL_PRICE is first multiplied by RETURNS, and then theresult is added to DAMAGED. The correct result is achieved by adding RETURNS to DAMAGED,then multiplying the result by RETAIL_PRICE.
You can change the order of evaluation by enclosing expressions in parentheses. Anexpression in parentheses is evaluated before any other expression. You may also useparentheses to improve readability.
Using parentheses, the correct syntax for the preceding calculation is:
COMPUTE RETAIL_LOSS/D12.2 = RETAIL_PRICE * (RETURNS + DAMAGED);
The output is:
PROD_CODE RETAIL_PRICE RETURNS DAMAGED RETAIL_LOSS--------- ------------ ------- ------- -----------E1 $.89 4 7 9.79
Example: Using IF-THEN-ELSE Logic in an Arithmetic Expression
The following request uses IF-THEN-ELSE logic in an arithmetic expression to determine howmuch to add to LISTPR to calculate NEWPRICE.
TABLE FILE MOVIESSUM COPIESLISTPRCOMPUTENEWPRICE = LISTPR + (IF COPIES GT 10 THEN 0.00 ELSE 25.00);BY CATEGORYON TABLE SET PAGE NOLEADON TABLE SET STYLE *GRID=OFF,$ENDSTYLEEND
Creating a Numeric Expression
436
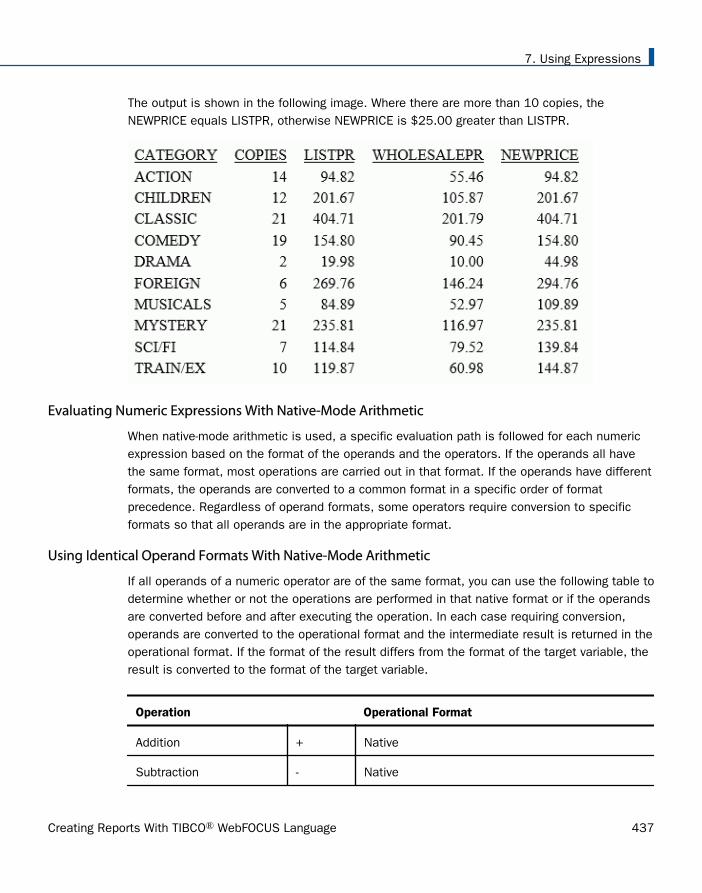
The output is shown in the following image. Where there are more than 10 copies, theNEWPRICE equals LISTPR, otherwise NEWPRICE is $25.00 greater than LISTPR.
Evaluating Numeric Expressions With Native-Mode Arithmetic
When native-mode arithmetic is used, a specific evaluation path is followed for each numericexpression based on the format of the operands and the operators. If the operands all havethe same format, most operations are carried out in that format. If the operands have differentformats, the operands are converted to a common format in a specific order of formatprecedence. Regardless of operand formats, some operators require conversion to specificformats so that all operands are in the appropriate format.
Using Identical Operand Formats With Native-Mode Arithmetic
If all operands of a numeric operator are of the same format, you can use the following table todetermine whether or not the operations are performed in that native format or if the operandsare converted before and after executing the operation. In each case requiring conversion,operands are converted to the operational format and the intermediate result is returned in theoperational format. If the format of the result differs from the format of the target variable, theresult is converted to the format of the target variable.
Operation Operational Format
Addition + Native
Subtraction - Native
7. Using Expressions
Creating Reports With TIBCO® WebFOCUS Language 437

Operation Operational Format
Multiplication * Native
Full Division / Accepts single or double-precision floating point,converts all others to double-precision floatingpoint
Exponentiation ** Double-precision floating point
Example: Using Identical Operand Formats (Native-mode Arithmetic)
The following variables are defined as integers in Maintain Data:
COMPUTE OPERANDONE/I4 ; OPERANDTWO/I4 ; RESULT/I4 ;
The required multiplication is done in native-mode arithmetic (integer arithmetic):
COMPUTE RESULT/I4 = OPERANDONE * OPERANDTWO ;
Using Different Operand Formats With Native-Mode Arithmetic
If operands of a numeric operator have different formats, you can use the following table todetermine what the common format is after they are converted. The lower operand is convertedto the format of the higher operand before performing the operation.
Order Format
1 16-byte packed decimal
2 Double-precision floating point
3 8-byte packed-decimal
4 Single-precision floating point
5 Integer
6 Character (alphanumeric and text)
Creating a Numeric Expression
438

For example, if a 16-byte packed-decimal operand is used in an expression, all other operandsare converted to 16-byte packed-decimal format for evaluation. On the other hand, if anexpression includes only integer and alphanumeric operands, all alphanumeric operands areconverted to integer format.
A character (that is, alphanumeric or text) value can be used in a computation if it is a numericstring. An attempt is made to convert the character operand to the format of the other operandin the expression. If both operands are character, an attempt is made to convert them todouble-precision. If the conversion is not possible, an error message is generated.
If you assign a decimal value to an integer, the fractional value is truncated.
Creating a Date Expression
A date expression performs a numeric calculation that involves dates.
A date expression returns a date, a date component, or an integer that represents the numberof days, months, quarters, or years between two dates. You can write a date expressiondirectly that consists of:
A date constant. For example:
COMPUTE END_DATE/MDYY = 'FEB 29 2000';
This requires single quotation marks around the date constant.
A date field. For example:
COMPUTE NEWDATE/YMD = START_DATE;
An alphanumeric, integer, or packed decimal format field, with date edit options. Forexample, in the second COMPUTE command, OLDDATE is a date expression:
COMPUTE OLDDATE/I6YMD = 980307;COMPUTE NEWDATE/YMD DFC 19 YRT 10 = OLDDATE;
A calculation that uses an arithmetic operator or date function to return a date. Use anumeric operator only with date formats (formerly called Smart dates). The followingexample first converts the integer date HIRE_DATE (format I6YMD) to the date formatCONVERTED_HDT (format YMD). It then adds 30 days to CONVERTED_HDT:
COMPUTE CONVERTED_HDT/YMD = HIRE_DATE;HIRE_DATE_PLUS_THIRTY/YMD = CONVERTED_HDT + 30;
A calculation that uses a numeric operator or date function to return an integer thatrepresents the number of days, months, quarters, or years between two dates. Thefollowing example uses the date function YMD to calculate the difference (number of days)between an employee hire date and the date of his first salary increase:
7. Using Expressions
Creating Reports With TIBCO® WebFOCUS Language 439

COMPUTE DIFF/I4 = YMD (HIRE_DATE,FST.DAT_INC);
Formats for Date Values
You can work with dates in one of two ways:
In date format. The value is treated as an integer that represents the number of daysbetween the date value and a base date. There are two base dates for date formats:
YMD and YYMD formats have a base date of December 31, 1900.
YM and YYM formats have a base date of January, 1901 on z/OS and a base date ofDecember 31, 1900 on Windows and UNIX.
When displayed, the integer value is converted to the corresponding date in the formatspecified for the field. The format can be specified in either the Master File or in thecommand that uses an expression to assign a value to the field. These were previouslyreferred to as smart date formatted fields.
In integer, packed decimal, or alphanumeric format with date edit options. The value istreated as an integer, a packed decimal, or an alphanumeric string. When displayed, thevalue is formatted as a date. These were previously referred to as old date formattedfields.
You can convert a date in one format to a date in another format simply by assigning one tothe other. For example, the following assignments take a date stored as an alphanumeric field,formatted with date edit options, and convert it to a date stored as a temporary date field:
COMPUTE ALPHADATE/A6MDY = '120599' ; REALDATE/MDY = ALPHADATE;
Reference: Base Dates for Date Formats
The following table shows the base date for each supported date format:
Format Base Date
YMD, YYMD, MDYY, DMYY, MDY, and DMY
1900/12/31
YM, YYM, MYY, and MY 1901/01 on z/OS
1900/12/31 on Windows and UNIX
Creating a Date Expression
440

Format Base Date
YQ, YYQ, QYY, and QY 1901 Q1
JUL and YYJUL 1900/365
DMY, YYQW
There is no base date for these formats; these arejust numbers, not dates.
Note that the base date used for the functions DA and DT is December 31, 1899. For detailson date functions, see the TIBCO WebFOCUS® Using Functions manual.
Reference: Impact of Date Formats on Storage and Display
The following table illustrates how the field format affects storage and display:
Date Format (For example:MDYY)
Integer, Packed, Decimal, orAlphanumeric Format (Forexample: A8MDYY)
February 28, 1999 35853 02/28/1999 02281999 02/28/1999
March 1, 1999 35854 03/01/1999 03011999 03/01/1999
Performing Calculations on Dates
The format of a field determines how you can use it in a date expression. Calculations ondates in date format can incorporate numeric operators as well as numeric functions.Calculations on dates in integer, packed, decimal, or alphanumeric format require the use ofdate functions. Numeric operators return an error message or an incorrect result.
A full set of functions is supplied with your software, enabling you to manipulate dates ininteger, packed decimal, and alphanumeric format. For details on date functions, see theTIBCO WebFOCUS® Using Functions manual.
7. Using Expressions
Creating Reports With TIBCO® WebFOCUS Language 441

Example: Calculating Dates
Assume that your company maintains a SHIPPING database. The following example calculateshow many days it takes the shipping department to fill an order by subtracting the date onwhich an item is ordered, the ORDER_DATE, from the date on which it is shipped, theSHIPDATE:
COMPUTE TURNAROUND/I4 = SHIP_DATE - ORDER_DATE;
An item ordered on February 28, 1999, and shipped on March 1, 1999, results in a differenceof one day. However, if the SHIP_DATE and ORDER_DATE fields have an integer format, theresult of the calculation (730000) is incorrect, since you cannot use the numeric operatorminus (-) with that format.
The following table shows how the field format affects the result:
Value in Date Format Value in Integer Format
SHIP_DATE = March 1, 1999 35854 03011999
ORDER_DATE = February 28, 1999 35853 02281999
TURNAROUND 1 730000
To obtain the correct result using fields in integer, packed, decimal, or alphanumeric format,use the date function MDY, which returns the difference between two dates in the form month-day-year. Using the function MDY, you can calculate TURNAROUND as follows:
COMPUTE TURNAROUND/I4 = MDY(ORDER_DATE, SHIP_DATE);
Cross-Century Dates With DEFINE and COMPUTE
You can use an expression in a DEFINE or COMPUTE command, or in a DEFINE attribute in aMaster File, that implements the sliding window technique for cross-century date processing.The parameters DEFCENT and YRTHRESH provide a means of interpreting the century if thefirst two digits of the year are not provided elsewhere. If the first two digits are provided, theyare simply accepted.
Creating a Date Expression
442

Returned Field Format Selection
A date expression always returns a number. That number may represent a date, or the numberof days, months, quarters, or years between two dates. When you use a date expression toassign a value to a field, the format selected for the field determines how the result isreturned.
Example: Selecting the Format of a Returned Field
Consider the following commands, assuming that SHIP_DATE and ORDER_DATE are date-formatted fields. The first command calculates how many days it takes a shipping departmentto fill an order by subtracting the date on which an item is ordered, ORDER_DATE, from thedate on which it is shipped, SHIP_DATE. The second command calculates a delivery date byadding five days to the date on which the order is shipped.
COMPUTE TURNAROUND/I4 = SHIP_DATE - ORDER_DATE;COMPUTE DELIVERY/MDY = SHIP_DATE + 5;
In the first command, the date expression returns the number of days it takes to fill an order;therefore, the associated field, TURNAROUND, must have an integer format. In the secondcommand, the date expression returns the date on which the item will be delivered; therefore,the associated field, DELIVERY, must have a date format.
Using a Date Constant in an Expression
When you use a date constant in a calculation with a field in date format, you must enclose itin single quotation marks; otherwise, it is interpreted as the number of days between theconstant and the base date (December 31, 1900, or January 1, 1901). For example, if022899 were not enclosed in quotation marks, the value would be interpreted as the22,899th day after 12/31/1900, rather than as February 28, 1999.
Example: Initializing a Field With a Date Constant
The following command initializes START_DATE with the date constant 02/28/99:
COMPUTE START_DATE/MDY = '022899';
The following command calculates the number of days elapsed since January 1, 1999:
COMPUTE YEAR_TO_DATE/I4 = CURR_DATE - 'JAN 1 1999' ;
7. Using Expressions
Creating Reports With TIBCO® WebFOCUS Language 443

Extracting a Date Component
Date components include days, months, quarters, or years. You can write an expression thatextracts a component from a field in date format. However, you cannot write an expressionthat extracts days, months, or quarters from a date that does not have these components. Forexample, you cannot extract a month from a date in YY format, which represents only thenumber of years.
Example: Extracting the Month Component From a Date
The following example extracts the month component from SHIP_DATE, which has the formatMDYY:
COMPUTE SHIP_MONTH/M = SHIP_DATE;
If SHIP_DATE has the value March 1, 1999, the above expression returns the value 03 forSHIP_MONTH.
A calculation on a date component automatically produces a valid value for the desiredcomponent. For example, if the current value of SHIP_MONTH is 03, the following expressioncorrectly returns the value 06:
COMPUTE ADD_THREE/M = SHIPMONTH + 3;
If the addition of months results in an answer greater than 12, the months are adjustedcorrectly (for example, 11 + 3 is 2, not 14).
Combining Fields With Different Formats in an Expression
When using fields in date format, you can combine fields with a different order of componentswithin the same expression. In addition, you can assign the result of a date expression to afield with a different order of components from the fields in the expression.
You cannot, however, write an expression that combines dates in date format with dates ininteger, packed, decimal or character format.
Example: Combining Fields With Format YYMD and MDY
Consider the two fields DATE_PAID and DUE_DATE. DATE_PAID has the format YYMD, andDUE_DATE has the format MDY. You can combine these two fields in an expression tocalculate the number of days that a payment is late:
COMPUTE DAYS_LATE/I4 = DATE_PAID - DUE_DATE;
Creating a Date Expression
444
Example: Assigning a Different Order of Components to a Returned Field
Consider the field DATE_SOLD. This field contains the date on which an item is sold, in YYMDformat. The following expression adds seven days to DATE_SOLD to determine the last date onwhich the item can be returned. It then assigns the result to a field with DMY format:
COMPUTE RETURN_BY/DMY = DATE_SOLD + 7;
Creating a Date-Time Expression
A date-time expression returns date and time components. You can create these expressionsusing a variety of supplied date-time functions. For details about date-time functions, see theTIBCO FOCUS® Describing Data manual.
Reference: Automatic Conversion Between Date and Date-Time Formats
In early releases of date-time fields, you were required to use date-time functions for allconversions between date and date-time formats. While these functions are still supported forconversions, the requirement to use them has been eliminated in certain operations.
The following automatic direct operations are supported between date and date-time formats:
Assignment.
Assignment of a date field or a date constant to a date-time field. The time component isset to zero (midnight). The date can be a full component date such as YYMD or a partialcomponent date such as YYM. It cannot be a single component date such as Q, as thistype of date, although displayed as a date in reports, is stored as an integer value and isused as an integer value in expressions.
Assignment of a date-time field or date-time constant to a date field. The timecomponents are removed.
Comparison and Subtraction.
When a date-time value is compared with or subtracted from a date value, or a date valueis compared with or subtracted from a date-time value, the date is converted to date-timewith the time component set to midnight. They are then compared or subtracted as date-time values.
Function parameters.
Simplified date functions can use either date or date-time values as their date parameters.Legacy user functions do not support this new functionality. The date-time functions (Hfunctions) use date-time parameters and the new date functions use new dates, which arestored as offsets from a base date.
7. Using Expressions
Creating Reports With TIBCO® WebFOCUS Language 445
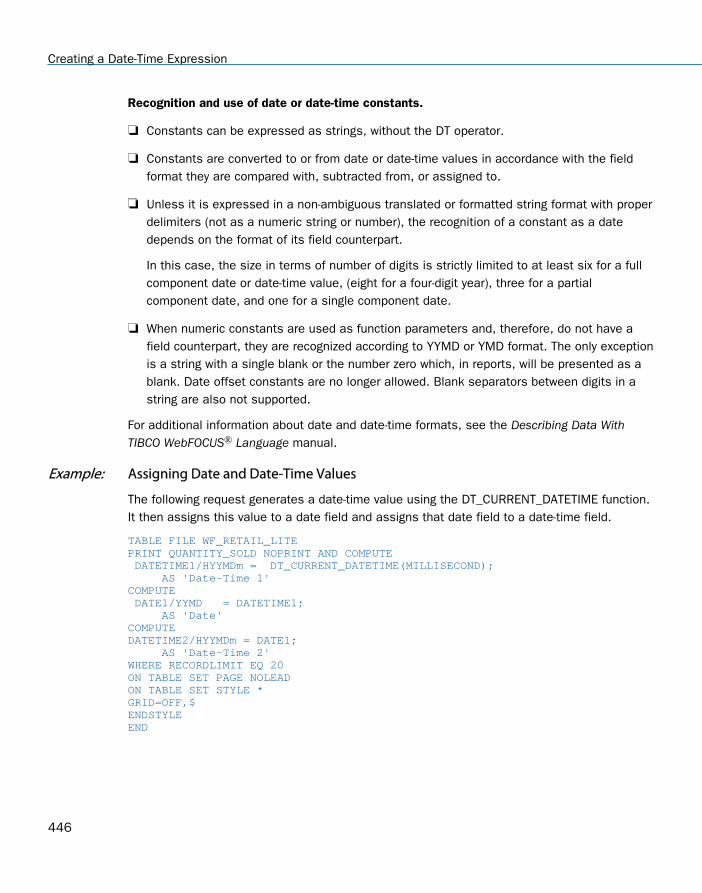
Recognition and use of date or date-time constants.
Constants can be expressed as strings, without the DT operator.
Constants are converted to or from date or date-time values in accordance with the fieldformat they are compared with, subtracted from, or assigned to.
Unless it is expressed in a non-ambiguous translated or formatted string format with properdelimiters (not as a numeric string or number), the recognition of a constant as a datedepends on the format of its field counterpart.
In this case, the size in terms of number of digits is strictly limited to at least six for a fullcomponent date or date-time value, (eight for a four-digit year), three for a partialcomponent date, and one for a single component date.
When numeric constants are used as function parameters and, therefore, do not have afield counterpart, they are recognized according to YYMD or YMD format. The only exceptionis a string with a single blank or the number zero which, in reports, will be presented as ablank. Date offset constants are no longer allowed. Blank separators between digits in astring are also not supported.
For additional information about date and date-time formats, see the Describing Data WithTIBCO WebFOCUS® Language manual.
Example: Assigning Date and Date-Time Values
The following request generates a date-time value using the DT_CURRENT_DATETIME function.It then assigns this value to a date field and assigns that date field to a date-time field.
TABLE FILE WF_RETAIL_LITEPRINT QUANTITY_SOLD NOPRINT AND COMPUTE DATETIME1/HYYMDm = DT_CURRENT_DATETIME(MILLISECOND); AS 'Date-Time 1'COMPUTE DATE1/YYMD = DATETIME1; AS 'Date'COMPUTEDATETIME2/HYYMDm = DATE1; AS 'Date-Time 2'WHERE RECORDLIMIT EQ 20ON TABLE SET PAGE NOLEADON TABLE SET STYLE *GRID=OFF,$ENDSTYLEEND
Creating a Date-Time Expression
446

The output is shown in the following image. The original date-time field has a non-zero timecomponent. When assigned to the date field, the time component is removed. When that dateis assigned to the second date-time field, a zero time component is added.
7. Using Expressions
Creating Reports With TIBCO® WebFOCUS Language 447

Example: Comparing Date and Date-Time Values
The following request creates one date-time field and one date field. When QUANTITY_SOLD is1, they have the same date value and the date-time field has a zero time component. WhenQUANTITY_SOLD is 2, they have different date values, and the date-time field has a zero timecomponent. In all other cases, the date-time field has the current date with a non-zero timecomponent, and the date field has the current date. The EQUAL1 field compares them to see ifthey compare as equal.
TABLE FILE WF_RETAIL_LITEPRINT QUANTITY_SOLD AS Quantity AND COMPUTE DATETIME1/HYYMDm = IF QUANTITY_SOLD EQ 1 THEN '2017/06/05' ELSE IF QUANTITY_SOLD EQ 2 THEN '2016/02/29' ELSE DT_CURRENT_DATETIME(MILLISECOND); AS 'Date-Time'COMPUTE DATE1/YYMD = IF QUANTITY_SOLD EQ 1 THEN '2017/06/05' ELSE IF QUANTITY_SOLD EQ 2 THEN '2015/12/30' ELSE DT_CURRENT_DATE(); AS 'Date'COMPUTE EQUAL1/A1 = IF DATETIME1 EQ DATE1 THEN 'Y' ELSE 'N'; AS 'Equal?'WHERE RECORDLIMIT EQ 12ON TABLE SET PAGE NOLEADON TABLE SET STYLE *GRID=OFF,$ENDSTYLEEND
Creating a Date-Time Expression
448

The output is shown in the following image. When a date value is compared to a date-timevalue, the date is converted to a date-time value with the time component set to zero, andthen the values are compared. Therefore, when QUANTITY_SOLD is 1, both the datecomponents are equal and the time component of the date-time field is set to zero, so whenthe date is converted to a date-time value, they are equal. When QUANTITY_SOLD is 2, thedate components are different, so they are not equal. When QUANTITY_SOLD is 3, the datecomponents are the same, but the date-time field has a non-zero time component. Therefore,when the date field is converted to a date-time value with a zero time component and they arecompared, they are not equal.
Syntax: How to Specify the Order of Date Components in a Date-Time Field
SET DATEFORMAT = option
where:
optionCan be one of the following: MDY, DMY, YMD, or MYD. MDY is the default value forthe U.S. English format.
7. Using Expressions
Creating Reports With TIBCO® WebFOCUS Language 449

Specifying a Date-Time Value
An external date-time value is a constant in character format from one of the following sources:
A sequential data source.
Used in an expression in a WHERE, IF, DEFINE, or a COMPUTE.
A date-time constant or a date-time value as it appears in a character file has one of thefollowing formats:
time_string [date_string] date_string [time_string]
A date-time constant in a COMPUTE, DEFINE, or WHERE expression must have one of thefollowing formats:
DT(time_string [date_string])DT(date_string [time_string])
A date-time constant in an IF expression has one of the following formats:
'time_string [date_string]' 'date_string [time_string]'
If the value contains no blanks or special characters, the single quotation marks are notnecessary. Note that the DT prefix is not supported in IF criteria.
where:
time_stringCannot contain blanks. Time components are separated by colons, and may be followed byAM, PM, am, or pm. For example:
14:30:20:99 (99 milliseconds)14:3014:30:20.99 (99/100 seconds)14:30:20.999999 (999999 microseconds)02:30:20:500pm
Note that the second can be expressed with a decimal point or be followed by a colon:
If there is a colon after the second, the value following it represents the millisecond.There is no way to express the microsecond or nanosecond using this notation.
A decimal point in the second value indicates the decimal fraction of a second. Amicrosecond can be represented using six decimal digits. A nanosecond can berepresented using nine decimal digits.
Creating a Date-Time Expression
450

date_stringCan have one of the following three formats:
Numeric string format. Is exactly four, six, or eight digits. Four-digit strings areconsidered to be a year (century must be specified). The month and day are set toJanuary 1. Six and eight-digit strings contain two or four digits for the year, followed bytwo for the month, and then two for the day. Because the component order is fixed withthis format, the DATEFORMAT setting described in How to Specify the Order of DateComponents in a Date-Time Field on page 449 is ignored.
If a numeric-string format longer than eight digits is encountered, it is treated as acombined date-time string in the Hn format. The following are examples of numericstring date constants:
99199919990201
Formatted-string format. Contains a one or two-digit day, a one or two-digit month, anda two or four-digit year separated by spaces, slashes, hyphens, or periods. All threeparts must be present and follow the DATEFORMAT setting described in How to Specifythe Order of Date Components in a Date-Time Field on page 449. If any of the threefields is four digits, it is interpreted as the year, and the other two fields must followthe order given by the DATEFORMAT setting. The following are examples of formatted-string date constants:
1999/05/205 20 199999.05.201999-05-20
Translated-string format. Contains the full or abbreviated month name. The year mustalso be present in four-digit or two-digit form. If the day is missing, day 1 of the monthis assumed; if present, it can have one or two digits. If the string contains both a two-digit year and a two-digit day, they must be in the order given by the DATEFORMATsetting. For example:
January 6 2000
Note:
The date and time strings must be separated by at least one blank space. Blank spacesare also permitted at the beginning and end of the date-time string or immediately beforean am/pm indicator.
7. Using Expressions
Creating Reports With TIBCO® WebFOCUS Language 451

In each date format, two-digit years are interpreted using the [F]DEFCENT and [F]YRTHRESHsettings.
Example: Assigning Date-Time Literals
The DT prefix can be used, although it is no longer required, in a COMPUTE, DEFINE, or WHEREexpression to assign a date-time literal to a date-time field. For example:
DT2/HYYMDS = DT(20051226 05:45);
DT3/HYYMDS = DT(2005 DEC 26 05:45);
DT4/HYYMDS = DT(December 26 2005 05:45);
Example: Specifying the Order of Date Components for a Date-Time Field
The following request sets DATEFORMAT to MYD:
SET DATEFORMAT = MYD DEFINE FILE EMPLOYEE DTFLDYYMD/HYYMDI = DT(APR 04 05);END TABLE FILE EMPLOYEE PRINT CURR_SAL DTFLDYYMD END
The output shows that the natural date literal 'APR 04 05' is interpreted as April 5, 1904:
CURR_SAL DTFLDYYMD -------- --------- $11,000.00 1904/04/05 00:00$13,200.00 1904/04/05 00:00$18,480.00 1904/04/05 00:00 $9,500.00 1904/04/05 00:00$29,700.00 1904/04/05 00:00$26,862.00 1904/04/05 00:00$21,120.00 1904/04/05 00:00$18,480.00 1904/04/05 00:00$21,780.00 1904/04/05 00:00$16,100.00 1904/04/05 00:00 $9,000.00 1904/04/05 00:00$27,062.00 1904/04/05 00:00
Example: Reading Date-Time Values From a Transaction File
The DTTRANS comma-delimited transaction file has an ID field and a date-time field thatcontains both the date (as eight characters) and time (in the format hour:minute:second):
01, 20000101 02:57:25,$02, 19991231 14:05:35,$
Creating a Date-Time Expression
452

Because the transaction file contains the dates in numeric string format, the DATEFORMATsetting is not used, and the dates are entered in YMD order.
The following transaction file is also valid. It contains formatted string dates that comply withthe default DATEFORMAT setting, MDY:
01, 01/01/2000 02:57:25,$02, 12/31/1999 14:05:35,$
The following Master File describes the FOCUS data source named DATETIME, which receivesthese values:
FILE=DATETIME, SUFFIX=FOC ,$SEGNAME=DATETIME, SEGTYPE=S0 ,$FIELD=ID, ID, USAGE = I2 ,$FIELD=DT1, DT1, USAGE=HYYMDS ,$
Example: Using a Date-Time Value in a COMPUTE Command
TABLE FILE EMPLOYEEPRINT LAST_NAME FIRST_NAME AND COMPUTENEWSAL/D12.2M = CURR_SAL + (0.1 * CURR_SAL);RAISETIME/HYYMDIA = DT(20000101 09:00AM);WHERE CURR_JOBCODE LIKE 'B%'END
The output is:
LAST_NAME FIRST_NAME NEWSAL RAISETIME--------- ---------- ------ ---------SMITH MARY $14,520.00 2000/01/01 9:00AMJONES DIANE $20,328.00 2000/01/01 9:00AMROMANS ANTHONY $23,232.00 2000/01/01 9:00AMMCCOY JOHN $20,328.00 2000/01/01 9:00AMBLACKWOOD ROSEMARIE $23,958.00 2000/01/01 9:00AMMCKNIGHT ROGER $17,710.00 2000/01/01 9:00AM
Example: Using a Date-Time Value in WHERE Criteria
In a WHERE clause, a date-time constant must use the DT( ) format:
TABLE FILE VIDEOTR2PRINT CUSTID TRANSDATEWHERE TRANSDATE GT DT(2000/01/01 02:57:25)END
The output is:
CUSTID TRANSDATE------ ---------1118 2000/06/26 05:451237 2000/02/05 03:30
7. Using Expressions
Creating Reports With TIBCO® WebFOCUS Language 453

Example: Using a Date-Time Value in IF Criteria
In an IF clause, a date-time constant must be enclosed in single quotation marks if it containsany blanks:
TABLE FILE VIDEOTR2PRINT CUSTID TRANSDATEIF TRANSDATE GT '2000/01/01 02:57:25'END
Note: The DT prefix for a date-time constant is not supported in an IF clause.
The output is:
CUSTID TRANSDATE------ ---------1118 2000/06/26 05:451237 2000/02/05 03:30
Example: Specifying Universal Date-Time Input Values
With DTSTANDARD settings of STANDARD and STANDARDU, the following date-time values canbe read as input:
Input Value Description
14:30[:20,99] Comma separates time components instead of period
14:30[:20.99]Z Universal time
15:30[:20,99]+0115:30[:20,99]+010015:30[:20,99]+01:00
Each of these is the same as above in Central EuropeanTime
09:30[:20.99]-05 Same as above in Eastern Standard Time
Note that these values are stored identically internally with the STANDARDU setting. With theSTANDARD setting, everything following the Z, +, or - is ignored.
Manipulating Date-Time Values
Any two date-time values can be compared, even if their lengths do not match.
Creating a Date-Time Expression
454

If a date-time field supports missing values, fields that contain the missing value have agreater value than any date-time field can have. Therefore, in order to exclude missing valuesfrom the report output when using a GT or GE operator in a selection test, it is recommendedthat you add the additional constraint field NE MISSING to the selection test:
date_time_field {GT|GE} date_time_value AND date_time_field NE MISSING
Assignments are permitted between date-time formats of equal or different lengths. Assigninga 10-byte date-time value to an 8-byte date-time value truncates the microsecond portion (norounding takes place). Assigning a short value to a long one sets the low-order three digits ofthe microseconds to zero.
Other operations, including concatenation, EDIT, and LIKE on date-time operands are notsupported. Prefix operators that work with alphanumeric fields are supported.
Example: Testing for Missing Date-Time Values
Consider the DATETIM2 Master File:
FILE=DATETIM2, SUFFIX=FOC ,$SEGNAME=DATETIME, SEGTYPE=S0 ,$FIELD=ID, ID, USAGE = I2 ,$FIELD=DT1, DT1, USAGE=HYYMDS, MISSING=ON,$
Field DT1 supports missing values. Consider the following request:
TABLE FILE DATETIM2PRINT ID DT1END
The resulting report output shows that in the instance with ID=3, the field DT1 has a missingvalue:
ID DT1-- --- 1 2000/01/01 02:57:25 2 1999/12/31 00:00:00 3 .
The following request selects values of DT1 that are greater than 2000/01/01 00:00:00 andare not missing:
TABLE FILE DATETIM2PRINT ID DT1 WHERE DT1 NE MISSING AND DT1 GT DT(2000/01/01 00:00:00);END
7. Using Expressions
Creating Reports With TIBCO® WebFOCUS Language 455

The missing value is not included in the report output:
ID DT1-- --- 1 2000/01/01 02:57:25
Example: Assigning a Different Usage Format to a Date-Time Column
Consider the following request using the VIDEOTR2 data source:
TABLE FILE VIDEOTR2 PRINT CUSTID TRANSDATE AND COMPUTE DT2/HYYMDH = TRANSDATE; T1/HHIS = TRANSDATE; WHERE DATE EQ 2000 END
The output is:
CUSTID TRANSDATE DT2 T1------ --------- --- --1118 2000/06/26 05:45 2000/06/26 05 05:45:001237 2000/02/05 03:30 2000/02/05 03 03:30:00
Creating a Character Expression
A character expression uses alphanumeric constants, fields, concatenation operators, IF-THEN-ELSE logic, or functions to derive an alphanumeric value.
Both text and alphanumeric fields can be assigned values stored in text fields or alphanumericexpressions in TABLE COMPUTE, MODIFY COMPUTE, and DEFINE commands. If analphanumeric field is assigned the value of a text field that is too long for the alphanumericfield, the value is truncated before being assigned to the alphanumeric field.
A character expression can consist of:
An alphanumeric constant (character string) enclosed in single quotation marks. Forexample:
COMPUTE STATE/A2 = 'NY';
A combination of alphanumeric fields and/or constants joined by the concatenationoperator. For example:
DEFINE FILE EMPLOYEE TITLE/A19 = 'DR. ' | LAST_NAME;END
An alphanumeric function. For example:
DEFINE FILE EMPLOYEE INITIAL/A1 = EDIT(FIRST_NAME, '9$$$$$$$$$$');END
Creating a Character Expression
456

A text field.
Note:
Non-printable characters are not supported in an alphanumeric constant.
Two consecutive single quotation marks represent a null value with format A1V and anactual length of 0 (zero), when the field has MISSING ON.
Embedding a Quotation Mark in a Quote-Delimited Literal String
Under certain conditions, you can use quote-delimited strings containing embedded quotationmarks. Within the string, you can use either one single quotation mark or two contiguoussingle quotation marks to represent the single quotation mark. Both are interpreted as a singlequotation mark.
You can use quote-delimited strings in the following instances:
WHERE and IF criteria containing multiple quotes.
WHERE criteria containing: fieldname {IS, IS-NOT, IN, IN FILE, or NOT IN FILE}.
EDIT.
WHEN fieldname EQ an embedded quote in a literal.
DEFINE commands.
DEFINE attributes in Master Files.
Database Administrator (DBA) attributes in Master Files (for example, VALUE = fieldnameEQ an embedded quote in a literal).
ACCEPT=, DESCRIPTION=, TITLE= attributes in Master Files.
AS.
DECODE.
7. Using Expressions
Creating Reports With TIBCO® WebFOCUS Language 457

Example: Specifying the Data Value O'BRIEN in a Quote-Delimited Literal String
The following example illustrates the use of quotation marks for the correct interpretation ofthe data value O'BRIEN:
TABLE FILE VIDEOTRKPRINT LASTNAMEWHERE LASTNAME IS 'O'BRIEN'END
Concatenating Character Strings
You can write an expression that concatenates two or more alphanumeric constants and/orfields into a single character string. This concatenation operator has two forms, as shown inthe following table:
Symbol Represents Description
| Weak concatenation Preserves trailing blanks.
|| Strong concatenation Moves trailing blanks to the end of a concatenatedstring.
Example: Concatenating Character Strings
The following example uses the EDIT function to extract the first initial from a first name. Itthen uses both strong and weak concatenation to produce the last name, followed by acomma, followed by the first initial, followed by a period:
DEFINE FILE EMPLOYEEFIRST_INIT/A1 = EDIT(FIRST_NAME, '9$$$$$$$$$');NAME/A19 = LAST_NAME ||(', '| FIRST_INIT |'.');END
TABLE FILE EMPLOYEEPRINT NAME WHERE LAST_NAME IS 'BANNING'END
The output is:
NAME ---- BANNING, J.
Creating a Character Expression
458

The request evaluates the expressions as follows:
1. The EDIT function extracts the initial J from FIRST_NAME.
2. The expression in parentheses returns the value:
, J.
3. LAST_NAME is concatenated to the string derived in step 2 to produce:
Banning, J.
While LAST_NAME has the format A15 in the EMPLOYEE Master File, strong concatenationsuppresses the trailing blanks. Regardless of the suppression or inclusion of blanks, theresulting field name, NAME, has a length of 19 characters (A19).
Example: Using IF-THEN-ELSE Logic in a Character Expression
The following request uses IF-THEN-ELSE logic to determine what characters to concatenate toMOVIECODE in order to compute NEWCODE.
TABLE FILE MOVIESPRINT COPIESMOVIECODECOMPUTENEWCODE/A20 = MOVIECODE |(IF MOVIECODE CONTAINS 'DIS' THEN 'NEY;' ELSE ';');BY CATEGORYWHERE CATEGORY EQ 'CHILDREN'ON TABLE SET PAGE NOLEADON TABLE SET STYLE *GRID=OFF,$ENDSTYLEEND
7. Using Expressions
Creating Reports With TIBCO® WebFOCUS Language 459

The output is shown in the following image. If MOVIECODE contains the characters 'DIS',NEWCODE is generated by concatenating the characters 'NEY;', otherwise NEWCODE isgenerated by concatenating the character ';'.
Creating a Variable Length Character Expression
As an alphanumeric type, an AnV field can be used in arithmetic and logical expressions in thesame way that the An type is used.
An expression that contains AnV type fields can be of either the AnV or An type.
The type that results from the expression depends on the specific type of operation, asdescribed in subsequent sections.
Note: Because AnV fields have two bytes of overhead and there is additional processingrequired to strip them, AnV format is not recommended for use in non-relational data sources.
Creating a Variable Length Character Expression
460

Using Concatenation With AnV Fields
If either of the operands in a concatenation between two fields is an AnV field, variable lengthalphanumeric rules are used to perform the concatenation:
The size of the concatenated string is the sum of the sizes of the operands.
For weak concatenation, the actual length of the concatenated string is the sum of the twoactual lengths of the input strings.
For strong concatenation, the actual length stored in an AnV field of the concatenatedstring is the sum of the actual length of the first input string minus its number of trailingblanks plus the actual length of the second string.
For any An field in the concatenation, the size and length are equal.
Two consecutive single quotation marks represent a null value with format A1V and anactual length of 0 (zero), when the field has MISSING ON.
Using the EDIT Function With AnV Fields
The following expression results in an AnV format only when x has AnV format.
EDIT(x,mask)
The actual length of the result is the number of characters in mask other than '$'.
Note that an actual length of zero may result.
EDIT(x) can be used to convert an AnV field to an integer value when x has AnV format.
Using CONTAINS and OMITS With AnV Fields
The only difference in evaluation of the CONTAINS and OMITS operators with AnV fields occurswhen one of the operands has an actual length of zero.
In the following examples, the field Z has an actual length of zero, but X and Y do not:
Expression Result
Z CONTAINS Y FALSE
X CONTAINS Z TRUE
Z CONTAINS Z TRUE
7. Using Expressions
Creating Reports With TIBCO® WebFOCUS Language 461

Expression Result
Z OMITS Y TRUE
X OMITS Z FALSE
Z OMITS Z FALSE
Using LIKE With AnV Fields
The only difference in evaluation of the following expression occurs when x has an actuallength of zero:
x LIKE mask ...
In the following example, the field instance Z has an actual length of zero:
Z LIKE mask ...
This expression evaluates to TRUE only when the mask consists exclusively of percent ('%')signs.
Note that no other mask can evaluate to an empty string. Even the mask in the followingexpression has a length of one, and therefore the expression evaluates as FALSE:
Z LIKE ''
Using the EQ, NE, LT, GT, LE, and GE Operators With AnV Fields
As with An type fields, operations are evaluated on the assumption that the shorter operand ispadded with blanks.
Therefore, even an empty AnV field, Z, is compared as a field consisting of all blanks.
In the following examples, Z is an empty AnV field instance and X is an AnV field instance thatis not empty and contains non-blank characters:
Expression Result
Z EQ ZZ GE ZZ LE Z
TRUE
Creating a Variable Length Character Expression
462

Expression Result
Z NE ZZ LT ZZ GT Z
FALSE
Z EQ X FALSE
Z NE X TRUE
Z LT X TRUE
Z GT X FALSE
Z LE X TRUE
Z GE X FALSE
X EQ Z FALSE
X NE Z TRUE
X LT Z FALSE
X GT Z TRUE
X LE Z FALSE
X GE Z TRUE
Using the DECODE Function With AnV Fields
DECODE alphafield (value 'result'...
The use of either an An or AnV field with DECODE causes a result of type An as long as theresult part of the value-result pairs is provided as a constant. (Constants are type An.)
7. Using Expressions
Creating Reports With TIBCO® WebFOCUS Language 463

Using the Assignment Operator With AnV Fields
There are three situations to consider when using the assignment operator with the AnVformat: AnV data type on the right hand side only, AnV data type on both sides, and AnV datatype on the left side only.
fld/An = AnV_type_expression;
The actual length of the evaluated expression is lost on assignment to the An field.
The size of the AnV result does not prevent assignment to a shorter An format field:
If the result of the expression has an actual length that is shorter than the length of thefield on the left side of the assignment operator, the result is padded with blanks.
If the result of the expression has an actual length that is longer than the length of thefield on the left side of the assignment operator, the result is truncated.
fld/AnV = AnV_type_expression;
The length of the result is assigned as the length of the field on the left of the assignmentoperator unless it exceeds the field's declared size. In this case, the length assigned is thedeclared size (n).
The size of the AnV evaluation result does not prevent assignment to a shorter AnV field:
If the length of the result of the expression is shorter than the size of the field on theleft side of the assignment operator, the result is padded with blanks.
If the result of the expression has an actual length that is longer than the size of thefield on the left side of the assignment operator, the result is truncated.
fld/AnV = An_type_expression;
The length of the field on the left side of the assignment operator is assigned equal to itssize (n).
The actual length of the result is verified against the size n declared for the AnV field. Anerror is generated if the result is longer than n.
Creating a Variable Length Character Expression
464
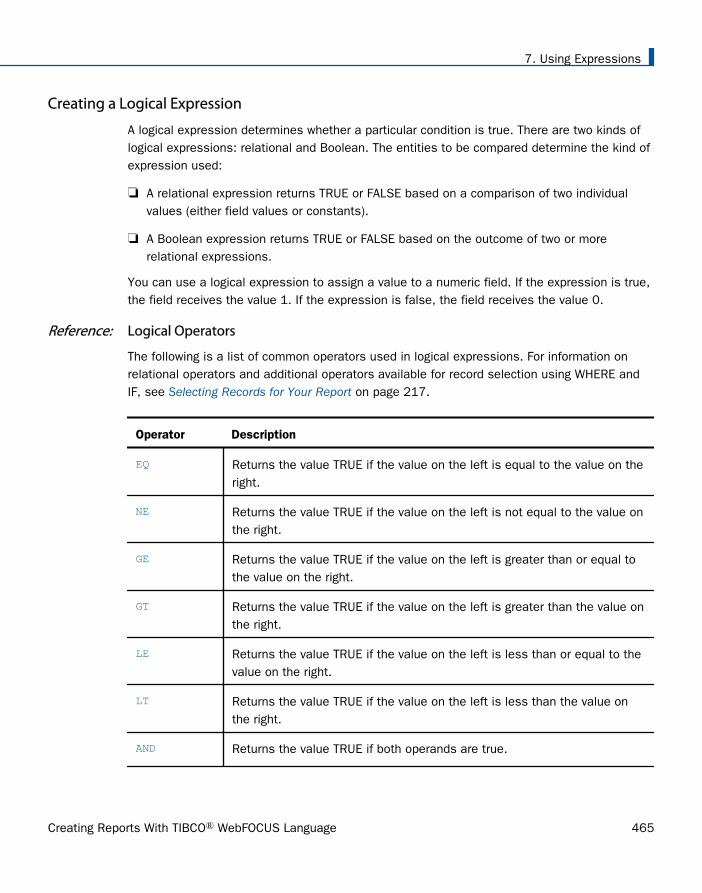
Creating a Logical Expression
A logical expression determines whether a particular condition is true. There are two kinds oflogical expressions: relational and Boolean. The entities to be compared determine the kind ofexpression used:
A relational expression returns TRUE or FALSE based on a comparison of two individualvalues (either field values or constants).
A Boolean expression returns TRUE or FALSE based on the outcome of two or morerelational expressions.
You can use a logical expression to assign a value to a numeric field. If the expression is true,the field receives the value 1. If the expression is false, the field receives the value 0.
Reference: Logical Operators
The following is a list of common operators used in logical expressions. For information onrelational operators and additional operators available for record selection using WHERE andIF, see Selecting Records for Your Report on page 217.
Operator Description
EQ Returns the value TRUE if the value on the left is equal to the value on theright.
NE Returns the value TRUE if the value on the left is not equal to the value onthe right.
GE Returns the value TRUE if the value on the left is greater than or equal tothe value on the right.
GT Returns the value TRUE if the value on the left is greater than the value onthe right.
LE Returns the value TRUE if the value on the left is less than or equal to thevalue on the right.
LT Returns the value TRUE if the value on the left is less than the value onthe right.
AND Returns the value TRUE if both operands are true.
7. Using Expressions
Creating Reports With TIBCO® WebFOCUS Language 465

Operator Description
OR Returns the value TRUE if either operand is true.
NOT Returns the value TRUE if the operand is false.
CONTAINS Contains the specified character strings.
OMITS Omits the specified character strings.
IS MISSING Returns the value TRUE if the field is missing.
IS-NOT MISSING
Returns the value TRUE if the field is not missing.
Syntax: How to Write a Relational Expression
Any of the following are valid for a relational expression:
value {EQ|NE} value value {LE|LT} value value {GE|GT} valuecharacter_value {CONTAINS|OMITS} character_value
where:
valueIs a field value or constant.
character_valueIs a character string. If it contains blanks, the string must be enclosed in singlequotation marks.
Syntax: How to Write a Boolean Expression
Either of the following is valid for a Boolean expression:
(relational_expression) {AND|OR} (relational_expression)NOT (logical_expression)
where:
relational_expressionIs an expression based on a comparison of two individual values (either field values orconstants).
Creating a Logical Expression
466
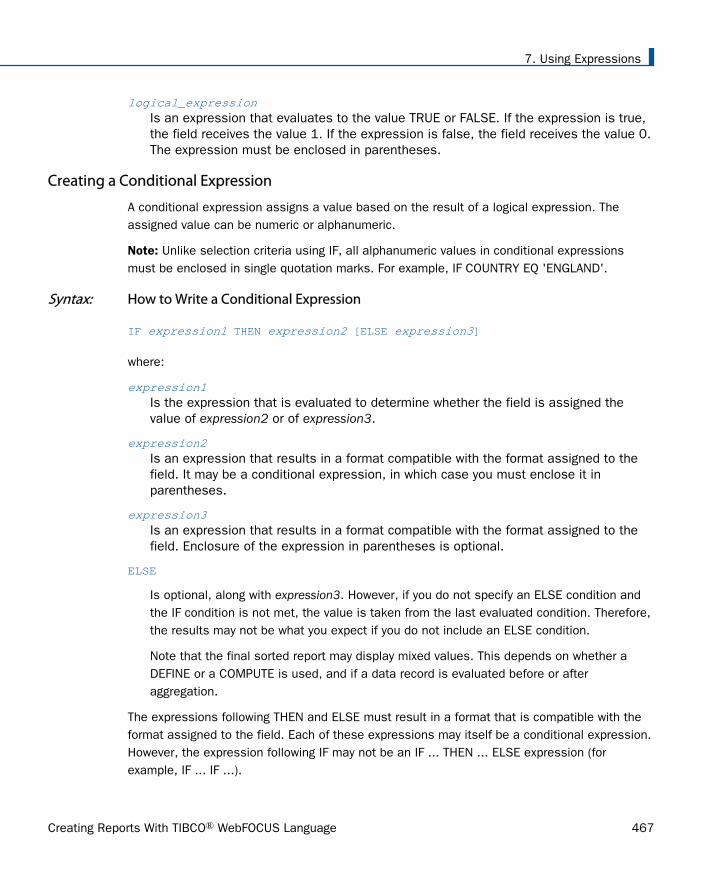
logical_expressionIs an expression that evaluates to the value TRUE or FALSE. If the expression is true,the field receives the value 1. If the expression is false, the field receives the value 0.The expression must be enclosed in parentheses.
Creating a Conditional Expression
A conditional expression assigns a value based on the result of a logical expression. Theassigned value can be numeric or alphanumeric.
Note: Unlike selection criteria using IF, all alphanumeric values in conditional expressionsmust be enclosed in single quotation marks. For example, IF COUNTRY EQ 'ENGLAND'.
Syntax: How to Write a Conditional Expression
IF expression1 THEN expression2 [ELSE expression3]
where:
expression1Is the expression that is evaluated to determine whether the field is assigned thevalue of expression2 or of expression3.
expression2Is an expression that results in a format compatible with the format assigned to thefield. It may be a conditional expression, in which case you must enclose it inparentheses.
expression3Is an expression that results in a format compatible with the format assigned to thefield. Enclosure of the expression in parentheses is optional.
ELSE
Is optional, along with expression3. However, if you do not specify an ELSE condition andthe IF condition is not met, the value is taken from the last evaluated condition. Therefore,the results may not be what you expect if you do not include an ELSE condition.
Note that the final sorted report may display mixed values. This depends on whether aDEFINE or a COMPUTE is used, and if a data record is evaluated before or afteraggregation.
The expressions following THEN and ELSE must result in a format that is compatible with theformat assigned to the field. Each of these expressions may itself be a conditional expression.However, the expression following IF may not be an IF ... THEN ... ELSE expression (forexample, IF ... IF ...).
7. Using Expressions
Creating Reports With TIBCO® WebFOCUS Language 467
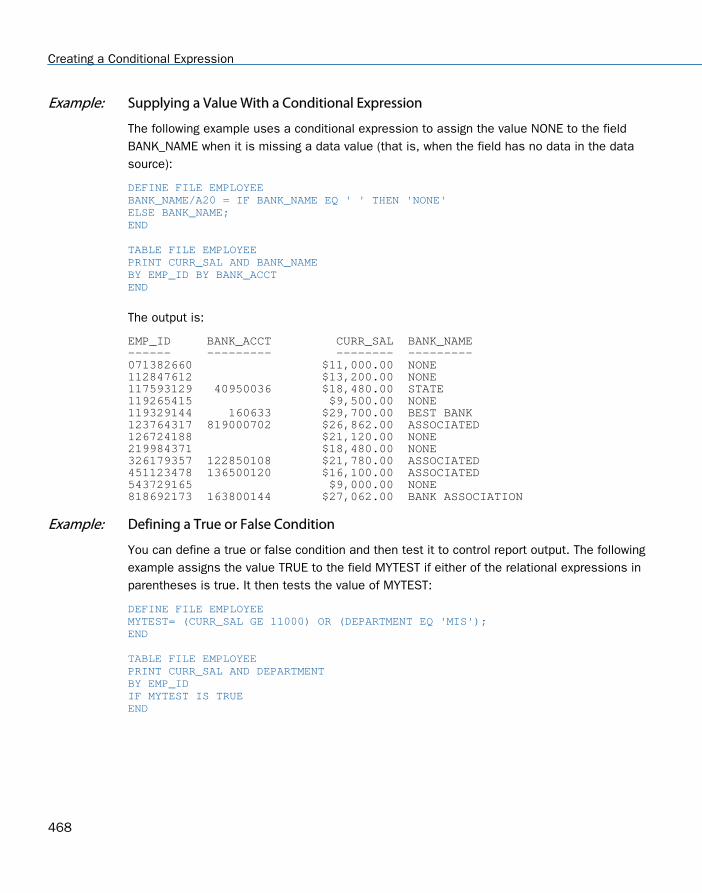
Example: Supplying a Value With a Conditional Expression
The following example uses a conditional expression to assign the value NONE to the fieldBANK_NAME when it is missing a data value (that is, when the field has no data in the datasource):
DEFINE FILE EMPLOYEEBANK_NAME/A20 = IF BANK_NAME EQ ' ' THEN 'NONE'ELSE BANK_NAME;END TABLE FILE EMPLOYEEPRINT CURR_SAL AND BANK_NAMEBY EMP_ID BY BANK_ACCTEND
The output is:
EMP_ID BANK_ACCT CURR_SAL BANK_NAME ------ --------- -------- --------- 071382660 $11,000.00 NONE 112847612 $13,200.00 NONE 117593129 40950036 $18,480.00 STATE 119265415 $9,500.00 NONE 119329144 160633 $29,700.00 BEST BANK 123764317 819000702 $26,862.00 ASSOCIATED 126724188 $21,120.00 NONE 219984371 $18,480.00 NONE 326179357 122850108 $21,780.00 ASSOCIATED 451123478 136500120 $16,100.00 ASSOCIATED 543729165 $9,000.00 NONE 818692173 163800144 $27,062.00 BANK ASSOCIATION
Example: Defining a True or False Condition
You can define a true or false condition and then test it to control report output. The followingexample assigns the value TRUE to the field MYTEST if either of the relational expressions inparentheses is true. It then tests the value of MYTEST:
DEFINE FILE EMPLOYEEMYTEST= (CURR_SAL GE 11000) OR (DEPARTMENT EQ 'MIS');END TABLE FILE EMPLOYEEPRINT CURR_SAL AND DEPARTMENTBY EMP_IDIF MYTEST IS TRUEEND
Creating a Conditional Expression
468

The output is:
EMP_ID CURR_SAL DEPARTMENT------ -------- ----------071382660 $11,000.00 PRODUCTION112847612 $13,200.00 MIS117593129 $18,480.00 MIS119329144 $29,700.00 PRODUCTION123764317 $26,862.00 PRODUCTION126724188 $21,120.00 PRODUCTION219984371 $18,480.00 MIS326179357 $21,780.00 MIS451123478 $16,100.00 PRODUCTION543729165 $9,000.00 MIS818692173 $27,062.00 MIS
Note: Testing for a TRUE or FALSE condition is valid only with the IF command. It is not validwith WHERE.
7. Using Expressions
Creating Reports With TIBCO® WebFOCUS Language 469

Creating a Conditional Expression
470

Chapter8Saving and Reusing Your Report Output
When you run a report request, by default the data values are collected and presented ina viewable form, complete with column titles and formatting features. Instead of viewingthe data values, you can save them to a special data file to:
Display as a webpage, as a printed document, or in a text document.
Process in another application, such as a spreadsheet, a database, a wordprocessor, or a 3GL program.
Send to another location, such as a browser or PC.
Extract a subset of the original data source in order to generate multi-step reports.
Extract a data source to a structured extract file that retains information about thesegment relationships in order to facilitate migration of data sources and reportsbetween operating environments.
In this chapter:
Saving Your Report Output
Creating a HOLD File
Holding Report Output in TIBCO FOCUSFormat
Controlling Attributes in HOLD MasterFiles
Keyed Retrieval From HOLD Files
Saving and Retrieving HOLD Files
Using DBMS Temporary Tables as HOLDFiles
Creating SAVE and SAVB Files
Creating a PCHOLD File
Choosing Output File Formats
Merging Data Into an Existing DataSource With ON TABLE MERGE
Using Text Fields in Output Files
Creating a Delimited Sequential File
Saving Report Output in INTERNALFormat
Creating A Subquery or Sequential FileWith HOLD FORMAT SQL_SCRIPT
Creating a Structured HOLD File
Creating Reports With TIBCO® WebFOCUS Language 471

Saving Your Report Output
The following commands extract and save report output in a variety of file formats:
HOLD. The HOLD command creates a data source containing the output of a reportrequest. By default, the data is stored in binary format, but you can specify a differentformat, such as FOCUS, HTML, or Excel. For some formats, the HOLD command alsocreates a corresponding Master File. You can then write other report requests that in turnextract or save data from the HOLD file. See Creating a HOLD File on page 473.
SAVE and SAVB. The SAVE command is identical to a HOLD command, except that it doesnot create a Master File, and ALPHA is the default format. If you wish to create a SAVE filein BINARY format, use a variation of the SAVE command called SAVB.
As with a HOLD file, you can specify a variety of formats suitable for use with othersoftware products. See Creating SAVE and SAVB Files on page 506.
PCHOLD. The PCHOLD command creates a data source containing the output of a reportrequest, and downloads the HOLD data source and the optional Master File to a clientcomputer or browser. As with a HOLD file, you can specify a variety of file formats. See Creating a PCHOLD File on page 509.
Tip: When saving or holding output files, it is recommended to have an Allocation in place forthe file. This is not applicable for PCHOLD files.
Naming and Storing Report Output Files
During a session, a report output file remains usable until it is erased or overwritten. Asubsequent output file created during the same session replaces the initial version, unless yougive it another name by using the AS phrase.
A FILEDEF command is automatically issued when you create an output file. The ddname usedto identify the file is the same as the name of the report output file (HOLD, SAVE, or SAVB, orthe name in the AS phrase), if not already allocated.
By default, report output files created with HOLD, SAVE, or SAVB are written to temporaryspace. When the session ends, these files are no longer available unless you save the outputto a specific location.
To save report output files to a specific location, use an ALLOCATE or FILEDEF command. Fordetails, see Saving and Retrieving HOLD Files on page 498. You can dynamically allocate anoutput file using the DYNAM ALLOCATE or TSO ALLOCATE command in z/OS.
For details, see the TIBCO WebFOCUS® Developing Reporting Applications manual.
Saving Your Report Output
472

When you create a HOLD file using the syntax ON TABLE HOLD AS name, the name can containup to the maximum number of characters supported by your operating system. For information,see the section Naming a Master File in the Describing Data With TIBCO WebFOCUS®
LanguageTIBCO FOCUS® Describing Data manual.
While a numeric name or a name beginning with a number is valid on many operating systems,such names are discouraged because they:
Cause errors (FOC14069) when a request attempts to access data using a SUFFIX=EDAsynonym that points to a file starting with a number. (Note that a SUFFIX=EDA synonym iscreated by the Adapter for Remote Servers.)
May cause problems when an external application (such as an API application) that doesnot accept files starting with numbers interacts with a SUFFIX=EDA synonym that points toa file starting with a number.
May be problematic to a third party application that does not work with numeric file namesor with file names that begin with numbers.
Creating a HOLD File
You can use the HOLD command to create report output files for a range of purposes:
As a tool for data extraction, the HOLD command enables you to retrieve and process data,then extract the results for further processing. Your report request can create a new datasource, complete with a corresponding Master File, from which you can generate newreports.
The output Master File contains only the fields in the report request. The fields in a HOLDfile have the original names specified in the Master File that are retrieved if the report isdisplayed or printed. You can alter the field names in the output Master File using the ASphrase in conjunction with the command SET ASNAMES. See Controlling Field Names in aHOLD Master File on page 485.
The HOLD command enables you to specify the appropriate formats for displaying orprocessing report output files in other software applications. See Choosing Output FileFormats on page 511.
When an application requires a data format that is not among the HOLD options, you canuse a subroutine to process each output record as it is written to the HOLD data source.
8. Saving and Reusing Your Report Output
Creating Reports With TIBCO® WebFOCUS Language 473

If your environment supports the SET parameter SAVEMATRIX, you can preserve the internalmatrix of your last report in order to keep it available for subsequent HOLD, SAVE, and SAVBcommands when the request is followed by Dialogue Manager commands. For details onSAVEMATRIX, see the Developing Reporting Applications manual.
Syntax: How to Create a HOLD File
From a report request, use
ON TABLE HOLD [AS filename] [FORMAT fmt] [DATASET dataset] [MISSING {ON|OFF}] [PERSISTENCE {STAGE|PERMANENT}]
or
hold_field HOLD [AS filename] [FORMAT fmt] [DATASET dataset] [MISSING {ON|OFF}] [PERSISTENCE {STAGE|PERMANENT}]
where:
HOLD
Extracts and saves report output. BINARY is the default format used when the HOLDcommand is issued without an explicit format. The output is saved with an associatedMaster File.
Note: Change the default output format to ALPHA by issuing the SET HOLDFORMATcommand.
hold_fieldIs the name of the last display field in the request.
AS filenameSpecifies a name for the HOLD file. If you do not specify a file name, HOLD becomesthe default. Since each subsequent HOLD command overwrites the previous HOLDfile, it is advisable to code a distinct file name in each request to direct the extracteddata to a separate file, thereby preventing it from being overwritten by the next HOLDcommand.
The name can contain up to the maximum number of characters supported by youroperating system. For information, see the section Naming a Master File in the DescribingData With TIBCO WebFOCUS® Language manual.
FORMAT fmtSpecifies the format of the HOLD output file. BINARY is the default format for reportingservers.
To display as a webpage, choose: HTML, HTMTABLE, DHTML
Creating a HOLD File
474

To display as a printed document, choose: PDF, PS
To use in a text document, choose: ALPHA, DOC, WP
To use in a spreadsheet application, choose: DIF, EXCEL, EXL97, EXL2K [PIVOT],LOTUS, SYLK
To use in a database application, choose: COMMA, COM, COMT, DB2, DATREC, DFIX,FOCUS, INGRES, REDBRICK, SQL, SQLDBC, SQLORA, SQLINF, SQLMSS, SQLSYB,SQLODBC, TAB, TABT, XFOCUS
To use with a 3-GL program, choose: INTERNAL
To use for additional reporting, choose: ALPHA, BINARY, FOCUS
To use as a transaction file for modifying a data source, choose: ALPHA, BINARY
To use for interactive analysis without connection to a server, choose: AHTML, APDF,FLEX
For details about all available formats, see Choosing Output File Formats on page 511.
dataset
Can be a fully-qualified data set or file name or an n-part name (app/.../filename.ext).
You can specify a data set or file to contain the report output within the request itself,rather than relying on an external or default specification. This allows you to place apermanent hold file in any folder, directory or data set that you can write to, whether or notthat location is included in your APP PATH. The accompanying HOLD Master File will havethe DATASET attribute pointing to the file that was generated.
The case in which the data set name is added in the Master File depends on the value ofthe FILECASE parameter. By default, lowercase is used. The actual data set is created withits name in the case that conforms to the standards of your operating environment.
Note:
On z/OS, the file cannot already exist or be allocated when the HOLD command isissued. Therefore, If the file already exists you must free the allocation and then deletethe file before running the request.
You can use a USS naming convention for the DATASET attribute to store the file in theUSS environment (for text output types).
MISSING
Controls whether fields with the attribute MISSING=ON in the Master File are carriedover into the HOLD file. MISSING ON is the default attribute. If the HOLD commandspecifies MISSING OFF, fields with the MISSING attribute are not carried over. For
8. Saving and Reusing Your Report Output
Creating Reports With TIBCO® WebFOCUS Language 475

related information, see Handling Records With Missing Field Values on page 1037.Also see the TIBCO WebFOCUS® Developing Reporting Applications manual for the SETHOLDMISS, SET NULL, and SET HNODATA parameters, which control how missingvalues are propagated to alphanumeric and comma-delimited files.
PERSISTENCE
Applies only to Relational HOLD files (FORMAT sqlengine). Specifies how to createintermediate tables that will be used only during UPLOAD and EBL requests to accelerateperformance by keeping all processing on the DBMS server instead of downloading datainto a HOLD file. The actual type of the intermediate table will be determined at run time,based on specific DBMS-supported features and the data-populating mechanisms beingused. Valid values are:
STAGE. Will create either a Volatile or GLOBAL TEMPORARY table, for a DBMS thatsupports that functionality. For a DBMS that does not support that functionality, amessage will display and the table will not be created.
PERMANENT. Will create a regular SQL table with a uniquely-generated name that willbe used in the request and will be available for further use after the request ends, butwill be dropped at the end of the session. This is the default value for PERSISTENCE forHOLD FORMAT sqlengine.
Syntax: How to Set the Default HOLD Format
SET HOLDFORMAT = {BINARY|ALPHA}
or
ON TABLE SET HOLDFORMAT {BINARY|ALPHA}
where:
BINARY
Sets the default HOLD file format to BINARY.
ALPHA
Sets the default HOLD file format to ALPHA.
Creating a HOLD File
476

Example: Extracting Data to a HOLD File
The following request extracts data from the EMPLOYEE data source and creates a HOLD file.
TABLE FILE EMPLOYEESUM CURR_SAL AND ED_HRSBY DEPARTMENTLIST CURR_SAL AND ED_HRS AND BANK_ACCTBY DEPARTMENTBY LAST_NAME BY FIRST_NAMEON TABLE HOLDEND
The following message appears:
NUMBER OF RECORDS IN TABLE= 12 LINES= 12
To display the report generated by this request issue a report request against the HOLD file.
Tip: If you wish to view the information in the HOLD Master File before reporting against it, youcan issue the query command ? HOLD.
Syntax: How to Query a HOLD Master File
If the HOLD format option you select creates a Master File, you can issue the followingcommand to display the fields, aliases, and formats in the HOLD Master File:
? HOLD
This command shows field names up to 32 characters. If a field name exceeds 32 characters,a caret (>) in the 32nd position indicates a longer field name.
If you have renamed the HOLD file using AS filename, use the following syntax:
? HOLD filename
Tip: You must issue the ? HOLD query in the same session in which the HOLD file is created.
8. Saving and Reusing Your Report Output
Creating Reports With TIBCO® WebFOCUS Language 477

Example: Reporting Against a HOLD Master File
In the following HOLD file, the formats shown are the values of the FORMAT attribute. You cansee the values of the ACTUAL attribute by displaying the HOLD Master File using TED or anytext editor. USAGE and ACTUAL formats for text fields specify only the length of the first line ofeach logical record in the HOLD file. The USAGE format is the same as the field format in theoriginal Master File. The ACTUAL format is rounded up to a full (internal) word boundary, as isdone for alphanumeric fields.
The following request contains the query command ? HOLD, which displays the fields, aliases,and formats in the associated Master File and creates a HOLD file.
TABLE FILE EMPLOYEESUM CURR_SAL AND ED_HRSBY DEPARTMENTLIST CURR_SAL AND ED_HRS AND BANK_ACCTBY DEPARTMENTBY LAST_NAME BY FIRST_NAMEON TABLE HOLDEND ? HOLD
The output is:
NUMBER OF RECORDS IN TABLE= 12 LINES= 12
DEFINITION OF HOLD FILE: HOLD
FIELDNAME ALIAS FORMAT
DEPARTMENT E01 A10
CURR_SAL E02 D12.2M
ED_HRS E03 F6.2
LAST_NAME E04 A15
FIRST_NAME E05 A10
LIST E06 I5
CURR_SAL E07 D12.2M
ED_HRS E08 F6.2
BANK_ACCT E09 I9S
Creating a HOLD File
478

You can now issue the following report request against the HOLD file:
TABLE FILE HOLDPRINT E07 AS 'SALARY OF,EMPLOYEE' AND LAST_NAME AND FIRST_NAMEBY HIGHEST E03 AS 'TOTAL,DEPT,ED_HRS'BY E01BY HIGHEST E08 AS 'EMPLOYEE,ED_HRS'END
The output is:
TOTAL DEPT EMPLOYEE SALARY OF ED_HRS DEPARTMENT ED_HRS EMPLOYEE LAST_NAME FIRST_NAME------ ---------- -------- --------- --------- ----------231.00 MIS 75.00 $21,780.00 BLACKWOOD ROSEMARIE 50.00 $18,480.00 JONES DIANE 45.00 $27,062.00 CROSS BARBARA 36.00 $13,200.00 SMITH MARY 25.00 $9,000.00 GREENSPAN MARY .00 $18,480.00 MCCOY JOHN 120.00 PRODUCTION 50.00 $16,100.00 MCKNIGHT ROGER 30.00 $26,862.00 IRVING JOAN 25.00 $11,000.00 STEVENS ALFRED 10.00 $9,500.00 SMITH RICHARD 5.00 $21,120.00 ROMANS ANTHONY .00 $29,700.00 BANNING JOHN
Holding Report Output in TIBCO FOCUS Format
Whether issued within a request or after the request has been executed, the HOLD commandcan create a FOCUS data source and a corresponding Master File from the data extracted bythe report request. This feature enables you to create:
A FOCUS data source from any other supported data source type.
A subset of an existing FOCUS data source.
8. Saving and Reusing Your Report Output
Creating Reports With TIBCO® WebFOCUS Language 479

Tip: If you are working in an environment that supports SCAN, FSCAN, MODIFY, or Maintain,and you create a HOLD file in FOCUS format, you can update, as well as report against, theHOLD file. See your documentation on these facilities for details.
Note: Holding a file in FOCUS format may generate the (FOC441) warning: The file existsalready. Create will write over it. Issuing the SET WARNING=OFF commandsuppresses this message.
Syntax: How to Create HOLD Files in TIBCO FOCUS Format
In a report request, use
ON TABLE HOLD [AS filename] FORMAT FOCUS [INDEX field1 field2 ...]
where:
AS filenameSpecifies a name for the HOLD file. If you do not specify a file name, HOLD becomesthe default. Since each subsequent HOLD command overwrites the previous HOLDfile, it is advisable to provide a distinct file name in each request to direct theextracted data to a separate file, thereby preventing it from being overwritten by thenext HOLD command.
The name can be up to 64 characters long.
Note: If you use a name longer than eight characters on z/OS, an eight-character membername is generated as described in the Describing Data With TIBCO WebFOCUS® Languagemanual. To relate the long name to the short member name, the $ VIRT attribute isgenerated on the top line in the Master File. The resulting HOLD file is a temporary datafile. To allocate the long Master File name to a permanent data file, issue the DYNAMALLOCATE command with the LONGNAME option prior to the HOLD request. The ddname inthe command must refer to an existing member of the MASTER data set.
INDEX field1...
Enables you to index FOCUS fields. All fields specified after INDEX are specified asFIELDTYPE=I in the Master File. Up to four fields can be indexed.
Note: Since the number of index field names is variable, a command name that follows theHOLD command and starts with the same characters as a field name may be counted asanother index field, generating an error. For example, if the command following HOLDstarts with ON TABLE and a field name starts with the characters 'ON', the ON in thecommand will be considered a truncated field name to add to the index. To avoid thisissue, either set the FIELDNAME parameter to NOTRUNC, so that command names will notbe confused with truncated field names, or move the HOLD command to the end of theprocedure right before the END command.
Holding Report Output in TIBCO FOCUS Format
480

Note that once you use this format from Hot Screen, you cannot issue another HOLDcommand while in the same Hot Screen session.
Reference: Operating System Notes for HOLD Files in TIBCO FOCUS Format
The HOLD file is dynamically allocated if it is not currently allocated in z/OS. This means thesystem may delete the file at the end of the session, even if you have not done so. SinceHOLD files are usually deleted, this is the desired default. However, if you want to save theMaster File, allocate it to ddname HOLDMAST as a permanent data set. The allocation can beperformed in the standard FOCUS CLIST. For example:
ALLOC F(HOLDMAST) DA('qualif.HOLDMAST') SHR REUSE
Note that ddname HOLDMAST must not refer to the same data set referred to by the MASTERand FOCEXEC ddnames.
Reference: Controlling the TIBCO FOCUS File Structure
The structure of the FOCUS data source varies according to the report request. The rules areas follows:
Each aggregation command (SUM, COUNT, WRITE) creates a segment, with each new BYfield in the request becoming a key. In a request that uses multiple display commands, thekey to any newly created segment does not contain keys that are in the parent segment.
If a PRINT or LIST command is used to create a segment, all the BY fields, together withthe internal FOCLIST field, form the key.
All fields specified after INDEX are indexed; that is, FIELDTYPE=I is specified in the MasterFile. Up to four fields may be indexed.
If the data in the HOLD file is longer than a page (4K for FOCUS data sources or 16K forXFOCUS data sources), it cannot be stored in a single segment. Data that is too long tobecome a single segment will become a parent segment with unique child segments. For aFOCUS data source, the fields will be grouped into normal FOCUS page size segments andadded as unique segments up to the total maximum of 32K of data. For an XFOCUS datasource, the root segment can hold the first 16K of data, and additional data up to the 32Ktotal, will be placed in a single unique segment. BY fields must all occur in the portion ofthe data assigned to the root segment.
8. Saving and Reusing Your Report Output
Creating Reports With TIBCO® WebFOCUS Language 481

To control whether the ACCEPT and TITLE attributes are propagated to the Master Fileassociated with the HOLD file, use the SET HOLDATTR command. To control the FIELDNAMEattribute in the Master File of the HOLD file, use the SET ASNAMES command. For moreinformation on how to control the TITLE, ACCEPT, and FIELDNAME attributes in a HOLD MasterFile, see Controlling Attributes in HOLD Master Files on page 484.
Example: Creating a HOLD File in TIBCO FOCUS Format
The following example creates a subset of the CAR data source.
TABLE FILE CARSUM SALES BY COUNTRY BY CAR BY MODELON TABLE HOLD AS X1 FORMAT FOCUSEND
This request creates a single-segment FOCUS data source with a SEGTYPE of S3 (because ithas three BY fields) named X1.
The X1 Master File is created by the request:
FILE=X1, SUFFIX=FOC SEGMENT=SEG01 ,SEGTYPE=S03 FIELDNAME=COUNTRY ,ALIAS=E01 ,USAGE=A10 ,$ FIELDNAME=CAR ,ALIAS=E02 ,USAGE=A16 ,$ FIELDNAME=MODEL ,ALIAS=E03 ,USAGE=A24 ,$ FIELDNAME=SALES ,ALIAS=E04 ,USAGE=I6 ,$
Example: Using PRINT to Create a TIBCO FOCUS Data Source With a FOCLIST Field
This example creates a single-segment FOCUS data source with a SEGTYPE of S4 because ofthe three BY fields and the FOCLIST FIELD.
TABLE FILE CARPRINT SALES BY COUNTRY BY CAR BY MODELON TABLE HOLD AS X2 FORMAT FOCUS INDEX MODELEND
The Master File created by this request is:
FILE=X2, SUFFIX=FOC SEGMENT=SEG01, SEGTYPE=S04 FIELDNAME=COUNTRY ,ALIAS=E01 ,USAGE=A10 ,$ FIELDNAME=CAR ,ALIAS=E02 ,USAGE=A16 ,$ FIELDNAME=MODEL ,ALIAS=E03 ,USAGE=A24 ,FIELDTYPE=I,$ FIELDNAME=FOCLIST ,ALIAS=E04 ,USAGE=I5 ,$ FIELDNAME=SALES ,ALIAS=E05 ,USAGE=I6 ,$
Holding Report Output in TIBCO FOCUS Format
482
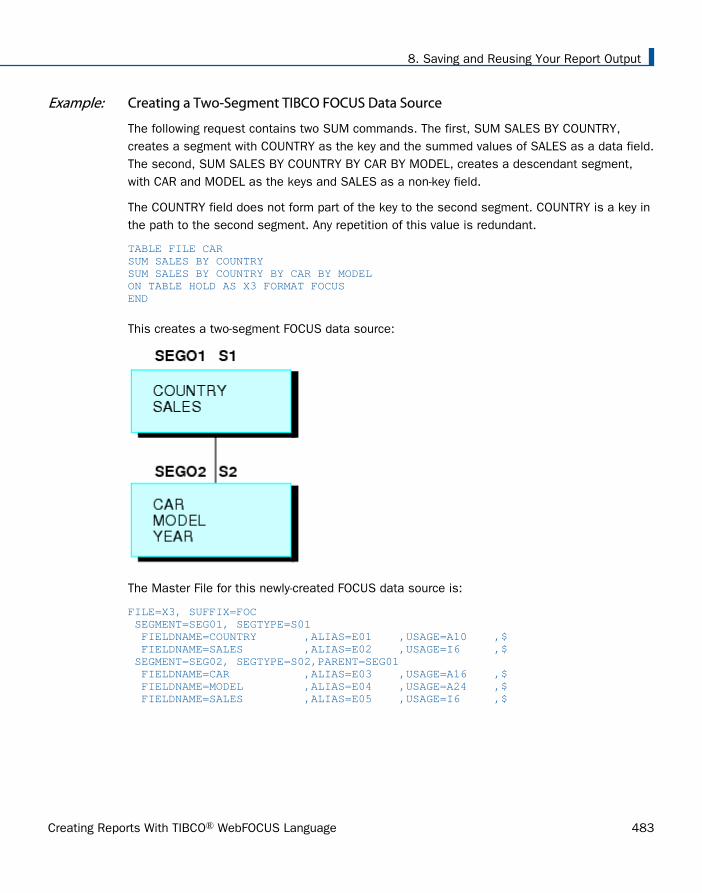
Example: Creating a Two-Segment TIBCO FOCUS Data Source
The following request contains two SUM commands. The first, SUM SALES BY COUNTRY,creates a segment with COUNTRY as the key and the summed values of SALES as a data field.The second, SUM SALES BY COUNTRY BY CAR BY MODEL, creates a descendant segment,with CAR and MODEL as the keys and SALES as a non-key field.
The COUNTRY field does not form part of the key to the second segment. COUNTRY is a key inthe path to the second segment. Any repetition of this value is redundant.
TABLE FILE CARSUM SALES BY COUNTRYSUM SALES BY COUNTRY BY CAR BY MODELON TABLE HOLD AS X3 FORMAT FOCUSEND
This creates a two-segment FOCUS data source:
The Master File for this newly-created FOCUS data source is:
FILE=X3, SUFFIX=FOC SEGMENT=SEG01, SEGTYPE=S01 FIELDNAME=COUNTRY ,ALIAS=E01 ,USAGE=A10 ,$ FIELDNAME=SALES ,ALIAS=E02 ,USAGE=I6 ,$ SEGMENT=SEG02, SEGTYPE=S02,PARENT=SEG01 FIELDNAME=CAR ,ALIAS=E03 ,USAGE=A16 ,$ FIELDNAME=MODEL ,ALIAS=E04 ,USAGE=A24 ,$ FIELDNAME=SALES ,ALIAS=E05 ,USAGE=I6 ,$
8. Saving and Reusing Your Report Output
Creating Reports With TIBCO® WebFOCUS Language 483

Example: Creating a Three-Segment TIBCO FOCUS Data Source
In this example, each display command creates one segment.
The key to the root segment is the BY field, COUNTRY, while the keys to the descendantsegments are the new BY fields. The last segment uses the internal FOCLIST field as part ofthe key, since the display command is PRINT.
TABLE FILE CARSUM SALES BY COUNTRY BY CARSUM SALES BY COUNTRY BY CAR BY MODELPRINT SALES BY COUNTRY BY CAR BY MODEL BY BODYON TABLE HOLD AS X4 FORMAT FOCUS INDEX COUNTRY MODELEND
The Master File is:
FILE=X4, SUFFIX=FOC SEGMENT=SEG01, SEGTYPE =S02 FIELDNAME=COUNTRY ,ALIAS=E01 ,USAGE=A10 ,FIELDTYPE=I,$ FIELDNAME=CAR ,ALIAS=E02 ,USAGE=A16 ,$ FIELDNAME=SALES ,ALIAS=E03 ,USAGE=I6 ,$ SEGMENT=SEG02, SEGTYPE =S01 ,PARENT=SEG01 FIELDNAME=MODEL ,ALIAS=E04 ,USAGE=A24 ,FIELDTYPE=I,$ FIELDNAME=SALES ,ALIAS=E05 ,USAGE=I6 ,$ SEGMENT=SEG03, SEGTYPE =S02 ,PARENT=SEG02 FIELDNAME=BODYTYPE ,ALIAS=E06 ,USAGE=A12 ,$ FIELDNAME=FOCLIST ,ALIAS=E07 ,USAGE=I5 ,$ FIELDNAME=SALES ,ALIAS=E08 ,USAGE=I6 ,$
Controlling Attributes in HOLD Master Files
The commands SET ASNAMES, SET HOLDLIST, and SET HOLDATTR enable you to control theFIELDNAME, TITLE, and ACCEPT attributes in HOLD Master Files. These commands are issuedprior to the report request and remain in effect for the duration of the session, unless youchange them.
The SET ASNAMES command designates text specified in an AS phrase as the field namein the HOLD Master File, and concatenates it to the beginning of the first field namespecified in an ACROSS phrase. See Controlling Field Names in a HOLD Master File on page485.
The SET HOLDLIST command restricts fields in HOLD and PCHOLD files to those appearingin a request. That is, non-displaying fields in a request (those designated as NOPRINTfields) are not included in the HOLD file. You can also distinguish between implicitly andexplicitly non-displaying fields. See Controlling Fields in a HOLD Master File on page 490.
Controlling Attributes in HOLD Master Files
484

The SET HOLDATTR command propagates TITLE and ACCEPT attributes used in the originalMaster File to the HOLD Master File. See Controlling Attributes in the HOLD Master File onpage 495.
In addition, the SET HOLDSTAT command enables you to include comments and DBAinformation in the HOLD Master File. For more information about SET HOLDSTAT, see theDescribing Data With TIBCO WebFOCUS® Language manual. For details about SET commands,see the TIBCO WebFOCUS® Developing Reporting Applications manual.
Controlling Field Names in a HOLD Master File
When SET ASNAMES is set to ON, MIXED or FOCUS, the literal specified in an AS phrase in areport request is used as the field name in a HOLD Master File. This command also controlshow ACROSS fields are named in HOLD files.
Syntax: How to Control Field Names in a HOLD Master File
SET ASNAMES = [ON|OFF|MIXED|FOCUS|FLIP]
where:
OFF
Does not use the literal specified in an AS phrase as a field name in HOLD files, anddoes not affect the way ACROSS fields are named.
ON
Uppercases the literal specified in an AS phrase and propagates it as the field namein the HOLD Master File. Creates names for ACROSS fields that consist of the ASname value concatenated to the beginning of the ACROSS field value and controls theway ACROSS fields are named in HOLD files of any format.
MIXED
Uses the literal specified in an AS phrase for the field name, retaining the case of theAS name, and creates names for ACROSS fields that consist of the AS name valueconcatenated to the beginning of the ACROSS field value.
FOCUS
Uses the literal specified in an AS phrase as the field name and controls the wayACROSS fields are named only in HOLD files in FOCUS format. FOCUS is the defaultvalue.
FLIP
Propagates the field names in the original Master File to the alias names in the HOLDMaster File and the alias names in the original Master File to the field names in the HOLDMaster File.
8. Saving and Reusing Your Report Output
Creating Reports With TIBCO® WebFOCUS Language 485

Reference: Usage Notes for Controlling Field Names in HOLD Files
If no AS phrase is specified for a field, the field name from the original Master File is used.The TITLE attribute specified in the Master File is not used unless SET HOLDATTRS waspreviously issued.
To ensure that fields referenced more than once in a request have unique names in theHOLD Master File, use SET ASNAMES.
Special characters and blanks used in the AS phrase are preserved in the field name thatis created when SET ASNAMES is used. Use single quotation marks around the non-standard field names when referring to them in the newly created Master File.
Text specified in an AS phrase that contains more than 66 characters is truncated to 66characters in the Master File.
When generating field names and aliases for a HOLD file with the default setting for theASNAMES parameter, if the HOLD file is a relational data source, the field names andaliases from the original Master File are propagated to the HOLD Master File. The aliasnames become the column names in the generated relational table. The AS name alsobecomes the TITLE attribute in the HOLD Master File.
When you set the ASNAMES parameter to FLIP, for relational HOLD files, the field namesfrom the original Master File or the AS names specified in the request become the aliasnames in the HOLD Master File as well as the column names in the generated relationaltable and the TITLE attributes in the HOLD Master File. The alias names in the originalMaster File become the field names in the HOLD Master File, except when there is an ASname, in which case the original field name becomes the HOLD field name.
If the HOLD file is not relational, field names from the original Master File are propagated tothe HOLD Master File, but alias name are not propagated, and default aliases of the formE01, E02, and so on, are generated in the HOLD Master File.
For SET ASNAMES=FLIP, for non-relational HOLD files, the field names from the originalMaster File or the AS names from the request become the alias names in the HOLD MasterFile, and default field names are generated in the form F01, F02, and so on.
Duplicate field names may occur in the newly created Master File as a result of truncationor the way AS phrases have been specified. In this case, refer to the fields by their aliases(E01, E02, and so forth).
When commas are used as delimiters to break lines in the column heading, only the literalup to the first comma is used as the field name in the Master File. For example, thefollowing produces the field name PLACE in the HOLD Master File:
Controlling Attributes in HOLD Master Files
486
PRINT COUNTRY AS 'PLACE,OF,ORIGIN'
When ACROSS is used in a report request and the results are extracted to a HOLD file, thecolumns generated by the ACROSS phrase all have the same field name in the HOLDMaster File. If SET ASNAMES is issued, each new column may have a unique field name.This unique field name consists of the ASNAME value specified in the request's displaycommand, concatenated to the beginning of the value of the field used in the ACROSSphrase. If several field names have the same letters, this approach does not work.
If an AS phrase is used for the fields in the ACROSS phrase, each new column has a fieldname composed of the literal in the AS phrase concatenated to the beginning of the valueof the first field used in the ACROSS phrase.
Example: Controlling Field Names in the HOLD Master File
In the following example, SET ASNAMES=ON causes the text in the AS phrase to be used asfield names in the HOLD1 Master File. The two fields in the HOLD1 Master File, NATION andAUTOMOBILE, contain the data for COUNTRY and CAR.
SET ASNAMES=ONTABLE FILE CARPRINT CAR AS 'AUTOMOBILE'BY COUNTRY AS 'NATION'ON TABLE HOLD AS HOLD1END
The request produces the following Master File:
FILE=HOLD1, SUFFIX=FIX SEGMENT=HOLD1, SEGTYPE=S01,$ FIELDNAME=NATION ,ALIAS=E01 ,USAGE=A10 ,ACTUAL=A12 ,$ FIELDNAME=AUTOMOBILE ,ALIAS=E02 ,USAGE=A16 ,ACTUAL=A16 ,$
Example: Providing Unique Field Names With SET ASNAMES
The following request generates a HOLD Master File with one unique field name for SALES andone for AVE.SALES. Both SALES and AVE.SALES would be named SALES, if SET ASNAMES hadnot been used.
SET ASNAMES=ONTABLE FILE CARSUM SALES AND AVE.SALES AS 'AVERAGESALES'BY CARON TABLE HOLD AS HOLD2END
8. Saving and Reusing Your Report Output
Creating Reports With TIBCO® WebFOCUS Language 487

The request produces the following Master File:
FILE=HOLD2, SUFFIX=FIX SEGMENT=HOLD2, SEGTYPE=S01,$ FIELDNAME=CAR ,ALIAS=E01 ,USAGE=A16 ,ACTUAL=A16 ,$ FIELDNAME=SALES ,ALIAS=E02 ,USAGE=I6 ,ACTUAL=I04 ,$ FIELDNAME=AVERAGESALES ,ALIAS=E03 ,USAGE=I6 ,ACTUAL=I04 ,$
Example: Using SET ASNAMES With the ACROSS Phrase
The following request produces a HOLD Master File with the literal CASH concatenated to eachvalue of COUNTRY.
SET ASNAMES=ONTABLE FILE CARSUM SALES AS 'CASH'ACROSS COUNTRYON TABLE HOLD AS HOLD3END
The request produces the following Master File:
FILE=HOLD3, SUFFIX=FIX SEGMENT=HOLD3, SEGTYPE=S01,$ FIELDNAME=CASHENGLAND ,ALIAS=E01 ,USAGE=I6 ,ACTUAL=I04 ,$ FIELDNAME=CASHFRANCE ,ALIAS=E02 ,USAGE=I6 ,ACTUAL=I04 ,$ FIELDNAME=CASHITALY ,ALIAS=E03 ,USAGE=I6 ,ACTUAL=I04 ,$ FIELDNAME=CASHJAPAN ,ALIAS=E04 ,USAGE=I6 ,ACTUAL=I04 ,$ FIELDNAME=CASHW GERMANY ,ALIAS=E05 ,USAGE=I6 ,ACTUAL=I04 ,$
Without the SET ASNAMES command, every field in the HOLD FILE is named COUNTRY.
To generate field names for ACROSS values that include only the field value, use the ASphrase followed by two single quotation marks, as follows:
SET ASNAMES=ONTABLE FILE CARSUM SALES AS ''ACROSS COUNTRYON TABLE HOLD AS HOLD4END
The resulting Master File looks like this:
FILE=HOLD4, SUFFIX=FIX SEGMENT=HOLD4, SEGTYPE=S0,$ FIELDNAME=ENGLAND ,ALIAS=E01 ,USAGE=I6 ,ACTUAL=I04 ,$ FIELDNAME=FRANCE ,ALIAS=E02 ,USAGE=I6 ,ACTUALI04 ,$ FIELDNAME=ITALY ,ALIAS=E03 ,USAGE=I6 ,ACTUALI04 ,$ FIELDNAME=JAPAN ,ALIAS=E04 ,USAGE=I6 ,ACTUALI04 ,$ FIELDNAME=W GERMANY ,ALIAS=E05 ,USAGE=I6 ,ACTUALI04 ,$
Controlling Attributes in HOLD Master Files
488

Example: Generating a HOLD File With SET ASNAMES=FLIP
The following request generates a HOLD file in ALPHA format using the OFF value for SETASNAMES. The field CURR_SAL has the AS name SALARY in the request:
SET ASNAMES=OFFTABLE FILE EMPLOYEESUM CURR_SAL AS SALARY PCT_INCBY DEPARTMENTON TABLE HOLD FORMAT ALPHAEND
In the HOLD Master File, AS names have not been propagated, the field names are from theoriginal Master File, and default alias names are generated:
FILENAME=HOLD , SUFFIX=FIX , IOTYPE=STREAM, $ SEGMENT=HOLD, SEGTYPE=S1, $ FIELDNAME=DEPARTMENT, ALIAS=E01, USAGE=A10, ACTUAL=A10, $ FIELDNAME=CURR_SAL, ALIAS=E02, USAGE=D12.2M, ACTUAL=A12, $ FIELDNAME=PCT_INC, ALIAS=E03, USAGE=F6.2, ACTUAL=A06, $
The following version of the request generates a relational table:
SET ASNAMES=OFFTABLE FILE EMPLOYEESUM CURR_SAL AS SALARY PCT_INCBY DEPARTMENTON TABLE HOLD FORMAT SQLMSSEND
The field names from the original Master File have been propagated to the field names in theHOLD Maser File, and the alias names from the original Master File have been propagated tothe HOLD Master File. The AS name for CURR_SAL has become the TITLE in the HOLD MasterFile:
FILENAME=HOLD , SUFFIX=SQLMSS , $ SEGMENT=SEG01, SEGTYPE=S0, $ FIELDNAME=DEPARTMENT, ALIAS=DPT, USAGE=A10, ACTUAL=A10, $ FIELDNAME=CURR_SAL, ALIAS=CSAL, USAGE=D12.2M, ACTUAL=D8, TITLE='SALARY', $ FIELDNAME=PCT_INC, ALIAS=PI, USAGE=F6.2, ACTUAL=F4, $
Changing SET ASNAMES to ON propagates the AS name SALARY to the field name in the HOLDMaster File. The following is the Master File for the HOLD file in ALPHA format:
FILENAME=HOLD , SUFFIX=FIX , IOTYPE=STREAM, $ SEGMENT=HOLD, SEGTYPE=S1, $ FIELDNAME=DEPARTMENT, ALIAS=E01, USAGE=A10, ACTUAL=A10, $ FIELDNAME=SALARY, ALIAS=E02, USAGE=D12.2M, ACTUAL=A12, $ FIELDNAME=PCT_INC, ALIAS=E03, USAGE=F6.2, ACTUAL=A06, $
8. Saving and Reusing Your Report Output
Creating Reports With TIBCO® WebFOCUS Language 489

The following is the Master File for the HOLD file in relational format:
FILENAME=HOLD , SUFFIX=SQLMSS , $ SEGMENT=SEG01, SEGTYPE=S0, $ FIELDNAME=DEPARTMENT, ALIAS=DPT, USAGE=A10, ACTUAL=A10, $ FIELDNAME=SALARY, ALIAS=CURR_SAL, USAGE=D12.2M, ACTUAL=D8, TITLE='SALARY', $ FIELDNAME=PCT_INC, ALIAS=PI, USAGE=F6.2, ACTUAL=F4, $
Changing SET ASNAMES to FLIP propagates the AS name SALARY to the alias name in theHOLD Master File. In the ALPHA HOLD file, the other field names have been propagated to thealias names in the HOLD Master File, and default field names have been generated:
FILENAME=HOLD , SUFFIX=FIX , IOTYPE=STREAM, $ SEGMENT=HOLD, SEGTYPE=S1, $ FIELDNAME=F01, ALIAS=DEPARTMENT, USAGE=A10, ACTUAL=A10, $ FIELDNAME=F02, ALIAS=SALARY, USAGE=D12.2M, ACTUAL=A12, $ FIELDNAME=F03, ALIAS=PCT_INC, USAGE=F6.2, ACTUAL=A06, $
In the relational HOLD file, changing SET ASNAMES to FLIP propagates the AS name SALARYto the alias name in the HOLD Master File. For that field, the field name from the originalMaster File becomes the field name in the HOLD Master File and the TITLE attribute. The otherfield names have been propagated to the alias names in the HOLD Master File, and thecorresponding alias names from the original Master File have been propagated to the fieldnames in the HOLD Master File:
FILENAME=HOLD , SUFFIX=SQLMSS , $ SEGMENT=SEG01, SEGTYPE=S0, $ FIELDNAME=DPT, ALIAS=DEPARTMENT, USAGE=A10, ACTUAL=A10, $ FIELDNAME=CURR_SAL, ALIAS=SALARY, USAGE=D12.2M, ACTUAL=D8, TITLE='SALARY', $ FIELDNAME=PI, ALIAS=PCT_INC, USAGE=F6.2, ACTUAL=F4, $
Controlling Fields in a HOLD Master File
You can use the SET HOLDLIST command to restrict fields in HOLD Master Files to thoseappearing in a request.
Syntax: How to Control Fields in a HOLD File
SET HOLDLIST = {PRINTONLY|ALL|ALLKEYS|EXPLICIT}
where:
PRINTONLY
Specifies that only those fields that would appear in the report are included in thegenerated HOLD file. Non-displaying fields in a request (those designated as NOPRINTfields explicitly or implicitly) are not included in the HOLD file.
Controlling Attributes in HOLD Master Files
490

ALL
Specifies that all display fields referenced in a request appear in a HOLD file,including calculated values. ALL is the default value. OLD may be used as a synonymfor ALL.
Note: Vertical sort (BY) fields specified in the request with the NOPRINT option are notincluded in the HOLD file even if HOLDLIST=ALL.
ALLKEYS
Propagates all fields, including NOPRINTed BY fields.
The ALLKEYS setting enables caching of all of the data necessary for manipulating anactive report.
EXPLICIT
Includes fields in the HOLD or PCHOLD file that are explicitly omitted from the reportoutput using the NOPRINT option in the request, but does not include fields that areimplicitly NOPRINTed. For example, if a field is reformatted in the request, twoversions of the field exist, the one with the new format and the one with the originalformat, which is implicitly NOPRINTed
Note that SET HOLDLIST may also be issued from within a TABLE request. When used withMATCH, SET HOLDLIST always behaves as if HOLDLIST is set to ALL.
Example: Using HOLDLIST=ALL
When HOLDLIST is set to ALL, the following TABLE request produces a HOLD file containing allspecified fields, including NOPRINT fields and values calculated with the COMPUTE command.
SET HOLDLIST=ALL TABLE FILE CARPRINT CAR MODEL NOPRINTCOMPUTE TEMPSEATS=SEATS+1;BY COUNTRYON TABLE HOLDEND ? HOLD
The output is:
NUMBER OF RECORDS IN TABLE= 18 LINE= 18
DEFINITION OF HOLD FILE: HOLD
FIELDNAME ALIAS FORMAT
8. Saving and Reusing Your Report Output
Creating Reports With TIBCO® WebFOCUS Language 491

COUNTRY E01 A10
CAR E02 A16
MODEL E03 A24
SEATS E04 I3
TEMPSEATS E05 D12.2
Example: Using HOLDLIST= PRINTONLY
When HOLDLIST is set to PRINTONLY, the following TABLE request produces a HOLD filecontaining only fields that would appear in report output:
SET HOLDLIST=PRINTONLY TABLE FILE CARPRINT CAR MODEL NOPRINTCOMPUTE TEMPSEATS=SEATS+1;BY COUNTRYON TABLE HOLDEND ? HOLD
The output is:
NUMBER OF RECORDS IN TABLE= 18 LINES= 18
DEFINITION OF HOLD FILE: HOLD
FIELDNAME ALIAS FORMAT
COUNTRY E01 A10
CAR E02 A16
TEMPSEATS E03 D12.2
Controlling Attributes in HOLD Master Files
492

Example: Comparing Master Files Created Using Different HOLDLIST Settings
The following request against the GGSALES data source has two reformatted display fields(DOLLARS, UNITS). The DOLLARS field is also an explicit NOPRINT field. The BY field namedCATEGORY is also an explicit NOPRINT field:
SET HOLDLIST=ALLTABLE FILE GGSALESSUM UNITS/I5 DOLLARS/D12.2 NOPRINTBY REGION BY CATEGORY NOPRINTON TABLE HOLD FORMAT FOCUSEND
Running the request with SET HOLDLIST=ALL generates the following HOLD Master File. Notethat the DOLLARS and UNITS fields are included twice, once with the original format (whichwould have been implicitly NOPRINTed if the report had been printed rather than held) andonce with the new format. However the NOPRINTed BY field (CATEGORY) is not included:
FILENAME=HOLD, SUFFIX=FOC , $ SEGMENT=SEG01, SEGTYPE=S1, $ FIELDNAME=REGION, ALIAS=E01, USAGE=A11, TITLE='Region', DESCRIPTION='Region code', $ FIELDNAME=UNITS, ALIAS=E02, USAGE=I08, TITLE='Unit Sales', DESCRIPTION='Number of units sold', $ FIELDNAME=UNITS, ALIAS=E03, USAGE=I5, TITLE='Unit Sales', $ FIELDNAME=DOLLARS, ALIAS=E04, USAGE=I08, TITLE='Dollar Sales', DESCRIPTION='Total dollar amount of reported sales', $ FIELDNAME=DOLLARS, ALIAS=E05, USAGE=D12.2, TITLE='Dollar Sales', $
8. Saving and Reusing Your Report Output
Creating Reports With TIBCO® WebFOCUS Language 493
Running the request with SET HOLDLIST=ALLKEYS generates the following HOLD Master File.Note that the DOLLARS and UNITS fields are included twice, once with the original format,which would have been implicitly NOPRINTed if the report had been printed rather than held,and once with the new format. The NOPRINTed BY field (CATEGORY) is included:
FILENAME=HOLD, SUFFIX=FOC , $ SEGMENT=SEG01, SEGTYPE=S2, $ FIELDNAME=REGION, ALIAS=E01, USAGE=A11, TITLE='Region', DESCRIPTION='Region code', $ FIELDNAME=CATEGORY, ALIAS=E02, USAGE=A11, TITLE='Category', DESCRIPTION='Product category', $ FIELDNAME=UNITS, ALIAS=E03, USAGE=I08, TITLE='Unit Sales', DESCRIPTION='Number of units sold', $ FIELDNAME=UNITS, ALIAS=E04, USAGE=I5, TITLE='Unit Sales', $ FIELDNAME=DOLLARS, ALIAS=E05, USAGE=I08, TITLE='Dollar Sales', DESCRIPTION='Total dollar amount of reported sales', $ FIELDNAME=DOLLARS, ALIAS=E06, USAGE=D12.2, TITLE='Dollar Sales', $
Running the request with SET HOLDLIST=PRINTONLY generates the following HOLD MasterFile. Only the fields that would have actually printed on the report output are included: REGIONand UNITS with the new format (I5). All explicitly and implicitly NOPRINTed fields are excluded,including the NOPRINTed BY field (CATEGORY):
FILENAME=HOLD , SUFFIX=FOC , $ SEGMENT=SEG01, SEGTYPE=S1, $ FIELDNAME=REGION, ALIAS=E01, USAGE=A11, TITLE='Region', DESCRIPTION='Region code', $ FIELDNAME=UNITS, ALIAS=E02, USAGE=I5, TITLE='Unit Sales', $
Running the request with SET HOLDLIST=EXPLICIT generates the following HOLD Master File.The fields that would have actually printed on the report output are included and so are theexplicitly NOPRINTed fields (the display field DOLLARS and the BY field CATEGORY). Theimplicitly NOPRINTed fields (DOLLARS and UNITS with their original formats) are omitted:
FILENAME=HOLD, SUFFIX=FOC , $ SEGMENT=SEG01, SEGTYPE=S2, $ FIELDNAME=REGION, ALIAS=E01, USAGE=A11, TITLE='Region', DESCRIPTION='Region code', $ FIELDNAME=CATEGORY, ALIAS=E02, USAGE=A11, TITLE='Category', DESCRIPTION='Product category', $ FIELDNAME=UNITS, ALIAS=E03, USAGE=I5, TITLE='Unit Sales', $ FIELDNAME=DOLLARS, ALIAS=E04, USAGE=D12.2, TITLE='Dollar Sales', $
Controlling Attributes in HOLD Master Files
494
Controlling Attributes in the HOLD Master File
The SET HOLDATTR command controls whether the TITLE and ACCEPT attributes, as well asother attributes in the original Master File, are propagated to the HOLD Master File. SETHOLDATTR does not affect the way fields are named in the HOLD Master File.
Note that if a field in a data source does not have the TITLE attribute specified in the MasterFile, but there is an AS phrase specified for the field in a report request, the correspondingfield in the HOLD file is named according to the AS phrase.
Syntax: How to Control TITLE and ACCEPT Attributes
SET HOLDATTR =[ON|OFF|FOCUS|CUBE]
where:
ON
Uses the TITLE attribute as specified in the original Master File in HOLD files in anyformat. The ACCEPT attribute is propagated to the HOLD Master File only for HOLDfiles in FOCUS format. PROPERTY attributes are also propagated.
OFF
Does not use the TITLE or ACCEPT attributes from the original Master File in the HOLDMaster File.
FOCUS
Uses the TITLE and ACCEPT attributes only for HOLD files in FOCUS format. PROPERTYattributes are also propagated. FOCUS is the default value.
CUBE
Propagates folders and DV_ROLE attributes, as well as TITLE attributes to the HOLDMaster File. It also propagates the field name as the alias value.
Example: Controlling TITLE and ACCEPT Attributes in a HOLD Master File
In this example, the Master File for the CAR data source specifies TITLE and ACCEPTattributes:
FILENAME=CAR2, SUFFIX=FOCSEGNAME=ORIGIN, SEGTYPE=S1 FIELDNAME =COUNTRY, COUNTRY, A10, TITLE='COUNTRY OF ORIGIN', ACCEPT='CANADA' OR 'ENGLAND' OR 'FRANCE' OR 'ITALY' OR 'JAPAN' OR 'W GERMANY', FIELDTYPE=I,$SEGNAME=COMP, SEGTYPE=S1, PARENT=ORIGIN FIELDNAME=CAR, CARS, A16, TITLE='NAME OF CAR',$...
8. Saving and Reusing Your Report Output
Creating Reports With TIBCO® WebFOCUS Language 495

Using SET HOLDATTR=FOCUS, the following request
SET HOLDATTR = FOCUSTABLE FILE CAR2PRINT CARBY COUNTRY ON TABLE HOLD FORMAT FOCUS AS HOLD5END
produces this HOLD Master File:
FILE=HOLD5, SUFFIX=FOC SEGMENT=SEG01, SEGTYPE=S02 FIELDNAME=COUNTRY ,USAGE=E01 ,ACTUAL=A10 TITLE='COUNTRY OF ORIGIN', ACCEPT=CANADA ENGLAND FRANCE ITALY JAPAN 'W GERMANY',$ FIELDNAME=FOCLIST ,USAGE=E02 ,ACTUAL=I5 ,$ FIELDNAME=CAR ,USAGE=E03 ,ACTUAL=A16 , TITLE='NAME OF CAR' ,$
Keyed Retrieval From HOLD Files
Keyed retrieval is supported with any single-segment SUFFIX=FIX data source or HOLD file thatis sorted based on the key. Keyed retrieval can reduce the IOs incurred in reading extract files,by using the SEGTYPE parameter in the Master File to identify which fields comprise the logicalkey for sequential files. When FIXRETRIEVE is:
ON, the retrieval process stops when an equality or range test on the key holds true.
OFF, all of the records from the sequential file are read and screening conditions areapplied when creating the final report.
The ON TABLE HOLD command enables you to read one of the many supported data sourcesand create extract files. You can then join these fixed-format sequential files to other datasources to narrow your view of the data. The concept of a logical key in a fixed-format fileenables qualified keyed searches for all records that match IF/WHERE tests for the first n KEYfields identified by the SEGTYPE attribute. Retrieval stops when the screening test detectsvalues greater than those specified in the IF/WHERE test.
When a Master File is created for the extract file, a SEGTYPE of either Sn or SHn is added,based on the BY fields in the request. For example, PRINT field BY field creates a HOLD MasterFile with SEGTYPE=S1. Using BY HIGHEST field creates a Master with SEGTYPE=SH1.
Keyed Retrieval From HOLD Files
496

Syntax: How to Control Keyed Retrieval for a HOLD File
SET FIXRET[RIEVE] = {ON|OFF}
where:
ON
Enables keyed retrieval. ON is the default setting.
OFF
Disables keyed retrieval.
Example: Master File for Keyed Retrieval From a HOLD File
The following Master File describes a fixed-format sequential file with sorted values ofSEQ_NO, in ascending order from 1 to 100,000.
FILE=SORTED,SUFFIX=FIX,$SEGNAME=ONE,SEGTYPE=S1,$ FIELD=MYKEY,MK,I8,I8,$ FIELD=MFIELD,MF,A10,A10,$ TABLE FILE SORTED PRINT MFIELD WHERE MYKEY EQ 100END
In this instance, with FIXRETRIEVE=ON, retrieval stops when MYKEY reaches 101, vastlyreducing the potential number of IOs, as only 101 records are read out of a possible 100,000.
Example: Selection Criteria for Keyed Retrieval From an Extract File
Selection criteria that include lists of equality values use keyed retrieval. For example,
{IF|WHERE} MYKEY EQ x OR y OR z
IF and WHERE tests can also include range tests. For example,
{IF|WHERE} MYKEY IS-FROM x TO y
The maximum number of vertical (BY) sort fields remains 32.
8. Saving and Reusing Your Report Output
Creating Reports With TIBCO® WebFOCUS Language 497

In using this feature, keep in mind that when adding unsorted records to a sorted HOLD file,records that are out of sequence are not retrieved. For example, suppose that a sorted filecontains the following three records:
Key
1 1200
2 2340
3 4875
and you add the following record at the bottom of the file:
1 1620
With FIXRETRIEVE=ON, the new record with a key value of 1 is omitted, as retrieval stops assoon as a key value of 2 is encountered.
Saving and Retrieving HOLD Files
In WebFOCUS, HOLD files are saved to a temporary directory during processing and deletedafter the connection to the server is broken. If you wish to retain these files for later use, youcan save the HOLD data source and its associated Master File to a specific location using APPcommands.
To report against the HOLD Master File at a later time, you can add the application to your APPpath, if it is not already there, or you can use a two-part name (appname/mastername) in theTABLE FILE command.
To report against the saved HOLD data file, you can issue a FILEDEF command that specifieswhere to find the file before you issue the TABLE FILE command.
Syntax: How to Specify a Storage Location for a HOLD Master File (Windows, UNIX, OpenVMS)
APP MAP appname path_to_directory APP HOLDDATA appname APP HOLDMETA appname
where:
APP MAP
Associates a directory location with an application name.
APP HOLDDATA
Specifies the application name for HOLD data files.
APP HOLDMETA
Specifies the application name for HOLD Master Files.
Saving and Retrieving HOLD Files
498

path_to_directorySpecifies the directory in which to store the files.
appnameIs an application name.
You should add the APP commands to a supported profile so that they will be available to all ofyour procedures rather than issuing them in every procedure that needs to access theapplication directory. In addition, you should add the application to your path so that it will befound by your procedures.
Example: Specifying a Storage Location for HOLD Data and Master Files
The following example for WebFOCUS on UNIX illustrates how to create an application namedholdapp and store HOLD data files and Master Files in the \ggtmp directory that is mapped tothat application.
Place the following commands in any supported profile:
APP MAP holdapp /ggtmpAPP HOLDDATA holdappAPP HOLDMETA holdapp
The following request creates a HOLD Master file named sales.mas and a HOLD data filenamed sales.ftm that will be stored in the /ggtmp directory:
TABLE FILE GGSALESPRINT SEQ_NO CATEGORY PRODUCTON TABLE HOLD AS SALESEND
To issue a TABLE request against the HOLD file, you must first issue a FILEDEF command thatpoints to the HOLD data file. The DDNAME for the FILEDEF is the AS name specified in theHOLD command. If no AS name was specified, the DDNAME is HOLD:
FILEDEF SALES DIR \ggtmp\sales.ftm
You must also make sure that WebFOCUS can find the Master File. One way to do this is tomake sure that the application is in your application path. You can add it to the path with thefollowing command:
APP APPENDPATH holdapp
Then you can issue a request against the HOLD file:
TABLE FILE SALESPRINT *END
8. Saving and Reusing Your Report Output
Creating Reports With TIBCO® WebFOCUS Language 499

Alternatively, you can issue the TABLE request against the HOLD file using a two-part name(application name and Master File name):
TABLE FILE holdapp/salesPRINT *END
Reference: Allocating HOLD Files on z/OS
The HOLD file is dynamically allocated if it is not currently allocated on z/OS. This means thesystem may delete the file at the end of the session, even if you have not. Since HOLD filesare usually deleted, this is a desired default. However, if you want to save the file, werecommend that you allocate the HOLD Master File to the ddname HOLDMAST as a permanentdata set, and allocate the HOLD data file to a permanent data set as well. The allocations canbe performed within the standard TIBCO WebFOCUS® Reporting Server CLIST or batch JCL or ina profile or procedure. For example, if your procedure had the following command:
ON TABLE HOLD AS SALES
you could use allocations similar to the following:
ALLOC F(HOLDMAST) DA('qualif.HOLDMAST.DATA') SHR REUSEALLOC F(SALES) DA('qualif.SALES.DATA') SHR REUSE
Note that ddname HOLDMAST must not refer to the same PDS referred to by the MASTER andFOCEXEC ddnames.
Using DBMS Temporary Tables as HOLD Files
You can create a report output file (that is, a HOLD file), as a native DBMS temporary table.This increases performance by keeping the entire reporting operation on the DBMS server,instead of downloading data to your computer and then back to the DBMS server.
For example, if you temporarily store report output for immediate use by another procedure,storing it as a temporary table instead of creating a standard HOLD file avoids the overhead oftransmitting the interim data to your computer.
The temporary table columns are created from the following report elements
Display columns
Sort (BY) columns
COMPUTE columns
except for those for which NOPRINT is specified.
Using DBMS Temporary Tables as HOLD Files
500

The temporary table that you create from your report will be the same data source type (that is,the same DBMS) as the data source from which you reported. If the data source from whichyou reported contains multiple tables, all must be of the same data source type and reside onthe same instance of the DBMS server.
You can choose between several types of table persistence.
You can create extract files as native DBMS tables with the following adapters:
Db2 (on z/OS, UNIX, and Windows)
Informix
Microsoft SQL Server
MySQL
Oracle
Teradata
Syntax: How to Save Report Output as a Native Temporary Table Using Commands
The syntax to save report output as a native DBMS temporary table is
ON TABLE HOLD [AS filename] FORMAT SAME_DB [PERSISTENCE persistValue]
where:
filenameSpecifies the name of the HOLD file. If you omit AS filename, the name of thetemporary table defaults to "HOLD".
Because each subsequent HOLD command overwrites the previous HOLD file, it isrecommended to specify a name in each request to direct the extracted data to a separatefile, thereby preventing an earlier file from being overwritten by a later one.
PERSISTENCE
Specifies the type of table persistence and related table properties. This is optionalfor DBMSs that support volatile tables, and required otherwise. For information aboutsupport for volatile tables for a particular DBMS, see Temporary Table Properties forSAME_DB Persistence Values on page 503, and consult your DBMS vendordocumentation.
8. Saving and Reusing Your Report Output
Creating Reports With TIBCO® WebFOCUS Language 501

persistValueIs one of the following:
VOLATILE
Specifies that the table is local to the DBMS session. A temporary synonym (aMaster File and Access File), is generated automatically. It expires when theserver session ends.
This is the default persistence setting for all DBMSs that support volatile tables.
For information about support for the volatile setting, and about persistence and othertable properties, for a particular DBMS, see Temporary Table Properties for SAME_DBPersistence Values on page 503, and consult your DBMS vendor documentation.
GLOBAL_TEMPORARY
Specifies that while the table exists, its definition will be visible to other databasesessions and users though its data will not be. A permanent synonym (a MasterFile and Access File), is generated automatically.
For information about support for the global temporary setting, and about persistenceand other table properties, for a particular DBMS, see Temporary Table Properties forSAME_DB Persistence Values on page 503, and consult your DBMS vendordocumentation.
PERMANENT
Specifies that a regular permanent table will be created. A permanent synonym (aMaster File and Access File), is generated automatically.
Using DBMS Temporary Tables as HOLD Files
502

Reference: Temporary Table Properties for SAME_DB Persistence Values
The following chart provides additional detail about persistence and other properties oftemporary tables of different data source types that are supported for use with HOLD formatSAME_DB.
DBMS VOLATILE GLOBAL_TEMPORARY
Db2 Db2 on Linux, UNIX, andWindows, and Db2 for z/OS: avolatile table is created usingthe DECLARE GLOBALTEMPORARY TABLE commandwith the ON COMMITPRESERVE ROWS option.Declared global temporarytables persist and are visibleonly within the currentsession (connection).SESSION is the schema namefor all declared globaltemporary tables.
Db2 on Linux, UNIX, and Windows, and Db2for z/OS: a global temporary table iscreated using the CREATE GLOBALTEMPORARY TABLE command. Thedefinition of a created global temporarytable is visible to other sessions, but thedata is not. The data is deleted at the endof each transaction (COMMIT or ROLLBACKcommand). The table definition persistsafter the session ends.
Global tables require the following settingto be in effect:
ENGINE DB2 SET AUTOCOMMIT ON FIN
For information on creating user-definedtablespaces on Linux, UNIX, and Windowsfor volatile and global temporary tables,see the TIBCO WebFOCUS® AdapterAdministration manual.
Informix A volatile table is createdusing the CREATE TEMPTABLE command with theWITH NO LOG option. Thedefinition and the datapersist, and are visible, onlywithin the current session.
This type of table is not supported byInformix.
8. Saving and Reusing Your Report Output
Creating Reports With TIBCO® WebFOCUS Language 503

DBMS VOLATILE GLOBAL_TEMPORARY
MicrosoftSQL Server
A volatile table is created as alocal temporary table whosename is prefixed with a singlenumber sign (#). Therefore,the name of a volatile tableused as a HOLD file is thename specified by the HOLDphrase, prefixed with anumber sign (#). The tabledefinition and the datapersist, and are visible, onlywithin the current session.
The name of a global temporary table isprefixed with two number signs (##).Therefore, the name of a global temporarytable used as a HOLD file is the namespecified by the HOLD phrase, prefixed withtwo number signs (##). The table isdropped automatically when the sessionthat created the table ends and all othertasks have stopped referencing it. Thetable definition and data are visible to othersessions.
MySQL A volatile table is createdusing the CREATETEMPORARY TABLEcommand. A temporary tablepersists and is visible onlywithin the current session(connection). If a temporarytable has the same name asa permanent table, thepermanent table becomesinvisible.
This type of table is not supported byMySQL.
Oracle This type of table is notsupported by Oracle.
The table definition is visible to allsessions. Its data is visible only to thesession that inserts data into it. The tabledefinition persists for the same period asthe definition of a regular table.
Using DBMS Temporary Tables as HOLD Files
504

DBMS VOLATILE GLOBAL_TEMPORARY
Teradata A volatile table definition anddata are visible only within thesession that created the tableand inserted the data. Thevolatile table is created withthe ON COMMIT PRESERVEROWS option.
A global temporary table persists for thesame duration as a permanent table. Thedefinition is visible to all sessions, but thedata is visible only to the session thatinserted the data. The global temporarytable is created with the ON COMMITPRESERVE ROWS option.
Column Names in the HOLD File
Each HOLD file column is assigned its name:
1. From the AS name specified for the column in the report request.
2. If there is no AS name specified, the name is assigned from the alias specified in thesynonym. (The alias is identical to the column name in the original relational table.)
3. In all other cases, the name is assigned from the field name as it is specified in thesynonym.
Primary Keys and Indexes in the HOLD File
A primary key or an index is created for the HOLD table. The key or index definition isgenerated from the sort (BY) keys of the TABLE command, except for undisplayed sort keys(that is, sort keys for which NOPRINT is specified). To determine whether a primary key or anindex will be created:
1. If these sort keys provide uniqueness and do not allow nulls (that is, if in the synonym, theMISSING attribute column is unselected or OFF), and if the DBMS supports primary keys onthe type of table being created, a primary key is created.
2. If these sort keys provide uniqueness but either
a. some of the columns allow nulls.
b. the DBMS does not support primary keys on the type of table being created then aunique index is created.
3. If these sort keys do not provide uniqueness, a non-unique index is created.
4. If there are no displayed sort keys (that is, no sort keys for which NOPRINT has not beenspecified), no primary key or index is created.
8. Saving and Reusing Your Report Output
Creating Reports With TIBCO® WebFOCUS Language 505
Creating SAVE and SAVB Files
The SAVE command, by default, captures report output in ALPHA format as a simple sequentialdata source, without headings or subtotals. However, you can specify a variety of other formatsfor SAVE files, which are compatible with many software products. For example, you canspecify SAVE formats to display report output in a webpage, a text document, a spreadsheet orword processing application, or to be used as input to other programming languages. For a listof supported formats, see Choosing Output File Formats on page 511.
Regardless of format, the SAVE command does not create a Master File.
The SAVB command is a variation on the SAVE command. SAVB creates a data source withouta Master File, but numeric fields are stored in BINARY format. You can use the SAVB file asinput to a variety of applications. SAVB output is the same as the default output created by theHOLD command.
Syntax: How to Create a SAVE File
From a report request, use
ON TABLE SAVE [AS filename] [FORMAT fmt] [MISSING {ON|OFF}]
or
save_field SAVE [AS filename] [FORMAT fmt] [MISSING {ON|OFF}]
where:
save_fieldIs the name of the last field in the request, excluding BY or ACROSS fields.
AS filenameSpecifies a name for the SAVE file. If you do not specify a file name, SAVE is used asthe default. Since each subsequent SAVE command overwrites the previous SAVE file,it is advisable to code a distinct file name in each request to direct the extracted datato a separate file, thereby preventing it from being overwritten by the next SAVEcommand.
You can also include a path, enclosed in single quotation marks, indicating where to storethe SAVE file. For example:
ON TABLE SAVE FILENAME 'install_dir:\dir\filename.ext' FORMAT fmt
FORMAT fmtSpecifies the format of the SAVE file. ALPHA is the default format.
To display as or in a webpage:
HTML, HTMTABLE, DHTML
Creating SAVE and SAVB Files
506

To use in a text document:
ALPHA, DOC, PDF, WP, Text
To use in a spreadsheet application:
DIF, EXCEL, EXL2K, LOTUS, (WK1), SYLK
To use in a database application:
COMMA, COM, COMT
For details about all available formats, see Choosing Output File Formats on page 511.
MISSING
Ensures that fields with the MISSING attribute set to ON are carried over into theSAVE file. MISSING OFF is the default attribute. See Handling Records With MissingField Values on page 1037.
Example: Creating a SAVE File
The following request extracts data from the EMPLOYEE data source and creates a SAVE file.
TABLE FILE EMPLOYEEPRINT LAST_NAME AND FIRST_NAMEBY DEPARTMENTON TABLE SAVEEND
A description of the ALPHA (default SAVE format) file layout appears after the records areretrieved.
The output is:
8. Saving and Reusing Your Report Output
Creating Reports With TIBCO® WebFOCUS Language 507

Syntax: How to Create a SAVB File
From a request, use
ON TABLE SAVB [AS filename] [MISSING {ON|OFF}]
or
save_field SAVB [AS filename] [MISSING {ON|OFF}]
where:
save_fieldIs the name of the last field in the request, excluding BY and ACROSS fields.
AS filenameSpecifies a name for the SAVB file. If you do not specify a file name, SAVB is used asthe default. Since each subsequent SAVB command overwrites the previous SAVB file,it is advisable to code a distinct file name in each request to direct the extracted datato a separate file, thereby preventing it from being overwritten by the next SAVBcommand.
You can also include a path, enclosed in single quotation marks, indicating where you wishto store the SAVB file. For example:
ON TABLE SAVB FILENAME 'c:\dir\filename.ext '
MISSING
Ensures that fields with the MISSING attribute set to ON are carried over into theSAVB file. The default is MISSING OFF. See Handling Records With Missing FieldValues on page 1037.
Example: Creating a SAVB File
The following request extracts data from the SALES data source and creates a SAVB file.
TABLE FILE SALESPRINT PROD_CODE AND AREABY DATEWHERE CITY IS 'STAMFORD' OR 'UNIONDALE'ON TABLE SAVBEND
A description of the BINARY file is appears after the records are retrieved.
Creating SAVE and SAVB Files
508

The output is:
Creating a PCHOLD File
The PCHOLD command enables you to extract data from the WebFOCUS Reporting Server byway of the WebFOCUS client, and automatically display the data in HTML format in yourbrowser.
In addition, if you have established a helper application, you can use the command ON TABLEPCHOLD to display the data in the helper application's viewer. For example, if a procedurecontains the ON TABLE PCHOLD FORMAT EXCEL command, data is not returned to the browserin HTML format. Instead, data is returned and imported into an Excel spreadsheet, or otherspreadsheet program you specify to your browser.
In contrast, when data access is handled directly by the Reporting Server (without interventionby the WebFOCUS Client), the data is extracted to a PCHOLD file and automatically delivered toyour PC for local reporting.
Note: If your environment supports the SET parameter SAVEMATRIX, you can preserve theinternal matrix of your last report in order to keep it available for subsequent HOLD, SAVE, andSAVB commands when the request is followed by Dialogue Manager commands. For details onSAVEMATRIX, see the TIBCO WebFOCUS® Developing Reporting Applications manual.
Syntax: How to Create a PCHOLD File
The syntax for PCHOLD in a report request is
ON TABLE PCHOLD [AS filename] [FORMAT fmt] [DATASET name.ext]
where:
PCHOLD
Enables you to extract and automatically display data in HTML format in your browser.HOLD AT CLIENT is a synonym for PCHOLD. The PCHOLD command does not have a
8. Saving and Reusing Your Report Output
Creating Reports With TIBCO® WebFOCUS Language 509

default format. You must specify a format when using PCHOLD. The output is savedwith a Master File. For details about the behavior of PCHOLD, see Creating a HOLDFile on page 473.
If you specify an ON TABLE PCHOLD command without a FORMAT, XML/HTML code isreturned to the browser.
AS filenameSpecifies a name for the PCHOLD file. If you do not specify a file name, PCHOLDbecomes the default. Since each subsequent PCHOLD command overwrites theprevious PCHOLD file, it is advisable to code a distinct file name in each request todirect the extracted data to a separate file, thereby preventing it from beingoverwritten by the next PCHOLD command.
FORMAT fmtSpecifies the format of the PCHOLD file.
To display as or in a webpage, choose:
HTML, HTMTABLE, DHTML, VISDIS
To display as a printed document, choose:
PDF, PS
To use in a text document, choose:
ALPHA, DOC, WP
To use in a spreadsheet application, choose:
DIF, XLSX, EXL2K [PIVOT], LOTUS
To use for additional reporting, choose:
ALPHA, DFIX, COM, COMT, TAB, TABT
To use in another application choose:
XML
To generate active output, choose:
AHTML, APDF, AFLEX
For details about all available formats, see Choosing Output File Formats on page 511.
Creating a PCHOLD File
510

DATASET name.ext
Is used with FORMAT ALPHA to specify a file name and extension for the report output. Theresult depends on the Redirection Settings in the WebFOCUS Administration Console forthe specified extension. If the extension is defined in the WebFOCUS AdministrationConsole, and the Save Report value is yes, the report output will be saved in yourDownloads directory with the specified file name and extension.
Choosing Output File Formats
You can select from a wide range of output formats to preserve your report output for use inany of the following ways:
To display as or in a webpage, as a printed document, or in a text document.
To process in another application, such as a spreadsheet, a database, a word processor,or a 3GL program.
To send to another location, such as a browser or PC.
To extract a subset of the original data source in order to generate multi-step reports.
For details on each of the supported formats, including the commands that support them(HOLD, PCHOLD, SAVE) and the operating environments in which they are available, see thereference topics for the following formats.
AHTML
AHTMLTAB
ALPHA
APDF
BINARY
COMMA
COM
COMT
DATREC
DB2
DBASE
DFIX
DHTML
DIF
DOC
EXL2K
EXL2KFORMULA
EXL2K PIVOT
EXL97
FLEX
FOCUS
GIF
HTML
HTMTABLE
INGRES
INTERNAL
JPEG
JSCHART
JSON
LOTUS
POSTSCRIPT(PS)
PPT
PPTX
REDBRICK
SQL
SQL_SCRIPT
SQLDBC
SQLINF
SQLMAC
SQLMSS
SQLODBC
SQLORA
SQLPSTGR
SQLSYB
SYLK
TAB
TABT
VISDIS
WK1
WP
XFOCUS
XLSX
XML
8. Saving and Reusing Your Report Output
Creating Reports With TIBCO® WebFOCUS Language 511

Reference: FORMAT AHTML
Description: Saves report output as an active report (HTML file that can be used for offlineanalysis and interactive functions without any connection to a server). All of the data andJavaScript code are stored within the HTML file, which also makes the output highlycompressible for email and transparent to security systems. For more information about activereports, see the Active Technologies User's Guide.
Use: For offline analysis of data.
Supported with the commands: HOLD, PCHOLD, SAVE.
Available in: WebFOCUS, FOCUS.
Reference: FORMAT AHTMLTAB
Description: Creates an output file that contains only data and parameters used in an HTMLactive report. The output produced is not a complete HTML active report. However, the file canbe included in another HTML document using the Dialogue Manager command -HTMLFORM.For details, see the documentation on Dialogue Manager in the TIBCO WebFOCUS® DevelopingReporting Applications manual.
Note: When issuing HOLD AS name FORMAT AHTMLTAB to embed an HTML active report intoanother HTML document, you must include Active Technologies JavaScript code into the HTMLBODY using:
<BODY>!IBI.OBJ.ACTIVEREPORTJS;
Use: For embedding HTML active reports into an existing HTML document.
Supported with the commands: HOLD, SAVE.
Available in: WebFOCUS.
Reference: FORMAT ALPHA
Description: Saves report output as fixed-format character data and can be created as a HOLDfile.
ALPHA is the default SAVE format. The output file contains data only.
Text fields are supported in ALPHA-formatted files. See Using Text Fields in Output Files onpage 547.
To control missing data characters that are propagated to fields with the MISSING=ONattribute, use the SET HNODATA command. For more information, see the TIBCO WebFOCUS®
Developing Reporting Applications manual.
Choosing Output File Formats
512

Use: For display in a text document. For further reporting in FOCUS, WebFOCUS, or App Studio.As a transaction file for modifying a data source.
Supported with the commands: HOLD, PCHOLD, SAVE.
Available in: WebFOCUS, FOCUS.
Reference: FORMAT APDF
Description: Saves report output as an Adobe® Flex® report (Adobe® Flash® file) embedded ina PDF file. The resulting PDF active report can be used for offline analysis and interactivefunctions without any connection to a server.
In order to run a report created using the APDF format, Adobe Reader 9 or higher is required sothe Flash run-time code included in the Acrobat client can render the Flash content.
Use: For offline analysis of data.
Supported with the command: HOLD, PCHOLD, SAVE.
Available in: FOCUS, WebFOCUS.
Reference: FORMAT BINARY
Description: Saves report data and stores numeric fields as binary numbers. When created asa HOLD file, also creates a Master File.
BINARY is the default format for HOLD files. When created in BINARY format:
The HOLD file is a sequential single-segment data source. The HOLD Master File is asubset of the original Master File, and may also contain fields that have been created usingthe COMPUTE or DEFINE commands or generated in an ACROSS phrase.
By default, fields with format I remain four-byte binary integers. Format F fields remain infour-byte floating-point format. Format D fields remain in eight-byte double-precision floating-point, and format P fields remain in packed decimal notation and occupy eight bytes (forfields less than or equal to eight bytes long) or 16 bytes (for packed decimal fields longerthan eight bytes). Alphanumeric fields (format A) are stored in character format.
Every data field in the sequential extract record is aligned on the start of a full four-byteword. Therefore, if the format is A1, the field is padded with three bytes of blanks on theright. This alignment makes it easier for user-coded subroutines to process these datafields. (Under some circumstances, you may wish to prevent the padding of integer andpacked decimal fields. Do so with HOLD FORMAT INTERNAL. See Saving Report Output inINTERNAL Format on page 558.)
The output file contains data only.
8. Saving and Reusing Your Report Output
Creating Reports With TIBCO® WebFOCUS Language 513
Use: For further reporting in FOCUS, WebFOCUS, or App Studio. As a transaction file formodifying a data source.
Supported with the commands: HOLD
Available in: WebFOCUS, FOCUS.
Reference: FORMAT COMMA
Description: Saves the data values as a variable-length text file, with fields separated bycommas and with character values enclosed in double quotation marks. All blanks within fieldsare retained. This format is the industry standard comma-delimited format.
This format does not have the safety feature of the double quote added within a text fieldcontaining a double quote.
The extension for this format is PRN. This format type does not create a Master File.
Note:
Smart date fields and dates formatted as I or P fields with date format options are treatedas numeric, and are not enclosed in double quotation marks in the output file. Datesformatted as alphanumeric fields with date format options are treated as alphanumeric,and enclosed in double quotation marks.
Continental decimal notation (CDN=ON|SPACE|QUOTE|QUOTEP) is not supported. A commawithin a number is interpreted as two separate columns by a destination application suchas Microsoft Access.
The output file contains data only.
Use: For further processing in a database application. This format type can be imported intoapplications such as Excel or Lotus.
Supported with the commands: HOLD, SAVE.
Available in: WebFOCUS, FOCUS.
Reference: FORMAT COM
Description: Saves the data values as a variable-length text file with fields separated bycommas and with character values enclosed in double quotation marks. Leading blanks areremoved from numeric fields, and trailing blanks are removed from character fields. To issue arequest against this data source, the setting PCOMMA=ON is required.
This format also includes a built-in safety feature, which allows embedded quotes withincharacter fields. A second double quote (") is inserted adjacent to the existing one. Forexample, if you input Joe "Smitty" Smith, the output is Joe ""Smitty"" Smith.
Choosing Output File Formats
514
The extension for this format is CSV. A Master File is created for this format type when thecommand used to create the output file is HOLD. The SUFFIX in the generated Master File isCOM.
Note:
Smart date fields and dates formatted as I or P fields with date format options are treatedas numeric, and are not enclosed in double quotation marks in the output file. Datesformatted as alphanumeric fields with date format options are treated as alphanumeric,and enclosed in double quotation marks.
Continental decimal notation (CDN=ON|SPACE|QUOTE|QUOTEP) is not supported. A commawithin a number is interpreted as two separate columns by a destination application suchas Microsoft Access.
To create a variable-length comma- or tab-delimited HOLD file that differentiates between amissing value and a blank string or zero value, use the SET NULL=ON command. For moreinformation, see the TIBCO WebFOCUS® Developing Reporting Applications manual.
Use: For further processing in a database application. This format type can be imported intoapplications such as Excel or Lotus.
Supported with the commands: HOLD, SAVE, PCHOLD.
Available in: WebFOCUS, FOCUS.
Reference: FORMAT COMT
Description: Saves the column headings in the first row of the output file. It produces avariable-length text file with fields separated by commas, and with character values enclosed indouble quotation marks. Leading blanks are removed from numeric fields, and trailing blanksare removed from character fields. This format is required by certain software packages suchas Microsoft Access.
This format also includes a built-in safety feature, which allows embedded quotes withincharacter fields. A second double quote (") is inserted adjacent to the existing one. Forexample, if you input Joe "Smitty" Smith, the output is Joe ""Smitty"" Smith.
The extension for this format is CSV. A Master File is created for this format type when thecommand used to create the output file is HOLD. The SUFFIX in the generated Master File isCOMT.
8. Saving and Reusing Your Report Output
Creating Reports With TIBCO® WebFOCUS Language 515

Note:
Smart date fields and dates formatted as I or P fields with date format options are treatedas numeric, and are not enclosed in double quotation marks in the output file. Datesformatted as alphanumeric fields with date format options are treated as alphanumeric,and enclosed in double quotation marks.
Continental decimal notation (CDN=ON|SPACE|QUOTE|QUOTEP) is not supported. A commawithin a number is interpreted as two separate columns by a destination application suchas Microsoft Access.
To create a variable-length comma- or tab-delimited HOLD file that differentiates between amissing value and a blank string or zero value, use the SET NULL=ON command. For moreinformation, see the TIBCO WebFOCUS® Developing Reporting Applications manual.
Use: For further processing in a database application. This format type can be imported intoapplications such as Excel or Lotus.
Supported with the commands: HOLD, SAVE, PCHOLD.
Available in: FOCUS, WebFOCUS.
Reference: FORMAT DATREC
Description: Saves report output as a sequential file with a Master File, and stores numericfields as binary numbers without aligning them on fullword boundaries. The last field consistsof one byte for each of the other fields in the Master File that indicates whether thecorresponding field is missing.
Use: For further reporting in FOCUS, WebFOCUS, or App Studio. As a transaction file formodifying a data source.
Supported with the command: HOLD.
Available in: WebFOCUS, FOCUS.
Reference: FORMAT DB2
Description: Creates a Db2 table, if you have the Adapter for Db2 and permission to createtables.
Use: For further processing in a database application.
Supported with the command: HOLD.
Available in: WebFOCUS, FOCUS.
Choosing Output File Formats
516

Reference: FORMAT DBASE
Description: Creates an extract file in dBase format that includes column headings in the firstrow.
Note: Blank field names display as blank column titles. This may result in an error whenattempting to use the file as input to various applications.
Use: For importing data to Windows-based applications such as MS Access and Excel.
Supported with the command: HOLD.
Available in: App Studio.
Reference: FORMAT DFIX
Description: Creates a delimited output file. You can specify the delimiter, whetheralphanumeric fields should be enclosed within a special character such as a double quotationmark, and whether the file should be generated with a header record containing the fieldnames.
For more information, see Creating a Delimited Sequential File on page 549.
Use: For importing data to Windows-based applications such as MS Access and Excel.
Supported with the command: HOLD, PCHOLD.
Available in: WebFOCUS, FOCUS.
Reference: FORMAT DHTML
Description: Provides HTML output that has most of the features normally associated withoutput formatted for printing such as PDF or PostScript output. You can create an HTML file(.htm) or a Web Archive file (.mht). The type of output file produced is controlled by the value ofthe HTMLARCHIVE parameter. HTMLARCHIVE=ON creates a Web Archive file.
Some of the features supported by format DHTML are:
Absolute positioning. DHTML precisely places text and images inside an HTML report,allowing you to use the same StyleSheet syntax to lay out HTML as you use for PDF or PSoutput.
On demand paging. On demand paging is available with SET HTMLARCHIVE=OFF.
PDF StyleSheet features. For example, the following features are supported: grids,background colors, OVER, bursting, coordinated compound reports.
8. Saving and Reusing Your Report Output
Creating Reports With TIBCO® WebFOCUS Language 517

Note:
The font map file for DHTML reports is dhtml.fmp.
Legacy compound reports are not supported.
Drillthrough reports are not supported.
Use: For display as a webpage.
Supported with the commands: HOLD, PCHOLD, SAVE.
Available in: WebFOCUS, FOCUS.
Reference: FORMAT DIF
Description: Captures the entire report output, excluding headings, footings, subheads, andsubfoots, and creates a character file that can be easily incorporated into most spreadsheetpackages.
For example, running a TABLE request with HEADING/FOOTING and ON TABLE PCHOLDFORMAT DIF does not display the report output with headings and footings. As a workaround,use another format (such as HTML, PDF, or EXL2K).
Note: Microsoft Excel SR-1 is no longer supported for HOLD FORMAT DIF. To open thesereports, use either Microsoft Excel SR-2 or Microsoft Excel 2000.
Use: For display or processing in a spreadsheet application.
Supported with the commands: HOLD, PCHOLD, SAVE.
The PCHOLD variation transfers the data from a web server to a browser.
Available in: WebFOCUS, FOCUS.
Reference: FORMAT DOC
Description: Captures the entire report output, including headings, footings, and subtotals,and creates a text file with layout and line breaks that can be easily incorporated into mostword processing packages. DOC format uses a form-feed character to indicate page controlinformation.
Note: A request that contains ON TABLE PCHOLD FORMAT DOC results in a blank first page inthe report when displayed in Microsoft XP Office. To eliminate this, include SET PAGE=NOPAGEin your request.
Use: For display in a text document.
Supported with the commands: HOLD, PCHOLD, SAVE.
Choosing Output File Formats
518

The PCHOLD variation transfers the data from a web server to a browser.
Available in: WebFOCUS, FOCUS.
Reference: FORMAT XLSX
Description: Generates fully styled reports in Excel 2007 XML format. You must haveExcel 2007 or higher installed to use this output format. For details, see Choosing a DisplayFormat on page 575.
An Excel 2007 worksheet can contain 1,048,576 rows by 16,384 columns. WebFOCUS willgenerate worksheets larger than these defined limits, but Excel 2007 will have difficultyopening the resulting workbook, and the data that exceeds the Excel 2007 limits will betruncated.
For information about creating overflow worksheets for the additional rows when the number ofrows becomes too high for a single worksheet, see Overcoming the Excel 2007/2010 RowLimit Using Overflow Worksheets on page 715.
Use: For display or processing in a spreadsheet application.
Supported with the commands: HOLD, PCHOLD, SAVE.
For Internet Explorer, the PCHOLD variation launches Excel 2007 in the browser. For details,and for information about working with XLSX files, see Choosing a Display Format on page575.
Available in: WebFOCUS.
Reference: FORMAT EXL2K
Description: Generates fully styled reports in Excel 2000 HTML format. You must have Excel2000 installed to use this output format. For details, see Choosing a Display Format on page575.
ACROSS column titles are supported for EXL2K output format.
For EXL2K output format, a report can include 65,536 rows and/or 256 columns. Rows andcolumns in excess of these limits are truncated from the worksheet when opened in Excel.
For information about creating overflow worksheets for the additional rows when the number ofrows becomes too high for a single worksheet, see Overcoming the Excel 2007/2010 RowLimit Using Overflow Worksheets on page 715.
Use: For display or processing in a spreadsheet application.
Supported with the commands: HOLD, PCHOLD, SAVE.
8. Saving and Reusing Your Report Output
Creating Reports With TIBCO® WebFOCUS Language 519

For Internet Explorer, the PCHOLD variation launches Excel 2000 in the browser. For details,and for information about working with EXL2K files, see Choosing a Display Format on page575.
Available in: WebFOCUS.
Reference: FORMAT EXL2K FORMULA
Description: Specifies that the report will be displayed as an Excel 2000 spreadsheet, withWebFOCUS totals and other calculated values translated to active Excel formulas. For details,see Choosing a Display Format on page 575.
Use: For display or processing in a spreadsheet application.
Supported with the commands: HOLD, PCHOLD, SAVE.
Available in: WebFOCUS, FOCUS.
Reference: FORMAT EXL2K PIVOT
Description: Generates fully styled reports in Excel 2000 HTML format, with added pivotingcapabilities. Requires Excel 2000 on your PC. For details, see Choosing a Display Format onpage 575.
Use: For display or processing in a spreadsheet application.
Supported with the commands: HOLD, PCHOLD, SAVE.
For Internet Explorer, the PCHOLD variation transfers the data from a web server to a browser,which launches Excel 2000.
Available in: WebFOCUS, FOCUS.
Reference: FORMAT EXL97
Description: Enables you to view and save reports in Excel 97 that include full styling. Fordetails on working with Excel formats, see Choosing a Display Format on page 575.
Leading zeros do not display for FORMAT EXL97.
Use: For display or processing in a spreadsheet application.
Supported with the command: HOLD, PCHOLD, SAVE.
Available in: FOCUS, WebFOCUS.
Choosing Output File Formats
520

Reference: FORMAT FLEX
Description: Saves report output as an active report in an Adobe Flash player compatible (.swf)file that can be used for offline analysis and interactive functions without any connection to aserver. Internet Explorer, Mozilla Firefox, and Opera internet browsers recognize an activereport in the Adobe Flex format as a Shockwave Flash Object.
In order to run a report created using the Active Technologies for Adobe Flash player (FLEX)format, Adobe Flash Player 9.0.28 or higher is required.
Use: For offline analysis of data.
Supported with the command: HOLD, SAVE.
Available in: FOCUS, WebFOCUS.
Reference: FORMAT FOCUS
Description: Creates a FOCUS data source. Four files result: a HOLD data file, a HOLD MasterFile, and two work files. See Holding Report Output in TIBCO FOCUS Format on page 479.
Text fields are supported for FOCUS output files. See Using Text Fields in Output Files on page547.
Use: For further processing in a database application.
Supported with the command: HOLD.
Available in: WebFOCUS, FOCUS.
Reference: FORMAT GIF
Description: Saves the output of a graph request as a GIF file.
Use: The resulting GIF file can be embedded in the heading/footing or body of a PDF or HTMLreport. This technique is useful when you want to create a single PDF or HTML report thatcontains multiple outputs, such as output from a TABLE request and a GRAPH request. Youcan distribute this type of report using ReportCaster.
When running graphs in GIF format on a UNIX platform with the HEADLESS configuration, thegraph may not display properly. You may see a red X instead of your image. This is due toSun's methodology of creating images without a head, which does not currently support GIFgraphics.
Supported with the commands: HOLD.
Available in: WebFOCUS.
8. Saving and Reusing Your Report Output
Creating Reports With TIBCO® WebFOCUS Language 521

For details see Creating a Graph on page 1745.
Reference: FORMAT HTML
Description: Creates a complete HTML document that can be viewed in a web browser. ThePCHOLD variation transfers the data from a web server to a browser.
The following StyleSheet features are supported with HTML: JAVASCRIPT (drill down toJavaScript), TARGET, COLSPAN, HEADALIGN, IMAGEALIGN, IMAGEBREAK, GUTTER,BACKIMAGE, BACKCOLOR, IMAGE, GRIDS.
Use: For display as a webpage.
Supported with the commands: HOLD, PCHOLD, SAVE.
Available in: WebFOCUS, FOCUS.
Reference: FORMAT HTMTABLE
Description: Creates an output file that contains only an HTML table. The output produced isnot a complete HTML document.
However, the file can be included in another HTML document using the Dialogue Managercommand -HTMLFORM. For details see the documentation on Dialogue Manager in the TIBCOWebFOCUS® Developing Reporting Applications manual.
Note: When issuing HOLD AS name FORMAT HTMTABLE, you must specify a different namethan the .htm filename used in the -HTMLFORM name.
The following StyleSheet features are supported with HTML: JAVASCRIPT (drill down toJavaScript), TARGET, COLSPAN, HEADALIGN, IMAGEALIGN, IMAGEBREAK, BACKCOLOR, IMAGE,GRIDS.
Internal cascading style sheets (CSS) are supported for FORMAT HTMTABLE. The CSS code isplaced immediately before the TABLE command.
Use: For embedding reports and graphs in an existing HTML document.
Supported with the commands: HOLD, PCHOLD, SAVE.
The PCHOLD variation also transfers the data from a web server to a browser.
Available in: WebFOCUS, FOCUS.
Reference: FORMAT INGRES
Description: Creates an Ingres table, if you have the Adapter for Ingres and permission tocreate tables.
Choosing Output File Formats
522

Use: For further processing in a database application.
Supported with the command: HOLD.
Available in: WebFOCUS, FOCUS when used as a client to the WebFOCUS Reporting Server.
Reference: FORMAT INTERNAL
Description: Saves report output without padding the values of integer and packed fields. See Saving Report Output in INTERNAL Format on page 558.
Use: For accurate processing by 3GL programs.
Supported with the command: HOLD, SAVB.
Available in: WebFOCUS, FOCUS.
Reference: FORMAT JPEG
Description: Saves the output of a graph request as a JPEG file.
Use: The resulting JPEG file can be embedded in the heading/footing or body of a PDF or HTMLreport. This technique is useful when you want to create a single PDF or HTML report thatcontains multiple outputs, such as output from a TABLE request and a GRAPH request. Youcan distribute this type of report using ReportCaster. JPEG (.jpg) files behave the same as GIFfiles.
Note: For JPEG files, only the .jpg extension is supported. The .jpeg extension is notsupported.
Supported with the commands: HOLD.
Available in: WebFOCUS.
For details, see Linking From a Graphic Image on page 870 and Adding an Image to a Reporton page 1464.
Reference: FORMAT JSCHART
Description: Saves the output of a graph request as an HTML5 graph.
Use: The charts are rendered in the browser as high quality interactive vector graphics using abuilt-in JavaScript engine. Note that older browsers do not support all of the features of theHTML5 standard. You must include the following command to create an HTML5 graph:
ON GRAPH PCHOLD FORMAT JSCHART
8. Saving and Reusing Your Report Output
Creating Reports With TIBCO® WebFOCUS Language 523

Supported with the commands: ON GRAPH PCHOLD, ON GRAPH HOLD.
Available in: WebFOCUS.
For details, see Creating an HTML5 Graph on page 1749.
Reference: FORMAT JSON
Description: JSON (JavaScript Object Notation) is a plain text format that consists of name:value pairs and is based on JavaScript. It can be parsed by many types of software and it oftenused for storing and exchanging data. The field names and values in a report request can beheld in a FORMAT JSON file. Subtotals, headings, footings, and ACROSS fields are notpropagated to the HOLD file. A synonym is generated for the HOLD file. Adding the syntaxSTRUCTURE HIERARCHY to the HOLD command generates a JSON output file that identifiesthe sort fields and display fields in the request.
Use: For data interchange between systems and applications.
Supported with the commands: HOLD, PCHOLD
Available in: WebFOCUS, FOCUS
Reference: FORMAT LOTUS
Description: Captures all the columns of the report in a character file that LOTUS 1-2-3 canthen import. All alphanumeric fields are enclosed in quotation marks. Columns are separatedby commas.
Use: For display and processing in a spreadsheet application.
Supported with the commands: HOLD, PCHOLD, SAVE (WebFOCUS only).
Available in: WebFOCUS, FOCUS.
Reference: FORMAT PDF
Description: Saves the report output in Adobe Portable Document Format (PDF), which enablesprecise placement of output (all formatting options such as headings, footings, and titles)correctly aligned on the physical page, so the report looks exactly as it does when printed.
In WebFOCUS, PDF format also supports StyleSheets that contain drill down parameters, linksto arbitrary URLs, and embedded GIF or JPEG images in report, page, and sort headings andfootings.
Choosing Output File Formats
524

PDF format does not support OLAP reports since Java applets cannot be embedded inside PDFdocuments. However, an OLAP report can drill down to a PDF-formatted report. PDF does notsupport drill downs when sorting across column. When you drill down from one report toanother report, do not use the following characters: + (plus sign); # (number sign); &(ampersand); \ (backslash).
A PDF object is a page, hyperlink, or image. The Portable Document Format (PDF) limits thenumber of objects that a PDF document can contain. WebFOCUS imposes the following objectlimits for each PDF report:
Object Limit
Pages 10,000
Images 900
Hyperlinks per page 500
Total pages with hyperlinks 100
Total hyperlinks 44,500
PDF format retains all formatting options, such as a headings, footings, and titles.
The following fonts are supported: Courier (fixed width), Times (proportional width), andHelvetica (proportional width). PDF format maps all fonts to Courier, Helvetica, or Times. Thefont styles that can be used are Normal (default), Bold, Italic, Underline, and combinations ofthese.
The following StyleSheet features are supported with PDF: PAGESIZE, ORIENTATION, UNITS,TOPMARGIN, BOTTOMMARGIN, LEFTMARGIN, RIGHTMARGIN, POSITION, SQUEEZE, FOCEXEC(drill down to FOCEXEC), URL (drill down to URL), HGRID, VGRID, BACKCOLOR. Note when youuse BACKCOLOR with PDF reports, extra space is added to the top, bottom, right, and left ofeach cell of data in the report. This is for readability and to prevent data truncation.
Use: For display as a printed document.
Supported with the commands: HOLD, PCHOLD, SAVE (WebFOCUS only).
Available in: WebFOCUS, FOCUS.
Reference: FORMAT PDF OPEN/CLOSE
Description: Saves multiple reports into one PDF report.
8. Saving and Reusing Your Report Output
Creating Reports With TIBCO® WebFOCUS Language 525

Use: For combining multiple reports into a single PDF file, also known as a compound report.For complete details, see Laying Out the Report Page on page 1333.
Supported with the command: PCHOLD.
Available in: WebFOCUS, FOCUS
Reference: FORMAT POSTSCRIPT (PS)
Description: Creates an output file in PostScript format, which supports headings, footings,and totals.
PS is an abbreviation for POSTSCRIPT.
PostScript format supports headings, footings, and totals. PS supports ISO Latin fontencoding.
Use: For display as a printed document.
Supported with the command: HOLD, PCHOLD.
Available in: WebFOCUS, FOCUS.
Reference: FORMAT PPT
Description: Creates an output file in PowerPoint® format in which each page of report outputbecomes a separate slide in the file with all styling applied.
Use: For use in a slide presentation.
Supported with the command: HOLD, SAVE.
Available in: WebFOCUS, FOCUS.
Reference: FORMAT PPTX
Description: Creates an output file in PowerPoint format in which each page of report outputbecomes a separate slide in the file with all styling applied.
Use: For use in a slide presentation.
Supported with the command: HOLD, SAVE.
Available in: WebFOCUS, FOCUS.
Reference: FORMAT REDBRICK
Description: Creates a Red Brick table, if you have the Adapter for Red Brick and permission tocreate tables.
Choosing Output File Formats
526
Use: For further processing in a database application.
Supported with the command: HOLD.
Available in: WebFOCUS, FOCUS when used as a client to the WebFOCUS Reporting Server.
Reference: FORMAT SQL_SCRIPT
Description: Creates an SQL subquery file or a file of data values with a correspondingsynonym.
When used in a request against a relational data source, the HOLD FORMAT SQL_SCRIPTcommand generates the SQL SELECT statement needed to execute the current query. It thenstores it in the application folder as a file with a .sql extension, along with the Master andAccess File pair that describes the SQL answer set.
When used in a request against any other type of data source, the HOLD FORMAT SQL_SCRIPTcommand executes the current query and stores the retrieved values in the application folderas a sequential file with a .ftm extension, along with the Master File that describes theretrieved data.
Use: You can use the output from HOLD FORMAT SQL_SCRIPT as the target file for theDB_INFILE function. For information about the DB_INFILE function, see the TIBCO WebFOCUS®
Using Functions manual.
Supported with the command: HOLD.
Available in: WebFOCUS, FOCUS.
Reference: FORMAT SQLDBC
Description: Creates a Teradata table, if you have the Adapter for Teradata and permission tocreate tables.
Use: For processing in a database application.
Supported with the command: HOLD.
Available in: WebFOCUS, FOCUS.
Reference: FORMAT SQLINF
Description: Creates an Informix table, if you have the Adapter for Informix and permission tocreate tables.
Use: For processing in a database application.
Supported with the command: HOLD.
8. Saving and Reusing Your Report Output
Creating Reports With TIBCO® WebFOCUS Language 527

Available in: WebFOCUS, FOCUS when used as a client to the WebFOCUS Reporting Server.
Reference: FORMAT SQLMAC
Description: Creates a Microsoft Access table, if you have the Adapter for Microsoft Accessand permission to create tables.
Use: For processing in a database application.
Supported with the command: HOLD.
Available in: WebFOCUS.
Reference: FORMAT SQLMSS
Description: Creates a Microsoft SQL Server table, if you have the Adapter for Microsoft SQLand permission to create tables.
Use: For processing in a database application.
Supported with the command: HOLD.
Available in: WebFOCUS, FOCUS when used as a client to the WebFOCUS Reporting Server.
Reference: FORMAT SQLODBC
Description: Creates an SQLODBC table if you have the current Adapter for ODBC andpermission to create tables.
Use: For processing in a database application.
Supported with the command: HOLD.
Available in: WebFOCUS, FOCUS when used as a client to the WebFOCUS Reporting Server.
Reference: FORMAT SQLORA
Description: Creates an Oracle table, if you have the Adapter for Oracle and permission tocreate tables.
Use: For processing in a database application.
Supported with the command: HOLD.
Available in: WebFOCUS, FOCUS.
Reference: FORMAT SQLPSTGR
Description: Creates a PostgreSQL table, if you have the Adapter for PostgreSQL andpermission to create tables.
Choosing Output File Formats
528

Use: For processing in a database application.
Supported with the command: HOLD.
Available in: WebFOCUS, FOCUS when used as a client to the WebFOCUS Reporting Server.
Reference: FORMAT SQLSYB
Description: Creates a Sybase table, if you have the Adapter for Sybase and permission tocreate tables.
Use: For processing in a database application.
Supported with the command: HOLD.
Available in: WebFOCUS, FOCUS when used as a client to the WebFOCUS Reporting Server.
Reference: FORMAT SYLK
Description: Captures all the columns of the report request in a character file for Microsoft'sspreadsheet program Multiplan. The generated file cannot have more than 9,999 rows.
Use: For display and processing in a spreadsheet application.
Supported with the command: HOLD, SAVE.
Available in: WebFOCUS, FOCUS.
Reference: FORMAT TAB
Description: Creates an output file in tab-delimited format. The TAB format includes a built-insafety feature, which allows embedded quotes within character fields. A second double quote(") is inserted adjacent to the existing one. For example, if you input Joe "Smitty" Smith, theoutput is Joe ""Smitty"" Smith. The TAB format also includes the following features:
All trailing blanks are stripped from alpha [An] fields.
All leading blanks are stripped from numeric [/Dx.y, /Fx.y, /Px.y, and /In] fields.
There is a 32K record length limit in the output file.
A Master File is created when the HOLD command is used to create the output file. TheMaster File behaves exactly as in FORMAT ALPHA, except for the inclusion of doublequotes.
Note: To create a variable-length comma- or tab-delimited HOLD file that differentiates betweena missing value and a blank string or zero value, use the SET NULL=ON command. For moreinformation, see the TIBCO WebFOCUS® Developing Reporting Applications manual.
Use: For importing data to Windows-based applications such as MS Access and Excel.
8. Saving and Reusing Your Report Output
Creating Reports With TIBCO® WebFOCUS Language 529
Supported with the command: HOLD, SAVE, PCHOLD.
Available in: WebFOCUS, FOCUS.
Reference: FORMAT TABT
Description: Creates an output file in tab-delimited format that includes column headings inthe first row. The TABT format includes a built-in safety feature, which allows embedded quoteswithin character fields. A second double quote (") is inserted adjacent to the existing one. Forexample, if you input Joe "Smitty" Smith, the output is Joe ""Smitty"" Smith. The TABT formatalso includes the following features:
The first row contains field names.
All trailing blanks are stripped from alpha [An] fields.
All leading blanks are stripped from numeric [/Dx.y, /Fx.y, /Px.y, and /In] fields.
There is a 32K record length limit in the output file.
A Master File is created when the HOLD command is used to create the output file. TheMaster File behaves exactly as in FORMAT ALPHA, except for the inclusion of doublequotes.
Note:
Blank field names display as blank column titles. This may result in an error whenattempting to use the file as input to various applications.
To create a variable-length comma- or tab-delimited HOLD file that differentiates between amissing value and a blank string or zero value, use the SET NULL=ON command. For moreinformation, see the TIBCO WebFOCUS® Developing Reporting Applications manual.
Use: For importing data to Windows-based applications such as MS Access and Excel.
Supported with the command: HOLD, SAVE, PCHOLD.
Available in: WebFOCUS, FOCUS.
Choosing Output File Formats
530

Reference: FORMAT VISDIS
Description: WebFOCUS has a data visualization tool called Visual Discovery that createsgraphs using a tab-delimited data file as input. The first record of the data file contains thecolumn titles for the data values. The next record can contain the Visual Discovery fieldformats. If this record is not present, Visual Discovery attempts to determine the formats ofthe data fields by reading the first 50 records from the data file, a process that is notguaranteed to create accurate representations of the WebFOCUS formats.
The following table identifies format conversions for HOLD FORMAT VISDIS:
FOCUS Format Visual Discovery Format
Integer I
Decimal/Packed R
Alphanumeric S
Date format (smart date) D%format%format%format (for example, D%Y%M%D). If the year is not a four-digityear, the format returned is S.
Other S
Note: No Master File is created for format VISDIS.
Use: HOLD FORMAT VISDIS creates a tab-delimited output file with the extension .txt in whichthe first record has the column titles and the second record contains Visual Discovery formatsbased on the FOCUS field formats of the data.
Supported with the command: HOLD, SAVE, PCHOLD
Available in: WebFOCUS, FOCUS.
Reference: FORMAT WK1
Description: Captures all the columns of the report in a character file that LOTUS 1-2-3Release 2 can then import.
Use: For display and processing in a spreadsheet application.
Supported with the commands: HOLD, PCHOLD.
Available in: App Studio.
8. Saving and Reusing Your Report Output
Creating Reports With TIBCO® WebFOCUS Language 531

Reference: FORMAT WP
Description: Captures the entire report output, including headings, footings, and subtotals,and creates a text file that can easily be incorporated into most word processing packages.
Text fields are supported in WP format. See Using Text Fields in Output Files on page 547.
To control whether a carriage control character is included in column 1 of each page of thereport output, use:
[ON TABLE] HOLD AS filename FORMAT WP [CC|NOCC]
NOCC excludes carriage control characters. The position reserved for those characters remainsin the file, but is blank. CC includes carriage control characters and, in z/OS, creates theHOLD file with RECFM VBA. To include page control information in the WP file, you can alsospecify the TABPAGENO option in a heading or the SET PAGE=OFF command. The character 1in the column 1 indicates the start of a new page.
The following rules summarize FORMAT WP carriage control options:
The CC option always inserts the carriage control character.
The NOCC option always omits the carriage control character.
When you issue HOLD FORMAT WP without the CC or NOCC option:
SET PAGE NUM=OFF and SET PAGE NUM=TOP always insert the carriage controlcharacter.
SET PAGE NUM=NOPAGE always omits the carriage control character.
SET PAGE NUM=ON inserts the carriage control character if TABPAGENO is included inthe heading and omits the carriage control character if TABPAGENO is not included inthe heading.
Tip: HOLD FORMAT WP does not change the number of lines per page. In order to do so, issueone or a combination of the commands SET PRINT=OFFLINE, SET SCREEN=PAPER, or SETSCREEN=OFF.
The WP file is created with a record format of VB in z/OS when the carriage control character isomitted and with a record format of VBA when the carriage control character is inserted.
The maximum record length for HOLD FORMAT WP is 358 characters, 356 of which canrepresent data. For larger output, use PCHOLD FORMAT WP.
Choosing Output File Formats
532

If you need the report width to remain fixed across releases for later processing of the outputfile, you can set the width you need using the SET WPMINWIDTH command. This parameterspecifies the minimum width of the output file. It will be automatically increased if the widthyou set cannot accommodate the fields propagated to the output file in the request. TheLRECL of the output file will be four bytes more than the report width on z/OS because the fileis variable length and needs an additional four bytes to hold the actual length of each recordinstance. In other operating environments, the length of the record is the value ofWPMIDWIDTH.
FORMAT WP retains headings, footings, and subtotals.
Use: For display in a text document.
Supported with the commands: HOLD, PCHOLD, SAVE.
Available in: WebFOCUS, FOCUS.
Reference: FORMAT XFOCUS
Description: Creates an XFOCUS data source.
Use: For further processing in a database application.
Supported with the command: HOLD.
Available in: WebFOCUS, FOCUS.
Reference: FORMAT XML
Description: Creates an XML output file based on an internal DTD that includes the rows thatare displayed in the final report output. It does not honor the HOLDLIST setting. It does nothonor the ASNAMES setting. The parameter HOLDATTRS ON is automatically invoked. The XMLfile generated is based on the structure and layout of the report request. The metadataincluded in the DTD for each column is FIELDNAME, ALIAS, data type, width, FOCUS format,DESCRIPTION, ACCEPTS, HELP_MESSAGE, TITLE, WITHIN, PROPERTY, REFERENCE, VALIGN,and column title. FORMAT XML does not create a Master File.
Note: When using an HTML Autoprompt page (select Run in new Window option), BI Portal, oran HTML page created with HTML canvas, browsers running in Standards Mode displayingoutput in an iframe do not display XML. When running a WebFOCUS request with PCHOLDFORMAT XML, the result will display in a new window.
Use: For further processing.
Supported with the command: HOLD, PCHOLD.
8. Saving and Reusing Your Report Output
Creating Reports With TIBCO® WebFOCUS Language 533
Available in: WebFOCUS, FOCUS.
Merging Data Into an Existing Data Source With ON TABLE MERGE
The ON TABLE MERGE clause in a TABLE or TABLEF command enables you to insert, update,and delete records in an existing single-segment data source.
Data sources that support insert, update, and delete operations, either for individual recordsor bulk load, can take advantage of the full set of options for ON TABLE MERGE. Relationaldata sources support all of these options. Other data sources, such as delimited and fixedformat sequential data sources, can only have records appended to the existing data source.
Reference: ON TABLE MERGE Processing
An ON TABLE MERGE request consists of two sections.
A TABLE or TABLEF request that retrieves the data from the source file to be merged intothe target file.
All TABLE syntax is supported, from any type of data source that has an accompanyingsynonym. The request can include joins, DEFINEs, COMPUTEs, and any other supportedsyntax. The records retrieved are either passed directly to a Relational DBMS in an SQLrequest (when the request can be optimized), loaded using the SQL MERGE command(when the request cannot be optimized but the database supports the SQL MERGEcommand), or stored in an internally-generated HOLD file that is used as the input to aMODIFY request.
An ON TABLE MERGE clause that specifies the existing target data source for the merge,the UPDATE, DELETE, or INSERT commands, and the calculations of the field values to beupdated or inserted.
The target must be a single-segment file with a corresponding synonym, and it must have aWrite Adapter that enables WebFOCUS to update it.
Supported Merge Phrases
MATCHING expression. Specifies the expression that selects the source and targetrecords to be passed to the UPDATE, DELETE, or INSERT commands. If records are only tobe appended, no MATCHING phrase is used.
WHEN MATCHED [AND expression] UPDATE. Updates matching records. Optionally,provides an additional expression that can be used to perform different updates to differentsets of target records. To perform multiple sets of updates, include multiple WHENMATCHED UPDATE phrases.
Merging Data Into an Existing Data Source With ON TABLE MERGE
534

The new target field values are calculated using expressions specified following the WHENMATCHED UPDATE phrase.
WHEN MATCHED [AND expression] DELETE. Deletes matching records. Optionally,provides an additional expression that can be used to delete multiple sets of targetrecords. To delete multiple sets of records, include multiple WHEN MATCHED DELETEphrases.
WHEN NOT MATCHED INSERT. Is used to insert new records when no field values satisfythe MATCHING expression.
The new target field values are calculated using expressions specified following the WHENNOT MATCHED INSERT phrase.
INSERT. When there is no MATCHING phrase and no WHEN NOT MATCHED phrase, INSERTis used to append new records.
The new target field values are calculated using expressions specified following the INSERTphrase.
Properties of the Generated MERGE Request
The merge request can be generated in several ways.
Optimized request. If the source and target are in the same database (have the samesuffix and use the same connection), and MERGE (or INSERT from SELECT, for INSERT) issupported by the DBMS, the whole request passed to the DBMS in an SQL request.
With an optimized request, the MATCHING expression can be any expression, and if anyrecord fails in the merge request, the entire merge is rejected.
Non-Optimized request. If for any reason, the request cannot be optimized, for example ifthe target and source are from different databases or use different connections, or, if theTABLE request contains syntax that cannot be optimized, one of the following methods isused to do the merge.
If the target database supports bulk load into a temporary table, and also supportsMERGE, then the data is loaded using bulk load into the target database as a temporarytable, and the target table is updated using the SQL MERGE command with thetemporary table as input.
If the target database supports MERGE but not bulk load, then the data will be loadedon a record-by-record basis, one request per record. This is more efficient than using aMODIFY request (which happens if the target database does not support MERGE), asMODIFY uses two requests per record (SELECT+INSERT or SELECT+UPDATE).
8. Saving and Reusing Your Report Output
Creating Reports With TIBCO® WebFOCUS Language 535

If the target database does not support MERGE, a HOLD file of the values retrieved bythe TABLE request is generated in DATREC (fast binary) format.
With a DATREC HOLD file, the processing is done by a simple MODIFY request. TheMATCHING expression must match on all key fields, and processing is done on a record-by-record basis, so if a record fails the merge request, the request continues with thenext record.
No logs are generated for an ON TABLE MERGE request. Therefore, when working withproduction files, creating a backup of the source file prior to running the request isrecommended. At the end of the merge processing, messages are generated that indicate ifthe merge was successful and how many records were affected. The following image shows anexample of the messages displayed for an optimized request.
The following image shows an example of the messages displayed for a non-optimized request.
If not all records were processed and you want to know which records were rejected, you musteither enable traces or look in the Session Log.
Merging Data Into an Existing Data Source With ON TABLE MERGE
536

Syntax: How to Merge Data Into an Existing Data Source With ON TABLE MERGE
In the following syntax, at least one UPDATE, DELETE, or INSERT command must be supplied.Multiple UPDATE and DELETE commands are supported, when multiple expressions provideseparate update or delete conditions and target field values.
{TABLEF|TABLE} FILE ... ON TABLE MERGE INTO FILE target_mf[MATCHING matching_expression;] [ WHEN MATCHED [AND matching_expression2;] UPDATE target_field1=expression1; target_field2=expression2; ... ... ]
[ WHEN MATCHED [AND matching_expression3;] DELETE ...]
[ [WHEN NOT MATCHED] INSERT target_field3=expression3; target_field4=expression4; ...]END
where:
target_mf
Is the name of the Master File for the target data source that is to be updated.
MATCHING matching_expression
Is the expression to match in order to apply the INSERT, UPDATE, and DELETE commands.The expression can be complex. For a non-optimized request, where the merge isperformed by a MODIFY procedure, all key fields must be matched in the expression. Omitthis phrase when using the INSERT command to append records. If the field names are thesame in the source and target files, use the prefix SRC. to reference fields in the sourcefile, and the prefix TRG. to reference fields in the target file.
matching_expression2
Is an additional expression to match in order to apply the UPDATE command. If the fieldnames are the same in the source and target files, use the prefix SRC. to reference fieldsin the source file, and the prefix TRG. to reference fields in the target file.
8. Saving and Reusing Your Report Output
Creating Reports With TIBCO® WebFOCUS Language 537

target_field1, target_field2 ...
Are one or more fields to be updated in the target data source.
expression1, expression2
Are expressions used to calculate the target field values to be used for updating theexisting target field values. These expressions can use fields from the TABLE request andthe target data source. If the field names are the same in the source and target files, usethe prefix SRC. to reference fields in the source file, and the prefix TRG. to reference fieldsin the target file.
matching_expression3
Is an additional expression to match in order to apply the DELETE command. If the fieldnames are the same in the source and target files, use the prefix SRC. to reference fieldsin the source file, and the prefix TRG. to reference fields in the target file.
target_field3, target_field4 ...Are the target field values for the new record to be inserted when the value ofmatching_expression is not found in the target data source.
expression3, expression4, expression5
Are expressions used to calculate the target field values to be used for inserting the newrecord. These expressions can use fields from the TABLE request. Use the prefix SRC. toreference these fields.
Merging Data Into an Existing Data Source With ON TABLE MERGE
538

Example: Updating and Inserting Records Using ON TABLE MERGE
This example uses source and target data sources from the TIBCO® Data Migrator - Generaltutorial. To access the tutorial, click the New button (+) on the Applications page ribbon andclick Tutorials, or right-click an application folder, point to New, and click Tutorials. Scroll downto the Data Migrator - General tutorial. Select or enter values for the DBMS, Connection, prefix,and application, and click Create.
The following request updates records in the table dmrpts from records in the table dminv,when the field value PROD_NUM in dminv (SRC.PROD_NUM) matches the field valuePROD_NUM in dmrpts (TRG.PROD_NUM). When the PROD_NUM fields do not match, recordsare inserted.
TABLE FILE dminv PRINT PROD_NUM COMPUTE QUANTITY = SUM.QTY_IN_STOCK; COMPUTE LINEPRICE = SUM.PRICE; COMPUTE LINECOST = SUM.COST; COMPUTE LINECOGS = LINECOST * QUANTITY;
ON TABLE MERGE INTO FILE dmrptsMATCHING TRG.PROD_NUM EQ SRC.PROD_NUM; WHEN MATCHED UPDATE QUANTITY=SRC.QUANTITY; YRMTH = TRG.YRMTH+1; LINEPRICE=SRC.LINEPRICE; LINECOGS=SRC.LINECOGS; PROFIT=SRC.LINECOGS - SRC.LINECOST; WHEN NOT MATCHED INSERT STORE_CODE='1004NY'; PROD_NUM=SRC.PROD_NUM; YRMTH=202101; QUANTITY=SRC.QUANTITY; LINEPRICE=SRC.LINEPRICE; LINECOGS=SRC.LINECOGS; PROFIT=SRC.LINECOGS - SRC.LINECOST;END
The following TABLE request prints the values in the updated dmrpts target.
TABLE FILE DMRPTSPRINT *ON TABLE SET PAGE NOLEADON TABLE SET STYLE *GRID=OFF,$ENDSTYLEEND
8. Saving and Reusing Your Report Output
Creating Reports With TIBCO® WebFOCUS Language 539
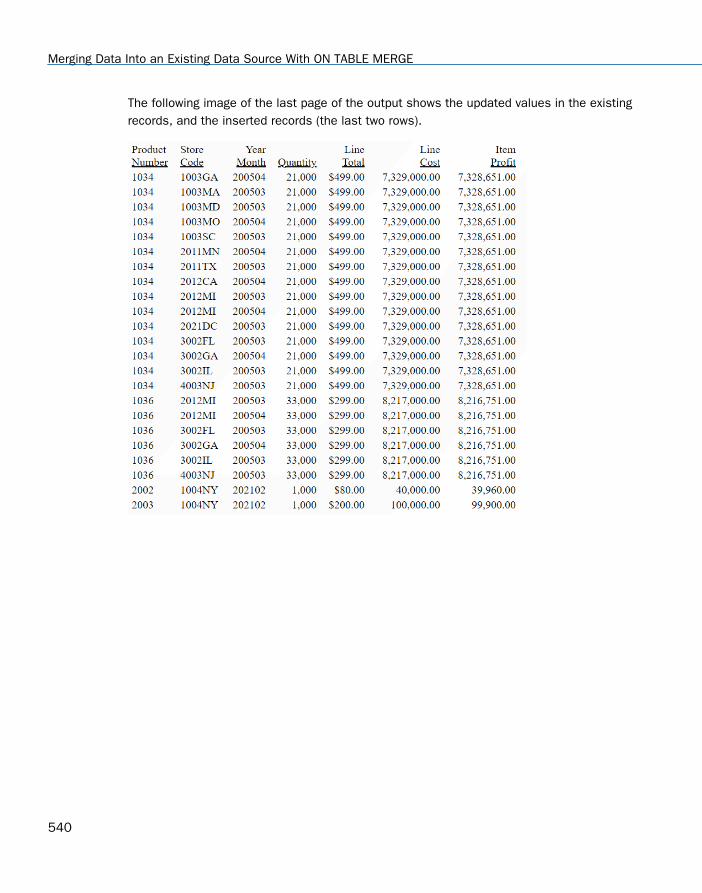
The following image of the last page of the output shows the updated values in the existingrecords, and the inserted records (the last two rows).
Merging Data Into an Existing Data Source With ON TABLE MERGE
540
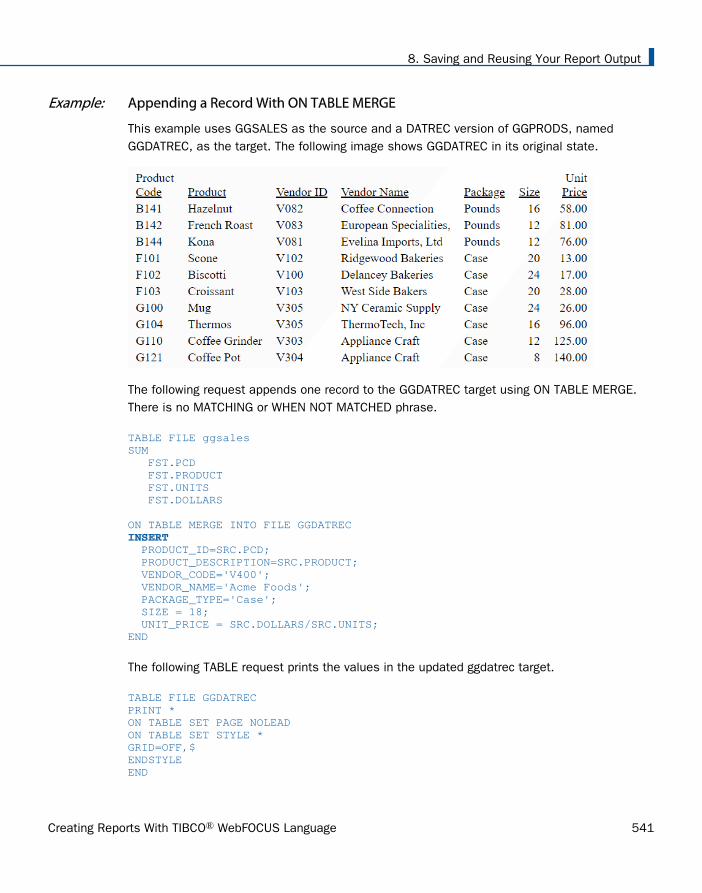
Example: Appending a Record With ON TABLE MERGE
This example uses GGSALES as the source and a DATREC version of GGPRODS, namedGGDATREC, as the target. The following image shows GGDATREC in its original state.
The following request appends one record to the GGDATREC target using ON TABLE MERGE.There is no MATCHING or WHEN NOT MATCHED phrase.
TABLE FILE ggsales SUM FST.PCD FST.PRODUCT FST.UNITS FST.DOLLARS ON TABLE MERGE INTO FILE GGDATRECINSERT PRODUCT_ID=SRC.PCD; PRODUCT_DESCRIPTION=SRC.PRODUCT; VENDOR_CODE='V400'; VENDOR_NAME='Acme Foods'; PACKAGE_TYPE='Case'; SIZE = 18; UNIT_PRICE = SRC.DOLLARS/SRC.UNITS;END
The following TABLE request prints the values in the updated ggdatrec target.
TABLE FILE GGDATRECPRINT *ON TABLE SET PAGE NOLEADON TABLE SET STYLE *GRID=OFF,$ENDSTYLEEND
8. Saving and Reusing Your Report Output
Creating Reports With TIBCO® WebFOCUS Language 541

The following image shows the appended record (the last row).
Example: Deleting Records Using ON TABLE MERGE
The following request uses the dminv table and a single-segment version of the dmord tablegenerated by the Data Migrator - General tutorial.
The following request displays all of the plant locations in the dmordsgl data source.
TABLE FILE DMORDSGLSUM QUANTITYBY PLANTON TABLE SET PAGE NOLEADON TABLE SET STYLE *GRID=OFF,$END
The output is shown in the following image.
Merging Data Into an Existing Data Source With ON TABLE MERGE
542

The following ON TABLE MERGE request deletes records where the source product numbermatches the target product number and the plant is 'LA'.
TABLE FILE dminv PRINTPROD_NUM ON TABLE MERGE INTO FILE dmordsglMATCHING TRG.PROD_NUM EQ SRC.PROD_NUM; WHEN MATCHED AND PLANT EQ 'LA'; DELETEEND
Running this request and then the request to display the plants shows that the records withthe LA plant have been deleted, as shown in the following image.
Reference: Best Practices for ON TABLE MERGE
We strongly recommend that you make a backup copy of your target data source prior tousing ON TABLE MERGE, in case you need to restore it to its original contents.
Always use the SRC. and TRG. prefixes in the merge expressions, for safety and clarity.
The TABLE commands prior to the ON TABLE MERGE clause internally generate a HOLD file,and the merge is done from the HOLD file into the target file. The HOLD file generates aliasnames for the source fields in the form E01, E02, and so on. These names are unique toeach field, while field names in the TABLE request may generate duplicate field names inthe HOLD file. Unique names must be used, so either use the alias names, or assign anew name to a duplicate field name using the AS phrase. For example, the followingrequest generates three fields named DOLLARS:
TABLE FILE GGSALESSUM DOLLARS MAX.DOLLARS MIN.DOLLARSBY UNITSON TABLE HOLDEND
8. Saving and Reusing Your Report Output
Creating Reports With TIBCO® WebFOCUS Language 543
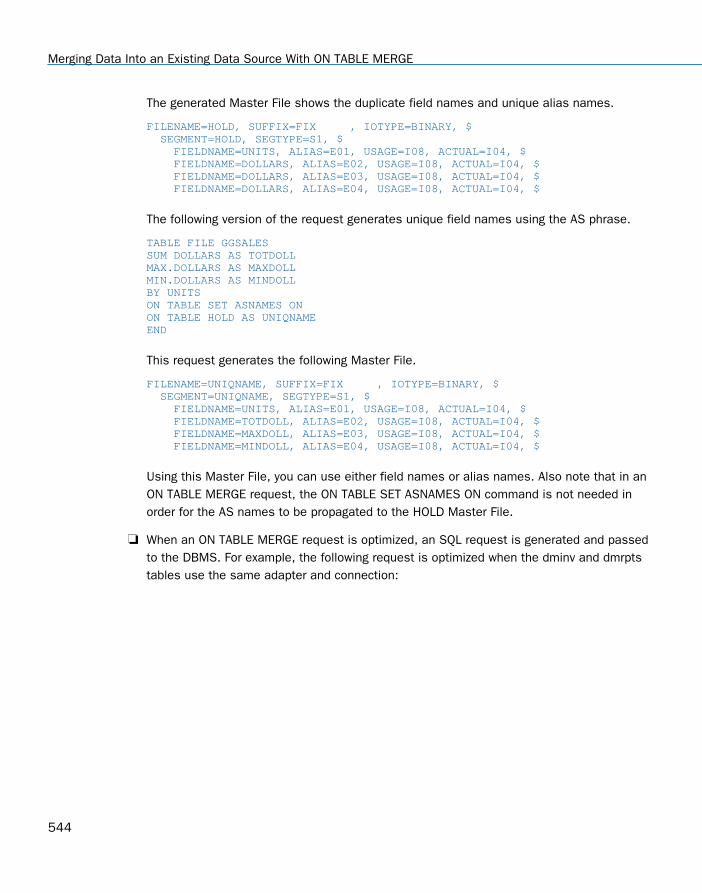
The generated Master File shows the duplicate field names and unique alias names.
FILENAME=HOLD, SUFFIX=FIX , IOTYPE=BINARY, $ SEGMENT=HOLD, SEGTYPE=S1, $ FIELDNAME=UNITS, ALIAS=E01, USAGE=I08, ACTUAL=I04, $ FIELDNAME=DOLLARS, ALIAS=E02, USAGE=I08, ACTUAL=I04, $ FIELDNAME=DOLLARS, ALIAS=E03, USAGE=I08, ACTUAL=I04, $ FIELDNAME=DOLLARS, ALIAS=E04, USAGE=I08, ACTUAL=I04, $
The following version of the request generates unique field names using the AS phrase.
TABLE FILE GGSALESSUM DOLLARS AS TOTDOLLMAX.DOLLARS AS MAXDOLL MIN.DOLLARS AS MINDOLLBY UNITSON TABLE SET ASNAMES ONON TABLE HOLD AS UNIQNAMEEND
This request generates the following Master File.
FILENAME=UNIQNAME, SUFFIX=FIX , IOTYPE=BINARY, $ SEGMENT=UNIQNAME, SEGTYPE=S1, $ FIELDNAME=UNITS, ALIAS=E01, USAGE=I08, ACTUAL=I04, $ FIELDNAME=TOTDOLL, ALIAS=E02, USAGE=I08, ACTUAL=I04, $ FIELDNAME=MAXDOLL, ALIAS=E03, USAGE=I08, ACTUAL=I04, $ FIELDNAME=MINDOLL, ALIAS=E04, USAGE=I08, ACTUAL=I04, $
Using this Master File, you can use either field names or alias names. Also note that in anON TABLE MERGE request, the ON TABLE SET ASNAMES ON command is not needed inorder for the AS names to be propagated to the HOLD Master File.
When an ON TABLE MERGE request is optimized, an SQL request is generated and passedto the DBMS. For example, the following request is optimized when the dminv and dmrptstables use the same adapter and connection:
Merging Data Into an Existing Data Source With ON TABLE MERGE
544
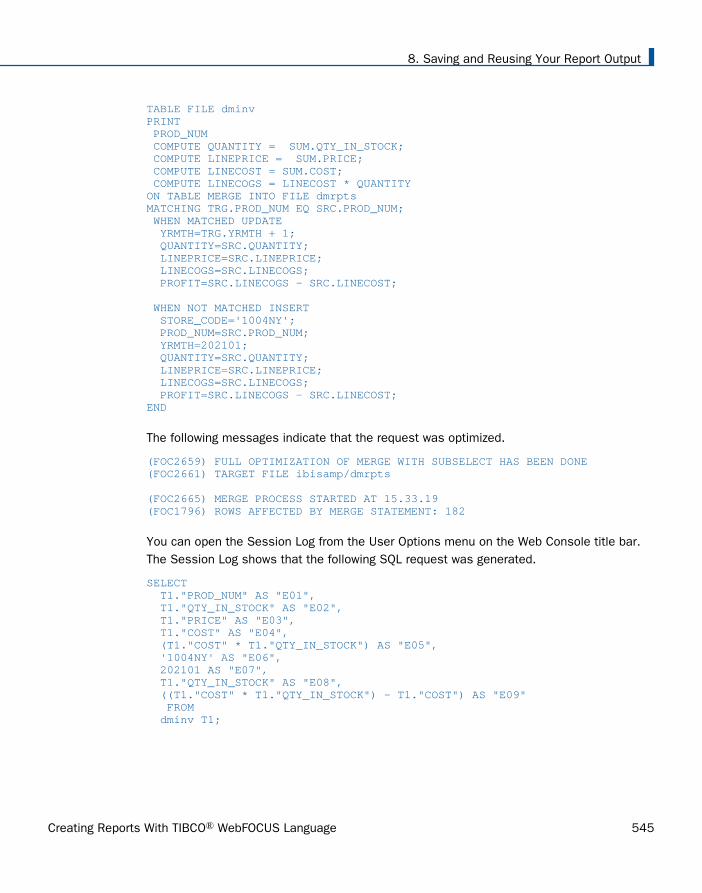
TABLE FILE dminv PRINT PROD_NUM COMPUTE QUANTITY = SUM.QTY_IN_STOCK; COMPUTE LINEPRICE = SUM.PRICE; COMPUTE LINECOST = SUM.COST; COMPUTE LINECOGS = LINECOST * QUANTITYON TABLE MERGE INTO FILE dmrptsMATCHING TRG.PROD_NUM EQ SRC.PROD_NUM; WHEN MATCHED UPDATE YRMTH=TRG.YRMTH + 1; QUANTITY=SRC.QUANTITY; LINEPRICE=SRC.LINEPRICE; LINECOGS=SRC.LINECOGS; PROFIT=SRC.LINECOGS - SRC.LINECOST; WHEN NOT MATCHED INSERT STORE_CODE='1004NY'; PROD_NUM=SRC.PROD_NUM; YRMTH=202101; QUANTITY=SRC.QUANTITY; LINEPRICE=SRC.LINEPRICE; LINECOGS=SRC.LINECOGS; PROFIT=SRC.LINECOGS - SRC.LINECOST;END
The following messages indicate that the request was optimized.
(FOC2659) FULL OPTIMIZATION OF MERGE WITH SUBSELECT HAS BEEN DONE(FOC2661) TARGET FILE ibisamp/dmrpts
(FOC2665) MERGE PROCESS STARTED AT 15.33.19(FOC1796) ROWS AFFECTED BY MERGE STATEMENT: 182
You can open the Session Log from the User Options menu on the Web Console title bar.The Session Log shows that the following SQL request was generated.
SELECT T1."PROD_NUM" AS "E01", T1."QTY_IN_STOCK" AS "E02", T1."PRICE" AS "E03", T1."COST" AS "E04", (T1."COST" * T1."QTY_IN_STOCK") AS "E05", '1004NY' AS "E06", 202101 AS "E07", T1."QTY_IN_STOCK" AS "E08", ((T1."COST" * T1."QTY_IN_STOCK") - T1."COST") AS "E09" FROM dminv T1;
8. Saving and Reusing Your Report Output
Creating Reports With TIBCO® WebFOCUS Language 545

MERGE INTO dmrpts AS T3 USING ( SELECT T1."PROD_NUM" AS "E01", T1."QTY_IN_STOCK" AS "E02", T1."PRICE" AS "E03", T1."COST" AS "E04", (T1."COST" * T1."QTY_IN_STOCK") AS "E05", '1004NY' AS "E06", 202101 AS "E07", T1."QTY_IN_STOCK" AS "E08", ((T1."COST" * T1."QTY_IN_STOCK") - T1."COST") AS "E09" FROM dminv T1) T2 ON (T3."PROD_NUM" = T2."E01")
WHEN MATCHED THEN UPDATE SET "YRMTH" = ("YRMTH" + 1), "QUANTITY" = T2."E08", "LINEPRICE" = T2."E03", "LINECOGS" = T2."E05", "PROFIT" = T2."E09"
WHEN NOT MATCHED THEN INSERT ( "PROD_NUM", "STORE_CODE", "YRMTH", "QUANTITY", "LINEPRICE", "LINECOGS", "PROFIT") VALUES ( T2."E01", T2."E06", T2."E07", T2."E08", T2."E03", T2."E05", T2."E09");
Merging Data Into an Existing Data Source With ON TABLE MERGE
546

Example: Using Alias Names With ON TABLE MERGE
The following request uses alias names from the source HOLD file in the expressions used toinsert fields into the target file.
TABLE FILE dminv PRINT PROD_NUM COMPUTE YM = 202102; COMPUTE QUANTITY = QTY_IN_STOCK; COMPUTE LINEPRICE = PRICE; COMPUTE LINECOGS = LINEPRICE * QUANTITY;ON TABLE MERGE INTO FILE ibisamp/dmrpts INSERT STORE_CODE='AAAA'; PROD_NUM=SRC.E01; YRMTH=SRC.E02; QUANTITY=SRC.E03; LINEPRICE=SRC.E04; LINECOGS=SRC.E05; PROFIT=SRC.E04 - SRC.E05; END
Using Text Fields in Output Files
Text fields can be propagated to HOLD and SAVE files that have the following formats: ALPHA,WP, and FOCUS or XFOCUS. However, although a Master File is generated for format ALPHA,you cannot issue a TABLE request against a HOLD file of format ALPHA that contains textfields.
Reference: Rules for Text Fields in Output Files
You can include as many text fields in the file as needed. However, you must specify textfields after non-text fields in the display list (PRINT..., SUM..., and so forth).
You can specify only one text field in the display list, and no non-text fields, in a requestthat includes an ACROSS phrase.
The following rules apply to missing data for text fields in HOLD and SAVE files:
A blank line is valid data. An end-of-text mark indicates the end of the field.
If there is no text for a field, a single period (.) followed by blanks appears in the HOLD orSAVE file.
If MISSING=ON during data extraction, a period (.) is written out to the HOLD or SAVE file.
If MISSING=OFF during data extraction, a blank is written out to the HOLD or SAVE file.
See Handling Records With Missing Field Values on page 1037.
8. Saving and Reusing Your Report Output
Creating Reports With TIBCO® WebFOCUS Language 547
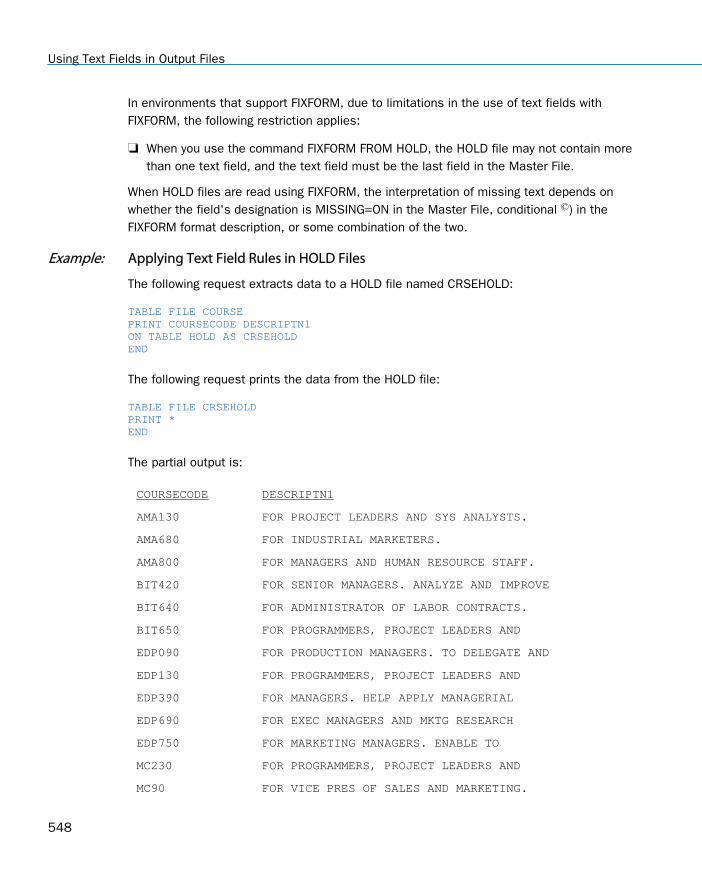
In environments that support FIXFORM, due to limitations in the use of text fields withFIXFORM, the following restriction applies:
When you use the command FIXFORM FROM HOLD, the HOLD file may not contain morethan one text field, and the text field must be the last field in the Master File.
When HOLD files are read using FIXFORM, the interpretation of missing text depends onwhether the field's designation is MISSING=ON in the Master File, conditional ©) in theFIXFORM format description, or some combination of the two.
Example: Applying Text Field Rules in HOLD Files
The following request extracts data to a HOLD file named CRSEHOLD:
TABLE FILE COURSEPRINT COURSECODE DESCRIPTN1ON TABLE HOLD AS CRSEHOLDEND
The following request prints the data from the HOLD file:
TABLE FILE CRSEHOLDPRINT *END
The partial output is:
COURSECODE DESCRIPTN1
AMA130 FOR PROJECT LEADERS AND SYS ANALYSTS.
AMA680 FOR INDUSTRIAL MARKETERS.
AMA800 FOR MANAGERS AND HUMAN RESOURCE STAFF.
BIT420 FOR SENIOR MANAGERS. ANALYZE AND IMPROVE
BIT640 FOR ADMINISTRATOR OF LABOR CONTRACTS.
BIT650 FOR PROGRAMMERS, PROJECT LEADERS AND
EDP090 FOR PRODUCTION MANAGERS. TO DELEGATE AND
EDP130 FOR PROGRAMMERS, PROJECT LEADERS AND
EDP390 FOR MANAGERS. HELP APPLY MANAGERIAL
EDP690 FOR EXEC MANAGERS AND MKTG RESEARCH
EDP750 FOR MARKETING MANAGERS. ENABLE TO
MC230 FOR PROGRAMMERS, PROJECT LEADERS AND
MC90 FOR VICE PRES OF SALES AND MARKETING.
Using Text Fields in Output Files
548
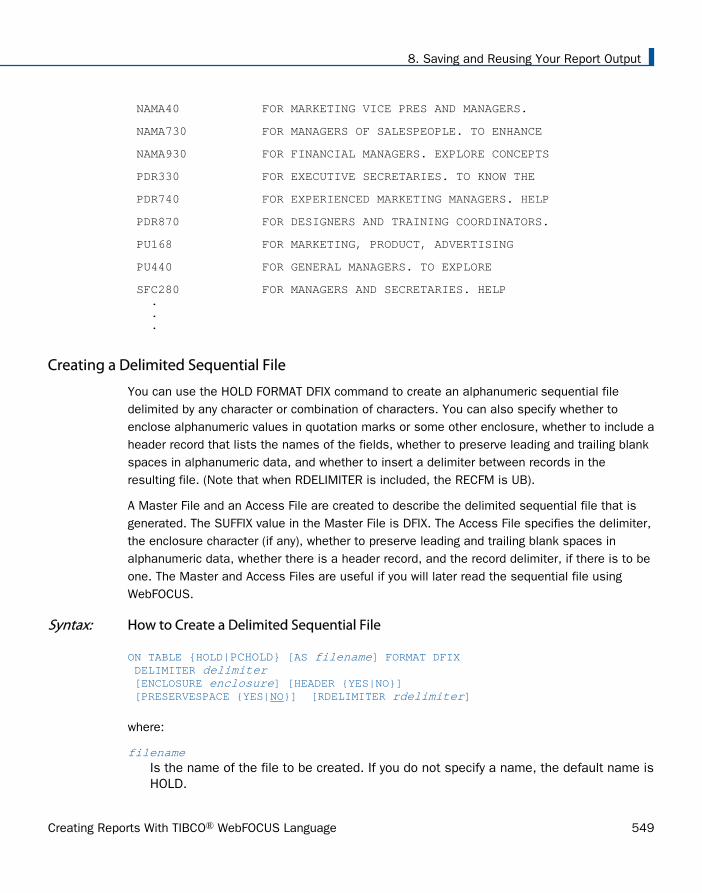
NAMA40 FOR MARKETING VICE PRES AND MANAGERS.
NAMA730 FOR MANAGERS OF SALESPEOPLE. TO ENHANCE
NAMA930 FOR FINANCIAL MANAGERS. EXPLORE CONCEPTS
PDR330 FOR EXECUTIVE SECRETARIES. TO KNOW THE
PDR740 FOR EXPERIENCED MARKETING MANAGERS. HELP
PDR870 FOR DESIGNERS AND TRAINING COORDINATORS.
PU168 FOR MARKETING, PRODUCT, ADVERTISING
PU440 FOR GENERAL MANAGERS. TO EXPLORE
SFC280 . . .
FOR MANAGERS AND SECRETARIES. HELP
Creating a Delimited Sequential File
You can use the HOLD FORMAT DFIX command to create an alphanumeric sequential filedelimited by any character or combination of characters. You can also specify whether toenclose alphanumeric values in quotation marks or some other enclosure, whether to include aheader record that lists the names of the fields, whether to preserve leading and trailing blankspaces in alphanumeric data, and whether to insert a delimiter between records in theresulting file. (Note that when RDELIMITER is included, the RECFM is UB).
A Master File and an Access File are created to describe the delimited sequential file that isgenerated. The SUFFIX value in the Master File is DFIX. The Access File specifies the delimiter,the enclosure character (if any), whether to preserve leading and trailing blank spaces inalphanumeric data, whether there is a header record, and the record delimiter, if there is to beone. The Master and Access Files are useful if you will later read the sequential file usingWebFOCUS.
Syntax: How to Create a Delimited Sequential File
ON TABLE {HOLD|PCHOLD} [AS filename] FORMAT DFIX DELIMITER delimiter [ENCLOSURE enclosure] [HEADER {YES|NO}] [PRESERVESPACE {YES|NO}] [RDELIMITER rdelimiter]
where:
filenameIs the name of the file to be created. If you do not specify a name, the default name isHOLD.
8. Saving and Reusing Your Report Output
Creating Reports With TIBCO® WebFOCUS Language 549

delimiter
Is the delimiter sequence consisting of up to 30 printable or non-printable non-nullcharacters. This represents character semantics. For example, if you are using DBCScharacters, the delimiter can be up to 60 bytes. Characters may also be represented bytheir 0x hex values which is the required specification method for non-printable characters.If you use a mixture of printable and non-printable characters, you must enter them all ashexadecimal values. To create a tab delimited file, you can specify the DELIMITER value asTAB or as its hexadecimal equivalent (0x09 on ASCII platforms or 0x05 on EBCDICplatforms). To create a single-quote delimited file, you must specify the single quoteDELIMITER value as its hexadecimal equivalent (0x27 on ASCII platforms or 0x7D onEBCDIC platforms), otherwise the request will be mis-interpreted and result in an unusableHOLD file.
enclosure
Is the enclosure sequence. It can be up to four printable or non-printable characters usedto enclose each alphanumeric value in the file. This represents character semantics. Forexample, if you are using DBCS characters, the enclosure can be up to 8 bytes. Mostalphanumeric characters can be used as all or part of the enclosure sequence. However,numeric digits and symbols used in numbers, such as a period (.), plus sign (+), or minussign (-) cannot be used in the enclosure sequence. Also note that, in order to specify asingle quotation mark as the enclosure character, you must enter four consecutive singlequotation marks. The most common enclosure is one double quotation mark.
If you use a mixture of printable and non-printable characters, you must enter them all ashexadecimal values. For printable characters, you can either use the charactersthemselves or their hexadecimal equivalents (for example, the ampersand character maybe interpreted as the beginning of a variable name rather than as part of the enclosure.)
HEADER {YES|NO}
Specifies whether to include a header record that contains the names of the fields inthe delimited sequential file generated by the request.
PRESERVESPACE {YES|NO}
Specifies whether to retain leading and trailing blanks in alphanumeric data. YESpreserves leading and trailing blanks. NO only preserves leading and trailing blanks thatare included within the enclosure characters. NO is the default value.
Note: PRESERVESPACE is overridden by the ENCLOSURE option. Therefore, exclude theenclosure option in order to have the PRESERVESPACE setting respected.
Creating a Delimited Sequential File
550

rdelimiter
Is the record delimiter sequence consisting of up to 30 printable or non-printable non-nullcharacters. This represents character semantics. For example, if you are using DBCScharacters, the delimiter can be up to 60 bytes. For a non-printable character, enter thehexadecimal value that represents the character. If you use a mixture of printable and non-printable characters, you must enter them all as hexadecimal values. For printablecharacters you can either use the characters themselves or their hexadecimal equivalents(for example, the ampersand character may be interpreted as the beginning of a variablename rather than as part of the delimiter). To use a tab character as the record delimiter,you can specify the delimiter value as TAB or as its hexadecimal equivalent (0x09 on ASCIIplatforms or 0x05 on EBCDIC platforms). The comma (,) is not supported as a recorddelimiter.
Note that numeric digits and symbols used in numbers, such as a period (.), plus sign (+),or minus sign (-) cannot be used in the delimiter sequence. When RDELIMITER is included,the RECFM is UB.
Reference: Usage Notes for HOLD FORMAT DFIX
Missing data is indicated by no data. So, with enclosure, a missing alphanumeric field isindicated by two enclosure characters, while a missing numeric field is indicated by twodelimiters.
Text fields are not supported with HOLD FORMAT DFIX.
While HOLD FORMAT DFIX creates a single segment file, you can manually add segments tothe resulting Master and Access File. In the Access File, you can specify a separatedelimiter and/or enclosure for each segment.
The extension of the generated sequential file is ftm.
HOLD FORMAT DFIX with the PRESERVESPACE YES option creates a file in which leadingand trailing blank spaces are preserved in alphanumeric data. It also adds the attributePRESERVESPACE=YES in the Access File. This attribute causes leading and trailing blankspaces to be preserved when reading a FORMAT DFIX file.
8. Saving and Reusing Your Report Output
Creating Reports With TIBCO® WebFOCUS Language 551

Example: Creating a Pipe-Delimited File
The following request against the CENTORD data source creates a sequential file named PIPE1with fields separated by the pipe character (|). Alphanumeric values are not enclosed inquotation marks, and there is no header record:
TABLE FILE CENTORD SUM QUANTITY LINEPRICE BY REGION BY YEAR ON TABLE HOLD AS PIPE1 FORMAT DFIX DELIMITER |END
The PIPE1 Master File specifies the SUFFIX value as DFIX:
FILENAME=PIPE1 , SUFFIX=DFIX , $ SEGMENT=PIPE1, SEGTYPE=S2, $ FIELDNAME=REGION, ALIAS=E01, USAGE=A5, ACTUAL=A05, $ FIELDNAME=YEAR, ALIAS=E02, USAGE=YY, ACTUAL=A04, $ FIELDNAME=QUANTITY, ALIAS=E03, USAGE=I8C, ACTUAL=A08, $ FIELDNAME=LINEPRICE, ALIAS=E04, USAGE=D12.2MC, ACTUAL=A12, $
The PIPE1 Access File specifies the delimiter:
SEGNAME=PIPE1, DELIMITER=|, HEADER=NO, $
The PIPE1 sequential file contains the following data. Each data value is separated from thenext value by a pipe character:
EAST|2000|3907|1145655.77 EAST|2001|495922|127004359.88EAST|2002|543678|137470917.05NORTH|2001|337168|85750735.54NORTH|2002|370031|92609802.80SOUTH|2000|3141|852550.45 SOUTH|2001|393155|99822662.88SOUTH|2002|431575|107858412.0WEST|2001|155252|39167974.18 WEST|2002|170421|42339953.45
The following version of the HOLD command specifies both the delimiter and an enclosurecharacter (“):
ON TABLE HOLD AS PIPE1 FORMAT DFIX DELIMITER | ENCLOSURE "
The Master File remains the same, but the Access File now specifies the enclosure character:
SEGNAME=PIPE1, DELIMITER=|, ENCLOSURE=", HEADER=NO, $
Creating a Delimited Sequential File
552

In the delimited file that is created, each data value is separated from the next by a pipecharacter, and alphanumeric values are enclosed within double quotation marks:
"EAST"|2000|3907|1145655.77 "EAST"|2001|495922|127004359.88 "EAST"|2002|543678|137470917.05 "NORTH"|2001|337168|85750735.54 "NORTH"|2002|370031|92609802.80 "SOUTH"|2000|3141|852550.45 "SOUTH"|2001|393155|99822662.88 "SOUTH"|2002|431575|107858412.01"WEST"|2001|155252|39167974.18 "WEST"|2002|170421|42339953.45
This version of the HOLD command adds a header record to the generated file:
ON TABLE HOLD AS PIPE1 FORMAT DFIX DELIMITER | ENCLOSURE " HEADER YES
The Master File remains the same, but the Access File now specifies that the generatedsequential file should contain a header record with column names as its first record:
SEGNAME=PIPE1, DELIMITER=|, ENCLOSURE=", HEADER=YES, $
In the delimited file that is created, each data value is separated from the next by a pipecharacter, and alphanumeric values are enclosed within double quotation marks. The firstrecord contains the column names:
"REGION"|"YEAR"|"QUANTITY"|"LINEPRICE""EAST"|2000|3907|1145655.77 "EAST"|2001|495922|127004359.88 "EAST"|2002|543678|137470917.05 "NORTH"|2001|337168|85750735.54 "NORTH"|2002|370031|92609802.80 "SOUTH"|2000|3141|852550.45 "SOUTH"|2001|393155|99822662.88 "SOUTH"|2002|431575|107858412.01 "WEST"|2001|155252|39167974.18 "WEST"|2002|170421|42339953.45
Example: Creating a Tab-Delimited File
The following request against the CENTORD data source creates a sequential file named TAB1with fields separated by a tab character:
TABLE FILE CENTORD SUM QUANTITY LINEPRICE BY REGION BY YEAR ON TABLE HOLD AS TAB1 FORMAT DFIX DELIMITER TABEND
8. Saving and Reusing Your Report Output
Creating Reports With TIBCO® WebFOCUS Language 553

As the tab character is not printable, the TAB1 Access File specifies the delimiter using itshexadecimal value.
The following is the Access File in an EBCDIC environment:
SEGNAME=TAB1, DELIMITER=0x05, HEADER=NO, $
The following is the Access File in an ASCII environment:
SEGNAME=TAB1, DELIMITER=0x09, HEADER=NO, $
Example: Creating a Delimited File With Blank Spaces Preserved
The following request against the GGSALES data source creates a comma-delimited file. Theoriginal alphanumeric data has trailing blank spaces. The PRESERVESPACE YES option in theHOLD command preserves these trailing blank spaces:
APP HOLDDATA APP1APP HOLDMETA APP1TABLE FILE GGSALESSUM DOLLARS UNITSBY REGIONBY CATEGORYBY PRODUCTON TABLE HOLD AS DFIX1 FORMAT DFIX DELIMITER , PRESERVESPACE YESEND
The following Master File is generated:
FILENAME=DFIX1 , SUFFIX=DFIX , $ SEGMENT=DFIX1, SEGTYPE=S3, $ FIELDNAME=REGION, ALIAS=E01, USAGE=A11, ACTUAL=A11, $ FIELDNAME=CATEGORY, ALIAS=E02, USAGE=A11, ACTUAL=A11, $ FIELDNAME=PRODUCT, ALIAS=E03, USAGE=A16, ACTUAL=A16, $ FIELDNAME=DOLLARS, ALIAS=E04, USAGE=I08, ACTUAL=A08, $ FIELDNAME=UNITS, ALIAS=E05, USAGE=I08, ACTUAL=A08, $
The following Access File is generated:
SEGNAME=DFIX1, DELIMITER=',', HEADER=NO, PRESERVESPACE=YES, $
Creating a Delimited Sequential File
554

In the DFIX1 file, the alphanumeric fields contain all of the blank spaces that existed in theoriginal file:
Midwest ,Coffee ,Espresso ,1294947,101154Midwest ,Coffee ,Latte ,2883566,231623Midwest ,Food ,Biscotti ,1091727,86105Midwest ,Food ,Croissant ,1751124,139182Midwest ,Food ,Scone ,1495420,116127Midwest ,Gifts ,Coffee Grinder ,619154,50393Midwest ,Gifts ,Coffee Pot ,599878,47156Midwest ,Gifts ,Mug ,1086943,86718Midwest ,Gifts ,Thermos ,577906,46587Northeast ,Coffee ,Capuccino ,542095,44785Northeast ,Coffee ,Espresso ,850107,68127Northeast ,Coffee ,Latte ,2771815,222866Northeast ,Food ,Biscotti ,1802005,145242Northeast ,Food ,Croissant ,1670818,137394Northeast ,Food ,Scone ,907171,70732Northeast ,Gifts ,Coffee Grinder ,509200,40977Northeast ,Gifts ,Coffee Pot ,590780,46185Northeast ,Gifts ,Mug ,1144211,91497Northeast ,Gifts ,Thermos ,604098,48870Southeast ,Coffee ,Capuccino ,944000,73264Southeast ,Coffee ,Espresso ,853572,68030Southeast ,Coffee ,Latte ,2617836,209654Southeast ,Food ,Biscotti ,1505717,119594Southeast ,Food ,Croissant ,1902359,156456Southeast ,Food ,Scone ,900655,73779Southeast ,Gifts ,Coffee Grinder ,605777,47083Southeast ,Gifts ,Coffee Pot ,645303,49922Southeast ,Gifts ,Mug ,1102703,88474Southeast ,Gifts ,Thermos ,632457,48976West ,Coffee ,Capuccino ,895495,71168West ,Coffee ,Espresso ,907617,71675West ,Coffee ,Latte ,2670405,213920West ,Food ,Biscotti ,863868,70436West ,Food ,Croissant ,2425601,197022West ,Food ,Scone ,912868,72776West ,Gifts ,Coffee Grinder ,603436,48081West ,Gifts ,Coffee Pot ,613624,47432West ,Gifts ,Mug ,1188664,93881West ,Gifts ,Thermos ,571368,45648
8. Saving and Reusing Your Report Output
Creating Reports With TIBCO® WebFOCUS Language 555

Creating the same file with PRESERVESPACE NO removes the trailing blank spaces:
Midwest,Coffee,Espresso,1294947,101154Midwest,Coffee,Latte,2883566,231623Midwest,Food,Biscotti,1091727,86105Midwest,Food,Croissant,1751124,139182Midwest,Food,Scone,1495420,116127Midwest,Gifts,Coffee Grinder,619154,50393Midwest,Gifts,Coffee Pot,599878,47156Midwest,Gifts,Mug,1086943,86718Midwest,Gifts,Thermos,577906,46587Northeast,Coffee,Capuccino,542095,44785Northeast,Coffee,Espresso,850107,68127Northeast,Coffee,Latte,2771815,222866Northeast,Food,Biscotti,1802005,145242Northeast,Food,Croissant,1670818,137394Northeast,Food,Scone,907171,70732Northeast,Gifts,Coffee Grinder,509200,40977Northeast,Gifts,Coffee Pot,590780,46185Northeast,Gifts,Mug,1144211,91497Northeast,Gifts,Thermos,604098,48870Southeast,Coffee,Capuccino,944000,73264Southeast,Coffee,Espresso,853572,68030Southeast,Coffee,Latte,2617836,209654Southeast,Food,Biscotti,1505717,119594Southeast,Food,Croissant,1902359,156456Southeast,Food,Scone,900655,73779Southeast,Gifts,Coffee Grinder,605777,47083Southeast,Gifts,Coffee Pot,645303,49922Southeast,Gifts,Mug,1102703,88474Southeast,Gifts,Thermos,632457,48976West,Coffee,Capuccino,895495,71168West,Coffee,Espresso,907617,71675West,Coffee,Latte,2670405,213920West,Food,Biscotti,863868,70436West,Food,Croissant,2425601,197022West,Food,Scone,912868,72776West,Gifts,Coffee Grinder,603436,48081West,Gifts,Coffee Pot,613624,47432West,Gifts,Mug,1188664,93881West,Gifts,Thermos,571368,45648
Example: Specifying a Record Delimiter
The following request against the GGSALES data source, the field delimiter is a comma, theenclosure character is a single quotation mark, and the record delimiter consists of bothprintable and non-printable characters, so it is specified as the following hexadecimalsequence:
0x: character sequence identifying the delimiter as hexadecimal character codes.
2C: hexadecimal value for comma (,).
Creating a Delimited Sequential File
556

24: hexadecimal value for dollar sign ($).
0D: hexadecimal value for carriage return.
0A: hexadecimal value for new line.
TABLE FILE GGSALES PRINT DOLLARS UNITS CATEGORY REGIONON TABLE HOLD AS RDELIM1 FORMAT DFIX DELIMITER , ENCLOSURE '''' HEADER NO RDELIMITER 0x2C240D0A END
The generated Master File follows:
FILENAME=RDELIM1 , SUFFIX=DFIX , $ SEGMENT=RDELIM1, SEGTYPE=S0, $ FIELDNAME=DOLLARS, ALIAS=E01, USAGE=I08, ACTUAL=A08, $ FIELDNAME=UNITS, ALIAS=E02, USAGE=I08, ACTUAL=A08, $ FIELDNAME=CATEGORY, ALIAS=E03, USAGE=A11, ACTUAL=A11, $ FIELDNAME=REGION, ALIAS=E04, USAGE=A11, ACTUAL=A11, $
The Access File contains the delimiters and enclosure characters:
SEGNAME=RDELIM1, DELIMITER=',', ENCLOSURE='''', HEADER=NO, RDELIMITER=0x2C240D0A, PRESERVESPACE=NO, $
Each row of the resulting DFIX file ends with the comma-dollar combination and a carriagereturn and line space. a partial listing follows:
20805,1387,'Coffee','Northeast',$20748,1729,'Coffee','Northeast',$20376,1698,'Coffee','Northeast',$20028,1669,'Coffee','Northeast',$19905,1327,'Coffee','Northeast',$19470,1770,'Coffee','Northeast',$19118,1738,'Coffee','Northeast',$18720,1560,'Coffee','Northeast',$18432,1536,'Coffee','Northeast',$17985,1199,'Coffee','Northeast',$17630,1763,'Coffee','Northeast',$16646,1189,'Coffee','Northeast',$15650,1565,'Coffee','Northeast',$15450,1545,'Coffee','Northeast',$15435,1029,'Coffee','Northeast',$14270,1427,'Coffee','Northeast',$
8. Saving and Reusing Your Report Output
Creating Reports With TIBCO® WebFOCUS Language 557
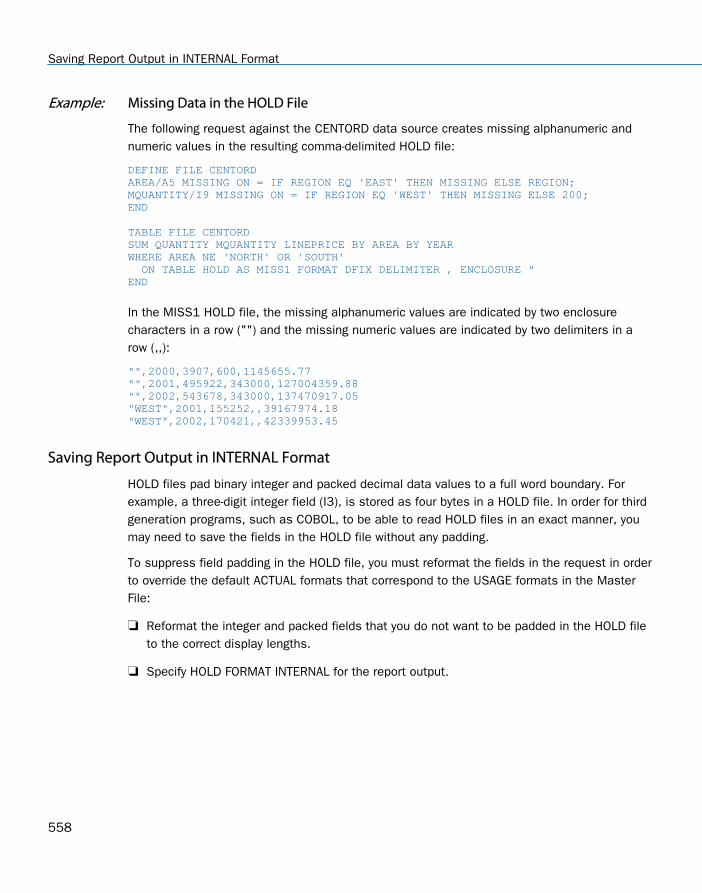
Example: Missing Data in the HOLD File
The following request against the CENTORD data source creates missing alphanumeric andnumeric values in the resulting comma-delimited HOLD file:
DEFINE FILE CENTORD AREA/A5 MISSING ON = IF REGION EQ 'EAST' THEN MISSING ELSE REGION; MQUANTITY/I9 MISSING ON = IF REGION EQ 'WEST' THEN MISSING ELSE 200;END TABLE FILE CENTORD SUM QUANTITY MQUANTITY LINEPRICE BY AREA BY YEAR WHERE AREA NE 'NORTH' OR 'SOUTH' ON TABLE HOLD AS MISS1 FORMAT DFIX DELIMITER , ENCLOSURE " END
In the MISS1 HOLD file, the missing alphanumeric values are indicated by two enclosurecharacters in a row ("") and the missing numeric values are indicated by two delimiters in arow (,,):
"",2000,3907,600,1145655.77 "",2001,495922,343000,127004359.88"",2002,543678,343000,137470917.05"WEST",2001,155252,,39167974.18 "WEST",2002,170421,,42339953.45
Saving Report Output in INTERNAL Format
HOLD files pad binary integer and packed decimal data values to a full word boundary. Forexample, a three-digit integer field (I3), is stored as four bytes in a HOLD file. In order for thirdgeneration programs, such as COBOL, to be able to read HOLD files in an exact manner, youmay need to save the fields in the HOLD file without any padding.
To suppress field padding in the HOLD file, you must reformat the fields in the request in orderto override the default ACTUAL formats that correspond to the USAGE formats in the MasterFile:
Reformat the integer and packed fields that you do not want to be padded in the HOLD fileto the correct display lengths.
Specify HOLD FORMAT INTERNAL for the report output.
Saving Report Output in INTERNAL Format
558

Syntax: How to Suppress Field Padding in HOLD Files
SET HOLDLIST = PRINTONLYTABLE FILE filename display_command fieldname/[In|Pn.d]..ON TABLE HOLD AS name FORMAT INTERNALEND
where:
PRINTONLY
Causes your report request to propagate the HOLD file with only the specified fieldsdisplaying in the report output. If you do not issue this setting, an extra fieldcontaining the padded field length is included in the HOLD file. See ControllingAttributes in HOLD Master Files on page 484.
fieldname/[In|Pn.d]Specify correct lengths in the formats for integer and packed fields where you wish tosuppress padding. These formats override the ACTUAL formats used for the displayformats in the Master File. See Usage Notes for Suppressing Padded Fields in HOLDFiles on page 560.
Note that floating point double-precision (D) and floating point single-precision (F) are notaffected by HOLD FORMAT INTERNAL.
FORMAT INTERNAL
Saves the HOLD file without padding for specified integer and packed decimal fields.
8. Saving and Reusing Your Report Output
Creating Reports With TIBCO® WebFOCUS Language 559

Reference: Usage Notes for Suppressing Padded Fields in HOLD Files
Integer fields (I) of one, two, three, or four bytes produce four-byte integers without HOLDFORMAT INTERNAL.
For packed decimal fields (Pn.d), n is the total number of digits and d is the number ofdigits to the right of the decimal point. The number of bytes is derived by dividing n by 2and adding 1.
The syntax is
bytes = INT (n/2) + 1
where:
INT (n/2)
Is the greatest integer after dividing by 2.
HOLD FORMAT INTERNAL does not affect floating point double-precision (D) and floatingpoint single-precision (F) fields. D remains at eight bytes, and F at four bytes.
Alphanumeric fields automatically inherit their length from their source Master File, and arenot padded to a full word boundary.
If a format override is not large enough to contain the data values, the values aretruncated. Truncation may cause the data in the HOLD file to be incorrect in the case of aninteger. For packed data and integers, truncation occurs for the high order digits so theremaining low order digits resemble the digits from the correct values.
To avoid incorrect results, be sure that the format you specify is large enough to containthe data values.
If you use the HOLDMISS=ON setting to propagate missing values to the HOLD file, shortpacked fields and fields with formats I1, I2, and I3 are not large enough to hold the missingvalue.
Example: Creating a HOLD File Without HOLD FORMAT INTERNAL
In this example, the values of ACTUAL for RETAIL_COST, DEALER_COST, and SEATS are allpadded to a full word. Alphanumeric fields also occupy full words.
TABLE FILE CARPRINT CAR COUNTRY RETAIL_COST DEALER_COST SEATSON TABLE HOLD AS DJGEND
Saving Report Output in INTERNAL Format
560
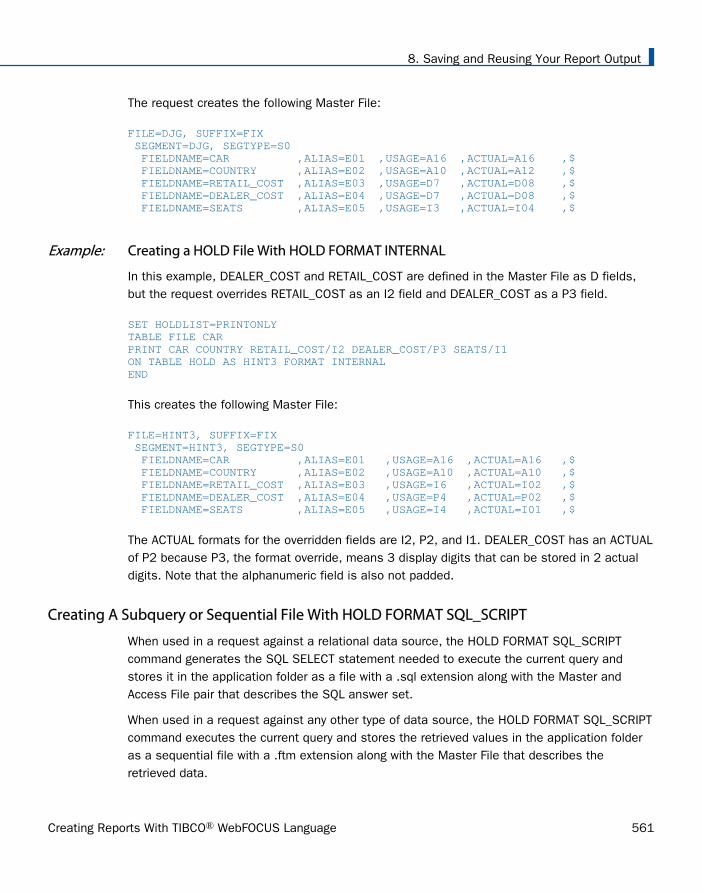
The request creates the following Master File:
FILE=DJG, SUFFIX=FIX SEGMENT=DJG, SEGTYPE=S0 FIELDNAME=CAR ,ALIAS=E01 ,USAGE=A16 ,ACTUAL=A16 ,$ FIELDNAME=COUNTRY ,ALIAS=E02 ,USAGE=A10 ,ACTUAL=A12 ,$ FIELDNAME=RETAIL_COST ,ALIAS=E03 ,USAGE=D7 ,ACTUAL=D08 ,$ FIELDNAME=DEALER_COST ,ALIAS=E04 ,USAGE=D7 ,ACTUAL=D08 ,$ FIELDNAME=SEATS ,ALIAS=E05 ,USAGE=I3 ,ACTUAL=I04 ,$
Example: Creating a HOLD File With HOLD FORMAT INTERNAL
In this example, DEALER_COST and RETAIL_COST are defined in the Master File as D fields,but the request overrides RETAIL_COST as an I2 field and DEALER_COST as a P3 field.
SET HOLDLIST=PRINTONLYTABLE FILE CARPRINT CAR COUNTRY RETAIL_COST/I2 DEALER_COST/P3 SEATS/I1ON TABLE HOLD AS HINT3 FORMAT INTERNALEND
This creates the following Master File:
FILE=HINT3, SUFFIX=FIX SEGMENT=HINT3, SEGTYPE=S0 FIELDNAME=CAR ,ALIAS=E01 ,USAGE=A16 ,ACTUAL=A16 ,$ FIELDNAME=COUNTRY ,ALIAS=E02 ,USAGE=A10 ,ACTUAL=A10 ,$ FIELDNAME=RETAIL_COST ,ALIAS=E03 ,USAGE=I6 ,ACTUAL=I02 ,$ FIELDNAME=DEALER_COST ,ALIAS=E04 ,USAGE=P4 ,ACTUAL=P02 ,$ FIELDNAME=SEATS ,ALIAS=E05 ,USAGE=I4 ,ACTUAL=I01 ,$
The ACTUAL formats for the overridden fields are I2, P2, and I1. DEALER_COST has an ACTUALof P2 because P3, the format override, means 3 display digits that can be stored in 2 actualdigits. Note that the alphanumeric field is also not padded.
Creating A Subquery or Sequential File With HOLD FORMAT SQL_SCRIPT
When used in a request against a relational data source, the HOLD FORMAT SQL_SCRIPTcommand generates the SQL SELECT statement needed to execute the current query andstores it in the application folder as a file with a .sql extension along with the Master andAccess File pair that describes the SQL answer set.
When used in a request against any other type of data source, the HOLD FORMAT SQL_SCRIPTcommand executes the current query and stores the retrieved values in the application folderas a sequential file with a .ftm extension along with the Master File that describes theretrieved data.
8. Saving and Reusing Your Report Output
Creating Reports With TIBCO® WebFOCUS Language 561

You can use the output from HOLD FORMAT SQL_SCRIPT as the target file for the DB_INFILEfunction. For information about the DB_INFILE function, see the TIBCO FOCUS® DevelopingApplica manual.
Note: Once you have the .sql file and its accompanying Master File, you can customize the .sqlfile using global Dialogue Manager variables. You must declare these global variables in theMaster File. For information about parameterizing Master Files with global variables, see theDescribing Data With TIBCO WebFOCUS® Language manual.
Syntax: How to Create an SQL Script or Sequential File Using HOLD FORMAT SQL_SCRIPT
ON TABLE HOLD AS script_name FORMAT SQL_SCRIPT
where:
script_name
Is the name of the .sql file or the .ftm file created as a result of the HOLD FORMATSQL_SCRIPT command.
Example: Creating an SQL Script File Using HOLD FORMAT SQL_SCRIPT
The following request against the WF_RETAIL relational data source creates an SQL Script filein the baseapp application:
APP HOLD baseappTABLE FILE WF_RETAIL_LITESUM BUSINESS_REGION STATE_PROV_CODE_ISO_3166_2BY BUSINESS_REGION NOPRINT BY STATE_PROV_CODE_ISO_3166_2 NOPRINTWHERE BUSINESS_REGION EQ 'North America' OR 'EMEA'WHERE STATE_PROV_CODE_ISO_3166_2 EQ 'AR' OR 'IA' OR 'KS' OR 'KY' OR 'WY' OR 'CT' OR 'MA' OR '04' OR '11' OR '14'OR 'NJ' OR 'NY' OR 'RI'ON TABLE HOLD AS RETAIL_SCRIPT FORMAT SQL_SCRIPTEND
WF_RETAIL is a sample data source you can create by right-clicking an application on theReporting Server Web Console and selecting New and then Samples from the context menu.
The result of this request is a script file named retail_script.sql and a corresponding Masterand Access File.
The retail_script.sql file contains the following SQL SELECT statement:
Creating A Subquery or Sequential File With HOLD FORMAT SQL_SCRIPT
562
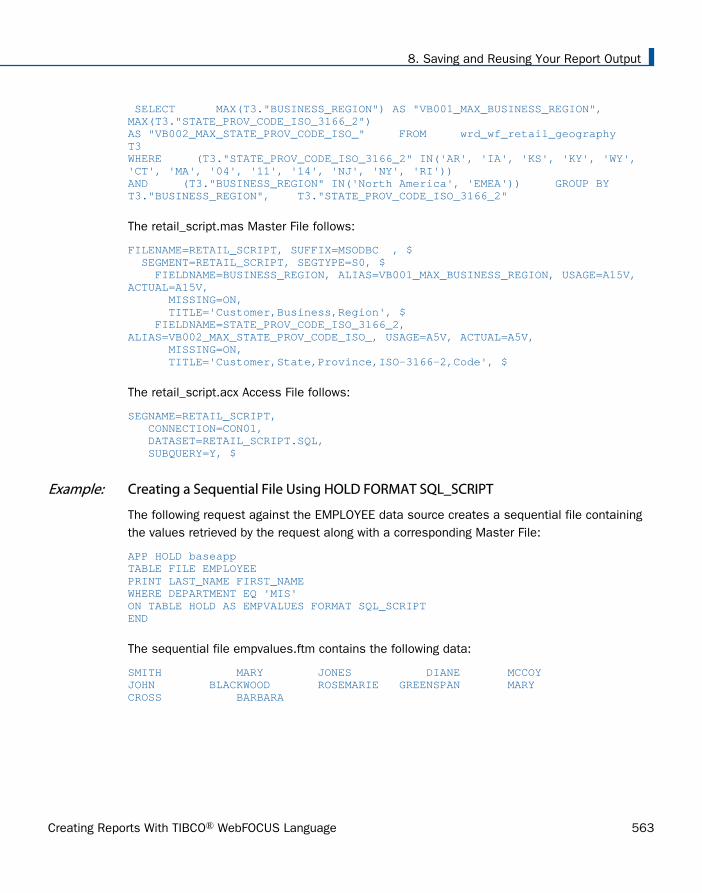
SELECT MAX(T3."BUSINESS_REGION") AS "VB001_MAX_BUSINESS_REGION", MAX(T3."STATE_PROV_CODE_ISO_3166_2") AS "VB002_MAX_STATE_PROV_CODE_ISO_" FROM wrd_wf_retail_geography T3 WHERE (T3."STATE_PROV_CODE_ISO_3166_2" IN('AR', 'IA', 'KS', 'KY', 'WY', 'CT', 'MA', '04', '11', '14', 'NJ', 'NY', 'RI')) AND (T3."BUSINESS_REGION" IN('North America', 'EMEA')) GROUP BY T3."BUSINESS_REGION", T3."STATE_PROV_CODE_ISO_3166_2"
The retail_script.mas Master File follows:
FILENAME=RETAIL_SCRIPT, SUFFIX=MSODBC , $ SEGMENT=RETAIL_SCRIPT, SEGTYPE=S0, $ FIELDNAME=BUSINESS_REGION, ALIAS=VB001_MAX_BUSINESS_REGION, USAGE=A15V, ACTUAL=A15V, MISSING=ON, TITLE='Customer,Business,Region', $ FIELDNAME=STATE_PROV_CODE_ISO_3166_2, ALIAS=VB002_MAX_STATE_PROV_CODE_ISO_, USAGE=A5V, ACTUAL=A5V, MISSING=ON, TITLE='Customer,State,Province,ISO-3166-2,Code', $
The retail_script.acx Access File follows:
SEGNAME=RETAIL_SCRIPT, CONNECTION=CON01, DATASET=RETAIL_SCRIPT.SQL, SUBQUERY=Y, $
Example: Creating a Sequential File Using HOLD FORMAT SQL_SCRIPT
The following request against the EMPLOYEE data source creates a sequential file containingthe values retrieved by the request along with a corresponding Master File:
APP HOLD baseapp TABLE FILE EMPLOYEE PRINT LAST_NAME FIRST_NAME WHERE DEPARTMENT EQ 'MIS' ON TABLE HOLD AS EMPVALUES FORMAT SQL_SCRIPT END
The sequential file empvalues.ftm contains the following data:
SMITH MARY JONES DIANE MCCOY JOHN BLACKWOOD ROSEMARIE GREENSPAN MARY CROSS BARBARA
8. Saving and Reusing Your Report Output
Creating Reports With TIBCO® WebFOCUS Language 563

The empvalues.mas Master File follows:
FILENAME=EMPVALUES, SUFFIX=DATREC , IOTYPE=BINARY, $ SEGMENT=EMPVALUE, SEGTYPE=S0, $ FIELDNAME=LAST_NAME, ALIAS=E01, USAGE=A15, ACTUAL=A15, $ FIELDNAME=FIRST_NAME, ALIAS=E02, USAGE=A10, ACTUAL=A10, $ FIELDNAME=NULLFLAG, ALIAS=__NULLFLAG__, USAGE=A2, ACTUAL=A2B, ACCESS_PROPERTY=(INTERNAL), $
Creating a Structured HOLD File
Structured HOLD Files facilitate migration of data sources and reports between operatingenvironments.
Other HOLD formats capture data from the original sources and may retain some implicitstructural elements from the request itself. However, they do not propagate most of theinformation about the original data sources accessed and their inter-relationships to the HOLDMaster File or data source. Structured HOLD files, however, extract the data to a structure thatparallels the original data sources. Subsequent requests against the HOLD file can use theseretained data relationships to recreate the same types of relationships in other environmentsor in other types of data sources.
A Structured HOLD File can be created in ALPHA, BINARY, or FOCUS format:
A Structured HOLD file created in either ALPHA or BINARY format is a flat file that saves thesegment instances that contain the data that satisfy the conditions of the TABLE request.Multiple segments are generated based on the original structure read by the TABLErequest. Segments are identified by assigning a RECTYPE for differentiation. Childsegments in the original data source become a unique segment in the HOLD file
A Structured HOLD file in FOCUS format uses normal FOCUS segments to retain the originalstructure.
In all cases the HOLD file contains all of the original segment instances required to provide thecomplete report based on the TABLE request itself. Regardless of the display command usedin the original request (PRINT, LIST, SUM, COUNT), the Structured HOLD File is created as ifthe request used PRINT. Aggregation is ignored.
The HOLD file contains either all of the fields in the structure identified by the request that areused to satisfy the request, or all of the display fields and BY fields. The file does not containDEFINE fields not specifically referenced in the request. It does contain all fields needed toevaluate any DEFINE fields referenced in the request.
Creating a Structured HOLD File
564

Structured HOLD files are only supported for TABLE and TABLEF commands. They can becreated anywhere a HOLD file is supported. You must activate Structured HOLD files in aspecific request by issuing the ON TABLE SET EXTRACT command in the request prior tocreating the Structured HOLD File.
Syntax: How to Activate Structured HOLD Files for a Request
ON TABLE SET EXTRACT {ON|*|OFF}
where:
ON
Activates Structured HOLD Files for this request and extracts all fields mentioned inthe request.
*
Activates Structured HOLD Files for this request and indicates that a block of extractoptions follows. For example, you can exclude specific fields from the StructuredHOLD File. For information, see How to Specify Options for Generating Structured HOLDFiles on page 566.
OFF
Deactivates Structured HOLD files for this request. OFF is the default value.
Syntax: How to Create a Structured HOLD File
Before issuing the HOLD command, activate Structured HOLD Files for the request by issuingthe ON TABLE SET EXTRACT command described in How to Activate Structured HOLD Files for aRequest on page 565. Then issue the HOLD command to create the Structured HOLD File:
[ON TABLE] {HOLD|PCHOLD} [AS name] FORMAT {ALPHA|BINARY|FOCUS}
where:
nameIs the name of the HOLD file. If omitted, the name becomes HOLD by default.
FORMAT
Is ALPHA, BINARY or FOCUS.
Note: You can issue a SET command to set the default HOLD format to either ALPHA orBINARY:
SET HOLDFORMAT=ALPHASET HOLDFORMAT=BINARY
8. Saving and Reusing Your Report Output
Creating Reports With TIBCO® WebFOCUS Language 565

Syntax: How to Specify Options for Generating Structured HOLD Files
To specify options for creating the extract, such excluding specific fields, use the * option ofthe SET EXTRACT command:
ON TABLE SET EXTRACT *EXCLUDE = (fieldname1, fieldname2, fieldname3 , ..., fieldnamen),$FIELDS={ALL|EXPLICIT},$ENDEXTRACTON TABLE HOLD AS name FORMAT {ALPHA|BINARY|FOCUS}
where:
EXCLUDE=(fieldname1, fieldname2, fieldname3,..., fieldnamen)Excludes the specified fields from the HOLD file.
,$
Is required syntax for delimiting elements in the extract block.
ALL
Includes all real fields and all DEFINE fields that are used in running the request.
EXPLICIT
Includes only those real fields and DEFINE fields that are in the display list or the BYsort field listing. DEFINE fields that are not explicitly referenced, and fields that areused to evaluate DEFINEs, are not included.
ENDEXTRACT
Ends the extract block.
Example: Creating a Structured HOLD File in ALPHA Format
TABLE FILE EMPLOYEEPRINT LAST_NAME FIRST_NAME JOBCODE ED_HRSBY DEPARTMENTBY HIGHEST SALARYON TABLE SET EXTRACT ONON TABLE HOLD FORMAT ALPHAEND
This request produces the following HOLD Master File:
FILENAME=HOLD , SUFFIX=FIX , $ SEGMENT=EMPINFO, SEGTYPE=S0, $ FIELDNAME=RECTYPE, ALIAS=R, USAGE=A3, ACTUAL=A3, $ FIELDNAME=LAST_NAME, ALIAS='LN', USAGE=A15, ACTUAL=A15, $ FIELDNAME=FIRST_NAME, ALIAS='FN', USAGE=A10, ACTUAL=A10, $ FIELDNAME=DEPARTMENT, ALIAS='DPT', USAGE=A10, ACTUAL=A10, $ FIELDNAME=ED_HRS, ALIAS='OJT', USAGE=F6.2, ACTUAL=A06, $ SEGMENT=PAYINFO, SEGTYPE=S0, PARENT=EMPINFO, $ FIELDNAME=RECTYPE, ALIAS=1, USAGE=A3, ACTUAL=A3, $ FIELDNAME=SALARY, ALIAS='SAL', USAGE=D12.2M, ACTUAL=A12, $ FIELDNAME=JOBCODE, ALIAS='JBC', USAGE=A3, ACTUAL=A03, $
Creating a Structured HOLD File
566
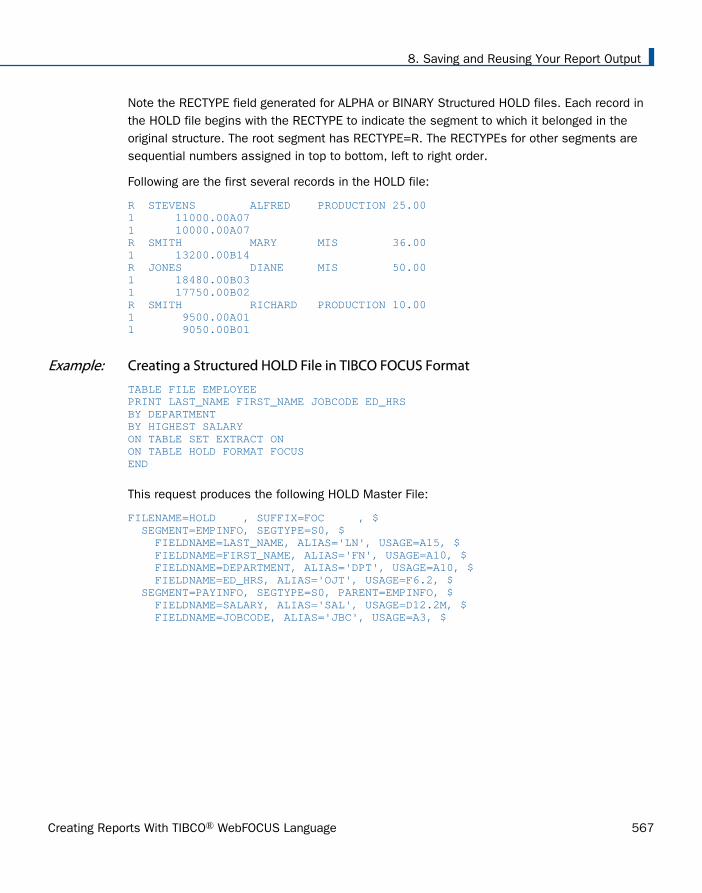
Note the RECTYPE field generated for ALPHA or BINARY Structured HOLD files. Each record inthe HOLD file begins with the RECTYPE to indicate the segment to which it belonged in theoriginal structure. The root segment has RECTYPE=R. The RECTYPEs for other segments aresequential numbers assigned in top to bottom, left to right order.
Following are the first several records in the HOLD file:
R STEVENS ALFRED PRODUCTION 25.001 11000.00A071 10000.00A07R SMITH MARY MIS 36.001 13200.00B14R JONES DIANE MIS 50.001 18480.00B031 17750.00B02R SMITH RICHARD PRODUCTION 10.001 9500.00A011 9050.00B01
Example: Creating a Structured HOLD File in TIBCO FOCUS Format
TABLE FILE EMPLOYEEPRINT LAST_NAME FIRST_NAME JOBCODE ED_HRSBY DEPARTMENTBY HIGHEST SALARYON TABLE SET EXTRACT ONON TABLE HOLD FORMAT FOCUSEND
This request produces the following HOLD Master File:
FILENAME=HOLD , SUFFIX=FOC , $ SEGMENT=EMPINFO, SEGTYPE=S0, $ FIELDNAME=LAST_NAME, ALIAS='LN', USAGE=A15, $ FIELDNAME=FIRST_NAME, ALIAS='FN', USAGE=A10, $ FIELDNAME=DEPARTMENT, ALIAS='DPT', USAGE=A10, $ FIELDNAME=ED_HRS, ALIAS='OJT', USAGE=F6.2, $ SEGMENT=PAYINFO, SEGTYPE=S0, PARENT=EMPINFO, $ FIELDNAME=SALARY, ALIAS='SAL', USAGE=D12.2M, $ FIELDNAME=JOBCODE, ALIAS='JBC', USAGE=A3, $
8. Saving and Reusing Your Report Output
Creating Reports With TIBCO® WebFOCUS Language 567

Example: Reconstituting a Structured HOLD File
The following request reconstitutes the original FOCUS data source from the Structured HOLDFile created in the example named Creating a Structured HOLD File in ALPHA Format:
TABLE FILE HOLDPRINT LAST_NAME FIRST_NAME JOBCODE ED_HRSBY DEPARTMENTBY HIGHEST SALARYON TABLE SET EXTRACT ONON TABLE HOLD AS RECONST FORMAT FOCUSEND
This request produces the following Master File:
FILENAME=RECONST , SUFFIX=FOC , $ SEGMENT=EMPINFO, SEGTYPE=S0, $ FIELDNAME=LAST_NAME, ALIAS='LN', USAGE=A15, $ FIELDNAME=FIRST_NAME, ALIAS='FN', USAGE=A10, $ FIELDNAME=DEPARTMENT, ALIAS='DPT', USAGE=A10, FIELDNAME=ED_HRS, ALIAS='OJT', USAGE=F6.2, $ SEGMENT=PAYINFO, SEGTYPE=S0, PARENT=EMPINFO, $ FIELDNAME=SALARY, ALIAS='SAL', USAGE=D12.2M, $ FIELDNAME=JOBCODE, ALIAS='JBC', USAGE=A3, $
The following request prints the report output:
TABLE FILE RECONSTPRINT LAST_NAME FIRST_NAME JOBCODE ED_HRSBY DEPARTMENTBY HIGHEST SALARYEND
Creating a Structured HOLD File
568
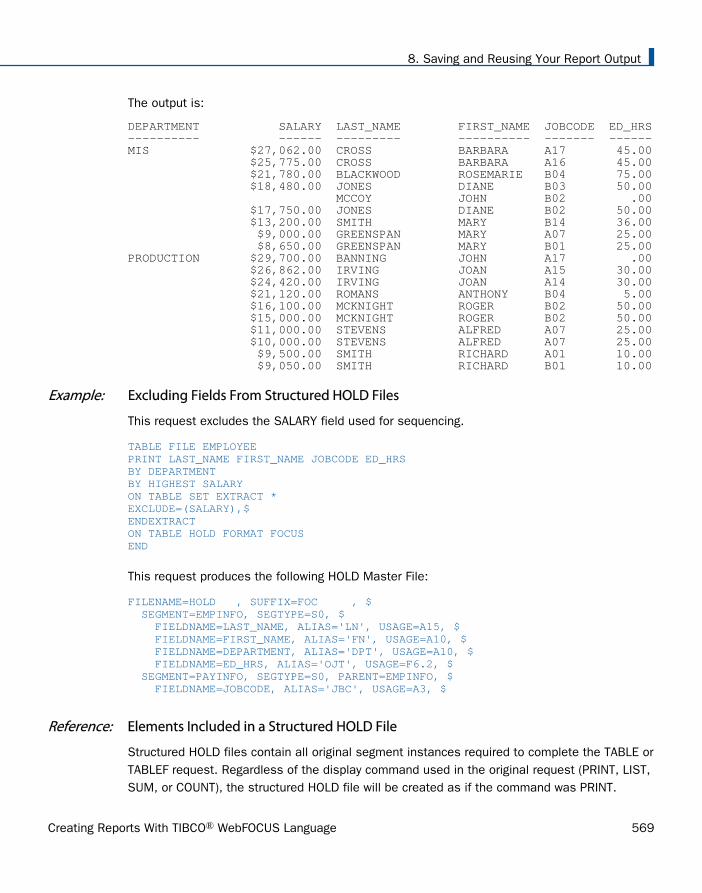
The output is:
DEPARTMENT SALARY LAST_NAME FIRST_NAME JOBCODE ED_HRS---------- ------ --------- ---------- ------- ------MIS $27,062.00 CROSS BARBARA A17 45.00 $25,775.00 CROSS BARBARA A16 45.00 $21,780.00 BLACKWOOD ROSEMARIE B04 75.00 $18,480.00 JONES DIANE B03 50.00 MCCOY JOHN B02 .00 $17,750.00 JONES DIANE B02 50.00 $13,200.00 SMITH MARY B14 36.00 $9,000.00 GREENSPAN MARY A07 25.00 $8,650.00 GREENSPAN MARY B01 25.00PRODUCTION $29,700.00 BANNING JOHN A17 .00 $26,862.00 IRVING JOAN A15 30.00 $24,420.00 IRVING JOAN A14 30.00 $21,120.00 ROMANS ANTHONY B04 5.00 $16,100.00 MCKNIGHT ROGER B02 50.00 $15,000.00 MCKNIGHT ROGER B02 50.00 $11,000.00 STEVENS ALFRED A07 25.00 $10,000.00 STEVENS ALFRED A07 25.00 $9,500.00 SMITH RICHARD A01 10.00 $9,050.00 SMITH RICHARD B01 10.00
Example: Excluding Fields From Structured HOLD Files
This request excludes the SALARY field used for sequencing.
TABLE FILE EMPLOYEEPRINT LAST_NAME FIRST_NAME JOBCODE ED_HRSBY DEPARTMENTBY HIGHEST SALARYON TABLE SET EXTRACT *EXCLUDE=(SALARY),$ENDEXTRACTON TABLE HOLD FORMAT FOCUSEND
This request produces the following HOLD Master File:
FILENAME=HOLD , SUFFIX=FOC , $ SEGMENT=EMPINFO, SEGTYPE=S0, $ FIELDNAME=LAST_NAME, ALIAS='LN', USAGE=A15, $ FIELDNAME=FIRST_NAME, ALIAS='FN', USAGE=A10, $ FIELDNAME=DEPARTMENT, ALIAS='DPT', USAGE=A10, $ FIELDNAME=ED_HRS, ALIAS='OJT', USAGE=F6.2, $ SEGMENT=PAYINFO, SEGTYPE=S0, PARENT=EMPINFO, $ FIELDNAME=JOBCODE, ALIAS='JBC', USAGE=A3, $
Reference: Elements Included in a Structured HOLD File
Structured HOLD files contain all original segment instances required to complete the TABLE orTABLEF request. Regardless of the display command used in the original request (PRINT, LIST,SUM, or COUNT), the structured HOLD file will be created as if the command was PRINT.
8. Saving and Reusing Your Report Output
Creating Reports With TIBCO® WebFOCUS Language 569
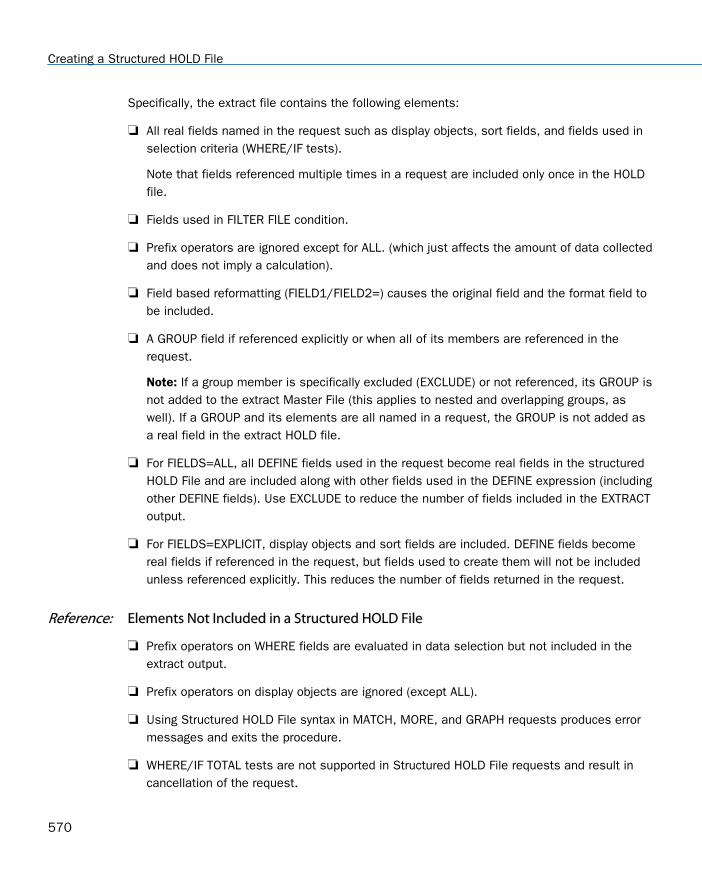
Specifically, the extract file contains the following elements:
All real fields named in the request such as display objects, sort fields, and fields used inselection criteria (WHERE/IF tests).
Note that fields referenced multiple times in a request are included only once in the HOLDfile.
Fields used in FILTER FILE condition.
Prefix operators are ignored except for ALL. (which just affects the amount of data collectedand does not imply a calculation).
Field based reformatting (FIELD1/FIELD2=) causes the original field and the format field tobe included.
A GROUP field if referenced explicitly or when all of its members are referenced in therequest.
Note: If a group member is specifically excluded (EXCLUDE) or not referenced, its GROUP isnot added to the extract Master File (this applies to nested and overlapping groups, aswell). If a GROUP and its elements are all named in a request, the GROUP is not added asa real field in the extract HOLD file.
For FIELDS=ALL, all DEFINE fields used in the request become real fields in the structuredHOLD File and are included along with other fields used in the DEFINE expression (includingother DEFINE fields). Use EXCLUDE to reduce the number of fields included in the EXTRACToutput.
For FIELDS=EXPLICIT, display objects and sort fields are included. DEFINE fields becomereal fields if referenced in the request, but fields used to create them will not be includedunless referenced explicitly. This reduces the number of fields returned in the request.
Reference: Elements Not Included in a Structured HOLD File
Prefix operators on WHERE fields are evaluated in data selection but not included in theextract output.
Prefix operators on display objects are ignored (except ALL).
Using Structured HOLD File syntax in MATCH, MORE, and GRAPH requests produces errormessages and exits the procedure.
WHERE/IF TOTAL tests are not supported in Structured HOLD File requests and result incancellation of the request.
Creating a Structured HOLD File
570

Reformatting of real fields is ignored (only the real field is included).
Computed fields are not included, but fields used in COMPUTE expressions are included inthe extract file.
Reference: Structural and Behavioral Notes
Structured HOLD File requests are subject to the same limitations on number and size offields as any other TABLE request.
Structural Notes
The following SET parameters are turned off or ignored in Structured HOLD File requests:
AUTOINDEX
AUTOPATH
AUTOSTRATEGY
EXTHOLD
EXTSORT
HOLDATTR
All SET and ON TABLE SET commands used to control output format are ignored increating the extract file.
Alternate views are respected and reflected in the structure of the extract file.
Indexed views specified in the request are respected and reflected in the structure of theoutput file.
If a request would generate a file containing two independent orphan segments becausethe parent segment is specifically excluded, a dummy system segment is created in the toact as parent of the two unrelated segments. There is only one instance of data for thatsegment. Both orphan segments refer to that system segment as parent. If the parent ismissing because it was not mentioned in the request, it is activated during the request andincluded as the parent the segments.
In the event that two unique (U) segments are included without the parent segment, theunique segments are converted to segments with SEGTYPE S0 that reference the systemsegment as parent.
JOIN and JOIN WHERE structures are supported.
8. Saving and Reusing Your Report Output
Creating Reports With TIBCO® WebFOCUS Language 571

SQL Optimization Notes
SQL optimization for aggregation must be turned off for EXTRACT requests.
BY/ACROSS/FOR Notes
BY and ACROSS sort fields become additional display objects.
BY. . .ROWS and ACROSS . . .COLUMNS function only as implicit WHEREs to limit fieldvalues included.
FOR fields are included.
RECAP fields are excluded (like COMPUTEs).
Summarization fields referencing previously identified fields are ignored in creatingStructured HOLD Files. These include: SUMMARIZE, RECOMPUTE, SUBTOTAL, SUB-TOTALACROSS-TOTAL, ROW-TOTAL and COLUMN-TOTAL.
Formatting Notes
Structured HOLD File processing ignores all formatting elements, including: IN, OVER,NOPRINT, SUP-PRINT, FOLD-LINE, SKIP-LINE, UNDER-LINE, PAGE-BREAK, TABPAGENO, AS,and column title justification. However, fields referenced within formatting commands, suchas HEADING, FOOTING, SUBHEAD, and SUBFOOT, and any WHEN expressions associatedwith them, are included.
All STYLE and STYLESHEET commands are ignored in producing extract output.
AnV and AnW fields are supported. TX fields are exported in FOCUS files only.
In the event that the FIELDNAME and ALIAS are the same for a real field and that field isredefined as itself (possibly with a different format), two fields are created in the HOLDMaster File with identical field names and aliases. In this situation, the second version ofthe field can never be accessed if referenced by name. You can use FIELDS=EXPLICIT toinclude only the second version of the field. The following DEFINE illustrates and example ofcreating a duplicate field name and alias:
DEFINE FILE CARCOUNTRY/A25=COUNTRY;END
DBA Notes
DBA controls on source files are respected when running Structured HOLD File requestswith the exception of RESTRICT=NOPRINT, where fields named in a request are notdisplayed (such fields cannot be exported and should be specifically EXCLUDED).
Creating a Structured HOLD File
572

DBA restrictions do not carry over to the HOLD Master File.
Reconstituting Extract Files
To reconstitute a FOCUS or flat file from a Structured HOLD file, you use the same syntaxused to generate the Structured HOLD File. The ON TABLE SET EXTRACT syntax must beused to preserve multipath structures.
All reconstituted FOCUS segments are SEGTYPE=S0, as neither KEY nor INDEX informationis retained. An INDEX can be reinserted using REBUILD INDEX.
8. Saving and Reusing Your Report Output
Creating Reports With TIBCO® WebFOCUS Language 573

Creating a Structured HOLD File
574

Chapter9Choosing a Display Format
You can choose from several different display formats when you display a report on thescreen. Some display formats are best suited for particular kinds of uses. For example,you can choose to display the report as:
An HTML page, which is optimized for display in a web browser.
A PDF document, which is useful when you want the report to look the same whetherdisplayed on a screen or printed.
A DHTML file, which is HTML output that has most of the features normallyassociated with output formatted for printing, such as PDF or PostScript output.
An Excel 2007 worksheet, where you can work with the data in Excel 2007 or higher.
An Excel 2000 worksheet, where you can work with the data in Excel 2000 or 2003.
You can learn which display formats are available in Report Display Formats on page576.
If you wish to send a report to a file instead of to the screen, you can learn about the fileformats that are available in Saving and Reusing Your Report Output on page 471.
In this chapter:
Report Display Formats
Preserving Leading and Internal Blanks in Report Output
Using Web Display Format: HTML
Using Print Display Formats: PDF, PS
Using Word Processing Display Formats: DOC, WP
Saving Report Output in Excel XLSX Format
Using PowerPoint PPT Display Format
Saving Report Output in PPTX Format
Creating Reports With TIBCO® WebFOCUS Language 575

Report Display Formats
You can choose from among several display formats for your report:
Web format: HTML. For more information, see Using Web Display Format: HTML on page581.
Print formats: PDF (Adobe Acrobat Portable Document Format) and PostScript (PS). Formore information, see Using Print Display Formats: PDF, PS on page 584.
Word-processing formats: WP and DOC. For more information, see Using Word ProcessingDisplay Formats: DOC, WP on page 644.
Worksheet formats: Excel 2007/2010 XML-based format, Excel 2000/2003 HTML-basedformat, with variations for Excel 2000 PivotTable and Excel 2000 FORMULA, Excel 97HTML-based format, and Excel binary format. For more information, see Saving ReportOutput in Excel XLSX Format on page 645.
A note about DHTML and HTML: DHTML is the absolute positioning version of HTML. Asarchitected, format HTML generates output in a table-based format that leaves the exactpositioning to the browser that is presenting the report. Format DHTML on the other hand isdesigned to render with the user-defined positioning in the same way as PDF. This meansthings should position on the page precisely as defined in the report procedure. PDF, DHTML,PPT, PPTX, and PS are position-based. HTML and EXL2K are table or cell based. Therefore,DHTML output looks more like PDF rather than HTML.
For information about which file formats are available for saving and reusing (as opposed todisplaying) report data, see Saving and Reusing Your Report Output on page 471.
Note: For styled output formats, setting the LINES parameter to 999 or higher generatescontinuous forms. When continuous forms are specified, but the output format has a physicalpage size (as is the case with PDF output), the column titles repeat at the top of the physicalpage, without page numbers.
Syntax: How to Choose a Display Format Using PCHOLD
You can display a report on screen using the ON TABLE PCHOLD command in a report request.
ON TABLE PCHOLD FORMAT formatname
where:
formatnameCan be one of the following:
Report Display Formats
576

DOC Specifies that the report will be displayed as a plain-text wordprocessing document, with page breaks, in Microsoft Word withinyour web browser. See ○k
Using Word Processing Display Formats: DOC, WP on page 644.
EXCEL Specifies that the report will be displayed as an Excelspreadsheet. See Saving Report Output in Excel XLSX Format onpage 645.
XLSX Specifies that the report will be displayed as an Excel2007/2010 worksheet. See Saving Report Output in Excel XLSXFormat on page 645.
EXL2K Specifies that the report will be displayed as an Excel2000/2003 worksheet.
EXL2K FORMULA Specifies that the report will be displayed as an Excel2000/2003 worksheet, with WebFOCUS totals and othercalculated values translated to active Excel formulas. (If yourreport does not contain any formulas, consider using EXL2Kformat since EXL2K FORMULA requires additional processingtime.)
EXL2K PIVOT Specifies that the report will be displayed as an Excel2000/2003 PivotTable.
EXL97 Specifies that the report will be displayed as an Excel 97worksheet.
HTML Specifies that the report will be displayed as an HTML page. See Using Web Display Format: HTML on page 581.
PDF Specifies that the report will be displayed as a PDF document(Adobe Acrobat's Portable Document Format). See Using PDFDisplay Format on page 585.
PostScript(PS)
Specifies that the report will be displayed as a PostScriptdocument. You must have installed a third party tool capable ofdisplaying PS. See Using PostScript (PS) Display Format on page621.
9. Choosing a Display Format
Creating Reports With TIBCO® WebFOCUS Language 577
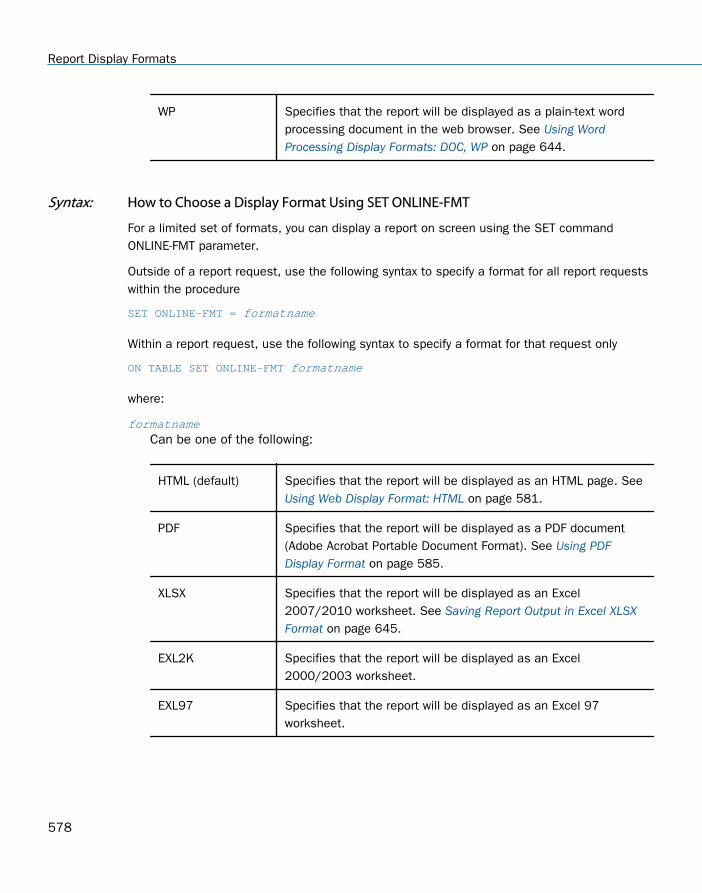
WP Specifies that the report will be displayed as a plain-text wordprocessing document in the web browser. See Using WordProcessing Display Formats: DOC, WP on page 644.
Syntax: How to Choose a Display Format Using SET ONLINE-FMT
For a limited set of formats, you can display a report on screen using the SET commandONLINE-FMT parameter.
Outside of a report request, use the following syntax to specify a format for all report requestswithin the procedure
SET ONLINE-FMT = formatname
Within a report request, use the following syntax to specify a format for that request only
ON TABLE SET ONLINE-FMT formatname
where:
formatnameCan be one of the following:
HTML (default) Specifies that the report will be displayed as an HTML page. See Using Web Display Format: HTML on page 581.
PDF Specifies that the report will be displayed as a PDF document(Adobe Acrobat Portable Document Format). See Using PDFDisplay Format on page 585.
XLSX Specifies that the report will be displayed as an Excel2007/2010 worksheet. See Saving Report Output in Excel XLSXFormat on page 645.
EXL2K Specifies that the report will be displayed as an Excel2000/2003 worksheet.
EXL97 Specifies that the report will be displayed as an Excel 97worksheet.
Report Display Formats
578
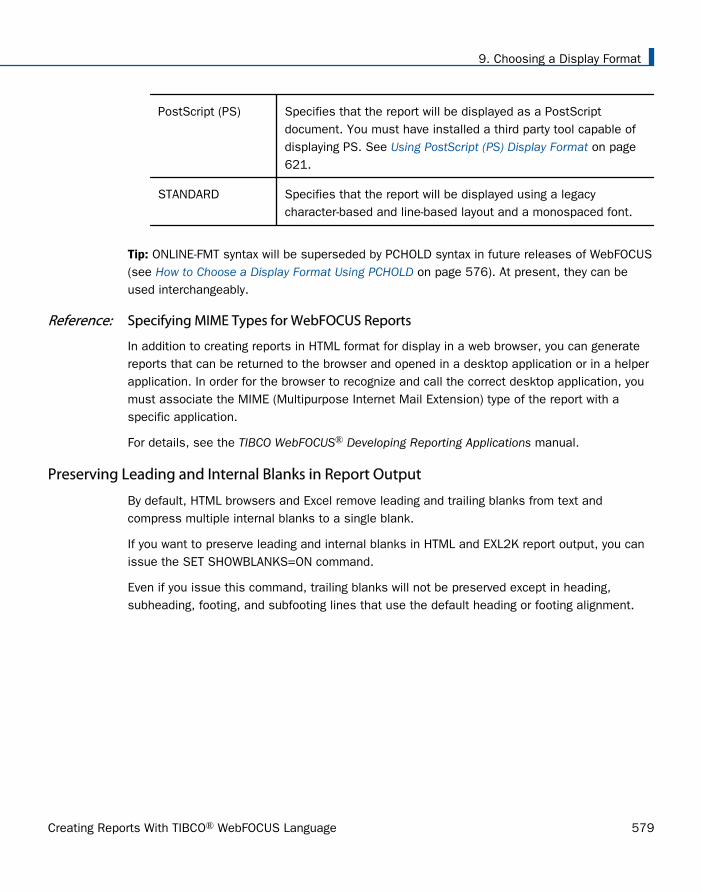
PostScript (PS) Specifies that the report will be displayed as a PostScriptdocument. You must have installed a third party tool capable ofdisplaying PS. See Using PostScript (PS) Display Format on page621.
STANDARD Specifies that the report will be displayed using a legacycharacter-based and line-based layout and a monospaced font.
Tip: ONLINE-FMT syntax will be superseded by PCHOLD syntax in future releases of WebFOCUS(see How to Choose a Display Format Using PCHOLD on page 576). At present, they can beused interchangeably.
Reference: Specifying MIME Types for WebFOCUS Reports
In addition to creating reports in HTML format for display in a web browser, you can generatereports that can be returned to the browser and opened in a desktop application or in a helperapplication. In order for the browser to recognize and call the correct desktop application, youmust associate the MIME (Multipurpose Internet Mail Extension) type of the report with aspecific application.
For details, see the TIBCO WebFOCUS® Developing Reporting Applications manual.
Preserving Leading and Internal Blanks in Report Output
By default, HTML browsers and Excel remove leading and trailing blanks from text andcompress multiple internal blanks to a single blank.
If you want to preserve leading and internal blanks in HTML and EXL2K report output, you canissue the SET SHOWBLANKS=ON command.
Even if you issue this command, trailing blanks will not be preserved except in heading,subheading, footing, and subfooting lines that use the default heading or footing alignment.
9. Choosing a Display Format
Creating Reports With TIBCO® WebFOCUS Language 579

Syntax: How to Preserve Leading and Internal Blanks in HTML and EXL2K Reports
In a FOCEXEC or in a profile, use the following syntax:
SET SHOWBLANKS = {OFF|ON}
In a request, use the following syntax
ON TABLE SET SHOWBLANKS {OFF|ON}
where:
OFF
Removes leading blanks and compresses internal blanks in HTML and EXL2K reportoutput.
ON
Preserves leading blanks and internal blanks in HTML and EXL2K report output. Alsopreserves trailing blanks in heading, subheading, footing, and subfooting lines that use thedefault heading or footing alignment.
Example: Preserving Leading and Internal Blanks in HTML and EXL2K Report Output
The following request creates a virtual field that adds leading blanks to the value ACTION andboth leading and internal blanks to the values TRAIN/EX and SCI/FI in the CATEGORY field. Italso adds trailing blanks to the value COMEDY:
SET SHOWBLANKS = OFFDEFINE FILE MOVIESNEWCAT/A30 = IF CATEGORY EQ 'ACTION' THEN ' ACTION' ELSE IF CATEGORY EQ 'SCI/FI' THEN 'SCIENCE FICTION' ELSE IF CATEGORY EQ 'TRAIN/EX' THEN ' TRAINING EXERCISE' ELSE IF CATEGORY EQ 'COMEDY' THEN 'COMEDY ' ELSE 'GENERAL';ENDTABLE FILE MOVIESSUM CATEGORY LISTPR/D12.2 COPIESBY NEWCAT
ON TABLE SET STYLE *GRID=OFF,$TYPE=REPORT, FONT=COURIER NEW,$ENDSTYLEEND
Preserving Leading and Internal Blanks in Report Output
580

With SHOWBLANKS OFF, these additional blanks are removed:
With SHOWBLANKS ON, the additional leading and internal blanks are preserved. Note thattrailing blanks are not preserved:
Using Web Display Format: HTML
You can display a report as an HTML page. HTML supports most style sheet options(especially when used with an internal cascading style sheet), allowing for full reportformatting.
By default, leading and internal blanks are compressed on the report output. For informationon preserving them, see Preserving Leading and Internal Blanks in Report Output on page 579.
For more information, see Controlling Report Formatting on page 1221.
HTML is the default display format when WebFOCUS is installed. An HTML report opens in yourweb browser.
If you do not wish to rely on the default, you can specify that a report display as an HTML pagewhen you run the report. You can use either:
PCHOLD command. For more information, see How to Choose a Display Format UsingPCHOLD on page 576.
ONLINE-FMT parameter of the SET command. For more information, see How to Choose aDisplay Format Using SET ONLINE-FMT on page 578.
9. Choosing a Display Format
Creating Reports With TIBCO® WebFOCUS Language 581
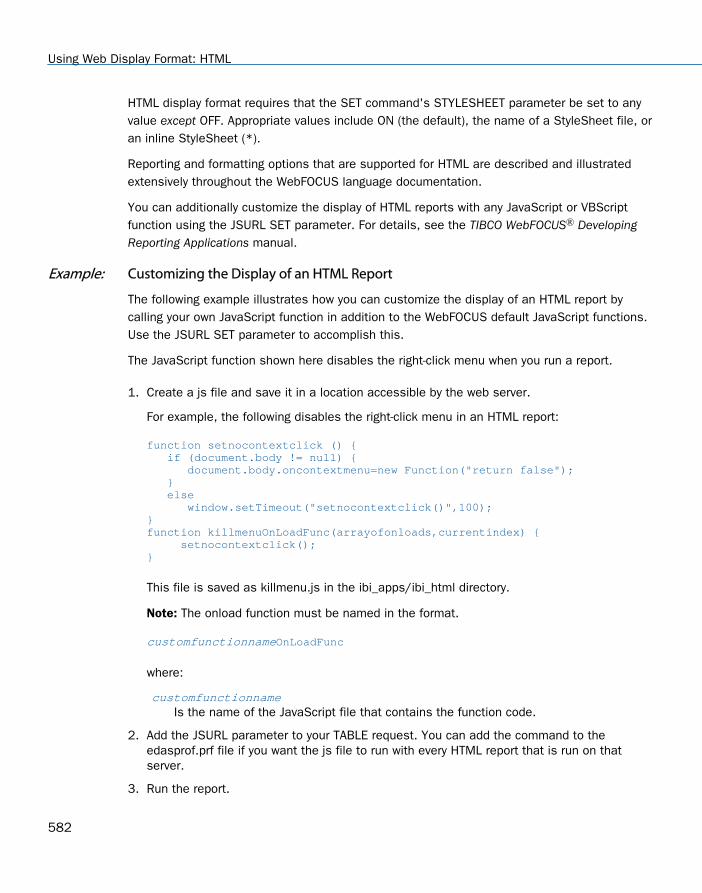
HTML display format requires that the SET command's STYLESHEET parameter be set to anyvalue except OFF. Appropriate values include ON (the default), the name of a StyleSheet file, oran inline StyleSheet (*).
Reporting and formatting options that are supported for HTML are described and illustratedextensively throughout the WebFOCUS language documentation.
You can additionally customize the display of HTML reports with any JavaScript or VBScriptfunction using the JSURL SET parameter. For details, see the TIBCO WebFOCUS® DevelopingReporting Applications manual.
Example: Customizing the Display of an HTML Report
The following example illustrates how you can customize the display of an HTML report bycalling your own JavaScript function in addition to the WebFOCUS default JavaScript functions.Use the JSURL SET parameter to accomplish this.
The JavaScript function shown here disables the right-click menu when you run a report.
1. Create a js file and save it in a location accessible by the web server.
For example, the following disables the right-click menu in an HTML report:
function setnocontextclick () { if (document.body != null) { document.body.oncontextmenu=new Function("return false"); } else window.setTimeout("setnocontextclick()",100);}function killmenuOnLoadFunc(arrayofonloads,currentindex) { setnocontextclick();}
This file is saved as killmenu.js in the ibi_apps/ibi_html directory.
Note: The onload function must be named in the format.
customfunctionnameOnLoadFunc
where:
customfunctionname Is the name of the JavaScript file that contains the function code.
2. Add the JSURL parameter to your TABLE request. You can add the command to theedasprof.prf file if you want the js file to run with every HTML report that is run on thatserver.
3. Run the report.
Using Web Display Format: HTML
582
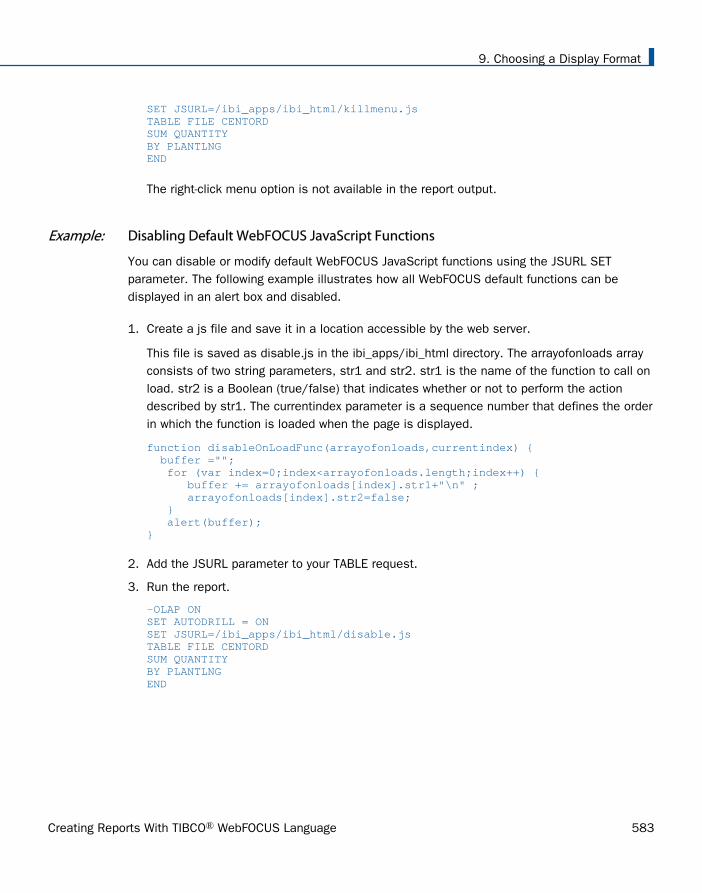
SET JSURL=/ibi_apps/ibi_html/killmenu.jsTABLE FILE CENTORDSUM QUANTITYBY PLANTLNGEND
The right-click menu option is not available in the report output.
Example: Disabling Default WebFOCUS JavaScript Functions
You can disable or modify default WebFOCUS JavaScript functions using the JSURL SETparameter. The following example illustrates how all WebFOCUS default functions can bedisplayed in an alert box and disabled.
1. Create a js file and save it in a location accessible by the web server.
This file is saved as disable.js in the ibi_apps/ibi_html directory. The arrayofonloads arrayconsists of two string parameters, str1 and str2. str1 is the name of the function to call onload. str2 is a Boolean (true/false) that indicates whether or not to perform the actiondescribed by str1. The currentindex parameter is a sequence number that defines the orderin which the function is loaded when the page is displayed.
function disableOnLoadFunc(arrayofonloads,currentindex) { buffer =""; for (var index=0;index<arrayofonloads.length;index++) { buffer += arrayofonloads[index].str1+"\n" ; arrayofonloads[index].str2=false; } alert(buffer);}
2. Add the JSURL parameter to your TABLE request.
3. Run the report.
-OLAP ONSET AUTODRILL = ONSET JSURL=/ibi_apps/ibi_html/disable.jsTABLE FILE CENTORDSUM QUANTITYBY PLANTLNGEND
9. Choosing a Display Format
Creating Reports With TIBCO® WebFOCUS Language 583
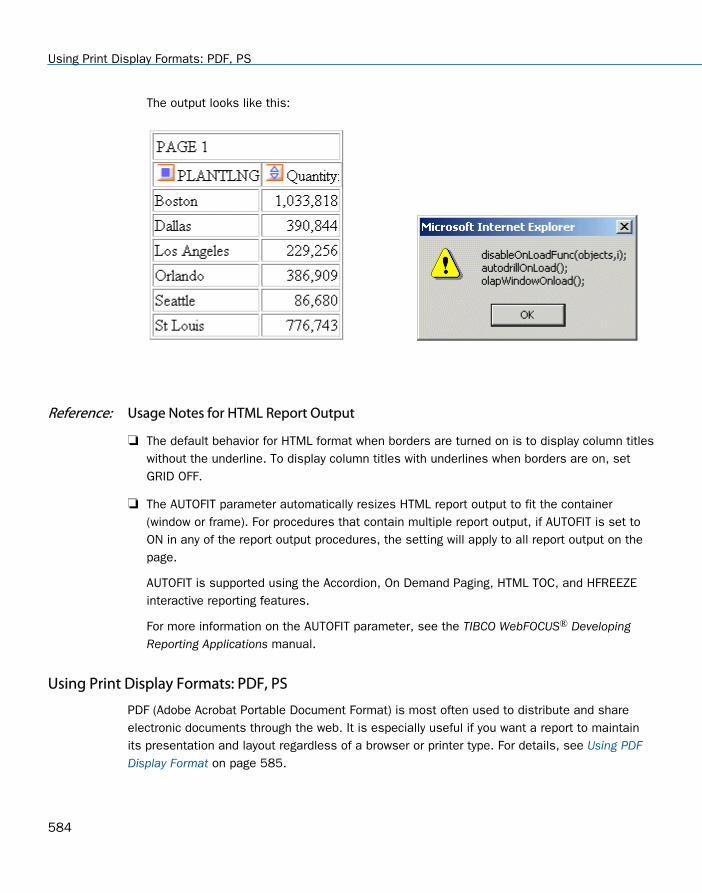
The output looks like this:
Reference: Usage Notes for HTML Report Output
The default behavior for HTML format when borders are turned on is to display column titleswithout the underline. To display column titles with underlines when borders are on, setGRID OFF.
The AUTOFIT parameter automatically resizes HTML report output to fit the container(window or frame). For procedures that contain multiple report output, if AUTOFIT is set toON in any of the report output procedures, the setting will apply to all report output on thepage.
AUTOFIT is supported using the Accordion, On Demand Paging, HTML TOC, and HFREEZEinteractive reporting features.
For more information on the AUTOFIT parameter, see the TIBCO WebFOCUS® DevelopingReporting Applications manual.
Using Print Display Formats: PDF, PS
PDF (Adobe Acrobat Portable Document Format) is most often used to distribute and shareelectronic documents through the web. It is especially useful if you want a report to maintainits presentation and layout regardless of a browser or printer type. For details, see Using PDFDisplay Format on page 585.
Using Print Display Formats: PDF, PS
584

PS (PostScript format), a print-oriented page description language, is most often used to senda report directly to a printer. While used less frequently as an online display format, you candisplay PS report output on your monitor before printing it. For details, see Using PostScript(PS) Display Format on page 621.
With the exception of drill-downs, all of the report formatting features that are supported forPDF are also supported for PostScript output.
You can specify that a report display as a PDF or PS document when you run the report. Youcan use either:
PCHOLD command. For more information, see How to Choose a Display Format UsingPCHOLD on page 576.
ONLINE-FMT parameter of the SET command. For more information, see How to Choose aDisplay Format Using SET ONLINE-FMT on page 578.
You can combine multiple styled reports into a single PDF or PS file. For details, see LayingOut the Report Page on page 1333.
PDF and PS reports, including compound reports, can be distributed using ReportCaster. Seethe TIBCO WebFOCUS® ReportCaster Guide for details.
Using PDF Display Format
You can display a report as a PDF document. PDF (Adobe Acrobat Portable Document Format)supports most StyleSheet attributes, allowing for full report formatting. The wide range ofStyleSheet features supported for PDF are described throughout this documentation.
PDF prints and displays a document consistently, regardless of the application software,hardware, and operating system used to create or display the document.
The report opens in Adobe Acrobat or Acrobat Reader within a web browser. To display a PDFreport, a computer must have Adobe Acrobat Reader installed. For free downloads of AcrobatReader, go to http://www.adobe.com.
Limit: Adobe Acrobat PDF format limits the number of pages, hyperlinks, and images in adocument. For information about what limits this creates for a WebFOCUS report in PDFformat, see Saving and Reusing Your Report Output on page 471.
Other print-oriented display formats. You can also display a report as a PostScript document.For more information, see Using PostScript (PS) Display Format on page 621.
9. Choosing a Display Format
Creating Reports With TIBCO® WebFOCUS Language 585

Syntax: How to Compress a PDF Output File
File compression can be used to minimize the physical size of the PDF output file. Using thisPDF-specific feature, you can generate smaller PDF files, making them easier to store anddistribute, while having no visible effect on the formatting or content of the reports theycontain.
SET FILECOMPRESS = {ON|OFF}
where:
ON
Compresses PDF output files.
OFF
Does not compress PDF output files. OFF is the default value.
This command applies to PDF output only. It is ignored by all other output formats, such asHTML and Excel.
Displaying Watermarks in PDF Output
Watermarks are images or text strings that are placed on the bottom layer of a document anddisplayed through the transparent layered content.
WebFOCUS backcolor does not support transparency. Therefore, standard images placedbelow it on the page may be obscured. To resolve this, in PDF reports, WebFOCUS mirrors theapproach taken by standard printers, and places an opaque image on the top of the documentlayers. With this approach, the layers of the document will be visible beneath the transparentwatermark image.
Watermark images are provided by the report developer. When creating a transparent image,the image needs to be created in GIF format with a transparent background.
Reference: Inserting Images in PDF Reports With Backcolor
Watermarks are supported for PDF output in compound reports and in single TABLE requests.Each document supports a single active watermark image. This image is designated as thewatermark image, by defining the placement order within the Z-INDEX attribute.
The first image with a Z-INDEX value will be considered the active watermark for the currentdocument. Any subsequent images, defined with style sheet attributes for Z-INDEX or OPACITY,will be displayed as standard WebFOCUS images.
Watermark images are designated by defining the following attributes in the style sheet for thetransparent GIF.
Using Print Display Formats: PDF, PS
586

Z-INDEX=TOP Designates that the image is to be handled as a watermarkimage and should always be placed on top of all other objects onthe page. This value will be respected as the topmost layer andwill be supported with other layers in future releases.
OPACITY=n Where n represents the percent (%) of OPACITY to be applied tothe image. The greater the OPACITY, the less transparent theimage. Less of the underlying report will be visible below theimage. The value for n can be any number from 0 through 100. Ifa value is not specified, it defaults to 100%, presenting a fullyopaque image.
Within a single TABLE request:
TYPE=<REPORT|HEADING>, OBJECT=IMAGE, IMAGE=<image.gif>,Z-INDEX=TOP, OPACITY=15, POSITION=(.25 .25), DIMENSION=(8 10.5),$
Within compound syntax:
On Page Master
PAGELAYOUT=ALL, NAME='Page Master', $OBJECT=IMAGE, IMAGE= internalonlyport.GIF, Z-INDEX=TOP, OPACITY=15,POSITION=(.25 .25), DIMENSION=(8 10.5),$
On Page Layout
PAGELAYOUT=1, NAME='Page Layout1', $OBJECT=IMAGE, IMAGE= internalonlyport.GIF, Z-INDEX=TOP, OPACITY=15,POSITION=(.25 .25), DIMENSION=(8 10.5),$
Example: Inserting Transparent Images Into a PDF Report
The following request against the GGSALES data source places the coffee image (coffee.gif) onthe page and layers the watermark image (internalonlyport.gif) on top. These images aredisplayed on every page of the report.
9. Choosing a Display Format
Creating Reports With TIBCO® WebFOCUS Language 587

TABLE FILE GGSALESSUM GGSALES.SALES01.DOLLARS/D12CM GGSALES.SALES01.UNITS/D12C GGSALES.SALES01.BUDDOLLARS/D12CM GGSALES.SALES01.BUDUNITS/D12CBY GGSALES.SALES01.REGIONBY GGSALES.SALES01.CATEGORYBY GGSALES.SALES01.PRODUCTHEADING"Gotham Grinds""Product Sales By Region"ON TABLE SET PAGE-NUM NOLEADON TABLE NOTOTALON TABLE PCHOLD FORMAT PDFON TABLE SET HTMLCSS ONON TABLE SET STYLE * INCLUDE = endeflt, TOPMARGIN=.5, BOTTOMMARGIN=.5, LEFTMARGIN=1, RIGHTMARGIN=1,$TYPE=REPORT, OBJECT=IMAGE, IMAGE=internalonlyport.gif, POSITION=(+0.70000 +0.70000), SIZE=(7 7.5), Z-INDEX=TOP, OPACITY=15, $TYPE=REPORT, OBJECT=IMAGE, IMAGE=coffee.gif, POSITION=(+1.0 +0.5), SIZE=(.5 .5),$ENDSTYLEEND
Using Print Display Formats: PDF, PS
588

The output is:
9. Choosing a Display Format
Creating Reports With TIBCO® WebFOCUS Language 589

Features Supported
The following core PDF features are supported with watermarks:
Standard TABLE requests, including reports with paneling
Compound report (MERGE=OFF)
Coordinated compound report (MERGE=ON)
Old compound syntax (OPEN/CLOSE)
Drilldown
Drillthrough
Bookmarks
Borders/backcolor
Limits
OPACITY must be between 0 and 100, inclusive.
A single watermark image is supported for a single document.
Usage Notes
For new compound syntax, the first watermark image found in the syntax will be used forthe report. Any other watermark images found in the code will be ignored or displayed asstandard WebFOCUS images.
For old compound syntax, the watermark image must be in the first report. If it is not in thefirst report, a FOC3362 message is generated.
The embedded PDF viewer for a browser may not display NLS characters correctly. If NLScharacters do not display correctly, use font embedding, as described in Adding PostScriptType 1 Fonts for PS and PDF Formats on page 626, or configure your browser to useAdobe Reader.
Scaling PDF Report Output to Fit the Page Width
By default, if PDF report output is too wide to fit on a single page, the report generates multiplepanels of the same page for the columns that do not fit. The page numbers specify the pageand panel numbers. For example, page numbers 1.1 and 1.2 represent page 1/panel 1 andpage 1/panel 2.
Using Print Display Formats: PDF, PS
590

You can scale the output to fit across the width of the page using the PAGE-SCALE StyleSheetattribute or the PAGE-SCALE SET parameter.
Reference: Usage Notes for PAGE-SCALE
PAGE-SCALE is supported for PDF report output only.
When a page is scaled to fit more content on the page horizontally, fewer vertical pagesmay be generated, as well.
Example: Scaling PDF Report Output to Fit the Page Width
The following request generates PDF report output without using page scaling.
SET SQUEEZE=ONDEFINE FILE WF_RETAIL_LITESHOWPIC/A100='C:\ibi\WebFOCUS82\samples\web_resource\signin\images\favicon.jpg';END
TABLE FILE WF_RETAIL_LITEPRINT PRODUCT_CATEGORYCOGS_US REVENUE_US MSRP_US DISCOUNT_US GROSS_PROFIT_US QUANTITY_SOLDBY SHOWPIC NOPRINTBY CONTINENT_NAMEBY COUNTRY_NAMEWHERE COUNTRY_NAME EQ 'FRANCE' OR 'ITALY'WHERE RECORDLIMIT=3000;ON TABLE SUBHEAD" "" "" Report Without PDF Scaling "" "" "ON COUNTRY_NAME SUBHEAD" "" "ON TABLE PCHOLD FORMAT PDF
ON TABLE SET STYLE *TYPE=DATA, COLUMN=CONTINENT_NAME, FONT=COMIC SANS MS, COLOR=BLUE, STYLE=BOLD+ITALIC, $TYPE=DATA, COLUMN=PRODUCT_CATEGORY, COLOR=FUSCHIA, $TYPE=HEADING, STYLE=BOLD, COLOR=RGB(0 35 95), SIZE=12, JUSTIFY=CENTER, $TYPE=SUBHEAD, SIZE=18, STYLE=BOLD, COLOR=RED, $TYPE=SUBHEAD, IMAGE=(SHOWPIC), SIZE=(.5 .5), $TYPE=TABHEADING, SIZE=12, STYLE=BOLD, JUSTIFY=CENTER, $ENDSTYLEEND
9. Choosing a Display Format
Creating Reports With TIBCO® WebFOCUS Language 591

Note: The image displayed in the subheading is distributed with WebFOCUS. The path to theimage is dependent on your platform and installation options. The path in the request uses thedefault installation directory on Windows.
Using Print Display Formats: PDF, PS
592

The output is too wide for the page and is paneled. Page 1.1 has the columns that fit acrossthe width of the page, as shown in the following image.
9. Choosing a Display Format
Creating Reports With TIBCO® WebFOCUS Language 593

Page 1.2 has the remaining columns, as shown in the following image.
Using Print Display Formats: PDF, PS
594
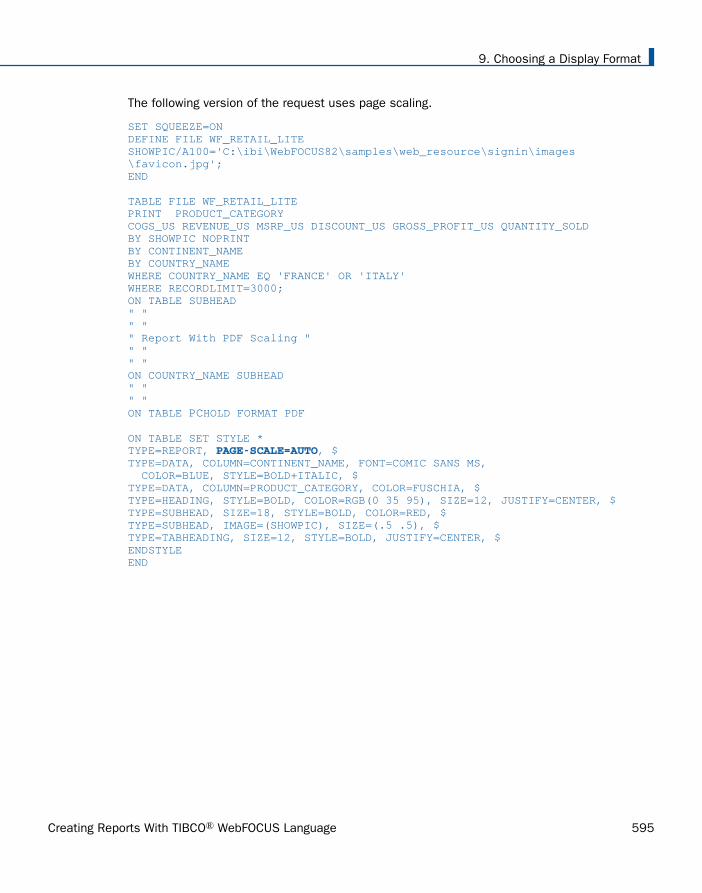
The following version of the request uses page scaling.
SET SQUEEZE=ONDEFINE FILE WF_RETAIL_LITESHOWPIC/A100='C:\ibi\WebFOCUS82\samples\web_resource\signin\images\favicon.jpg';END
TABLE FILE WF_RETAIL_LITEPRINT PRODUCT_CATEGORYCOGS_US REVENUE_US MSRP_US DISCOUNT_US GROSS_PROFIT_US QUANTITY_SOLDBY SHOWPIC NOPRINTBY CONTINENT_NAMEBY COUNTRY_NAMEWHERE COUNTRY_NAME EQ 'FRANCE' OR 'ITALY'WHERE RECORDLIMIT=3000;ON TABLE SUBHEAD" "" "" Report With PDF Scaling "" "" "ON COUNTRY_NAME SUBHEAD" "" "ON TABLE PCHOLD FORMAT PDF
ON TABLE SET STYLE *TYPE=REPORT, PAGE-SCALE=AUTO, $TYPE=DATA, COLUMN=CONTINENT_NAME, FONT=COMIC SANS MS, COLOR=BLUE, STYLE=BOLD+ITALIC, $TYPE=DATA, COLUMN=PRODUCT_CATEGORY, COLOR=FUSCHIA, $TYPE=HEADING, STYLE=BOLD, COLOR=RGB(0 35 95), SIZE=12, JUSTIFY=CENTER, $TYPE=SUBHEAD, SIZE=18, STYLE=BOLD, COLOR=RED, $TYPE=SUBHEAD, IMAGE=(SHOWPIC), SIZE=(.5 .5), $TYPE=TABHEADING, SIZE=12, STYLE=BOLD, JUSTIFY=CENTER, $ENDSTYLEEND
9. Choosing a Display Format
Creating Reports With TIBCO® WebFOCUS Language 595

The output is shown in the following image. All of the columns fit across the width of the page,with no paneling.
Using Print Display Formats: PDF, PS
596

Aligning a PDF Report Within a Page
You can left-align, center, or right-align an entire PDF report within a page by using theJUSTIFYREPORT StyleSheet attribute.
To left-align, center, or right-align a PDF report, include the following syntax in your procedure.
TYPE=REPORT, JUSTIFYREPORT={LEFT|CENTER|RIGHT},$
Example: Left-Aligning a PDF Report Within a Page
To left-align a PDF report, include the TYPE=REPORT, JUSTIFYREPORT=LEFT attribute, asshown in the following procedure.
TABLE FILE GGSALESSUM BUDDOLLARSBY REGIONBY CATEGORY
HEADING"Budget Dollars By Region and Product Category "" "FOOTING"End of Report "" "ON TABLE SET PAGE-NUM NOLEADON TABLE PCHOLD FORMAT PDF
ON TABLE SET STYLE *SQUEEZE=ON, GRID=ON, $TYPE=REPORT, JUSTIFYREPORT=LEFT,$ENDSTYLE
END
9. Choosing a Display Format
Creating Reports With TIBCO® WebFOCUS Language 597

The output is:
Example: Centering a PDF Report Within a Page
To center a PDF report, include the TYPE=REPORT, JUSTIFYREPORT=CENTER attribute, asshown in the following procedure.
TABLE FILE GGSALESSUM BUDDOLLARSBY REGIONBY CATEGORY
HEADING"Budget Dollars By Region and Product Category "" "FOOTING"End of Report "" "ON TABLE SET PAGE-NUM NOLEADON TABLE PCHOLD FORMAT PDF
ON TABLE SET STYLE *SQUEEZE=ON, GRID=ON, $TYPE=REPORT, JUSTIFYREPORT=CENTER,$ENDSTYLE
END
Using Print Display Formats: PDF, PS
598

The output is:
Example: Right-Aligning a PDF Report Within a Page
To right-align a PDF report, include the TYPE=REPORT, JUSTIFYREPORT=RIGHT attribute, asshown in the following procedure.
TABLE FILE GGSALESSUM BUDDOLLARSBY REGIONBY CATEGORY
HEADING"Budget Dollars By Region and Product Category "" "FOOTING"End of Report "" "ON TABLE SET PAGE-NUM NOLEADON TABLE PCHOLD FORMAT PDF
ON TABLE SET STYLE *SQUEEZE=ON, GRID=ON, $TYPE=REPORT, JUSTIFYREPORT=RIGHT,$ENDSTYLE
END
9. Choosing a Display Format
Creating Reports With TIBCO® WebFOCUS Language 599
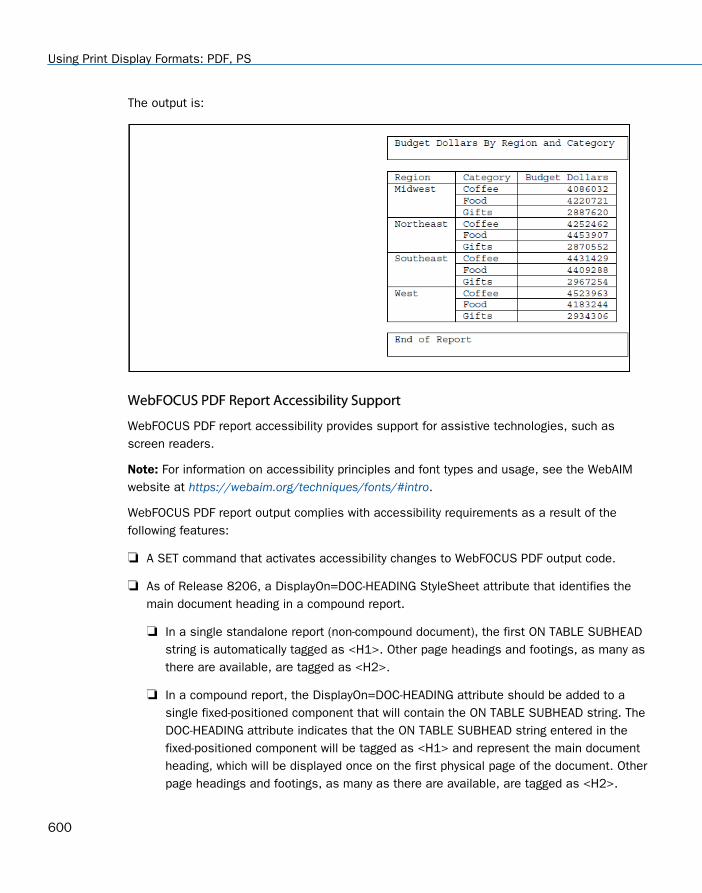
The output is:
WebFOCUS PDF Report Accessibility Support
WebFOCUS PDF report accessibility provides support for assistive technologies, such asscreen readers.
Note: For information on accessibility principles and font types and usage, see the WebAIMwebsite at https://webaim.org/techniques/fonts/#intro.
WebFOCUS PDF report output complies with accessibility requirements as a result of thefollowing features:
A SET command that activates accessibility changes to WebFOCUS PDF output code.
As of Release 8206, a DisplayOn=DOC-HEADING StyleSheet attribute that identifies themain document heading in a compound report.
In a single standalone report (non-compound document), the first ON TABLE SUBHEADstring is automatically tagged as <H1>. Other page headings and footings, as many asthere are available, are tagged as <H2>.
In a compound report, the DisplayOn=DOC-HEADING attribute should be added to asingle fixed-positioned component that will contain the ON TABLE SUBHEAD string. TheDOC-HEADING attribute indicates that the ON TABLE SUBHEAD string entered in thefixed-positioned component will be tagged as <H1> and represent the main documentheading, which will be displayed once on the first physical page of the document. Otherpage headings and footings, as many as there are available, are tagged as <H2>.
Using Print Display Formats: PDF, PS
600

A USEASTITLES StyleSheet attribute that places and aligns custom column titles in aheading.
A BOOKMARK StyleSheet attribute that enables you to go directly to a destination in adocument.
An ALT StyleSheet attribute that describes an image embedded in a report.
An ALT StyleSheet attribute that provides a description of a drill-down component.
A LANG attribute that identifies the default language of the document.
Report output, with the SET ACCESSPDF command enabled, is created withBYDISPLAY=ON, which produces a value in each cell for sort (BY) fields.
Note: It is the responsibility of the report developer to follow general accessibility standards inorder for the report to be 508 compliant.
Controlling PDF Code For Accessibility
The SET ACCESSPDF command enables accessibility for PDF reports.
Syntax: How to Control PDF Code Accessibility
For all requests in a procedure or in a profile:
SET ACCESSPDF = {508|OFF}
For a single request:
ON TABLE SET ACCESSPDF {508|OFF}
where:
508
Generates a PDF file compliant with Section 508 accessibility requirements.
OFF
Generates a PDF file that is non-compliant with Section 508 accessibility requirements.This value is the default.
Example: Controlling PDF Code for Accessibility
The following request generates accessible PDF report output. The SET and SUBHEADcommands that enable accessibility appear in boldface.
9. Choosing a Display Format
Creating Reports With TIBCO® WebFOCUS Language 601

TABLE FILE GGSALESSUM DOLLARS/D12MBY REGIONBY CATEGORYON REGION SUBTOTAL AS 'Total for 'HEADING" ""Sales Report"" "ON TABLE SET ACCESSPDF 508 ON TABLE SET PAGE-NUM OFFON TABLE COLUMN-TOTAL AS 'Grand Total'ON TABLE SUBHEAD "Regional Totals by Category"ON TABLE PCHOLD FORMAT PDFON TABLE SET STYLE *TYPE=REPORT, FONT='ARIAL',$TYPE=TITLE, COLUMN=N1, FONT='ARIAL', STYLE=BOLD,$TYPE=TITLE, COLUMN=N2, FONT='ARIAL', STYLE=BOLD,$TYPE=TITLE, COLUMN=N3, FONT='ARIAL', STYLE=BOLD,$TYPE=HEADING, SIZE=14, STYLE=BOLD,$ TYPE=TABHEADING, SIZE=16, STYLE=BOLD,$TYPE=SUBTOTAL, BY=1, STYLE=BOLD,$TYPE=GRANDTOTAL, FONT='ARIAL', STYLE=BOLD,$ENDSTYLEEND
WebFOCUS generates the following tags when SET ACCESSPDF is set to 508.
Page Heading
Heading tags <H1> and <H2> and are automatically generated by WebFOCUS.
Using Print Display Formats: PDF, PS
602

Column Titles
Row tags <TR> and header cell tags <TH> are generated by WebFOCUS. The column title isaligned with the appropriate data columns.
9. Choosing a Display Format
Creating Reports With TIBCO® WebFOCUS Language 603
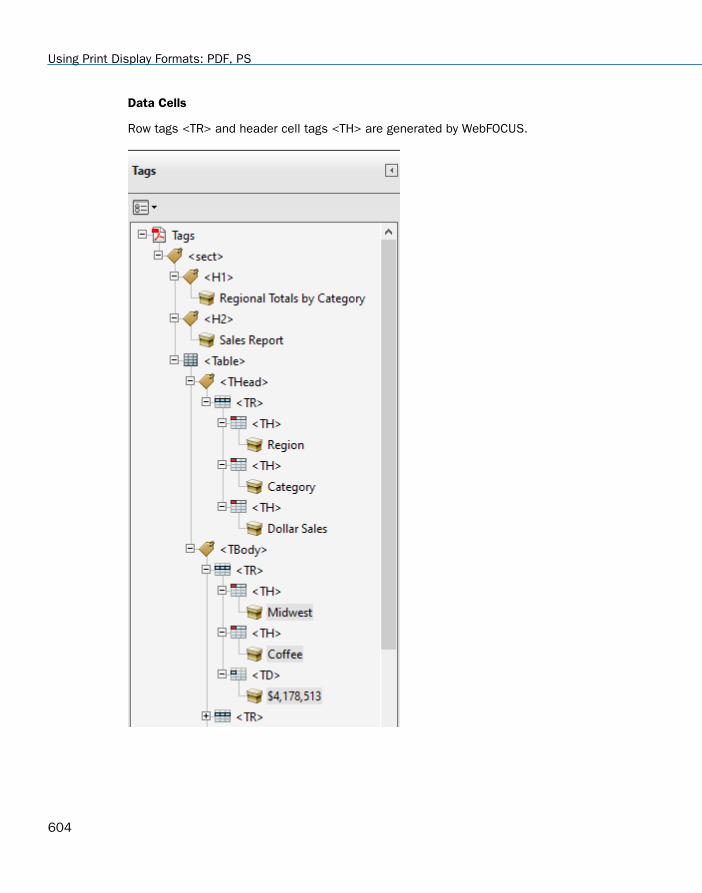
Data Cells
Row tags <TR> and header cell tags <TH> are generated by WebFOCUS.
Using Print Display Formats: PDF, PS
604

The output is:
Aligning Elements in a Page Heading With Column Data
The USEASTITLES StyleSheet attribute for PDF reports enables you to place and align customcolumn titles (AS='text') in the heading, rather than use the default column titles. TheUSEASTITLES attribute associates column titles in the heading with the appropriate datacolumn.
Syntax: How to Align Elements in a Page Heading With Column Data
TYPE=HEADING, USEASTITLES=ON, HEADALIGN=BODY,$
9. Choosing a Display Format
Creating Reports With TIBCO® WebFOCUS Language 605

USEASTITLES=ON can only be set for the entire HEADING. HEADALIGN=BODY must also be setfor the HEADING.
To use this attribute in App Studio:
The Report Output Format is PDF.
The Alignment Grid is enabled for the Page Heading.
Add a Page Heading to the report.
Right-click the Page Heading and select Alignment Grid.
On the Insert Alignment Grid dialog box, select the Align with Data option and click OK.
In the Page Heading, right-click the alignment grid and select Align column title (Section508).
Example: Aligning Elements in a Page Heading to Column Data
The USEASTITLES attribute that enables the alignment of the heading elements is in bold.Note that the HEADALIGN=BODY attribute is also in bold.
Using Print Display Formats: PDF, PS
606

TABLE FILE GGSALESSUM DOLLARS/D12M AS ''BY REGION AS ''BY CATEGORY AS ''ON REGION SUBTOTAL AS 'Total for 'HEADING" ""Sales Report"" <+0> <+0> ""Region<+0>Category<+0>Dollar Sales"ON TABLE SET ACCESSPDF 508ON TABLE SET PAGE-NUM OFF ON TABLE COLUMN-TOTAL AS 'Grand Total'ON TABLE SUBHEAD "Regional Totals by Category <+1"ON TABLE PCHOLD FORMAT PDFON TABLE SET STYLE *$TYPE=REPORT, FONT='ARIAL',$TYPE=TITLE, COLUMN=N1, FONT='ARIAL', STYLE=BOLD,$TYPE=TITLE, COLUMN=N2, FONT='ARIAL', STYLE=BOLD,$TYPE=TITLE, COLUMN=N3, FONT='ARIAL', STYLE=BOLD,$TYPE=HEADING, SIZE=14, STYLE=BOLD,HEADALIGN=BODY, USEASTITLES=ON,$ TYPE=HEADING, LINE=2, OBJECT=TEXT, ITEM=1, COLSPAN=3, JUSTIFY=LEFT,$TYPE=HEADING, LINE=3, OBJECT=TEXT, ITEM=1, COLSPAN=1, JUSTIFY=LEFT,$TYPE=HEADING, LINE=3, OBJECT=TEXT, ITEM=2, SIZE=10, COLSPAN=1, JUSTIFY=RIGHT,$TYPE=HEADING, LINE=3, OBJECT=TEXT, ITEM=3, SIZE=10, COLSPAN=1, JUSTIFY=RIGHT,$TYPE=HEADING, LINE=4, OBJECT=TEXT, ITEM=1, SIZE=11, COLSPAN=1, JUSTIFY=LEFT,$TYPE=HEADING, LINE=4, OBJECT=TEXT, ITEM=2, SIZE=11, COLSPAN=1, JUSTIFY=LEFT,$TYPE=HEADING, LINE=4, OBJECT=TEXT, ITEM=3, SIZE=11, COLSPAN=1, JUSTIFY=RIGHT,$TYPE=TABHEADING, SIZE=16, STYLE=BOLD,$TYPE=SUBTOTAL, BY=1, STYLE=BOLD,$TYPE=GRANDTOTAL, FONT='ARIAL', STYLE=BOLD,$ENDSTYLEEND
9. Choosing a Display Format
Creating Reports With TIBCO® WebFOCUS Language 607

WebFOCUS generates the following tags when the USEASTITLES attribute is used.
Page Heading and Column Titles
Row tags <TR> and header cell tags <TH> are generated by WebFOCUS. Along with the PageHeading, the column titles are also tagged as header cells <TH>.
Using Print Display Formats: PDF, PS
608

The output is:
Adding Bookmarks
Bookmarks are links in the navigation pane that enable you to go directly to a destination inthe document. Using bookmarks enables you to jump from the tagged items in the navigationpane directly to the page where the item is located. The benefit of using bookmarks inconjunction with a screen reader is that you will be able to navigate a defined hierarchy withouthaving to listen to the reading of the entire document. For more information about navigatingPDF Bookmarks, see the Adobe documentation on the Adobe Web site, www.adobe.com.
9. Choosing a Display Format
Creating Reports With TIBCO® WebFOCUS Language 609

Note:
Since a PDF document is a complete file, you can use bookmarks and scrolling to navigatethrough the file. You can easily navigate through a document, especially documents thatare two or more pages in length.
You can generate bookmarks within WebFOCUS by including the BOOKMARKS and/or TOCobject in the compound layout syntax. Then, in the component definitions, specify the Tableof Contents level and description. You can also optionally specify the BYTOC levels.
For 508 compliance, it is recommended that the Bookmark object be used.
Example: Adding Bookmarks to the Compound Layout
The BOOKMARK attribute that enables the alignment is in bold. The TOC-LEVEL=1 andBYTOC=2 attributes for both reports are also in bold. These attributes are explained below:
TOC-LEVEL=n
Defines n as the Table of Contents level for the report layout object. This option defines thehierarchical order of objects within the Table of Contents.
0 = the object is not shown in the Table of Contents.
1 = the object is shown as a first-level item in the Table of Contents.
2 = the object is shown as a second-level item in the Table of Contents, and so on.
BYTOC=m
Specifies the number of BY fields to be included within the current component entry (m).
The following request adds bookmarks and specifies the main document heading for thecompound report. The report0 component uses the DisplayOn=DOC-HEADING attribute toindicate that the ON TABLE SUBHEAD string from the report0 component should be tagged asthe main document heading in the PDF output.
Using Print Display Formats: PDF, PS
610

SET ACCESSPDF = 508COMPOUND LAYOUT PCHOLD FORMAT PDFOBJECT=BOOKMARKS,$ SECTION=S1, LAYOUT=ON, MERGE=OFF, ORIENTATION=PORTRAIT,$PAGELAYOUT=1,$COMPONENT=report0, position=(1 0.5), Dimension=(* *),DisplayOn=DOC-HEADING, $COMPONENT=report1, TEXT='This is the Title for Report 1',TOC-LEVEL=1,BYTOC=2, POSITION=(1 1), DIMENSION=(* *),$COMPONENT=report2, TEXT='Sales By Region',TOC-LEVEL=1, BYTOC=2, POSITION=(+0.00 +0.519), DIMENSION=(* *), RELATIVE-TO='report1',REQUIRED-SPACE=(*3.5), RELATIVE-POINT=BOTTOM-LEFT, POSITION-POINT=TOP-LEFT,$END
SET COMPONENT=report0TABLE FILE GGSALESBY CATEGORY NOPRINTON TABLE SUBHEAD" ""DOLLAR SALES REPORT"" "" "ON TABLE SET PAGE-NUM OFFON TABLE HOLD FORMAT PDFON TABLE SET STYLE *TYPE=TABHEADING , SIZE=18, FONT=ARIAL, STYLE=BOLD, JUSTIFY=CENTER,$ENDSTYLEEND
SET COMPONENT=report1TABLE FILE GGSALESSUM DOLLARS/F8MBY CATEGORYBY PRODUCTBY REGIONBY STON CATEGORY PAGE-BREAKWHERE PRODUCT NE 'Capuccino'ON CATEGORY SUBTOTAL AS 'Subtotal for: 'HEADING"Sales by Category"" "ON TABLE HOLD FORMAT PDFON TABLE SET PAGE-NUM OFFON TABLE NOTOTALON TABLE SET STYLE *TYPE=REPORT, SIZE=10, FONT=ARIAL,$TYPE=HEADING, SIZE=14, FONT=ARIAL, STYLE=BOLD, JUSTIFY=CENTER,$TYPE=SUBTOTAL, SIZE=10, STYLE=BOLD,$ENDSTYLEEND
9. Choosing a Display Format
Creating Reports With TIBCO® WebFOCUS Language 611

SET COMPONENT=report2TABLE FILE GGSALESSUM DOLLARS/F8MBY REGIONBY STBY CATEGORYBY PRODUCTON REGION PAGE-BREAKWHERE PRODUCT NE 'Capuccino'ON REGION SUBTOTAL AS 'Subtotal for: 'HEADING"Sales by Region"" "ON TABLE HOLD FORMAT PDFON TABLE SET PAGE-NUM OFFON TABLE NOTOTALON TABLE SET STYLE *TYPE=REPORT, SIZE=10, FONT=ARIAL,$TYPE=HEADING, SIZE=14, FONT=ARIAL, STYLE=BOLD, JUSTIFY=CENTER,$TYPE=SUBTOTAL, SIZE=10, STYLE=BOLD,$ENDSTYLEENDCOMPOUND END
The report output, with bookmarks, is shown below.
Using Print Display Formats: PDF, PS
612

Notice that the hierarchy tree in the Bookmarks pane has two levels for each report and isdetermined with the BYTOC attribute. The title for each report in the Bookmarks tree isdetermined with the TEXT attribute, as shown in the following image.
The first three pages of the PDF output, with the Tags panel, are shown in the followingimages. Note that only the first page of output contains the <H1> heading, DOLLAR SALESREPORT. The other headings are tagged as <H2>.
9. Choosing a Display Format
Creating Reports With TIBCO® WebFOCUS Language 613

Page 1
Using Print Display Formats: PDF, PS
614

Page 2
Page 3
9. Choosing a Display Format
Creating Reports With TIBCO® WebFOCUS Language 615
Adding Descriptive Text to an Image
The ALT attribute in a WebFOCUS StyleSheet adds descriptive text to an embedded image in aPDF report. The ALT attribute in the StyleSheet generates a PDF ALT attribute on the <IMG>tag.
The ALT tag is displayed in the PDF when you hover the mouse over the image.
Procedure: How to Add Descriptive Text to an Image
ALT='description'
where:
description
Is a brief description of the image, enclosed in single quotation marks (‘). The length canbe a maximum of 256 characters.
For details on the StyleSheet syntax for adding an image, see Adding an Image to a Report onpage 1464.
Example: Adding Descriptive Text to an Image
This request adds the TIBCO® logo to a report heading. It uses the WebFOCUS StyleSheet ALTattribute to add descriptive text (TIBCO logo) that identifies the image.
Using Print Display Formats: PDF, PS
616

TABLE FILE GGSALESSUM DOLLARS/D12NBY REGIONBY CATEGORYON REGION SUBTOTAL AS 'Total sales: 'ON REGION PAGE-BREAKHEADING"Sales Report"" "" "" "" "" "ON TABLE SET ACCESSPDF 508ON TABLE SET PAGE-NUM OFFON TABLE NOTOTALON TABLE PCHOLD FORMAT PDFON TABLE SUBHEAD "Regional Totals by Category"ON TABLE SET STYLE * UNITS=IN, SQUEEZE=ON, ORIENTATION=PORTRAIT,$TYPE=REPORT, GRID=OFF, FONT='ARIAL', SIZE=9,$TYPE=TITLE, STYLE=BOLD,$TYPE=HEADING, SIZE=12, STYLE=BOLD, JUSTIFY=CENTER,$TYPE=TABHEADING, SIZE=14, STYLE=BOLD, JUSTIFY=CENTER,$TYPE=SUBTOTAL, BACKCOLOR=RGB(210 210 210), STYLE=BOLD,$TYPE=REPORT, IMAGE=tibco.png, ALT='TIBCO logo',POSITION=(0 .5),$ENDSTYLEEND
9. Choosing a Display Format
Creating Reports With TIBCO® WebFOCUS Language 617

The report is:
When the request is run, hovering the mouse over the image displays the descriptive text. Thistext is read by accessibility tools, such as JAWS.
Describing Drill Down Information
When ACCESSPDF is enabled, the developer can provide a description of the Drill Down usingthe ALT attribute in a WebFOCUS StyleSheet. In the PDF report, JAWS will read the value of theDrill Down component along with the ALT text.
Including a description of the detail component of a Drill Down report supports accessibility.
Syntax: How to Add Descriptive Drill Down Information
ALT='description'
where:
description
Is the description of the Drill Down information in a report, enclosed in single quotationmarks (‘). The length can be a maximum of 256 characters.
For details on the StyleSheet syntax for Drill Down reports, see Linking a Report to OtherResources on page 821.
Using Print Display Formats: PDF, PS
618

TABLE FILE GGSALESSUM DOLLARS/D12NBY REGIONBY CATEGORYON REGION SUBTOTAL AS 'Total sales: 'HEADING" "ON TABLE SET ACCESSPDF 508ON TABLE SET PAGE-NUM OFFON TABLE NOTOTALON TABLE SUBHEAD "Sales Report"ON TABLE PCHOLD FORMAT PDFON TABLE SET STYLE * UNITS=IN, SQUEEZE=ON, ORIENTATION=PORTRAIT, SUMMARY='508 Sales report example', TITLETEXT='508 Sales report example',$TYPE=REPORT, GRID=OFF, FONT='ARIAL', SIZE=9,$TYPE=DATA, COLUMN=N2,ALT='Drill Down to detail report.', \ FOCEXEC=508drill01detail( REGION=N1 CATEGORY=N2 ),$TYPE=TITLE, STYLE=BOLD,$TYPE=TABHEADING, SIZE=12, STYLE=BOLD, JUSTIFY=CENTER,$TYPE=HEADING, SIZE=12, STYLE=BOLD, JUSTIFY=CENTER,$TYPE=SUBTOTAL, BACKCOLOR=RGB(210 210 210), STYLE=BOLD,$ENDSTYLEEND
Note the ALT attribute and associated text in BOLD.
9. Choosing a Display Format
Creating Reports With TIBCO® WebFOCUS Language 619
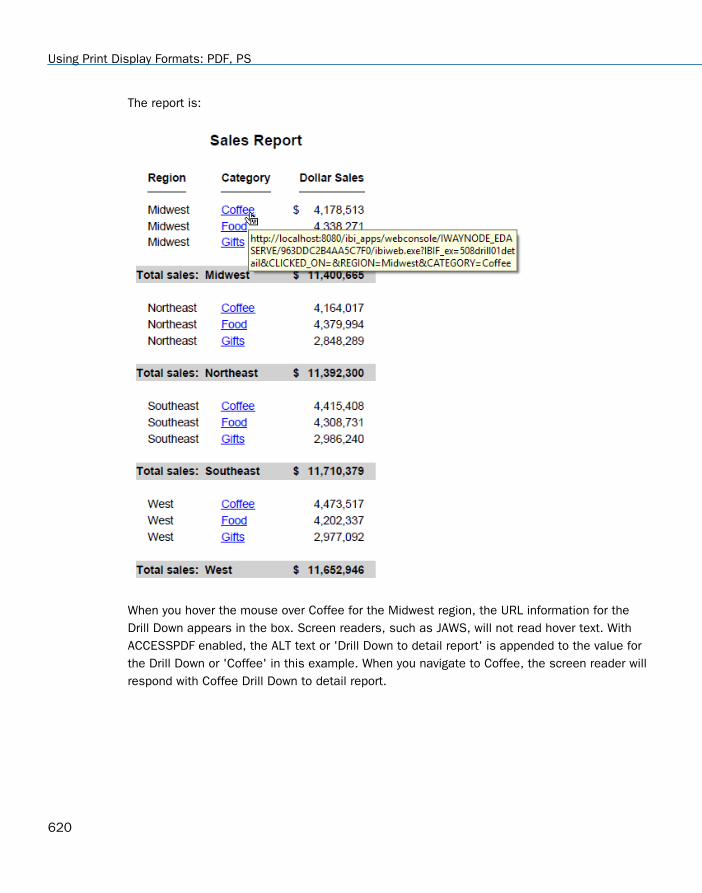
The report is:
When you hover the mouse over Coffee for the Midwest region, the URL information for theDrill Down appears in the box. Screen readers, such as JAWS, will not read hover text. WithACCESSPDF enabled, the ALT text or 'Drill Down to detail report' is appended to the value forthe Drill Down or 'Coffee' in this example. When you navigate to Coffee, the screen reader willrespond with Coffee Drill Down to detail report.
Using Print Display Formats: PDF, PS
620

Note:
Users that use screen readers, such as JAWS, may need more information regarding theDrill Down link. In the above example, notice that there are multiple hyperlinks for the valueCoffee. This functionality, along with the 'read current cell' command, allows the user tounderstand the difference in those values. The screen reader command to 'read currentcell' in JAWS is the Ctrl+Alt+Num5 shortcut. In this example, JAWS would respond to the'read current cell' command with column two, row two, region Midwest, link Coffee DrillDown to detail report.
If you are opening the output in Adobe Reader, make sure you specify the FOCEXURLsetting to provide the URL context of the WebFOCUS environment the Drill Down is to callback to. In addition, the FOCEXURL value has to have the parameter to specify that therequest is a Drill Down request. For example:
-SET &FOCEXURL='http://host:port/ibi_apps/WFServlet?IBIF_webapp= /ibi_apps' | '&';-SET &FOCEXURL=&FOCEXURL | 'IBIMR_drill=IBFS,RUNFEX,IBIF_ex,true' | '&';-SET &FOCEXURL=&FOCEXURL | 'IBIC_server=EDASERVE' | '&';-SET &FOCEXURL=&FOCEXURL | 'IBIAPP_app=ibisamp' | '&';SET FOCEXURL='&FOCEXURL'
Accessibility Limitations
Reports using the following elements are not accessible:
If a procedure does not contain the SET PAGE-NUM=OFF or ON TABLE SET PAGE-NUM OFFcommand, the page number will be announced two times by the screen reader.
ACROSS and OVER reports.
Financial Modeling Language (FML).
FOLD-LINE. Accessibility is disabled when FOLD-LINE is used in a report.
Fixed monetary edit options (N, !d, !e, !l and !y) including the Credit Negative (CR). Aunique cell is created for the noted monetary options or CR option.
Text included or designed in FOOTING, SUBHEAD, SUBFOOT, RECAP, SUMMARIZE, andRECOMPUTE commands do not generate row header tags.
Using PostScript (PS) Display Format
You can display a report as a PostScript document. PostScript (format PS) is a print-orientedpage description language. As a display format, it may be helpful if you wish to see the reportoutput on your monitor before printing it using PostScript.
9. Choosing a Display Format
Creating Reports With TIBCO® WebFOCUS Language 621

To display a PostScript report, a computer must have a third-party PostScript applicationinstalled, such as GSview (a graphical interface for Ghostscript).
If you are sending a PS report to a printer from WebFOCUS or from ReportCaster, you canselect the size of the paper on which to print the output. The PostScript code that is generatedworks on PS printers that support Language Level 2 or above. It is ignored, without harmfuleffects, on Level 1 printers. For details, see How to Select Paper Size in a PostScript (PS)Report on page 622. This capability is only supported for the PostScript format.
Other print-oriented display formats. You can also display a report as a PDF document. Formore information, see Using PDF Display Format on page 585.
Procedure: How to Select Paper Size in a PostScript (PS) Report
PAGESIZE and ORIENTATION are two WebFOCUS StyleSheet options that are used to display areport. You can enable these features in printed documents using the SET parameterPSPAGESETUP. You can then select the size of the paper on which to print a PostScript reportby selecting a PAGESIZE option.
Complete these steps:
1. Place the following SET parameter before or within your request
SET PSPAGESETUP= ON
or
ON TABLE SET PSPAGESETUP ON
OFF is the default setting.
2. Include your PAGESIZE specification in a SET command or StyleSheet declaration in therequest
SET PAGESIZE= option
or
ON TABLE SET PAGESIZE option
or
PAGESIZE=option, $
where:
optionCan be any paper size supported for your printer. LETTER is the default setting.
Using Print Display Formats: PDF, PS
622
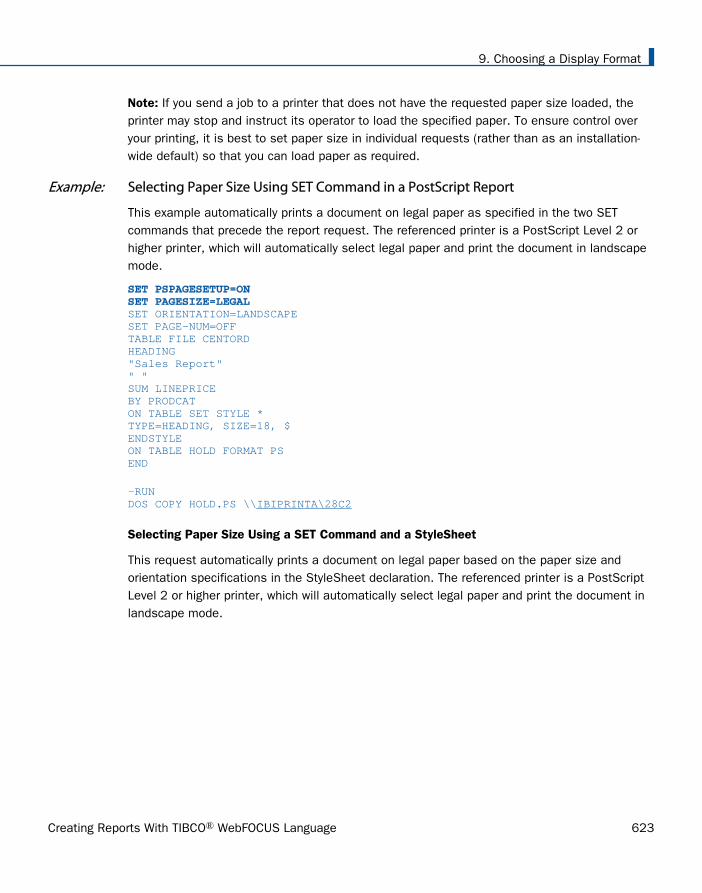
Note: If you send a job to a printer that does not have the requested paper size loaded, theprinter may stop and instruct its operator to load the specified paper. To ensure control overyour printing, it is best to set paper size in individual requests (rather than as an installation-wide default) so that you can load paper as required.
Example: Selecting Paper Size Using SET Command in a PostScript Report
This example automatically prints a document on legal paper as specified in the two SETcommands that precede the report request. The referenced printer is a PostScript Level 2 orhigher printer, which will automatically select legal paper and print the document in landscapemode.
SET PSPAGESETUP=ONSET PAGESIZE=LEGAL SET ORIENTATION=LANDSCAPESET PAGE-NUM=OFFTABLE FILE CENTORDHEADING"Sales Report"" "SUM LINEPRICEBY PRODCATON TABLE SET STYLE *TYPE=HEADING, SIZE=18, $ENDSTYLEON TABLE HOLD FORMAT PSEND
-RUNDOS COPY HOLD.PS \\IBIPRINTA\28C2
Selecting Paper Size Using a SET Command and a StyleSheet
This request automatically prints a document on legal paper based on the paper size andorientation specifications in the StyleSheet declaration. The referenced printer is a PostScriptLevel 2 or higher printer, which will automatically select legal paper and print the document inlandscape mode.
9. Choosing a Display Format
Creating Reports With TIBCO® WebFOCUS Language 623
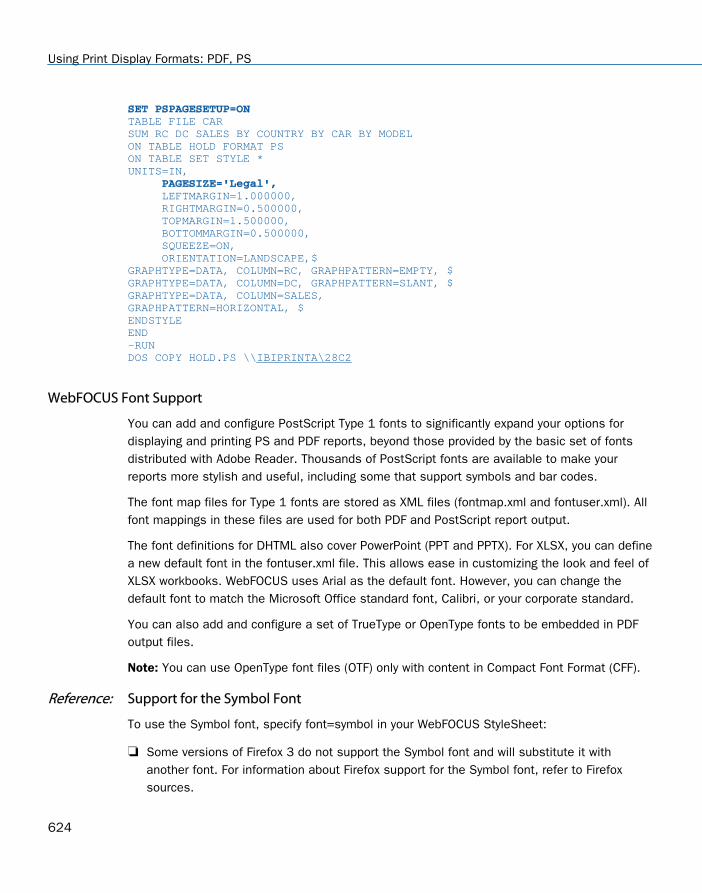
SET PSPAGESETUP=ON TABLE FILE CARSUM RC DC SALES BY COUNTRY BY CAR BY MODELON TABLE HOLD FORMAT PSON TABLE SET STYLE *UNITS=IN, PAGESIZE='Legal', LEFTMARGIN=1.000000, RIGHTMARGIN=0.500000, TOPMARGIN=1.500000, BOTTOMMARGIN=0.500000, SQUEEZE=ON, ORIENTATION=LANDSCAPE,$GRAPHTYPE=DATA, COLUMN=RC, GRAPHPATTERN=EMPTY, $GRAPHTYPE=DATA, COLUMN=DC, GRAPHPATTERN=SLANT, $GRAPHTYPE=DATA, COLUMN=SALES, GRAPHPATTERN=HORIZONTAL, $ENDSTYLEEND-RUNDOS COPY HOLD.PS \\IBIPRINTA\28C2
WebFOCUS Font Support
You can add and configure PostScript Type 1 fonts to significantly expand your options fordisplaying and printing PS and PDF reports, beyond those provided by the basic set of fontsdistributed with Adobe Reader. Thousands of PostScript fonts are available to make yourreports more stylish and useful, including some that support symbols and bar codes.
The font map files for Type 1 fonts are stored as XML files (fontmap.xml and fontuser.xml). Allfont mappings in these files are used for both PDF and PostScript report output.
The font definitions for DHTML also cover PowerPoint (PPT and PPTX). For XLSX, you can definea new default font in the fontuser.xml file. This allows ease in customizing the look and feel ofXLSX workbooks. WebFOCUS uses Arial as the default font. However, you can change thedefault font to match the Microsoft Office standard font, Calibri, or your corporate standard.
You can also add and configure a set of TrueType or OpenType fonts to be embedded in PDFoutput files.
Note: You can use OpenType font files (OTF) only with content in Compact Font Format (CFF).
Reference: Support for the Symbol Font
To use the Symbol font, specify font=symbol in your WebFOCUS StyleSheet:
Some versions of Firefox 3 do not support the Symbol font and will substitute it withanother font. For information about Firefox support for the Symbol font, refer to Firefoxsources.
Using Print Display Formats: PDF, PS
624

The Euro character displays in PDF output because the Adobe Symbol character setincludes the Euro character.
The Euro character does not display in DHTML, PPT, and PPTX report output because theWindows Symbol character set does not include the Euro character.
The following style options can be rendered with the Symbol font:
DHTML, PPT, and PPTX support style=normal, bold, italic, and bold+italic.
PDF supports only style=normal. Any other style specified in the StyleSheet will bemapped to normal.
How WebFOCUS Uses Type 1 Fonts
WebFOCUS generates a PDF or PS document from scratch. In order to do that, it mustphysically embed all the objects it displays or prints, including images and fonts, in thedocument itself.
When you execute a report and specify one of these formats as your display format, theWebFOCUS Reporting Server retrieves the data and begins to format the report. Fonts andimages specified in the StyleSheet must be available to the Reporting Server to create theoutput file. It reads the font information from the font files and embeds that information intothe document. The font itself is stored on the Reporting Server.
To ensure that the Reporting Server can locate the required information, you must define andmap it in the following files:
Font file, usually a PFB (Printer Font Binary) file. This file contains the information aboutthe shape to draw for each character of the font. The information in the font file is scalable,which means that a single font file can be used to generate characters of any size. Note,however, that bold and italic variations of the typeface are separate fonts. An alternativeASCII format, PFA, can also be used by WebFOCUS. In addition to PFB and PFA font files,you can use OTF font files to enable more flexibility in customizing PDF files, such assupport for expanded character sets and layout features, and cross-platform compatibility.
Adobe Font Metrics (AFM) file. This file is distributed with all Adobe fonts. It containsinformation about the size of each character in each font. WebFOCUS uses this informationto lay out the report on the page. Note that the three built-in fonts also have AFM files,which are distributed with WebFOCUS. However, these fonts do not require font files, sincethe fonts are built in to Adobe Reader.
Note: A Printer Font Metrics (PFM) file is also available. This file is used by applicationssuch as Adobe Reader for laying out text, however it is not supported by WebFOCUS. Youmust use the AFM file.
9. Choosing a Display Format
Creating Reports With TIBCO® WebFOCUS Language 625
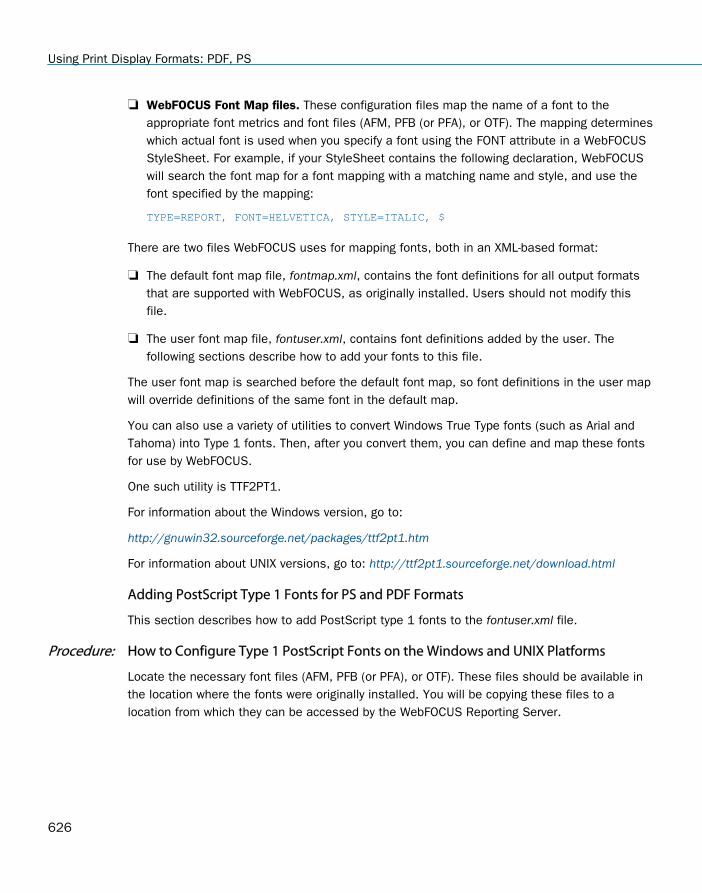
WebFOCUS Font Map files. These configuration files map the name of a font to theappropriate font metrics and font files (AFM, PFB (or PFA), or OTF). The mapping determineswhich actual font is used when you specify a font using the FONT attribute in a WebFOCUSStyleSheet. For example, if your StyleSheet contains the following declaration, WebFOCUSwill search the font map for a font mapping with a matching name and style, and use thefont specified by the mapping:
TYPE=REPORT, FONT=HELVETICA, STYLE=ITALIC, $
There are two files WebFOCUS uses for mapping fonts, both in an XML-based format:
The default font map file, fontmap.xml, contains the font definitions for all output formatsthat are supported with WebFOCUS, as originally installed. Users should not modify thisfile.
The user font map file, fontuser.xml, contains font definitions added by the user. Thefollowing sections describe how to add your fonts to this file.
The user font map is searched before the default font map, so font definitions in the user mapwill override definitions of the same font in the default map.
You can also use a variety of utilities to convert Windows True Type fonts (such as Arial andTahoma) into Type 1 fonts. Then, after you convert them, you can define and map these fontsfor use by WebFOCUS.
One such utility is TTF2PT1.
For information about the Windows version, go to:
http://gnuwin32.sourceforge.net/packages/ttf2pt1.htm
For information about UNIX versions, go to: http://ttf2pt1.sourceforge.net/download.html
Adding PostScript Type 1 Fonts for PS and PDF Formats
This section describes how to add PostScript type 1 fonts to the fontuser.xml file.
Procedure: How to Configure Type 1 PostScript Fonts on the Windows and UNIX Platforms
Locate the necessary font files (AFM, PFB (or PFA), or OTF). These files should be available inthe location where the fonts were originally installed. You will be copying these files to alocation from which they can be accessed by the WebFOCUS Reporting Server.
Using Print Display Formats: PDF, PS
626

Tip:
You may need to run an installer program to install these in a directory on your Windows orUNIX machine. Note that the fonts do not have to be installed on a client machine in orderto be used, since they will be embedded in the PDF or PostScript files created byWebFOCUS. PDF files with these embedded fonts can be displayed on any machine thathas Adobe Reader (or a similar PDF viewer), and PostScript files with these embeddedfonts can be printed on any PostScript printer (or displayed in a PostScript viewer such asGhostView).
Note that PFB files are binary, so if they are FTPed from another machine, they must beFTPed in BINARY mode.
The maximum number of embedded fonts supported in a PDF report is 63.
After you have located the font files you wish to add, you can set up WebFOCUS to use one ormore Type 1 fonts.
1. For each font you wish to add, copy the AFM, PFB (or PFA), and OTF files into the etcsubdirectory of your WebFOCUS configuration directory. On a Windows machine, thelocation is usually:
drive:\ibi\srv82\wfs\etc
where:
wfs
Is your WebFOCUS configuration directory (it may have a different name depending oninstallation options, but should always be a directory directly under drive:\ibi\srv82).Note that home is the other directory directly under drive:\ibi\srv82.
Under Unix, the location is /ibi/srv82/wfs/etc, assuming that the Reporting Serverwas installed in /ibi/srv82.
Keeping user font files in this directory allows user font files to remain separate fromthe default font files (under \ibi\srv82\home) so they can be easily preserved ifWebFOCUS is updated to a new release.
After you copy these files, you can rename them to any descriptive name.
2. The user font map file, fontuser.xml, is created by the installer in the same directory. Usinga text editor, add your font definitions to this file using the syntax described in thefollowing section, How to Add Fonts to the Font Map on page 629.
9. Choosing a Display Format
Creating Reports With TIBCO® WebFOCUS Language 627

Procedure: How to Configure Type 1 PostScript Fonts on z/OS Under PDS Deployment
After you have located the font files you wish to add, you can configure WebFOCUS to use oneor more Type 1 fonts.
1. Copy the AFM (font metrics) file into the PDS allocated to DDNAME EDACCFG in theReporting Server JCL. You can copy this file from another machine using FTP in standardASCII (text) mode. The member name of the AFM file in this PDS will match the metricsfilevalue in the font map file.
Note: If the Windows font file names contain underscore characters or are longer thaneight characters, you must rename them, since these are not valid for z/OS membernames.
2. You can use either PFB (binary) fonts or PFA (ASCII) fonts:
If you are using PFB (binary) fonts, create a partitioned data set, put the PFB file in it(for example, using FTP in BINARY mode), and concatenate this data set to the dataset already allocated to DDNAME EDAHBIN in the WebFOCUS Reporting Server JCL.
This PDS should be created with the following DCB attributes:
RECFM: VB LRECL: 1028 BLKSIZE: 27998
The member name in this PDS should match the fontfile name in the font map file.
If you copy the PFB font file into the PDS using FTP, you must use BINARY mode. Themember name of the PFB file in this PDS will match the fontfile value in the font mapfile.
If you are using PFA (ASCII) font files, create a PDS (separate from the one you use forPFB fonts), put the PFA file in it (for example, using FTP in regular, ASCII mode), andconcatenate this data set to the data set already allocated to DDNAME EDAHETC inthe Reporting Server JCL. This PDS should be created with the following DCBattributes:
RECFM: VB LRECL: 2044 BLKSIZE: 27998
The member name in this PDS should match the fontfile value in the font map file.Note that you can use PFB and PFA files simultaneously. The fonttype attribute in thefont map file (PFB or PFA) tells WebFOCUS which PDS to search for the specifiedmember name.
3. The user font map file is in member FONTUSER in the data set allocated to DDNAMEEDACCFG. Using a text editor, add your font definition to the user font map using thesyntax described in How to Add Fonts to the Font Map on page 629.
Using Print Display Formats: PDF, PS
628

Syntax: How to Add Fonts to the Font Map
The Type 1 PostScript fonts used with the PostScript and PDF output formats use separatefont files for each variant of the font: normal, bold, italic, and bold-italic. This grouping ofrelated fonts is called a font family.
The XML font map syntax uses two XML tags, <family> and <font>, to represent this structure.The example uses the family name Garamond. For example:
<family name="garamond"> <font style="normal" metricsfile="gdrg" fontfile="gdrg" fonttype="PFB" /> <font style="bold" metricsfile="gdb" fontfile="gdb" fonttype="PFB" /> <font style="italic" metricsfile="gdi" fontfile="gdi" fonttype="PFB" /> <font style="bold+italic" metricsfile="gdbi" fontfile="gdbi" fonttype="PFB" /></family>
The following example uses the family name otf. For example:
<family name="otf"> <font style="normal" metricsfile="otfn" fontfile="otfn" fonttype="OTF" /> <font style="bold" metricsfile="otfb" fontfile="otfb" fonttype="OTF" /> <font style="italic" metricsfile="otfi" fontfile="otfi" fonttype="OTF" /> <font style="bold+italic" metricsfile="otfbi" fontfile="otfbi" fonttype="OTF" /></family>
The basics of the XML syntax are:
Tag names (such as family and font) and attribute names (such as style or metricsfile) mustbe in lowercase. Attribute values, such as font file names, are case-insensitive.
Attribute values, which is the text after the equal sign (=), must be in double quotationmarks (for example, "bold")
Elements that have no explicit end-tag must end with />. (For example, the family tag hasthe closing tag </family>, but the font tag has no closing tag, so it ends with />.)
Comments are enclosed in special delimiters:
<!-- This is a comment -->
Line breaks may be placed between attribute-value pairs.
A more complete description of XML syntax can be found here:
9. Choosing a Display Format
Creating Reports With TIBCO® WebFOCUS Language 629

http://en.wikipedia.org/wiki/Xml
The family element
The family element specifies the name of a font family. This family name, specified in thename attribute of the family element, is the name by which the font will be referenced in aStyleSheet. It corresponds to the value of the FONT attribute in the StyleSheet. The end-tag </family> closes the family element, and any number of additional family elements may follow.
Font family names should be composed of letters (A-Z, a-z), digits, and limited specialcharacters, such as a minus sign (-), underscore (_), and blank. Font family names should havea maximum length of 40 characters. Since the font name is only a reference to a mapping inthe font map, it does not need to be related to the actual name of the font (which WebFOCUSobtains from the mapped AFM file) or the file name of the font.
Font elements
Nested within each family element are one or more font elements that specify the font files foreach font in the family. For example, there may be one font element for the font GaramondRegular (normal), one for Garamond Italic (italic). Since a font element has no child elements,it is closed with "/>".
The actual name of the font as used in the PDF or PostScript document is taken from the fontmetric file.
Fonts defined in the user font file (fontuser.xml) can override default font definitions infontmap.xml. Thus, you should be careful to choose family names that do not conflict withexisting definitions, unless you actually wish to override these definitions (which shouldgenerally not be done).
Each font element contains the following attributes:
style: This attribute specifies the style of the font and corresponds to the STYLE attributein the StyleSheet. The allowed values are "normal", "bold", "italic", and "bold+italic". Forexample, the font defined in the following bold italic font element:
<font style="bold+italic" metricsfile="gdbi" fontfile="gdbi" fonttype="PFB" />
could be referenced in the StyleSheet like this:
TYPE=REPORT, FONT=GARAMOND, STYLE=BOLD+ITALIC, $
Although most fonts have a font file for each of the four styles, some specialized fontssuch as bar code fonts might only have a single style (usually "normal"). Only the stylesthat exist for a particular font need to be specified in the font map file.
Using Print Display Formats: PDF, PS
630

The actual names of the fonts may vary. Some fonts may be called "oblique" rather than"italic", or "heavy" rather than "bold". However, the font map and StyleSheet always usethe keywords "normal", "bold", "italic" and "bold+italic".
metricsfile: This attribute specifies the name of the Adobe Font Metrics (AFM) file thatprovides the measurements of the font. You should only use the base name of the file (forexample, "gdrg", not "gdrg.afm"). On Windows and UNIX systems, the file is assumed tohave the extension .afm and reside in the wfs/etc directory. On z/OS with PDS deployment,the name refers to a member in the PDS allocated to EDACCFG. For information about filelocations, see How to Configure Type 1 PostScript Fonts on the Windows and UNIX Platformson page 626 orHow to Configure Type 1 PostScript Fonts on z/OS Under PDS Deployment onpage 628.
File names should be composed of letters and numbers, and should not contain blanks. OnWindows and UNIX systems, the file names may also contain underscore characters. OnUNIX systems, the file names should not contain uppercase letters. Since the files must belocated in specific directories, no directory paths or drive letters are allowed.
fonttype: This attribute specifies the type of the font file. The allowed values are "PFA","PFB", or "OTF".
fontfile: This attribute specifies the name of the PFB or PFA file that contains the font itself.As with metricsfile, the value specifies only the base file name (the fonttype attributespecifies the type). On Windows and UNIX, the file is assumed to have the extension .pfbfor binary (PFB) font files or .pfa for ASCII (PFA) font files, and should reside in the samedirectory as the AFM files (wfs/etc). On z/OS with PDS deployment, the name refers to amember in the appropriate PDS.
Additional items of XML syntax include the XML header on the first line of the file and the<fontmap> and <when> elements that enclose all of the family elements. The <when> tagallows the same font mappings to be used for both PDF and PostScript reports across outputformats. These can include PDF, PS, and DHTML. PPT and PPTX formats will use fontsspecified for DHTML. If no <when> is specified, the font will be available for all formats.
9. Choosing a Display Format
Creating Reports With TIBCO® WebFOCUS Language 631

The following is a complete example of a user font map:
<?xml version="1.0" encoding="UTF-8" ?><!-- Example of a user font map file with two font families. --><fontmap version="1"> <when format="PDF PS"> <family name="garamond"> <font style="normal" metricsfile="gdrg" fontfile="gdrg" fonttype="PFB" /> <font style="bold" metricsfile="gdb" fontfile="gdb" fonttype="PFB" /> <font style="italic" metricsfile="gdi" fontfile="gdi" fonttype="PFB" /> <font style="bold+italic" metricsfile="gdbi" fontfile="gdbi" fonttype="PFB" /> </family> <!-- This font only has a "normal" style, others omitted. --> <family name="ocra"> <font style="normal" metricsfile="ocra" fontfile="ocra" fonttype="PFB" /> </family> </when></fontmap>
Example: WebFOCUS StyleSheet Declaration
Once the font map files have been set up, the newly mapped fonts can be used in aWebFOCUS StyleSheet. For example, to use the Garamond fonts:
ON TABLE SET STYLE *type=report, font=garamond, size=12, $type=title, font=garamond, style=bold, color=blue, $ENDSTYLE
Since the style attribute has been omitted for the report font in the StyleSheet, it defaults tonormal. Attributes such as size and color can also be applied.
Reference: Editing the Font Map File
There is a byte order mark (BOM) at the beginning of the user font map file (fontuser.xml),which must be preserved for this file to be read correctly.
If you are using a Unicode-aware editor, such as Notepad on Windows, to edit the file, the BOMwill not be visible, but you can preserve it by making sure that you select an encoding of UTF-8in the Save-As dialog. In most other editors, such as vi on UNIX or the ISPF editor under z/OS,the BOM will display as three or four strange-looking characters at the beginning of the file. Aslong as you do not delete or modify these characters, the BOM will be preserved.
Using Print Display Formats: PDF, PS
632

Reference: The WebFOCUS Default Font Map
Since the user font map is searched before the WebFOCUS default font map, font definitions inthe user font map file will override mappings of the same font in the default font map file.Since you usually would not want to override existing font mappings, you can check which fontnames are already used by WebFOCUS by examining the default font map file.
On Windows platforms, it can be found in
drive:\ibi\srv82\home\etc\style\fontmap.xml
On UNIX, it can be found in a similarly named directory.
On z/OS with PDS deployment, the default font map file is in the FONTMAP member of theprefix.P.HOME.ERR partitioned data set. Unlike the user font map file, this file has separatesections containing definitions for PS, PDF, and DHTML formats.
Note: The DHTML mappings are used for the DHTML and PowerPoint output formats, which donot support user-added fonts.
Since the font mappings in the default font map file are for fonts that are already assumed toexist on the user machines (for example, built-in Adobe Reader fonts, standard PostScriptprinter fonts, or standard Windows fonts), they do not reference font files, only font metricsfiles. Fonts provided by the user should reference both font files and metrics files.
AFM files for the default fonts can be found in drive:\ibi\srv82\home\etc\style (or members ofprefix.P.HOME.ERR with z/OS under PDS deployment).
Procedure: How to Define a Default Font in the Font Map
An individual default font can be set for each output type and/or language setting within anoutput type. This setting should be defined in the fontuser.xml file rather than the fontmap.xmlfile. Fontmap.xml may be updated by a future release installation, so customizations may belost. Additionally, the settings in fontuser.xml override settings in fontmap.xml.
Note:
Fontmap.xml can be found in ..\ibi\srvXX\home\etc\style, where XX is your server release.
Fontuser.xml can be found in ..\ibi\srvXX\wfs\etc, where XX is your server release.
To designate the default font use the following steps:
1. Copy the selected font entry from frontmap.xml to fontuser xml.
a. Within fontmap.xml, find the entry for the font family within the desired output formatto be designated as the default.
9. Choosing a Display Format
Creating Reports With TIBCO® WebFOCUS Language 633

b. Copy the entire entry into the appropriate format area within fontuser.xml.
2. In fontuser.xml, within the entry for the font to be designated as the default font and style,add the following attribute:
default="yes"
For example, the following code defines the default fonts to be Helvetica bold for PDF,Calibri for XLSX, and Arial Italic for DHTML:
<fontmap version="1"><when format="PDF PS"> <family name="Helvetica" htmlfont="Arial"> <font style="normal" metricsfile="pdhelv" /> <font style="bold" metricsfile="pdhelvb" default="yes" /> <font style="italic" metricsfile="pdhelvi" /> <font style="bold+italic" metricsfile="pdhelvbi" /> </family></when><when format="XLSX"> <family name="Calibri" htmlfont="Calibri"> <font style="normal" metricsfile="ttcali" default="yes" /> <font style="bold" metricsfile="ttcalib" /> <font style="italic" metricsfile="ttcalii" /> <font style="bold+italic" metricsfile="ttcalibi" /> </family></when><when format="DHTML"> <family name="Arial"> <font style="normal" metricsfile="ttarial" /> <font style="bold" metricsfile="ttarialb" /> <font style="italic" metricsfile="ttariali" default="yes" /> <font style="bold+italic" metricsfile="ttariabi" /> </family></when></fontmap>
If multiple fonts in a font map family, such as PDF, have the default="yes" attribute, thelast font with that attribute becomes the default font. Fonts in fontuser.xml are processedafter those in fontmap.xml, so a default font set in fontuser.xml can override the one setin fontmap.xml.
A default font set in the PDF section of the font map does not affect a default in theDHTML section, and a default for one specific language does not override the default forother languages.
Using Print Display Formats: PDF, PS
634

Embedding TrueType Fonts Into WebFOCUS PDF Reports Generated in Windows
You can have WebFOCUS embed the following TrueType fonts into PDF output files generatedin Windows:
Arial Unicode MS
Courier New
Lucida Sans Unicode
Tahoma
Times New Roman
Trebuchet MS
Note:
Custom TrueType font embedding is supported, as long as you provide the AFM and TTFfiles. Only TTF fonts that have format 4 layer with platform ID 3 and platform specific ID 1are supported.
The addition of the font file and font type attributes activates the embedding feature. Touse any of these fonts and font styles without embedding, do not add the font file and fontstyle attributes into the font map definition for each individual style.
Procedure: How to Add TrueType Fonts for Embedding Into PDF Output Files
1. Make the fonts available to the Reporting Server by copying the TrueType font files fromthe Windows font directory (C:\Windows\fonts) to the WebFOCUS server configurationdirectory:
drive:\ibi\srv82\wfs\etc
where:
drive
Is the drive on which the Reporting Server is installed.
wfs
Is your WebFOCUS configuration directory (it may have a different name depending oninstallation options, but should always be a directory directly under drive:\ibi\srv82).Note that home is the other directory directly under drive:\ibi\srv82.
9. Choosing a Display Format
Creating Reports With TIBCO® WebFOCUS Language 635

For each of the supported fonts, you will need to copy the following font files. You will alsoneed to know the metrics file name associated with each font file:
Arial Unicode MS
Style Metrics File Name Font File Name
Normal pdarum.afm arialuni.ttf
Bold pdarumb.afm arialuni.ttf
Italic pdarumi.afm arialuni.ttf
Bold Italic pdarumbi.afm arialuni.ttf
Courier New
Style Metrics File Name Font File Name
Normal pdconu.afm cour.ttf
Bold pdconub.afm courbd.ttf
Italic pdconui.afm couri.ttf
Bold Italic pdconubi.afm courbi.ttf
Lucida Sans Unicode
Style Metrics File Name Font File Name
Normal pdlusu.afm l_10646.ttf
Bold pdlusub.afm l_10646.ttf
Italic pdlusui.afm l_10646.ttf
Bold Italic pdlusubi.afm l_10646.ttf
Using Print Display Formats: PDF, PS
636
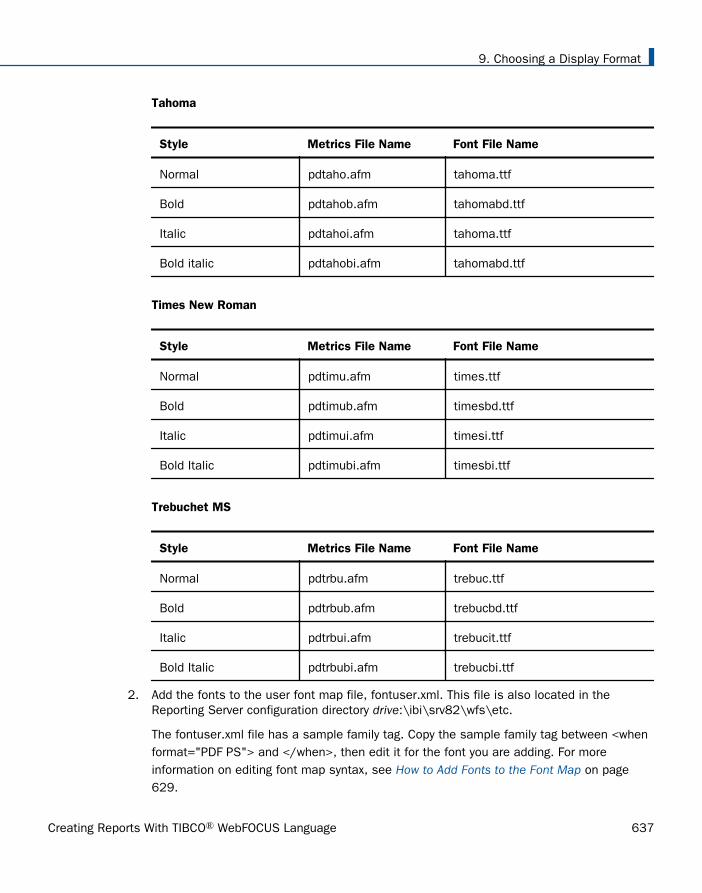
Tahoma
Style Metrics File Name Font File Name
Normal pdtaho.afm tahoma.ttf
Bold pdtahob.afm tahomabd.ttf
Italic pdtahoi.afm tahoma.ttf
Bold italic pdtahobi.afm tahomabd.ttf
Times New Roman
Style Metrics File Name Font File Name
Normal pdtimu.afm times.ttf
Bold pdtimub.afm timesbd.ttf
Italic pdtimui.afm timesi.ttf
Bold Italic pdtimubi.afm timesbi.ttf
Trebuchet MS
Style Metrics File Name Font File Name
Normal pdtrbu.afm trebuc.ttf
Bold pdtrbub.afm trebucbd.ttf
Italic pdtrbui.afm trebucit.ttf
Bold Italic pdtrbubi.afm trebucbi.ttf
2. Add the fonts to the user font map file, fontuser.xml. This file is also located in theReporting Server configuration directory drive:\ibi\srv82\wfs\etc.
The fontuser.xml file has a sample family tag. Copy the sample family tag between <whenformat="PDF PS"> and </when>, then edit it for the font you are adding. For moreinformation on editing font map syntax, see How to Add Fonts to the Font Map on page629.
9. Choosing a Display Format
Creating Reports With TIBCO® WebFOCUS Language 637

The following shows a user font map file with the Arial Unicode MS font added:
<?xml version="1.0" encoding="UTF-8" ?><!-- Example of a user font map file defining Arial Unicode MS true type fonts --><fontmap version="1"><when format="PDF"> <family name = "Arial Unicode MS"> <font style="normal" metricsfile="pdarum" fontfile="arialuni" fonttype="TTF" /> <font style="bold" metricsfile="pdarumb" fontfile="arialuni" fonttype="TTF" /> <font style="bold+italic" metricsfile="pdarumbi" fontfile="arialuni" fonttype="TTF" /> <font style="italic" metricsfile="pdarumi" fontfile="arialuni" fonttype="TTF" /> </family> </when></fontmap>
Note that the font file name does not include the extension. The extension, TTF, is enteredas the fonttype attribute.
3. In a report request, specify the font family names and the style attributes in thestylesheet, and hold the report output in PDF format.
An example follows of the contents of a fontuser.xml file with all of the supported embeddedfonts defined. You can select only the ones you need for your environment:
<fontmap version="1"> <when format="PDF PS">
<family name = "Arial Unicode MS"> <font style="normal" metricsfile="pdarum" fontfile="arialuni" fonttype="TTF" /> <font style="bold" metricsfile="pdarumb" fontfile="arialuni" fonttype="TTF" /> <font style="bold+italic" metricsfile="pdarumbi" fontfile="arialuni" fonttype="TTF" /> <font style="italic" metricsfile="pdarumi" fontfile="arialuni" fonttype="TTF" /> </family>
<family name="Trebuchet MS"> <font style="normal" metricsfile="pdtrbu" fontfile="trebuc" fonttype="TTF" /> <font style="bold" metricsfile="pdtrbub" fontfile="trebucbd" fonttype="TTF" /> <font style="italic" metricsfile="pdtrbui" fontfile="trebucit" fonttype="TTF" /> <font style="bold+italic" metricsfile="pdtrbubi" fontfile="trebucbi" fonttype="TTF" /> </family>
Using Print Display Formats: PDF, PS
638
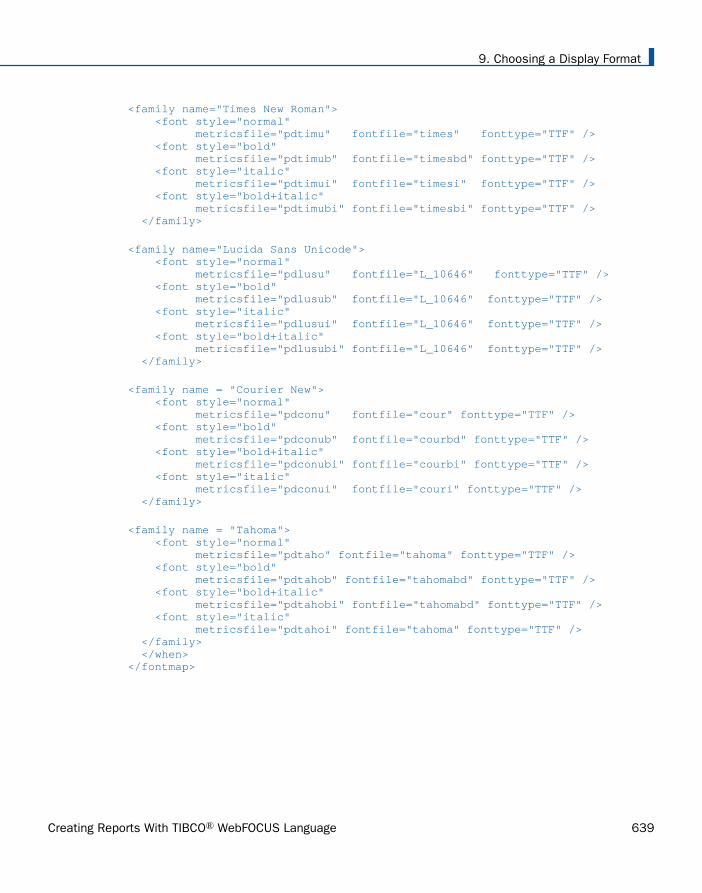
<family name="Times New Roman"> <font style="normal" metricsfile="pdtimu" fontfile="times" fonttype="TTF" /> <font style="bold" metricsfile="pdtimub" fontfile="timesbd" fonttype="TTF" /> <font style="italic" metricsfile="pdtimui" fontfile="timesi" fonttype="TTF" /> <font style="bold+italic" metricsfile="pdtimubi" fontfile="timesbi" fonttype="TTF" /> </family>
<family name="Lucida Sans Unicode"> <font style="normal" metricsfile="pdlusu" fontfile="L_10646" fonttype="TTF" /> <font style="bold" metricsfile="pdlusub" fontfile="L_10646" fonttype="TTF" /> <font style="italic" metricsfile="pdlusui" fontfile="L_10646" fonttype="TTF" /> <font style="bold+italic" metricsfile="pdlusubi" fontfile="L_10646" fonttype="TTF" /> </family>
<family name = "Courier New"> <font style="normal" metricsfile="pdconu" fontfile="cour" fonttype="TTF" /> <font style="bold" metricsfile="pdconub" fontfile="courbd" fonttype="TTF" /> <font style="bold+italic" metricsfile="pdconubi" fontfile="courbi" fonttype="TTF" /> <font style="italic" metricsfile="pdconui" fontfile="couri" fonttype="TTF" /> </family>
<family name = "Tahoma"> <font style="normal" metricsfile="pdtaho" fontfile="tahoma" fonttype="TTF" /> <font style="bold" metricsfile="pdtahob" fontfile="tahomabd" fonttype="TTF" /> <font style="bold+italic" metricsfile="pdtahobi" fontfile="tahomabd" fonttype="TTF" /> <font style="italic" metricsfile="pdtahoi" fontfile="tahoma" fonttype="TTF" /> </family> </when> </fontmap>
9. Choosing a Display Format
Creating Reports With TIBCO® WebFOCUS Language 639

Example: Embedding TrueType Fonts in a PDF Output File
The font files trebuc.ttf, trebudbd.ttf, trebucit.ttf, trebucbi.ttf, tahoma.ttf, and tahomabd.ttfhave been copied to the Reporting Server configuration directory, drive:\ibi\srv82\wfs\etc. Inaddition, the Trebuchet MS and Tahoma fonts have been added to the fontuser.xml file:
<fontmap version="1"> <when format="PDF PS"> <!-- family/font tags should be added here --> <family name="Trebuchet MS"> <font style="normal" metricsfile="pdtrbu" fontfile="trebuc" fonttype="TTF" /> <font style="bold" metricsfile="pdtrbub" fontfile="trebucbd" fonttype="TTF" /> <font style="italic" metricsfile="pdtrbui" fontfile="trebucit" fonttype="TTF" /> <font style="bold+italic" metricsfile="pdtrbubi" fontfile="trebucbi" fonttype="TTF" /> </family> <family name="Tahoma"> <font style="normal" metricsfile="pdtaho" fontfile="tahoma" fonttype="TTF" /> <font style="bold" metricsfile="pdtahob" fontfile="tahomabd" fonttype="TTF" /> </family> </when></fontmap>
The following request against the GGSALES data source specifies the Trebuchet MS font forthe column headings and the bold style of Tahoma for the data in the PDF report output:
TABLE FILE GGSALESSUM DOLLARS UNITSBY REGIONON TABLE PCHOLD FORMAT PDFON TABLE SET PAGE NOPAGEON TABLE SET STYLE *TYPE = TITLE, FONT='Trebuchet MS',$TYPE = DATA, FONT='Tahoma', style=bold, size=10, color=blue, $END
Using Print Display Formats: PDF, PS
640

The output is:
9. Choosing a Display Format
Creating Reports With TIBCO® WebFOCUS Language 641
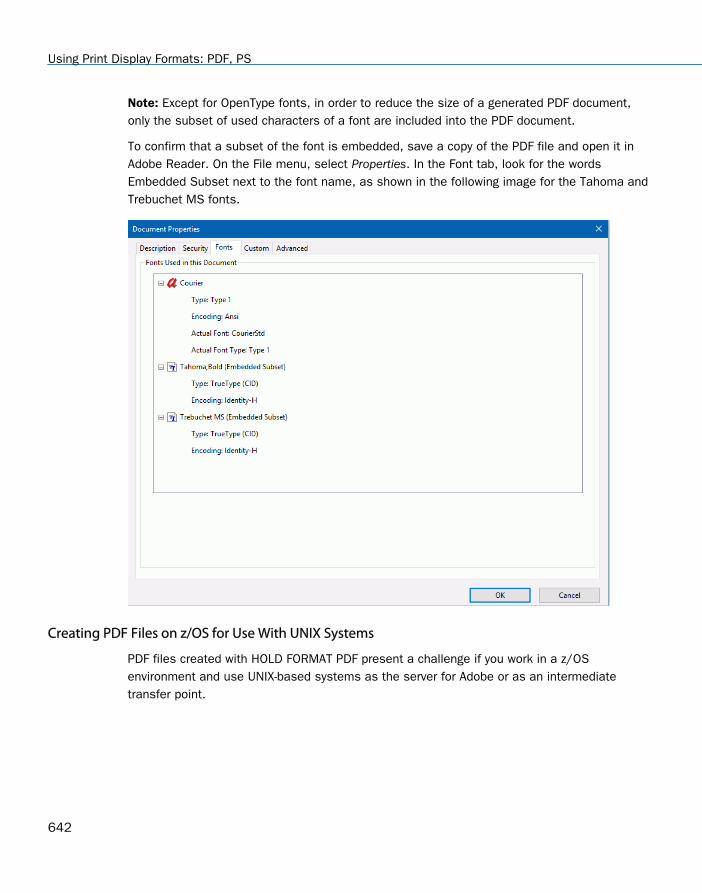
Note: Except for OpenType fonts, in order to reduce the size of a generated PDF document,only the subset of used characters of a font are included into the PDF document.
To confirm that a subset of the font is embedded, save a copy of the PDF file and open it inAdobe Reader. On the File menu, select Properties. In the Font tab, look for the wordsEmbedded Subset next to the font name, as shown in the following image for the Tahoma andTrebuchet MS fonts.
Creating PDF Files on z/OS for Use With UNIX Systems
PDF files created with HOLD FORMAT PDF present a challenge if you work in a z/OSenvironment and use UNIX-based systems as the server for Adobe or as an intermediatetransfer point.
Using Print Display Formats: PDF, PS
642

The end of each PDF file has a table containing the byte offset, including line terminationcharacters, of each PDF object in the file. The offsets indicate that each line is terminated bytwo characters, a carriage return and a line feed, which is the standard Windows text fileformat. However, records in a UNIX text file are terminated by one character, a line feed only.When using default settings, the offsets in a PDF file will be incorrect, causing an error whenAcrobat attempts to open the file. If the file is then transferred in BINARY mode to Windows, itcannot be opened in Acrobat for Windows, as the carriage-return character was not inserted.
One solution has been to transfer the file to the UNIX system in text mode and then transfer intext mode to the Windows system, as the carriage return is added by the transfer facility whentransferring to Windows.
If that is not possible or desirable, you can use the SET PDFLINETERM=SPACE command tofacilitate binary transfer to Windows from an ASCII-based UNIX system. This command causesan extra space character to be appended to each record of the PDF output file. This extraspace acts as a placeholder for the expected carriage return character and makes the objectoffsets in the file correct when it is transferred from z/OS to a UNIX system. This enables aUNIX server to open a PDF file in that environment.
Note: A text mode transfer is always required when transferring a text file from a mainframe toany other environment (Windows, ASCII Unix, or EBCDIC Unix).
Syntax: How to Specify Line Termination Characters When Creating a PDF File
In a profile, a FOCEXEC, or from the command line, issue the following command:
SET PDFLINETERM={STANDARD|SPACE}
In a TABLE request, issue the following command
ON TABLE SET PDFLINETERM {STANDARD|SPACE}
where:
STANDARD
Creates a PDF file without any extra characters. This file will be a valid PDF file iftransferred in text mode to a Windows machine, but not to a UNIX machine. Ifsubsequently transferred from a UNIX machine to a Windows machine in text mode, it willbe a valid PDF file on the Windows machine.
9. Choosing a Display Format
Creating Reports With TIBCO® WebFOCUS Language 643
SPACE
Creates a PDF file with an extra space character appended to each record. This file will bea valid PDF file if transferred in text mode to a UNIX machine, but not to a Windowsmachine. If subsequently transferred from an ASCII UNIX machine to a Windows machinein binary mode, it will be a valid PDF file on the Windows machine.
Reference: Required PDFLINETERM Settings Based on Environment
The following chart will assist you in determining the correct setting to use, based on yourenvironment:
Transferring from z/OS to: SET PDFLINETERM=
EBCDIC UNIX (text transfer) SPACE
ASCII UNIX (text transfer) SPACE
ASCII UNIX (text); then to Windows (binary) SPACE
UNIX (text); then to Windows (text) STANDARD
Directly to Windows (text) STANDARD
Using Word Processing Display Formats: DOC, WP
You can display a report as a plain text word processing document using:
DOC format. The report opens in Microsoft Word within your web browser. When Wordopens the report, it may prompt you for information about converting text. If it does, acceptthe default selection. The computer on which the report is being displayed must have Wordinstalled.
DOC format includes page breaks, including an initial page break before the beginning ofthe report. If you wish to omit page breaks, issue the SET PAGE = NOPAGE command at thebeginning of the procedure.
DOC format does not support StyleSheets.
WP format. The report opens as plain text within your web browser.
Using Word Processing Display Formats: DOC, WP
644

If you issue the SET PAGE = OFF command, or include TABPAGENO in a heading or footing,WP will indicate page breaks by including the character "1" in the first column at eachbreak, which is recognized as a page break control in the S/390 environment. WP formatdoes not include page breaks that are recognized by most browsers or word processingprograms.
WP format does not support StyleSheets.
You can specify that a report display as a plain text word processing document via the PCHOLDcommand when you run the report in WebFOCUS. For more information, see How to Choose aDisplay Format Using PCHOLD on page 576.
Saving Report Output in Excel XLSX Format
With Excel® 2007, Microsoft® introduced enhanced spreadsheet functionality in a newworkbook file format. Using WebFOCUS, you can retrieve data from any WebFOCUS supporteddata source and generate a native XLSX format (Excel 2007, Excel 2010, and Excel 2013)workbook for data analysis and distribution. This section applies to Excel 2007, Excel 2010,and Excel 2013, unless otherwise indicated.
The WebFOCUS XLSX/EXL07 format supports the following Microsoft Office software products:
Microsoft Office 2013/2010/2007 and Microsoft Office 2000/2003 with the MicrosoftOffice Compatibility Pack.
Open Office Support (FORMAT EXL07/XLSX). Core Excel functionality generated by theEXL07/XLSX format is supported for Open Office as of WebFOCUS 8. For details on OpenOffice, see http://www.openoffice.org/.
MAC Office 2008 and 2011. FORMAT EXL07/XLSX is certified with WebFOCUS 8.
WebFOCUS generates XLSX workbooks based on the Microsoft XLSX standard. Theseworkbooks are accessible through all browsers and mobile applications that support nativeMicrosoft XLSX files.
Microsoft Office 365™. Microsoft Office 365 offers the local installation of Microsoft Excel2013. It works with the Office 2010 release and provides limited functionality with Office2007. Microsoft Office 365 also permits uploading Microsoft Excel files to the cloud, wherethey can be accessed on most devices using Office Online. For information on the MicrosoftOffice 365 plans and features, see Office 365 for business FAQ.
You can use Microsoft Office 365 to access a WebFOCUS XLSX report. First, display theXSLX report on the screen using the PCHOLD command, and then save the report toOneDrive® for Business. Once the file is in the cloud, you can access the file using OfficeOnline.
9. Choosing a Display Format
Creating Reports With TIBCO® WebFOCUS Language 645

For information on the differences in features available in Excel Online and in MicrosoftOffice 2013, see Office Online Service Description.
For more information on working with Office Online and OneDrive for Business, see UsingOffice Online in OneDrive.
Overview of EXL07/XLSX Format
FORMAT EXL07 and FORMAT XLSX are synonyms and can be used interchangeably. The FILESAVED message will always display "XLSX FILE SAVED", regardless of the syntax specified.
The WebFOCUS procedure generates a new workbook containing a single worksheet with thereport output containing your defined report elements (headings and subtotals), as well asStyleSheet syntax (such as conditional styling and drill downs):
You can define a new default font for XLSX in the fontuser.xml file. This allows ease incustomizing the look and feel of XLSX workbooks. WebFOCUS uses Arial as the defaultfont. However, you can change the default font to match the Microsoft Office standard font,Calibri, or your corporate standard.
XLSX format accurately displays formatted numeric, character, and date formats.
XLSX FORMULA enables you to convert summed information (such as column totals, rowtotals, and calculated values) into Excel formulas that will automatically update as you editthe Excel worksheet.
ReportCaster supports distribution of XLSX workbooks and XLSX FORMULA workbooks.
Within each generated worksheet, the columns in the report are automatically sized to fitthe largest value in the column (SQUEEZE=ON). WebFOCUS calculates the width of eachdata column based on the font and size requirement of all cells in that column using fontmetrics developed for other styled formats, including PDF and DHTML. Calculations arebased on the data and title elements of the report. Heading and footing elements are notused in the sizing calculation and will be sized based on the data column requirements.
By default, there is a standard height for the data and Title rows. Heading, Footing,Subhead, and Subfoot rows are taller than the data rows to support wrapping and for aclearer distinction between headings and data.
Using the TITLETEXT StyleSheet attribute, tab names within the workbook can becustomized to provide better descriptions of the worksheet content.
Saving Report Output in Excel XLSX Format
646

Unlike the HTML-based (EXL2K) format, which removes all blanks, XLSX, by default, retainsleading, internal, and trailing blanks in cells within the worksheet. For more information onhow to affect these blanks, see Preserving Leading and Internal Blanks in Report Output onpage 687.
An XLSX worksheet can contain 1,048,576 rows by 16,384 columns. WebFOCUS willgenerate worksheets larger than these defined limits, but Excel is not able to open theworkbook. For more information on how to support overflow in worksheets, see Overcomingthe Excel 2007/2010 Row Limit Using Overflow Worksheets on page 715.
Because of the new format of the zipped XLSX files, native HTML symbols, such as a caret(<), cannot be supported as tag characters. For XLSX, unlike other output formats,HTMLENCODE defaults to ON. HTMLENCODE set to OFF will cause any data containingHTML tag characters to be omitted from the cell. For more information on the SETHTMLENCODE command, see the TIBCO WebFOCUS® Developing Reporting Applicationsmanual.
Building the .xlsx Workbook File
Microsoft changed the format and structure of the Excel workbook in Excel 2007. The new .xlsxfile is a binary compilation of a group of xml files. Generating this new file format usingWebFOCUS is a two-step process that consists of generating the xml files containing the reportoutput and zipping the xml documents into the binary .xlsx format. The Reporting Serverperforms the xml generation process. The zipping process can be completed either by theclient (WebFOCUS Servlet) or the server (JSCOM3):
WebFOCUS Servlet. The WebFOCUS Client within the application server performs thezipping process. This can be done within the local client or through a remotely accessedclient. The servlet method is the default approach defined for each WebFOCUS Client, withthe client pointing to itself, by default.
JSCOM3. The Java layer of the Reporting Server performs the zipping operation. This optionshould be used when the WebFOCUS Servlet is configured on a secured web or applicationserver. This is because JSCOM3 does not require URL access to a remote WebFOCUSClient.
9. Choosing a Display Format
Creating Reports With TIBCO® WebFOCUS Language 647

Syntax: How to Select the Method for Zipping the .xlsx File
You designate the method and location where the zipping will occur by setting EXCELSERVURLto a URL (for the WebFOCUS Servlet) or to a blank (for JSCOM3). You can set this value for aspecific procedure or for the entire environment:
For a procedure. Issue the SET EXCELSERVURL command within the procedure.
For the entire environment. Edit the IBIF_excelservurl variable in the WebFOCUSAdministration Console by selecting:
Configuration/Client Settings/General/IBIF_excelservurl
For more information on accessing the WebFOCUS Administration Console and setting theIBIF_excelservurl variable, see the TIBCO WebFOCUS® Security and Administration manual.
The value you assign to EXCELSERVURL determines whether the WebFOCUS Servlet orJSCOM3 performs the zipping operation:
Specifying the Servlet. To specify that the WebFOCUS Servlet should be used, set theEXCELSERVURL parameter or the IBIF_variable to the URL. For example,
In a procedure:
SET EXCELSERVURL = http://servername:8080/ibi_apps
In the WebFOCUS Administration Console:
IBIF_excelservurl = http://servername:8080/ibi_apps
Specifying JSCOM3. To specify that JSCOM3 should be used within the current ReportingServer, set EXCELSERVURL to a blank or an empty string.
In a procedure:
SET EXCELSERVURL = ''
In the WebFOCUS Administration Console:
IBIF_excelservurl = ''
By default, each WebFOCUS Client contains the following URL definition that points to itself:
&URL_PROTOCOL://&servername:&server_port&IBIF_webapp
Saving Report Output in Excel XLSX Format
648

Syntax: How to Generate an Excel XLSX Workbook
You can specify that a report should be saved to an XLSX workbook, displayed in the browser,or displayed in the Excel application.
ON TABLE {PCHOLD|HOLD} AS name FORMAT XLSX
where:
PCHOLD
Displays the generated workbook in either the browser or the Excel application, based onyour desktop settings. For information, see Viewing Excel Workbooks in the Browser vs. theExcel Application on page 651.
HOLD
Saves a workbook with an .xlsx extension to the designated location.
name
Specifies a file name for the generated workbook.
Note: To assign a file name to the generated workbook, set the Save Report option to YES forthe .xlsx file extension in the WebFOCUS Client Redirection Settings. When opened in the Excelapplication, the generated workbook will retain the designated AS name. For more information,see the TIBCO WebFOCUS® Security and Administration manual.
Opening XLSX Report Output
To open XLSX workbooks, Excel 2013, 2010, or 2007 must be installed on the desktop.
9. Choosing a Display Format
Creating Reports With TIBCO® WebFOCUS Language 649

Reference: Opening XLSX Report Output in Excel 2000/2003
Excel 2000 and Excel 2003 can be updated to read Excel XLSX workbooks using the MicrosoftOffice Compatibility Pack available from the Microsoft download site (http://www.microsoft.com/downloads/en/default.aspx). When the file extension of the file beingopened is .xlsx (XLSX workbook), the Microsoft Office Compatibility Pack performs thenecessary conversion to allow Excel 2000/2003 to read and open it.
In addition to the Microsoft Office Compatibility Pack, it is important to enable the WebFOCUSClient Redirection Settings Save As option so that Excel 2000/2003 will be able to open theXLSX report output without users first having to save it to their machine with the .xlxs fileextension. The WebFOCUS Client processing Redirection Settings Save As option configureshow the WebFOCUS Client sends each report output file type to the user machine. This optioncan be set as follows:
Save As Option disabled (NO). The WebFOCUS Client Redirection Setting Save As isdisabled by default. When the Save As option is disabled, the WebFOCUS Client sendsreport output to the user machine in memory with the application association specified forthe report format in the WebFOCUS Client Redirection Settings configuration file(mime.wfs).
A user machine that does not have Excel 2007/2010 installed will not recognize theapplication association for Excel 2007/2010 and Excel will display a message.
The Excel 2000/2003 user can select Save and provide a file name with the .xlsxextension to save the report output to their machine. The user can then open the .xlsx filedirectly from Excel 2000/2003.
Saving Report Output in Excel XLSX Format
650

Save As Option enabled (YES). When the WebFOCUS Redirection Save As option isenabled, the WebFOCUS Client sends the report output to the user as a file with theextension specified in the WebFOCUS Client Redirection Settings configuration file(mime.wfs).
Upon receiving the file, Windows will display the File Download prompt asking the user toOpen or Save the file with the identified application type. The File Download promptdisplays the Name with the .xlsx file extension for the report output that is recognized as anExcel XLSX file type.
Note: The download prompt will display for all users, including users who have Excel2007/2010 installed on their machines.
If an Excel 2000/2003 user chooses to open the file, the Microsoft Office CompatibilityPack will recognize the .xlsx file extension and perform the necessary conversion to allowExcel 2000/2003 to read the Excel XLSX workbook.
If an Excel 2007/2010 user chooses to open the file, Excel will recognize the .xlsx fileextension and read the Excel XLSX workbook.
For additional information on WebFOCUS Client Redirection Settings, see the TIBCOWebFOCUS® Security and Administrationmanual.
Reference: Viewing Excel Workbooks in the Browser vs. the Excel Application
Your Operating System and desktop settings determine whether Excel output sent to the clientis displayed in an Internet Browser window or within the Excel application. When Excel outputhas been defined within the Windows environment to Browse in same window, the workbookgenerated by a WebFOCUS request is opened within an Internet Explorer® browser window.When the Browse in same window option is unchecked for the .xls file type, the browserwindow created by WebFOCUS is blank because the report output is displayed in the stand-alone Excel application window.
In Windows XP and earlier, file type specific settings are managed on the desktop withinWindows Explorer by selecting Tools/Folder Options, clicking the File Types tab, selectingthe extension (.xls or .xlsx), clicking the Advanced button, and checking the Browse in samewindow box.
In Windows 7, Microsoft removed the desktop settings that support opening worksheets inthe browser. This means that to change this behavior, you can no longer simply navigate tothe Folder Options dialog box, but that you must change a registry setting.
Note: This works the same for both EXL2K and XLSX formats. The only difference is theselection of file type based on the version of Excel output you will be generating.
9. Choosing a Display Format
Creating Reports With TIBCO® WebFOCUS Language 651

Formatting Values Within Cells in XLSX Report Output
WebFOCUS formats defined in Master Files or within a FOCEXEC will be represented in theresulting cells in an Excel XLSX worksheet. Where possible, the WebFOCUS formats aretranslated to custom Excel formats and applied to values passed as raw data. Each data valuepassed to a cell in Excel is defined with a value and a format mask pair. The data format isassociated with the cell rather than embedded in the value. This technique provides enhancedsupport for editing worksheets generated by WebFOCUS. New values entered into existing cellswill retain the cell formats and continue to display in the style defined for the column within thereport.
The following types of data can be passed to Excel:
Numeric. Where corresponding Excel format masks can be defined, numeric values arepassed as raw values with associated format masks. In instances where an equivalentformat mask cannot be defined, the numeric value is passed as a text string.
Alphanumeric. Alphanumeric formats are passed to Excel as text strings, with Generalformat defined. By default, General format presents all text fields as left-justified. Alignmentand other styling attributes can be applied to these cells to override the default.
Date formats. Data that contain sufficient elements to define a valid Excel date format arepassed as raw date values with the WebFOCUS formats translated to Excel date formatmasks. In WebFOCUS formats that do not contain sufficient information to create validExcel date values, the dates are converted to text strings.
Date-Time formats. Date-time values are passed as raw date-time values with WebFOCUSformats translated to Excel date-time format masks using Custom formats.
Text. Text values are passed as strings with General Format defined (as with alphanumericdata).
Note: This behavior is a change from EXL2K format, where cells containing dates and morecomplex numeric formats were passed as formatted text.
Displaying Formatted Numeric Values in XLSX Report Output
Each numeric WebFOCUS format is translated to a custom numeric Excel format. The numericvalue is displayed in the Excel formula bar for the selected cell. Within the actual cell, thevalue with the format mask applied displays.
The WebFOCUS formats for the following numeric data types are translated into Excel XLSXformat masks supporting full editing within the resulting workbook:
Data types: E, F, D, I, P
Saving Report Output in Excel XLSX Format
652
Comma edit option (C)
Zero suppression (S)
Leading zero (L)
Floating currency symbol (M)
Comma suppression (c)
Right-side minus sign (-)
Credit negative (CR)
Bracket negative (B)
Fixed extended currency symbol (!d, !e, !l, !y)
Floating extended currency symbol (!D, !E, !L, !Y)
Percent (%)
Example: Passing Numeric Formats to XLSX Report Output
In the following example, the DOLLARS field is assigned different numeric formats todemonstrate different available options. The column titles have been edited to display theWebFOCUS format options that have been applied:
TABLE FILE GGSALESSUM DOLLARS/D12.2 AS 'D12.2' DOLLARS/D12C AS 'D12C' DOLLARS/D12CM AS 'D12CM'BY REGIONBY CATEGORYON TABLE PCHOLD FORMAT XLSXON TABLE SET BYDISPLAY ONEND
In the resulting worksheet, notice that cell C2 containing the DOLLAR value for Midwest Coffeepresents the value with the WebFOCUS format D12.2, which presents the comma (,) and twodecimal places. On the formula bar, the actual value is presented without any formatting.Examine each of the DOLLAR values in each row to see that the value as displayed in theformula bar remains the same, and only the display values presented in each cell change.
9. Choosing a Display Format
Creating Reports With TIBCO® WebFOCUS Language 653

Also notice that with SET BYDISPLAY ON, the BY field values are repeated for every row on theworksheet. This creates fully qualified data rows that can be used with various data sorting,filtering, and table features in Excel without losing valuable information. This setting isrecommended as a best practice for all worksheets.
The following example uses Fixed Dollar (N) format, as well as multiple combined formatoptions. Each WebFOCUS format option is translated to the appropriate Excel XLSX formatmask and applied to the cell value:
TABLE FILE GGSALESSUM BUDDOLLARS/D12N DOLLARS/D12MCOMPUTE OVERBUDGET/D12BMc = BUDDOLLARS-DOLLARS; AS 'Over Budget'BY REGIONBY CATEGORYON TABLE PCHOLD FORMAT XLSXON TABLE SET BYDISPLAY ONEND
Saving Report Output in Excel XLSX Format
654

Notice the fixed numeric format defined for the BUDDOLLARS column (Column C) presents thelocal currency symbol in a fixed position within each cell, regardless of the size of the datavalue. On the formula bar, the values in the Over Budget calculated field is passed as anegative value where appropriate. In the actual cells, the bracketed styling is applied to thenegative values as part of the custom Excel XLSX format mask.
Using Numeric Formats in Report Headings and Footings
By default, headings and footings are passed to Excel as a single character string. Spotmarkers are not supported for positioning within each line. Numeric fields and dates passed inheadings and footings are passed as text strings within the overall heading or footingcontents.
To display numeric fields and dates within headings and footings as numeric or date values,use HEADALIGN=BODY in the StyleSheet to define each of the items in the heading as anindividual cell. Each cell containing numeric or date values will then be passed as theappropriate value with the associated format mask.
Using Numeric Format Punctuation in Headings and Footings
For data columns, all currency formats are translated using the Excel XLSX format masks thatuse the punctuation rules defined by the regional settings of the desktop.
9. Choosing a Display Format
Creating Reports With TIBCO® WebFOCUS Language 655
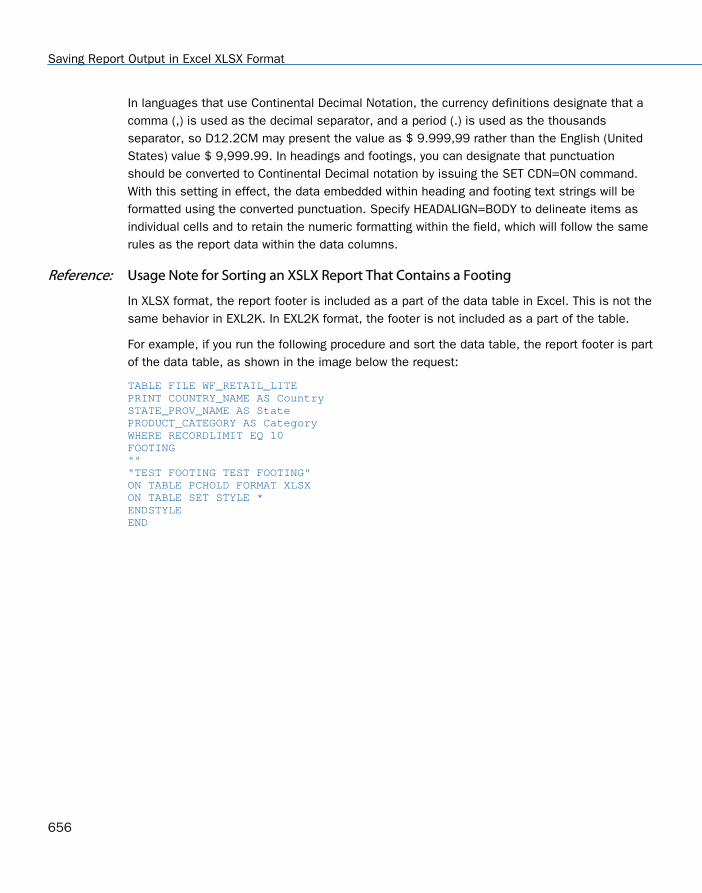
In languages that use Continental Decimal Notation, the currency definitions designate that acomma (,) is used as the decimal separator, and a period (.) is used as the thousandsseparator, so D12.2CM may present the value as $ 9.999,99 rather than the English (UnitedStates) value $ 9,999.99. In headings and footings, you can designate that punctuationshould be converted to Continental Decimal notation by issuing the SET CDN=ON command.With this setting in effect, the data embedded within heading and footing text strings will beformatted using the converted punctuation. Specify HEADALIGN=BODY to delineate items asindividual cells and to retain the numeric formatting within the field, which will follow the samerules as the report data within the data columns.
Reference: Usage Note for Sorting an XSLX Report That Contains a Footing
In XLSX format, the report footer is included as a part of the data table in Excel. This is not thesame behavior in EXL2K. In EXL2K format, the footer is not included as a part of the table.
For example, if you run the following procedure and sort the data table, the report footer is partof the data table, as shown in the image below the request:
TABLE FILE WF_RETAIL_LITEPRINT COUNTRY_NAME AS CountrySTATE_PROV_NAME AS StatePRODUCT_CATEGORY AS CategoryWHERE RECORDLIMIT EQ 10FOOTING "" "TEST FOOTING TEST FOOTING" ON TABLE PCHOLD FORMAT XLSX ON TABLE SET STYLE * ENDSTYLE END
Saving Report Output in Excel XLSX Format
656

The output is:
The workaround is to add a named data range to the procedure, as shown in the followingprocedure:
TABLE FILE WF_RETAIL_LITEPRINT COUNTRY_NAME AS CountrySTATE_PROV_NAME AS StatePRODUCT_CATEGORY AS CategoryWHERE RECORDLIMIT EQ 10FOOTING "" "TEST FOOTING TEST FOOTING" ON TABLE PCHOLD FORMAT XLSX ON TABLE SET STYLE * TYPE=DATA, IN-RANGES=DATA, $ TYPE=TITLE, IN-RANGES=DATA, $ ENDSTYLE END
9. Choosing a Display Format
Creating Reports With TIBCO® WebFOCUS Language 657
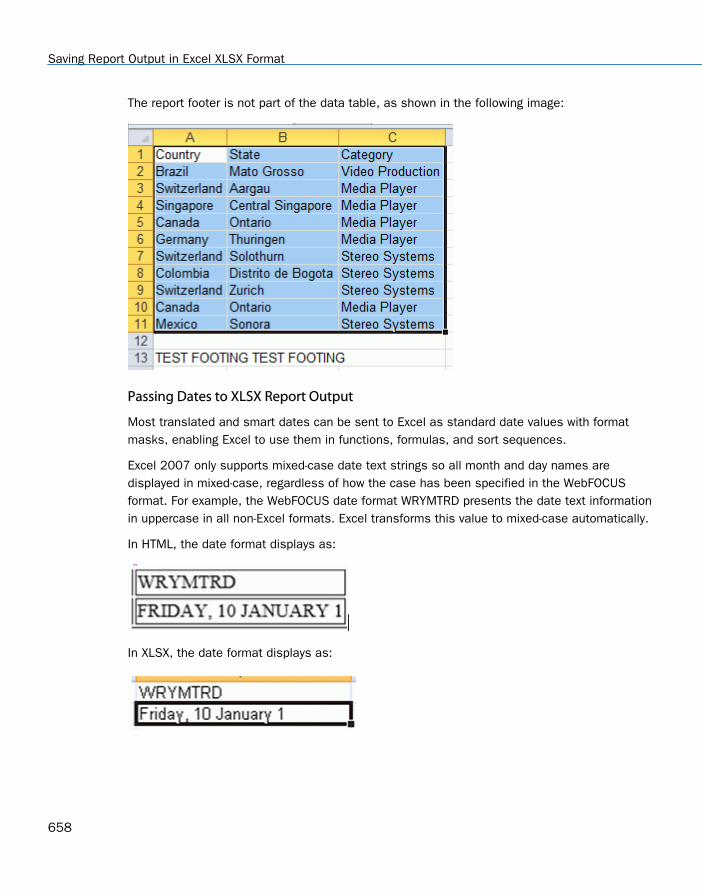
The report footer is not part of the data table, as shown in the following image:
Passing Dates to XLSX Report Output
Most translated and smart dates can be sent to Excel as standard date values with formatmasks, enabling Excel to use them in functions, formulas, and sort sequences.
Excel 2007 only supports mixed-case date text strings so all month and day names aredisplayed in mixed-case, regardless of how the case has been specified in the WebFOCUSformat. For example, the WebFOCUS date format WRYMTRD presents the date text informationin uppercase in all non-Excel formats. Excel transforms this value to mixed-case automatically.
In HTML, the date format displays as:
In XLSX, the date format displays as:
Saving Report Output in Excel XLSX Format
658

Example: Translating WebFOCUS Dates to Excel XLSX Dates
The following request against the GGSALES data source creates the date January 1, 2010 andconverts it to four date formats with translated text:
DEFINE FILE GGSALESNEWDATE/MDYY = '01/01/2010';WRMtrDY/WRMtrDY = NEWDATE;wDMTY/wDMTY = NEWDATE;wrDMTRY/wrDMTRY = NEWDATE;wrYMtrD/wrYMtrD = NEWDATE;ENDTABLE FILE GGSALESSUM DATE NOPRINTNEWDATE WRMtrDY wDMTY wrDMTRY wrYMtrDON TABLE PCHOLD FORMAT XLSXEND
The following table shows how the dates should appear.
WebFOCUS Format WebFOCUS Display XLSX Display XLSX Value
WRMtrDY FRIDAY, January 1 10 Friday, January 1 10 1/1/2010
wDMTY Fri, 1 JAN 10 Fri, 1 Jan 10 1/1/2010
wrDMTY Friday, 1 JANUARY 10 Friday, 1 January 10 1/1/2010
wrYMtrD FRIDAY, 10 JANUARY 1 Friday, 10 January 1 1/1/2010
In Excel 2007/2010, all of the cells have a date value with format masks, and all month andday names are in mixed-case, regardless of how the case has been specified in theWebFOCUS format. The output is:
Passing Dates Without a Day Component
Date formats that do not specify the day value explicitly are defined as the date value of thefirst day of the month. Therefore, the value placed in the cell may be different from the daycomponent value in the source data field and may produce unexpected results when used forsorting or date calculations in an Excel formula.
9. Choosing a Display Format
Creating Reports With TIBCO® WebFOCUS Language 659

The following table shows how WebFOCUS date formats are represented in XLSX. The tableshows how the value is preserved in the cell and how the display is generated using the formatmask that corresponds to the WebFOCUS date format.
DATEFLD/MDYY = '01/02/2010'
WebFOCUS Format XLSX Display XLSX Value
DMYY 02/01/2010 1/2/2010
MY 01/10 1/1/2010
MTY Jan, 10 1/1/2010
MTDY Jan 2, 10 1/2/2010
Example: Passing WebFOCUS Dates With and Without a Day Component to XLSX Report Output
The following request against the GGSALES data source creates the date January 2, 2010 andpasses it to Excel with formats MDYY, DMYY, MY, and MTDY:
DEFINE FILE GGSALESNEWDATE/MDYY = '01/02/2010';ENDTABLE FILE GGSALESSUM DATE NOPRINTNEWDATE AS 'MDYY' NEWDATE/DMYY AS 'DMYY' NEWDATE/MY AS 'MY' NEWDATE/MTY AS 'MTY' NEWDATE/MTDY AS 'MTDY'ON TABLE PCHOLD FORMAT XLSX END
Columns D and E have actual date values with format masks, displayed by Excel 2007/2010in mixed-case. Since the MTY format does not have a day component, the date value stored isthe first of January 2010 (1/1/2010), not the second of January 2010 (1/2/2010):
Passing Date Components for Use in Excel Formulas
Dates formatted as individual components (for example, D, Y, M, W) are passed to Excel asnumeric values that can be used as parameters to Excel date functions. The values arepassed as General format that are recognized by Excel as numbers.
Saving Report Output in Excel XLSX Format
660

Example: Passing Numeric Date Components to XLSX Report Output
The following request against the GGSALES data source creates the date January 1, 2010 andextracts numeric date components, passing them to Excel 2007/2010:
DEFINE FILE GGSALESNEWDATE/MDYY = '01/01/2010';D/D = NEWDATE;Y/Y = NEWDATE;W/W = NEWDATE;w/w = NEWDATE;M/M = NEWDATE;YY/YY = NEWDATE;ENDTABLE FILE GGSALESSUM DATE NOPRINTNEWDATE D Y W w M YYON TABLE PCHOLD FORMAT XLSX END
The output is:
Passing Quarter Formats
Date formats that contain a Quarter component are always passed to Excel as text stringssince Excel does not support Quarter formats.
Example: Passing Dates With a Quarter Component to XLSX Report Output
The following request against the GGSALES data source creates the date January 1, 2010 andconverts it to date formats that contain a Quarter component:
DEFINE FILE GGSALESNEWDATE/MDYY = '01/01/2010';Q/Q = NEWDATE;QY/QY = NEWDATE;YBQ/YBQ = NEWDATE;ENDTABLE FILE GGSALESSUM DATE NOPRINTNEWDATE Q QY YBQON TABLE PCHOLD FORMAT XLSX END
In XLSX, the cells containing dates with Quarter components have General format. To see this,open the Format Cells dialog box.
9. Choosing a Display Format
Creating Reports With TIBCO® WebFOCUS Language 661

The output is:
Passing Date Components Defined as Translated Text
Date formats that do not contain sufficient information to present a valid date result in Excelare not translated to a value, including formats that do not contain year and/or monthinformation. These dates will be sent to Excel as text. In the absence of complete information,the year defaults to the current year, so the value sent would be incorrect if this type of formatwas passed as a date value. The following formats will not be sent as values:
MT, MTR, Mt, Mtr
W, w, WR, wr
When date formats are passed to XLSX with format masks, all month and day names are inmixed-case, regardless of how the case has been specified in the WebFOCUS format. However,since the values in this example are always sent as text, the casing defined in the WebFOCUSformat is applied in the resulting cell.
Example: Passing Date Components Defined as Translated Text to XLSX Report Output
The following request against the GGSALES data source creates the date January 1, 2010 andconverts it to date formats that are defined as either month name or day name:
DEFINE FILE GGSALESNEWDATE/MDYY = '01/01/2010';MT/MT = NEWDATE;MTR/MTR = NEWDATE;Mtr/Mtr = NEWDATE;WR/WR = NEWDATE;wr/wr = NEWDATE;ENDTABLE FILE GGSALESSUM DATE NOPRINTNEWDATE MT MTR Mtr WR wrON TABLE PCHOLD FORMAT XLSX END
In Excel 2007 or 2010, the cells containing the days have General format. To see this, openthe Format Cells dialog box.
Saving Report Output in Excel XLSX Format
662

The output is:
Reference: Usage Notes for Date Values in XLSX Report Output
The following date formats are not supported in XLSX. They will translate into Excel Generalformat and possibly produce unpredictable results:
JUL, YYJUL, and I2MT.
Dates stored as a packed or alphanumeric field with date display options.
Passing Date-Time to XLSX
Most WebFOCUS date-time formats can be sent to XLSX as standard date/time values withformat masks, enabling Excel to use them in functions, formulas, and sort sequences.
As with the Date formats, Excel only supports mixed-case to date-time fields, so if the date-time format contains text and is supported by Excel, the text will be in mixed-case, regardlessof the casing defined within the WebFOCUS format.
Example: Passing Date-Time to XLSX
The following request shows an example against the GGSALES data source.
DEFINE FILE GGSALESDT1/HYYMDm WITH REGION = DT(20100506 16:17:01.993876);DPT1/HDMTYYm = DT1;ALPHA_DATE1/A30 = HCNVRT(DT1,'(HYYMDm)',30,'A30');ENDTABLE FILE GGSALESPRINTALPHA_DATE1DT1 AS 'HYYMDm'DPT1 AS 'HDMTYYm'DT1/HdMTYYBS AS 'HdMTYYBS' DT1/HdMTYYBs AS 'HdMTYYBs' ON TABLE SET SPACES 1IF RECORDLIMIT EQ 1ON TABLE PCHOLD FORMAT XLSX END
9. Choosing a Display Format
Creating Reports With TIBCO® WebFOCUS Language 663
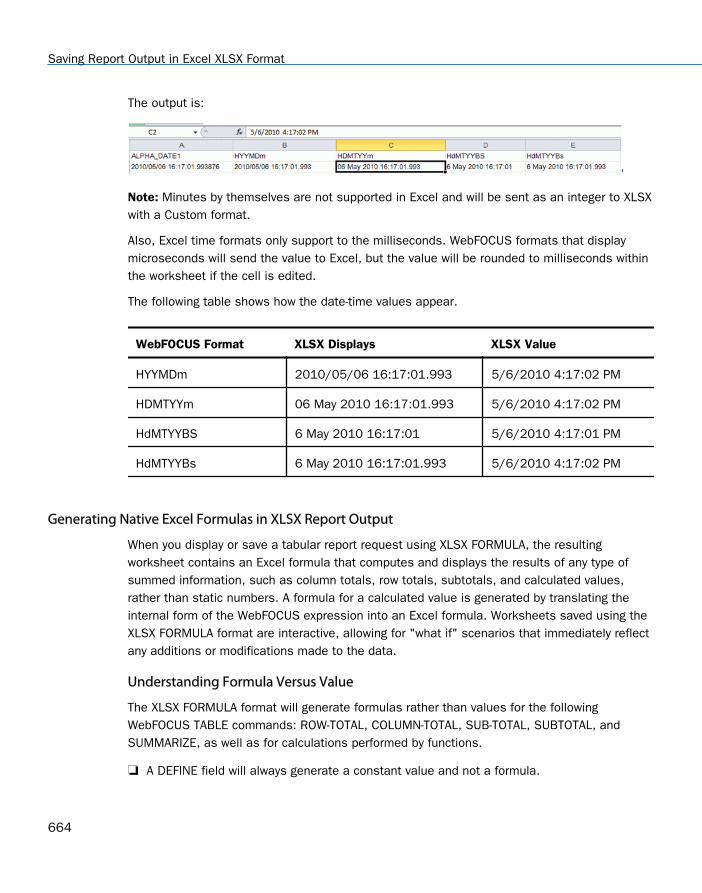
The output is:
Note: Minutes by themselves are not supported in Excel and will be sent as an integer to XLSXwith a Custom format.
Also, Excel time formats only support to the milliseconds. WebFOCUS formats that displaymicroseconds will send the value to Excel, but the value will be rounded to milliseconds withinthe worksheet if the cell is edited.
The following table shows how the date-time values appear.
WebFOCUS Format XLSX Displays XLSX Value
HYYMDm 2010/05/06 16:17:01.993 5/6/2010 4:17:02 PM
HDMTYYm 06 May 2010 16:17:01.993 5/6/2010 4:17:02 PM
HdMTYYBS 6 May 2010 16:17:01 5/6/2010 4:17:01 PM
HdMTYYBs 6 May 2010 16:17:01.993 5/6/2010 4:17:02 PM
Generating Native Excel Formulas in XLSX Report Output
When you display or save a tabular report request using XLSX FORMULA, the resultingworksheet contains an Excel formula that computes and displays the results of any type ofsummed information, such as column totals, row totals, subtotals, and calculated values,rather than static numbers. A formula for a calculated value is generated by translating theinternal form of the WebFOCUS expression into an Excel formula. Worksheets saved using theXLSX FORMULA format are interactive, allowing for "what if" scenarios that immediately reflectany additions or modifications made to the data.
Understanding Formula Versus Value
The XLSX FORMULA format will generate formulas rather than values for the followingWebFOCUS TABLE commands: ROW-TOTAL, COLUMN-TOTAL, SUB-TOTAL, SUBTOTAL, andSUMMARIZE, as well as for calculations performed by functions.
A DEFINE field will always generate a constant value and not a formula.
Saving Report Output in Excel XLSX Format
664

COMPUTE will generate the formula, except when the COMPUTE is equal to a singlevariable. In that case, the constant is placed and not the formula.
If your report contains a calculated value (generated by the COMPUTE or RECOMPUTEcommand), all of the fields referenced by the calculated value must be displayed in thereport in order for a cell reference to be included in the formula. If the referenced column isnot displayed in the workbook, the data value will be placed in the formula, rather than acell reference. Additionally, if the value cannot be reliably calculated based on theinformation passed to Excel, the value, rather than an expression, will be used. Forexample, using the LAST function in WebFOCUS cannot be translated correctly into Excel. Inthis instance, the LAST value is used in the expression, rather than a cell reference.
XLSX FORMULA is not supported with financial reports created with the Report canvas or theunderlying Financial Modeling Language (FML).
For more information, see Translation Support for FORMAT XLSX FORMULA on page 665.
Reference: Translation Support for FORMAT XLSX FORMULA
This topic describes translation support for FORMAT XLSX FORMULA. Use of unsupportedWebFOCUS features may produce unreliable results.
All standard operators are supported. These include arithmetic operators, relationaloperators, string operators, IF/THEN/ELSE, and logical operators. However, columnnotation is not supported.
The IS-PRESENT, IS-MISSING, IS-FROM, FROM, NOT-FROM, IS-MORE-THAN, IS-LESS-THAN,CONTAINS, and OMITS operators are not supported.
The logical operators AND and OR are not supported in conditional (IF-THEN-ELSE) or logicalexpressions.
The following functions are supported:
ABS, ARGLEN, ATODBL, BYTVAL, CHARGET, CTRAN, DMOD, DOWK, DOWK, DOWKL, EXP,FMOD, HEXBYT, HHMMSS, IMOD, LCWORD, LOCASE, LOG, MAX, MIN, OVRLAY, POSIT,RDUNIF, SQRT, SUBSTR, TODAY, and UPCASE. The EDIT function is supported forconverting formats (one argument variant). It is not supported for editing strings.
The functions CTRFLD, LJUST, and RJUST are not recommended for justifying data in Excelcolumns. With the use of Excel proportional fonts, the StyleSheet JUSTIFY attribute is moreappropriate.
Be cautious when using functions that use decimal values as an argument (BYTVAL,CTRAN, HEXBYT). Based on whether the operating environment is EBCDIC or ASCII, theresults may be different.
9. Choosing a Display Format
Creating Reports With TIBCO® WebFOCUS Language 665

XLSX FORMULA is not supported with the following WebFOCUS commands and phrases:
DEFINE
OVER
FOR
NOPRINT
Multiple display (PRINT, LIST, SUM, and COUNT) commands
SEQUENCE StyleSheet attribute
RECAP
SET HIDENULLACRS
SET SUBTOTALS = ABOVE
LAST
The BYDISPLAY ON setting is recommended to allow the sort field value to be available onall rows for recalculations.
If an expression requires more than 1024 characters, WebFOCUS will place the value intothe cell, and not the formula.
Conditional styling is based on the values in the original report. If the worksheet values arechanged and the formulas are recomputed, the styling will not reflect the updatedinformation.
Syntax: How to Save Reports as FORMAT XLSX FORMULA
Add the following syntax to your request to take advantage of Excel formulas in your workbook:
ON TABLE {PCHOLD|HOLD} FORMAT XLSX FORMULA
where:
PCHOLD
Displays the output in an XLSX workbook.
HOLD
Saves the output for reuse in an Excel worksheet. For details, see Saving and Reusing YourReport Output on page 471.
Saving Report Output in Excel XLSX Format
666

Example: Generating Native Excel Formulas for Column Totals
The following example illustrates how a column total in a report request is translated to anExcel formula when you use the XLSX FORMULA format. Notice that the formatting of thecolumn total (TYPE=GRANDTOTAL) is retained in the Excel workbook. When you select the totalin the report, the equation =SUM(B4:B10) displays in the formula bar, representing the columntotal as a sum of cell ranges.
TABLE FILE SHORTHEADING"Projected Return By Region"" "SUM PROJECTED_RETURN AS 'RETURN'BY REGION AS 'REGION'ON TABLE COLUMN-TOTALON TABLE PCHOLD FORMAT XLSX FORMULAON TABLE SET STYLE *TYPE=REPORT, GRID=OFF, FONT='ARIAL', SIZE=9, TITLETEXT=’By Region’,$TYPE=TITLE, BACKCOLOR=RGB(102 102 102), COLOR=RGB(255 255 255),$TYPE=HEADING, SIZE=12, STYLE=BOLD, JUSTIFY=CENTER,$TYPE=GRANDTOTAL, BACKCOLOR=RGB(210 210 210), STYLE=BOLD,$END
The output is:
9. Choosing a Display Format
Creating Reports With TIBCO® WebFOCUS Language 667

WebFOCUS can translate any total (subtotal, row total, or column total) to an Excel formula.For related information, see Translation Support for FORMAT XLSX FORMULA on page 665.
Example: Generating Native Excel Formulas for Row Totals
The following request calculates totals for returns and balances across continents. The rowtotals are represented as sums of cell ranges.
TABLE FILE SHORTHEADING"Projected Return Across Continent"" "SUM PROJECTED_RETURN AS 'Return' AND BALANCE AS 'Balance'ACROSS CONTINENT AS 'CONTINENT'BY REGION AS 'REGION'ON CONTINENT ROW-TOTAL AS 'TOTAL'ON TABLE COLUMN-TOTAL AS 'TOTAL'ON TABLE PCHOLD FORMAT XLSX FORMULAON TABLE SET STYLE *TYPE=REPORT, GRID=OFF, FONT='ARIAL', SIZE=9, TITLETEXT=’Across Continent’,$TYPE=TITLE, BACKCOLOR=RGB(102 102 102), COLOR=RGB(255 255 255),$TYPE=HEADING, SIZE=12, STYLE=BOLD, JUSTIFY=CENTER,$TYPE=ACROSSTITLE, STYLE=BOLD,$TYPE=GRANDTOTAL, BACKCOLOR=RGB(210 210 210), STYLE=BOLD,$END
The following output highlights the formula that calculates the row total in cellI12=C12+E12+G12.
Example: Generating Native Excel Formulas for Calculated Values
The following request totals the columns for retail cost and dealer cost, and calculates thevalue of a field called PROFIT by subtracting the DOLLARS from the BUDDOLLARS.
Saving Report Output in Excel XLSX Format
668
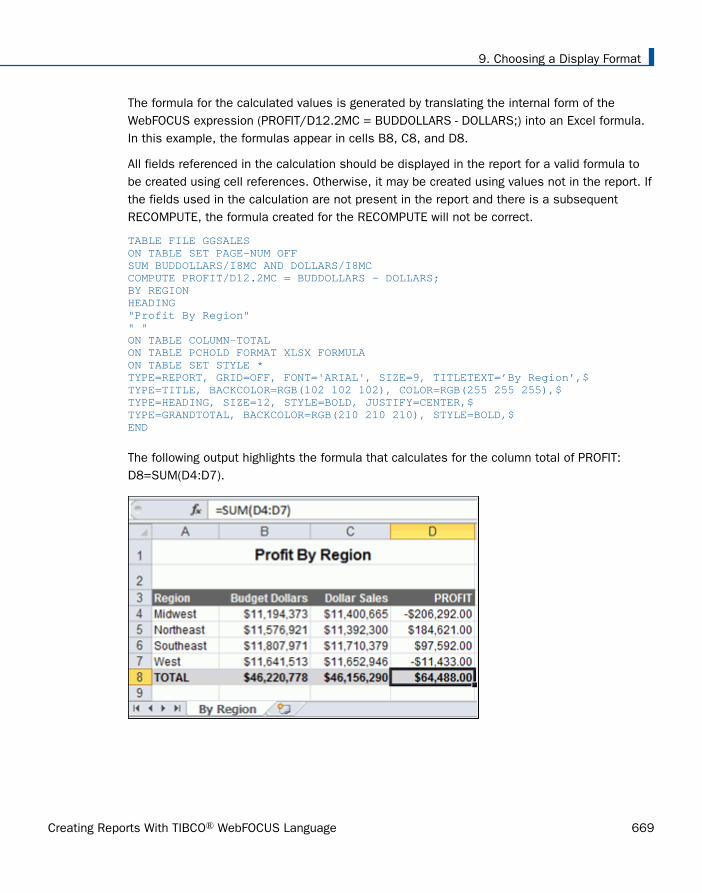
The formula for the calculated values is generated by translating the internal form of theWebFOCUS expression (PROFIT/D12.2MC = BUDDOLLARS - DOLLARS;) into an Excel formula.In this example, the formulas appear in cells B8, C8, and D8.
All fields referenced in the calculation should be displayed in the report for a valid formula tobe created using cell references. Otherwise, it may be created using values not in the report. Ifthe fields used in the calculation are not present in the report and there is a subsequentRECOMPUTE, the formula created for the RECOMPUTE will not be correct.
TABLE FILE GGSALESON TABLE SET PAGE-NUM OFFSUM BUDDOLLARS/I8MC AND DOLLARS/I8MCCOMPUTE PROFIT/D12.2MC = BUDDOLLARS - DOLLARS;BY REGIONHEADING"Profit By Region"" "ON TABLE COLUMN-TOTALON TABLE PCHOLD FORMAT XLSX FORMULAON TABLE SET STYLE *TYPE=REPORT, GRID=OFF, FONT='ARIAL', SIZE=9, TITLETEXT=’By Region’,$TYPE=TITLE, BACKCOLOR=RGB(102 102 102), COLOR=RGB(255 255 255),$TYPE=HEADING, SIZE=12, STYLE=BOLD, JUSTIFY=CENTER,$TYPE=GRANDTOTAL, BACKCOLOR=RGB(210 210 210), STYLE=BOLD,$END
The following output highlights the formula that calculates for the column total of PROFIT:D8=SUM(D4:D7).
9. Choosing a Display Format
Creating Reports With TIBCO® WebFOCUS Language 669

Example: Generating a Native Excel Formula for a Function
The following example illustrates how functions are translated to Excel reports. The functionIMOD divides ACCTNUMBER by 1000 and returns the remainder to LAST3_ACCT. The Excelformula corresponds to =TRUNC((MOD($C3,(1000)))). TRUNC is used when the answerreturned from an equation is being placed into an Integer field, to be sure there are nodecimals.
TABLE FILE EMPLOYEEPRINT ACCTNUMBER AS 'Account Number'COMPUTE LAST3_ACCT/I3L = IMOD(ACCTNUMBER, 1000, LAST3_ACCT);BY LAST_NAME AS 'Last Name' BY FIRST_NAME AS 'First Name'WHERE (ACCTNUMBER NE 000000000) AND (DEPARTMENT EQ 'MIS');ON TABLE PCHOLD FORMAT XLSX FORMULAON TABLE SET STYLE *TYPE=REPORT, GRID=OFF, FONT='ARIAL', SIZE=9,$TYPE=TITLE, BACKCOLOR=RGB(102 102 102), COLOR=RGB(255 255 255), STYLE=BOLD,$END
The output is:
Reference: Generating a Formula With Recomputed Values
If your report contains a calculated value (generated by the COMPUTE or RECOMPUTEcommand), all of the fields referenced by the calculated value must be displayed in thereport in order for cell references to be included in the formula. If a referenced column isnot displayed in the workbook, the data value will be placed in the formula, rather than acell reference. In the case of RECOMPUTE, the value used may be an incorrect value fromthe last detail record of the sort break.
Saving Report Output in Excel XLSX Format
670

Example: Generating a Formula With Recomputed Values
The following request computes the difference (DIFF) by subtracting budgeted dollars fromdollar sales. The budgeted dollars field used in the expression is not included in the SUMcommand. The value of DIFF is recomputed on the region level.
TABLE FILE GGSALESHEADING"Profit By Region"" "SUM DOLLARS/I8CM COMPUTE DIFF/I8CM=DOLLARS - BUDDOLLARS;BY REGIONBY CATEGORYON REGION RECOMPUTEON TABLE PCHOLD FORMAT XLSX FORMULAON TABLE SET STYLE *TYPE=REPORT, GRID=OFF, FONT='ARIAL', SIZE=9, TITLETEXT=’By Region’,$TYPE=TITLE, BACKCOLOR=RGB(102 102 102), COLOR=RGB(255 255 255),$TYPE=HEADING, SIZE=12, STYLE=BOLD, JUSTIFY=CENTER,$TYPE=SUBTOTAL, BACKCOLOR=RGB(210 210 210),$TYPE=GRANDTOTAL, BACKCOLOR=RGB(166 166 166), STYLE=BOLD,$END
9. Choosing a Display Format
Creating Reports With TIBCO® WebFOCUS Language 671

The output shows that the formula is subtracting a data value that is not displayed on theworksheet. It is actually the BUDDOLLARS value from the current hardcoded value, since thereis no cell reference.
If you add the BUDDOLLARS column to the request, the formula can be recomputed correctly.
SUM DOLLARS/I8MC BUDDOLLARS/I8MC
Saving Report Output in Excel XLSX Format
672

The formula generated with the new SUM command contains cell references for both fieldsused in the calculation.
Using XLSX FORMULA With Prefix Operators
XLSX FORMULA output supports prefix operators that are used on summary lines generated byWebFOCUS commands, such as SUBTOTAL and RECOMPUTE. Where a corresponding formulaexists in Excel, these prefix operators are translated into the equivalent Excel summarizationformula. The results of prefix operators used directly against retrieved data continue to bepassed to Excel as values, not formulas.
The following table identifies the prefix operators supported by XLSX FORMULA when used onsummary lines, and the Excel formula equivalent placed in the generated worksheet.
Prefix Operator Excel Formula Equivalent
SUM. =SUM()
9. Choosing a Display Format
Creating Reports With TIBCO® WebFOCUS Language 673

Prefix Operator Excel Formula Equivalent
AVE. =AVERAGE()
CNT. =COUNT()
MIN. =MIN()
MAX. =MAX()
The following prefix operators are not translated to formulas when used on summary lines inXLSX FORMULA.
ASQ.
FST.
LST.
Note:
When using a prefix operator on a field specified directly against retrieved data, there is nospace between the prefix operator and the field on which it operates.
For example, in the following aggregating display command, the AVE. prefix operatoroperates on the DOLLARS field.
SUM AVE.DOLLARS
When using a prefix operator on a summary line, you must leave a space between theprefix operator and the aggregated field on which it operates.
In the following summary command, the MAX. prefix operator operates on the DOLLARSfield at the REGION sort break. Note the required blank space between the prefix operatorand the field name.
ON REGION RECOMPUTE MAX. DOLLARS
Example: Using a Summary Prefix Operator With FORMAT XLSX FORMULA
In the following request against the GGSALES data source, the RECOMPUTE command for theREGION sort field calculates the maximum of the aggregated DOLLARS field and the minimumof the aggregated BUDDOLLARS field.
Saving Report Output in Excel XLSX Format
674
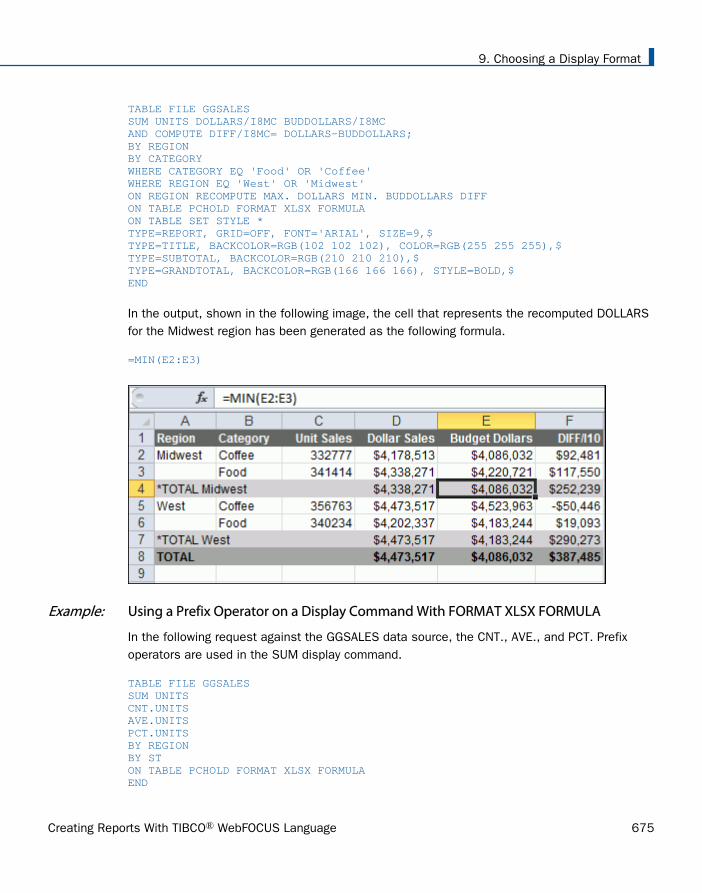
TABLE FILE GGSALESSUM UNITS DOLLARS/I8MC BUDDOLLARS/I8MCAND COMPUTE DIFF/I8MC= DOLLARS-BUDDOLLARS;BY REGIONBY CATEGORYWHERE CATEGORY EQ 'Food' OR 'Coffee'WHERE REGION EQ 'West' OR 'Midwest'ON REGION RECOMPUTE MAX. DOLLARS MIN. BUDDOLLARS DIFFON TABLE PCHOLD FORMAT XLSX FORMULAON TABLE SET STYLE *TYPE=REPORT, GRID=OFF, FONT='ARIAL', SIZE=9,$TYPE=TITLE, BACKCOLOR=RGB(102 102 102), COLOR=RGB(255 255 255),$TYPE=SUBTOTAL, BACKCOLOR=RGB(210 210 210),$TYPE=GRANDTOTAL, BACKCOLOR=RGB(166 166 166), STYLE=BOLD,$END
In the output, shown in the following image, the cell that represents the recomputed DOLLARSfor the Midwest region has been generated as the following formula.
=MIN(E2:E3)
Example: Using a Prefix Operator on a Display Command With FORMAT XLSX FORMULA
In the following request against the GGSALES data source, the CNT., AVE., and PCT. Prefixoperators are used in the SUM display command.
TABLE FILE GGSALESSUM UNITSCNT.UNITSAVE.UNITSPCT.UNITSBY REGION BY ST ON TABLE PCHOLD FORMAT XLSX FORMULAEND
9. Choosing a Display Format
Creating Reports With TIBCO® WebFOCUS Language 675

The output shows that the prefix operators were not passed to Excel as formulas. They werepassed as data values.
NODATA With Formulas
Support for full Excel functionality requires that only valid numeric values are placed into cellsthat will be used for formula references.
The null value (NODATA='') is supported for calculations. When cells containing the defaultNODATA symbol (.) are used in a formula, they will cause a formula error.
For example:
Saving Report Output in Excel XLSX Format
676

SET NODATA=''TABLE FILE GGSALESSUM DOLLARS/D12CM UNITS/D12C AND ROW-TOTAL AND COLUMN-TOTALCOMPUTE REVENUE/D12CM=DOLLARS*UNITS; AS 'Revenue'BY LOWEST GGSALES.SALES01.CATEGORYBY GGSALES.SALES01.PRODUCTACROSS REGION ON TABLE PCHOLD FORMAT XLSX FORMULAEND------------------------SET NODATA=''DEFINE FILE GGSALESDOLLARMOD/D12CM MISSING ON=IF REGION GT 'V' THEN MISSING ELSE DOLLAR;ENDTABLE FILE GGSALESSUM DOLLARMOD/D12CM UNITS/D12C AND ROW-TOTAL AND COLUMN-TOTALCOMPUTE REVENUE/D12CM=DOLLARMOD*UNITS; AS 'Revenue'BY REGIONBY LOWEST GGSALES.SALES01.CATEGORYBY GGSALES.SALES01.PRODUCTON TABLE SET PAGE-NUM NOLEADON TABLE PCHOLD FORMAT XLSX FORMULAEND
Reference: Usage Notes for XLSX With Formulas
Formulas are defined within a single worksheet. They will not be assigned acrossworksheets.
BYTOC compound workbooks can contain formulas. A separate worksheet/tab is generatedfor each primary key value and formulas are defined with references within that sheet. InBYTOC compound workbooks, a separate tab is generated for overall grand totals. Thesewill not contain formula references to the component worksheets.
Controlling Column Width and Wrapping in XLSX Report Output
Column width and data wrapping can be controlled in an Excel worksheet when usingFORMAT XLSX.
To size the column without wrapping and define the exact size width, use SQUEEZE=ON. Ifa data value is wider than the specified width of the column, a portion of the data will behidden from view, but fully visible in the formula bar. You can adjust the column width inExcel after the worksheet has been generated.
The default behavior is for all data to wrap within the defined column width. You can alsospecify the exact width of a column using WRAP=ON.
WRAP is not supported for Date format fields.
9. Choosing a Display Format
Creating Reports With TIBCO® WebFOCUS Language 677

Syntax: How to Set Column Width in XLSX Report Output
TYPE=REPORT, [COLUMN=column,] SQUEEZE=value,$
where:
column
Identifies a particular column. If COLUMN is not included in the declaration, defaultSQUEEZE behavior is applied to the entire report.
value
Is one of the following:
ON
Automatically sizes the columns based on the largest data value in the column. This isthe default behavior.
OFF
Sizes the columns based on the maximum size defined for the field in the Master Fileor Define.
n
Represents a specific numeric value for which the column width can be set. The valuerepresents the measure specified with the UNITS parameter (the default is inches).This is the most commonly used SQUEEZE setting in an XLSX report. This turns offdata wrapping.
Note:
SQUEEZE can be applied to the entire report by using the ON TABLE SET SQUEEZE ONcommand.
SQUEEZE is not supported for columns created with the OVER phrase or with TABLEF.
Syntax: How to Wrap Data in XLSX Report Output
TYPE=REPORT, [COLUMN=column,] WRAP=value,$
where:
column
Designates a particular column to apply wrapping behavior to. If COLUMN is not included inthe declaration, wrapping will be applied to the entire report.
Saving Report Output in Excel XLSX Format
678

value
Is one of the following:
ON
Turns on data wrapping. ON is the default value. With this setting, the column width isdetermined by the client (Excel). Data wraps if it exceeds the width of the column andthe row height expands to meet the new height of the wrapped data.
OFF
Turns off data wrapping. Data will not wrap in any cell in the column.
n
Represents a specific numeric value that the column width can be set to. The valuerepresents the measure specified with the UNITS parameter (the default is inches).
This setting implies ON. However, the column width is set to the specified widthunless the data is wider than the column width, in which case, wrapping will occur asfor ON.
Note: WRAP is not supported for Date format fields.
Example: Controlling Column Width and Wrapping in XLSX Report Output
The following example illustrates how to turn on and turn off data wrapping in a column andhow to set the column width for a particular column. The UNITS in this example are set toinches (the default).
DEFINE FILE GGSALESPROFIT/D14.3 = BUDDOLLARS-DOLLARS;DESCRIPTION/A80 = 'Subtract Total Sales Quota from Reported Sales to calculate profit.';END
TABLE FILE GGSALESSUM DESCRIPTION AS 'DEFAULT' DESCRIPTION AS 'WRAP = 2'DESCRIPTION AS 'WRAP = OFF'DESCRIPTION AS 'SQUEEZE = 1.5' PROFITBY REGION NOPRINTON TABLE PCHOLD FORMAT XLSXON TABLE SET STYLE *TYPE=REPORT, COLUMN=DESCRIPTION(2), WRAP=2,$TYPE=REPORT, COLUMN=DESCRIPTION(3), WRAP=OFF,$TYPE=REPORT, COLUMN=DESCRIPTION(4), SQUEEZE=1.5,$END
9. Choosing a Display Format
Creating Reports With TIBCO® WebFOCUS Language 679

where:
1. The column titled "DEFAULT" illustrates the default column width and wrapping behavior.
2. The column titled "WRAP=2" sets the column width to 2 inches with data wrapping on.
3. The column titled "WRAP=OFF" turns off data wrapping for that column.
4. The column titled "SQUEEZE=1.5" sets the column width to 1.5 inches with data wrappingoff.
Since the output spans two pages, the output is shown below in two separate images.
The following XLSX output displays the different behavior for the "DEFAULT" and "WRAP=2"columns.
The following XLSX output displays the output for the "WRAP=OFF" and "SQUEEZE=1.5"columns.
Saving Report Output in Excel XLSX Format
680

Synchronizing WebFOCUS Page Breaks With Excel Page Breaks
When using the BY_field PAGE-BREAK phrase, WebFOCUS page breaks are automaticallysynchronized with Microsoft Excel page breaks.
Example: Synchronizing WebFOCUS Page Breaks With Excel Page Breaks in Format XLSX ReportOutput
The following request generates format XLSX report output with WebFOCUS page breaks thatare inserted using the BY REGION PAGE-BREAK phrase.
TABLE FILE GGSALESHEADING"Sales Report by Region"" "SUM UNITS BUDUNITS DOLLARS BUDDOLLARSBY REGION PAGE-BREAKBY DATEBY CATEGORYWHERE CITY LE 'Memphis'ON TABLE PCHOLD FORMAT XLSXON TABLE SET STYLE *TOPMARGIN=1.25, BOTTOMMARGIN=1, $TYPE=REPORT, FONT=ARIAL, SIZE=9, $TYPE=TITLE, STYLE=BOLD, SIZE=10, $TYPE=HEADING, STYLE=BOLD, SIZE=12, $ENDSTYLEEND
9. Choosing a Display Format
Creating Reports With TIBCO® WebFOCUS Language 681

Using Print Preview in Excel, output for pages 1 and 2 for the Midwest Region are shown in thefollowing images. The default Excel page breaks are synchronized with the page breaksspecified in the WebFOCUS request. The page heading and column titles are displayed onlywhen the BY value changes.
Page 1 Output
Saving Report Output in Excel XLSX Format
682

Page 2 Output
9. Choosing a Display Format
Creating Reports With TIBCO® WebFOCUS Language 683

To repeat the page heading and column titles on each printed page, use the BY_field PAGE-BREAK phrase in combination with the XLSXPAGETITLES=ON StyleSheet attribute, as shown inthe following procedure.
Note: You can also use XLSXPAGETITLES as a SET command.
TABLE FILE GGSALESHEADING"Sales Report by Region"" "SUM UNITS BUDUNITS DOLLARS BUDDOLLARSBY REGION PAGE-BREAKBY DATEBY CATEGORYWHERE CITY LE 'Memphis'ON TABLE PCHOLD FORMAT XLSXON TABLE SET STYLE *XLSXPAGETITLES=ON,TOPMARGIN=1.25, BOTTOMMARGIN=1, $TYPE=REPORT, FONT=ARIAL, SIZE=9, $TYPE=TITLE, STYLE=BOLD, SIZE=10, $TYPE=HEADING, STYLE=BOLD, SIZE=12, $ENDSTYLEEND
Saving Report Output in Excel XLSX Format
684

Using Print Preview in Excel, output for pages 1 and 2 for the Midwest Region are shown in thefollowing images. Notice that the page heading and column titles are repeated on each printedpage.
Page 1 Output
9. Choosing a Display Format
Creating Reports With TIBCO® WebFOCUS Language 685

Page 2 Output
Note: If your report contains OVER or ACROSS phrases, use the BY_field PAGE-BREAK phrasein combination with the XLSXPAGETITLES=ALL StyleSheet or SET command.
Saving Report Output in Excel XLSX Format
686

Preserving Leading and Internal Blanks in Report Output
The SHOWBLANKS command allows you to preserve leading blanks in data cells and headingsin XLSX reports. In XLSX, internal blanks will always be retained, but leading and trailing blanksin data fields are removed. You can use the SHOWBLANKS command to retain leading andtrailing blanks.
Since XLSX is not HTML-based like EXL2K, setting SHOWBLANKS OFF will not affect internalblanks. By default, EXL2K reduces all embedded blanks to a single blank, while XLSXpreserves all embedded blanks. This difference in spacing may cause additional differences inhow fields wrap within a cell.
SET SHOWBLANKS XLSX (not HTML-based) EXL2K (HTML-based)
SET SHOWBLANKS = ON Leading and embeddedblanks are preserved.
Leading and embedded blanks arepreserved.
SET SHOWBLANKS =OFF
Leading blanks areremoved, but embeddedblanks are respected.
Leading and embedded blanks areremoved.
Blanks are handled differently in headings:
By default, in standard headings containing multiple items (without HEADALIGN=BODY),items are concatenated together into a single text object. All blanks are retained.
Fields placed in headings with HEADALIGN=BODY behave the same way as data elements.
Variables placed in headings with HEADALIGN=BODY respect all leading, embedded blanks,and trailing blanks. With SHOWBLANKS=OFF, only embedded blanks are retained. WithSHOWBLANKS=ON all leading, embedded, and trailing blanks are retained.
Syntax: How to Preserve Leading and Internal Blanks in XLSX Reports
In a FOCEXEC or in a profile, use the following syntax:
SET SHOWBLANKS = {OFF|ON}
In a request, use the following syntax
ON TABLE SET SHOWBLANKS {OFF|ON}
9. Choosing a Display Format
Creating Reports With TIBCO® WebFOCUS Language 687

where:
OFF
Removes leading blanks and preserves internal blanks in XLSX report output. OFF is thedefault value.
ON
Preserves leading and internal blanks in XLSX report output. Also preserves trailing blanksin heading, subheading, footing, subfooting lines that use the default heading or footingalignment.
Example: Preserving Leading and Internal Blanks in XLSX Report Output
The following request creates a variable called SHOWVAR that contains leading, internal, andtrailing blanks.
SET SHOWBLANKS = OFF
-SET &SHOWVAR= ' AB C ';DEFINE FILE CARSHOWFIELD/A9 = ' AB C ';END
TABLE FILE CARON TABLE SUBHEAD"SHOWBLANKS OFF""/&SHOWVAR/"""HEADING"In Heading:""SHOWVAR<+0>&SHOWVAR""SHOWFIELD<+0><SHOWFIELD""""In DATA":PRINT SHOWFIELDBY COUNTRY WHERE RECORDLIMIT EQ 1;ON TABLE PCHOLD FORMAT XLSXON TABLE SET STYLE *HEADALIGN=BODY,SQUEEZE=ON,$TYPE=TABHEADING,COLSPAN=2,$END
The following outputs show the differences in XLSX generated using SET SHOWBLANKS = OFFand SET SHOWBLANKS = ON.
Saving Report Output in Excel XLSX Format
688

SET SHOWBLANKS = OFF with HEADALIGN=BODY (no leading blanks or trailing blanks)
SET SHOWBLANKS = OFF without HEADALIGN=BODY (preserved blanks and concatenatedheading items)
9. Choosing a Display Format
Creating Reports With TIBCO® WebFOCUS Language 689

SET SHOWBLANKS = ON with HEADALIGN=BODY (leading blanks and trailing blanks)
SET SHOWBLANKS = ON without HEADALIGN=BODY (preserved blanks and concatenatedheading items)
Saving Report Output in Excel XLSX Format
690

Support for Drill Downs With XLSX Report Output
Drill downs are supported within the data elements in a report in XLSX format in the samemanner as they are supported in EXL2K format. Hyperlink connections can be defined in theStyleSheet declaration of any data column to provide access to any external web source or toexecute a FOCEXEC. Drill downs to FOCEXECs can contain data-driven parameters and cangenerate any of the supported output formats, including XLSX, PDF, HTML, DHTML, and PPT.
Drill downs within text embedded in headings, subheadings, subfootings, and footings will beimplemented for XLSX format in a future release.
Note:
When the limit of 65530 hyperlinks for a worksheet is reached, a warning messagedisplays and no further links can be inserted. For more information on drill downs, see Linking Using StyleSheets on page 821.
The JAVASCRIPT and IMAGE drill-down options are not supported with FORMAT XLSX.
Redirection and Excel Drill-Down Reports
The WebFOCUS Client can use redirection when passing the report output to the clientapplication. When redirection is enabled, the WebFOCUS Client saves report output in atemporary directory when a request is executed. Then, an HTTP call is made from the browserto retrieve the temporary stored output for display. When redirection is disabled, the reportoutput is sent directly to the browser without any buffering.
Redirection is disabled by default for the .xlsx file extension because this enables drill downsto run successfully whether the user machine is configured to launch Excel in the browser oras an application outside of the browser.
When redirection is enabled, drill downs within Excel reports will work differently depending onwhether the workbook is opened in the browser (only applies to Windows XP) or in the Excelapplication. For information about launching Excel in the browser or as an application, see Viewing Excel Workbooks in the Browser vs. the Excel Application on page 651.
For workbooks opened outside the browser in the Excel application: The current securitycontext and any previously established session-related cookies are not retained, changingthe user authorization, so drill-down reports will not have the information required to accessthe redirected files. The initial workbook will open within Excel, but the target drill-downworkbook will not open and you will receive a message stating You are not allowed toaccess this viewer file. The drill-down feature in Microsoft Office products functioned inWebFOCUS Release 7.7.x because anonymous drill-down access was permitted.
9. Choosing a Display Format
Creating Reports With TIBCO® WebFOCUS Language 691

The following options are available to allow the feature in WebFOCUS Release 8.x:
Configure WebFOCUS authentication to allow anonymous access. For more information,see the TIBCO WebFOCUS® Security and Administration manual.
Use SSO with IIS/Tomcat Integrated Windows Authentication. Renegotiation occursautomatically and the Excel and PowerPoint reports display correctly.
As of WebFOCUS Release 8.x, the Remember Me feature can be enabled on the Sign-inpage. If the end user uses the Remember Me feature, a persistent cookie is used.
For workbooks opened in the browser (only applies to Windows XP): Drill downs will workwith redirection enabled because the browser session has access to the HTTP headerand/or cookies that need to be sent with the HTTP request to the WebFOCUS Client inorder to obtain the redirected target workbook file.
Note: For Windows 7, Excel applications no longer display in a browser window.
For additional information about redirection options, see WebFOCUS Administration ConsoleClient Settings described in the TIBCO WebFOCUS® Security and Administration manual.
Excel Page Settings
Excel page settings for the XLSX workbook default to the WebFOCUS standards:
Orientation: Portrait
Page Size: Letter
,75 inches (Excel default)
.75 inches (Excel default)
To customize these page settings, turn the XLSXPAGESETS attribute ON and define individualattributes.
If XLSXPAGESETS is turned on, but the page margin attributes are not defined within theprocedure, the values will be set to the WebFOCUS default of .25 inches.
Syntax: How to Define Excel Page Settings
[TYPE=REPORT,] XLSXPAGESETS={ON|OFF} [,PAGESIZE={pagesize|LETTER}] [,ORIENTATION={PORTRAIT|LANDSCAPE}] [,TOPMARGIN=n] [,BOTTOMMARGIN=m],$
Saving Report Output in Excel XLSX Format
692
where:
XLSPAGESETS={ON|OFF}
ON causes the page settings defined in the WebFOCUS request to be applied to the Excelworksheet page settings. OFF retains the default page settings defined in the standardExcel workbook. OFF is the default value.
n
Defines the top margin for the worksheet in the units identified by the UNITS parameter(inches, by default). The default value is .25.
m
Defines the bottom margin for the worksheet in the units identified by the UNITSparameter (inches, by default). The default value is .25.
pagesize
Is one of the PAGESIZE values supported in a WebFOCUS StyleSheet. LETTER is thedefault page size.
PORTRAIT|LANDSCAPE
PORTRAIT displays the report across the narrower dimension of a vertical page, producinga page that is longer than it is wide. PORTRAIT is the default value.
LANDSCAPE displays the report across the wider dimension of a horizontal page, producinga page that is wider than it is long.
Adding an Image to a Report
WebFOCUS supports the placement of images within each area or node of the report on theworksheet. An image, such as a logo, gives corporate identity to a report, or provides visualappeal. Data specific images can be placed in headers, footers, and data columns to provideadditional clarity and style.
The image must reside on the WebFOCUS Reporting Server in a directory named on EDAPATHor APPPATH. If the file is not on the search path, supply the full path name.
Inserting Images Into Excel XLSX Reports
Images can be placed in any available WebFOCUS reporting node or element of a worksheet.Supported image formats include .gif and .jpg.
9. Choosing a Display Format
Creating Reports With TIBCO® WebFOCUS Language 693

Usage Considerations
All images will be placed in the top-left corner of the first cell of the defined area, based onthe top and left gap. Defined explicit positioning and justification have not beenimplemented yet.
Standard page setting keywords can be used in conjunction with XLSXPAGESETS to controlthe page layout in standard reports (not compound).
Images placed within a report cell in a row or column is anchored to the top-left corner ofthe cell. The cell is automatically sized to the height and width to fit the largest image(SQUEEZE=ON).
Additional lines may need to be added within a heading, footing, subhead, or subfoot toaccommodate the placement of the image.
Syntax: How to Insert Images Into WebFOCUS Report Elements in XLSX Reports
TYPE={REPORT|heading|data}, IMAGE={url|file|(column)} [,BY=byfield] [,SIZE=(w h)] ,$
where:
REPORT
Embeds an image in the body of a report. The image appears in the background of thereport. REPORT is the default value.
heading
Embeds an image in a heading or footing. Valid values are TABHEADING, TABFOOTING,FOOTING, HEADING, SUBHEAD, and SUBFOOT. Provide sufficient blank space in theheading or footing so that the image does not overlap the heading or footing text. You mayalso want to place heading or footing text to the right of the image using spot markers.
data
Defines a cell within a data column to place the image. Must be used with COLUMNS=attributes to identify the specific report column where the image should be anchored.
url
Is the URL of the image file.
Saving Report Output in Excel XLSX Format
694

file
Is the name of the image file. It must reside on the WebFOCUS Reporting Server in adirectory named on EDAPATH or APPPATH. If the file is not on the search path, supply thefull path name. When specifying a GIF file, you can omit the file extension.
column
Is an alphanumeric field in the data source that contains the name of an image file.Enclose the column in parentheses ( ). The field containing the file name or image must bea display field or BY field referenced in the request. Note that the value of the field isinterpreted exactly as if it were typed as the URL of the image in the StyleSheet. If youomit the suffix, .GIF is supplied, by default. You can use the SET BASEURL command forsupplying the base URL of the images. This way, the value of the field does not have toinclude the complete URL. This syntax is useful, for example, if you want to embed animage in a SUBHEAD, and you want a different image for each value of the BY field onwhich the SUBHEAD occurs.
byfield
Is the sort field that generates the subhead or subfoot.
SIZE
Is the size of the image. By default, an image is added at its original size.
w
Is the width of the image, expressed in the unit of measurement specified by the UNITSparameter. Enclose the w and h values in parentheses. Do not include a comma betweenthem.
h
Is the height of the image, expressed in the unit of measurement specified by the UNITSparameter.
9. Choosing a Display Format
Creating Reports With TIBCO® WebFOCUS Language 695

Example: Adding a GIF Image to a Single Table Request
In the following request, since the referenced images are not part of the existing GGSALEStable, the image files (.gif) are being built in the DEFINE and then referenced in the TABLErequest. You can NOPRINT fields if you do not want them to display as columns, but the fieldsmust be referenced in the table to include them in the internal matrix. This will allow theimages to be placed in the headings, footings, or data cells. The specific location is definedusing StyleSheet definitions for attaching the image based on field value.
DEFINE FILE GGSALESSHOWCAT/A100=CATEGORY || '.GIF';ENDTABLE FILE GGSALESSUM DOLLARS/D12CM UNITS/D12C BY LOWEST CATEGORY NOPRINTBY SHOWCAT NOPRINTBY PRODUCTACROSS REGION WHERE CATEGORY NE 'Gifts'
ON CATEGORY SUBHEAD" "“Image in SUBHEAD for Category <CATEGORY "" "ON TABLE SUBHEAD" "" "" "" Report Heading "" "" "ON CATEGORY SUBFOOT"ON CATEGORY SUBFOOT"
Saving Report Output in Excel XLSX Format
696

ON TABLE SUBFOOT"Report Footing"" "ON TABLE SET PAGE-NUM NOLEADON TABLE NOTOTALON TABLE SET ACROSSTITLE SIDEON TABLE PCHOLD FORMAT XLSXON TABLE SET STYLE *TYPE=REPORT, GRID=OFF, FONT='ARIAL', SIZE=9, TITLETEXT='Food and Coffee',$TYPE=REPORT, COLUMN=PRODUCT, SQUEEZE=1,$TYPE=TITLE, BACKCOLOR=RGB(90 90 90), COLOR=RGB(255 255 255), STYLE=BOLD,$TYPE=ACROSSTITLE, STYLE=BOLD, BACKCOLOR=RGB(90 90 90), COLOR=RGB(255 255 255),$TYPE=ACROSSVALUE, BACKCOLOR=RGB(218 225 232), STYLE=BOLD, JUSTIFY=CENTER,$TYPE=HEADING, STYLE=BOLD, COLOR=RGB(0 35 95), SIZE=12, JUSTIFY=Center,$TYPE=FOOTING, BACKCOLOR=RGB(90 90 90), SIZE=12, COLOR=RGB(255 255 255), STYLE=BOLD, JUSTIFY=CENTER,$TYPE=SUBHEAD, SIZE=12, STYLE=BOLD, BACKCOLOR=RGB(218 225 232), JUSTIFY=CENTER,$TYPE=SUBHEAD, IMAGE=(SHOWCAT), SIZE=(.6 .6),$TYPE=SUBFOOT, SIZE=10, STYLE=BOLD, JUSTIFY=CENTER,$TYPE=TABHEADING, SIZE=12, STYLE=BOLD, JUSTIFY=CENTER,$TYPE=TABHEADING, IMAGE=gglogo.gif,$TYPE=TABFOOTING, SIZE=12, STYLE=BOLD, JUSTIFY=RIGHT,$TYPE=TABFOOTING, IMAGE=tibco.gif, SIZE=(1.0 .6),$END
9. Choosing a Display Format
Creating Reports With TIBCO® WebFOCUS Language 697

The output is shown in the following image.
Example: Adding a GIF Image to a Compound Request
Note: Compound Layout syntax cannot contain hidden carriage return or line feed characters.For purposes of presenting this example, line feed characters have been added so that thesample code wraps to fit within the printed page. To run this example in your environment,copy the code into a text editor and delete any line feed characters within the CompoundLayout syntax by going to the end of each line and pressing Delete. In some instances, youmay need to add a space to maintain the structure of the string.
Saving Report Output in Excel XLSX Format
698

APP PATH IBISAMPSET HTMLARCHIVE=ON*-HOLD_SOURCECOMPOUND LAYOUT PCHOLD FORMAT XLSXUNITS=IN,$SECTION=section1, LAYOUT=ON, METADATA='prop_with_names, Margins_Left=0.5,Margins_Top=0.5, Margins_Right=0.5, Margins_Bottom=0.5,thumbnailscale=4', MERGE=OFF, ORIENTATION=LANDSCAPE, PAGESIZE=Legal,SHOW_GLOBALFILTER=OFF,$PAGELAYOUT=1, NAME='Page layout 1', text='Page layout 1', TOC-LEVEL=1, BOTTOMMARGIN=0.5, TOPMARGIN=0.5, METADATA='BOTTOMMARGIN=0.5, TOPMARGIN=0.5,LEFTMARGIN=0,RIGHTMARGIN=0,',$COMPONENT='report1', TEXT='report1', TOC-LEVEL=2, POSITION=(0.650 0.917),DIMENSION=(7.250 3.000), BYTOC=0, ARREPORTSIZE=DIMENSION,METADATA='left: 0.65in; top: 0.917in; width: 7.25in; height: 3in;position: absolute; z-index: 1;',$COMPONENT='chart1', TEXT='chart1', TOC-LEVEL=2, POSITION=(0.735 4.332),DIMENSION=(7.167 2.917), COMPONENT-TYPE=GRAPH, ARREPORTSIZE=DIMENSION,METADATA='left: 0.735in; top: 4.332in; width: 7.167in; height: 2.917in;position: absolute; z-index: 2;',$END
SET COMPONENT='report1'-*component_type reportDEFINE FILE GGSALESSHOWCAT/A100=CATEGORY || '.GIF';SHOWDATEQ/Q=DATE;SHOWDATEY/YY=DATE;SHOWDATEQY/YYQ=DATE;END
9. Choosing a Display Format
Creating Reports With TIBCO® WebFOCUS Language 699

TABLE FILE GGSALESSUM DOLLARS/D12CM AS 'Dollars' BY REGION AS ''BY LOWEST CATEGORYBY SHOWCAT AS 'Data Image'ACROSS SHOWDATEY AS ''ACROSS SHOWDATEQ AS ''WHERE REGION NE 'Midwest' OR 'West'ON TABLE SET HIDENULLACRS ONHEADING" ""Image in Page Heading "ON REGION SUBHEAD" <+0> SUBHEAD: <REGION"FOOTING" ""Image in Page Footing"ON TABLE SET PAGE-NUM NOLEADON TABLE NOTOTALON TABLE PCHOLD FORMAT XLSX ON TABLE SET STYLE *TYPE=REPORT, SIZE=10, BACKCOLOR=NONE, GRID=OFF, FONT='ARIAL',XLSXPAGESETS=ON, TOPMARGIN=1, BOTTOMMARGIN=1, ORIENTATION=LANDSCAPE,PAGESIZE=LEGAL, TITLETEXT='With Images',$TYPE=REPORT, COLUMN=REGION, SQUEEZE=1.5, JUSTIFY=CENTER,$TYPE=DATA, BACKCOLOR=NONE,$TYPE=DATA, COLUMN=SHOWCAT, IMAGE=(SHOWCAT), SIZE=(.5 .5),$TYPE=TITLE, BACKCOLOR=RGB(218 225 232), BORDER=LIGHT, STYLE=-UNDERLINE+BOLD,$TYPE=HEADING, IMAGE=GGLOGO.GIF, SIZE=(.65 .65),$TYPE=HEADING, SIZE=12, STYLE=BOLD, JUSTIFY=CENTER,$TYPE=SUBHEAD, SIZE=10, STYLE=BOLD, BORDER-TOP=LIGHT,$TYPE=SUBHEAD, BY=1, JUSTIFY=CENTER, BORDER-TOP=LIGHT,$TYPE=SUBFOOT, STYLE=BOLD,$TYPE=FOOTING, SIZE=12, STYLE=+BOLD, JUSTIFY=CENTER,$TYPE=FOOTING, IMAGE=tibco.gif, SIZE=(1.0 .6),$TYPE=ACROSS, JUSTIFY=CENTER, BORDER=LIGHT,$TYPE=ACROSSTITLE, STYLE=-UNDERLINE+BOLD,$TYPE=ACROSSVALUE, BACKCOLOR=RGB(218 225 232), STYLE=-UNDERLINE+BOLD,$END
Saving Report Output in Excel XLSX Format
700

SET COMPONENT='chart1'ENGINE INT CACHE SET ON-DEFAULTH &WF_STYLE_UNITS='PIXELS';-DEFAULTH &WF_STYLE_HEIGHT='1005.0';-DEFAULTH &WF_STYLE_WIDTH='1070.0';-DEFAULTH &WF_TITLE='WebFOCUS Report';GRAPH FILE GGSALESHEADING"Sales Graph"SUM GGSALES.SALES01.DOLLARSBY SHOWDATEY AS YearBY GGSALES.SALES01.REGIONON GRAPH PCHOLD FORMAT XLSXON GRAPH SET VZERO OFFON GRAPH SET HTMLENCODE ONON GRAPH SET GRAPHDEFAULT OFFON GRAPH SET GRWIDTH 1ON GRAPH SET UNITS &WF_STYLE_UNITSON GRAPH SET HAXIS 1000ON GRAPH SET VAXIS 1000ON GRAPH SET GRMERGE ADVANCEDON GRAPH SET GRLEGEND 0ON GRAPH SET GRXAXIS 2ON GRAPH SET LOOKGRAPH HBARON GRAPH SET STYLE *
*GRAPH_SCRIPTsetPieDepth(0);setPieTilt(0);setDepthRadius(0); setCurveFitEquationDisplay(false); setPlace(true); setPieFeelerTextDisplay(1); setUseSeriesShapes(true);setMarkerSizeDefault(50); setScaleMustIncludeZero(getX1Axis(), false);setScaleMustIncludeZero(getY1Axis(), false);setScaleMustIncludeZero(getY2Axis(), false);setMarkerSizeDefault(60); *ENDINCLUDE=IBFS:/FILE/IBI_HTML_DIR/javaassist/intl/EN/ENIADefault_combine.sty,$TYPE=REPORT, TITLETEXT='Graph Over Time',$*GRAPH_SCRIPTsetReportParsingErrors(false);setSelectionEnableMove(false);*ENDENDSTYLEENDCOMPOUND END
9. Choosing a Display Format
Creating Reports With TIBCO® WebFOCUS Language 701

The output is shown in the following images.
Saving Report Output in Excel XLSX Format
702

Example: Adding a GIF Image to a BYTOC Compound Request
The following syntax is a portion of the code from the previous example to show theCOMPOUND BYTOC syntax. By adding the ON TABLE SET COMPOUND BYTOC command to thecompound report above, you can turn the report into a Compound Table of Contents report.The BYTOC syntax can be added to a stand-alone request or to a component of a compounddocument.
TABLE FILE GGSALESSUM DOLLARS/D12CM AS 'Dollars'SHOWREGNOPRINTBY REGION AS ''BY LOWEST CATEGORYBY SHOWCAT AS 'Data Image'WHERE REGION NE 'Midwest' OR 'West'ACROSS SHOWDATEY AS '' ACROSS SHOWDATEQ AS ''ON TABLE SET HIDENULLACRS ON HEADING"Image in Page Heading" ON REGION SUBHEAD"<+0> Image in SUBHEAD:<REGION" FOOTING" ""Image in Page Footing"ON TABLE SET PAGE-NUM NOLEAD ON TABLE NOTOTALON TABLE PCHOLD FORMAT XLSX ON TABLE SET COMPOUND BYTOC ON TABLE SET STYLE *
9. Choosing a Display Format
Creating Reports With TIBCO® WebFOCUS Language 703

The output is:
Inserting Text and Images Into XLSX Workbook Headers and Footers
WebFOCUS supports the insertion of text and images into Excel headers and footers and thedefinition of key page settings to support the placement of text and images in relationship tothe overall worksheet and the Excel generated page breaks. This access to the Excel pagefunctionality is designed to enhance overall usability of the worksheets for users who will beprinting these reports. Page settings including orientation, page size, and page margins willdirectly affect the layout of each Excel page based on values defined within the FOCEXEC.Images and text can be included on headers and footers on every printed page, on the firstpage of the report only, or only on all subsequent pages. The WebFOCUS headings andfootings continue to display within the worksheet. With this feature, WebFOCUS can insertlogos to be printed once at the top of a report and watermark images that need to bedisplayed on every printed page.
Syntax: How to Insert Text and Images Into XLSX Workbook Headers and Footers
To place images in XLSX Workbook headers and footers, the syntax is:
TYPE={PAGEHEADER|PAGEFOOTER},OBJECT=IMAGE, IMAGE=imagename, JUSTIFY={LEFT|CENTER|RIGHT} [,DISPLAYON={FIRST|NOT-FIRST}] [,SIZE=(w h)],$
Saving Report Output in Excel XLSX Format
704

To place text in XLSX Workbook headers and footers, the syntax is:
TYPE={PAGEHEADER|PAGEFOOTER},OBJECT=STRING, TEXT=text, JUSTIFY={LEFT|CENTER|RIGHT} [,DISPLAYON={FIRST|NOT-FIRST}] ,$
where:
PAGEHEADER
Places the text or image in the worksheet header.
PAGEFOOTER
Places the text or image in the worksheet footer.
imagename
Is the name of a valid image file to be placed in the header or footer. The image must belocated in the defined application path on the Reporting Server. The image types supportedare GIF and JPEG.
text
Is the text to be placed in the header or footer.
JUSTIFY={LEFT|CENTER|RIGHT}
Identifies the area in the header or footer to contain the text or image and the justificationor placement within that defined area.
DISPLAYON
Defines whether the text or image should be placed on the first page only or on all pagesexcept the first. Omit this attribute to place the text or image on all pages.
Valid values are:
FIRST places the text or image only on the first page.
NOT-FIRST places the text or image on every page, except the first page.
SIZE=(w h)
Is the size of the image. By default, an image is added at its original size.
w is the width of the image, expressed in the unit of measurement specified by the UNITSparameter.
h is the height of the image, expressed in the unit of measurement specified by the UNITSparameter.
9. Choosing a Display Format
Creating Reports With TIBCO® WebFOCUS Language 705

Example: Inserting Images in Excel Headers and Footers and Defining Page Settings
The following request against the GGSALES data source places the image tibco.gif on the leftheader area of the first page and the right header area of every subsequent page of theresulting worksheet. It places the image gglogo1.gif in the center area of the footer on everypage.
TABLE FILE GGSALESSUM DOLLARS UNITS BUDDOLLARS BUDUNITS BY REGIONBY STBY CATEGORYBY PRODUCTON TABLE SET BYDISPLAY ONON TABLE PCHOLD FORMAT XLSX ON TABLE SET STYLE *FONT=ARIAL,SIZE=12,XLSXPAGESETS=ON,TOPMARGIN=2,BOTTOMMARGIN=2,ORIENTATION=LANDSCAPE,PAGESIZE=LETTER,$TYPE=TITLE, COLOR=WHITE, BACKCOLOR=GREY,$TYPE=PAGEHEADER, OBJECT=IMAGE, JUSTIFY=LEFT, IMAGE=tibco.GIF, DISPLAYON=FIRST,$TYPE=PAGEHEADER, OBJECT=IMAGE, JUSTIFY=RIGHT, IMAGE=tibco.GIF, DISPLAYON=NOT-FIRST,$TYPE=PAGEFOOTER, OBJECT=IMAGE, JUSTIFY=CENTER, IMAGE=gglogo.GIF,$END
Saving Report Output in Excel XLSX Format
706
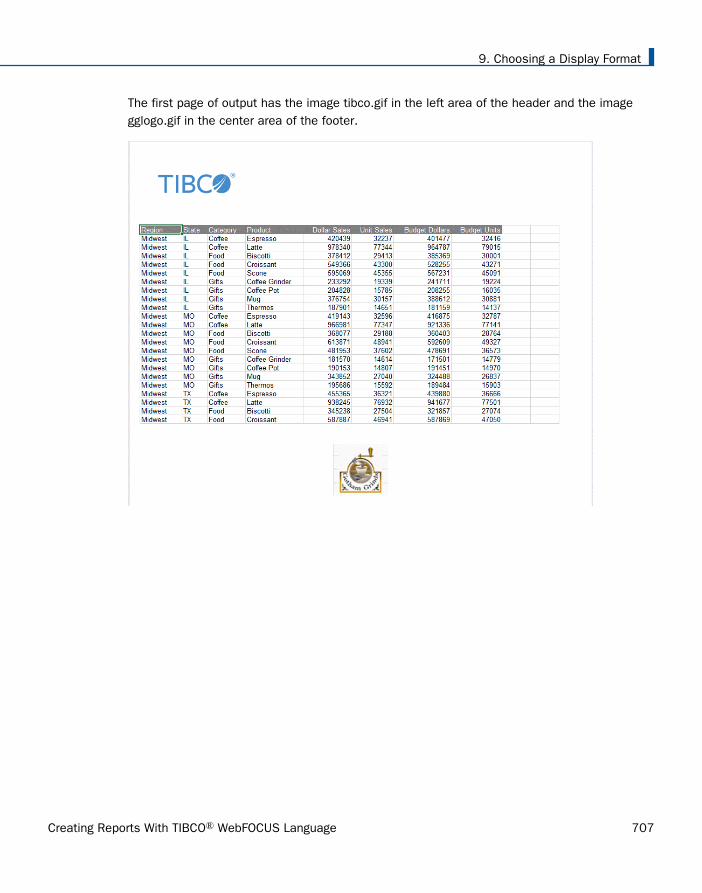
The first page of output has the image tibco.gif in the left area of the header and the imagegglogo.gif in the center area of the footer.
9. Choosing a Display Format
Creating Reports With TIBCO® WebFOCUS Language 707

The second page of output has the image tibco.gif in the right area of the header and theimage gglogo.gif in the center area of the footer.
Reference: Usage Notes for Inserting Text and Images Into XLSX Worksheet Headers and Footers
In Microsoft Excel, the maximum number of characters in a page header or page footer is255. This limit is for the entire page header or page footer (across the left, center, andright), and includes symbols or any other characters that Microsoft Excel needs to use, inaddition to the text string itself. Any text string that exceeds this limit will be truncated.
The Excel headers and footers are not automatically sized based on contents of the areas.Define page margins within the page settings (XLSPAGESETS) to account for the spacerequired to display the images within each page of the report.
The image sizing based on the specified height and width is not proportional. Sizing maycause image distortion.
BLOB image fields are not supported in this release.
Saving Report Output in Excel XLSX Format
708

Reference: Displaying Watermarks on XLSX Report Output
Watermark images can be placed into the Excel headers to display on every printed page of thegenerated worksheet.
Excel places images on the page starting in the header from left to right and then the footerfrom left to right. Large images placed in the header may overlap images before them in thepresentation order. For page layouts with a logo in the left area and watermark centered on thepage, watermark image background must be transparent so it does not overlay the logo image.
In Excel, images are placed first on the page. All other contents of the worksheet are thenplaced on top of the images. Text in cells and styling, such as background color and drawingobjects, are placed on top of the images. Excel supports transparency in drawing objects andimages, but not in cell background color. BACKCOLOR will cover over images placed on thepage.
Example: Placing a Watermark in an XLSX Header
The following request against the GGSALES data source uses the image internaluseonly.gif asa watermark to display in the background of every page of the worksheet. Although the imageis placed in the center area of the header, it is large enough to span the entire worksheetpage. It has a transparent background, so it does not cover the logo images placed at the leftin the header and the center in the footer.
TABLE FILE GGSALESSUM DOLLARS UNITS BUDDOLLARS BUDUNITS BY REGIONBY STBY CATEGORYBY PRODUCTON TABLE SET BYDISPLAY ONON TABLE PCHOLD FORMAT XLSX ON TABLE SET STYLE *XLSXPAGESETS=ON,TOPMARGIN=1,BOTTOMMARGIN=1,LEFTMARGIN=1, RIGHTMARGIN=1, ORIENTATION=LANDSCAPE,PAGESIZE=LETTER,$TYPE=PAGEHEADER, OBJECT=IMAGE, JUSTIFY=LEFT, IMAGE=TIBCO.GIF, DISPLAYON=FIRST,$TYPE=PAGEHEADER, OBJECT=IMAGE, JUSTIFY=CENTER, IMAGE=WFINTERNALUSEONLY.GIF,$TYPE=PAGEFOOTER, OBJECT=IMAGE, JUSTIFY=RIGHT, IMAGE=GGLOGO.GIF,$END
9. Choosing a Display Format
Creating Reports With TIBCO® WebFOCUS Language 709
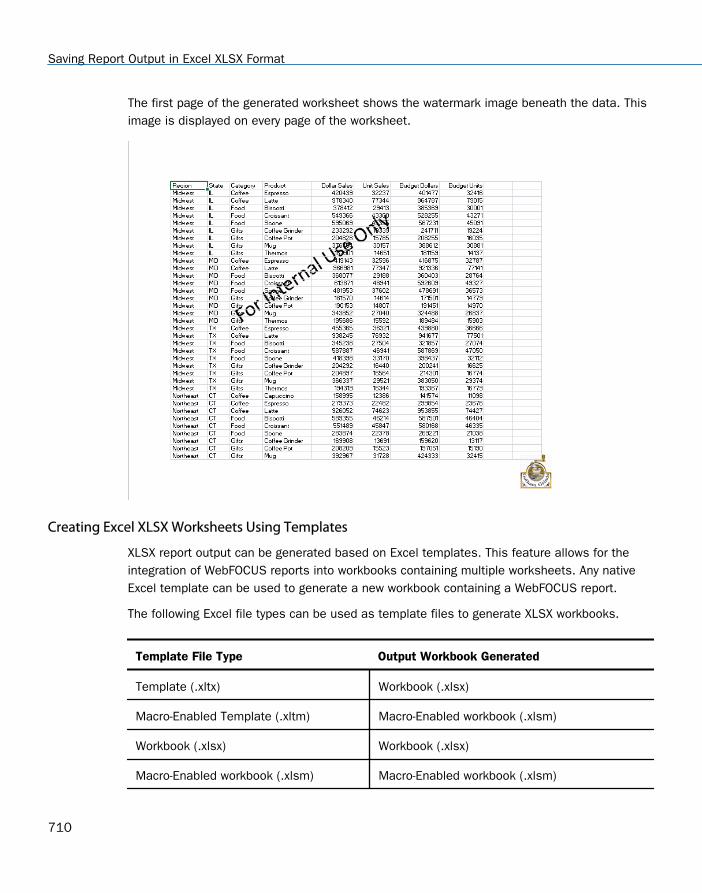
The first page of the generated worksheet shows the watermark image beneath the data. Thisimage is displayed on every page of the worksheet.
Creating Excel XLSX Worksheets Using Templates
XLSX report output can be generated based on Excel templates. This feature allows for theintegration of WebFOCUS reports into workbooks containing multiple worksheets. Any nativeExcel template can be used to generate a new workbook containing a WebFOCUS report.
The following Excel file types can be used as template files to generate XLSX workbooks.
Template File Type Output Workbook Generated
Template (.xltx) Workbook (.xlsx)
Macro-Enabled Template (.xltm) Macro-Enabled workbook (.xlsm)
Workbook (.xlsx) Workbook (.xlsx)
Macro-Enabled workbook (.xlsm) Macro-Enabled workbook (.xlsm)
Saving Report Output in Excel XLSX Format
710

WebFOCUS XLSX TEMPLATE format provides support for basic Excel templates (.xltx) files.These templates cannot contain macros or other content that Microsoft considers active, aswell as templates with active content (XLTM/XLSM). Additionally, macro-enabled templates(.xltm) allow for the inclusion of active content (macros and VB script) into templates.
A WebFOCUS EXL07 template procedure generates a native Excel workbook with the standardExcel extension, based on the defined template file. The WebFOCUS request will replace anexisting worksheet within the template workbook, and any formulas or references defined inother worksheets to cells within the replaced worksheet will automatically update when theworkbook is opened.
Since the template feature replaces existing worksheets, the designated worksheet must existin the template workbook. Any content on the replaced worksheet within the template will notbe retained. Content contained on any other worksheets will be retained and updated.
Named ranges can be defined within the procedure using the INRANGES attribute to designatecell groupings that can be referenced by other worksheets.
An Excel 2007/2010 template can be generated by saving any workbook with the .xltxextension. The template file should be stored within your application path (EDAPATH or APPPATH) rather than the default Excel template directory so that it can be accessed by theReporting Server when the procedure is executed.
The EXL07 TEMPLATE feature is supported for basic EXL07 format reports. The followingfeatures are not supported with EXL07 TEMPLATE in this release: FORMULA, EXL97, EXCEL,and compound Excel reports.
In most cases, existing Excel 2003/2000 templates created as .mht files can easily beconverted to Excel 2013/2010/2007 templates by opening the .mht file in Excel2013/2010/2007 and resaving the file as either an Excel template (.xltx) or a macro enabled(.xltm) file. Native Excel formulas and functionality should be retained within these templates.Use .xltms to retain active content, including macros. This new XLTX template can be usedwith XLSX procedures.
Syntax: How to Create an XLSX Report Using Any Supported Template File Type
To support the expanded template files types, the template file name attribute has beenenhanced to allow for the inclusion of the file extension. If no extension is specified within thetemplate name, the file extension will default to .XLTX.
ON TABLE PCHOLD FORMAT XLSX TEMPLATE template_name SHEETNUMBER n
9. Choosing a Display Format
Creating Reports With TIBCO® WebFOCUS Language 711

where:
template_name
Is the name of the Excel template file (workbook), up to 64 characters including the filename and extension, residing on the WebFOCUS Reporting Server application directorysearch path. For example, IPOLICY.XLTX, PRINTSHEETS.XLTM, or DASHBOARD.XLSM. If theextension is not provided, it defaults to .XLTX.
n
Is the number of the existing Excel worksheet being replaced in the template file(workbook).
Reference: Usage Notes for XLSX Templates
The workbook template used by the WebFOCUS procedure must contain valid worksheets.
The worksheet that is updated must exist in the workbook, as WebFOCUS is replacing theworksheet rather than inserting a worksheet. If the sheet designated does not exist, theprocedure will return an error.
In any template file, at least one of the sheets in the workbook must contain a cell with avalid value (blank or any other value). To replace a worksheet in a template that containsonly empty worksheets, replace one of the cells in any of the sheets with a space andsave. This will instantiate the worksheets so they are accessible to WebFOCUS forupdating.
The supported file name length has been extended to 64 characters. Any procedurereferencing a template with a longer file name produces a message.
Creating Excel Table of Contents Reports
Excel Table of Contents (BYTOC) enables you to generate a separate worksheet within aninstance of the report for each value of the first BY field in the WebFOCUS report.
Syntax: How to Use the Excel Table of Contents Feature
There are three different ways that BYTOC can be invoked:
ON TABLE {HOLD|PCHOLD} FORMAT XLSX BYTOC
SET COMPOUND=BYTOC
ON TABLE SET COMPOUND BYTOC
Saving Report Output in Excel XLSX Format
712

Since a BYTOC report generates separate worksheets according to the value of the first BYfield in the report, the report must contain at least one BY field. The primary BY field may be aNOPRINT field.
The BYTOC feature is not supported with the XLSX TEMPLATE format.
Example: Creating a Simple BYTOC Report
The following request against the GGSALES data source creates separate tabs based on theREGION sort field.
TABLE FILE GGSALESSUM UNITS/D12C DOLLARS/D12CMBY REGION NOPRINTBY CATEGORYBY PRODUCTHEADING"<REGION Region Sales"ON TABLE PCHOLD FORMAT XLSXON TABLE SET BYDISPLAY ONON TABLE SET COMPOUND BYTOCON TABLE SET STYLE *TYPE=REPORT, FONT=ARIAL, SIZE=9,$TYPE=HEADING, SIZE=12,$TYPE=TITLE, BACKCOLOR=GREY, COLOR=WHITE,$ENDSTYLEEND
The output is:
9. Choosing a Display Format
Creating Reports With TIBCO® WebFOCUS Language 713
Reference: How to Name Worksheets
The worksheet tab names are the BY field values that correspond to the data on thecurrent worksheet. If the user specifies the TITLETEXT keyword in the StyleSheet, it will beignored.
Excel limits the length of worksheet titles to 31 characters. The following special characterscannot be used: ':', '?', '*', and '/'.
If you want to use date fields as the bursting BY field, you can include the - characterinstead of the / character. The - character is valid in an Excel tab title. However, if you douse the / character, WebFOCUS will substitute it with the - character.
Naming XLSX Worksheets With Case Sensitive Data
Excel requires each sheet name to be unique. Excel is case insensitive meaning it evaluatestwo values as being the same when the values contain the same characters but have differentcasing. For example, Excel evaluates the values WEST and West to be the same value.WebFOCUS XLSX format identifies duplicate names and adds a unique number to the name toallow Excel to maintain both sheets.
By default, WebFOCUS sort processing is case-sensitive, so the same field value with differentcasing is considered to be two different values when used as a sort (BY) field. In an ExcelBYTOC report, WebFOCUS will generate sheets with sheet names for each value of the primarysort (BY) key based on case sensitivity. To account for this, XLSX has been enhanced to addcounters where duplicate tab names are found in the data to ensure the names are unique.
Saving Report Output in Excel XLSX Format
714

For example, if the report had EAST and East as the values for the Region, each worksheetwould be displayed as EAST(1) and East(2), as shown in the following image.
Overcoming the Excel 2007/2010 Row Limit Using Overflow Worksheets
The maximum number of rows supported by Excel 2007/2010 on a worksheet is 1,048,576(1MB). When you create an XLSX output file from a WebFOCUS report, the number of rowsgenerated can be greater than this maximum.
To avoid creating an incomplete output file, you can have extra rows flow onto a newworksheet, called an overflow worksheet. The name of each overflow worksheet will be thename of the original worksheet appended with an increment number.
In addition, when the overflow worksheet feature is enabled, you can set a target value for themaximum number of rows to be included on a worksheet. By default, the row limit will be set tothe default value for the LINES parameter (57).
Note: By default, when generating XLSX output, the WebFOCUS page heading and page footingcommands generate only worksheet headings and worksheet footings.
Syntax: How to Enable Overflow Worksheets
Add the ROWOVERFLOW attribute to your WebFOCUS StyleSheet
TYPE=REPORT, ROWOVERFLOW={ON|OFF|PBON}, [ROWLIMIT={n|MAX},]$
9. Choosing a Display Format
Creating Reports With TIBCO® WebFOCUS Language 715

where:
ON
Enables overflow worksheets.
OFF
Disables overflow worksheets. OFF is the default value.
PBON
Inserts WebFOCUS page breaks that display the page heading, footing, and column titlesat the appropriate places within the worksheet rows. This option does not cause a newworksheet to start when a WebFOCUS page break occurs.
ROWLIMIT=n
Sets a target value for the number of rows to be included on a worksheet to n rows. Thedefault value is the LINES value (by default, 57).
ROWLIMIT=MAX
Sets a target value for the number of rows to be included on a worksheet to 1,048,000rows for XLSX output.
Reference: Usage Notes for XLSX Overflow Worksheets
The report heading is placed once at the start of the first sheet. The report footing isplaced once at the bottom of the last overflow sheet.
Unless the PBON setting is used, worksheet headings and column titles are repeated atthe top of the original sheet and each subsequent overflow sheet. worksheet footings areplaced at the bottom of the original sheet and each subsequent overflow sheet. The datavalues are displayed on the top data row of each overflow sheet as they would be on astandard new page.
Report total lines are displayed at the bottom of the last overflow sheet directly above thefinal page and table footings.
Subheadings, subfootings, and subtotal lines display within the data flow as normal. Nospecial consideration is made to retain groupings within a given sheet.
If ROWOVERFLOW=PBON, the page headings and footings and column titles display withinthe worksheet when a WebFOCUS command causes a page break.
For XLSX output, if the ROWOVERFLOW attribute is specified in the StyleSheet andROWLIMIT is greater than 1MB, the following message is presented and no output file isgenerated:
Saving Report Output in Excel XLSX Format
716

(FOC3338) The row limit for EXCEL XLSX worksheets is 1048576.
Output types that contain formula references (EXL2K PIVOT and EXL2K FORMULA) are notsupported, as formula references are not automatically updated to reflect placement onnew overflow worksheets.
The overflow worksheet feature applies to rows only, not columns. A new worksheet will notautomatically be created if a report generates more than the Excel 2007/2010 limit or16,384 columns.
ROWOVERFLOW is supported for BYTOC reports for XLSX.
As named ranges in Excel cannot run across multiple worksheets, the IN-RANGES phrasethat defines named ranges in the resulting workbook is not supported with theROWOVERFLOW feature. When they exist together in the same request, ROWOVERFLOWtakes precedence and the IN-RANGES phrase is ignored.
Example: Creating Overflow Worksheets
The following request creates XLSX report output with overflow worksheets. TheROWOVERFLOW=ON attribute in the StyleSheet activates the overflow feature. Without thisattribute, one worksheet would have been generated instead of three.
TABLE FILE GGSALES-* ****Report Heading****ON TABLE SUBHEAD"SALES BY REGION, CATEGORY, AND PRODUCT"" "-* ****Worksheet Heading****HEADING"SALES REPORT WORKSHEET <TABPAGENO"" "-* ****Worksheet Footing****FOOTING" ""END OF WORKSHEET <TABPAGENO"PRINT DOLLARS UNITS BUDDOLLARS BUDUNITSBY REGIONBY CATEGORYBY PRODUCTBY DATE
9. Choosing a Display Format
Creating Reports With TIBCO® WebFOCUS Language 717

-* ****Subfoot****ON REGION SUBFOOT" "" End of Region <REGION"" "-* ****Subhead****ON REGION SUBHESD" ""Category <CATEGORY for Region <REGION"" "-* ****Report Footing****ON TABLE SUBFOOT" ""END OF REPORT"ON TABLE PCHOLD FORMAT XLSXON TABLE SET STYLE *TYPE=REPORT, TITLETEXT=EXLOVER, ROWOVERFLOW=ON, ROWLIMIT=2000,$ENDSTYLEEND
The report heading displays on the first worksheet only, the page heading and column titlesdisplay on each worksheet, and the subhead and subfoot display whenever the associated sortfield changes value. The following image shows the top of the first worksheet, displaying thereport heading, page heading, column titles, and first subhead.
Saving Report Output in Excel XLSX Format
718
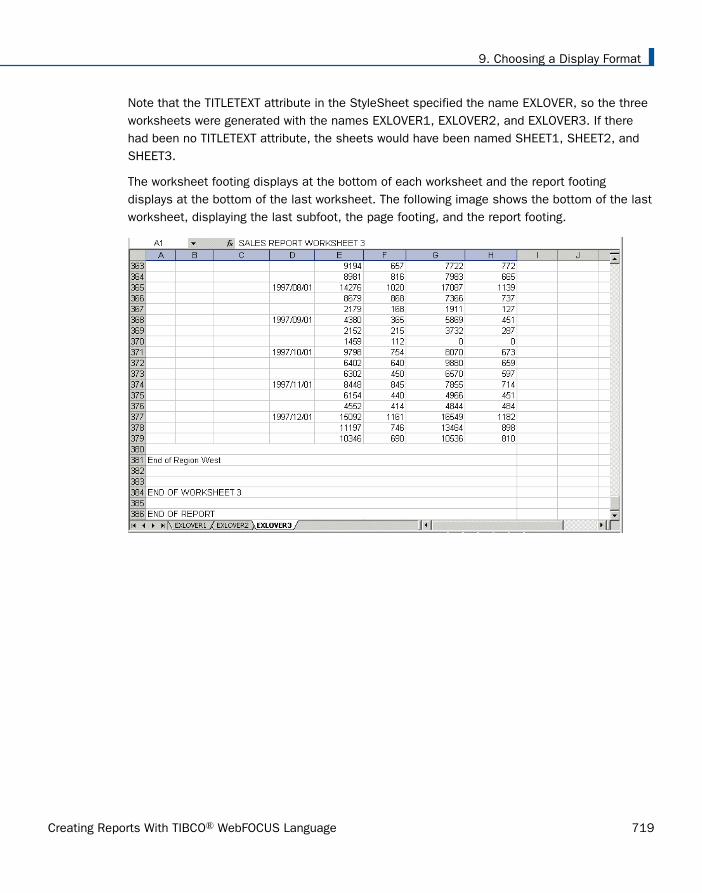
Note that the TITLETEXT attribute in the StyleSheet specified the name EXLOVER, so the threeworksheets were generated with the names EXLOVER1, EXLOVER2, and EXLOVER3. If therehad been no TITLETEXT attribute, the sheets would have been named SHEET1, SHEET2, andSHEET3.
The worksheet footing displays at the bottom of each worksheet and the report footingdisplays at the bottom of the last worksheet. The following image shows the bottom of the lastworksheet, displaying the last subfoot, the page footing, and the report footing.
9. Choosing a Display Format
Creating Reports With TIBCO® WebFOCUS Language 719

Example: Creating Overflow Worksheets With WebFOCUS Page Breaks
The following request creates XLSX report output with overflow worksheets. TheROWOVERFLOW=PBON attribute in the StyleSheet activates the overflow feature, and theROWLIMIT=250 sets the maximum number of rows in each worksheet to approximately 250.Without this attribute, one worksheet would have been generated. The PRODUCT sort phrasespecifies a page break.
TABLE FILE GGSALES-* ****Report Heading****ON TABLE SUBHEAD"SALES BY REGION, CATEGORY, AND PRODUCT"" "PRINT DOLLARS UNITS BUDDOLLARS BUDUNITSBY REGION BY HIGHEST CATEGORY BY PRODUCT PAGE-BREAKBY DATEWHERE DATE GE '19971001'-* ****Page Heading****HEADING" Product: <PRODUCT in Category: <CATEGORY for Region: <REGION"-* ****Page Footing****FOOTING" "-* ****Report Footing****ON TABLE SUBFOOT" ""END OF REPORT"ON TABLE SET BYDISPLAY ONON TABLE PCHOLD FORMAT XLSXON TABLE SET STYLE *INCLUDE=IBFS:/FILE/IBI_HTML_DIR/javaassist/intl/EN/ENIADefault_combine.sty,$ TITLETEXT=EXLOVER, ROWOVERFLOW=PBON, ROWLIMIT=250,$ENDSTYLEEND
Saving Report Output in Excel XLSX Format
720

The report heading displays on the first worksheet only, the page heading, footing, and columntitles display on each worksheet and at each WebFOCUS page break (each time the productchanges), and the subhead and subfoot display whenever the associated sort field changesvalue. The following image shows the top of the first worksheet.
Excel Compound Reports Using XLSX
Excel compound reports generate compound workbooks that can contain multiple worksheetreports using the XLSX output format.
9. Choosing a Display Format
Creating Reports With TIBCO® WebFOCUS Language 721

You can use standard Compound Layout syntax to generate XLSX compound workbooks. Bydefault, each of the component reports from the compound report is placed in a new Excelworksheet (analogous to a new page in PDF).
The components of an Excel compound report can include standard tables, Table of Content(BYTOC), and ROWOVERFLOW reports.
Component graphs will be added to worksheets as images.
Reference: Usage Notes for Excel Compound Reports Using XLSX
Images and graphs can be embedded within a component, but images and drawing objects(lines, boxes, strings) defined in Compound Layout syntax on a page layout will not beincluded in the generated workbook.
Graphs and images are not supported in Excel headers and footers within XLSX compoundworkbooks.
Coordinated compound reports that generate individual instances of the overall report foreach unique primary key are not available in XLSX.
Note: Since multiple tables are generated, WebFOCUS will ensure that each tab name isunique.
Saving Report Output in Excel XLSX Format
722

Example: Compound Excel Report including Table of Contents (BYTOC)
SET PAGE-NUM=OFFCOMPOUND LAYOUT PCHOLD FORMAT XLSXSECTION=Example, LAYOUT=ON, MERGE=OFF,$ PAGELAYOUT=1,$ COMPONENT=R1, TYPE=REPORT,TEXT='report1', POSITION=(0.833 0.729), DIMENSION=(6.250 1.771),$COMPONENT=R2, TYPE=REPORT,TEXT='report2', POSITION=(0.833 2.917), DIMENSION=(6.250 1.875),$COMPONENT=R3, TYPE=REPORT,TEXT='report3', POSITION=(0.938 5.313), DIMENSION=(6.250 1.354),$COMPONENT=R4, TYPE=REPORT,TEXT='report4', POSITION=(0.938 7.083), DIMENSION=(6.042 1.146),$END SET COMPONENT=R1 TABLE FILE GGSALES HEADING CENTER "Gotham Grinds Sales to Information Builders" " ""Report 1""Sales Summary by Region"" "SUM UNITS/D12C BUDUNITS/D12C DOLLARS/D12CM BUDDOLLARS/D12CMBY REGIONON TABLE HOLD FORMAT XLSXON TABLE SET STYLE *TYPE=REPORT, TITLETEXT=Region Summary,$TYPE=REPORT, TOPMARGIN=1.5, BOTTOMMARGIN=1, PAGESIZE=LETTER,$TYPE=TITLE, COLOR=WHITE, BACKCOLOR=GREY,$TYPE=HEADING, LINE=1, OBJECT=TEXT, COLOR=PURPLE, JUSTIFY=CENTER, STYLE=BOLD,$TYPE=HEADING, LINE=3, OBJECT=TEXT, COLOR=BLUE, JUSTIFY=CENTER, STYLE=BOLD,$TYPE=HEADING, LINE=4, OBJECT=TEXT, COLOR=PURPLE, JUSTIFY=CENTER, STYLE=BOLD,$ENDSTYLEEND
9. Choosing a Display Format
Creating Reports With TIBCO® WebFOCUS Language 723
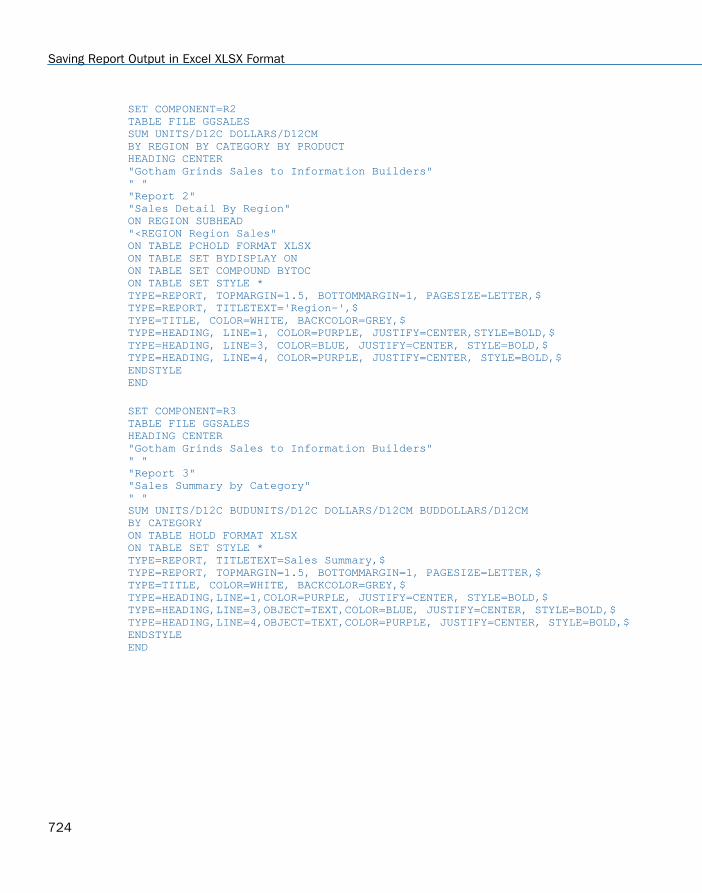
SET COMPONENT=R2TABLE FILE GGSALESSUM UNITS/D12C DOLLARS/D12CMBY REGION BY CATEGORY BY PRODUCTHEADING CENTER"Gotham Grinds Sales to Information Builders"" ""Report 2""Sales Detail By Region"ON REGION SUBHEAD"<REGION Region Sales"ON TABLE PCHOLD FORMAT XLSXON TABLE SET BYDISPLAY ONON TABLE SET COMPOUND BYTOCON TABLE SET STYLE *TYPE=REPORT, TOPMARGIN=1.5, BOTTOMMARGIN=1, PAGESIZE=LETTER,$TYPE=REPORT, TITLETEXT='Region-',$TYPE=TITLE, COLOR=WHITE, BACKCOLOR=GREY,$TYPE=HEADING, LINE=1, COLOR=PURPLE, JUSTIFY=CENTER,STYLE=BOLD,$TYPE=HEADING, LINE=3, COLOR=BLUE, JUSTIFY=CENTER, STYLE=BOLD,$TYPE=HEADING, LINE=4, COLOR=PURPLE, JUSTIFY=CENTER, STYLE=BOLD,$ENDSTYLEEND
SET COMPONENT=R3TABLE FILE GGSALESHEADING CENTER"Gotham Grinds Sales to Information Builders"" ""Report 3""Sales Summary by Category"" "SUM UNITS/D12C BUDUNITS/D12C DOLLARS/D12CM BUDDOLLARS/D12CMBY CATEGORYON TABLE HOLD FORMAT XLSXON TABLE SET STYLE *TYPE=REPORT, TITLETEXT=Sales Summary,$TYPE=REPORT, TOPMARGIN=1.5, BOTTOMMARGIN=1, PAGESIZE=LETTER,$TYPE=TITLE, COLOR=WHITE, BACKCOLOR=GREY,$TYPE=HEADING,LINE=1,COLOR=PURPLE, JUSTIFY=CENTER, STYLE=BOLD,$TYPE=HEADING,LINE=3,OBJECT=TEXT,COLOR=BLUE, JUSTIFY=CENTER, STYLE=BOLD,$TYPE=HEADING,LINE=4,OBJECT=TEXT,COLOR=PURPLE, JUSTIFY=CENTER, STYLE=BOLD,$ENDSTYLEEND
Saving Report Output in Excel XLSX Format
724

SET COMPONENT=R4TABLE FILE GGSALESHEADING CENTER"Gotham Grinds Sales to Information Builders"" ""Report 4""Sales Detail Report By Category"" "SUM UNITS/D12C BUDUNITS/D12C DOLLARS/D12CM BUDDOLLARS/D12CMBY CATEGORY BY PRODUCT BY REGIONON TABLE SET BYDISPLAY ONON TABLE HOLD FORMAT XLSXON TABLE SET STYLE *TYPE=REPORT, TITLETEXT=Sales Detail,$TYPE=REPORT, TOPMARGIN=1.5, BOTTOMMARGIN=1, PAGESIZE=LETTER,$TYPE=TITLE, COLOR=WHITE, BACKCOLOR=GREY,$TYPE=HEADING,LINE=1,OBJECT=TEXT,COLOR=PURPLE, JUSTIFY=CENTER, STYLE=BOLD,$TYPE=HEADING,LINE=3,OBJECT=TEXT,COLOR=BLUE, JUSTIFY=CENTER, STYLE=BOLD,$TYPE=HEADING,LINE=4,OBJECT=TEXT,COLOR=PURPLE, JUSTIFY=CENTER, STYLE=BOLD,$ENDSTYLEENDCOMPOUND END
The output is:
Report 1: Summary Report by Region
9. Choosing a Display Format
Creating Reports With TIBCO® WebFOCUS Language 725

Report 2: BYTOC Reports by Region
The following image shows the worksheet fot the first region.
Saving Report Output in Excel XLSX Format
726

Report 3: Sales Summary Report by Category
9. Choosing a Display Format
Creating Reports With TIBCO® WebFOCUS Language 727

Report 4: Sales Detail Report by Category
Reference: Guidelines for Using the Legacy OPEN, CLOSE, and NOBREAK Keywords and SETCOMPOUND
The keywords OPEN, CLOSE, and NOBREAK are used to control Excel compound reports. Theycan be specified with the HOLD or PCHOLD command or with a separate SET COMPOUNDcommand.
OPEN is used on the first report of a sequence of component reports to specify that acompound report should be started.
CLOSE is used to designate the last report in a compound report.
NOBREAK specifies that the next report be placed on the same worksheet as the currentreport. If it is not present, the default behavior is to place the next report on a separateworksheet.
Saving Report Output in Excel XLSX Format
728

When used with the HOLD or PCHOLD syntax, the compound report keywords OPEN,CLOSE, and NOBREAK must appear immediately after FORMAT XLSX. For example, you canspecify:
ON TABLE PCHOLD FORMAT XLSX OPEN
ON TABLE HOLD AS MYHOLD FORMAT XLSX OPEN NOBREAK
As with PDF compound reports, compound report keywords can be alternatively specifiedusing SET COMPOUND:
SET COMPOUND = OPEN
SET COMPOUND = 'OPEN NOBREAK'
SET COMPOUND = NOBREAK
SET COMPOUND = CLOSE
Reference: Guidelines for Producing Excel Compound Reports Using XLSX
Naming of Worksheets. The default worksheet tab names will be Sheet1, Sheet2, and soon. You have the option to specify a different worksheet tab name by using the TITLETEXTkeyword in the StyleSheet. For example:
TYPE=REPORT, TITLETEXT='Summary Report',$
Excel limits the length of worksheet titles to 31 characters. The following special characterscannot be used: ':', '?', '*', and '/'.
File Names and Formats. The output file name (AS name, or HOLD by default) is obtainedfrom the first report of the compound report (the report with the OPEN keyword). Output filenames on subsequent reports are ignored.
The HOLD FORMAT syntax used in the first component report in a compound report appliesto all subsequent reports in the compound report, regardless of their format.
NOBREAK Behavior. When NOBREAK is specified, the following report appears on the rowimmediately after the last row of the report with the NOBREAK. If additional spacing isrequired between the reports, a FOOTING or an ON TABLE SUBFOOT can be placed on thereport with the NOBREAK, or a HEADING or an ON TABLE SUBHEAD can be placed on thefollowing report. This allows the most flexibility, since if blank rows were added by default,there would be no way to remove them.
9. Choosing a Display Format
Creating Reports With TIBCO® WebFOCUS Language 729
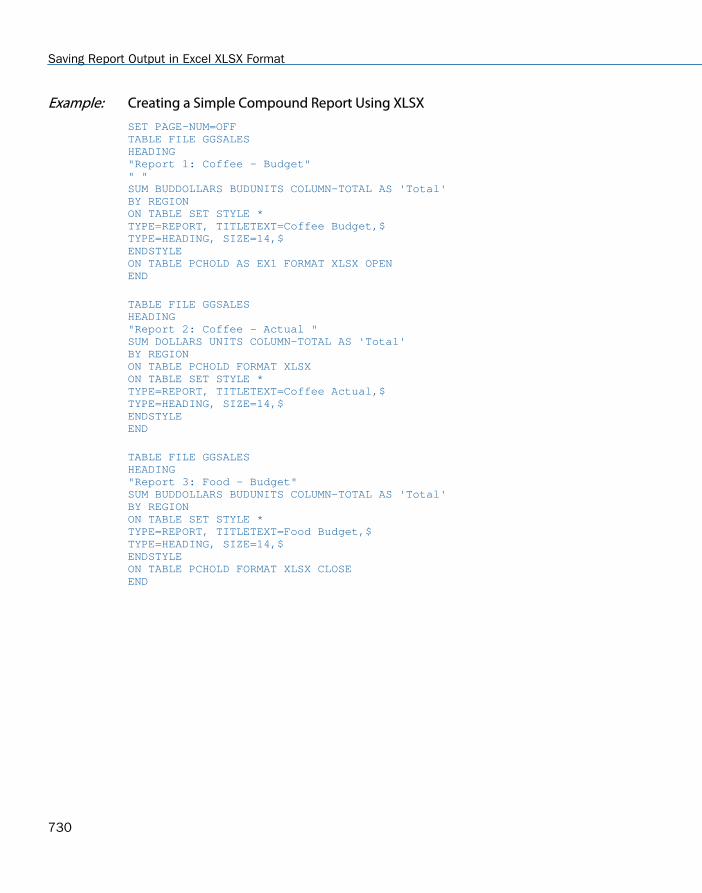
Example: Creating a Simple Compound Report Using XLSX
SET PAGE-NUM=OFFTABLE FILE GGSALESHEADING"Report 1: Coffee - Budget"" "SUM BUDDOLLARS BUDUNITS COLUMN-TOTAL AS 'Total'BY REGIONON TABLE SET STYLE *TYPE=REPORT, TITLETEXT=Coffee Budget,$TYPE=HEADING, SIZE=14,$ENDSTYLEON TABLE PCHOLD AS EX1 FORMAT XLSX OPENEND
TABLE FILE GGSALESHEADING"Report 2: Coffee - Actual "SUM DOLLARS UNITS COLUMN-TOTAL AS 'Total'BY REGIONON TABLE PCHOLD FORMAT XLSXON TABLE SET STYLE *TYPE=REPORT, TITLETEXT=Coffee Actual,$TYPE=HEADING, SIZE=14,$ENDSTYLEEND
TABLE FILE GGSALESHEADING"Report 3: Food - Budget"SUM BUDDOLLARS BUDUNITS COLUMN-TOTAL AS 'Total'BY REGIONON TABLE SET STYLE *TYPE=REPORT, TITLETEXT=Food Budget,$TYPE=HEADING, SIZE=14,$ENDSTYLEON TABLE PCHOLD FORMAT XLSX CLOSEEND
Saving Report Output in Excel XLSX Format
730

The output is:
Example: Creating a Compound Report Using NOBREAK
In this example, the first two reports are on the first worksheet, and the last two reports are onthe second worksheet, since NOBREAK appears on both the first and third reports.
TABLE FILE GGSALESHEADING"Report 1: Coffee - Budget"SUM BUDDOLLARS BUDUNITS COLUMN-TOTAL AS 'Total'BY REGION IF CATEGORY EQ CoffeeON TABLE PCHOLD FORMAT XLSX OPEN NOBREAKON TABLE SET STYLE *TYPE=REPORT, TITLETEXT=Coffee, FONT=ARIAL, SIZE=10, STYLE=NORMAL,$TYPE=TITLE, STYLE=BOLD,$TYPE=HEADING, SIZE=12, STYLE=BOLD, COLOR=BLUE,$TYPE=GRANDTOTAL, STYLE=BOLD,$END
TABLE FILE GGSALESHEADING" ""Report 2: Coffee - Actual "SUM DOLLARS UNITS COLUMN-TOTAL AS 'Total'BY REGION IF CATEGORY EQ CoffeeON TABLE PCHOLD FORMAT XLSXON TABLE SET STYLE *TYPE=REPORT, FONT=ARIAL, SIZE=10, STYLE=NORMAL,$TYPE=GRANDTOTAL, STYLE=BOLD,$TYPE=HEADING, SIZE=12, STYLE=BOLD, COLOR=BLUE,$END
9. Choosing a Display Format
Creating Reports With TIBCO® WebFOCUS Language 731

TABLE FILE GGSALESHEADING"Report 3: Food - Budget"SUM BUDDOLLARS BUDUNITS COLUMN-TOTAL AS 'Total'BY REGION IF CATEGORY EQ FoodON TABLE PCHOLD FORMAT XLSX NOBREAKON TABLE SET STYLE *TYPE=REPORT, TITLETEXT=Food, FONT=ARIAL, SIZE=10, STYLE=NORMAL,$TYPE=HEADING, STYLE=BOLD, SIZE=12, COLOR=BLUE,$TYPE=TITLE, STYLE=BOLD,$TYPE=GRANDTOTAL, STYLE=BOLD,$END
TABLE FILE GGSALESHEADING" ""Report 4: Food - Actual"SUM DOLLARS UNITS COLUMN-TOTAL AS 'Total'BY REGION IF CATEGORY EQ FoodON TABLE PCHOLD FORMAT XLSX CLOSEON TABLE SET STYLE *TYPE=REPORT, FONT=ARIAL, SIZE=10, $TYPE=TITLE, STYLE=BOLD,$TYPE=HEADING, SIZE=12, STYLE=BOLD, COLOR=BLUE,$TYPE=GRANDTOTAL, STYLE=BOLD,$END
Saving Report Output in Excel XLSX Format
732

Report output is displayed in two separate tabs.
Using XLSX FORMULA With Compound Reports
In new compound syntax, the implementation of compound workbooks with XLSX FORMULAcan be activated in either of the following ways. Each of these approaches will generate aworkbook with all of the component reports in FORMULA mode.
1. Add FORMAT XLSX FORMULA to the compound syntax header, as shown in the followingsyntax:
9. Choosing a Display Format
Creating Reports With TIBCO® WebFOCUS Language 733

COMPOUND LAYOUT PCHOLD FORMAT XLSX FORMULAUNITS=IN, $SECTION=section1, LAYOUT=ON, METADATA='prop_with_names, Margins_Left=0.5,Margins_Top=0.5, Margins_Right=0.5, Margins_Bottom=0.5, thumbnailscale=4,MERGE=OFF, ORIENTATION=PORTRAIT, PAGESIZE=Letter, SHOW_GLOBALFILTER=OFF, $PAGELAYOUT=1, NAME='Page layout 1', text='Page layout 1', TOC-LEVEL=1,BOTTOMMARGIN=0.5, TOPMARGIN=0.5, METADATA='BOTTOMMARGIN=0.5,TOPMARGIN=0.5,LEFTMARGIN=0,RIGHTMARGIN=0,', $COMPONENT='report1', TEXT='report1', TOC-LEVEL=2, POSITION=(0.567 0.667),DIMENSION=(6.883 2.314), BYTOC=0, ARREPORTSIZE=DIMENSION,METADATA='left: 0.567in; top: 0.667in; width: 6.883in; height: 2.314in;position: absolute; z-index: 1;', $COMPONENT='report2', TEXT='report2', TOC-LEVEL=2, POSITION=(0.567 3.250),DIMENSION=(7.000 2.833), BYTOC=0, ARREPORTSIZE=DIMENSION,METADATA='left: 0.567in; top: 3.25in; width: 7in; height: 2.833in;position: absolute; z-index: 2;', $END
2. Define XLSX FORMULA as the output setting for the first component, as shown in thefollowing syntax:
SET COMPONENT='report1'-*component_type report-*File: IBFS:/localhost/EDA/9999/APPPATH/xlsx2015/Report1.fex -*Created by WebFOCUS AppStudioDEFINE FILE GGSALESD_UOVERBUD/D12C=GGSALES.SALES01.UNITS - GGSALES.SALES01.BUDUNITS;ENDTABLE FILE GGSALESSUM GGSALES.SALES01.UNITS GGSALES.SALES01.BUDUNITS GGSALES.SALES01.DOLLARS GGSALES.SALES01.BUDDOLLARS GGSALES.SALES01.D_UOVERBUD COMPUTE C_DOVERBUD/D12.2CM = GGSALES.SALES01.DOLLARS - GGSALES.SALES01.BUDDOLLARS;BY GGSALES.SALES01.REGIONBY GGSALES.SALES01.CATEGORYHEADING"XLSX FORMULA - the difference betweem DEFINE & COMPUTES"ON TABLE SET PAGE-NUM NOLEADON TABLE SET ASNAMES ONON TABLE COLUMN-TOTAL AS 'TOTAL'ON TABLE PCHOLD FORMAT XLSX FORMULAON TABLE SET HTMLCSS ONON TABLE SET STYLE * INCLUDE = endeflt,$ENDSTYLE
Saving Report Output in Excel XLSX Format
734

Note:
Although both of these approaches will work, from a tool perspective, it is advantageous touse the first approach (add FORMAT XLSX FORMULA to the compound syntax header) sincethe user may not have control of the first table when system tables are generated withpage masters and in other page layout scenarios. This approach ensures that the XLSXFORMULA designation is always moved to the first table.
If you change the format for the compound workbook so that the compound headerrequests XLSX, not XLSX FORMULA, this will not automatically turn off FORMULA. WhenFORMULA is set in the first component, this will always override the compound headingsetting. This may cause confusion when you think you have turned FORMULA off at thedocument level, but it is actually retained at the first component level.
WebFOCUS Pivot Support for XLSX
The WebFOCUS XLSX format can generate a workbook based on a template that containspredefined pivot tables. These pivot tables can be built based on data fed from a report and/orexist independently of the WebFOCUS data on other worksheets.
Example: Feeding Data From a WebFOCUS Report Into a Pivot Table and Pivot Chart
The following sample procedure shows how to feed data from a WebFOCUS report into a pivottable and pivot chart within an existing Excel template called wf2pivot.xltx.
Note: Template names containing embedded blanks must be enclosed in single quotationmarks.
TABLE FILE GGSALESPRINTUNITS/D12C DOLLARS/D12CM BUDUNITS/D12C BUDDOLLARS/D12CMBY LOWEST REGIONBY LOWEST STBY HIGHEST CATEGORY BY LOWEST PRODUCTON TABLE SET BYDISPLAY ONON TABLE PCHOLD AS PIVOTWITHCHART FORMAT XLSX TEMPLATE wf2pivot.xltx SHEETNUMBER 2ON TABLE SET STYLE *TYPE=DATA,IN-RANGES='DATAwithHEADERS',$TYPE=TITLE,IN-RANGES='DATAwithHEADERS',$ENDSTYLEEND
The wf2pivot.xltx template file must be in the Reporting Server path. The following imagesshow the default of the first and second worksheets in the wf2pivot.xltx template, beforeexecuting the sample procedure.
9. Choosing a Display Format
Creating Reports With TIBCO® WebFOCUS Language 735

The first worksheet, PivotTablewithChart, contains an empty pivot table and pivot chart. It alsocontains an empty PivotTableFieldList. The first worksheet is shown in the following image.
Saving Report Output in Excel XLSX Format
736
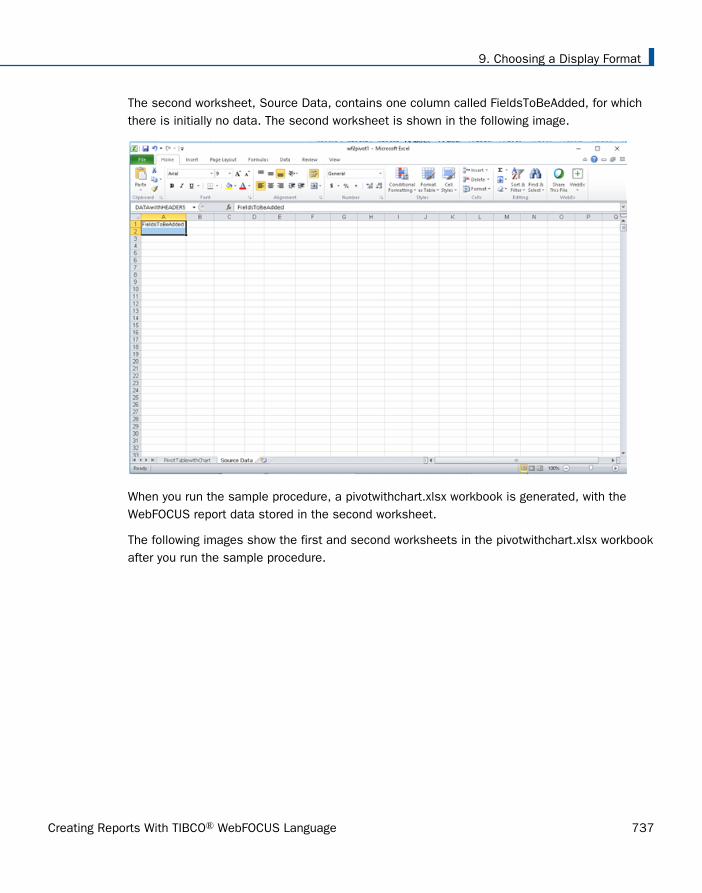
The second worksheet, Source Data, contains one column called FieldsToBeAdded, for whichthere is initially no data. The second worksheet is shown in the following image.
When you run the sample procedure, a pivotwithchart.xlsx workbook is generated, with theWebFOCUS report data stored in the second worksheet.
The following images show the first and second worksheets in the pivotwithchart.xlsx workbookafter you run the sample procedure.
9. Choosing a Display Format
Creating Reports With TIBCO® WebFOCUS Language 737

First Worksheet
Saving Report Output in Excel XLSX Format
738

Second Worksheet
In the PivotTablewithChart worksheet, note that the PivotTableFieldList is populated with thefields from the WebFOCUS report. There is one check box for each field in the reportprocedure. All the check boxes are not selected, by default.
The data used to populate the check boxes is obtained from the Source Data worksheet,where the data from the WebFOCUS report was saved upon executing the sample procedure.
9. Choosing a Display Format
Creating Reports With TIBCO® WebFOCUS Language 739

To start building a pivot report and pivot chart, you can select the check boxes for the desiredfields in the PivotTableFieldList. For example, selecting the check boxes for Product, UnitSales, and Budget Units will automatically feed the data from the Source Data worksheet intothe pivot table and pivot chart in the PivotTablewithChart worksheet. The resulting pivot tableand pivot chart are shown in the following image.
The wf2pivot.xltx template is provided, by default, with the WebFOCUS Reporting Serverinstallation as part of the Legacy Samples. For information on how to download the ReportingServer Legacy Samples, see the TIBCO WebFOCUS® Reporting Server Administration manual.
You can use the WebFOCUS XLSX template as is, or you can customize it to meet the yourbusiness requirements.
Note: The wf2pivot.xltx template includes a pivot table and pivot chart on the same worksheet,but you can use a macro-enabled template to generate a pivot table and a pivot chart onseparate worksheets, which are linked to a common data source.
FORMAT XLSX Limitations
Format XLSX does not support the following features, currently supported for EXL2K:
Cell locking
XLSX reports are available on a z/OS USS server but are not currently supported on a z/OSPDS server or on a z/OS USS server with the setting DYNAM TEMP ALLOC MVS.
For additional support on the implementation of features supported by the XLSX format, seeWebFOCUS XLSX Format Supported Features Roadmap, located at the following link:
Saving Report Output in Excel XLSX Format
740

https://techsupport.informationbuilders.com/tech/wbf/wbf_rln_formatXLSX_support.html
Using PowerPoint PPT Display Format
Specifying PowerPoint (PPT) as the output format creates a PowerPoint document with a singleslide that includes the report.
You can add multiple graphs and images to a PowerPoint presentation. The PowerPoint outputformat can contain a variety of graphs positioned anywhere on a slide to create a visual layout.
You can also place report output on a specific slide in a PowerPoint template.
Using PowerPoint PPT Templates
A WebFOCUS report can be placed inside of an existing PowerPoint presentation. This enablesyou to populate existing presentations with preset Slide Masters, styling, and other businesscontent. PowerPoint PPT templates are stored on the server with a .MHT extension and can bedistributed automatically with ReportCaster.
Syntax: How to Create PowerPoint PPT Report Output
ON TABLE {PCHOLD|HOLD|SAVE} [AS name] FORMAT PPT [TEMPLATE 'template' SLIDENUMBER n]
where:
name
Is the name of the PowerPoint output file.
template
Is the name of the PowerPoint template file. The template file must have at least oneblank slide and must be saved as a Web Archive (.MHT extension) on your WebFOCUSReporting Server application directory.
Tip: Since the Reporting Server cannot differentiate between Excel and PowerPointtemplate files (.MHT), it is important to apply a naming convention to your template files.This will help you organize and distinguish the different Excel and PowerPoint template fileswhen developing your reports. For example, Excel_template.MHT or PPT_template.MHT.
n
Is the number of the slide on which to place the report output. This number is optional ifthe template has only one slide.
9. Choosing a Display Format
Creating Reports With TIBCO® WebFOCUS Language 741
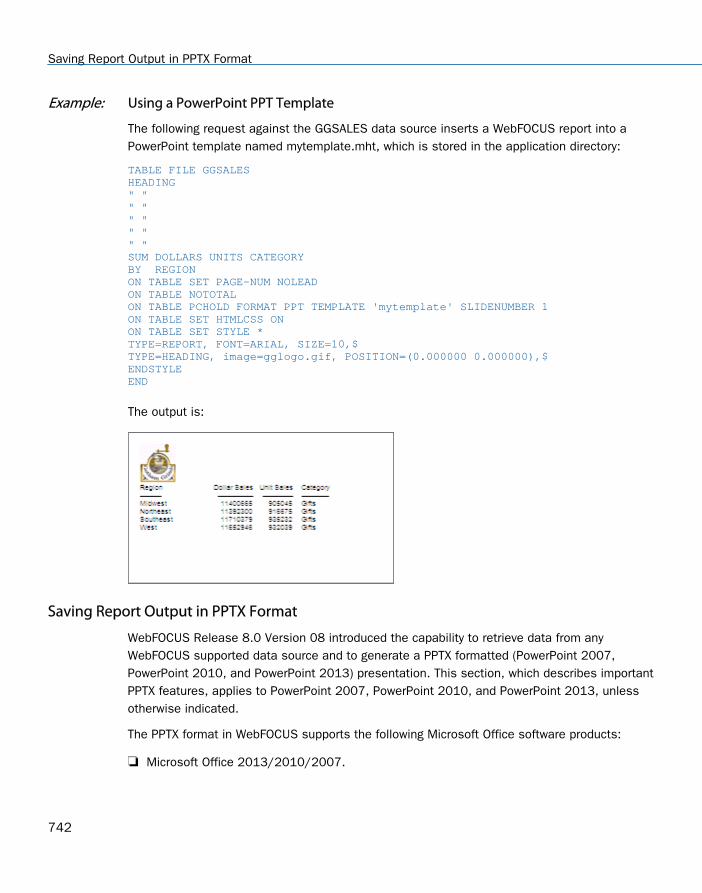
Example: Using a PowerPoint PPT Template
The following request against the GGSALES data source inserts a WebFOCUS report into aPowerPoint template named mytemplate.mht, which is stored in the application directory:
TABLE FILE GGSALESHEADING" "" "" "" "" "SUM DOLLARS UNITS CATEGORY BY REGIONON TABLE SET PAGE-NUM NOLEADON TABLE NOTOTALON TABLE PCHOLD FORMAT PPT TEMPLATE 'mytemplate' SLIDENUMBER 1ON TABLE SET HTMLCSS ONON TABLE SET STYLE *TYPE=REPORT, FONT=ARIAL, SIZE=10,$TYPE=HEADING, image=gglogo.gif, POSITION=(0.000000 0.000000),$ENDSTYLEEND
The output is:
Saving Report Output in PPTX Format
WebFOCUS Release 8.0 Version 08 introduced the capability to retrieve data from anyWebFOCUS supported data source and to generate a PPTX formatted (PowerPoint 2007,PowerPoint 2010, and PowerPoint 2013) presentation. This section, which describes importantPPTX features, applies to PowerPoint 2007, PowerPoint 2010, and PowerPoint 2013, unlessotherwise indicated.
The PPTX format in WebFOCUS supports the following Microsoft Office software products:
Microsoft Office 2013/2010/2007.
Saving Report Output in PPTX Format
742

Microsoft Office 2000/2003 with the Microsoft Office Compatibility Pack.
Note: As per the Microsoft Support has ended for Office 2003 statement, support andupdates for Office 2003 are no longer available. Although you will still be able to start andwork in the Microsoft Office 2003 application, Microsoft recommends that you upgrade to anewer version of Office to get continuing support and updates. If you are using Office 2003,see end of support page for Windows XP SP3 and Office 2003 for more information.
Open Office Support (FORMAT PPTX). Core PowerPoint functionality generated by the PPTXformat is supported for Open Office as of WebFOCUS Release 8.0 Version 08. For detailson Open Office, see http://www.openoffice.org/.
MAC Office 2008 and 2011. FORMAT PPTX is supported as of WebFOCUS Release 8.0.08.
WebFOCUS generates PPTX presentations based on the Microsoft PPTX standard. Thesepresentations are accessible through all browsers and the Microsoft PowerPoint mobileapplication.
Microsoft Office 365™. Microsoft Office 365 offers the local installation of PowerPoint2013. It works with the Office 2010 release and provides limited functionality with Office2007. Microsoft Office 365 also permits uploading Microsoft PowerPoint files to the cloud,where they can be accessed on most devices using Office Online. For information on theMicrosoft Office 365 plans and features, see Office 365 for business FAQ.
You can use Microsoft Office 365 to access a WebFOCUS PPTX report. First, display thePPTX report on the screen using the PCHOLD command, and then save the report toOneDrive® for Business. Once the file is in the cloud, you can access the file using OfficeOnline.
For information on the differences in features available in PowerPoint Online and inMicrosoft Office 2013, see Office Online Service Description.
For more information on working with Office Online and OneDrive for Business, see UsingOffice Online in OneDrive.
9. Choosing a Display Format
Creating Reports With TIBCO® WebFOCUS Language 743

Building the .pptx Presentation File
Microsoft changed the format and structure of the PowerPoint presentation file in PowerPoint2007. The new .pptx file is a binary compilation of a group of .xml files. Generating this newfile format using WebFOCUS is a two-step process that consists of generating the .xml filescontaining the report output and zipping the .xml documents into the binary .pptx format. TheReporting Server performs the xml generation process. The zipping process can be completedeither by the Client (WebFOCUS Servlet) or the Server (JSCOM3):
WebFOCUS Servlet. The WebFOCUS Client within the application server performs thezipping process. This can be done within the local client or through a remotely accessedclient. The servlet method is the default approach defined for each WebFOCUS Client, withthe client pointing to itself, by default.
JSCOM3. The Java layer of the Reporting Server performs the zipping operation. This optionshould be used when the WebFOCUS Servlet is configured on a secured web or applicationserver. This is because JSCOM3 does not require URL access to a remote WebFOCUSClient.
Syntax: How to Select the Method for Zipping the .pptx File
You designate the method and location where the zipping will occur by setting EXCELSERVURLto a URL (for the WebFOCUS Servlet) or to a blank (for JSCOM3). Even though this setting isprefaced with EXCEL, when applied, the same results are achieved for PowerPoint. You can setthis value for a specific procedure or for the entire environment:
For a procedure. Issue the SET EXCELSERVURL command within the procedure.
For the entire environment. Edit the IBIF_excelservurl variable in the WebFOCUSAdministration Console by selecting Configuration/Client Settings/General/IBIF_excelservurl.
For more information on accessing the WebFOCUS Administration Console and setting theIBIF_excelservurl variable, see the TIBCO WebFOCUS® Security and Administration manual.
The value you assign to EXCELSERVURL determines whether the WebFOCUS Servlet orJSCOM3 performs the zipping operation:
Specifying the Servlet. To specify that the WebFOCUS Servlet should be used, set theEXCELSERVURL parameter or the IBIF_excelservurl variable to the URL of a WebFOCUSRelease 8.0 Version 09 or higher client configuration.
In a procedure:
SET EXCELSERVURL = http://servername:8080/ibi_apps
In the WebFOCUS Administration Console:
Saving Report Output in PPTX Format
744

IBIF_excelservurl = http://servername:8080/ibi_apps
Specifying JSCOM3. To specify that JSCOM3 should be used within the current ReportingServer, set EXCELSERVURL to a blank or an empty string.
In a procedure:
SET EXCELSERVURL = ' '
In the WebFOCUS Administration Console:
IBIF_excelservurl = ' '
By default, each WebFOCUS Client contains the following URL definition that points toitself:
&URL_PROTOCOL://&servername:&server_port&IBIF_webapp
Syntax: How to Generate a PPTX Presentation
You can specify that a report should be saved to a PPTX presentation, displayed in thebrowser, or displayed in the PowerPoint application.
ON TABLE {PCHOLD|HOLD} AS name FORMAT PPTX
where:
PCHOLD
Displays the generated presentation in either the browser or the PowerPoint application,based on your desktop settings. For information, see Viewing PowerPoint Presentations inthe Browser vs. the PowerPoint Application on page 747.
HOLD
Saves a presentation with a .pptx extension to the designated location.
name
Specifies a file name for the generated presentation.
Note: To assign a file name to the generated presentation, set the Save Report option toYES for the .pptx file extension in the WebFOCUS Client Redirection Settings. When openedin the PowerPoint application, the generated presentation will retain the designated ASname. For more information on the Redirection Settings, see the TIBCO WebFOCUS®
Security and Administration manual.
9. Choosing a Display Format
Creating Reports With TIBCO® WebFOCUS Language 745

Opening PPTX Report Output
To open PPTX presentations, the user must have an account for Microsoft Office365 orMicrosoft PowerPoint 2013, 2010, or 2007 must be installed on the desktop.
Upon execution of a report with FORMAT PPTX, the user is prompted to Open or Save the PPTXfile. The file name displayed before the .pptx extension is an internally generated name.
The WebFOCUS procedure generates a presentation containing as many slides as required todisplay output. A report may contain defined elements, such as headings, subtotals, and titles,as well as StyleSheet syntax, such as conditional styling and drill downs.
Opening PPTX Report Output in Microsoft PowerPoint 2000/2003
PowerPoint 2000 and PowerPoint 2003 can be updated to read PowerPoint PPTX presentationsusing the Microsoft Office Compatibility Pack available from the Microsoft download site(http://www.microsoft.com/downloads/en/default.aspx). When the file extension of the filebeing opened is .pptx (PPTX presentation), the Microsoft Office Compatibility Pack performs thenecessary conversion to allow PowerPoint 2000/2003 to read and open it.
In addition to the Microsoft Office Compatibility Pack, it is important to enable the WebFOCUSClient Redirection Settings Save As option so that PowerPoint 2000/2003 will be able to openthe PPTX report output without users first having to save it to their machine with the .pptx fileextension. The WebFOCUS Client processing Redirection Settings Save As option configureshow the WebFOCUS Client sends each report output file type to the user machine.
This option can be set as follows:
Save As Option disabled (NO). The WebFOCUS Client Redirection Setting Save As isdisabled, by default. When the Save As option is disabled, the WebFOCUS Client sendsreport output to the user machine in memory with the application association specified forthe report format in the WebFOCUS Client Redirection Settings configuration file(mime.wfs).
A user machine that does not have PowerPoint 2007 or higher installed will not recognizethe application association for PowerPoint and PowerPoint will display a message. ThePowerPoint 2000/2003 user can select Save and provide a file name with the .pptxextension to save the report output to their machine. The user can then open the .pptx filedirectly from PowerPoint 2000/2003.
Saving Report Output in PPTX Format
746
Save As Option enabled (YES). When the WebFOCUS Redirection Save As option isenabled, the WebFOCUS Client sends the report output to the user as a file with theextension specified in the WebFOCUS Client Redirection Settings configuration file(mime.wfs). Upon receiving the file, Windows will display the File Download prompt askingthe user to Open or Save the file with the identified application type. The File Downloadprompt displays the Name with the .pptx file extension for the report output that isrecognized as a PowerPoint PPTX file type.
Note: The download prompt will display for all users, including users who have PowerPoint2007 or higher installed on their machines.
If a PowerPoint 2000/2003 user chooses to open the file, the Microsoft OfficeCompatibility Pack will recognize the .pptx file extension and perform the necessaryconversion to allow PowerPoint 2000/2003 to read the PowerPoint PPTX presentation.
If a PowerPoint 2007 or higher user chooses to open the file, PowerPoint will recognizethe .pptx file extension and read the PowerPoint PPTX presentation.
For additional information on WebFOCUS Client Redirection Settings, see the TIBCOWebFOCUS® Security and Administration manual.
Viewing PowerPoint Presentations in the Browser vs. the PowerPoint Application
Your Operating System and desktop settings determine whether PowerPoint output sent to theclient is displayed in an Internet Browser window or within the PowerPoint application. WhenPowerPoint output has been defined within the Windows environment to Browse in samewindow, the workbook generated by a WebFOCUS request is opened within an InternetExplorer® browser window. When the Browse in same window option is unchecked for the .pptfile type, the browser window created by WebFOCUS is blank because the report output isdisplayed in the stand-alone PowerPoint application window.
In Windows XP and earlier, file type specific settings are managed on the desktop withinWindows Explorer by selecting Tools/Folder Options, clicking the File Types tab, selectingthe extension (.ppt or .pptx), clicking the Advanced button, and checking the Browse insame window check box.
As per the Microsoft Support has ended for Office 2003 statement, support and updates forOffice 2003 are no longer available. Although you will still be able to start and work in theMicrosoft Office 2003 application, Microsoft recommends that you upgrade to a newerversion of Office to get continuing support and updates. If your organization uses Office2003, go to the end of support page for Windows XP SP3 and Office 2003 for moreinformation.
9. Choosing a Display Format
Creating Reports With TIBCO® WebFOCUS Language 747

In Windows 7, Microsoft removed the desktop settings that support opening worksheets inthe browser. This means that to change this behavior, you can no longer simply navigate tothe Folder Options dialog box, but you must change a registry setting.
Note: This works the same for both PPT and PPTX formats. The only difference is theselection of file type based on the version of PowerPoint output you will be generating.
Grouping Tables and Components in a PowerPoint Slide
When table elements are placed on a PowerPoint slide, the elements are placed in individualtext boxes to allow for explicit positioning to match the other positioned drivers, such as PDFand DHTML.
The PPTXGROUP parameter enables you to group elements together in a PPTX report. You canrotate, flip, move, or resize objects within a group at the same time as though they were asingle object. You can also change the attributes of all of the objects in a group at one time,including font, color, or size, and you can ungroup a group of objects at any time, and thenregroup them later.
In WebFOCUS, grouping is done within each report component. Objects within the reportcomponent (or stand-alone report), including data, all headings and footings, and images, aregrouped together. In compound reports, each component report is grouped individually andnon-component elements, such as drawing objects, lines, and images, are not included in anygroup.
Syntax: How to Group Tables and Components in a PowerPoint Slide
SET PPTXGROUP = {ON|OFF}
The command can also be issued from within a report using:
ON TABLE SET PPTXGROUP = {ON|OFF}
In a StyleSheet:
TYPE=REPORT, PPTXGROUP = {ON|OFF}
where:
ON
Enables you to group elements together in a PPTX report.
OFF
Indicates no grouping of elements, which is the legacy behavior. OFF is the default value.
Saving Report Output in PPTX Format
748

Example: Displaying Group Tables and Components in a Standard Report
In the following standard report, the grouping is defined for the core report elements, excludingimages and drawing objects, defined at the TYPE=REPORT level.
TABLE FILE GGSALESSUM DOLLARS/D12CM UNITS/D12C BUDDOLLARS/D12CM BUDUNITS/D12CCOMPUTE SHOWCAT/A100=CATEGORY||'.GIF';BY REGIONBY CATEGORYON TABLE SUBHEAD"Report Heading Here"" "" "" "HEADING"Page Heading here"FOOTING"Page Footing here"ON TABLE SUBFOOT"Report Footing Here"ON TABLE PCHOLD AS GROUPTEST FORMAT PPTXON TABLE SET STYLE *TYPE=REPORT, PPTXGROUP = ON, SQUEEZE=ON, FONT=TAHOMA,SIZE=12, ORIENTATION=LANDSCAPE, $TYPE=REPORT, OBJECT=LINE, POSITION=(9 1), DIMENSION=(1 5), COLOR=BLUE, $TYPE=REPORT, IMAGE=TIBCO, POSITION=(0 0),SIZE=(1 .6), $TYPE=TABHEADING, IMAGE=GGLOGO.GIF, POSITION=(6.5 .10), $TYPE=DATA,COLUMN=SHOWCAT, IMAGE=(SHOWCAT), PRESERVERATIO=ON,SIZE=(.5 .5), $END
9. Choosing a Display Format
Creating Reports With TIBCO® WebFOCUS Language 749

The output is:
Example: Displaying Group Tables and Components in a Compound Report
In the following compound report, the grouping is defined for the component report. Additionalobjects on the page, including the chart image, logo image, lines, and text box are not includedin the grouping.
Saving Report Output in PPTX Format
750

SET HTMLARCHIVE=ONSET PPTXGRAPHTYPE=PNGSET PPTXGROUP=ON COMPOUND LAYOUT PCHOLD FORMAT PPTXUNITS=IN, $SECTION=section1, LAYOUT=ON, MERGE=OFF, ORIENTATION=LANDSCAPE, PAGESIZE=PPT Slide, $PAGELAYOUT=1, NAME='Page layout 1', TEXT='Page layout 1', BOTTOMMARGIN=0.5, TOPMARGIN=0.5, $OBJECT=STRING, NAME='text1', TEXT='<left>Grouping is supported within the component reports of a compound report:<ul type=disc><LI>Each table / report is grouped together. </LI><LI>Drawing objects such as images and lines are not included in any group. </LI><LI>Charts are inserted as images.</LI></ul><div><br></div><br></left>',POSITION=(2.764 4.958), MARKUP=ON, WRAP=ON, DIMENSION=(4.000 1.992), FONT='TREBUCHET MS', COLOR=RGB(0 0 0), SIZE=10, $COMPONENT='report1', TEXT='report1', POSITION=(1.028 2.083), DIMENSION=(4.431 1.667), $COMPONENT='chart2', TEXT='chart2', POSITION=(4.972 1.319), DIMENSION=(4.456 3.085), COMPONENT-TYPE=GRAPH, $OBJECT=BOX, NAME='line1', POSITION=(0.498 6.500),DIMENSION=(9.167 0.022), BACKCOLOR=BLACK, BORDER-COLOR=BLACK, $OBJECT=BOX, NAME='line2', POSITION=(0.502 1.097),DIMENSION=(9.167 0.022), BACKCOLOR=BLACK, BORDER-COLOR=BLACK, $OBJECT=IMAGE, NAME='image4', IMAGE=tibco.gif, ALT='',POSITION=(0.502 0.499), DIMENSION=(1.861 0.7), $END
SET COMPONENT='report1'TABLE FILE GGSALESSUM GGSALES.SALES01.DOLLARSBY GGSALES.SALES01.REGIONACROSS LOWEST GGSALES.SALES01.CATEGORYON TABLE SET PAGE-NUM NOLEADON TABLE NOTOTALON TABLE PCHOLD FORMAT PPTXON TABLE SET STYLE * INCLUDE=IBFS:/FILE/IBI_HTML_DIR/ibi_themes/Warm.sty,$$ENDSTYLEEND
9. Choosing a Display Format
Creating Reports With TIBCO® WebFOCUS Language 751

SET COMPONENT='chart2'SET PAGE-NUM=NOLEADSET ARGRAPHENGINE=JSCHARTSET EMBEDHEADING=ONSET GRAPHDEFAULT=OFFGRAPH FILE GGSALESSUM GGSALES.SALES01.DOLLARSBY GGSALES.SALES01.CATEGORYACROSS GGSALES.SALES01.REGIONON GRAPH PCHOLD FORMAT HTMLON GRAPH SET VZERO OFFON GRAPH SET GRWIDTH 1ON GRAPH SET UNITS 'PIXELS'ON GRAPH SET HAXIS 770.0ON GRAPH SET VAXIS 405.0ON GRAPH SET GRMERGE ADVANCEDON GRAPH SET GRMULTIGRAPH 0ON GRAPH SET GRLEGEND 1ON GRAPH SET GRXAXIS 1ON GRAPH SET LOOKGRAPH HBARON GRAPH SET STYLE *
*GRAPH_SCRIPTsetPieDepth(0);setPieTilt(0);setDepthRadius(0);setCurveFitEquationDisplay(false);setPlace(true);*ENDINCLUDE=IBFS:/FILE/IBI_HTML_DIR/ibi_themes/Warm.sty,$TYPE=REPORT, TITLETEXT='WebFOCUS Report', $*GRAPH_SCRIPTsetLegendPosition(4);*GRAPH_JS_FINAL"blaProperties": { "orientation": "horizontal"},"agnosticSettings": { "chartTypeFullName": "Bar_Clustered_Horizontal"}*ENDENDSTYLEEND-RUN
COMPOUND END
Saving Report Output in PPTX Format
752
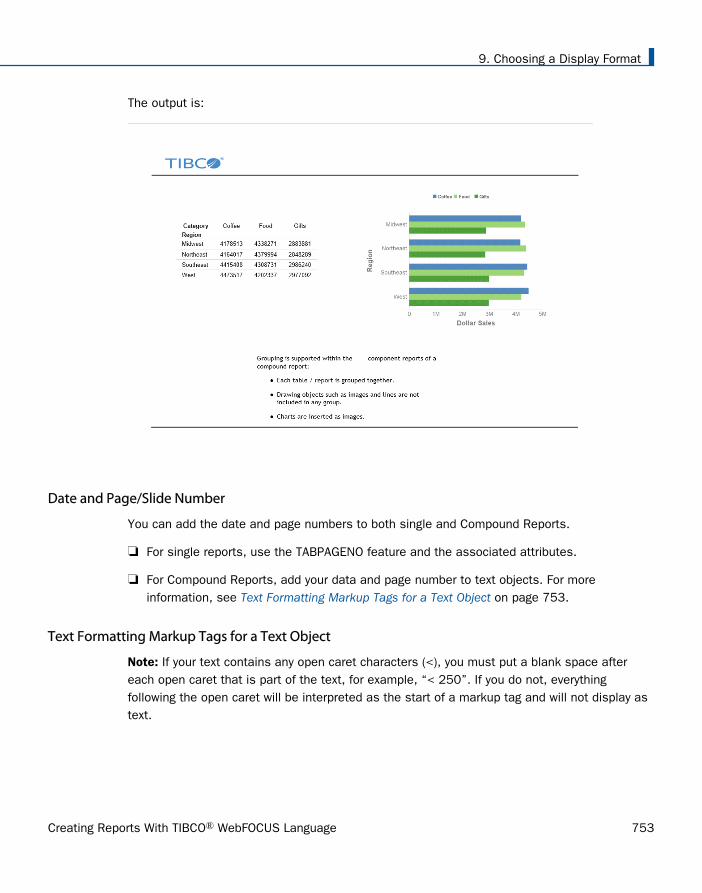
The output is:
Date and Page/Slide Number
You can add the date and page numbers to both single and Compound Reports.
For single reports, use the TABPAGENO feature and the associated attributes.
For Compound Reports, add your data and page number to text objects. For moreinformation, see Text Formatting Markup Tags for a Text Object on page 753.
Text Formatting Markup Tags for a Text Object
Note: If your text contains any open caret characters (<), you must put a blank space aftereach open caret that is part of the text, for example, “< 250”. If you do not, everythingfollowing the open caret will be interpreted as the start of a markup tag and will not display astext.
9. Choosing a Display Format
Creating Reports With TIBCO® WebFOCUS Language 753

Font Properties
The font tag supports three attributes: face, size, and color (where the color must be specifiedas the hexadecimal number code for the color):
<font face="font" size=[+|-]n color=color_code>text</font>
For example:
<font face="New Century Schoolbook">Test1</font><font face="Times" size=12>test2</font><font face="Times New Roman" color=#0000FF size=+4>Test3</font> <font size=-2 face="Times New Roman" color=#0000FF >Test4</font>
Text Styles
The supported text styles are bold, italic, underline, and superscript:
Bold: <b>text</b>
Italic: <i>text</i>
Underline: <u>text</u>
Superscript: <sup>text</sup>
Line Breaks
The line break tag after a portion of text begins the next portion of text on a new line. Note thatthere is no closing tag for a line break:
<br>
Text Alignment
The alignment options pertain to wrapped text, as well as specified line breaks. Both horizontaljustification and vertical alignment are supported.
Horizontal Justification
Left Justification:
<left>text</left>
Right Justification:
<right>text</right>
Center Justification:
<center>text</center>
Saving Report Output in PPTX Format
754

Full Justification:
<full>text</full>
Vertical Alignment
Top Alignment:
<top>text</top>
Middle Alignment:
<mid>text</mid>
Bottom Alignment:
<bottom>text</bottom>
Unordered (Bullet) List
The unordered (ul) list tag encloses a bullet list. Each item is enclosed in a list item tag (li).The start tag and end tag for the list must each be on its own line. Each list item must start ona new line:
<ul><li>list item1</li><li>list item2</li> . . .</ul>
By default, the bullet type is disc. You can also specify circle or square:
<ul type=disc>
<ul type=circle>
<ul type=square>
9. Choosing a Display Format
Creating Reports With TIBCO® WebFOCUS Language 755

Ordered (Number or Letter) List
The ordered (ol) list tag encloses a list in which each item has a consecutive number or letter.Each item is enclosed in a list item tag (li). The start tag and end tag for the list must each beon its own line. Each list item must start on a new line:
<ol><li>list item1</li><li>list item2</li> . . .</ol>
By default, Arabic numerals (type=1) are used for the ordering of the list. You can specify thefollowing types of order:
Arabic numerals (the default): <ol type=1>
Lowercase letters: <ol type=a>
Uppercase letters: <ol type=A>
Lowercase Roman numerals: <ol type=I>
Uppercase Roman numerals: <ol type=I>
Hyperlinks
Hyperlinks can be included within text markup in a PPTX output file.
The syntax for the anchor markup tag is a subset of the HTML anchor syntax:
<a href="hyperlink">Text to display</a>
where:
hyperlink
Is the hyperlink to jump to when the text is clicked.
Text to display
Is the text to display for the hyperlink.
For example:
<a href="http://www.example.com/help.htm">Click here for help</a>
No other attributes are supported in the anchor markup tag.
Saving Report Output in PPTX Format
756

Page Numbering
There are two pseudo-HTML tags for embedding page numbers in text on a Page Master for aCoordinated Compound Layout report:
Current page number: <ibi-page-number/>
Total number of pages: <ibi-total-pages/>
Note that when MARKUP=ON, space is allocated for the largest number of pages, so there maybe a wide gap between the page number and the text that follows. To remove the extra spacein the text object that has the page numbering tags:
If specific styling of the text object is not required, do not insert markup tags, and turnMARKUP=OFF.
MARKUP=OFF, TEXT='Page <ibi-page-number/> of <ibi-total-pages/> of Sales Report', $
This displays the following output:
Page 1 of 100 of Sales Report
If specific styling of the text object is required, you must set MARKUP=ON. WithMARKUP=ON, set WRAP=OFF and do not place any styling tags between the page numbervariables within the string. Tags can be used around the complete Page n of m string. Thefollowing code produces a page number string without the extra spaces:
MARKUP=ON, WRAP=OFF, TEXT='<font face="ARIAL" size=10><i>Page <ibi-page-number/> of <ibi-total-pages/> of Sales Report </i>', $
This displays the following output:
Dates
To display a date in the report output, insert a WebFOCUS date variable in a text object on aPage Master (such as &DATEtrMDYY) in the text object.
9. Choosing a Display Format
Creating Reports With TIBCO® WebFOCUS Language 757

Example: Formatting a Compound Layout Text Object With Markup Tags
The following request displays a text object with markup tags in a PPTX output file.
Important: Text markup syntax cannot contain hidden carriage return or line feed characters.For purposes of presenting the example in this documentation, line feed characters have beenadded so that the sample code wraps to fit within the printed page. To run this example in yourenvironment, copy the code into a text editor and delete any line feed characters within thetext markup object by going to the end of each line and pressing the Delete key. In someinstances, you may need to add a space to maintain the structure of the string. For additionalinformation on displaying carriage returns within the text object see Text Formatting MarkupTags for a Text Object on page 753.
SET PAGE-NUM=OFFSET LAYOUTGRID=ONTABLE FILE GGSALESBY REGION NOPRINTON TABLE PCHOLD AS LINESP1 FORMAT PPTXON TABLE SET STYLE *type=report, size=8, $object=string, position=(1 1), dimension=(7 3), wrap=on, markup=on, linespacing=multiple(3), text='<b><font face="Arial" size=12>This paragraph is triple-spaced (LINESPACING=MULTIPLE(3)):</font></b> <full>Our <i>primary</I> goal for fiscal 2006 was to accelerate our transformation to customer centricity. In this letter, I’d like to give you an update on this work, which contributed to the 22-percent increase in earnings from continuing operations we garnered for fiscal 2006. Since the past is often prologue to the future, I’d like to describe how customer centricity is influencing not only our goals for fiscal 2007, but also our long-term plans. At Gotham Grinds, customer centricity means treating each customer as a unique individual, meeting their needs with end-to-end solutions, and engaging and energizing our employees to serve them.</full>', $ENDSTYLEEND
In this request:
No fields from the data source are displayed. Only the text object displays on the output.
The SET LAYOUTGRID command displays a grid to indicate the coordinates and dimensionsof the text object.
The OBJECT=STRING declaration specifies triple spacing: LINESPACING=MULTIPLE(3).
The following text is displayed in boldface, in the Arial font face, and with a font size of 12(the default is 8 from the TYPE=REPORT declaration):
‘This paragraph is triple-spaced (LINESPACING=MULTIPLE(3)):’
The markup for this formatting is:
Saving Report Output in PPTX Format
758
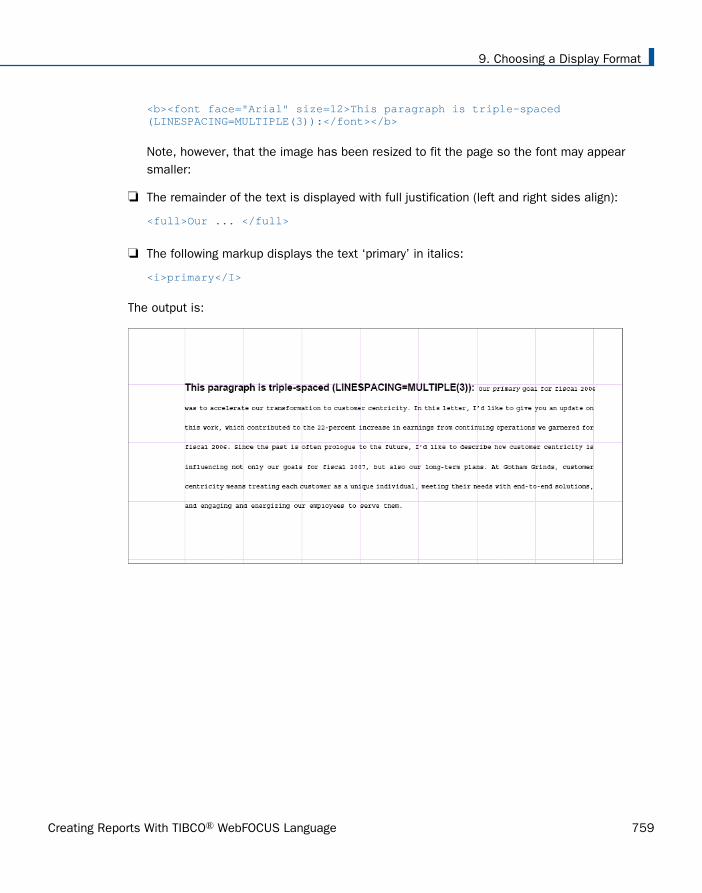
<b><font face="Arial" size=12>This paragraph is triple-spaced (LINESPACING=MULTIPLE(3)):</font></b>
Note, however, that the image has been resized to fit the page so the font may appearsmaller:
The remainder of the text is displayed with full justification (left and right sides align):
<full>Our ... </full>
The following markup displays the text ‘primary’ in italics:
<i>primary</I>
The output is:
9. Choosing a Display Format
Creating Reports With TIBCO® WebFOCUS Language 759

Example: Drawing Text and Line objects on a Page Master
The following request places a line on the Page Master between the header report and thecomponent reports and places a line and a text string on the bottom of each page:
SET PAGE-NUM=OFFSET SQUEEZE=ONCOMPOUND LAYOUT PCHOLD FORMAT PPTXSECTION=S1, LAYOUT=ON, MERGE=ON, ORIENTATION=LANDSCAPE, $PAGELAYOUT=ALL, $COMPONENT=HEADER, TYPE=REPORT, POSITION=(1 1), DIMENSION=(4 4), $OBJECT=STRING, POSITION=(1 6.6), MARKUP=ON,TEXT='<font face="Arial" color=#0000FF size=12> Slide <ibi-page-number/> </font> ', WRAP=ON, DIMENSION=(4 4),$OBJECT=LINE, POSITION=(1 2.5), ENDPOINT=(9.5 2.5), BORDER-COLOR=BLUE,$OBJECT=LINE, POSITION=(1 6.5), ENDPOINT=(9.5 6.5), BORDER-COLOR=BLUE,$PAGELAYOUT=1, $COMPONENT=R1, TYPE=REPORT, POSITION=(1 3), DIMENSION=(4 4), $COMPONENT=R2, TYPE=REPORT, POSITION=(6 3), DIMENSION=(4 4), $PAGELAYOUT=2, $COMPONENT=R3, TYPE=REPORT, POSITION=(4 3), DIMENSION=(4 4), $END
Saving Report Output in PPTX Format
760

SET COMPONENT=HEADERTABLE FILE GGSALES" ""Report package for <REGION"BY REGION NOPRINTON TABLE HOLD FORMAT PDFON TABLE SET STYLE *TYPE=REPORT, FONT=HELVETICA, SIZE=20, $TYPE=REPORT, IMAGE=gglogo.gif, POSITION=(+.25 +.25), $TYPE=HEADING, LINE=2, ITEM=1, POSITION=1.5, $ENDSET COMPONENT=R1TABLE FILE GGSALES"Sales report for <REGION"" "SUM DOLLARS/F8MBY REGION NOPRINTBY STBY CITYON TABLE SET STYLE *TYPE=REPORT, FONT=HELVETICA, COLOR=RED, SQUEEZE=ON, $ENDSET COMPONENT=R2TABLE FILE GGSALES"Number of unit sales per product for <REGION"" "SUM CNT.UNITS AS 'Number of units sold'BY REGION NOPRINTBY PRODUCTON TABLE SET STYLE *TYPE=REPORT, FONT=HELVETICA, COLOR=BLUE, SQUEEZE=ON, $ENDSET COMPONENT=R3TABLE FILE GGSALES"Report R3 for <REGION"BY REGION NOPRINTSUM DOLLARS BY STON TABLE SET STYLE *TYPE=REPORT, FONT=HELVETICA, COLOR=GREEN, $ENDCOMPOUND END
9. Choosing a Display Format
Creating Reports With TIBCO® WebFOCUS Language 761

The first page of output is:
The second page of output has the same drawing objects:
Saving Report Output in PPTX Format
762

Example: Vertically Aligning Text Markup in PPTX Report Output
The following request creates three boxes and places a text string object within each of them:
In the left box, the text is aligned vertically at the top.
In the middle box, the text is aligned vertically at the middle.
In the right box, the text is aligned vertically at the bottom.
Important: Text markup syntax cannot contain hidden carriage return or line feed characters.For purposes of presenting the example in this documentation, line feed characters have beenadded so that the sample code wraps to fit within the printed page. To run this example in yourenvironment, copy the code into a text editor and delete any line feed characters within thetext markup object by going to the end of each line and pressing the Delete key. In someinstances, you may need to add a space to maintain the structure of the string. For additionalinformation on displaying carriage returns within the text object see Text Formatting MarkupTags for a Text Object on page 753.
SET PAGE-NUM=OFFTABLE FILE GGSALESBY REGION NOPRINTON TABLE PCHOLD FORMAT PPTXON TABLE SET STYLE *type=report, font=arial, size=10, $object=box, position=(1 1), dimension=(6 1), $object=line, position=(3 1), endpoint=(3 2), $object=line, position=(5 1), endpoint=(5 2), $object=string, text='<top>Vertically aligned text within a text object using top alignment.</top>', position=(1.05 1), dimension=(2 1), linespacing=exact(.15), markup=on, wrap=on, $object=string, text='<mid>Vertically aligned text within a text object using middle alignment.</mid>', position=(3.05 1), dimension=(2 1), linespacing=exact(.15), markup=on, wrap=on, $object=string, text='<bottom>Vertically aligned text within a text object using bottom alignment.</bottom>', position=(5.05 .9), dimension=(2 1),linespacing=exact(.15), markup=on, wrap=on, $END
The output is:
9. Choosing a Display Format
Creating Reports With TIBCO® WebFOCUS Language 763

Display Unordered Lists With Bullets, Discs, Squares, and Circles
The unordered (ul) list tag encloses a bulleted list in which each item is marked by a bullet of aparticular shape or design. Each item or point is enclosed in a list item tag (li). The start andend tags for each point may occupy one continuous line or be placed on different lines. Wheneach list is placed on a new line, insert a backslash (\) after each closing tag.
Example: Displaying Unordered Lists With Bullets, Squares, and Circles
The following request displays a bulleted list with bullets of particular shapes and designs.
<ul><li>list item1</li>\<li>list item2</li>\</ul>
SET HTMLARCHIVE=ONCOMPOUND LAYOUT PCHOLD FORMAT PPTXUNITS=IN, $SECTION=section1, LAYOUT=ON, MERGE=OFF, ORIENTATION=PORTRAIT, PAGESIZE=Letter, SHOW_GLOBALFILTER=OFF, $PAGELAYOUT=1, NAME='Page layout 1', text='Page layout 1', BOTTOMMARGIN=0.5, TOPMARGIN=0.5, $OBJECT=STRING, NAME='text1', TEXT='<font face="TREBUCHET MS" size=10>\<UL><LI>The first level of a bulleted line </LI>\<UL><LI><b>Second level:</b> Indented or nested line one</LI>\<LI><b>Second level:</b> Indented or nested line two</LI>\<LI><b>Second level:</b> Indented or nested line three</LI>\<UL>\<LI>Third level: Indented or nested line one</LI>\<LI>Third level: Indented or nested line two</LI>\</UL>\
<BR><BR><BR><U><DIV><BR></DIV></U></font>', POSITION=(0.938 0.938),MARKUP=ON, WRAP=ON, DIMENSION=(6.563 4.167), $COMPONENT='DfltCmpt1', POSITION=(0 0), DIMENSION=(0 0), $ENDSET COMPONENT='DfltCmpt1'TABLE FILE SYSCOLUM" "SUM TBNAME NOPRINTIF READLIMIT EQ 1ON TABLE SET PREVIEW ONON TABLE PCHOLD FORMAT PPTXON TABLE SET STYLE *ENDCOMPOUND END
Saving Report Output in PPTX Format
764

The output is:
The default bullet type is disc. You may also specify circle or square, as shown in the followingrequest.
SET HTMLARCHIVE=ONCOMPOUND LAYOUT PCHOLD FORMAT PPTXUNITS=IN, $SECTION=section1, LAYOUT=ON, MERGE=OFF, ORIENTATION=PORTRAIT, PAGESIZE=Letter, SHOW_GLOBALFILTER=OFF, $PAGELAYOUT=1, NAME='Page layout 1', text='Page layout 1', BOTTOMMARGIN=0.5, TOPMARGIN=0.5, $OBJECT=STRING, NAME='text1', TEXT='<font face="TREBUCHET MS" size=10>\<UL type=square>\<LI> line 1, showing a square </LI>\<UL type=circle>\<LI> line 2, showing a circle </LI>\<UL type=disc>\<LI> line 3, showing a disc </LI>\</UL>\<BR><BR><BR><U><DIV><BR></DIV></U></font>', POSITION=(0.938 0.938),MARKUP=ON, WRAP=ON, DIMENSION=(6.563 4.167), $COMPONENT='DfltCmpt1', POSITION=(0 0), DIMENSION=(0 0), $ENDSET COMPONENT='DfltCmpt1'TABLE FILE SYSCOLUM" "SUM TBNAME NOPRINTIF READLIMIT EQ 1ON TABLE SET PREVIEW ONON TABLE PCHOLD FORMAT PPTXON TABLE SET STYLE *ENDCOMPOUND END
9. Choosing a Display Format
Creating Reports With TIBCO® WebFOCUS Language 765

The output is:
Inserting Images In Various Elements of PowerPoint PPTX Reports
WebFOCUS supports the placement of images within each element or node of the report. Animage, such as a logo, gives corporate identity to a report, or provides visual appeal. Dataspecific images can be placed in headers and footers to provide additional clarity and style.The image must reside on the WebFOCUS Reporting Server in a directory named on EDAPATHor APPPATH. If the file is not on the search path, supply the full path name.
All images will be placed in the defined area, based on the explicit positioning defined by thePOSITION attribute within the style sheet.
Images can be placed in any available WebFOCUS reporting node or element. Supported imageformats include .gif, .jpg, and .png. Images may be positioned and resized by using thePOSITION and SIZE attributes to set the x, y coordinates and height, width settings,respectively. Justification of images is not supported.
Note: The highest quality image format for charts is PNG, which allows for transparency, aswell as better integration with the styling within slide backgrounds.
Saving Report Output in PPTX Format
766

Syntax: How to Insert Images Into WebFOCUS PPTX Reports
TYPE={REPORT|HEADING|data}, IMAGE={file|(column)}[,BY=byfield] [,SIZE=(w h)] ,$
where:
REPORT
Embeds an image in the body of a report. The image appears in the background of thereport. REPORT is the default value.
HEADING
Embeds an image in a heading or footing. Valid values are TABHEADING, TABFOOTING,FOOTING, HEADING, SUBHEAD, and SUBFOOT. Provide sufficient blank space in theheading or footing so that the image does not overlap the heading or footing text. You mayalso want to place heading or footing text to the right of the image using spot markers.
data
Defines a data column in which to place the image. Must be used with COLUMNS=columntitle to identify the specific report column where the image should be anchored.
file
Is the name of the image file. It must reside on the WebFOCUS Reporting Server in adirectory named on EDAPATH or APPPATH. If the file is not on the search path, supply thefull path name. When specifying a GIF file, you can omit the file extension.
Example: Inserting Images in the Headers and Footers of a Report
The following request inserts images in the headers and footers of a report.
9. Choosing a Display Format
Creating Reports With TIBCO® WebFOCUS Language 767

TABLE FILE EMPDATA SUMEMPDATA.EMPDATA.SALARYBY LOWEST EMPDATA.EMPDATA.DEPT BY EMPDATA.EMPDATA.LASTNAMEON EMPDATA.EMPDATA.DEPT SUBFOOT "Subfoot"" " ON EMPDATA.EMPDATA.DEPT PAGE-BREAK ON TABLE SUBHEAD"Report Heading" " "HEADING"Page Heading" " "FOOTING"Page Footing" " "ON TABLE SUBFOOT "Report Footing" " "ON TABLE SET PAGE-NUM NOLEAD ON TABLE NOTOTALON TABLE PCHOLD FORMAT PPTX ON TABLE SET STYLE * PAGESIZE='PPT Slide', ORIENTATION=LANDSCAPE,$TYPE=REPORT, OBJECT=STATUS-AREA, JUSTIFY=LEFT, PAGE-LOCATION=BOTTOM,$
Saving Report Output in PPTX Format
768

TYPE=REPORT, GRID=OFF, FONT='ARIAL', SIZE=12, STYLE=NORMAL, SQUEEZE=ON, TOPGAP=0.05, BOTTOMGAP=0.05, BORDER-COLOR=RGB(219 219 219), TITLELINE=SKIP, TOPMARGIN=.75, LEFTMARGIN=.5,$TYPE=TITLE, COLOR=RGB(51 51 51), STYLE=-UNDERLINE +BOLD,$TYPE=DATA, BORDER-TOP=LIGHT, BORDER-TOP-COLOR=RGB(219 219 219),$TYPE=SUBTOTAL, STYLE=BOLD, BORDER-TOP=LIGHT, BORDER-TOP-COLOR=RGB(219 219 219),$TYPE=TABHEADING, SIZE=14, JUSTIFY=LEFT,$TYPE=TABHEADING, IMAGE=tibco.gif, POSITION=(+4.500000 +0.000000),SIZE=(1 .6),$TYPE=TABFOOTING, SIZE=10,$
9. Choosing a Display Format
Creating Reports With TIBCO® WebFOCUS Language 769

TYPE=SUBHEAD, BACKCOLOR=RGB(246 246 246), BORDER-TOP=LIGHT, BORDER-TOP-COLOR=RGB(219 219 219),$TYPE=SUBHEAD, BY=1, BORDER-TOP=LIGHT, BORDER-TOP-COLOR=RGB(102 102 102),$TYPE=SUBHEAD, OBJECT=FIELD, STYLE=BOLD,$TYPE=SUBFOOT, SIZE=9, BORDER-TOP=LIGHT, BORDER-TOP-COLOR=RGB(219 219 219),$TYPE=TABFOOTING, IMAGE=gglogo.gif, POSITION=(+4.500000 +0.000000),$
TYPE=HEADING, SIZE=12,$TYPE=HEADING, IMAGE=coffee.gif, POSITION=(+4.500000 +0.000000),SIZE=(1 .6),$TYPE=FOOTING, SIZE=10,$TYPE=FOOTING, STYLE=BOLD, JUSTIFY=LEFT, IMAGE=gifts.gif, POSITION=(+4.500000 +0.000000),$TYPE=SUBFOOT, SIZE=10,$TYPE=SUBFOOT, IMAGE=food.gif, POSITION=(+4.500000 +0.000000), SIZE=(1.000000 0.500000),$ENDSTYLEEND
Saving Report Output in PPTX Format
770

The output is:
9. Choosing a Display Format
Creating Reports With TIBCO® WebFOCUS Language 771

Example: Inserting Images in the Data Cells of a Report
The following request inserts images in the data cells of a report.
APP PATH IBISAMP IBIDEMOTABLE FILE GGSALESSUM DOLLARS/D17M AS 'Revenue'COMPUTE Surplus/A15 = IF DOLLARS GE 4000000 THEN 'g1.gif' ELSE 'r1.gif';BY REGIONBY STON TABLE SUBHEAD"Current Year Revenue"FOOTING"Revenue in excess of 4 million""Revenue less than 4 million"ON TABLE SET PAGE-NUM NOLEADON TABLE PCHOLD FORMAT PPTXON TABLE SET SQUEEZE ONON TABLE SET STYLE *TYPE=REPORT, GRID=OFF, FONT='ARIAL', SIZE=14, STYLE=NORMAL, SQUEEZE=ON, TOPGAP=0.05, BOTTOMGAP=0.05, BORDER-COLOR=RGB(219 219 219), TITLELINE=SKIP, ORIENTATION = LANDSCAPE,TOPMARGIN=1,LEFTMARGIN=1,$TYPE=DATA, COLUMN=Surplus, IMAGE=(Surplus), SIZE=(.2 .2),$TYPE=FOOTING,IMAGE=g1.gif, position=(.122 .055), SIZE=(.2 .2 ),$TYPE=FOOTING,line=1,item=1,position=.5,$TYPE=FOOTING,IMAGE='r1.gif', position=(.122 .33), SIZE=(.2 .2),$TYPE=FOOTING,line=2,item=1, position=.5,$TYPE=DATA, BORDER-TOP=LIGHT, BORDER-TOP-COLOR=RGB(219 219 219),$
Saving Report Output in PPTX Format
772

TYPE=TITLE, COLOR=RGB(51 51 51), STYLE=-UNDERLINE +BOLD,$TYPE=TABHEADING, SIZE=18, JUSTIFY=LEFT,$TYPE=TABFOOTING, SIZE=10,$TYPE=HEADING, JUSTIFY=LEFT, SIZE=12,$TYPE=SUBHEAD, BACKCOLOR=RGB(246 246 246), BORDER-TOP=LIGHT, BORDER-TOP-COLOR=RGB(219 219 219),$TYPE=SUBHEAD, BY=1, BORDER-TOP=LIGHT, BORDER-TOP-COLOR=RGB(102 102 102),$TYPE=SUBHEAD, OBJECT=FIELD, STYLE=BOLD,$TYPE=SUBFOOT, SIZE=9, BORDER-TOP=LIGHT, BORDER-TOP-COLOR=RGB(219 219 219),$END
9. Choosing a Display Format
Creating Reports With TIBCO® WebFOCUS Language 773
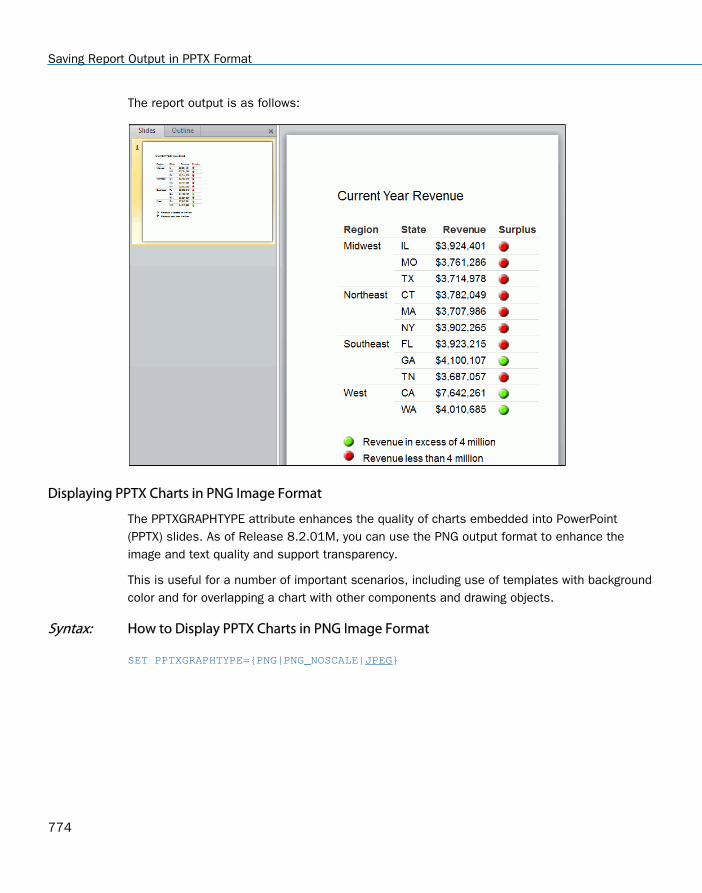
The report output is as follows:
Displaying PPTX Charts in PNG Image Format
The PPTXGRAPHTYPE attribute enhances the quality of charts embedded into PowerPoint(PPTX) slides. As of Release 8.2.01M, you can use the PNG output format to enhance theimage and text quality and support transparency.
This is useful for a number of important scenarios, including use of templates with backgroundcolor and for overlapping a chart with other components and drawing objects.
Syntax: How to Display PPTX Charts in PNG Image Format
SET PPTXGRAPHTYPE={PNG|PNG_NOSCALE|JPEG}
Saving Report Output in PPTX Format
774

where:
PNG
Scales the PNG image to twice its dimensions to get significantly improved quality. Thismay cause problems if you have non-scalable items in the chart, such as text withabsolute point sizes (including embedded scales headings). The output file is also largerdue to the larger bitmap. Text within the chart is noticeable sharper than the legacy JPEGformat.
PNG preserves font sizes in the chart when it is internally rescaled for increasedresolution. It converts absolute font sizes set in the stylesheet (*GRAPH_SCRIPT) to sizesexpressed in virtual coordinates (which are relative to the dimensions of the chart) andgenerates font sizes for embedded headings and footings in virtual coordinates.
PNG_NOSCALE
Renders in PNG, but does not scale. This produces slightly better quality than JPEG. Goingfrom JPEG to PNG_NOSCALE makes the chart sharper, but has only a slight effect on thetext.
JPEG
Indicates legacy format. This is the default value.
Example: Displaying a PNG Chart With Transparency
Transparency enables greater control over how components and drawing objects can be placedtogether on a slide. The following report contains a text box, report, and chart that can beintertwined on the page because the background of the chart does not cover the contents ofthe other objects.
SET PPTXGRAPHTYPE=PNG
COMPOUND LAYOUT PCHOLD FORMAT PPTXUNITS=IN, $SECTION=section1, LAYOUT=ON, MERGE=OFF, ORIENTATION=LANDSCAPE,PAGESIZE=PPT Slide, $PAGELAYOUT=1, NAME='Page layout 1', text='Page layout 1',BOTTOMMARGIN=0.5, TOPMARGIN=0.5, $COMPONENT='report1', TEXT='report1', POSITION=(5.088 1.375),DIMENSION=(2.260 2.500), $COMPONENT='chart2', TEXT='chart2', POSITION=(0.815 1.351),DIMENSION=(5.104 2.917), COMPONENT-TYPE=GRAPH, $OBJECT=STRING, NAME='text1', TEXT='<left>PNG charts can be defined with transparency to allow the background to show through and allow for overlapping components to optimize the use of space on the slide.</left>',POSITION=(0.500 0.979), MARKUP=ON, WRAP=ON, DIMENSION=(4.635 0.729), font='TREBUCHET MS', color=RGB(0 0 0), size=10, $END
9. Choosing a Display Format
Creating Reports With TIBCO® WebFOCUS Language 775
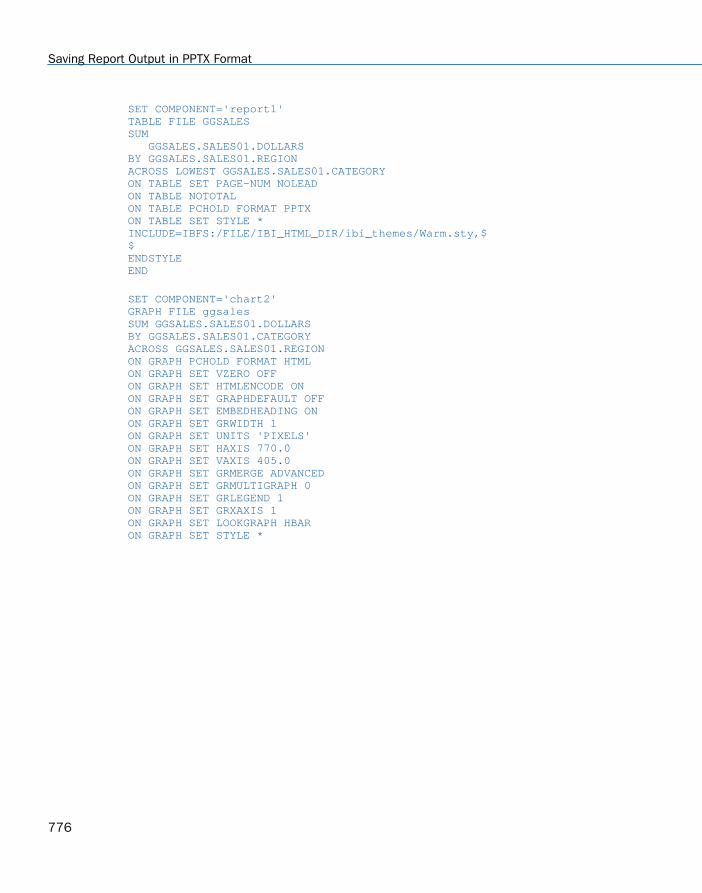
SET COMPONENT='report1'TABLE FILE GGSALESSUM GGSALES.SALES01.DOLLARSBY GGSALES.SALES01.REGIONACROSS LOWEST GGSALES.SALES01.CATEGORYON TABLE SET PAGE-NUM NOLEADON TABLE NOTOTALON TABLE PCHOLD FORMAT PPTXON TABLE SET STYLE *INCLUDE=IBFS:/FILE/IBI_HTML_DIR/ibi_themes/Warm.sty,$$ENDSTYLEEND
SET COMPONENT='chart2'GRAPH FILE ggsalesSUM GGSALES.SALES01.DOLLARSBY GGSALES.SALES01.CATEGORYACROSS GGSALES.SALES01.REGIONON GRAPH PCHOLD FORMAT HTMLON GRAPH SET VZERO OFFON GRAPH SET HTMLENCODE ONON GRAPH SET GRAPHDEFAULT OFFON GRAPH SET EMBEDHEADING ONON GRAPH SET GRWIDTH 1ON GRAPH SET UNITS 'PIXELS'ON GRAPH SET HAXIS 770.0ON GRAPH SET VAXIS 405.0ON GRAPH SET GRMERGE ADVANCEDON GRAPH SET GRMULTIGRAPH 0ON GRAPH SET GRLEGEND 1ON GRAPH SET GRXAXIS 1ON GRAPH SET LOOKGRAPH HBARON GRAPH SET STYLE *
Saving Report Output in PPTX Format
776

*GRAPH_SCRIPTsetPieDepth(0);setPieTilt(0);setDepthRadius(0);setPlace(true);setCurveFitEquationDisplay(false);*ENDINCLUDE=IBFS:/FILE/IBI_HTML_DIR/ibi_themes/Warm.sty,$TYPE=REPORT, TITLETEXT='WebFOCUS Report', $*GRAPH_SCRIPTsetFillColor(getChartBackground(),new Color(255,255,255,0));setLegendPosition(4);*GRAPH_JS_FINAL"blaProperties": { "orientation": "horizontal"},"agnosticSettings": { "chartTypeFullName": "Bar_Clustered_Horizontal"}*ENDENDSTYLEEND-RUN
COMPOUND END
The output is:
Example: Displaying a PNG Image With Transparency in a Designated Template
The following compound report places a chart defined with transparency on a slide from thedesignated template that contains background colors and patterns.
9. Choosing a Display Format
Creating Reports With TIBCO® WebFOCUS Language 777

SET PPTXGRAPHTYPE=PNG
COMPOUND LAYOUT PCHOLD FORMAT PPTXUNITS=IN, $SECTION=section1, LAYOUT=ON, MERGE=OFF, ORIENTATION=LANDSCAPE,PAGESIZE=Letter, $PAGELAYOUT=1, NAME='Page layout 1', text='Page layout 1', $COMPONENT='ppt_template', $COMPONENT='chart1', TEXT='chart1', POSITION=(0.500 2.10),DIMENSION=(9.336 3.437),COMPONENT-TYPE=GRAPH, ARREPORTSIZE=DIMENSION, $END
SET COMPONENT='ppt_template'TABLE FILE SYSCOLUMSUM TBNAME NOPRINTIF READLIMIT EQ 1ON TABLE PCHOLD FORMAT PPTX TEMPLATE 'golden.potx' SLIDENUMBER 1END
SET COMPONENT='chart1'GRAPH FILE ggsalesSUM GGSALES.SALES01.DOLLARSBY GGSALES.SALES01.CATEGORYBY GGSALES.SALES01.REGIONBY GGSALES.SALES01.STON GRAPH PCHOLD FORMAT HTMLON GRAPH SET EMBEDHEADING ONON GRAPH SET GRWIDTH 1ON GRAPH SET UNITS PIXELSON GRAPH SET HAXIS 770.0ON GRAPH SET VAXIS 405.0ON GRAPH SET GRMERGE ADVANCEDON GRAPH SET GRMULTIGRAPH 1ON GRAPH SET GRLEGEND 0ON GRAPH SET GRXAXIS 2ON GRAPH SET LOOKGRAPH VBARON GRAPH SET STYLE *
Saving Report Output in PPTX Format
778
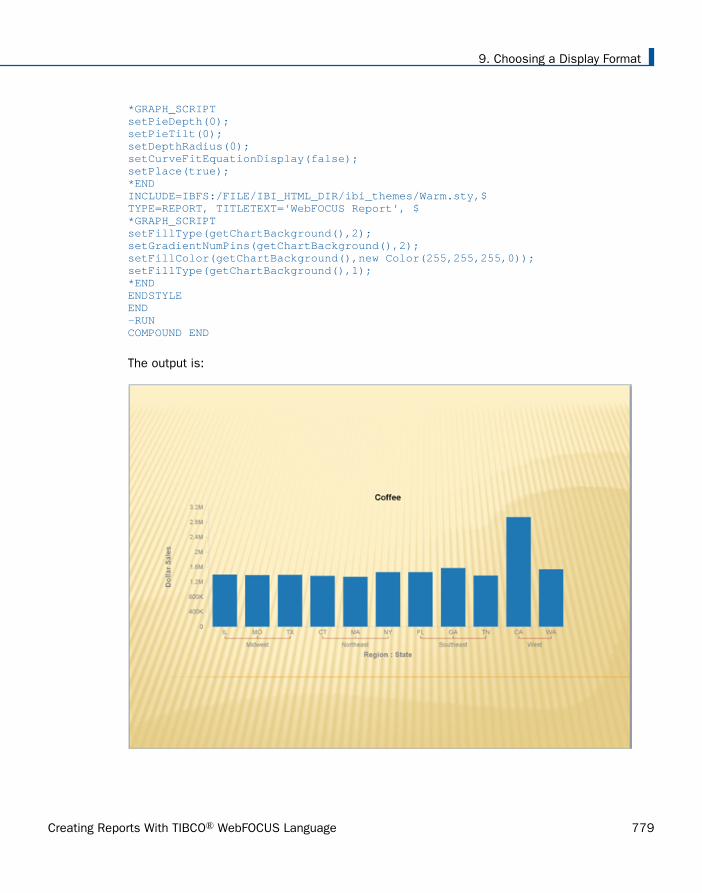
*GRAPH_SCRIPTsetPieDepth(0);setPieTilt(0);setDepthRadius(0);setCurveFitEquationDisplay(false);setPlace(true);*ENDINCLUDE=IBFS:/FILE/IBI_HTML_DIR/ibi_themes/Warm.sty,$TYPE=REPORT, TITLETEXT='WebFOCUS Report', $*GRAPH_SCRIPTsetFillType(getChartBackground(),2);setGradientNumPins(getChartBackground(),2);setFillColor(getChartBackground(),new Color(255,255,255,0));setFillType(getChartBackground(),1);*ENDENDSTYLEEND-RUNCOMPOUND END
The output is:
9. Choosing a Display Format
Creating Reports With TIBCO® WebFOCUS Language 779

Drill Down From Microsoft PowerPoint
Two types of drill downs are supported:
WebFOCUS content
External URL
When working in the WebFOCUS Repository or Content environment, drill-down hyperlinks inPPTX reports will not work when Microsoft PowerPoint opens in a PowerPoint applicationwindow instead of in a browser. The current security context and any previously establishedsession-related cookies are not retained and this changes user authorization. Therecommendation is to configure one of the three security models described below, to allowsuccessful drill down from reports displayed in a Microsoft PowerPoint application.
The Remember Me Security Model
The Remember Me Security model is a method of user authentication that enables WebFOCUSto store a trusted sign-in cookie locally, on the workstation, for a default period of 14 days.WebFOCUS does not however, store the user password in the sign-in cookie. Enable theRemember Me feature on the Sign-in page. If the end-user uses the Remember Me feature, apersistent cookie is used.
Public Access
Public Access is useful for procedures that are available to everyone within an organization orthe general public and do not require authentication. Set up WebFOCUS security such that thePUBLIC user has the necessary permissions to drill down to reports.
Integrated Windows Authentication
Integrated Windows Authentication (IWA) is enabled by configuring the browser. Use SSO withIIS/Tomcat Integrated Windows Authentication. Renegotiation occurs automatically and thePowerPoint formatted reports display correctly.
Refer to the TIBCO WebFOCUS® Security and Administration manual for details on theseauthentication models.
Example: Drilling Down to an External URL
The following request places a reference to an external URL on the grand total line tag.
Saving Report Output in PPTX Format
780

TABLE FILE GGSALESSUM GGSALES.SALES01.BUDDOLLARS/D12CM GGSALES.SALES01.DOLLARS/D12CMBY GGSALES.SALES01.REGIONBY GGSALES.SALES01.CATEGORYBY GGSALES.SALES01.PRODUCTHEADING"REVENUE BY REGION "ON GGSALES.SALES01.REGION SUBTOTAL AS '*TOTAL'WHERE GGSALES.SALES01.CATEGORY NE 'Gifts';ON TABLE SET PAGE-NUM NOLEADON TABLE COLUMN-TOTAL AS 'TOTAL'ON TABLE PCHOLD FORMAT PPTXON TABLE SET STYLE *PAGESIZE='PPT Slide', ORIENTATION=LANDSCAPE,$
9. Choosing a Display Format
Creating Reports With TIBCO® WebFOCUS Language 781

TYPE=REPORT, OBJECT=STATUS-AREA, JUSTIFY=LEFT, PAGE-LOCATION=BOTTOM,$TYPE=REPORT, GRID=OFF, FONT='ARIAL', SIZE=12, STYLE=NORMAL, SQUEEZE=ON, TOPGAP=0.05, BOTTOMGAP=0.05, BORDER-COLOR=RGB(219 219 219), TITLELINE=SKIP, TOPMARGIN=1, LEFTMARGIN=1,$TYPE=TITLE, COLOR=RGB(51 51 51), STYLE=-UNDERLINE +BOLD,$TYPE=DATA, BORDER-TOP=LIGHT, BORDER-TOP-COLOR=RGB(219 219 219),$TYPE=HEADING, JUSTIFY=LEFT, SIZE=14,$TYPE=SUBTOTAL, STYLE=BOLD, BORDER-TOP=LIGHT, BORDER-TOP-COLOR=RGB(219 219 219),$TYPE=GRANDTOTAL, OBJECT=TAG, URL=http://www.tibco.com,$
TYPE=REPORT, OBJECT=STATUS-AREA, JUSTIFY=LEFT, PAGE-LOCATION=BOTTOM,$TYPE=GRANDTOTAL, COLOR=RGB(51 51 51), STYLE=BOLD, BORDER-TOP=LIGHT, BORDER-TOP-COLOR=RGB(102 102 102),$ENDSTYLEEND
Saving Report Output in PPTX Format
782

The output is:
PowerPoint PPTX Presentations Using Templates
PPTX report output can be generated based on PowerPoint templates. This feature allows forthe integration of WebFOCUS reports into presentations containing multiple slides. Any nativePowerPoint template can be used to generate a new presentation containing a WebFOCUSreport.
The following PowerPoint file types can be used as template files to generate PPTXpresentations.
Template File Type Presentation Output Generated
Template (.potx) Presentation (.pptx)
Macro-Enabled Template (.potm) Macro-Enabled presentation (.pptm)
Presentation (.pptx) Presentation (.pptx)
Macro-Enabled presentation (.pptm) Macro-Enabled presentation (.pptm)
9. Choosing a Display Format
Creating Reports With TIBCO® WebFOCUS Language 783

Note: For more information on working with active content in macro-enabled templates, see theMicrosoft webpage: https://support.office.com/en-nz/article/Enable-or-disable-macros-in-Office-documents-7b4fdd2e-174f-47e2-9611-9efe4f860b12
Example: Using Standard PowerPoint Templates (POTX)
In the following request, the report occupies multiple slides. The designated slide is replacedby as many slides as are needed to display the report output.
TABLE FILE TRAININGSUMTRAINING.TRAINING.EXPENSES/D12CM BY TRAINING.TRAINING.LOCATIONBY TRAINING.TRAINING.PINBY LOWEST TRAINING.TRAINING.COURSECODE BY TRAINING.TRAINING.COURSESTARTBY TRAINING.TRAINING.GRADEON TRAINING.TRAINING.LOCATION SUBTOTAL AS 'TOTAL EXPENSES FOR' ON TRAINING.TRAINING.LOCATION PAGE-BREAKHEADING"MONTHLY EXPENSES BY STATE"" "ON TABLE SET ASNAMES ON ON TABLE NOTOTALON TABLE PCHOLD FORMAT PPTX TEMPLATE 'ibi_template.potx' SLIDENUMBER 2ON TABLE SET STYLE *PAGESIZE='PPT Slide', ORIENTATION=LANDSCAPE,$TYPE=REPORT, OBJECT=STATUS-AREA, JUSTIFY=LEFT, PAGE-LOCATION=BOTTOM,$TYPE=REPORT, GRID=OFF, FONT='ARIAL', SIZE=14, STYLE=NORMAL, SQUEEZE=ON, TOPGAP=0.05, BOTTOMGAP=0.05, BORDER-COLOR=RGB(219 219 219), TITLELINE=SKIP, TOPMARGIN=.1, LEFTMARGIN=1.5,$
Saving Report Output in PPTX Format
784
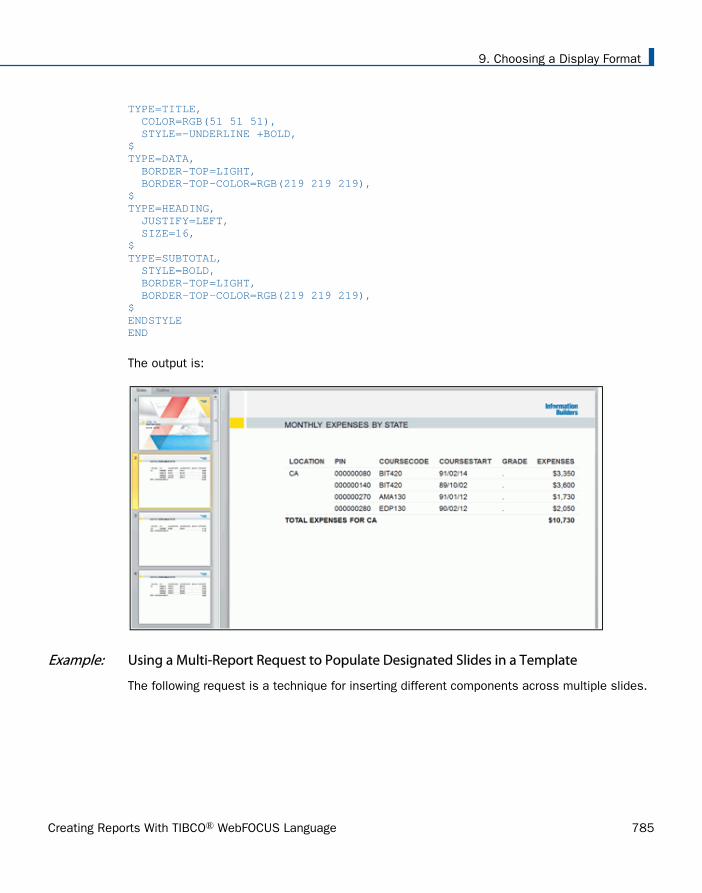
TYPE=TITLE, COLOR=RGB(51 51 51), STYLE=-UNDERLINE +BOLD,$TYPE=DATA, BORDER-TOP=LIGHT, BORDER-TOP-COLOR=RGB(219 219 219),$TYPE=HEADING, JUSTIFY=LEFT, SIZE=16,$TYPE=SUBTOTAL, STYLE=BOLD, BORDER-TOP=LIGHT, BORDER-TOP-COLOR=RGB(219 219 219),$ENDSTYLEEND
The output is:
Example: Using a Multi-Report Request to Populate Designated Slides in a Template
The following request is a technique for inserting different components across multiple slides.
9. Choosing a Display Format
Creating Reports With TIBCO® WebFOCUS Language 785

-* Replace Slide #2TABLE FILE GGSALESHEADING"FIRST SLIDE"SUM DOLLARS/D12CM UNITS BY REGION AS 'My Field' BY CATEGORYON TABLE COLUMN-TOTALON TABLE HOLD AS SLIDE_A FORMAT PPTX TEMPLATE 'ibi_template.potx' SLIDENUMBER 2ON TABLE SET STYLE * TYPE=REPORT, OBJECT=STATUS-AREA, JUSTIFY=LEFT, PAGE-LOCATION=BOTTOM,$TYPE=REPORT, GRID=OFF, FONT='ARIAL', SIZE=14, STYLE=NORMAL, SQUEEZE=ON, TOPGAP=0.05, BOTTOMGAP=0.05, BORDER-COLOR=RGB(219 219 219), TITLELINE=SKIP, ORIENTATION = LANDSCAPE, TOPMARGIN=.1, LEFTMARGIN=1.5,$TYPE=TITLE, COLOR=RGB(51 51 51), STYLE=-UNDERLINE +BOLD,$
Saving Report Output in PPTX Format
786

TYPE=DATA, BORDER-TOP=LIGHT, BORDER-TOP-COLOR=RGB(219 219 219),$TYPE=HEADING, JUSTIFY=LEFT, SIZE=16,$TYPE=DATA, COLUMN=DOLLARS, COLOR=BLUE,$TYPE=REPORT, COLUMN=REGION, COLOR=RED,$TYPE=REPORT, COLUMN=CATEGORY, COLOR=GREEN,$TYPE=GRANDTOTAL, COLOR=RGB(51 51 51), STYLE=BOLD, BORDER-TOP=LIGHT, BORDER-TOP-COLOR=RGB(102 102 102),$END-* Replace Slide #3TABLE FILE GGSALES HEADING"SECOND SLIDE"SUM DOLLARS/D12CM UNITS BY REGION AS 'My Field' BY CATEGORYON TABLE COLUMN-TOTALON TABLE HOLD AS SLIDE_1 FORMAT PPTX TEMPLATE 'slide_a.pptx' SLIDENUMBER 3ON TABLE COLUMN-TOTALON TABLE SET STYLE *$TYPE=REPORT, OBJECT=STATUS-AREA, JUSTIFY=LEFT, PAGE-LOCATION=BOTTOM,$
9. Choosing a Display Format
Creating Reports With TIBCO® WebFOCUS Language 787

TYPE=REPORT, GRID=OFF, FONT='ARIAL', SIZE=14, STYLE=NORMAL, SQUEEZE=ON, TOPGAP=0.05, BOTTOMGAP=0.05, BORDER-COLOR=RGB(219 219 219), TITLELINE=SKIP, ORIENTATION = LANDSCAPE, TOPMARGIN=.1, LEFTMARGIN=1.5,$TYPE=TITLE, COLOR=RGB(51 51 51), STYLE=-UNDERLINE +BOLD,$TYPE=DATA, BORDER-TOP=LIGHT, BORDER-TOP-COLOR=RGB(219 219 219),$TYPE=HEADING, JUSTIFY=LEFT, SIZE=16,$TYPE=DATA, COLUMN=DOLLARS, COLOR=BLUE,$TYPE=REPORT, COLUMN=REGION, COLOR=RED,$TYPE=REPORT, COLUMN=CATEGORY, COLOR=GREEN,$TYPE=GRANDTOTAL, COLOR=RGB(51 51 51), STYLE=BOLD, BORDER-TOP=LIGHT, BORDER-TOP-COLOR=RGB(102 102 102),$END
Saving Report Output in PPTX Format
788
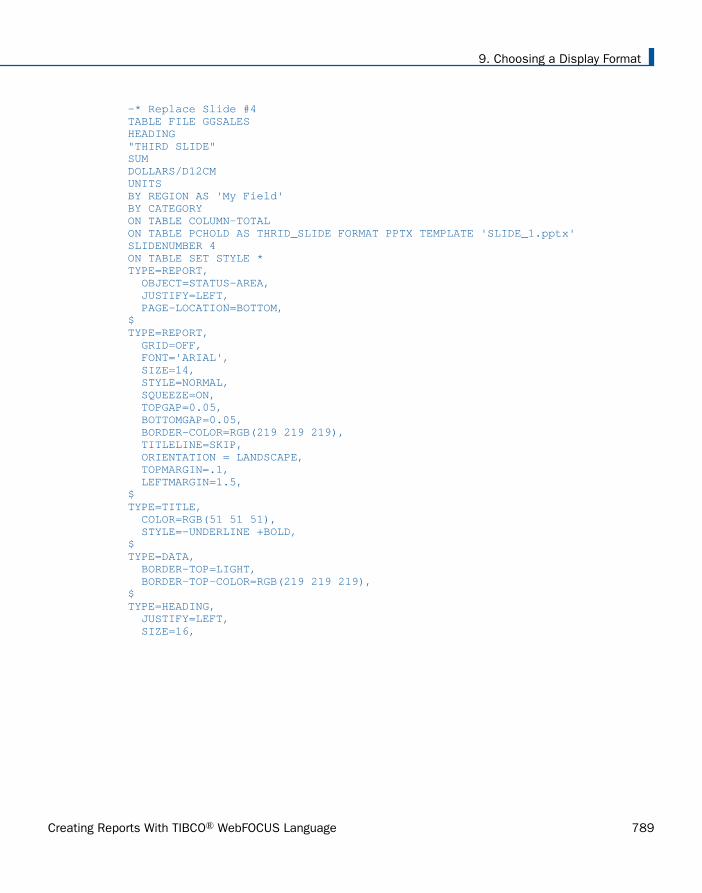
-* Replace Slide #4TABLE FILE GGSALESHEADING"THIRD SLIDE"SUM DOLLARS/D12CM UNITSBY REGION AS 'My Field' BY CATEGORYON TABLE COLUMN-TOTALON TABLE PCHOLD AS THRID_SLIDE FORMAT PPTX TEMPLATE 'SLIDE_1.pptx' SLIDENUMBER 4ON TABLE SET STYLE * TYPE=REPORT, OBJECT=STATUS-AREA, JUSTIFY=LEFT, PAGE-LOCATION=BOTTOM,$TYPE=REPORT, GRID=OFF, FONT='ARIAL', SIZE=14, STYLE=NORMAL, SQUEEZE=ON, TOPGAP=0.05, BOTTOMGAP=0.05, BORDER-COLOR=RGB(219 219 219), TITLELINE=SKIP, ORIENTATION = LANDSCAPE, TOPMARGIN=.1, LEFTMARGIN=1.5,$TYPE=TITLE, COLOR=RGB(51 51 51), STYLE=-UNDERLINE +BOLD,$TYPE=DATA, BORDER-TOP=LIGHT, BORDER-TOP-COLOR=RGB(219 219 219),$TYPE=HEADING, JUSTIFY=LEFT, SIZE=16,
9. Choosing a Display Format
Creating Reports With TIBCO® WebFOCUS Language 789

$TYPE=DATA, COLUMN=DOLLARS, COLOR=BLUE,$ TYPE=REPORT, COLUMN=REGION, COLOR=RED,$TYPE=REPORT, COLUMN=CATEGORY, COLOR=GREEN,$TYPE=GRANDTOTAL, COLOR=RGB(51 51 51), STYLE=BOLD, BORDER-TOP=LIGHT, BORDER-TOP-COLOR=RGB(102 102 102),$END
The output is:
PowerPoint PPTX Compound Syntax
PowerPoint Compound Documents generate presentations that may contain multiple slides.The components of a PowerPoint Compound Document can include standard tables andcharts.
Saving Report Output in PPTX Format
790

Example: Generating a Compound Document
The following request creates a slide deck, which presents the selected information instandard tables and charts.
SET HTMLARCHIVE=ONCOMPOUND LAYOUT PCHOLD FORMAT PPTXUNITS=IN, $SECTION=section1, LAYOUT=ON, MERGE=OFF,ORIENTATION=LANDSCAPE, PAGESIZE=PPT Slide, SHOW_GLOBALFILTER=OFF, $PAGELAYOUT=1, NAME='Page layout 1', text='Page layout 1', BOTTOMMARGIN=0.2, TOPMARGIN=0.5, LEFTMARGIN=2.0, $COMPONENT='chart1', TEXT='chart1', POSITION=(0.707 0.520),DIMENSION=(8.750 2.917), COMPONENT-TYPE=GRAPH, $COMPONENT='report1', TEXT='report1', POSITION=(0.500 3.542),DIMENSION=(9.271 3.646), $ENDSET COMPONENT='chart1'ENGINE INT CACHE SET ON-DEFAULTH &WF_STYLE_UNITS='PIXELS';-DEFAULTH &WF_STYLE_HEIGHT='405.0';-DEFAULTH &WF_STYLE_WIDTH='770.0';-DEFAULTH &WF_TITLE='WebFOCUS Report';GRAPH FILE ibisamp/ggsalesSUM GGSALES.SALES01.DOLLARSBY GGSALES.SALES01.REGIONBY TOTAL HIGHEST GGSALES.SALES01.DOLLARS NOPRINTBY GGSALES.SALES01.STON GRAPH PCHOLD FORMAT PPTXON GRAPH SET HTMLENCODE ONON GRAPH SET GRAPHDEFAULT OFFON GRAPH SET ARGRAPHENGIN JSCHARTON GRAPH SET EMBEDHEADING ONON GRAPH SET VZERO OFFON GRAPH SET GRWIDTH 1
9. Choosing a Display Format
Creating Reports With TIBCO® WebFOCUS Language 791

ON GRAPH SET UNITS &WF_STYLE_UNITSON GRAPH SET HAXIS &WF_STYLE_WIDTHON GRAPH SET VAXIS &WF_STYLE_HEIGHTON GRAPH SET GRMERGE ADVANCEDON GRAPH SET GRMULTIGRAPH 1ON GRAPH SET GRLEGEND 0ON GRAPH SET GRXAXIS 2ON GRAPH SET LOOKGRAPH VBARON GRAPH SET STYLE **GRAPH_SCRIPTsetPieDepth(0);setPieTilt(0);setDepthRadius(0);setCurveFitEquationDisplay(false);setPlace(true);setPieFeelerTextDisplay(1);setUseSeriesShapes(true);setMarkerSizeDefault(50);*ENDINCLUDE=IBFS:/FILE/IBI_HTML_DIR/javaassist/intl/EN/combine_templates/warm.sty,$TYPE=REPORT, TITLETEXT=&WF_TITLE.QUOTEDSTRING, $*GRAPH_SCRIPTsetReportParsingErrors(false);setSelectionEnableMove(false);setFillType(getSeries(0),2);setGradientPinLeftColor0(getSeries(0),new Color(0,127,192));setGradientPinRightColor0(getSeries(0),new Color(0,127,192));setGradientPinLeftColor2(getSeries(0),new Color(0,127,192));setGradientPinRightColor2(getSeries(0),new Color(0,127,192));setGradientPinLeftColor1(getSeries(0),new Color(0,64,128));setGradientPinRightColor1(getSeries(0),new Color(0,64,128));setGradientPinPosition0(getSeries(0),0.0);setGradientPinPosition1(getSeries(0),1.0);setPieTilt(0);setPieDepth(0);setDepthRadius(0);setDepthAngle(0);setFillType(getSeries(7),2);setGradientPinPosition0(getSeries(7),0.0);setGradientPinPosition1(getSeries(7),1.0);setFillType(getSeries(9),2);setGradientDirection(getSeries(9),16);setGradientPinPosition0(getSeries(9),0.0);setGradientPinPosition1(getSeries(9),1.0);*ENDENDSTYLEEND-RUN
Saving Report Output in PPTX Format
792
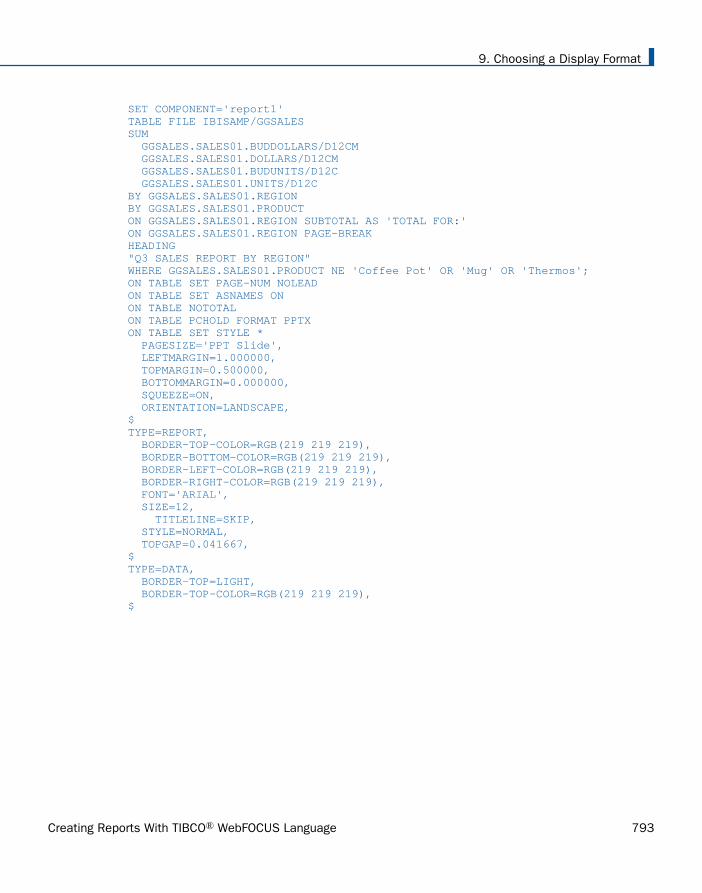
SET COMPONENT='report1'TABLE FILE IBISAMP/GGSALESSUM GGSALES.SALES01.BUDDOLLARS/D12CM GGSALES.SALES01.DOLLARS/D12CM GGSALES.SALES01.BUDUNITS/D12C GGSALES.SALES01.UNITS/D12CBY GGSALES.SALES01.REGIONBY GGSALES.SALES01.PRODUCTON GGSALES.SALES01.REGION SUBTOTAL AS 'TOTAL FOR:'ON GGSALES.SALES01.REGION PAGE-BREAKHEADING"Q3 SALES REPORT BY REGION"WHERE GGSALES.SALES01.PRODUCT NE 'Coffee Pot' OR 'Mug' OR 'Thermos';ON TABLE SET PAGE-NUM NOLEADON TABLE SET ASNAMES ONON TABLE NOTOTALON TABLE PCHOLD FORMAT PPTXON TABLE SET STYLE * PAGESIZE='PPT Slide', LEFTMARGIN=1.000000, TOPMARGIN=0.500000, BOTTOMMARGIN=0.000000, SQUEEZE=ON, ORIENTATION=LANDSCAPE,$TYPE=REPORT, BORDER-TOP-COLOR=RGB(219 219 219), BORDER-BOTTOM-COLOR=RGB(219 219 219), BORDER-LEFT-COLOR=RGB(219 219 219), BORDER-RIGHT-COLOR=RGB(219 219 219), FONT='ARIAL', SIZE=12, TITLELINE=SKIP, STYLE=NORMAL, TOPGAP=0.041667,$TYPE=DATA, BORDER-TOP=LIGHT, BORDER-TOP-COLOR=RGB(219 219 219),$
9. Choosing a Display Format
Creating Reports With TIBCO® WebFOCUS Language 793

TYPE=TITLE, COLOR=RGB(51 51 51), STYLE=-UNDERLINE+BOLD,$TYPE=HEADING, SIZE=14, JUSTIFY=LEFT,$TYPE=SUBTOTAL, BORDER-TOP=LIGHT, BORDER-TOP-COLOR=RGB(219 219 219), STYLE=BOLD,$TYPE=REPORT, OBJECT=STATUS-AREA, JUSTIFY=LEFT, PAGE-LOCATION=BOTTOM,$ENDSTYLEENDCOMPOUND END
The resulting Compound Document output is:
Saving Report Output in PPTX Format
794

Coordinated Compound Layout Reports
A Coordinated Compound Layout report is coordinated so that all reports and graphs thatcontain a common sort field are burst into separate page layouts. Pages are generated foreach value of the common sort field, with every component displaying the data it retrieved forthat value on that page. You create a Coordinated Compound Layout report by specifyingMERGE=ON in the SECTION declaration for the Compound Layout report.
In a Coordinated Compound Layout report, if at least one component contains data for aspecific sort field value, a page is generated for that value even though some of thecomponents may be missing.
While the length of the report will always include all of the rows of data generated by the query,the width of the report is limited by the size of the defined component container. This meansthat paneling is not supported for Compound Reports, although it is for non-Compound PPTXReports.
If the width of the report data is wider than the defined page size, a panel (or horizontaloverflow page) is automatically generated.
In legacy compound syntax, if one of the component reports is too large to fit within thedefined page width, execution is halted and the user is presented with an error messagestating that paneling is not supported.
In Compound Layout syntax, if a component is too wide to fit within the defined container, thereport wraps the contents within the container. The container size is defined through acombination of the POSITION and DIMENSIONS parameters for the component within thecompound syntax.
Example: Generating a Coordinated Compound Layout Report
The following request generates a Coordinated Compound Layout report. This CompoundReport is coordinated by Region, so that individual slides are generated for each value of theprimary Key, Region.
9. Choosing a Display Format
Creating Reports With TIBCO® WebFOCUS Language 795

SET HTMLARCHIVE=ON*-HOLD_SOURCECOMPOUND LAYOUT PCHOLD FORMAT PPTX UNITS=IN, $SECTION=section1, LAYOUT=ON, MERGE=ON, ORIENTATION=LANDSCAPE,PAGESIZE=PPT Slide, SHOW_GLOBALFILTER=OFF,$ PAGELAYOUT=1, NAME='Page layout 1', text='Page layout 1', BOTTOMMARGIN=0.5,TOPMARGIN=0.5, $COMPONENT='report1', TEXT='report1', POSITION=(0.500 0.625),DIMENSION=(* *), $COMPONENT='report2', TEXT='report2', POSITION=(0.712 0.771),DIMENSION=(* *), $COMPONENT='report3', TEXT='report3', POSITION=(5.702 0.759),DIMENSION=(* *), $ENDSET COMPONENT='report1'TABLE FILE WF_RETAILBY WF_RETAIL.WF_RETAIL_GEOGRAPHY_CUSTOMER.BUSINESS_REGION NOPRINT HEADING"PROFIT REPORTS FOR <WF_RETAIL.WF_RETAIL_GEOGRAPHY_CUSTOMER.BUSINESS_REGION<+15>DISCOUNTS APPLIED: <WF_RETAIL.WF_RETAIL_GEOGRAPHY_CUSTOMER.BUSINESS_REGION"" "ON TABLE SET ASNAMES ONON TABLE NOTOTALON TABLE PCHOLD FORMAT PPTX ON TABLE SET STYLE *
Saving Report Output in PPTX Format
796

TYPE=REPORT, GRID=OFF, FONT='ARIAL', SIZE=9, STYLE=NORMAL, SQUEEZE=ON, TOPGAP=0.05, BOTTOMGAP=0.05, PAGECOLOR='WHITE', BORDER-COLOR=RGB(219 219 219), TITLELINE=SKIP, TOPMARGIN=.5, LEFTMARGIN=.15,$TYPE=HEADING, JUSTIFY=LEFT, SIZE=14,$ ENDSTYLEENDSET COMPONENT='report2'TABLE FILE WF_RETAIL SUMWF_RETAIL.WF_RETAIL_SALES.COGS_USWF_RETAIL.WF_RETAIL_SALES.GROSS_PROFIT_USBY WF_RETAIL.WF_RETAIL_GEOGRAPHY_CUSTOMER.BUSINESS_REGION NOPRINTBY WF_RETAIL.WF_RETAIL_PRODUCT.PRODUCT_CATEGORYON WF_RETAIL.WF_RETAIL_GEOGRAPHY_CUSTOMER.BUSINESS_REGION SUBTOTAL AS 'TOTAL FOR' ON TABLE SET ASNAMES ONON TABLE NOTOTALON TABLE PCHOLD FORMAT PPTXON TABLE SET STYLE * PAGESIZE='PPT Slide', ORIENTATION=LANDSCAPE,$TYPE=REPORT, OBJECT=STATUS-AREA, JUSTIFY=LEFT, PAGE-LOCATION=BOTTOM,$
9. Choosing a Display Format
Creating Reports With TIBCO® WebFOCUS Language 797

TYPE=REPORT, GRID=OFF, FONT='ARIAL', SIZE=14, STYLE=NORMAL, SQUEEZE=ON, TOPGAP=0.05, BOTTOMGAP=0.05, PAGECOLOR='WHITE', BORDER-COLOR=RGB(219 219 219), TITLELINE=SKIP, TOPMARGIN=.5, LEFTMARGIN=.15,$TYPE=DATA, BORDER-TOP=LIGHT, BORDER-TOP-COLOR=RGB(219 219 219),$TYPE=TITLE, COLOR=RGB(51 51 51), STYLE=-UNDERLINE +BOLD,$TYPE=DATA, COLUMN=ROWTOTAL(*), STYLE=BOLD,$TYPE=TITLE, COLUMN=ROWTOTAL(*), COLOR=RGB(51 51 51), STYLE=-UNDERLINE +BOLD,$TYPE=SUBTOTAL, STYLE=BOLD, BORDER-TOP=LIGHT, BORDER-TOP-COLOR=RGB(219 219 219),$ENDSTYLEENDSET COMPONENT='report3'TABLE FILE WF_RETAIL SUMWF_RETAIL.WF_RETAIL_SALES.DISCOUNT_USBY WF_RETAIL.WF_RETAIL_GEOGRAPHY_CUSTOMER.BUSINESS_REGION NOPRINTBY WF_RETAIL.WF_RETAIL_PRODUCT.PRODUCT_CATEGORYON WF_RETAIL.WF_RETAIL_GEOGRAPHY_CUSTOMER.BUSINESS_REGION SUBTOTALAS 'TOTAL FOR'
Saving Report Output in PPTX Format
798
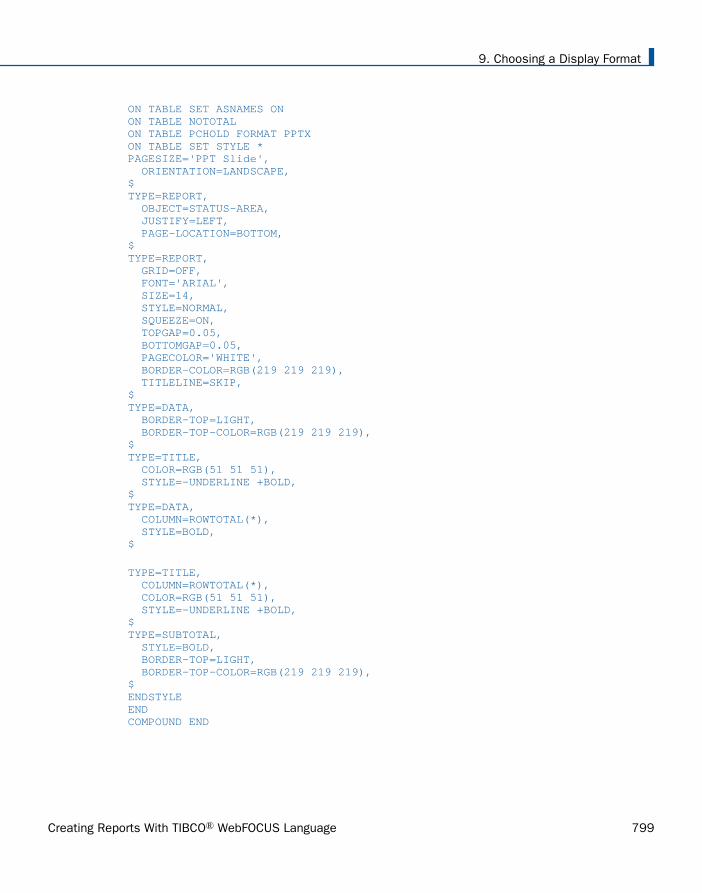
ON TABLE SET ASNAMES ONON TABLE NOTOTALON TABLE PCHOLD FORMAT PPTX ON TABLE SET STYLE * PAGESIZE='PPT Slide', ORIENTATION=LANDSCAPE,$TYPE=REPORT, OBJECT=STATUS-AREA, JUSTIFY=LEFT, PAGE-LOCATION=BOTTOM,$TYPE=REPORT, GRID=OFF, FONT='ARIAL', SIZE=14, STYLE=NORMAL, SQUEEZE=ON, TOPGAP=0.05, BOTTOMGAP=0.05, PAGECOLOR='WHITE', BORDER-COLOR=RGB(219 219 219), TITLELINE=SKIP,$TYPE=DATA, BORDER-TOP=LIGHT, BORDER-TOP-COLOR=RGB(219 219 219),$TYPE=TITLE, COLOR=RGB(51 51 51), STYLE=-UNDERLINE +BOLD,$TYPE=DATA, COLUMN=ROWTOTAL(*), STYLE=BOLD,$
TYPE=TITLE, COLUMN=ROWTOTAL(*), COLOR=RGB(51 51 51), STYLE=-UNDERLINE +BOLD,$TYPE=SUBTOTAL, STYLE=BOLD, BORDER-TOP=LIGHT, BORDER-TOP-COLOR=RGB(219 219 219),$ENDSTYLEENDCOMPOUND END
9. Choosing a Display Format
Creating Reports With TIBCO® WebFOCUS Language 799

The output is:
Templates for Compound Reports
For Compound Reports, the template is defined in the first component report. For compoundreports with Page Masters, this table will be the default table used to substantiate the pagelayout. For uncoordinated standard compound reports, this default component can be createdusing the system table, as shown in the following request.
SET COMPONENT='ppt_template'TABLE FILE SYSCOLUMSUM TBNAME NOPRINTIF READLIMIT EQ 1ON TABLE PCHOLD FORMAT PPTX TEMPLATE 'template_plus.potx' SLIDENUMBER 1END
For Coordinated Compound Reports, this table must contain the same primary key as the othercomponents in the report. This includes any preprocessing of the data to define the universe ofavailable primary key values including JOINS and DEFINES.
SET COMPONENT='ppt_template'TABLE FILE GGSALESBY REGION NOPRINTIF READLIMIT EQ 1ON TABLE PCHOLD FORMAT PPTX TEMPLATE 'template_plus.potx' SLIDENUMBER 1END
Saving Report Output in PPTX Format
800

Adding Images to a Compound Request
Images may be inserted on the Page Master, Page Layout, and PowerPoint template (POTX) toenhance the Compound Document. Images inserted on the Page Master will be visible onevery Page Layout within the Compound Document. Images on a Page Layout will be displayedonly on that page. If the Document is to be displayed on a PowerPoint Template, images maybe saved on the Template so that they will be displayed as positioned on the individual slides.
Important: Compound Layout syntax cannot contain hidden carriage return or line feedcharacters. For purposes of presenting this example, line feed characters have been added sothat the sample code wraps to fit within the printed page. To run this example in yourenvironment, copy the code into a text editor and delete any line feed characters within theCompound Layout syntax by going to the end of each line and pressing the Delete key.
Example: Adding Images to a Compound Request
The following compound syntax creates a Document with images in the Page Master, the PageLayout, and that is displayed on a PowerPoint template on which an image has been inserted.
SET HTMLARCHIVE=ON*-HOLD_SOURCECOMPOUND LAYOUT PCHOLD FORMAT PPTXUNITS=IN, $SECTION=section1, LAYOUT=ON, MERGE=OFF,ORIENTATION=LANDSCAPE, PAGESIZE=PPT Slide, SHOW_GLOBALFILTER=OFF, $PAGELAYOUT=ALL, NAME='Page Master', $COMPONENT='ppt_template', $OBJECT=BOX, NAME='line1', POSITION=(0.052 0.500), DIMENSION=(10.000 0.031),BACKCOLOR=RGB(176 196 222), BORDER-COLOR=RGB(176 196 222), $OBJECT=BOX, NAME='line2', POSITION=(-12.000 -10.000), DIMENSION=(0.000 0.000), BACKCOLOR=BLACK, BORDER-COLOR=BLACK, $OBJECT=BOX, NAME='line3', POSITION=(0.479 0.000), DIMENSION=(0.025 7.600),BACKCOLOR=RGB(176 196 222), BORDER-COLOR=RGB(176 196 222), $OBJECT=IMAGE, NAME='image1', IMAGE=webfocus1.gif, ALT='', POSITION=(0.601 6.700), DIMENSION=(1.248 0.436), $PAGELAYOUT=1, NAME='Page layout 1', text='Page layout 1', BOTTOMMARGIN=0.15, TOPMARGIN=0.5, $COMPONENT='report1', TEXT='report1', POSITION=(1.853 1.289),DIMENSION=(6.458 5.417), $OBJECT=IMAGE, NAME='image2', IMAGE=analyst_logo.gif, ALT='',POSITION=(0.499 0.509), DIMENSION=(2.081 0.477), $END
9. Choosing a Display Format
Creating Reports With TIBCO® WebFOCUS Language 801

SET COMPONENT='ppt_template'TABLE FILE SYSCOLUMSUM TBNAME NOPRINTIF READLIMIT EQ 1ON TABLE PCHOLD FORMAT PPTX TEMPLATE '_ibi_template.potx' SLIDENUMBER 2ENDSET COMPONENT='report1'TABLE FILE IBISAMP/EMPDATASUM EMPDATA.EMPDATA.SALARYBY LOWEST EMPDATA.EMPDATA.DEPTBY EMPDATA.EMPDATA.LASTNAMEON EMPDATA.EMPDATA.DEPT SUBFOOT"Subfoot"" "ON EMPDATA.EMPDATA.DEPT PAGE-BREAKON TABLE SUBHEAD"Report Heading "" "" "HEADING"Page Heading "" "FOOTING"Page Footing"" "ON TABLE SUBFOOT"Report Footing"WHERE EMPDATA.EMPDATA.SALARY GE 40900;ON TABLE SET PAGE-NUM NOLEADON TABLE SET ASNAMES ONON TABLE NOTOTALON TABLE PCHOLD FORMAT PPTXON TABLE SET STYLE * PAGESIZE='PPT Slide', ORIENTATION=LANDSCAPE,$TYPE=REPORT, OBJECT=STATUS-AREA, JUSTIFY=LEFT, PAGE-LOCATION=BOTTOM,$
Saving Report Output in PPTX Format
802

TYPE=REPORT, GRID=OFF, FONT='ARIAL', SIZE=14, STYLE=NORMAL, SQUEEZE=ON, TOPGAP=0.05, BOTTOMGAP=0.05, BORDER-COLOR=RGB(219 219 219), TITLELINE=SKIP, TOPMARGIN=.25, LEFTMARGIN=2, BOTTOMMARGIN=0.05,$TYPE=TITLE, COLOR=RGB(51 51 51), STYLE=-UNDERLINE +BOLD,$TYPE=DATA, BORDER-TOP=LIGHT, BORDER-TOP-COLOR=RGB(219 219 219),$TYPE=HEADING, JUSTIFY=LEFT, SIZE=16,$TYPE=HEADING, IMAGE=smplogo1.gif, POSITION=(+4.500000 +0.000000),$TYPE=TABFOOTING, IMAGE=smplogo1.gif, POSITION=(+4.500000 +0.000000),$TYPE=TABFOOTING, SIZE=10,$TYPE=FOOTING, SIZE=10,$TYPE=FOOTING, IMAGE=smplogo1.gif, POSITION=(+4.500000 +0.000000),$
9. Choosing a Display Format
Creating Reports With TIBCO® WebFOCUS Language 803

TYPE=SUBFOOT, SIZE=9, BORDER-TOP=LIGHT, BORDER-TOP-COLOR=RGB(219 219 219),$TYPE=SUBFOOT, BY=1, IMAGE=smplogo1.gif, POSITION=(+4.500000 +0.000000),$ENDSTYLEENDCOMPOUND END
The output is:
Saving Report Output in PPTX Format
804

Template Masters and Slide Layouts
A Microsoft PPTX 2007 and higher template can contain one or more Slide Masters, defining avariety of different Slide Layouts.
A Slide Master is the top slide in a hierarchy of slides that stores information about the themeand Slide Layouts of a presentation, including the background, color, fonts, effects,placeholder sizes, and positioning.
You can incorporate two or more different styles or themes, such as backgrounds, colorschemes, fonts, and effects, by inserting an individual Slide Master into the template for eachdifferent theme.
Note: Additional information on Microsoft PowerPoint Slide Layouts is available in an articletitled What is a slide layout? on the Microsoft support site.
By default, the first Slide Layout in the first Slide Master is applied to slides on whichWebFOCUS data is displayed.
With this new feature, WebFOCUS enables the developer to select any Slide Layout in anySlide Master in a PowerPoint template (POTX/POTM) or Presentation file (PPTX/PPTM). OneSlide Layout may be applied to a slide or slides, displaying the output of a standard report,while one or different Slide Layouts may be applied to each Page Layout in a PPTX formattedCompound Document. The WebFOCUS generated ouput is placed on top of the styling on theselected Slide Layout.
Identifying Slide Master Attributes in PowerPoint
To identify Slide Masters and Slide Layouts in a template, open the file in the PowerPointapplication, select the Home tab, and click the Layout button on the ribbon.
9. Choosing a Display Format
Creating Reports With TIBCO® WebFOCUS Language 805

A context menu displays all Slide Layouts with labels, as shown in the following image.
To view the Slide Master, select the View tab, and in the Master Views group on the ribbon,click the Slide Master button, as shown in the following image.
Saving Report Output in PPTX Format
806

The Master View opens to show the Slide Master and its associated Slide Layouts, as shownin the following image.
9. Choosing a Display Format
Creating Reports With TIBCO® WebFOCUS Language 807
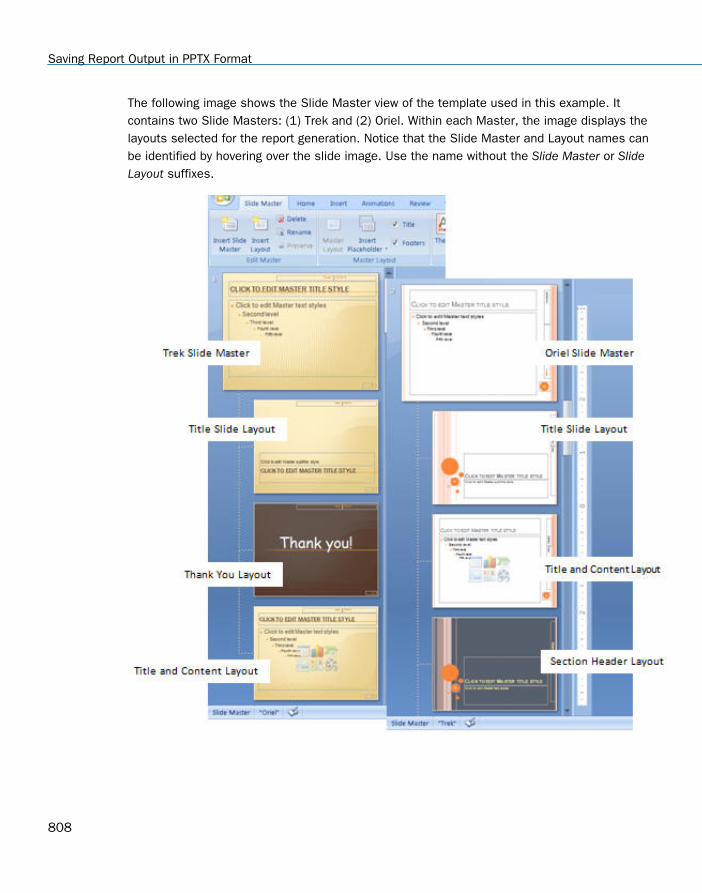
The following image shows the Slide Master view of the template used in this example. Itcontains two Slide Masters: (1) Trek and (2) Oriel. Within each Master, the image displays thelayouts selected for the report generation. Notice that the Slide Master and Layout names canbe identified by hovering over the slide image. Use the name without the Slide Master or SlideLayout suffixes.
Saving Report Output in PPTX Format
808

Syntax: How to Identify Slide Master Attributes in PowerPoint
For single reports:
TYPE=REPORT,SLIDE-MASTER='slidemaster_name',SLIDE-LAYOUT='layout_name', $
For Compound syntax:
PAGELAYOUT=n, NAME='Page layout (n)', SLIDE-MASTER='slidemaster_name', SLIDE-LAYOUT='layout_name', $
Note: Slide Masters and Slide Layouts can be defined on the Page Master within the Sectionsyntax or on any Page Layout.
Example: Compound Report Accessing Multiple Masters
The following syntax creates a full PPTX presentation based on a template with two SlideMasters and four individual Slide Layouts. Each of the five individual procedures (.fex) shownin this example need to be copied to a separate file.
COMPOUND LAYOUT PCHOLD FORMAT PPTXUNITS=IN, $SECTION=section1, LAYOUT=ON, SLIDE-MASTER='TREK',SLIDE-LAYOUT='Title and Content', MERGE=OFF, ORIENTATION=LANDSCAPE,PAGESIZE=PPT Slide, SHOW_GLOBALFILTER=OFF, $PAGELAYOUT=1, NAME='Page layout 1', SLIDE-MASTER='TREK',SLIDE-LAYOUT='Title Slide', text='Page layout 1', BOTTOMMARGIN=0.5, TOPMARGIN=0.5, $COMPONENT='ppt_template', $OBJECT=STRING, NAME='text1', TEXT='Gotham Grinds Sales Summary',POSITION=(1.083 3.117), MARKUP=OFF, WRAP=ON, DIMENSION=(6.799 0.620),font='TREBUCHET MS', color=RGB(0 0 0), size=36, $OBJECT=STRING, NAME='text2', TEXT='Profit By Category', POSITION=(1.100 3.733), MARKUP=OFF, WRAP=ON, DIMENSION=(6.833 0.500),font='TREBUCHET MS', color=RGB(0 0 0), size=18, $OBJECT=STRING, NAME='text3', TEXT='Prepared By:<br><br>Anne T Jones,EVP of Sales<br>Joe F Smith, VP of Sales<br><br>&DATEtrMDYY',POSITION=(5.683 5.433), MARKUP=ON, WRAP=ON, DIMENSION=(4.049 1.721),font='TREBUCHET MS', color=RGB(0 0 0), size=18, $PAGELAYOUT=2, NAME='Page layout 2', text='Page layout 2',BOTTOMMARGIN=0.025, TOPMARGIN=4.8, $
9. Choosing a Display Format
Creating Reports With TIBCO® WebFOCUS Language 809

OBJECT=STRING, NAME='pl2_text2', TEXT='Sales By Region',POSITION=(0.5 0.325), MARKUP=ON, WRAP=ON, DIMENSION=(4.146 0.609),font='TREBUCHET MS', color=RGB(0 0 0), style=bold, size=24, $OBJECT=STRING, NAME='pl2_text3', TEXT=' ', POSITION=(0.5 .725), MARKUP=ON,WRAP=ON, DIMENSION=(4.146 0.609), font='TREBUCHET MS', color=RGB(0 0 0),style=bold, size=20, $COMPONENT='report1', TEXT='report1', POSITION=(2.2 4.8), DIMENSION=(* *), $COMPONENT='chart1', TEXT='chart1', POSITION=(0.733 1.25),DIMENSION=(8.680 3.10), COMPONENT-TYPE=GRAPH, $PAGELAYOUT=5, NAME='Page layout 5', SLIDE-MASTER='ORIEL',SLIDE-LAYOUT='Section Header', text='Page layout 3',BOTTOMMARGIN=0.5, TOPMARGIN=0.5, $OBJECT=STRING, NAME='pl3text1', TEXT='Sales Performance Regional Breakdowns', POSITION=(1.0 3.35), MARKUP=OFF, WRAP=ON,DIMENSION=(6.799 0.620), font='TREBUCHET MS', color=RGB(0 0 0), size=24,$COMPONENT='DfltCmpt2_3', POSITION=(0 0), DIMENSION=(0 0), $PAGELAYOUT=6, NAME='Page layout 2', text='Page layout 4',SLIDE-MASTER='ORIEL', SLIDE-LAYOUT='Title and Content', BOTTOMMARGIN=0.025, TOPMARGIN=4.8, $OBJECT=STRING, NAME='pl4_text2', TEXT='Sales By Category',POSITION=(0.5 0.325), MARKUP=ON, WRAP=ON, DIMENSION=(4.146 0.609),font='TREBUCHET MS', color=RGB(0 0 0), style=bold, size=24, $OBJECT=STRING, NAME='pl4_text3', TEXT=' ', POSITION=(0.5 .725), MARKUP=ON,WRAP=ON, DIMENSION=(4.146 0.609), font='TREBUCHET MS', color=RGB(0 0 0),style=bold, size=20, $COMPONENT='report2_2', TEXT='report2', POSITION=(2.2 4.8),DIMENSION=(* *), $COMPONENT='chart2_2', TEXT='chart2', POSITION=(0.733 1.25),DIMENSION=(8.680 3.10), COMPONENT-TYPE=GRAPH, $COMPONENT='report2_3', TEXT='report3', POSITION=(0.5 .725),DIMENSION=(3 3), $PAGELAYOUT=9, NAME='Page layout 9', SLIDE-MASTER='TREK',SLIDE-LAYOUT='Thank You', text='Page layout 3',BOTTOMMARGIN=0.5, TOPMARGIN=0.5, $COMPONENT='DfltCmpt9', POSITION=(0 0), DIMENSION=(0 0), $END
SET COMPONENT='ppt_template'TABLE FILE SYSCOLUMSUM TBNAME NOPRINTIF READLIMIT EQ 1ON TABLE PCHOLD FORMAT PPTX TEMPLATE 'template_plus.potx' SLIDENUMBER 1END
Saving Report Output in PPTX Format
810

SET COMPONENT='report1'-INCLUDE GG_RPT1
SET COMPONENT='chart1'-INCLUDE GG_CHART1
SET COMPONENT='DfltCmpt2_3'TABLE FILE SYSCOLUM" "SUM TBNAME NOPRINTIF READLIMIT EQ 1ON TABLE SET PAGE-NUM NOLEADON TABLE PCHOLD FORMAT PPTXON TABLE SET STYLE *END
SET COMPONENT='report2_2'-INCLUDE GG_RPT2SET COMPONENT='chart2_2'-INCLUDE GG_CHART2SET COMPONENT='report2_3'-INCLUDE GG_RPT3
SET COMPONENT='DfltCmpt9'TABLE FILE SYSCOLUM" "SUM TBNAME NOPRINTIF READLIMIT EQ 1ON TABLE SET PAGE-NUM NOLEADON TABLE PCHOLD FORMAT PPTXON TABLE SET STYLE *END
COMPOUND END
-*gg_rpt1.fex TABLE FILE GGSALESSUM DOLLARS/D12CM BUDDOLLARS/D12CM UNITS/D12 BUDUNITS/D12BY REGION ON TABLE SET PAGE-NUM NOLEADON TABLE PCHOLD FORMAT PPTXON TABLE SET STYLE * INCLUDE = warm,$ENDSTYLEEND
9. Choosing a Display Format
Creating Reports With TIBCO® WebFOCUS Language 811

-*gg_rpt2.fex TABLE FILE GGSALESSUM DOLLARS/D12CM BUDDOLLARS/D12CM UNITS/D12 BUDUNITS/D12BY REGION NOPRINTBY CATEGORY ON REGION PAGE-BREAKON TABLE SET PAGE-NUM NOLEADON TABLE PCHOLD FORMAT PPTXON TABLE SET STYLE * INCLUDE = warm,$ENDSTYLEEND
-*gg_chart1.fex ENGINE INT CACHE SET ON-DEFAULTH &WF_STYLE_UNITS='INCHES';-DEFAULTH &WF_STYLE_HEIGHT='4.21875';-DEFAULTH &WF_STYLE_WIDTH='8.020833';-DEFAULTH &WF_TITLE='WebFOCUS Report';GRAPH FILE GGSALESSUM DOLLARS UNITSBY REGION NOPRINTON GRAPH PCHOLD FORMAT PPTXON GRAPH SET HTMLENCODE ONON GRAPH SET GRAPHDEFAULT OFFON GRAPH SET ARGRAPHENGIN JSCHARTON GRAPH SET VZERO OFFON GRAPH SET GRWIDTH 1ON GRAPH SET UNITS &WF_STYLE_UNITSON GRAPH SET HAXIS &WF_STYLE_WIDTHON GRAPH SET VAXIS &WF_STYLE_HEIGHTON GRAPH SET GRMERGE ADVANCEDON GRAPH SET GRMULTIGRAPH 0ON GRAPH SET GRLEGEND 1ON GRAPH SET GRXAXIS 0ON GRAPH SET LOOKGRAPH VBARON GRAPH SET STYLE **GRAPH_SCRIPTsetPieDepth(0);setPieTilt(0);setDepthRadius(0); setCurveFitEquationDisplay(false); setPlace(true); *END
Saving Report Output in PPTX Format
812

INCLUDE = warm,$TYPE=REPORT, TITLETEXT=&WF_TITLE.QUOTEDSTRING, $*GRAPH_SCRIPTsetReportParsingErrors(false);setSelectionEnableMove(false);setTransparentBorderColor(getChartBackground(),true);setTransparentFillColor(getFrameSide(),true);setTransparentBorderColor(getFrameSide(),true);setTransparentFillColor(getFrameBottom(),true);setTransparentBorderColor(getFrameBottom(),true);*GRAPH_SCRIPT-* Make the chart background, borders, etc. transparent:setTransparentFillColor(getChartBackground(),true);setFillColor(getChartBackground(),new Color(255,255,255,0));setTransparentBorderColor(getChartBackground(),true);setTransparentFillColor(getFrameSide(),true);setTransparentBorderColor(getFrameSide(),true);setTransparentFillColor(getFrameBottom(),true);setTransparentBorderColor(getFrameBottom(),true);setPlace(true);*ENDENDSTYLEEND-RUN
-*gg_chart2.fex -DEFAULTH &WF_STYLE_UNITS='INCHES';-DEFAULTH &WF_STYLE_HEIGHT='4.21875';-DEFAULTH &WF_STYLE_WIDTH='8.020833';-DEFAULTH &WF_TITLE='WebFOCUS Report';GRAPH FILE GGSALESSUM DOLLARS UNITSBY REGION NOPRINTBY CATEGORYON GRAPH PCHOLD FORMAT PPTXON GRAPH SET HTMLENCODE ONON GRAPH SET GRAPHDEFAULT OFFON GRAPH SET ARGRAPHENGIN JSCHARTON GRAPH SET VZERO OFFON GRAPH SET GRWIDTH 1ON GRAPH SET UNITS &WF_STYLE_UNITSON GRAPH SET HAXIS &WF_STYLE_WIDTHON GRAPH SET VAXIS &WF_STYLE_HEIGHTON GRAPH SET GRMERGE ADVANCEDON GRAPH SET GRMULTIGRAPH 1ON GRAPH SET GRLEGEND 1ON GRAPH SET GRXAXIS 0ON GRAPH SET LOOKGRAPH VBARON GRAPH SET STYLE *
9. Choosing a Display Format
Creating Reports With TIBCO® WebFOCUS Language 813

*GRAPH_SCRIPTsetPieDepth(0);setPieTilt(0);setDepthRadius(0); setCurveFitEquationDisplay(false); setPlace(true); *ENDINCLUDE = warm,$TYPE=REPORT, TITLETEXT=&WF_TITLE.QUOTEDSTRING, $*GRAPH_SCRIPTsetReportParsingErrors(false);setSelectionEnableMove(false);setTransparentBorderColor(getChartBackground(),true);setTransparentFillColor(getFrameSide(),true);setTransparentBorderColor(getFrameSide(),true);setTransparentFillColor(getFrameBottom(),true);setTransparentBorderColor(getFrameBottom(),true);*GRAPH_SCRIPT-* Make the chart background, borders, etc. transparent:setTransparentFillColor(getChartBackground(),true);setFillColor(getChartBackground(),new Color(255,255,255,0));setTransparentBorderColor(getChartBackground(),true);setTransparentFillColor(getFrameSide(),true);setTransparentBorderColor(getFrameSide(),true);setTransparentFillColor(getFrameBottom(),true);setTransparentBorderColor(getFrameBottom(),true);setPlace(true);*ENDENDSTYLEEND-RUN
-*gg_rpt3.fexTABLE FILE GGSALESBY REGION PAGE-BREAK NOPRINTHEADING"<REGION"ON TABLE SET PAGE-NUM NOLEADON TABLE PCHOLD FORMAT PPTXON TABLE SET STYLE * INCLUDE = warm,$TYPE=HEADING, SIZE=20,$ENDSTYLEEND
Saving Report Output in PPTX Format
814

The output is:
9. Choosing a Display Format
Creating Reports With TIBCO® WebFOCUS Language 815

Merging WebFOCUS Content With PowerPoint Template Content
Using the TEMPLATE-ACTION Stylesheet attribute, you can merge WebFOCUS content withPowerPoint template content. The MERGE action allows you to edit components, such ascomments in native PowerPoint text boxes, in the resulting PowerPoint PPTX output.
Syntax: How to Merge WebFOCUS Content With PowerPoint Template Content
To merge WebFOCUS content with PowerPoint template content, include the followingStyleSheet syntax in your procedure.
TYPE=REPORT, TEMPLATE-ACTION=MERGE ,$
Note: You can include the TEMPLATE-ACTION=REPLACE StyleSheet attribute to retain thedefault behavior, which causes WebFOCUS output to override all target slide content.
Example: Merging WebFOCUS Content With PowerPoint Template Content
The following example shows how to merge WebFOCUS content with the PowerPoint templatecontent shown in the image below. The name of the PowerPoint template is my_template.potx.
Saving Report Output in PPTX Format
816

Merge Procedure
The following procedure includes the TEMPLATE-ACTION=MERGE StyleSheet attribute to mergeWebFOCUS content with PowerPoint template content, my_template.potx.
TABLE FILE GGSALESHEADING CENTER"Sales for Region: <REGION"SUM DOLLARSBY REGION NOPRINT PAGE-BREAKBY CATEGORYBY PRODUCT
ON TABLE HOLD AS MERGEPPTX FORMAT PPTX TEMPLATE 'my_template.potx' SLIDENUMBER 2
ON TABLE SET STYLE *TYPE=REPORT, PAGESIZE=PPT-SLIDE, ORIENTATION=LANDSCAPE, TEMPLATE-ACTION=MERGE, LEFTMARGIN=2.75, TOPMARGIN=.75, BOTTOMMARGIN=1.5, FONT=ARIAL, SQUEEZE=ON, BORDER=LIGHT, STYPE=BOLD, SIZE=16, $ENDSTYLE
END
The output is:
9. Choosing a Display Format
Creating Reports With TIBCO® WebFOCUS Language 817

Example: Overriding Target Slide Content
The following procedure includes the TEMPLATE-ACTION=REPLACE StyleSheet attribute toretain the default behavior and override all target slide content.
TABLE FILE GGSALESHEADING CENTER"Sales for Region: <REGION"SUM DOLLARSBY REGION NOPRINT PAGE-BREAKBY CATEGORYBY PRODUCT
ON TABLE HOLD AS REPLACEPPTX FORMAT PPTX TEMPLATE 'my_template.potx' SLIDENUMBER 2ON TABLE SET STYLE *TYPE=REPORT, PAGESIZE=PPT-SLIDE, ORIENTATION=LANDSCAPE, TEMPLATE-ACTION=REPLACE, LEFTMARGIN=2.75, TOPMARGIN=.75, BOTTOMMARGIN=1.5, FONT=ARIAL, SQUEEZE=ON, BORDER=LIGHT, STYPE=BOLD, SIZE=16, $ENDSTYLE
END
The output is:
Saving Report Output in PPTX Format
818

ReportCaster Distribution and ReportCaster Bursting
ReportCaster Distribution is supported for simple reports, reports with images, PPTXTemplates, Coordinated Compound Reports, and graphs. Bursting is supported for simplereports, reports with images, PPTX Templates, and Coordinated Compound Reports. For moreinformation, see the TIBCO WebFOCUS® ReportCaster manual.
PPTX Limitations
The following is a limitation when using PPTX output format:
Justification of images in report elements.
In Compound syntax, the following are limitations when using PPTX output format:
Paneled reports.
Nested syntax.
Multi-pane reports or reports with multiple columns.
OPEN, CLOSE, or NOBREAK command.
Related Information
For related information on these topics, see the following WebFOCUS manuals:
Describing Data With WebFOCUS Language
Developing Reporting Applications
Using Functions
ReportCaster
9. Choosing a Display Format
Creating Reports With TIBCO® WebFOCUS Language 819

Saving Report Output in PPTX Format
820

Chapter10Linking a Report to Other Resources
You can use StyleSheet declarations to define links from any report component. You canuse links to:
Create a series of drill-down reports by linking the procedures that generate thesereports.
Link to URLs. These can be other webpages, websites, Servlet programs, or non-World Wide Web resources, such as an email application.
Execute JavaScript functions to perform additional analysis of the report data.
You can create links from report data as well as graphical images within a report. Youcan also create links from a graph. For details on linking from a graph, see Creating aGraph on page 1745.
In this chapter:
Linking Using StyleSheets
Linking to Another Report
Linking to a URL
Linking to a JavaScript Function
Linking to a Maintain Data Procedure
Multi-Drill Feature With Cascading Menusand User-Defined Styling
Creating Parameters
Linking With Conditions
Linking From a Graphic Image
Specifying a Base URL
Specifying a Target Frame
Creating a Compound Report
Creating a PDF Compound Report WithDrill Through Links
Linking Using StyleSheets
You can use StyleSheets to define a link from any report component. You can create links fromreport data (including headings and footings) as well as graphic images (such as a companylogo or product image), to other reports, procedures, URLs, or JavaScript functions.
Creating Reports With TIBCO® WebFOCUS Language 821
The links you create can be dynamic. With a dynamic link, your selection passes the value ofthe selected report component to the linked report (procedure, URL, or JavaScript function).The resource uses the passed value to dynamically determine the results that are returned.You can pass one or more parameters. For details, see Creating Parameters on page 856.
Procedure: How to Create Links Using StyleSheets
This procedure is a basic overview of how to create links using StyleSheets.
1. Identify the report component that the user selects in the web browser to execute the link.
2. Specify the name of the embedded procedure, URL, or JavaScript function to execute.
3. Identify the parameters that define the specifics of your link, if necessary.
Linking to Another Report
A link allows you to drill down to a report for more details or execute a procedure by selecting adesignated hot spot (the link) in the report. By linking reports you provide easy access to moredetailed data that supplements the information in your base report. The drill-down report cancontain information that is either independent of the data in the base report or depends andexpands on a specific data value in the base report.
To create a link, you must have a report to link from (the base report) and a report to link to(the drill-down report). If the drill-down report depends on a specific data value in the basereport, you also need to pass that value to the drill-down report by creating parameters. Fordetails, see Creating Parameters on page 856.
Syntax: How to Link to Reports and Procedures
TYPE=type, [subtype], FOCEXEC=fex[(parameters ...)], [TARGET=frame,] [ALT = 'description',] $
where:
typeIdentifies the report component that you select in the web browser to execute the link.The TYPE attribute and its value must appear at the beginning of the declaration.
subtypeAre any additional attributes, such as COLUMN, LINE, or ITEM, that are needed toidentify the report component that you are formatting. For information on identifyingreport components, see Identifying a Report Component in a WebFOCUS StyleSheet onpage 1251.
Linking to Another Report
822

fexIdentifies the file name of the linked procedure to run when you select the reportcomponent.
Note: The procedure cannot be named NONE (all uppercase). Using NONE as theprocedure name will result in a syntax error. Mixed or lowercase is allowed.
To determine the file name in WebFOCUS, see How to Determine a WebFOCUS File Nameon page 824.
The maximum length of a FOCEXEC=fex argument, including any associated parameters, is2400 characters. The FOCEXEC argument can span more than one line, as described in Creating and Managing a WebFOCUS StyleSheet on page 1199.
parametersValues that are passed to the report, URL, or JavaScript function. For details, see Creating Parameters on page 856.
frameIdentifies the target frame in the webpage in which the output from the drill-down linkis displayed. For details, see Specifying a Target Frame on page 875.
descriptionIs a textual description of the link supported in an HTML report for compliance withSection 508 accessibility. Enclose the description in single quotation marks.
The description also displays as a pop-up description when your mouse or cursor hoversover the link in the report output.
Reference: Usage Notes for Drilldown Reports in PDF Format
When going back to the original report from a drilldown report in PDF format, you must click theBack button twice quickly. The alternative is to use the drop-down list presented to the right ofthe Back button to view the browser history and select the link two steps back. The first historyitem will point to the redirection page and be titled based on the method used to access theWFServlet. The previous item will be titled WebFOCUS Report and will point back to the originalPDF report.
10. Linking a Report to Other Resources
Creating Reports With TIBCO® WebFOCUS Language 823

Procedure: How to Determine a WebFOCUS File Name
1. Right-click the report name and select Properties. The Report Properties dialog box opens.
2. The file name appears under Name. In the example below, the name of the file is"salesrep". Do not include the file extension (.fex) or the directory location and slash (/).
Example: Linking to a Report From a Footing
The following report request summarizes product sales and sorts the data by region, state,and store code. The store code also displays in the subfootings where links to detailed reportsabout the store's sales (by product or by date) display. Each line of the subfoot contains twotext objects and one embedded field. The relevant StyleSheet declarations are highlighted inthe request.
Linking to Another Report
824

The main report is:
TABLE FILE GGSALESHEADING"Sales Report"SUM DOLLARS/I08MBY REGION BY ST BY STCDON STCD SUBFOOT"View Store <STCD Sales By Product"" ""View Store <STCD Sales By Date"ON REGION PAGE-BREAKON TABLE SET PAGE-NUM OFFON TABLE SET STYLE *TYPE=HEADING, SIZE=12, STYLE=BOLD, $ TYPE=SUBFOOT, LINE=1, OBJECT=TEXT, ITEM=2, COLOR=GREEN, FOCEXEC=PRDSALES(STOREID=STCD), $TYPE=SUBFOOT, LINE=3, OBJECT=TEXT, ITEM=2, COLOR=BLUE, FOCEXEC=HSTSALES(STOREID=STCD), $ ENDSTYLEEND
Using StyleSheet declarations, the subfoot phrase Sales By Product links to a secondprocedure named PRDSALES and passes it the value of STCD displayed in the subfoot. Thesubfoot phrase Sales By Date links to a procedure named HSTSALES and passes it the valueof STCD displayed in the subfoot.
The request for the linked report HSTSALES is:
TABLE FILE GGSALESSUM UNITSBY STCDBY DATEWHERE STCD = '&STOREID'ON TABLE SET PAGE-NUM OFFON TABLE SET STYLE *TYPE=REPORT, GRID=OFF, $ENDSTYLEEND
The request for the linked report PRDSALES is:
TABLE FILE GGSALESSUM UNITSBY STCDBY PRODUCTWHERE STCD = '&STOREID'ON TABLE SET PAGE-NUM OFFON TABLE SET STYLE *TYPE=REPORT, GRID=OFF, $ENDSTYLEEND
10. Linking a Report to Other Resources
Creating Reports With TIBCO® WebFOCUS Language 825
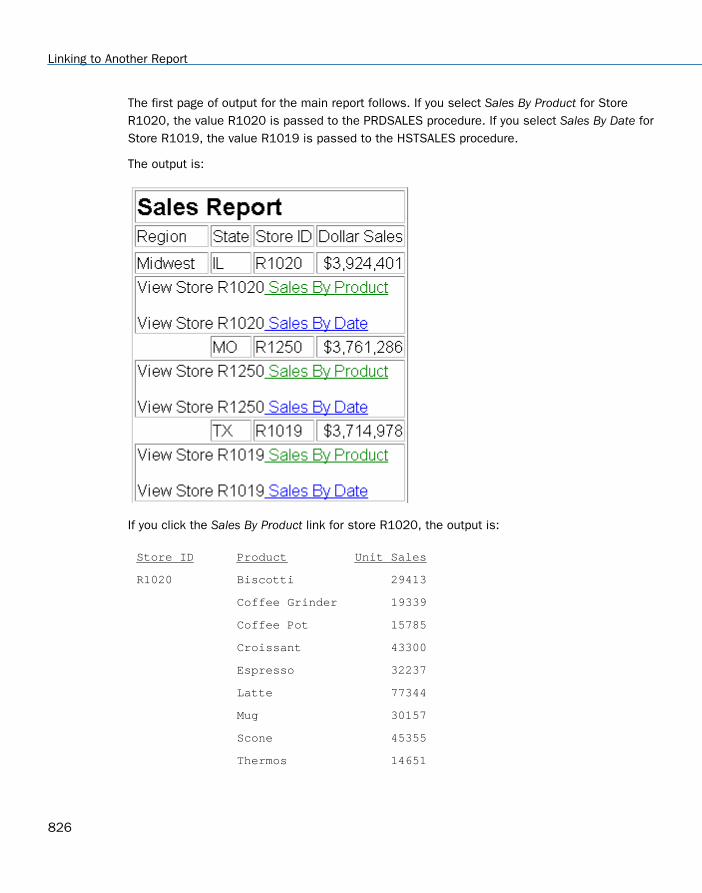
The first page of output for the main report follows. If you select Sales By Product for StoreR1020, the value R1020 is passed to the PRDSALES procedure. If you select Sales By Date forStore R1019, the value R1019 is passed to the HSTSALES procedure.
The output is:
If you click the Sales By Product link for store R1020, the output is:
Store ID Product Unit Sales
R1020 Biscotti 29413
Coffee Grinder 19339
Coffee Pot 15785
Croissant 43300
Espresso 32237
Latte 77344
Mug 30157
Scone 45355
Thermos 14651
Linking to Another Report
826

Linking to a URL
You can define a link from any report component to any URL including webpages, websites,Servlet programs, or non-World Wide Web resources, such as an email application. After youhave defined a link, you can select the report component to access the URL.
The links you create can be dynamic. With a dynamic link, your selection passes the value ofthe selected report component to the URL. The resource uses the passed value to dynamicallydetermine the results that are returned. You can pass one or more parameters. For details,see Creating Parameters on page 856.
Syntax: How to Link to a URL
TYPE=type, [subtype], URL=url[(parameters ...)], [TARGET=frame,] [ALT = 'description',] $
where:
typeIdentifies the report component that you select in the web browser to execute the link.The TYPE attribute and its value must appear at the beginning of the declaration.
subtypeAre any additional attributes, such as COLUMN, LINE, or ITEM, that are needed toidentify the report component that you are formatting. For information on identifyingreport components, see Identifying a Report Component in a WebFOCUS StyleSheet onpage 1251.
urlIdentifies any valid URL, including a URL that specifies a WebFOCUS Servlet program,or the name of a report column enclosed in parentheses whose value is a valid URL towhich the link will jump.
Note:
The maximum length of a URL=url argument, including any associated variable=objectparameters, is limited by the maximum number of characters allowed by the browser.For information about this limit for your browser, search on your browser vendor'ssupport site. The URL argument can span more than one line, as described in Creatingand Managing a WebFOCUS StyleSheet on page 1199.
Note that the length of the URL is limited by the maximum number of charactersallowed by the browser. For information about this limit for your browser, search on yourbrowser vendor’s support site.
10. Linking a Report to Other Resources
Creating Reports With TIBCO® WebFOCUS Language 827

If the URL refers to a WebFOCUS Servlet program that takes parameters, the URL mustend with a question mark (?).
parametersValues that are passed to the URL. For details, see Creating Parameters on page856.
frameIdentifies the target frame in the webpage in which the output from the drill-down linkis displayed. For details, see Specifying a Target Frame on page 875.
descriptionIs a textual description of the link supported in an HTML report for compliance withSection 508 accessibility. Enclose the description in single quotation marks.
The description also displays as a pop-up description when your mouse or cursor hoversover the link in the report output.
Example: Linking to a URL
The following example illustrates how to link to a URL from a report. The heading Click here toaccess the IB homepage is linked to the URL www.ibi.com. The relevant StyleSheet declarationsare highlighted in the request.
Note that webserver indicates the name of the webserver that runs WebFOCUS.
TABLE FILE GGSALESON TABLE SET PAGE-NUM OFFSUM UNITS AND DOLLARSBY CATEGORY BY REGIONHEADING"Regional Sales Report""Click here to access the IB homepage."" "ON TABLE SET STYLE *TYPE=REPORT, GRID=OFF, $ TYPE=HEADING, LINE=2, OBJECT=TEXT, ITEM=1, URL=http://www.ibi.com, $ ENDSTYLEEND
Linking to a URL
828

The output is:
When you click the link the site displays in your browser.
Example: Linking to a URL to Run a Drilldown WebFOCUS Server Procedure
The following request is initiated from a browser session and runs a drill down report stored onthe WebFOCUS Reporting Server.
This procedure is run from a browser, so the drilldown in the example is specified as a relativeURL (it does not have protocol, host, or port) because it will be submitted using the protocol,host, and port of the current browser session.
Note: This technique is useful in a Managed Reporting procedure for creating a drill down to aWebFOCUS Server procedure. The FOCEXEC= technique for running a drill down proceduredoes not work because Managed Reporting always looks for the procedure in the ManagedReporting repository.
10. Linking a Report to Other Resources
Creating Reports With TIBCO® WebFOCUS Language 829

The main procedure is:
TABLE FILE GGSALESON TABLE SET PAGE-NUM OFFSUM UNITS AND DOLLARSBY CATEGORY BY REGIONHEADING"Regional Sales Report"" "ON TABLE SET STYLE *TYPE=REPORT, GRID=OFF, $TYPE=DATA, COLUMN=REGION,URL=/ibi_apps/WFServlet?(IBIF_ex='ggdrill' AREA=REGION IBIC_server='EDASERVE' IBI_APPS='IBISAMP'),$ENDSTYLEEND
The drilldown report, which must be in application ibisamp, is:
-DEFAULTS ®ION='$*';TABLE FILE GGSALESON TABLE SET PAGE-NUM OFFSUM UNITS AND DOLLARSBY PRODUCTWHERE REGION = '&AREA'HEADING"Sales Report for Region &AREA"" "ON TABLE SET STYLE *TYPE=REPORT, GRID=OFF, $ENDSTYLEEND
Linking to a URL
830

The output of the main report is:
10. Linking a Report to Other Resources
Creating Reports With TIBCO® WebFOCUS Language 831
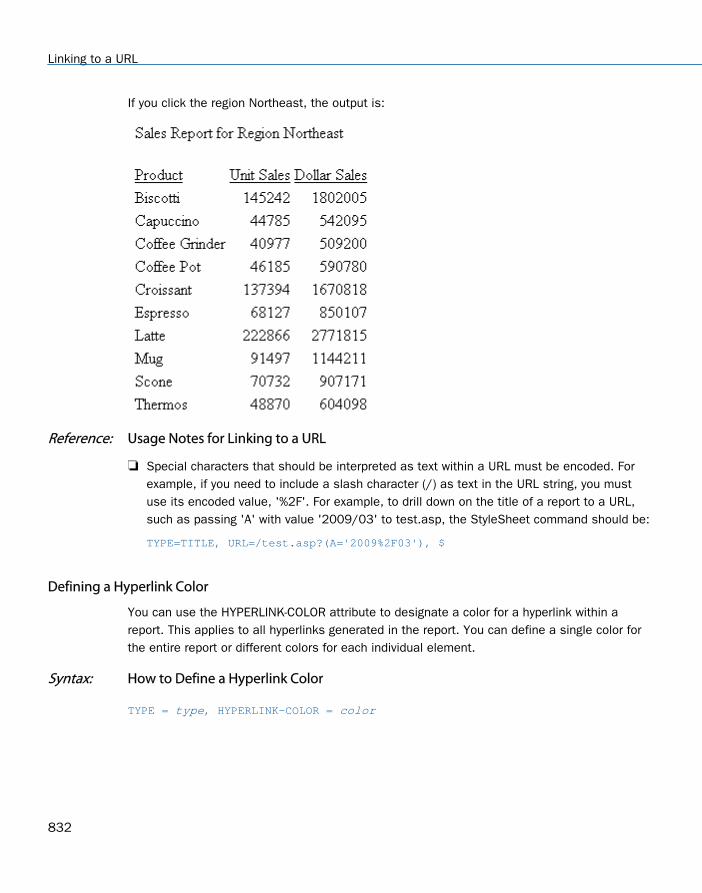
If you click the region Northeast, the output is:
Reference: Usage Notes for Linking to a URL
Special characters that should be interpreted as text within a URL must be encoded. Forexample, if you need to include a slash character (/) as text in the URL string, you mustuse its encoded value, '%2F'. For example, to drill down on the title of a report to a URL,such as passing 'A' with value '2009/03' to test.asp, the StyleSheet command should be:
TYPE=TITLE, URL=/test.asp?(A='2009%2F03'), $
Defining a Hyperlink Color
You can use the HYPERLINK-COLOR attribute to designate a color for a hyperlink within areport. This applies to all hyperlinks generated in the report. You can define a single color forthe entire report or different colors for each individual element.
Syntax: How to Define a Hyperlink Color
TYPE = type, HYPERLINK-COLOR = color
Linking to a URL
832

where:
type
Is the report component you wish to affect. You can apply this keyword to the entire reportusing TYPE=REPORT. The attribute can also individually be set for any other element of thereport. For details, see Identifying a Report Component in a WebFOCUS StyleSheet on page1251.
color
Can use any style sheet supported color value designation. For available color values thatcan be utilized with the syntax, see Color Values in a Report on page 1703.
Example: Defining a Hyperlink Color
The following PDF request illustrates how to define hyperlink colors for the entire report, aswell as individual elements.
The default font color for the entire report is grey and the default hyperlink color for theentire report is slate blue.
For the Dollar Sales column (DOLLARS), the font color is green and the hyperlink color ispurple.
For both the Dollar Sales column (DOLLARS) and the Unit Sales column (UNITS),conditional styling has been applied using the same condition (REGION GE 'O').
For the Unit Sales column (UNITS), when the conditional styling is met, the hyperlink coloris inherited from the default hyperlink color for the report (slate blue).
For the Dollar Sales column (DOLLARS), when the conditional styling is met, the hyperlinkcolor is purple.
10. Linking a Report to Other Resources
Creating Reports With TIBCO® WebFOCUS Language 833
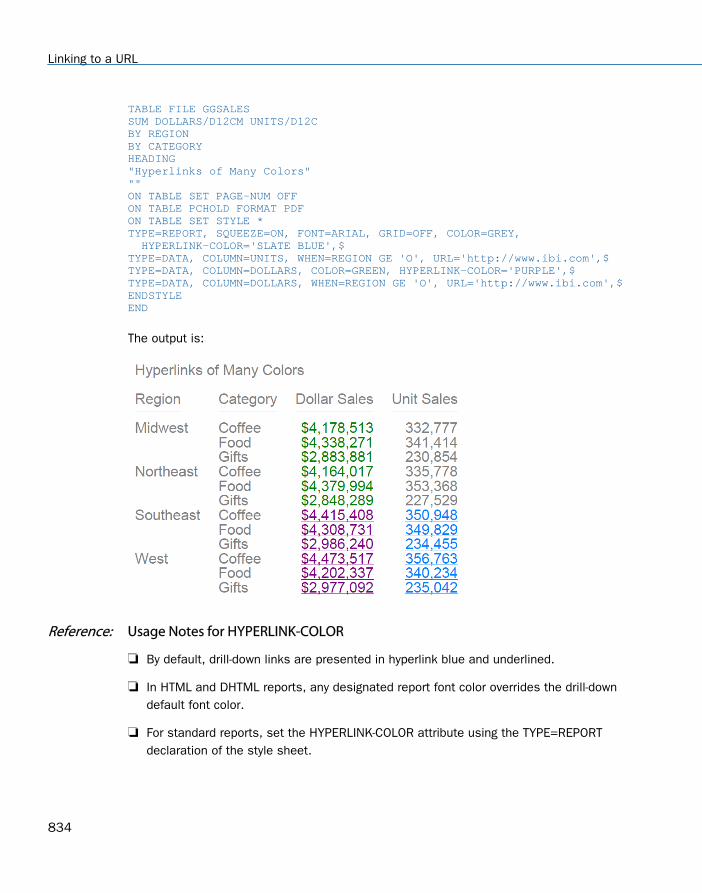
TABLE FILE GGSALESSUM DOLLARS/D12CM UNITS/D12CBY REGIONBY CATEGORYHEADING"Hyperlinks of Many Colors"""ON TABLE SET PAGE-NUM OFFON TABLE PCHOLD FORMAT PDFON TABLE SET STYLE *TYPE=REPORT, SQUEEZE=ON, FONT=ARIAL, GRID=OFF, COLOR=GREY, HYPERLINK-COLOR='SLATE BLUE',$TYPE=DATA, COLUMN=UNITS, WHEN=REGION GE 'O', URL='http://www.ibi.com',$TYPE=DATA, COLUMN=DOLLARS, COLOR=GREEN, HYPERLINK-COLOR='PURPLE',$TYPE=DATA, COLUMN=DOLLARS, WHEN=REGION GE 'O', URL='http://www.ibi.com',$ENDSTYLEEND
The output is:
Reference: Usage Notes for HYPERLINK-COLOR
By default, drill-down links are presented in hyperlink blue and underlined.
In HTML and DHTML reports, any designated report font color overrides the drill-downdefault font color.
For standard reports, set the HYPERLINK-COLOR attribute using the TYPE=REPORTdeclaration of the style sheet.
Linking to a URL
834

For compound reports, set the HYPERLINK-COLOR attribute using the TYPE=REPORTdeclaration of the style sheet of the first component report (excluding anything on the PageMaster).
For PPTX, the hyperlink color is stored as part of the PPTX Slide Master theme. Only oneHYPERLINK-COLOR attribute can be defined for each request (report/compound report).
Linking to a JavaScript Function
You can use a StyleSheet to define a link to a JavaScript function from any report component.After you have defined the link, you can select the report component to execute the JavaScriptfunction.
Just as with drill-down links to procedures and URLs, you can specify optional parameters thatallow values of a report component to be passed to the JavaScript function. The function willuse the passed value to dynamically determine the results that are returned to the browser.For details, see Creating Parameters on page 856.
Note:
JavaScript functions can, in turn, call other JavaScript functions.
You cannot specify a target frame if you are executing a JavaScript function. However, theJavaScript function itself can specify a target frame for its results.
Syntax: How to Link to a JavaScript Function
TYPE=type, [subtype], JAVASCRIPT=function[(parameters ...)], $
where:
typeIdentifies the report component that you select in the web browser to execute the link.The TYPE attribute and its value must appear at the beginning of the declaration.
subtypeAre any additional attributes, such as COLUMN, LINE, or ITEM, that are needed toidentify the report component that you are formatting. See Identifying a ReportComponent in a WebFOCUS StyleSheet on page 1251 for details.
functionIdentifies the JavaScript function to run when you select the report component.
10. Linking a Report to Other Resources
Creating Reports With TIBCO® WebFOCUS Language 835

The maximum length of a JAVASCRIPT=function argument, including any associatedparameters, is 2400 characters and can span more than one line. If you split a singleargument across a line, you need to use the \ character at the end of the first line, ascontinuation syntax. If you split an argument at a point where a space is required as adelimiter, the space must be before the \ character or be the first character on the nextline. The \ character does not act as the delimiter.
In this example,
JAVASCRIPT=myfunc(COUNTRY \CAR MODEL 'ABC'),$
the argument correctly spans two lines.
Note:
You can use the Dialogue Manager -HTMLFORM command to embed the report into anHTML document in which the function is defined.
When you have an HTML document called by -HTMLFORM, ensure that the fileextension is .HTM (not .HTML).
For more information about the -HTMLFORM command, see the TIBCO WebFOCUS®
Developing Reporting Applications manual.
parametersValues that are passed to the JavaScript function. For details, see CreatingParameters on page 856.
Example: Linking to a JavaScript Function
The following displays the report and StyleSheet syntax used to link to a JavaScript function. Italso shows the JavaScript function that is executed, and the result that is displayed in thebrowser.
The report request (which contains the inline StyleSheet) is:
Linking to a JavaScript Function
836
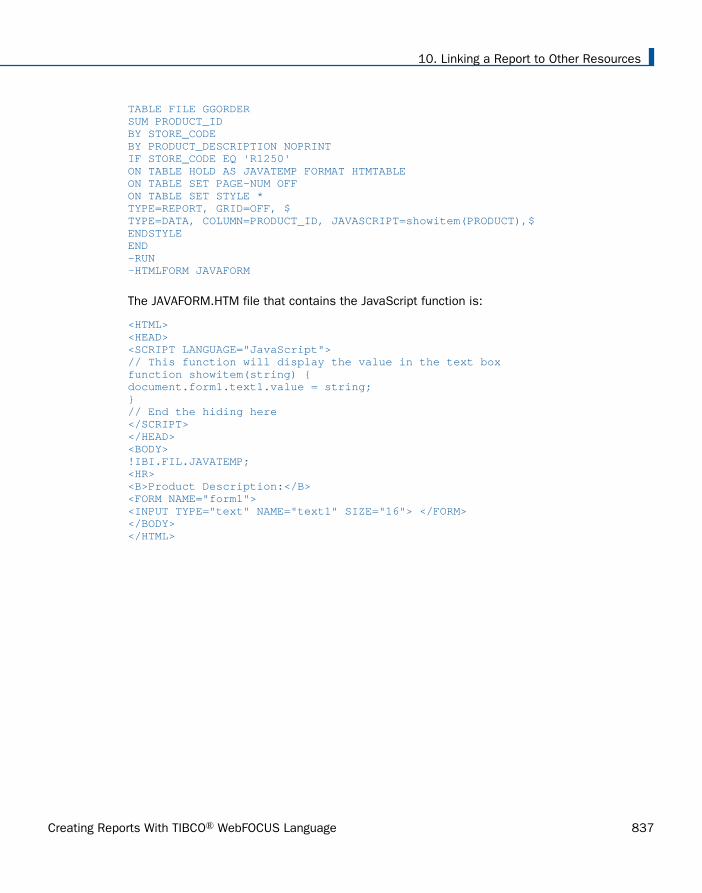
TABLE FILE GGORDERSUM PRODUCT_IDBY STORE_CODEBY PRODUCT_DESCRIPTION NOPRINTIF STORE_CODE EQ 'R1250'ON TABLE HOLD AS JAVATEMP FORMAT HTMTABLEON TABLE SET PAGE-NUM OFFON TABLE SET STYLE *TYPE=REPORT, GRID=OFF, $TYPE=DATA, COLUMN=PRODUCT_ID, JAVASCRIPT=showitem(PRODUCT),$ENDSTYLEEND-RUN-HTMLFORM JAVAFORM
The JAVAFORM.HTM file that contains the JavaScript function is:
<HTML><HEAD><SCRIPT LANGUAGE="JavaScript">// This function will display the value in the text boxfunction showitem(string) {document.form1.text1.value = string;}// End the hiding here</SCRIPT></HEAD><BODY>!IBI.FIL.JAVATEMP;<HR><B>Product Description:</B><FORM NAME="form1"><INPUT TYPE="text" NAME="text1" SIZE="16"> </FORM></BODY></HTML>
10. Linking a Report to Other Resources
Creating Reports With TIBCO® WebFOCUS Language 837
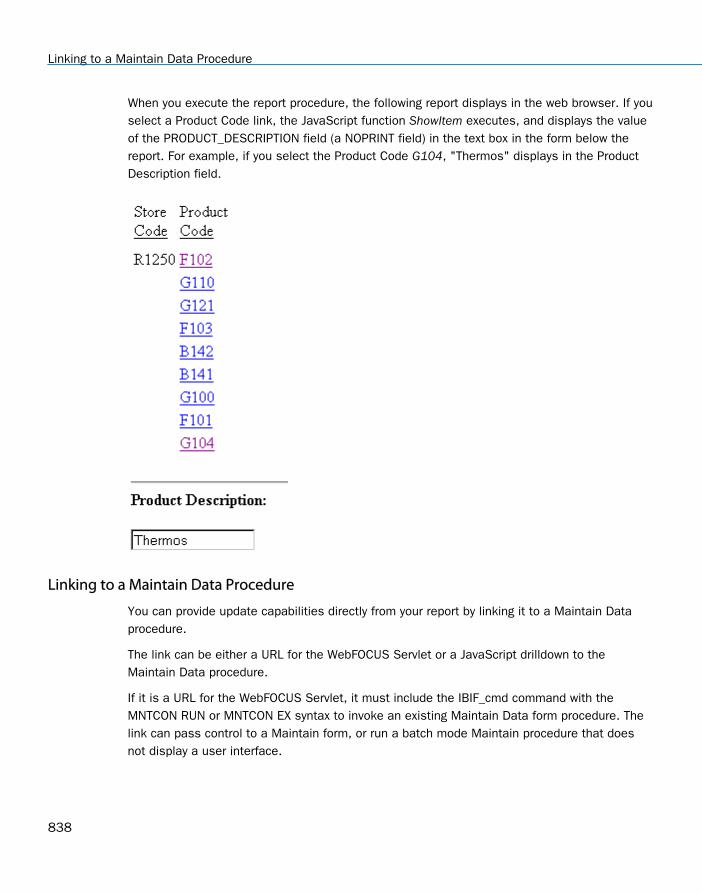
When you execute the report procedure, the following report displays in the web browser. If youselect a Product Code link, the JavaScript function ShowItem executes, and displays the valueof the PRODUCT_DESCRIPTION field (a NOPRINT field) in the text box in the form below thereport. For example, if you select the Product Code G104, "Thermos" displays in the ProductDescription field.
Linking to a Maintain Data Procedure
You can provide update capabilities directly from your report by linking it to a Maintain Dataprocedure.
The link can be either a URL for the WebFOCUS Servlet or a JavaScript drilldown to theMaintain Data procedure.
If it is a URL for the WebFOCUS Servlet, it must include the IBIF_cmd command with theMNTCON RUN or MNTCON EX syntax to invoke an existing Maintain Data form procedure. Thelink can pass control to a Maintain form, or run a batch mode Maintain procedure that doesnot display a user interface.
Linking to a Maintain Data Procedure
838

If it is a JavaScript drilldown, it uses the parent.IbComposer_drillMntdata function.
Syntax: How to Link to a Maintain Data Procedure Using a URL
TYPE=type, [subtype, ] URL=/ibi_apps/WFServlet? IBIF_cmd='MNTCON {RUN|EX} procname' IBIS_passthru='on' IBIS_connect='on' [(parameters...)], $
where:
typeIdentifies the report component that you select in the web browser to execute the link.The TYPE attribute and its value must appear at the beginning of the declaration.
subtypeAre any additional attributes, such as COLUMN, LINE, or ITEM, that are needed toidentify the report component that you are formatting. See Identifying a ReportComponent in a WebFOCUS StyleSheet on page 1251 for information on identifyingreport components.
procnameIs the name of the Maintain Data procedure.
parametersValues that are passed to the Maintain Data procedure. For details, see CreatingParameters on page 856.
Example: Linking to a Maintain Data Procedure
The following report allows you to update the unit price for a product directly from the reportoutput by linking the report to the appropriate Maintain procedure.
The report request is:
TABLE FILE GGPRODSPRINT PRODUCT_DESCRIPTION VENDOR_CODE VENDOR_NAME UNIT_PRICE BY PRODUCT_IDON TABLE SET PAGE-NUM OFFON TABLE SET STYLE *TYPE=REPORT, GRID=OFF, $TYPE=DATA, COLUMN=N1, URL=/ibi_apps/WFServlet?(PRODUCT_ID=N1 IBIF_cmd='MNTCON RUN GGUPD1' IBIS_passthru=\ 'on' IBIS_connect='on'), $ENDSTYLEEND
The Maintain Data procedure (ggupd1) is:
10. Linking a Report to Other Resources
Creating Reports With TIBCO® WebFOCUS Language 839

MAINTAIN FILE ggprodsmodule import(mntuws FOCCOMP)$$DeclarationsDeclare pcode/a4;Case Topcompute timechk/a0=HHMMSS();document.referer='/ibi_apps/WFServlet?IBIF_ex=ggprod&IBIS_connect=on'||'&timechk='|timechk;compute pcode = IWC.getAppCGIValue("PRODUCT_ID");Infer ggprods.prods01.product_id into ggstk1;Reposition PRODUCT_IDStack clear ggstk1 ;For all next ggprods.prods01.product_id into ggstk1 where product_id eq pcode;Winform Show Form1;EndCaseCase Updte1for all Update ggprods.prods01.unit_price from ggstk1(1) ;EndCaseEND
Note: This is an interactive form to display data and is created in App Studio.
The report is:
When you click a Product Code, the Maintain procedure ggupd1 is invoked, which uses theIWC.getAppCGIValue function to retrieve the correct value.
Linking to a Maintain Data Procedure
840

Form 1 in the Maintain Data procedure ggupd1 opens and you can update the unit price forthat product:
Syntax: How to Link to a Maintain Data Procedure Using a JavaScript Drilldown
TYPE=DATA, DRILLMENUITEM='DrillDown 1', JAVASCRIPT=parent.IbComposer_drillMntdata( \ 'Request2' \ 'mntcase' \ 'stack_field' \ rptcol \ ), TARGET='_parent',$
where:
'DrillDown 1'
Is the text that displays for the drilldown link.
'Request2'
Is the name of the Maintain Data procedure.
'mntcase'
Is the name of the Maintain case.
'stack_field'
Is the stack and stack field associated with the report column.
10. Linking a Report to Other Resources
Creating Reports With TIBCO® WebFOCUS Language 841
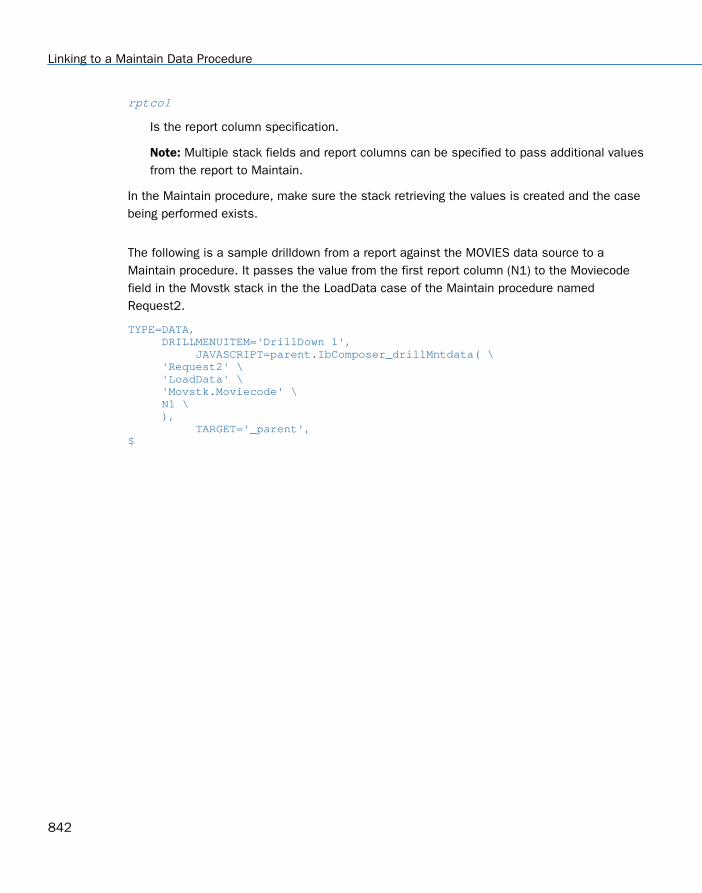
rptcol
Is the report column specification.
Note: Multiple stack fields and report columns can be specified to pass additional valuesfrom the report to Maintain.
In the Maintain procedure, make sure the stack retrieving the values is created and the casebeing performed exists.
The following is a sample drilldown from a report against the MOVIES data source to aMaintain procedure. It passes the value from the first report column (N1) to the Moviecodefield in the Movstk stack in the the LoadData case of the Maintain procedure namedRequest2.
TYPE=DATA, DRILLMENUITEM='DrillDown 1', JAVASCRIPT=parent.IbComposer_drillMntdata( \ 'Request2' \ 'LoadData' \ 'Movstk.Moviecode' \ N1 \ ), TARGET='_parent',$
Linking to a Maintain Data Procedure
842
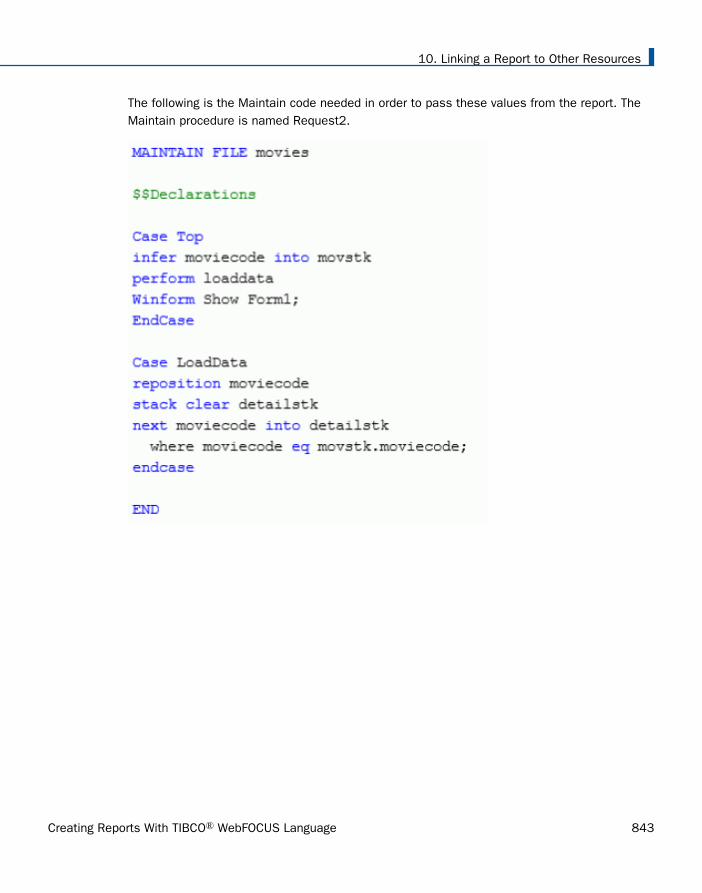
The following is the Maintain code needed in order to pass these values from the report. TheMaintain procedure is named Request2.
10. Linking a Report to Other Resources
Creating Reports With TIBCO® WebFOCUS Language 843
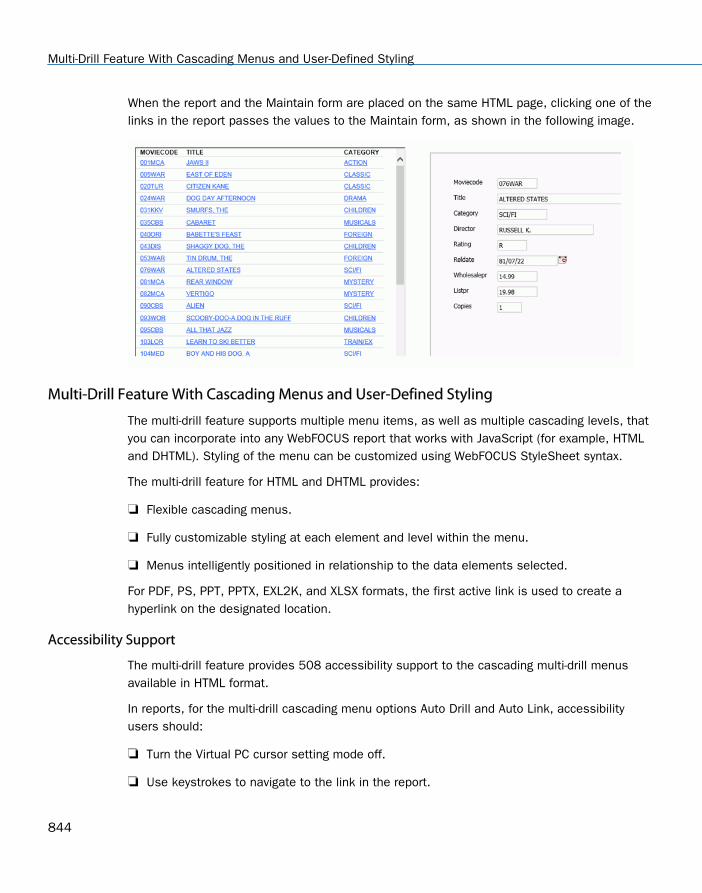
When the report and the Maintain form are placed on the same HTML page, clicking one of thelinks in the report passes the values to the Maintain form, as shown in the following image.
Multi-Drill Feature With Cascading Menus and User-Defined Styling
The multi-drill feature supports multiple menu items, as well as multiple cascading levels, thatyou can incorporate into any WebFOCUS report that works with JavaScript (for example, HTMLand DHTML). Styling of the menu can be customized using WebFOCUS StyleSheet syntax.
The multi-drill feature for HTML and DHTML provides:
Flexible cascading menus.
Fully customizable styling at each element and level within the menu.
Menus intelligently positioned in relationship to the data elements selected.
For PDF, PS, PPT, PPTX, EXL2K, and XLSX formats, the first active link is used to create ahyperlink on the designated location.
Accessibility Support
The multi-drill feature provides 508 accessibility support to the cascading multi-drill menusavailable in HTML format.
In reports, for the multi-drill cascading menu options Auto Drill and Auto Link, accessibilityusers should:
Turn the Virtual PC cursor setting mode off.
Use keystrokes to navigate to the link in the report.
Multi-Drill Feature With Cascading Menus and User-Defined Styling
844

Open the cascading menu item and then press Enter to view the item.
Turn the Virtual PC cursor setting on to navigate through the report.
For more information, see TM4505: WebFOCUS HTML Report Accessibility Support.
Creating Multiple Drill-Down Links
You can customize the drill-down menu at two levels:
Global styling of all menus within the current procedure (fex).
Item level styling for each entry in the menu.
Global Menu Styling
To define styling attributes for all menus within the current procedure (fex):
TYPE=REPORT, OBJECT=MENU, [FONT=font], [SIZE=size], [COLOR=color],[HOVER-COLOR=hover_color], [BACKCOLOR=backcolor], [HOVER-BACKCOLOR=hover_backcolor], [BORDER={ON|OFF|n}],[BORDER-COLOR=border_color], [BORDER-STYLE=border_style]$
where:
font
Defines the font typeface for the menu item. The default is inherited from the report.
size
Defines the font size for the menu item. The default font size is 9.
color
Defines the text color for the menu item (named colors or RGB/HEX values). The defaulttext color for the menu item is RGB(#6B6B6B). Also used to define the color of theSEPARATOR line and the control caret.
hover_color
Defines the text color for the hover over or select menu item (named colors or RGB/HEXvalues). The default text color for hover over or select menu item is RGB(#495263).
backcolor
Defines the background color for the menu item (named colors or RGB/HEX values). Thedefault background color is RGB(#F8F8F8).
10. Linking a Report to Other Resources
Creating Reports With TIBCO® WebFOCUS Language 845

hover_backcolor
Defines the background color for hover over or select menu item (named colors orRGB/HEX values). The default background color for hover over or select menu item isRGB(#DFDFDF).
BORDER={ON|OFF|n}
where:
ON displays borders around the menu objects and as the separator lines, based onuser defined styling or system defaults.
OFF displays no border around the menu objects.
n is border weight in pixels (valid values 1, 2, 3, light, medium, heavy).
The default border weight is light.
border_color
Defines border coloring to be used for borders around the menu. This will also be used forthe color of the separator lines within the menu. Is one of the preset color values. Thedefault border color is RGB(#D6D6D6).
border_style
Defines line styles to be used for borders around the menu, as well as separator lines.Possible values are listed in the following table. This will also be used for separator stylewithin the menu. The default border style is solid. Seeing the distinction in border stylemay require using a heavier weight (for example, border=heavy, or border=3).
Style Description
NONE No border/divider
SOLID Solid line
DOTTED Dotted line
DASHED Dashed line
DOUBLE Double line
GROOVE 3D groove
RIDGE 3D ridge
Multi-Drill Feature With Cascading Menus and User-Defined Styling
846

Style Description
INSET 3D inset
OUTSET 3D outset
Note:
If a multi-drill menu is tagged with the DRILL-SOURCE attribute, it indicates that the menuwas generated by WebFOCUS and should be merged into the existing drilldowns added bythe user for the specified report element, if any. The value of the attribute indicates whichWebFOCUS feature generated the menu. This attribute is reserved for internal use only.
When you create multiple drill-down links, you cannot specify a single drill-down action (forexample, FOCEXEC or URL) before the first DRILLMENUITEM.
Menu Items Styling
The syntax for cascading menus is an extension of the existing multi-drill (DRILLMENUITEM)syntax. Any syntax that is currently valid should behave the same after the extended syntax isimplemented.
To define individual menus and items attached to a report node or data element:
TYPE=type, [subtype], [DRILLMENUITEM='description', action|'keyword'], [NAME=name], [PARENT=parentname],
where:
type
Identifies the report component that you select in the web browser to execute the link. TheTYPE attribute and its value must appear at the beginning of the declaration.
subtype
Are any additional attributes, such as COLUMN, LINE, or ITEM, that are needed to identifythe report component that you are formatting.
Each DRILLMENUITEM item must have a description or a keyword pair. Descriptions withoutactions will automatically be inactive by default.
10. Linking a Report to Other Resources
Creating Reports With TIBCO® WebFOCUS Language 847
The exception to this rule will be parent items containing children entries linked with theNAME/PARENT pairing. In this instance, the action will be to present the children in thecascading menu.
description
Is the text that appears on the pop-up menu of drill-down options on the report output. Thedefault value is DrillDown n, where n is a consecutive integer, such as DrillDown 1,DrillDown 2, and so on.
Note:
If DRILLMENUITEM is set to the special value 'SEPARATOR':
A horizontal separator line will be drawn using the styling and color attributesdefined for the menu borders at the location within the menu.
A separator cannot be associated with an action.
The DRILLMENUITEM value cannot be empty or blank.
action
Is the type of link, as described in Drill-Down Action Options on page 848. For example, alink to a detail report or URL.
The following attributes are optional. They are only required for cascading menus where ahierarchy must be defined.
name
An optional unique identifier for the current item to use as a link between parent andchildren items. Only required if this node serves as a parent to children menu items wherea link must be identified.
parentname
An optional unique identifier/name of the parent menu item for the current child item. Onlyrequired if this node serves as a parent to another item in the hierarchy.
Drill-Down Action Options
Each drill menu item can be linked to a single instance of the actions below:
FOCEXEC=report.fex
Another report. The StyleSheet attribute is FOCEXEC.
TYPE=type, [subtype], FOCEXEC=fex[(parameters...)], [TARGET=frame,][ALT='description',] $
Multi-Drill Feature With Cascading Menus and User-Defined Styling
848

URL=url string
A URL. The StyleSheet attribute is URL. You pass a valid URL. Note that the length of theURL is limited by the maximum number of characters allowed by the browser. Forinformation about this limit for your browser, see the browser support site.
TYPE=type, [subtype], URL=url[(parameters...)], [TARGET=frame,] [ALT='description',] $
URL=(field)
A URL from a field. The StyleSheet attribute is URL. You pass the name of a report columnwhose value is a valid URL to which the link will jump.
TYPE=type, [subtype], URL=url[(parameters ...)], [TARGET=frame,] [ALT='description',] $
JAVASCRIPT=function
A JavaScript function. The StyleSheet attribute is JAVASCRIPT.
TYPE=type, [subtype], JAVASCRIPT=function[(parameters ...)], $
Note: If a drilldown link calls a JavaScript function that displays a popup message, the drillmenu will remain open until the popup message is dismissed.
Summary of Drill-Down Links
Within a multi-drill menu, you can link to:
Another report. The StyleSheet attribute is FOCEXEC. For details on the syntax, see Linkingto Another Report on page 822.
A URL. The StyleSheet attribute is URL. You pass a valid URL. For details on the syntax,see Linking to a URL on page 827.
Note that the length of the URL is limited by the maximum number of characters allowed bythe browser. For information about this limit for your browser, search on your browservendor support site.
A URL from a field. The StyleSheet attribute is URL. You pass the name of a report columnwhose value is a valid URL to which the link will jump. For details on the syntax, see Linkingto a URL on page 827.
A JavaScript function. The StyleSheet attribute is JAVASCRIPT. For details on the syntax,see Linking to a JavaScript Function on page 835.
A Maintain Data procedure. The StyleSheet attribute is URL with the keyword MNTCON EX.For details on the syntax, see Linking to a Maintain Data Procedure on page 838.
10. Linking a Report to Other Resources
Creating Reports With TIBCO® WebFOCUS Language 849
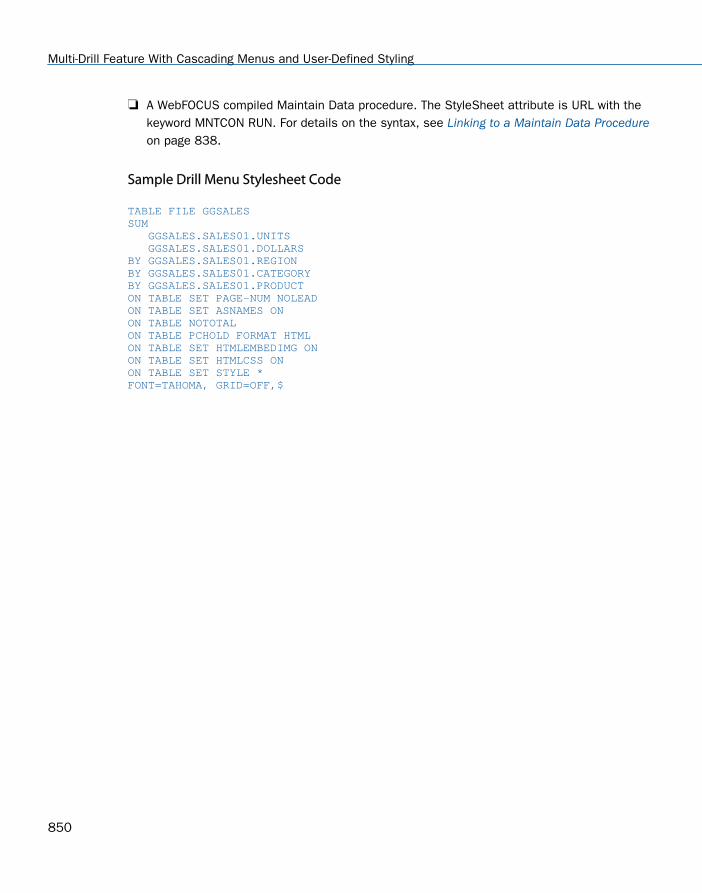
A WebFOCUS compiled Maintain Data procedure. The StyleSheet attribute is URL with thekeyword MNTCON RUN. For details on the syntax, see Linking to a Maintain Data Procedureon page 838.
Sample Drill Menu Stylesheet Code
TABLE FILE GGSALESSUM GGSALES.SALES01.UNITS GGSALES.SALES01.DOLLARSBY GGSALES.SALES01.REGIONBY GGSALES.SALES01.CATEGORYBY GGSALES.SALES01.PRODUCTON TABLE SET PAGE-NUM NOLEADON TABLE SET ASNAMES ONON TABLE NOTOTALON TABLE PCHOLD FORMAT HTMLON TABLE SET HTMLEMBEDIMG ONON TABLE SET HTMLCSS ONON TABLE SET STYLE *FONT=TAHOMA, GRID=OFF,$
Multi-Drill Feature With Cascading Menus and User-Defined Styling
850

TYPE=DATA,COLUMN=B2, DRILLMENUITEM='Sales Details', NAME=menu2, DRILLMENUITEM='By Month', PARENT=menu2, NAME=menu21, FOCEXEC=detailreport.fex(PARAMETER=CATEGORY),TARGET=_blank, DRILLMENUITEM='By Quarter', PARENT=menu2, NAME=menu23, FOCEXEC=detailreport.fex(PARAMETER=CATEGORY),TARGET=_blank, DRILLMENUITEM=SEPARATOR, PARENT=menu2, DRILLMENUITEM='By Product', PARENT=menu2, NAME=menu24, FOCEXEC=detailreport.fex(PARAMETER=CATEGORY),TARGET=_blank, DRILLMENUITEM='By Customer', PARENT=menu2,NAME=menu25, FOCEXEC=detailreport.fex(PARAMETER=CATEGORY),TARGET=_blank, DRILLMENUITEM=SEPARATOR, PARENT=menu2, DRILLMENUITEM='Profitablity Analysis', PARENT=menu2,NAME=menu3, DRILLMENUITEM='By Month', PARENT=menu3, NAME=menu31, FOCEXEC=detailreport.fex(PARAMETER=CATEGORY),TARGET=_blank, DRILLMENUITEM='By Region', PARENT=menu3, NAME=menu32, FOCEXEC=detailreport.fex(PARAMETER=CATEGORY),TARGET=_blank, DRILLMENUITEM='Forecasts', FOCEXEC=detailreport.fex(PARAMETER=CATEGORY),TARGET=_blank,$TYPE=DATA,COLUMN=B3, DRILLMENUITEM='IBI Links',NAME=menu4a, DRILLMENUITEM='Information Builders', PARENT=menu4a, NAME=menu41, URL=http://www.ibi.com,TARGET=_blank, DRILLMENUITEM='Summit 2015', PARENT=menu4a, NAME=menu42, URL=http://www.ibi.com,TARGET=_blank, DRILLMENUITEM='Competative Analysis', PARENT=menu4a, NAME=menu43, URL=http://www.ibi.com,TARGET=_blank, DRILLMENUITEM='External Links', NAME=menu4b, DRILLMENUITEM='Google', PARENT=menu4b, NAME=menu45, URL=http://www.google.com,TARGET=_blank, DRILLMENUITEM='Weather', PARENT=menu4b, NAME=menu46, URL=http://www.weather.com,TARGET=_blank, DRILLMENUITEM='CNN', PARENT=menu4b,NAME=menu47, URL=http://www.cnn.com,TARGET=_blank,$ENDSTYLEEND
10. Linking a Report to Other Resources
Creating Reports With TIBCO® WebFOCUS Language 851

This code generates a menu structure that looks like the following images.
Multi-Drill Feature With Cascading Menus and User-Defined Styling
852
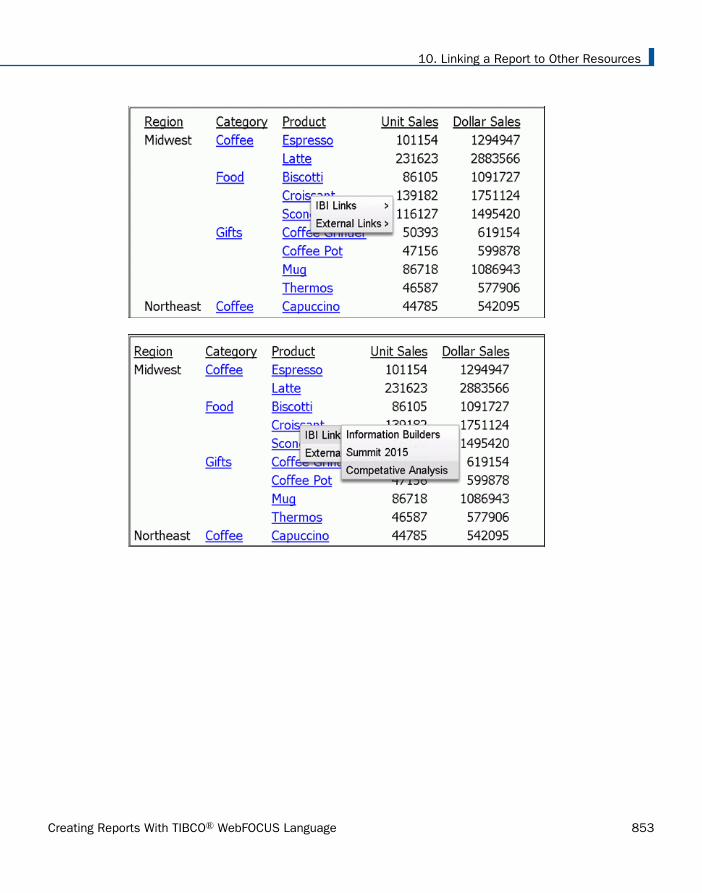
10. Linking a Report to Other Resources
Creating Reports With TIBCO® WebFOCUS Language 853

To apply custom styling to the menus, add the following syntax to the StyleSheet:
TYPE=REPORT, OBJECT=MENU, FONT="COMIC SANS MS", COLOR=NAVY,BACKCOLOR=GREY, HOVER-COLOR=GREY, HOVER-BACKCOLOR=NAVY, $
The menu structure will now look like the following images.
Multi-Drill Feature With Cascading Menus and User-Defined Styling
854
Reference: Usage Notes for Multi-Drill Menus
The following interactive reports are supported with the multi-drill cascading menus with userdefined styling:
HFREEZE
Accordion by Row (EXPANDBYROW, EXPANDBYROWTREE)
Accordion by Column (EXPANDABLE)
OLAP
HTML TOC
Note: As of Release 8.2 Version 01, when the Multi-Drill and On Demand Paging features areenabled in a report, the cascading Multi-Drill menus do not display. Instead, the legacy Multi-Drill menus generated prior to Release 8.2.01 will be generated. Cascading menus are notavailable and all hyperlinks display on the same level on the menu.
Applying Conditional Styling
You can apply conditional styling to a report component, using a phrase such as WHEN, anduse it to select one of a number of different actions, depending on the value of fields in thereport.
The WHEN condition must precede the DRILLMENUITEM syntax.
For details on creating conditions, see Linking With Conditions on page 867.
Example: Applying Conditional Styling to a Multiple Drill-Down Report
Add the following boldface code to the sample summary report in Creating Multiple Drill-DownLinks on page 845. Notice that the WHEN condition precedes the code for DRILLMENUITEM,as required.
When you run the summary report, the State field is in red instead of blue whenever budgetdollars is greater than dollar sales, and the pop-up menu of drill-down options shows DetailBudget Report instead of DrillDown 1 and DrillDown 2.
10. Linking a Report to Other Resources
Creating Reports With TIBCO® WebFOCUS Language 855

.
.
.TYPE=DATA, COLUMN=N1, COLOR='BLUE', STYLE=UNDERLINE, DRILLMENUITEM='DrillDown 1', URL=http://www.informationbuilders.com?, DRILLMENUITEM='DrillDown 2', FOCEXEC=DETAILREPORT(PARAMETER=N1),$
TYPE=DATA, COLUMN=N1, COLOR='RED', STYLE=UNDERLINE, WHEN=BUDDOLLARS GT DOLLARS, DRILLMENUITEM='Detail Budget Report', FOCEXEC=DETAILREPORT(PARAMETER=N1),$...
Sample output is:
Creating Parameters
If your drill-down report depends on a specific data value in the base report, you must create aparameter (or parameters) that can pass one or more values to the report you are drilling downto.
Creating Parameters
856

Parameters are useful when you want to create a dynamic link. For example, your first report isa summary report that lists the total number of products ordered by a company on a specificdate. You can drill down from a specific product in that report to a more detailed report thatshows the name of the product's vendor and the individual number of units ordered by ordernumber. With a dynamic link, you create only one drill-down report that uses the value passedfrom the first report to determine what information to display, instead of several static reports.
You can create multiple parameters. The entire string of parameters must be enclosed inparentheses, separated from each other by a blank space, and cannot exceed 2400characters.
You can use any combination of the following methods to create parameters in your StyleSheetdeclaration. You can specify:
A constant value.
The name or the position of a field.
The name of an amper variable to pass its value. Amper variables can only be used withinline StyleSheets. For details on inline StyleSheets, see Creating and Managing aWebFOCUS StyleSheet on page 1199.
Syntax: How to Create Parameters
parameter=value
where:
parameterIs the name of the variable in the linked procedure.
Note: To avoid conflicts, do not name variables beginning with Date, IBI, or WF. Variablenames beginning with these values are reserved for internal use.
valueIdentifies the value to be passed. Values can be any of the following:
'constant_value' identifies an actual value to be passed. The value must be enclosedin single quotation marks.
field identifies the field in the report whose value is to be passed to the procedure. Youcan identify the field using either the field name or the field position. For details on fieldposition, see Identifying a Report Component in a WebFOCUS StyleSheet on page 1251.
'&variable' identifies an amper variable whose value is to be passed to the procedure.The name of the amper variable must be enclosed in single quotation marks. You can useamper variables only in inline StyleSheets.
10. Linking a Report to Other Resources
Creating Reports With TIBCO® WebFOCUS Language 857

Note: The usual use of an amper variable is to pass a constant value. If the ampervariable corresponds to an alphanumeric field, the amper variable would have to beembedded in single quotation marks, for example:
'&ABC'.
The entire string of parameter names and values must be enclosed in parentheses. Eachparameter=value pair must be separated by a blank space. You can include multipleparameters in your request but the entire string cannot exceed 2400 characters.
Note: If the drill-down report contains a -DEFAULTS statement that sets a default value to thesame amper variable passed from the main report, the amper variable value passed downoverwrites the -DEFAULTS statement in the target procedure.
Example: Creating Parameters by Specifying a Constant Value
The following example illustrates how to create parameters by specifying a constant value. Therelevant StyleSheet declarations are highlighted in the request.
Main report:
SET LOOKGRAPH BARSET 3D=OFFGRAPH FILE SHORTHEADING"Sum of Balance Across Short Date""Click Any Bar For a Report on Projected Returns Since June 29, 1998 "SUM BALANCEACROSS SHORT_DATEON GRAPH SET STYLE * TYPE=DATA, ACROSSCOLUMN=N1,FOCEXEC=PROJRET(Short_Date='06291998'),$ ENDSTYLEEND
Drill-down report (PROJRET):
TABLE FILE SHORTHEADING"Projected Returns Since June 29, 1998 "SUM PROJECTED_RETURNBY SHORT_DATEBY REGIONWHERE SHORT_DATE GE '&Short_Date';ON TABLE SET PAGE-NUM OFFON TABLE SET STYLE *TYPE=REPORT, GRID=OFF, $ENDSTYLEEND
Creating Parameters
858
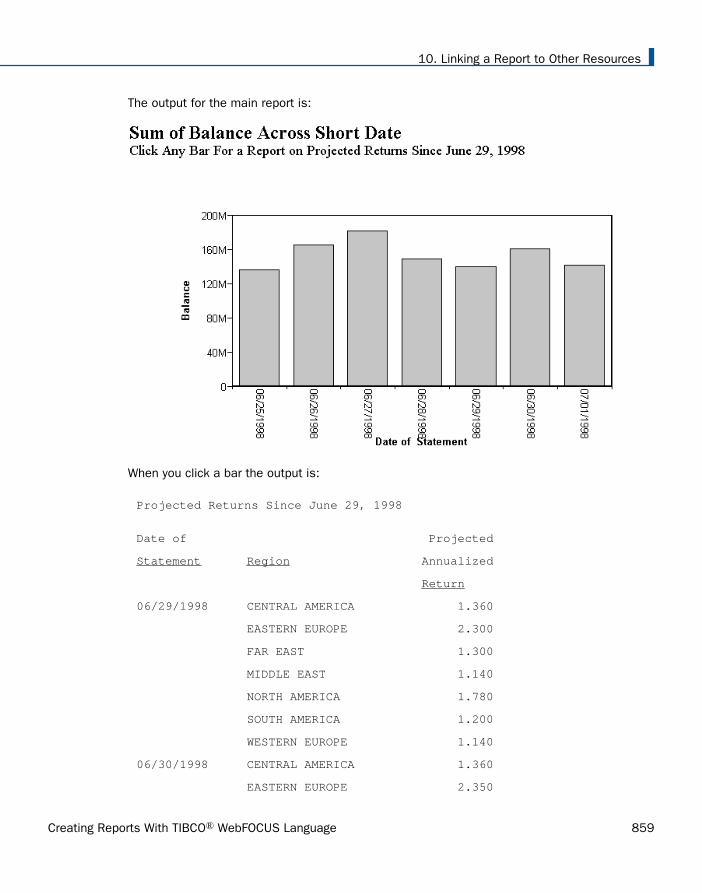
The output for the main report is:
When you click a bar the output is:
Projected Returns Since June 29, 1998
Date of Projected
Statement Region Annualized
Return
06/29/1998 CENTRAL AMERICA 1.360
EASTERN EUROPE 2.300
FAR EAST 1.300
MIDDLE EAST 1.140
NORTH AMERICA 1.780
SOUTH AMERICA 1.200
WESTERN EUROPE 1.140
06/30/1998 CENTRAL AMERICA 1.360
EASTERN EUROPE 2.350
10. Linking a Report to Other Resources
Creating Reports With TIBCO® WebFOCUS Language 859
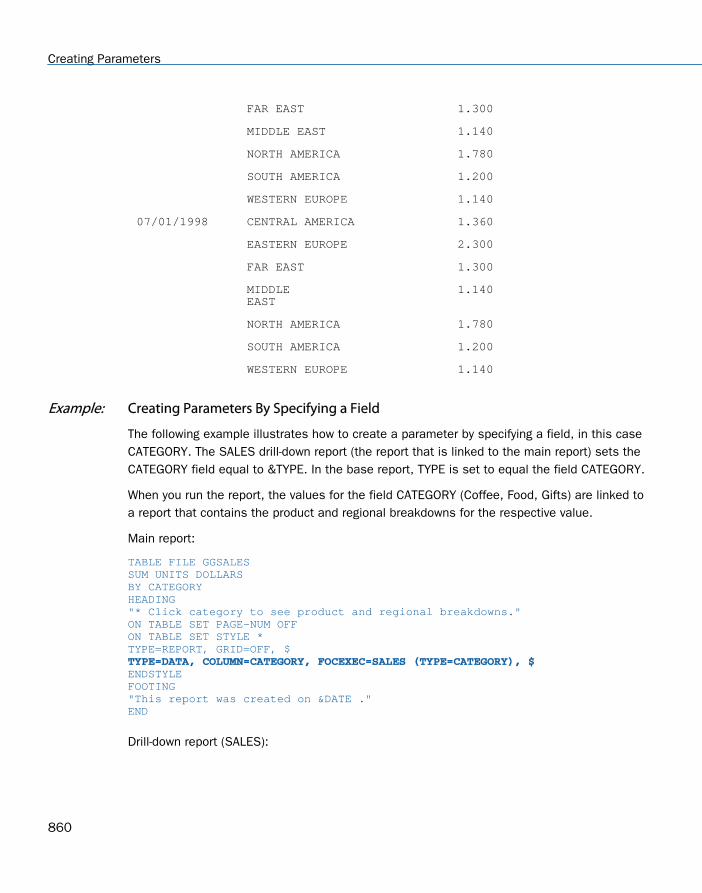
FAR EAST 1.300
MIDDLE EAST 1.140
NORTH AMERICA 1.780
SOUTH AMERICA 1.200
WESTERN EUROPE 1.140
07/01/1998 CENTRAL AMERICA 1.360
EASTERN EUROPE 2.300
FAR EAST 1.300
MIDDLE EAST
1.140
NORTH AMERICA 1.780
SOUTH AMERICA 1.200
WESTERN EUROPE 1.140
Example: Creating Parameters By Specifying a Field
The following example illustrates how to create a parameter by specifying a field, in this caseCATEGORY. The SALES drill-down report (the report that is linked to the main report) sets theCATEGORY field equal to &TYPE. In the base report, TYPE is set to equal the field CATEGORY.
When you run the report, the values for the field CATEGORY (Coffee, Food, Gifts) are linked toa report that contains the product and regional breakdowns for the respective value.
Main report:
TABLE FILE GGSALESSUM UNITS DOLLARSBY CATEGORYHEADING "* Click category to see product and regional breakdowns."ON TABLE SET PAGE-NUM OFFON TABLE SET STYLE *TYPE=REPORT, GRID=OFF, $ TYPE=DATA, COLUMN=CATEGORY, FOCEXEC=SALES (TYPE=CATEGORY), $ ENDSTYLEFOOTING"This report was created on &DATE ."END
Drill-down report (SALES):
Creating Parameters
860

TABLE FILE GGSALESON TABLE SET PAGE-NUM OFFSUM UNITS DOLLARSBY CATEGORY BY PRODUCTACROSS REGIONWHERE CATEGORY = '&TYPE';ON TABLE SET PAGE-NUM OFFON TABLE SET STYLE *TYPE=REPORT, GRID=OFF, $ENDSTYLEEND
The output for the main report is:
Click Coffee and the product and regional breakdown for Coffee displays:
Example: Creating Parameters by Specifying an Amper Variable
The following request illustrates how to create a parameter by specifying an amper variable.The relevant StyleSheet declarations are highlighted in the request.
10. Linking a Report to Other Resources
Creating Reports With TIBCO® WebFOCUS Language 861

Main report:
SET3D=OFFGRAPH FILE EMPLOYEEHEADING"Salary Report Per Employee ID""Click A Bar For The List of Employees in the '&DEPARTMENT' Department"SUM SALARYACROSS EMP_ID AS 'EMPLOYEE ID'ON GRAPH SET STYLE * TYPE=DATA, ACROSSCOLUMN=SALARY,FOCEXEC=EMPBYDEP(DEPARTMENT='&DEPARTMENT'), $ ENDSTYLEEND
Linked report (EMPBYDEP):
TABLE FILE EMPLOYEEHEADING"List Of Employees in the '&DEPARTMENT' Department "PRINT FIRST_NAME LAST_NAMEBY DEPARTMENTWHERE DEPARTMENT EQ '&DEPARTMENT';ON TABLE SET PAGE-NUM OFFON TABLE SET STYLE *TYPE=REPORT, GRID=OFF, $ENDSTYLEEND
When the main report request is run, the following prompt opens:
Creating Parameters
862
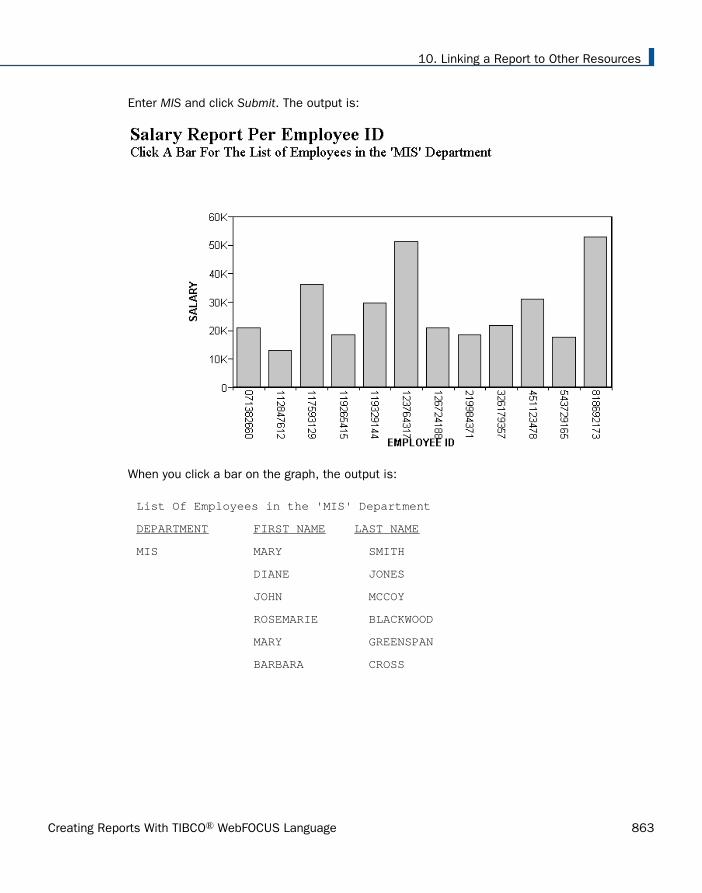
Enter MIS and click Submit. The output is:
When you click a bar on the graph, the output is:
List Of Employees in the 'MIS' Department
DEPARTMENT FIRST NAME LAST NAME
MIS MARY SMITH
DIANE JONES
JOHN MCCOY
ROSEMARIE BLACKWOOD
MARY GREENSPAN
BARBARA CROSS
10. Linking a Report to Other Resources
Creating Reports With TIBCO® WebFOCUS Language 863

Example: Using DRILLMETHOD in a Drill-Down Request
The following example illustrates how to use the DRILLMETHOD parameter to control themethod used in a drill-down request.
When DRILLMETHOD is set to POST, parameters and values are not included in the URL orstored in the logs, which makes this method more secure.
When DRILLMETHOD is set to GET, parameters and values are included in the URL andstored in the logs.
The following drill-down request against the GGSALES data source includes a SETDRILLMETHOD=POST command and two parameters, one for CATEGORY and one forPRODUCT.
SET DRILLMETHOD=POSTTABLE FILE GGSALESSUM DOLLARS BUDDOLLARSBY CATEGORYBY PRODUCTON TABLE PCHOLD FORMAT HTMLON TABLE SET STYLE * INCLUDE=IBFS:/FILE/IBI_HTML_DIR/ibi_themes/Warm.sty,$TYPE=DATA, COLUMN=N1, TARGET='_blank', FOCEXEC=IBFS:/WFC/Repository/My_Workspace/~admin/child_report.fex(PARA1=CATEGORY PARA2=PRODUCT), $ ENDSTYLE END-RUN
Note: You can also use DRILLMETHOD in a StyleSheet command for each drill down, forexample:
TYPE=DATA, COLUMN=N1, DRILLMETHOD='POST', FOCEXEC=drilldown.fex, $
The following request is the child report.
TABLE FILE GGSALESSUM DOLLARS BUDDOLLARSBY CATEGORYBY PRODUCTWHERE CATEGORY EQ &PARA1.QUOTEDSTRING AND PRODUCT EQ &PARA2.QUOTEDSTRING; ON TABLE PCHOLD FORMAT HTMLON TABLE SET STYLE *INCLUDE=IBFS:/FILE/IBI_HTML_DIR/ibi_themes/Warm.sty,$ ENDSTYLEEND
Creating Parameters
864

When you run the drill-down request with DRILLMETHOD=POST and select a category, forexample, Coffee, the parameters and values are not included in the URL, as shown in thefollowing image.
If you run the drill-down request with DRILLMETHOD=GET, and select a category, for example,Coffee, the parameters and values are included in the URL, as shown in the following image.
Note: For more information about the SET DRILLMETHOD command, see Customizing YourEnvironment in the TIBCO WebFOCUS® Developing Reporting Applications manual.
Example: Using Multiple Parameters
When using multiple parameters, the entire string must be enclosed in parentheses andseparated from each other by a blank space. The relevant StyleSheet declarations arehighlighted in the request.
Main report:
SET 3D=OFFGRAPH FILE EMPLOYEESUM CURR_SALACROSS DEPARTMENTON GRAPH SET STYLE * TYPE=DATA, ACROSSCOLUMN=CURR_SAL,FOCEXEC=REPORT2 (DEPARTMENT='&DEPARTMENT' LAST_NAME='SMITH'), $ ENDSTYLEEND
10. Linking a Report to Other Resources
Creating Reports With TIBCO® WebFOCUS Language 865

Drill-down report (REPORT2):
TABLE FILE EMPLOYEEPRINT SALARYBY DEPARTMENTBY FIRST_NAMEBY LAST_NAMEWHERE DEPARTMENT EQ '&DEPARTMENT'WHERE LAST_NAME EQ '&LAST_NAME'ON TABLE SET PAGE-NUM OFFON TABLE SET STYLE *TYPE=REPORT, GRID=OFF, $ENDSTYLEEND
When the main report request is run, the following prompt opens:
Creating Parameters
866
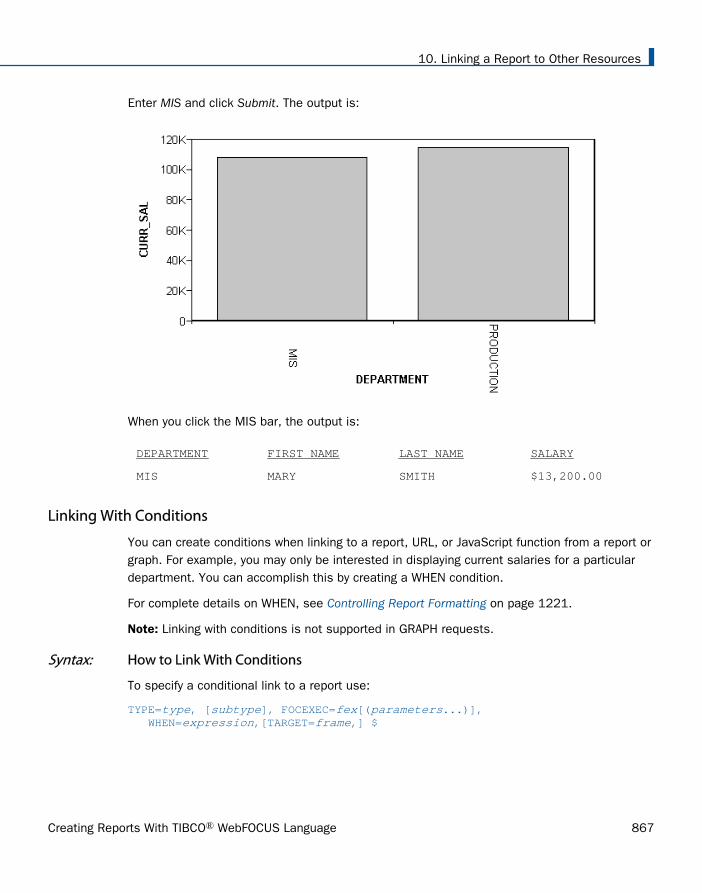
Enter MIS and click Submit. The output is:
When you click the MIS bar, the output is:
DEPARTMENT FIRST NAME LAST NAME SALARY
MIS MARY SMITH $13,200.00
Linking With Conditions
You can create conditions when linking to a report, URL, or JavaScript function from a report orgraph. For example, you may only be interested in displaying current salaries for a particulardepartment. You can accomplish this by creating a WHEN condition.
For complete details on WHEN, see Controlling Report Formatting on page 1221.
Note: Linking with conditions is not supported in GRAPH requests.
Syntax: How to Link With Conditions
To specify a conditional link to a report use:
TYPE=type, [subtype], FOCEXEC=fex[(parameters...)], WHEN=expression,[TARGET=frame,] $
10. Linking a Report to Other Resources
Creating Reports With TIBCO® WebFOCUS Language 867

To specify a conditional link to a URL use:
TYPE=type, [subtype], URL=url[(parameters...)], WHEN=expression,[TARGET=frame,] $
To specify a conditional link to a JavaScript function use:
TYPE=type, [subtype], JAVASCRIPT=function[(parameters...)], WHEN=expression,[TARGET=frame,] $
where:
typeIdentifies the report component that you select in the web browser to execute the link.The TYPE attribute and its value must appear at the beginning of the declaration.
subtypeAre any additional attributes, such as COLUMN, LINE, or ITEM, that are needed toidentify the report component that you are formatting. For information on identifyingreport components, see Identifying a Report Component in a WebFOCUS StyleSheet onpage 1251.
fexIdentifies the file name of the linked procedure to run when you select the reportcomponent. For details about linking to another procedure, see Linking to AnotherReport on page 822.
urlIdentifies any valid URL, or the name of a report column enclosed in parentheseswhose value is a valid URL. For details about linking to a URL, see Linking to a URL onpage 827.
functionIdentifies the JavaScript function to run when you select the report component. Fordetails about calling a JavaScript function, see Linking to a JavaScript Function onpage 835.
parametersValues that are passed to the report, URL, or JavaScript function. For details, see Creating Parameters on page 856.
expressionIs any Boolean expression that would be valid on the right side of a COMPUTEexpression.
Note: IF... THEN... ELSE logic is not necessary in a WHEN clause and is not supported. Allnon-numeric literals in a WHEN expression must be specified within single quotationmarks.
Linking With Conditions
868

frameIdentifies the target frame in the webpage in which the output from the drill-down linkis displayed. For details, see Specifying a Target Frame on page 875.
Example: Linking With Conditions
In this example, we only want to link the MIS value of the DEPARTMENT field to REPORT3. Todo this we include the phrase WHEN=DEPARTMENT EQ 'MIS' in the StyleSheet declaration.The relevant declarations are highlighted in the requests.
Main report:
TABLE FILE EMPLOYEESUM CURR_SAL AS 'Total,Current,Salaries'BY DEPARTMENT AS 'Department'ON TABLE SET PAGE-NUM OFFON TABLE SET STYLE *TYPE=REPORT, GRID=OFF, $ TYPE=DATA, COLUMN=N1, FOCEXEC=REPORT3(DEPARTMENT=N1), WHEN=DEPARTMENT EQ 'MIS', $ ENDSTYLEEND
Drill-down report (REPORT3):
TABLE FILE EMPLOYEEPRINT SALARYBY DEPARTMENTBY LAST_NAME WHERE DEPARTMENT EQ '&DEPARTMENT' ON TABLE SET PAGE-NUM OFFON TABLE SET STYLE *TYPE=REPORT, GRID=OFF, $ENDSTYLEEND
In the following output, note that only the MIS department is linked:
When you click MIS, the following output displays:
10. Linking a Report to Other Resources
Creating Reports With TIBCO® WebFOCUS Language 869

DEPARTMENT LAST NAME SALARY
MIS BLACKWOOD $21,780.00
CROSS $27,062.00
$25,755.00
GREENSPAN $9,000.00
$8,650.00
JONES $18,480.00
$17,750.00
MCCOY $18,480.00
SMITH $13,200.00
Linking From a Graphic Image
You can link to a report or procedure from an image in an HTML report. The image can beattached to the entire report or to the report heading or footing (this includes table headings/table footings, and sub-headings/sub-footings).
The syntax for linking from a graphic image is the same as for linking from a report component.The only difference is adding IMAGE=image to the StyleSheet declaration.
Note: You can only link to a report or procedure from an image when you are using HTMLformat.
Syntax: How to Specify Links From a Graphic Image
To specify a link from an image in a report or procedure use:
TYPE=type, [subtype], IMAGE=image, FOCEXEC=fex [(parameters ...)],[TARGET=frame,] $
To specify a link from an image in an URL use:
TYPE=type, [subtype], IMAGE=image, URL=url [(parameters ...)],[TARGET=frame,] $
To specify a link from an image in a JavaScript function use:
TYPE=type, [subtype], IMAGE=image, JAVASCRIPT=function [(parameters ...)],$
Linking From a Graphic Image
870

where:
typeIdentifies the report component that the user selects to execute the link. The TYPEattribute and its value must appear at the beginning of the declaration. You canspecify the following types of components:
REPORT enables you to drill down from a graphical image that is attached to the entirereport.
TABHEADING or TABFOOTING enables you to drill down from a graphical image that isattached to a report heading or footing.
HEADING or FOOTING enables you to drill down from a graphical image that is attached toa page heading or footing.
SUBHEAD or SUBFOOT enables you to drill down from a graphical image that is attached toa sub heading or sub footing.
Report components are described in Identifying a Report Component in a WebFOCUSStyleSheet on page 1251.
subtypeAre any additional attributes, such as COLUMN, LINE, or ITEM, that are needed toidentify the report component that you are formatting. See Identifying a ReportComponent in a WebFOCUS StyleSheet on page 1251 for information on identifyingreport components.
imageSpecifies the file name of a graphical image file. The image must exist as a separategraphic file in a format that your browser supports. Most browsers support GIF andJPEG file types.
You can specify a local image file, or identify an image elsewhere on the network using aURL. URLs can be absolute, such as, http://www.ibi.com/graphic.gif, or relative alias thatcan be identified to the application server or web server, such as, /ibi_apps/ibi_html/ibi_logo.gif.
Alternatively, you can specify an alphanumeric field in the report (either a BY sort field or adisplay field) whose value corresponds to the name of the image file. For information aboutusing StyleSheets to incorporate and position graphical images in a report, see Laying Outthe Report Page on page 1333.
fexIdentifies the file name of the linked procedure to run when the user selects the reportcomponent. For details about linking to another procedure, see Linking to AnotherReport on page 822.
10. Linking a Report to Other Resources
Creating Reports With TIBCO® WebFOCUS Language 871

urlIdentifies any valid URL, or the name of a report column enclosed in parentheseswhose value is a valid URL. For details about linking to an URL, see Linking to a URLon page 827.
functionIdentifies the JavaScript function to run when the user selects the report component.For details about calling a JavaScript function, see Linking to a JavaScript Function onpage 835.
parametersAre values that are passed to the report, URL, or JavaScript function. You can passone or more parameters. The entire string of parameters must be enclosed inparentheses, and separated from each other by a blank space. For details, see Creating Parameters on page 856.
frameIdentifies the target frame in the webpage in which the output from the drill-down linkis displayed. For details, see Specifying a Target Frame on page 875.
Note: You cannot specify a target frame if you are executing a JavaScript function. However,the JavaScript function itself can specify a target frame for its results.
Example: Specifying a Link From an Image
The following example illustrates how to link a report from an image. The relevant StyleSheetdeclarations are highlighted in the request.
Main report:
TABLE FILE EMPLOYEEPRINT LAST_NAME BY EMP_IDHEADING"List Of Employees By Employee ID"ON TABLE SET ONLINE-FMT HTMLON TABLE SET PAGE-NUM OFFON TABLE SET STYLE *TYPE=HEADING, STYLE=BOLD, $TYPE=REPORT, GRID=OFF, $ TYPE=REPORT, IMAGE=E:\IBI\WEBFOCUS81\APPS\IBINCCEN\IMAGES\LEFTLOGO.GIF, FOCEXEC=IMAGE-D, $ ENDSTYLEEND
Note: The IBINCCEN directory contains the English version of the samples.
Drill-down report (IMAGE-D):
Linking From a Graphic Image
872

TABLE FILE EMPDATAPRINT SALARYBY DIVWHERE DIV LE 'CORP';ON TABLE SET PAGE-NUM OFFON TABLE SET STYLE *TYPE=REPORT, GRID=OFF, $ENDSTYLEEND
The output for the main report is:
When you click the graphic, the output is:
DIV SALARY
10. Linking a Report to Other Resources
Creating Reports With TIBCO® WebFOCUS Language 873

CE $62,500.00
$54,100.00
$25,400.00
$115,000.00
$33,300.00
$25,000.00
$49,000.00
$40,900.00
$43,000.00
$45,000.00
CORP $55,500.00
$83,000.00
$32,000.00
$62,500.00
$79,000.00
$35,200.00
$62,500.00
$26,400.00
Specifying a Base URL
If you want to link to files, images, and Java files, but do not know their full, physical URLs, youcan specify a default location where the browser searches for relative URLs.
To specify a default URL location, use the SET BASEURL command. Using SET BASEURL puts<BASE HREF="url"> into the HTML file that WebFOCUS generates. When a report is run, thespecified directory is searched for the HTML files, graphics files, and Java applet CLASS filesthat are called by the generated webpage.
For more details on specifying URLs, see Navigating Within an HTML Report on page 971.
Specifying a Base URL
874

Syntax: How to Specify a Base URL
SET BASEURL=url
where:
urlIs the default location where the browser searches for relative URLs specified in theHTML documents created by your application.
The URL must begin with http:// and end with a closing delimiter (/).
Example: Specifying a Base URL
The following illustrates how to specify a base URL:
SET BASEURL=http://host[:port]/ibi_apps/ibi_html/
where:
host
Is the host name where the WebFOCUS Web application is deployed.
port
Is the port number (specified only if you are not using the default port number) where theWebFOCUS Web application is deployed.
If you are including a graphic image in your report that is stored in the specified base URL, youcan add the following declaration to your StyleSheet instead of typing the entire URL:
TYPE=HEADING, IMAGE=ib_logo.gif, ..., $
Note: If the URL is at a remote website, it may take longer to retrieve. Whenever possible,store graphic image files on your WebFOCUS system.
Specifying a Target Frame
You can use frames to subdivide application HTML pages into separate scrollable sections.Frames enable users to explore various information items on a page by scrolling through asection, instead of linking to a separate page. When defining a link from a report component toa report procedure or URL, you can specify that the results of the drill-down link be displayed ina target frame on a webpage.
10. Linking a Report to Other Resources
Creating Reports With TIBCO® WebFOCUS Language 875

There are two ways to specify a target frame. You can specify:
A target frame in a StyleSheet declaration using the TARGET attribute. You can useStyleSheets to specify that drill-down links from a report or graph are displayed in a targetframe on the webpage displaying the report or graph. However, using StyleSheets to specifytarget frames adds extra HTML syntax to every HREF that is generated.
Note: When specifying a target frame from the Report canvas, manually added commandsin the StyleSheet are not recognized. The Report canvas removes commands that it doesnot generate itself.
A default target frame with a SET command. SET TARGETFRAME puts the HTML code<BASE TARGET="framename"> into the header of the HTML file that WebFOCUS displays.All drill-down links from the base report or graph are directed to the specified frame, unlessoverridden by the TARGET attribute in the StyleSheet.
To use the TARGET attribute or the SET TARGETFRAME command, you must create multipleframes on the webpage.
Note: You cannot specify a target frame if you are executing a JavaScript function. However,the JavaScript function itself can specify a target frame for its results.
Syntax: How to Specify a Target Frame
To specify a target frame in a report or procedure use:
TYPE=type, [subtype], FOCEXEC=fex[(parameters ...)], [TARGET=frame,] $
To specify a target frame for an URL use:
TYPE=type, [subtype], URL=url[(parameters ...)], [TARGET=frame,] $
where:
typeIdentifies the report component that the user selects in the web browser to executethe link. The TYPE attribute and its value must appear at the beginning of thedeclaration.
subtypeAre any additional attributes, such as COLUMN, LINE, or ITEM, that are needed toidentify the report component that you are formatting. See Identifying a ReportComponent in a WebFOCUS StyleSheet on page 1251 for information on identifyingreport components.
Specifying a Target Frame
876
fexIdentifies the file name of the linked procedure to run when the user selects the reportcomponent. For details about linking to another procedure, see Linking to AnotherReport on page 822.
urlIdentifies any valid URL, or the name of a report column enclosed in parentheseswhose value is a valid URL to which the link will jump. For details about linking to anURL, see Linking to a URL on page 827.
parametersAre values being passed to the procedure or URL. You can pass one or moreparameters. The entire string of values must be enclosed in parentheses, andseparated from each other by a blank space. For details, see Creating Parameters onpage 856.
frameIdentifies the target frame in the web page in which the output from the drill-down link(either a FOCEXEC or URL) is displayed.
If the name of the target frame contains embedded spaces, the name will be correctlyinterpreted without enclosing the name in quotation marks. For example:
TYPE=DATA, COLUMN=N1,FOCEXEC=MYREPORT, TARGET=MY FRAME, $
The name of the target frame is correctly interpreted to be MY FRAME.
You can also use the following standard HTML frame names: _BLANK, _SELF, _PARENT,_TOP.
Syntax: How to Specify a Default Target Frame
SET TARGETFRAME=frame
where:
frameIdentifies the target frame in the webpage in which the output from the drill-down link(either a FOCEXEC or URL) is displayed.
10. Linking a Report to Other Resources
Creating Reports With TIBCO® WebFOCUS Language 877

Example: Specifying a Target Frame
The following illustrates how to specify a default target frame:
SET TARGETFRAME=_SELF
The following illustrates how to specify a target frame in a request. The relevant StyleSheetdeclaration is highlighted in the request.
TABLE FILE EMPLOYEEPRINT CURR_SALBY DEPARTMENTON TABLE SET STYLE * TYPE=DATA, COLUMN=N1, URL=http:\\www.informationbuilders.com, TARGET=_SELF, $ ENDSTYLEEND
Creating a Compound Report
Compound reports combine multiple reports into a single file. This enables you to concatenatereports with styled formats (such as PDF, DHTML, PS, EXL2K, or XLSX). You can also embedimage files, including graphs saved as images, in a compound report.
Three types of compound reports exist:
Legacy Compound Reports (or, simply, Compound Reports). These reports string theindividual reports or graphs together sequentially into a single output file. The functionalityfor this type of compound report has been stabilized. The syntax is included in thisdocument for upward compatibility, and applications using this technique will continue towork. For more information, see Creating a Compound PDF or PS Report on page 936 and Creating a Compound Excel Report Using EXL2K on page 945.
Compound Layout Reports. A Compound Layout report is comprised of individualcomponent reports or graphs, either embedded or external. Reports and graphs can bepositioned anywhere on the page. You can assign specific pages to combinations of reportsand specify how to handle overflow onto additional pages. For more information, see Creating a Compound Layout Report With Document Syntax on page 879.
Coordinated Compound Layout Reports. A Coordinated Compound Layout report iscoordinated so that all reports and graphs that contain a common sort field are burst intoseparate page layouts. Pages are generated for each value of the common sort field, withevery component displaying the data it retrieved for that value on that page. You create aCoordinated Compound Layout report by specifying MERGE=ON in the SECTION declarationfor the Compound Layout report.
Creating a Compound Report
878
In a Coordinated Compound Layout report, if at least one component contains data for aspecific sort field value, a page is generated for that value even though some of thecomponents may be missing. For more information about Coordinated Compound Layoutreports with missing data, see Coordinated Compound Layout Reports With Missing Data onpage 914.
While the length of the report will always include all of the rows of data generated by the query,the width of the report is limited by the size of the defined component container. This meansthat paneling is not supported for compound reports, although it is for non-compound PDFreports. For non-compound PDF documents, if the width of the report data is wider than thedefined page size, a panel (or horizontal overflow page) is automatically generated. Thispaneling feature is not supported for compound PDF documents, so each compoundcomponent must fit within the width of the defined container in order for the report to besuccessfully generated. The container size is defined within each type of report.
In legacy compound syntax, if one of the component reports is too large to fit within thedefined page width, execution is halted and the user is presented with an error messagestating that paneling is not supported.
In Compound Layout Syntax, if a component is too wide to fit within the defined container,the report wraps the contents within the container. The container size is defined through acombination of the POSITION and DIMENSIONS parameters for the component within thecompound syntax. For more information about compound layout syntax, see Creating aCompound Layout Report With Document Syntax on page 879.
For information about creating PDF Compound Reports with Drill Through links, see How toCreate a Drill Through in a PDF Compound Report on page 958.
Creating a Compound Layout Report With Document Syntax
Typically, you create a compound layout report by using the options in the Document canvas.Alternatively, you may create a compound layout report by modifying the syntax in any texteditor.
Syntax for a compound layout report is structured by a compound layout block, which places allof the layout information in a single block that precedes the report. This block begins with aCOMPOUND LAYOUT declaration and is terminated with END. The language it contains isbased on StyleSheet syntax and is parsed by the StyleSheet parser.
This is supported with styled formats, such as PDF, PS, DHTML, EXL2K, or XLSX.
Tip: For details about StyleSheet syntax, see Creating and Managing a WebFOCUS StyleSheeton page 1199.
10. Linking a Report to Other Resources
Creating Reports With TIBCO® WebFOCUS Language 879

The compound layout block consists of SECTION, PAGELAYOUT, and COMPONENTdeclarations. The general structure of the compound layout block of syntax is:
COMPOUND LAYOUT PCHOLD AS filename FORMAT format
SECTION PAGELAYOUT COMPONENT COMPONENT ... PAGELAYOUT COMPONENT COMPONENT ... ...END...COMPOUND END
Note on Compound Layout Declaration: The available compound layout output formats arePDF, DHTML, PowerPoint, AHTML, Excel, FLEX, and APDF. The selected compound layoutformat will override any report output format from the individual components. The output filename can be defined using an AS filename phrase in the COMPOUND block. If none is defined,the file name is taken from the ON TABLE HOLD phrase in the first component report.
END signifies the end of the COMPOUND LAYOUT block, whereas COMPOUND END signifiesthe end of the compound report.
Additionally, the syntax SET COMPONENT=report(n) is added after each component, followedby the actual WebFOCUS code to generate the report.
Reference: SECTION Declaration and Syntax
A compound report section, or SECTION declaration, is a grouping of component reports withina compound report. While the current functionality only supports reports with a single section,this structure is used to support more complex reports. The SECTION declaration is mandatorywhen creating a compound layout report.
The SECTION syntax appears as:
SECTION=section-name, LAYOUT=ON, [MERGE=ON|OFF,] [UNITS=IN|CM|PTS,] [PAGESIZE=size,] [ORIENTATION=PORTRAIT|LANDSCAPE,] [LEFTMARGIN=m,] [RIGHTMARGIN=m,] [TOPMARGIN=m,] [BOTTOMMARGIN=m,] $
Creating a Compound Report
880

where:
section-name
Is the unique identifier of the section, up to 16 characters.
LAYOUT=ON
Specifies that the section uses a complex layout.
Note: LAYOUT=ON is the only applicable option at this time.
MERGE={ON|OFF}
Specifies whether the section is coordinated (merged) based on the value of the initial BYfield.
Note: The default value is OFF.
mSpecifies the margins (LEFT, RIGHT, TOP, BOTTOM) in inches, centimeters, or points.
If the optional items, UNITS, PAGESIZE, ORIENTATION, or MARGIN are present in the SECTIONdeclaration, they override any settings of these parameters within the component reports,global SET commands, ON TABLE SET commands, and StyleSheet keywords.
Reference: PAGELAYOUT Declaration
A SECTION consists of one or more PAGELAYOUT declarations, each of which group together anumber of COMPONENT declarations that are laid out on that particular page of the section.
The PAGELAYOUT keyword brackets a group of COMPONENT declarations that follow, up to thenext PAGELAYOUT keyword, or the end of the section.
The PAGELAYOUT syntax appears as:
PAGELAYOUT={n|ALL}, [TOPMARGIN=m,] [BOTTOMMARGIN=m,]$
where:
{n|ALL}
Specifies on what page of a multi-page layout the components appear. The value (n) iseither a page number within the current section, or ALL to indicate that the componentappears on every page of the section.
The PAGELAYOUT values are numbered starting with 1. For example, if a compoundreport is printed on two sides of a page, the component reports on the front side wouldbe specified as PAGELAYOUT 1, and the reverse side would be PAGELAYOUT 2.
Note: Syntax is required even if the report only contains a single page.
PAGELAYOUT=1, $
10. Linking a Report to Other Resources
Creating Reports With TIBCO® WebFOCUS Language 881

The PAGELAYOUT=ALL syntax specifies a component that appears on every page. Thisis useful for components that generate page headers or footers.
PAGELAYOUT=ALL, $
mDefines the boundaries (TOP, BOTTOM) for flowing reports in current units. For adescription of flowing reports, see COMPONENT Declaration on page 883.
Reference: Page Masters
Components included in a declaration for PAGELAYOUT=ALL appear on every page of the reportoutput. This is useful for creating a design theme for the compound report output:
Page masters must have a default report component (since COMPONENT is a requiredsyntax element), but that report component should not display any data, except in theheading. If the component displays data or graphics in the heading, you must leave spacefor the heading on every page, being careful to place the other components in areas on thepage that do not overlap with the heading.
For example, the following report does not display any data:
SET COMPONENT='DfltCmpt1'TABLE FILE SYSCOLUMSUM TBNAME NOPRINTIF READLIMIT EQ 1ON TABLE SET PREVIEW ONON TABLE SET PAGE-NUM NOLEADEND
Page masters for coordinated compound reports must have the same primary BY field asother components in the compound layout report. The best way to create the defaultcomponent for the page master in a coordinated compound report is to use one of the datasources for one of the compound layout reports. For example, if a component report forPAGELAYOUT1 is against the GGSALES data source, and the primary BY field is PCD, thedefault component for the page master could be:
SET COMPONENT='DfltCmpt1'TABLE FILE GGSALESSUM UNITS NOPRINTBY PCD NOPRINTIF READLIMIT EQ 1ON TABLE SET PREVIEW ONON TABLE SET PAGE-NUM NOLEADEND
Creating a Compound Report
882

Note that the recommended way to create a design theme with repeating text and imageson a page master is to place drawing objects on the page master. For information, see Howto Draw Objects With Document Syntax on page 897.
Page master styling for size and orientation only applies to the default document level.Page master elements do not automatically resize and position for various pageorientations throughout the document. For documents requiring mixed page orientations,each page layout can be defined with its own orientation. In this scenario, styling elementsshould be applied to the individual page layouts so that the styling can be appropriatelyapplied for each change in page orientation.
Reference: COMPONENT Declaration
The order of COMPONENT declarations in the COMPOUND LAYOUT block must match the orderin which the component reports are executed, and there must be a COMPONENT declarationfor each component report.
There are two types of components: fixed and flowing. A fixed component fills the containerdefined by the dimension parameters on the page and, if additional data exists, it overflowsonto the next page in the same fixed size in the same location. The size and location of thefixed overflow component can be customized on the overflow page (using the OVERFLOW-POSITION and OVERFLOW-DIMENSION parameters). In a flowing component, the data flowsfrom the top of the defined component to the bottom page margin and then begins to flowagain on the top page margin of the overflow page, until the data is complete. The startingposition of each type of component is defined by the POSITION parameter.
You can also specify the starting position of a component relative to another component, usingthe RELATIVE-TO, RELATIVE-POINT, and POSITION-POINT keywords. In this case, the relativecoordinates of the component's POSITION are interpreted based on where the component, towhich it is relative, ends. If the relative component is a flowing component, you can optionallyuse the REQUIRED-SPACE keyword in conjunction with the RELATIVE-TO keyword to specifywhere to start the current component.
The fixed or flowing aspect of the component is determined by the DIMENSION parameter. Fora fixed component, the DIMENSION parameter specifies sizes for the dimensions of thebounding box. However, for a flowing component the DIMENSION parameter specifies asterisks(* *) for the dimensions.
10. Linking a Report to Other Resources
Creating Reports With TIBCO® WebFOCUS Language 883

The COMPONENT syntax appears as:
COMPONENT=component-name, TYPE=component-type, POSITION=(x y), DIMENSION=(xsize ysize), [OVERFLOW-POSITION=(x y),] [OVERFLOW-DIMENSION=(xsize ysize),] [RELATIVE-TO=relative_component_name,] [RELATIVE-POINT=relative-value, POSITION-POINT=position-value, REQUIRED-SPACE=required-space-value,] [DRILLMAP=((L1 targetreport)),] $
where:
component-name
The name of the component must be a unique identifier, up to 16 characters. Itdesignates a component report that appears later in the request (in the same procedure(FOCEXEC) or in a called procedure), and is identified by SET COMPONENT=component-name syntax, using the same name.
Note: The SET syntax only tags styled reports that can participate in a compound report,so it can be placed before unstyled reports that precede the report to be named. Forexample, reports that generate extract files.
component-type
Specifies the type of component being declared. Currently, only REPORT is supported.
POSITION=(x y)
Specifies the (x y) coordinate on the page where the upper-left corner of the component isto be placed. All coordinates are in current UNITs (default inches), and (0 0) is the upper-left corner of the physical page.
Note: By default, coordinates are absolute locations on the physical page. If x or y ispreceded by a plus sign (+) or a minus sign ( - ), for example, (+.25 +0), the coordinate isrelative to the top-left page margin. If the RELATIVE-TO keyword is present, then a relativecoordinate is relative to the named object of RELATIVE-TO declared in the keyword.
DIMENSION=(xsize ysize)
Specifies the size of the bounding box of the component (in current UNITs).
For a fixed component, xsize and ysize must be numeric dimension sizes.
For a flowing component, xsize and ysize must both be asterisks DIMENSION = (* *).
OVERFLOW-POSITION=(x y) and OVERFLOW-DIMENSION=(xsize ysize)
These optional items specify the position and dimension on subsequent pages, if itoverflows its initial bounding box.
Creating a Compound Report
884

OVERFLOW-POSITION and OVERFLOW-DIMENSION are supported for flowing components,as well. For example:
COMPONENT='report2', TEXT='report2', TOC-LEVEL=2,POSITION=(0.5 1.7), DIMENSION=(* *), OVERFLOW-POSITION=(0.5 1.7), OVERFLOW-DIMENSION=(* *),
RELATIVE-TO=relative_component_name
Specifies another component with respect to which relative coordinates of the currentcomponent's POSITION are interpreted.
The relative component must either have a fixed position, or be generated prior to thecurrent component.
RELATIVE-POINT=relative-value and POSITION-POINT=position-value
These optional parameters designate which point on the current component is positionedrelative to which point on the relative component (for example, TOP-LEFT of the currentcomponent relative to BOTTOM-LEFT of the relative component).
Can be set to any combination of the following values:
TOP-LEFT
TOP-CENTER
TOP-RIGHT
CENTER-LEFT
CENTER
CENTER-RIGHT
BOTTOM-LEFT
BOTTOM-CENTER
BOTTOM-RIGHT
REQUIRED-SPACE=required-space-value
Specifies the minimum amount of space that must be left on the page, from where therelative component ends, in order to start the current component. If there is not enoughspace left from where the relative component ends, the current component will start on thenext page.
10. Linking a Report to Other Resources
Creating Reports With TIBCO® WebFOCUS Language 885

Can be one of the following:
An (x y) pair that specifies, in current units, the minimum horizontal and vertical spaceleft on the page after the relative component and that is needed in order to start thecurrent component.
AUTO, which will automatically calculate the remaining available space left on the pageafter the relative component and determine if the entire current component can fit intothat space. If it cannot fit in the available space, it will start the current component onthe next page.
DRILLMAP=((L1 targetreport))
Identifies the link identifier and the target report for a Drill Through hyperlink from thisreport. L1 is a sufficient link identifier at this time. For more information on Drill Throughreports, see How to Create a Drill Through in a PDF Compound Report on page 958.
Note: The double parentheses are required.
Example: Creating a Compound Layout Report With Document Syntax
In this simple example using the GGSALES Master File, the MERGE keyword specifies that aCoordinated Compound Layout Report is to be generated. Since the first BY field of eachcomponent is REGION, a page will be generated for each value of REGION, with the first report(Sales) positioned at (1 1) and the second report (Units) at (6.25 1).
Enter the following syntax in the Text Editor.
Creating a Compound Report
886
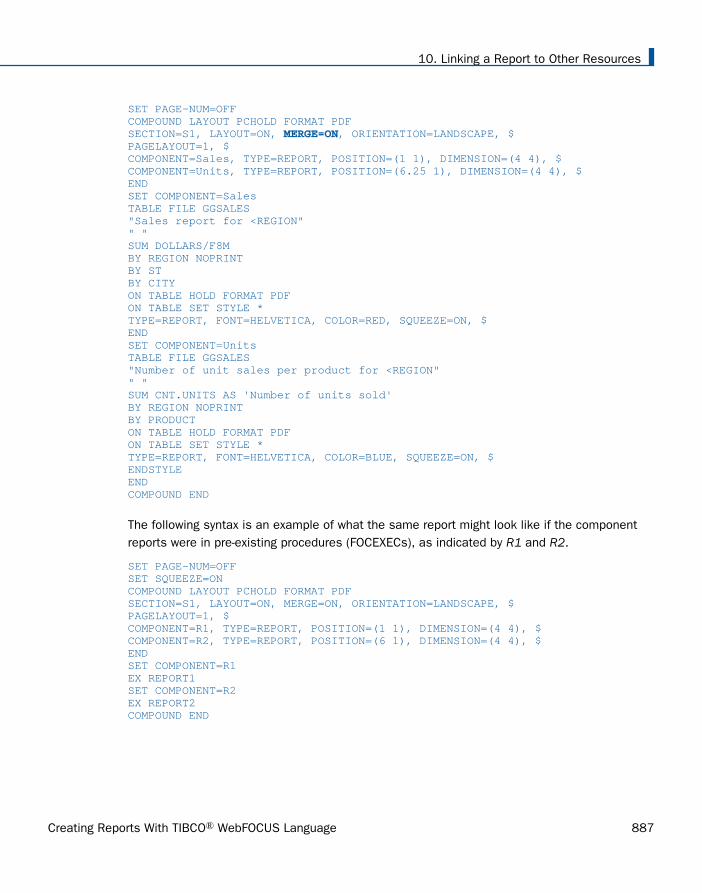
SET PAGE-NUM=OFFCOMPOUND LAYOUT PCHOLD FORMAT PDFSECTION=S1, LAYOUT=ON, MERGE=ON, ORIENTATION=LANDSCAPE, $PAGELAYOUT=1, $COMPONENT=Sales, TYPE=REPORT, POSITION=(1 1), DIMENSION=(4 4), $COMPONENT=Units, TYPE=REPORT, POSITION=(6.25 1), DIMENSION=(4 4), $ENDSET COMPONENT=SalesTABLE FILE GGSALES"Sales report for <REGION"" "SUM DOLLARS/F8MBY REGION NOPRINTBY STBY CITYON TABLE HOLD FORMAT PDFON TABLE SET STYLE *TYPE=REPORT, FONT=HELVETICA, COLOR=RED, SQUEEZE=ON, $ENDSET COMPONENT=UnitsTABLE FILE GGSALES"Number of unit sales per product for <REGION"" "SUM CNT.UNITS AS 'Number of units sold'BY REGION NOPRINTBY PRODUCTON TABLE HOLD FORMAT PDFON TABLE SET STYLE *TYPE=REPORT, FONT=HELVETICA, COLOR=BLUE, SQUEEZE=ON, $ENDSTYLEENDCOMPOUND END
The following syntax is an example of what the same report might look like if the componentreports were in pre-existing procedures (FOCEXECs), as indicated by R1 and R2.
SET PAGE-NUM=OFFSET SQUEEZE=ONCOMPOUND LAYOUT PCHOLD FORMAT PDFSECTION=S1, LAYOUT=ON, MERGE=ON, ORIENTATION=LANDSCAPE, $PAGELAYOUT=1, $COMPONENT=R1, TYPE=REPORT, POSITION=(1 1), DIMENSION=(4 4), $COMPONENT=R2, TYPE=REPORT, POSITION=(6 1), DIMENSION=(4 4), $ENDSET COMPONENT=R1EX REPORT1SET COMPONENT=R2EX REPORT2COMPOUND END
10. Linking a Report to Other Resources
Creating Reports With TIBCO® WebFOCUS Language 887

The first page of output is:
Example: Creating a Coordinated Graph With Document Syntax
This example, using the GGSALES Master File, generates a Coordinated Compound Layoutreport that contains a graph and a report (by replacing the first report in the previous examplewith a graph). Note that a graph request with two BY fields will generate a graph for each valueof the first BY field (REGION), and that these files are named by appending sequence numbersto the HOLD file name. For example, HOLD0.SVG, HOLD1.SVG, and so on.
To place these graphs into a report as a component of a Coordinated Compound Layout report,several COMPUTE commands are required to construct the name of each graph file(HOLD0.SVG, HOLD1.SVG, and so on). Additionally, a COMPUTE command will add the imagefiles into the HEADING of the TABLE request so that they are associated with the same valueof REGION, from which they were originally produced.
Enter the following syntax in the Text Editor.
SET PAGE-NUM=OFFCOMPOUND LAYOUT PCHOLD FORMAT PDFSECTION=S1, LAYOUT=ON, MERGE=ON, ORIENTATION=LANDSCAPE, $PAGELAYOUT=1, $COMPONENT=Sales, TYPE=REPORT, POSITION=(0.25 1), DIMENSION=(4 4), $COMPONENT=Fuel, TYPE=REPORT, POSITION=(7.25 1), DIMENSION=(4 4), $END
Creating a Compound Report
888

SET COMPONENT=SalesGRAPH FILE GGSALESSUM PCT.DOLLARSBY REGION NOPRINTBY PRODUCTON GRAPH SET LOOKGRAPH HBARON GRAPH HOLD AS HOLD FORMAT SVGON GRAPH SET GRAPHSTYLE *setPlace(true);setColorMode(1);setDepthRadius(0);setDepthAngle(0);setDisplay(getO1MajorGrid(),false);setTransparentBorderColor(getFrame(),true);setDisplay(getDataText(),true);setTextFormatPreset(getDataText(),28);setFontSizeAbsolute(getDataText(),true);setFontSizeInPoints(getDataText(),9);setPlaceResize(getDataText(),0);setFontStyle(getDataText(),0);setTransparentBorderColor(getSeries(0),true);setDisplay(getO1AxisLine(),false);setFontSizeAbsolute(getO1Label(),true);setFontSizeInPoints(getO1Label(),9);setPlaceResize(getO1Label(),0);setFontSizeAbsolute(getY1Label(),true);setFontSizeInPoints(getY1Label(),9);setPlaceResize(getY1Label(),0);setTextFormatPreset(getY1Label(),28);setGridStyle(getY1MajorGrid(),3);setDisplay(getY1AxisLine(),false);setDisplay(getY1MajorGrid(),false);setDisplay(getY1Label(),false);setDataTextPosition(3);setTextString(getO1Title(),"");setTextString(getY1Title(),"");setFontStyle(getTitle(),0);ENDSTYLEEND
10. Linking a Report to Other Resources
Creating Reports With TIBCO® WebFOCUS Language 889

TABLE FILE GGSALES"Percent of Sales by Product in <REGION"" "SUMCOMPUTE CNTR/I4 = CNTR + 1; NOPRINTCOMPUTE CNTR2/A4 = IF &FOCGRAPHCNT EQ 1 THEN ' ' ELSE FTOA(CNTR-1,'(F4)','A4'); NOPRINTCOMPUTE IMG/A16 = 'HOLD'||LJUST(4,CNTR2,'A4')|| '.svg'; NOPRINTBY REGION NOPRINTON REGION PAGE-BREAKON TABLE HOLD FORMAT PDFON TABLE SET STYLE *type=HEADING, IMAGE=(IMG), position=(0 0), $TYPE=REPORT,PAGE-LOCATION=OFF,$TYPE=REPORT, FONT=HELVETICA, COLOR=BLACK, SQUEEZE=ON, $ENDSTYLEEND
SET COMPONENT=FuelTABLE FILE GGSALES"Sales report for <REGION"" "SUM DOLLARS/F8MBY REGION NOPRINTBY STBY CITYON TABLE HOLD FORMAT PDFON TABLE SET STYLE *TYPE=REPORT, FONT=HELVETICA, COLOR=RED, SQUEEZE=ON, $ENDSTYLEENDCOMPOUND END
Creating a Compound Report
890

The first page of output is:
Example: Creating Multi-Page Layouts With Document Syntax
In this example using the GGSALES Master File, multi-page layouts allow components to beplaced in fixed locations on multiple pages. For example, a Coordinated Compound Layoutreport can contain component reports R1 and R2 for each value of the first sort field on theodd-numbered pages (front side), and R3 on the even-numbered pages (reverse side).Additionally, you can place the same heading that contains a logo and some text with theembedded value of the first sort field at the top of each side.
For the heading report, create a procedure (named HEADER.FEX), and enter the followingsyntax:
TABLE FILE GGSALES" ""Report package for <REGION"BY REGION NOPRINTON TABLE HOLD FORMAT PDFON TABLE SET STYLE *TYPE=REPORT, FONT=HELVETICA, SIZE=20, $TYPE=REPORT, IMAGE=poweredbyibi.gif, POSITION=(+.25 +.25), $TYPE=HEADING, LINE=2, ITEM=1, POSITION=4, $ENDSTYLEEND
10. Linking a Report to Other Resources
Creating Reports With TIBCO® WebFOCUS Language 891

We will use components R1 and R2 from the previous example. If you did not already do so,save them as REPORT1.FEX and REPORT2.FEX. Enter the following syntax as the R3 reportcomponent, by creating a procedure named REPORT3.FEX.
TABLE FILE GGSALES"Report R3 for <REGION"BY REGION NOPRINTSUM DOLLARS BY STON TABLE HOLD FORMAT PDFON TABLE SET STYLE *TYPE=REPORT, FONT=HELVETICA, COLOR=GREEN, $ENDSTYLEEND
From the Text Editor, enter the following syntax specifying that the R1 and R2 reportcomponents appear on page 1. The R3 report component appears on page 2, and the headingreport will appear on all pages of the document.
SET PAGE-NUM=OFFSET SQUEEZE=ONCOMPOUND LAYOUT PCHOLD FORMAT PDFSECTION=S1, LAYOUT=ON, MERGE=ON, ORIENTATION=LANDSCAPE, $PAGELAYOUT=ALL, $COMPONENT=HEADER, TYPE=REPORT, POSITION=(1 1), DIMENSION=(4 4), $PAGELAYOUT=1, $COMPONENT=R1, TYPE=REPORT, POSITION=(1 3), DIMENSION=(4 4), $COMPONENT=R2, TYPE=REPORT, POSITION=(6 3), DIMENSION=(4 4), $PAGELAYOUT=2, $COMPONENT=R3, TYPE=REPORT, POSITION=(4 3), DIMENSION=(4 4), $END
SET COMPONENT=HEADEREX HEADERSET COMPONENT=R1EX REPORT1SET COMPONENT=R2EX REPORT2SET COMPONENT=R3EX REPORT3COMPOUND END
Creating a Compound Report
892

Page 1 of the output is:
Page 2 of the output is:
10. Linking a Report to Other Resources
Creating Reports With TIBCO® WebFOCUS Language 893

Example: Creating Page Overflow With Document Syntax
A common type of report contains a fixed layout at the top of the page, followed by a reportcontaining detail records of unfixed length. For example, a brokerage statement may containthe customer name and address, an asset-allocation graph, and a comparison of the portfoliowith market indexes at the top, followed by a list of securities held in the account. If the list ofsecurities overflows the first page, we would like it to continue on the second page,underneath the common heading which appears on all pages (a logo, account number, pagenumber for instance). The OVERFLOW-POSITION and OVERFLOW-DIMENSION syntax enables usto specify where on the overflow page the report continues and what its maximum length oneach overflow page should be. (Note that its width should not vary from one page to the next.)
The following example, using the GGSales Master File, demonstrates how you can useOVERFLOW-POSITION and OVERFLOW-DIMENSION to reposition the second report component(R2) so that it begins below the first component on the initial page, and two inches below thetop of the page on subsequent pages. Note that this leaves enough space for the headerreport component (HEADER) at the top of each page.
Additionally, PAGELAYOUT=ALL forces the HEADER component to appear at the top of eachoverflow page.
Enter the following syntax in the Text Editor.
SET PAGE-NUM=OFFCOMPOUND LAYOUT PCHOLD FORMAT PDFSECTION=Example, LAYOUT=ON, MERGE=OFF, $ PAGELAYOUT=1, $ COMPONENT=R1, TYPE=REPORT, POSITION=(1.5 2), DIMENSION=(8 3), $ COMPONENT=R2, TYPE=REPORT, POSITION=(.5 5), DIMENSION=(8 5), OVERFLOW-POSITION=(.5 2), OVERFLOW-DIMENSION=(8 8.5), $ PAGELAYOUT=ALL, $ COMPONENT=HEADER, TYPE=REPORT, POSITION=(1.25 1), DIMENSION=(6 1), $END
SET COMPONENT=R1TABLE FILE GGSALESHEADING CENTER"Report 1""Sales Summary by Category"" "SUM UNITS BUDUNITS DOLLARS BUDDOLLARS BY CATEGORYON TABLE HOLD FORMAT PDFON TABLE SET STYLE *TYPE=REPORT, FONT=HELVETICA, SQUEEZE=ON, $ENDSTYLEEND
Creating a Compound Report
894
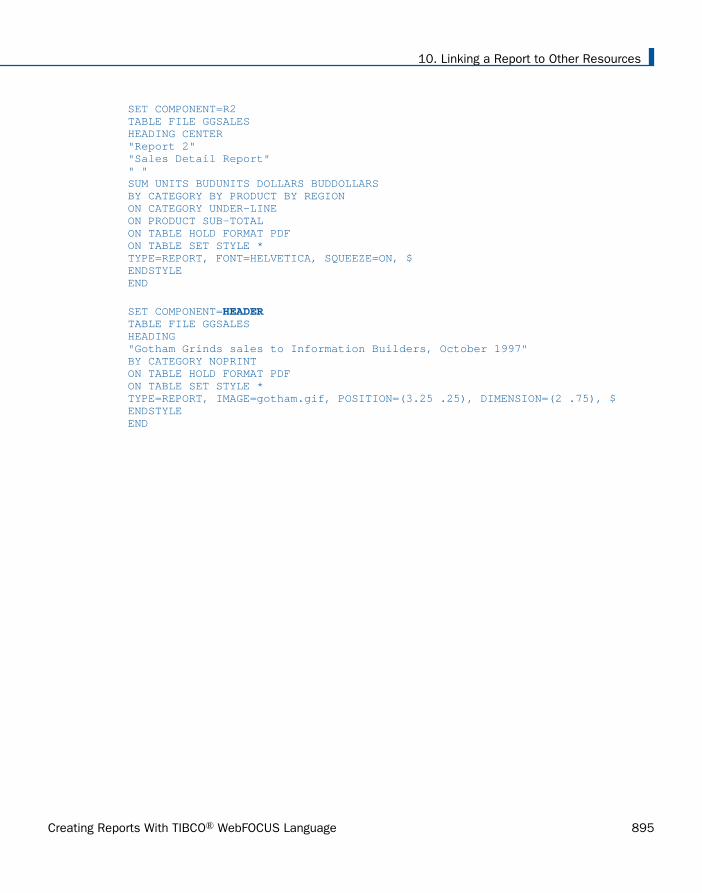
SET COMPONENT=R2TABLE FILE GGSALESHEADING CENTER"Report 2""Sales Detail Report"" "SUM UNITS BUDUNITS DOLLARS BUDDOLLARSBY CATEGORY BY PRODUCT BY REGIONON CATEGORY UNDER-LINEON PRODUCT SUB-TOTALON TABLE HOLD FORMAT PDFON TABLE SET STYLE *TYPE=REPORT, FONT=HELVETICA, SQUEEZE=ON, $ENDSTYLEEND
SET COMPONENT=HEADER TABLE FILE GGSALESHEADING"Gotham Grinds sales to Information Builders, October 1997"BY CATEGORY NOPRINTON TABLE HOLD FORMAT PDFON TABLE SET STYLE *TYPE=REPORT, IMAGE=gotham.gif, POSITION=(3.25 .25), DIMENSION=(2 .75), $ENDSTYLEEND
10. Linking a Report to Other Resources
Creating Reports With TIBCO® WebFOCUS Language 895

The first page of output is:
Creating a Compound Report
896

The second page of output is:
Syntax: How to Draw Objects With Document Syntax
A variety of objects can be drawn on the page to enhance a report. The currently supportedobjects include Lines, Boxes, Static text strings, and Images.
The syntax for drawing these objects may appear in the StyleSheet of a report, but they mayalso be included within a PAGELAYOUT grouping in the COMPOUND LAYOUT declarations. Thesyntax for each drawing object is described below.
Lines. To draw a line from point (x1 y1) to point (x2 y2), enter the following syntax:
OBJECT=LINE, POSITION=(x1 y1), ENDPOINT=(x2 y2), [BORDER=b,] [BORDER-COLOR=c,] [BORDER-STYLE=s,]$
Optionally, the border attributes BORDER, BORDER-COLOR, and BORDER-STYLE follow theexisting BORDER syntax, as shown below:
10. Linking a Report to Other Resources
Creating Reports With TIBCO® WebFOCUS Language 897

OBJECT=LINE, POSITION=(1 1), ENDPOINT=(8 1), BORDER=HEAVY, BORDER-COLOR=RED, BORDER-STYLE=DASHED, $
Boxes. To draw a box, whose upper left corner is at (x y), and whose dimensions are xdimby ydim, enter the following syntax:
OBJECT=BOX, POSITION=(x y), DIMENSION=(xdim ydim), BACKCOLOR=c, [BORDER=b,] [BORDER-COLOR=bc,] [BORDER-STYLE=bs,] $
Tip: The background color, which is c, specifies the color with which the box is filled andcan be any valid color. For example, yellow or RGB(200 200 200).
As in the BORDER syntax, the individual sides of the box can be styled separately. Forexample:
OBJECT=BOX, POSITION=(1 1), DIMENSION=(2 3), BACKCOLOR=YELLOW, BORDER=HEAVY, BORDER-TOP-COLOR=RED, BORDER-BOTTOM-COLOR=BLUE, $
Note that, as in the BORDER syntax, attributes of lines or boxes that are not explicitlyspecified have the following defaults:
Color: black
Style: solid
Width border attribute: medium
Static text strings. Static text strings display text that you enter as part of the objectdescription.
You can format the text displayed in the text object by including markup tags within the textportion of the text object. A report with markup tags in a text object is called a markupreport. A markup report can be generated as a PDF, DHTML, PPT, or PPTX output file.WebFOCUS supports a subset of HTML tags and its own page numbering tags. To activatethese markup tags (so that they are treated as formatting elements instead of displayingas text), add the attribute MARKUP=ON to the string object. For additional information, see Text Formatting Markup Tags for a Text Object on page 903.
To draw a static text string at position (x y), enter the following syntax:
OBJECT=STRING, POSITION=(X Y), TEXT='any text you like', [MARKUP={ON|OFF},] [FONT=f,] [SIZE=sz,] [STYLE=st,] [COLOR=c,] [WRAP=ON, DIMENSION=(xdim ydim),] [LINESPACING=linesoption ,] $
Creating a Compound Report
898

where:
POSITION=(xy)
Specifies the (x y) coordinate on the page where the upper-left corner of thecomponent is to be placed. All coordinates are in current UNITs (default is inches),and (0 0) is the upper-left corner of the physical page.
Note: By default, coordinates are absolute locations on the physical page. If x or y ispreceded by a plus sign (+) or minus sign ( - ), for example, (+.25 +0), the coordinateis relative to the left or top page margin.
TEXT='any text you like'
Is the text to be placed in the text object.
Note: If your text contains any open caret characters (<), you must put a blank spaceafter each open caret that is part of the text. If you do not, everything following theopen caret will be interpreted as the start of a markup tag and will not display as text.
MARKUP={ON|OFF}
ON causes the markup tags to be interpreted as formatting options. OFF displays thetags as text. OFF is the default value.
FONT=f
Is the default font to be used for the text.
SIZE=sz
Is the default font size to be used for the text.
STYLE=st
Is the default font style to be used for the text.
COLOR=c
Is the default font color to be used for the text.
WRAP=ON
Specifies that the text should wrap when it reaches the end of the text objectbounding box.
DIMENSION=(xdimydim)
Specifies the size of the text object bounding box (in current UNITs).
LINESPACING=linesoption
Determines the amount of vertical space between lines of text in a paragraph. Twotypes of LINESPACING attributes are supported:
LINESPACING={SINGLE|1.5LINES|DOUBLE}
or
10. Linking a Report to Other Resources
Creating Reports With TIBCO® WebFOCUS Language 899

LINESPACING=type(value)
where:
SINGLE
Accommodates the largest font in that line, plus a small amount of extra space. Theamount of extra space varies depending on the font used. SINGLE is the defaultoption.
1.5LINES
Is one-and-one-half times that of single line spacing.
DOUBLE
Is twice that of single line spacing.
type(value)
Can be one of the following where value is a positive number:
Type Value Example
MULTIPLE The percentage by which toincrease or decrease the linespace.
LINESPACING=MULTIPLE(1.2)increases line space by 20percent.
MIN The minimum line space (inthe unit specified by UNITSparameter) needed to fit thelargest font on the line.
LINESPACING=MIN(0.5)provides a minimum line spaceof 0.5 inch when UNITS=IN.
EXACT The fixed line space (in theunit specified by UNITSparameter) that WebFOCUSdoes not adjust.
LINESPACING=EXACT(.3)provides a fixed line space of0.3 inch when UNITS=IN.
Optionally, you may specify the FONT, SIZE, STYLE, and COLOR attributes as you would forany textual object in a report. For example:
Creating a Compound Report
900

OBJECT=STRING, POSITION=(1 1), TEXT='Hello world!', FONT=TIMES, SIZE=12, STYLE=BOLD, COLOR=RED, $
Note: A position of a string is measured from its bottom left to allow strings with differentheights to be aligned to a common base-line. However, if WRAP=ON is present, it indicatesthat the string should be wrapped to a bounding box whose top-left corner is at (x y) andwhose dimensions are (xdim ydim). In this case, the top left of the text string is positionedat point (x y).
Images. An image can be drawn as a drawing object by entering the following syntax:
OBJECT=IMAGE, IMAGE=file, POSITION=(x y), DIMENSION=(xdim ydim), $
Note: The image file name=file can be any image file valid in a PDF report. POSITION isused as with a conventional image, and DIMENSION is used in place of the SIZE attributeof a conventional image.
10. Linking a Report to Other Resources
Creating Reports With TIBCO® WebFOCUS Language 901
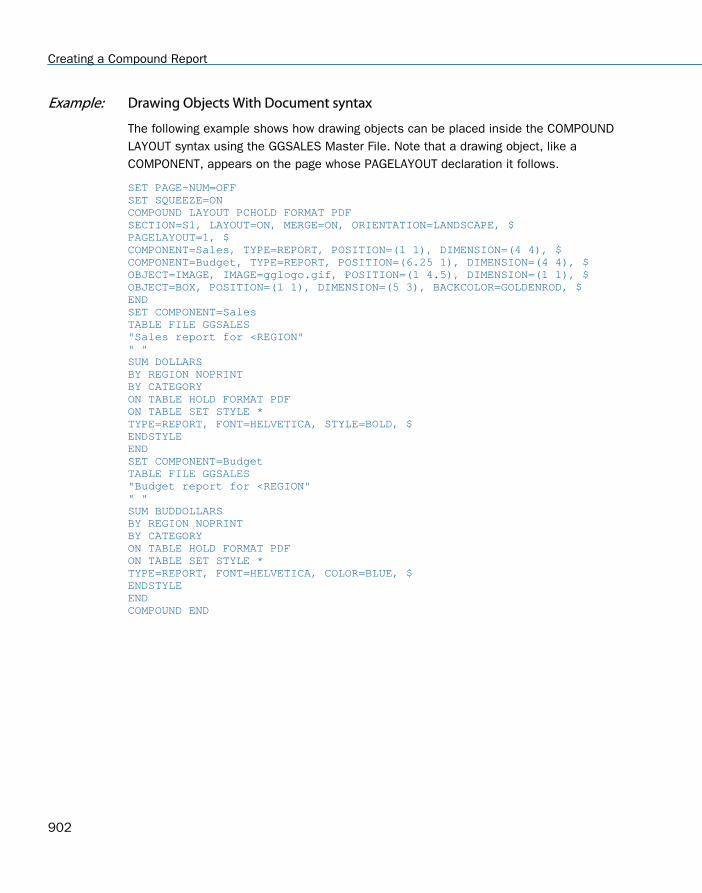
Example: Drawing Objects With Document syntax
The following example shows how drawing objects can be placed inside the COMPOUNDLAYOUT syntax using the GGSALES Master File. Note that a drawing object, like aCOMPONENT, appears on the page whose PAGELAYOUT declaration it follows.
SET PAGE-NUM=OFFSET SQUEEZE=ONCOMPOUND LAYOUT PCHOLD FORMAT PDFSECTION=S1, LAYOUT=ON, MERGE=ON, ORIENTATION=LANDSCAPE, $PAGELAYOUT=1, $COMPONENT=Sales, TYPE=REPORT, POSITION=(1 1), DIMENSION=(4 4), $COMPONENT=Budget, TYPE=REPORT, POSITION=(6.25 1), DIMENSION=(4 4), $ OBJECT=IMAGE, IMAGE=gglogo.gif, POSITION=(1 4.5), DIMENSION=(1 1), $ OBJECT=BOX, POSITION=(1 1), DIMENSION=(5 3), BACKCOLOR=GOLDENROD, $ENDSET COMPONENT=SalesTABLE FILE GGSALES"Sales report for <REGION"" "SUM DOLLARSBY REGION NOPRINTBY CATEGORY ON TABLE HOLD FORMAT PDFON TABLE SET STYLE *TYPE=REPORT, FONT=HELVETICA, STYLE=BOLD, $ENDSTYLEENDSET COMPONENT=BudgetTABLE FILE GGSALES"Budget report for <REGION"" "SUM BUDDOLLARSBY REGION NOPRINTBY CATEGORYON TABLE HOLD FORMAT PDFON TABLE SET STYLE *TYPE=REPORT, FONT=HELVETICA, COLOR=BLUE, $ENDSTYLEENDCOMPOUND END
Creating a Compound Report
902

The first page of output is:
Note: A drawing object will not be drawn unless there is at least one COMPONENT in itsPAGELAYOUT.
Syntax: How to Display Grids With Document Syntax
The SET LAYOUTGRID command can be used as an aid to manually develop report layouts.Displaying grids superimposes a light one-inch by one-inch grid on the page so that thelocations of the various report components can be verified. Currently, the grid only works ininches.
Enter the following syntax to display grids:
SET LAYOUTGRID=ON
Reference: Text Formatting Markup Tags for a Text Object
Note: If your text contains any open caret characters (<), you must put a blank space aftereach open caret that is part of the text. If you do not, everything following the open caret willbe interpreted as the start of a markup tag and will not display as text.
Font Properties
The font tag supports three attributes: face, size, and color (where the color must be specifiedas the hexadecimal number code for the color):
<font face="font" size=[+|-]n color=color_code>text</font>
10. Linking a Report to Other Resources
Creating Reports With TIBCO® WebFOCUS Language 903

For example:
<font face="New Century Schoolbook">Test1</font><font face="Times" size=12>test2</font><font face="Times New Roman" color=#0000FF size=+4>Test3</font> <font size=-2 face="Times New Roman" color=#0000FF >Test4</font>
Text Styles
The supported text styles are bold, italic, underline, and superscript:
Bold: <b>text</b>
Italic: <i>text</i>
Underline: <u>text</u>
Superscript: <sup>text</sup>
Line Breaks
The line break tag after a portion of text begins the next portion of text on a new line. Note thatthere is no closing tag for a line break:
<br>
Text Alignment
The alignment options pertain to wrapped text, as well as specified line breaks. Both horizontaljustification and vertical alignment are supported.
Horizontal Justification
Left Justification:
<left>text</left>
Right Justification:
<right>text</right>
Center Justification:
<center>text</center>
Full Justification:
<full>text</full>
Vertical Alignment
Creating a Compound Report
904

Top Alignment:
<top>text</top>
Middle Alignment:
<mid>text</mid>
Bottom Alignment:
<bottom>text</bottom>
Unordered (Bullet) List
The unordered (ul) list tag encloses a bullet list. Each item is enclosed in a list item tag (li).The start tag and end tag for the list must each be on its own line. Each list item must start ona new line:
<ul><li>list item1</li><li>list item2</li> . . .</ul>
By default, the bullet type is disc. You can also specify circle or square:
<ul type=disc>
<ul type=circle>
<ul type=square>
Ordered (Number or Letter) List
The ordered (ol) list tag encloses a list in which each item has a consecutive number or letter.Each item is enclosed in a list item tag (li). The start tag and end tag for the list must each beon its own line. Each list item must start on a new line:
<ol><li>list item1</li><li>list item2</li> . . .</ol>
10. Linking a Report to Other Resources
Creating Reports With TIBCO® WebFOCUS Language 905

By default, Arabic numerals (type=1) are used for the ordering of the list. You can specify thefollowing types of order:
Arabic numerals (the default): <ol type=1>
Lowercase letters: <ol type=a>
Uppercase letters: <ol type=A>
Lowercase Roman numerals: <ol type=I>
Uppercase Roman numerals: <ol type=I>
Hyperlinks
Hyperlinks can be included within text markup in PDF documents.
The syntax for the anchor markup tag is a subset of the HTML anchor syntax:
<a href="hyperlink">Text to display</a>
where:
hyperlink
Is the hyperlink to jump to when the text is clicked.
Text to display
Is the text to display for the hyperlink.
For example:
<a href="http://www.example.com/help.htm">Click here for help</a>
No other attributes are supported in the anchor markup tag.
Page Numbering and Dates
There are two pseudo-HTML tags for embedding page numbers in text on a Page Master for aCoordinated Compound Layout report:
Current page number: <ibi-page-number/>
Total number of pages: <ibi-total-pages/>
Note that when MARKUP=ON, space is allocated for the largest number of pages, so there maybe a wide gap between the page number and the text that follows. To remove the extra spacein the text object that has the page numbering tags:
If specific styling of the text object is not required, do not insert markup tags, and turnMARKUP=OFF.
Creating a Compound Report
906

MARKUP=OFF, TEXT='Page <ibi-page-number/> of <ibi-total-pages/> of Sales Report', $
This displays the following
Page 1 of 100 of Sales Report
If specific styling of the text object is required, you must set MARKUP=ON. WithMARKUP=ON, set WRAP=OFF and do not place any styling tags between the page numbervariables within the string. Tags can be used around the complete Page n of m string. Thefollowing code produces a page number string without the extra spaces:
MARKUP=ON, WRAP=OFF, TEXT='<font face="ARIAL" size=10><i>Page <ibi-page-number/> of <ibi-total-pages/> of Sales Report </i>', $
This displays the following
To display a date in the report output, insert a WebFOCUS date variable in a text object on aPage Master (such as &DATEtrMDYY) in the text object.
10. Linking a Report to Other Resources
Creating Reports With TIBCO® WebFOCUS Language 907

Example: Formatting a Compound Layout Text Object With Markup Tags
The following request displays a text object with markup tags in a PDF output file.
Note: Text markup syntax cannot contain hidden carriage return or line feed characters. Forpurposes of presenting the example in this documentation, line feed characters have beenadded so that the sample code wraps to fit within the printed page. To run this example in yourenvironment, copy the code into a text editor and delete any line feed characters within thetext markup object by going to the end of each line and pressing Delete. In some instances,you may need to add a space to maintain the structure of the string. For additional informationon displaying carriage returns within the text object see Text Formatting Markup Tags for a TextObject on page 903.
SET PAGE-NUM=OFFSET LAYOUTGRID=ONTABLE FILE GGSALESBY REGION NOPRINTON TABLE PCHOLD AS LINESP1 FORMAT PDFON TABLE SET STYLE *type=report, size=8, $object=string, position=(1 1), dimension=(7 3), wrap=on, markup=on, linespacing=multiple(3), text='<b><font face="Arial" size=12>This paragraph is triple-spaced (LINESPACING=MULTIPLE(3)):</font></b> <full>Our <i>primary</I> goal for fiscal 2006 was to accelerate our transformation to customer centricity. In this letter, I’d like to give you an update on this work, which contributed to the 22-percent increase in earnings from continuing operations we garnered for fiscal 2006. Since the past is often prologue to the future, I’d like to describe how customer centricity is influencing not only our goals for fiscal 2007, but also our long-term plans. At Gotham Grinds, customer centricity means treating each customer as a unique individual, meeting their needs with end-to-end solutions, and engaging and energizing our employees to serve them.</full>', $ENDSTYLEEND
In this request:
No fields from the data source are displayed. Only the text object displays on the output.
The SET LAYOUTGRID command displays a grid to indicate the coordinates and dimensionsof the text object.
The OBJECT=STRING declaration specifies triple spacing: LINESPACING=MULTIPLE(3).
The following text is displayed in boldface, in the Arial font face, and with a font size of 12(the default is 8 from the TYPE=REPORT declaration):
‘This paragraph is triple-spaced (LINESPACING=MULTIPLE(3)):’
The markup for this formatting is:
Creating a Compound Report
908
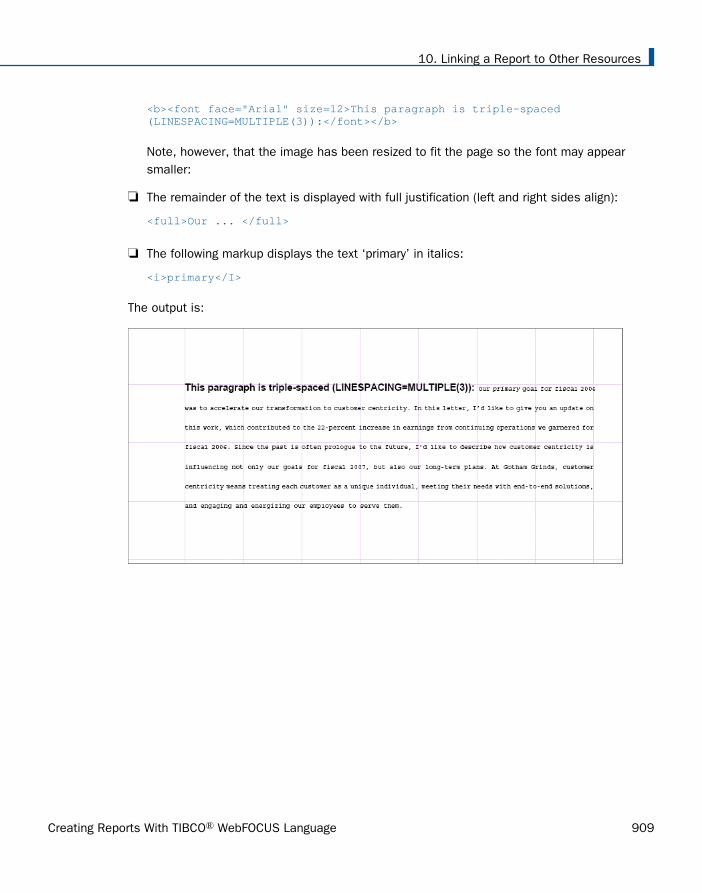
<b><font face="Arial" size=12>This paragraph is triple-spaced (LINESPACING=MULTIPLE(3)):</font></b>
Note, however, that the image has been resized to fit the page so the font may appearsmaller:
The remainder of the text is displayed with full justification (left and right sides align):
<full>Our ... </full>
The following markup displays the text ‘primary’ in italics:
<i>primary</I>
The output is:
10. Linking a Report to Other Resources
Creating Reports With TIBCO® WebFOCUS Language 909
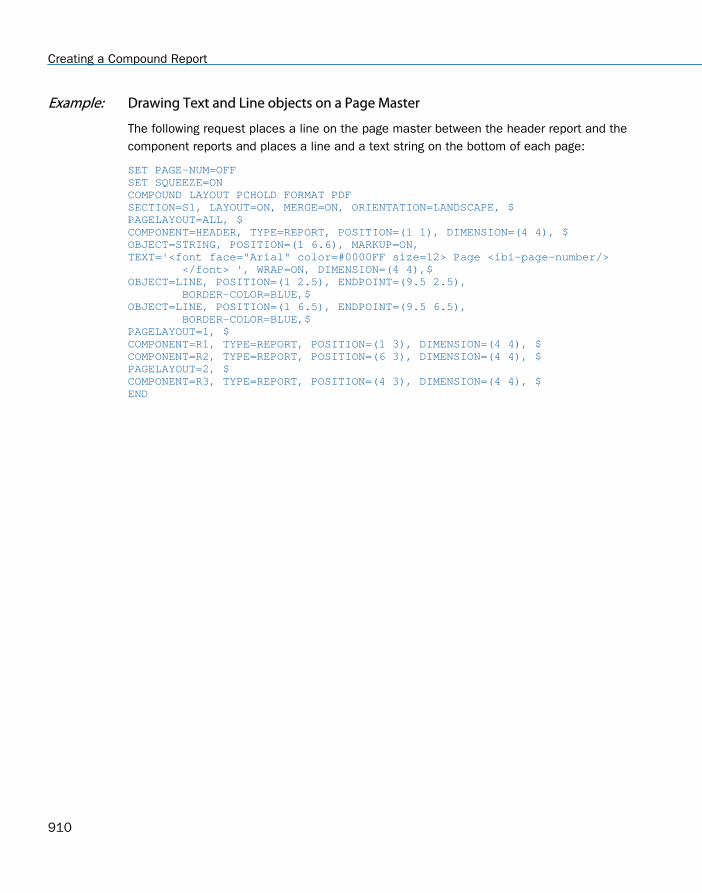
Example: Drawing Text and Line objects on a Page Master
The following request places a line on the page master between the header report and thecomponent reports and places a line and a text string on the bottom of each page:
SET PAGE-NUM=OFFSET SQUEEZE=ONCOMPOUND LAYOUT PCHOLD FORMAT PDFSECTION=S1, LAYOUT=ON, MERGE=ON, ORIENTATION=LANDSCAPE, $PAGELAYOUT=ALL, $COMPONENT=HEADER, TYPE=REPORT, POSITION=(1 1), DIMENSION=(4 4), $OBJECT=STRING, POSITION=(1 6.6), MARKUP=ON,TEXT='<font face="Arial" color=#0000FF size=12> Page <ibi-page-number/> </font> ', WRAP=ON, DIMENSION=(4 4),$OBJECT=LINE, POSITION=(1 2.5), ENDPOINT=(9.5 2.5), BORDER-COLOR=BLUE,$OBJECT=LINE, POSITION=(1 6.5), ENDPOINT=(9.5 6.5), BORDER-COLOR=BLUE,$PAGELAYOUT=1, $COMPONENT=R1, TYPE=REPORT, POSITION=(1 3), DIMENSION=(4 4), $COMPONENT=R2, TYPE=REPORT, POSITION=(6 3), DIMENSION=(4 4), $PAGELAYOUT=2, $COMPONENT=R3, TYPE=REPORT, POSITION=(4 3), DIMENSION=(4 4), $END
Creating a Compound Report
910

SET COMPONENT=HEADERTABLE FILE GGSALES" ""Report package for <REGION"BY REGION NOPRINTON TABLE HOLD FORMAT PDFON TABLE SET STYLE *TYPE=REPORT, FONT=HELVETICA, SIZE=20, $TYPE=REPORT, IMAGE=gglogo.gif, POSITION=(+.25 +.25), $TYPE=HEADING, LINE=2, ITEM=1, POSITION=1.5, $ENDSTYLEENDSET COMPONENT=R1TABLE FILE GGSALES"Sales report for <REGION"" "SUM DOLLARS/F8MBY REGION NOPRINTBY STBY CITYON TABLE SET STYLE *TYPE=REPORT, FONT=HELVETICA, COLOR=RED, SQUEEZE=ON, $ENDSTYLEENDSET COMPONENT=R2TABLE FILE GGSALES"Number of unit sales per product for <REGION"" "SUM CNT.UNITS AS 'Number of units sold'BY REGION NOPRINTBY PRODUCTON TABLE SET STYLE *TYPE=REPORT, FONT=HELVETICA, COLOR=BLUE, SQUEEZE=ON, $ENDSTYLEENDSET COMPONENT=R3TABLE FILE GGSALES"Report R3 for <REGION"BY REGION NOPRINTSUM DOLLARS BY STON TABLE SET STYLE *TYPE=REPORT, FONT=HELVETICA, COLOR=GREEN, $ENDSTYLEENDCOMPOUND END
10. Linking a Report to Other Resources
Creating Reports With TIBCO® WebFOCUS Language 911
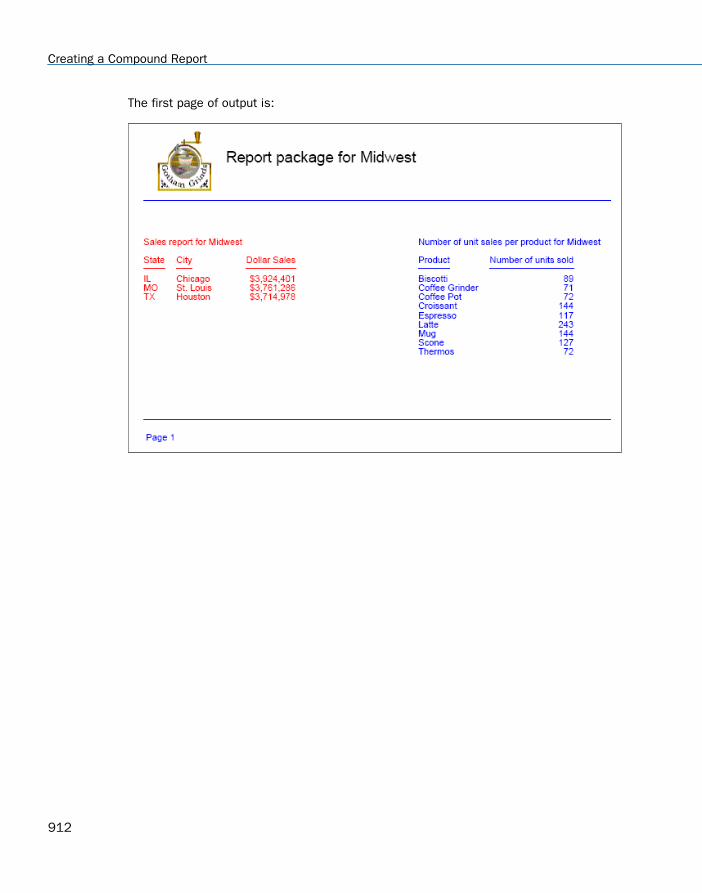
The first page of output is:
Creating a Compound Report
912

The second page of output has the same drawing objects:
Example: Vertically Aligning Text Markup in PDF Report Output
The following request creates three boxes and places a text string object within each of them:
In the left box, the text is aligned vertically at the top.
In the middle box, the text is aligned vertically at the middle.
10. Linking a Report to Other Resources
Creating Reports With TIBCO® WebFOCUS Language 913

In the right box, the text is aligned vertically at the bottom.
Note: Text markup syntax cannot contain hidden carriage return or line feed characters. Forpurposes of presenting the example in this documentation, line feed characters have beenadded so that the sample code wraps to fit within the printed page. To run this example in yourenvironment, copy the code into a text editor and delete any line feed characters within thetext markup object by going to the end of each line and pressing Delete. In some instances,you may need to add a space to maintain the structure of the string. For additional informationon displaying carriage returns within the text object see Text Formatting Markup Tags for a TextObject on page 903.
SET PAGE-NUM=OFFTABLE FILE GGSALESBY REGION NOPRINTON TABLE PCHOLD FORMAT PDFON TABLE SET STYLE *type=report, font=arial, size=10, $object=box, position=(1 1), dimension=(6 1), $object=line, position=(3 1), endpoint=(3 2), $object=line, position=(5 1), endpoint=(5 2), $ object=string, text='<top>Vertically aligned text within a text object using top alignment.</top>', position=(1.05 1), dimension=(2 1), linespacing=exact(.15), markup=on, wrap=on, $object=string, text='<mid>Vertically aligned text within a text object using middle alignment.</mid>', position=(3.05 1), dimension=(2 1), linespacing=exact(.15), markup=on, wrap=on, $object=string, text='<bottom>Vertically aligned text within a text object using bottom alignment.</bottom>', position=(5.05 .9), dimension=(2 1),linespacing=exact(.15), markup=on, wrap=on, $ ENDSTYLEEND
The output is:
Reference: Coordinated Compound Layout Reports With Missing Data
A Coordinated Compound Layout report is comprised of individual component reports or graphswith a common first sort field. The compound procedure generates an output document with aseparate page (or set of pages) for each individual value of the sort field, with the embeddedcomponents segmented to display the data that corresponds to that sort field value.
Creating a Compound Report
914
A Coordinated Compound Layout report page is generated in the designated page layout forevery sort field value found in at least one of the component reports, presenting theappropriate data for those components where data exists for that value, and presenting anempty component report where data does not exist.
The way an empty component is represented on the report page is dependent on how thecomponent positioning is defined within the Coordinated Compound Layout report.Components can be defined with absolute positioning or relative to other components in thelayout. If the empty component and subsequent components on the page are defined withabsolute positioning, the empty component report will display as blank space in the designatedlocation. If relative positioning is defined between the empty component and subsequentcomponents, the subsequent components will float up on the page, and no empty space willbe displayed in the area defined for the empty component.
In compound reports with relative positioning defined between reports, when an empty reportis encountered, the report following the empty report is positioned vertically relative to thebottom of the last non-empty report and horizontally relative to the page margin. This meansthat when a report contains no data, the subsequent report will float up (vertically) and beginrelative to the previous report but it will not move horizontally on the page relative to either ofthe previous reports
Using POSITION = (X Y), the placement of a report is designated by the left coordinate(X = horizontal) and the top coordinate (Y = vertical). Each of these coordinates can be definedindependently as relative to the previous report or in a fixed position on the page.
To define positioning so that the report floats up on the page to replace the empty report but isanchored in a fixed left position on the page, you can define the Y coordinate (top) as relativeand anchor the X coordinate (left). To anchor one of the position coordinates, change thereference from a relative position (+/-) to an absolute position. For example:
Both coordinates relative: POSITION(+0.003 +0.621)
Anchor horizontal / flow vertical: POSITION( 0.520 +0.621)
You do not need to change or add any WebFOCUS syntax to your request in order to takeadvantage of this feature. You will, however, want to pay attention to how you select and relatethe data within your coordinated components to ensure you are generating the desired output.
Example: Setup: Creating a Coordinated Compound Report With Missing Data
In this example, we will create a set of statements reporting the outstanding inventory ordersfor a select group of stores. Each store may have unfilled orders in any of three inventorycategories: Food, Coffee, and Gifts.
10. Linking a Report to Other Resources
Creating Reports With TIBCO® WebFOCUS Language 915

To demonstrate how this works we will first build a set of data files: a header file containingcontact information for the selected set of stores, and transaction files for each inventorycategory. We are selecting specific data to demonstrate how this will work when differentcomponent reports are empty.
After creating the data files, we will build four component reports, one to display the headerinformation and one for each inventory category.
Finally, we will bring them together in a Coordinated Compound Layout report that merges all ofthis information into a single statement page for each store.
Example: Step 1: Creating the Data Files
The following four data files will be created from a join of the GGORDER and GGSALES datasources:
Data FileCreated
Type of Information Included Stores included
GGHDR Store information R1019, R1020, R1040, R1041
GG1 Order transactions for Coffee R1019, R1040, R1088
GG2 Order transactions for Food R1019, R1020, R1041, R1088
GG3 Order transactions for Gifts R1019, R1020, R1040, R1088
The APP HOLD, JOIN, and DEFINE commands are:
APP HOLD baseappJOIN GGORDER.ORDER01.STORE_CODE IN GGORDER TO UNIQUE GGSTORES.STORES01.STORE_CODE IN GGSTORES AS J1ENDDEFINE FILE GGORDERPRODUCT_CATEGORY/A15=IF (PRODUCT_DESCRIPTION IN ('Biscotti','Croissant','Scone')) THEN 'Food' ELSE IF (PRODUCT_DESCRIPTION IN ('French Roast','Hazelnut','Kona')) THEN 'Coffee' ELSE 'Gifts';END
Creating a Compound Report
916

The following procedure creates the data source GGHDR:
TABLE FILE GGORDERSUM FST.STORE_NAME FST.ADDRESS1 FST.ADDRESS2 FST.CITY FST.STATE FST.ZIPBY STORE_CODEWHERE STORE_CODE IN ('R1019','R1020','R1040','R1041');ON TABLE NOTOTALON TABLE HOLD AS GGHDR FORMAT FOCUS INDEX 'STORE_CODE'END
The following procedure creates the data source GG1:
TABLE FILE GGORDERPRINT QUANTITY UNIT_PRICE PACKAGE_TYPE SIZE VENDOR_NAME PRODUCT_CATEGORYBY STORE_CODEBY ORDER_DATEBY PRODUCT_DESCRIPTIONWHERE ( PRODUCT_CATEGORY EQ 'Coffee' ) AND ( ORDER_DATE GE '09/01/97' );WHERE STORE_CODE IN ('R1019','R1040','R1088');ON TABLE HOLD AS GG1 FORMAT FOCUS INDEX 'STORE_CODE'END
The following procedure creates the data source GG2:
TABLE FILE GGORDERPRINT QUANTITY UNIT_PRICE PACKAGE_TYPE SIZE VENDOR_NAME PRODUCT_CATEGORYBY STORE_CODEBY ORDER_DATEBY PRODUCT_DESCRIPTIONWHERE ( PRODUCT_CATEGORY EQ 'Food' ) AND ( ORDER_DATE GE '09/01/97' );WHERE STORE_CODE IN ('R1019','R1020','R1041','R1088');ON TABLE HOLD AS GG2 FORMAT FOCUS INDEX 'STORE_CODE'END
10. Linking a Report to Other Resources
Creating Reports With TIBCO® WebFOCUS Language 917

The following procedure creates the data source GG3:
TABLE FILE GGORDERPRINT QUANTITY UNIT_PRICE PACKAGE_TYPE SIZE VENDOR_NAME PRODUCT_CATEGORYBY STORE_CODEBY ORDER_DATEBY PRODUCT_DESCRIPTIONWHERE ( PRODUCT_CATEGORY EQ 'Gifts' ) AND ( ORDER_DATE GE '09/01/97' );WHERE STORE_CODE IN ('R1019','R1020','R1040','R1088');ON TABLE HOLD AS GG3 FORMAT FOCUS INDEX 'STORE_CODE'END
Example: Step 2: Creating the Component Reports
The following procedure, GGHDR.FEX, creates the first report component for the CoordinatedCompound Layout report from the GGHDR data source. This will function as a header for eachpage of the Compound Layout report. The shared sort field for all of the report components isSTORE_CODE. On each page of the PDF output file, this procedure lists the name and addressof one store:
TABLE FILE GGHDRBY STORE_CODE NOPRINTHEADING"<STORE_NAME ""<ADDRESS1 ""<ADDRESS2 ""<CITY , <STATE <ZIP "" "ON TABLE SET PAGE-NUM OFFON TABLE NOTOTALON TABLE PCHOLD FORMAT HTMLON TABLE SET HTMLCSS ONON TABLE SET STYLE * UNITS=IN, SQUEEZE=ON, ORIENTATION=PORTRAIT,$TYPE=REPORT, GRID=OFF, FONT='ARIAL', SIZE=9,$TYPE=HEADING, SIZE=10, STYLE=BOLD, COLOR=BLUE,$ENDSTYLEEND
Creating a Compound Report
918
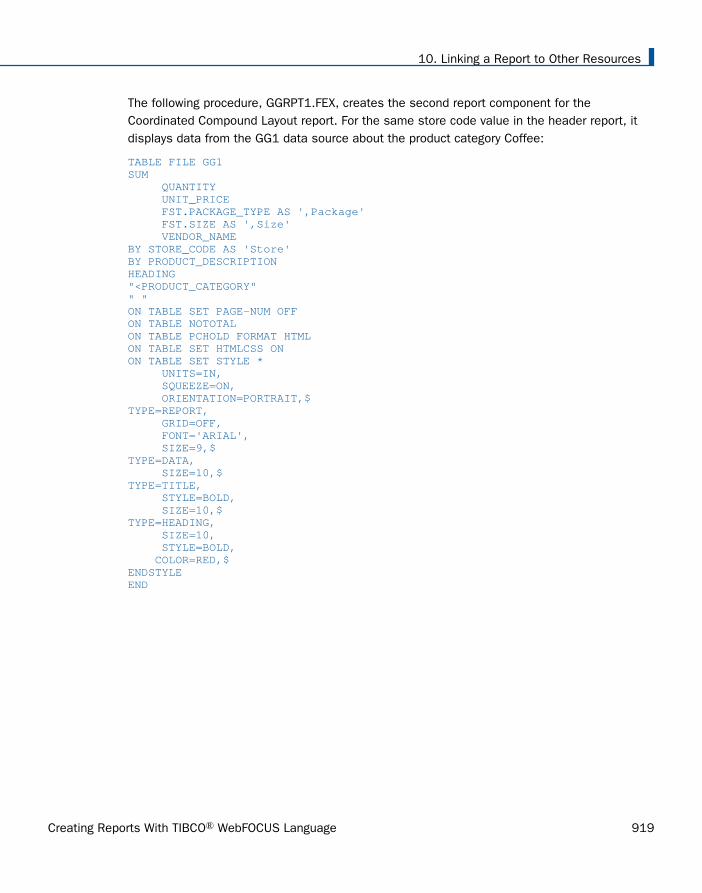
The following procedure, GGRPT1.FEX, creates the second report component for theCoordinated Compound Layout report. For the same store code value in the header report, itdisplays data from the GG1 data source about the product category Coffee:
TABLE FILE GG1SUM QUANTITY UNIT_PRICE FST.PACKAGE_TYPE AS ',Package' FST.SIZE AS ',Size' VENDOR_NAMEBY STORE_CODE AS 'Store'BY PRODUCT_DESCRIPTIONHEADING"<PRODUCT_CATEGORY"" "ON TABLE SET PAGE-NUM OFFON TABLE NOTOTALON TABLE PCHOLD FORMAT HTMLON TABLE SET HTMLCSS ONON TABLE SET STYLE * UNITS=IN, SQUEEZE=ON, ORIENTATION=PORTRAIT,$TYPE=REPORT, GRID=OFF, FONT='ARIAL', SIZE=9,$TYPE=DATA, SIZE=10,$TYPE=TITLE, STYLE=BOLD, SIZE=10,$TYPE=HEADING, SIZE=10, STYLE=BOLD, COLOR=RED,$ENDSTYLEEND
10. Linking a Report to Other Resources
Creating Reports With TIBCO® WebFOCUS Language 919

The following procedure, GGRPT2.FEX, creates the third report component for the CoordinatedCompound Layout report. For the same store code value in the header report, it displays datafrom the GG2 data source about the product category Food:
TABLE FILE GG2SUM QUANTITY UNIT_PRICE FST.PACKAGE_TYPE AS ',Package' FST.SIZE AS ',Size' VENDOR_NAMEBY STORE_CODEBY PRODUCT_DESCRIPTIONHEADING"<PRODUCT_CATEGORY"" "ON TABLE SET PAGE-NUM OFFON TABLE NOTOTALON TABLE PCHOLD FORMAT HTMLON TABLE SET HTMLCSS ONON TABLE SET STYLE * UNITS=IN, SQUEEZE=ON, ORIENTATION=PORTRAIT,$TYPE=REPORT, GRID=OFF, FONT='ARIAL', SIZE=9,$TYPE=DATA, SIZE=10,$TYPE=TITLE, STYLE=BOLD, SIZE=10,$TYPE=HEADING, SIZE=10, STYLE=BOLD, COLOR=RED,$ENDSTYLEEND
Creating a Compound Report
920

The following procedure, GGRPT3.FEX, creates the final report component for the CoordinatedCompound Layout report. For the same store code value in the header report, it displays datafrom the GG3 data source about the product category Gifts:
TABLE FILE GG3SUM QUANTITY UNIT_PRICE FST.PACKAGE_TYPE AS ',Package' FST.SIZE AS ',Size' VENDOR_NAMEBY STORE_CODEBY PRODUCT_DESCRIPTIONHEADING"<PRODUCT_CATEGORY"" "ON TABLE SET PAGE-NUM OFFON TABLE NOTOTALON TABLE PCHOLD FORMAT HTMLON TABLE SET HTMLCSS ONON TABLE SET STYLE * UNITS=IN, SQUEEZE=ON, ORIENTATION=PORTRAIT,$TYPE=REPORT, GRID=OFF, FONT='ARIAL', SIZE=9,$TYPE=DATA, SIZE=10,$TYPE=TITLE, STYLE=BOLD, SIZE=10,$TYPE=HEADING, SIZE=10, STYLE=BOLD, COLOR=RED,$ENDSTYLEEND
10. Linking a Report to Other Resources
Creating Reports With TIBCO® WebFOCUS Language 921

Example: Step 3: Building the Coordinated Compound Layout Report
The following procedure, GGCMPD.FEX, combines the four components into a CoordinatedCompound Layout report. The reports and relative positioning for each component is presentedin the following diagram:
Creating a Compound Report
922

The Coordinated Compound Layout syntax is:
SET HTMLARCHIVE=ONCOMPOUND LAYOUT PCHOLD FORMAT PDFUNITS=IN, $SECTION=section1, LAYOUT=ON, MERGE=ON, ORIENTATION=PORTRAIT, PAGESIZE=Letter, $PAGELAYOUT=1, NAME='Page layout 1', text='Page layout 1', TOC-LEVEL=1, BOTTOMMARGIN=0.5, TOPMARGIN=0.5, $COMPONENT='report1', TEXT='report1', TOC-LEVEL=2, POSITION=(0.667 1.083), DIMENSION=(3.417 1.412), $COMPONENT='report2', TEXT='report2', TOC-LEVEL=2, POSITION=(0.837 2.584), DIMENSION=(* *), $COMPONENT='report3', TEXT='report3', TOC-LEVEL=2, POSITION=(-0.006 +0.084), DIMENSION=(* *), RELATIVE-TO='report2', RELATIVE-POINT=BOTTOM-LEFT, POSITION-POINT=TOP-LEFT, $COMPONENT='report4', TEXT='report4', TOC-LEVEL=2, POSITION=(+0.010 +0.080), DIMENSION=(* *), RELATIVE-TO='report3', RELATIVE-POINT=BOTTOM-LEFT, POSITION-POINT=TOP-LEFT, $ENDSET COMPONENT='report1'-INCLUDE GGHDR.FEXSET COMPONENT='report2'-INCLUDE GGRPT1.FEXSET COMPONENT='report3'-INCLUDE GGRPT2.FEXSET COMPONENT='report4'-INCLUDE GGRPT3.FEXCOMPOUND END
10. Linking a Report to Other Resources
Creating Reports With TIBCO® WebFOCUS Language 923
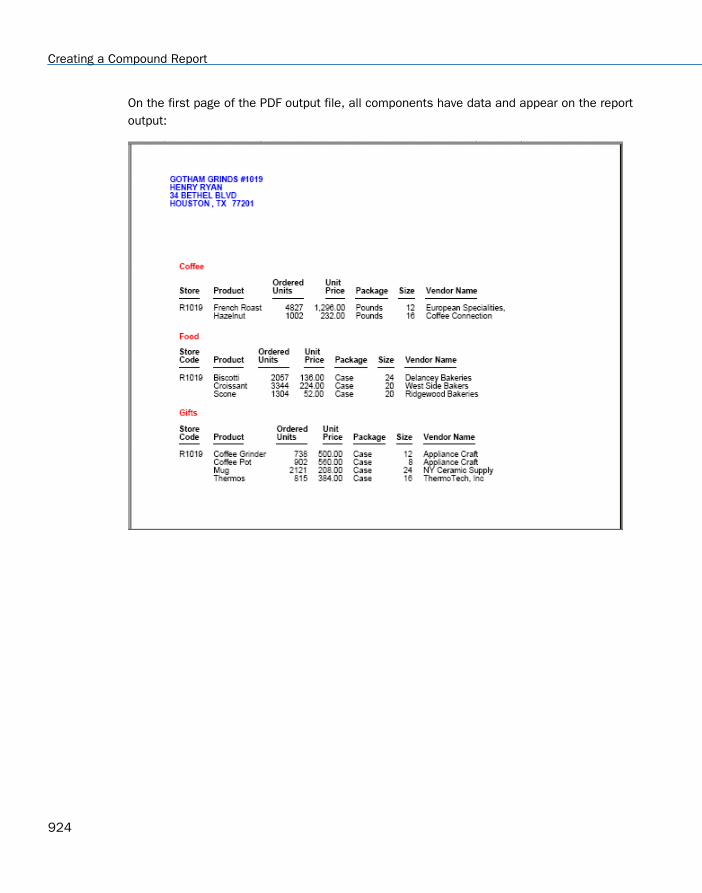
On the first page of the PDF output file, all components have data and appear on the reportoutput:
Creating a Compound Report
924

On the second page, report GGRPT2.FEX did not retrieve any data for the store in the header.Therefore, the Coffee component is missing. Note that because Component 3 and 4 arepositioned RELATIVE-TO the components defined above them in the Compound Layout syntax,the Food and Gifts components move up instead of leaving blank space where the Coffeecomponent would have been:
10. Linking a Report to Other Resources
Creating Reports With TIBCO® WebFOCUS Language 925

On page 5, the header report did not retrieve any data for a store code value present in theother three components. A page is still generated for this store code. Since the secondcomponent (Coffee report) was positioned absolutely in the Compound Layout syntax, notRELATIVE-TO the first component (header report), the space where the header report wouldhave been is left blank:
Generating a Table of Contents With BY Field Entries for PPTX and PDF Compound Layout Reports
Using compound layout syntax, you can generate a Table of Contents for a PPTX and PDFcompound report.
Creating a Compound Report
926
In PPTX, the Table of Contents can be presented as a Table of Contents page placed at thebeginning of the document. In PDF, the Table of Contents can be presented as either PDFbookmarks displayed by Adobe Reader®, or as a Table of Contents page placed at thebeginning of the document, or both. Both the Table of Contents entries and the bookmarks (inPDF) provide links to each of the components and included sort fields. These links position thereader on the page where the Table of Contents link is located.
Include any report or graph component in the Table of Contents at a specific level by defining aTOC Description and TOC Level in the compound layout syntax for the component. Additionally,the BY field values of any of the report components can be presented within the TOC treeindented one level within the component report entry. BYTOC entries are supported for reportcomponents only (not graph components).
Compound reports defining the Table of Contents page or Bookmarks (in PDF) based on BYfield entries are supported for both non-coordinated (MERGE=OFF) and coordinated reports(MERGE=ON). For coordinated reports, the primary sort key is presented as the top-level entryfor individual instances of the report, and subsequent keys are presented within theappropriate components within the tree. These coordinated reports can also be burst intoseparate documents by the primary sort key and distributed using ReportCaster.
Table of Contents Features
The Table of Contents (TOC) page shows a summary of the contents of the document, alongwith page numbers, and can be printed with the document. The entries in the Table ofContents enable you to easily navigate to a particular section while viewing the documentonline. The entries can link to any component of the compound output (page, report, or graph),any object (image, text box) within the compound report, and vertical sort field values (BY fieldvalues) within each component report.
The actual content of the Table of Contents is represented as a text element in the compoundlayout syntax. When using a Table of Contents page, you can:
Customize the title of the Table of Contents, as well as format all of the text.
Specify a TOC level for each component to be included in the Table of Contents.
Enable TOC page numbering so that each element in the Table of Contents is numbered.You can also add tab leaders (dots) from the entry to the page number for easier selectionof the contents.
Control which reports and graphs show up in the Table of Contents by customizing theobject properties.
Use hypertext links in the Table of Contents page which enable you to click on an entry andjump to the specified page in the document.
10. Linking a Report to Other Resources
Creating Reports With TIBCO® WebFOCUS Language 927
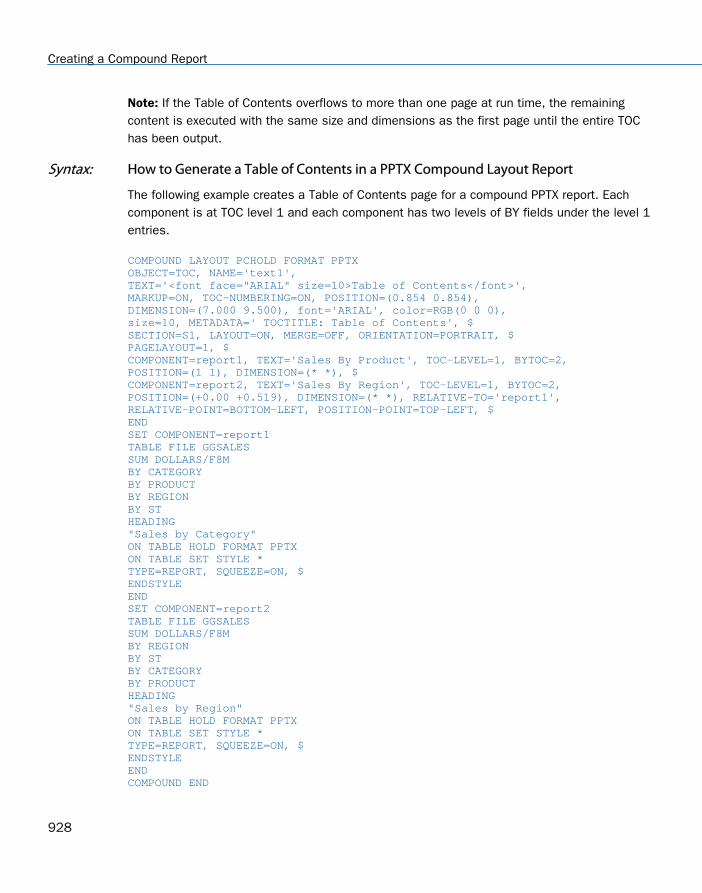
Note: If the Table of Contents overflows to more than one page at run time, the remainingcontent is executed with the same size and dimensions as the first page until the entire TOChas been output.
Syntax: How to Generate a Table of Contents in a PPTX Compound Layout Report
The following example creates a Table of Contents page for a compound PPTX report. Eachcomponent is at TOC level 1 and each component has two levels of BY fields under the level 1entries.
COMPOUND LAYOUT PCHOLD FORMAT PPTXOBJECT=TOC, NAME='text1',TEXT='<font face="ARIAL" size=10>Table of Contents</font>',MARKUP=ON, TOC-NUMBERING=ON, POSITION=(0.854 0.854),DIMENSION=(7.000 9.500), font='ARIAL', color=RGB(0 0 0),size=10, METADATA=' TOCTITLE: Table of Contents', $SECTION=S1, LAYOUT=ON, MERGE=OFF, ORIENTATION=PORTRAIT, $PAGELAYOUT=1, $COMPONENT=report1, TEXT='Sales By Product', TOC-LEVEL=1, BYTOC=2,POSITION=(1 1), DIMENSION=(* *), $COMPONENT=report2, TEXT='Sales By Region', TOC-LEVEL=1, BYTOC=2,POSITION=(+0.00 +0.519), DIMENSION=(* *), RELATIVE-TO='report1',RELATIVE-POINT=BOTTOM-LEFT, POSITION-POINT=TOP-LEFT, $ENDSET COMPONENT=report1TABLE FILE GGSALESSUM DOLLARS/F8MBY CATEGORYBY PRODUCTBY REGIONBY STHEADING"Sales by Category"ON TABLE HOLD FORMAT PPTXON TABLE SET STYLE *TYPE=REPORT, SQUEEZE=ON, $ENDSTYLEENDSET COMPONENT=report2TABLE FILE GGSALESSUM DOLLARS/F8MBY REGIONBY STBY CATEGORYBY PRODUCTHEADING"Sales by Region"ON TABLE HOLD FORMAT PPTXON TABLE SET STYLE *TYPE=REPORT, SQUEEZE=ON, $ENDSTYLEENDCOMPOUND END
Creating a Compound Report
928

The output shows that each component report is at Table of Contents level 1 and has twolevels of sort fields under it, as shown in the following image. For the Sales by Product report,the BY fields are Category and Product. For the Sales by Region report, the BY fields areRegion and State. Each entry in the Table of Contents is a link to the page containing thatvalue.
10. Linking a Report to Other Resources
Creating Reports With TIBCO® WebFOCUS Language 929
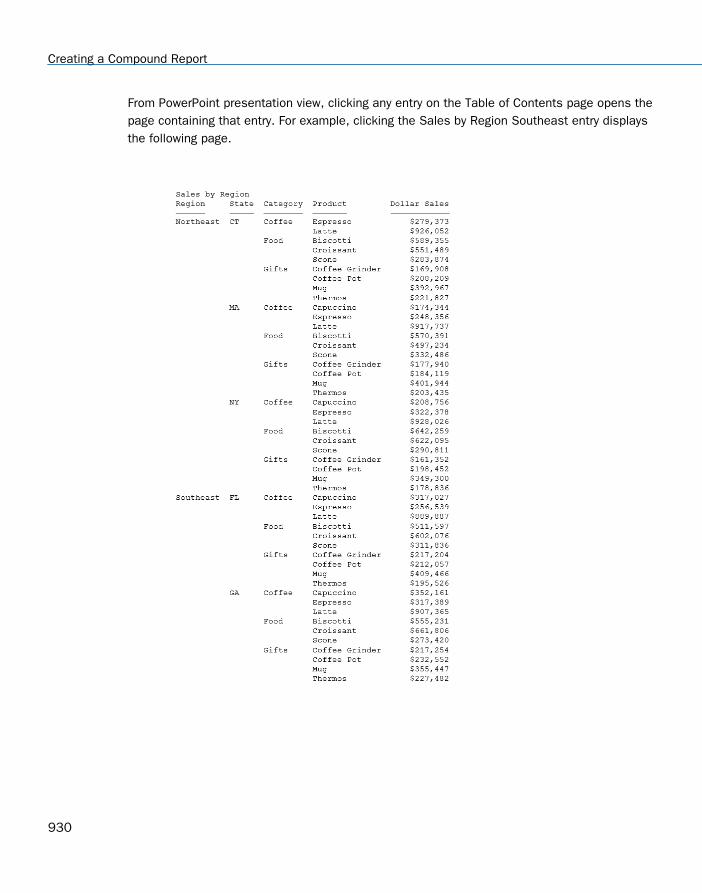
From PowerPoint presentation view, clicking any entry on the Table of Contents page opens thepage containing that entry. For example, clicking the Sales by Region Southeast entry displaysthe following page.
Creating a Compound Report
930

Syntax: How to Generate a Table of Contents in a PDF Compound Layout Report
You can generate bookmarks, a Table of Contents page, or both by including the BOOKMARKSand/or TOC object in the compound layout syntax. Then in the component definitions, specifythe Table of Contents level and description and, optionally, the BYTOC levels.
TOC Attributes
COMPOUND LAYOUT PCHOLD FORMAT PDF[OBJECT=BOOKMARKS, $][OBJECT=TOC, NAME='text1', TEXT='<font face="font1" size=sz1>Table of Contents</font>', MARKUP=ON, TOC-NUMBERING={OFF|ON}, POSITION=(xy), [TOC-FILL=DOTS,] DIMENSION=(mn), font='font2', color={color|RGB(rgb)}, size=sz2, METADATA=' TOCTITLE: Table of Contents', $]
where:
OBJECT=BOOKMARKS
Generates PDF bookmarks for the Table of Contents entries specified in the COMPONENTdeclarations.
OBJECT=TOC
Generates a Table of Contents page for the Table of Contents entries specified in theCOMPONENT declarations.
NAME='text1'
Specifies a name for the Table of Contents page item.
TEXT='<font face="font1" size=sz1>Table of Contents</font>'
Specifies the title and text characteristics for the Table of Contents title. In order for thisinformation to be interpreted correctly, the MARKUP=ON attribute must be specified. Thetext will not wrap and must fit within the width of the overall text element.
MARKUP=ON
Causes the markup tags used with the Table of Contents title to be interpreted asformatting options, not as text.
TOC-NUMBERING={OFF|ON}
Specifies whether the entries on the Table of Contents page are numbered. ON is thedefault value.
POSITION=(xy)
Defines the x and y coordinates for the object on the page.
DIMENSION=(ab)
Defines the size of the bounding box for the object.
10. Linking a Report to Other Resources
Creating Reports With TIBCO® WebFOCUS Language 931

font='font2', color={color|RGB(rgb)},size=sz2,
Specifies text characteristics for the Table of Contents body. If omitted, the attributes aretaken from the TEXT attribute.
TOC-FILL=DOTS
Places tab leader dots from the entry to the page number. If this attribute is not included,the entry and the page number are separated by blank space.
Component Entries
COMPONENT=component1, TITLE='title1', TOC-LEVEL=n, [BYTOC=m,] POSITION=(xy),DIMENSION=(ab), $
where:
component1
Is a component to be included in the Table of Contents.
title1
Is the title for the component to be used as the TOC entry.
TOC-LEVEL=n
Defines n as the Table of Contents level for the report, graph, or page layout object. Thisoption defines the hierarchical order of objects within the Table of Contents.
0 = the object is not shown in the Table of Contents.
1 = the object is shown as a first level item in the Table of Contents.
2 = the object is shown as a second level item in the Table of Contents and so on.
BYTOC=m
Specifies the number of BY fields to be included within the current component entry (m).
POSITION=(xy)
Defines the x and y coordinates for the object on the page.
DIMENSION=(ab)
Defines the size of the bounding box for the object.
Reference: Usage Notes for Table of Contents
General Notes
The Table of Contents entry is a link to the overall page, not a direct link to the location ofthe selected data element on the page.
Creating a Compound Report
932

Reports used for headings or footings on overflow pages (DisplayOn=OVERFLOW-ONLY)should not be included in any TOC or BYTOC entries. These components will generateduplicate entries in the Table of Contents because they are repeated on the second pageand all subsequent pages of a given page layout based on page count rather than sort fieldvalues.
For an uncoordinated document, the TOC presents all of the page layouts and componentsdesignated in the TOC parameters.
For a coordinated document, the TOC presents a reference to each of the coordinated sortfields, with a link to the first page of the associated pages for that common sort field.
BYTOC Notes
If the BYTOC value designated is greater than the count of BY fields in the componentreport, the value defaults to the total count of available BY fields.
Any valid field that can be used as a BY field can be used in a BYTOC entry, including thosetaken directly from a data source or created in a DEFINE.
BY fields designated not to be displayed within the body of the component report (NOPRINTfields) will still be displayed within the Table of Contents.
The TOC-level values defined cannot skip levels. Any skip in level will cause the bookmarksbelow that level not to display.
Example: Creating Bookmarks and a Table of Contents Page
The following example has two component reports. Both PDF bookmarks and a Table ofContents page are generated. Each component is at TOC level 1 and each has two levels of BYfields under the Level 1 entries:
COMPOUND LAYOUT PCHOLD FORMAT PDFOBJECT=BOOKMARKS, $OBJECT=TOC, NAME='text1', TEXT='<font face="ARIAL" size=10>Table of Contents</font>', MARKUP=ON, TOC-NUMBERING=ON, POSITION=(0.854 0.854), DIMENSION=(7.000 9.500), font='ARIAL', color=RGB(0 0 0), size=10, METADATA=' TOCTITLE: Table of Contents', $SECTION=S1, LAYOUT=ON, MERGE=OFF, ORIENTATION=PORTRAIT, $PAGELAYOUT=1, $COMPONENT=report1, TEXT='Sales By Product', TOC-LEVEL=1, BYTOC=2, POSITION=(1 1), DIMENSION=(* *), $COMPONENT=report2, TEXT='Sales By Region', TOC-LEVEL=1, BYTOC=2, POSITION=(+0.00 +0.519), DIMENSION=(* *), RELATIVE-TO='report1', RELATIVE-POINT=BOTTOM-LEFT, POSITION-POINT=TOP-LEFT, $END
10. Linking a Report to Other Resources
Creating Reports With TIBCO® WebFOCUS Language 933
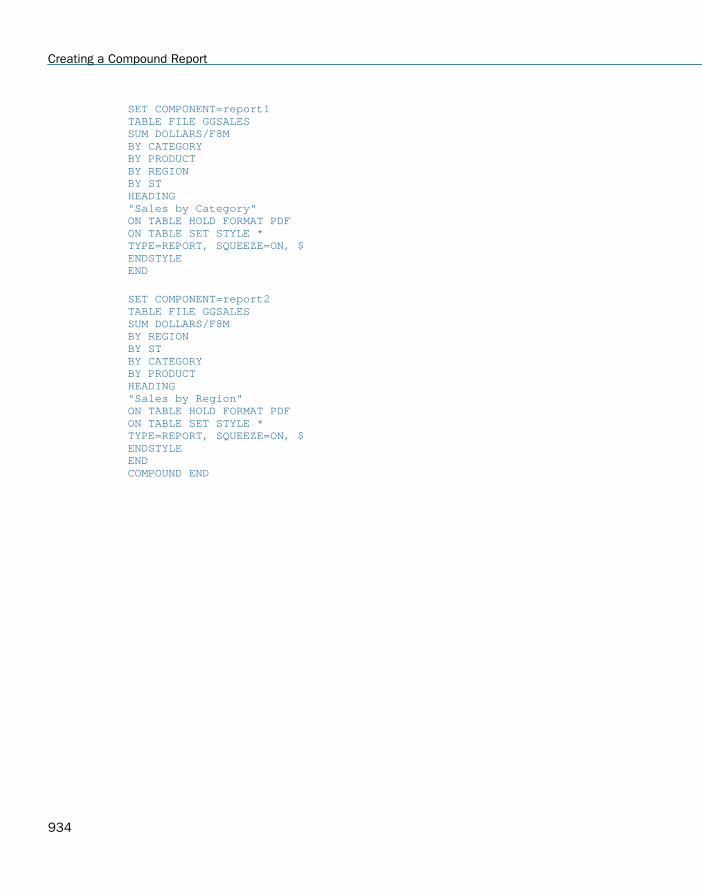
SET COMPONENT=report1TABLE FILE GGSALESSUM DOLLARS/F8MBY CATEGORY BY PRODUCTBY REGION BY STHEADING"Sales by Category"ON TABLE HOLD FORMAT PDFON TABLE SET STYLE *TYPE=REPORT, SQUEEZE=ON, $ENDSTYLEEND
SET COMPONENT=report2TABLE FILE GGSALESSUM DOLLARS/F8MBY REGION BY STBY CATEGORY BY PRODUCTHEADING"Sales by Region"ON TABLE HOLD FORMAT PDFON TABLE SET STYLE *TYPE=REPORT, SQUEEZE=ON, $ENDSTYLEENDCOMPOUND END
Creating a Compound Report
934

The output shows that each component reports is at Table of Contents level 1 and has twolevels of sort fields under it. For the Sales by Product report, the BY fields are Category andProduct. For the Sales by Region report, the BY fields are Region and State. Each entry in theTable of Contents is a link to the page containing that value:
10. Linking a Report to Other Resources
Creating Reports With TIBCO® WebFOCUS Language 935
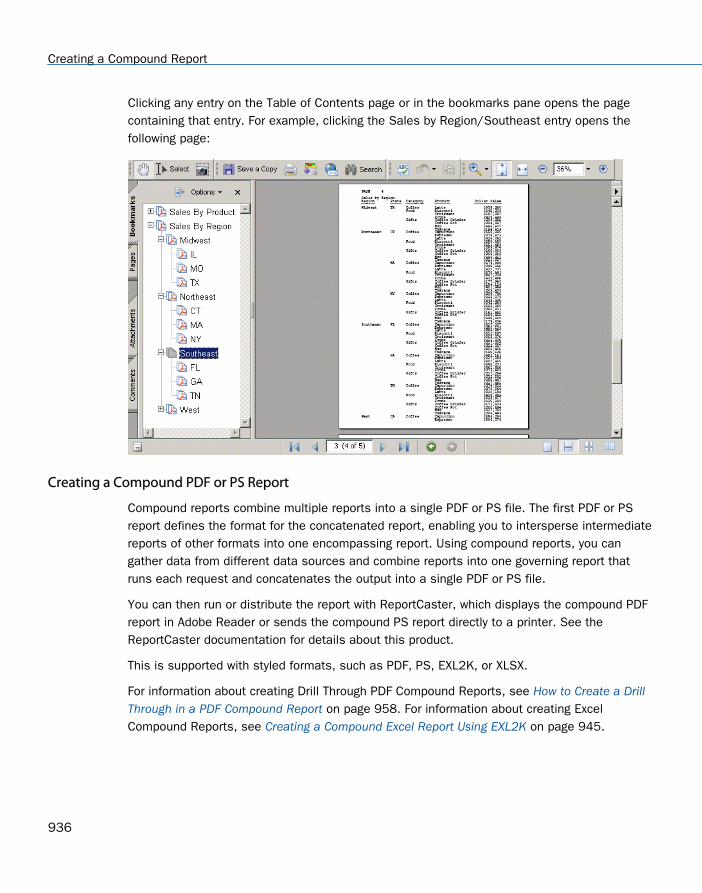
Clicking any entry on the Table of Contents page or in the bookmarks pane opens the pagecontaining that entry. For example, clicking the Sales by Region/Southeast entry opens thefollowing page:
Creating a Compound PDF or PS Report
Compound reports combine multiple reports into a single PDF or PS file. The first PDF or PSreport defines the format for the concatenated report, enabling you to intersperse intermediatereports of other formats into one encompassing report. Using compound reports, you cangather data from different data sources and combine reports into one governing report thatruns each request and concatenates the output into a single PDF or PS file.
You can then run or distribute the report with ReportCaster, which displays the compound PDFreport in Adobe Reader or sends the compound PS report directly to a printer. See theReportCaster documentation for details about this product.
This is supported with styled formats, such as PDF, PS, EXL2K, or XLSX.
For information about creating Drill Through PDF Compound Reports, see How to Create a DrillThrough in a PDF Compound Report on page 958. For information about creating ExcelCompound Reports, see Creating a Compound Excel Report Using EXL2K on page 945.
Creating a Compound Report
936

Syntax: How to Display Compound Reports
For a compound report that may contain different report types, use the syntax
SET COMPOUND= {OPEN|CLOSE} [NOBREAK]
or
ON TABLE SET COMPOUND {OPEN|CLOSE}
Note that when you are using this syntax, you must also include the following code to identifythe display format of each of the reports to be concatenated:
ON TABLE {PCHOLD|HOLD|SAVE} [AS name] FORMAT formatname
If all of the reports in the compound set are of the same type, either PDF or PS, you can usethe following, more compact, syntax
ON TABLE {PCHOLD|HOLD|SAVE} [AS name] FORMAT {PDF|PS} {OPEN|CLOSE} [NOBREAK]
where:
name
Is the name of the generated file. The name is taken from the first request in thecompound report. If no name is specified in the first report, the name HOLD is used.
OPEN
Is specified with the first report, and begins the concatenation process. A report thatcontains the OPEN attribute must be PDF or PS format.
CLOSE
Is specified with the last report, and ends the concatenation process.
NOBREAK
Is an optional phrase that suppresses page breaks. By default, each report is displayed ona separate page.
You can use NOBREAK selectively in a request to control which reports are displayed onthe same page.
10. Linking a Report to Other Resources
Creating Reports With TIBCO® WebFOCUS Language 937
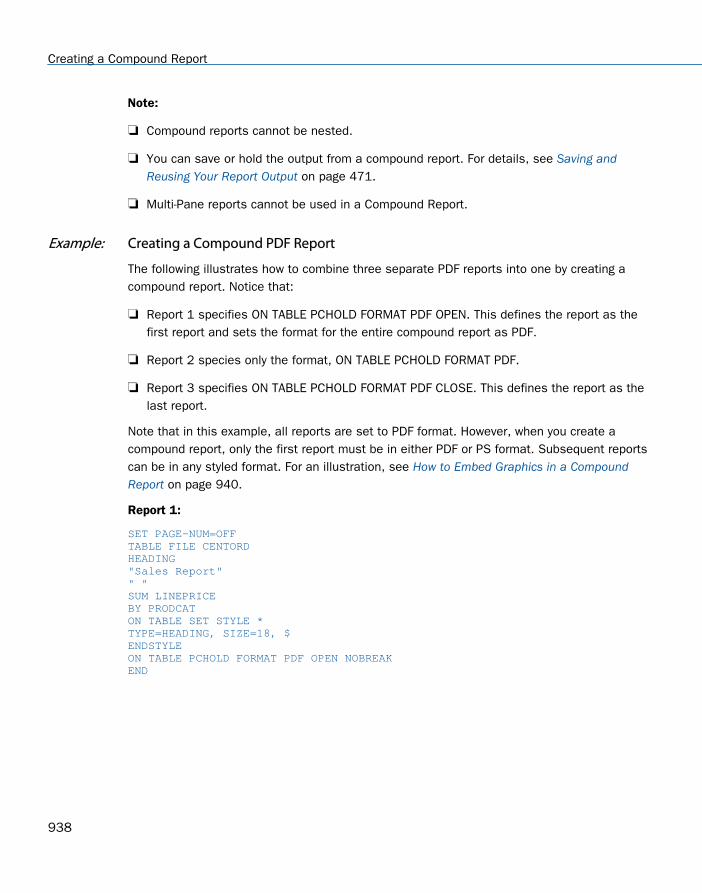
Note:
Compound reports cannot be nested.
You can save or hold the output from a compound report. For details, see Saving andReusing Your Report Output on page 471.
Multi-Pane reports cannot be used in a Compound Report.
Example: Creating a Compound PDF Report
The following illustrates how to combine three separate PDF reports into one by creating acompound report. Notice that:
Report 1 specifies ON TABLE PCHOLD FORMAT PDF OPEN. This defines the report as thefirst report and sets the format for the entire compound report as PDF.
Report 2 species only the format, ON TABLE PCHOLD FORMAT PDF.
Report 3 specifies ON TABLE PCHOLD FORMAT PDF CLOSE. This defines the report as thelast report.
Note that in this example, all reports are set to PDF format. However, when you create acompound report, only the first report must be in either PDF or PS format. Subsequent reportscan be in any styled format. For an illustration, see How to Embed Graphics in a CompoundReport on page 940.
Report 1:
SET PAGE-NUM=OFFTABLE FILE CENTORDHEADING"Sales Report"" "SUM LINEPRICEBY PRODCATON TABLE SET STYLE *TYPE=HEADING, SIZE=18, $ENDSTYLEON TABLE PCHOLD FORMAT PDF OPEN NOBREAKEND
Creating a Compound Report
938

Report 2:
TABLE FILE CENTORDHEADING"Inventory Report"" "SUM QUANTITYBY PRODCATON TABLE SET STYLE *TYPE=HEADING, SIZE=18, $ENDSTYLEON TABLE PCHOLD FORMAT PDF NOBREAKEND
Report 3:
TABLE FILE CENTORDHEADING"Cost of Goods Sold Report"" "SUM LINE_COGSBY PRODCATON TABLE SET STYLE *TYPE=HEADING, SIZE=18, $ENDSTYLEON TABLE PCHOLD FORMAT PDF CLOSEEND
10. Linking a Report to Other Resources
Creating Reports With TIBCO® WebFOCUS Language 939
The output displays as a PDF report. Because the syntax for reports 1 and 2 contain theNOBREAK command, the three reports appear on a single page. (Without NOBREAK, eachreport displays on a separate page.)
Syntax: How to Embed Graphics in a Compound Report
You can embed a graphic, such as a logo or a WebFOCUS graph captured as a GIF file, in acompound report. The graphic file must be embedded in a particular report within the set ofcompound reports.
To save a graph as a graphic image, include the following syntax in your graph request:
HOLD FORMAT GIF
For details on saving a graph as an image file, see Creating a Graph on page 1745.
Creating a Compound Report
940

To embed a graphic in a compound report, you must identify the image file in the StyleSheetdeclaration of the report in which you want to include it, along with size and positionspecifications if desired. For details about embedding and positioning graphics in reports, see Adding an Image to a Report on page 1464.
Example: Combining Report Formats and Graphs in a Compound Report
This request generates a compound report from three different report types (PDF, HTML, andEXL2K), and embeds a graph in each report. Notice that each graph is saved as a GIF file inthe graph request. The graph is then identified, sized, and positioned within the StyleSheetdeclaration (TYPE=REPORT, IMAGE=graphname...) of the report in which it is being embedded).Variations on the SET COMPOUND= syntax (OPEN, NOBREAK, CLOSE) combine the threereports on the same page. Key lines of code are highlighted in the following request.
Report 1:
SET GRMERGE = ONGRAPH FILE SHORTSUM PROJECTED_RETURN AS 'Return on Investment'BY HOLDERACROSS CONTINENTON GRAPH SET LOOKGRAPH 3D_BARON GRAPH SET GRAPHEDIT SERVER ON GRAPH HOLD AS SLSGRPH1 FORMAT GIF END
SET COMPOUND='OPEN NOBREAK' TABLE FILE SHORTSUM PROJECTED_RETURN AS 'Return on Investment'BY CONTINENTBY HOLDERHEADING"Investment Report"" "
ON TABLE SET STYLE *TYPE=DATA, BACKCOLOR=( BY=B2 'SILVER' 'WHITE' ), $TYPE=HEADING, SIZE=14, STYLE=BOLD, $ TYPE=REPORT, IMAGE=SLSGRPH1.gif, POSITION=(4.5 0.5), SIZE=(3.5 2.5), $ ENDSTYLE ON TABLE PCHOLD FORMAT PDF
END
10. Linking a Report to Other Resources
Creating Reports With TIBCO® WebFOCUS Language 941

Report 2:
GRAPH FILE TRADESSUM AMOUNTBY CONTINENTON GRAPH SET LOOKGRAPH PIEON GRAPH SET GRAPHEDIT SERVER ON GRAPH HOLD AS TRDSGR1 FORMAT GIF END
SET COMPOUND=NOBREAK TABLE FILE TRADESSUM AMOUNT AS 'Amount'BY CONTINENT AS 'Continent'BY REGION AS 'Region'HEADING"Trades Report"" "ON TABLE SET HTMLCSS ONON TABLE SET STYLE * TYPE=DATA, BACKCOLOR=( BY=B2 'SILVER' 'WHITE' ), $TYPE=HEADING, SIZE=14, STYLE=BOLD, $TYPE=REPORT, IMAGE=TRDSGR1.gif, POSITION=(4 3), SIZE=(4 2.5), $ENDSTYLEON TABLE PCHOLD FORMAT HTML END
Creating a Compound Report
942

Report 3:
GRAPH FILE SHORTSUM BALANCEBY CONTINENTON GRAPH SET LOOKGRAPH 3D_BARON GRAPH SET GRAPHEDIT SERVERON GRAPH SET STYLE *TYPE=DATA, COLOR=RED,$ENDSTYLE ON GRAPH HOLD AS BALGR1 FORMAT GIF END
SET COMPOUND=CLOSE TABLE FILE SHORTSUM BALANCE AS 'Balance'BY CONTINENT AS 'Continent'BY REGION AS 'Region'HEADING"Balance by Region"" "ON TABLE SET STYLE * TYPE=DATA, BACKCOLOR=( BY=B2 'SILVER' 'WHITE' ), $TYPE=HEADING, SIZE=14, STYLE=BOLD, $TYPE=REPORT, IMAGE=BALGR1.gif, POSITION=(4 6), SIZE=(4 2.5), $ENDSTYLEON TABLE PCHOLD FORMAT EXL2K END
10. Linking a Report to Other Resources
Creating Reports With TIBCO® WebFOCUS Language 943

The output is:
Creating a Compound Report
944

Creating a Compound Excel Report Using EXL2K
Excel Compound Reports generate multiple worksheet reports using the EXL2K output format.
The syntax of Excel Compound Reports is identical to that of PDF Compound Reports. Bydefault, each of the component reports from the compound report is placed in a new Excelworksheet (analogous to a new page in PDF). If the NOBREAK keyword is used, the next reportfollows the current report on the same worksheet (analogous to starting the report on thesame page in PDF).
Output, whether sent to the client using PCHOLD or saved in a file using HOLD, is generated inMicrosoft Web Archive format. This format is labeled Single File Web Page in the Excel Save Asdialog. Excel provides the conventionally given file suffixes: .mht or .mhtml. WebFOCUS usesthe same .xht suffix that is used for EXL2K reports.Since the output is always a single file, itcan be easily distributed using ReportCaster.
The components of an Excel compound report can be FORMULA or PIVOT reports (subject tothe restrictions). They cannot be Table of Contents (TOC) reports.
Note: Excel 2002 (Office XP) or higher must be installed. Excel Compound Reports will notwork with earlier versions of Excel since they do not support the Web Archive file format.
Reference: Guidelines for Using the OPEN, CLOSE, and NOBREAK Keywords and SET COMPOUND
As with PDF, the keywords OPEN, CLOSE, and NOBREAK are used to control Excel compoundreports. They can be specified with the HOLD or PCHOLD command or with a separate SETCOMPOUND command.
OPEN is used on the first report of a sequence of component reports to specify that acompound report be produced.
CLOSE is used to designate the last report in a compound report.
NOBREAK specifies that the next report be placed on the same worksheet as the currentreport. If it is not present, the default behavior is to place the next report on a separateworksheet.
NOBREAK may appear with OPEN on the first report, or alone on a report between the firstand last reports. (Using CLOSE is irrelevant, since it refers to the placement of the nextreport, and no report follows the final report on which CLOSE appears.)
When used with the HOLD/PCHOLD syntax, the compound report keywords OPEN, CLOSE,and NOBREAK must appear immediately after FORMAT EXL2K, and before any additionalkeywords, such as FORMULA or PIVOT. For example, you can specify:
ON TABLE PCHOLD FORMAT EXL2K OPEN
10. Linking a Report to Other Resources
Creating Reports With TIBCO® WebFOCUS Language 945

ON TABLE HOLD AS MYHOLD FORMAT EXL2K OPEN NOBREAK
ON TABLE PCHOLD FORMAT EXL2K NOBREAK FORMULA
ON TABLE HOLD FORMAT EXL2K CLOSE PIVOT PAGEFIELDS COUNTRY
As with PDF compound reports, compound report keywords can be alternatively specifiedusing SET COMPOUND:
SET COMPOUND = OPEN
SET COMPOUND = 'OPEN NOBREAK'
SET COMPOUND = NOBREAK
SET COMPOUND = CLOSE
Reference: Guidelines for Producing Excel Compound Reports Using EXL2K
Pivot Tables and NOBREAK. Pivot Table Reports may appear in compound reports, but theymay not be combined with another report on the same worksheet using NOBREAK.
Naming of Worksheets. The default worksheet tab names will be Sheet1, Sheet2, and soon. You have the option to specify a different worksheet tab name by using the TITLETEXTkeyword in the stylesheet. For example:
TYPE=REPORT, TITLETEXT='Summary Report', $
Excel limits the length of worksheet titles to 31 characters. The following special characterscannot be used: ':', '?', '*', and '/'.
File Names and Formats. The output file name (AS name, or HOLD by default) is obtainedfrom the first report of the compound report (the report with the OPEN keyword). Output filenames on subsequent reports are ignored.
The HOLD FORMAT syntax used in the first component report in a compound report appliesto all subsequent reports in the compound report, regardless of their format.
NOBREAK Behavior. When NOBREAK is specified, the following report appears on the rowimmediately after the last row of the report with the NOBREAK. If additional spacing isrequired between the reports, a FOOTING or an ON TABLE SUBFOOT can be placed on thereport with the NOBREAK, or a HEADING or an ON TABLE SUBHEAD can be placed on thefollowing report. This allows the most flexibility, since if blank rows were added by defaultthere would be no way to remove them.
Creating a Compound Report
946

Example: Creating a Simple Compound Report Using EXL2K
SET PAGE-NUM=OFFTABLE FILE CARHEADING"Sales Report"" "SUM SALESBY COUNTRYON TABLE SET STYLE *type=report, titletext='Sales Rpt', $type=heading, size=18, $ENDSTYLEON TABLE PCHOLD AS EX1 FORMAT EXL2K OPENEND
TABLE FILE CARHEADING"Inventory Report"" "SUM RCBY COUNTRYON TABLE SET STYLE *type=report, titletext='Inv. Rpt', $type=heading, size=18, $ENDSTYLEON TABLE HOLD AS EX1 FORMAT EXL2KEND
TABLE FILE CARHEADING"Cost of Goods Sold Report"" "SUM DCBY COUNTRYON TABLE SET STYLE *type=report, titletext='Cost Rpt', $type=heading, size=18, $ENDSTYLEON TABLE HOLD AS EX1 FORMAT EXL2K CLOSEEND
10. Linking a Report to Other Resources
Creating Reports With TIBCO® WebFOCUS Language 947

The output for each tab in the Excel worksheet is:
Creating a Compound Report
948

Example: Creating a Compound Report With Pivot Tables and Formulas
SET PAGE-NUM=OFFTABLE FILE CARHEADING"Sales Report"" "PRINT RCOSTBY COUNTRYON TABLE SET STYLE *type=report, titletext='Sales Rpt', $type=heading, size=18, $ENDSTYLEON TABLE PCHOLD AS PIV1 FORMAT EXL2K OPENEND
10. Linking a Report to Other Resources
Creating Reports With TIBCO® WebFOCUS Language 949

TABLE FILE CARHEADING"Inventory Report"" "PRINT SALESBY COUNTRYON TABLE SET STYLE *type=report, titletext='Inv. Rpt', $type=heading, size=18, $ENDSTYLEON TABLE HOLD AS PPPP FORMAT EXL2K PIVOTPAGEFIELDS TYPE SEATSCACHEFIELDS MODEL MPG RPM END
TABLE FILE CARSUM RCOSTBY COUNTRY BY CAR BY MODEL BY TYPE BY SEATS SUMMARIZEON MODEL SUB-TOTALON TABLE HOLD AS XFOCB FORMAT EXL2K FORMULAEND
TABLE FILE CARHEADING"Cost of Goods Sold Report"" "PRINT DCOSTBY COUNTRYON TABLE SET STYLE *type=report, titletext='Cost Rpt', $type=heading, size=18, $ENDSTYLEON TABLE HOLD AS ONE FORMAT EXL2K CLOSE PIVOTPAGEFIELDS RCOSTCACHEFIELDS MODEL TYPE SALES ACCEL SEATSEND
Creating a Compound Report
950

The output for each tab in the Excel worksheet is:
10. Linking a Report to Other Resources
Creating Reports With TIBCO® WebFOCUS Language 951

Creating a Compound Report
952

Example: Creating a Compound Report Using NOBREAK
In this example, the first two reports are on the first worksheet, and the last two reports are onthe second worksheet, since NOBREAK appears on both the first and third reports.
TABLE FILE GGSALESHEADING"Report 1: Coffee - Budget"SUM BUDDOLLARS BUDUNITS COLUMN-TOTAL AS 'Total'BY REGION IF CATEGORY EQ CoffeeON TABLE PCHOLD FORMAT EXL2K OPEN NOBREAKON TABLE SET STYLE *type=report, font=Arial, size = 10, style=normal, $type=title, style=bold, $type=heading, size=12, style=bold, color=blue, $type=grandtotal, style=bold, $ENDSTYLEEND
TABLE FILE GGSALESHEADING" ""Report 2: Coffee - Actual "SUM DOLLARS UNITS COLUMN-TOTAL AS 'Total'BY REGION IF CATEGORY EQ CoffeeON TABLE PCHOLD FORMAT EXL2KON TABLE SET STYLE *type=report, font=Arial, size=10, style=normal, $type=grandtotal, style=bold, $type=heading, size=12, style=bold, color=blue, $ENDSTYLEEND
TABLE FILE GGSALESHEADING"Report 3: Food - Budget"SUM BUDDOLLARS BUDUNITS COLUMN-TOTAL AS 'Total'BY REGION IF CATEGORY EQ FoodON TABLE PCHOLD FORMAT EXL2K NOBREAKON TABLE SET STYLE *type=REPORT, font=Arial, size=10, style=normal, $type=HEADING, style=bold, size=12, color=blue, $type=title, style=bold, $type=grandtotal, style=bold, $ENDSTYLEEND
10. Linking a Report to Other Resources
Creating Reports With TIBCO® WebFOCUS Language 953
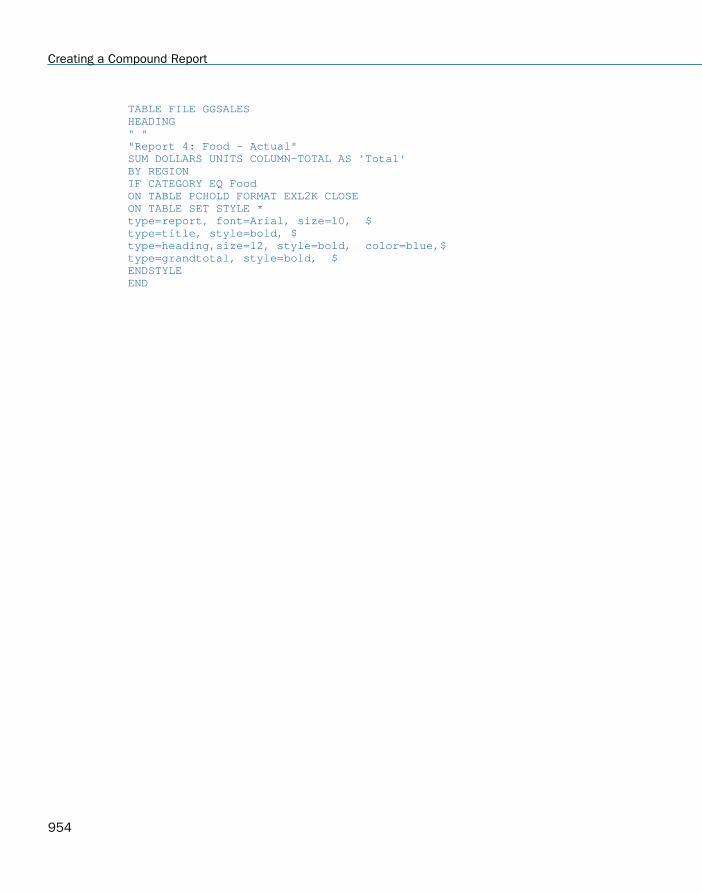
TABLE FILE GGSALESHEADING" ""Report 4: Food - Actual"SUM DOLLARS UNITS COLUMN-TOTAL AS 'Total'BY REGION IF CATEGORY EQ FoodON TABLE PCHOLD FORMAT EXL2K CLOSEON TABLE SET STYLE *type=report, font=Arial, size=10, $type=title, style=bold, $type=heading,size=12, style=bold, color=blue,$type=grandtotal, style=bold, $ENDSTYLEEND
Creating a Compound Report
954

The output is:
10. Linking a Report to Other Resources
Creating Reports With TIBCO® WebFOCUS Language 955

Creating a PDF Compound Report With Drill Through Links
A common technique in business reporting is to create two related reports:
Summary Report. Contains condensed information for a category such as a businessaccount, with summed data such as total balances and total sales.
Detail Report. For specified fields in the associated summary report, a detail reportcontains all the component values that contributed to each summary field value.
Drill Through provides a way to easily relate the data in these two types of reports. Forexample, a user scanning a summary report account may see an unusual figure in one of theaccounts, requiring examination of the specific data behind that figure.
There are two forms of Compound Drill Through reports:
Legacy Drill Through Compound Reports. These reports use the legacy compound reportsyntax (PCHOLD with the OPEN and CLOSE options) to create the compound report.
Drill Through Compound Layout Reports. These reports use document syntax declarationsto create the compound procedure and define which reports will be related throughhyperlinks.
In both types of Compound Drill Through reports, the syntax for creating hyperlinks betweenreports within the PDF file are exactly the same.
Reference: Drill Through and Drill Down Compared
Using Drill Down, you can construct a summary report in which clicking a hyperlink displaysdetail data. A Drill Down is implemented dynamically. Clicking a hyperlink causes a new reportto run. The detail report typically displays only the detail data for a selected field on thesummary report.
In contrast, Drill Through reports are static. Drill Through creates a PDF document thatcontains the summary report plus the detail report, with the detail report containing all thedetail data for designated fields in the summary report. Clicking a Drill Through hyperlinknavigates internally in the PDF file. No additional reports are run. You can save the PDF file todisk or distribute it using ReportCaster. When opened with Adobe Reader, it retains its full DrillThrough functionality.
Drill Through provides flexibility in the appearance of reports and location of hyperlinks:
Drill Through hyperlinks may appear in headings and subheadings, as well as, in rows ofdata.
You can format the reports using a WebFOCUS StyleSheet.
Creating a PDF Compound Report With Drill Through Links
956

You can indicate a hyperlink by color, font, underlining, and so forth.
You can mix conventional Drill Down hyperlinks freely in the same report with Drill Throughhyperlinks.
The PDF file created with Drill Through can consist of more than two reports.
Reference: Use With Other Features
You can use Drill Through with other WebFOCUS features:
Compound reports that contain linked Drill Through reports may also contain unrelatedreports, before or after the Drill Through reports. For example, you can add to thecompound report package a PDF report that contains embedded graphs.
You can add Drill Down and URL hyperlinks to a PDF report that contains Drill Throughhyperlinks.
Since Drill Through reports are standard PDF compound reports packaged into a single PDFfile, you can distribute them using ReportCaster.
Reports with DRILLTHROUGH syntax can be rendered in all other styled output formats:HTML, PostScript, EXL2K, and so on. In these other formats, the DRILLTHROUGH syntax isignored. It is useful, for example, to generate a PostScript version of a Drill Through report,which is formatted identically to the PDF version, but which you can send directly to aPostScript printer using ReportCaster or operating system commands.
Drill Through automates the process of navigating quickly and easily from general tospecific information in related reports packaged in a single PDF compound report. DrillThrough syntax sets up hyperlinks that take you from an item in a summary report to acorresponding item in a detail report.
Procedure: How to Create a Drill Through in a PDF Compound Layout Report
To create a Drill Through in a PDF Compound Layout report:
1. Create the summary report with a DRILLTHROUGH hyperlink.
2. Create the detail report with sort values that match the hyperlink field values.
3. Create the Compound Layout report with page layouts for each component report, anddefine a DRILLMAP attribute within the calling report to specify the targets of the drillthrough hyperlinks.
10. Linking a Report to Other Resources
Creating Reports With TIBCO® WebFOCUS Language 957

Procedure: How to Create a Drill Through in a PDF Compound Report
To create a Drill Through in a PDF Compound Report:
1. Create the summary report.
2. Create the detail report.
3. Connect the reports with hyperlinks.
4. Merge the summary and detail reports into a PDF compound report.
Syntax: How to Specify Drill Through Hyperlinks
TYPE=type, [element,] [styling_attributes,] DRILLTHROUGH={DOWN|FIRST}(link_fields) , $
where:
typeIs one of the following StyleSheet types:
DATA
HEADING
FOOTING
SUBHEAD
SUBFOOT
SUBTOTAL
RECAP
elementIs one or more identifying elements allowed in a WebFOCUS StyleSheet and DrillThrough report. An element can describe a specific column (for example,COLUMN=PRODUCT) or heading item (for example, LINE=2, OBJECT=field, ITEM=3).
styling_attributesOptionally specify the appearance of the hyperlink (for example, COLOR=RED,STYLE=BOLD).
DOWN
Links to the next (the following) report.
FIRST
Links to the first Drill Through report in the sequence.
Creating a PDF Compound Report With Drill Through Links
958

link_fieldsSpecifies blank-delimited link field pairs with the following format:
T1=S1 T2=S2 T3=S3...
T1, T2, and T3 represent column references in the target (linked) report, and S1,S2, and S3 represent column references in the source (current) report. There maybe more than three pairs.
A column reference can be the name of a field or any of the other symbols valid inWebFOCUS StyleSheets syntax (for example, Bn, Cn, Pn, Nn, An, subscripted fieldname, and so on).
The order of the syntax is similar to Drill Down syntax, in which the parameter pairsspecify the column reference in the current (source) report on the right and the nameof the Dialogue Manager variable in the Drill Down (target) procedure on the left.
If the column reference in the target report is identical to the column reference in thesource report, you can use a single column reference, for example, COUNTRY insteadof COUNTRY=COUNTRY.
Example: Specifying Drill Through Hyperlinks
The following StyleSheet declaration places a hyperlink on the PRODUCT field on each DATAline, specifies that the fields to link to the next report are CATEGORY and PRODUCT, specifiesthe action DOWN, so that clicking a hyperlink brings you to the location in the next report thathas the corresponding values of the two link fields, and uses the default appearance for thehyperlinks, which is blue, underlined text. Since the target fields in the detail report haveidentical names in the summary report, you can use the notation CATEGORY rather thanCATEGORY=CATEGORY.
TYPE=DATA, COLUMN=PRODUCT, DRILLTHROUGH=DOWN(CATEGORY PRODUCT), $
Syntax: How to Specify Which Compound Layout Reports Will be Related Through Hyperlinks
The target report is specified in the DRILLMAP attribute of the COMPONENT declaration for thecalling report.
DRILLMAP=((L1 targetreport))
where:
L1
Is the link identifier.
targetreportIs the component name of hyperlink destination.
10. Linking a Report to Other Resources
Creating Reports With TIBCO® WebFOCUS Language 959
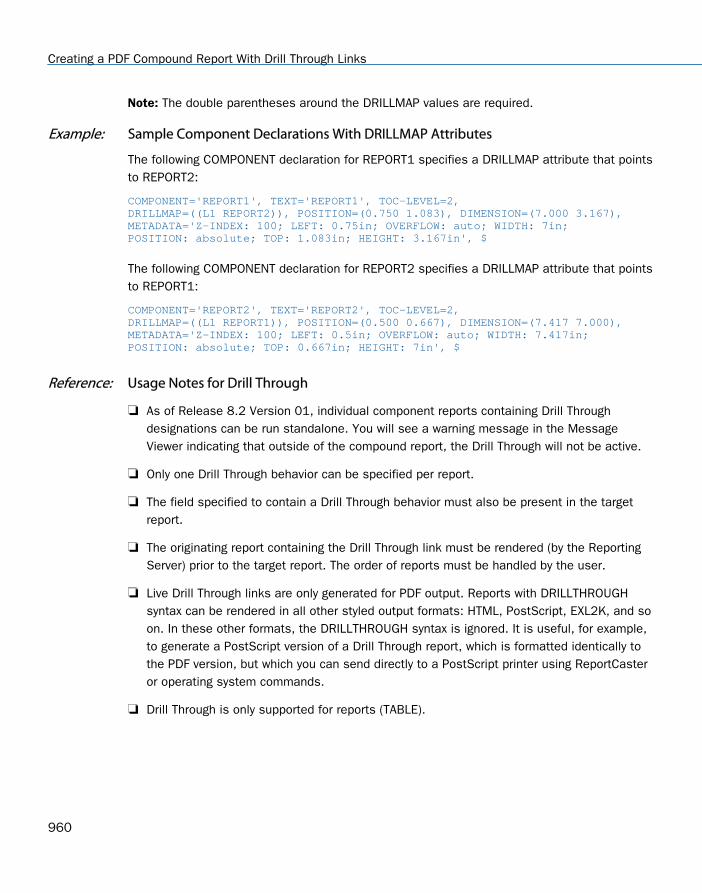
Note: The double parentheses around the DRILLMAP values are required.
Example: Sample Component Declarations With DRILLMAP Attributes
The following COMPONENT declaration for REPORT1 specifies a DRILLMAP attribute that pointsto REPORT2:
COMPONENT='REPORT1', TEXT='REPORT1', TOC-LEVEL=2, DRILLMAP=((L1 REPORT2)), POSITION=(0.750 1.083), DIMENSION=(7.000 3.167),METADATA='Z-INDEX: 100; LEFT: 0.75in; OVERFLOW: auto; WIDTH: 7in;POSITION: absolute; TOP: 1.083in; HEIGHT: 3.167in', $
The following COMPONENT declaration for REPORT2 specifies a DRILLMAP attribute that pointsto REPORT1:
COMPONENT='REPORT2', TEXT='REPORT2', TOC-LEVEL=2, DRILLMAP=((L1 REPORT1)), POSITION=(0.500 0.667), DIMENSION=(7.417 7.000),METADATA='Z-INDEX: 100; LEFT: 0.5in; OVERFLOW: auto; WIDTH: 7.417in;POSITION: absolute; TOP: 0.667in; HEIGHT: 7in', $
Reference: Usage Notes for Drill Through
As of Release 8.2 Version 01, individual component reports containing Drill Throughdesignations can be run standalone. You will see a warning message in the MessageViewer indicating that outside of the compound report, the Drill Through will not be active.
Only one Drill Through behavior can be specified per report.
The field specified to contain a Drill Through behavior must also be present in the targetreport.
The originating report containing the Drill Through link must be rendered (by the ReportingServer) prior to the target report. The order of reports must be handled by the user.
Live Drill Through links are only generated for PDF output. Reports with DRILLTHROUGHsyntax can be rendered in all other styled output formats: HTML, PostScript, EXL2K, and soon. In these other formats, the DRILLTHROUGH syntax is ignored. It is useful, for example,to generate a PostScript version of a Drill Through report, which is formatted identically tothe PDF version, but which you can send directly to a PostScript printer using ReportCasteror operating system commands.
Drill Through is only supported for reports (TABLE).
Creating a PDF Compound Report With Drill Through Links
960

Sample Drill Through PDF Compound Reports
The following examples illustrate how to use Drill Through syntax to create a compound reportwith a summary and detail report and navigate between them.
Example: Creating the Summary Report (Step 1)
The following syntax generates a sample summary report:
TABLE FILE GGSALESSUM UNITS DOLLARS BY CATEGORY BY PRODUCTON TABLE PCHOLD FORMAT PDFEND
The output is:
10. Linking a Report to Other Resources
Creating Reports With TIBCO® WebFOCUS Language 961

Example: Creating the Detail Report (Step 2)
The following syntax generates a sample detail report:
The first page of the output is:
SET SQUEEZE=ONTABLE FILE GGSALESSUM UNITS BUDUNITS DOLLARSBY CATEGORY NOPRINT BY PRODUCT NOPRINTON CATEGORY PAGE-BREAKHEADING CENTER"Category: <CATEGORY"" "ON PRODUCT SUBHEAD"**** Product: <PRODUCT"ON PRODUCT SUBFOOT" ""<25 **** Return to Summary ****"ON PRODUCT PAGE-BREAKBY REGION BY CITYON TABLE PCHOLD FORMAT PDFEND
Creating a PDF Compound Report With Drill Through Links
962

Example: Connecting the Reports With Hyperlinks (Step 3)
The example illustrates the following:
When you place a Drill Through hyperlink on a sort-break element, ensure the sort-break isat least at the level of the last sort field participating in the Drill Through. For example, inthe second report, the Drill Through hyperlink is on the subfooting associated withPRODUCT rather than the heading (with a sort break) associated with CATEGORY.
Although the code can infer a value of PRODUCT for the CATEGORY heading (you can verifythis by embedding the field <PRODUCT> in the heading), it is always the value of the firstPRODUCT within that CATEGORY. Typically you want a Drill Through hyperlink for each valueof PRODUCT within each CATEGORY.
You do not need to place the hyperlink on an embedded item. You can just as effectivelyplace it on a text item. Any item in the subfooting is associated with the same values ofCATEGORY and PRODUCT. Similarly, you can place a hyperlink on any field in a DATA line,and the values of the associated link fields will be identical. Conventional Drill Downhyperlinks also work this way.
The summary report:
Places a hyperlink on the PRODUCT field on each DATA line.
Specifies that the fields to link to the next report are CATEGORY and PRODUCT. Since thetarget fields in the detail report have identical names in the summary report, you can usethe notation CATEGORY rather than CATEGORY=CATEGORY.
Specifies the action DOWN, so that clicking a hyperlink brings you to the location in thenext report that has the corresponding values of the two link fields.
Uses the default appearance for the hyperlinks, which is blue, underlined text.
The summary report is:
TABLE FILE GGSALESSUM UNITS DOLLARS BY CATEGORY BY PRODUCTON TABLE PCHOLD FORMAT PDFON TABLE SET STYLE *TYPE=DATA, COLUMN=PRODUCT, DRILLTHROUGH=DOWN(CATEGORY PRODUCT), $ENDSTYLEEND
10. Linking a Report to Other Resources
Creating Reports With TIBCO® WebFOCUS Language 963
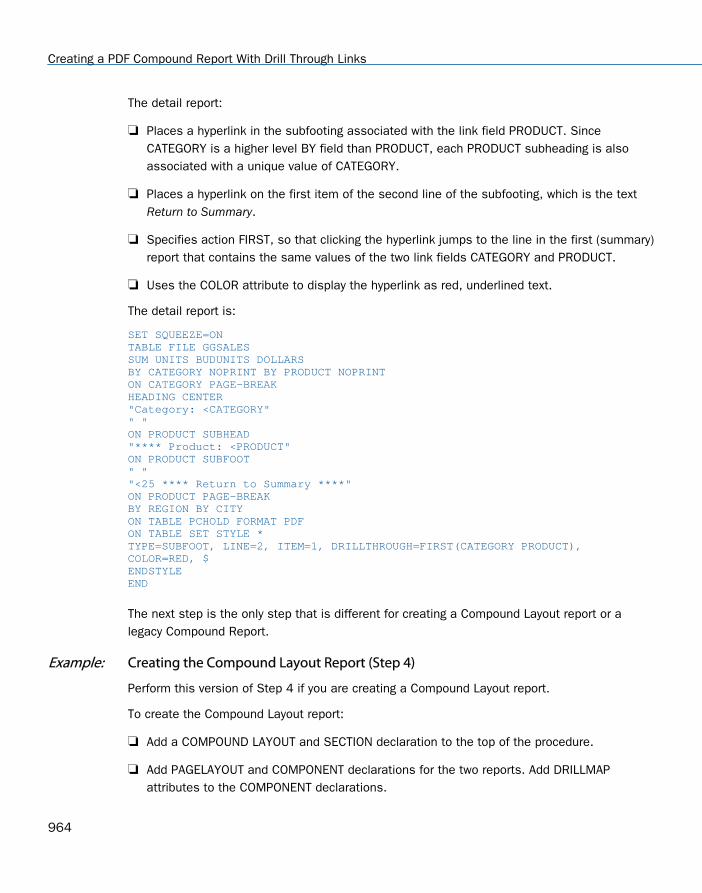
The detail report:
Places a hyperlink in the subfooting associated with the link field PRODUCT. SinceCATEGORY is a higher level BY field than PRODUCT, each PRODUCT subheading is alsoassociated with a unique value of CATEGORY.
Places a hyperlink on the first item of the second line of the subfooting, which is the textReturn to Summary.
Specifies action FIRST, so that clicking the hyperlink jumps to the line in the first (summary)report that contains the same values of the two link fields CATEGORY and PRODUCT.
Uses the COLOR attribute to display the hyperlink as red, underlined text.
The detail report is:
SET SQUEEZE=ONTABLE FILE GGSALESSUM UNITS BUDUNITS DOLLARSBY CATEGORY NOPRINT BY PRODUCT NOPRINTON CATEGORY PAGE-BREAKHEADING CENTER"Category: <CATEGORY"" "ON PRODUCT SUBHEAD"**** Product: <PRODUCT"ON PRODUCT SUBFOOT" ""<25 **** Return to Summary ****"ON PRODUCT PAGE-BREAKBY REGION BY CITYON TABLE PCHOLD FORMAT PDFON TABLE SET STYLE *TYPE=SUBFOOT, LINE=2, ITEM=1, DRILLTHROUGH=FIRST(CATEGORY PRODUCT),COLOR=RED, $ENDSTYLEEND
The next step is the only step that is different for creating a Compound Layout report or alegacy Compound Report.
Example: Creating the Compound Layout Report (Step 4)
Perform this version of Step 4 if you are creating a Compound Layout report.
To create the Compound Layout report:
Add a COMPOUND LAYOUT and SECTION declaration to the top of the procedure.
Add PAGELAYOUT and COMPONENT declarations for the two reports. Add DRILLMAPattributes to the COMPONENT declarations.
Creating a PDF Compound Report With Drill Through Links
964
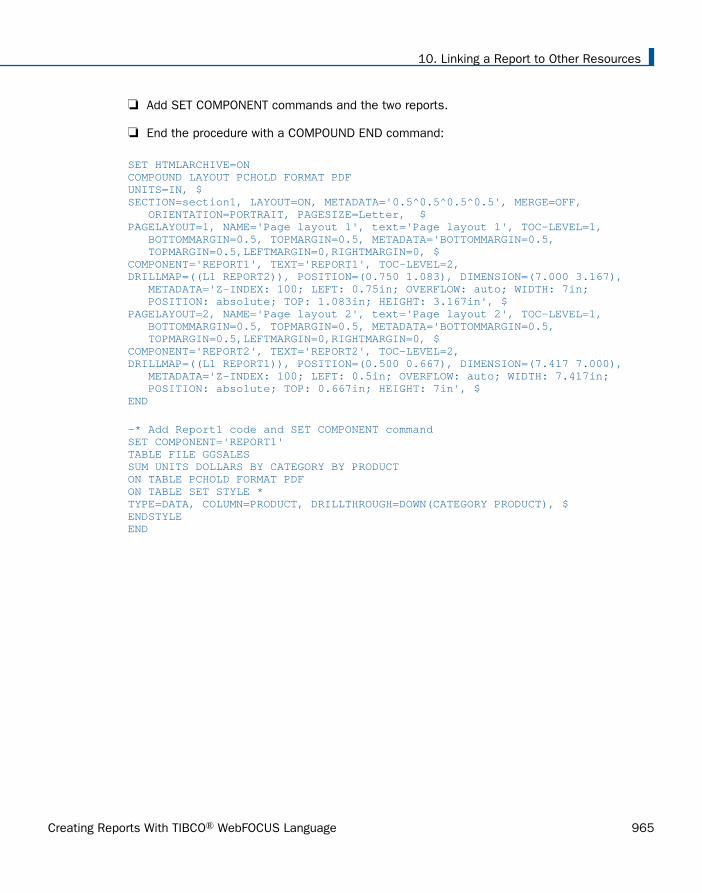
Add SET COMPONENT commands and the two reports.
End the procedure with a COMPOUND END command:
SET HTMLARCHIVE=ONCOMPOUND LAYOUT PCHOLD FORMAT PDFUNITS=IN, $SECTION=section1, LAYOUT=ON, METADATA='0.5^0.5^0.5^0.5', MERGE=OFF, ORIENTATION=PORTRAIT, PAGESIZE=Letter, $PAGELAYOUT=1, NAME='Page layout 1', text='Page layout 1', TOC-LEVEL=1, BOTTOMMARGIN=0.5, TOPMARGIN=0.5, METADATA='BOTTOMMARGIN=0.5, TOPMARGIN=0.5,LEFTMARGIN=0,RIGHTMARGIN=0, $COMPONENT='REPORT1', TEXT='REPORT1', TOC-LEVEL=2,DRILLMAP=((L1 REPORT2)), POSITION=(0.750 1.083), DIMENSION=(7.000 3.167), METADATA='Z-INDEX: 100; LEFT: 0.75in; OVERFLOW: auto; WIDTH: 7in; POSITION: absolute; TOP: 1.083in; HEIGHT: 3.167in', $PAGELAYOUT=2, NAME='Page layout 2', text='Page layout 2', TOC-LEVEL=1, BOTTOMMARGIN=0.5, TOPMARGIN=0.5, METADATA='BOTTOMMARGIN=0.5, TOPMARGIN=0.5,LEFTMARGIN=0,RIGHTMARGIN=0, $COMPONENT='REPORT2', TEXT='REPORT2', TOC-LEVEL=2,DRILLMAP=((L1 REPORT1)), POSITION=(0.500 0.667), DIMENSION=(7.417 7.000), METADATA='Z-INDEX: 100; LEFT: 0.5in; OVERFLOW: auto; WIDTH: 7.417in; POSITION: absolute; TOP: 0.667in; HEIGHT: 7in', $END
-* Add Report1 code and SET COMPONENT commandSET COMPONENT='REPORT1'TABLE FILE GGSALESSUM UNITS DOLLARS BY CATEGORY BY PRODUCTON TABLE PCHOLD FORMAT PDFON TABLE SET STYLE *TYPE=DATA, COLUMN=PRODUCT, DRILLTHROUGH=DOWN(CATEGORY PRODUCT), $ENDSTYLEEND
10. Linking a Report to Other Resources
Creating Reports With TIBCO® WebFOCUS Language 965

-* Add report2 code and SET COMPONENT commandSET COMPONENT='REPORT2'SET SQUEEZE=ONTABLE FILE GGSALESSUM UNITS BUDUNITS DOLLARSBY CATEGORY NOPRINT BY PRODUCT NOPRINTON CATEGORY PAGE-BREAKHEADING CENTER"Category: <CATEGORY"" "ON PRODUCT SUBHEAD"**** Product: <PRODUCT"ON PRODUCT SUBFOOT" ""<25 **** Return to Summary ****"ON PRODUCT PAGE-BREAKBY REGION BY CITYON TABLE PCHOLD FORMAT PDFON TABLE SET STYLE *TYPE=SUBFOOT, LINE=2, ITEM=1, DRILLTHROUGH=FIRST(CATEGORY PRODUCT),COLOR=RED, $ENDSTYLEENDCOMPOUND END
Example: Merging Summary and Detail Reports Into a PDF Compound Report (Step 4)
Perform this version of Step 4 if you are creating a legacy compound report.
The next step is to combine the reports into a single PDF Compound Report. You can:
Code the OPEN and CLOSE options on the [PC]HOLD FORMAT PDF command.
Code the OPEN and CLOSE options on the SET COMPOUND command before thecomponent report syntax.
Drill Through does not support the NOBREAK option, which displays compound reports withoutintervening page breaks.
Creating a PDF Compound Report With Drill Through Links
966

This example uses the OPEN and CLOSE options on the PCHOLD FORMAT PDF command:
TABLE FILE GGSALESSUM UNITS DOLLARS BY CATEGORY BY PRODUCTON TABLE PCHOLD FORMAT PDF OPENON TABLE SET STYLE *TYPE=DATA, COLUMN=PRODUCT, DRILLTHROUGH=DOWN(CATEGORY PRODUCT), $ENDSTYLEEND
SET SQUEEZE=ONTABLE FILE GGSALESSUM UNITS BUDUNITS DOLLARSBY CATEGORY NOPRINT BY PRODUCT NOPRINTON CATEGORY PAGE-BREAKHEADING CENTER"Category: <CATEGORY"" "ON PRODUCT SUBHEAD"**** Product: <PRODUCT"ON PRODUCT SUBFOOT" ""<25 **** Return to Summary ****"ON PRODUCT PAGE-BREAKBY REGION BY CITYON TABLE PCHOLD FORMAT PDF CLOSEON TABLE SET STYLE *TYPE=SUBFOOT, LINE=2, ITEM=1, DRILLTHROUGH=FIRST(CATEGORY PRODUCT),COLOR=RED, $ENDSTYLEEND
10. Linking a Report to Other Resources
Creating Reports With TIBCO® WebFOCUS Language 967

Example: Run the Drill Through Report (Step 5)
Run the compound report. The first page of output has the summary report with the hyperlinksto the individual products in blue and underlined:
Click the hyperlink Croissant for the category Food. You jump to that detail information. In thedetail report, the hyperlink back to the summary report is in red and underlined:
Click the hyperlink Return to Summary to return to the first page (summary report).
Creating a PDF Compound Report With Drill Through Links
968

Reference: Guidelines on Links For FIRST
The following guidelines apply:
The set of link fields used with FIRST must correspond to the set of link fields used withDOWN on the first report.
The action of a FIRST hyperlink in the last report should return to the corresponding line inthe first report. The chosen set of links must uniquely identify that line of the first report.
The DOWN hyperlink on the line of the first report must uniquely identify that line of the firstreport to locate the matching line of the detail report. The set of links for the DOWN in thefirst report and the FIRST link in the last report are the same, since they both must uniquelyidentify a line in the first report.
Reference: Rules For Drill Through Hyperlinks
Reports linked with Drill Through must follow certain rules to ensure that the hyperlinksbetween them work correctly. The following are key concepts:
Source report. The report from which you are linking. The source report contains hyperlinksto the target report.
Target report. The report to which you are linking.
Link field. One of a set of corresponding fields of the same data type that exist in both thesource and target reports. Link fields locate the position in the target report to which ahyperlink in the source report jumps.
Source and target terminology refer to each pair of linked reports. For example, if there arethree reports linked with Drill Through, the second report is generally the target report of thefirst report, and also the source report of the third report.
To process a report as a Drill Through, you must identify the link fields in the source report thatrelate to the target report:
Choose meaningful link fields whose values match in the source and target reports. Forexample, if a field in the source report contains a part number and a field in the targetreport contains a Social Security number, the field values will not match and you cannotconstruct hyperlinks.
Specify as many link fields as necessary to uniquely locate the position in the target reportthat corresponds to the link fields in the source report. For example, if the source report issorted by STATE and CITY, specifying CITY alone as the link field will be problematic ifdifferent states contain a city with the same name.
10. Linking a Report to Other Resources
Creating Reports With TIBCO® WebFOCUS Language 969
The link fields in the source and target reports must have the same internal (actual) format:the stopped data type and internal length must be identical. Formatting options, such asnumber of displayed digits and comma suppression, may differ. For example, an A20 fieldmust link to another A20 field. However, an I6C field may link to an I8 field, since internallyboth are four-byte fields.
The link fields must be sort fields or verb objects in both the source and target reports. Youcan include a NOPRINT (non-display) field, which is useful when constructing a report inwhich a field is in embedded in heading text.
Designing Drill Through reports is very similar to designing Drill Down reports. Choosing thelink fields for a Drill Through report is similar to choosing the parameter fields in a DrillDown report. Likewise, the syntax of a Drill Through closely parallels the syntax of a DrillDown.
Since Drill Through reports are linked by corresponding values of link fields, the hyperlinksmust appear on report elements associated with a particular value of a link field. However,hyperlinks do not have to appear on any link itself.
Not all line types are appropriate for placement of a Drill Through hyperlink. For example, ifa page break occurs on a BY field that is also a Drill Through link, each page heading isclearly associated with a value in that field. However, if a page break occurs because ofpage overflow, avoid placing a Drill Through link in a heading. Similarly, subheadings,subfootings, subtotals, and recaps are associated only with the values of particular BYfields.
Creating a PDF Compound Report With Drill Through Links
970

Chapter11Navigating Within an HTML Report
You can include the following navigation features within a report to control the reportdisplay:
Dynamic TOC. You can add a multi-level table of contents to a report to enhance theviewing and navigation of data. The TOC can appear as an expandable list of clickablevalues or as a series of drop-down form controls. By clicking values in the TOC, youcan toggle between views of the data and quickly locate specific values in the report.
WebFOCUS Viewer. You can divide an HTML report into multiple webpages to speedthe delivery of information to your browser. This feature, also known as on-demandpaging, is implemented in the WebFOCUS Viewer, where you can navigate tosubsequent, previous, or specific pages after your first page of output is displayed.
Hyperlinks between pages. You can define automatic hyperlinks in a report thatcontains multiple pages, making it easy to link consecutive report pages together andnavigate to the next or previous page.
For related information, see Navigating Between Reports on page 990.
In this chapter:
Navigating Sort Groups From a Table of Contents
Adding the HTML Table of Contents Tree Control to Reports
Controlling the Display of Sorted Data With Accordion Reports
Navigating a Multi-Page Report With the WebFOCUS Viewer
Linking Report Pages
Navigating Sort Groups From a Table of Contents
You can enhance navigation within a large HTML report by adding a dynamic HTML-based Tableof Contents (TOC). To take advantage of this feature, the report must contain at least onevertical sort (BY) field. If you include more than one sort field in a report, the hierarchy isdetermined by the order in which the sort fields are specified in the request.
The TOC also enhances the display of groups of data. You can view one section (or page) ofthe report at a time, or you can view all sections at once. You can control this with a pagebreak. For more information, see Grouping Sort Fields for Display on page 978.
Creating Reports With TIBCO® WebFOCUS Language 971

The TOC displays all values of the first (highest-level) vertical sort field, as well as the values ofany lower level BY fields that you designate for inclusion. These values are displayed as anexpandable series of links or as a series of list controls. Unless otherwise specified in therequest, a new page begins when the highest-level sort field changes.
The display of data for a lower level sort field is controlled by your selection of a higher-levelsort field value. For example, in a report sorted first by country and then by car model, if youchoose Italy from the TOC for country, you will only see a listing of Italian models in the TOC forcars. Cars produced in other countries are not displayed.
Using the TOC, you can:
View any section of a report by clicking the associated link.
Toggle between a single section and the entire report content by clicking View Entire Report.
Remove the TOC by clicking Remove Table of Contents. This is beneficial when printing thereport from the browser. Double-click anywhere in the report to restore it and continuenavigation.
The TOC itself is an object that initially appears as an icon in the upper-left corner of the reportor as one or more drop-down lists in a page heading or footing or a report heading or footing.
Heading Option. To add the TOC to a heading or footing, you can use a StyleSheet. See How to Add TOC Drop-down List Controls to a Heading on page 983.
Report Option. To add an HTML TOC object to the upper-left hand corner of a report, youcan use a SET command or a PCHOLD command. See How to Add a TOC Tree Control to aReport Using a SET Command. on page 973.
The sizing of tables within the HTML report is done by the browser. The columns are sized to fitthe largest data value, and trailing spaces are automatically removed. In standard HTMLreports, the data is presented in a single table, so the column widths are fixed for all datarows. Both HTML BYTOC (Report)/TOC (Heading) features place the data for each sort keyvalue into individual tables or sections that are accessed using the HTML control. In the HTMLBYTOC/TOC reports, the column widths in each individual table are determined by the datapresented for each value, rather than the overall report. These different table sizes becomeapparent when the View Entire Report option is selected. Set SQUEEZE = OFF to define fixedcolumn widths across all of the tables.
Reference: Usage Notes for HTMLARCHIVE With HTML Table of Contents
WebFOCUS interactive reporting features must have a connection to the WebFOCUS client inorder to access the components required to operate successfully.
Navigating Sort Groups From a Table of Contents
972

HTMLARCHVE can be used to create self-contained HTML pages with user-defined imageswhen client access is not available.
To generate HTML pages containing user-defined images that can operate interactively, useone of the following commands:
SET HTMLEMBEDIMG=ONSET HTMLARCHIVE=ON
Define BASEURL to point directly to the host machine where these files can be accessed usingthe following syntax:
SET BASEURL=http://{hostname:portnumber}
For more information on SET BASEURL, see Specifying a Base URL on page 874.
Adding the HTML Table of Contents Tree Control to Reports
You can use three different types of syntax to add an HTML TOC object to a report.
Syntax: How to Add a TOC Tree Control to a Report Using a SET Command.
Using a SET command, the syntax is
At the beginning of a request:
SET COMPOUND = 'BYTOC [n]'
In a request, use the syntax:
ON TABLE SET COMPOUND 'BYTOC [n]'
where:
nRepresents the number of vertical sort (BY) fields to include in the TOC, beginning withthe first (highest-level) sort field in the request. The hierarchy of sort fields isdetermined by the order in which they are specified in the request.
The default value is 1, meaning that only the highest-level sort field and its values aredisplayed in the TOC.
By default, a section break is placed after the first (highest-level) sort field, unlessotherwise specified in the request.
Note: Single quotation marks (') should be used when BYTOC is specified with a number in aSET command.
11. Navigating Within an HTML Report
Creating Reports With TIBCO® WebFOCUS Language 973

Syntax: How to Add a TOC Tree Control to a Report by Using the PCHOLD Command
Using a PCHOLD command, the syntax is
ON TABLE PCHOLD FORMAT HTML BYTOC [n]
where:
nRepresents the number of vertical sort (BY) fields to include in the TOC, beginning withthe first (highest-level) sort field in the request. The hierarchy of sort fields isdetermined by the order in which they are specified in the request.
The default value is 1, meaning that only the highest-level sort field and its values aredisplayed in the TOC.
By default, a section break is placed after the first (highest-level) sort field, unlessotherwise specified in the request.
Note: Single quotation marks (') should not be used when BYTOC is specified in a PCHOLDcommand with a number.
Syntax: How to Add a TOC Tree Control to a Report Using a StyleSheet Declaration
The following syntax enables the TOC tree control in the StyleSheet:
TYPE=REPORT, TOC='n',$
or
TYPE=REPORT, TOC='sortfieldname',$
where:
n
Represents the number of vertical sort (BY) fields to include in the TOC, beginning with thefirst (highest-level) sort field in the request. The hierarchy of sort fields in the TOC Tree isdetermined by the order in which they are listed in the request.
sortfieldname
Specifies the vertical sort (BY) column by its field name.
Note: Single quotation marks (') should be used when TOC is specified in the StyleSheet.
Example: Adding an HTML TOC as an Object in the Report (Report Option)
You can add an HTML TOC as an icon to the upper-left corner of a report by preceding therequest with a SET command, as illustrated in the following request. The TOC will list values ofthe first (highest level) vertical sort field, PLANT:
Adding the HTML Table of Contents Tree Control to Reports
974
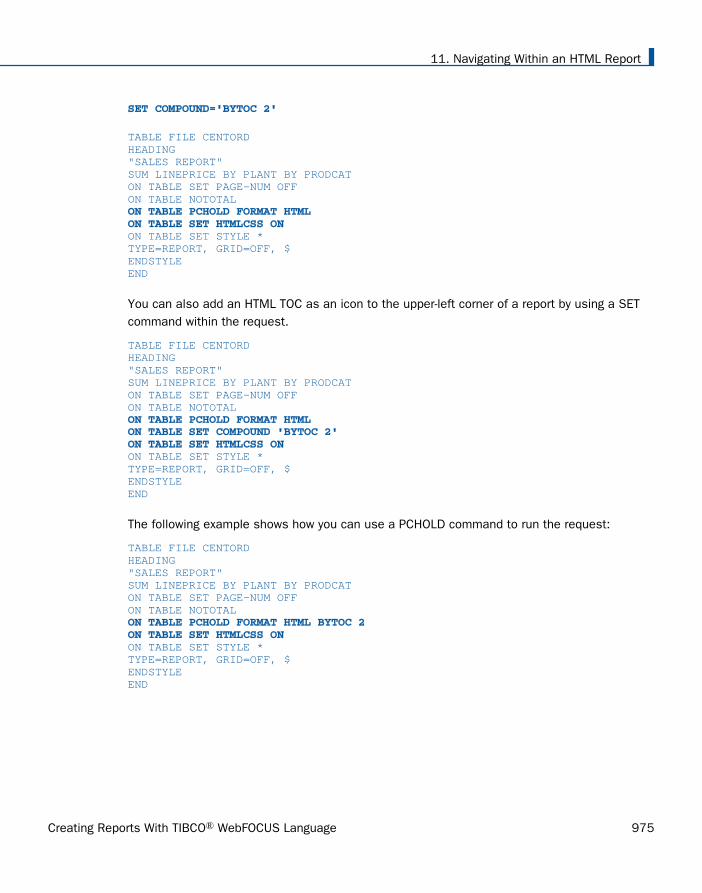
SET COMPOUND='BYTOC 2'
TABLE FILE CENTORDHEADING"SALES REPORT"SUM LINEPRICE BY PLANT BY PRODCATON TABLE SET PAGE-NUM OFFON TABLE NOTOTAL ON TABLE PCHOLD FORMAT HTMLON TABLE SET HTMLCSS ON ON TABLE SET STYLE *TYPE=REPORT, GRID=OFF, $ENDSTYLEEND
You can also add an HTML TOC as an icon to the upper-left corner of a report by using a SETcommand within the request.
TABLE FILE CENTORDHEADING"SALES REPORT"SUM LINEPRICE BY PLANT BY PRODCATON TABLE SET PAGE-NUM OFFON TABLE NOTOTAL ON TABLE PCHOLD FORMAT HTMLON TABLE SET COMPOUND 'BYTOC 2'ON TABLE SET HTMLCSS ON ON TABLE SET STYLE *TYPE=REPORT, GRID=OFF, $ENDSTYLEEND
The following example shows how you can use a PCHOLD command to run the request:
TABLE FILE CENTORDHEADING"SALES REPORT"SUM LINEPRICE BY PLANT BY PRODCATON TABLE SET PAGE-NUM OFFON TABLE NOTOTAL ON TABLE PCHOLD FORMAT HTML BYTOC 2ON TABLE SET HTMLCSS ON ON TABLE SET STYLE *TYPE=REPORT, GRID=OFF, $ENDSTYLEEND
11. Navigating Within an HTML Report
Creating Reports With TIBCO® WebFOCUS Language 975

In the following request, the TOC Tree control is enabled in the Report StyleSheet:
TABLE FILE CENTORD HEADING"SALES REPORT"SUM LINEPRICEBY PLANT BY PRODCATON TABLE SET PAGE-NUM OFFON TABLE NOTOTALON TABLE PCHOLD FORMAT HTMLON TABLE SET HTMLCSS ONON TABLE SET STYLE *TYPE=REPORT, GRID=OFF, $ TYPE=REPORT, TOC='PRODCAT', $ ENDSTYLEEND
Note: Single quotation marks (') should be used when TOC is specified in the StyleSheet.
Run the report. The TOC object displays in the upper-left corner.
Adding the HTML Table of Contents Tree Control to Reports
976

Double-click the TOC icon to open the Table of Contents Tree control. This displays the valuesof the sort fields in the report in the order in which they have been specified.
Note: You can move the TOC by clicking the blue area above Table of Contents and thendragging it to another area of the report, or double-click on a desired location in the report.
If you wish to display all available fields (the whole report), click the View Entire Report (On/Off)option.
11. Navigating Within an HTML Report
Creating Reports With TIBCO® WebFOCUS Language 977

Tip: You can also customize the look and feel of the TOC object by editing a .css file. It isrecommended that you make a backup copy prior to editing.
If you are working in a self service or Managed Reporting environment from a browser, go tothe \ibi\WebFOCUS##\ibi_apps\ibi_html\javaassist\intl\xx directory, where ## is therelease of WebFOCUS and xx is the language abbreviation. For English (EN) the .css filename is toc.css. For all other languages the .css file name is xxtoc.css, where xx is thelanguage abbreviation.
Note: If you click Remove Table of Contents and then want to view the TOC again, simplydouble-click on a desired location in the report.
Reference: Grouping Sort Fields for Display
Data in a TOC report is grouped into sections based on the sort fields. TOC reports only displayone section at a time for easier viewing. Each section contains all of the values for its sortfield. You can customize each section with a page break. By default, a page break is includedin the first (highest level) sort field. You can add page breaks to create additional sections andgroup data that is based on lower level sort fields.
When adding a TOC to a heading, add additional page breaks for each lower level sort field.This ensures that the sorted data is correctly grouped and displayed.
Example: Customizing Sections of the Report With a Page Break
TABLE FILE SHORTPRINT PROJECTED_RETURNBY CONTINENTBY REGIONBY COUNTRYBY HOLDERBY TYPEON HOLDER PAGE-BREAKON TABLE SET PAGE-NUM OFF ON TABLE PCHOLD FORMAT HTMLON TABLE SET COMPOUND 'BYTOC 5'ON TABLE SET HTMLCSS ONON TABLE SET STYLE *TYPE=REPORT,GRID=OFF,FONT='ARIAL',SIZE=9,COLOR='BLACK',BACKCOLOR='NONE',STYLE=NORMAL,$ENDSTYLEEND
Adding the HTML Table of Contents Tree Control to Reports
978

One section of the report is displayed at a time.
The report is broken into sections based on the values for HOLDER. You will see the detail foreach value of HOLDER in a single section.
Navigation Behavior in a Multi-Level TOC
If you select a value in the TOC, that value flashes (that is, it is highlighted in gray) to drawyour attention to it in the browser window. Where the flash appears, and whether and how thescreen display changes, is controlled by the following factors:
When you change the highest level sort group from the TOC (either from the hierarchyabove the report or from the first drop-down list in a heading or footing), the selected valueflashes three times in the browser window.
When you change a lower-level sort value within the current high-level sort group, theselected value flashes three times in window. This is because you are still within the samemajor sort group, and, therefore, within the same page-break. From the selected value atthe top of the window: you can then scroll quickly to the related details.
If the selected lower level value is already viewable on the screen, and the remaining reportwill fit on the screen, the value flashes, but the report does not scroll.
11. Navigating Within an HTML Report
Creating Reports With TIBCO® WebFOCUS Language 979

Example: Navigating Sorted Data From a Multi-Level TOC
This request adds a dynamic HTML TOC as an icon in the upper-left corner of the report byincluding a SET command in the request. The TOC displays a hierarchy consisting of four levelsof sort fields, beginning with the first (highest-level). The sort fields are: CONTINENT, REGION,COUNTRY, and TYPE.
TABLE FILE SHORTPRINT PROJECTED_RETURNBY CONTINENTBY REGIONBY COUNTRYBY HOLDERBY TYPEON TABLE SET PAGE-NUM OFF ON TABLE PCHOLD FORMAT HTMLON TABLE SET COMPOUND 'BYTOC 5'ON TABLE SET HTMLCSS ONON TABLE SET STYLE *TYPE=REPORT,GRID=OFF,FONT='ARIAL',SIZE=9,STYLE=NORMAL,$ENDSTYLEEND
Adding the HTML Table of Contents Tree Control to Reports
980
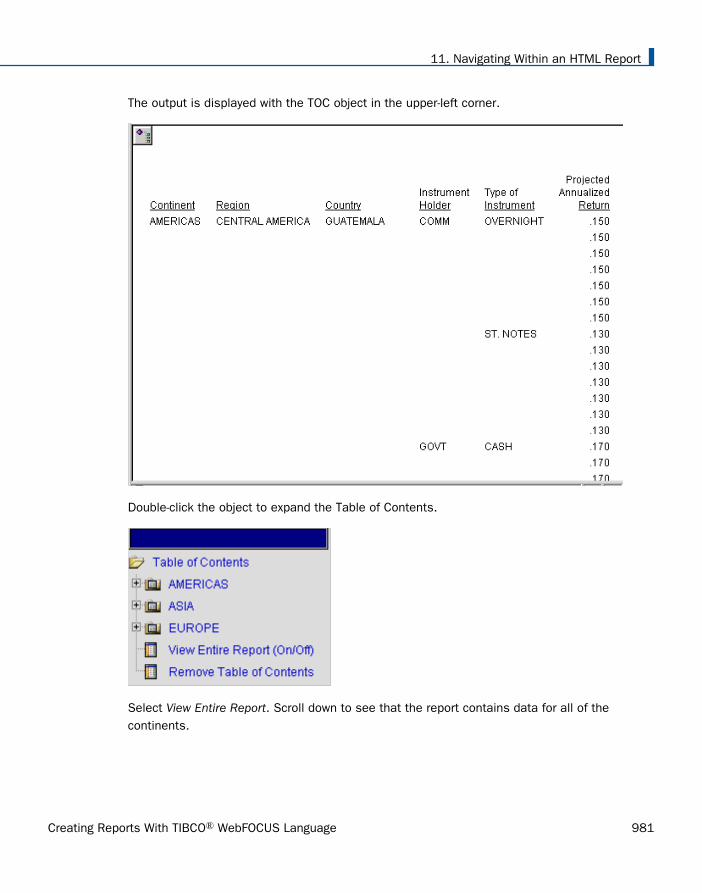
The output is displayed with the TOC object in the upper-left corner.
Double-click the object to expand the Table of Contents.
Select View Entire Report. Scroll down to see that the report contains data for all of thecontinents.
11. Navigating Within an HTML Report
Creating Reports With TIBCO® WebFOCUS Language 981

Scroll back to the top of the report window and reopen the TOC. This time select Americas.Your selection flashes to highlight it on the screen. Although the report display does notappear to change, if you scroll down now you will see that the report only contains values forthe Americas.
Scroll up again and double-click anywhere in the report to open the TOC. This time click the +sign next to Americas, then click the + sign next to South America.
The field values (Argentina and Brazil) are listed in the TOC. These are values of the fieldCOUNTRY. If you wish to see the field name of a value in the TOC, hover over that value withyour cursor.
Adding the HTML Table of Contents Tree Control to Reports
982

Select Brazil. Your selection flashes and moves to the top of the window, as shown next.
Scroll down to see the data for Brazil.
Continue to navigate to the detail you want to view by choosing values at any sort level in theTOC.
Clicking a + sign expands the field to display its values in the TOC.
Clicking an actual value (hyperlink) in the TOC momentarily highlights that value and, ifnecessary, adjusts the report display to move the value into view.
The TOC collapses to its icon when you click Table of Contents, but you can continue toscroll back, expand it, and make additional selections.
Syntax: How to Add TOC Drop-down List Controls to a Heading
Include the following attribute in your StyleSheet declaration
TYPE=heading, [subtype,] TOC=sort_column, $
where:
headingIs the type of heading or footing that contains the TOC.Valid values are:
11. Navigating Within an HTML Report
Creating Reports With TIBCO® WebFOCUS Language 983

TABHEADING Report heading.
TABFOOTING Report footing.
HEADING Page heading.
FOOTING Page footing.
subtypeAre attributes that identify the location in the heading or footing where each requesteddrop-down list will be displayed. These options can be used separately or incombination, depending upon the degree of specificity required to identify acomponent. Valid values are:
LINE_# identifies a line by its position in a heading or footing.
If a heading or footing has multiple lines and you apply a StyleSheet declaration that doesnot specify LINE_#, the declaration is applied to all lines. Blank lines are counted wheninterpreting the value of LINE.
LINE=n is required for a heading or footing that has multiple lines. Otherwise, you canomit it.
OBJECT identifies the TOC object in a heading or footing as a text string or field value.Valid values are TEXT or FIELD.
You can use a field and/or text as a placeholder for a TOC drop-down list. However, field ispreferred. (If the TOC feature is not in effect, the field name is displayed in the report.)
TEXT may represent free text or a Dialogue Manager amper (&) variable.
It is not necessary to specify OBJECT=TEXT unless you are styling both text strings andembedded fields in the same heading or footing.
For related information, see ITEM_#.
ITEM_# which identifies an item by its position in a line.
To determine an ITEM_# for an OBJECT, follow these guidelines:
When used with OBJECT=TEXT, count only the text strings from left to right.
When used with OBJECT=FIELD, count only the fields from left to right.
If you apply a StyleSheet declaration that specifies ITEM_#, the number is counted fromthe beginning of each line in the heading or footing, not just from the beginning of the firstline.
Adding the HTML Table of Contents Tree Control to Reports
984

sort_columnIdentifies the vertical sort columns (BY fields) to include as TOCs. You can identify acolumn using the following notations:
TOC=fieldname specifies the sort column by its field name.
TOC=Bn specifies the sort column by its order in the request. For example, B2 denotes thesecond BY field (NOPRINT BY fields are included in the count).
TOC=n is the same as TOC=Bn.
Note: You must maintain the hierarchy of BY fields because the TOC objects in headings (thedrop-down lists) are interdependent and corresponds with the hierarchy in the report.
Example: Adding HTML TOC Drop Down Lists in a Page Heading
This request uses the required StyleSheet attributes to add a TOC to an HTML report. Thedrop-down TOC lists the values of the field CONTINENT, identified in the StyleSheet code asOBJECT=FIELD, ITEM=1, TOC=CONTINENT.
TABLE FILE SHORTHEADING"Projected Returns Report for Region: <REGION in Continent: <CONTINENT "" "SUM PROJECTED_RETURNBY CONTINENTBY REGIONBY COUNTRYBY TYPEON TABLE SET PAGE-NUM OFF ON TABLE PCHOLD FORMAT HTMLON TABLE SET HTMLCSS ONON TABLE SET STYLE *TYPE=REPORT,GRID=OFF,FONT='ARIAL',SIZE=9,STYLE=NORMAL,$TYPE=HEADING, LINE=1, OBJECT=FIELD, ITEM=1, TOC=CONTINENT, $ENDSTYLEEND
11. Navigating Within an HTML Report
Creating Reports With TIBCO® WebFOCUS Language 985

When you run the report. The TOC appears as a drop-down menu in the heading, in place ofthe field CONTINENT:
Click the TOC to see the list of sort values: AMERICAS, ASIA, EUROPE.
Click each continent to see the related information. The selected value flashes gray tohighlight it in the window.
Adding the HTML Table of Contents Tree Control to Reports
986

You can display all available fields (the whole report) by clicking the View Entire Report option.To remove the TOC, click the Remove Table of Contents option. To restore the TOC, double-clickanywhere in the report or click the Refresh button in your browser.
Example: Navigating a Multi-Level HTML TOC in a Page Heading
This request uses a StyleSheet to add an HTML TOC that contains drop-down lists in the thirdline of the page heading for two sort (BY) fields specified in the request: CONTINENT andREGION. Each field becomes a place-holder for its TOC. (If the TOC features were not in effect,the field would display in the report.)
TABLE FILE SHORT"Projected Return"" ""For:<CONTINENT For:<REGION "SUM PROJECTED_RETURNBY CONTINENT BY REGION BY COUNTRY BY TYPEON TABLE PCHOLD FORMAT HTMLON TABLE SET HTMLCSS ONON CONTINENT PAGE-BREAKON TABLE SET STYLE *TYPE=REPORT,GRID=OFF,FONT='ARIAL',SIZE=9,STYLE=NORMAL,$TYPE=HEADING, LINE=1, STYLE=BOLD, $TYPE=HEADING, LINE=3, OBJECT=FIELD, ITEM=1, TOC=B1,$TYPE=HEADING, LINE=3, OBJECT=FIELD, ITEM=2, TOC=REGION,$ENDSTYLEEND
11. Navigating Within an HTML Report
Creating Reports With TIBCO® WebFOCUS Language 987

The output is:
Adding the HTML Table of Contents Tree Control to Reports
988

Click the arrow in the second TOC drop-down list and select North America. Keep in mind thatthe values in this drop-down list are related to those in the higher level drop-down list. They areall part of the same higher level sort group, and therefore, within the same section break. Theselected value, North America, flashes and moves to the top of the browser window. Fromthere, you can scroll to see the related data, as shown in the image below.
Note that if you select information already in your field of view, the value will be highlighted ingray and will flash, to draw your attention to it.
11. Navigating Within an HTML Report
Creating Reports With TIBCO® WebFOCUS Language 989

Next, scroll up and choose ASIA from the first TOC list. This selection changes your highest-level sort group, and affects all of the lists below it. ASIA flashes and moves to the top of thewindow, where you see information for the first country (Hong Kong) in the Far East region. Thepage number is now 2 since this is the second of the high-level sort groups in the TOC.
Continue to experiment with other selections.
Reference: Navigating Between Reports
Along with techniques and tools for navigating within a report, WebFOCUS provides severalmechanisms for navigating between reports. With these features, a user initiates navigationfrom a report display. You can:
Drill down to other reports, URLs, and JavaScript functions. See Linking a Report to OtherResources on page 821.
Define frames and populate them with reports. See Specifying a Target Frame on page 875.
Adding the HTML Table of Contents Tree Control to Reports
990

Reference: HTML Table of Contents Limits
The TOC feature:
Applies to HTML output.
Is supported with Internet Explorer. This feature may generate unexpected behavior whenusing other browsers. See the Web Browser Support Statement for WebFOCUS (https://techsupport.informationbuilders.com/tech/wbf/wbf_tmo_027.html) for information onsupported browsers for this and other WebFOCUS features.
Does not support the Dialogue Manager command -HTMLFORM.
Is not supported with Accordion reports.
You cannot designate a TOC for a BY field without also specifying a TOC for its parent (BY)fields. The reason for this is that the TOC controls are interdependent and require thephysical presence of each parent control to operate correctly. For example, if the requestcontains BY COUNTRY BY CAR BY MODEL, a report cannot include a TOC control for CARwithout also including one for COUNTRY.
The size of a TOC-enabled report is limited to the memory available on the WebFOCUSClient.
If your request has both BYTOC Table of Contents and a Heading Table of Contents in theStyleSheet, the output will have the Heading TOC.
If you have installed ReportCaster, you can distribute a report with an HTML TOC by includingthe following commands in the report request:
The SET BASEURL command set to the URL to connect to the application server on whichWebFOCUS Client is installed. For information, see Specifying a Base URL on page 874.
Controlling the Display of Sorted Data With Accordion Reports
Accordion Reports provide a way to control the amount of sorted data that appears on anHTML report page. You can produce reports with expandable views for each vertical sort field ina request with multiple BY fields.
11. Navigating Within an HTML Report
Creating Reports With TIBCO® WebFOCUS Language 991

You can create two types of Accordion Reports:
Accordion By Row. Accordion By Row reports present sort field values and theircorresponding aggregated measures rolled up so that the highest level sort field and thegrand totals are at the top of the report. A tree control can be used to open each dimensionand view the associated aggregated values. Clicking the plus sign (+) next to a sort fieldvalue opens new rows that display the next lower-level sort field values and subtotals. Thelowest-level sort field, when expanded, displays the aggregated data values. This type ofAccordion Report is generated using the SET EXPANDBYROW command.
Using the Accordion By Row enhanced interface, navigation is easier when working withwide and large reports in a portal page, the data automatically resizes to fit the size of thecontainer, and the column widths automatically adjust based on the largest data value orcolumn title, whichever is larger. The SET EXPANDBYROWTREE=ON command in aprocedure enables the enhanced Accordion by Row feature. For more information on theenhanced interface, see How to Create an Accordion Report With the Enhanced Interface onpage 1001.
Note: EXPANDBYROW is functionally stabilized. Any future enhancements will be done forEXPANDBYROWTREE.
Accordion By Column. Accordion By Column reports present rolled up sort field and datavalues. However, they do not automatically display entire report rows. A plus sign appearsto the left of each data value in the column under the highest-level sort heading. For dataassociated with lower-level sort fields, a plus sign is placed to the left of each data value,but the data does not appear unless manually expanded. Data values of the lowest-levelsort field are not expandable. To expand your view of data for any expandable sort field,click a plus sign and all data associated with the next lower-level sort field appears. Whenyou expand a data value under the next to lowest sort heading, all of the remainingassociated data values in the report appear. This type of Accordion Report is generatedusing the SET EXPANDABLE command.
The use of horizontal sort fields coded with ACROSS phrases is supported with AccordionReports. The ACROSS sort headings that appear above vertical sort headings in a standardHTML report do not display in an Accordion Report until at least one sorted data value hasbeen manually expanded in each expandable sort column.
Two vertical sort fields coded with BY phrases are required when using Accordion Reports. Ifthe command syntax does not contain at least two BY phrases, the Accordion ReportsEXPANDABLE, EXPANDBYROW, or EXPANDBYROWTREE command is ignored, no message isgenerated, and a standard HTML report is created.
Note: Accordion Reports are only supported for HTML report output.
Controlling the Display of Sorted Data With Accordion Reports
992

Requirements for Accordion Reports
The following requirements must be taken into consideration when creating Accordion Reports:
Adding a drill-down link to an Accordion Report requires that the TARGET parameter must beset to a value that specifies a new HTML frame.
Once an Accordion Report is created and delivered to the user, there are no subsequentcalls to the WebFOCUS Reporting Server required when the user is interacting with thereport. However, the collapsible folder controls on the sort fields require JavaScript andimages that reside on the WebFOCUS Client. The user must be connected to theWebFOCUS Web tier components in order to use this feature. For online, connected usersof WebFOCUS, no change is required to the report.
However, for distribution of reports using ReportCaster, see the following Reference topic toensure that the report is delivered correctly as an email attachment or as an archivedreport in the Report Library.
Reference: Usage Notes for HTMLARCHIVE With Accordion Reports
WebFOCUS interactive reporting features must have a connection to the WebFOCUS client inorder to access the components required to operate successfully.
HTMLARCHVE can be used to create self-contained HTML pages with user-defined imageswhen client access is not available.
To generate HTML pages containing user-defined images that can operate interactively, useone of the following commands:
SET HTMLEMBEDIMG=ONSET HTMLARCHIVE=ON
Define BASEURL to point directly to the host machine where these files can be accessed usingthe following syntax:
SET BASEURL=http://{hostname:portnumber}
For more information on SET BASEURL, see Specifying a Base URL on page 874.
Reference: Distributing Accordion Reports With ReportCaster
Distributing Accordion Reports with ReportCaster requires the use of JavaScript componentsand images located on the WebFOCUS Client. To access the JavaScript components andimages from a report distributed by ReportCaster, the scheduled procedure must contain theSET FOCHTMLURL command, which must be set to an absolute URL instead of the defaultvalue. For example,
11. Navigating Within an HTML Report
Creating Reports With TIBCO® WebFOCUS Language 993
SET FOCHTMLURL = http://hostname[:port]/ibi_apps/ibi_html
where:
hostname[:port]
Is the host name and optional port number (specified only if you are not using the defaultport number) where the WebFOCUS Web application is deployed.
ibi_apps/ibi_html
ibi_apps is the site-customized web server alias pointing to the WEBFOCUS81/ibi_appsdirectory (where ibi_apps is the default value). ibi_html is a directory within the path to theJavaScript files that are required to be accessible when viewing an Accordion report.
For more information about coding reports for use with ReportCaster, see the Tips andTechniques for Coding a ReportCaster Report appendix in the TIBCO WebFOCUS® ReportCastermanual.
Creating an Accordion By Row Report
Accordion By Row reports are HTML reports that offer an interactive interface to dataaggregated at multiple levels by presenting the sort fields within an expandable tree. Bydefault, the report will present the highest dimension or sort field (BY value) and theaggregated measures associated with each value. The tree control can be used to open orclose each dimension and view the associated aggregated values. Clicking the plus sign (+)next to a sort field value opens new rows that display the next lower level sort field values andsubtotals. The lowest level sort field, when expanded, displays the aggregated data values.
Using the SET EXPANDBYROW or SET EXPANDBYROWTREE command with HTMLCSS ONenables any HTML report to be turned into an Accordion By Row request. EXPANDBYROW andEXPANDBYROWTREE automatically invoke the SET SUBTOTALS=ABOVE command, whichmoves the subtotal rows above the subheading and data rows. A SUB-TOTAL command isautomatically added for the next-to-last BY field.
When an Accordion By Row report uses the PRINT command, the innermost level of theresulting tree contains detail records from the data source. There can be many detail recordsfor each combination of BY fields, so it may be unclear what distinguishes the various detailrecords within the display. In order to make the report more useful, include at least one field inthe report that can be used to distinguish between the detail level rows.
When an Accordion By Row report uses the SUM command, each row, even at the innermostlevel of the tree, is actually a subtotal row and is completely described by the combination ofBY fields in the request. Each level will be presented at the aggregated level, and the datavalues will represent the aggregation of the lowest level BY.
Controlling the Display of Sorted Data With Accordion Reports
994

Styling an Accordion By Row report can be done using standard HTML report techniques, but itis important to keep the report structure in mind. All rows, except the lowest level, are actuallySUBTOTAL rows and the lowest level contains the report DATA.
Accordion By Row reports display the grand total row as an anchor row below the data. Thisanchor row displays above both the report and page footings aligned to the left margin of thereport. To generate Accordion By Row reports without the grand total anchor row, add ONTABLE NOTOTAL to the request.
Using the Accordion By Row enhanced interface, navigation is easier when working with wideand large reports in a portal page, the data automatically resizes to fit the size of thecontainer, and the column widths automatically adjust based on the largest data value orcolumn title, whichever is larger. The SET EXPANDBYROWTREE=ON command in a procedureenables the enhanced Accordion by Row feature. The SET AUTOFIT ON command in aprocedure automatically resizes the data to fit the size of the container. For more informationon the enhanced interface, see How to Create an Accordion Report With the Enhanced Interfaceon page 1001.
Accordion reports can also be created to be opened by column, instead of by row. See How toCreate an Accordion Report With the Enhanced Interface on page 1001 for information on howto create Accordion reports using the SET EXPANDABLE command.
Syntax: How to Create Accordion Reports That Expand By Row
SET EXPANDBYROW = {OFF|ON|n}
ON TABLE SET EXPANDBYROW {OFF|ON|n}
where:
OFF
Does not create an Accordion report. OFF is the default value.
ON
Creates an Accordion report, which initially displays only the highest sort field level. To seerows on lower levels, click the plus sign (+) next to one of the displayed sort field values.
ALL
Creates an Accordion report in which all sort field levels are initially expanded. To roll up asort field level, click the minus sign (-) next to one of the sort field values on that level.
11. Navigating Within an HTML Report
Creating Reports With TIBCO® WebFOCUS Language 995

n
Creates an Accordion report in which n sort field levels are initially expanded. To roll up anexpanded sort field level, click the minus sign (-) next to one of the sort field values on thatlevel.
Note:
Accordion By Row reports require that the HTMLCSS parameter be set to ON.
By default, a blank line is generated before a subtotal on the report output. You caneliminate these automatic blank lines by issuing the SET DROPBLNKLINE=ONcommand.
Example: Creating an Accordion By Row SUM Report
The following request against the GGSALES data source has four sort fields, REGION, ST,CATEGORY, and PRODUCT:
TABLE FILE GGSALESSUM DOLLARS/D8MC UNITS/D8CBUDDOLLARS/D8MC BUDUNITS/D8CBY REGIONBY ST BY CATEGORY BY PRODUCTON TABLE SET HTMLCSS ONON TABLE SET EXPANDBYROW ONON TABLE SET DROPBLNKLINE ONON TABLE PCHOLD FORMAT HTMLON TABLE SET STYLE *TYPE=REPORT, COLOR=RGB(66 70 73), FONT='TREBUCHET MS', SIZE=9, SQUEEZE=ON, GRID=OFF,$TYPE=REPORT, GRID=OFF, FONT='TREBUCHET MS', COLOR=RGB(52 85 64), $
Controlling the Display of Sorted Data With Accordion Reports
996

TYPE=TITLE, COLOR='WHITE', BACKCOLOR=RGB(52 85 64), STYLE=-UNDERLINE,$TYPE=HEADING, COLOR='WHITE', BACKCOLOR=RGB(52 85 64),$TYPE=FOOTING, COLOR='WHITE', BACKCOLOR=RGB(52 85 64),$TYPE=SUBTOTAL, BACKCOLOR=RGB(72 118 91),$TYPE=SUBTOTAL, BY=1, COLOR='WHITE',$TYPE=SUBTOTAL, BY=2, COLOR='WHITE', BACKCOLOR=RGB(132 159 126),$TYPE=SUBTOTAL, BY=3, COLOR='WHITE', BACKCOLOR=RGB(158 184 153),$TYPE=GRANDTOTAL, COLOR='WHITE', BACKCOLOR=RGB(52 85 64), STYLE=BOLD,$ENDSTYLEEND
The initial output shows only the top level BY field (REGION), as shown in the following image.
11. Navigating Within an HTML Report
Creating Reports With TIBCO® WebFOCUS Language 997

Clicking the plus sign (+) next to the Midwest region opens the rows that show the statesassociated with that region, as shown in the following image.
Clicking the plus sign (+) next to the state IL opens the rows that show the categoriesassociated with that state, as shown in the following image.
Controlling the Display of Sorted Data With Accordion Reports
998
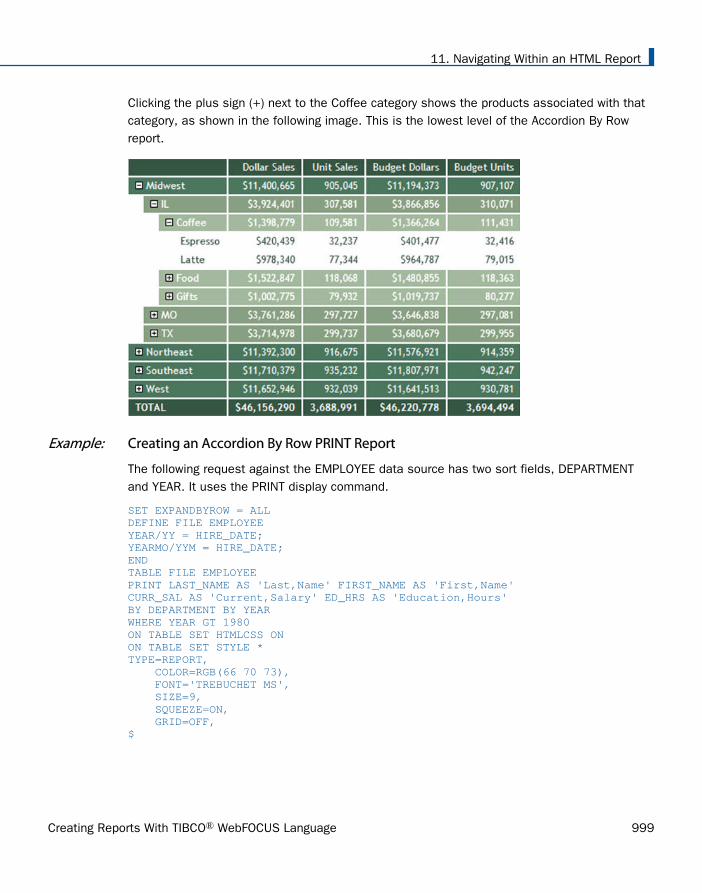
Clicking the plus sign (+) next to the Coffee category shows the products associated with thatcategory, as shown in the following image. This is the lowest level of the Accordion By Rowreport.
Example: Creating an Accordion By Row PRINT Report
The following request against the EMPLOYEE data source has two sort fields, DEPARTMENTand YEAR. It uses the PRINT display command.
SET EXPANDBYROW = ALLDEFINE FILE EMPLOYEEYEAR/YY = HIRE_DATE;YEARMO/YYM = HIRE_DATE;ENDTABLE FILE EMPLOYEEPRINT LAST_NAME AS 'Last,Name' FIRST_NAME AS 'First,Name'CURR_SAL AS 'Current,Salary' ED_HRS AS 'Education,Hours'BY DEPARTMENT BY YEARWHERE YEAR GT 1980ON TABLE SET HTMLCSS ONON TABLE SET STYLE *TYPE=REPORT, COLOR=RGB(66 70 73), FONT='TREBUCHET MS', SIZE=9, SQUEEZE=ON, GRID=OFF,$
11. Navigating Within an HTML Report
Creating Reports With TIBCO® WebFOCUS Language 999

TYPE=TITLE, BACKCOLOR=RGB(102 102 102), COLOR=RGB(255 255 255), STYLE=-UNDERLINE+BOLD,$TYPE=DATA, BACKCOLOR=RGB(255 255 255),$TYPE=TITLE, COLOR='WHITE', BACKCOLOR=RGB(52 85 64), STYLE=-UNDERLINE,$TYPE=HEADING, COLOR='WHITE', BACKCOLOR=RGB(52 85 64),$TYPE=FOOTING, COLOR='WHITE', BACKCOLOR=RGB(52 85 64),$TYPE=SUBTOTAL, BACKCOLOR=RGB(72 118 91),$TYPE=SUBTOTAL, BY=1, COLOR='WHITE',$TYPE=SUBTOTAL, BY=2, COLOR='WHITE', BACKCOLOR=RGB(132 159 126),$TYPE=SUBTOTAL, BY=3, COLOR='WHITE', BACKCOLOR=RGB(158 184 153),$TYPE=GRANDTOTAL, COLOR='WHITE', BACKCOLOR=RGB(52 85 64), STYLE=BOLD,$ENDSTYLEEND
Including the fields LAST_NAME and FIRST_NAME in the report output distinguishes each detailline. However, those fields do not apply to the summary lines, so they are blank on thesummary lines.
Controlling the Display of Sorted Data With Accordion Reports
1000

The output is:
Syntax: How to Create an Accordion Report With the Enhanced Interface
SET EXPANDBYROWTREE = {OFF|ON|ALL|n}ON TABLE SET EXPANDBYROWTREE {OFF|ON|ALL|n}
11. Navigating Within an HTML Report
Creating Reports With TIBCO® WebFOCUS Language 1001

where:
OFF
Does not create an Accordion report, with the enhanced interface. OFF is the default value.
ON
Creates an Accordion report, with the enhanced interface. This setting initially displays onlythe highest sort field level. To see rows on lower levels, click the plus sign (+) next to oneof the displayed sort field values.
ALL
Creates an Accordion report, with the enhanced interface. This setting displays all sortfield levels initially expanded. To roll up a sort field level, click the minus sign (-) row nextto one of the sort field values on that level.
n
Creates an Accordion report, with the enhanced interface. This setting displays the n sortfield levels initially expanded. To roll up an expanded sort field level, click the minus sign(-) next to one of the sort field values on that level.
Example: Creating an Accordion Report With the Enhanced Interface
The following request against the GGSALES data source has four sort fields, REGION, ST,CATEGORY, and PRODUCT. The request uses the default StyleSheet and the default plus sign(+) and minus sign (-) to expand or collapse a row. In order to create the Accordion report, withthe enhanced interface, the SET EXPANDBYROWTREE command must be set to ON. In order toautomatically resize the data to fit the size of the container, the SET AUTOFIT command mustbe set to ON.
TABLE FILE GGSALESSUM DOLLARS/D8MCUNITS/D8CBUDDOLLARS/D8MC BUDUNITS/D8CBY REGIONBY STBY CATEGORYBY PRODUCTON TABLE SET EXPANDBYROWTREE ONON TABLE SET DROPBLNKLINE ONON TABLE SET AUTOFIT ONON TABLE PCHOLD FORMAT HTMLON TABLE SET STYLE *INCLUDE=IBFS:/FILE/IBI_HTML_DIR/ibi_themes/Warm.sty,$ENDSTYLEEND
Controlling the Display of Sorted Data With Accordion Reports
1002
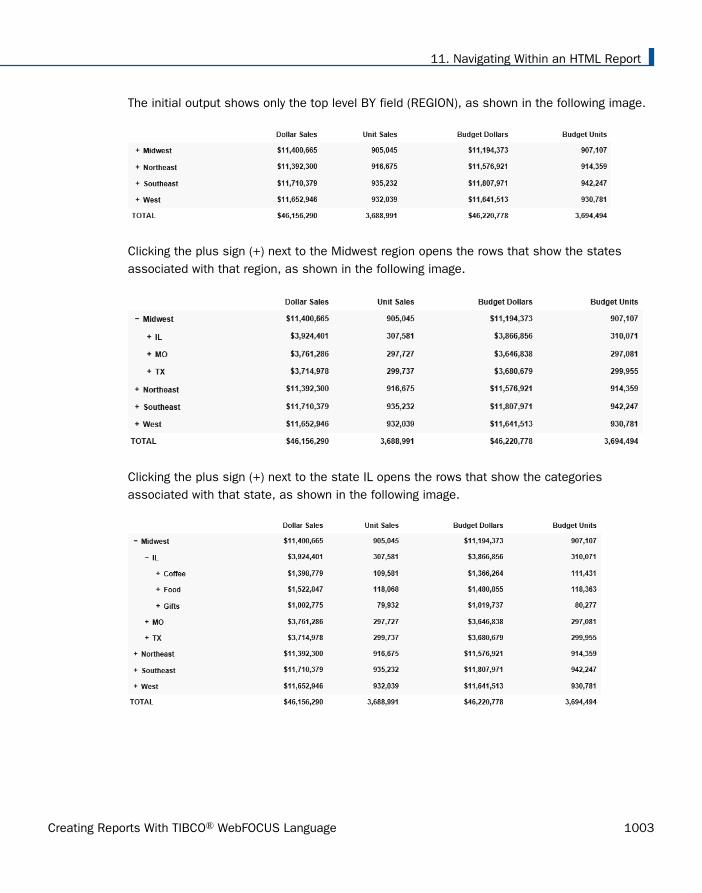
The initial output shows only the top level BY field (REGION), as shown in the following image.
Clicking the plus sign (+) next to the Midwest region opens the rows that show the statesassociated with that region, as shown in the following image.
Clicking the plus sign (+) next to the state IL opens the rows that show the categoriesassociated with that state, as shown in the following image.
11. Navigating Within an HTML Report
Creating Reports With TIBCO® WebFOCUS Language 1003

Clicking the plus sign (+) next to the Coffee category shows the products associated with thatcategory, as shown in the following image. This is the lowest level of the Accordion By Rowreport.
You can use the EBRT_ANCHOR StyleSheet attribute to change the default plus sign (+) andminus sign (-) to an arrow. Valid settings for the EBRT_ANCHOR attribute are PLUSMINUS andARROWS. The following request changes the default plus sign (+) and minus sign (-) to anarrow, and applies StyleSheet formatting to the request to change the color of the text to whiteand the background color to different shades of purple.
Note: The color of the arrows match the color of the SUBTOTAL line, in this case, white.
Controlling the Display of Sorted Data With Accordion Reports
1004

TABLE FILE GGSALESSUM DOLLARS/D8MCUNITS/D8CBUDDOLLARS/D8MC BUDUNITS/D8CBY REGIONBY STBY CATEGORYBY PRODUCTON TABLE SET EXPANDBYROWTREE ONON TABLE SET DROPBLNKLINE ONON TABLE SET AUTOFIT ONON TABLE PCHOLD FORMAT HTMLON TABLE SET STYLE *TYPE=REPORT, EBRT_ANCHOR=ARROWS,COLOR=RGB(66 70 73), FONT='TREBUCHET MS', SIZE=9, SQUEEZE=ON,$TYPE=REPORT, FONT='TREBUCHET MS', COLOR=RGB(151 43 153),$TYPE=TITLE, COLOR='WHITE', BACKCOLOR=RGB(151 43 153), STYLE=-UNDERLINE,$TYPE=HEADING, COLOR='WHITE', BACKCOLOR=RGB(151 43 153),$TYPE=FOOTING, COLOR='WHITE', BACKCOLOR=RGB(151 43 153),$TYPE=SUBTOTAL, COLOR=WHITE, BACKCOLOR=RGB(179 72 180),$TYPE=SUBTOTAL, BY=2, BACKCOLOR=RGB(208 99 208),$TYPE=SUBTOTAL, BY=3, BACKCOLOR=RGB(237 127 236),$TYPE=GRANDTOTAL, COLOR='WHITE', BACKCOLOR=RGB(151 43 153), STYLE=BOLD,$ENDSTYLEEND
The initial output shows only the top level BY field (REGION), as shown in the following image.
Clicking the arrow next to the Midwest region opens the rows that show the states associatedwith that region, as shown in the following image.
11. Navigating Within an HTML Report
Creating Reports With TIBCO® WebFOCUS Language 1005

Clicking the right arrow next to the state IL opens the rows that show the categoriesassociated with that state, as shown in the following image.
Clicking the right arrow next to the Coffee category shows the products associated with thatcategory, as shown in the following image. This is the lowest level of the Accordion By Rowreport.
You can use the CONTROLCOLOR StyleSheet attribute on the SUBTOTAL line to specify thecolor of the arrows. The following syntax shows how to change the color of the arrows topurple.
Controlling the Display of Sorted Data With Accordion Reports
1006

TABLE FILE GGSALESSUM DOLLARS/D8MCUNITS/D8CBUDDOLLARS/D8MC BUDUNITS/D8CBY REGIONBY STBY CATEGORYBY PRODUCTON TABLE SET EXPANDBYROWTREE ONON TABLE SET DROPBLNKLINE ONON TABLE SET AUTOFIT ONON TABLE PCHOLD FORMAT HTMLON TABLE SET STYLE *TYPE=REPORT, EBRT_ANCHOR=ARROWS,COLOR=RGB(66 70 73), FONT='TREBUCHET MS', SIZE=9, SQUEEZE=ON,$TYPE=REPORT, FONT='TREBUCHET MS', COLOR=RGB(151 43 153),$TYPE=TITLE, COLOR='WHITE', BACKCOLOR=RGB(151 43 153), STYLE=-UNDERLINE,$TYPE=HEADING, COLOR='WHITE', BACKCOLOR=RGB(151 43 153),$TYPE=FOOTING, COLOR='WHITE', BACKCOLOR=RGB(151 43 153),$TYPE=SUBTOTAL, COLOR=WHITE, BACKCOLOR=RGB(179 72 180), CONTROLCOLOR=PURPLE,$TYPE=SUBTOTAL, BY=2, BACKCOLOR=RGB(208 99 208),$TYPE=SUBTOTAL, BY=3, BACKCOLOR=RGB(237 127 236),$TYPE=GRANDTOTAL, COLOR='WHITE', BACKCOLOR=RGB(151 43 153), STYLE=BOLD,$ENDSTYLEEND
The following output shows the lowest level of the Accordion By Row report, with purple arrows.
Reference: Usage Notes for EXPANDBYROW and EXPANDBYROWTREE
As of Release 8.2 Version 04, grids are supported with EXPANDBYROWTREE.
The maximum length of a BY field value is 245 bytes.
11. Navigating Within an HTML Report
Creating Reports With TIBCO® WebFOCUS Language 1007

EXPANDBYROWTREE is not supported with OLAP. When both OLAP andEXPANDBYROWTREE are enabled, EXPANDBYROWTREE will be ignored. As a workaround,use EXPANDBYROW.
EXPANDBYROWTREE is not supported with the AHTML output format. When usingEXPANDBYROWTREE with an active report, EXPANDBYROWTREE will be ignored.
When running an accordion summary report against a SQL Server Analysis Services (SSAS)cube data source, the PRINT command is used internally to retrieve the data, so that thereport output displayed will be that of a detailed report, instead of a summary report. Thisis because the SSAS cube data source contains pre-aggregated data, and therefore SUMcommands are internally changed to PRINT commands.
Accordion By Row Tooltips
By default, EXPANDBYROW and EXPANDBYROWTREE reports display field information intooltips activated when you hover the mouse over the values at each level of the tree. Sincethe column titles are not displayed above the tree control columns, as they would be in astandard HTML report, the field list for the tree is presented in the tooltip in the top-left cornerof the report.
Pop-up field descriptions can also be enabled in Accordion By Row reports to present the fielddescriptions maintained within the Master File or DEFINE associated with the fields.
Titles can be customized by defining an AS name. To remove pop-up field descriptions from theexpanding tree, define a blank AS name for the column title. In an Accordion By Row report,pop-up text boxes that display on mouse over present additional information about the fieldsand columns within the report. In standard Accordion reports, these pop-up text boxes displaythe column title or AS name for all of the BY values in the expandable tree.
As with standard HTML reports, the POPUPDESC parameter can be set ON to display fielddescriptions in these pop-up text boxes for all verb columns. Additionally, turning POPUPDESCON will cause the BY field pop-up text to present the description value, if available.
The table below represents the order of precedence for descriptions displayed in tooltips whenthe EXPANDBYROW or EXPANDBYROWTREE setting is on.
Existing Field Information Pop-Up Description Off Pop-Up Description On
Description 1
AS Name 1 2
Controlling the Display of Sorted Data With Accordion Reports
1008
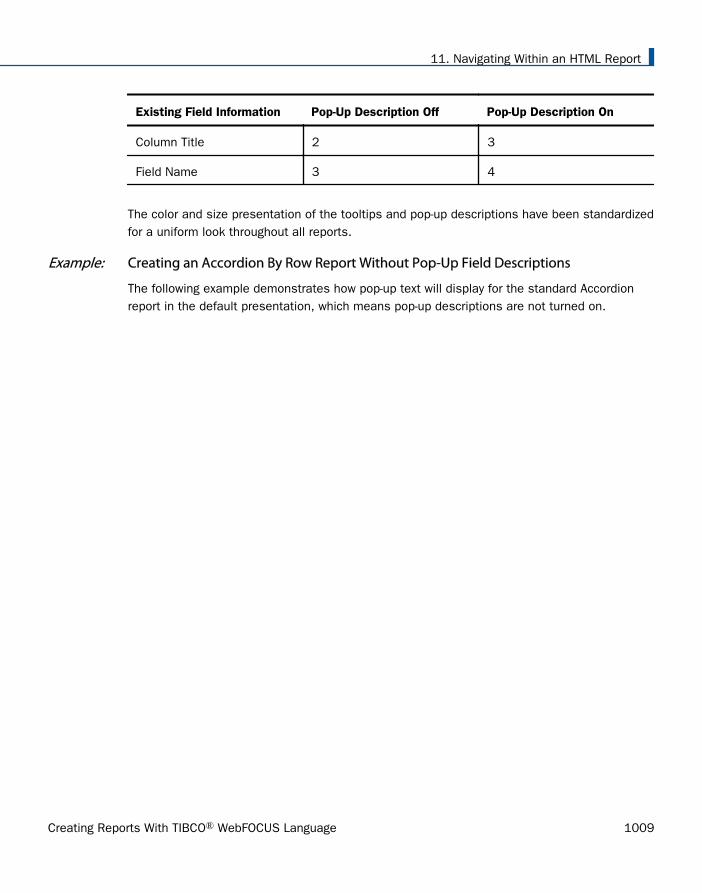
Existing Field Information Pop-Up Description Off Pop-Up Description On
Column Title 2 3
Field Name 3 4
The color and size presentation of the tooltips and pop-up descriptions have been standardizedfor a uniform look throughout all reports.
Example: Creating an Accordion By Row Report Without Pop-Up Field Descriptions
The following example demonstrates how pop-up text will display for the standard Accordionreport in the default presentation, which means pop-up descriptions are not turned on.
11. Navigating Within an HTML Report
Creating Reports With TIBCO® WebFOCUS Language 1009

DEFINE FILE GGSALES.UNITS/D12C DESCRIPTION ''=UNITS;TOTSALES/D12CM DESCRIPTION 'DOLLARS*UNITS'=DOLLARS*UNITS;ENDTABLE FILE GGSALESSUM DOLLARS UNITS AS 'Units'TOTSALES AS 'Total Sales'BY REGION BY CATEGORY AS ''BY PRODUCT AS 'Product AS Name'ON TABLE SET EXPANDBYROW ALLON TABLE SET DROPBLNKLINE ALLON TABLE SET STYLE *TYPE=REPORT, COLOR=RGB(66 70 73), FONT='TREBUCHET MS', SIZE=9, SQUEEZE=ON, GRID=OFF,$TYPE=TITLE, BACKCOLOR=RGB(102 102 102), COLOR=RGB(255 255 255), STYLE=-UNDERLINE+BOLD,$TYPE=DATA, BACKCOLOR=RGB(255 255 255),$TYPE=SUBTOTAL, BACKCOLOR=RGB(200 200 200), STYLE=BOLD, $TYPE=GRANDTOTAL, BACKCOLOR=RGB(66 70 73), COLOR=RGB(255 255 255), STYLE=BOLD,$ENDSTYLEEND
Fields as defined in the Master File:
FIELD=CATEGORY, ALIAS=E02, FORMAT=A11, INDEX=I, TITLE='Category', DESC='Product category',$FIELD=PRODUCT, ALIAS=E04, FORMAT=A16, TITLE='Product', DESC='Product name',$ FIELD=REGION, ALIAS=E05, FORMAT=A11, INDEX=I, TITLE='Region', DESC='Region code',$FIELD=UNITS, ALIAS=E10, FORMAT=I08, TITLE='Unit Sales', DESC='Number of units sold',$
Controlling the Display of Sorted Data With Accordion Reports
1010

The following image shows the pop-up description for the tree control, located at the top-leftcorner of the table, displaying the list of column titles or AS name for the given BY columnwithin the underlying tree control.
The following image shows the pop-up text that will display when the mouse hovers over any ofthe top level BY values that do not have an AS name, but do have a defined description andtitle. In this case, the column titles will display.
The pop-up text for a top level BY value that has an AS name and a defined description willdisplay the AS name.
Example: Creating an Accordion By Row Report With Pop-Up Field Descriptions
The following example demonstrates how pop-up text displays with pop-up descriptions turnedon.
11. Navigating Within an HTML Report
Creating Reports With TIBCO® WebFOCUS Language 1011

SET POPUPDESC = ONDEFINE FILE GGSALES.UNITS/D12C DESCRIPTION ''=UNITS;TOTSALES/D12CM DESCRIPTION 'DOLLARS*UNITS'=DOLLARS*UNITS;ENDTABLE FILE GGSALESSUM DOLLARS UNITS AS 'Units'TOTSALES AS 'Total Sales'BY REGION BY CATEGORY AS ''BY PRODUCT AS 'Product AS Name'ON TABLE SET EXPANDBYROW ALLON TABLE SET DROPBLNKLINE ALLON TABLE SET STYLE *INCLUDE=IBFS:/FILE/IBI_HTML_DIR/javaassist/intl/EN/ENIADefault_combine.sty,$ENDSTYLEEND
As with all HTML reports, setting POPUPDESC=ON will activate a text box that displays the fielddescriptions for each of the verb column titles.
Additionally, with POPUPDESC set ON, the field description will be presented for the BYelements within the tree. If no field description is defined, the column title or AS name willdisplay.
With POPUPDESC=ON, the defined description will display in the pop-up text, as shown in thefollowing image.
The image that shows the description for the BY value appears in the pop-up text even thoughan AS name has been given to this field.
Controlling the Display of Sorted Data With Accordion Reports
1012

For additional information on pop-up field descriptions with HTML reports, see DisplayingReport Data on page 39.
Accordion By Row With NOPRINT
Hidden, NOPRINT BY fields, can be used in Accordion by Row reports. They allow thecalculation of values for, and the sorting of data by, fields which are hidden. NOPRINT sortfields are included in the internal matrix and affect the sorting and aggregation of data in theAccordion report, even though they are not displayed in the report. These NOPRINT sort fieldsare defined using the BY sortfield NOPRINT phrase.
Note:
Hidden or NOPRINT fields are not displayed in tooltips or pop-up descriptions.
When using empty or blank AS names, if spaces are added between the quotation marks,for example, BY fieldname ' ', the spaces will be removed and the functionality will be thesame as BY fieldname ''.
Example: Creating an Accordion By Row Report With an Explicit NOPRINT
The following request against the EMPLOYEE data source shows salary data for employees,grouped in categories. The output is sorted by the virtual field NAME_SORT, whichconcatenates the LAST_NAME and FIRST_NAME fields. The NAME_SORT field is hidden usingNOPRINT on the sort phrase. To display employee names, the NAME_DISPLAY virtual field iscreated, which concatenates the FIRST_NAME field and the LAST_NAME field.
11. Navigating Within an HTML Report
Creating Reports With TIBCO® WebFOCUS Language 1013

DEFINE FILE EMPLOYEENAME_SORT/A50=EMPLOYEE.EMPINFO.LAST_NAME || ( ', ' | EMPLOYEE.EMPINFO.FIRST_NAME ); NAME_DISPLAY/A57=EMPLOYEE.EMPINFO.FIRST_NAME | EMPLOYEE.EMPINFO.LAST_NAME;NAME_CODE/A1=EDIT(LAST_NAME, '9'); NAME_GROUP/A10=IF NAME_CODE LE 'G' THEN 'A-G' ELSE IF NAME_CODE LE 'P' THEN 'H-P' ELSE 'Q-Z';ENDTABLE FILE EMPLOYEESUMEMPLOYEE.EMPINFO.CURR_SAL AS 'Current Salary'BY NAME_GROUP AS 'Alphabetical Group'BY LOWEST NAME_SORT NOPRINTBY LOWEST NAME_DISPLAY AS 'Employee Name'ON TABLE SET PAGE-NUM NOLEADON TABLE SET EXPANDBYROW 2ON TABLE PCHOLD FORMAT HTMLON TABLE SET DROPBLNKLINE ONON TABLE SET HTMLCSS ONON TABLE SET STYLE *TYPE=REPORT, COLOR=RGB(66 70 73), FONT='TREBUCHET MS', SIZE=9, SQUEEZE=ON, GRID=OFF,$
Controlling the Display of Sorted Data With Accordion Reports
1014

TYPE=TITLE, BACKCOLOR=RGB(102 102 102), COLOR=RGB(255 255 255), STYLE=-UNDERLINE+BOLD,$TYPE=DATA, BACKCOLOR=RGB(255 255 255),$TYPE=SUBTOTAL BY=1, BACKCOLOR=RGB(200 200 200), STYLE=BOLD,$TYPE=SUBTOTAL, BY=2, BACKCOLOR=RGB(200 220 220), STYLE=BOLD,$TYPE=SUBTOTAL, BY=3, BACKCOLOR=RGB(220 220 200), STYLE=BOLD,$TYPE=GRANDTOTAL, BACKCOLOR=RGB(66 70 73), COLOR=RGB(255 255 255), STYLE=BOLD,$ENDSTYLEEND
11. Navigating Within an HTML Report
Creating Reports With TIBCO® WebFOCUS Language 1015
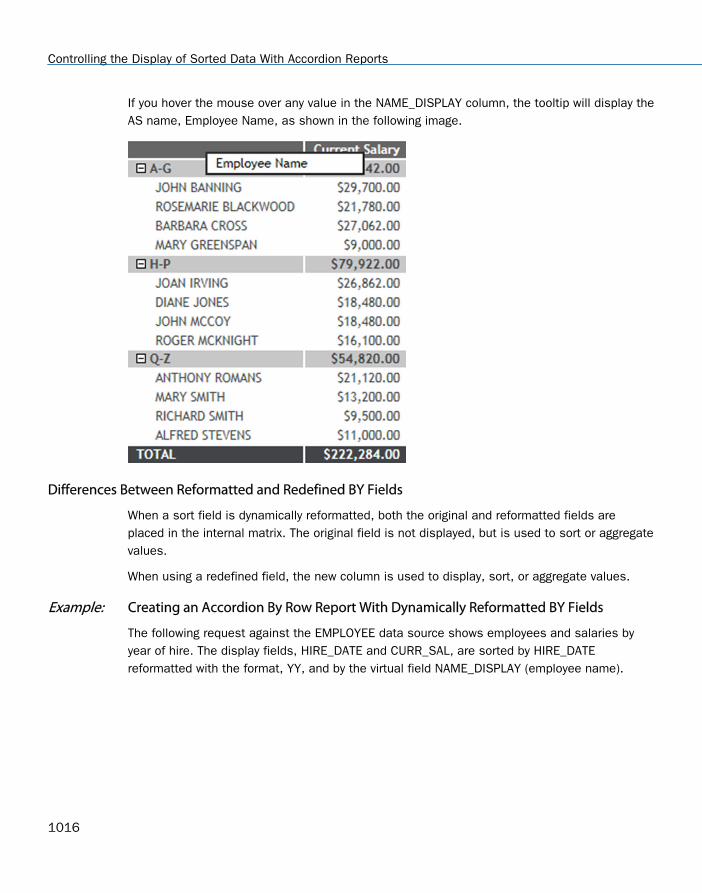
If you hover the mouse over any value in the NAME_DISPLAY column, the tooltip will display theAS name, Employee Name, as shown in the following image.
Differences Between Reformatted and Redefined BY Fields
When a sort field is dynamically reformatted, both the original and reformatted fields areplaced in the internal matrix. The original field is not displayed, but is used to sort or aggregatevalues.
When using a redefined field, the new column is used to display, sort, or aggregate values.
Example: Creating an Accordion By Row Report With Dynamically Reformatted BY Fields
The following request against the EMPLOYEE data source shows employees and salaries byyear of hire. The display fields, HIRE_DATE and CURR_SAL, are sorted by HIRE_DATEreformatted with the format, YY, and by the virtual field NAME_DISPLAY (employee name).
Controlling the Display of Sorted Data With Accordion Reports
1016
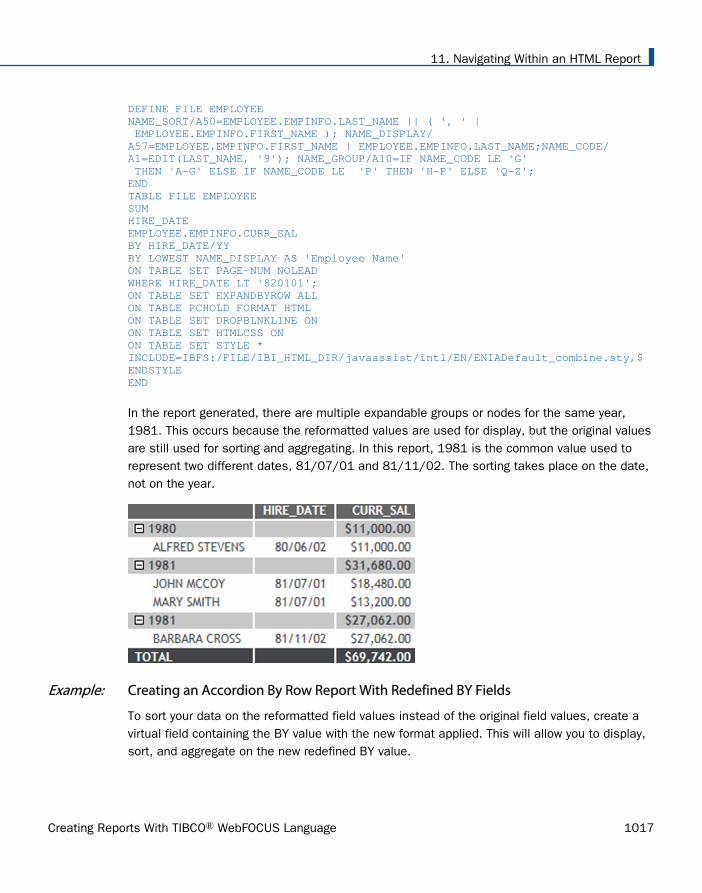
DEFINE FILE EMPLOYEENAME_SORT/A50=EMPLOYEE.EMPINFO.LAST_NAME || ( ', ' | EMPLOYEE.EMPINFO.FIRST_NAME ); NAME_DISPLAY/A57=EMPLOYEE.EMPINFO.FIRST_NAME | EMPLOYEE.EMPINFO.LAST_NAME;NAME_CODE/A1=EDIT(LAST_NAME, '9'); NAME_GROUP/A10=IF NAME_CODE LE 'G' THEN 'A-G' ELSE IF NAME_CODE LE 'P' THEN 'H-P' ELSE 'Q-Z'; END TABLE FILE EMPLOYEESUMHIRE_DATEEMPLOYEE.EMPINFO.CURR_SALBY HIRE_DATE/YYBY LOWEST NAME_DISPLAY AS 'Employee Name'ON TABLE SET PAGE-NUM NOLEADWHERE HIRE_DATE LT '820101';ON TABLE SET EXPANDBYROW ALLON TABLE PCHOLD FORMAT HTMLON TABLE SET DROPBLNKLINE ONON TABLE SET HTMLCSS ONON TABLE SET STYLE *INCLUDE=IBFS:/FILE/IBI_HTML_DIR/javaassist/intl/EN/ENIADefault_combine.sty,$ENDSTYLEEND
In the report generated, there are multiple expandable groups or nodes for the same year,1981. This occurs because the reformatted values are used for display, but the original valuesare still used for sorting and aggregating. In this report, 1981 is the common value used torepresent two different dates, 81/07/01 and 81/11/02. The sorting takes place on the date,not on the year.
Example: Creating an Accordion By Row Report With Redefined BY Fields
To sort your data on the reformatted field values instead of the original field values, create avirtual field containing the BY value with the new format applied. This will allow you to display,sort, and aggregate on the new redefined BY value.
11. Navigating Within an HTML Report
Creating Reports With TIBCO® WebFOCUS Language 1017
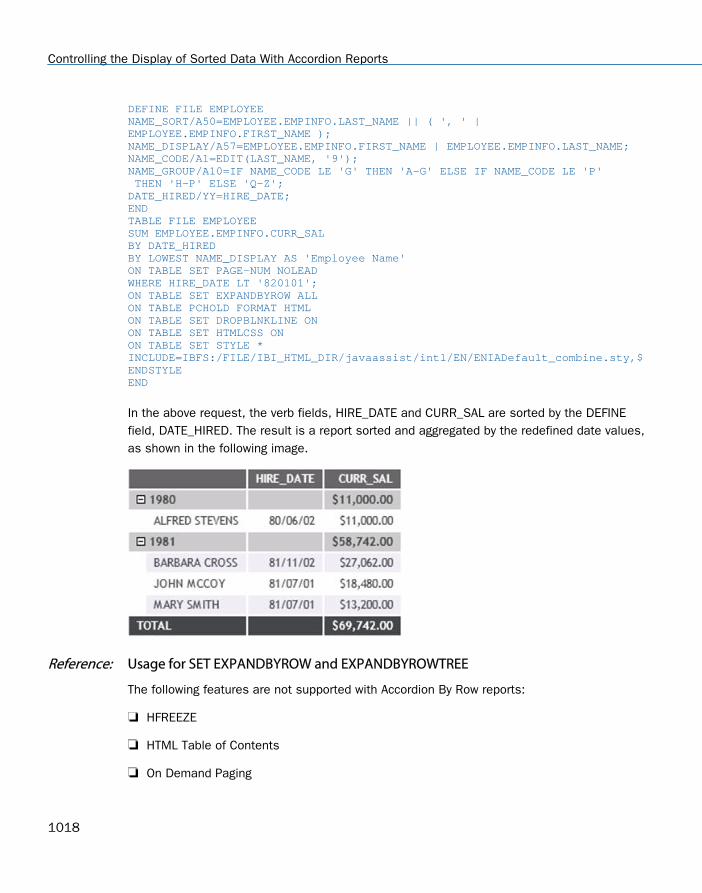
DEFINE FILE EMPLOYEENAME_SORT/A50=EMPLOYEE.EMPINFO.LAST_NAME || ( ', ' | EMPLOYEE.EMPINFO.FIRST_NAME );NAME_DISPLAY/A57=EMPLOYEE.EMPINFO.FIRST_NAME | EMPLOYEE.EMPINFO.LAST_NAME;NAME_CODE/A1=EDIT(LAST_NAME, '9');NAME_GROUP/A10=IF NAME_CODE LE 'G' THEN 'A-G' ELSE IF NAME_CODE LE 'P' THEN 'H-P' ELSE 'Q-Z';DATE_HIRED/YY=HIRE_DATE;ENDTABLE FILE EMPLOYEESUM EMPLOYEE.EMPINFO.CURR_SALBY DATE_HIREDBY LOWEST NAME_DISPLAY AS 'Employee Name'ON TABLE SET PAGE-NUM NOLEADWHERE HIRE_DATE LT '820101';ON TABLE SET EXPANDBYROW ALLON TABLE PCHOLD FORMAT HTMLON TABLE SET DROPBLNKLINE ONON TABLE SET HTMLCSS ONON TABLE SET STYLE *INCLUDE=IBFS:/FILE/IBI_HTML_DIR/javaassist/intl/EN/ENIADefault_combine.sty,$ENDSTYLEEND
In the above request, the verb fields, HIRE_DATE and CURR_SAL are sorted by the DEFINEfield, DATE_HIRED. The result is a report sorted and aggregated by the redefined date values,as shown in the following image.
Reference: Usage for SET EXPANDBYROW and EXPANDBYROWTREE
The following features are not supported with Accordion By Row reports:
HFREEZE
HTML Table of Contents
On Demand Paging
Controlling the Display of Sorted Data With Accordion Reports
1018
TABLEF
OVER
ROW-TOTAL
ON field RECAP
FOR
IN
SEQUENCE
PAGENUM
SUBHEAD
BORDER
MULTILINES
BY HIERARCHY
Compound Reports
Multiple requests in a single HTML report
In certain scenarios, a blank line is generated before a subtotal on the report output. You caneliminate these automatic blank lines by issuing the SET DROPBLNKLINE=ON command.
Creating an Accordion By Column Report
Accordion By Column reports do not automatically display entire report rows. A plus signappears to the left of each data value in the column under the highest-level sort heading. Fordata associated with lower-level sort fields, a plus sign is placed to the left of each data value,but the data does not appear unless manually expanded. Data values of the lowest-level sortfield are not expandable. To expand your view of data for any expandable sort field, click a plussign and all data associated with the next lower-level sort field appears. When you expand adata value under the next to lowest sort heading, all of the remaining associated data valuesin the report appear. This type of Accordion Report is generated using the SET EXPANDABLEcommand.
Reference: Support for Accordion By Column Reports
The following commands are not supported when using Accordion Reports:
BORDER, COLUMN, FOR, IN, OVER, PAGE-NUM, ROW-TOTAL, TOTAL
11. Navigating Within an HTML Report
Creating Reports With TIBCO® WebFOCUS Language 1019

Data Visualization, HTML BYTOC, OLAP, On Demand Paging (WebFOCUS Viewer), columnfreezing, and the ReportCaster burst feature are also not supported with Accordion Reports.
Syntax: How to Create Accordion by Column Reports
To enable Accordion By Column Reports, specify the following
ON TABLE SET EXPANDABLE = {ON|OFF}
where:
ON
Enables Accordion By Column Reports.
OFF
Disables Accordion By Column Reports. OFF is the default value.
Example: Creating an Accordion By Column Report
This example shows how to use an EXPANDABLE command to create an Accordion By ColumnReport.
TABLE FILE GGSALESSUM UNITS DOLLARSBY REGION BY ST BY CITY BY CATEGORYON TABLE SET EXPANDABLE ONEND
Controlling the Display of Sorted Data With Accordion Reports
1020

The following image shows an Accordion by Column Report which displays all data associatedwith the first-level sort field, Region, by default. The expanded data values you see are theresult of a report user clicking plus signs to the left of specific first, second- and third-level sortfields after the report is generated.
Navigating a Multi-Page Report With the WebFOCUS Viewer
Normally, a web server returns an entire HTML report to a browser, which waits for all of thereport before displaying it. On-demand paging, implemented in the WebFOCUS Viewer, returnsone page of a report to a browser instead of the entire report. The web server holds theremaining pages until the user requests them. This feature shortens the time the user waits tosee the first page and is especially useful for long reports. It also contains navigationalfeatures that enable you to move quickly among the pages of the report.
The WebFOCUS Viewer does not support the table of contents (BYTOC) option because thetable of contents option requires all of the data to be on the same HTML page, even though itthen filters and only exposes part of the page at a time. The WebFOCUS Viewer splits theoutput into many pages, only one of which is downloaded to the browser at a time. Accordionreports are also not supported with the WebFOCUS Viewer.
Note that you can use the HFREEZE StyleSheet option to display column titles on every page ofoutput returned by the WebFOCUS Viewer.
11. Navigating Within an HTML Report
Creating Reports With TIBCO® WebFOCUS Language 1021

The following is page 1 of a 31-page report displayed in the WebFOCUS Viewer.
Notice that the WebFOCUS Viewer is divided into two frames:
The Report Frame is the larger upper frame that contains one page of a report.
The Control Frame contains the controls used to navigate the report and to search for astring in the report. The navigational controls allow you to display the next or previous page,the first or last page, or a specific page.
Note: You can control whether certain buttons display using SET commands. For moreinformation, see Controlling Button Display on the WebFOCUS Viewer in the TIBCOWebFOCUS® Developing Reporting Applications manual.
Reference: Usage Notes for HTMLARCHIVE With the WebFOCUS Viewer
WebFOCUS interactive reporting features must have a connection to the WebFOCUS client inorder to access the components required to operate successfully.
HTMLARCHVE can be used to create self-contained HTML pages with user-defined imageswhen client access is not available.
Navigating a Multi-Page Report With the WebFOCUS Viewer
1022

To generate HTML pages containing user-defined images that can operate interactively, useone of the following commands:
SET HTMLEMBEDIMG=ONSET HTMLARCHIVE=ON
Define BASEURL to point directly to the host machine where these files can be accessed usingthe following syntax:
SET BASEURL=http://{hostname:portnumber}
For more information on SET BASEURL, see Specifying a Base URL on page 874.
Procedure: How to Navigate in the WebFOCUS Viewer
The WebFOCUS Viewer Control Panel offers several ways to view pages in your report:
To display the previous or the next page in sequence, click the Previous or Next arrow.
To display the first or last page of the report, click the First Page or the Last Page arrow.
To display a specific page:
1. Enter a page number in the page input box.
2. Click the Go to Page button.
To download the entire report as a single document, click the All Pages button. TheWebFOCUS Viewer displays the entire report without the Viewer Control Panel.
You can return to viewing a single page of your report by clicking the Back button on thebrowser toolbar.
To locate a text string, enter the text in the input box and click the Find button.
To limit your search by case, toggle the A=a button.
To control the direction of your search, toggle the -->/<-- button.
Using the WebFOCUS Viewer Search Option
The Viewer Control Panel contains controls that offer several ways to search your report. Usingthe Viewer search controls, you can select a string of information, such as a phrase thatoccurs in your report or a group of numbers, and search for each occurrence of that string. Youcan further customize your search by matching capitalization of words exactly (a case-sensitivesearch) or by controlling the direction of your search (either forward or backward from yourstarting point in the report).
11. Navigating Within an HTML Report
Creating Reports With TIBCO® WebFOCUS Language 1023

When using the Search option:
1. The first search starts at top of the document.
2. The second and subsequent searches start from the last successfully found search stringin the direction selected in the Viewer Control Panel. Note that the direction control is tothe right of the Search entry field used to specify a search string.
Linking Report Pages
With a StyleSheet, you can insert one or more navigational hyperlinks in a multi-page HTMLreport. This feature makes it easy for you to link consecutive report pages together withoutcreating individual hyperlinks for each page.
You can define any report component as a hyperlink.
Syntax: How to Link Report Pages
Use the following syntax in an HTML report
URL=#_destination, $
where:
destinationIs one of the following:
#_next goes to the top of the next report page.
#_previous goes to the top of the previous report page.
#_top goes to the top of the current report page.
#_start goes to the first page of the report.
#_end goes to the last page of the report.
Note: In order to use these destinations in a self service applications, the followingcommand must be issued at the beginning of the FOCEXEC:
SET BASEURL=''
Example: Linking Report Pages Through Images in a Heading
This request displays two images in the page heading of a long report. It creates a linkbetween BULLET.GIF and the next page of the report, and GOBACK.GIF and the previous pageof the report.
Linking Report Pages
1024

TABLE FILE GGORDERON TABLE SUBHEAD"COFFEE GRINDER SALES BY STORE"" "HEADING"Next page or previous page."PRINT QUANTITY AS 'Ordered Units' BY STORE_CODE BY PRODUCT NOPRINTBY ORDER_NUMBERWHERE PRODUCT EQ 'Coffee Grinder'ON STORE_CODE PAGE-BREAKON TABLE SET STYLE *TYPE=REPORT, GRID=OFF, $TYPE=TABHEADING, STYLE=BOLD,$ TYPE=HEADING, IMAGE=/IBI_APPS/IBI_HTML/GGDEMO/BULLET, URL=#_next, IMAGEALIGN=LEFT,$TYPE=HEADING, IMAGE=/IBI_APPs/IBI_HTML/GGDEMO/GOBACK, URL=#_previous, IMAGEALIGN=RIGHT,$ ENDSTYLEEND
The images display in each page heading.
11. Navigating Within an HTML Report
Creating Reports With TIBCO® WebFOCUS Language 1025

Click the image on the left of page 1 to display page 2.
Linking Report Pages
1026
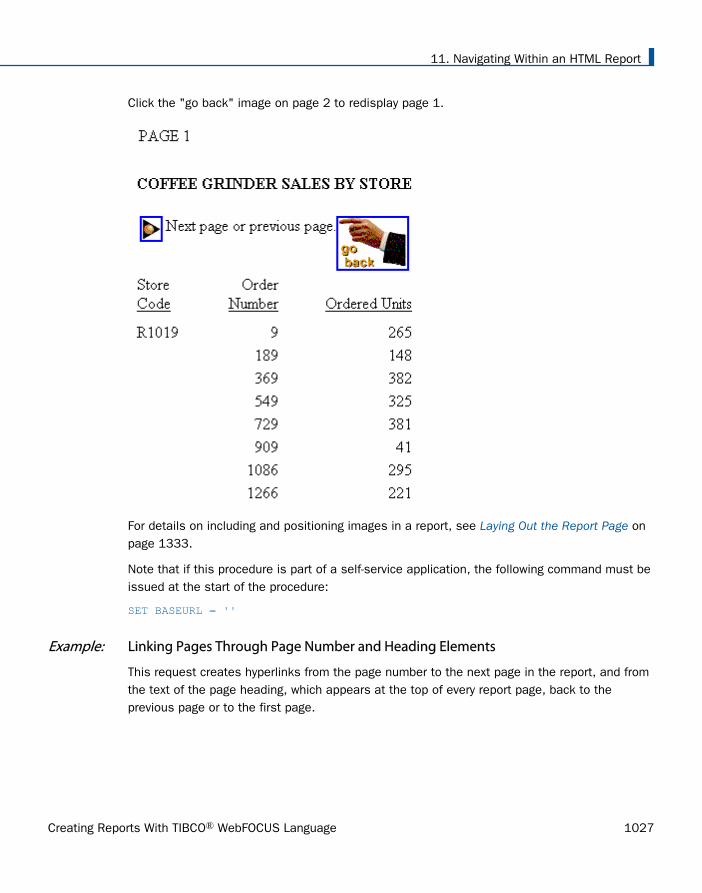
Click the "go back" image on page 2 to redisplay page 1.
For details on including and positioning images in a report, see Laying Out the Report Page onpage 1333.
Note that if this procedure is part of a self-service application, the following command must beissued at the start of the procedure:
SET BASEURL = ''
Example: Linking Pages Through Page Number and Heading Elements
This request creates hyperlinks from the page number to the next page in the report, and fromthe text of the page heading, which appears at the top of every report page, back to theprevious page or to the first page.
11. Navigating Within an HTML Report
Creating Reports With TIBCO® WebFOCUS Language 1027

TABLE FILE GGORDERON TABLE SUBHEAD"COFFEE GRINDER SALES BY STORE"" "HEADING"return to previous page""return to beginning"PRINT QUANTITY AS 'Ordered Units' BY STORE_CODE BY PRODUCT NOPRINTBY ORDER_NUMBERWHERE PRODUCT EQ 'Coffee Grinder'ON STORE_CODE PAGE-BREAKON TABLE SET STYLE *TYPE=REPORT, GRID=OFF, $TYPE=TABHEADING, STYLE=BOLD,$TYPE=PAGENUM, URL=#_next, $ TYPE=HEADING, LINE=1, URL=#_previous, $TYPE=HEADING, LINE=2, URL=#_start, $ENDSTYLEEND
The first page looks as follows:
Linking Report Pages
1028

Click the page number three times to move to PAGE 4.
Click previous page to return to PAGE 3. Click return to beginning to go directly to PAGE 1.
Note that if this procedure is part of a self-service application, the following command must beissued at the start of the procedure:
SET BASEURL = ''
11. Navigating Within an HTML Report
Creating Reports With TIBCO® WebFOCUS Language 1029

Linking Report Pages
1030

Chapter12Bursting Reports Into Multiple HTML Files
Bursting separates a single report into multiple HTML files based on the value of the firstsort field in your report.
In this chapter:
Bursting Reports Overview
Bursting Reports Overview
When bursting separates a single report into multiple HTML files, each file contains all therequested information for one specific value of the sort field. By providing direct access todifferent sections of your report, this technique enables you to:
Provide easier navigation of large reports. Bursting automatically creates an index file withdirect links to each of the resulting files.
Tailor the distribution of your report so that recipients can easily navigate to the sectionthey need.
Use standard heading and footing commands to label the index page and/or each of theresulting report files.
Syntax: How to Burst Reports Into Multiple HTML Files
ON sortfield PCSEND LOCATION dir [AS burstname] FORMAT HTML
where:
sortfield
Specifies the sort field based upon which bursting will occur. Each burst file will containreport output for only one sort group.
You can burst reports based on the value of the first sort field only. You cannot burstreports based on the value of subsequent sort fields.
You can burst a report into a maximum of 10,000 separate files. Therefore, you can bursta report only if the number of individual values of the first sort field does not exceed10,000.
Creating Reports With TIBCO® WebFOCUS Language 1031

PCSEND
Initiates bursting. You can only use one PCSEND command in a request.
dir
Specifies the location on the web server where the HTML index file and report files arestored. The LOCATION parameter is required and must specify a directory from which theweb server reads HTML files. There is no default.
On UNIX, Windows, and OpenVMS platforms, the directory value must specify a fullyqualified directory path.
Note for z/OS Web390 users: On z/OS platforms, the directory value must specify theddname of an allocated PDS. No dynamic allocation of datasets is provided. The PDS isallocated to a ddname other than the Web390 standard WWWHTM. The alternate ddnamemust be WWWxxx, where xxx are any three alphanumeric characters. The Web390 webserver requires an entry in its mime table to recognize the allocated PDS as having HTMLoutput.
If the LOCATION parameter specifies an invalid directory or specifies a directory thatcannot be written to, an error message is returned.
burstname
Specifies the name of the HTML index file, which contains a list of hyperlinks to thebursted HTML report files. The hyperlinks to the bursted HTML report files will benumbered from 0 to 9999. If no file name is specified for the HTML index file, the defaultname is HOLD.
Each bursted HTML report file will use the first four characters of the index file name,followed by numerics 0000 through 9999.
Note: The report request can contain display fields with missing values. The report request canalso contain NOPRINT fields. For details, see Handling Records With Missing Field Values onpage 1037.
Reference: Rules for Headings and Footings on Index Pages and Bursted Reports
To include a heading or footing on the HTML index page, use the commands:
ON TABLE SUBHEAD
Bursting Reports Overview
1032
and
ON TABLE SUBFOOT
These headings and footings can contain embedded fields. The heading or footing is notincluded in the HTML report output pages. Default styling is applied to the HTML indexpage.
To include a standard heading or footing on all HTML report output pages, use thecommands:
HEADING
and
FOOTING
These headings and footings can contain embedded fields. Default styling is applied to theHTML report output pages.
To include headings and footings that change each time the sortfield changes, use thecommands:
ON sortfield SUBHEAD
and
ON sortfield SUBFOOT
These subheadings or subfootings can include embedded fields, such as the sortfield usedin the PCSEND command. Default styling is applied to the HTML report output pages.
For details on including heading and footings in reports, see Using Headings, Footings, Titles,and Labels on page 1519.
12. Bursting Reports Into Multiple HTML Files
Creating Reports With TIBCO® WebFOCUS Language 1033

Example: Bursting a Report
The following report procedure creates an HTML report output file for each different REGIONvalue in the GGSALES data source. The report output files are named test0000.html,test0001.html, test0002.html, and so forth. The HTML index page is named test.html andcontains a hyperlink for each REGION data value. The directory you select depends on whereWebFOCUS is installed. In this example, the index page is stored in the directory e:\ibi\WebFOCUS82\temp.
TABLE FILE GGSALESHEADING"Regional Report"SUM UNITS AND DOLLARSBY REGION BY STCD BY CATEGORYON TABLE SET PAGE NOPAGEON TABLE SUBHEAD"Year-end Sales:""Regional Summary by Store"ON REGION PCSEND LOCATION E:\IBI\WebFOCUS82\temp AS TEST FORMAT HTMLEND
After running this request, no report output is returned, but the following message displays ifthe request was successful:
The bursted files were successfully created.
Separate HTML files are created for each value of the major sort field REGION and are storedin the location specified in the request.
The HTML index page created by the procedure follows:
Selecting the Midwest hyperlink displays the following HTML report:
Regional Report
Bursting Reports Overview
1034

Region Store ID Category Unit Sales Dollar Sales
Midwest R1019 Coffee 113253 1393610
Food 107615 1351523
Gifts 78869 969845
R1020 Coffee 109581 1398779
Food 118068 1522847
Gifts 79932 1002775
R1250 Coffee 109943 1386124
Food 115731 1463901
Gifts 72053 911261
Notice that the headings specified in the ON TABLE SUBHEAD command are displayed on theHTML index page. See Rules for Headings and Footings on Index Pages and Bursted Reports onpage 1032.
12. Bursting Reports Into Multiple HTML Files
Creating Reports With TIBCO® WebFOCUS Language 1035
Bursting Reports Overview
1036

Chapter13Handling Records With Missing FieldValues
Missing data is defined as data that is missing from a report because it is not relevant ordoes not exist in the data source. Report output that involves averaging and countingcalculations or the display of parent segment instances may be affected by missing data.Data can be missing from reports and calculations for the following reasons:
Data is not relevant to a particular row and column in a report. See Irrelevant ReportData on page 1037.
A field in a segment instance does not have a data value. See Missing Field Values onpage 1038.
A parent segment instance does not have child instances (missing segmentinstances). See Handling a Missing Segment Instance on page 1058.
Note: To run the examples in this topic, you must run the stored procedures EMPMISSand SALEMISS to add missing data to the EMPLOYEE and SALES data sources,respectively.
In this chapter:
Irrelevant Report Data
Missing Field Values
Handling a Missing Segment Instance
Setting the NODATA Character String
Irrelevant Report Data
Data can be missing from a report row or column because it is not relevant. The missing orinapplicable value is indicated by the NODATA default character, a period (.).
Tip: You may specify a more meaningful NODATA value by issuing the SET NODATA command(see Setting the NODATA Character String on page 1068).
Creating Reports With TIBCO® WebFOCUS Language 1037

Example: Irrelevant Report Data
The following request shows how the default NODATA character displays missing data in areport.
TABLE FILE EMPLOYEEPRINT CURR_SALBY LAST_NAMEBY FIRST_NAMEACROSS DEPARTMENTEND
The output is:
The salary for an employee working in the production department displays in the PRODUCTIONcolumn. The salary for an employee working in the MIS department displays in the MIS column.The corresponding value in the PRODUCTION or MIS column, respectively, is missing becausethe salary displays only under the department where the person is employed.
Missing Field Values
Missing values within segment instances occur when the instances exist, but some of thefields lack values.
When fields in instances lack values, numeric fields are assigned the value 0, andalphanumeric fields, the value blank. These default values appear in reports and are used inall calculations performed by the SUM and COUNT display commands, DEFINE commands, andprefix operators such as MAX. and AVE.
Missing Field Values
1038

To prevent the use of these default values in calculations (which might then give erroneousresults), you can add the MISSING attribute to the field declaration in the Master File, foreither a real or a virtual field. When the MISSING attribute is set to ON, the missing values aremarked with a special internal code to distinguish them from blanks or zeros, and the missingvalues are ignored in calculations. In reports, the internal code is represented by the SETNODATA value, a period (.), by default. See Setting the NODATA Character String on page1068.
For example, missing data for a field in a segment instance may occur when the data valuesare unknown, as in the following scenario. Suppose that the employees recorded in theEMPLOYEE data source are due for a pay raise by a certain date, but the amount of the raisehas not yet been determined. The company enters the date for each employee into the datasource without the salary amounts; the salaries will be entered later. Each date is an individualinstance in the salary history segment, but the new salary for each date instance is missing.Suppose further that a report request averages the SALARY field (SUM AVE.SALARY). Theaccuracy of the resulting average depends on whether the missing values for the SALARY fieldare treated as zeros (MISSING=OFF), or as internal codes (MISSING=ON).
Note: When all of the field values used in the calculation of a numeric summary value, such asa subtotal, are missing, the summary value is assigned the missing data value, not the valuezero (0). This includes summary values produced by the operators ST. and CT. used in asubfooting.
Example: Counting With Missing Values
Suppose the CURR_SAL field appears in 12 segment instances. In three of those instances,the field was given no value. Nevertheless, the display command
COUNT CURR_SAL
counts 12 occurrences of the CURR_SAL field. This occurs because the MISSING attribute isOFF by default, so the missing values are included in the count. If you wanted to exclude themissing data from the count, you could set MISSING ON.
Example: Averaging With Missing Values
Suppose you have the following records of data for a field:
.
.13
13. Handling Records With Missing Field Values
Creating Reports With TIBCO® WebFOCUS Language 1039
The numeric values in the first two records are missing (indicated by the periods). The last tworecords have values of 1 and 3. If you average these fields without the MISSING attribute(MISSING OFF), the value 0 is supplied for the two records that are missing values. Thus, theaverage of the records is (0+0+1+3)/4, or 1. If you use the MISSING ON attribute, the twomissing values are ignored, calculating the average as (1+3)/2, or 2.
MISSING Attribute in the Master File
In some applications, the default values (blanks and zeros) may represent valid data ratherthan the absence of information. However, if this is not the case, you can include the MISSINGattribute after the field format in the Master File declaration for the field with the missingvalues. The MISSING attribute can be used with an actual field in the data source, or a virtualfield that you are defining in the Master File.
For example, the following field declaration specifies the MISSING attribute for the RETURNSfield:
FIELDNAME=RETURNS, ALIAS=RTN, FORMAT=I4, MISSING=ON,$
The next declaration specifies the MISSING attribute for a virtual field called PROFIT:
DEFINE PROFIT/D7 MISSING ON NEEDS SOME DATA = RETAIL_COST - DEALER_COST;$
To ensure that missing values are handled properly for virtual fields, you can set the MISSINGattribute ON for the virtual field in the DEFINE command, and specify whether you want to applythe calculation if some or all values are missing. For related information on the SOME and ALLphrases, see How to Specify Missing Values in a DEFINE or COMPUTE Command on page1042.
When the MISSING attribute is set to ON in a field declaration, the field containing no data ismarked with a special internal code, rather than with blanks or zeros. During report generation,the SUM and COUNT commands and all prefix operators (for example, AVE., MAX., MIN.)exclude the missing data in their computations. For related information about the MISSINGattribute and field declarations, see the Describing Data With TIBCO WebFOCUS® Languagemanual.
Note:
You may add MISSING field attributes to the Master File at any time. However, MISSINGattributes only affect data entered into the data source after the attributes were added.
Key fields are needed to identify a record. Therefore, key fields should not be identified asmissing.
Missing Field Values
1040

Example: Handling Missing Values With the MISSING Attribute
This example illustrates the difference between a field with MISSING ON and one without. In ita virtual field, X_RETURNS, without the MISSING attribute, is set to equal a real field,RETURNS, with the MISSING attribute declared in the Master File. When the field with theMISSING attribute (RETURNS) is missing a value, the corresponding value of X_RETURNS is 0,since a data source field that is missing a value is evaluated as 0 (or blank) for the purpose ofcomputation (see MISSING Attribute in a DEFINE or COMPUTE Command on page 1041).
The following request defines the virtual field:
DEFINE FILE SALESX_RETURNS/I4 = RETURNS;END
Now issue the following report request:
TABLE FILE SALESSUM CNT.X_RETURNS CNT.RETURNS AVE.X_RETURNS AVE.RETURNSEND
Remember that the field X_RETURNS has the same value as RETURNS except when RETURNSis missing a value, in which case, the X_RETURNS value is 0.
The output is:
The count for the RETURNS field is lower than the count for X_RETURNS and the average forRETURNS is higher than for X_RETURNS because the missing values in RETURNS are not partof the calculations.
MISSING Attribute in a DEFINE or COMPUTE Command
You can set the MISSING attribute ON in a DEFINE or COMPUTE command to enable atemporary field with missing values to be interpreted and represented correctly in reports.
An expression used to derive the values of the temporary field can contain real fields that havemissing values. However, when used to derive the value of a temporary field, a data sourcefield that is missing a value is evaluated as 0 or blank for computational purposes, even if theMISSING attribute has been set to ON for that field in the Master File.
13. Handling Records With Missing Field Values
Creating Reports With TIBCO® WebFOCUS Language 1041

To ensure that missing values are handled properly for temporary fields, you can set theMISSING attribute ON for the virtual field in the DEFINE or COMPUTE command, and specifywhether you want to apply the calculation if some or all values are missing. See How to SpecifyMissing Values in a DEFINE or COMPUTE Command on page 1042.
Syntax: How to Specify Missing Values in a DEFINE or COMPUTE Command
field[/format] MISSING {ON|OFF} [NEEDS] {SOME|ALL} [DATA] = expression;
where:
field
Is the name of the virtual field created by the DEFINE command.
/format
Is the format of the virtual field. The default is D12.2.
MISSING
ON enables the value of the temporary field to be interpreted as missing (that is,distinguished by the special internal code from an intentionally entered zero or blank), andrepresented by the NODATA character in reports.
OFF treats missing values for numeric fields as zeros, and missing values foralphanumeric fields as blanks. This is the default value.
NEEDS
Is optional. It helps to clarify the meaning of the command.
SOME
Indicates that if at least one field in the expression has a value, the temporary field has avalue (the missing values of the field are evaluated as 0 or blank in the calculation). If allof the fields in the expression are missing values, the temporary field is missing its value.SOME is the default value.
ALL
Indicates that if all the fields in the expression have values, the temporary field has avalue. If at least one field in the expression has a missing value, the temporary field alsohas a missing value.
DATA
Is optional. It helps to clarify the meaning of the command.
Missing Field Values
1042
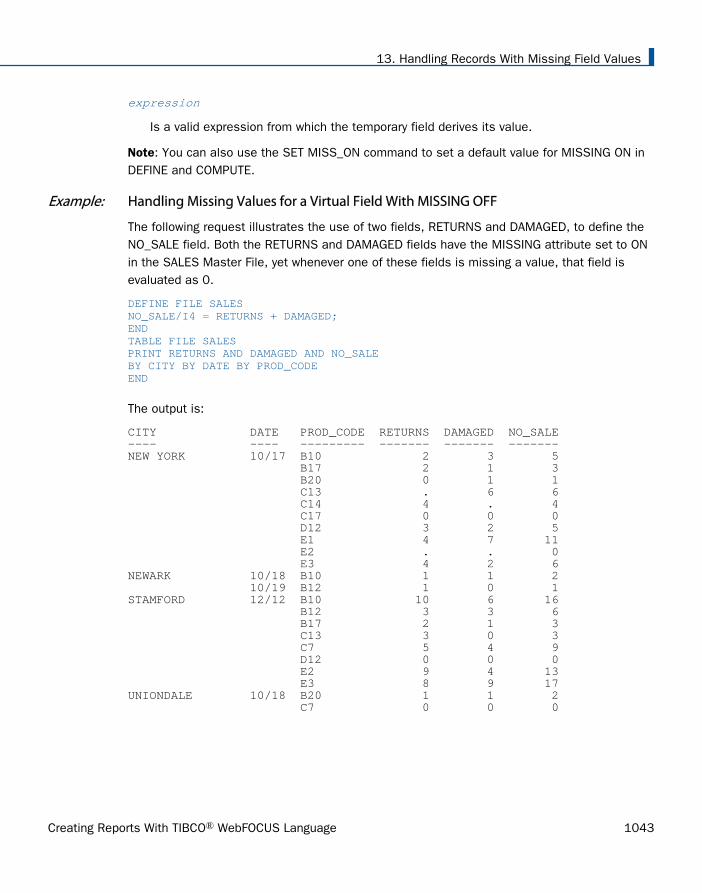
expression
Is a valid expression from which the temporary field derives its value.
Note: You can also use the SET MISS_ON command to set a default value for MISSING ON inDEFINE and COMPUTE.
Example: Handling Missing Values for a Virtual Field With MISSING OFF
The following request illustrates the use of two fields, RETURNS and DAMAGED, to define theNO_SALE field. Both the RETURNS and DAMAGED fields have the MISSING attribute set to ONin the SALES Master File, yet whenever one of these fields is missing a value, that field isevaluated as 0.
DEFINE FILE SALESNO_SALE/I4 = RETURNS + DAMAGED;ENDTABLE FILE SALESPRINT RETURNS AND DAMAGED AND NO_SALEBY CITY BY DATE BY PROD_CODEEND
The output is:
CITY DATE PROD_CODE RETURNS DAMAGED NO_SALE---- ---- --------- ------- ------- -------NEW YORK 10/17 B10 2 3 5 B17 2 1 3 B20 0 1 1 C13 . 6 6 C14 4 . 4 C17 0 0 0 D12 3 2 5 E1 4 7 11 E2 . . 0 E3 4 2 6NEWARK 10/18 B10 1 1 2 10/19 B12 1 0 1STAMFORD 12/12 B10 10 6 16 B12 3 3 6 B17 2 1 3 C13 3 0 3 C7 5 4 9 D12 0 0 0 E2 9 4 13 E3 8 9 17UNIONDALE 10/18 B20 1 1 2 C7 0 0 0
13. Handling Records With Missing Field Values
Creating Reports With TIBCO® WebFOCUS Language 1043

Notice that the products C13, C14, and E2 in the New York section all show missing values foreither RETURNS or DAMAGED, because the MISSING ON attribute has been set in the MasterFile. However, the calculation that determines the value of NO_SALE interprets these missingvalues as zeros, because MISSING ON has not been set for the virtual field.
Example: Handling Missing Values for Virtual Fields With SOME and ALL
The following request illustrates how to use the DEFINE command with the MISSING attributeto specify that if either some or all of the field values referenced in a DEFINE command aremissing, the virtual field should also be missing its value.
The SOMEDATA field contains a value if either the RETURNS or DAMAGED field contains avalue. Otherwise, SOMEDATA is missing its value. The ALLDATA field contains a value only ifboth the RETURNS and DAMAGED fields contain values. Otherwise, ALLDATA is missing itsvalue.
DEFINE FILE SALESSOMEDATA/I5 MISSING ON NEEDS SOME=RETURNS + DAMAGED;ALLDATA/I5 MISSING ON NEEDS ALL=RETURNS + DAMAGED;END
TABLE FILE SALESPRINT RETURNS AND DAMAGED SOMEDATA ALLDATABY CITY BY DATE BY PROD_CODEEND
Missing Field Values
1044

The output is:
Syntax: How to Setting MISSING ON Behavior for DEFINE and COMPUTE
When a virtual field or calculated value can have missing values, you can specify whether all orsome of the field values used in the expression that creates the DEFINE or COMPUTE fieldmust be missing to make the result field missing. If you do not specify ALL or SOME for aDEFINE or COMPUTE with MISSING ON, the default value is SOME.
The SET parameter MISS_ON enables you to specify whether SOME or ALL should be used forMISSING ON in a DEFINE or COMPUTE that does not specify which to use.
SET MISS_ON = {SOME|ALL}
where:
SOME
Indicates that if at least one field in the expression has a value, the temporary field has avalue (the missing values of the field are evaluated as 0 or blank in the calculation). If allof the fields in the expression are missing values, the temporary field has a missing value.SOME is the default value.
13. Handling Records With Missing Field Values
Creating Reports With TIBCO® WebFOCUS Language 1045
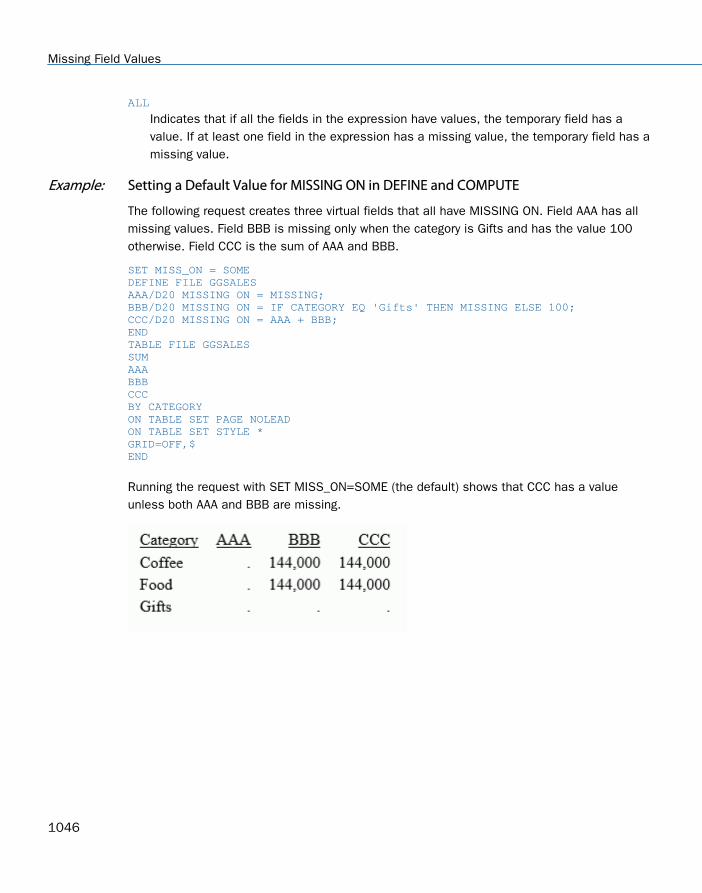
ALL
Indicates that if all the fields in the expression have values, the temporary field has avalue. If at least one field in the expression has a missing value, the temporary field has amissing value.
Example: Setting a Default Value for MISSING ON in DEFINE and COMPUTE
The following request creates three virtual fields that all have MISSING ON. Field AAA has allmissing values. Field BBB is missing only when the category is Gifts and has the value 100otherwise. Field CCC is the sum of AAA and BBB.
SET MISS_ON = SOMEDEFINE FILE GGSALESAAA/D20 MISSING ON = MISSING;BBB/D20 MISSING ON = IF CATEGORY EQ 'Gifts' THEN MISSING ELSE 100;CCC/D20 MISSING ON = AAA + BBB;ENDTABLE FILE GGSALESSUMAAABBBCCCBY CATEGORYON TABLE SET PAGE NOLEADON TABLE SET STYLE *GRID=OFF,$END
Running the request with SET MISS_ON=SOME (the default) shows that CCC has a valueunless both AAA and BBB are missing.
Missing Field Values
1046

Changing SET MISS_ON to ALL, produces the following output. CCC is assigned a missingvalue because one of the fields used to calculate it is always missing.
Testing for Missing Values in IF-THEN-ELSE Expressions
In order to optimize the efficiency of IF-THEN-ELSE expression processing, the entireexpression may not be parsed when the result (true or false) can be determined withoutparsing the entire expression. For example, consider the following IF-THEN-ELSE expression.
COMPUTE CCC/D9.1 MISSING ON = IF AAA EQ 0 OR BBB EQ 0 THEN 0 ELSE AAA / BBB * 100;
Note:
AAA is a missable field (MISSING ON) that is set to MISSING.
BBB is a field with MISSING ON that is set to 100, so it has a value that is not MISSING.
For evaluation in expressions, a field that is MISSING is treated as zero (0).
CCC is a numeric field that has MISSING ON computed using an IF-THEN-ELSE expression. TheIF clause contains two tests connected by the OR operator. If either one of these two tests isTRUE, the value in the THEN clause will be passed to the final MISSING check. If neither isTRUE, the value in the ELSE clause will be passed to the MISSING check.
In this case, AAA EQ 0 is true (since MISSING is treated as 0 when used in a comparison). Sothe THEN value, which is zero, is accepted. Since CCC has MISSING ON, which defaults toNEEDS SOME values, at least one data value evaluated in the IF clause must not be missing.
Only AAA was evaluated to get the TRUE condition. BBB was not tested and, therefore, is notincluded in the fields that are checked for missing values. Since AAA is MISSING, CCC (since itNEEDS SOME and does not have any) must be set to MISSING. Note that this processingrepresents a change from the processing in prior releases and, while it increases processingefficiency, it may produce different results.
Since the test for a value and the test for existence or presence (MISSING) are not the same,the best practice is always to use the test that is appropriate. When testing for MISSING,using IS MISSING is preferred to using EQ 0, as it is more direct and does not result in thesame behavior change from previous releases.
13. Handling Records With Missing Field Values
Creating Reports With TIBCO® WebFOCUS Language 1047
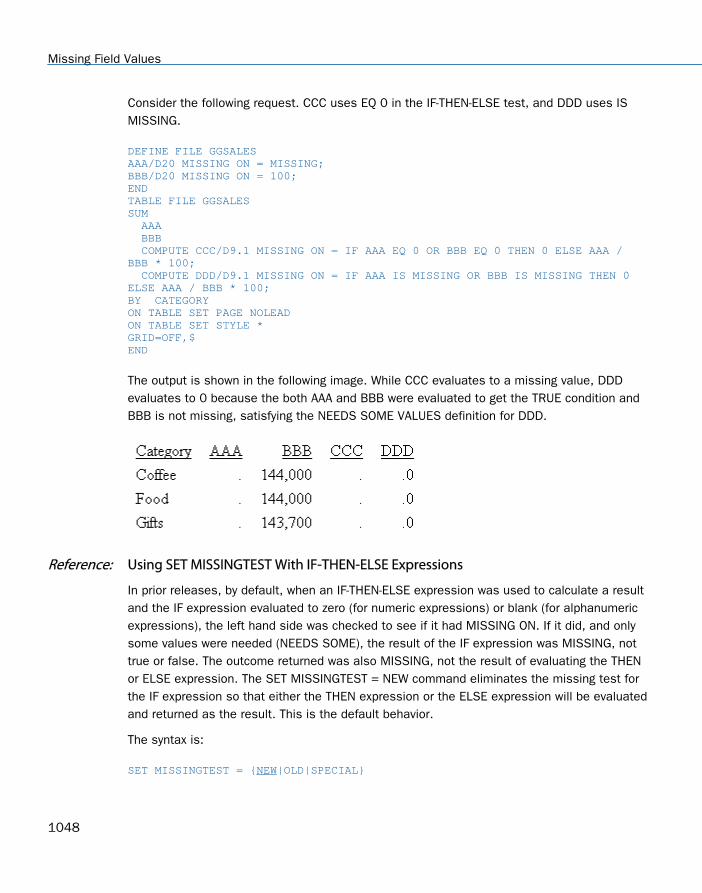
Consider the following request. CCC uses EQ 0 in the IF-THEN-ELSE test, and DDD uses ISMISSING.
DEFINE FILE GGSALESAAA/D20 MISSING ON = MISSING;BBB/D20 MISSING ON = 100;ENDTABLE FILE GGSALESSUM AAA BBB COMPUTE CCC/D9.1 MISSING ON = IF AAA EQ 0 OR BBB EQ 0 THEN 0 ELSE AAA / BBB * 100; COMPUTE DDD/D9.1 MISSING ON = IF AAA IS MISSING OR BBB IS MISSING THEN 0 ELSE AAA / BBB * 100;BY CATEGORYON TABLE SET PAGE NOLEADON TABLE SET STYLE *GRID=OFF,$END
The output is shown in the following image. While CCC evaluates to a missing value, DDDevaluates to 0 because the both AAA and BBB were evaluated to get the TRUE condition andBBB is not missing, satisfying the NEEDS SOME VALUES definition for DDD.
Reference: Using SET MISSINGTEST With IF-THEN-ELSE Expressions
In prior releases, by default, when an IF-THEN-ELSE expression was used to calculate a resultand the IF expression evaluated to zero (for numeric expressions) or blank (for alphanumericexpressions), the left hand side was checked to see if it had MISSING ON. If it did, and onlysome values were needed (NEEDS SOME), the result of the IF expression was MISSING, nottrue or false. The outcome returned was also MISSING, not the result of evaluating the THENor ELSE expression. The SET MISSINGTEST = NEW command eliminates the missing test forthe IF expression so that either the THEN expression or the ELSE expression will be evaluatedand returned as the result. This is the default behavior.
The syntax is:
SET MISSINGTEST = {NEW|OLD|SPECIAL}
Missing Field Values
1048

where:
NEW
Excludes the IF expression from the missing values evaluation so that the IF expressionresults in either true or false, not MISSING. If it evaluates to true, the THEN expression isused to calculate the result. If it evaluates to false, the ELSE expression is used tocalculate the result. This is the default value.
OLD
Includes the IF expression in the missing values evaluation. If the IF expression evaluatesto MISSING and the missing field only needs some missing values, the result is alsoMISSING.
SPECIAL
Is required for passing parameters to RStat.
Example: Using SET MISSINGTEST With IF-THEN-ELSE Expressions
The following request defines a field named MISS_FIELD that contains a missing value for thecountry name Austria. In the TABLE request there are two calculated values, CALC1 and CALC2that test this field in IF-THEN-ELSE expressions. Both of these fields have MISSING ON andneed only some missing values to be missing:
SET MISSINGTEST = OLDDEFINE FILE WF_RETAIL_LITEMISS_FIELD/A10 MISSING ON = IF COUNTRY_NAME NE 'Austria' THEN 'DATAEXISTS' ELSE MISSING;END TABLE FILE WF_RETAIL_LITESUM COGS_US MISS_FIELDCOMPUTE CALC1/A7 MISSING ON = IF ((MISS_FIELD EQ '') OR (MISS_FIELD EQ MISSING)) THEN 'THEN' ELSE 'ELSE';COMPUTE CALC2/A7 MISSING ON = IF ((MISS_FIELD EQ MISSING) OR (MISS_FIELD EQ '')) THEN 'THEN' ELSE 'ELSE';BY COUNTRY_NAMEWHERE BUSINESS_REGION EQ 'EMEA'WHERE COUNTRY_NAME LT 'E'ON TABLE SET NODATA 'MISSING'ON TABLE SET PAGE NOLEADON TABLE SET STYLE *GRID=OFF,$ENDSTYLEEND
13. Handling Records With Missing Field Values
Creating Reports With TIBCO® WebFOCUS Language 1049

Running the request with MISSINGTEST=OLD produces the output shown in the followingimage:
Note that for Austria, MISS_FIELD is MISSING.
In CALC1, the expression MISS_FIELD EQ ' ' is evaluated to true. MISS_FIELD IS MISSINGis not evaluated at all because evaluation stops when it can be determined that the resultof the expression is true. However, since the expression compared the field to blank, it ischecked to see if the result field supports missing values. Since it does, the final result isMISSING.
In CALC2, the expression MISS_FIELD EQ MISSING is true. MISS_FIELD EQ ' ' is notevaluated at all because evaluation stops when it can be determined that the result of theexpression is true. No missing check is needed, so the result of the IF expression is TRUE,and the THEN expression is evaluated and returned as the result.
Changing the SET command to SET MISSINGTEST=NEW and rerunning the request producesthe output shown in the following image. The IF expressions in CALC1 and CALC2 bothevaluate to true because neither expression is checked to see if the result field supportsmissing, so the THEN expression is evaluated and returned as the result in both cases.
Testing for a Segment With a Missing Field Value
You can specify WHERE criteria to identify segment instances with missing field values.
Missing Field Values
1050

You cannot use these tests to identify missing instances. See Handling a Missing SegmentInstance on page 1058.
Syntax: How to Test for a Segment With a Missing Field Value
To test for a segment with missing field values, the syntax is:
WHERE field {IS|EQ} MISSING
To test for the presence of field values, the syntax is:
WHERE field {NE|IS-NOT} MISSING
A WHERE criterion that tests a numeric field for 0 or an alphanumeric field for blanks alsoretrieves instances for which the field has a missing value.
Example: Testing for a Missing Field Value
The following request illustrates the use of MISSING to display grocery items (by code) forwhich the number of packages returned by customers is missing.
TABLE FILE SALESPRINT RETURNSBY CITY BY DATE BY PROD_CODEWHERE RETURNS IS MISSINGEND
The output is:
CITY DATE PROD_CODE RETURNS---- ---- --------- -------NEW YORK 10/17 C13 . E2 .
13. Handling Records With Missing Field Values
Creating Reports With TIBCO® WebFOCUS Language 1051

Example: Testing for an Existing Field Value
The following request illustrates the use of MISSING to display only those grocery items forwhich the number of packages returned by customers is not missing.
TABLE FILE SALESPRINT RETURNSBY CITY BY DATE BY PROD_CODEWHERE RETURNS IS-NOT MISSINGEND
The output is:
Example: Testing for a Blank or Zero
The following request displays grocery items that either were never returned or for which thenumber of returned packages was never recorded:
TABLE FILE SALESPRINT RETURNSBY CITY BY DATE BY PROD_CODEWHERE RETURNS EQ 0END
Missing Field Values
1052

The output is:
Example: Excluding Missing Values From a Test
To display only those items that have not been returned by customers, you need two WHEREcriteria. The first to restrict the number of returns to 0, the other to exclude missing values, asin the following request.
TABLE FILE SALESPRINT RETURNSBY CITY BY DATE BY PROD_CODEWHERE RETURNS EQ 0WHERE RETURNS IS-NOT MISSINGEND
The output is:
Preserving Missing Data Values in an Output File
The ability to distinguish between missing data and default values (blanks and zeros) in fieldscan be carried over into output files. If the retrieved and processed information displayed theNODATA string in a report, by default the NODATA string can be stored in the output file. Usingthe SET HNODATA command, you can change the NODATA value used for alphanumeric outputfiles. You can also use the SET HOLDMISS command to store the missing values rather thanthe NODATA character in an output file. For related information, see Saving and Reusing YourReport Output on page 471.
13. Handling Records With Missing Field Values
Creating Reports With TIBCO® WebFOCUS Language 1053

Syntax: How to Distinguish Missing Data in an Extract File
ON TABLE {HOLD|SAVE|SAVB} MISSING {ON|OFF}
where:
HOLD
Creates an extract file for use in subsequent reports. The default for MISSING is ON.
SAVE
Creates a text extract file for use in other programs. The default for MISSING is OFF.
SAVB
Creates a binary extract file for use in other programs. The default for MISSING is OFF.
HOLD files can be created with both the MISSING and FORMAT ALPHA options, specified in anyorder. For example:
ON TABLE HOLD FORMAT ALPHA MISSING OFFON TABLE HOLD MISSING OFF FORMAT ALPHA
Example: Incorporating MISSING Values in an Extract File
The following request specifies MISSING ON in the HOLD phrase:
TABLE FILE SALESSUM RETURNS AND HOLD FORMAT ALPHA MISSING ONBY CITY BY DATE BY PROD_CODEEND
The MISSING=ON attribute for the RETURNS field is propagated to the HOLD Master File. Inaddition, the missing data symbols are propagated to the HOLD file for the missing fieldvalues:
FILENAME=HOLD , SUFFIX=FIX , $ SEGMENT=HOLD, SEGTYPE=S3, $ FIELDNAME=CITY, ALIAS=E01, USAGE=A15, ACTUAL=A15, $ FIELDNAME=DATE, ALIAS=E02, USAGE=A4MD, ACTUAL=A04, $ FIELDNAME=PROD_CODE, ALIAS=E03, USAGE=A3, ACTUAL=A03, $ FIELDNAME=RETURNS, ALIAS=E04, USAGE=I3, ACTUAL=A03, MISSING=ON, $
With MISSING OFF in the HOLD phrase, the MISSING=ON attribute is not propagated to theHOLD Master File and the missing data symbols are replaced with default values.
Missing Field Values
1054

Syntax: How to Store Missing Data in HOLD Files
SET HOLDMISS={ON|OFF}ON TABLE SET HOLDMISS {ON|OFF}
where:
ON
Allows you to store missing data in a HOLD file. When TABLE generates a default value fordata not found, it generates missing values.
OFF
Does not allow you to store missing data in a HOLD file. OFF is the default value.
Reference: Usage Notes for Holding Missing Values
Setting HOLDMISS ON adds the MISSING=ON attribute to every field in the extract file.
Data is not found if:
ALL is set to ON.
The request is multi-path.
An ACROSS statement has been issued.
Example: Holding Missing Values Using HOLDMISS
SET HOLDMISS=ONTABLE FILE MOVIES SUM WHOLESALEPRBY CATEGORY ACROSS RATING ON TABLE HOLD AS HLDMENDTABLE FILE HLDM PRINT * END
13. Handling Records With Missing Field Values
Creating Reports With TIBCO® WebFOCUS Language 1055

The output is:
CATEGORY WHOLESALEPR WHOLESALEPR WHOLESALEPR WHOLESALEPR WHOLESALEPR-------- ----------- ----------- ----------- ----------- -----------ACTION . . 20.98 . 34.48CHILDREN 54.49 51.38 . . .CLASSIC 40.99 160.80 . . .COMEDY . . 46.70 30.00 13.75DRAMA . . . . 10.00FOREIGN 13.25 . 62.00 . 70.99MUSICALS 15.00 . 13.99 9.99 13.99MYSTERY . 9.00 18.00 9.00 80.97SCI/FI . . . 35.99 43.53TRAIN/EX . 60.98 . . .
Propagating Missing Values to Reformatted Fields in a Request
When a field is reformatted in a request (for example, SUM field/format), an internal COMPUTEfield is created to contain the reformatted field value and display on the report output. If theoriginal field has a missing value, that missing value can be propagated to the internal field bysetting the COMPMISS parameter ON. If the missing value is not propagated to the internalfield, it displays a zero (if it is numeric) or a blank (if it is alphanumeric). If the missing value ispropagated to the internal field, it displays the missing data symbol on the report output.
Syntax: How to Control Missing Values in Reformatted Fields
SET COMPMISS = {ON|OFF}
where:
ON
Propagates a missing value to a reformatted field. ON is the default value.
OFF
Displays a blank or zero for a reformatted field.
Note: The COMPMISS parameter cannot be set in an ON TABLE command.
Example: Controlling Missing Values in Reformatted Fields
The following procedure prints the RETURNS field from the SALES data source for store 14Z.With COMPMISS OFF, the missing values display as zeros in the column for the reformattedfield value.
Note: Before trying this example, you must make sure that the SALEMISS procedure, whichadds missing values to the SALES data source, has been run.
Missing Field Values
1056

SET COMPMISS = OFF TABLE FILE SALES PRINT RETURNS RETURNS/D12.2 AS 'REFORMATTED,RETURNS'BY STORE_CODE WHERE STORE_CODE EQ '14Z' END
The output is:
REFORMATTEDSTORE_CODE RETURNS RETURNS ---------- ------- -----------14Z 2 2.00 2 2.00 0 .00 . .00 4 4.00 0 .00 3 3.00 4 4.00 . .00 4 4.00
With COMPMISS ON, the column for the reformatted version of RETURNS displays the missingdata symbol when a value is missing:
SET COMPMISS = ON TABLE FILE SALES PRINT RETURNS RETURNS/D12.2 AS 'REFORMATTED,RETURNS'BY STORE_CODE WHERE STORE_CODE EQ '14Z' END
The output is:
REFORMATTED STORE_CODE RETURNS RETURNS ---------- ------- ----------- 14Z 2 2.00 2 2.00 0 .00 . . 4 4.00 0 .00 3 3.00 4 4.00 . . 4 4.00
13. Handling Records With Missing Field Values
Creating Reports With TIBCO® WebFOCUS Language 1057

Reference: Usage Notes for SET COMPMISS
If you create a HOLD file with COMPMISS ON, the HOLD Master File for the reformatted fieldindicates MISSING = ON (as does the original field). With COMPMISS = OFF, the reformattedfield does NOT have MISSING = ON in the generated Master File.
Handling a Missing Segment Instance
In multi-segment data sources, when an instance in a parent segment does not havedescendant instances, the nonexistent descendant instances are called missing instances.
When you write a request from a data source that has missing segment instances, the missinginstances affect the report. For example, if the request names fields in a segment and itsdescendants, the report omits parent segment instances that have no descendants. It makesno difference whether fields are display fields or sort fields.
When an instance is missing descendants in a child segment, the instance, its parent, theparent of its parent, and so on up to the root segment, is called a short path. Uniquesegments are never considered to be missing.
For example, consider the following subset of the EMPLOYEE data source.
The top segment contains employee names.
The left segment contains addresses.
The right segment contains the salary history of each employee: the date the employee wasgranted a new salary, and the amount of the salary.
Suppose some employees are paid by an outside agency. None of these employees have acompany salary history. Instances referring to these employees in the salary history segmentare missing.
Handling a Missing Segment Instance
1058
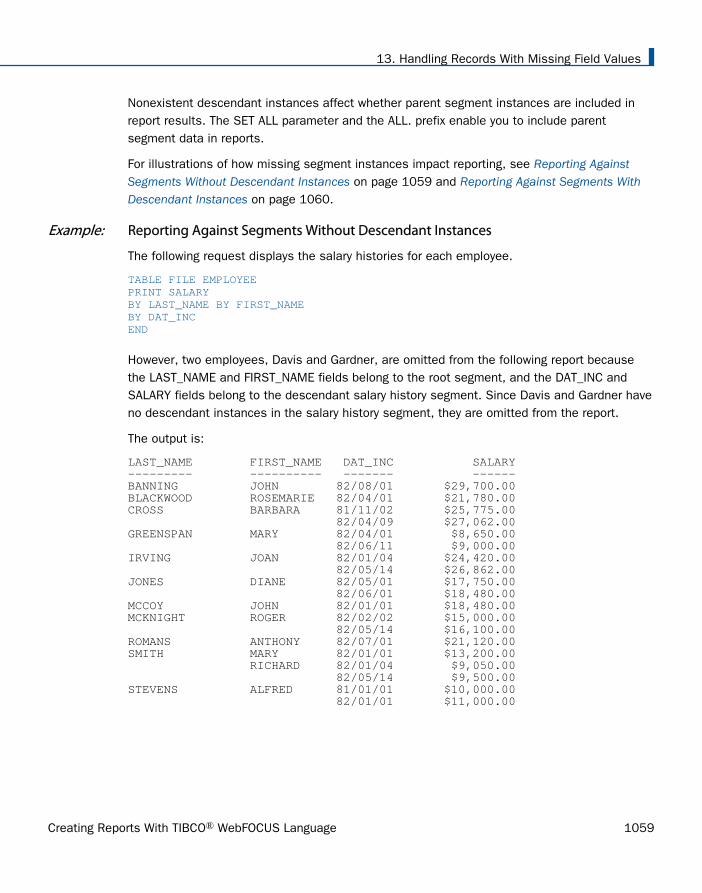
Nonexistent descendant instances affect whether parent segment instances are included inreport results. The SET ALL parameter and the ALL. prefix enable you to include parentsegment data in reports.
For illustrations of how missing segment instances impact reporting, see Reporting AgainstSegments Without Descendant Instances on page 1059 and Reporting Against Segments WithDescendant Instances on page 1060.
Example: Reporting Against Segments Without Descendant Instances
The following request displays the salary histories for each employee.
TABLE FILE EMPLOYEEPRINT SALARYBY LAST_NAME BY FIRST_NAMEBY DAT_INCEND
However, two employees, Davis and Gardner, are omitted from the following report becausethe LAST_NAME and FIRST_NAME fields belong to the root segment, and the DAT_INC andSALARY fields belong to the descendant salary history segment. Since Davis and Gardner haveno descendant instances in the salary history segment, they are omitted from the report.
The output is:
LAST_NAME FIRST_NAME DAT_INC SALARY--------- ---------- ------- ------BANNING JOHN 82/08/01 $29,700.00BLACKWOOD ROSEMARIE 82/04/01 $21,780.00CROSS BARBARA 81/11/02 $25,775.00 82/04/09 $27,062.00GREENSPAN MARY 82/04/01 $8,650.00 82/06/11 $9,000.00IRVING JOAN 82/01/04 $24,420.00 82/05/14 $26,862.00JONES DIANE 82/05/01 $17,750.00 82/06/01 $18,480.00MCCOY JOHN 82/01/01 $18,480.00MCKNIGHT ROGER 82/02/02 $15,000.00 82/05/14 $16,100.00ROMANS ANTHONY 82/07/01 $21,120.00SMITH MARY 82/01/01 $13,200.00 RICHARD 82/01/04 $9,050.00 82/05/14 $9,500.00STEVENS ALFRED 81/01/01 $10,000.00 82/01/01 $11,000.00
13. Handling Records With Missing Field Values
Creating Reports With TIBCO® WebFOCUS Language 1059

Example: Reporting Against Segments With Descendant Instances
The following request displays the course codes and expenses for employees in the EMPDATAand TRAIN2 data sources. The report output displays all employees that have instances in theCOURSECODE or EXPENSES fields. The employees that are missing instances for either ofthose fields are omitted from the report. For those employees that have instances for only oneof the fields, the designator for missing data displays in the respective column. In thisexample, Henry Chisolm has taken two courses but only has expenses for one. Therefore, thedesignator for missing instances displays in the EXPENSES column.
JOIN EMPDATA.PIN IN EMPDATA TO ALL TRAINING.PIN IN TRAIN2 AS JOIN1TABLE FILE EMPDATAPRINT LASTNAME AND FIRSTNAME AND COURSECODE AND EXPENSES BY PINEND
The output is:
PIN LASTNAME FIRSTNAME COURSECODE EXPENSES
000000010 VALINO DANIEL PDR740 2,300.00
000000030 CASSANOVA LOIS NAMA730 2,600.00
CASSANOVA LOIS EDP090 2,300.00
.
.
.
000000350 FERNSTEIN ERWIN SSI220 1,850.00
FERNSTEIN ERWIN MC90 1,730.00
FERNSTEIN ERWIN UMI720 3,350.00
000000360 CHISOLM HENRY EDP090 .00
CHISOLM HENRY EDP690 3,000.00
000000370 WANG JOHN UMI710 2,050.00
000000380 ELLNER DAVID EDP090 .
ELLNER DAVID UNI780 3,350.00
000000410 CONTI MARSHALL EDP690 3,100.00
Note: The report output has been truncated for demonstration purposes.
Handling a Missing Segment Instance
1060

Including Missing Instances in Reports With the ALL. Prefix
If a request excludes parent segment instances that lack descendants, you can include theparent instances by attaching the ALL. prefix to one of the fields in the parent segment.
Note that if the request contains WHERE or IF criteria that screen fields in segments that havemissing instances, the report omits parent instances even when you use the ALL. prefix. Toinclude these instances, use the SET ALL=PASS command described in Including MissingSegment Instances With the ALL. Prefix on page 1061.
Example: Including Missing Segment Instances With the ALL. Prefix
The following request displays the salary history of each employee. Although employeesElizabeth Davis and David Gardner have no salary histories, they are included in the report.
TABLE FILE EMPLOYEEPRINT SALARYBY ALL.LAST_NAME BY FIRST_NAMEBY DAT_INCEND
The output is:
LAST_NAME FIRST_NAME DAT_INC SALARY--------- ---------- ------- ------BANNING JOHN 82/08/01 $29,700.00BLACKWOOD ROSEMARIE 82/04/01 $21,780.00CROSS BARBARA 81/11/02 $25,775.00 82/04/09 $27,062.00DAVIS ELIZABETH . .GARDNER DAVID . .GREENSPAN MARY 82/04/01 $8,650.00 82/06/11 $9,000.00IRVING JOAN 82/01/04 $24,420.00 82/05/14 $26,862.00JONES DIANE 82/05/01 $17,750.00 82/06/01 $18,480.00MCCOY JOHN 82/01/01 $18,480.00MCKNIGHT ROGER 82/02/02 $15,000.00 82/05/14 $16,100.00ROMANS ANTHONY 82/07/01 $21,120.00SMITH MARY 82/01/01 $13,200.00 RICHARD 82/01/04 $9,050.00 82/05/14 $9,500.00STEVENS ALFRED 81/01/01 $10,000.00 82/01/01 $11,000.00
Including Missing Instances in Reports With the SET ALL Parameter
You can control how parent instances with missing descendants are processed by issuing theSET ALL command before executing the request. In a join, issuing the SET ALL = ON commandcontrols left outer join processing.
13. Handling Records With Missing Field Values
Creating Reports With TIBCO® WebFOCUS Language 1061

Note: A request with WHERE or IF criteria, which screen fields in a segment that has missinginstances, omits instances in the parent segment even if you use the SET ALL=ON command.To include these instances, use the SET ALL=PASS command.
In WebFOCUS, the command SET ALL = ON or JOIN LEFT_OUTER specifies a left outer join.With a left outer join, all records from the host file display on the report output. If a cross-referenced segment instance does not exist for a host segment instance, the report outputdisplays missing values for the fields from the cross-referenced segment.
If there is a screening condition on the dependent segment, those dependent segmentinstances that do not satisfy the screening condition are omitted from the report output, andso are their corresponding host segment instances. With missing segment instances, tests formissing values fail because the fields in the segment have not been assigned missing values.
When a relational engine performs a left outer join, it processes host records with missingcross-referenced segment instances slightly differently from the way WebFOCUS processesthose records when both of the following conditions apply:
There is a screening condition on the cross-referenced segment.
A host segment instance does not have a corresponding cross-referenced segmentinstance. This is called a short path.
When these two conditions are true, WebFOCUS omits the host record from the report output,while relational engines supply null values for the fields from the dependent segment and thenapply the screening condition. If the missing values pass the screening condition, the entirerecord is retained on the report output. This type of processing is useful for finding or countingall host records that do not have matching records in the cross-referenced file or for creating aDEFINE-based join from the cross-referenced segment with the missing instance to anotherdependent segment.
If you want WebFOCUS to assign null values to the fields in a missing segment instance whena left outer join is in effect, you can issue the command SET SHORTPATH=SQL.
Syntax: How to Include a Parent Instance With Missing Descendants
SET ALL= {OFF|ON|PASS}
where:
OFF
Omits parent instances that are missing descendants from the report. OFF is the defaultvalue.
Handling a Missing Segment Instance
1062
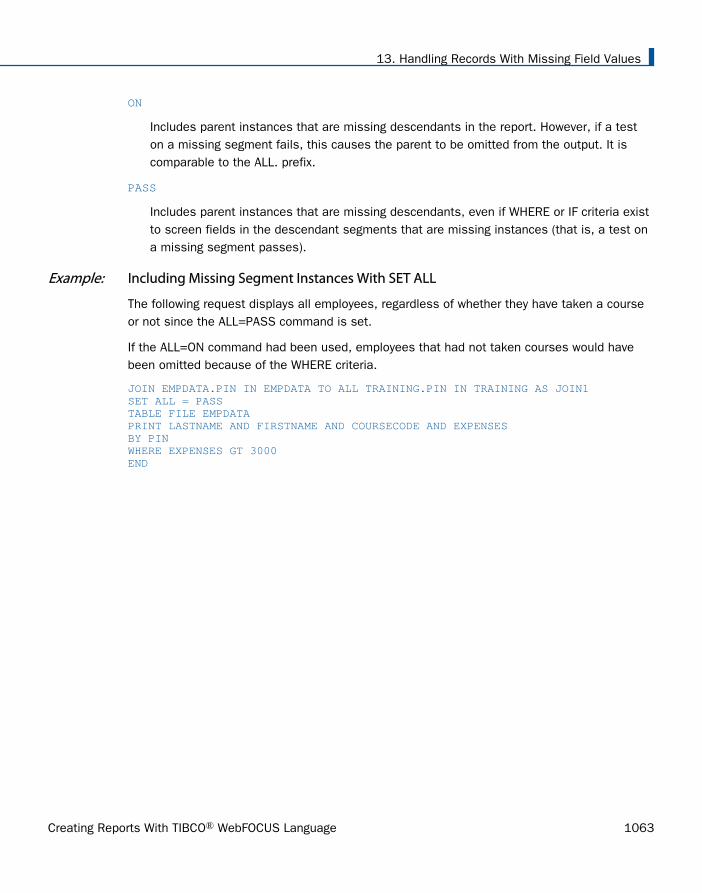
ON
Includes parent instances that are missing descendants in the report. However, if a teston a missing segment fails, this causes the parent to be omitted from the output. It iscomparable to the ALL. prefix.
PASS
Includes parent instances that are missing descendants, even if WHERE or IF criteria existto screen fields in the descendant segments that are missing instances (that is, a test ona missing segment passes).
Example: Including Missing Segment Instances With SET ALL
The following request displays all employees, regardless of whether they have taken a courseor not since the ALL=PASS command is set.
If the ALL=ON command had been used, employees that had not taken courses would havebeen omitted because of the WHERE criteria.
JOIN EMPDATA.PIN IN EMPDATA TO ALL TRAINING.PIN IN TRAINING AS JOIN1SET ALL = PASSTABLE FILE EMPDATAPRINT LASTNAME AND FIRSTNAME AND COURSECODE AND EXPENSES BY PINWHERE EXPENSES GT 3000END
13. Handling Records With Missing Field Values
Creating Reports With TIBCO® WebFOCUS Language 1063

The output is:
Syntax: How to Control Short Path Processing In a Left Outer Join
SET SHORTPATH = {FOCUS|SQL}
where:
FOCUS
Omits a host segment from the report output when it has no corresponding cross-referenced segment and the report has a screening condition on the cross-referencedsegment.
SQL
Supplies missing values for the fields in a missing cross-referenced segment in an outerjoin. Applies screening conditions against this record and retains the record on the reportoutput if it passes the screening test.
Note: There must be an outer join in effect, either as a result of the SET ALL=ONcommand or a JOIN LEFT_OUTER command (either inside or outside of the Master File).
Handling a Missing Segment Instance
1064

Reference: Usage Notes for SET SHORTPATH = SQL
A FOCUS data source is supported as the host file in a join used with SET SHORTPATH = SQL,but not as the cross-referenced file.
Example: Controlling Outer Join Processing
The following procedure creates two Oracle tables, ORAEMP and ORAEDUC, that will be used ina join.
TABLE FILE EMPLOYEESUM LAST_NAME FIRST_NAME CURR_SAL CURR_JOBCODE DEPARTMENTBY EMP_IDON TABLE HOLD AS ORAEMP FORMAT SQLORAEND-RUNTABLE FILE EDUCFILESUM COURSE_CODE COURSE_NAMEBY EMP_ID BY DATE_ATTENDON TABLE HOLD AS ORAEDUC FORMAT SQLORAEND
The following request joins the two Oracle tables and creates a left outer join (SET ALL = ON).
JOIN EMP_ID IN ORAEMP TO ALL EMP_ID IN ORAEDUC AS J1SET ALL = ONTABLE FILE ORAEMPPRINT COURSE_CODE COURSE_NAMEBY EMP_IDEND
Since the join is an outer join, all ORAEMP rows display on the report output. ORAEMP rowswith no corresponding ORAEDUC row display the missing data symbol for the fields from theORAEDUC table.
13. Handling Records With Missing Field Values
Creating Reports With TIBCO® WebFOCUS Language 1065

EMP_ID COURSE_CODE COURSE_NAME ------ ----------- -----------071382660 101 FILE DESCRPT & MAINT 112847612 101 FILE DESCRPT & MAINT 103 BASIC REPORT PREP FOR PROG 117593129 101 FILE DESCRPT & MAINT 103 BASIC REPORT PREP FOR PROG 201 ADVANCED TECHNIQUES 203 FOCUS INTERNALS 119265415 108 BASIC RPT NON-DP MGRS 119329144 . . 123764317 . . 126724188 . . 219984371 . . 326179357 104 FILE DESC & MAINT NON-PROG 106 TIMESHARING WORKSHOP 102 BASIC REPORT PREP NON-PROG 301 DECISION SUPPORT WORKSHOP 202 WHAT'S NEW IN FOCUS 451123478 101 FILE DESCRPT & MAINT 543729165 . . 818692173 107 BASIC REPORT PREP DP MGRS
The following request adds a screening condition on the ORAEDUC segment. To satisfy thescreening condition, the course name must either contain the characters BASIC or be missing.
JOIN CLEAR JOIN EMP_ID IN ORAEMP TO ALL EMP_ID IN ORAEDUC AS J1SET ALL = ONTABLE FILE ORAEMPPRINT COURSE_CODE COURSE_NAMEBY EMP_IDWHERE COURSE_NAME CONTAINS 'BASIC' OR COURSE_NAME IS MISSINGEND
However, with SET ALL = ON, the rows with missing values are not retained on the reportoutput.
EMP_ID COURSE_CODE COURSE_NAME ------ ----------- ----------- 112847612 103 BASIC REPORT PREP FOR PROG 117593129 103 BASIC REPORT PREP FOR PROG 119265415 108 BASIC RPT NON-DP MGRS 326179357 102 BASIC REPORT PREP NON-PROG 818692173 107 BASIC REPORT PREP DP MGRS
Handling a Missing Segment Instance
1066

The following request adds the SET SHORTPATH = SQL command.
JOIN CLEAR JOIN EMP_ID IN ORAEMP TO ALL EMP_ID IN ORAEDUC AS J1SET ALL = ONSET SHORTPATH=SQLTABLE FILE ORAEMPPRINT COURSE_CODE COURSE_NAMEBY EMP_IDWHERE COURSE_NAME CONTAINS 'BASIC' OR COURSE_NAME IS MISSINGEND
The report output now displays both the records containing the characters BASIC and thosewith missing values.
EMP_ID COURSE_CODE COURSE_NAME ------ ----------- ----------- 112847612 103 BASIC REPORT PREP FOR PROG 117593129 103 BASIC REPORT PREP FOR PROG 119265415 108 BASIC RPT NON-DP MGRS 119329144 . . 123764317 . . 126724188 . . 219984371 . . 326179357 102 BASIC REPORT PREP NON-PROG 543729165 . . 818692173 107 BASIC REPORT PREP DP MGRS
Example: Finding Host Records That Have No Matching Cross-Referenced Records
The following request counts and lists those employees who have taken no courses.
JOIN LEFT_OUTER EMP_ID IN ORAEMP TO ALL EMP_ID IN ORAEDUC AS J1SET ALL = ONSET SHORTPATH=SQLTABLE FILE ORAEMPCOUNT EMP_IDLIST EMP_ID LAST_NAME FIRST_NAMEWHERE COURSE_NAME IS MISSINGEND
The output is:
EMP_ID COUNT LIST EMP_ID LAST_NAME FIRST_NAME------ ---- ------ --------- ---------- 5 1 119329144 BANNING JOHN 2 123764317 IRVING JOAN 3 126724188 ROMANS ANTHONY 4 219984371 MCCOY JOHN 5 543729165 GREENSPAN MARY
13. Handling Records With Missing Field Values
Creating Reports With TIBCO® WebFOCUS Language 1067

Testing for Missing Instances in TIBCO FOCUS Data Sources
You can use the ALL PASS parameter to produce reports that include only parent instanceswith missing descendant values. To do so, write the request to screen out all existinginstances in the segment with missing instances. After you set the ALL parameter to PASS, thereport displays only the parent instances that are missing descendants.
Example: Testing for a MISSING Instance in a TIBCO FOCUS Data Source
The following request tests for missing instances in the COURSECODE field. Since noCOURSECODE can equal 'XXXX', only employees with missing instances in COURSECODEdisplay in the report output.
JOIN EMPDATA.PIN IN EMPDATA TO ALL TRAINING.PIN IN TRAINING AS JOIN1SET ALL = PASSTABLE FILE EMPDATAPRINT LASTNAME AND FIRSTNAME AND COURSECODE AND EXPENSES BY PINWHERE COURSECODE EQ 'XXXX'END
The output is:
PIN LASTNAME FIRSTNAME COURSECODE EXPENSES
000000020 BELLA MICHAEL . .
000000060 PATEL DORINA . .
000000070 SANCHEZ EVELYN . .
000000090 PULASKI MARIANNE . .
000000130 CVEK MARCUS . .
000000170 MORAN WILLIAM . .
000000220 LEWIS CASSANDRA . .
000000230 NOZAWA JIM . .
000000300 SOPENA BEN . .
000000390 GRAFF ELAINE . .
000000400 LOPEZ ANNE . .
Setting the NODATA Character String
In a report, the NODATA character string indicates no data or inapplicable data. The defaultNODATA character is a period. However, you can change this character designation.
Setting the NODATA Character String
1068

Syntax: How to Set the NODATA String
SET NODATA = string
where:
string
Is the character string used to indicate missing data in reports. The default string is aperiod (.). The string may be a maximum of 11 characters. Common choices are NONE,N/A, and MISSING.
Example: Setting NODATA Not to Display Characters
If you do not want any characters, issue the command:
SET NODATA = ' '
Example: Setting the NODATA Character String
In the following request, the NODATA character string is set to MISSING. The word MISSINGdisplays on the report instead of the default period.
SET NODATA=MISSING TABLE FILE EMPLOYEEPRINT CURR_SAL BY LAST_NAME BY FIRST_NAMEACROSS DEPARTMENTEND
The output is:
13. Handling Records With Missing Field Values
Creating Reports With TIBCO® WebFOCUS Language 1069

Setting the NODATA Character String
1070

Chapter14Joining Data Sources
You can join two or more related data sources to create a larger integrated data structurefrom which you can report in a single request. The joined structure is virtual. It is a way ofaccessing multiple data sources as if they were a single data source. Up to 1022 joinscan be in effect at one time, for a total of 1023 segments, depending on the number ofactive segments and the number and length of the fields (there is a 32K limit on thelength of all fields).
For details about data sources you can use in a join, see Data Sources You Can andCannot Join on page 1073.
In this chapter:
Types of Joins
How the JOIN Command Works
Creating an Equijoin
Using a Conditional Join
Full Outer Joins
Reporting Against a Multi-Fact ClusterSynonym
Navigating Joins Between ClusterSynonyms
Cross Database Join Optimization
Invoking Context Analysis for a StarSchema With a Fan Trap
Adding DBA Restrictions to the JoinCondition: SET DBAJOIN
Preserving Virtual Fields During JoinParsing
Displaying Joined Structures
Clearing Joined Structures
Types of Joins
When you join two data sources, some records in one of the files may lack correspondingrecords in the other file. When a report omits records that are not in both files, the join iscalled an inner join. When a report displays all matching records, plus all records from the hostfile that lack corresponding cross-referenced records, the join is called a left outer join. When areport displays all matching records plus all records from both files that lack correspondingrecords in the other file, the join is called a full outer join. Full outer joins are supported forrelational data sources only.
Creating Reports With TIBCO® WebFOCUS Language 1071

The SET ALL command globally determines how all joins are implemented. If the SET ALL=ONcommand is issued, all joins are treated as outer joins. With SET ALL=OFF, the default, alljoins are treated as inner joins.
Each JOIN command can specify explicitly which type of join to perform, locally overruling theglobal setting. This syntax is supported for FOCUS, XFOCUS, Relational, VSAM, IMS, andAdabas. If you do not specify the type of join in the JOIN command, the ALL parameter settingdetermines the type of join to perform.
You can also join data sources using one of two techniques for determining how to matchrecords from the separate data sources. The first technique is known as an equijoin and thesecond is known as a conditional join. When deciding which of the two join techniques to use,it is important to know that when there is an equality condition between two data sources, it ismore efficient to use an equijoin rather than a conditional join.
You can use an equijoin structure when you are joining two or more data sources that have twofields, one in each data source, with formats (character, numeric, or date) and values incommon. Joining a product code field in a sales data source (the host file) to the product codefield in a product data source (the cross-referenced file) is an example of an equijoin. For moreinformation on using equijoins, see Creating an Equijoin on page 1084.
The conditional join uses WHERE-based syntax to specify joins based on WHERE criteria, notjust on equality between fields. Additionally, the host and cross-referenced join fields do nothave to contain matching formats. Suppose you have a data source that lists employees bytheir ID number (the host file), and another data source that lists training courses and theemployees who attended those courses (the cross-referenced file). Using a conditional join,you could join an employee ID in the host file to an employee ID in the cross-referenced file todetermine which employees took training courses in a given date range (the WHERE condition).For more information on conditional joins, see Using a Conditional Join on page 1103.
Joins can also be unique or non-unique. A unique, or one-to-one, join structure matches onevalue in the host data source to one value in the cross-referenced data source. Joining anemployee ID in an employee data source to an employee ID in a salary data source is anexample of a unique equijoin structure.
A non-unique, or one-to-many, join structure matches one value in the host data source tomultiple values in the cross-referenced field. Joining an employee ID in a company's employeedata source to an employee ID in a data source that lists all the training classes offered bythat company results in a listing of all courses taken by each employee, or a joining of the oneinstance of each ID in the host file to the multiple instances of that ID in the cross-referencedfile.
Types of Joins
1072

For more information on unique and non-unique joins, see Unique and Non-Unique JoinedStructures on page 1074.
Example: Joined Data Structure
Consider the SALES and PRODUCT data sources. Each store record in SALES may containmany instances of the PROD_CODE field. It would be redundant to store the associatedproduct information with each instance of the product code. Instead, PROD_CODE in theSALES data source is joined to PROD_CODE in the PRODUCT data source. PRODUCT containsa single instance of each product code and related product information, thus saving space andmaking it easier to maintain product information. The joined structure, which is an example ofan equijoin, is illustrated below:
Reference: Data Sources You Can and Cannot Join
The use of data sources as host files and cross-referenced files in joined structures dependson the types of data sources you are joining:
Typically, joins can be established between any FOCUS-readable files.
Data sources protected by DBA security may be joined, with certain restrictions. For details,see Notes on DBA Security for Joined Data Structures on page 1074.
Conditional joins are supported only for FOCUS, VSAM, ADABAS, IMS, and all relationaldata sources.
14. Joining Data Sources
Creating Reports With TIBCO® WebFOCUS Language 1073

Reference: Notes on DBA Security for Joined Data Structures
You can join a data source with DBA protection to another data source with DBA protection,as long as they use the same password.
In addition, you can join DBA protected data sources with different passwords by adding theDBAFILE attribute to your security definition. The DBAFILE attribute names a central MasterFile that contains different passwords and restrictions for several Master Files. If you use aDBAFILE, a user can set separate passwords for each file using the syntax:
SET PASS = pswd1 IN file1, pswd2 IN file2
Individual DBA information remains in effect for each file in the JOIN. For details about theDBAFILE attribute, see the Describing Data With TIBCO WebFOCUS® Language manual.
You can also join a DBA-protected host file to an unprotected cross-referenced file. TheDBA information is taken from the host file.
Unique and Non-Unique Joined Structures
In a unique joined structure, one value in the host field corresponds to one value in the cross-referenced field. In a non-unique joined structure, one value in the host field corresponds tomultiple values in the cross-referenced field.
The ALL parameter in a JOIN command indicates that the joined structure is non-unique.
Omit the ALL parameter only when you are sure that the joined structure is unique. Omittingthe ALL parameter reduces overhead.
The ALL parameter does not interfere with the proper creation of the joined structure even ifit is unique. Use the ALL parameter if you are not sure whether the joined structure isunique. This ensures that your reports contain all relevant data from the cross-referencedfile, regardless of whether the structure is unique.
Types of Joins
1074

Example: A Unique Equijoin Structure
The following example illustrates a unique joined structure. Two FOCUS data sources arejoined together: an EMPDATA data source and a SALHIST data source. Both data sources areorganized by PIN, and they are joined on a PIN field in the root segments of both files. EachPIN has one segment instance in the EMPDATA data source, and one instance in the SALHISTdata source. To join these two data sources, issue this JOIN command:
JOIN PIN IN EMPDATA TO PIN IN SALHIST
Example: A Non-Unique Equijoin Structure
If a field value in the host file can appear in many segment instances in the cross-referencedfile, then you should include the ALL phrase in the JOIN syntax. This structure is called a non-unique joined structure.
For example, assume that two FOCUS data sources are joined together: the JOB data sourceand an EDUCFILE data source which records employee attendance at in-house courses. Thejoined structure is shown in the following diagram.
The JOB data source is organized by employee, but the EDUCFILE data source is organized bycourse. The data sources are joined on the EMP_ID field. Since an employee has one positionbut can attend several courses, the employee has one segment instance in the JOB datasource but can have as many instances in the EDUCFILE data source as courses attended.
14. Joining Data Sources
Creating Reports With TIBCO® WebFOCUS Language 1075

To join these two data sources, issue the following JOIN command, using the ALL phrase:
JOIN EMP_ID IN JOB TO ALL EMP_ID IN EDUCFILE
Syntax: How to Correct for Lagging Values With a Unique Join
If a parent segment has two or more unique child segments that each have multiple children,the report may incorrectly display a missing value. The remainder of the child values may thenbe misaligned in the report. These misaligned values are called lagging values. The JOINOPTparameter ensures proper alignment of your output by correcting for lagging values.
SET JOINOPT={NEW|OLD|GNTINT}
where:
NEW
Specifies that segments be retrieved from left to right and from top to bottom, whichresults in the display of all data for each record, properly aligned. Missing values onlyoccur when they exist in the data.
OLD
Specifies that segments be retrieved as unique segments, which results in the display ofmissing data in a report where all records should have values. This might cause laggingvalues. OLD is the default value.
Types of Joins
1076

GNTINT
Specifies that segments be retrieved from left to right and from top to bottom, whichresults in the display of all data for each record, properly aligned. Missing values onlyoccur when they exist in the data.
Note: The value GNTINT both corrects for lagging values and enables joins betweendifferent numeric data types, as described in Joining Fields With Different Numeric DataTypes on page 1102.
Example: Correcting for Lagging Values in a Procedure With Unique Segments and MultipleChildren
This example is a hypothetical scenario in which you would use the JOINOPT parameter tocorrect for lagging values. Lagging values display missing data such that each value appearsoff by one line.
A single-segment host file (ROUTES) is joined to two files (ORIGIN and DEST), each having twosegments. The files are joined to produce a report that shows each train number, along withthe city that corresponds to each station.
The following request prints the city of origin (OR_CITY) and the destination city (DE_CITY).Note that missing data is generated, causing the data for stations and corresponding cities tolag, or be off by one line.
TABLE FILE ROUTESPRINT TRAIN_NUMOR_STATION OR_CITYDE_STATION DE_CITYEND
The output is:
TRAIN_NUM OR_STATION OR_CITY DE_STATION DE_CITY--------- ---------- ------- ---------- -------101 NYC NEW YORK ATL .202 BOS BOSTON BLT ATLANTA303 DET DETROIT BOS BALTIMORE404 CHI CHICAGO DET BOSTON505 BOS BOSTON STL DETROIT505 BOS . STL ST. LOUIS
14. Joining Data Sources
Creating Reports With TIBCO® WebFOCUS Language 1077

Issuing SET JOINOPT=NEW enables segments to be retrieved in the expected order (from leftto right and from top to bottom), without missing data.
SET JOINOPT=NEWTABLE FILE ROUTESPRINT TRAIN_NUMOR_STATION OR_CITYDE_STATION DE_CITYEND
The correct report has only 5 lines instead of 6, and the station and city data is properlyaligned. The output is:
TRAIN_NUM OR_STATION OR_CITY DE_STATION DE_CITY--------- ---------- ------- ---------- -------101 NYC NEW YORK ATL ATLANTA202 BOS BOSTON BLT BALTIMORE303 DET DETROIT BOS BOSTON404 CHI CHICAGO DET DETROIT505 BOS BOSTON STL ST. LOUIS
Recursive Joined Structures
You can join a FOCUS or IMS data source to itself, creating a recursive structure. In the mostcommon type of recursive structure, a parent segment is joined to a descendant segment, sothat the parent becomes the child of the descendant. This technique (useful for storing bills ofmaterials, for example) enables you to report from data sources as if they have more segmentlevels than is actually the case.
Example: Understanding Recursive Joined Structures
For example, the GENERIC data source shown below consists of Segments A and B.
Types of Joins
1078

The following request creates a recursive structure:
JOIN FIELD_B IN GENERIC TAG G1 TO FIELD_A IN GENERIC TAG G2 AS RECURSIV
This results in the joined structure (shown below).
Note that the two segments are repeated on the bottom. To refer to the fields in the repeatedsegments (other than the field to which you are joining), prefix the tag names to the fieldnames and aliases and separate them with a period, or append the first four characters of theJOIN name to the field names and aliases. In the above example, the JOIN name is RECURSIV.You should refer to FIELD_B in the bottom segment as G2.FIELD_B (or RECUFIELD_B). Forrelated information, see Usage Notes for Recursive Joined Structures on page 1079.
Reference: Usage Notes for Recursive Joined Structures
You must either specify a unique JOIN name, or use tag names in the JOIN command.Otherwise, you will not be able to refer to the fields in the repeated segments at the bottomof the join structure.
14. Joining Data Sources
Creating Reports With TIBCO® WebFOCUS Language 1079

If you use tag names in a recursive joined structure, note the following guidelines:
If tag names are specified in a recursive join, duplicate field names must be qualifiedwith the tag name.
If a join name is specified and tag names are not specified in a recursive join, duplicatefield names must be prefixed with the first four characters of the join name.
If both a join name and a tag name are specified in a recursive join, the tag name mustbe used as a qualifier.
The tag name must be used as the field name qualifier in order to retrieve duplicatefield names in a non-recursive join. If you do not qualify the field name, the firstoccurrence is retrieved.
You may use a DEFINE-based join (see How to Join From a Virtual Field to a Real Field onpage 1097) to join a virtual field in a descendant segment to a field in the parent segment.
You can extend a recursive structure by issuing multiple JOIN commands from the bottomrepeat segment in the structure to the parent segment, creating a structure up to 16 levelsdeep.
For FOCUS data sources, the field in the parent segment to which you are joining must beindexed.
For IMS data sources, the following applies:
The parent segment must be the root segment of the data source.
The field to which you are joining must be both a key field and a primary or secondaryindex.
You need a duplicate PCB in the PSB for every recursive join you create.
Example: Using Recursive Joined Structures
This example explains how to use recursive joins to store and report on a bill of materials.Suppose you are designing a data source called AIRCRAFT that contains the bill of materialsfor an aircraft manufactured by a company. The data source records data on three levels ofairplane parts:
Major divisions, such as the cockpit or cabin.
Parts of divisions, such as instrument panels and seats.
Types of Joins
1080

Subparts, such as nuts and bolts.
The data source must record each part, the part description, and the smaller parts composingthe part. Some parts, such as nuts and bolts, are common throughout the aircraft. If youdesign a three-segment structure, one segment for each level of parts, descriptions ofcommon parts are repeated in every place they are used.
To reduce this repetition, design a data source that has only two segments (shown in thefollowing diagram). The top segment describes each part of the aircraft, large and small. Thebottom segment lists the component parts without descriptions.
Every part (except for the largest divisions) appears in both the top segment, where it isdescribed, and in the bottom segment, where it is listed as one of the components of a largerpart. (The smallest parts, such as nuts and bolts, appear in the top segment without aninstance of a child in the bottom segment.) Note that each part, no matter how often it is usedin the aircraft, is described only once.
If you join the bottom segment to the top segment, the descriptions of component parts in thebottom segment can be retrieved. The first-level major divisions can also be related to third-level small parts, going from the first level to the second level to the third level. Thus, thestructure behaves as a three-level data source, although it is actually a more efficient two-levelsource.
14. Joining Data Sources
Creating Reports With TIBCO® WebFOCUS Language 1081

For example, CABIN is a first-level division appearing in the top segment. It lists SEATS as acomponent in the bottom segment. SEATS also appears in the top segment. It lists BOLTS asa component in the bottom segment. If you join the bottom segment to the top segment, youcan go from CABIN to SEATS and from SEATS to BOLTS.
Join the bottom segment to the top segment with this JOIN command:
JOIN SUBPART IN AIRCRAFT TO PART IN AIRCRAFT AS SUB
This creates the following recursive structure.
Types of Joins
1082

You can then produce a report on all three levels of data with this TABLE command (the fieldSUBDESCRIPT describes the contents of the field SUBPART):
TABLE FILE AIRCRAFTPRINT SUBPART BY PART BY SUBPART BY SUBDESCRIPTEND
How the JOIN Command Works
The JOIN command enables you to report from two or more related data sources with a singlerequest. Joined data sources remain physically separate, but are treated as one. Up to 1022joins can be in effect at any one time.
When two data sources are joined, one is called the host file; the other is called the cross-referenced file. Each time a record is retrieved from the host file, the corresponding fields inthe cross-referenced file are identified if they are referenced in the report request. The recordsin the cross-referenced file containing the corresponding values are then retrieved.
Two data sources can be joined using a conditional join whenever you can define anexpression that determines how to relate records in the host file to records in the cross-referenced file. Two data sources can be joined using an equijoin when they have fields in eachdata source with formats (character, numeric, or date) and values in common. The commonformats ensure proper interpretation of the values. For example, suppose that you need toread data from two data sources: one named JOB, containing job information, and a secondnamed SALARY, containing salary information. You can join these two data sources if each hasa field identifying the same group of employees in the same way: by last name, serial number,or social security number. The join becomes effective when common values (for example,common social security numbers) are retrieved for the joined fields.
After you issue the JOIN command, you can issue a single TABLE, TABLEF, MATCH FILE, orGRAPH request to read the joined data source. You only need to specify the first data source(host file) to produce a report from two or more data sources. For example, assume you arewriting a report from the JOB and SALARY data sources. You execute the following equijoin:
JOIN EMP_ID IN JOB TO ALL EMP_ID IN SALARY
This command joins the field EMP_ID in the JOB file to the field EMP_ID in the SALARY file.JOB is the host file and SALARY is the cross-referenced file. You then execute this reportrequest:
TABLE FILE JOBPRINT SALARY AND JOB_TITLE BY EMP_IDEND
14. Joining Data Sources
Creating Reports With TIBCO® WebFOCUS Language 1083

The first record retrieved is a JOB file record for employee #071382660. Next, all records inthe SALARY data source containing employee #071382660 are retrieved. This processcontinues until all the records have been read.
You can base your join on:
Real fields that have been declared in the Master Files of the host and cross-referenceddata sources, respectively. See How to Join Real Fields on page 1084.
A virtual field in the host data source (that has either been defined in the Master File orwith a DEFINE command) and a real field that has been declared in the Master File of thecross-referenced data source. See How to Join From a Virtual Field to a Real Field on page1097.
A condition you specify in the JOIN command itself. See How to Create a Conditional JOINon page 1104.
Reference: Increasing Retrieval Speed in Joined Data Sources
You can increase retrieval speed in joined structures by using an external index. However, thetarget segment for the index cannot be a cross-referenced segment. For related information,see Improving Report Processing on page 1929.
Creating an Equijoin
The most common joined structures are based on real fields that have been declared in theMaster Files of the host and cross-referenced data sources, respectively.
Syntax: How to Join Real Fields
The following JOIN syntax requires that the fields you are using to join the files are real fieldsdeclared in the Master File. This join may be a simple one based on one field in each file to bejoined, or a multi-field join for data sources that support this type of behavior. The followingsyntax describes the simple and multi-field variations:
JOIN [LEFT_OUTER|RIGHT_OUTER|INNER] hfld1 [AND hfld2 ...] IN hostfile [TAG tag1] TO [UNIQUE|MULTIPLE] crfield [AND crfld2 ...] IN crfile [TAG tag2] [AS joinname]END
where:
JOIN hfld1Is the name of a field in the host file containing values shared with a field in the cross-referenced file. This field is called the host field.
Creating an Equijoin
1084
AND hfld2...Can be an additional field in the host file, with the caveats noted below. The phrasebeginning with AND is required when specifying multiple fields.
For adapters that support multi-field and concatenated joins, and FOCUS or XFOCUSdata sources when SET NFOC=ON (the default), you can specify up to 128 fields. Seeyour data adapter documentation for specific information about supported join featuresfor each adapter.
When you are joining two FOCUS data sources, and SET NFOC=OFF, you can specify upto four alphanumeric fields in the host file that, if concatenated, contain values sharedwith the cross-referenced file. You may not specify more than one field in the cross-referenced file when the suffix of the file is FOC. For example, assume the cross-referenced file contains a phone number field with an area code-prefix-exchange format.The host file has an area code field, a prefix field, and an exchange field. You canspecify these three fields to join them to the phone number field in the cross-referenced file. The JOIN command treats the three fields as one. Other data sourcesdo not have this restriction on the cross-referenced file.
INNER
Specifies an inner join. If you do not specify the type of join in the JOIN command, theALL parameter setting determines the type of join to perform.
LEFT_OUTER
Specifies a left outer join. If you do not specify the type of join in the JOIN command,the ALL parameter setting determines the type of join to perform.
Note that in a left outer join, host records with a missing cross-referenced instance areincluded in the report output. To control how tests against missing cross-referencedsegment instances are processed, use the SET SHORTPATH command described in Handling Records With Missing Field Values on page 1037.
RIGHT_OUTER
Specifies a right outer join. This option is available for relational data sources thatsupport this type of join. Using this option requires that you issue the SETSHORTPATH = SQL command.
Note that in a right outer join, cross-referenced records with a missing host instance areincluded in the report output.
IN hostfileIs the name of the host file.
TAG tag1Is a tag name of up to 66 characters (usually the name of the Master File), which isused as a unique qualifier for fields and aliases in the host file.
14. Joining Data Sources
Creating Reports With TIBCO® WebFOCUS Language 1085

The tag name for the host file must be the same in all the JOIN commands of a joinedstructure.
TO [UNIQUE|MULTIPLE] crfld1Is the name of a field in the cross-referenced file containing values that match thoseof hfld1 (or of concatenated host fields). This field is called the cross-referenced field.
Note: Unique returns only one instance and, if there is no matching instance in the cross-referenced file, it supplies default values (blank for alphanumeric fields and zero fornumeric fields).
Use the MULTIPLE parameter when crfld1 may have multiple instances in common withone value in hfld1. Note that ALL is a synonym for MULTIPLE, and omitting this parameterentirely is a synonym for UNIQUE. See Unique and Non-Unique Joined Structures on page1074 for more information.
AND crfld2...Is the name of a field in the cross-referenced file with values in common with hfld2.
Note: crfld2 may be qualified. This field is only available for data adapters that supportmulti-field joins.
IN crfileIs the name of the cross-referenced file.
TAG tag2Is a tag name of up to 66 characters (usually the name of the Master File), which isused as a unique qualifier for fields and aliases in cross-referenced files. In arecursive join structure, if no tag name is provided, all field names and aliases areprefixed with the first four characters of the join name. For related information, see Usage Notes for Recursive Joined Structures on page 1079.
The tag name for the host file must be the same in all the JOIN commands of a joinedstructure.
AS joinnameIs an optional name of up to eight characters that you may assign to the joinstructure. You must assign a unique name to a join structure if:
You want to ensure that a subsequent JOIN command does not overwrite it.
You want to clear it selectively later.
The structure is recursive. See Recursive Joined Structures on page 1078.
Note: If you do not assign a name to the join structure with the AS phrase, the name isassumed to be blank. A join without a name overwrites an existing join without a name.
Creating an Equijoin
1086

END
Required when the JOIN command is longer than one line. It terminates the command.It must be on a line by itself.
Example: Creating a Simple Unique Joined Structure
An example of a simple unique join is shown below:
JOIN JOBCODE IN EMPLOYEE TO JOBCODE IN JOBFILE AS JJOIN
Example: Creating an Inner Join
The following procedure creates three FOCUS data sources:
EMPINFO, which contains the fields EMP_ID, LAST_NAME, FIRST_NAME, andCURR_JOBCODE from the EMPINFO segment of the EMPLOYEE data source.
JOBINFO, which contains the JOBCODE and JOB_DESC fields from the JOBFILE data source.
EDINFO, which contains the EMP_ID, COURSE_CODE, and COURSE_NAME fields from theEDUCFILE data source.
14. Joining Data Sources
Creating Reports With TIBCO® WebFOCUS Language 1087

The procedure then adds an employee to EMPINFO named Fred Newman who has no matchingrecord in the JOBINFO or EDINFO data sources.
TABLE FILE EMPLOYEESUM LAST_NAME FIRST_NAME CURR_JOBCODEBY EMP_IDON TABLE HOLD AS EMPINFO FORMAT FOCUS INDEX EMP_ID CURR_JOBCODEEND-RUN TABLE FILE JOBFILESUM JOB_DESCBY JOBCODEON TABLE HOLD AS JOBINFO FORMAT FOCUS INDEX JOBCODEEND-RUN TABLE FILE EDUCFILESUM COURSE_CODE COURSE_NAMEBY EMP_IDON TABLE HOLD AS EDINFO FORMAT FOCUS INDEX EMP_IDEND-RUN MODIFY FILE EMPINFOFREEFORM EMP_ID LAST_NAME FIRST_NAME CURR_JOBCODEMATCH EMP_IDON NOMATCH INCLUDEON MATCH REJECTDATA111111111, NEWMAN, FRED, C07,$END
The following request prints the contents of EMPINFO. Note that Fred Newman has been addedto the data source:
TABLE FILE EMPINFOPRINT *END
Creating an Equijoin
1088

The output is:
EMP_ID LAST_NAME FIRST_NAME CURR_JOBCODE------ --------- ---------- ------------071382660 STEVENS ALFRED A07112847612 SMITH MARY B14117593129 JONES DIANE B03119265415 SMITH RICHARD A01119329144 BANNING JOHN A17123764317 IRVING JOAN A15126724188 ROMANS ANTHONY B04219984371 MCCOY JOHN B02326179357 BLACKWOOD ROSEMARIE B04451123478 MCKNIGHT ROGER B02543729165 GREENSPAN MARY A07818692173 CROSS BARBARA A17111111111 NEWMAN FRED C07
The following JOIN command creates an inner join between the EMPINFO data source and theJOBINFO data source.
JOIN CLEAR *JOIN INNER CURR_JOBCODE IN EMPINFO TO MULTIPLE JOBCODE IN JOBINFO AS J0
Note that the JOIN command specifies a multiple join. In a unique join, the cross-referencedsegment is never considered missing, and all records from the host file display on the reportoutput. Default values (blank for alphanumeric fields and zero for numeric fields) display if noactual data exists.
The following request displays fields from the joined structure:
TABLE FILE EMPINFOPRINT LAST_NAME FIRST_NAME JOB_DESCEND
Fred Newman is omitted from the report output because his job code does not have a match inthe JOBINFO data source:
LAST_NAME FIRST_NAME JOB_DESC--------- ---------- --------STEVENS ALFRED SECRETARYSMITH MARY FILE QUALITYJONES DIANE PROGRAMMER ANALYSTSMITH RICHARD PRODUCTION CLERKBANNING JOHN DEPARTMENT MANAGERIRVING JOAN ASSIST.MANAGERROMANS ANTHONY SYSTEMS ANALYSTMCCOY JOHN PROGRAMMERBLACKWOOD ROSEMARIE SYSTEMS ANALYSTMCKNIGHT ROGER PROGRAMMERGREENSPAN MARY SECRETARYCROSS BARBARA DEPARTMENT MANAGER
14. Joining Data Sources
Creating Reports With TIBCO® WebFOCUS Language 1089

Example: Creating a Left Outer Join
The following JOIN command creates a left outer join between the EMPINFO data source andthe EDINFO data source:
JOIN CLEAR *JOIN LEFT_OUTER EMP_ID IN EMPINFO TO MULTIPLE EMP_ID IN EDINFO AS J1
The following request displays fields from the joined structure:
TABLE FILE EMPINFOPRINT LAST_NAME FIRST_NAME COURSE_NAMEEND
All employee records display on the report output. The records for those employees with nomatching records in the EDINFO data source display the missing data character (.) in theCOURSE_NAME column. If the join were unique, blanks would display instead of the missingdata character.
LAST_NAME FIRST_NAME COURSE_NAME--------- ---------- -----------STEVENS ALFRED FILE DESCRPT & MAINTSMITH MARY BASIC REPORT PREP FOR PROGJONES DIANE FOCUS INTERNALSSMITH RICHARD BASIC RPT NON-DP MGRSBANNING JOHN .IRVING JOAN .ROMANS ANTHONY .MCCOY JOHN .BLACKWOOD ROSEMARIE DECISION SUPPORT WORKSHOPMCKNIGHT ROGER FILE DESCRPT & MAINTGREENSPAN MARY .CROSS BARBARA HOST LANGUAGE INTERFACENEWMAN FRED .
Example: Creating a Right Outer Join
The following requests generate two Microsoft SQL Server tables to join, and then issues arequest against the join.
The following request generates the WF_SALES table. The field ID_PRODUCT will be used inthe right outer join command.
TABLE FILE WF_RETAIL_LITESUM GROSS_PROFIT_US PRODUCT_CATEGORY PRODUCT_SUBCATEGBY ID_PRODUCTWHERE ID_PRODUCT FROM 2150 TO 4000ON TABLE HOLD AS WF_SALES FORMAT SQLMSSEND
Creating an Equijoin
1090

The following request generates the WF_PRODUCT table. The field ID_PRODUCT will be used inthe right outer join command.
TABLE FILE WF_RETAIL_LITESUM PRICE_DOLLARS PRODUCT_CATEGORY PRODUCT_SUBCATEG PRODUCT_NAMEBY ID_PRODUCTWHERE ID_PRODUCT FROM 3000 TO 5000ON TABLE HOLD AS WF_PRODUCT FORMAT SQLMSSEND
The following request issues the SET SHORTPATH=SQL and JOIN commands and displaysvalues from the joined tables:
SET SHORTPATH = SQLJOIN RIGHT_OUTER ID_PRODUCT IN WF_PRODUCT TAG T1 TO ALL ID_PRODUCT INWF_SALES TAG T2ENDTABLE FILE WF_PRODUCTPRINT T1.ID_PRODUCT AS 'Product ID'PRICE_DOLLARS AS PriceT2.ID_PRODUCT AS 'Sales ID'GROSS_PROFIT_USBY T1.ID_PRODUCT NOPRINTON TABLE SET PAGE NOPAGEON TABLE SET STYLE *GRID=OFF,$ENDSTYLEEND
You can generate a trace that shows the resulting SQL by adding the following commands.
SET TRACEUSER=ONSET TRACESTAMP=OFFSET TRACEOFF=ALLSET TRACEON = STMTRACE//CLIENT
The trace shows that the request was optimized as a right outer join to the RDBMS.
SELECT T1."ID_PRODUCT", T1."PRICE_DOLLARS", T2."ID_PRODUCT", T2."GROSS_PROFIT_US" FROM ( WF_PRODUCT T1 RIGHT OUTER JOIN WF_SALES T2 ON T2."ID_PRODUCT" = T1."ID_PRODUCT" ) ORDER BY T1."ID_PRODUCT";
14. Joining Data Sources
Creating Reports With TIBCO® WebFOCUS Language 1091

The output, shown in the following image, has a row for each ID_PRODUCT value that is in theWF_PRODUCT table. The columns from WF_SALES rows that do not have a matchingID_PRODUCT value display the NODATA symbol.
Example: Creating Two Inner Joins With a Multipath Structure
The following JOIN commands create an inner join between the EMPINFO and JOBINFO datasources and an inner join between the EMPINFO and EDINFO data sources:
JOIN CLEAR *JOIN INNER CURR_JOBCODE IN EMPINFO TO MULTIPLE JOBCODE IN JOBINFO AS J0JOIN INNER EMP_ID IN EMPINFO TO MULTIPLE EMP_ID IN EDINFO AS J1
Creating an Equijoin
1092

The structure created by the two joins has two independent paths:
SEG01 01 S1***************EMP_ID **I*CURR_JOBCODE**I*LAST_NAME ***FIRST_NAME *** ***************** ************** I +-----------------+ I I I SEG01 I SEG01 02 I KM 03 I KM.............. ..............:EMP_ID ::K :JOBCODE ::K:COURSE_CODE :: :JOB_DESC :::COURSE_NAME :: : ::: :: : ::: :: : :::............:: :............:: .............: .............: JOINED EDINFO JOINED JOBINFO
The following request displays fields from the joined structure:
SET MULTIPATH=SIMPLETABLE FILE EMPINFOPRINT LAST_NAME FIRST_NAME IN 12 COURSE_NAME JOB_DESCEND
With MULTIPATH=SIMPLE, the independent paths create independent joins. All employeerecords accepted by either join display on the report output. Only Fred Newman (who has nomatching record in either of the cross-referenced files) is omitted:
LAST_NAME FIRST_NAME COURSE_NAME JOB_DESC--------- ---------- ----------- --------STEVENS ALFRED FILE DESCRPT & MAINT SECRETARYSMITH MARY BASIC REPORT PREP FOR PROG FILE QUALITYJONES DIANE FOCUS INTERNALS PROGRAMMER ANALYSTSMITH RICHARD BASIC RPT NON-DP MGRS PRODUCTION CLERKBANNING JOHN . DEPARTMENT MANAGERIRVING JOAN . ASSIST.MANAGERROMANS ANTHONY . SYSTEMS ANALYSTMCCOY JOHN . PROGRAMMERBLACKWOOD ROSEMARIE DECISION SUPPORT WORKSHOP SYSTEMS ANALYSTMCKNIGHT ROGER FILE DESCRPT & MAINT PROGRAMMERGREENSPAN MARY . SECRETARYCROSS BARBARA HOST LANGUAGE INTERFACE DEPARTMENT MANAGER
14. Joining Data Sources
Creating Reports With TIBCO® WebFOCUS Language 1093

With MULTIPATH=COMPOUND, only employees with matching records in both of the cross-referenced files display on the report output:
LAST_NAME FIRST_NAME COURSE_NAME JOB_DESC--------- ---------- ----------- --------STEVENS ALFRED FILE DESCRPT & MAINT SECRETARYSMITH MARY BASIC REPORT PREP FOR PROG FILE QUALITYJONES DIANE FOCUS INTERNALS PROGRAMMER ANALYSTSMITH RICHARD BASIC RPT NON-DP MGRS PRODUCTION CLERKBLACKWOOD ROSEMARIE DECISION SUPPORT WORKSHOP SYSTEMS ANALYSTMCKNIGHT ROGER FILE DESCRPT & MAINT PROGRAMMERCROSS BARBARA HOST LANGUAGE INTERFACE DEPARTMENT MANAGER
Reference: Requirements for Cross-Referenced Fields in an Equijoin
The cross-referenced fields used in a JOIN must have the following characteristics in specificdata sources:
In relational data sources and in a CA-DATACOM/DB data source, the cross-referenced fieldcan be any field.
In FOCUS and XFOCUS data sources, the cross-referenced field must be indexed. Indexedfields have the attribute FIELDTYPE=I or INDEX=I or INDEX=ON in the Master File. If thecross-referenced field does not have this attribute, append the attribute to the fielddeclaration in the Master File and rebuild the file using the REBUILD utility with the INDEXoption. This adds an index to your FOCUS or XFOCUS data source.
Note: The indexed fields can be external. See the Describing Data With TIBCO WebFOCUS®
Language manual for more information about indexed fields and the Rebuild tool.
In IMS data sources, the cross-referenced field must be a key field in the root segment. Itcan be a primary or secondary index.
In fixed format or delimited sequential files, any field can be a cross-referenced field.However, both the host and cross-referenced file must be retrieved in ascending order onthe named (key) fields, if the command ENGINE INT CACHE SET OFF is in effect. In thissituation, if the data is not in the same sort order, errors are displayed and a many-to-manyjoin is not supported. However, if ENGINE INT CACHE SET ON is in effect, the files do nothave to be in ascending order and a many-to-many join is supported. ON is the defaultvalue. A delimited file used as the cross-referenced file in the join must consist of only onesegment. If the join is based on multiple fields, a fixed format sequential file must consistof a single segment. If the cross-referenced fixed format sequential file contains only onesegment, the host file must have a segment declaration.
Creating an Equijoin
1094

Reference: Restrictions on Group Fields
When group fields are used in a joined structure, the group in the host file and the group in thecross-referenced file must have the same number of elements:
In ISAM data sources, the field must be the full primary key if you issue a unique join, or aninitial subset of the primary key if you issue a non-unique join. In the Master File, theprimary key is described by a key GROUP; the initial subset is the first field in that group.
In VSAM KSDS data sources, the field must be the full primary or alternate key if you issuea unique join, or an initial subset of the primary or alternate key if you issue a non-uniquejoin. In the Master File, the primary key is described by a key GROUP. The initial subset isthe first field in that group.
In VSAM ESDS data sources, the field can be any field, as long as the file is already sortedon that field.
In Model 204 data sources, the field must be a key field. In the Access File, the types ofkey fields are alphanumeric (KEY), ordered character (ORA), ordered numeric (ORN),numeric range (RNG), invisible (IVK), and invisible range (IVR).
In ADABAS data sources, the field must be a descriptor field, a superdescriptor definedwith the .SPR or .NOP field name suffix, or a subdescriptor defined with the .NOP fieldname suffix. The field description in the Master File must contain the attributeFIELDTYPE=I.
In the Access File, the cross-referenced segment must specify ACCESS=ADBS and eitherCALLTYPE=FIND or CALLTYPE=RL. If CALLTYPE=RL, the host field can be joined to the high-order portion of a descriptor, superdescriptor, or subdescriptor, if the high-order portion islonger than the host field.
In CA-IDMS/DB data sources, the field must be an indexed field on a network recordidentified by the attribute FIELDTYPE=I in the Master File, a CA-IDMS/DB CALC field on anetwork record identified by the CLCFLD phrase in the Access File, or any field on an LRF orASF record.
For a partial key join using fixed format or delimited sequential files, the setting ENGINE INTCACHE SET OFF must be in effect.
Reference: Usage Notes for Inner and Outer JOIN Command Syntax
The SET ALL and SET CARTESIAN commands are ignored by the syntax.
The ALL. parameter is not supported. If the ALL. parameter is used, the following messagedisplays:
14. Joining Data Sources
Creating Reports With TIBCO® WebFOCUS Language 1095
(FOC32452) Use of ALL. with LEFT_OUTER/INNER not allowed
If you define multiple joins, the resulting structure can be a single path or multi-path datasource.
If the setting MULTIPATH=SIMPLE is in effect and the report is based on multiple paths,each of the individual joins is constructed separately without regard to the other joins,and the matching records from each of the separate paths displays on the reportoutput. Therefore, the output can contain records that would have been omitted if onlyone of the joins was in effect.
If the setting MULTIPATH=COMPOUND is in effect with a multi-path report, or if thereport displays data only from a single path, the report output displays only thoserecords that satisfy all of the joins.
Joining From a Virtual Field to a Real Field Using an Equijoin
You can use DEFINE-based JOIN syntax to create a virtual host field that you can join to a realcross-referenced field. The DEFINE expression that creates the virtual host field may containonly fields in the host file and constants. (It may not contain fields in the cross-referenced file.)You can do more than one join from a virtual field.
You can create the virtual host field in a separate DEFINE command or in a Master File. Forinformation on Master Files, see the Describing Data With TIBCO WebFOCUS® Languagemanual.
The same report request can use JOIN-based virtual fields, and virtual fields unrelated to thejoin.
Note that if you are creating a virtual field in a DEFINE command, you must issue the DEFINEafter the JOIN command, but before the TABLE request since a JOIN command clears all fieldscreated by DEFINE commands for the host file and the joined structure. Virtual fields defined inMaster Files are not cleared.
Tip: If a DEFINE command precedes the JOIN command, you can set KEEPDEFINES ON or ALLto reinstate virtual fields during the parsing of a subsequent JOIN command. For moreinformation, see Preserving Virtual Fields Using KEEPDEFINES on page 1146.
Creating an Equijoin
1096
Syntax: How to Join From a Virtual Field to a Real Field
The DEFINE-based JOIN command enables you to join a virtual field in the host file to a realfield in the cross-referenced file. The syntax is:
JOIN [LEFT_OUTER|RIGHT_OUTER|INNER] deffld WITH host_field ... IN hostfile [TAG tag1] TO [UNIQUE|MULTIPLE] cr_field IN crfile [TAG tag2] [AS joinname]END
where:
JOIN deffld Is the name of a virtual field for the host file (the host field). The virtual field can bedefined in the Master File or with a DEFINE command. For related information, see Notes on Using Virtual Fields With Joined Data Sources on page 1099.
WITH host_field
Is the name of any real field in the host segment with which you want to associate thevirtual field. This association is required to locate the virtual field.
Note: The WITH field referenced in the JOIN command must be in the same segment asthe WITH field referenced in the DEFINE that creates the virtual field or no output will beproduced.
The WITH phrase is required unless the KEEPDEFINES parameter is set to ON or ALL anddeffld was defined prior to issuing the JOIN command.
To determine which segment contains the virtual field, use the ? DEFINE query afterissuing the DEFINE command. See the TIBCO WebFOCUS® Developing ReportingApplications manual for details about Query commands.
INNER
Specifies an inner join. If you do not specify the type of join in the JOIN command, theALL parameter setting determines the type of join to perform.
LEFT_OUTER
Specifies a left outer join. If you do not specify the type of join in the JOIN command,the ALL parameter setting determines the type of join to perform.
RIGHT_OUTER
Specifies a right outer join. This option is available for relational data sources thatsupport this type of join. The SET SHORTPATH = SQL command must be in effect inorder to issue a right outer join.
IN hostfileIs the name of the host file.
14. Joining Data Sources
Creating Reports With TIBCO® WebFOCUS Language 1097
TAG tag1Is a tag name of up to 66 characters (usually the name of the Master File), which isused as a unique qualifier for fields and aliases in host files.
The tag name for the host file must be the same in all JOIN commands of a joinedstructure.
TO [UNIQUE|MULTIPLE] crfld1Is the name of a real field in the cross-referenced data source whose values matchthose of the virtual field. This must be a real field declared in the Master File.
Note: UNIQUE returns only one instance and, if there is no matching instance in the cross-referenced file, it supplies default values (blank for alphanumeric fields and zero fornumeric fields).
Use the MULTIPLE parameter when crfld1 may have multiple instances in common withone value in hfld1. Note that ALL is a synonym for MULTIPLE, and omitting this parameterentirely is a synonym for UNIQUE. See Unique and Non-Unique Joined Structures on page1074 for more information.
IN crfileIs the name of the cross-referenced file.
TAG tag2Is a tag name of up to 66 characters (usually the name of the Master File), which isused as a unique qualifier for fields and aliases in cross-referenced files. In arecursive joined structure, if no tag name is provided, all field names and aliases areprefixed with the first four characters of the join name. For related information, see Unique and Non-Unique Joined Structures on page 1074.
The tag name for the host file must be the same in all JOIN commands of a joinedstructure.
AS joinnameIs an optional name of up to eight characters that you may assign to the joinedstructure. You must assign a unique name to a join structure if:
You want to ensure that a subsequent JOIN command does not overwrite it.
You want to clear it selectively later.
The structure is recursive, and you do not specify tag names. See Recursive JoinedStructures on page 1078.
If you do not assign a name to the joined structure with the AS phrase, the name isassumed to be blank. A join without a name overwrites an existing join without a name.
Creating an Equijoin
1098

END
Required when the JOIN command is longer than one line. It terminates the command.It must be on a line by itself.
Reference: Notes on Using Virtual Fields With Joined Data Sources
Requests reading joined data sources can contain virtual fields that are defined either:
In the Master File of the host data source.
In a DEFINE command, in which the syntax
DEFINE FILE hostfile
identifies the host data source in the joined structure.
Note: The expression defining the host field for the join can use only host fields andconstants.
All other virtual fields can contain real fields from the host file and the cross-referenced file.
Tip: Since issuing the JOIN command clears all DEFINE commands for the host file and thejoined structure, you must issue the DEFINE command after the JOIN or turn KEEPDEFINESON or ALL to preserve the virtual fields. For more information, see Preserving Virtual FieldsDuring Join Parsing on page 1145.
Example: Creating a Virtual Host Field for a Joined Structure
Suppose that a retail chain sends four store managers to attend classes. Each person,identified by an ID number, manages a store in a different city. The stores and the cities inwhich they are located are contained in the SALES data source. The manager IDs, the classes,and dates the managers attended are contained in the EDUCFILE data source.
The following procedure lists the courses that the managers attended, identifying themanagers by the cities in which they work. Note the three elements in the procedure:
The JOIN command joins the SALES data source to the EDUCFILE data source, based onthe values common to the ID_NUM field (which contains manager IDs) in SALES and theEMP_ID field in EDUCFILE. Note that the ID_NUM field does not exist yet and will becreated by the DEFINE command.
The DEFINE command creates the ID_NUM field, assigning to it the IDs of the managersworking in the four cities.
The TABLE command produces the report.
14. Joining Data Sources
Creating Reports With TIBCO® WebFOCUS Language 1099

The procedure is:
JOIN ID_NUM WITH CITY IN SALES TO ALL EMP_ID IN EDUCFILE AS SALEDUC
DEFINE FILE SALESID_NUM/A9 = DECODE CITY ('NEW YORK' 451123478 'NEWARK' 119265415 'STAMFORD' 818692173 'UNIONDALE' 112847612);END
TABLE FILE SALESPRINT DATE_ATTEND BY CITY BY COURSE_NAMEEND
The output is:
CITY COURSE_NAME DATE_ATTEND---- ----------- -----------NEW YORK FILE DESCRPT & MAINT 81/11/15NEWARK BASIC RPT NON-DP MGRS 82/08/24STAMFORD BASIC REPORT PREP DP MGRS 82/08/02 HOST LANGUAGE INTERFACE 82/10/21UNIONDALE BASIC REPORT PREP FOR PROG 81/11/16 FILE DESCRPT & MAINT 81/11/15
Join Modes in an Equijoin
The JOIN_LENGTH_MODE (JOINLM) parameter controls processing of equality joined field pairsfor record-based non-SQL Adapters, such as DFIX, VSAM, and FIX. This setting controlsprocessing when two alphanumeric fields of different lengths or two numeric fields of differentdata types and precisions are joined.
For SQL data sources, joins are normally either optimized (sent to the SQL engine forprocessing) or managed to comply with SQL processing rules.
There are two supported modes of handling compatible, but not identical, joined fields:
SQL compliance mode. The JOIN command processor assures strict value equality ofjoined fields. Detected truncation of significant characters during host to cross-referencedconversion generates atarget not found condition, in which case the join is not done. If ashorter host field is joined to a longer cross-referenced file, the shorter host field value isextended to the length of the cross-referenced field with non-significant characters,according to the data type, and the join is processed.
FOCUS reporting mode. The JOIN command processor assures partial value equality ofjoined fields.
When joining a shorter to a longer field, a search range is created to find all cross-referenced values that are prefixed with the host value.
Creating an Equijoin
1100

When joining a longer to a shorter field, the host value is unconditionally truncated tothe cross referenced field length. If the truncation removes non-blank characters, thematch will not be done and the comparison will fail, rejecting the records.
Syntax: How to Control the Join Mode for Record-Based Data Sources
SET JOIN_LENGTH_MODE|JOINLM} = {SQL|RANGE}
where:
SQL
Sets SQL compliant mode. which assures strict equality between host and cross-referenced field values. This is the default value.
RANGE
Sets FOCUS reporting mode, which supports partial key joins.
Data Formats of Shared Fields
Generally, the fields containing the shared values in the host and cross-referenced files musthave the same data formats.
If you specify multiple host file fields, the JOIN command treats the fields as one concatenatedfield. Add the field format lengths to obtain the length of the concatenated field. You mustobserve the following rules:
If the host field is alphanumeric, the cross-referenced field must also be alphanumeric andhave the same length.
The formats may have different edit options.
Note that a text field cannot be used to join data sources.
If the host field is a numeric field, the host field format, as specified by the USAGE (orFORMAT) attribute in the Master File, must agree in type (I, P, F, or D) with the format of thecross-referenced field as specified by the USAGE (or FORMAT) attribute. For details, see Joining Fields With Different Numeric Data Types on page 1102.
14. Joining Data Sources
Creating Reports With TIBCO® WebFOCUS Language 1101

The edit options may differ. The length may also differ, but with the following effect:
If the format of the host field (as specified by the USAGE attribute) is packed decimal(P) or integer (I) and is longer than the cross-referenced field format (specified by theUSAGE attribute for FOCUS data sources or the ACTUAL attribute for other datasources), only the length of the cross-referenced field format is compared, using onlythe right-most digits of the shorter field. For example, if a five-digit packed decimalformat field is joined to a three-digit packed decimal format field, when a host recordwith a five-digit number is retrieved, all cross-referenced records with the last threedigits of that number are also retrieved.
If the format of the host field is double precision (D), the left-most eight bytes of eachfield are compared.
If the host field is a date field, the cross-referenced field must also be a date field. Dateand date-time fields must have the same components, not necessarily in the same order.
The host and cross-referenced fields can be described as groups in the Master File if theycontain the same number of component fields. The corresponding component fields in eachgroup (for example, the first field in the host group and the first field in the cross-referencedgroup) must obey the above rules. For related information, see Restrictions on Group Fieldson page 1095.
If the host field is not a group field, the cross-referenced field can still be a group. If thehost field is a group, the cross-referenced field must also be a group.
Joining Fields With Different Numeric Data Types
You can join two or more data sources containing different numeric data types. For example,you can join a field with a short packed decimal format to a field with a long packed decimalformat, or a field with an integer format to a field with a packed decimal format. This providesenormous flexibility for creating reports from joined data sources.
When joining a shorter field to a longer field, the cross-referenced value is padded to thelength of the host field, adding spaces (for alpha fields) or hexadecimal zeros (for numericfields). This new value is used for searches in the cross-referenced file.
When joining a longer field to a shorter field, the FROM value is truncated. If part of yourvalue is truncated due to the length of the USAGE in the cross-referenced file, only recordsmatching the truncated value will be found in the cross-referenced file.
Note:
For comparison on packed decimal fields to be accomplished properly, all signs for positivevalues are converted to hex C and all signs for negative values are converted to hex D.
Creating an Equijoin
1102

The JOINOPT parameter also corrects for lagging values in a unique join. For information,see How to Correct for Lagging Values With a Unique Join on page 1076.
Syntax: How to Enable Joins With Data Type Conversion
To enable joins with data type conversion, issue the command
SET JOINOPT = [GNTINT|OLD]
where:
GNTINT
Enables joins with data type conversion.
OLD
Disables joins with data type conversion. This value is the default.
Example: Issuing Joins With Data Type Conversion
Since you can join a field with a short packed decimal format to a field with a long packeddecimal format, a join can be defined in the following Master Files:
FILE=PACKED,SUFFIX=FIX,$ SEGNAME=ONE,SEGTYPE=S0 FIELD=FIRST,,P8,P4,INDEX=I,$
FILE=PACKED2,SUFFIX=FIX,$ SEGNAME=ONE,SEGTYPE=S0 FIELD=PFIRST,,P31,P16,INDEX=I,$
The JOIN command might look like this:
JOIN FIRST IN PACKED TO ALL PFIRST IN PACKED2 AS J1
When joining packed fields, the preferred sign format of X'C' for positive values and X'D' fornegative values is still required. All other non-preferred signs are converted to either X'C' orX'D'.
Using a Conditional Join
Using conditional JOIN syntax, you can establish joins based on conditions other than equalitybetween fields. In addition, the host and cross-referenced join fields do not have to containmatching formats, and the cross-referenced field does not have to be indexed.
The conditional join is supported for FOCUS and for VSAM, ADABAS, IMS, IDMS, and allrelational data sources. Because each data source differs in its ability to handle complexWHERE criteria, the optimization of the conditional JOIN syntax differs depending on thespecific data sources involved in the join and the complexity of the WHERE criteria.
14. Joining Data Sources
Creating Reports With TIBCO® WebFOCUS Language 1103

The standard ? JOIN command lists every join currently in effect, and indicates any that arebased on WHERE criteria.
Syntax: How to Create a Conditional JOIN
The syntax of the conditional (WHERE-based) JOIN command is
JOIN [LEFT_OUTER|RIGHT_OUTER|INNER] FILE hostfile AT hfld1 [WITH hfld2] [TAG tag1] TO {UNIQUE|MULTIPLE} FILE crfile AT crfld [TAG tag2] [AS joinname] [WHERE expression1; [WHERE expression2; ...]END
where:
INNER
Specifies an inner join. If you do not specify the type of join in the JOIN command, the ALLparameter setting determines the type of join to perform.
LEFT_OUTER
Specifies a left outer join. If you do not specify the type of join in the JOIN command, theALL parameter setting determines the type of join to perform.
RIGHT_OUTER
Specifies a right outer join. The command SET SHORTPATH = SQL must be in effect.
hostfile
Is the host Master File.
AT
Links the correct parent segment or host to the correct child or cross-referenced segment.The field values used as the AT parameter are not used to cause the link. They are simplyused as segment references.
hfld1
Is a field name in the host Master File whose segment will be joined to the cross-referenced data source. The field name must be at the lowest level segment in its datasource that is referenced.
tag1
Is the optional tag name of up to 66 characters that is used as a unique qualifier for fieldsand aliases in the host data source.
Using a Conditional Join
1104
hfld2
Is a data source field with which to associate a DEFINE-based conditional JOIN. For aDEFINE-based conditional join, the KEEPDEFINES setting must be ON or ALL, and you mustcreate the virtual fields before issuing the JOIN command.
MULTIPLE
Specifies a one-to-many relationship between hostfile and crfile. Note that ALL is asynonym for MULTIPLE.
UNIQUE
Specifies a one-to-one relationship between hostfile and crfile. Note that ONE is a synonymfor UNIQUE.
Note: Regardless of the character of the JOIN—INNER or LEFT_OUTER—the join to UNIQUEwill return only one instance of the cross-referenced file, and if this instance does notmatch based on the evaluation of the WHERE expression, default values (spaces foralphanumeric fields and 0 for numerical fields) are returned. There are never short pathsor missing values in the cross-referenced file.
crfile
Is the cross-referenced Master File.
crfld
Is a field name in the cross-referenced Master File. It can be any field in the segment.
tag2
Is the optional tag name of up to 66 characters that is used as a unique qualifier for fieldsand aliases in the cross-referenced data source.
joinname
Is the name associated with the joined structure.
expression1, expression2
Are any expressions that are acceptable in a DEFINE FILE command. All fields used in theexpressions must lie on a single path.
You must include the connection between the tables in the WHERE conditions. The ATreferences do not actually perform a JOIN between the fields as with a standard JOIN.
If you do not include any WHERE conditions in the join, a cartesian product is generated.
END
The END command is required to terminate the command and must be on a line by itself.
14. Joining Data Sources
Creating Reports With TIBCO® WebFOCUS Language 1105

Note: Single line JOIN syntax is not supported.
Example: Using a Conditional Join
The following example joins the VIDEOTRK and MOVIES data sources on the conditions that:
The transaction date (in VIDEOTRK) is more than ten years after the release date (inMOVIES).
The movie codes match in both data sources.
The join is performed at the segment that contains MOVIECODE in the VIDEOTRK data source,because the join must occur at the lowest segment referenced.
The following request displays the title, most recent transaction date, and release date foreach movie in the join, and computes the number of years between this transaction date andthe release date:
JOIN FILE VIDEOTRK AT MOVIECODE TAG V1 TO ALL FILE MOVIES AT RELDATE TAG M1 AS JW1 WHERE DATEDIF(RELDATE, TRANSDATE,'Y') GT 10; WHERE V1.MOVIECODE EQ M1.MOVIECODE;ENDTABLE FILE VIDEOTRK SUM TITLE/A25 AS 'Title' TRANSDATE AS 'Last,Transaction' RELDATE AS 'Release,Date' COMPUTE YEARS/I5 = (TRANSDATE - RELDATE)/365; AS 'Years,Difference' BY TITLE NOPRINT BY HIGHEST 1 TRANSDATE NOPRINTEND
Using a Conditional Join
1106

The output is:
Last Release YearsTitle Transaction Date Difference----- ----------- ------- ----------ALICE IN WONDERLAND 91/06/22 51/07/21 39ALIEN 91/06/18 80/04/04 11ALL THAT JAZZ 91/06/25 80/05/11 11ANNIE HALL 91/06/24 78/04/16 13BAMBI 91/06/22 42/07/03 49BIRDS, THE 91/06/23 63/09/27 27CABARET 91/06/25 73/07/14 17CASABLANCA 91/06/27 42/03/28 49CITIZEN KANE 91/06/22 41/08/11 49CYRANO DE BERGERAC 91/06/20 50/11/09 40DEATH IN VENICE 91/06/26 73/07/27 17DOG DAY AFTERNOON 91/06/23 76/04/04 15EAST OF EDEN 91/06/20 55/01/12 36GONE WITH THE WIND 91/06/24 39/06/04 52JAWS 91/06/27 78/05/13 13MALTESE FALCON, THE 91/06/19 41/11/14 49MARTY 91/06/19 55/10/26 35NORTH BY NORTHWEST 91/06/21 59/02/09 32ON THE WATERFRONT 91/06/24 54/07/06 36PHILADELPHIA STORY, THE 91/06/21 40/05/06 51PSYCHO 91/06/17 60/05/16 31REAR WINDOW 91/06/17 54/12/15 36SHAGGY DOG, THE 91/06/25 59/01/09 32SLEEPING BEAUTY 91/06/24 75/08/30 15TIN DRUM, THE 91/06/17 80/03/01 11VERTIGO 91/06/27 58/11/25 32
Full Outer Joins
The WebFOCUS join command and conditional join command have a FULL OUTER join option.
A full outer join returns all rows from the source data source and all rows from the target datasource. Where values do not exist for the rows in either data source, null values are returned.WebFOCUS substitutes default values on the report output (blanks for alphanumeric columns,the NODATA symbol for numeric columns).
Full outer joins and right outer joins are supported whether or not the underlying data sourcesupports them. When the underlying data source has support for these joins, the joinprocessing is passed to the database engine. When it does not support them, all necessarydata is returned and the join processing is handled by WebFOCUS.
Note: The command SET SHORTPATH = SQL must be in effect in order to issue a full outerjoin.
Syntax: How to Specify a Full Outer Join
The following syntax generates a full outer equijoin based on real fields:
14. Joining Data Sources
Creating Reports With TIBCO® WebFOCUS Language 1107
JOIN FULL_OUTER hfld1 [AND hfld2 ...] IN table1 [TAG tag1] TO {UNIQUE|MULTIPLE} cfld [AND cfld2 ...] IN table2 [TAG tag2] [AS joinname]END
where:
hfld1
Is the name of a field in the host table containing values shared with a field in the cross-referenced table. This field is called the host field.
AND hfld2...
Can be an additional field in the host table. The phrase beginning with AND is requiredwhen specifying multiple fields.
For relational adapters that support multi-field and concatenated joins, you can specifyup to 20 fields. See your adapter documentation for specific information aboutsupported join features.
IN table1
Is the name of the host table.
TAG tag1
Is a tag name of up to 66 characters (usually the name of the Master File), which is usedas a unique qualifier for fields and aliases in the host table.
The tag name for the host table must be the same in all the JOIN commands of a joinedstructure.
TO [UNIQUE|MULTIPLE] crfld1
Is the name of a field in the cross-referenced table containing values that match those ofhfld1 (or of concatenated host fields). This field is called the cross-referenced field.
Note: UNIQUE returns only one instance and, if there is no matching instance in the cross-referenced table, it returns null values.
Use the MULTIPLE parameter when crfld1 may have multiple instances in common withone value in hfld1. Note that ALL is a synonym for MULTIPLE, and omitting this parameterentirely is a synonym for UNIQUE.
AND crfld2...
Is the name of a field in the cross-referenced table with values in common with hfld2.
Note: crfld2 may be qualified. This field is only available for adapters that support multi-field joins.
Full Outer Joins
1108

IN crfile
Is the name of the cross-referenced table.
TAG tag2
Is a tag name of up to 66 characters (usually the name of the Master File), which is usedas a unique qualifier for fields and aliases in cross-referenced tables. In a recursive joinstructure, if no tag name is provided, all field names and aliases are prefixed with the firstfour characters of the join name.
The tag name for the host table must be the same in all the JOIN commands of a joinedstructure.
AS joinname
Is an optional name of up to eight characters that you may assign to the join structure.You must assign a unique name to a join structure if:
You want to ensure that a subsequent JOIN command does not overwrite it.
You want to clear it selectively later.
The structure is recursive.
Note: If you do not assign a name to the join structure with the AS phrase, the name isassumed to be blank. A join without a name overwrites an existing join without a name.
END
Required when the JOIN command is longer than one line. It terminates the command andmust be on a line by itself.
The following syntax generates a DEFINE-based full outer join:
JOIN FULL_OUTER deffld WITH host_field ... IN table1 [TAG tag1] TO [UNIQUE|MULTIPLE] cr_field IN table2 [TAG tag2] [AS joinname]END
where:
deffld
Is the name of a virtual field for the host file (the host field). The virtual field can bedefined in the Master File or with a DEFINE command.
WITH host_field
Is the name of any real field in the host segment with which you want to associate thevirtual field. This association is required to locate the virtual field.
14. Joining Data Sources
Creating Reports With TIBCO® WebFOCUS Language 1109

The WITH phrase is required unless the KEEPDEFINES parameter is set to ON or ALL anddeffld was defined prior to issuing the JOIN command.
To determine which segment contains the virtual field, use the ? DEFINE query afterissuing the DEFINE command.
IN table1
Is the name of the host table.
TAG tag1
Is a tag name of up to 66 characters (usually the name of the Master File), which is usedas a unique qualifier for fields and aliases in host tables.
The tag name for the host table must be the same in all JOIN commands of a joinedstructure.
TO [UNIQUE|MULTIPLE] crfld1
Is the name of a real field in the cross-referenced table whose values match those of thevirtual field. This must be a real field declared in the Master File.
Note: UNIQUE returns only one instance and, if there is no matching instance in the cross-referenced table, it returns null values.
Use the MULTIPLE parameter when crfld1 may have multiple instances in common withone value in hfld1. Note that ALL is a synonym for MULTIPLE, and omitting this parameterentirely is a synonym for UNIQUE.
IN crfile
Is the name of the cross-referenced table.
TAG tag2
Is a tag name of up to 66 characters (usually the name of the Master File), which is usedas a unique qualifier for fields and aliases in cross-referenced tables. In a recursive joinedstructure, if no tag name is provided, all field names and aliases are prefixed with the firstfour characters of the join name.
The tag name for the host file must be the same in all JOIN commands of a joinedstructure.
AS joinname
Is an optional name of up to eight characters that you may assign to the joined structure.You must assign a unique name to a join structure if:
You want to ensure that a subsequent JOIN command does not overwrite it.
Full Outer Joins
1110

You want to clear it selectively later.
The structure is recursive, and you do not specify tag names.
If you do not assign a name to the joined structure with the AS phrase, the name isassumed to be blank. A join without a name overwrites an existing join without a name.
END
Required when the JOIN command is longer than one line. It terminates the command andmust be on a line by itself.
The following syntax generates a full outer conditional join:
JOIN FULL_OUTER FILE table1 AT hfld1 [WITH hfld2] [TAG tag1] TO {UNIQUE|MULTIPLE} FILE table2 AT crfld [TAG tag2] [AS joinname] [WHERE expression1; [WHERE expression2; ...]END
where:
table1
Is the host Master File.
AT
Links the correct parent segment or host to the correct child or cross-referenced segment.The field values used as the AT parameter are not used to cause the link. They are usedas segment references.
hfld1
Is the field name in the host Master File whose segment will be joined to the cross-referenced table. The field name must be at the lowest level segment in its data sourcethat is referenced.
tag1
Is the optional tag name that is used as a unique qualifier for fields and aliases in thehost table.
hfld2
Is a table column with which to associate a DEFINE-based conditional JOIN. For a DEFINE-based conditional join, the KEEPDEFINES setting must be ON or ALL, and you must createthe virtual fields before issuing the JOIN command.
14. Joining Data Sources
Creating Reports With TIBCO® WebFOCUS Language 1111

MULTIPLE
Specifies a one-to-many relationship between table1 and table2. Note that ALL is asynonym for MULTIPLE.
UNIQUE
Specifies a one-to-one relationship between table1 and table2. Note that ONE is a synonymfor UNIQUE.
Note: The join to UNIQUE will return only one instance of the cross-referenced table, and ifthis instance does not match based on the evaluation of the WHERE expression, nullvalues are returned.
crfile
Is the cross-referenced Master File.
crfld
Is the join field name in the cross-referenced Master File. It can be any field in thesegment.
tag2
Is the optional tag name that is used as a unique qualifier for fields and aliases in thecross-referenced table.
joinname
Is the name associated with the joined structure.
expression1, expression2
Are any expressions that are acceptable in a DEFINE FILE command. All fields used in theexpressions must lie on a single path.
END
The END command is required to terminate the command and must be on a line by itself.
Example: Optimizing a Full Outer Join of Microsoft SQL Server Tables
The following requests generate two Microsoft SQL Server tables to join, and then issues arequest against the join. The tables are generated using the wf_retail sample that you cancreate using the WebFOCUS - Retail Demo tutorial in the server Web Console.
The following request generates the WF_SALES table. The field ID_PRODUCT will be used inthe full outer join command. The generated table will contain ID_PRODUCT values from 2150to 4000:
Full Outer Joins
1112

TABLE FILE WF_RETAIL_LITESUM GROSS_PROFIT_US PRODUCT_CATEGORY PRODUCT_SUBCATEGBY ID_PRODUCTWHERE ID_PRODUCT FROM 2150 TO 4000ON TABLE HOLD AS WF_SALES FORMAT SQLMSSEND
The following request generates the WF_PRODUCT table. The field ID_PRODUCT will be used inthe full outer join command. The generated table will contain ID_PRODUCT values from 3000to 5000:
TABLE FILE WF_RETAIL_LITESUM PRICE_DOLLARS PRODUCT_CATEGORY PRODUCT_SUBCATEG PRODUCT_NAMEBY ID_PRODUCTWHERE ID_PRODUCT FROM 3000 TO 5000ON TABLE HOLD AS WF_PRODUCT FORMAT SQLMSSEND
The following request issues the SET SHORTPATH = SQL and JOIN commands and displaysvalues from the joined tables:
SET SHORTPATH = SQLSET TRACEUSER=ONSET TRACESTAMP=OFFSET TRACEOFF=ALLSET TRACEON = STMTRACE//CLIENTJOIN FULL_OUTER ID_PRODUCT IN WF_PRODUCT TAG T1 TO ALL ID_PRODUCT IN WF_SALES TAG T2END TABLE FILE WF_PRODUCTPRINT T1.ID_PRODUCT AS 'Product ID' PRICE_DOLLARS AS PriceT2.ID_PRODUCT AS 'Sales ID' GROSS_PROFIT_USBY T1.ID_PRODUCT NOPRINTON TABLE SET PAGE NOPAGEON TABLE SET STYLE *GRID=OFF,$ENDSTYLEEND
14. Joining Data Sources
Creating Reports With TIBCO® WebFOCUS Language 1113

The trace shows that the full outer join was optimized (translated to SQL) so that SQL Servercould process the join:
SELECT T1."ID_PRODUCT", T1."PRICE_DOLLARS", T2."ID_PRODUCT", T2."GROSS_PROFIT_US" FROM ( WF_PRODUCT T1 FULL OUTER JOIN WF_SALES T2 ON T2."ID_PRODUCT" = T1."ID_PRODUCT" ) ORDER BY T1."ID_PRODUCT";
Full Outer Joins
1114
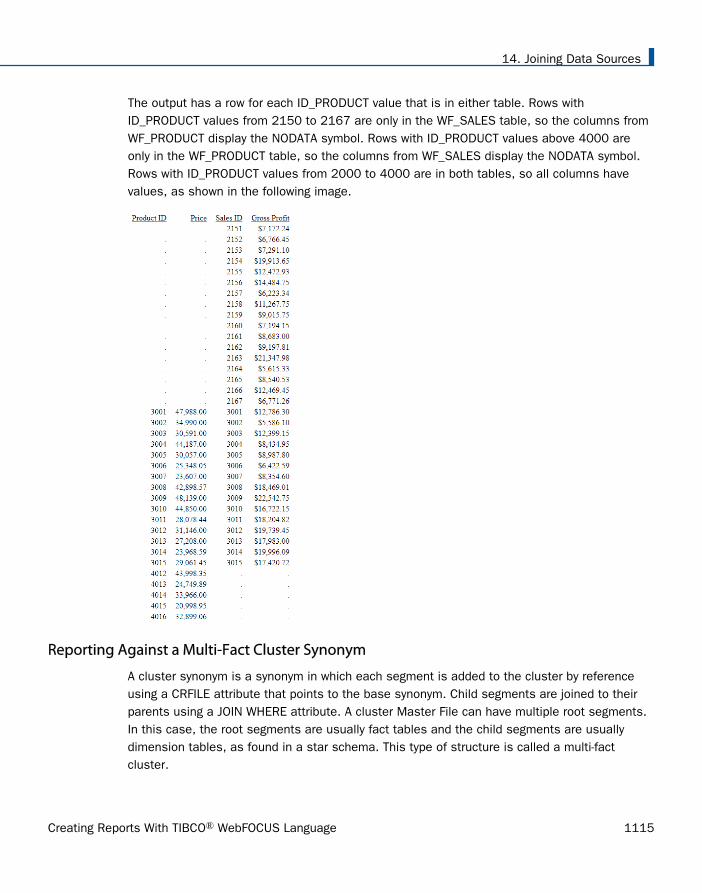
The output has a row for each ID_PRODUCT value that is in either table. Rows withID_PRODUCT values from 2150 to 2167 are only in the WF_SALES table, so the columns fromWF_PRODUCT display the NODATA symbol. Rows with ID_PRODUCT values above 4000 areonly in the WF_PRODUCT table, so the columns from WF_SALES display the NODATA symbol.Rows with ID_PRODUCT values from 2000 to 4000 are in both tables, so all columns havevalues, as shown in the following image.
Reporting Against a Multi-Fact Cluster Synonym
A cluster synonym is a synonym in which each segment is added to the cluster by referenceusing a CRFILE attribute that points to the base synonym. Child segments are joined to theirparents using a JOIN WHERE attribute. A cluster Master File can have multiple root segments.In this case, the root segments are usually fact tables and the child segments are usuallydimension tables, as found in a star schema. This type of structure is called a multi-factcluster.
14. Joining Data Sources
Creating Reports With TIBCO® WebFOCUS Language 1115

A dimension table can be a child of multiple fact tables (called a shared dimension) or be achild of a single fact table (called a non-shared dimension). In most cases, the fact tables areused for aggregation and the dimension tables are used for sorting.
The following image shows a simple multi-fact structure.
For information about creating a multi-fact cluster Master File, see the Describing Data WithTIBCO WebFOCUS® Language manual.
The following list shows the rules for creating a report request against a multi-fact clusterMaster File.
You can report against only the fact tables, as long as you aggregate (SUM) at least onefact from each fact table and have at most one sort phrase.
The first sort field in the request must be from a shared dimension.
Any number of shared dimensions can be referenced in the request.
Multiple non-shared dimensions can be included in the request, as long as they have thesame parent. More than one non-shared dimension from different parents cannot bereferenced in a request.
The MATCH FILE command is not supported for reporting against a multi-fact synonym.
Reporting Against a Multi-Fact Cluster Synonym
1116

Example: Reporting Against a Multi-Fact Cluster Synonym
The following request against the WF_RETAIL_LITE multi-fact cluster synonym sums theCOGS_US measure from the WF_RETAIL_SALES segment and the DAYSDELAYED measurefrom the WF_RETAIL_SHIPMENTS segment. The first BY field, BRAND, is in the shareddimension WF_RETAIL_PRODUCT. The second BY field, TIME_QTR, is from the non-shareddimension WF_RETAIL_TIME_DELIVERED.
TABLE FILE WF_RETAIL_LITESUM COGS_US DAYSDELAYED BY BRANDBY WF_RETAIL_TIME_DELIVERED.TIME_QTRWHERE BRAND EQ 'Denon' OR 'Grado'WHERE DAYSDELAYED GT 1ON TABLE SET PAGE NOLEADON TABLE SET STYLE *INCLUDE=IBFS:/FILE/IBI_HTML_DIR/ibi_themes/Warm.sty,$END
The output is shown in the following image. The sum of DAYSDELAYED is totaled for eachvalue of the shared dimension and, within each value of the shared dimension, for each valueof the non-shared dimension.
Adding a New Fact To Multi-Fact Synonyms: JOIN AS_ROOT
The JOIN AS_ROOT command adds a new fact table as an additional root to an existing fact-based cluster (star schema). The source Master File has a parent fact segment and at leastone child dimension segment. The JOIN AS_ROOT command supports a unique join from achild dimension segment (at any level) to an additional fact parent.
14. Joining Data Sources
Creating Reports With TIBCO® WebFOCUS Language 1117

Syntax: How to Add an Additional Parent Segment
JOIN AS_ROOT sfld1 [AND sfld2 ...] IN [app1/]sfile TO UNIQUE tfld1 [AND tfld2 ...] IN [app2/]tfile AS jname END
where:
sfld1 [AND sfld2 ...]
Are fields in the child (dimension) segment of the source file that match values of fields inthe target file.
[app1/]sfile
Is the source file.
TO UNIQUE tfld1 [AND tfld2 ...]
Are fields in the target file that match values of fields in the child segment of the sourcefile. The join must be unique.
[app2/]tfile
Is the target file.
jname
Is the join name.
END
Is required to end the JOIN command.
Example: Joining AS_ROOT From the WebFOCUS Retail Data Source to an Excel File
The following request joins the product category and product subcategory fields in theWebFOCUS Retail data source to an Excel file named PROJECTED.
Reporting Against a Multi-Fact Cluster Synonym
1118

To generate the WebFOCUS Retail data source in the Web Console, click Tutorials from theApplications page.
Select WebFOCUS - Retail Demo. Select your configured relational adapter (or select the flat fileoption if you do not have a relational adapter configured), check Limit Tutorial Data, and thenclick Create.
The Master File for the Excel File is:
FILENAME=PROJECTED, SUFFIX=DIREXCEL, DATASET=app2/projected.xlsx, $ SEGMENT=PROJECTED, SEGTYPE=S0, $ FIELDNAME=PRODUCT_CATEGORY, ALIAS='Product Category', USAGE=A16V, ACTUAL=A16V, MISSING=ON, TITLE='Product Category', WITHIN='*PRODUCT', $ FIELDNAME=PRODUCT_SUBCATEGORY, ALIAS='Product Subcategory', USAGE=A25V, ACTUAL=A25V, MISSING=ON, TITLE='Product Subcategory', WITHIN=PRODUCT_CATEGORY, $ FIELDNAME=PROJECTED_COG, ALIAS=' Projected COG', USAGE=P15.2C, ACTUAL=A15, MISSING=ON, TITLE=' Projected COG', MEASURE_GROUP=PROJECTED, PROPERTY=MEASURE, $ FIELDNAME=PROJECTED_SALE_UNITS, ALIAS=' Projected Sale Units', USAGE=I9, ACTUAL=A11, MISSING=ON, TITLE=' Projected Sale Units', MEASURE_GROUP=PROJECTED, PROPERTY=MEASURE, $ MEASUREGROUP=PROJECTED, CAPTION='PROJECTED', $ DIMENSION=PRODUCT, CAPTION='Product', $ HIERARCHY=PRODUCT, CAPTION='Product', HRY_DIMENSION=PRODUCT, HRY_STRUCTURE=STANDARD, $
14. Joining Data Sources
Creating Reports With TIBCO® WebFOCUS Language 1119

The following image shows the data in the Excel file.
The following request joins from the wf_retail_product segment of the wf_retail data source tothe excel file as a new root and reports from both parent segments:
JOIN AS_ROOT PRODUCT_CATEGORY AND PRODUCT_SUBCATEG IN WF_RETAIL TO UNIQUE PRODUCT_CATEGORY AND PRODUCT_SUBCATEGORY IN PROJECTED AS J1ENDTABLE FILE WF_RETAILSUM PROJECTED_SALE_UNITS REVENUE_US BY PRODUCT_CATEGORYON TABLE SET PAGE NOPAGEEND
Reporting Against a Multi-Fact Cluster Synonym
1120

The output is:
14. Joining Data Sources
Creating Reports With TIBCO® WebFOCUS Language 1121

Generating Outer Joins of Cluster Synonym Contexts
Reporting against multiple root segments and a shared dimension generates multiple contextsin a cluster synonym. For example, in the following image Sales and Products form onecontext, while Shipments and Products form a second context.
When a request contains fields from both contexts, by default, an inner join is passed to theSQL engine. This retrieves only matching values of the shared dimension fields from bothcontexts.
You can use the BLEND-MODE parameter to generate a full outer join instead of an inner joinand retrieve all values from both contexts.
Reporting Against a Multi-Fact Cluster Synonym
1122
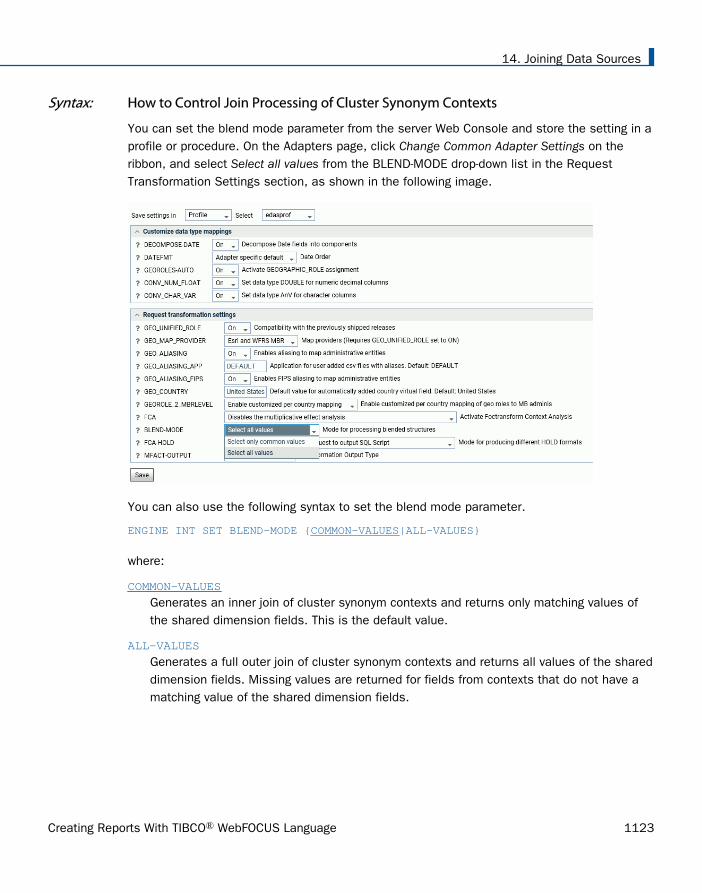
Syntax: How to Control Join Processing of Cluster Synonym Contexts
You can set the blend mode parameter from the server Web Console and store the setting in aprofile or procedure. On the Adapters page, click Change Common Adapter Settings on theribbon, and select Select all values from the BLEND-MODE drop-down list in the RequestTransformation Settings section, as shown in the following image.
You can also use the following syntax to set the blend mode parameter.
ENGINE INT SET BLEND-MODE {COMMON-VALUES|ALL-VALUES}
where:
COMMON-VALUES
Generates an inner join of cluster synonym contexts and returns only matching values ofthe shared dimension fields. This is the default value.
ALL-VALUES
Generates a full outer join of cluster synonym contexts and returns all values of the shareddimension fields. Missing values are returned for fields from contexts that do not have amatching value of the shared dimension fields.
14. Joining Data Sources
Creating Reports With TIBCO® WebFOCUS Language 1123

Example: Controlling Join Processing of Cluster Synonym Contexts
The following Excel file (excelroot.xlsx) will be uploaded to the server using the Adapter forExcel and joined as a root to the WF_RETAIL Master File, creating two contexts. A reportrequest will then be issued against the two roots and the shared dimension.
Note that this file has no data for product categories Camcorder, Stereo Systems, and VideoProduction. It has a product category named Displays that does not exist in WF_RETAIL.
The following is the Master File generated for this Excel file.
FILENAME=EXCELROOT, SUFFIX=DIREXCEL, DATASET=ibisamp/excelroot.xlsx, $ SEGMENT=EXCELROOT, SEGTYPE=S0, $ FIELDNAME=PRODUCT_CATEGORY, ALIAS='Product Category', USAGE=A15V, ACTUAL=A15V, MISSING=ON, TITLE='Product Category', $ FIELDNAME=PRODUCT_SUBCATEGORY, ALIAS='Product Subcategory', USAGE=A31V, ACTUAL=A31V, MISSING=ON, TITLE='Product Subcategory', $ FIELDNAME=PROJECTED_COG, ALIAS='Projected COG', USAGE=D15.2:C, ACTUAL=A64V, MISSING=ON, TITLE='Projected COG', CURRENCY_DISPLAY=LEFT_FLOAT, CURRENCY_ISO_CODE=USD, $ FIELDNAME=PROJECTED_SALE_UNITS, ALIAS='Projected Sale Units', USAGE=I9, ACTUAL=A11V, MISSING=ON, TITLE='Projected Sale Units', $
Reporting Against a Multi-Fact Cluster Synonym
1124

The following request joins the Excel file as a root and generates a report that contains fieldsfrom both roots and the shared dimension. Using the default value for BLEND-MODE producesan inner join that returns only common values of PRODUCT_CATEGORY.
JOIN AS_ROOT PRODUCT_CATEGORY AND PRODUCT_SUBCATEG IN ibisamp/WF_RETAIL TO PRODUCT_CATEGORY AND PRODUCT_SUBCATEGORY IN ibisamp/EXCELROOT AS J1 ENDTABLE FILE ibisamp/WF_RETAILSUM COGS_US PROJECTED_SALE_UNITSBY PRODUCT_CATEGORYON TABLE SET PAGE NOPAGEON TABLE SET STYLE *GRID=OFF,$END
The output is shown in the following image.
The following version of the request issues the ENGINE INT SET BLEND-MODE ALL-VALUEScommand to produce a full outer join that returns all values of PRODUCT_CATEGORY.
ENGINE INT SET BLEND-MODE ALL-VALUESJOIN AS_ROOT PRODUCT_CATEGORY AND PRODUCT_SUBCATEG IN ibisamp/WF_RETAIL TO PRODUCT_CATEGORY AND PRODUCT_SUBCATEGORY IN ibisamp/EXCELROOT AS J1 ENDTABLE FILE ibisamp/WF_RETAILSUM COGS_US PROJECTED_SALE_UNITSBY PRODUCT_CATEGORYON TABLE SET PAGE NOPAGEON TABLE SET STYLE *GRID=OFF,$END
The output is shown in the following image. Note the missing value indicators:
For the Projected Sale Units field in the rows that correspond to product categoriesCamcorder, Stereo Systems, and Video Production, which are not represented in the Excelfile.
14. Joining Data Sources
Creating Reports With TIBCO® WebFOCUS Language 1125
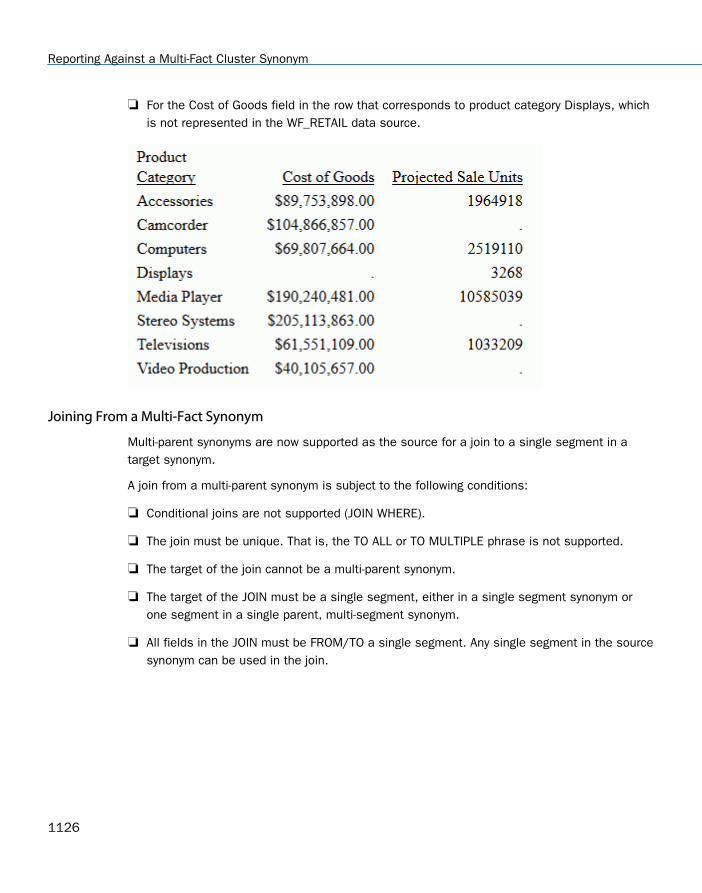
For the Cost of Goods field in the row that corresponds to product category Displays, whichis not represented in the WF_RETAIL data source.
Joining From a Multi-Fact Synonym
Multi-parent synonyms are now supported as the source for a join to a single segment in atarget synonym.
A join from a multi-parent synonym is subject to the following conditions:
Conditional joins are not supported (JOIN WHERE).
The join must be unique. That is, the TO ALL or TO MULTIPLE phrase is not supported.
The target of the join cannot be a multi-parent synonym.
The target of the JOIN must be a single segment, either in a single segment synonym orone segment in a single parent, multi-segment synonym.
All fields in the JOIN must be FROM/TO a single segment. Any single segment in the sourcesynonym can be used in the join.
Reporting Against a Multi-Fact Cluster Synonym
1126

Example: Joining From a Multi-Fact Synonym
The following Master File describes a multi-parent structure based on the WebFOCUS Retailtutorial. The two fact tables wf_retail_sales and wf_retail_shipments are parents of thedimension table wf_retail_product.
FILENAME=WF_RETAIL_MULTI_PARENT, $ SEGMENT=WF_RETAIL_SHIPMENTS, CRFILE=WFRETAIL/FACTS/WF_RETAIL_SHIPMENTS, CRINCLUDE=ALL, DESCRIPTION='Shipments Fact', $ SEGMENT=WF_RETAIL_SALES, PARENT=., CRFILE=WFRETAIL/FACTS/WF_RETAIL_SALES, CRINCLUDE=ALL, DESCRIPTION='Sales Fact', $ SEGMENT=WF_RETAIL_PRODUCT, CRFILE=WFRETAIL/DIMENSIONS/WF_RETAIL_PRODUCT, CRINCLUDE=ALL, DESCRIPTION='Product Dimension', $ PARENT=WF_RETAIL_SHIPMENTS, SEGTYPE=KU, JOIN_WHERE=WF_RETAIL_SHIPMENTS.ID_PRODUCT EQ WF_RETAIL_PRODUCT.ID_PRODUCT;, $ PARENT=WF_RETAIL_SALES, SEGTYPE=KU, JOIN_WHERE=WF_RETAIL_SALES.ID_PRODUCT EQ WF_RETAIL_PRODUCT.ID_PRODUCT;, $
The following image shows the joins between these tables in the Synonym Editor of the DataManagement Console (DMC).
14. Joining Data Sources
Creating Reports With TIBCO® WebFOCUS Language 1127

The following request joins the product segment to the dimension table wf_retail_vendor basedon the vendor ID and issues a request against the joined structure:
JOIN ID_VENDOR IN WF_RETAIL_MULTI_PARENT TO ID_VENDOR IN WF_RETAIL_VENDOR AS J1TABLE FILE WF_RETAIL_MULTI_PARENTSUM COGS_US DAYSDELAYEDBY PRODUCT_CATEGORYBY VENDOR_NAMEWHERE PRODUCT_CATEGORY LT 'S'ON TABLE SET PAGE NOPAGEEND
Reporting Against a Multi-Fact Cluster Synonym
1128
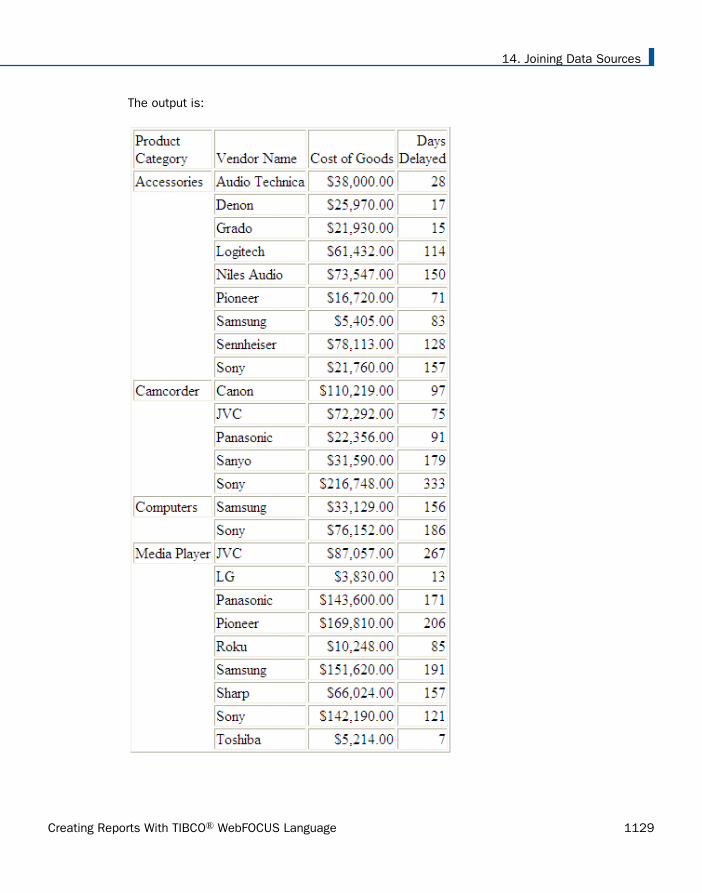
The output is:
14. Joining Data Sources
Creating Reports With TIBCO® WebFOCUS Language 1129
Navigating Joins Between Cluster Synonyms
By default, when joining cluster synonyms, a hierarchy of segments is constructed from all ofthe joined files, and the resulting hierarchy is navigated in top-to-bottom, left-to-right order.
Therefore, if a left outer join is specified from a host synonym to a cluster that has an innerjoin, the inner join will be performed last and may remove rows from the host file,counteracting the purpose of the left outer join. Using the SET FOCTRANSFORM =NESTED_CLUSTERS/ON command, you can force the joins in the target cluster to beperformed prior to the join between the host and target synonyms. When you use this setting,SQL scripts are used to join the tables in the target cluster prior to implementing the join tothe host file. The left outer join will be performed last and will retain all rows in the hostsynonym.
The syntax is:
SET FOCTRANSFORM = {NESTED_CLUSTERS/OFF|NESTED_CLUSTERS/ON}
where:
NESTED_CLUSTERS/OFF
Maintains the left-to-right, top-to-bottom order of segment navigation. This is the defaultvalue.
NESTED_CLUSTERS/ON
Performs the joins in the target cluster synonym prior to joining the host synonym to theresult.
Reference: Usage Notes for Joins to Cluster Synonyms
Using the SET FOCTRANSFORM = NESTED_CLUSTERS feature requires that the joins beoptimized. The command SET SHORTPATH = SQL must be in effect for combinations ofinner and outer joins with the setting FOCTRANSFORM = NESTED_CLUSTERS/OFF, in orderfor the request to be optimized. The SHORTPATH = SQL setting has no effect onoptimization with the setting FOCTRANSFORM = NESTED_CLUSTERS/ON.
You cannot join to a non-root segment of a cluster synonym. If you issue a join to a non-rootsegment, the following message displays and the request terminates:
(FOC906) JOIN TO NON-ROOT SEGMENT segname IS NOT ALLOWED FOR NESTED_CLUSTERS
Navigating Joins Between Cluster Synonyms
1130

Example: Navigating Joins Between Cluster Synonyms
This example uses SQL Server data sources generated from a file of citibike trips uploadedfrom https://www.citibikenyc.com/system-data, and from a file of zip codes for the stationsused for the trips (you can download this file from https://techsupport.informationbuilders.com/public/station_zip.csv).
A cluster synonym named station_trip_cls joins the station zip data source to a data sourcecontaining partial trip data (with only a few rows). The following shows the inner join defined inthe cluster synonym:
FILENAME=STATION_TRIP_CLS, $ SEGMENT=STATION_ZIP_OLEDB, CRFILE=CITIBIKE/STATION_ZIP_OLEDB, CRINCLUDE=ALL, $ SEGMENT=CITIBIKE_PARTIAL_OLEDB, SEGTYPE=KU, PARENT=STATION_ZIP_OLEDB, CRFILE=CITIBIKE/CITIBIKE_PARTIAL_OLEDB, CRINCLUDE=ALL, CRJOINTYPE=INNER, JOIN_WHERE=STATION_ID EQ START_STATION_ID;, $
The following request issues a left outer join from a larger version of the trip data file to thecluster:
SET FOCTRANSFORM = NESTED_CLUSTERS/&VALUESET SHORTPATH = SQLJOIN LEFT_OUTER START_STATION_ID IN CITIBIKE_TRIPDATA TAG T1 TO ALL STATION_ID IN STATION_TRIP_CLS TAG T2 AS J1TABLE FILE CITIBIKE_TRIPDATA" NESTED_CLUSTERS/&VALUE"" "SUM CNT.T1.START_STATION_ID AS T1,Station CNT.ZIP_CODE CNT.T2.START_STATION_ID AS T2,StationON TABLE SET PAGE NOLEADON TABLE SET STYLE *GRID=OFF,$ENDSTYLEEND
Running the request with &VALUE set to OFF generates the following trace:
SELECT COUNT(T1."START_STATION_ID"), COUNT(T2."ZIP_CODE"), COUNT(T3."START_STATION_ID") FROM ( ( citibike_tripdata_mssqloledb T1 LEFT OUTER JOIN station_zip_oledb T2 ON T2."STATION_ID" = T1."START_STATION_ID" ) INNER JOIN citibike_partial_msoledb T3 ON (T3."START_STATION_ID" = T2."STATION_ID") );
14. Joining Data Sources
Creating Reports With TIBCO® WebFOCUS Language 1131

The output is shown in the following image. The inner join was done last, reducing the numberof stations in the host file to the same number as in the cluster.
Running the request with &VALUE set to ON generates the following trace. Two SQL scripts aregenerated, one for the host file and one for the join in the cluster. Then, the left outer join isperformed against the result of the inner join:
SELECT T1."START_STATION_ID" AS "SK001_START_STATION_ID", COUNT(T1."START_STATION_ID") AS "VB001_CNT_START_STATION_ID" FROM citibike_tripdata_mssqloledb T1 GROUP BY T1."START_STATION_ID"; (FOC2546) SQL SCRIPT __CITIBIKE_TRIPDATA_OLEDB_CITIBIKE_TRIPDATA_OLEDB.SQL CREATED SUCCESSFULLY (BUT NOT EXECUTED) _EDATEMP/__citibike_tripdata_oledb_citibike_tripdata_oledb HELD AS SQL_SCRIPT SELECT T1."STATION_ID" AS "SK001_STATION_ID", COUNT(T1."ZIP_CODE") AS "VB001_CNT_ZIP_CODE", COUNT(T2."START_STATION_ID") AS "VB002_CNT_START_STATION_ID" FROM station_zip_oledb T1, citibike_partial_msoledb T2 WHERE (T2."START_STATION_ID" = T1."STATION_ID") GROUP BY T1."STATION_ID"; (FOC2546) SQL SCRIPT __CITIBIKE_TRIPDATA_OLEDB_STATION_PARTIAL_OLEDB_CLS.SQL CREATED SUCCESSFULLY (BUT NOT EXECUTED) _EDATEMP/__citibike_tripdata_oledb_station_partial_oledb_cls HELD AS SQL_SCRIPT
Navigating Joins Between Cluster Synonyms
1132

SELECT SUM(T1."VB001_CNT_START_STATION_ID"), SUM(T2."VB001_CNT_ZIP_CODE"), SUM(T2."VB002_CNT_START_STATION_ID") FROM ( ( /* vvv */ SELECT T1."START_STATION_ID" AS "SK001_START_STATION_ID", COUNT(T1."START_STATION_ID") AS "VB001_CNT_START_STATION_ID" FROM citibike_tripdata_mssqloledb T1 GROUP BY T1."START_STATION_ID" ) /* ^^^ */ T1 LEFT OUTER JOIN ( /* vvv */ SELECT T1."STATION_ID" AS "SK001_STATION_ID", COUNT(T1."ZIP_CODE") AS "VB001_CNT_ZIP_CODE", COUNT(T2."START_STATION_ID") AS "VB002_CNT_START_STATION_ID" FROM station_zip_oledb T1, citibike_partial_msoledb T2 WHERE (T2."START_STATION_ID" = T1."STATION_ID") GROUP BY T1."STATION_ID" ) /* ^^^ */ T2 ON T2."SK001_STATION_ID" = T1."SK001_START_STATION_ID" );
The output is shown in the following image. The left outer join was done last, maintaining theoriginal number of stations in the host file.
Cross Database Join Optimization
Retrieval performance has been optimized under certain conditions when you join tables fromdifferent Relational database systems.
14. Joining Data Sources
Creating Reports With TIBCO® WebFOCUS Language 1133

One type of performance optimization results from extracting data from the cross-referencedtable prior to performing the join, or issuing a sub-select. You can disable this optimizationprocess by issuing the following command:
SQL SET HOLDSQLJOIN = OFFEND
By default, this parameter is ON.
The following performance optimization procedures have been implemented:
For a non-aggregated query, the cross-referenced (TO) table is saved as a file in an internalbinary format. This is faster than joining to a table in a different database system.
For an aggregated query, for the cross-referenced table joined from any aggregationfunctions (min, max, sum, avg, count), the retrieval is passed to the relational database ina sub-select. This can result in retrieving a much smaller answer set, which improvesperformance.
For a request with a clause that tests if two columns are equal or both are NULL, the TOtable is held in an internal binary format, also improving performance.
You can view the generated query in either the Session Log or the trace file.
Cross Database Join Optimization
1134

The following SQL request joins a Microsoft SQL Server named citibike_mssql table to aMySQL table named station_zip_mysql.
SQLSELECT T1.TRIPDURATION, T1.START_STATION_NAME , T1.END_STATION_NAME , T1.BIKEID , T1.BIRTH_YEAR , T1.GENDER , T1.STARTTIME , T1.STOPTIME , T1.USERTYPE , T2.ZIP_CODE , T2.COUNTY , T2.CITYFROM citibike.citibike_mssql T1 INNER JOIN /*Join 1*/ citibike.station_zip_mysql T2 ON T1.START_STATION_ID = T2.STATION_ID;TABLEON TABLE SET PAGE NOLEADON TABLE SET STYLE *GRID=OFF,$ENDSTYLEEND
When this request is run, the Session Log shows the generated request. First thestation_zip_mysql table is held in an internal format:
TABLEF FILE STATION_ZIP_MYSQL PRINT ZIP_CODE COUNTY CITY STATION_IDON TABLE SET CARTESIAN ONON TABLE SET ASNAMES ONON TABLE SET HOLDLIST PRINTONLY ON TABLE HOLD AS SQLHLD01 FORMAT DATRECEND
14. Joining Data Sources
Creating Reports With TIBCO® WebFOCUS Language 1135

Next, the citibike_mssql table is joined to the HOLD file.
JOIN INNER CITIBIKE_MSSQL2.START_STATION_ID IN CITIBIKE_MSSQL TO ALL E04 IN SQLHLD01 AS SQLJNM01END
Finally, the joined structure is queried to produce the output.
TABLEF FILE CITIBIKE_MSSQL PRINT CITIBIKE_MSSQL.TRIPDURATION CITIBIKE_MSSQL.START_STATION_NAME CITIBIKE_MSSQL.END_STATION_NAME CITIBIKE_MSSQL.BIKEID CITIBIKE_MSSQL.BIRTH_YEAR CITIBIKE_MSSQL.GENDER CITIBIKE_MSSQL.STARTTIME CITIBIKE_MSSQL.STOPTIME CITIBIKE_MSSQL.USERTYPE SQLHLD01.E01 SQLHLD01.E02 SQLHLD01.E03 SQLHLD01.E04 NOPRINTON TABLE SET CARTESIAN ONON TABLE SET ASNAMES ONON TABLE SET HOLDLIST PRINTONLYEND
Additional performance improvements result from the following conversions:
If there is more than one cluster of tables from the same DBMS in the FROM clause, joinsbetween those tables are passed to the corresponding DBMS.
If there is a WHERE condition on fields from the outer table in a left or right outer join, andthis condition always fails for null values, that join is converted to an inner join.
If there is WHERE condition on fields from the left, right, or both tables in a full outer join,and this condition always fails for null values, that join is converted to a left, right, or innerjoin.
Merge sub-select phrases if from, where, group by, and having are the same and re-use thetemporary table created for the merge sub-select statement.
Cross Database Join Optimization
1136

For example, following flow creates three left outer joins between Microsoft SQL Server tablesand Oracle tables. The Oracle synonyms start with the characters o_.
14. Joining Data Sources
Creating Reports With TIBCO® WebFOCUS Language 1137
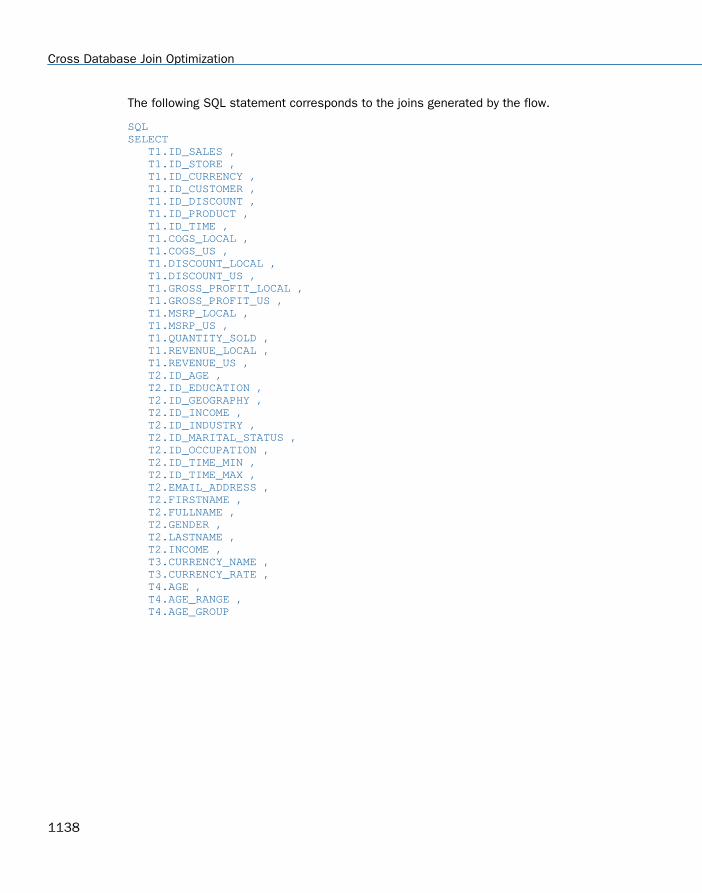
The following SQL statement corresponds to the joins generated by the flow.
SQLSELECT T1.ID_SALES , T1.ID_STORE , T1.ID_CURRENCY , T1.ID_CUSTOMER , T1.ID_DISCOUNT , T1.ID_PRODUCT , T1.ID_TIME , T1.COGS_LOCAL , T1.COGS_US , T1.DISCOUNT_LOCAL , T1.DISCOUNT_US , T1.GROSS_PROFIT_LOCAL , T1.GROSS_PROFIT_US , T1.MSRP_LOCAL , T1.MSRP_US , T1.QUANTITY_SOLD , T1.REVENUE_LOCAL , T1.REVENUE_US , T2.ID_AGE , T2.ID_EDUCATION , T2.ID_GEOGRAPHY , T2.ID_INCOME , T2.ID_INDUSTRY , T2.ID_MARITAL_STATUS , T2.ID_OCCUPATION , T2.ID_TIME_MIN , T2.ID_TIME_MAX , T2.EMAIL_ADDRESS , T2.FIRSTNAME , T2.FULLNAME , T2.GENDER , T2.LASTNAME , T2.INCOME , T3.CURRENCY_NAME , T3.CURRENCY_RATE , T4.AGE , T4.AGE_RANGE , T4.AGE_GROUP
Cross Database Join Optimization
1138

FROM ((("ibisamp/facts".wf_retail_sales T1 LEFT OUTER JOIN /*Join 1*/ "ibisamp/dimensions".o_wf_retail_customer T2 ON T1.ID_CUSTOMER = T2.ID_CUSTOMER ) LEFT OUTER JOIN /*Join 2*/ "ibisamp/dimensions".wf_retail_currency T3 ON T1.ID_CURRENCY = T3.ID_CURRENCY ) LEFT OUTER JOIN /*Join 3*/ "ibisamp/dimensions".o_wf_retail_age T4 ON T2.ID_AGE = T4.ID_AGE ) WHERE T1.REVENUE_US > 600 AND T2.LASTNAME LIKE 'C%' AND T3.CURRENCY_NAME = 'US Dollar' AND T4.AGE BETWEEN 35 AND 40;END
14. Joining Data Sources
Creating Reports With TIBCO® WebFOCUS Language 1139

The Session Log shows the joins that were generated. The left outer joins were converted toinner joins, as shown in the following partial listing.
JOIN INNER SQLAPP01.ID_AGE IN 'ibisamp/dimensions/o_wf_retail_customer' TAG SQLAPP01 TO ALL ID_AGE IN 'ibisamp/dimensions/o_wf_retail_age' TAG SQLJTG01 AS SQLJNM01ENDDEFINE FILE 'ibisamp/dimensions/o_wf_retail_customer' TEMP SQLDEF01/I1 WITH SQLJTG01.O_WF_RETAIL_AGE.ID_AGE = 1;ENDTABLEF FILE 'ibisamp/dimensions/o_wf_retail_customer' PRINT SQLAPP01.ID_AGE SQLAPP01.ID_EDUCATION SQLAPP01.ID_GEOGRAPHY SQLAPP01.ID_INCOME SQLAPP01.ID_INDUSTRY SQLAPP01.ID_MARITAL_STATUS SQLAPP01.ID_OCCUPATION SQLAPP01.ID_TIME_MIN SQLAPP01.ID_TIME_MAX SQLAPP01.EMAIL_ADDRESS SQLAPP01.FIRSTNAME SQLAPP01.FULLNAME SQLAPP01.GENDER SQLAPP01.LASTNAME SQLAPP01.INCOME SQLJTG01.AGE SQLJTG01.AGE_RANGE SQLJTG01.AGE_GROUP SQLAPP01.ID_CUSTOMER SQLDEF01 AS (,'SQL$$HIDDEN01',) SQLJTG01.ID_AGE NOPRINT
WHERE ( SQLAPP01.LASTNAME LIKE 'C%' ) ; WHERE ( ( SQLJTG01.AGE FROM 35 TO 40 AND SQLJTG01.AGE NE MISSING) ) ;ON TABLE SET HOLDATTRS ONON TABLE SET CARTESIAN ONON TABLE SET ASNAMES MIXEDON TABLE SET HOLDLIST PRINTONLY ON TABLE HOLD AS SQLHLD01 FORMAT DATRECEND
Cross Database Join Optimization
1140

In addition, joins that use the same DBMS are passed to that DBMS, as shown in the followingpartial listing.
SELECT T1."ID_CUSTOMER", T1."ID_AGE", T1."ID_EDUCATION", T1."ID_GEOGRAPHY", T1."ID_INCOME", T1."ID_INDUSTRY", T1."ID_MARITAL_STATUS", T1."ID_OCCUPATION", T1."ID_TIME_MIN", T1."ID_TIME_MAX", T1."EMAIL_ADDRESS", T1."FIRSTNAME", T1."FULLNAME", T1."GENDER", T1."LASTNAME", T1."INCOME", T2."ID_AGE", T2."AGE", T2."AGE_RANGE", T2."AGE_GROUP" FROM wf_retail_customer_t T1, wf_retail_age_t T2 WHERE (T2."ID_AGE" = T1."ID_AGE") AND (T1."LASTNAME" LIKE 'C%') AND (T2."AGE" IS NOT NULL) AND (T2."AGE" BETWEEN 35 AND 40);
Invoking Context Analysis for a Star Schema With a Fan Trap
When a star schema contains a segment with aggregated facts and a lower-level segment withthe related detail-level facts, a request that performs aggregation on both levels and returnsthem sorted by the higher level can experience the multiplicative effect. This means that thefact values that are already aggregated may be re-aggregated and, therefore, return multipliedvalues.
When the adapter detects the multiplicative effect, it turns optimization off in order to handlethe request processing and circumvent the multiplicative effect. However, performance isdegraded when a request is not optimized.
A new context analysis process has been introduced in this release that detects themultiplicative effect and generates SQL script commands that retrieve the correct values foreach segment context. These scripts are then passed to the RDBMS as subqueries in anoptimized SQL statement.
14. Joining Data Sources
Creating Reports With TIBCO® WebFOCUS Language 1141

To activate the context analysis feature, click Change Common Adapter Settings on theAdapters page of the Web Console. Then select Yes for the FCA parameter in theMiscellaneous Settings section and click Save, as shown in the following image.
Adding DBA Restrictions to the Join Condition: SET DBAJOIN
When DBA restrictions are applied to a request on a multi-segment structure, by default, therestrictions are added as WHERE conditions in the report request. When the DBAJOINparameter is set ON, DBA restrictions are treated as internal to the file or segment for whichthey are specified, and are added to the join syntax.
Note: DBA restrictions with DBAJOIN OFF apply to the entire record instance that is beingretrieved. Therefore, the entire record instance is suppressed when any part of that instance isrestricted. DBAJOIN ON applies the DBA only to the segment where the data value appears,allowing the rest of the record instance to be displayed, if applicable.
This difference is important when the file or segment being restricted has a parent in thestructure and the join is an outer or unique join.
Adding DBA Restrictions to the Join Condition: SET DBAJOIN
1142

When restrictions are treated as report filters, lower-level segment instances that do notsatisfy them are omitted from the report output, along with their host segments. Since hostsegments are omitted, the output does not reflect a true outer or unique join.
When the restrictions are treated as join conditions, lower-level values from segment instancesthat do not satisfy them are displayed as missing values, and the report output displays allhost rows.
Syntax: How to Add DBA Restrictions to the Join Condition
SET DBAJOIN = {OFF|ON}
where:
OFF
Treats DBA restrictions as WHERE filters in the report request. OFF is the default value.
ON
Treats DBA restrictions as join conditions.
Example: Using the DBAJOIN Setting With Relational Tables
The following request creates two tables, EMPINFOSQL and EDINFOSQL:
TABLE FILE EMPLOYEESUM LAST_NAME FIRST_NAME CURR_JOBCODEBY EMP_IDON TABLE HOLD AS EMPINFOSQL FORMAT SQLMSSEND-RUNTABLE FILE EDUCFILESUM COURSE_CODE COURSE_NAMEBY EMP_IDON TABLE HOLD AS EDINFOSQL FORMAT SQLMSSEND
Add the following DBA attributes to the end of the generated EMPINFOSQL Master File. Withthe restrictions listed, USER2 cannot retrieve course codes of 300 or above:
ENDDBA=USER1,$USER=USER2, ACCESS = R, $FILENAME=EDINFOSQL,$USER=USER2, ACCESS = R, RESTRICT = VALUE, NAME=SYSTEM, VALUE=COURSE_CODE LT 300;,$
Add the following DBA attributes to the end of the generated EDINFOSQL Master File:
ENDDBA=USER1,DBAFILE=EMPINFOSQL,$
14. Joining Data Sources
Creating Reports With TIBCO® WebFOCUS Language 1143
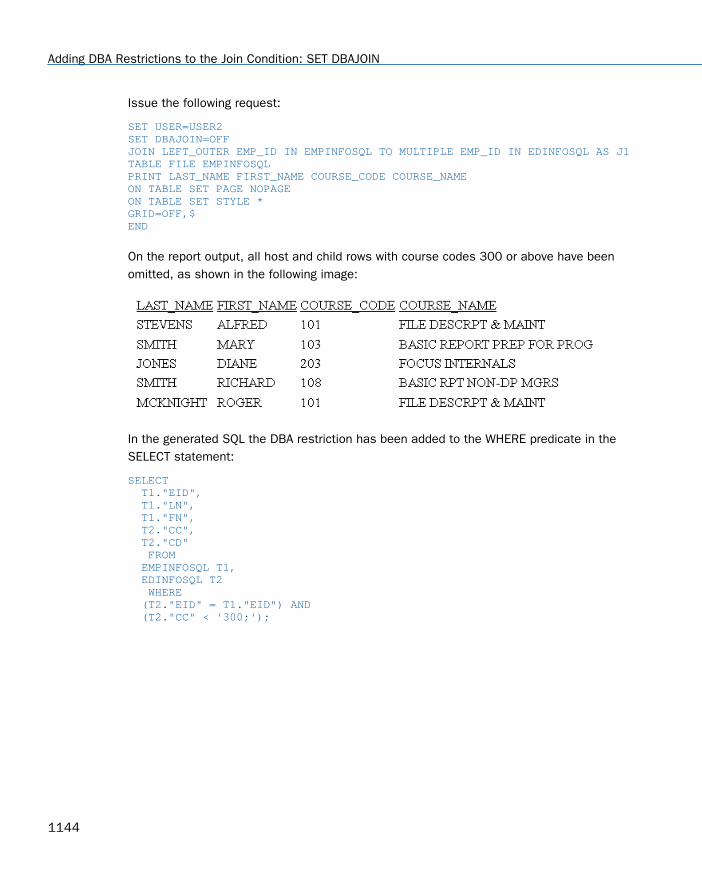
Issue the following request:
SET USER=USER2SET DBAJOIN=OFFJOIN LEFT_OUTER EMP_ID IN EMPINFOSQL TO MULTIPLE EMP_ID IN EDINFOSQL AS J1TABLE FILE EMPINFOSQLPRINT LAST_NAME FIRST_NAME COURSE_CODE COURSE_NAMEON TABLE SET PAGE NOPAGEON TABLE SET STYLE *GRID=OFF,$END
On the report output, all host and child rows with course codes 300 or above have beenomitted, as shown in the following image:
In the generated SQL the DBA restriction has been added to the WHERE predicate in theSELECT statement:
SELECT T1."EID", T1."LN", T1."FN", T2."CC", T2."CD" FROM EMPINFOSQL T1, EDINFOSQL T2 WHERE (T2."EID" = T1."EID") AND (T2."CC" < '300;');
Adding DBA Restrictions to the Join Condition: SET DBAJOIN
1144

Rerun the request with SET DBAJOIN=ON. The output now displays all host rows, with missingvalues substituted for lower-level segment instances that did not satisfy the DBA restriction, asshown on the following image:
In the generated SQL, the DBA restriction has been added to the join, and there is no WHEREpredicate:
SELECT T1."EID", T1."LN", T1."FN", T2."EID", T2."CC", T2."CD" FROM ( EMPINFOSQL T1 LEFT OUTER JOIN EDINFOSQL T2 ON T2."EID" = T1."EID" AND (T2."CC" < '300;') );
Preserving Virtual Fields During Join Parsing
There are two ways to preserve virtual fields during join parsing. One way is to useKEEPDEFINES, and the second is to use DEFINE FILE SAVE and DEFINE FILE RETURN.
14. Joining Data Sources
Creating Reports With TIBCO® WebFOCUS Language 1145

Preserving Virtual Fields Using KEEPDEFINES
The KEEPDEFINES parameter determines if a virtual field created by the DEFINE command for ahost or joined structure is retained or cleared after the JOIN command is run. It applies whenthe DEFINE command precedes the JOIN command.
The prior virtual fields constitute what is called a context. Each new context creates a newlayer or command environment. When you first enter the new environment, all virtual fieldsdefined in the previous layer are available in the new layer. Overwriting or clearing a virtual fielddefinition affects only the current layer. When you return to the previous layer, its virtual fielddefinitions are intact.
New DEFINE fields issued after the JOIN command constitute another context, and by so doinggenerate a stack of contexts. In each context, all virtual fields of all prior contexts areaccessible.
By default the KEEPDEFINES setting is OFF. With this setting, a JOIN command removesprior virtual fields.
After KEEPDEFINES is set to ON, subsequent virtual fields are reinstated during the parsingof a JOIN command.
When KEEPDEFINES is set to ALL, all subsequent virtual fields, as well as any prior virtualfields, are reinstated during the parsing of JOIN commands.
A JOIN CLEAR as_name command removes all the contexts that were created after the JOINas_name was issued.
For DEFINE-based conditional joins, the KEEPDEFINES setting must be ON. You then mustcreate all virtual fields before issuing the DEFINE-based conditional JOIN command. This differsfrom traditional DEFINE-based joins in which the virtual field is created after the JOINcommand. In addition, a virtual field may be part of the JOIN syntax or WHERE syntax.
DEFINE commands issued after the JOIN command do not replace or clear the virtual fieldscreated before the join, since a new file context is created.
Syntax: How to Use KEEPDEFINES
SET KEEPDEFINES = {ON|OFF|ALL}
where:
ON
Retains subsequent virtual fields after a JOIN command is run.
Preserving Virtual Fields During Join Parsing
1146

OFF
Clears the virtual field after a JOIN command is run. OFF is the default value.
ALL
Retains all prior and subsequent virtual fields in the request after a JOIN command is run.
Reference: Usage Notes for KEEPDEFINES
Virtual fields defined prior to setting KEEPDEFINES ON are not preserved after a JOINcommand. Set KEEPDEFINES to ALL to preserve any previously defined virtual fields.
Example: Preserving Virtual Fields During Join Parsing With KEEPDEFINES
The first virtual field, DAYSKEPT, is defined prior to issuing any joins, but after settingKEEPDEFINES to ON. DAYSKEPT is the number of days between the return date and rentaldate for a videotape:
SET KEEPDEFINES = ONDEFINE FILE VIDEOTRKDAYSKEPT/I5 = RETURNDATE - TRANSDATE;END
The ? DEFINE query command shows that this is the only virtual field defined at this point:
? DEFINE
FILE FIELD NAME FORMAT SEGMENT VIEW TYPEVIDEOTRK DAYSKEPT I5 4
The following request prints all transactions in which the number of days kept is two:
TABLE FILE VIDEOTRKPRINT MOVIECODE TRANSDATE RETURNDATE DAYSKEPTCOMPUTE ACTUAL_DAYS/I2 = RETURNDATE-TRANSDATE;WHERE DAYSKEPT EQ 2END
The first few lines of output show that each return date is two days after the transaction date:
MOVIECODE TRANSDATE RETURNDATE DAYSKEPT ACTUAL_DAYS--------- --------- ---------- -------- -----------001MCA 91/06/27 91/06/29 2 2692PAR 91/06/27 91/06/29 2 2259MGM 91/06/19 91/06/21 2 2
14. Joining Data Sources
Creating Reports With TIBCO® WebFOCUS Language 1147

Now, the VIDEOTRK data source is joined to the MOVIES data source. The ? DEFINE queryshows that the join did not clear the DAYSKEPT virtual field:
JOIN MOVIECODE IN VIDEOTRK TO ALL MOVIECODE IN MOVIES AS J1? DEFINE
FILE FIELD NAME FORMAT SEGMENT VIEW TYPEVIDEOTRK DAYSKEPT I5 4
Next a new virtual field, YEARS, is defined for the join between VIDEOTRK and MOVIES:
DEFINE FILE VIDEOTRKYEARS/I5 = (TRANSDATE - RELDATE)/365;END
The ? DEFINE query shows that the virtual field created prior to the join was not cleared by thisnew virtual field because it was in a separate context:
? DEFINE
FILE FIELD NAME FORMAT SEGMENT VIEW TYPEVIDEOTRK DAYSKEPT I5 4VIDEOTRK YEARS I5 5
Next, the field DAYSKEPT is re-defined so that it is the number of actual days plus one:
DEFINE FILE VIDEOTRKDAYSKEPT/I5 = RETURNDATE - TRANSDATE + 1;END
The ? DEFINE query shows that there are two versions of the DAYSKEPT virtual field. However,YEARS was cleared because it was in the same context (after the join) as the new version ofDAYSKEPT, and the DEFINE command did not specify the ADD option:
? DEFINE
FILE FIELD NAME FORMAT SEGMENT VIEW TYPEVIDEOTRK DAYSKEPT I5 4VIDEOTRK DAYSKEPT I5 4
The same request now uses the new definition for DAYSKEPT. Note that the number of daysbetween the return date and transaction date is actually one day, not two because of thechange in the definition of DAYSKEPT:
MOVIECODE TRANSDATE RETURNDATE DAYSKEPT ACTUAL_DAYS--------- --------- ---------- -------- -----------040ORI 91/06/20 91/06/21 2 1505MGM 91/06/21 91/06/22 2 1710VES 91/06/26 91/06/27 2 1
Preserving Virtual Fields During Join Parsing
1148

Now, J1 is cleared. The redefinition for DAYSKEPT is also cleared:
JOIN CLEAR J1? DEFINE
FILE FIELD NAME FORMAT SEGMENT VIEW TYPEVIDEOTRK DAYSKEPT I5 4
The report output shows that the original definition for DAYSKEPT is now in effect:
MOVIECODE TRANSDATE RETURNDATE DAYSKEPT ACTUAL_DAYS--------- --------- ---------- -------- -----------001MCA 91/06/27 91/06/29 2 2692PAR 91/06/27 91/06/29 2 2259MGM 91/06/19 91/06/21 2 2
Preserving Virtual Fields Using DEFINE FILE SAVE and RETURN
The DEFINE FILE SAVE command forms a new context for virtual fields, which can then beremoved with DEFINE FILE RETURN. For details, see Creating Temporary Fields on page 277.
Example: Preserving Virtual Fields With DEFINE FILE SAVE and RETURN
The following command enables you to preserve virtual fields within a file context:
SET KEEPDEFINES=ON
The following command defines virtual field A for the VIDEOTRK data source and places it inthe current context:
DEFINE FILE VIDEOTRK A/A5='JAWS'; END
The following command creates a new context and saves virtual field B in this context:
DEFINE FILE VIDEOTRK SAVE B/A5='ROCKY'; END? DEFINE
The output of the ? DEFINE query lists virtual fields A and B:
FILE FIELD NAME FORMAT SEGMENT VIEW TYPEVIDEOTRK A A5VIDEOTRK B A5
14. Joining Data Sources
Creating Reports With TIBCO® WebFOCUS Language 1149

The following DEFINE command creates virtual field C. All previously defined virtual fields arecleared because the ADD option was not used in the DEFINE command:
DEFINE FILE VIDEOTRK C/A10='AIRPLANE'; END? DEFINE
The output of the ? DEFINE query shows that C is the only virtual field defined:
FILE FIELD NAME FORMAT SEGMENT VIEW TYPEVIDEOTRK C A10
The following JOIN command creates a new context. Because KEEPDEFINES is set to ON,virtual field C is not cleared by the JOIN command:
JOIN MOVIECODE IN VIDEOTRK TAG V1 TO MOVIECODE IN MOVIES TAG M1 AS J1? DEFINE
The output of the ? DEFINE query shows that field C is still defined:
FILE FIELD NAME FORMAT SEGMENT VIEW TYPEVIDEOTRK C A10
The next DEFINE command creates virtual field D in the new context created by the JOINcommand:
DEFINE FILE VIDEOTRK SAVE D/A10='TOY STORY'; END? DEFINE
The output of the ? DEFINE query shows that virtual fields C and D are defined:
FILE FIELD NAME FORMAT SEGMENT VIEW TYPEVIDEOTRK C A10VIDEOTRK D A10
The DEFINE FILE RETURN command clears virtual field D created in the current context (afterthe JOIN):
DEFINE FILE VIDEOTRK RETURNEND? DEFINE
The output of the ? DEFINE query shows that virtual field D was cleared, but C is still defined:
FILE FIELD NAME FORMAT SEGMENT VIEW TYPE VIDEOTRK C A10
Preserving Virtual Fields During Join Parsing
1150
The following DEFINE FILE RETURN command does not clear virtual field C because field C wasnot created using a DEFINE FILE SAVE command:
DEFINE FILE VIDEOTRK RETURNEND? DEFINE
The output of the ? DEFINE query shows that virtual field C is still defined:
FILE FIELD NAME FORMAT SEGMENT VIEW TYPE VIDEOTRK C A10
Note: DEFINE FILE RETURN is only activated when a DEFINE FILE SAVE is in effect.
Screening Segments With Conditional JOIN Expressions
The conditional JOIN command can reference any and all fields in the joined segment and anyand all fields in the parent segment, or higher on the parent's path.
When active, these join expressions screen the segment on which they reside (the child orjoined segment). That is, if no child segment passes the test defined by the expression, thejoin follows the rules of SET ALL=OFF, or SET ALL=ON when no child segment exists. UnlikeWHERE phrases in TABLE commands, JOIN_WHERE screening does not automatically screenthe parent segment when SET ALL=ON.
Parsing WHERE Criteria in a Join
WHERE criteria take effect in a join only when a TABLE request reference is made to a cross-referenced segment or its children. If no such reference is made, the WHERE has no effect.
The AT attribute is used to link the correct parent segment or host to the correct child or cross-referenced segment. The field values used as the AT parameter are not used to cause the link.They are used simply as segment references.
Note: If no WHERE criteria are in effect, you receive a Cartesian product.
Displaying Joined Structures
When you join two data sources together, they are subsequently treated as one logicalstructure. This structure results from appending the structure of the cross-referenced file to thestructure of the host file. The segment in the cross-referenced file containing the shared valuefield becomes the child of the segment in the host file with the shared value field.
14. Joining Data Sources
Creating Reports With TIBCO® WebFOCUS Language 1151

Syntax: How to Display a Joined Structure
To display the joined structure, issue the following command:
CHECK FILE hostfile PICTURE
where:
hostfileIs the name of the host file.
Example: Displaying a Joined Structure
Notice that the segments belonging to the host file appear as regular segments outlined byasterisks. The segments belonging to the cross-referenced file appear as virtual segmentsoutlined by dots. The segments of the cross-referenced file are also labeled with the cross-referenced file name below each segment.
JOIN PIN IN EMPDATA TO PIN IN SALHISTCHECK FILE EMPDATA PICTURE0 NUMBER OF ERRORS= 0 NUMBER OF SEGMENTS= 2 ( REAL= 1 VIRTUAL= 1 ) NUMBER OF FIELDS= 14 INDEXES= 1 FILES= 2 NUMBER OF DEFINES= 1 TOTAL LENGTH OF ALL FIELDS= 1321SECTION 01.01 STRUCTURE OF FOCUS FILE EMPDATA ON 03/05/01 AT 12.22.49
EMPDATA 01 S1 ************** *PIN **I *LASTNAME ** *FIRSTNAME ** *MIDINITIAL ** * ** *************** ************** I I I I SLHISTRY 02 I KU .............. :PIN :K :EFFECTDATE : :OLDSALARY : : : : : :............: JOINED SALHIST
Displaying Joined Structures
1152
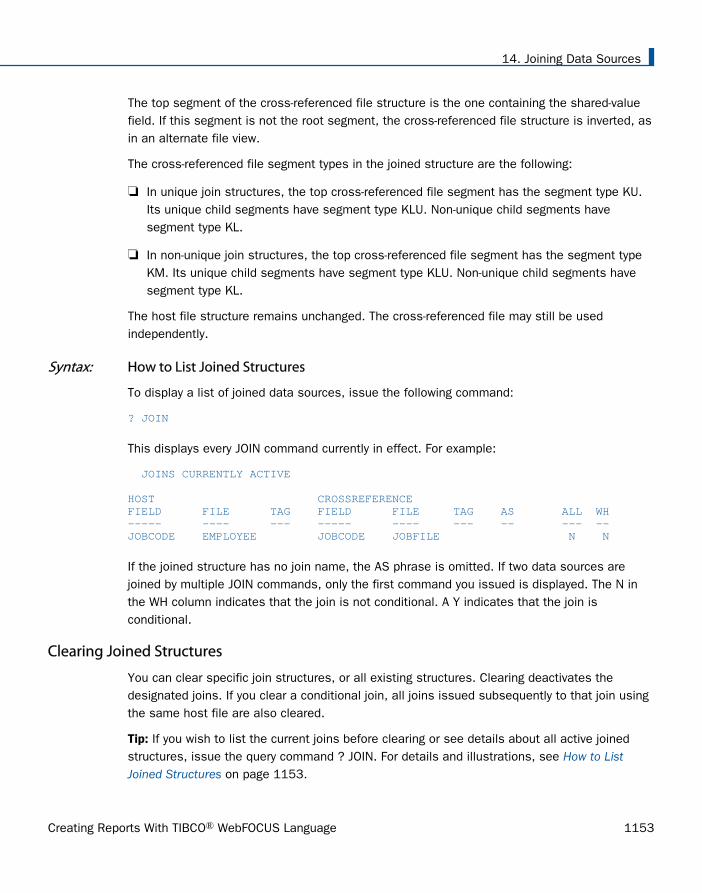
The top segment of the cross-referenced file structure is the one containing the shared-valuefield. If this segment is not the root segment, the cross-referenced file structure is inverted, asin an alternate file view.
The cross-referenced file segment types in the joined structure are the following:
In unique join structures, the top cross-referenced file segment has the segment type KU.Its unique child segments have segment type KLU. Non-unique child segments havesegment type KL.
In non-unique join structures, the top cross-referenced file segment has the segment typeKM. Its unique child segments have segment type KLU. Non-unique child segments havesegment type KL.
The host file structure remains unchanged. The cross-referenced file may still be usedindependently.
Syntax: How to List Joined Structures
To display a list of joined data sources, issue the following command:
? JOIN
This displays every JOIN command currently in effect. For example:
JOINS CURRENTLY ACTIVE HOST CROSSREFERENCEFIELD FILE TAG FIELD FILE TAG AS ALL WH----- ---- --- ----- ---- --- -- --- --JOBCODE EMPLOYEE JOBCODE JOBFILE N N
If the joined structure has no join name, the AS phrase is omitted. If two data sources arejoined by multiple JOIN commands, only the first command you issued is displayed. The N inthe WH column indicates that the join is not conditional. A Y indicates that the join isconditional.
Clearing Joined Structures
You can clear specific join structures, or all existing structures. Clearing deactivates thedesignated joins. If you clear a conditional join, all joins issued subsequently to that join usingthe same host file are also cleared.
Tip: If you wish to list the current joins before clearing or see details about all active joinedstructures, issue the query command ? JOIN. For details and illustrations, see How to ListJoined Structures on page 1153.
14. Joining Data Sources
Creating Reports With TIBCO® WebFOCUS Language 1153

Syntax: How to Clear a Join
To clear a joined structure, issue this command:
JOIN CLEAR {joinname|*}
where:
joinnameIs the AS name of the joined structure you want to clear.
*
Clears all joined structures.
Clearing a Conditional Join
You can clear a join by issuing the JOIN CLEAR command. The effect of the JOIN CLEARcommand depends on whether any conditional join exists.
If conditional joins are found and were issued after the join you wish to clear, or if the joinyou wish to clear is a conditional join, then the JOIN CLEAR as_name command removes alljoins issued after the specified join.
If no conditional joins were issued after the join you wish to clear, only the join you specifyis cleared. Any virtual fields saved in the context of a join that is cleared are also cleared.Normal joins may or may not be cleared, depending on the position of the conditional join.The JOIN CLEAR * command clears every join issued, along with its associated virtualfields. However, all virtual fields in the null context remain untouched.
Note: The null context is the context of the data source prior to any joins being issued.
Example: Clearing Joins
The following request creates three joins using VIDEOTRK as the host data source. The firsttwo are conditional (JW1, JW2), and the third join is unconditional (J1):
JOIN FILE VIDEOTRK AT PRODCODE TO ALL FILE GGSALES AT PCD AS JW1WHERE PRODCODE NE PCD;ENDJOIN FILE VIDEOTRK AT TRANSDATE TO ALL FILE MOVIES AT RELDATE AS JW2WHERE (TRANSDATE - RELDATE)/365 GT 10;ENDJOIN MOVIECODE IN VIDEOTRK TO MOVIECODE IN MOVIES AS J1
Clearing Joined Structures
1154
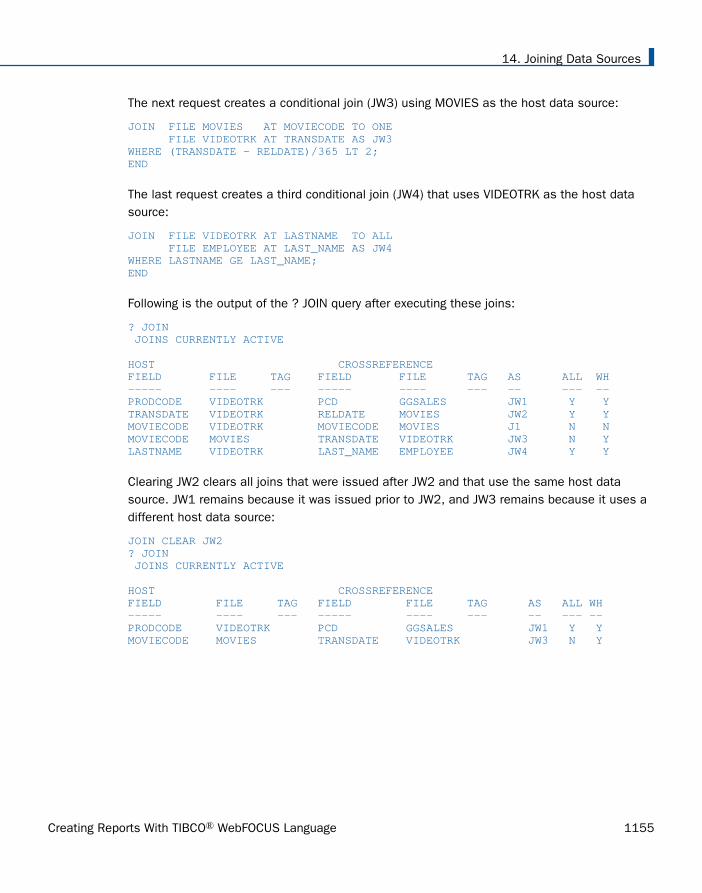
The next request creates a conditional join (JW3) using MOVIES as the host data source:
JOIN FILE MOVIES AT MOVIECODE TO ONE FILE VIDEOTRK AT TRANSDATE AS JW3WHERE (TRANSDATE - RELDATE)/365 LT 2;END
The last request creates a third conditional join (JW4) that uses VIDEOTRK as the host datasource:
JOIN FILE VIDEOTRK AT LASTNAME TO ALL FILE EMPLOYEE AT LAST_NAME AS JW4WHERE LASTNAME GE LAST_NAME;END
Following is the output of the ? JOIN query after executing these joins:
? JOIN JOINS CURRENTLY ACTIVE HOST CROSSREFERENCEFIELD FILE TAG FIELD FILE TAG AS ALL WH----- ---- --- ----- ---- --- -- --- --PRODCODE VIDEOTRK PCD GGSALES JW1 Y YTRANSDATE VIDEOTRK RELDATE MOVIES JW2 Y YMOVIECODE VIDEOTRK MOVIECODE MOVIES J1 N NMOVIECODE MOVIES TRANSDATE VIDEOTRK JW3 N YLASTNAME VIDEOTRK LAST_NAME EMPLOYEE JW4 Y Y
Clearing JW2 clears all joins that were issued after JW2 and that use the same host datasource. JW1 remains because it was issued prior to JW2, and JW3 remains because it uses adifferent host data source:
JOIN CLEAR JW2? JOIN JOINS CURRENTLY ACTIVE HOST CROSSREFERENCEFIELD FILE TAG FIELD FILE TAG AS ALL WH----- ---- --- ----- ---- --- -- --- --PRODCODE VIDEOTRK PCD GGSALES JW1 Y YMOVIECODE MOVIES TRANSDATE VIDEOTRK JW3 N Y
14. Joining Data Sources
Creating Reports With TIBCO® WebFOCUS Language 1155

Clearing Joined Structures
1156

Chapter15Merging Data Sources
You can gather data for your reports by merging the contents of data structures with theMATCH command, or concatenating data sources with the MORE phrase, and reportingfrom the combined data.
In this chapter:
Merging Data
Types of MATCH Processing
MATCH Processing With Common High-Order Sort Fields
Fine-Tuning MATCH Processing
Universal Concatenation
Merging Concatenated Data Sources
Cartesian Product
Merging Data
You can merge two or more data sources, and specify which records to merge and which tosort out, using the MATCH command. The command creates a new data source (a HOLD file),into which it merges fields from the selected records. You can report from the new data sourceand use it as you would use any other HOLD file.
You select the records to be merged into the new data source by specifying sort fields in theMATCH command. You specify one set of sort fields (using the BY phrase), for the first datasource, and a second set of sort fields for the second data source. The MATCH commandcompares all sort fields that have been specified in common for both data sources, and thenmerges all records from the first data source whose sort values match those in the seconddata source into the new HOLD file. You can specify up to 128 sort sets. This includes thenumber of common sort fields.
In addition to merging data source records that share values, you can merge records based onother relationships. For example, you can merge all records in each data source whose sortvalues are not matched in the other data source. Yet another type of merge combines allrecords from the first data source with any matching records from the second data source.
Creating Reports With TIBCO® WebFOCUS Language 1157

You can merge up to 16 sets of data in one Match request. For example, you can mergedifferent data sources, or data from the same data source.
Note: The limit of 16 applies to the most complex request. Simpler requests may be able tomerge more data sources.
Syntax: How to Merge Data Sources
The syntax of the MATCH command is similar to that of the TABLE command:
MATCH FILE file1 ...RUN FILE file2 ...[AFTER MATCH merge_phrase]RUN FILE file3 ...[AFTER MATCH merge_phrase]END
where:
file1
Is the first data source from which MATCH retrieves requested records.
merge_phrase
Specifies how the retrieved records from the files are to be compared. For details, see Merge Phrases on page 1165.
file2/file3
Are additional data sources from which MATCH retrieves requested records.
Note that a RUN command must follow each AFTER MATCH command (except for the last one).The END command must follow the final AFTER MATCH command.
MATCH generates a HOLD file. You can print the contents of the HOLD file using the PRINTcommand with the wildcard character (*).
Merging Data
1158
Types of MATCH Processing
There are two types of MATCH processing, grouped and ungrouped. Grouped processing is thenewer type of MATCH processing, and is the processing used by default. Ungroupedprocessing is the legacy MATCH processing. If you need to invoke legacy processing, you canuse the SET MATCHCOLUMNORDER = UNGROUPED command.
In all MATCH requests:
The two sides of the merge, the OLD and the NEW, are matched together based on theircommon high-order BY fields. In order for actual matching to take place between the OLDand NEW files, the high-order BY fields have to be the same. If there are no common high-order BY fields, the records are concatenated on a record-by-record basis.
The output selected from the OLD and NEW sides is based on the AFTER MATCHcommand.
The output stage of the MATCH differs for grouped and ungrouped processing.
With grouped processing, the output file has each common sort key (BY field) followed itsdisplay fields in the order specified in the request. As a result, ungrouped processing islimited to flat file output.
In contrast, with grouped processing, fields in the request are grouped with their highestcommon sort fields in the output file. This enables you to generate multi-segmenthierarchical output files in FOCUS or XFOCUS format by using multiple display commandson each side of the merge. In fact, you can create the output file using any format that hasa corresponding Master File.
For standard MATCH requests that use the same sort keys on both sides of the MATCH (OLDand NEW), grouped and ungrouped processing produce the same output.
However, in requests that use multiple display commands or differing sort fields on each sideof the merge, the grouping of fields with their sort keys can produce output files in which thefield order is different from the legacy processing. In any case where the new behaviorgenerates output that is different from previous results and not desireable, the SETMATCHCOLUMNORDER command is available to return the legacy results.
For example, if you use MATCH to create output that includes a list of products with columnsof aggregations based on differing sorts, MATCHCOLUMNORDER=UNGROUPED will ensure thatthe sequence of the column output will remain what it was in the past.
15. Merging Data Sources
Creating Reports With TIBCO® WebFOCUS Language 1159

The way MATCH merges data depends on the order in which you name data sources in therequest, the BY fields, display commands, the type of processing, and the merge phrases youuse. In general, however, processing is as follows:
1. MATCH retrieves requested records from the first data source you name, and writes themto a temporary work area.
2. MATCH retrieves requested records from the second data source you name, and writesthem to a temporary work area.
3. It compares the common high-order sort fields from the retrieved records as specified inthe merge phrase (for example, OLD-OR-NEW). For more information, see Merge Phrases onpage 1165.
4. If the default grouped processing is in effect, it may re-order the fields to group them undertheir common sort fields.
5. It writes the merged results of the comparison to a temporary data source (if there aremore MATCH operations). It cycles through all data sources named until END isencountered.
6. It writes final records to the HOLD file.
Syntax: How to Controlling MATCH Processing
SET MATCHCOLUMNORDER = {GROUPED|UNGROUPED}
where:
GROUPED
Groups fields in the output file under their common high-order sort fields. This is thedefault value.
UNGROUPED
Does not group fields in the output file with their common hig-order sort fields, but laysthem out as specified in the MATCH request.
Reference: Usage Notes for Match Requests
With ungrouped processing, you cannot specify a format for the HOLD file generated byMATCH. It will be created as a single-segment BINARY or ALPHA HOLD file, depending onthe value of the HOLDFORMAT parameter. The merge process does not change the originaldata sources.
Types of MATCH Processing
1160

Alias names are assigned sequentially (E01, E02, ...) in the HOLD Master File that resultsfrom the MATCH request. When the same field name is used mutliple times in the MATCH,users distinguish between them in requests against the HOLD file by referencing thesealias names instead of the field names.
With grouped processing, fields are rearranged in the Master File, and this causes the aliasnames to represent different fields from the same alias names assigned with ungroupedprocessing. This can produce different results if you switch from one type of processing tothe other.
To avoid using alias names, use the AS phrase in your MATCH request to create distinctfield names (except for the common high-order BY fields, which have to be the same), anduse those field names in requests against the HOLD file.
The ACROSS, BY HIGHEST/LOWEST n, IN-GROUPS-OF, WHERE TOTAL, and IF TOTALphrases, and the COMPUTE command, are not permitted in a MATCH request. You can,however, use the DEFINE command.
Up to 128 BY phrases and the maximun number of display fields can be used in eachMATCH request. The count of sort sets includes the number of common sort fields. Themaximum number of display fields is determined by a combination of factors.
For details, see Displaying Report Data on page 39.
You must specify at least one BY field for each file used in the MATCH request.
When used with MATCH, the SET HOLDLIST parameter behaves as if HOLDLIST were set toALL.
The following prefix operators are not supported in MATCH requests: DST., DST.CNT., RNK.,ST., and CT.
15. Merging Data Sources
Creating Reports With TIBCO® WebFOCUS Language 1161

Example: Merging Data Sources
In the following request, the high-order sort field is the same for both files, so the result is thesame using grouped and ungrouped processing.
MATCH FILE EDUCFILESUM COURSE_CODEBY EMP_IDRUNFILE EMPLOYEESUM LAST_NAME AND FIRST_NAMEBY EMP_ID BY CURR_SALAFTER MATCH HOLD OLD-OR-NEWEND-******************************-* PRINT CONTENTS OF HOLD FILE-******************************TABLE FILE HOLDPRINT *END
The merge phrase used in this example was OLD-OR-NEW. This means that records from boththe first (old) data source plus the records from the second (new) data source appear in theHOLD file.
The output is:
EMP_ID COURSE_CODE CURR_SAL LAST_NAME FIRST_NAME------ ----------- -------- --------- ----------071382660 101 $11,000.00 STEVENS ALFRED 112847612 103 $13,200.00 SMITH MARY 117593129 203 $18,480.00 JONES DIANE 119265415 108 $9,500.00 SMITH RICHARD 119329144 $29,700.00 BANNING JOHN 123764317 $26,862.00 IRVING JOAN 126724188 $21,120.00 ROMANS ANTHONY 212289111 103 $.00 219984371 $18,480.00 MCCOY JOHN 315548712 108 $.00 326179357 301 $21,780.00 BLACKWOOD ROSEMARIE 451123478 101 $16,100.00 MCKNIGHT ROGER 543729165 $9,000.00 GREENSPAN MARY 818692173 302 $27,062.00 CROSS BARBARA
Types of MATCH Processing
1162

Example: Comparing Grouped and Ungrouped Processing
The following MATCH request has two SUM commands and one PRINT command for each file,with all sort fields common to both files. The SET MATCHCOLUMNORDER = UNGROUPEDcommand is issued to invoke legacy processing.
SET MATCHCOLUMNORDER = UNGROUPEDMATCH FILE GGSALESSUM DOLLARSBY ST SUM BUDDOLLARS BY ST BY CITYPRINT UNITS BY ST BY CITY BY CATEGORYRUNFILE GGSALESSUM DOLLARSBY STSUM BUDDOLLARS BY ST BY CITYPRINT BUDUNITS BY ST BY CITY BY CATEGORYAFTER MATCH HOLD OLD-OR-NEWENDTABLE FILE HOLD PRINT *ON TABLE SET PAGE NOLEADON TABLE SET STYLE *TYPE=REPORT, GRID=OFF, SIZE=9,$ENDSTYLEEND
The HOLD Master File follows. Since the sort fields are common to both files, the two fileswere merged based on those fields. However, note that the order of fields in the Master Filefollows the order in the request, the highest-level sort field followed by its display field, thenthe next sort field followed by its display fields, and so on.
FILENAME=HOLD, SUFFIX=FIX , IOTYPE=BINARY, $ SEGMENT=HOLD, SEGTYPE=S1, $ FIELDNAME=ST, ALIAS=E01, USAGE=A02, ACTUAL=A04, $ FIELDNAME=DOLLARS, ALIAS=E02, USAGE=I08, ACTUAL=I04, $ FIELDNAME=CITY, ALIAS=E03, USAGE=A20, ACTUAL=A20, $ FIELDNAME=BUDDOLLARS, ALIAS=E04, USAGE=I08, ACTUAL=I04, $ FIELDNAME=CATEGORY, ALIAS=E05, USAGE=A11, ACTUAL=A12, $ FIELDNAME=UNITS, ALIAS=E06, USAGE=I08, ACTUAL=I04, $ FIELDNAME=DOLLARS, ALIAS=E07, USAGE=I08, ACTUAL=I04, $ FIELDNAME=BUDDOLLARS, ALIAS=E08, USAGE=I08, ACTUAL=I04, $ FIELDNAME=BUDUNITS, ALIAS=E09, USAGE=I08, ACTUAL=I04, $
15. Merging Data Sources
Creating Reports With TIBCO® WebFOCUS Language 1163

The partial output is shown in the following image.
Changing the UNGROUPED setting to GROUPED produces the following Master File. The fieldsthat have the same common sort fields from both files are moved to be under those sort fieldsin the Master File.
FILENAME=HOLD, SUFFIX=FIX , IOTYPE=BINARY, $ SEGMENT=HOLD, SEGTYPE=S1, $ FIELDNAME=ST, ALIAS=E01, USAGE=A02, ACTUAL=A04, $ FIELDNAME=DOLLARS, ALIAS=E02, USAGE=I08, ACTUAL=I04, $ FIELDNAME=DOLLARS, ALIAS=E03, USAGE=I08, ACTUAL=I04, $ FIELDNAME=CITY, ALIAS=E04, USAGE=A20, ACTUAL=A20, $ FIELDNAME=BUDDOLLARS, ALIAS=E05, USAGE=I08, ACTUAL=I04, $ FIELDNAME=BUDDOLLARS, ALIAS=E06, USAGE=I08, ACTUAL=I04, $ FIELDNAME=CATEGORY, ALIAS=E07, USAGE=A11, ACTUAL=A12, $ FIELDNAME=UNITS, ALIAS=E08, USAGE=I08, ACTUAL=I04, $ FIELDNAME=BUDUNITS, ALIAS=E09, USAGE=I08, ACTUAL=I04, $
The partial output is shown in the following image.
For the request that uses the GROUPED value for MATCHCOLUMNORDER, you can change theHOLD command to produce a FORMAT FOCUS output file, as follows.
AFTER MATCH HOLD FORMAT FOCUS OLD-OR-NEW
Types of MATCH Processing
1164

The following hierarchical multi-segment Master File is generated.
FILENAME=HOLD , SUFFIX=FOC , $ SEGMENT=SEG01, SEGTYPE=S1, $ FIELDNAME=ST, ALIAS=E01, USAGE=A02, TITLE='State', DESCRIPTION='State', $ FIELDNAME=DOLLARS, ALIAS=E02, USAGE=I08, TITLE='Dollar Sales', DESCRIPTION='Total dollar amount of reported sales', $ FIELDNAME=DOLLARS, ALIAS=E03, USAGE=I08, TITLE='Dollar Sales', DESCRIPTION='Total dollar amount of reported sales', $ SEGMENT=SEG02, SEGTYPE=S1, PARENT=SEG01, $ FIELDNAME=CITY, ALIAS=E04, USAGE=A20, TITLE='City', DESCRIPTION='City', $ FIELDNAME=BUDDOLLARS, ALIAS=E05, USAGE=I08, TITLE='Budget Dollars', DESCRIPTION='Total sales quota in dollars', $ FIELDNAME=BUDDOLLARS, ALIAS=E06, USAGE=I08, TITLE='Budget Dollars', DESCRIPTION='Total sales quota in dollars', $ SEGMENT=SEG03, SEGTYPE=S2, PARENT=SEG02, $ FIELDNAME=CATEGORY, ALIAS=E07, USAGE=A11, TITLE='Category', DESCRIPTION='Product category', $ FIELDNAME=FOCLIST, ALIAS=E08, USAGE=I5, $ FIELDNAME=UNITS, ALIAS=E09, USAGE=I08, TITLE='Unit Sales', DESCRIPTION='Number of units sold', $ SEGMENT=SEG04, SEGTYPE=S1, PARENT=SEG03, $ FIELDNAME=FOCLIST, ALIAS=E10, USAGE=I5, $ FIELDNAME=BUDUNITS, ALIAS=E11, USAGE=I08, TITLE='Budget Units', DESCRIPTION='Number of units budgeted', $
Reference: Merge Phrases
MATCH logic depends on the concept of old and new data sources. Old refers to the first datasource named in the request, and new refers to the second data source. The result of eachmerge creates a HOLD file until the END command is encountered.
15. Merging Data Sources
Creating Reports With TIBCO® WebFOCUS Language 1165

The following diagram illustrates the general merge process:
Types of MATCH Processing
1166

Syntax: How to Specify Merge Phrases
AFTER MATCH HOLD [AS 'name'] mergetype
where:
AS 'name'
Specifies the name of the extract data source created by the MATCH command. Thedefault is HOLD.
mergetype
Specifies how the retrieved records from the files are to be compared.
The results of each phrase are graphically represented using Venn diagrams. In thediagrams, the left circle represents the old data source, the right circle represents the newdata source, and the shaded areas represent the data that is written to the HOLD file.
OLD-OR-NEW specifies that all records from both the old data source and the new datasource appear in the HOLD file. This is the default if the AFTER MATCH line is omitted.
OLD-AND-NEW specifies that records that appear in both the old and new data sourcesappear in the HOLD file. (The intersection of the sets.)
OLD-NOT-NEW specifies that records that appear only in the old data source appear in theHOLD file.
15. Merging Data Sources
Creating Reports With TIBCO® WebFOCUS Language 1167

NEW-NOT-OLD specifies that records that appear only in the new data source appear in theHOLD file.
OLD-NOR-NEW specifies that only records that are in the old data source but not in the newdata source, or in the new data source but not in the old, appear in the HOLD file (thecomplete set of non-matching records from both data sources).
OLD specifies that all records from the old data source, and any matching records from thenew data source, are merged into the HOLD file.
NEW specifies that all records from the new data source, and any matching records fromthe old data source, are merged into the HOLD file.
MATCH Processing With Common High-Order Sort Fields
When you construct your MATCH so that the first sort (BY) field (called the common high-ordersort field) used for both data sources is the same, the match compares the values of thecommon high-order sort fields. If the entire sequence of sort fields is common to both files, allare compared.
MATCH Processing With Common High-Order Sort Fields
1168
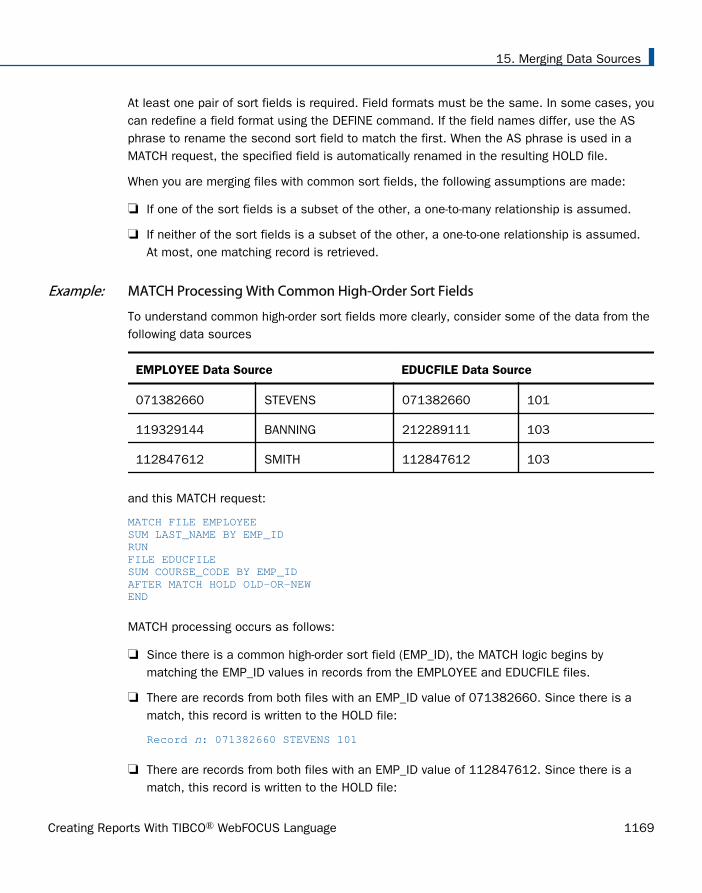
At least one pair of sort fields is required. Field formats must be the same. In some cases, youcan redefine a field format using the DEFINE command. If the field names differ, use the ASphrase to rename the second sort field to match the first. When the AS phrase is used in aMATCH request, the specified field is automatically renamed in the resulting HOLD file.
When you are merging files with common sort fields, the following assumptions are made:
If one of the sort fields is a subset of the other, a one-to-many relationship is assumed.
If neither of the sort fields is a subset of the other, a one-to-one relationship is assumed.At most, one matching record is retrieved.
Example: MATCH Processing With Common High-Order Sort Fields
To understand common high-order sort fields more clearly, consider some of the data from thefollowing data sources
EMPLOYEE Data Source EDUCFILE Data Source
071382660 STEVENS 071382660 101
119329144 BANNING 212289111 103
112847612 SMITH 112847612 103
and this MATCH request:
MATCH FILE EMPLOYEESUM LAST_NAME BY EMP_IDRUN FILE EDUCFILESUM COURSE_CODE BY EMP_IDAFTER MATCH HOLD OLD-OR-NEWEND
MATCH processing occurs as follows:
Since there is a common high-order sort field (EMP_ID), the MATCH logic begins bymatching the EMP_ID values in records from the EMPLOYEE and EDUCFILE files.
There are records from both files with an EMP_ID value of 071382660. Since there is amatch, this record is written to the HOLD file:
Record n: 071382660 STEVENS 101
There are records from both files with an EMP_ID value of 112847612. Since there is amatch, this record is written to the HOLD file:
15. Merging Data Sources
Creating Reports With TIBCO® WebFOCUS Language 1169

Record n: 112847612 SMITH 103
The records do not match where a record from the EMPLOYEE file has an EMP_ID value of119329144 and a record from the EDUCFILE file has an EMP_ID value of 212289111. Therecord with the lower value is written to the HOLD file and a space is inserted for themissing value:
Record n: 119329144 BANNING
Similarly, the 212289111 record exists only in the EDUCFILE file, and is written as:
Record n: 212289111 103
The following code produces a report of the records in the HOLD file:
TABLE FILE HOLDPRINT *END
The output is:
EMP_ID LAST_NAME COURSE_CODE
071382660 STEVENS 101
112847612 SMITH 103
117593129 JONES 203
119265415 SMITH 108
119329144 BANNING
123764317 IRVING
126724188 ROMANS
212289111 103
219984371 MCCOY
315548712 108
326179357 BLACKWOOD 301
451123478 MCKNIGHT 101
543729165 GREENSPAN
818692173 CROSS 302
MATCH Processing With Common High-Order Sort Fields
1170

Example: Merging With a Common High-Order Sort Field
This request combines data from the EMPLOYEE and EMPDATA data sources. The sort fieldsare EID and PIN.
MATCH FILE EMPLOYEEPRINT LN FN DPTBY EIDRUNFILE EMPDATAPRINT LN FN DEPTBY PINAFTER MATCH HOLD OLD-OR-NEWEND TABLE FILE HOLDPRINT *END
Example: Merging Without a Common High-Order Sort Field
If there are no common high-order sort fields, a match is performed on a record-by-recordbasis. The following request matches the data and produces the HOLD file:
MATCH FILE EMPLOYEEPRINT LAST_NAME AND FIRST_NAMEBY EMP_IDRUNFILE EMPDATAPRINT PINBY LASTNAMEBY FIRSTNAMEAFTER MATCH HOLD OLD-OR-NEWEND TABLE FILE HOLDPRINT *END
The retrieved records from the two data sources are written to the HOLD file; no values arecompared. The output is:
EMP_ID LAST_NAME FIRST_NAME LASTNAME FIRSTNAME
PIN
071382660 STEVENS ALFRED ADAMS RUTH 000000040
112847612 SMITH MARY ADDAMS PETER 000000050
117593129 JONES DIANE ANDERSON TIM 000000100
119265415 SMITH RICHARD BELLA MICHAEL 000000020
15. Merging Data Sources
Creating Reports With TIBCO® WebFOCUS Language 1171

119329144 BANNING JOHN CASSANOVA LOIS 000000030
123764317 IRVING JOAN CASTALANETTA
MARIE 000000270
126724188 ROMANS ANTHONY CHISOLM HENRY 000000360
219984371 MCCOY JOHN CONRAD ADAM 000000250
326179357 BLACKWOOD ROSEMARIE CONTI MARSHALL 000000410
451123478 MCKNIGHT ROGER CVEK MARCUS 000000130
543729165 GREENSPAN MARY DONATELLO ERICA 000000320
818692173 CROSS BARBARA DUBOIS ERIC 000000210
ELLNER DAVID 000000380
FERNSTEIN ERWIN 000000350
GORDON LAURA 000000180
GOTLIEB CHRIS 000000340
GRAFF ELAINE 000000390
HIRSCHMAN ROSE 000000160
KASHMAN YOLANDA 000000240
LASTRA KAREN 000000200
LEWIS CASSANDRA
000000220
.
.
.
Fine-Tuning MATCH Processing
You can fine-tune the MATCH process using the PRINT and SUM commands. To understandtheir difference, you should have an understanding of the one-to-many relationship: SUMgenerates one record from many, while PRINT displays each individual record. Through properchoices of BY fields, it is possible to use only the SUM command and get the same result thatPRINT would produce.
Fine-Tuning MATCH Processing
1172

Example: Using Display Commands in MATCH Processing
To illustrate the effects of PRINT and SUM on the MATCH process, consider data sources Aand B and the series of requests that follow:
A B F1 F2 F3 F1 F4 F5 1 x 100 1 a 102 y 200 1 b 20 2 c 30 2 d 40
Request 1: This request sums the fields F2 and F3 from file A, sums the fields F4 and F5 fromfile B, and uses F1 as the common high-order sort field.
MATCH FILE ASUM F2 AND F3 BY F1RUN FILE BSUM F4 AND F5 BY F1AFTER MATCH HOLD OLD-OR-NEWEND
The HOLD file contains the following data:
F1 F2 F3 F4 F5 1 x 100 b 302 y 200 d 70
Note that the resulting file contains only 1 record for each common high-order sort field.
Request 2: This request sums fields F2 and F3 from file A, prints fields F4 and F5 from file B,and uses F1 as the common high-order sort field.
MATCH FILE ASUM F2 AND F3 BY F1RUN FILE B PRINT F4 AND F5 BY F1AFTER MATCH HOLD OLD-OR-NEWEND
The HOLD file contains:
F1 F2 F3 F4 F5 1 x 100 a 101 x 100 b 202 y 200 c 302 y 200 d 40
15. Merging Data Sources
Creating Reports With TIBCO® WebFOCUS Language 1173

Note that the records from file A are duplicated for each record from file B.
Request 3: This request prints fields F2 and F3 from file A, sums fields F4 and F5 from file B,and uses F1 as the common high-order sort field.
MATCH FILE APRINT F2 AND F3 BY F1RUN FILE BSUM F4 AND F5 BY F1AFTER MATCH HOLD OLD-OR-NEWEND
The HOLD file contains:
F1 F2 F3 F4 F5 1 x 100 b 302 y 200 d 70
Note that each record from file A is included, but only the last record from file B for eachcommon high-order sort field is included.
Request 4: This request prints fields F2 and F3 from file A, prints fields F4 and F5 from file B,and uses F1 as the common high-order sort field.
MATCH FILE APRINT F2 AND F3 BY F1RUN FILE B PRINT F4 AND F5 BY F1AFTER MATCH HOLD OLD-OR-NEWEND
The HOLD file contains:
F1 F2 F3 F4 F5 1 x 100 a 101 0 b 202 y 200 c 302 0 d 40
Note the blank value for F2 and the 0 for F3.
Fine-Tuning MATCH Processing
1174

Request 5: This request sums the fields F2 and F3 from file A, sums the field F5 from file Band sorts it by field F1, the common high-order sort field, and by F4.
MATCH FILE ASUM F2 AND F3 BY F1RUN FILE BSUM F5 BY F1 BY F4AFTER MATCH HOLD OLD-OR-NEWEND
The HOLD file contains:
F1 F2 F3 F4 F5 1 x 100 a 101 x 100 b 202 y 200 c 302 y 200 d 40
Note that the records for file A are printed for every occurrence of the record in file B.
Universal Concatenation
With universal concatenation, you can retrieve data from unlike data sources in a singlerequest; all data, regardless of source, appears to come from a single file. The MORE phrasecan concatenate all types of data sources (such as, FOCUS, DB2, IMS, and VSAM), providedthey share corresponding fields with the same format. You can use WHERE and IF selectiontests in conjunction with MORE. For related information, see Selecting Records for Your Reporton page 217.
To use MORE, you must divide your request into:
One main request that retrieves the first data source and defines the data fields, sortingcriteria, and output format for all data.
Subrequests that define the data sources and fields to be concatenated to the data of themain request. The fields printed and sorted by the main request must exist in eachconcatenated data source. If they do not, you must create them as virtual fields.
During retrieval, data is gathered from each data source in turn, then all data is sorted and theoutput formatted as specified in the main request.
15. Merging Data Sources
Creating Reports With TIBCO® WebFOCUS Language 1175
Syntax: How to Concatenate Data Sources
The MORE phrase, which is accessible within the TABLE and MATCH commands, specifies howto concatenate data from sources with dissimilar Master Files.
{TABLE|MATCH} FILE file1main request MOREFILE file2 subrequest MOREFILE file3 subrequest MORE . . .{END|RUN}
where:
TABLE|MATCH
Begins the request that concatenates the data sources.
file1
Is the name of the first data source.
main request
Is a request, without END or RUN, that retrieves the first data source and defines the datafields, sorting criteria, and output format for all data. WHERE and IF criteria in the mainrequest apply only to file1.
When concatenating files within the TABLE command, you can also define calculatedvalues for the first data source.
MORE
Begins a subrequest. There is no limit to the number of subrequests, other than availablememory.
FILE file2
Defines file2 as the second data source for concatenation.
subrequest
Is a subrequest. Subrequests can only include WHERE and IF phrases.
Universal Concatenation
1176
END|RUN
Ends the request.
Example: Concatenating Data Sources
Both the EMPLOYEE and the EXPERSON data sources contain employee information. You canconcatenate their common data into a single file:
EMPLOYEE contains the field values EMP_ID=123456789 and CURR_SAL=50.00.
EXPERSON contains the field values SSN=987654321 and WAGE=100.00.
The following annotated request concatenates the two data sources:
DEFINE FILE EXPERSON 1. EMP_ID/A9 = SSN; CURR_SAL/D12.2 = WAGE; END 2. TABLE FILE EMPLOYEE PRINT CURR_SAL BY EMP_ID 3. MORE FILE EXPERSON END
1. The request must re-map the field names and formats in the EXPERSON data source tomatch those used in the main request.
2. The main request names the first data source in the concatenation, EMPLOYEE. It alsodefines the print and sort fields for both data sources.
3. The MORE phrase starts the subrequest that concatenates the next data source,EXPERSON. No display commands are allowed in the subrequest. IF and WHERE criteria arethe only report components permitted in a subrequest.
15. Merging Data Sources
Creating Reports With TIBCO® WebFOCUS Language 1177

Field Name and Format Matching
All fields referenced in the main request must either exist with the same names and formats inall the concatenated files, or be remapped to those names and formats using virtual fields.Referenced fields include those used in COMPUTE commands, headings, aggregation phrases,sort phrases, and the PRINT, LIST, SUM, COUNT, WRITE, or ADD commands.
A successful format match means that:
Usage Format Type Correspondence
A Format type and length must be equal.
I, F, D Format type must be the same.
P Format type and scale must be equal.
DATE (new) Format information (type, length, components, and order) mustalways correspond.
DATE (old) Edit options must be the same.
DATE -TIME Format information (type, length, components, and order) mustalways correspond.
Text (TX) fields and CLOB fields (if supported) cannot be concatenated.
Universal Concatenation
1178

Example: Matching Field Names and Formats
The following annotated example concatenates data from the EMPDATA and SALHIST datasources.
DEFINE FILE EMPDATA 1. NEWID/A11=EDIT (ID,'999-99-9999'); END DEFINE FILE SALHIST 2. NEWID/A11=EDIT (ID,'999-99-9999'); CSAL/D12.2M=OLDSALARY; END 3. TABLE FILE EMPDATA HEADING "EMPLOYEE SALARIES" " " PRINT CSAL BY NEWID 4. WHERE CSAL GT 65000 5. MORE FILE SALHIST 6. WHERE OLDSALARY GT 65000 END
1. Defines NEWID in the EMPDATA data source with the same name and format as the sortfield referenced in the main request.
2. Defines NEWID in the SALHIST data source with the same name and format as the sortfield referenced in the main request.
3. The main request. This contains all the formatting for the resulting report and names thefirst file to be concatenated. It also contains all printing and sorting information. The fieldsprinted and the sort fields must exist as real or DEFINE fields in each file.
4. The WHERE criterion in the main request applies only to the EMPDATA data source.
5. The MORE phrase concatenates the SALHIST data source to the EMPDATA data source.
6. This WHERE criterion applies only to the SALHIST data source. Notice that it references afield that is not defined in the EMPDATA data source.
The output is:
EMPLOYEE SALARIES
NEWID SALARY
000-00-0030 $70,000.00
15. Merging Data Sources
Creating Reports With TIBCO® WebFOCUS Language 1179
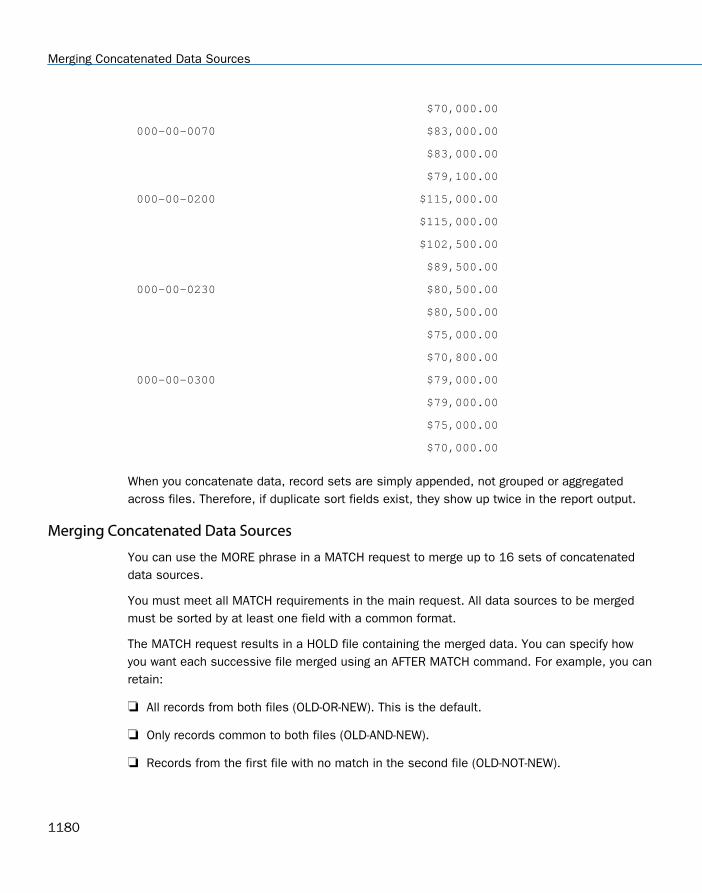
$70,000.00
000-00-0070 $83,000.00
$83,000.00
$79,100.00
000-00-0200 $115,000.00
$115,000.00
$102,500.00
$89,500.00
000-00-0230 $80,500.00
$80,500.00
$75,000.00
$70,800.00
000-00-0300 $79,000.00
$79,000.00
$75,000.00
$70,000.00
When you concatenate data, record sets are simply appended, not grouped or aggregatedacross files. Therefore, if duplicate sort fields exist, they show up twice in the report output.
Merging Concatenated Data Sources
You can use the MORE phrase in a MATCH request to merge up to 16 sets of concatenateddata sources.
You must meet all MATCH requirements in the main request. All data sources to be mergedmust be sorted by at least one field with a common format.
The MATCH request results in a HOLD file containing the merged data. You can specify howyou want each successive file merged using an AFTER MATCH command. For example, you canretain:
All records from both files (OLD-OR-NEW). This is the default.
Only records common to both files (OLD-AND-NEW).
Records from the first file with no match in the second file (OLD-NOT-NEW).
Merging Concatenated Data Sources
1180
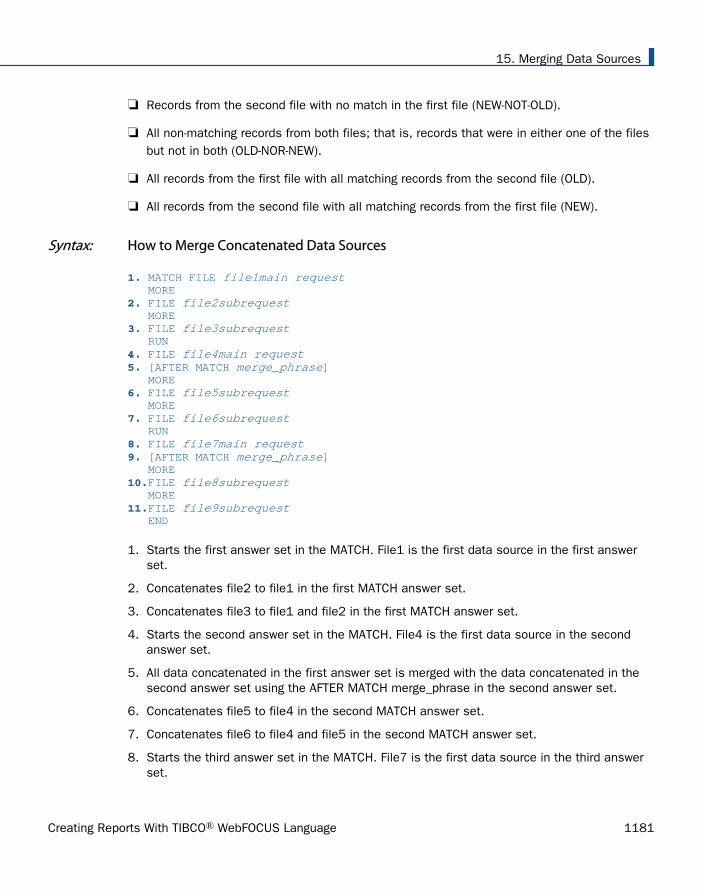
Records from the second file with no match in the first file (NEW-NOT-OLD).
All non-matching records from both files; that is, records that were in either one of the filesbut not in both (OLD-NOR-NEW).
All records from the first file with all matching records from the second file (OLD).
All records from the second file with all matching records from the first file (NEW).
Syntax: How to Merge Concatenated Data Sources
1. MATCH FILE file1main request MORE 2. FILE file2subrequest MORE 3. FILE file3subrequest RUN 4. FILE file4main request 5. [AFTER MATCH merge_phrase] MORE 6. FILE file5subrequest MORE 7. FILE file6subrequest RUN 8. FILE file7main request 9. [AFTER MATCH merge_phrase] MORE 10.FILE file8subrequest MORE 11.FILE file9subrequest END
1. Starts the first answer set in the MATCH. File1 is the first data source in the first answerset.
2. Concatenates file2 to file1 in the first MATCH answer set.
3. Concatenates file3 to file1 and file2 in the first MATCH answer set.
4. Starts the second answer set in the MATCH. File4 is the first data source in the secondanswer set.
5. All data concatenated in the first answer set is merged with the data concatenated in thesecond answer set using the AFTER MATCH merge_phrase in the second answer set.
6. Concatenates file5 to file4 in the second MATCH answer set.
7. Concatenates file6 to file4 and file5 in the second MATCH answer set.
8. Starts the third answer set in the MATCH. File7 is the first data source in the third answerset.
15. Merging Data Sources
Creating Reports With TIBCO® WebFOCUS Language 1181

9. All merged data from the first and second answer sets, now a HOLD file, is merged with thedata concatenated in the third answer set using the AFTER MATCH merge_phrase in thethird answer set. This final set of merged data is stored in a HOLD file.
10.Concatenates file8 to file7 in the third MATCH answer set.
11.Concatenates file9 to file7 and file8 in the third MATCH answer set.
Using Sort Fields in MATCH Requests
If the data sources in the MATCH share common high-order sort fields with identical namesand formats, the MATCH process merges records with matching sort field values from each ofthe files. If the two data sources in the MATCH have the same sort field with different names,you can change one of the names with an AS phrase.
If the files in the MATCH do not share a high-order sort field, the fields are not compared.Instead, the fields from the first record in each data source are merged to create the firstrecord in the HOLD file, and so on for all remaining records.
Merging Concatenated Data Sources
1182

Example: Merging Concatenated Data Sources With Common High-Order Sort Fields
The following annotated sample stored procedure illustrates MATCH with MORE, using acommon sort field:
1. DEFINE FILE EMPDATA CURR_SAL/D12.2M = CSAL; FIRST_NAME/A10 = FN; EID/A9 = PIN; END -*Start MATCH. 2. MATCH FILE EMPLOYEE SUM CURR_SAL AS 'CURRENT' FIRST_NAME AS 'FIRST' BY EID AS 'SSN' -*Concatenate file EMPDATA to EMPLOYEE to form first MATCH answer set. 3. MORE FILE EMPDATA RUN -*Second MATCH answer set: 4. FILE TRAINING PRINT EXPENSES 5. BY PIN AS 'SSN' 6. AFTER MATCH HOLD OLD-OR-NEW END -*Print merged file: 7. TABLE FILE HOLD PRINT * END
1. Defines the EMPDATA fields needed for concatenating it to EMPLOYEE.
2. Starts the MATCH and the main request in the concatenation. The main request defines allprinting and sorting for the concatenated files. The sort field is called SSN in the resultingfile.
3. Concatenates file EMPDATA to EMPLOYEE. This concatenated file becomes the OLD file inthe MATCH.
4. Creates the NEW file in the MATCH.
5. Uses an AS phrase to change the name of the sort field in the NEW file to the same nameas the sort field in the OLD file.
6. Defines the merge procedure. All records from the NEW file, the OLD file, and both files areincluded in the final HOLD file.
7. Prints the values from the merged file.
15. Merging Data Sources
Creating Reports With TIBCO® WebFOCUS Language 1183

The first page of output is:
SSN CURRENT FIRST EXPENSES--- ------- ----- --------000000010 $55,500.00 DANIEL 2,300.00000000020 $62,500.00 MICHAEL .000000030 $70,000.00 LOIS 2,600.00000000030 $70,000.00 LOIS 2,300.00000000040 $62,500.00 RUTH 3,400.00000000050 $54,100.00 PETER 3,300.00000000060 $55,500.00 DORINA .000000070 $83,000.00 EVELYN .000000080 $43,400.00 PAMELA 3,200.00000000080 $43,400.00 PAMELA 3,350.00000000090 $33,000.00 MARIANNE .000000100 $32,400.00 TIM 3,100.00000000110 $19,300.00 ANTHONY 1,800.00000000110 $19,300.00 ANTHONY 2,500.00000000110 $19,300.00 ANTHONY 2,400.00000000120 $49,500.00 KATE 2,200.00000000130 $62,500.00 MARCUS .
Merging Concatenated Data Sources
1184
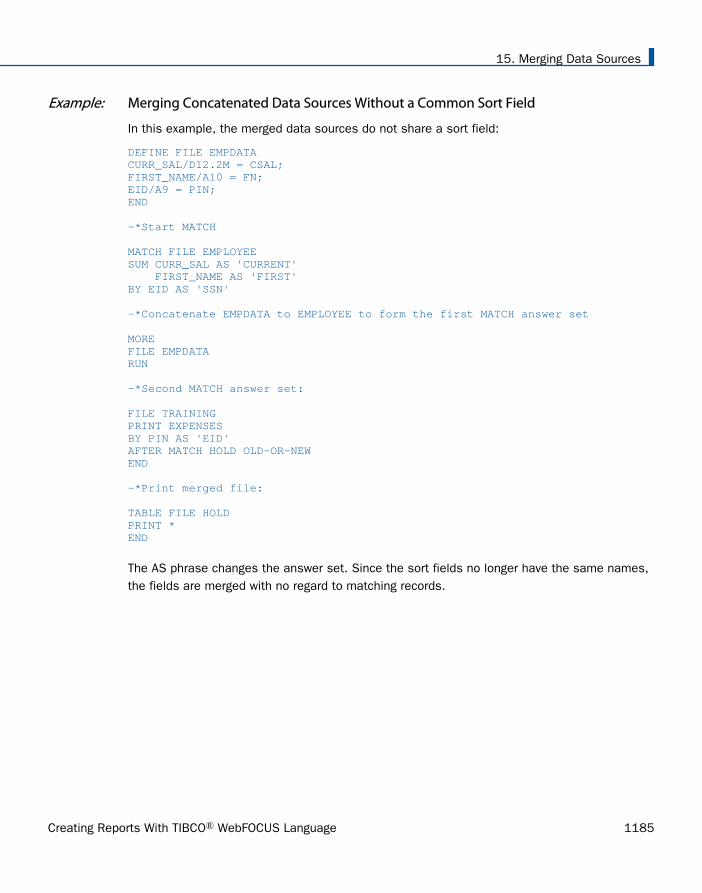
Example: Merging Concatenated Data Sources Without a Common Sort Field
In this example, the merged data sources do not share a sort field:
DEFINE FILE EMPDATACURR_SAL/D12.2M = CSAL;FIRST_NAME/A10 = FN;EID/A9 = PIN;END -*Start MATCH MATCH FILE EMPLOYEESUM CURR_SAL AS 'CURRENT' FIRST_NAME AS 'FIRST'BY EID AS 'SSN' -*Concatenate EMPDATA to EMPLOYEE to form the first MATCH answer set MOREFILE EMPDATARUN -*Second MATCH answer set: FILE TRAININGPRINT EXPENSESBY PIN AS 'EID'AFTER MATCH HOLD OLD-OR-NEWEND -*Print merged file: TABLE FILE HOLDPRINT *END
The AS phrase changes the answer set. Since the sort fields no longer have the same names,the fields are merged with no regard to matching records.
15. Merging Data Sources
Creating Reports With TIBCO® WebFOCUS Language 1185

The first page of output is:
SSN CURRENT FIRST EID EXPENSES--- ------- ----- --- --------000000010 $55,500.00 DANIEL 000000010 2,300.00000000020 $62,500.00 MICHAEL 000000030 2,600.00000000030 $70,000.00 LOIS 000000030 2,300.00000000040 $62,500.00 RUTH 000000040 3,400.00000000050 $54,100.00 PETER 000000050 3,300.00000000060 $55,500.00 DORINA 000000080 3,200.00000000070 $83,000.00 EVELYN 000000080 3,350.00000000080 $43,400.00 PAMELA 000000100 3,100.00000000090 $33,000.00 MARIANNE 000000110 1,800.00000000100 $32,400.00 TIM 000000110 2,500.00000000110 $19,300.00 ANTHONY 000000110 2,400.00000000120 $49,500.00 KATE 000000120 2,200.00000000130 $62,500.00 MARCUS 000000140 3,600.00000000140 $62,500.00 VERONICA 000000150 3,400.00000000150 $40,900.00 KARL 000000160 1,000.00000000160 $62,500.00 ROSE 000000180 1,250.00000000170 $30,800.00 WILLIAM 000000190 3,150.00
Cartesian Product
Cartesian product enables you to generate a report containing all combinations of non-relatedrecords or data instances in a multi-path request. This means that if a parent segment hasthree child instances on one path and two child instances on another path, when CARTESIANis ON a request that references the parent segment and both children generates 16 records.When CARTESIAN is OFF, the same request generates only three records.
For related information about controlling how selection tests are applied to child segments onindependent paths, see Selecting Records for Your Report on page 217.
Syntax: How to Enable/Disable Cartesian Product
SET CARTESIAN = {OFF|ON}
where:
OFF
Disables Cartesian product. OFF is the default setting.
ON
Enables Cartesian product and generates all possible combinations of non-related records.
SET CARTESIAN may also be issued within a request.
Reference: Usage Notes for Cartesian Product
Cartesian product is performed on the lowest segment common to all paths, whether or nota field in that segment is referenced.
Cartesian Product
1186

Short paths do not display in requests with Cartesian product.
The SET CARTESIAN parameter is disabled when ACROSS is specified, and a warningmessage is issued.
The SUM display command and the TOT. prefix operator have no effect on Cartesianproduct.
SUM, COMPUTE, and WITHIN in combination with the PRINT display command areperformed on the Cartesian product.
ON TABLE COLUMN-TOTAL is automatically generated on the Cartesian product.
NOSPLIT is disabled if specified in combination with the SET CARTESIAN parameter, and nowarning message is issued.
MATCH is not supported with the SET CARTESIAN parameter. A warning message is notissued if MATCH is requested, and the request is processed as if CARTESIAN is set to OFF.
TABLEF is not supported with the SET CARTESIAN parameter.
Example: Reporting With Cartesian Product
When CARTESIAN is set to ON, the following multi-path request produces a report containingall possible combinations of models and standards for each car:
SET CARTESIAN=ONTABLE FILE CARPRINT MODEL STANDARDBY CARIF CAR EQ 'JAGUAR'END
The output in an ASCII environment is:
CAR MODEL STANDARD
JAGUAR V12XKE AUTO 4 WHEEL DISC BRAKES
V12XKE AUTO POWER STEERING
V12XKE AUTO RECLINING BUCKET SEATS
V12XKE AUTO WHITEWALL RADIAL PLY TIRES
V12XKE AUTO WRAP AROUND BUMPERS
XJ12L AUTO 4 WHEEL DISC BRAKES
XJ12L AUTO POWER STEERING
15. Merging Data Sources
Creating Reports With TIBCO® WebFOCUS Language 1187

XJ12L AUTO RECLINING BUCKET SEATS
XJ12L AUTO WHITEWALL RADIAL PLY TIRES
XJ12L AUTO WRAP AROUND BUMPERS
When CARTESIAN is set to OFF (the default), the same request results in a report from the CARdata source containing a list of models and standards without logical relationships.
The output in an ASCII environment is:
CAR MODEL STANDARD
JAGUAR V12XKE AUTO 4 WHEEL DISC BRAKES
XJ12L AUTO POWER STEERING
. RECLINING BUCKET SEATS
. WHITEWALL RADIAL PLY TIRES
. WRAP AROUND BUMPERS
Cartesian Product
1188

Chapter16Formatting Reports: An Overview
To create an effective report, you need to account for:
Content. The data in your report.
Formatting. How to present that content to a reader in a way that achieves maximumimpact.
There are many formatting options that you can use to give your report a professionalappearance and affect how people read and interpret it. For example, you can control:
The appearance of the data, which you can change to emphasize important values.
The headings, footings, and other text with which you "frame" the data to give itcontext.
The layout of the report on the page or screen, which you can adjust for differentdisplay environments and for audiences with different vision needs.
The following topics provide an overview of formatting tabular reports (including FinancialModeling Language reports) and free-form reports. For information about formattinggraphs, see Creating a Graph on page 1745.
In this chapter:
What Kinds of Formatting Can I Do?
How to Specify Formatting in a Report
Standard and Legacy Formatting
Techniques for Quick and Easy Formatting
Navigating From a Report to Other Resources
What Kinds of Formatting Can I Do?
There are many kinds of formatting that you can apply to a report:
The appearance of the report data, such as its font, size, style (italic, bold, or underlined),color (of the foreground and the background), position, and justification. You can also drawboxes or lines around data. You can use these properties to emphasize critical values andto draw attention to important data relationships.
Creating Reports With TIBCO® WebFOCUS Language 1189

You can also select which character to use to mark decimal position, using either a period(.) or a comma (,), to match the convention of the country in which the report will be read.You can even choose which character to use to represent a null value and missing data.For more information, see Formatting Report Data on page 1699.
Providing context for data by "framing" it with headings, footings, and customized columntitles. You can include fields and images within headings and footings. As with data, youcan specify a heading, footing, and column title font, size, style, color, position, andjustification, as well as enclose it within boxes or lines. You can use these framing devicesto explain the context of the data and to engage the interest of the reader. For moreinformation, see Using Headings, Footings, Titles, and Labels on page 1519.
Laying out the report on the screen or printed page. You can choose the report margins,where to place headings and footings, where to place background images (watermarks),and how to arrange the report columns (adjusting the space around and between columns,adjusting column width and column order, and even stacking one column above another toreduce report width). You can visually distinguish between different columns, rows, or sortgroups using color and lines. If you wish, you can draw borders around parts of a report oraround the entire report.
You can lay out the report to optimize it for different display environments such as screensof different sizes and resolutions, and printed pages of different sizes. You can createmultiple report panes on a single page to print labels. You can even combine severalreports into a single file to display or print them as a group. For more information, see Laying Out the Report Page on page 1333.
Conditionally formatting a report based on the report data. You specify a condition that, atrun time, is automatically evaluated for each instance of the report component you specify,such as each value of a sort column. The formatting option is applied to each instance ofthe report component for which the condition is true. For example, in a sales report, youcan draw attention to sales staff who exceeded quota by making their names bold andusing a different color. For more information, see Controlling Report Formatting on page1221.
Choosing a display format, such as HTML (the default), PDF (Adobe Acrobat PortableDocument Format), Excel 2000, or PostScript, to suit the viewing and processing needs ofthe readers. For more information and a list of all the display formats available to you, see Choosing a Display Format on page 575.
What Kinds of Formatting Can I Do?
1190
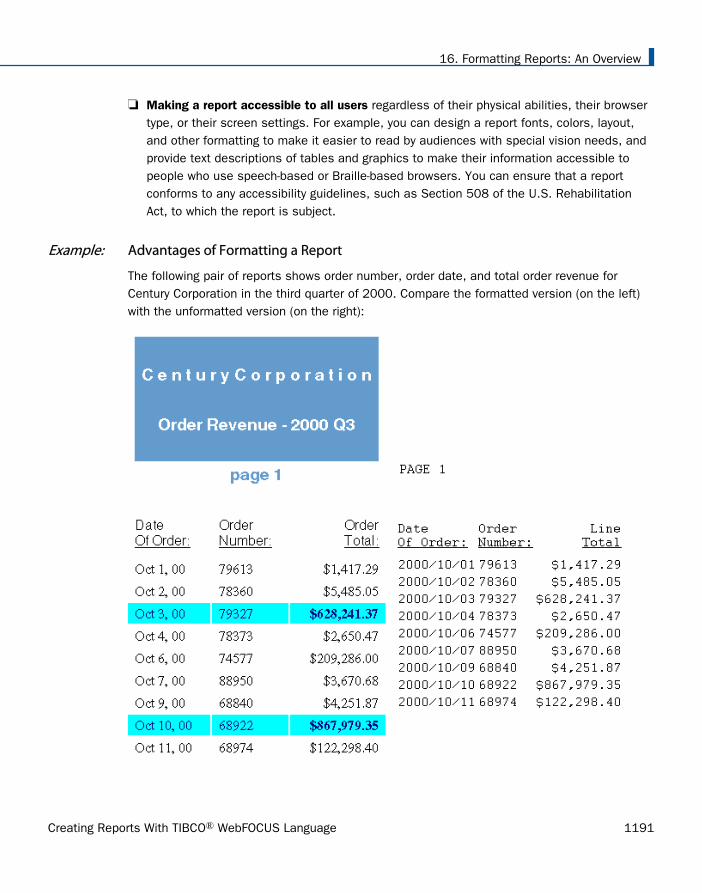
Making a report accessible to all users regardless of their physical abilities, their browsertype, or their screen settings. For example, you can design a report fonts, colors, layout,and other formatting to make it easier to read by audiences with special vision needs, andprovide text descriptions of tables and graphics to make their information accessible topeople who use speech-based or Braille-based browsers. You can ensure that a reportconforms to any accessibility guidelines, such as Section 508 of the U.S. RehabilitationAct, to which the report is subject.
Example: Advantages of Formatting a Report
The following pair of reports shows order number, order date, and total order revenue forCentury Corporation in the third quarter of 2000. Compare the formatted version (on the left)with the unformatted version (on the right):
16. Formatting Reports: An Overview
Creating Reports With TIBCO® WebFOCUS Language 1191

Consider how the formatting applied to the version on the left:
Catches the interest of the reader with a heading and use of color.
Makes the significance of the report clearer using the heading, and by changing the lastcolumn title from the default "Line Total" to "Order Total."
Makes the report easier and more appealing to read by increasing the space betweenrows, by reformatting the order date, and by using proportional fonts.
Draws the attention of the reader to important data. In this case, to orders exceeding$500,000, by conditionally formatting these rows with background color, font color, and (forthe order total) bold font style.
How to Specify Formatting in a Report
You can specify your report formatting using a style sheet. A style sheet is a set ofdeclarations that defines the appearance of a report. For some types of formatting, you mayneed to supplement style sheets with other features, such as SET parameters and TABLEcommands. In each case, this manual describes everything required to achieve a given kind offormatting.
Benefits of using style sheets. For some types of formatting you can choose between using astyle sheet or a different feature. Style sheets are usually preferred because they enable youto centralize and reuse formatting logic. This provides you with several advantages:
Productivity. By using just a few lines of code (a single style sheet), you can format dozensof reports, reducing the development time of each report.
Easy maintenance. You can change formatting for dozens of reports at one time by editinga single style sheet.
Consistent appearance. Your enterprise can guarantee a consistent look for its reports byassigning the same style sheet(s) to them.
Rapid reformatting. You can change the appearance of a report quickly and easily byswitching the style sheet assigned to it.
Prioritizing. You can focus on your first priority (report content), because you can quicklyaddress report presentation by applying an existing style sheet.
There are different kinds of style sheets that you can use to format a report. You can learnabout them and how to choose between them in How to Choose a Type of Style Sheet on page1195.
How to Specify Formatting in a Report
1192

Example: Specifying Formatting for the Order Revenue Report
This report displays the order number, order date, and total order revenue for CenturyCorporation for the third quarter of 2000:
The report is formatted by a WebFOCUS StyleSheet and by formatting commands in the reportprocedure itself. The procedure, Revenue.fex, is shown below, followed by the StyleSheet file,OrderRev.sty:
Revenue.fex
16. Formatting Reports: An Overview
Creating Reports With TIBCO® WebFOCUS Language 1193

TABLE FILE CENTORD 1.HEADING1. " " 1. "C e n t u r y C o r p o r a t i o n" 1. " " 1. "Order Revenue - 2000 Q3" 1. " " 1. "page <TABPAGENO" 1. " " 2. SUM ORDER_DATE/MtDY ORDER_NUM LINEPRICE AS 'Order,Total:' BY LOWEST 9 ORDER_DATE NOPRINT WHERE (ORDER_DATE GE '2000/10/01') AND (ORDER_DATE LE '2000/12/31'); ON TABLE SET ONLINE-FMT PDF 3. ON TABLE SET SQUEEZE ON4. ON TABLE SET STYLESHEET OrderRev END
OrderRev.sty
5. TYPE=Report, GRID=Off, UNITS=Inches, TOPGAP=0.06, BOTTOMGAP=0.06, $ 6. TYPE=Data, FONT='Times', $ 7. TYPE=Data, BACKCOLOR=Aqua, COLOR=Navy, 7. WHEN=LinePrice GT 500000, $ 7. TYPE=Data, COLUMN=LINEPRICE, BACKCOLOR=Aqua, COLOR=Navy, STYLE=Bold, 7. WHEN=LinePrice GT 500000, $ 8. TYPE=Title, FONT='Helvetica', $ 9. TYPE=Heading, FONT='Helvetica', STYLE=Bold, SIZE=14, JUSTIFY=Center, 9. BACKCOLOR=Dark Turquoise, COLOR=White, $ 9. TYPE=Heading, LINE=6, BACKCOLOR=White, COLOR=Dark Turquoise, $ 9. TYPE=Heading, LINE=7, BACKCOLOR=White, $
1. Adds a page heading to the report.
2. Reformats the order date from (for example) 2000/10/07 to Oct. 7, 00.
3. Aligns the heading with the report margins instead of the page margins.
4. Identifies a StyleSheet file to format the report.
5. Increases spacing between report lines.
6. Uses a proportional serif font for the report data.
7. Highlights each order that totals more than $500,000 by applying a navy font and an aquabackground, and by bolding the order total.
8. Uses a proportional sans serif font for the report column titles.
9. Formats the report heading by centering it, applying a larger sans serif font, coloring mostof it with a dark turquoise background and white lettering, and applying the inverse coloringto the page number (the sixth line of the heading).
This is only a summary of what these formatting instructions do. You can find completeexplanations in the topics that describe each formatting feature.
How to Specify Formatting in a Report
1194

The formatting logic that you apply to your own reports may be briefer or more extensive thanthis example, depending on the report and on what formatting you choose to apply.
How to Choose a Type of Style Sheet
You can choose between two types of style sheets to format a report:
WebFOCUS StyleSheets (often abbreviated to "StyleSheets"), the native WebFOCUS stylesheet language. These provide you with the flexibility to format reports in many displayformats, including HTML, PDF, Excel 2000, and PostScript. You can choose between savingthe StyleSheet as a separate file, which you can assign to multiple reports, or saving itwithin one report request.
If you are generating a report in HTML format, you can boost its performance, and increasethe number of formatting options available to it, by having the WebFOCUS StyleSheetdynamically generate an "internal" cascading style sheet (CSS). (CSS is the standard stylesheet language designed for HTML documents. The internal CSS generated by WebFOCUSis internal to the report output, instead of being saved as a separate file.) For moreinformation about generating an internal cascading style sheet, see Generating an InternalCascading Style Sheet for HTML Reports on page 1222.
External cascading style sheets, the standard style sheet language designed for HTMLdocuments. You can apply an external cascading style sheet to any WebFOCUS report inHTML format. (An external cascading style sheet is one that is saved as a separate file,instead of within the document it formats, and so is "external" to the document.)
How do you choose between the two types of style sheets? Consider choosing:
A WebFOCUS StyleSheet if:
You want to display a report in different display formats, such as PDF and Excel 2000.WebFOCUS StyleSheets are supported for many kinds of display formats, but cascadingstyle sheets work for reports in HTML format only.
An external cascading style sheet for any of the following reasons:
Your enterprise already uses cascading style sheets to format HTML documents, and itwants reports to conform to these same presentation guidelines.
You want to apply the same formatting to other kinds of HTML documents in yourenterprise.
16. Formatting Reports: An Overview
Creating Reports With TIBCO® WebFOCUS Language 1195

Standard and Legacy Formatting
New releases of WebFOCUS often introduce improved ways of formatting reports. Some ofthese new features are advances over earlier features that performed similar formatting, butwith fewer options or less functionality. The new feature becomes the standard, and the earlierone is then considered a "legacy" feature.
When you create a new application and have a choice between using a standard or a legacyfeature, we encourage you to use the standard feature. When you are maintaining an earlierapplication that incorporates a legacy feature, you may choose to retain the legacy feature tosave time, or to convert the application to the standard feature in order to leverage its newfunctionality.
As an example of the difference between standard and legacy formatting, consider thestandard and legacy methods of laying out a report on a page:
The standard way is to specify the page margins using TOPMARGIN, BOTTOMMARGIN,LEFTMARGIN, and RIGHTMARGIN. (You can apply these keywords as StyleSheet attributesor SET command parameters.) You can specify the margins in inches, centimeters, orpoints, as determined by UNITS (which you can also issue as a StyleSheet attribute or aSET command parameter). This is simple, and enables you to design reports the same waythat you design other kinds of documents.
The legacy way is to specify the height of the report output on the page, measured inreport lines (using the LINES parameter of the SET command); and the width of the report,measured in characters (using the WIDTH parameter of the SET command). The top andbottom margins will each be half the difference of the page height and the report height,measured in character lines; the left and right margins will each be half the difference ofthe page width and the report width, measured in characters. This legacy method limits youto using a monospace font, such as Courier.
Techniques for Quick and Easy Formatting
You can apply several formatting techniques to save yourself time and effort. Most of thesetechniques enable you to use code provided for you by WebFOCUS, or to leverage code thatyou write yourself:
Inheritance and overrides. Each report component inherits StyleSheet attributes from its"parent" report component. This powerful feature lets you define common formatting in asingle declaration for a parent component, and lets descendant components automaticallyinherit the formatting, while enabling you to override the inherited values when you wish. Bydesigning your StyleSheet to take advantage of inheritance, you can write less code andcan quickly update formatting for multiple report components.
Standard and Legacy Formatting
1196

For example, if you declare all the report data to be blue, all data in all columns will bedisplayed as blue. If you also declare all vertical sort (BY) columns to be orange, this willoverride the blue for sort columns, which will be displayed as orange. If you also declarethe EMP_ID sort column green, it will override the orange and be displayed as green. Formore information, see WebFOCUS StyleSheet Attribute Inheritance on page 1209.
Macros. If you are going to specify the same attribute and value in several declarations in aStyleSheet, you can create a "macro" that enables you to apply the attribute repeatedlythroughout the StyleSheet without coding it each time. Then, if you ever need to change thevalue, you can change it once (in the macro), and have the change applied automaticallythroughout the StyleSheet.
For example, if there are several parts of a report that you wish to emphasize (such as,titles of important columns, data values that exceed a threshold, and sort headings), andyou want all of these to be bold and purple, you could define a macro that sets font style tobold and color to purple, and then apply the macro to all of these report components. Formore information, see Reusing WebFOCUS StyleSheet Declarations With Macros on page1206.
Defaults. Many WebFOCUS StyleSheet attributes have default values. Instead of explicitlyspecifying every StyleSheet attribute, you can omit some and accept their defaults. Forexample, you can accept the default font instead of specifying a font. You can find eachdefault value of an attribute documented where its syntax is described.
Navigating From a Report to Other Resources
You can enable someone reading a report to navigate to other reports and Internet resources,and even to navigate within the report itself. Although navigation is not considered formatting,you can support some kinds of navigation by using a StyleSheet.
You can enable someone reading a report to:
Drill down to a related report. For more information, see Linking to Another Report on page822.
Link to a webpage, compose and send an email message, and connect to other kinds ofInternet resources. For more information, see Linking to a URL on page 827.
Execute JavaScript functions to perform additional analysis of report data. For moreinformation, see Linking to a JavaScript Function on page 835.
16. Formatting Reports: An Overview
Creating Reports With TIBCO® WebFOCUS Language 1197

Use a table of contents to jump directly to the data that interests that reader. The reportgenerates the table of contents dynamically based on sort values, and enables the readerto see any report section, or the entire report, simply by selecting it from the table ofcontents. For more information, see Navigating Sort Groups From a Table of Contents onpage 971.
Jump from one report page to the next, to the top of the current report page, or to thebeginning or end of the report. For more information, see Linking Report Pages on page1024.
Navigating From a Report to Other Resources
1198

Chapter17 Creating and Managing a WebFOCUSStyleSheet
A StyleSheet enables you to format and produce attractive reports that highlight keyinformation. With StyleSheets, you can specify various characteristics of your report andformat report components individually.
You can use a StyleSheet to:
Format report components individually.
Incorporate graphical elements.
Define dynamic hyperlinks.
Format data that meets specified conditions.
Create macros that enable you to streamline your formatting specifications.
You can also use external cascading style sheets and you can enable internal cascadingstyle sheets for HTML reports. For details, see Using an External Cascading Style Sheeton page 1295 and Controlling Report Formatting on page 1221.
Unless otherwise noted, all StyleSheet references in this chapter refer to WebFOCUSStyleSheets.
In this chapter:
Creating a WebFOCUS StyleSheet
General WebFOCUS StyleSheet Syntax
Reusing WebFOCUS StyleSheet Declarations With Macros
WebFOCUS StyleSheet Attribute Inheritance
Creating Reports With the ENWarm StyleSheet
Creating a WebFOCUS StyleSheet
You can create a StyleSheet:
Within a report request, as an inline StyleSheet. This is useful when you need to apply aStyleSheet to only one report. For details, see Creating a WebFOCUS StyleSheet Within aReport Request on page 1200.
Creating Reports With TIBCO® WebFOCUS Language 1199
Outside of a report request, as a separate file. This enables you to apply one StyleSheet tomultiple reports. For details, see Creating and Applying a WebFOCUS StyleSheet File on page1202.
Note: You can also include a StyleSheet file in another StyleSheet. This enables you to applythe styles in the included StyleSheet file, but override specific attributes. For information, see How to Include a StyleSheet File in Another StyleSheet on page 1201.
Creating a WebFOCUS StyleSheet Within a Report Request
You can create a StyleSheet within a report request. This enables you to create and maintainthe formatting for your report directly in the report request. This type of StyleSheet is known asan inline StyleSheet.
Syntax: How to Create a WebFOCUS StyleSheet Within a Report Request
ON TABLE SET STYLE[SHEET] * declaration [declaration]...[ENDSTYLE]
where:
SHEET
Can be omitted to make the command shorter, and has no effect on its behavior.
declarationIs a StyleSheet declaration. StyleSheet declarations usually specify the reportcomponent you want to format and the formatting you want to apply. For moreinformation about declarations, see General WebFOCUS StyleSheet Syntax on page1204.
ENDSTYLE
Indicates the end of an inline StyleSheet. You can omit ENDSTYLE if it is followedimmediately by END in the report request.
Example: Creating a WebFOCUS StyleSheet Within a Report Request
The following illustrates an inline StyleSheet. The StyleSheet is highlighted in the request.
Creating a WebFOCUS StyleSheet
1200

TABLE FILE GGSALESSUM UNITS DOLLARS BY CATEGORY BY PRODUCTHEADING"Sales Report"FOOTING CENTER"**End of Report**"ON TABLE SET PAGE-NUM OFF ON TABLE SET STYLE *TYPE=REPORT, GRID=OFF, $TYPE=HEADING, FONT=ARIAL, SIZE=12, STYLE=BOLD, $TYPE=TITLE, STYLE=ITALIC, $TYPE=DATA, COLUMN=N1, STYLE=BOLD, COLOR=BLUE, $TYPE=FOOTING, COLOR=RED, STYLE=BOLD, $ENDSTYLE END
The output is:
Syntax: How to Include a StyleSheet File in Another StyleSheet
INCLUDE = stysheet,$
17. Creating and Managing a WebFOCUS StyleSheet
Creating Reports With TIBCO® WebFOCUS Language 1201

where:
stysheet
Is the StyleSheet file to include.
StyleSheet declarations are applied in the order in which they are found in the StyleSheet.Therefore, if you want to include a StyleSheet file and then override some of the attributeswithin it, place the INCLUDE statement first, then the declarations that override specificattributes below it.
Example: Including a StyleSheet File in Another StyleSheet
The following request includes one of the distributed WebFOCUS StyleSheet Sin the inlinereport StyleSheet and overrides the heading style to be bold and italic.
HEADING CENTER "Test of Stylesheet with Include" " " SUM DOLLARS BUDDOLLARS BY CATEGORY ON TABLE HOLD AS STYLE2 FORMAT HTMLON TABLE SET STYLE * INCLUDE=IBFS:/FILE/IBI_HTML_DIR/javaassist/intl/EN/ENIADefault_combine.sty,$ TYPE=HEADING, STYLE = BOLD+ITALIC,$END
The output is shown in the following image.
Creating and Applying a WebFOCUS StyleSheet File
You can create a StyleSheet as a separate file and apply it to as many reports as you wish. AStyleSheet file contains only declarations and optional comments. Unlike an inline StyleSheet,a StyleSheet file does not contain the ON TABLE SET STYLESHEET and ENDSTYLE commands.You can apply a StyleSheet file to a report using the SET STYLESHEET command, as describedin How to Apply a WebFOCUS StyleSheet File to a Report on page 1203. For information aboutStyleSheet declarations, see General WebFOCUS StyleSheet Syntax on page 1204.
Creating a WebFOCUS StyleSheet
1202

As an alternative to creating a new StyleSheet file, you can use one of the sample StyleSheetfiles provided with WebFOCUS as a template.
Whether you create a StyleSheet file, or copy and customize an existing one, you need to storeit in the correct location, as described in Naming and Storing a WebFOCUS StyleSheet File onpage 1203.
Reference: Naming and Storing a WebFOCUS StyleSheet File
When you create a StyleSheet file to be used in:
WebFOCUS, upload the file to the WebFOCUS repository to a folder in which you arepermitted to create content, and that users running procedures that reference theStyleSheet are permitted to read.
If you create a StyleSheet for a self-service application, you can deploy your StyleSheet fileto the apps\baseapp directory where it can be shared by multiple applications. You canalso deploy the StyleSheet file to the same location as the report procedure it works with ifyou are only applying the file to that particular procedure.
You should name a StyleSheet file filename.sty, where filename can include letters, numbers,and underscores (_), and otherwise must be valid for the operating environments on which itresides.
Syntax: How to Apply a WebFOCUS StyleSheet File to a Report
To apply your StyleSheet file at the beginning of your report request, use
SET STYLE[SHEET] = stylesheet
To apply your StyleSheet file within your report request use
ON TABLE SET STYLE[SHEET] stylesheet
where:
SHEET
Can be omitted to make the command shorter, and has no effect on its behavior.
stylesheetIs the name of the StyleSheet file. Do not include the file extension.
17. Creating and Managing a WebFOCUS StyleSheet
Creating Reports With TIBCO® WebFOCUS Language 1203
General WebFOCUS StyleSheet Syntax
A StyleSheet consists of declarations that identify the report components you wish to formatand the formatting you wish to apply. A declaration usually begins with the TYPE attribute andis followed by the attribute=value pairs you assign to the report component. You can alsoinclude comments that provide context for your StyleSheet. Comments do not affectStyleSheet behavior. For details, see Adding a Comment to a WebFOCUS StyleSheet on page1206.
For information about identifying a report component, see Identifying a Report Component in aWebFOCUS StyleSheet on page 1251.
Syntax: How to Specify a WebFOCUS StyleSheet Declaration
Each StyleSheet declaration specifies a series of attributes in the form
attribute = value, [attribute = value, ...] $
where:
attributeIs the attribute you are specifying, such as TYPE, COLUMN, COLOR, or FONT.
valueIs the value you assign to the attribute.
Example: Sample WebFOCUS StyleSheet
Following is a request that includes an inline StyleSheet. The StyleSheet begins with ON TABLESET STYLE * and ends with ENDSTYLE.
General WebFOCUS StyleSheet Syntax
1204

TABLE FILE CENTORDHEADING" ""C e n t u r y C o r p o r a t i o n"" ""Order Revenue - 2000 Q3"" ""page <TABPAGENO"" "SUM ORDER_DATE/MtDY ORDER_NUM LINEPRICE AS 'Order,Total:'BY LOWEST 9 ORDER_DATE NOPRINTWHERE (ORDER_DATE GE '2000/10/01') AND (ORDER_DATE LE '2000/12/31');ON TABLE SET ONLINE-FMT HTMLON TABLE SET HTMLCSS ON ON TABLE SET STYLESHEET *TYPE=Report, GRID=Off, UNITS=Inches, $TYPE=Data, FONT='Times', $TYPE=Data, BACKCOLOR=Aqua, COLOR=Navy, WHEN=LinePrice GT 500000, $TYPE=Data, COLUMN=LinePrice, BACKCOLOR=Aqua, COLOR=Navy, STYLE=Bold, WHEN=LinePrice GT 500000, $TYPE=Title, FONT='Helvetica', $TYPE=Heading, FONT='Helvetica', STYLE=Bold, SIZE=14, JUSTIFY=Center, COLOR=White, BACKCOLOR=Dark Turquoise, $TYPE=Heading, LINE=6, BACKCOLOR=White, COLOR=Dark Turquoise, $TYPE=Heading, LINE=7, BACKCOLOR=White, $ENDSTYLE END
Improving WebFOCUS StyleSheet Readability
There are many ways to structure your StyleSheet declarations in order to make the StyleSheeteasy to read. You can do any one, or a combination, of the following:
Begin a declaration in any column using blank spaces or tabs.
Include blank lines between declarations.
Create declarations in all uppercase, all lowercase, or mixed case.
Use more than one declaration to format a single report component.
Include blank spaces or tabs in between the attribute, equal sign (=), value, comma, anddollar sign ($).
17. Creating and Managing a WebFOCUS StyleSheet
Creating Reports With TIBCO® WebFOCUS Language 1205

Split a single declaration across a line. The declaration will continue to be processed untilthe terminating dollar sign. For example, you can split a declaration like this:
TYPE=HEADING, FONT=ARIAL,SIZE=14, STYLE=BOLD, $
Split an attribute=value pair across a line. Use the backslash (\) character as continuationsyntax at the end of the first line if you are splitting an attribute or value in a declarationacross a line. For example:
TYPE=TITLE, COLUMN=N2, STY\LE=BOLD+ITALIC, COLOR=BLUE, $
Adding a Comment to a WebFOCUS StyleSheet
You can add comments to a StyleSheet to give context to a declaration. Comments do notaffect StyleSheet behavior.
You can add a comment:
On a declaration line. Add the desired text after the dollar sign ($). For example,
TYPE=HEADING, STYLE=BOLD, COLOR=BLUE, SIZE=14, $ Sample comment
On its own line. Begin the line with either a dollar sign ($), or a hyphen and an asterisk (-*),followed by the desired text. For example,
-* This is a sample comment$ This is another sample comment
Note: You can add comments anywhere in your request, not only in StyleSheets.
Reusing WebFOCUS StyleSheet Declarations With Macros
If you frequently use a group of attributes within a StyleSheet declaration, you can create aStyleSheet macro that groups the sequence of attributes together, enabling you to apply themrepeatedly throughout the StyleSheet without recoding them.
Defining a WebFOCUS StyleSheet Macro
A StyleSheet macro must be defined in the StyleSheet that references it and the macrodefinition must precede its use in the StyleSheet.
To define a macro, use the DEFMACRO attribute followed by the desired styling attributes.
Reusing WebFOCUS StyleSheet Declarations With Macros
1206
Syntax: How to Define a WebFOCUS StyleSheet Macro
DEFMACRO = macroname, attribute1 = value1, [attribute2 = value2,]... $
where:
macronameIs the name you assign to the macro you are creating.
attributeIs any StyleSheet attribute, such as an attribute to format a report component, inserta graphic, define a hyperlink, or apply a condition for conditional formatting (WHEN).
valueIs the value you want to assign to the attribute.
Applying a WebFOCUS StyleSheet Macro
A StyleSheet macro applies all the formatting defined in the macro to the report componentspecified in the declaration. To apply a macro, use the MACRO attribute. You can apply onemacro per declaration.
When applying a StyleSheet macro to a report component, you can override any attributedefined in the macro by specifying the same attribute with the new value in that declaration,following the MACRO attribute.
Syntax: How to Apply a WebFOCUS StyleSheet Macro
TYPE=type, [subtype,] MACRO=macroname, [condition,] $
where:
type
Is the report component you wish to affect. You can specify any report component.
subtype
Are any additional attributes, such as COLUMN, ACROSS, or ITEM, that are needed toidentify the report component to which you are applying the macro. For information abouthow to specify different types of report components, see Identifying a Report Component ina WebFOCUS StyleSheet on page 1251.
macroname
Is the name of the macro to apply to the specified report component. The macro must bedefined in the same StyleSheet.
17. Creating and Managing a WebFOCUS StyleSheet
Creating Reports With TIBCO® WebFOCUS Language 1207

condition
Is an optional WHEN attribute that you can specify if you wish to make this declarationconditional. For information about conditional declarations, see Controlling ReportFormatting on page 1221.
Example: Defining, Applying, and Overriding a WebFOCUS StyleSheet Macro
The following annotated example illustrates how to define, apply, and override macros in yourStyleSheet:
TABLE FILE GGSALES SUM UNITS DOLLARS BY CATEGORY BY PRODUCT HEADING "Sales Report" FOOTING "Sales Report - Page <TABPAGENO" ON TABLE SET STYLE * TYPE=REPORT, GRID=OFF,$ 1. DEFMACRO=A, STYLE=BOLD, SIZE=12, $2. DEFMACRO=BI, STYLE=BOLD+ITALIC, COLOR=PURPLE, $3. TYPE=HEADING, MACRO=A, $4. TYPE=FOOTING, MACRO=BI, COLOR=BLACK, $5. TYPE=DATA, COLUMN=N1, MACRO=BI, $ ENDSTYLE END
1. Defines the A macro.
2. Defines the BI macro.
3. Illustrates how the A macro is applied to the heading.
4. Illustrates how the BI macro is applied to the footing and is partially overridden by theattribute value pair COLOR=BLACK.
5. Illustrates how the BI macro is applied to the data in the BY sort field CATEGORY (specifiedby TYPE=DATA, COLUMN=N1).
Reusing WebFOCUS StyleSheet Declarations With Macros
1208

The output is:
WebFOCUS StyleSheet Attribute Inheritance
Each report component inherits StyleSheet attributes from its parent component. You canoverride an inherited attribute by explicitly specifying the same attribute with a different valuein the declaration for the child component. Since each component inherits automatically, youneed specify only those attributes that differ from, or that augment, the inherited attributes ofa component.
Inheritance enables you to define common formatting in a single declaration, and to apply itautomatically to all child components, except for those components for which you specifydifferent attribute values to override the inherited values. You benefit from less coding and amore concise StyleSheet.
For example, you could specify that all report titles should be blue and bold:
TYPE=TITLE, COLOR=BLUE, STYLE=BOLD, $
Each column title will inherit this formatting, appearing in blue and bold by default. However,you can choose to format one column differently, allowing it to inherit the blue color, butspecifying that it override the bold style and that it add a yellow background color:
17. Creating and Managing a WebFOCUS StyleSheet
Creating Reports With TIBCO® WebFOCUS Language 1209

TYPE=TITLE, COLUMN=N2, STYLE=-BOLD, BACKCOLOR=YELLOW, $
Reference: WebFOCUS StyleSheet Inheritance Hierarchy
Report components inherit StyleSheet attributes according to a hierarchy. The root of thehierarchy is the entire report, specified in a StyleSheet declaration by TYPE=REPORT.Declarations that omit TYPE default to TYPE=REPORT and are also applied to the entire report.Attributes that are unspecified for the entire report default to values that are determinedaccording to the display format of the report, such as HTML or PDF.
Each report component inherits from its parent component. Component X is a parent ofcomponent Y if X is specified by a subset of all the "type" attributes that specify Y, and ifthose shared type attributes have the same values. For example,
A component specified by TYPE=x, subtype=y, elementtype=z is a child of the componentspecified by TYPE=x, subtype=y and inherits attributes from it.
The component specified by TYPE=x, subtype=y is a child of the component specified byTYPE=x, and inherits from it.
The component specified by TYPE=x, where x is any value other than REPORT, is a child ofthe entire report (TYPE=REPORT) and inherits from it.
The component specified by TYPE=DATA, subtype=z does not inherit from TYPE=REPORT,subtype=z. The rule is that a style for individual components (subtype=z) can only inheritfrom a style with the same type. The only exception is that any style can inherit from thetop-level TYPE=REPORT component (the default style that has only TYPE=REPORT, with noother components, such as COLUMN, and so on).
For example, in the following syntax, by defining specific styling for the column at the DATAlevel, the overall style from TYPE=REPORT will be applied (FONT=TAHOMA), but notTYPE=REPORT, COLUMN=N2 (COLOR=GREEN). To apply the color green to the data incolumn 2, you have to explicitly make it green.
TYPE=REPORT, FONT=TAHOMA, $TYPE=REPORT, COLUMN=N2, COLOR=GREEN, $TYPE=DATA, COLUMN=N2, STYLE=+UNDERLINE+BOLD, $
When you use an external cascading style sheet (CSS), a report component inherits formattingfrom parent HTML elements, not from a parent report component. For more information, see Inheritance and External Cascading Style Sheets on page 1316.
Example: Augmenting Inherited WebFOCUS StyleSheet Attributes
The following illustrates how to augment inherited StyleSheet attributes. The StyleSheetdeclarations discussed in this example are highlighted in the report request.
WebFOCUS StyleSheet Attribute Inheritance
1210

The page heading in this report has two lines. The first StyleSheet declaration identifies thereport component HEADING to be formatted in bold and have 12-point font size. This willformat both lines of the heading with these styles.
To augment the format for the second line of the heading, a second declaration has beenadded that specifies the heading line number and the additional style characteristic. In thiscase we have added the declaration TYPE=HEADING, LINE=2, STYLE=ITALIC. The second lineof the heading will inherit the bold style and 12-point font size from the first HEADINGdeclaration, and will also receive the italic style defined in the second declaration.
TABLE FILE GGSALESSUM UNITS DOLLARSBY CATEGORY BY PRODUCTHEADING"Sales Report:""First Quarter"ON TABLE SET PAGE-NUM OFFON TABLE SET STYLE *TYPE=REPORT, GRID=OFF, $ TYPE=HEADING, STYLE=BOLD, SIZE=12, $TYPE=HEADING, LINE=2, STYLE=ITALIC, $ ENDSTYLEEND
The output is:
17. Creating and Managing a WebFOCUS StyleSheet
Creating Reports With TIBCO® WebFOCUS Language 1211

Example: Overriding Inherited WebFOCUS StyleSheet Attributes
The following illustrates how to override StyleSheet inheritance. The StyleSheet declarationsdiscussed in this example are highlighted in the report request.
TABLE FILE GGSALESHEADING"Sales Report"SUM UNITS DOLLARSBY CATEGORY BY PRODUCT BY DATE NOPRINTWHERE DATE GE 19960101 AND DATE LE 19960401ON TABLE SET STYLEMODE PAGEDON TABLE SET LINES 20FOOTING"Page <TABPAGENO of <TABLASTPAGE" ON TABLE SET STYLE * TYPE=REPORT, GRID=OFF, $ 1. TYPE=REPORT, BACKCOLOR=BLUE, COLOR=WHITE, $2. TYPE=HEADING, BACKCOLOR=WHITE, COLOR=BLACK, STYLE=BOLD, SIZE=12, $3. TYPE=FOOTING, SIZE=11, STYLE=BOLD+ITALIC, BACKCOLOR=WHITE, COLOR=BLACK, $4. TYPE=FOOTING, OBJECT=FIELD, ITEM=1, STYLE=-ITALIC, $ ENDSTYLE END
1. Formats the entire report (all components) to appear with a blue background and whitefont.
2. Overrides the inherited format for the page heading (defined in the TYPE=REPORTdeclaration) by specifying the background color as white and the font as black.
3. Formats the page footing as font size 11, with a bold and italic style and overrides thereport color by specifying BACKCOLOR=WHITE and COLOR=BLACK.
4. Since the <TABPAGENO system variable is part of the page footing, it inherits all of theformatting specified in the first TYPE=FOOTING declaration. This declaration overrides theinherited format for the page footing by specifying OBJECT=FIELD, ITEM=1, and removingthe italic style (STYLE=-ITALIC). Note that ITEM=1 needs to be specified since there are twoembedded fields in the footing.
WebFOCUS StyleSheet Attribute Inheritance
1212

The output is:
Creating Reports With the ENWarm StyleSheet
The ENWarm StyleSheet (ENWarm.sty) is the new default style sheet for the WebFOCUStoolset. Using a clean and simple layout and design, you can take advantage of this stylesheet when working with styling options for your reports and charts. Consistent text and colorschemes, as well as a common look and feel, provide you with predictability across all of yourreporting and charting activities.
In addition, there is an ENFlat StyleSheet, which offers the look and feel of ENWarm, with adifferent color scheme. It is recommend that you use this StyleSheet with active reports.
This section explains the specifications of the ENWarm StyleSheet and how it applies to reportstyling, and active reports.
17. Creating and Managing a WebFOCUS StyleSheet
Creating Reports With TIBCO® WebFOCUS Language 1213

Report Styling
The following topic explains the specifications of the ENWarm StyleSheet and how it apples toreport styling.
Data, Report, and Title Styling
Styling for the data, report, and title elements are shown in the following image.
Title
Bold
Report
Arial
9 pt
Font color: RGB (20, 20, 20)
Title line skip
Hyperlink color: RGB (51, 102, 255)
Page color: White
Data
Top border: RGB (219, 219, 219)
Bottom border: RGB (219, 219, 219)
Top gap: .05
Bottom gap: .05
Creating Reports With the ENWarm StyleSheet
1214

Headings and Footings Styling
The headers and footers are defined in your report and pages, as shown in the followingimage.
The ENWarm StyleSheet style settings are as follows:
Heading
14 pt
Bold
Font color: RGB (75, 75, 75)
Left justify
Page Heading
12 pt
Bold
Font color: RGB (75, 75, 75)
Left justify
Page Footing
10 pt
Font color: RGB (102, 102, 102)
Report Footing
10 pt
17. Creating and Managing a WebFOCUS StyleSheet
Creating Reports With TIBCO® WebFOCUS Language 1215

Font color: RGB (102, 102, 102)
Subheading and Subfooting Styling
Styling for the subheading element is shown in the following image.
Subheading
Background color: RGB (246, 246, 246)
Top border: RGB (219, 219, 219)
Subheading Data
Bold
Creating Reports With the ENWarm StyleSheet
1216

Styling for the subfooting element is shown in the following image.
Subfooting Data
Bold
Across Styling
Across styling for a report is shown in the following image.
17. Creating and Managing a WebFOCUS StyleSheet
Creating Reports With TIBCO® WebFOCUS Language 1217

Across Title
Right justify on outer BY field
Across Data
Center justify
Row Total Data
Bold
Subtotal and Column Total Styling
Subtotal
Bold
Column Total
Bold
Top Border: RGB (102, 102, 102)
Active Reports
The following topic explains the specifications of the ENWarm StyleSheet and how it apples toactive reports.
Creating Reports With the ENWarm StyleSheet
1218

Pagination, Menu, and Hover Text Styling in WebFOCUS Active Reports
Styling for pagination, menu, and hover text elements in WebFOCUS active reports are shownin the following image.
Pagination
Location: Bottom
Background color: None
Left justify
Menu
Text color: RGB (#6B6B6B)
17. Creating and Managing a WebFOCUS StyleSheet
Creating Reports With TIBCO® WebFOCUS Language 1219

Background color: RGB (#F8F8F8)
Hover text color: RGB (#495263)
Hover background color: RGB (#DFDFDF)
Hover
Background color: RGB (243, 243, 243)
AR Iconset
Blue
Usage Notes for ENWarm.sty
AHTML does not support borders.
Sort objects can contain multiple BY fields. In procedures where the sort object is the firstBY field, the ENWarm StyleSheet defines attributes specifically for the first BY field and,therefore, is not supported.
Sort Objects are not supported with any reference to a BY column in the StyleSheet.ENWarm styles the first BY subhead to distinguish a break.
Horizontal borders are used to distinguish each data row. When borders are present in areport, the following behavior will change:
Blank line between heading and titles.
Blank line between end of data and footing.
FML bar will not show the bar line.
Note: For scenarios involving these usage notes, use the endeflt StyleSheet as an alternativeto the ENWarm StyleSheet.
Creating Reports With the ENWarm StyleSheet
1220

Chapter18Controlling Report Formatting
When you format a report, you can control how the formatting is applied. You can:
Generate an internal cascading style sheet for HTML reports. This improvesperformance and provides more formatting options.
Apply formatting conditionally. You can make the appearance of a report conditionalbased on the report values. You can also make its links to other reports and Internetresources conditional. For example, in a monthly order report, you can specify that allunpaid orders be displayed in red and be linked to a recent payment history report ofa customer.
Select a scale for specifying measurements, such as the size of a report top margin.You can select an inch, centimeter, or point as the unit of measure.
Control the display of empty reports. If a report request returns no records, you canchoose to display the report without data, or to display a message stating there is nooutput.
In this chapter:
Generating an Internal Cascading Style Sheet for HTML Reports
Selecting a Unit of Measurement
Conditionally Formatting, Displaying, and Linking in a StyleSheet
Including Summary Lines, Underlines, Skipped Lines, and Page Breaks
Conditionally Including Summary Lines, Underlines, Skipped Lines, and Page Breaks
Controlling the Display of Empty Reports
Formatting a Report Using Only StyleSheet Defaults
Creating Reports With TIBCO® WebFOCUS Language 1221

Generating an Internal Cascading Style Sheet for HTML Reports
When you create a report in HTML format, code is generated that specifies how the report isformatted. You can set up your report to generate an internal cascading style sheet as part ofthis HTML code. This will:
Improve performance by significantly reducing the size of the HTML file, decreasingtransmission bandwidth, and displaying large reports more quickly.
Provide more formatting options for your HTML report. Some WebFOCUS StyleSheetattributes are supported for HTML display format only in reports that generate an internalcascading style sheet.
Internal cascading style sheets enable HTML support for the UNITS, BOTTOMMARGIN,TOPMARGIN, LEFTMARGIN, RIGHTMARGIN, SIZE, POSITION, WRAP, and PAGECOLORattributes. It also enables you to add and remove underlines from most report componentsand specify the starting position and size of an image. For details on the UNITS attribute,see Selecting a Unit of Measurement on page 1223. For more information on all otherattributes, see Laying Out the Report Page on page 1333.
You can generate an internal cascading style sheet and apply an external cascading stylesheet in the same report request. If any formatting instructions conflict, the internal cascadingstyle sheet should override the external cascading style sheet.
Note: In most cases, you should not specify native WebFOCUS StyleSheet attributes andexternal CSS classes in the same report or style sheet. For more information, see Using anExternal Cascading Style Sheet on page 1295.
Syntax: How to Generate an Internal Cascading Style Sheet
You can have an internal cascading style sheet created as part of the HTML code that isgenerated for a report in HTML format. To do so:
Outside of a report request, use
SET HTMLCSS = {ON|OFF}
Within a report request, use
ON TABLE SET HTMLCSS {ON|OFF}
where:
ON
Generates an internal cascading style sheet in the HTML output to control most aspects ofthe report appearance. ON is the default value.
Generating an Internal Cascading Style Sheet for HTML Reports
1222

OFF
Turns off the generation of an internal cascading style sheet. Instead, formatting tags areplaced in each HTML table cell used to create the report.
Reference: Requirements for Internal Cascading Style Sheets
If you wish to display a report formatted via an internal cascading style sheet (CSS), you musthave a web browser that supports cascading style sheets. Microsoft Internet Explorer Version5.0 or higher, support cascading style sheets.
Note that how an internal cascading style sheet formats your report is determined entirely byyour web browser support and implementation of cascading style sheets, not by WebFOCUS.Some web browsers may not fully support the latest CSS version, or may implement a CSSfeature in a different way.
Selecting a Unit of Measurement
You can select the unit of measurement for page margins and column width for HTML reportsthat generate an internal cascading style sheet, as well as PDF and PostScript reports. Inaddition, you can also select the unit of measurement for column position in PDF and PSreports. You can select inches, centimeters, or points as the unit of measure.
If you change the unit of measure, all existing measurements are automatically converted tothe new scale. For example, if the unit of measure is inches and the top margin for the reportis set to 1, and you later change the unit of measure to centimeters, the size of the top marginis automatically converted to 1 centimeter.
You can set the unit of measure using a:
StyleSheet by using the UNITS attribute.
SET command by using the UNITS parameter.
Syntax: How to Set the Unit of Measurement
To set a unit of measurement:
In a StyleSheet, add the following attribute
UNITS = units
Outside of a report request, use
SET UNITS = units
18. Controlling Report Formatting
Creating Reports With TIBCO® WebFOCUS Language 1223

Within a report request, use
ON TABLE SET UNITS units
where:
units
Is the unit of measure. Values can be:
INCHES, that specifies the unit of measure as inches. This is the default value.
CM, that specifies the unit of measure as centimeters.
PTS, that specifies the unit of measure as points. Points is a common measurementscale for typefaces.
Conditionally Formatting, Displaying, and Linking in a StyleSheet
You can conditionally format report components, display a graphic, and include links in yourreport based on the values in your report. Using conditional styling, you can:
Draw attention to particular items in the report.
Emphasize differences between significant values.
Customize the resources to which an end user navigates from different parts of the report.
To conditionally format reports, add the WHEN attribute to a StyleSheet declaration. The WHENattribute specifies a condition that is evaluated for each instance of a report component (thatis, for each cell of a tabular report column, each element in a graph, or each free-form reportpage). The StyleSheet declaration is applied to each instance that satisfies the condition, andis ignored by each instance that fails to satisfy the condition.
You can also apply sequential conditional formatting.
Note: The variables TABPAGENO and TABLASTPAGE cannot be used to define styling withconditional styling (WHEN).
Conditionally Formatting, Displaying, and Linking in a StyleSheet
1224

Applying Sequential Conditional Formatting
You can apply sequential conditional logic to a report component by creating a series ofdeclarations, each with a different condition. This is the StyleSheet equivalent of a sequenceof nested IF-THEN-ELSE statements. When several conditional declarations specify the samereport component (for example, the same column) and evaluate the same field in thecondition, they are processed together as a group. For each instance of the report component(for example, for each cell of a column):
1. The conditional declarations in the "group" are evaluated, in the order in which they arefound in the StyleSheet, until one of the conditions is satisfied. That declaration is thenapplied to that instance of the report component. The other conditional declarations in the"group," and any non-conditional declarations that specify the same report component andthe same attributes, are ignored for that instance.
2. If, however, none of the conditional declarations have been satisfied for that instance, thenthe first unconditional declaration for that report component that specifies the sameattribute(s) is applied to that instance.
3. Any unconditional declarations for that report component that specify other attributes (thatis, attributes that have not already been applied to the instance in Steps 1 or 2) are nowapplied to the instance.
4. The entire process is repeated for the next instance of the report component (for example,for the next cell of the column).
Syntax: How to Conditionally Format, Display, or Link in a StyleSheet
TYPE=type, [subtype,] attributes, WHEN=field1 operator {field2|value},$
or
TYPE=type, [subtype,] attributes, WHEN=FORECAST, $
where:
type
Is the value of the TYPE attribute. You can specify any report component. For details, see Identifying a Report Component in a WebFOCUS StyleSheet on page 1251.
subtype
Are any additional attributes, such as COLUMN, ACROSS, or ITEM, that are needed toidentify the report component to which you are applying the declaration.
attributes
Are the attributes in the StyleSheet declaration that are made conditional by the WHENattribute. They can include most formatting, graphic images, and hyperlink attributes.
18. Controlling Report Formatting
Creating Reports With TIBCO® WebFOCUS Language 1225

field1, field2
Identifies the report fields that are being compared. Each one can be:
The name of a display field or vertical or horizontal sort field in a graph or tabularreport. ACROSS values can be used as part of the conditional expressions used todefine styling attributes for each cell in the table.
A column reference in a graph or tabular report.
The name of an embedded field in the heading or footing of a free-form report.
If you wish to use a field that you do not want to display in the report, you can specify thefield in the report request, and use the NOPRINT option to prevent the field from beingdisplayed (for example, PRINT fieldname NOPRINT).
To apply a prefix operator to a field in a report, you can:
Use the same prefix operator in the WHEN attribute. You must refer to the field byname in the WHEN attribute (for example, WHEN=AVE.PRICE GT 300).
Refer to the field in the WHEN attribute by column position and omit the prefix operator(for example, WHEN=N3 GT 300). This is not supported for the ST. and CT. prefixoperators.
You cannot use compound boolean expressions with the WHEN attribute.
The field cannot be a packed (P) numeric field.
operator
Defines how the condition is satisfied. You can use these relational operators:
EQ where the condition is satisfied if the values on the left and right are equal. If thevalues being compared are alphanumeric, their case (uppercase, lowercase, or mixedcase) must match.
NE where the condition is satisfied if the values on the left and right are not equal.
LT where the condition is satisfied if the value on the left is less than the value on theright.
LE where the condition is satisfied if the value on the left is less than or equal to the valueon the right.
GT where the condition is satisfied if the value on the left is greater than the value on theright.
GE where the condition is satisfied if the value on the left is greater than or equal to thevalue on the right.
Conditionally Formatting, Displaying, and Linking in a StyleSheet
1226

value
Is a constant, such as a number, character string, or date. You must enclose non-numericconstants, such as character strings and dates, in single quotation marks.
Although you cannot use functions or operators here to specify the value, you can define atemporary field (COMPUTE or DEFINE) using functions and operators, use the temporaryfield in the report, and specify it here instead of a constant.
FORECAST
Identifies fields that are generated using the FORECAST command.
Example: Using Sequential Conditional Formatting
This example illustrates how to apply sequential conditional formatting to a report. This reportuses sequential conditional logic to format each row based on its order total (LINEPRICE).
TABLE FILE CENTORD HEADING "Order Revenue" " " SUM ORDER_DATE LINEPRICE AS 'Order,Total:' BY HIGHEST 10 ORDER_NUM ON TABLE SET PAGE-NUM OFF ON TABLE SET STYLESHEET * TYPE=REPORT, GRID=OFF, $ 1. TYPE=DATA, BACKCOLOR=AQUA, STYLE=BOLD+ITALIC, WHEN=LINEPRICE GT 500000, $2. TYPE=DATA, BACKCOLOR=YELLOW, STYLE=BOLD, WHEN=LINEPRICE GT 400000, $3. TYPE=DATA, BACKCOLOR=ORANGE, STYLE=ITALIC, WHEN=LINEPRICE GT 100000, $4. TYPE=DATA, BACKCOLOR=SILVER, FONT='Arial', $ TYPE=HEADING, FONT='Arial', STYLE=BOLD, SIZE=11, $ ENDSTYLE END
Notice that:
1. The first conditional declaration formats any rows whose order total is greater than500,000.
2. The second conditional declaration formats any rows whose order total is greater than400,000 and less than or equal to 500,000. This is because rows with an order totalgreater than 500,000 would have already been formatted by the first conditionaldeclaration.
18. Controlling Report Formatting
Creating Reports With TIBCO® WebFOCUS Language 1227
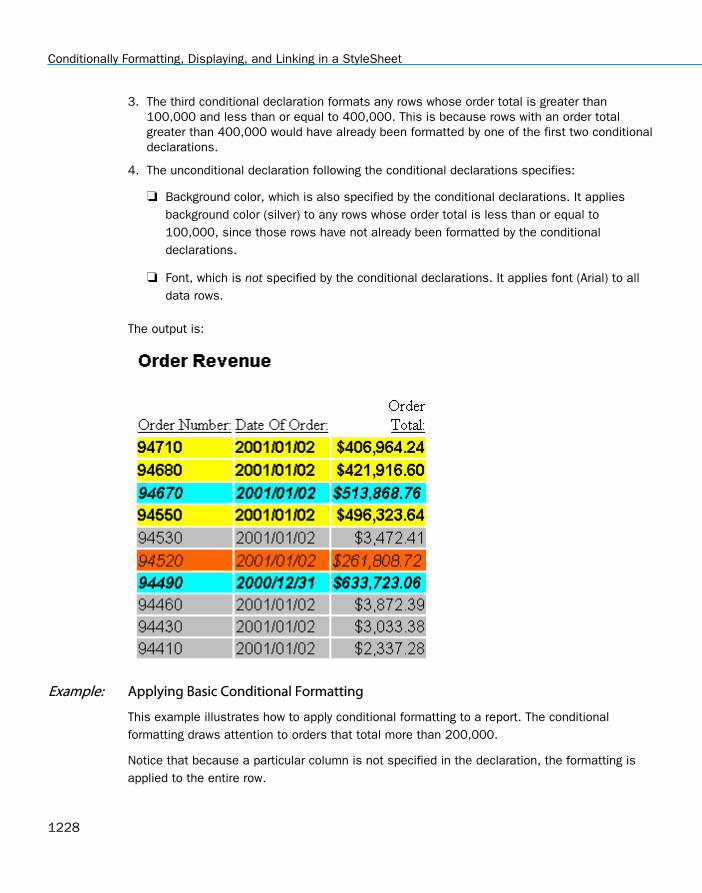
3. The third conditional declaration formats any rows whose order total is greater than100,000 and less than or equal to 400,000. This is because rows with an order totalgreater than 400,000 would have already been formatted by one of the first two conditionaldeclarations.
4. The unconditional declaration following the conditional declarations specifies:
Background color, which is also specified by the conditional declarations. It appliesbackground color (silver) to any rows whose order total is less than or equal to100,000, since those rows have not already been formatted by the conditionaldeclarations.
Font, which is not specified by the conditional declarations. It applies font (Arial) to alldata rows.
The output is:
Example: Applying Basic Conditional Formatting
This example illustrates how to apply conditional formatting to a report. The conditionalformatting draws attention to orders that total more than 200,000.
Notice that because a particular column is not specified in the declaration, the formatting isapplied to the entire row.
Conditionally Formatting, Displaying, and Linking in a StyleSheet
1228

TABLE FILE CENTORDHEADING"Order Revenue"" "SUM ORDER_DATE LINEPRICE AS 'Order,Total:'BY HIGHEST 10 ORDER_NUMON TABLE SET PAGE-NUM OFF ON TABLE SET STYLESHEET *TYPE=REPORT, GRID=OFF, $ TYPE=DATA, BACKCOLOR=AQUA, STYLE=BOLD, WHEN=LINEPRICE GT 200000, $ TYPE=HEADING, FONT='Arial', STYLE=BOLD, SIZE=11, $ENDSTYLE END
The output is:
18. Controlling Report Formatting
Creating Reports With TIBCO® WebFOCUS Language 1229
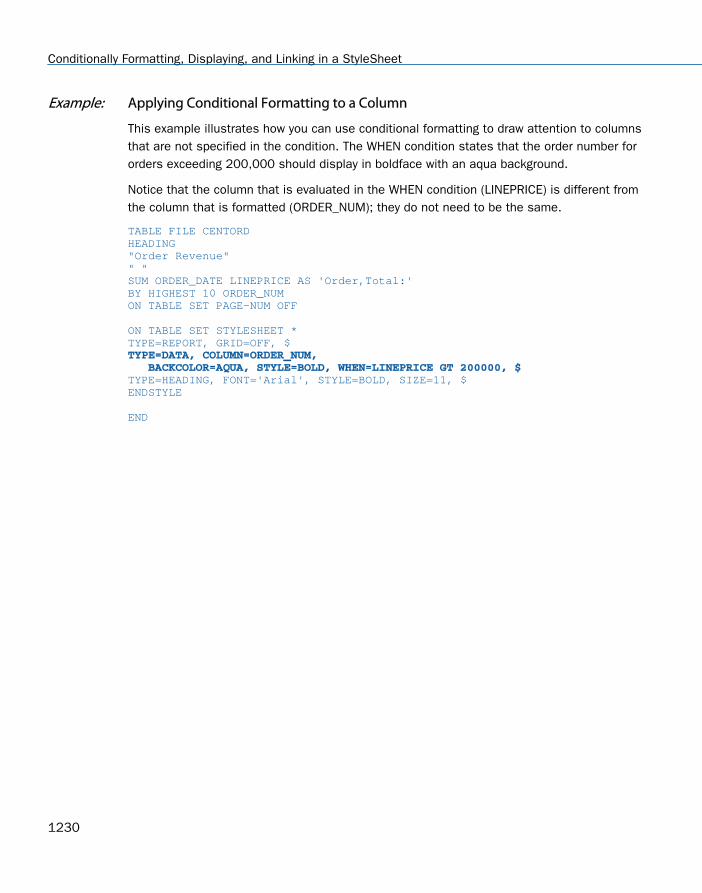
Example: Applying Conditional Formatting to a Column
This example illustrates how you can use conditional formatting to draw attention to columnsthat are not specified in the condition. The WHEN condition states that the order number fororders exceeding 200,000 should display in boldface with an aqua background.
Notice that the column that is evaluated in the WHEN condition (LINEPRICE) is different fromthe column that is formatted (ORDER_NUM); they do not need to be the same.
TABLE FILE CENTORDHEADING"Order Revenue"" "SUM ORDER_DATE LINEPRICE AS 'Order,Total:'BY HIGHEST 10 ORDER_NUMON TABLE SET PAGE-NUM OFF ON TABLE SET STYLESHEET *TYPE=REPORT, GRID=OFF, $ TYPE=DATA, COLUMN=ORDER_NUM, BACKCOLOR=AQUA, STYLE=BOLD, WHEN=LINEPRICE GT 200000, $ TYPE=HEADING, FONT='Arial', STYLE=BOLD, SIZE=11, $ENDSTYLE END
Conditionally Formatting, Displaying, and Linking in a StyleSheet
1230

The output is:
Example: Conditionally Styling an ACROSS Value
The example below demonstrates how an ACROSS value can be referenced using either theACROSS field name or the ACROSS column designator (A1, A2).
18. Controlling Report Formatting
Creating Reports With TIBCO® WebFOCUS Language 1231

In this example, the ACROSS values are used in conditional styling to set a unique backcolorfor all ACROSS columns in the Category Coffee, and additional font styling for the EspressoACROSS column.
SET ACROSSTITLE=SIDETABLE FILE GGSALESSUM DOLLARS/I8M AS ''BY REGIONBY STBY CITYACROSS CATEGORYACROSS PRODUCTWHERE CATEGORY EQ 'Coffee' OR 'Food';ON TABLE SET PAGE-NUM NOPAGEON TABLE NOTOTALON TABLE PCHOLD FORMAT PDFON TABLE SET HTMLCSS ONON TABLE SET STYLE *SQUEEZE=ON,UNITS=IN,ORIENTATION=PORTRAIT,$TYPE=REPORT,FONT='ARIAL',SIZE=10,BORDER=LIGHT,$TYPE=ACROSSTITLE,COLOR=WHITE, BACKCOLOR=GREY,$TYPE=ACROSSVALUE,COLOR=WHITE, BACKCOLOR=GREY,$ TYPE=TITLE,COLOR=WHITE, BACKCOLOR=GREY,$TYPE=DATA, ACROSSCOLUMN=DOLLARS, BACKCOLOR=THISTLE, WHEN=CATEGORY EQ 'Coffee',$TYPE=DATA, ACROSSCOLUMN=DOLLARS, STYLE=BOLD+ITALIC, WHEN=A2 EQ 'Espresso', $ENDSTYLEEND
The output is:
Conditionally Formatting, Displaying, and Linking in a StyleSheet
1232

Example: Conditionally Formatting a Data Visualization Bar Graph
This example illustrates how to apply conditional formatting to a data visualization bar graph.This report request incorporates a data visualization bar chart to graphically represent the datain the LINEPRICE column. It uses conditional formatting to draw attention to orders that totalmore than 200,000. It conditionally applies that formatting both to the data columns(TYPE=DATA) and to the bar graph (GRAPHTYPE=DATA).
Note that data visualization is only supported for HTML reports.
TABLE FILE CENTORDHEADING"Order Revenue"" "SUM ORDER_DATE LINEPRICE AS 'Order,Total:'BY HIGHEST 10 ORDER_NUMON TABLE SET PAGE-NUM OFF ON TABLE SET STYLESHEET *TYPE=REPORT, GRID=OFF, $ TYPE=DATA, BACKCOLOR=AQUA, STYLE=BOLD, WHEN=LINEPRICE GT 200000, $ GRAPHTYPE=DATA, COLUMN=LINEPRICE, $ GRAPHTYPE=DATA, GRAPHCOLOR=AQUA, WHEN=LINEPRICE GT 200000,$ TYPE=HEADING, FONT='Arial', STYLE=BOLD, SIZE=11, $ENDSTYLE END
18. Controlling Report Formatting
Creating Reports With TIBCO® WebFOCUS Language 1233
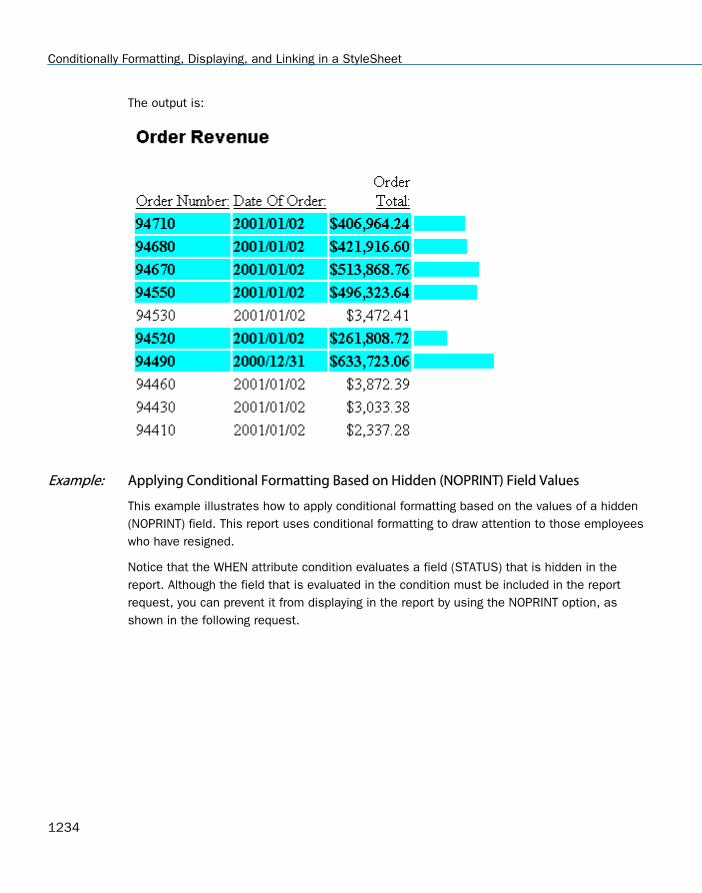
The output is:
Example: Applying Conditional Formatting Based on Hidden (NOPRINT) Field Values
This example illustrates how to apply conditional formatting based on the values of a hidden(NOPRINT) field. This report uses conditional formatting to draw attention to those employeeswho have resigned.
Notice that the WHEN attribute condition evaluates a field (STATUS) that is hidden in thereport. Although the field that is evaluated in the condition must be included in the reportrequest, you can prevent it from displaying in the report by using the NOPRINT option, asshown in the following request.
Conditionally Formatting, Displaying, and Linking in a StyleSheet
1234

TABLE FILE CENTHRHEADING"Employee List for Boston"" ""For Pay Levels 5+"" ""Resigned Employees Shown in <0>Red Bold"" " PRINT LNAME FNAME PAYSCALE STATUS NOPRINT BY ID_NUMWHERE PLANT EQ 'BOS' AND PAYSCALE GE 5ON TABLE SET PAGE-NUM OFF ON TABLE SET STYLESHEET *TYPE=REPORT, GRID=OFF, $ TYPE=DATA, COLUMN=LNAME, COLOR=RED, FONT='Arial', STYLE=BOLD, WHEN=STATUS EQ 'RESIGNED', $TYPE=DATA, COLUMN=FNAME, COLOR=RED, FONT='Arial', STYLE=BOLD, WHEN=STATUS EQ 'RESIGNED', $ TYPE=HEADING, FONT='Arial', STYLE=BOLD, SIZE=11, $TYPE=HEADING, LINE=5, STYLE=-BOLD, $TYPE=HEADING, LINE=5, ITEM=2, STYLE=BOLD, COLOR=RED, $ENDSTYLE END
18. Controlling Report Formatting
Creating Reports With TIBCO® WebFOCUS Language 1235

The output is:
Example: Applying Conditional Formatting to a Sort Group
This example illustrates how to apply conditional formatting to a sort group. This report usesconditional formatting to draw attention to those employees who have resigned.
Notice that one conditional declaration can apply formatting to all the sort group rows. You canaccomplish this by evaluating the sort field (STATUS) in the WHEN attribute condition.
Conditionally Formatting, Displaying, and Linking in a StyleSheet
1236

TABLE FILE CENTHRHEADING"Employee List for Boston"" ""For Pay Levels 5+"" "PRINT LNAME FNAME PAYSCALEBY STATUS SKIP-LINEWHERE PLANT EQ 'BOS' AND PAYSCALE GE 5ON TABLE SET PAGE-NUM OFF ON TABLE SET STYLESHEET *TYPE=REPORT, GRID=OFF, $ TYPE=DATA, COLOR=RED, FONT='Arial', STYLE=BOLD, WHEN=STATUS EQ 'RESIGNED',$ TYPE=HEADING, FONT='Arial', STYLE=BOLD, SIZE=11, $ENDSTYLE END
The output is:
18. Controlling Report Formatting
Creating Reports With TIBCO® WebFOCUS Language 1237

In order to apply the same conditional formatting to only two columns, instead of all thecolumns, this version of the report request uses two declarations, each specifying a differentcolumn (LNAME and FNAME):
TABLE FILE CENTHRHEADING"Employee List for Boston"" ""Pay Levels 5+"" "PRINT LNAME FNAME PAYSCALEBY STATUS SKIP-LINEWHERE PLANT EQ 'BOS' AND PAYSCALE GE 5ON TABLE SET PAGE-NUM OFF ON TABLE SET STYLESHEET *TYPE=REPORT, GRID=OFF, $ TYPE=DATA, COLUMN=LNAME, COLOR=RED, FONT='Arial', STYLE=BOLD, WHEN=STATUS EQ 'RESIGNED', $TYPE=DATA, COLUMN=FNAME, COLOR=RED, FONT='Arial', STYLE=BOLD, WHEN=STATUS EQ 'RESIGNED', $ TYPE=HEADING, FONT='Arial', STYLE=BOLD, SIZE=11, $ENDSTYLE END
Conditionally Formatting, Displaying, and Linking in a StyleSheet
1238

The output is:
Example: Applying Conditional Formatting to Forecasted Values
The following illustrates how you can apply conditional formatting to forecasted values in areport.
18. Controlling Report Formatting
Creating Reports With TIBCO® WebFOCUS Language 1239

DEFINE FILE GGSALESSDATE/YYM = DATE;SYEAR/Y = SDATE;SMONTH/M = SDATE;PERIOD/I2 = SMONTH;END TABLE FILE GGSALESSUM UNITS DOLLARSBY CATEGORY BY PERIODWHERE SYEAR EQ 97 AND CATEGORY EQ 'Coffee'ON PERIOD RECAP MOVAVE/D10.1= FORECAST(DOLLARS,1,3,'MOVAVE',3);ON TABLE SET PAGE-NUM OFFON TABLE SET STYLE *TYPE=REPORT, GRID=OFF, $TYPE=REPORT, BACKCOLOR=SILVER, WHEN=FORECAST, $ENDSTYLEEND
The output is:
Conditionally Formatting, Displaying, and Linking in a StyleSheet
1240

Including Summary Lines, Underlines, Skipped Lines, and Page Breaks
You can include sort-based options such as subtotals and other summary lines, sort headingsand footings, underlines, skipped lines, and page breaks, as well as restart page numbering,by using the ON phrase in your report request. The ON phrase specifies an option that can betriggered by the change in a sort field or display field. The sort-based option (summary line,underline, skipped line, or page break) is applied to each sort group.
To make report requests flexible, options may be included that are not needed in everysituation. User selections then control the options used for each execution of the request.
By default, if the field referenced in the ON phrase is not present in the request, or if theoption is not supported with the type of field specified, the following message is generated andprocessing terminates:
(FOC013) The 'ON FIELDNAME' FIELD IS NOT A SORT FIELD: sortfield
You can use the SET ONFIELD =IGNORE command to instruct WebFOCUS to ignore ON phrasesthat reference absent fields or fields that are not supported by the specified option.
Note that any field used must be present in the Master File for the data source or the followingmessage is generated and execution terminates:
(FOC003) THE FIELDNAME IS NOT RECOGNIZED: field
Syntax: How to Display Summary Lines, Underlines, Skipped lines, and Page Breaks
{BY|ON} sortfield option [[AND] option ...]
where:
BY|ON
These are functionally identical. The only difference is syntactic (BY enables you to specifythe sort-based feature as part of the sort phrase, while ON enables you to specify itseparately from the sort phrase). For more information, see the documentation for thesortfield option you are using.
sortfield
Is the name of a vertical sort (BY) field.
18. Controlling Report Formatting
Creating Reports With TIBCO® WebFOCUS Language 1241

option
Is one of the following sort-based features: PAGE-BREAK, PAGE-BREAK REPAGE, RECAP,RECOMPUTE, SKIP-LINE, SUBFOOT, SUBHEAD, SUBTOTAL, SUB-TOTAL, SUMMARIZE,UNDER-LINE.
AND
Can be included between two sets of sortfield options to enhance readability.
Syntax: How to Control Processing of ON Phrases
SET ONFIELD = {ALL|IGNORE}
ON TABLE SET ONFIELD {ALL|IGNORE}
where:
ALL
Issues a message and terminates execution when a field referenced in an ON phrase isnot present in the request. ALL is the default value.
IGNORE
Ignores ON phrases that reference fields that are not present in the request, as well as ONphrases that include options not supported by the type of field specified.
Example: Ignoring ON Phrases for Absent Fields
The following request against the EMPDATA data source has ON phrases for the fields DEPT,DIV, and PIN. PIN is a sort field, but the other sort field must be entered at run time as theamper variable &F1:
SET USER = EUSER TABLE FILE EMPDATA SUM SALARY BY &F1 BY PIN ON DEPT SKIP-LINE NOSPLIT ON &F1 SUBTOTAL ON DIV PAGE-BREAK ON TABLE SET ONFIELD ALL END
Run the request supplying the value DEPT for the variable &F1. The following messages aregenerated:
ERROR AT OR NEAR LINE 8 IN PROCEDURE IGNORE3 FOCEXEC *(FOC013) THE 'ON FIELDNAME' FIELD IS NOT A SORT FIELD: DIV BYPASSING TO END OF COMMAND (FOC009) INCOMPLETE REQUEST STATEMENT
Including Summary Lines, Underlines, Skipped Lines, and Page Breaks
1242

Now change the value of the ONFIELD parameter to IGNORE and run the request again,supplying the value DEPT for the variable &F1. The partial output is:
DEPT PIN SALARY---- --- ------ ACCOUNTING 000000070 $83,000.00 000000100 $32,400.00 000000300 $79,000.00 000000370 $62,500.00 000000400 $26,400.00 *TOTAL ACCOUNTING $283,300.00 ADMIN SERVICES 000000170 $30,800.00 000000180 $25,400.00 *TOTAL ADMIN SERVICES $56,200.00
Conditionally Including Summary Lines, Underlines, Skipped Lines, and Page Breaks
You can conditionally include sort-based options such as subtotals and other summary lines,sort headings and footings, underlines, skipped lines, and page breaks, as well asconditionally restart page numbering, by using the WHEN phrase in your report request. TheWHEN phrase specifies a condition that is evaluated for each value of a vertical sort (BY) field.The sort-based option (summary line, underline, skipped line, or page break) is applied to eachsort group that satisfies the condition, and is ignored by sort groups that do not satisfy thecondition.
The WHEN phrase is an extension of the ON sortfield and BY sortfield phrases. You can specifya WHEN phrase for each sortfield phrase. For example:
ON ORDER_NUM UNDER-LINE WHEN QUANTITY GT 5ON COUNTRY PAGE-BREAK WHEN LINEPRICE GT 200000
If a sortfield phrase includes several sort-related options, you can specify a different WHENphrase for each option. For example:
ON ORDER_NUM SKIP-LINE WHEN QUANTITY GT 5; UNDER-LINE WHEN QUANTITY GT 10
18. Controlling Report Formatting
Creating Reports With TIBCO® WebFOCUS Language 1243

Syntax: How to Conditionally Display Summary Lines, Underlines, Skipped lines, and PageBreaks
{BY|ON} sortfield [option WHEN condition [;] [AND]]...
where:
BY|ON
These are functionally identical. The only difference is syntactic (BY enables you to specifythe sort-based feature as part of the sort phrase, while ON enables you to specify itseparately from the sort phrase). For more information, see the documentation for thesortfield option you are using.
sortfield
Is the name of a vertical sort (BY) field.
option
Is one of the following sort-based features: PAGE-BREAK, PAGE-BREAK REPAGE, RECAP,RECOMPUTE, SKIP-LINE, SUBFOOT, SUBHEAD, SUBTOTAL, SUB-TOTAL, SUMMARIZE,UNDER-LINE.
If you specify SUBHEAD or SUBFOOT, you must place the WHEN phrase on the linefollowing the text of the heading or footing.
condition
Is a logical expression. For more information, see Using Expressions on page 429.
You must enclose non-numeric constants, such as character strings and dates, in singlequotation marks.
If the condition evaluates a numeric detail field, it evaluates the sum of the detail fieldvalues within each sort group, not the individual detail values. For example, in the request
TABLE FILE CENTHR PRINT ID_NUM SALARY BY PLANTON PLANT UNDER-LINE WHEN SALARY GT 2000000 END
the condition evaluates the sum of the SALARY values within each PLANT value.
If the condition evaluates an alphanumeric field that appears multiple times in a sortgroup, it evaluates the last value of the field in each sort group.
You can apply a prefix operator to a field in the condition (for example, WHEN AVE.PRICEGT 300) even if the operator and the field are not used in the report. The aggregation isperformed for each value of the sort field.
Conditionally Including Summary Lines, Underlines, Skipped Lines, and Page Breaks
1244

If the BY or ON phrase includes several options, the WHEN condition applies only to theoption that immediately precedes it.
;
Is required if WHEN phrases are being included for several options in this BY or ONphrase. In all other situations it is optional and just enhances readability.
AND
Can be included between two sets of sortfield options to enhance readability.
Example: Using a WHEN Condition for a Sort Option
This example illustrates how to conditionally display a sub footing in a report. This report usesa conditional sort footing to draw attention to orders that total less than 200,000.
TABLE FILE CENTORDHEADING"Order Revenue"" "SUM ORDER_DATE LINEPRICE AS 'Order,Total:'BY HIGHEST 5 ORDER_NUM ON ORDER_NUM SUBFOOT "--- Order total is less than $200,000 ---" " " WHEN LINEPRICE LT 200000 ON TABLE SET PAGE-NUM OFFON TABLE SET STYLESHEET *TYPE=REPORT, GRID=OFF, $ENDSTYLEEND
18. Controlling Report Formatting
Creating Reports With TIBCO® WebFOCUS Language 1245
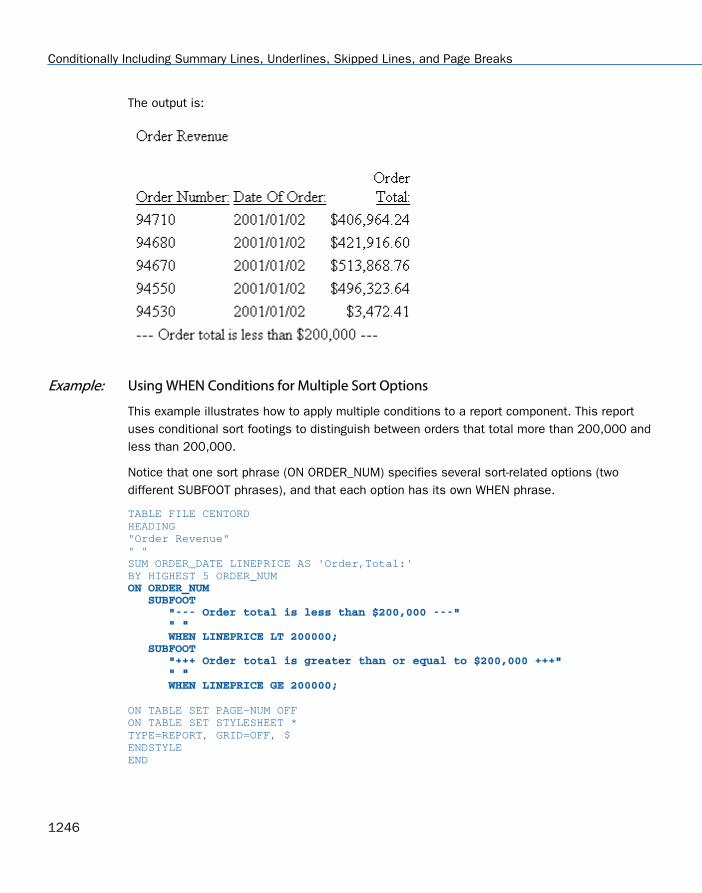
The output is:
Example: Using WHEN Conditions for Multiple Sort Options
This example illustrates how to apply multiple conditions to a report component. This reportuses conditional sort footings to distinguish between orders that total more than 200,000 andless than 200,000.
Notice that one sort phrase (ON ORDER_NUM) specifies several sort-related options (twodifferent SUBFOOT phrases), and that each option has its own WHEN phrase.
TABLE FILE CENTORDHEADING"Order Revenue"" "SUM ORDER_DATE LINEPRICE AS 'Order,Total:'BY HIGHEST 5 ORDER_NUM ON ORDER_NUM SUBFOOT "--- Order total is less than $200,000 ---" " " WHEN LINEPRICE LT 200000; SUBFOOT "+++ Order total is greater than or equal to $200,000 +++" " " WHEN LINEPRICE GE 200000; ON TABLE SET PAGE-NUM OFFON TABLE SET STYLESHEET *TYPE=REPORT, GRID=OFF, $ENDSTYLEEND
Conditionally Including Summary Lines, Underlines, Skipped Lines, and Page Breaks
1246

The output is:
18. Controlling Report Formatting
Creating Reports With TIBCO® WebFOCUS Language 1247

Controlling the Display of Empty Reports
If a report request returns no records (for example, because no records satisfy its selectioncriteria, or because the data source has no records), you can choose to display or print:
An empty report, that is, the report without data but including column titles, a reportheading (if one was specified in the report request), and a page heading (if one wasspecified).
To do this, set the EMPTYREPORT parameter to ON.
A message stating that there is no report output.
This is the default. You can return to the default by setting the EMPTYREPORT parameter toOFF.
This applies to tabular reports, not to free-form reports and graphs.
SET EMPTYREPORT = OFF is not supported with DOC format.
If you have created a report that contains a WHERE TOTAL statement and the test yields zerorecords, an empty report will display.
Syntax: How to Control the Display of an Empty Report
You can control what is displayed (or printed) when a report request returns no records, usingthe EMPTYREPORT parameter. To issue the SET command:
Outside of a report request, use the syntax
SET EMPTYREPORT = {ANSI|ON|OFF}
Within a report request, use the syntax
ON TABLE SET EMPTYREPORT {ANSI|ON|OFF}
where:
ANSI
Produces a single-line report and displays the missing data character or a zero if a COUNTis requested. In each case, &RECORDS will be 0, and &LINES will be 1.
If the SQL Translator is invoked, ANSI automatically replaces OFF as the default setting forEMPTYREPORT.
Controlling the Display of Empty Reports
1248

ON
Specifies that the report will be displayed without data but with column titles, a reportheading (if one was specified in the report request), and a page heading (if one wasspecified).
OFF
Specifies that a message will be displayed indicating that there is no report output. OFF isthe default value.
Example: Controlling the Display of Empty Reports
The following request does not retrieve any records and sets the EMPTYREPORT parameter toOFF.
SET EMPTYREPORT=OFFTABLE FILE WF_RETAIL_LITEHEADING"This is the heading"SUM COGS_US REVENUE_US COLUMN-TOTAL ROW-TOTALBY COUNTRY_NAMEWHERE COUNTRY_NAME EQ 'Louisiana'FOOTING"This is the footing"ON TABLE SET STYLE *GRID=OFF,$END
The following output is produced.
0 NUMBER OF RECORDS IN TABLE= 0 LINES= 0
Changing the EMPTYREPORT setting to ON produces the output shown in the following image.
18. Controlling Report Formatting
Creating Reports With TIBCO® WebFOCUS Language 1249
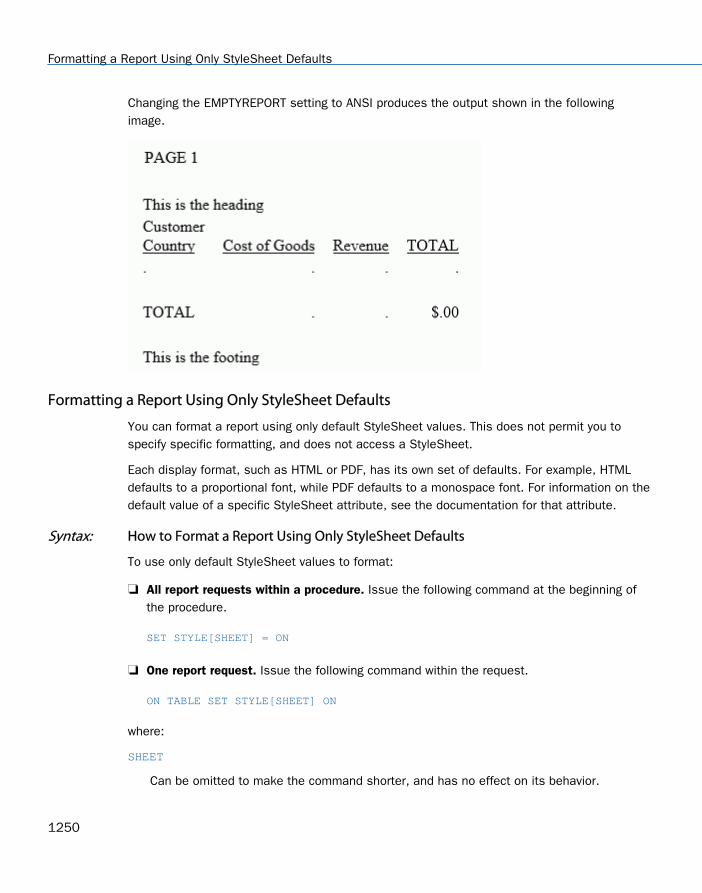
Changing the EMPTYREPORT setting to ANSI produces the output shown in the followingimage.
Formatting a Report Using Only StyleSheet Defaults
You can format a report using only default StyleSheet values. This does not permit you tospecify specific formatting, and does not access a StyleSheet.
Each display format, such as HTML or PDF, has its own set of defaults. For example, HTMLdefaults to a proportional font, while PDF defaults to a monospace font. For information on thedefault value of a specific StyleSheet attribute, see the documentation for that attribute.
Syntax: How to Format a Report Using Only StyleSheet Defaults
To use only default StyleSheet values to format:
All report requests within a procedure. Issue the following command at the beginning ofthe procedure.
SET STYLE[SHEET] = ON
One report request. Issue the following command within the request.
ON TABLE SET STYLE[SHEET] ON
where:
SHEET
Can be omitted to make the command shorter, and has no effect on its behavior.
Formatting a Report Using Only StyleSheet Defaults
1250

Chapter19 Identifying a Report Component in aWebFOCUS StyleSheet
A report consists of several types of components, each of which you can identify in aStyleSheet in order to format it.
Report components are subject to StyleSheet inheritance. For details, see Creating andManaging a WebFOCUS StyleSheet on page 1199.
For information about identifying components in a graph, see Creating a Graph on page1745.
Unless otherwise noted, all StyleSheet references in this chapter refer to WebFOCUSStyleSheets.
In this chapter:
Identifying an Entire Report, Column, or Row
Identifying Tags for SUBTOTAL and GRANDTOTAL Lines
Identifying Data
Identifying a Heading, Footing, Title, or FML Free Text
Identifying a Page Number, Underline, or Skipped Line
Identifying an Entire Report, Column, or Row
You can apply formatting to an:
Entire report. For more information, see How to Identify an Entire Report on page 1252.
Entire column within a report, both its title and data (including ROW-TOTAL columns). Formore information, see How to Identify an Entire Column on page 1254.
Entire row within a report, either an FML (Financial Modeling Language) row, or a total orsubtotal row, comprising the labeling text and data of the row. For more information, see How to Identify an Entire Financial Modeling Language (FML) Row on page 1257, and Howto Identify an Entire Total or Subtotal Row on page 1258.
You can also identify an entire horizontal sort (ACROSS) title or value row in a StyleSheet,although each of these rows contains only a single kind of information. For details, see How to Identify a Column Title on page 1276.
Creating Reports With TIBCO® WebFOCUS Language 1251
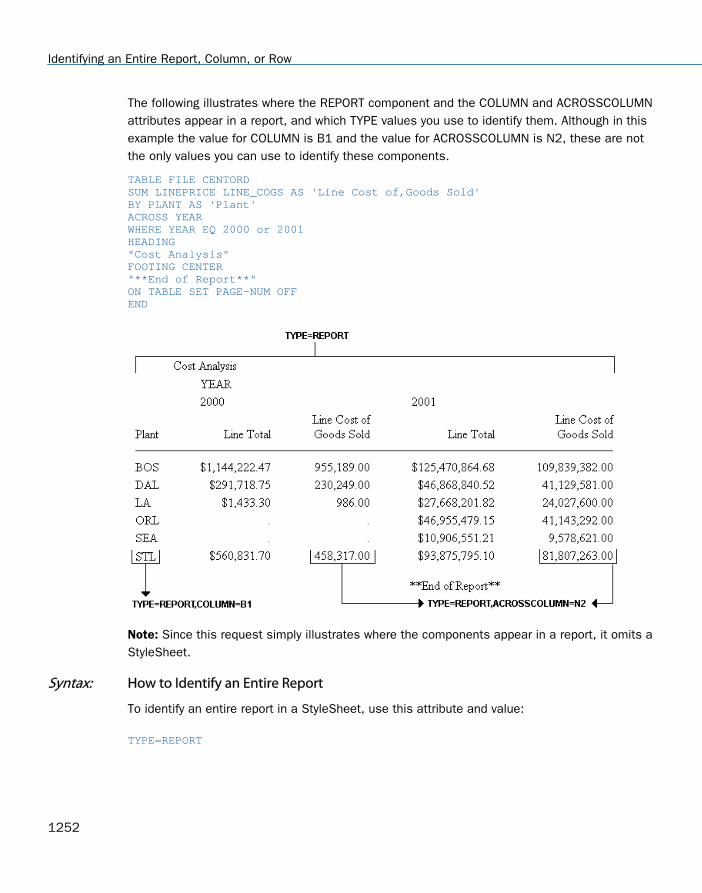
The following illustrates where the REPORT component and the COLUMN and ACROSSCOLUMNattributes appear in a report, and which TYPE values you use to identify them. Although in thisexample the value for COLUMN is B1 and the value for ACROSSCOLUMN is N2, these are notthe only values you can use to identify these components.
TABLE FILE CENTORDSUM LINEPRICE LINE_COGS AS 'Line Cost of,Goods Sold'BY PLANT AS 'Plant'ACROSS YEARWHERE YEAR EQ 2000 or 2001HEADING"Cost Analysis"FOOTING CENTER"**End of Report**"ON TABLE SET PAGE-NUM OFFEND
Note: Since this request simply illustrates where the components appear in a report, it omits aStyleSheet.
Syntax: How to Identify an Entire Report
To identify an entire report in a StyleSheet, use this attribute and value:
TYPE=REPORT
Identifying an Entire Report, Column, or Row
1252

Example: Identifying an Entire Report
The following illustrates how to identify and apply formatting to an entire report. The relevantStyleSheet declarations are highlighted in the request.
TABLE FILE CENTINVHEADING"Excess Stock Report"SUM QTY_IN_STOCK BY PRODNAMEWHERE QTY_IN_STOCK GT 10000FOOTING CENTER"**End of Report**"ON TABLE SET PAGE-NUM OFFON TABLE SET STYLE * TYPE=REPORT, GRID=OFF,$TYPE=REPORT, STYLE=BOLD,$ ENDSTYLEEND
The output is:
19. Identifying a Report Component in a WebFOCUS StyleSheet
Creating Reports With TIBCO® WebFOCUS Language 1253

Syntax: How to Identify an Entire Column
TYPE=REPORT, coltype=column
where:
coltype
Specifies the type of column. It can be:
COLUMN, which specifies a sort column (generated by BY), a display column(generated by PRINT, LIST, SUM, or COUNT), a computed column (generated byCOMPUTE), or a column of row totals (generated by ROW-TOTAL).
ACROSSCOLUMN, which specifies every instance of a column that is repeated acrossa horizontal sort (ACROSS) row. This also applies the formatting to the horizontal sort(ACROSS) values that appear above the column titles.
column
Specifies one or more columns. If you are identifying an ACROSSCOLUMN, the only valididentifiers are Nn and Pn, and these only count ACROSS fields, not display fields.
Options for identifying columns in a StyleSheet are:
Identifier Description
Nn Identifies a column by its position in the report. To determine thisvalue, count vertical sort (BY) fields, display fields, and ROW-TOTALfields, from left to right, including NOPRINT fields. ForACROSSCOLUMN, only ACROSS fields are counted.
Pn Identifies a column by its position in the report. To determine the valueof n, count vertical sort (BY) fields, display fields, and ROW-TOTALfields from left to right. Do not count NOPRINT fields. ForACROSSCOLUMN, only ACROSS fields are counted.
Cn Identifies a display column by its position in the report. To determinethe value of n, count only display fields from left to right, includingNOPRINT fields. Do not count vertical sort (BY) fields or ROW-TOTALfields.
To select all display fields use C*.
Identifying an Entire Report, Column, or Row
1254

Identifier Description
Bn Identifies a vertical sort (BY) column by its position in the report. Todetermine the value of n, count only vertical sort (BY) fields, includingNOPRINTs, from left to right.
To select all BY fields use B*.
field Identifies a column by its field name.
When a field occurs more than once, use field(n) to select a particularoccurrence or field(*) to select all occurrences of the field.
ROWTOTAL Identifies a column of row totals generated using ROW-TOTAL. Whenused with ACROSS and multiple display commands, ROWTOTALgenerates multiple total columns. Use ROWTOTAL(n) to select aparticular total column. Use ROWTOTAL(field) to select the row totalcolumn for a particular field.
Use ROWTOTAL(*) to select all row total columns in the report.
Note: Within a StyleSheet, all columns must be specified in the same way, either by fieldname or positional reference.
Example: Identifying an Entire Column
The following illustrates how to identify an entire column, which consists of the column dataand the column title, in a report. The relevant StyleSheet declaration is highlighted in therequest.
Note: To produce the same results you can, alternatively, use the values P1, B1, or thefieldname (PRODNAME) for the COLUMN attribute in the StyleSheet declaration.
TABLE FILE CENTINVHEADING"Excess Stock Report"SUM QTY_IN_STOCK BY PRODNAMEWHERE QTY_IN_STOCK GT 10000FOOTING CENTER"**End of Report**"ON TABLE SET PAGE-NUM OFFON TABLE SET STYLE *TYPE=REPORT, GRID=OFF,$ TYPE=REPORT, COLUMN=N1, STYLE=ITALIC,$ ENDSTYLEEND
19. Identifying a Report Component in a WebFOCUS StyleSheet
Creating Reports With TIBCO® WebFOCUS Language 1255

The output is:
Example: Identifying an Entire Horizontal (ACROSS) Column
The following illustrates how to identify a horizontal (ACROSS) column. When you identify andformat an ACROSSCOLUMN, all data values, the column title, and any horizontal sort(ACROSS) values associated with the field are formatted for every instance of the column inthe report output. The relevant StyleSheet declarations are highlighted in the request.
Note: To produce the same results you can alternatively use the values P1 and P2,respectively, for the ACROSSCOLUMN attribute.
TABLE FILE CENTORDSUM LINEPRICE LINE_COGS AS 'Line Cost of,Goods Sold'BY PLANT AS 'Plant'ACROSS YEARWHERE YEAR EQ 2000 OR 2001HEADING"Cost Analysis"FOOTING CENTER"**End of Report**"ON TABLE SET PAGE-NUM OFFON TABLE SET STYLE *TYPE=REPORT, GRID=OFF,$ TYPE=REPORT, ACROSSCOLUMN=N1, STYLE=ITALIC,$TYPE=REPORT, ACROSSCOLUMN=N2, STYLE=BOLD,$ ENDSTYLEEND
Identifying an Entire Report, Column, or Row
1256
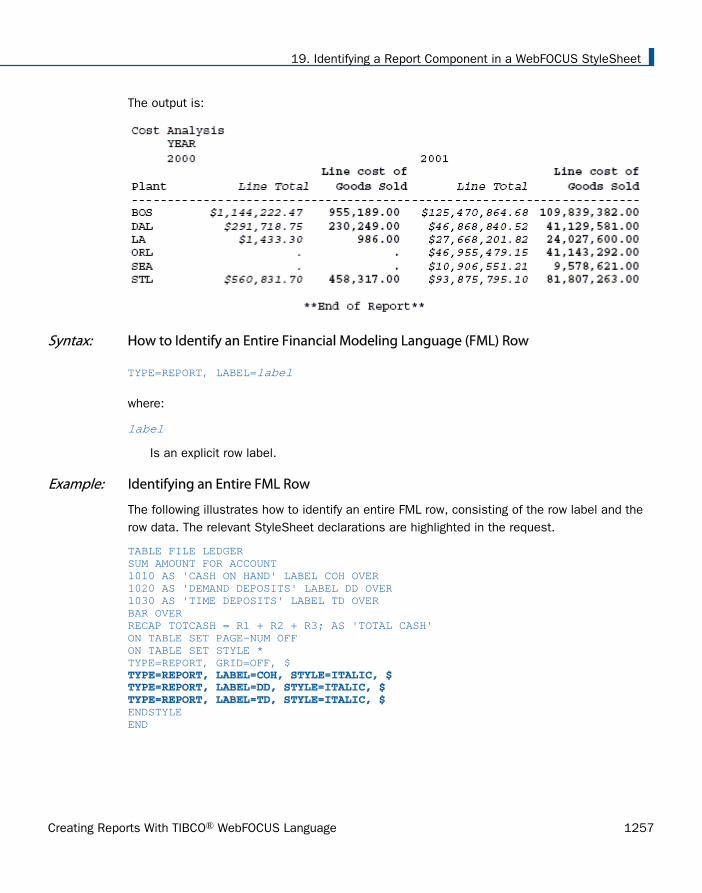
The output is:
Syntax: How to Identify an Entire Financial Modeling Language (FML) Row
TYPE=REPORT, LABEL=label
where:
label
Is an explicit row label.
Example: Identifying an Entire FML Row
The following illustrates how to identify an entire FML row, consisting of the row label and therow data. The relevant StyleSheet declarations are highlighted in the request.
TABLE FILE LEDGERSUM AMOUNT FOR ACCOUNT1010 AS 'CASH ON HAND' LABEL COH OVER1020 AS 'DEMAND DEPOSITS' LABEL DD OVER1030 AS 'TIME DEPOSITS' LABEL TD OVERBAR OVERRECAP TOTCASH = R1 + R2 + R3; AS 'TOTAL CASH' ON TABLE SET PAGE-NUM OFFON TABLE SET STYLE *TYPE=REPORT, GRID=OFF, $ TYPE=REPORT, LABEL=COH, STYLE=ITALIC, $TYPE=REPORT, LABEL=DD, STYLE=ITALIC, $TYPE=REPORT, LABEL=TD, STYLE=ITALIC, $ ENDSTYLEEND
19. Identifying a Report Component in a WebFOCUS StyleSheet
Creating Reports With TIBCO® WebFOCUS Language 1257

The output is:
Syntax: How to Identify an Entire Total or Subtotal Row
TYPE=type, [BY=sortcolumn]
where:
type
Identifies a subtotal or total. Select from:
GRANDTOTAL which is a grand total (generated by COLUMN-TOTAL, SUBTOTAL, SUB-TOTAL,RECOMPUTE, or SUMMARIZE).
SUBTOTAL which is a subtotal (generated by SUBTOTAL, SUB-TOTAL, RECOMPUTE, orSUMMARIZE).
RECAP which is a subtotal calculation (generated by ON sortfield RECAP or ON sortfieldCOMPUTE).
BY
When there are several subtotal commands, each associated with a different vertical sort(BY) column, this enables you to identify which of the subtotal commands you wish toformat.
sortcolumn
Specifies the vertical sort (BY) column associated with one of the several subtotal in thereport commands. Use the field name to identify the sort column.
Identifying an Entire Report, Column, or Row
1258

Example: Identifying an Entire Total Row
The following illustrates how to identify an entire COLUMN-TOTAL row in a StyleSheet. Therelevant StyleSheet declaration is highlighted in the request.
TABLE FILE SALESSUM RETURNS DAMAGED AND ROW-TOTAL AND COLUMN-TOTALBY PROD_CODEON TABLE SET PAGE-NUM OFFON TABLE SET STYLE *TYPE=REPORT, GRID=OFF, $ TYPE=GRANDTOTAL, STYLE=BOLD, SIZE=12, $ ENDSTYLEEND
The output is:
19. Identifying a Report Component in a WebFOCUS StyleSheet
Creating Reports With TIBCO® WebFOCUS Language 1259

Example: Identifying a Row Total
The following illustrates how to identify a row total. The relevant StyleSheet declaration ishighlighted in the request. Note that if you want to format an instance of row-total, you can adda WHEN statement to your StyleSheet. For details, see Controlling Report Formatting on page1221.
TABLE FILE SALESSUM RETURNS DAMAGED AND ROW-TOTALBY PROD_CODE AS 'PRODUCT,CODE'ON TABLE SET PAGE-NUM OFFON TABLE SET STYLE *TYPE=REPORT, GRID=OFF, $ TYPE=REPORT, COLUMN=ROWTOTAL, STYLE=BOLD, $ ENDSTYLEEND
The output is:
Identifying Tags for SUBTOTAL and GRANDTOTAL Lines
The tag is the text that is displayed in the leftmost portion of each SUBTOTAL andGRANDTOTAL row in a report. The tag is used to identify the type of data represented withinthis row. The text used to generate this tag can be customized by adding an AS name to theSUBTOTAL syntax.
Identifying Tags for SUBTOTAL and GRANDTOTAL Lines
1260
You can define styling for the subtotal and grand total tag separately from the rest of the row.Text attributes available for the tag, including font, color, size, and style, can be used todifferentiate and highlight the tags. Additionally, styling can be applied that turns tags into drill-down links.
Styling is supported for text attributes only. Cell or column features, such as borders,background color, or justification are not supported.
This feature is available for PDF, DHTML, PS, HTML, AHTML, PPTX, XLSX, and EXL2K formats.
Syntax: How to Style Subtotal and Grand Total Tags
TYPE={SUBTOTAL|GRANDTOTAL}, OBJECT=TAG, [FONT=font], [SIZE=size], [STYLE=style], [COLOR={color|RGB({rgb|#hexcolor})], [drilltype=drillparms], $
where:
font
Is the name of the font.
size
Is the point size of the font.
style
Is the font style, for example bold, italic, or bold+italic.
color
Is a color name.
rgb
Specifies the font color using a mixture of red, green, and blue.
(r g b) is the desired intensity of red, green, and blue, respectively. The values are on ascale of 0 to 255, where 0 is the least intense and 255 is the most intense. Note thatusing the three color components in equal intensities results in shades of gray.
#hexcolor
Is the hexadecimal value for the color. For example, FF0000 is the hexadecimal value forred. The hexadecimal digits can be in uppercase or lowercase and must be preceded by apound sign (#).
19. Identifying a Report Component in a WebFOCUS StyleSheet
Creating Reports With TIBCO® WebFOCUS Language 1261

drilltype
Is any valid drill-down attribute, for example, URL= or FOCEXEC=. For more informationabout drill-down links, see Linking a Report to Other Resources on page 821.
drillparms
Are valid attribute values for the type of drill down.
Example: Styling SUBTOTAL and GRANDTOTAL Tags
The following request against the GGSALES data source generates subtotal and grand totalrows. The tags for the subtotal rows are in italics and are white. The tag for the grand total rowhas a drill-down link to a URL:
TABLE FILE GGSALES SUM UNITS/D8C DOLLARS/D12CM BUDUNIT/D8C BUDDOLLARS/D12CMBY REGIONBY CATEGORYON REGION SUBTOTALHEADING"Gotham Grinds Sales Report"ON TABLE SET HTMLCSS ONON TABLE PCHOLD FORMAT PDFON TABLE SET DROPBLNKLINE ALLON TABLE SET PAGE-NUM OFFON TABLE SET STYLE * INCLUDE=IBFS:/FILE/IBI_HTML_DIR/javaassist/intl/EN/ENIADefault_combine.sty,$TYPE=SUBTOTAL, OBJECT=TAG,STYLE=ITALIC,COLOR=WHITE,$TYPE=GRANDTOTAL, BACKCOLOR='LIGHT GREY',$TYPE=GRANDTOTAL, OBJECT=TAG,URL='http://www.informationbuilders.com',$ENDSTYLE END
Identifying Tags for SUBTOTAL and GRANDTOTAL Lines
1262
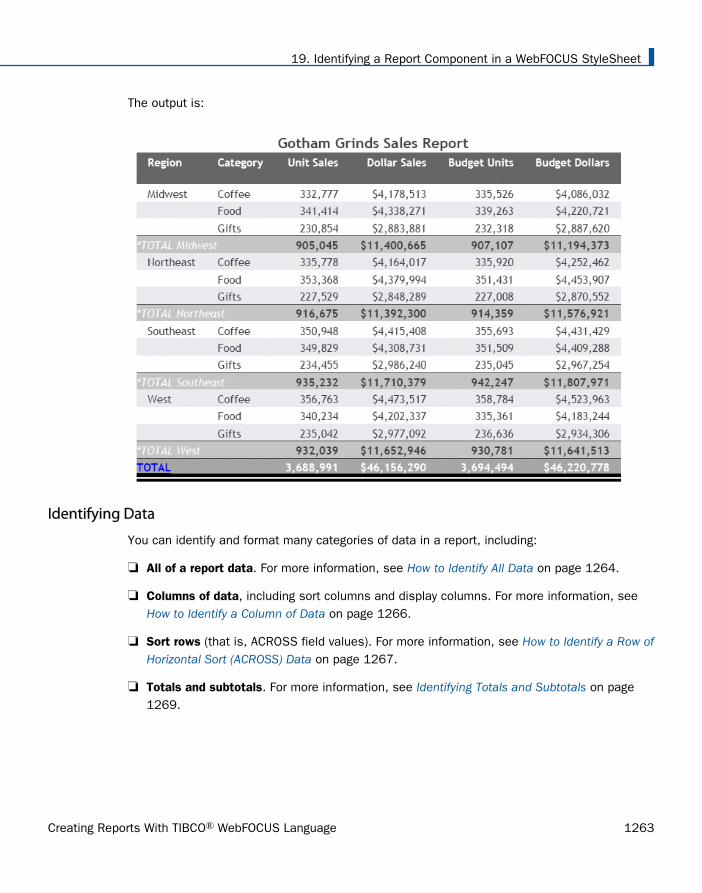
The output is:
Identifying Data
You can identify and format many categories of data in a report, including:
All of a report data. For more information, see How to Identify All Data on page 1264.
Columns of data, including sort columns and display columns. For more information, see How to Identify a Column of Data on page 1266.
Sort rows (that is, ACROSS field values). For more information, see How to Identify a Row ofHorizontal Sort (ACROSS) Data on page 1267.
Totals and subtotals. For more information, see Identifying Totals and Subtotals on page1269.
19. Identifying a Report Component in a WebFOCUS StyleSheet
Creating Reports With TIBCO® WebFOCUS Language 1263

The following illustrates where the DATA and ACROSSVALUE components appear in a report,and which TYPE values you use to identify them.
TABLE FILE CENTORDHEADING CENTER"UNITS SOLD IN 2002 BY PLANT"SUM QUANTITY AND ROW-TOTAL AS '2002 TOTAL'ACROSS QUARTERBY PLANTLNG AS 'PLANT'WHERE YEAR EQ 2002ON TABLE COLUMN-TOTAL AS 'TOTAL UNITS'ON TABLE SET PAGE-NUM OFFON TABLE SET STYLE *TYPE=REPORT, GRID=OFF,$END
Note: Since this request simply illustrates where the components appear in a report, it omits aStyleSheet.
Syntax: How to Identify All Data
To identify all report data in a StyleSheet (except totals, grand totals, subtotals, and horizontalsort (ACROSS) values, which need to be identified separately) use this attribute and value:
TYPE = DATA
Identifying Data
1264

Example: Identifying All Data in a Report
The following illustrates how to identify all of the data in a report. The relevant StyleSheetdeclaration is highlighted in the request.
TABLE FILE CENTORDHEADING CENTER"UNITS SOLD IN 2002 BY PLANT"SUM QUANTITY AND ROW-TOTAL AS '2002 TOTAL'ACROSS QUARTERBY PLANTLNG AS 'PLANT'WHERE YEAR EQ 2002ON TABLE COLUMN-TOTAL AS 'TOTAL UNITS'ON TABLE SET PAGE-NUM OFFON TABLE SET STYLE *TYPE=REPORT, GRID=OFF, $ TYPE=DATA, STYLE=BOLD, $ ENDSTYLEEND
The output is:
19. Identifying a Report Component in a WebFOCUS StyleSheet
Creating Reports With TIBCO® WebFOCUS Language 1265

Syntax: How to Identify a Column of Data
TYPE=DATA, COLUMN=column
where:
column
Specifies one or more columns that you wish to format. For a list of values, see How toIdentify an Entire Column on page 1254.
Example: Identifying a Column of Data
The following illustrates how to identify a column of data. The relevant StyleSheet declarationis highlighted in the request.
Note that when identifying a column using Nn, NOPRINT columns are counted. Even though theProduct Name field is the first column in this report, it is identified with N2 because of theNOPRINT column.
TABLE FILE CENTORDPRINT QUANTITY LINEPRICE LINE_COGSBY ORDER_NUM NOPRINT BY PRODNAMEWHERE ORDER_NUM EQ '48045'ON TABLE SET PAGE-NUM OFFON TABLE SET STYLE *TYPE=REPORT, GRID=OFF,$ TYPE=DATA, COLUMN=N2, STYLE=ITALIC,$ ENDSTYLEEND
The output is:
Identifying Data
1266
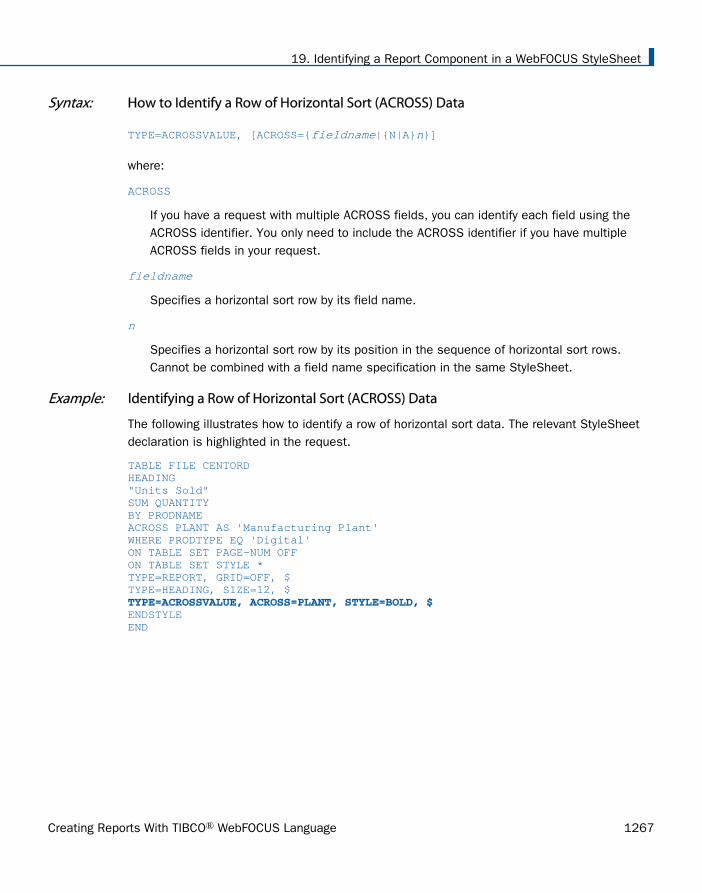
Syntax: How to Identify a Row of Horizontal Sort (ACROSS) Data
TYPE=ACROSSVALUE, [ACROSS={fieldname|{N|A}n}]
where:
ACROSS
If you have a request with multiple ACROSS fields, you can identify each field using theACROSS identifier. You only need to include the ACROSS identifier if you have multipleACROSS fields in your request.
fieldname
Specifies a horizontal sort row by its field name.
n
Specifies a horizontal sort row by its position in the sequence of horizontal sort rows.Cannot be combined with a field name specification in the same StyleSheet.
Example: Identifying a Row of Horizontal Sort (ACROSS) Data
The following illustrates how to identify a row of horizontal sort data. The relevant StyleSheetdeclaration is highlighted in the request.
TABLE FILE CENTORDHEADING"Units Sold"SUM QUANTITYBY PRODNAMEACROSS PLANT AS 'Manufacturing Plant'WHERE PRODTYPE EQ 'Digital'ON TABLE SET PAGE-NUM OFFON TABLE SET STYLE *TYPE=REPORT, GRID=OFF, $TYPE=HEADING, SIZE=12, $ TYPE=ACROSSVALUE, ACROSS=PLANT, STYLE=BOLD, $ ENDSTYLEEND
19. Identifying a Report Component in a WebFOCUS StyleSheet
Creating Reports With TIBCO® WebFOCUS Language 1267

The output is:
Note: To produce the same results you can alternatively use the value N1 for the ACROSSattribute in the StyleSheet declaration. For example, TYPE=ACROSSVALUE, ACROSS=N1,STYLE=BOLD, $.
Example: Identifying Row Totals (ACROSS-TOTAL) for Horizontal Sort Data
The following illustrates how to identify a row total (ACROSS-TOTAL) for horizontal sort(ACROSS) data using the ACROSSVALUE component and a numeric column reference (Nn). Therelevant StyleSheet declaration is highlighted in the request.
TABLE FILE CENTORDSUM QUANTITYBY PRODNAMEACROSS PLANT AS 'Manufacturing Plant'ACROSS-TOTAL AS 'Plant Totals'WHERE PRODTYPE EQ 'Digital'ON TABLE SET PAGE-NUM OFFON TABLE SET STYLE *TYPE=REPORT, GRID=OFF, $ TYPE=ACROSSVALUE, COLUMN=N8, STYLE=ITALIC, COLOR='RED', $ ENDSTYLEEND
Identifying Data
1268

The following image shows the output with the ACROSS-TOTAL value, Plant Totals, styled in reditalics.
Identifying Totals and Subtotals
Within a StyleSheet, you can identify the grand totals, subtotals, subtotal calculations(generated by ON sortfield RECAP or ON sortfield COMPUTE), column totals, and row totals of areport in order to format them. For details on identifying row totals, see Identifying an EntireReport, Column, or Row on page 1251.
The following example illustrates where these components are in a report, and which TYPEvalues you use to identify them.
TABLE FILE EMPLOYEESUM DED_AMT AND GROSSBY DEPARTMENT BY PAY_DATEON DEPARTMENT RECAP DEPT_NET/D8.2M = GROSS-DED_AMT;WHEN PAY_DATE GT 820101ON DEPARTMENT SUBTOTALEND
19. Identifying a Report Component in a WebFOCUS StyleSheet
Creating Reports With TIBCO® WebFOCUS Language 1269

The following figure shows each component:
Note: Since this request simply illustrates how to identify different types of totals andsubtotals, it omits a StyleSheet.
Syntax: How to Identify a Grand Total, Subtotal, or Subtotal Calculation
TYPE=type, [BY=sortfield] [coltype=column]
where:
type
Identifies a subtotal or total. Select from:
GRANDTOTAL which is a grand total (generated by COLUMN-TOTAL, SUBTOTAL, SUB-TOTAL,RECOMPUTE, or SUMMARIZE). See Identifying a Grand Total on page 1272 for anexample.
SUBTOTAL which is a subtotal (generated by SUBTOTAL, SUB-TOTAL, RECOMPUTE, orSUMMARIZE). See Identifying Subtotals on page 1273 for an example.
RECAP which is a subtotal calculation (generated by ON sortfield RECAP or ON sortfieldCOMPUTE). See Identifying a Subtotal Calculation (RECAP/COMPUTE) on page 1274 for anexample.
Identifying Data
1270

BY
If you have a request with multiple BY fields, and two or more have subtotal commandsassociated with them, you can identify each field using the BY identifier. This is helpfulwhen you want to format each subtotal differently or when you want to format only onesubtotal.
You only need to include the BY identifier if you have multiple BY fields in your request.
sortfield
Specifies the BY field associated with several subtotal commands of a report. Use thefieldname for the value (BY=fieldname).
coltype
Identifies a specific column to apply formatting. When you include the COLUMN orACROSSCOLUMN identifier in your declaration, only the subtotal values receive theformatting, the labeling text will not. Values can be:
COLUMN which is a display column (generated by PRINT, LIST, SUM, or COUNT) or acomputed column (generated by COMPUTE).
ACROSSCOLUMN where every instance of a display or computed column is repeated acrossa horizontal sort (ACROSS) row.
If there are several columns being totaled or subtotaled by one command, and you do notspecify a column in the StyleSheet, the formatting will be applied to the totals or subtotalsfor all of the columns. It will also be applied to the labeling text for the total and subtotalvalues.
column
Specifies the column whose totals or subtotals you wish to format. For a list of values, see How to Identify an Entire Column on page 1254.
19. Identifying a Report Component in a WebFOCUS StyleSheet
Creating Reports With TIBCO® WebFOCUS Language 1271

Example: Identifying a Grand Total
The following illustrates how to identify a grand total in a report request. In this example, weonly want to format the grand total value for the LINE_COGS field, so the COLUMN attribute isincluded in the StyleSheet declaration. The grand total in this request is generated byCOLUMN-TOTAL. The relevant StyleSheet declaration is highlighted in the request.
Note:
To style the entire grand total row, remove the COLUMN attribute from the StyleSheetdeclaration.
To produce the same results you can alternatively use the values N5, P5, or C3 for theCOLUMN attribute in the StyleSheet declaration.
TABLE FILE CENTORDSUM QUANTITY LINEPRICE LINE_COGS AND COLUMN-TOTALBY ORDER_NUM BY PRODNAMEWHERE ORDER_NUM EQ '48053' OR '48798'ON TABLE SET PAGE-NUM OFFON TABLE SET STYLE *TYPE=REPORT, GRID=OFF,$ TYPE=GRANDTOTAL, COLUMN=LINE_COGS, STYLE=BOLD, SIZE=11,$ ENDSTYLEEND
The output is:
Identifying Data
1272

Example: Identifying Subtotals
The following illustrates how to identify subtotals in a report request. In this example, onlysubtotal values in the QUANTITY and LINE_COGS fields are formatted, so the COLUMNattribute is included in the StyleSheet declarations.
Also, since there are two SUBTOTAL commands associated with two of the three BY fields(PLANT and ORDER_NO), the BY attribute is also included in each declaration to ensure theformatting is applied to the correct value. The relevant StyleSheet declarations are highlightedin the request.
Note:
To style an entire subtotal row, remove the COLUMN and BY attributes from the StyleSheetdeclaration.
To produce the same results you can, alternatively, use the values COLUMN=N6,COLUMN=P6, or COLUMN=C3 for the COLUMN=LINE_COGS attribute.
To produce the same results you can, alternatively, use the values COLUMN=N4,COLUMN=P4, or COLUMN=C1 for the COLUMN=QUANTITY attribute.
TABLE FILE CENTORDSUM QUANTITY LINEPRICE LINE_COGS AS 'Line Cost of, Goods Sold'BY PLANTBY ORDER_NUMBY PRODNAMEON PLANT SUBTOTALON ORDER_NUM SUBTOTALWHERE ORDER_NUM EQ '35774' OR '48041'WHERE PLANT EQ 'BOS'ON TABLE SET PAGE-NUM OFFON TABLE SET STYLE *TYPE=REPORT, GRID=OFF,$ TYPE=SUBTOTAL, BY=PLANT, COLUMN=LINE_COGS, STYLE=BOLD+ITALIC, COLOR=BLUE,$TYPE=SUBTOTAL, BY=ORDER_NUM, COLUMN=QUANTITY, STYLE=BOLD, SIZE=11,$ ENDSTYLEEND
19. Identifying a Report Component in a WebFOCUS StyleSheet
Creating Reports With TIBCO® WebFOCUS Language 1273

The output is:
Example: Identifying a Subtotal Calculation (RECAP/COMPUTE)
The following illustrates how to identify a subtotal calculation created with a RECAP orCOMPUTE phrase. In this example, the subtotal calculation is generated with ON PLANT RECAPQTY/F6=QUANTITY. The relevant StyleSheet declaration is highlighted in the request.
Note: If there is more than one RECAP or COMPUTE field in your request, you can distinguishthem by adding BY=fieldname to the StyleSheet declaration.
TABLE FILE CENTORDSUM QUANTITY LINEPRICE LINE_COGS AS 'Line Cost of, Goods Sold'BY PLANT BY ORDER_NUMON PLANT RECAP QTY/F6=QUANTITY;WHERE PLANT EQ 'BOS'WHERE ORDER_NUM LT '56098'ON TABLE SET PAGE-NUM OFFON TABLE SET STYLE *TYPE=REPORT, GRID=OFF, $ TYPE=RECAP, STYLE=BOLD+ITALIC, $ ENDSTYLEEND
Identifying Data
1274

The output is:
Identifying a Heading, Footing, Title, or FML Free Text
A report data is framed by headings, footings, and titles. These provide context for the data.You can identify and format many categories of headings, footings, and titles in a report,including:
Report, page, and sort headings.
Report, page, and sort footings.
Column titles.
Horizontal sort (ACROSS) titles and values.
Free text in Financial Modeling Language (FML) reports.
Identifying a Column or Row Title
Within a StyleSheet you can identify column titles and horizontal sort (ACROSS) values of areport in order to format them. The following example illustrates where column titles andhorizontal sort values are in a report, and which TYPE values you use to identify them.
19. Identifying a Report Component in a WebFOCUS StyleSheet
Creating Reports With TIBCO® WebFOCUS Language 1275

TABLE FILE EMPLOYEESUM GROSS AND DED_AMTACROSS DEPARTMENT BY PAY_DATEEND
Note: Since this request simply illustrates how to identify column titles and horizontal sortvalues in a report, it omits a StyleSheet.
Syntax: How to Identify a Column Title
TYPE=TITLE, [COLUMN=column]
where:
COLUMN
Is used to specify one or more column titles. If you omit this attribute and value, theformatting will be applied to all of the report column titles.
column
Specifies the column whose title you wish to format. For column values, see How toIdentify an Entire Column on page 1254.
Syntax: How to Identify a Horizontal Sort Title or Value
TYPE={ACROSSTITLE|ACROSSVALUE}, [ACROSS=column]
where:
ACROSSTITLE
Specifies a horizontal sort (ACROSS) title.
Identifying a Heading, Footing, Title, or FML Free Text
1276
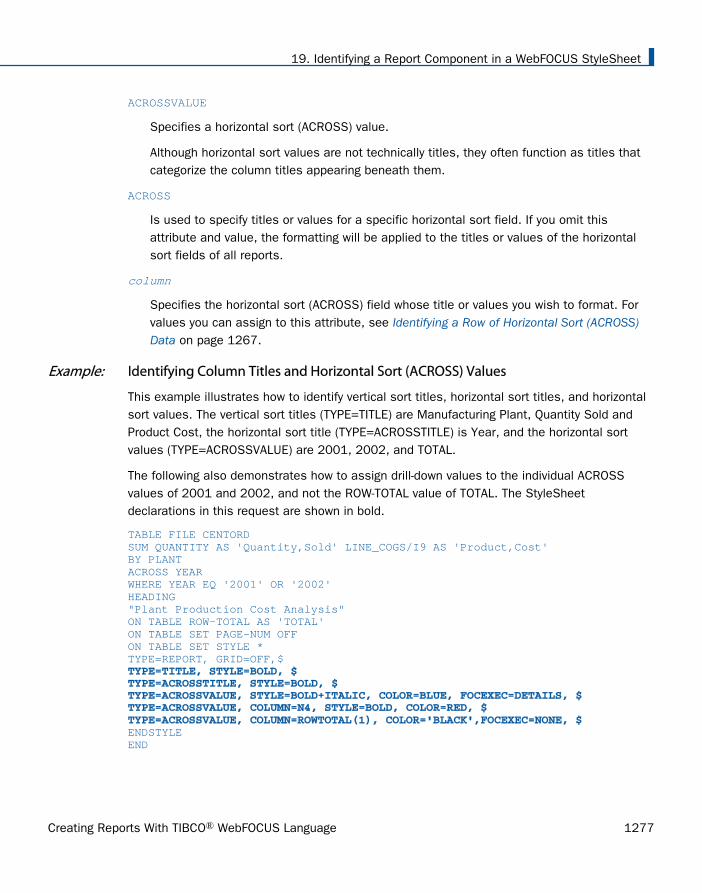
ACROSSVALUE
Specifies a horizontal sort (ACROSS) value.
Although horizontal sort values are not technically titles, they often function as titles thatcategorize the column titles appearing beneath them.
ACROSS
Is used to specify titles or values for a specific horizontal sort field. If you omit thisattribute and value, the formatting will be applied to the titles or values of the horizontalsort fields of all reports.
column
Specifies the horizontal sort (ACROSS) field whose title or values you wish to format. Forvalues you can assign to this attribute, see Identifying a Row of Horizontal Sort (ACROSS)Data on page 1267.
Example: Identifying Column Titles and Horizontal Sort (ACROSS) Values
This example illustrates how to identify vertical sort titles, horizontal sort titles, and horizontalsort values. The vertical sort titles (TYPE=TITLE) are Manufacturing Plant, Quantity Sold andProduct Cost, the horizontal sort title (TYPE=ACROSSTITLE) is Year, and the horizontal sortvalues (TYPE=ACROSSVALUE) are 2001, 2002, and TOTAL.
The following also demonstrates how to assign drill-down values to the individual ACROSSvalues of 2001 and 2002, and not the ROW-TOTAL value of TOTAL. The StyleSheetdeclarations in this request are shown in bold.
TABLE FILE CENTORDSUM QUANTITY AS 'Quantity,Sold' LINE_COGS/I9 AS 'Product,Cost'BY PLANTACROSS YEARWHERE YEAR EQ '2001' OR '2002'HEADING"Plant Production Cost Analysis"ON TABLE ROW-TOTAL AS 'TOTAL'ON TABLE SET PAGE-NUM OFFON TABLE SET STYLE *TYPE=REPORT, GRID=OFF,$ TYPE=TITLE, STYLE=BOLD, $TYPE=ACROSSTITLE, STYLE=BOLD, $TYPE=ACROSSVALUE, STYLE=BOLD+ITALIC, COLOR=BLUE, FOCEXEC=DETAILS, $TYPE=ACROSSVALUE, COLUMN=N4, STYLE=BOLD, COLOR=RED, $TYPE=ACROSSVALUE, COLUMN=ROWTOTAL(1), COLOR='BLACK',FOCEXEC=NONE, $ ENDSTYLEEND
19. Identifying a Report Component in a WebFOCUS StyleSheet
Creating Reports With TIBCO® WebFOCUS Language 1277

The following image shows the report output.
Syntax: How to Identify Free Text in an FML Report
TYPE=FREETEXT, LABEL={Rn|label}
where:
n
Is an implicit row label. To determine the value of n, count the number of rows up to andincluding the desired row.
label
Is an explicit row label.
Identifying a Heading, Footing, Title, or FML Free Text
1278

Example: Identifying Free Text in an FML Report
The following illustrates how to identify free text in an FML report. In this example, the free textare the rows "CASH ACCOUNTS" and "OTHER CURRENT ASSETS". The relevant StyleSheetdeclarations are displayed in bold.
TABLE FILE LEDGERSUM AMOUNT FOR ACCOUNT" --- CASH ACCOUNTS ---" LABEL CA OVER1010 AS 'CASH ON HAND' OVER1020 AS 'DEMAND DEPOSITS' OVER1030 AS 'TIME DEPOSITS' OVER" " OVER" --- OTHER CURRENT ASSETS ---" LABEL OCA OVER1100 AS 'ACCOUNTS RECEIVABLE' OVER1200 AS 'INVENTORY'ON TABLE SET PAGE-NUM OFFON TABLE SET STYLE *TYPE=REPORT, GRID=OFF, $ TYPE=FREETEXT, LABEL=CA, STYLE=BOLD, SIZE=12, $TYPE=FREETEXT, LABEL=OCA, STYLE=BOLD, SIZE=12, $ ENDSTYLEEND
The output is:
Identifying a Heading or Footing
Within a StyleSheet you can identify a report headings and footings, and the individual lines,text strings, and fields within them, in order to format them.
19. Identifying a Report Component in a WebFOCUS StyleSheet
Creating Reports With TIBCO® WebFOCUS Language 1279

A TABLE request can have more than one page heading or footing. For each heading or footing,a WHEN clause against the data being retrieved can determine whether the heading or footingdisplays on the report output. The CONDITION StyleSheet attribute enables you to identify aspecific WHEN clause so that you can style each heading or footing separately.
The following code and output examples illustrate where a report heading (TABHEADING), apage heading (HEADING), a sort heading (SUBHEAD), a sort footing (SUBFOOT), and a reportfooting (TABFOOTING) are in a report, and which TYPE values you use to identify them.
TABLE FILE EMPLOYEEPRINT CURR_SAL HIRE_DATEBY LAST_NAMEBY FIRST_NAMEON TABLE SUBHEAD"CONFIDENTIAL INFORMATION""SWIFTY INFORMATION GROUP - EMPLOYEE LIST BY DEPARTMENT"HEADING CENTER"</1>EMPLOYEE LIST FOR DEPARTMENT: <DEPARTMENT"ON LAST_NAME SUBHEAD"ID: <EMP_ID"ON LAST_NAME SUBFOOT"** REVIEW SALARY FOR <FIRST_NAME <LAST_NAME"FOOTING"CONFIDENTIAL INFORMATION"ON TABLE SUBFOOT"</1>***END OF REPORT***"ON TABLE SET ONLINE-FMT STANDARDEND
The following output goes with the previous code example:
Identifying a Heading, Footing, Title, or FML Free Text
1280

Note: Since this request simply illustrates how to identify different types of headings andfootings, it omits a StyleSheet.
Syntax: How to Identify a Heading or Footing
TYPE=headfoot, [BY=sortcolumn]
where:
headfoot
Identifies a heading or footing. Select from:
TABHEADING, which is a report heading. This appears once at the beginning of thereport and is generated by ON TABLE SUBHEAD.
TABFOOTING, which is a report footing. This appears once at the end of the report andis generated by ON TABLE SUBFOOT.
HEADING, which is a page heading. This appears at the top of every report page and isgenerated by HEADING.
FOOTING, which is a page footing. This appears at the bottom of every report page andis generated by FOOTING.
SUBHEAD, which is a sort heading. This appears at the beginning of a vertical (BY) sortgroup (generated by ON sortfield SUBHEAD).
SUBFOOT, which is a sort footing. This appears at the end of a vertical (BY) sort group(generated by ON sortfield SUBFOOT).
BY
When there are several sort headings or sort footings, each associated with a differentvertical sort (BY) column, this enables you to identify which sort heading or sort footing youwish to format.
If there are several sort headings or sort footings associated with different vertical sort(BY) columns, and you omit this attribute and value, the formatting will be applied to all ofthe sort headings or footings.
sortcolumn
Specifies the vertical sort (BY) column associated with one of the report sort headings orsort footings.
19. Identifying a Report Component in a WebFOCUS StyleSheet
Creating Reports With TIBCO® WebFOCUS Language 1281

Example: Identifying a Page Heading and a Report Footing
The following illustrates how to identify a page heading, which appears at the top of everyreport page, and a report footing, which appears only on the last page of the report. Therelevant StyleSheet declarations are highlighted in the request.
TABLE FILE CENTORDHEADING"Sales Quantity and Amount by Plant"SUM QUANTITY LINEPRICE BY PLANT ON TABLE SUBFOOT" ""***End of Report***"ON TABLE SET PAGE-NUM OFFON TABLE SET STYLE *TYPE=REPORT, GRID=OFF, $ TYPE=HEADING, FONT=TIMES, SIZE=12, STYLE=BOLD,$TYPE=TABFOOTING, JUSTIFY=CENTER, STYLE=BOLD, SIZE=11,$ ENDSTYLEEND
The output is:
Identifying a Heading, Footing, Title, or FML Free Text
1282

Syntax: How to Identify an Individual Line in a Heading or Footing
TYPE=type, LINE=line_#
where:
type
Identifies a type of heading or footing. Select from HEADING, FOOTING, TABHEADING,TABFOOTING, SUBHEAD, or SUBFOOT. For details, see Identifying a Heading or Footing onpage 1279.
line_#
Identifies a line by its position in the heading or footing.
Example: Identifying an Individual Line in a Heading
The following example illustrates how to format individual lines in a heading. Heading line 1(Sales Quantity Analysis) is formatted in bold, point-size 11. Heading line 2 (**Confidential**)is formatted in bold and red. The relevant StyleSheet declarations are highlighted in therequest.
TABLE FILE CENTORDHEADING"Sales Quantity Analysis""**Confidential**"" "SUM QUANTITYACROSS YEARBY PLANTON TABLE SET PAGE-NUM OFFON TABLE SET STYLE *TYPE=REPORT, GRID=OFF, $ TYPE=HEADING, LINE=1, SIZE=11, STYLE=BOLD,$TYPE=HEADING, LINE=2, COLOR=RED, STYLE=BOLD,$ TYPE=HEADING, JUSTIFY=CENTER,$ENDSTYLEEND
19. Identifying a Report Component in a WebFOCUS StyleSheet
Creating Reports With TIBCO® WebFOCUS Language 1283

The output is:
Syntax: How to Identify a Text String in a Heading or Footing
TYPE=type, [LINE=line_#], [OBJECT=TEXT], ITEM=item_#
where:
type
Identifies a type of heading or footing. Select from HEADING, FOOTING, TABHEADING,TABFOOTING, SUBHEAD, or SUBFOOT. For details, see Identifying a Heading or Footing onpage 1279.
line_#
Identifies a line by its position in the heading or footing. You only need to include the LINEattribute if you have a multi-line heading or footing.
TEXT
Formats only text strings and Dialogue Manager variables (also known as &variables). It isnot necessary to use OBJECT=TEXT in your declaration unless you are styling both textstrings and embedded fields in the same heading or footing.
Identifying a Heading, Footing, Title, or FML Free Text
1284

item_#
Identifies an item by its position in a line.
If you need to apply formatting to several parts of a continuous text string that displays onone line, you can break the header or footer into multiple parts using spot markers. Placethe spot marker after the text string you wish to specify. The <+0> spot marker will notadd any additional spaces to your heading or footing. When using spot markers, text isdivided as follows:
Note: When a closing spot marker is immediately followed by an opening spot marker (><),a single space text item will be placed between the two spot markers (> <). This must beconsidered when applying formatting.
The position value also depends on whether you are using the OBJECT attribute or not. Ifyou are using:
OBJECT=TEXT, count only text strings from left to right.
No OBJECT, count text strings and embedded field values from left to right.
19. Identifying a Report Component in a WebFOCUS StyleSheet
Creating Reports With TIBCO® WebFOCUS Language 1285

Example: Identifying a Text String in a Heading Using Spot Markers
The following illustrates how to apply different formats to text strings in a heading using spotmarkers. The spot markers used in this example are <+0> since they do not add any spaces.The relevant StyleSheet declarations are highlighted in the request.
TABLE FILE CENTORDHEADING"Third Quarter,<+0>2002:<+0> Sales Quantity Analysis"SUM QUANTITY BY PLANTON TABLE SET PAGE-NUM OFFON TABLE SET STYLE *TYPE=REPORT, GRID=OFF, $ TYPE=HEADING, OBJECT=TEXT, ITEM=1, STYLE=BOLD+UNDERLINE, SIZE=12, $TYPE=HEADING, OBJECT=TEXT, ITEM=2, COLOR=BLUE, SIZE=12, STYLE=BOLD+UNDERLINE, $TYPE=HEADING, OBJECT=TEXT, ITEM=3, STYLE=ITALIC,$ ENDSTYLEEND
The output is:
Syntax: How to Identify an Embedded Field in a Heading or Footing
TYPE=type, [LINE=line_#], OBJECT=FIELD, [ITEM=item #]
where:
type
Identifies a type of heading or footing. Select from HEADING, FOOTING, TABHEADING,TABFOOTING, SUBHEAD, or SUBFOOT. For details, see Identifying a Heading or Footing onpage 1279.
Identifying a Heading, Footing, Title, or FML Free Text
1286

line_#
Identifies a line by its position in the heading or footing. You only need to include the LINEattribute if you have a multi-line heading or footing.
item_#
Identifies an item by its position in a line.
If you have more than one embedded field in a heading or footing, you must specify thefield you wish to format by giving the item number. Count items from left to right. Do notinclude text fields in the count. You do not need to specify the item number if there is onlyone embedded field in the heading or footing.
Note: BORDER options are not supported on specific ITEMS in a HEADING, FOOTING,SUBHEAD, SUBFOOT.
Example: Identifying Embedded Fields in a Heading
The following illustrates how to format an embedded field in a heading. Notice that the itemnumber is not specified in the StyleSheet declaration since there is only one embedded field inthe heading. The relevant StyleSheet declaration is highlighted in the request.
TABLE FILE CENTORDHEADING"Sales For <YEAR By Plant"SUM QUANTITY BY PLANTWHERE YEAR EQ 2000 ON TABLE SET PAGE-NUM OFFON TABLE SET STYLE *TYPE=REPORT, GRID=OFF, $TYPE=HEADING, OBJECT=TEXT, COLOR=BLUE,$ TYPE=HEADING, OBJECT=FIELD, COLOR=RED, STYLE=BOLD,$ ENDSTYLEEND
19. Identifying a Report Component in a WebFOCUS StyleSheet
Creating Reports With TIBCO® WebFOCUS Language 1287

The output is:
Syntax: How to Identify a Specific Heading or Footing Based on a WHEN Clause
TYPE = {HEADING|FOOTING}, CONDITION = n, ... ,$
where:
n
Is the number of the WHEN condition in the heading or footing from top to bottom. If notspecified, formatting applies to all headings and footings.
Example: Styling Multiple Headings With WHEN
The following request displays a page for each employee with salary and job code informationfor that employee. The first WHEN condition applies if the employee is female. The secondWHEN condition applies if the employee is male. The third WHEN condition applies if thedepartment is MIS. The fourth WHEN condition applies if the department is PRODUCTION. TheStyleSheet declarations include styling elements for the second and third conditions:
Identifying a Heading, Footing, Title, or FML Free Text
1288

DEFINE FILE EMPLOYEEGENDER/A1 = DECODE FIRST_NAME(ALFRED 'M' RICHARD 'M' JOHN 'M' ANTHONY 'M' ROGER 'M' MARY 'F' DIANE 'F' JOAN 'F' ROSEMARIE 'F' BARBARA 'F');MIXEDNAME/A15 = LCWORD(15, LAST_NAME, MIXEDNAME);NAME/A16 = MIXEDNAME||',';END
TABLE FILE EMPLOYEEPRINT LAST_NAME NOPRINT GENDER NOPRINT NAME NOPRINTHEADING"Dear Ms. <NAME" WHEN GENDER EQ 'F';HEADING"Dear Mr. <NAME>" WHEN GENDER EQ 'M';HEADING" "HEADING"This is to inform you that your current salary is ""<CURR_SAL and <CURR_JOBCODE>is your job code."" ""Sincerely,"HEADING"Barbara Cross " WHEN DEPARTMENT EQ 'MIS';HEADING"John Banning " WHEN DEPARTMENT EQ 'PRODUCTION' ;WHERE LAST_NAME NE 'BANNING' OR 'CROSS'BY EMP_ID NOPRINT PAGE-BREAKON TABLE SET PAGE NOPAGEON TABLE PCHOLD FORMAT PDFON TABLE SET STYLE *TYPE=HEADING, CONDITION=2, STYLE=ITALIC,$TYPE=HEADING, CONDITION=3, STYLE=BOLD,$ENDSTYLEEND
In the StyleSheet for the request, heading lines displayed because of the first condition are initalics and heading lines displayed because of the third condition are in boldface.
The first page of output is for a male employee, so the greeting line is in italics:
19. Identifying a Report Component in a WebFOCUS StyleSheet
Creating Reports With TIBCO® WebFOCUS Language 1289

The second page of output is for an employee in the MIS department, so the signature line isin boldface:
Identifying a Page Number, Underline, or Skipped Line
In a report you can identify and format page numbers, underlines, and skipped lines using thePAGENUM, SKIPLINE, and UNDERLINE attributes.
Note that although you can insert skipped lines and underlines in an HTML report, formatting isnot supported.
The following code and output examples illustrate where the PAGENUM, UNDERLINE, andSKIPLINE components appear in a report, and which TYPE values you use to identify them.
SET ONLINE-FMT=PDFTABLE FILE CENTORDHEADING"Sales By Plant"SUM QUANTITY BY PLANT BY YEARWHERE PLANT EQ 'BOS' OR 'DAL'ON YEAR UNDER-LINEON PLANT SKIP-LINEEND
Identifying a Page Number, Underline, or Skipped Line
1290

The following output goes with the previous code example.
Note: Since this request simply illustrates where the components appear in a report, it omits aStyleSheet.
Syntax: How to Identify a Page Number, Underline, or Skipped Line
TYPE=type
where:
type
Identifies the report component. Select from:
PAGENUM which identifies page numbers.
SKIPLINE which denotes skipped lines generated by ON field SKIP-LINE. This is notsupported for reports in HTML format.
UNDERLINE which identifies underlines generated by ON field UNDER-LINE, or by BAR in aFinancial Modeling Language (FML) report. This is not supported for reports in HTMLformat.
19. Identifying a Report Component in a WebFOCUS StyleSheet
Creating Reports With TIBCO® WebFOCUS Language 1291

Example: Identifying Underlines and Page Numbers
The following illustrates how to identify underlines and page numbers in a report request. Therelevant StyleSheet declarations appear in boldface in the request.
Note that this report is formatted in PDF since formatting is not supported for underlines in anHTML report.
SET ONLINE-FMT=PDFTABLE FILE CENTORDHEADING"Sales By Plant"SUM QUANTITY BY PLANT BY YEARWHERE PLANT EQ 'BOS' OR 'DAL' OR 'LA'ON PLANT UNDER-LINE SKIP-LINEON TABLE SET STYLE *TYPE=REPORT, GRID=OFF, $TYPE=HEADING, OBJECT=TEXT, COLOR=BLUE, FONT=ARIAL,$ TYPE=PAGENUM, STYLE=ITALIC, SIZE=8,$TYPE=UNDERLINE, COLOR=RED,$ ENDSTYLEEND
The output is:
Identifying a Page Number, Underline, or Skipped Line
1292

Example: Identifying Skipped Lines
The following illustrates how to identify skipped lines in a report. The relevant StyleSheetdeclaration is highlighted in the request.
SET ONLINE-FMT=PDFTABLE FILE CENTINVHEADING"Low Stock Report"" "SUM QTY_IN_STOCK WHERE QTY_IN_STOCK LT 5000BY PRODNAMEON PRODNAME SKIP-LINEON TABLE SET PAGE-NUM OFFON TABLE SET STYLE * TYPE=SKIPLINE, BACKCOLOR=SILVER, $ ENDSTYLEEND
The output is:
19. Identifying a Report Component in a WebFOCUS StyleSheet
Creating Reports With TIBCO® WebFOCUS Language 1293
Identifying a Page Number, Underline, or Skipped Line
1294

Chapter20Using an External Cascading Style Sheet
Cascading style sheets (CSS) provide a standard way of formatting HTML documents. Toformat WebFOCUS HTML report output using an external CSS, simply link the CSS to thereport (using the WebFOCUS StyleSheet CSSURL attribute) and, optionally, apply the CSSclasses to specific report components (using the CLASS attribute).
In this chapter:
What Is a Cascading Style Sheet?
Why Use an External Cascading Style Sheet?
Formatting a Report With an External Cascading Style Sheet
Working With an External Cascading Style Sheet
Applying External Cascading Style Sheet Formatting
Combining an External CSS With Other Formatting Methods
Linking to an External Cascading Style Sheet
Inheritance and External Cascading Style Sheets
Using External Cascading Style Sheets With Non-HTML Reports
Requirements for Using an External Cascading Style Sheet
FAQ About Using External Cascading Style Sheets
Troubleshooting External Cascading Style Sheets
What Is a Cascading Style Sheet?
Cascading style sheets (CSS) are an extension to HTML that allow you to specify formatting foran HTML document. You can use two kinds of CSS with WebFOCUS:
An internal cascading style sheet, which is stored internally in the HTML document that itformats. For information about generating and using an internal CSS for a WebFOCUSreport, see Generating an Internal Cascading Style Sheet for HTML Reports on page 1222.
Creating Reports With TIBCO® WebFOCUS Language 1295

An external cascading style sheet, which is stored in a separate file that can be shared bymultiple documents. The external CSS file can reside on any web server accessible to thebrowser. You specify its location using the CSSURL WebFOCUS StyleSheet attribute, theCSSURL SET parameter, or (in special cases) the LINK element.
You can define classes in a cascading style sheet, and format a report component byassigning one of these CSS classes to it. Classes are described in What Are Cascading StyleSheet Rules and Classes? on page 1296.
Cascading style sheets are called cascading because several different style sheets can beactive for a single document at the same time. For example, one style sheet may beassociated with the document itself, another style sheet may be linked to the first one, and yetanother may be associated with the web browser on which the document is being displayed.When multiple style sheets are in effect, they are applied to the document in a pre-determinedsequence set by the browser: their formatting instructions can be thought of as cascading fromone style sheet to the next.
The benefits of using an external cascading style sheet to format a report are described in WhyUse an External Cascading Style Sheet? on page 1297.
You will find external cascading style sheets relevant if you:
Develop reports, since you now have an improved way of formatting those reports.
Are responsible for presentation guidelines for web documents, since you will now be ableto apply your existing cascading style sheets to reports.
For information about internal cascading style sheets, see Generating an Internal CascadingStyle Sheet for HTML Reports on page 1222.
Need more information about CSS? This WebFOCUS documentation assumes that you have aworking knowledge of cascading style sheets. Teaching about CSS is beyond the scope of thisdocumentation, but many sources of information are available to you. A useful place to beginonline is the World Wide Web Consortium's cascading style sheets home page (http://www.w3.org/Style/CSS/).
What Are Cascading Style Sheet Rules and Classes?
A cascading style sheet (CSS) defines formatting in statements called rules. For example, thisis a simple rule that makes the background color of the body of an HTML page yellow:
BODY {background: yellow}
Each rule has a selector (BODY in this example) and a declaration (background: yellow). Adeclaration has a property (background) and a value assigned to the property (yellow).
What Is a Cascading Style Sheet?
1296
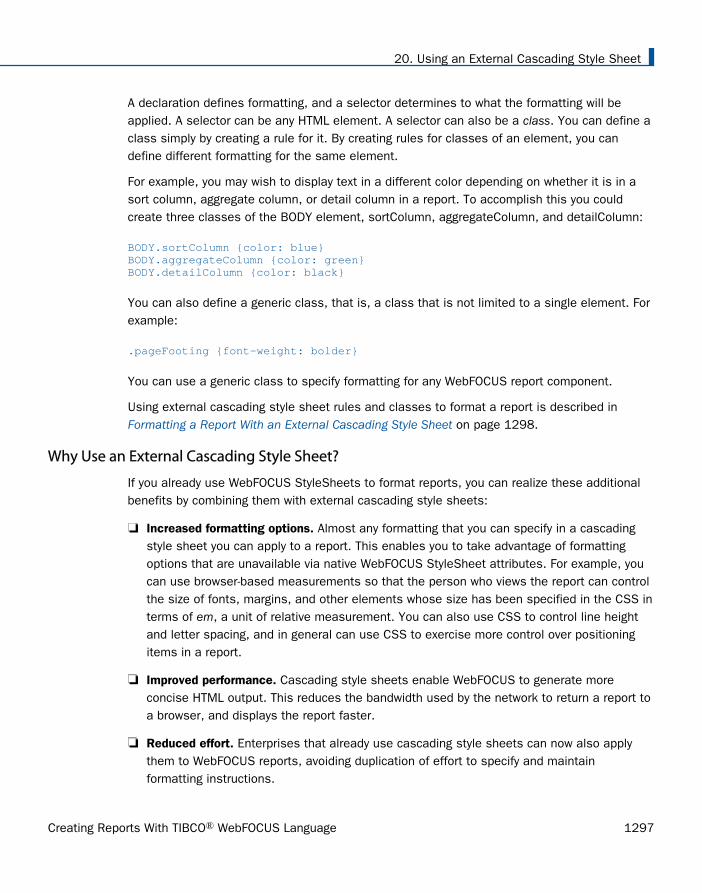
A declaration defines formatting, and a selector determines to what the formatting will beapplied. A selector can be any HTML element. A selector can also be a class. You can define aclass simply by creating a rule for it. By creating rules for classes of an element, you candefine different formatting for the same element.
For example, you may wish to display text in a different color depending on whether it is in asort column, aggregate column, or detail column in a report. To accomplish this you couldcreate three classes of the BODY element, sortColumn, aggregateColumn, and detailColumn:
BODY.sortColumn {color: blue}BODY.aggregateColumn {color: green}BODY.detailColumn {color: black}
You can also define a generic class, that is, a class that is not limited to a single element. Forexample:
.pageFooting {font-weight: bolder}
You can use a generic class to specify formatting for any WebFOCUS report component.
Using external cascading style sheet rules and classes to format a report is described in Formatting a Report With an External Cascading Style Sheet on page 1298.
Why Use an External Cascading Style Sheet?
If you already use WebFOCUS StyleSheets to format reports, you can realize these additionalbenefits by combining them with external cascading style sheets:
Increased formatting options. Almost any formatting that you can specify in a cascadingstyle sheet you can apply to a report. This enables you to take advantage of formattingoptions that are unavailable via native WebFOCUS StyleSheet attributes. For example, youcan use browser-based measurements so that the person who views the report can controlthe size of fonts, margins, and other elements whose size has been specified in the CSS interms of em, a unit of relative measurement. You can also use CSS to control line heightand letter spacing, and in general can use CSS to exercise more control over positioningitems in a report.
Improved performance. Cascading style sheets enable WebFOCUS to generate moreconcise HTML output. This reduces the bandwidth used by the network to return a report toa browser, and displays the report faster.
Reduced effort. Enterprises that already use cascading style sheets can now also applythem to WebFOCUS reports, avoiding duplication of effort to specify and maintainformatting instructions.
20. Using an External Cascading Style Sheet
Creating Reports With TIBCO® WebFOCUS Language 1297
Easier standards conformance. You can ensure that reports conform to your enterprise'sformatting guidelines, because now formatting instructions for all your Web documents canbe specified in one set of cascading style sheets (instead of replicating some of them inWebFOCUS StyleSheets).
Formatting a Report With an External Cascading Style Sheet
There are just three items required to format a report with an external cascading style sheet(CSS):
An external cascading style sheet that specifies the formatting to be applied to the report.For more information, see Working With an External Cascading Style Sheet on page 1304.
A WebFOCUS StyleSheet in which you apply external CSS formatting to the components ofyour report. However, you do not need a WebFOCUS StyleSheet when you apply formattingto the entire report. For more information, see Applying External Cascading Style SheetFormatting on page 1308.
(Although you can also use a WebFOCUS StyleSheet to specify additional formattingoutside of the external CSS, this is subject to restrictions. For more information, see Combining an External CSS With Other Formatting Methods on page 1310.)
A link to the external cascading style sheet from the report. For more information, see Linking to an External Cascading Style Sheet on page 1312.
To find out how to use these three items to format a report, see How to Format a Report Usingan External Cascading Style Sheet on page 1300.
Formatting a Report With an External Cascading Style Sheet
1298

For an example that demonstrates how these items work together, see Linking to theReportStyles External Cascading Style Sheet on page 1301 and the following diagram:
20. Using an External Cascading Style Sheet
Creating Reports With TIBCO® WebFOCUS Language 1299
Procedure: How to Format a Report Using an External Cascading Style Sheet
To format a report using an external cascading style sheet (CSS):
1. Specify the report formatting in the CSS. Determine which cascading style sheet you willuse, which of its rules specify default formatting for your report, and which of its classesare suitable for you to apply to the report components. Alternatively, if you are creating anew CSS, or extending an existing one, define new rules to specify formatting for yourreport. To specify formatting for:
A report component, you can use a rule for any generic class (that is, any class notdeclared for an element). For an example, see A CSS Rule for the ColumnTitle Class onpage 1301.
Graphs differ from other types of reports: to specify formatting for the page in whichthe graph appears, or for the graph heading or footing, you can use a rule for the BODYelement, but not a rule for a class. You cannot format other graph components.
The entire report, use a rule for the BODY or TD elements (not a rule for a class ofthese elements), and skip Step 2. This is an effective way of specifying the defaultformatting of a report, and generates more efficient report output than does applying aCSS class to the entire report. For an example, see A CSS Rule for the TD Element onpage 1301.
Graphs differ from other types of reports: you can use a rule for the BODY element, butnot one for TD. A rule for BODY will format the page in which the graph appears, and itsheading and footing, but not the graph itself.
For more information, see Working With an External Cascading Style Sheet on page 1304.
2. Assign classes to report components. In a WebFOCUS StyleSheet, assign a cascadingstyle sheet class to each report component that you want to format. Specify the classusing the CLASS attribute. You can assign each component a different class, and you canassign the same class to multiple components.
For an example, see Applying a CSS Class to ACROSS Values in a Report on page 1301.For more information, see Applying External Cascading Style Sheet Formatting on page1308.
3. Link to the CSS. Link to the external cascading style sheet by assigning the CSS file URLto either the CSSURL WebFOCUS StyleSheet attribute or to the CSSURL SET parameter.For instructions, see Using the CSSURL Attribute and Parameter on page 1312.
There is one exception: if you embed the report output in an existing HTML page using the-HTMLFORM command, include a LINK element in that HTML page instead of settingCSSURL.
Formatting a Report With an External Cascading Style Sheet
1300

For an example, see Linking to the ReportStyles External Cascading Style Sheet on page1301. For more information, see Linking to an External Cascading Style Sheet on page1312.
Problems? If you encounter problems, see Troubleshooting External Cascading Style Sheets onpage 1329.
Reference: A CSS Rule for the ColumnTitle Class
This cascading style sheet (CSS) rule declares the ColumnTitle generic class (that is, a classnot tied to an element):
.ColumnTitle {font-family:helvetica; font-weight:bold; color:blue;}
Reference: A CSS Rule for the TD Element
This cascading style sheet (CSS) rule for the TD element specifies the element's font family:
TD {font-family:helvetica}
Because this rule is for the TD element, its formatting is applied to an entire report, not just acomponent of the report.
For a more comprehensive example of using a rule for the TD element to provide general reportformatting, see Linking to the ReportStyles External Cascading Style Sheet on page 1301.
Reference: Applying a CSS Class to ACROSS Values in a Report
This WebFOCUS StyleSheet declaration formats ACROSS values by applying the formattingspecified for the ColumnTitle class:
TYPE=AcrossValue, CLASS=ColumnTitle, $
Reference: Linking to the ReportStyles External Cascading Style Sheet
This WebFOCUS StyleSheet declaration links to the ReportStyles external cascading stylesheet:
TYPE=REPORT, CSSURL=http://webserv1/css/reportstyles.css
or
TYPE=REPORT, CSSURL=IBFS:/WFC/Repository/css/reportstyles.css
20. Using an External Cascading Style Sheet
Creating Reports With TIBCO® WebFOCUS Language 1301

You could accomplish the same thing using a SET command:
SET CSSURL=http://webserv1/css/reportstyles.css
Or within a request:
ON TABLE SET CSSURL=http://webserv1/css/reportstyles.css
Alternatively, if you want to embed your report output in an existing HTML page using -HTMLFORM, you would specify the link by coding the LINK element in the HTML page in whichthe report will be embedded, instead of setting CSSURL:
<HEAD><TITLE>Accounts Receivable Report</TITLE><LINK REL="STYLESHEET" HREF="http://srv3/css/reports.css" TYPE="text/css"></HEAD>
Example: Formatting a Report Using an External CSS
This report displays the products currently offered by Gotham Grinds, and is formatted usingan external cascading style sheet (CSS). The report is formatted so that:
Its default font family is Arial.
The report heading overrides the default with a font family of Times New Roman. Theheading is also in a larger font and center justified.
All column titles are in a bolder font and have a light-blue background.
When a product unit price is less than $27, the report displays the product row in greenitalics.
The report request and inline WebFOCUS StyleSheet are shown in the following procedure,curprods.fex. The external cascading style sheet, named report01.css, follows the procedure.
curprods.fex
TABLE FILE GGPRODS HEADING "</1 Current Products</1" PRINT PRODUCT_DESCRIPTION UNIT_PRICE BY PRODUCT_ID ON TABLE SET PAGE-NUM OFF 1. ON TABLE SET STYLE * 2. TYPE=REPORT, CSSURL=http://websrv2/css/report01.css, $ 3. TYPE=HEADING, CLASS=headText, $ 4. TYPE=TITLE, CLASS=reportTitles, $ 5. TYPE=DATA, CLASS=lowCost, WHEN=N3 LT 27, $ 6. ENDSTYLE END
Formatting a Report With an External Cascading Style Sheet
1302

Note: To specify a path that points to a WebFOCUS repository that contains the report01.cssfile, use the following syntax for the CSSURL parameter on the TYPE=REPORT line in therequest:
TYPE=REPORT, CSSURL=IBFS:/WFC/Repository/css/report01.css, $
Where css is the folder in the WebFOCUS repository where the report01.css file resides.
report01.css
7. BODY {font-family:Arial, sans-serif} 8. TABLE {border:0} 8. TD {border:0} 9. .reportTitles {font-weight:bolder; background:lightblue;} 10. .lowCost {color:green; font-style:italic;} 11. .headText {font-family:Times New Roman, serif; font-size:larger; text-align:center}
1. Begin the inline WebFOCUS StyleSheet.
2. Link to the external cascading style sheet, report01.css.
3. Format the report heading using the cascading style sheet rule for the headText class.
4. Format the report column titles using the CSS rule for the reportTitles class.
5. For each report row for which the product unit cost is less than $27, format that row usingthe CSS rule for the lowCost class.
6. End the inline WebFOCUS StyleSheet.
7. This CSS rule for the BODY element specifies the font family Arial and, if Arial isunavailable, the generic font family sans serif.
Because this is a rule for BODY, it is applied to the entire report: all text in the report willdefault to Arial. You can override this for a particular report component by applying a rulefor a generic class to that component, as is done in this procedure with the rule for theheadText class (see line 11).
8. These CSS rules for the TABLE and TD elements remove the report default grid.
9. This CSS rule for the generic class reportTitles specifies a bolder relative font weight and alight blue background color.
The WebFOCUS StyleSheet applies this to the report column titles (see line 4).
10.This CSS rule for the generic class lowCost specifies the text color green and the font styleitalic.
The WebFOCUS StyleSheet applies this rule conditionally to report rows for which theproduct unit cost is less than $27 (see line 5).
20. Using an External Cascading Style Sheet
Creating Reports With TIBCO® WebFOCUS Language 1303

11.The CSS rule for the generic class headText specifies the font family Times New Romanand, if Times New Roman is unavailable, the generic font family serif. It also specifies alarger relative font size and center justification.
The WebFOCUS StyleSheet applies this rule to the report heading. It overrides the defaultfont family specified in the rule for the BODY element (see line 7).
The procedure displays this report:
Working With an External Cascading Style Sheet
When you work with an external cascading style sheet (CSS) to specify report formatting, youneed to know about:
Choosing an existing or new external CSS. For more information, see Choosing an ExternalCascading Style Sheet on page 1305.
Where an external CSS can reside. For more information, see External Cascading StyleSheet Location on page 1305.
How you can apply multiple cascading style sheets to one report. For more information, see Using Several External Cascading Style Sheets on page 1305.
Editing an external CSS. For more information, see Editing an External Cascading StyleSheet on page 1306.
Working With an External Cascading Style Sheet
1304
Using CSS rules and classes to specify report formatting. For more information, see Choosing a Cascading Style Sheet Rule on page 1306.
Suggestions for naming cascading style sheet classes. For more information, see Naming aCascading Style Sheet Class on page 1307.
Combining other formatting methods, such as WebFOCUS StyleSheets or TABLE languageinstructions, with an external CSS. For more information, see Combining an External CSSWith Other Formatting Methods on page 1310.
Choosing an External Cascading Style Sheet
To format a report using an external cascading style sheet (CSS), you can choose to:
Apply an existing CSS with no changes. The external cascading style sheet can be onethat you use for other documents, and can contain all kinds of rules, not only rules thatformat reports. For example, the CSS could include rules to format other elements in thewebpages used by your WebFOCUS applications, as well as rules for other kinds ofwebpages. This enables you to use one cascading style sheet to format all of your webdocuments.
Edit an existing CSS to add or modify rules. For example, you might edit a cascading stylesheet to add new generic classes to format report components.
Create a new CSS. You can create a new cascading style sheet to format your reports. Seethe recommendations in Naming a Cascading Style Sheet Class on page 1307 aboutnaming classes.
To create an external cascading style sheet, use a text editor or a third-party web developmenttool.
External Cascading Style Sheet Location
An external cascading style sheet (CSS) can reside on any web server platform. However, ifCSSURL (the StyleSheet attribute or the SET parameter) specifies a relative URL, thecascading style sheet must reside on the web server used by WebFOCUS.
Using Several External Cascading Style Sheets
Although each report procedure can link to only one external cascading style sheet (CSS), youcan use several cascading style sheets to format a report by linking to one CSS that thenimports several others. For information about importing one CSS into another, see your third-party CSS documentation.
20. Using an External Cascading Style Sheet
Creating Reports With TIBCO® WebFOCUS Language 1305

Editing an External Cascading Style Sheet
You can edit an external cascading style sheet (CSS) using a text editor or a third-party webdevelopment tool.
If the formatting of a report is specified entirely using a cascading style sheet, and you editthat CSS, the next time someone displays the report it will reflect the changes to the CSSwithout the report having to be rerun.
However, if the report does not reflect the changes, it may be because the web browser iscontinuing to use the old version of the CSS that it had stored in cache. The person displayingthe report may need to reload the CSS file from the web server by clicking the Refresh buttonof the browser in Microsoft Internet Explorer to ensure that the browser uses the most currentversion of the CSS to format the report.
Choosing a Cascading Style Sheet Rule
You can format different parts of a report using different types of rules.
To format: Use a rule for:
The entire report BODY or TD
Any report component A generic class (that is, one declared withoutan element)
To choose between using a rule for BODY or for TD, note that a rule for:
BODY will specify default formatting for the entire webpage in which the report appears,including the report itself. (Note that this relies upon CSS inheritance which, like all CSSbehavior, is implemented by the web browser of each user and is browser-dependent.)
Graphs differ from other types of reports: a rule for BODY will format the page in which thegraph appears, and its heading and footing, but not the graph itself.
Working With an External Cascading Style Sheet
1306

TD will specify default formatting only for the report, and for any other table cells that youmay have on the page. TD is the table data (that is, table cell) element. WebFOCUSgenerates most HTML report output as an HTML table, placing each report item in aseparate cell. This enables a rule for TD to format the entire report.
Graphs differ from other types of reports: to specify default formatting for a graph, use arule for BODY, not for TD. See the previous note regarding formatting graphs using a rulefor BODY.
When you use a rule for a class to format a report component, you must assign the class tothe component in a WebFOCUS StyleSheet using the CLASS attribute, as described in How toUse the CLASS Attribute to Apply CSS Formatting on page 1309.
If you wish to apply several CSS properties to a single report component, we recommend thatyou declare them in a single class. This generates more efficient output than does declaringone property per class.
The owner of each cascading style sheet should consider making available a list of all theclasses in that CSS that can be used to format reports, so that everyone who develops reportsknows from which classes they may choose.
For an example of a rule for:
A generic class to format a report component, see A CSS Rule for the ColumnTitle Class onpage 1301.
The TD element to format an entire report, see A CSS Rule for the TD Element on page1301.
Naming a Cascading Style Sheet Class
When you provide a name for a new class, note that class names are case-sensitive (althoughsome web browsers may not enforce case sensitivity).
When you create a new class, we recommend naming it after the function, not the appearance,of the report component to which you will be applying it. This ensures that the name remainsmeaningful even if you later change the appearance of the report component. For example, ifyou want all report titles to be red, the class you declare to format titles might be named Title,but not Red.
20. Using an External Cascading Style Sheet
Creating Reports With TIBCO® WebFOCUS Language 1307

Applying External Cascading Style Sheet Formatting
You can apply external cascading style sheet (CSS) formatting to:
A report component (for example, to make a column italic). Assign a cascading style sheetclass to the report component using the WebFOCUS StyleSheet CLASS attribute. Forinformation about the CLASS attribute, see How to Use the CLASS Attribute to Apply CSSFormatting on page 1309. For information about specifying different types of reportcomponents, see Identifying a Report Component in a WebFOCUS StyleSheet on page1251..
When formatting a tabular or free-form report, you can format any report component byassigning a CSS class.
When formatting a graph report, you can format the graph heading and footing, and canspecify the background color and background image of the page in which the graphappears, in a rule for the BODY element. (Note that when formatting a graph heading orfooting, you cannot format individual lines, strings, and field values. If you wish to center aheading or footing, it is recommended that you do so using the CENTER option of theHEADING or FOOTING command, not in a style sheet.)
When working with the WebFOCUS StyleSheet CLASS attribute, you must edit theWebFOCUS StyleSheet using the WebFOCUS text editor.
An entire report (for example, to make the entire report italic). You specify the formatting inthe external CSS in a rule for the BODY or TD elements (for graphs, specify the formattingin a rule for the BODY element only. This will format the page in which the graph appears,and the graph heading and footing, but not the graph itself). You must also link the reportto the CSS. You do not need a rule for a class of an element, and you do not need aWebFOCUS StyleSheet declaration. For an example, see A CSS Rule for the TD Element onpage 1301.
We recommend that when you use an external cascading style sheet to format a report, you donot also use a WebFOCUS StyleSheet to specify the report formatting, unless you alsogenerate an internal cascading style sheet. For more information, see Combining an ExternalCSS With Other Formatting Methods on page 1310.
Applying External Cascading Style Sheet Formatting
1308

Syntax: How to Use the CLASS Attribute to Apply CSS Formatting
To apply an external cascading style sheet (CSS) class to a report component, use thefollowing syntax in a WebFOCUS StyleSheet declaration
TYPE = type, [subtype,] CLASS = classname, [when,] [link,] $
where:
type
Identifies the report component to which you are applying the class formatting. For tabularand free-form reports, it can be any component, as described in Identifying a ReportComponent in a WebFOCUS StyleSheet on page 1251. You cannot specify a component ofa graph report: to format a graph's heading and footing, and the background color andbackground image of the page in which the graph appears, use a rule for the BODYelement without a WebFOCUS StyleSheet declaration.
Each report component can be formatted by one class. If you specify several classes for areport component:
1. The classes that are in declarations with conditional formatting are evaluated first. Foreach cell in the report component, the first class whose condition is satisfied by thecell row is assigned to the cell.
2. If none of the conditions is satisfied, or if there are no conditional declarations, theclass in the first unconditional declaration is assigned to the report component. Allfollowing declarations for that component are ignored.
subtype
Is an optional attribute and value needed to completely specify some kinds of reportcomponents. For example, COLUMN and a column identifier are needed to specify aparticular report column.
classname
Is the name of the cascading style sheet class whose formatting you are applying to thereport component. You can assign the same class to multiple report components.
Class names can be up to 511 characters and are case-sensitive: you must use the samecase found in the class rule in the external cascading style sheet. (Note, however, thatsome web browsers may not enforce case sensitivity.)
when
Is an optional WHEN attribute and value. Supply this if you want to apply the formattingconditionally. For more information, see Formatting Reports: An Overview on page 1189.
20. Using an External Cascading Style Sheet
Creating Reports With TIBCO® WebFOCUS Language 1309

link
Is an optional FOCEXEC, URL, or JAVASCRIPT attribute and value. Supply this if you want tolink the report component to another resource, such as a report to which the user can drilldown. For more information, see Linking a Report to Other Resources on page 821.
For an example, see Applying a CSS Class to ACROSS Values in a Report on page 1301.
Combining an External CSS With Other Formatting Methods
When you use an external cascading style sheet (CSS) to format a report, you can use otherformatting methods at the same time. Some of these other methods are subject torestrictions. The other methods that you can use with an external CSS are:
WebFOCUS StyleSheets. An effective way of combining an external CSS with a WebFOCUSStyleSheet is to link to an external CSS to provide default formatting, and use a WebFOCUSStyleSheet to override those defaults for individual report components. Note that if youcombine a WebFOCUS StyleSheet and an external cascading style sheet, you shouldgenerate an internal cascading style sheet to avoid reducing the performance benefitsassociated with an external CSS.
Do not attempt to format the same property of the same report component using both anexternal CSS class (through the CLASS attribute) and a WebFOCUS StyleSheet attribute,since the two formatting instructions could conflict with each other.
For complete instructions about using an external CSS with a WebFOCUS StyleSheet, see Combining an External CSS With a WebFOCUS StyleSheet on page 1311.
TABLE language instructions. You can use TABLE language (or GRAPH language)formatting instructions, such as HEADING CENTER, PAGE-BREAK, and spot markers (forexample, </3). However, you should not apply both a TABLE (or GRAPH) languageinstruction, and an external cascading style sheet rule, to perform the same formatting onthe same report component, because they might conflict with each other.
For example, you should not specify both of the following for the same report:
HEADING CENTER in the report request.
Text-align in an external CSS, applied to the report page heading.
Both of these will attempt to align the report page heading.
Combining an External CSS With Other Formatting Methods
1310

Combining an External CSS With a WebFOCUS StyleSheet
When you use an external cascading style sheet (CSS) to format a report, you can use aWebFOCUS StyleSheet at the same time. You may do this with or without generating aninternal cascading style sheet.
An effective way of doing this is to link to an external CSS to provide default formatting, anduse a WebFOCUS StyleSheet to override those defaults for individual report components. Thecascading style sheet BODY or TD rule will provide the default formatting for the report. If youwish, you can override the defaults for individual report components via native WebFOCUSStyleSheet attributes. This enables you to conform to your organization's formatting standardsas they are implemented in a CSS, while allowing you to customize those standards forWebFOCUS reports using WebFOCUS StyleSheet attributes. For information about using aBODY or TD rule for default formatting, see Choosing a Cascading Style Sheet Rule on page1306. For an example, see Inheritance and External Cascading Style Sheets on page 1316.
Performance considerations. Note that, unless you generate an internal cascading style sheetfrom the WebFOCUS StyleSheet, combining an external CSS and a WebFOCUS StyleSheet mayreduce the performance benefits associated with the external CSS. This is because a reportthat uses both an external CSS and native WebFOCUS StyleSheet attributes generates moreHTML code than the same report using an external CSS alone, although it still generates lesscode than if the report had used native WebFOCUS StyleSheet attributes alone. (Reducing theamount of generated HTML code can reduce network load and browser display time.) Forinformation about generating an internal cascading style sheet, see Generating an InternalCascading Style Sheet for HTML Reports on page 1222.
You cannot double-format. You should not attempt to format the same property of the samereport component using both an external CSS class (via the CLASS attribute) and a WebFOCUSStyleSheet attribute, since the class and the StyleSheet attribute could conflict with eachother.
For example, you should not include the following declarations in the same StyleSheetbecause they would both try to assign a color to the Country column:
TYPE=Data, COLUMN=Country, COLOR=Orange, $TYPE=Data, CLASS=TextColor, $
20. Using an External Cascading Style Sheet
Creating Reports With TIBCO® WebFOCUS Language 1311
You can specify classes and WebFOCUS StyleSheet attributes that format different propertiesof the same report component, and that format different report components. For example, thefollowing declarations are acceptable in the same StyleSheet:
1. TYPE=Heading, COLOR=Green, $ 1. TYPE=Heading, CLASS=HeadingFontSize, $ 2. TYPE=Data, Column=Country, BACKCOLOR=Yellow, $ 2. TYPE=Data, Column=Car, CLASS=DataBackgroundColor, $ 3. TYPE=Data, Column=Model, FOCEXEC=NewSales(CarGroup=Car), $
1. These two declarations are compatible because they format different properties (color andfont size).
2. These two declarations are compatible because they format different report components(the Country column and the Car column).
3. This declaration will be compatible with all CSS classes, since it does not format a reportcomponent, but instead defines a hyperlink.
Linking to an External Cascading Style Sheet
To format a report using an external cascading style sheet (CSS), you must link the cascadingstyle sheet to the report in one of the following ways:
For most report procedures, assign the CSS file's URL to the CSSURL attribute orparameter. For more information, see Using the CSSURL Attribute and Parameter on page1312.
For report output that you are embedding in an existing HTML page using the -HTMLFORMcommand, include a LINK element in the existing HTML page to point to the external CSSfile. For example, if you are embedding a report from an output (HOLD) file that wasgenerated in HTMTABLE format, use LINK. For more information, see your third-party CSSdocumentation. For an example, see Linking to the ReportStyles External Cascading StyleSheet on page 1301.
Using the CSSURL Attribute and Parameter
You can link an external cascading style sheet (CSS) to a report using the CSSURL WebFOCUSStyleSheet attribute or the CSSURL SET parameter. To choose between them, consider theadvantages of:
An attribute. Using CSSURL as a StyleSheet attribute enables you to specify:
A longer URL, since the maximum URL length is 255 characters in the attribute,compared with 69 characters in the parameter.
Linking to an External Cascading Style Sheet
1312

All formatting information in one place, since you can specify the link to the externalCSS and the references to CSS classes within the WebFOCUS StyleSheet. This makes iteasier for you to maintain your formatting logic.
A SET parameter. Using CSSURL as a SET parameter enables you to quickly redirect a link(from one CSS to another) for many reports at once. You do this by putting the SETCSSURL command in its own procedure, and merging that into report procedures using a -INCLUDE Dialogue Manager statement in each report procedure.
If you specify CSSURL in several ways, the specification with the most local scope takesprecedence. The order of precedence, from highest (1) to lowest (3), is:
For more information about the CSS attribute, see How to Use the CSSURL Attribute to Link toan External CSS on page 1313. For more information about the CSS parameter, see How toUse the CSSURL Parameter to Link to an External CSS on page 1315.
Syntax: How to Use the CSSURL Attribute to Link to an External CSS
To link an external cascading style sheet (CSS) to report using a WebFOCUS StyleSheetattribute, use the following syntax
[TYPE=REPORT,] CSSURL={url|ibfs}, $
where:
TYPE=REPORT
Specifies that this attribute is being applied to the entire report. If it is omitted, theStyleSheet declaration defaults to it.
url
Is the URL of the external cascading style sheet. If the external CSS resides on a webserver platform that is case-sensitive, you must specify it using the correct case.
The URL can be up to 255 characters. If your external cascading style sheet URL exceedsthis limit, you can shorten the URL by defining an alias (also known as a virtual directory)on the web server to represent part of the path.
You can specify an absolute or relative URL. If it is relative, the external CSS must resideon the web server used by WebFOCUS.
ibfs
Is a path that points to a WebFOCUS repository that contains the external cascading stylesheet file. This path is internally converted to a web-accessible URL that points to thelocation of the .css file.
20. Using an External Cascading Style Sheet
Creating Reports With TIBCO® WebFOCUS Language 1313
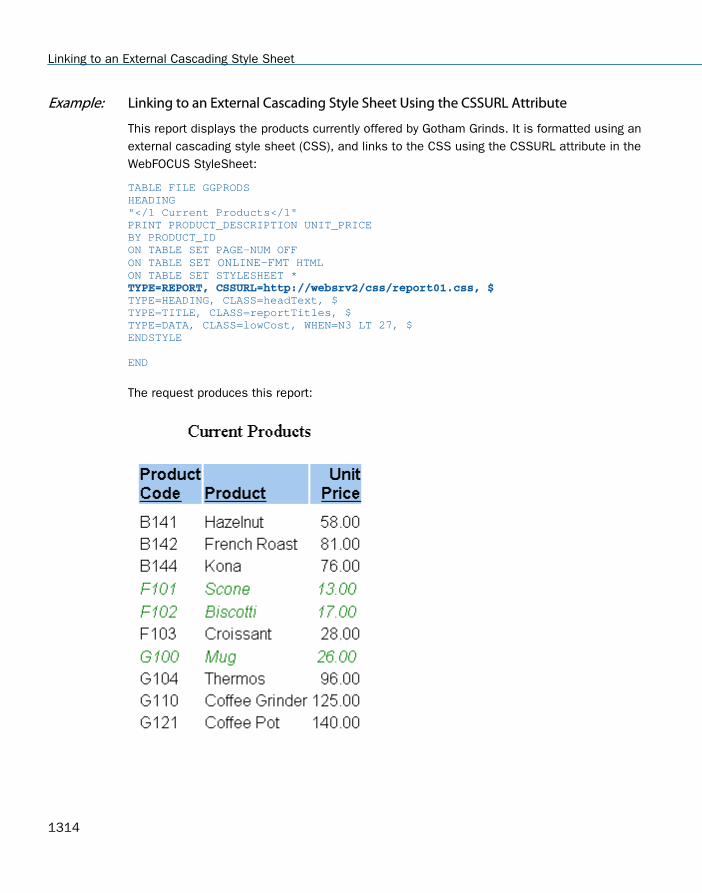
Example: Linking to an External Cascading Style Sheet Using the CSSURL Attribute
This report displays the products currently offered by Gotham Grinds. It is formatted using anexternal cascading style sheet (CSS), and links to the CSS using the CSSURL attribute in theWebFOCUS StyleSheet:
TABLE FILE GGPRODSHEADING"</1 Current Products</1"PRINT PRODUCT_DESCRIPTION UNIT_PRICEBY PRODUCT_IDON TABLE SET PAGE-NUM OFFON TABLE SET ONLINE-FMT HTMLON TABLE SET STYLESHEET * TYPE=REPORT, CSSURL=http://websrv2/css/report01.css, $ TYPE=HEADING, CLASS=headText, $TYPE=TITLE, CLASS=reportTitles, $TYPE=DATA, CLASS=lowCost, WHEN=N3 LT 27, $ENDSTYLE END
The request produces this report:
Linking to an External Cascading Style Sheet
1314

Note: To specify a path that points to a WebFOCUS repository that contains the report01.cssfile, use the following syntax for the CSSURL parameter on the TYPE=REPORT line in therequest:
TYPE=REPORT, CSSURL=IBFS:/WFC/Repository/css/report01.css, $
Where css is the folder in the WebFOCUS repository where the report01.css file resides.
Syntax: How to Use the CSSURL Parameter to Link to an External CSS
To link an external cascading style sheet (CSS) to a report using a SET parameter, issue thefollowing SET command in a procedure
SET CSSURL = css_url
or the following ON TABLE SET command in a report request
ON TABLE SET CSSURL css_url
where:
css_url
Is the URL of the external cascading style sheet. If the external CSS resides on a webserver platform that is case-sensitive, you must specify it using the correct case.
The URL can be up to:
69 characters long in a SET command.
57 characters long in an ON TABLE SET command.
If your external cascading style sheet URL exceeds this limit, you can shorten the URL bydefining an alias (also known as a virtual directory) on the web server to represent part ofthe path.
You can specify an absolute or relative URL. If it is relative, the external CSS must resideon the web server used by WebFOCUS.
For an example, see Linking to the ReportStyles External Cascading Style Sheet on page 1301.
If you specify CSSURL multiple times, the last value specified using ON TABLE SET overridesall the other values within that report request. If CSSURL is not specified within a reportrequest, the last value specified using SET overrides all the others.
For general information about using SET commands, see Customizing Your Environment in theTIBCO WebFOCUS® Developing Reporting Applications manual.
20. Using an External Cascading Style Sheet
Creating Reports With TIBCO® WebFOCUS Language 1315

Inheritance and External Cascading Style Sheets
In a report that is formatted using an external cascading style sheet (CSS), a report componentinherits formatting from the TD element and from all elements that TD nests within, such asBODY. (Note that inheritance, like all CSS behavior, is implemented by the web browser ofeach user and is browser-dependent.)
This differs from a report that is formatted using a WebFOCUS StyleSheet, in which a reportcomponent inherits formatting from a higher-level component. When you format a report usingexternal cascading style sheet classes, a class assigned to a report component does notinherit formatting from a class that has been assigned to a higher-level component.
Example: A Report Column Inheriting Formatting From the TD Element
This report displays a list of the vendors that supply products to Gotham Grinds. Its formattinginstructions specify that:
The entire report has an orange default background color. This is specified in a rule for theTD element.
The report data is displayed in an italic Arial font. The report data inherits the orangebackground color from the rule for TD.
The report PRODUCT_ID data has a yellow background color, overriding the defaultspecified in the rule for TD.
If the formatting of the report had been specified in a WebFOCUS StyleSheet instead of inan external CSS, PRODUCT_ID would inherit the italic Arial font from its parent reportcomponent (that is, from the report data). Instead, because its formatting is specified in anexternal CSS, PRODUCT_ID inherits formatting from the rule for the TD element, not from ahigher-level report component, and so it does not inherit the italic Arial font.
The report request and inline WebFOCUS StyleSheet are shown in the following procedure,prodvend.fex. The external cascading style sheet, named report02.css, follows the procedure.
prodvend.fex
TABLE FILE GGPRODS PRINT PRODUCT_DESCRIPTION VENDOR_NAME BY PRODUCT_ID ON TABLE SET PAGE-NUM OFF
ON TABLE SET STYLE * 1. TYPE=REPORT, CSSURL = http://websrv2/css/report02.css, $ 2. TYPE=DATA, CLASS=Data, $ 3. TYPE=DATA, COLUMN=PRODUCT_ID, CLASS=Sort, $ ENDSTYLE
Inheritance and External Cascading Style Sheets
1316
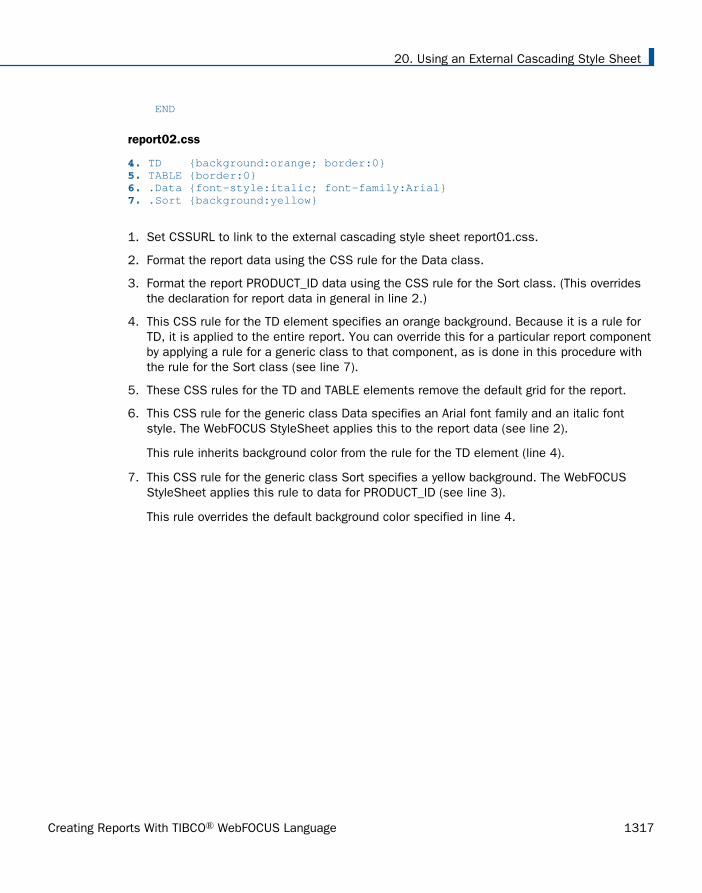
END
report02.css
4. TD {background:orange; border:0} 5. TABLE {border:0} 6. .Data {font-style:italic; font-family:Arial} 7. .Sort {background:yellow}
1. Set CSSURL to link to the external cascading style sheet report01.css.
2. Format the report data using the CSS rule for the Data class.
3. Format the report PRODUCT_ID data using the CSS rule for the Sort class. (This overridesthe declaration for report data in general in line 2.)
4. This CSS rule for the TD element specifies an orange background. Because it is a rule forTD, it is applied to the entire report. You can override this for a particular report componentby applying a rule for a generic class to that component, as is done in this procedure withthe rule for the Sort class (see line 7).
5. These CSS rules for the TD and TABLE elements remove the default grid for the report.
6. This CSS rule for the generic class Data specifies an Arial font family and an italic fontstyle. The WebFOCUS StyleSheet applies this to the report data (see line 2).
This rule inherits background color from the rule for the TD element (line 4).
7. This CSS rule for the generic class Sort specifies a yellow background. The WebFOCUSStyleSheet applies this rule to data for PRODUCT_ID (see line 3).
This rule overrides the default background color specified in line 4.
20. Using an External Cascading Style Sheet
Creating Reports With TIBCO® WebFOCUS Language 1317

The procedure displays this report:
Using External Cascading Style Sheets With Non-HTML Reports
You can use an external cascading style sheet (CSS) to format a report that is generated asHTML, but not one that is generated as a different output type, such as PDF. If you have areport that you will sometimes generate as HTML and sometimes generate as a differentoutput type, and you wish to gain the benefits of cascading style sheets, we recommend thatyou use this technique:
Shared formatting. Specify formatting that is shared by all output types in WebFOCUSStyleSheet macros. (For example, setting a font style to italic is something that can beapplied to both HTML and PDF report output, so you would specify it in a macro.) Definetwo versions of each macro:
One version for HTML output. This version specifies formatting using a cascading stylesheet class.
One version for non-HTML output. This version specifies formatting using nativeWebFOCUS StyleSheet attributes.
Unique formatting. Specify formatting that is applicable only to HTML output, or only tonon-HTML output, in standard WebFOCUS StyleSheet declarations. Place each of thesedeclarations in the WebFOCUS StyleSheet section that contains macro definitions for thattype of output. (For example, turning a grid on or off is applicable to HTML output, but notto Excel 2000, so you would place it with the macro definitions for HTML.)
Using External Cascading Style Sheets With Non-HTML Reports
1318
Branch between the HTML and non-HTML declarations using Dialogue Manager.
You can see the basic code for this technique in How to Use an External CSS With MultipleOutput Types on page 1320.
20. Using an External Cascading Style Sheet
Creating Reports With TIBCO® WebFOCUS Language 1319

Syntax: How to Use an External CSS With Multiple Output Types
If you have a report that you will sometimes generate as HTML and sometimes as other typesof output, and you wish to gain the benefits of cascading style sheets (CSS), we recommendthat you use this technique:
1. -DEFAULTS &FORMAT='output_type'; 2. SET ONLINE-FMT = &FORMAT TABLE FILE datasource report_logic
ON TABLE SET STYLE * 3. TYPE=REPORT, CSSURL = CascadingStyleSheetURL, $ 4. -IF &FORMAT NE 'HTML' GOTO NONHTML; 5. DEFMACRO=macro1, CLASS=class1, $ DEFMACRO=macro2, CLASS=class2, $ . . . 6. TYPE=component3, CLASS=class3, $ . . . 7. -GOTO SHARED 8. -NONHTML 9. DEFMACRO=macro1, attribute1=value1, $ DEFMACRO=macro2, attribute2=value2, $ . . . 10. TYPE=component4, attribute4=value4, $ . . . 11. -SHARED 12. TYPE=component1, MACRO=macro1, $ TYPE=component2, MACRO=macro2, $ . . . ENDSTYLE END
1. Assign the type of report output (for example, HTML, PDF, PS, or EXL2K) to the DialogueManager variable &FORMAT. You will use this variable to toggle the WebFOCUS StyleSheetbetween formatting for HTML output and formatting for non-HTML output, and also toprovide a value for SET ONLINE-FMT.
You can use forms and other presentation logic to enable the application user to select thetype of report output.
2. Set the report output type to the value of &FORMAT. In this procedure, SET ONLINE-FMTsets the display type for the report. Alternatively, you could use ON TABLE HOLD to save
Using External Cascading Style Sheets With Non-HTML Reports
1320

the report as a file and set its file type.
3. Set CSSURL to link to the external cascading style sheet to be used for formatting thereport HTML output. When the report generates non-HTML output, this command will beignored.
4. Branch to the WebFOCUS StyleSheet declarations for the current type of report output(which is indicated by &FORMAT).
5. Define the HTML version of the WebFOCUS StyleSheet macros. These macros specifyformatting that is shared by all output types.
This HTML version of the macros is implemented using external cascading style sheetclasses.
6. If there is any formatting that is applicable only to HTML output, specify it here, usingexternal cascading style sheet classes.
7. Branch to the WebFOCUS StyleSheet declarations that apply the macros to the reportcomponents.
8. This label marks the beginning of the macro definitions and unique formatting declarationsfor non-HTML report output.
9. Define the non-HTML version of the WebFOCUS StyleSheet macros. These macros specifyformatting that is shared by all output types.
This non-HTML version of the macros is implemented using native WebFOCUS StyleSheetattributes.
10.If there is any formatting that is applicable only to non-HTML output, specify it here usingnative WebFOCUS StyleSheet attributes.
11.This label marks the beginning of the declarations that apply macros to the report.
12.These are the macros that were defined earlier and are being applied to the report.
20. Using an External Cascading Style Sheet
Creating Reports With TIBCO® WebFOCUS Language 1321

Example: Using an External CSS With PDF and HTML Output
This report procedure (videorpt.fex) can generate both HTML and PDF output. When itgenerates HTML output, it uses an external cascading style sheet (reports.css) to format thereport. When it generates PDF output, it uses an inline WebFOCUS StyleSheet. In both cases,the report provides a light blue background for the LASTNAME column and makes all columntitles bold.
The procedure as shown is set to generate HTML output.
videorpt.fex
1. -DEFAULTS &FORMAT='HTML'; 2. SET CSSURL = http://websrv2/css/reports.css 3. SET ONLINE-FMT = &FORMAT TABLE FILE VIDEOTRK PRINT LASTNAME AS 'Last Name' FIRSTNAME AS 'First Name' BY LOWEST 5 CUSTID AS 'Cust ID' ON TABLE SET PAGE-NUM OFF ON TABLE SET STYLE * 4. -IF &FORMAT NE 'HTML' GOTO NONHTML; 5. DEFMACRO=boldTitles, CLASS=bold, $ DEFMACRO=blueColumn, CLASS=blueBack, $ 6. -GOTO SHARED 7. -NONHTML 8. DEFMACRO=boldTitles, STYLE=bold, $ DEFMACRO=blueColumn, BACKCOLOR=light blue, $ 9. -SHARED 10. TYPE=DATA, COLUMN=LastName, MACRO=blueColumn, $ TYPE=TITLE, MACRO=boldTitles, $ ENDSTYLE END
reports.css
11. .bold {font-weight: bolder} 12. .blueBack {background: lightblue} 13. TABLE {border:0} 13. TD {border:0}
1. Assign a default value to &FORMAT to toggle the WebFOCUS StyleSheet between formattingfor HTML output and formatting for PDF output. It is currently set to HTML output.
2. Set CSSURL to link to the external cascading style sheet reports.css to format the HTMLoutput of the report.
3. Set the display type of the report to the value of &FORMAT.
4. Branch to the WebFOCUS StyleSheet declarations for the current type of report output(HTML).
5. Define the HTML version of the WebFOCUS StyleSheet macros, which are implementedusing external cascading style sheet classes.
Using External Cascading Style Sheets With Non-HTML Reports
1322

6. Branch to the WebFOCUS StyleSheet declarations that apply the macros to the componentsfor the report.
7. This label marks the beginning of the macro definitions for PDF report output.
8. These declarations define the PDF version of the WebFOCUS StyleSheet macros, which areimplemented using native WebFOCUS StyleSheet attributes. These macro definitions will beignored because &FORMAT is set to HTML.
9. This label marks the beginning of the declarations that apply macros to the report.
10.These are the macros that were defined earlier and are being applied to the report.
11.This cascading style sheet declaration makes text bolder than it had been.
12.This cascading style sheet declaration makes a background light blue.
13.These CSS rules for the TABLE and TD elements remove the default grid for the report.
The procedure displays this report:
Requirements for Using an External Cascading Style Sheet
When you use an external cascading style sheet (CSS) to format a report, be aware of thefollowing requirements:
Generate HTML report output. You can use an external cascading style sheet to formatany report that you generate as HTML, whether you save the report output in a file or sendit directly to a web browser. You cannot use an external CSS for a report generated in adifferent format, such as PDF or Excel.
If you wish to use an external CSS with a report that you will sometimes generate as HTMLand sometimes as a different format, such as PDF, see Using External Cascading StyleSheets With Non-HTML Reports on page 1318.
If you are not generating an internal cascading style sheet, do not specify external CSSclasses (CLASS=) and native WebFOCUS StyleSheet attributes in the same WebFOCUSStyleSheet (other than the exceptions noted in the next paragraph). Doing so could createformatting conflicts.
20. Using an External Cascading Style Sheet
Creating Reports With TIBCO® WebFOCUS Language 1323

Exceptions. Even when specifying external CSS classes, you should use native WebFOCUSStyleSheet attributes to:
Create hyperlinks (using the FOCEXEC, JAVASCRIPT, and URL attributes). However, ifyou wish to format a hyperlink, you should do so using the cascading style sheet.
Make a WebFOCUS StyleSheet declaration conditional (using the WHEN attribute).
Embed an image (using the IMAGE attribute). However, if you wish to format the image(for example, to position it), you should do so using the cascading style sheet.
For more information, see Combining an External CSS With Other Formatting Methods onpage 1310.
Do not specify the same formatting using TABLE/GRAPH and CSS. You can use TABLElanguage (or GRAPH language) formatting instructions, such as HEADING CENTER, PAGE-BREAK, and spot markers (for example, </3). However, you should not apply both a TABLE(or GRAPH) language instruction, and an external cascading style sheet rule, to perform thesame formatting on the same report component. For more information, see Combining anExternal CSS With Other Formatting Methods on page 1310.
SET STYLEMODE. If you wish to use cascading style sheets to format a report in the usualway, you can set STYLEMODE to FULL (the default) or PAGED. If you set it to FIXED and linkto an external cascading style sheet, the report will inherit formatting from the BODY andPRE elements, but you will not be able to format the report using classes and the TDelement.
Use a cascading style sheet-enabled web browser. Each user who wishes to display areport formatted using a cascading style sheet must have a web browser that supportsCSS. All versions of Microsoft Internet Explorer that are certified for use with WebFOCUSsupport cascading style sheets.
Note that how a cascading style sheet rule formats your report is determined entirely by thesupport of your web browser and implementation of cascading style sheets, not byWebFOCUS. Some web browsers may not fully support the latest CSS version, or mayimplement a CSS feature in different ways.
Do not override the cascading style sheet specified for the report. If a browser has beencustomized to ignore cascading style sheets or to employ the personal cascading stylesheet of the user, and the user wishes to view reports as they were intended to be seen(with the specified cascading style sheet), the user must reset his or her browser to acceptthe cascading style sheet of each document.
Requirements for Using an External Cascading Style Sheet
1324
For instructions about checking or changing a browser setting, see the browser Help. Forinformation about how conflicts between CSS rules are resolved (for example, between arule specified in a CSS document and a rule specified in the reader web browser CSS), seeyour third-party CSS documentation.
Reference: Usage Notes for External Cascading Style Sheets With SET HTMLCSS ON
Styling only to the CLASS, referenced from the external cascading style sheet, is honoredwhen internal and external styling is applied to multiple subtypes in an element. Theinternal styling applied to the element is ignored. With HTMLCSS OFF, only the internalstyling applied to each subtype is honored.
In a report with no borders specified in the external cascading style sheet, borders in theinternal styling are respected and only grids are shown when HTMLCSS is OFF.
Border style specified in the external cascading style sheet overrides that specified in theinternal style sheet. With HTMLCSS OFF, both grids and the border style specified in theexternal cascading style sheet are displayed.
Border weights are consistent in all elements of the report. With HTMLCSS OFF, differentborder weights are seen in different elements of the report.
When the heading of the report contains multiple lines, the border outlines the entireheading. With HTMLCSS OFF, the border outlines each line in the heading.
FAQ About Using External Cascading Style Sheets
This topic answers the most frequently asked questions (FAQ) about using external cascadingstyle sheets (CSS) to format reports.
Does it answer your question? We invite you to send us any questions that you would likeanswered. Each question will get a response, and will also be considered for inclusion in afuture release of FAQ. (We also invite your comments on anything in this document.)
How do I specify a report default formatting using CSS?
You can specify default formatting for an entire report in an external cascading style sheet rulefor the BODY or TD element. For more information, see Choosing an External Cascading StyleSheet on page 1305.
20. Using an External Cascading Style Sheet
Creating Reports With TIBCO® WebFOCUS Language 1325

Do I always need to use the CLASS attribute?
No. You need the CLASS attribute in a WebFOCUS StyleSheet if you specify formatting for anindividual report component. (You use CLASS to assign a rule for a generic class to the reportcomponent.) When you specify formatting for the entire report, you do so in a rule for the BODYor TD element, not a rule for a class, so you omit the CLASS attribute.
If you place a reference to a CSS class in your stylesheet, it will be applied to the <A> tag aswell as the <TD> tag. For example, if you have the class ".class1" in your external CSS,WebFOCUS would generate the following HTML for a value with a drilldown:
<TD CLASS='class1'><A class='class1' HREF="...">ENGLAND</A></TD>
For example, if you want red hyperlinks without underlines, issue:
SET CSSURL=http://myserver/mycss.cssTABLE FILE CARSUM SALES BY COUNTRYON TABLE PCHOLD FORMAT HTMLON TABLE SET STYLE *type=data, column=country, focexec=fex1, class=class1, $END
where mycss.css contains:
.class1 { color:red; text-decoration:none }
FAQ About Using External Cascading Style Sheets
1326

The output is:
For more information, see Applying External Cascading Style Sheet Formatting on page 1308.
Can I use a cascading style sheet and a WebFOCUS StyleSheet together?
When you link to an external cascading style sheet, you can also specify native WebFOCUSStyleSheet attributes in a WebFOCUS StyleSheet. However, if you do not generate an internalcascading style sheet, you should not specify CSS classes (CLASS=) and native WebFOCUSStyleSheet attributes in the same WebFOCUS StyleSheet (except to specify a condition forconditional formatting, to specify a link to another resource, and to embed an image). For moreinformation, see Combining an External CSS With Other Formatting Methods on page 1310. Forinformation about internal cascading style sheets, see Generating an Internal Cascading StyleSheet for HTML Reports on page 1222.
20. Using an External Cascading Style Sheet
Creating Reports With TIBCO® WebFOCUS Language 1327

Which version of CSS does WebFOCUS support?
Support for different versions of cascading style sheets (such as CSS2) is determined entirelyby your web browser support and implementation of cascading style sheets, not byWebFOCUS. Note that some web browsers may not fully support the latest CSS version, or mayimplement a CSS feature in different ways. For more information, see Requirements for Usingan External Cascading Style Sheet on page 1323, and Troubleshooting External Cascading StyleSheets on page 1329.
Can I use CSS to format reports generated as PDF, PostScript, or Excel 2000?
No, you can only use external cascading style sheets to format reports that are generated asHTML.
Which types of reports can I format using an external cascading style sheet?
You can format all types of reports using an external CSS:
Tabular reports, including regular (column-oriented) reports and Financial ModelingLanguage (FML, also known as extended matrix or row-oriented) reports.
Graphs. Note that, while you can format a graph heading and footing, and the backgroundcolor and background image of the page in which the graph appears, the graph itself isgenerated using Java and so cannot be formatted using CSS.
Free-form reports. Most people choose to generate free-form reports using output typesother than HTML, making CSS a rarely-used option for formatting free form.
FAQ About Using External Cascading Style Sheets
1328
Troubleshooting External Cascading Style Sheets
This topic will help you solve some common problems encountered when formatting reportswith external cascading style sheets (CSS).
Which problems have you needed to troubleshoot? If you have troubleshooting suggestionsthat you think others will find helpful, we invite you to send them to us so that we can considerincluding them in a future release.
Symptom: The report does not reflect recent changes to the cascading style sheet.
Reason: When you run a report that references an external cascading style sheet, your webbrowser stores the CSS file in its memory or disk cache. When you later edit the CSS andrun the report again, your browser may continue to use the earlier version of the CSS filethat it had stored.
Solution: Click your browser Refresh button (Microsoft Internet Explorer) to reload the CSSfile from the web server. This ensures that your web browser will use the most currentversion of the cascading style sheet to format the report.
Symptom: The report is not using any of the cascading style sheet formatting.
Reason 1: You may have specified an incorrect URL when you attempted to link to theexternal cascading style sheet.
Solution 1: Check the URL that specifies the link (in the CSSURL attribute or in the SETCSSURL command, or if the report procedure uses -HTMLFORM, in the LINK element) andcorrect it, if necessary.
Reason 2: Your web browser may not support cascading style sheets.
Solution 2: All versions of Microsoft Internet Explorer that are certified for use withWebFOCUS support cascading style sheets. Check to be sure that your browser is certified.If it is not, install an appropriate version of Internet Explorer or Communicator.
Reason 3: Your web browser may be set to ignore cascading style sheets.
Solution 3: Reset your browser to accept a document cascading style sheet. Forinstructions about checking or changing a browser setting, see the browser Help.
Reason 4: Some web browsers, if they do not support a single property specified in a rule,ignore the entire rule. If this is true of your web browser, and all of your report formatting isspecified in a single rule (for example, a rule for TD or BODY), but the browser does notsupport one of the properties specified for the rule, none of the formatting will be applied tothe report.
20. Using an External Cascading Style Sheet
Creating Reports With TIBCO® WebFOCUS Language 1329

Solution 4: Remove the unsupported property, or upgrade your browser to a version thatsupports the property.
Reason 5: Some web browsers implement CSS inheritance rules for nested elements inways that do not conform to the CSS standard. If you are using such a browser, and forexample, you specify all formatting in a rule for the BODY element, your browser may notapply the rule to other elements nested within BODY.
Solution 5: Specify the report formatting in a rule for a different element (for example, if thebrowser does not correctly implement inheritance from BODY, use a rule for TD), or elseupgrade your browser to a version that correctly supports inheritance.
Reason 6: The CSS file was not found on the server path when the report that referencesthe .css file was run.
Solution 6: Make sure the directory with the CSS file is on the server search path.
Symptom: The report reflects some, but not all, of the CSS formatting.
Reason 1: How a cascading style sheet rule formats your report is determined entirely byyour web browser support and implementation of cascading style sheets, not byWebFOCUS. You may be experiencing this symptom because your browser does notsupport the level of cascading style sheets that you are using, leaving some CSS featuresunimplemented.
Solution 1: Upgrade your browser to a version that supports all the CSS features used toformat the report, or edit the cascading style sheet to remove features that areunsupported by some of the browsers that will be used to display the report.
Reason 2: Your web browser may be set to use your personal cascading style sheet, andsome of the rules you had specified there may override rules specified in the cascadingstyle sheet assigned to the report. For information about how conflicts between rules indifferent cascading style sheets are resolved, see your third-party CSS documentation.
Solution 2: Reset your browser to accept the cascading style sheet for each document, oredit the rules in the two cascading style sheets so that they no longer conflict.
Reason 3: Some web browsers, if they do not support a property specified in a rule, ignorethe entire rule. If this is true of your web browser, and the browser does not support one ofthe properties specified in the rule for one of the classes assigned to the report, none ofthe report components to which that rule has been assigned will be formatted.
Solution 3: Remove the unsupported property, or upgrade your browser to a version thatsupports the property.
Troubleshooting External Cascading Style Sheets
1330
Reason 4: Each report component can be assigned only one cascading style sheet class. Ifyou have specified more than one class, only the first one specified is assigned to thecomponent; the others are ignored.
If a class has not yet been assigned to a report cell, and you specify conditional formattingfor it, only the first class whose condition is satisfied by that row is assigned to the cell.The others are ignored.
Solution 4: Do not assign more than one CSS class to each report component. If you needto apply multiple attributes, bundle them into a single class.
Reason 5: Some web browsers implement CSS inheritance rules for nested elements inways that do not conform to the CSS standard. If you are using such a browser, and forexample, you specify some formatting in a rule for the BODY element, your browser may notapply the rule to other elements nested within BODY.
Solution 5: Specify the report formatting in a rule for a different element (for example, if thebrowser does not correctly implement inheritance from BODY, use a rule for TD), or elseupgrade your browser to a version that correctly supports inheritance.
Reason 6: External cascading style sheets can be subject to certain restrictions when usedwith other formatting methods. For example, if a WebFOCUS StyleSheet report does notgenerate an internal cascading style sheet, but it references external CSS classes and alsospecifies native WebFOCUS StyleSheet attributes, there may be a formatting conflict.
Solution 6: The solution depends on the kind of formatting conflict. In the example above,the solution is to generate an internal cascading style sheet. For a complete description ofwhich formatting methods are compatible with an external CSS, and how to avoidformatting conflicts, see Combining an External CSS With Other Formatting Methods on page1310.
Symptom: A report distributed with ReportCaster does not have the CSS styling, but it doeshave CSS styling when run interactively.
Reason: The mail server to which ReportCaster is distributing reports may not supportexternally referenced CSS files. For example, Gmail strips the CSS from HTML email, youmust use an inline CSS for GMail.
Solution: Issue the WebFOCUS command SET HTMLCSS=ON in your procedure, or issuethe command ON TABLE SET HTMLCSS ON in your request. This creates reports with aninline CSS.
20. Using an External Cascading Style Sheet
Creating Reports With TIBCO® WebFOCUS Language 1331
Troubleshooting External Cascading Style Sheets
1332

Chapter21Laying Out the Report Page
You can customize page layout using StyleSheet attributes. The page layout attributesavailable to you, like all other attributes, depend on the display format. For instance,some attributes support print-oriented display formats such as PDF, and they do notapply to HTML reports displayed in a browser. For details on display formats, see Choosing a Display Format on page 575 and Saving and Reusing Your Report Output onpage 471.
A report page has default layout characteristics. However, you can change any of them tocustomize the layout. You control a report's appearance, including column arrangementon a page, page numbering, page breaks, use of grids and images, and much more.
You can use SET parameters in place of most StyleSheet attributes to define page layoutcharacteristics. For details on SET, see the TIBCO WebFOCUS® Developing ReportingApplications manual.
In this chapter:
Selecting Page Size, Orientation, andColor
Setting Page Margins
Positioning a Report Component
Arranging Columns on a Page
Suppressing Column Display
Inserting a Page Break
Inserting Page Numbers
Adding Grids and Borders
Defining Borders Around Boxes WithPPTX and PDF Formats
Displaying Superscripts On Data,Heading, and Footing Lines
Adding Underlines and Skipped Lines
Removing Blank Lines From a Report
Adding an Image to a Report
Associating Bar Graphs With Report Data
Working With Mailing Labels and Multi-Pane Pages
Creating Reports With TIBCO® WebFOCUS Language 1333

Selecting Page Size, Orientation, and Color
You can select the page size, page orientation (portrait or landscape), and page color for yourreport. The default page size is letter (8.5 x 11 inches), but you can select from many othersizes, including legal and envelopes.
Reference: Page Size, Orientation, and Color Attributes
Attribute Description Applies to
PAGESIZE Sets page size. In the Development environment:
PS
PPT
PPTX
ORIENTATION Sets page orientation. In the Development environment:
PS
EXL2K
PPT
PPTX
PAGECOLOR Sets page color. HTML report with internalcascading style sheet
PPTX
Note: The PAGECOLORStyleSheet attribute is ignored ina report containing a template, inorder to preserve the styles in thetemplate.
Selecting Page Size, Orientation, and Color
1334

Syntax: How to Set Page Size
This syntax applies to a PDF, PS, PPT, or PPTX report.
[TYPE=REPORT,] PAGESIZE={size|LETTER}, $
where:
TYPE=REPORT
Applies the page size to the entire report. Not required, as it is the default value.
size
Is the page size. If printing a report, the value should match the size of the paper.Otherwise, the report may be cropped or printed with extra blank space.
Valid values are:
Value Description
SCREEN Sets the page size so that the report fills thescreen. Each print line is infinitely wide. Thereport width determines the page width. Thenumber of lines per page depends on how manylines fit on the screen. This number varies,depending on the font and screen resolution.
LETTER 8.5 x 11 inches. LETTER is the default value.
LEGAL 8.5 x 14 inches.
CUSTOM Enables you to set a custom page size for aDHTML, PDF, or PPTX report. If you use theCUSTOM option, you can specify the length andwidth values in the request using CUSTOM-PAGE-LENGTH=number and CUSTOM-PAGE-WIDTH=number through a SET command orStyleSheet attribute. The number value youspecify depends on the UNITS parameter (inches,centimeters, points). The default is inches.
TABLOID 11 x 17 inches.
21. Laying Out the Report Page
Creating Reports With TIBCO® WebFOCUS Language 1335

Value Description
LEDGER 17 x 11 inches.
WIDESCREEN 13.333 x 7.5 inches.
C 17 x 22 inches.
D 22 x 34 inches.
E 34 x 44 inches.
STATEMENT 5.5 x 8.5 inches.
EXECUTIVE 7.5 x 10.5 inches.
FOLIO 8.5 x 13 inches.
10x14 10 x 14 inches.
A3 297 x 420 millimeters.
A4 210 x 297 millimeters.
A5 148 x 210 millimeters.
B4 250 x 354 millimeters.
B5 182 x 257 millimeters.
QUARTO 215 x 275 millimeters.
ENVELOPE-9 3.875 x 8.875 inches.
ENVELOPE-10 4.125 x 9.5 inches.
ENVELOPE-11 4.5 x 10.375 inches.
ENVELOPE-12 4.5 x 11 inches.
Selecting Page Size, Orientation, and Color
1336

Value Description
ENVELOPE-14 5 x 11.5 inches.
ENVELOPE-MONARCH 3.875 x 7.5 inches.
ENVELOPE-PERSONAL 3.625 x 6.5 inches.
ENVELOPE-DL 110 x 220 millimeters.
ENVELOPE-C3 324 x 458 millimeters.
ENVELOPE-C4 229 x 324 millimeters.
ENVELOPE-C5 162 x 229 millimeters.
ENVELOPE-C6 114 x 162 millimeters.
ENVELOPE-C65 114 x 229 millimeters.
ENVELOPE-B4 250 x 353 millimeters.
ENVELOPE-B5 176 x 250 millimeters.
ENVELOPE-B6 176 x 125 millimeters.
ENVELOPE-ITALY 110 x 230 millimeters.
US-STANDARD-FANFOLD 14.875 x 11 inches.
GERMAN-STANDARD-FANFOLD 8.5 x 12 inches.
GERMAN-LEGAL-FANFOLD 8.5 x 13 inches.
Syntax: How to Set Page Orientation
This syntax applies to a PDF, PS, or EXL2K report.
21. Laying Out the Report Page
Creating Reports With TIBCO® WebFOCUS Language 1337

[TYPE=REPORT,] ORIENTATION={PORTRAIT|LANDSCAPE}, $
where:
TYPE=REPORT
Applies the page orientation to the entire report. Not required, as it is the default.
PORTRAIT
Displays the report across the narrower dimension of a vertical page, producing a pagethat is longer than it is wide. PORTRAIT is the default value.
LANDSCAPE
Displays the report across the wider dimension of a horizontal page, producing a page thatis wider than it is long.
Example: Setting Page Orientation
This request sets the page orientation of a PDF report to landscape.
SET ONLINE-FMT = PDF TABLE FILE CENTQASUM CNT.PROBNUM AS 'Total Number, of Problems'SUM CNT.PROBNUM AS 'Problems From, Each Plant' BY PLANTSUM CNT.PROBNUM AS 'Problem by Product' BY PLANT BY PRODNAMEON PLANT PAGE-BREAKHEADING CENTER"QA Report for Company, Plant, and Product"" "ON TABLE COLUMN-TOTALON TABLE SET PAGE-NUM OFFON TABLE SET STYLE * TYPE=REPORT, ORIENTATION=LANDSCAPE, $ ENDSTYLEEND
Syntax: How to Set Page Color
This syntax applies to an HTML report with internal cascading style sheet.
[TYPE=REPORT,] ... PAGECOLOR=color, ... , $
where:
TYPE=REPORT
The TYPE specification is optional with this feature. If omitted, TYPE defaults to REPORT.
Selecting Page Size, Orientation, and Color
1338

color
Is a supported color. For a list of values, see Formatting Report Data on page 1699.
Example: Setting Page Color
This request sets the page color of an HTML report with internal cascading style sheet tosilver.
SET HTMLCSS = ON TABLE FILE CENTORDON TABLE SUBHEAD"SELECTED PRODUCT INVENTORY"SUM QTY_IN_STOCK/D12 BY PROD_NUM BY SNAME BY STATEWHERE PROD_NUM EQ '1004'WHERE SNAME EQ 'eMart'WHERE STATE EQ 'CA'ON TABLE SET PAGE-NUM OFFON TABLE SET STYLE * TYPE=REPORT, PAGECOLOR=SILVER, GRID=OFF, $ ENDSTYLEEND
The output is:
Setting Page Margins
You can set the page margins for your report. This includes the top, bottom, left, and rightmargins. You can also change the default unit of measurement (inches) to either centimetersor points. The unit of measurement applies to page margins, column width, and columnposition.
Reference: Page Margin Attributes
21. Laying Out the Report Page
Creating Reports With TIBCO® WebFOCUS Language 1339

Attribute Description Applies to
UNITS Sets unit of measurement.
Used when specifying margin size orother page characteristics. If youchange the current unit ofmeasurement, the new value is appliedto all instances in which unit ofmeasurement is used.
PS
HTML report with internalcascading style sheet
TOPMARGINBOTTOMMARGINLEFTMARGINRIGHTMARGIN
Sets size of top, bottom, left, and rightmargin.
PS
HTML report with internalcascading style sheet
Syntax: How to Set the Unit of Measurement
This syntax applies to a PDF, PS, or HTML report with internal cascading style sheet.
In a StyleSheet, add the following attribute
UNITS = units
Outside of a report request, use
SET UNITS = units
Within a report request, use
ON TABLE SET UNITS units
where:
units
Is the unit of measure. Values can be:
INCHES, which specifies the unit of measure as inches. This is the default value.
CM, which specifies the unit of measure as centimeters.
PTS, which specifies the unit of measure as points. Points is a common measurementscale for typefaces.
Setting Page Margins
1340

Syntax: How to Set Margin Size
This syntax applies to a PDF, PS, or HTML report with internal cascading style sheet.
[TYPE=REPORT,] [TOPMARGIN={value|.25},] [BOTTOMMARGIN={value|.25},] [LEFTMARGIN={value|.25},] [RIGHTMARGIN={value|.25},] $
where:
TYPE=REPORT
Applies the margin size to the entire report. Not required, as it is the default.
TOPMARGIN
Sets the top boundary of the report content.
BOTTOMMARGIN
Sets the bottom boundary of the report content.
LEFTMARGIN
Sets the left boundary of the report content.
RIGHTMARGIN
Sets the right boundary of the report content.
value
Is the size of the specified margin. The report content displays inside the margin. Ifprinting a report, specify a value compatible with the printer's print area. For example, ifthe print area has 0.25 inch margins all around, set the margins to 0.25 inches, or larger.
The default value for all margins is 0.25 inches.
21. Laying Out the Report Page
Creating Reports With TIBCO® WebFOCUS Language 1341

Example: Setting the Left Margin
This request sets the left margin of an HTML report with internal cascading style sheet to oneinch.
SET HTMLCSS = ON TABLE FILE GGSALESSUM CATEGORY PRODUCT DOLLARS BUDDOLLARSBY REGION BY ST BY CITYWHERE DOLLARS GT BUDDOLLARSON TABLE SET PAGE-NUM OFFON TABLE SET STYLE *TYPE=REPORT, GRID=OFF, $ LEFTMARGIN = 1, $ ENDSTYLEEND
The output is:
Positioning a Report Component
A StyleSheet enables you to specify an absolute or relative starting position for a column,heading, or footing, or element in a heading or footing. You can also add blank space around areport component.
This topic addresses column positioning using the StyleSheet attribute POSITION. For detailson the column positioning command IN, see Positioning a Column on page 1369.
Positioning a Report Component
1342

For details on positioning a heading or footing, or an element in a heading or footing, see UsingHeadings, Footings, Titles, and Labels on page 1519.
Reference: Positioning Attributes
Attribute Description Applies to
POSITION Sets absolute or relative starting position of a column.
An absolute position is the distance from the leftmargin of the printed paper.
A relative position is the distance from the defaultposition. After the first column, the default position isthe end of the preceding column.
PS
TOPGAPBOTTOMGAP
Adds blank space to the top or bottom of a report line. PDF
PS
LEFTGAPRIGHTGAP
Adds blank space to the left or right of a reportcolumn.
PS
Syntax: How to Specify the Starting Position of a Column
This syntax applies to a PDF or PS report.
TYPE=REPORT, COLUMN=identifier, POSITION={+|-}position, $
where:
identifier
Selects a single column and collectively positions the column title, data, and totals ifapplicable. For valid values, see Identifying a Report Component in a WebFOCUS StyleSheeton page 1251.
+
Starts the column at the specified distance to the right of the default starting position.
By default, text items and alphanumeric fields are left-justified in a column, and numericfields are right-justified in a column.
21. Laying Out the Report Page
Creating Reports With TIBCO® WebFOCUS Language 1343

-
Starts the column at the specified distance to the left of the default starting position.
It is possible to create a report in which columns overlap. If this occurs, simply adjust thevalues.
position
Is the desired distance, in the unit of measurement specified with the UNITS attribute.
Example: Specifying an Absolute Starting Position for a Column
The following illustrates how to position a column in a printed report. It is specified in therequest that the PRODUCT_DESCRIPTION field display three inches from the left margin of thePDF report.
SET ONLINE-FMT = PDF TABLE FILE GGORDER"PRODUCTS ORDERED ON 08/01/96"SUM QUANTITY BY PRODUCT_DESCRIPTIONWHERE ORDER_DATE EQ '080196'ON TABLE SET PAGE-NUM OFFON TABLE SET STYLE * TYPE=REPORT, COLUMN=PRODUCT_DESCRIPTION, POSITION=3, $ ENDSTYLEEND
The output is:
Positioning a Report Component
1344

Example: Specifying a Relative Starting Position for a Column
This request positions the column title and data for the QUANTITY field two inches from thedefault position, in this case, two inches from the end of the preceding column.
SET ONLINE-FMT = PDF TABLE FILE GGORDER"PRODUCTS ORDERED ON 08/01/96"SUM QUANTITY BY PRODUCT_DESCRIPTIONWHERE ORDER_DATE EQ '080196'ON TABLE SET PAGE-NUM OFFON TABLE SET STYLE *TYPE=REPORT, COLUMN=PRODUCT_DESCRIPTION, POSITION=3, $ TYPE=REPORT, COLUMN=QUANTITY, POSITION=+2, $ ENDSTYLEEND
QUANTITY, titled Ordered Units in the report, is relatively positioned to Product:
Syntax: How to Add Blank Space Around a Report Component
This syntax applies to a PDF or PS report.
TYPE=REPORT, {TOPGAP|BOTTOMGAP}=gap, $TYPE=type, [COLUMN=identifier,|ACROSSCOLUMN=acrosscolumn,] {LEFTGAP|RIGHTGAP}=gap, $
21. Laying Out the Report Page
Creating Reports With TIBCO® WebFOCUS Language 1345

TYPE=type, [COLUMN=identifier,|ACROSSCOLUMN=acrosscolumn,] {LEFTGAP|RIGHTGAP}=gap, $
where:
TOPGAP
Indicates how much space to add above the report line.
BOTTOMGAP
Indicates how much space to add below the report line.
gap
Is the amount of blank space, in the unit of measurement specified with the UNITSattribute.
In the absence of grids or background color, the default value is 0. For RIGHTGAP, thedefault value is proportional to the size of the text font.
In the presence of grids or background color, the default value increases to provide spacebetween the grid and the text or to extend the color beyond the text.
The gaps must be the same within a single column or row. That is, you cannot specifydifferent left or right gaps for individual cells in the same column, or different top andbottom gaps for individual cells in the same row.
type
Identifies the report component. For valid values, see Identifying a Report Component in aWebFOCUS StyleSheet on page 1251.
identifier
Selects one or more columns using the COLUMN attribute described in Identifying a ReportComponent in a WebFOCUS StyleSheet on page 1251.
acrosscolumn
Selects the same column under every occurrence of an ACROSS sort field using theACROSSCOLUMN attribute described in Identifying a Report Component in a WebFOCUSStyleSheet on page 1251.
LEFTGAP
Indicates how much space to add to the left of a report column.
RIGHTGAP
Indicates how much space to add to the right of a report column.
Positioning a Report Component
1346

Note: For TOPGAP, BOTTOMGAP, LEFTGAP, and RIGHT GAP, you must specify a value of atleast 0.013889 (the decimal size of a point in inches). If you specify a value less than this,WebFOCUS will round down to the nearest point, which is zero.
Example: Adding Blank Space Above Data Values
This request generates one-tenth of an inch of blank space above every data value in a PDFreport.
SET ONLINE-FMT = PDF SET PAGE-NUM = OFFTABLE FILE GGORDER"PRODUCTS ORDERED ON 08/01/96"" "SUM QUANTITY BY PRODUCT_DESCRIPTIONWHERE ORDER_DATE EQ '080196'ON TABLE SET STYLE * TYPE=DATA, TOPGAP = 0.1, $ ENDSTYLEEND
The data is spaced for readability:
21. Laying Out the Report Page
Creating Reports With TIBCO® WebFOCUS Language 1347

Example: Adding Blank Space to the Left of a Column
The following illustrates how to add blank space to the left of a report component. In thisexample, 1.5 inches of blank space are inserted to the left of the Product Category column.
SET ONLINE-FMT=PDFTABLE FILE CENTORDHEADING CENTER"Summary Report for Digital Products"" "SUM LINE_COGS/D12 AS 'Cost of Goods Sold'BY PRODTYPE AS 'Product Type'BY PRODCAT AS 'Product Category'WHERE PRODTYPE EQ 'Digital';ON TABLE COLUMN-TOTAL/D12ON TABLE SET PAGE-NUM OFFON TABLE SET STYLE * TYPE=REPORT, COLUMN=PRODCAT, LEFTGAP=1.5, $ ENDSTYLEEND
The output is:
Arranging Columns on a Page
How easily a user locates data depends on the arrangement of columns on a page. You havemany design options. Using StyleSheet attributes or commands you can:
Determine column width.
Control the number of spaces between columns.
Change the order of vertical sort (BY) columns.
Stack columns to reduce report width, or to easily compare values in a report by creating amatrix.
Specify the absolute or relative starting position for a column.
Arranging Columns on a Page
1348

Reference: Column Arrangement Features
Feature Description Applies to
SQUEEZE Sets column width. HTML
PS
SET SPACES Sets number of spacesbetween columns.
HTML
SEQUENCE Sets column order. PDF
PS
HTML
EXL2K (Note: Does not workwith XLSX and EXL2KFORMULA)
FOLD-LINE Reduces report width bystacking columns.
PS
OVER Stacks columns by placingthem over one another.
HTML
PS
IN {n|+n} Sets absolute or relativestarting position of a column.
HTML
PS
Determining Column Width
The value of the SQUEEZE attribute in a StyleSheet determines column width in a report. Youcan use a SET parameter instead of a StyleSheet to set the value of SQUEEZE. If there areconflicting StyleSheet and SET values, the StyleSheet overrides the SET. For details on SET,see the TIBCO WebFOCUS® Developing Reporting Applications manual.
21. Laying Out the Report Page
Creating Reports With TIBCO® WebFOCUS Language 1349

When SQUEEZE is set to ON (the default), StyleSheet column width is ignored. Column width isdetermined using your browser's default settings.
When using SQUEEZE it may affect the way headings, footings, and column titles display inyour report. For details, see Using Headings, Footings, Titles, and Labels on page 1519.
Syntax: How to Determine Column Width (HTML)
This syntax applies to an HTML report. For the syntax for a PDF or PS report, see How toDetermine Column Width (PDF or PS) on page 1352.
The sizing of tables and column width within a standard HTML report is done by browserprocessing, including the browser default settings and the size of the browser window oriframe. The columns are sized to fit the largest data value or column title, whichever is greater,and trailing spaces are automatically removed.
In standard HTML reports, the data is presented in a single table, so the column widths arefixed for all data rows.
In HFREEZE HTML reports, the data is presented with no wrapping in three tables containingthe heading, data rows, and footing, to ensure the alignment of the column titles with the datarows.
[TYPE=REPORT,] SQUEEZE={ON|OFF}, $
where:
TYPE=REPORT
Applies the column width to the entire report. Not required, as it is the default.
ON
Determines column width based on the longest data value or column title, whichever isgreater. ON is the default value.
For HTML reports, the web browser shrinks the column width to the shortest column title orfield value.
OFF
Determines column width based on the longest data value or column title, whichever isgreater. Blank spaces pad the column width up to the length of the column title or fieldformat, whichever is greater.
Note:
In an HTML report that sets SQUEEZE and uses conditional styling for some columns, useTYPE=DATA, COLUMN=n, not TYPE=REPORT, COLUMN=n.
Arranging Columns on a Page
1350

SQUEEZE is not supported for columns created with the OVER phrase.
Example: Using Default Column Width (HTML)
This request uses SQUEEZE=ON (the default) for an HTML report. Column width is based onthe wider of the data value or column title.
SET PAGE-NUM = OFFTABLE FILE GGSALESSUM UNITS DOLLARSBY CATEGORY BY PRODUCTON TABLE SET STYLE *TYPE=REPORT, GRID=OFF, FONT=COURIER, $ENDSTYLEEND
For Category, Unit Sales, and Dollar Sales, the column title is wider than the correspondingdata values. For Product, the wider data values determine column width. The HTML report is:
Example: Using Column Width Based on Field Format (HTML)
This request sets SQUEEZE to OFF for an HTML report. Column width is based on the longestdata value or column title, whichever is greater.
SET PAGE-NUM = OFFTABLE FILE GGSALESSUM UNITS DOLLARSBY CATEGORY BY PRODUCTON TABLE SET STYLE *TYPE=REPORT, GRID=OFF, SQUEEZE=OFF, FONT=COURIER, $ENDSTYLEEND
21. Laying Out the Report Page
Creating Reports With TIBCO® WebFOCUS Language 1351

Blank spaces pad the column width up to the length of the field format for Category (A11) andProduct (A16). The HTML report is:
Syntax: How to Determine Column Width (PDF or PS)
This syntax applies to a PDF or PS report. For the syntax for an HTML report, see How toDetermine Column Width (HTML) on page 1350.
[TYPE=REPORT,] COLUMN=identifier, SQUEEZE={ON|OFF|width}, $
where:
TYPE=REPORT
Applies the column width to the entire report. Not required, as it is the default.
identifier
Selects a column using the COLUMN attribute described in Identifying a Report Componentin a WebFOCUS StyleSheet on page 1251. If you omit a column identifier, the value forSQUEEZE applies to all columns in a report. You can also use SET SQUEEZE to set thewidth of all columns.
ON
Determines column width based on the widest data value or column title, whichever isgreater.
Arranging Columns on a Page
1352
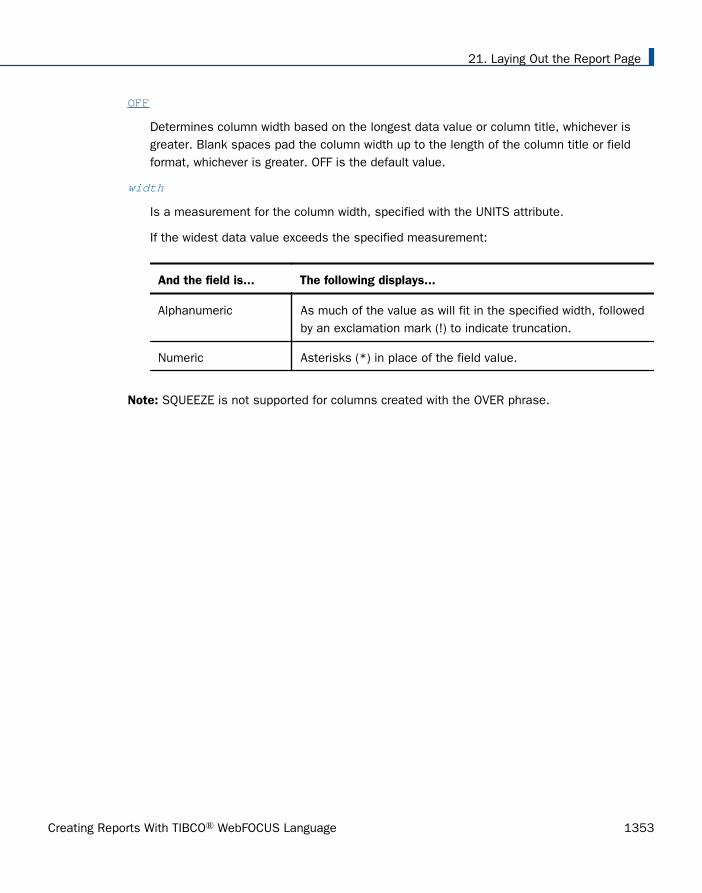
OFF
Determines column width based on the longest data value or column title, whichever isgreater. Blank spaces pad the column width up to the length of the column title or fieldformat, whichever is greater. OFF is the default value.
width
Is a measurement for the column width, specified with the UNITS attribute.
If the widest data value exceeds the specified measurement:
And the field is... The following displays...
Alphanumeric As much of the value as will fit in the specified width, followedby an exclamation mark (!) to indicate truncation.
Numeric Asterisks (*) in place of the field value.
Note: SQUEEZE is not supported for columns created with the OVER phrase.
21. Laying Out the Report Page
Creating Reports With TIBCO® WebFOCUS Language 1353

Example: Determining Column Width (PDF)
This request uses SQUEEZE=2.5 to increase the default column width of the PRODUCT field ina PDF report. Note that this feature is used primarily for printed reports. Depending on yourscreen resolution, the column width may look different than how it will print.
SET ONLINE-FMT = PDF TABLE FILE GGSALESSUM UNITSBY PRODUCTON TABLE SET PAGE-NUM OFFON TABLE SET STYLE * TYPE=REPORT, COLUMN=PRODUCT, SQUEEZE=2.5, $ ENDSTYLEEND
The PDF report is:
Controlling Column Spacing
By default, report columns are separated by one or two spaces, depending on the outputwidth. The SET SPACES or ON TABLE SET SPACES parameter controls the number of spacesbetween columns in a report.
In a horizontal sort (ACROSS) phrase, the SPACES parameter determines the distance betweenhorizontal sort sets. Within a set, the distance between columns is always one space andcannot be changed.
This feature applies to an HTML report. It requires you to set the STYLEMODE parameter toFIXED.
Arranging Columns on a Page
1354
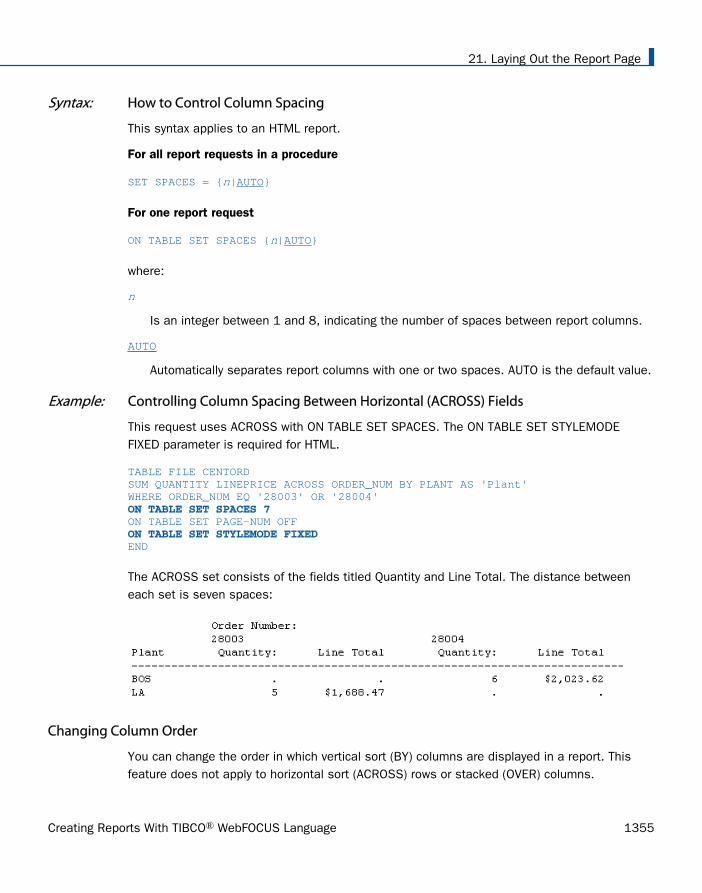
Syntax: How to Control Column Spacing
This syntax applies to an HTML report.
For all report requests in a procedure
SET SPACES = {n|AUTO}
For one report request
ON TABLE SET SPACES {n|AUTO}
where:
n
Is an integer between 1 and 8, indicating the number of spaces between report columns.
AUTO
Automatically separates report columns with one or two spaces. AUTO is the default value.
Example: Controlling Column Spacing Between Horizontal (ACROSS) Fields
This request uses ACROSS with ON TABLE SET SPACES. The ON TABLE SET STYLEMODEFIXED parameter is required for HTML.
TABLE FILE CENTORDSUM QUANTITY LINEPRICE ACROSS ORDER_NUM BY PLANT AS 'Plant'WHERE ORDER_NUM EQ '28003' OR '28004' ON TABLE SET SPACES 7 ON TABLE SET PAGE-NUM OFF ON TABLE SET STYLEMODE FIXED END
The ACROSS set consists of the fields titled Quantity and Line Total. The distance betweeneach set is seven spaces:
Changing Column Order
You can change the order in which vertical sort (BY) columns are displayed in a report. Thisfeature does not apply to horizontal sort (ACROSS) rows or stacked (OVER) columns.
21. Laying Out the Report Page
Creating Reports With TIBCO® WebFOCUS Language 1355

Syntax: How to Change Column Order
This syntax applies to PDF, PS, HTML, XLSX, and EXL2K reports. XLSX FORMULA and EXL2KFORMULA formats are not supported.
[TYPE=REPORT,] COLUMN=identifier, SEQUENCE=sequence, $
where:
TYPE=REPORT
Applies the column order to the entire report. Not required, as it is the default.
identifier
Selects a column using the COLUMN attribute described in Identifying a Report Componentin a WebFOCUS StyleSheet on page 1251.
sequence
Is a number that represents the order of the selected column.
Numbers need not be in sequential order or in increments of one. The order of thecolumns is from lowest to highest. NOPRINT columns are not included.
Example: Changing Column Order
This request rearranges the order in which columns normally appear in the report, that is, withSNAME first, PRODCAT second, and LINEPRICE third.
SET ONLINE-FMT = PDFTABLE FILE CENTORDSUM LINEPRICE AS 'Sales'BY SNAME BY PRODCAT AS 'Product'WHERE SNAME EQ 'eMart' OR 'City Video'ON TABLE SET PAGE-NUM OFFON TABLE SET STYLE * TYPE=REPORT, COLUMN=SNAME, SEQUENCE=3, $TYPE=REPORT, COLUMN=PRODCAT, SEQUENCE=2, $TYPE=REPORT, COLUMN=LINEPRICE, SEQUENCE=1, $ ENDSTYLEEND
Arranging Columns on a Page
1356
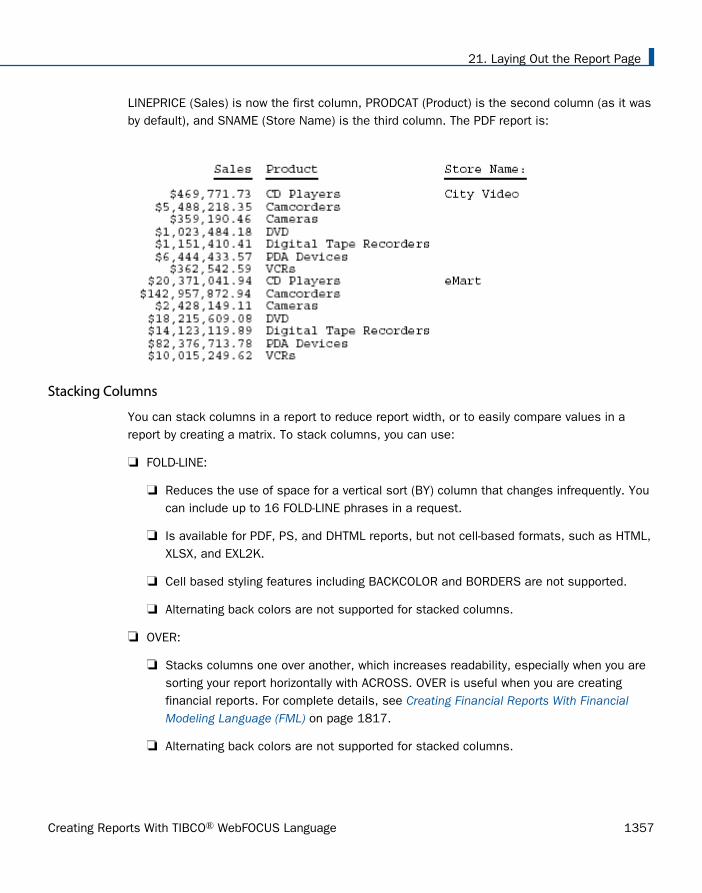
LINEPRICE (Sales) is now the first column, PRODCAT (Product) is the second column (as it wasby default), and SNAME (Store Name) is the third column. The PDF report is:
Stacking Columns
You can stack columns in a report to reduce report width, or to easily compare values in areport by creating a matrix. To stack columns, you can use:
FOLD-LINE:
Reduces the use of space for a vertical sort (BY) column that changes infrequently. Youcan include up to 16 FOLD-LINE phrases in a request.
Is available for PDF, PS, and DHTML reports, but not cell-based formats, such as HTML,XLSX, and EXL2K.
Cell based styling features including BACKCOLOR and BORDERS are not supported.
Alternating back colors are not supported for stacked columns.
OVER:
Stacks columns one over another, which increases readability, especially when you aresorting your report horizontally with ACROSS. OVER is useful when you are creatingfinancial reports. For complete details, see Creating Financial Reports With FinancialModeling Language (FML) on page 1817.
Alternating back colors are not supported for stacked columns.
21. Laying Out the Report Page
Creating Reports With TIBCO® WebFOCUS Language 1357
The difference between FOLD-LINE and OVER is that FOLD-LINE begins the second line (not thesecond column) just underneath the first line, but slightly indented. OVER literally stacks thevalues of one column directly over another. You can use FOLD-LINE and OVER in the samerequest.
Syntax: How to Stack Columns With FOLD-LINE
display_command fieldname ... FOLD-LINE fieldname ...
or
{ON|BY} fieldname FOLD-LINE
where:
display_command
Is a display command. There is no offset when a line is folded after a display field.
fieldname
Is a display field or sort field placed on a separate line when the value of the ON or BYfield changes. When folded on a sort field, a line is offset by two spaces from thepreceding line.
ON|BY
Is a vertical sort phrase. The terms are synonymous.
Example: Stacking Columns With FOLD-LINE
The following illustrates how to use FOLD-LINE to decrease the width of your report. In thisexample, columns are stacked when the value of the sort field CATEGORY changes.
TABLE FILE GGSALESSUM UNITS BUDUNITSBY CATEGORYON CATEGORY FOLD-LINEON TABLE SET ONLINE-FMT PDFON TABLE SET PAGE-NUM OFFEND
Arranging Columns on a Page
1358

The report is:
Without FOLD-LINE, the report looks like this:
Syntax: How to Stack Columns With OVER
display_command fieldname1 OVER fieldname2 OVER fieldname3 ...
where:
display_command
Is a display command.
fieldname1, fieldname2, fieldname3
Is a display field or calculated value. A text field is not valid.
Example: Stacking Columns With OVER
This request contains an ACROSS phrase in an HTML report to sort horizontally by department.It uses two OVER phrases to stack columns.
TABLE FILE EMPLOYEESUM GROSS OVER DED_AMT OVERCOMPUTE NET/D8.2M = GROSS - DED_AMT; ACROSS DEPARTMENTON TABLE SET PAGE-NUM OFFON TABLE SET STYLE *TYPE=REPORT, GRID=OFF,$ENDSTYLEEND
21. Laying Out the Report Page
Creating Reports With TIBCO® WebFOCUS Language 1359
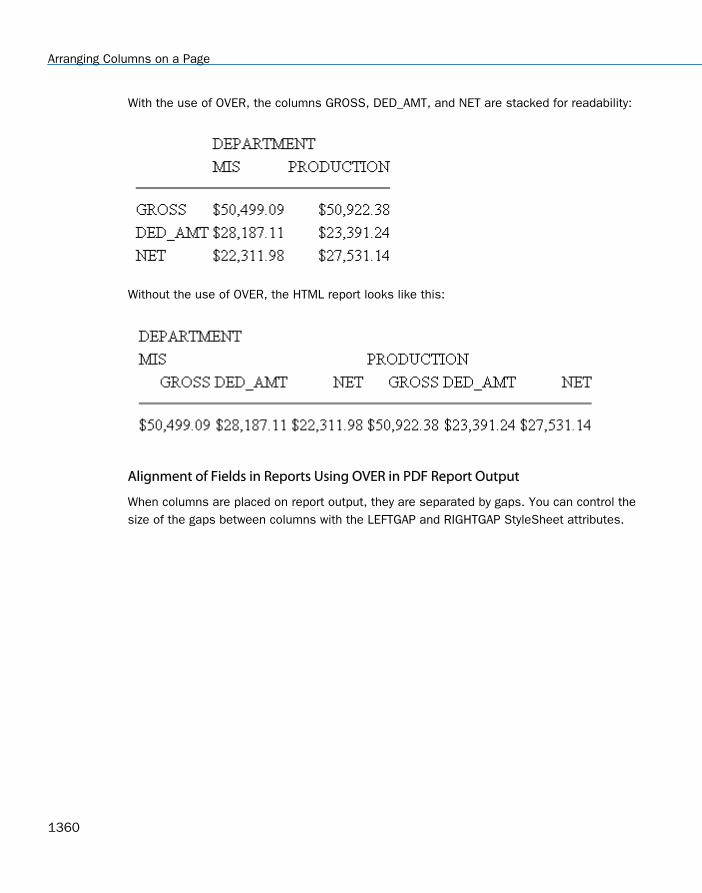
With the use of OVER, the columns GROSS, DED_AMT, and NET are stacked for readability:
Without the use of OVER, the HTML report looks like this:
Alignment of Fields in Reports Using OVER in PDF Report Output
When columns are placed on report output, they are separated by gaps. You can control thesize of the gaps between columns with the LEFTGAP and RIGHTGAP StyleSheet attributes.
Arranging Columns on a Page
1360

By default, the gaps between columns are placed outside of the boundaries reserved for thefields on the report output. Therefore, the width or squeeze value defined for a field definesthe size of the text area for the data value. It does not count the width of the gaps betweencolumns. The bounding box used to define borders and background color is determined basedon the data width plus the left gap plus the right gap.
Gaps external to the column boundaries must be accounted for when you try to align fields inreports that use the OVER phrase.
This feature is designed to support the development of multi-row reports using blank AS names(column titles). Unless otherwise noted, these features work with non-blank titles, but theyhave not been designed to support alignment with non-blank column titles.
By default, column titles are placed to the left of the field values in a report using OVER. TheOVER Title and the OVER Value each are measured by the combination of three parameters,LEFTGAP, WIDTH, and RIGHTGAP:
21. Laying Out the Report Page
Creating Reports With TIBCO® WebFOCUS Language 1361
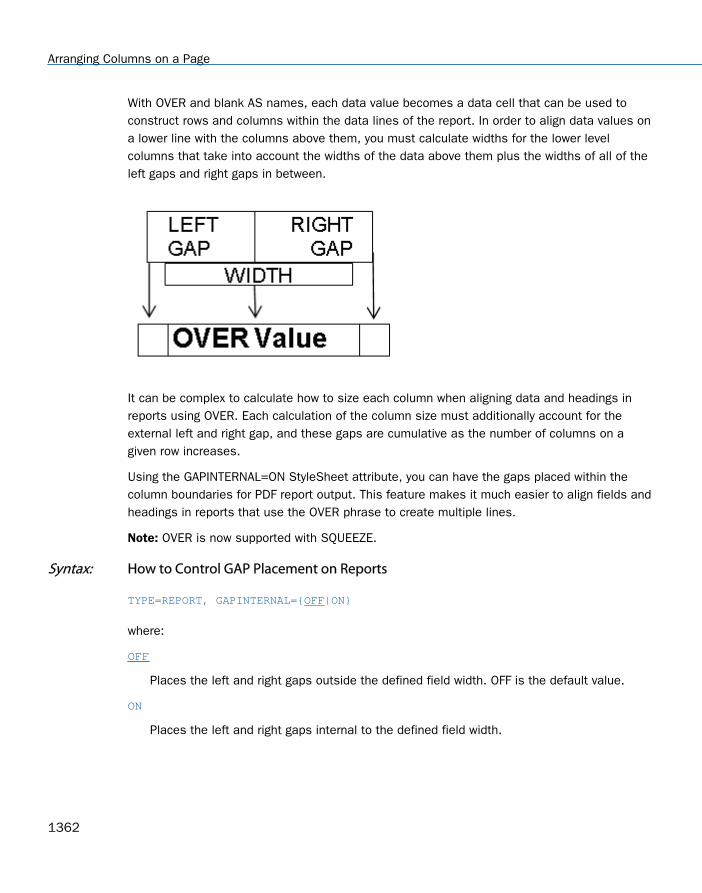
With OVER and blank AS names, each data value becomes a data cell that can be used toconstruct rows and columns within the data lines of the report. In order to align data values ona lower line with the columns above them, you must calculate widths for the lower levelcolumns that take into account the widths of the data above them plus the widths of all of theleft gaps and right gaps in between.
It can be complex to calculate how to size each column when aligning data and headings inreports using OVER. Each calculation of the column size must additionally account for theexternal left and right gap, and these gaps are cumulative as the number of columns on agiven row increases.
Using the GAPINTERNAL=ON StyleSheet attribute, you can have the gaps placed within thecolumn boundaries for PDF report output. This feature makes it much easier to align fields andheadings in reports that use the OVER phrase to create multiple lines.
Note: OVER is now supported with SQUEEZE.
Syntax: How to Control GAP Placement on Reports
TYPE=REPORT, GAPINTERNAL={OFF|ON}
where:
OFF
Places the left and right gaps outside the defined field width. OFF is the default value.
ON
Places the left and right gaps internal to the defined field width.
Arranging Columns on a Page
1362

Example: Comparing External Gaps With Internal Gaps
With GAPINTERNAL=OFF, you must account for the accumulation of left and right gaps as wellas the field widths when defining widths of stacked columns.
21. Laying Out the Report Page
Creating Reports With TIBCO® WebFOCUS Language 1363

With GAPINTERNAL=ON, the defined WIDTH represents the entire space used by the given datacell or column. This takes the cumulative effect out as the OVER values proceed across a row.
Arranging Columns on a Page
1364

Example: Using GAPINTERNAL in a Report
The following request against the GGSALES data source places the PRODUCT field over theUNITS and DOLLARS fields and sets GAPINTERNAL to OFF:
SET LAYOUTGRID=ONTABLE FILE GGSALES"Product<+0>""Units<+0>Dollars"SUMPRODUCT AS ''OVERUNITS/D8C AS '' DOLLARS/D12.2CM AS ''BY PRODUCT NOPRINTON TABLE PCHOLD FORMAT PDFON TABLE SET STYLE *TYPE=REPORT, SQUEEZE=ON, FONT=ARIAL, SIZE=8, LEFTMARGIN=1, TOPMARGIN=1, LEFTGAP=.1, RIGHTGAP=.1, GAPINTERNAL=OFF, $TYPE=REPORT, BORDER=ON, $TYPE=HEADING, BORDERALL=ON, $TYPE=HEADING, LINE=1, ITEM=1, POSITION = PRODUCT, $TYPE=HEADING, LINE=2, ITEM=1, POSITION = UNITS, $TYPE=HEADING, LINE=2, ITEM=2, POSITION = DOLLARS, $TYPE=REPORT, COLUMN=PRODUCT(2), SQUEEZE=2, $TYPE=REPORT, COLUMN=UNITS, SQUEEZE=1, $TYPE=REPORT, COLUMN=DOLLARS, SQUEEZE=1, $ENDSTYLEEND
21. Laying Out the Report Page
Creating Reports With TIBCO® WebFOCUS Language 1365

The widths specified for UNITS and DOLLARS are one inch each, while the PRODUCT field isspecified to be two inches. With GAPINTERNAL=OFF, the LAYOUTGRID shows that the widthsused to place the columns are greater than the widths specified in the request. The additionalspace presented by the external leftgap and rightgap accounts for this effect:
Arranging Columns on a Page
1366

The heading borders are aligned on the right of the report because of the SQUEEZE=ONattribute in the StyleSheet. Extra space was added to the report to align the headings. If youchange the StyleSheet declaration for the PRODUCTS field to JUSTIFY=RIGHT, you can see thatthe extra space prevents the product value from aligning with the dollar value:
21. Laying Out the Report Page
Creating Reports With TIBCO® WebFOCUS Language 1367

Changing the StyleSheet declaration to GAPINTERNAL=ON causes the specified widths to beused because the gaps are internal and are included in the specified values:
Arranging Columns on a Page
1368

The following report output demonstrates that the values align properly even if the PRODUCTvalues are defined with JUSTIFY=RIGHT:
Positioning a Column
You can specify the absolute or relative starting position for a column in a report. The relativestarting position is the number of characters to the right of the last column.
When using this feature with an HTML report, set the STYLEMODE parameter to FIXED.
21. Laying Out the Report Page
Creating Reports With TIBCO® WebFOCUS Language 1369

Syntax: How to Position a Column
field IN {n|+n}
where:
field
Is the column that is positioned.
n
Is a number indicating the absolute position of the column.
When used with ACROSS, n specifies the starting position of the ACROSS set.
When used with FOLD-LINE or OVER, n applies to the line on which the referenced fieldoccurs.
+n
Is a number indicating the relative position of the column. The value of n is the number ofcharacters to the right of the last column.
Example: Positioning Columns
This request specifies absolute positioning for the three columns in the report. The ON TABLESET STYLEMODE FIXED parameter is required for HTML.
TABLE FILE CENTQA SUM CNT.PROBNUM IN 1 AS 'Total #,Problems' SUM CNT.PROBNUM IN 45 AS '# Problems,by Product'BY PLANT NOPRINT BY PRODNAME IN 15 WHERE PLANT EQ 'ORL'ON TABLE SET PAGE-NUM OFF ON TABLE SET STYLEMODE FIXED END
Arranging Columns on a Page
1370
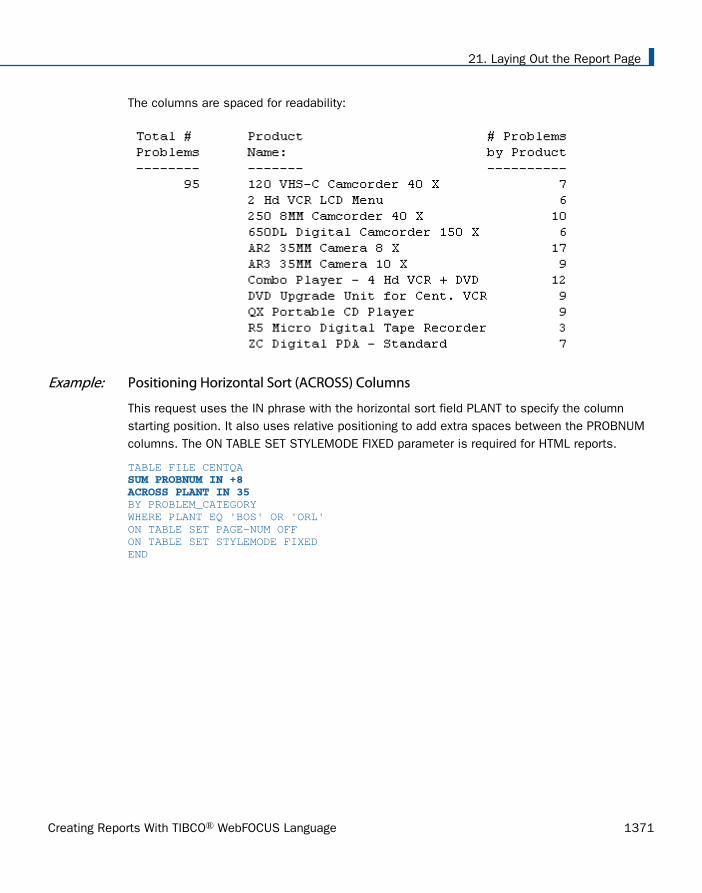
The columns are spaced for readability:
Example: Positioning Horizontal Sort (ACROSS) Columns
This request uses the IN phrase with the horizontal sort field PLANT to specify the columnstarting position. It also uses relative positioning to add extra spaces between the PROBNUMcolumns. The ON TABLE SET STYLEMODE FIXED parameter is required for HTML reports.
TABLE FILE CENTQA SUM PROBNUM IN +8ACROSS PLANT IN 35 BY PROBLEM_CATEGORYWHERE PLANT EQ 'BOS' OR 'ORL'ON TABLE SET PAGE-NUM OFFON TABLE SET STYLEMODE FIXEDEND
21. Laying Out the Report Page
Creating Reports With TIBCO® WebFOCUS Language 1371
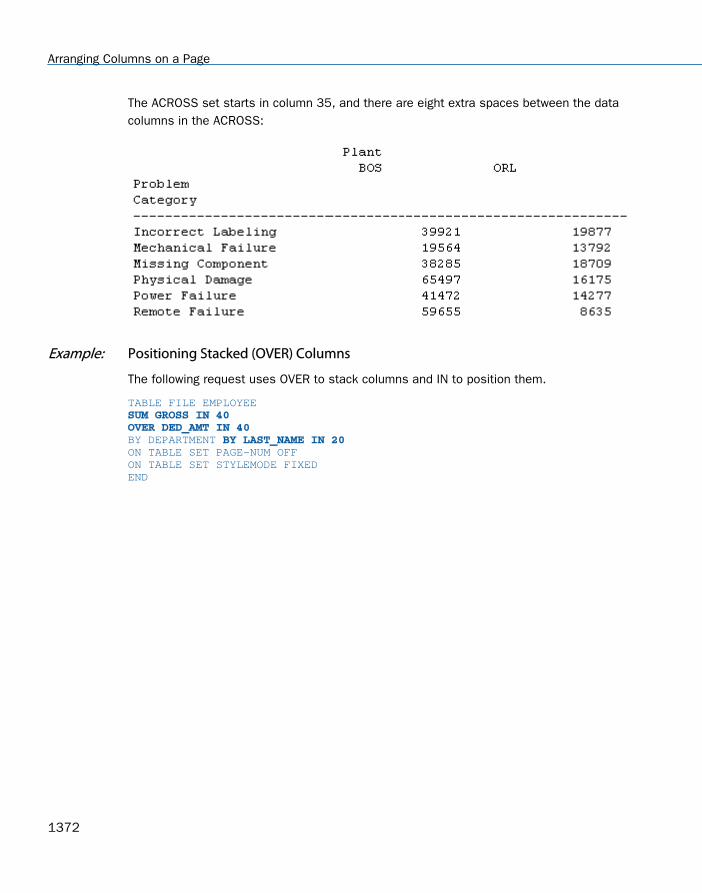
The ACROSS set starts in column 35, and there are eight extra spaces between the datacolumns in the ACROSS:
Example: Positioning Stacked (OVER) Columns
The following request uses OVER to stack columns and IN to position them.
TABLE FILE EMPLOYEE SUM GROSS IN 40OVER DED_AMT IN 40 BY DEPARTMENT BY LAST_NAME IN 20 ON TABLE SET PAGE-NUM OFFON TABLE SET STYLEMODE FIXEDEND
Arranging Columns on a Page
1372

In the report, GROSS and DED_AMT are stacked, starting in column 40. LAST_NAME starts incolumn 20.
Suppressing Column Display
A report request may include a field to create a certain result. For example, it may name a sortfield by which to arrange data. However, you may not want to display the title or values of thatfield if they appear elsewhere in the report. The phrase NOPRINT (synonym SUP-PRINT)suppresses column display.
21. Laying Out the Report Page
Creating Reports With TIBCO® WebFOCUS Language 1373
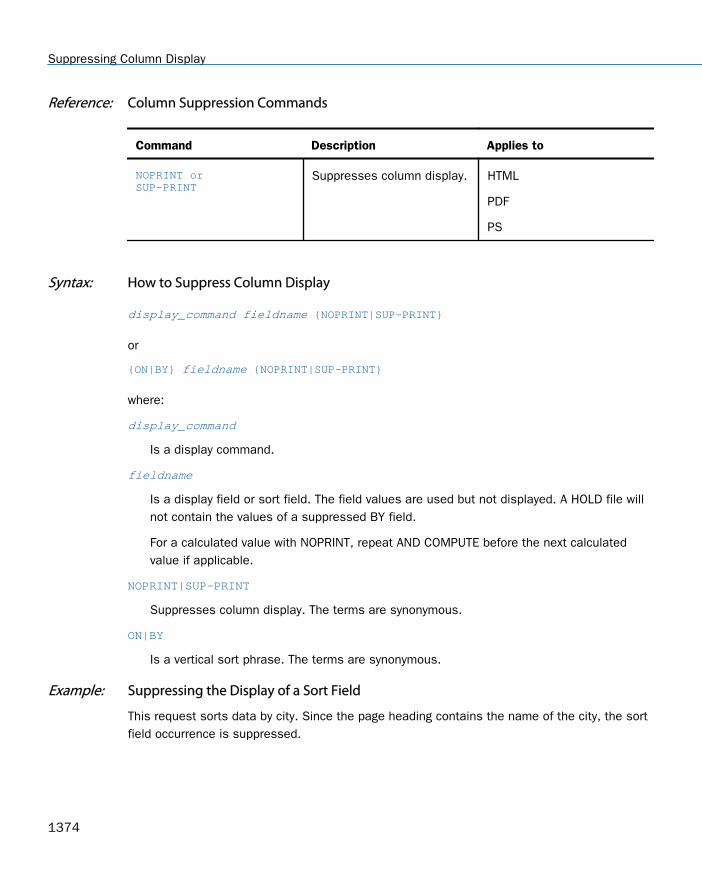
Reference: Column Suppression Commands
Command Description Applies to
NOPRINT or SUP-PRINT
Suppresses column display. HTML
PS
Syntax: How to Suppress Column Display
display_command fieldname {NOPRINT|SUP-PRINT}
or
{ON|BY} fieldname {NOPRINT|SUP-PRINT}
where:
display_command
Is a display command.
fieldname
Is a display field or sort field. The field values are used but not displayed. A HOLD file willnot contain the values of a suppressed BY field.
For a calculated value with NOPRINT, repeat AND COMPUTE before the next calculatedvalue if applicable.
NOPRINT|SUP-PRINT
Suppresses column display. The terms are synonymous.
ON|BY
Is a vertical sort phrase. The terms are synonymous.
Example: Suppressing the Display of a Sort Field
This request sorts data by city. Since the page heading contains the name of the city, the sortfield occurrence is suppressed.
Suppressing Column Display
1374
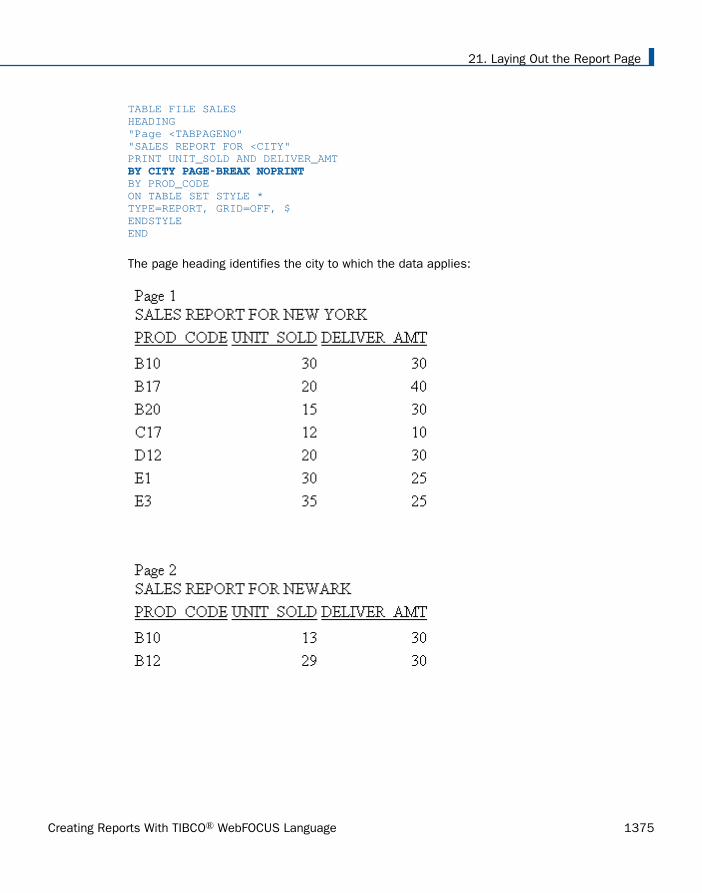
TABLE FILE SALESHEADING"Page <TABPAGENO""SALES REPORT FOR <CITY"PRINT UNIT_SOLD AND DELIVER_AMT BY CITY PAGE-BREAK NOPRINT BY PROD_CODEON TABLE SET STYLE *TYPE=REPORT, GRID=OFF, $ENDSTYLEEND
The page heading identifies the city to which the data applies:
21. Laying Out the Report Page
Creating Reports With TIBCO® WebFOCUS Language 1375

Without NOPRINT, the report would unnecessarily repeat the city:
Suppressing Column Display
1376

Example: Suppressing Display of a Sort Field With Subtotal
This request generates a subtotal for each value of the sort field CATEGORY but suppressesthe display of the sort field occurrence.
TABLE FILE GGSALESSUM UNITS BY CATEGORYBY PRODUCT ON CATEGORY SUB-TOTAL SUP-PRINT PAGE-BREAK ON TABLE SET PAGE-NUM OFFON TABLE SET STYLE *TYPE=REPORT, GRID=OFF, $ENDSTYLEEND
The default subtotal line identifies each category (for example, *TOTAL Coffee):
21. Laying Out the Report Page
Creating Reports With TIBCO® WebFOCUS Language 1377
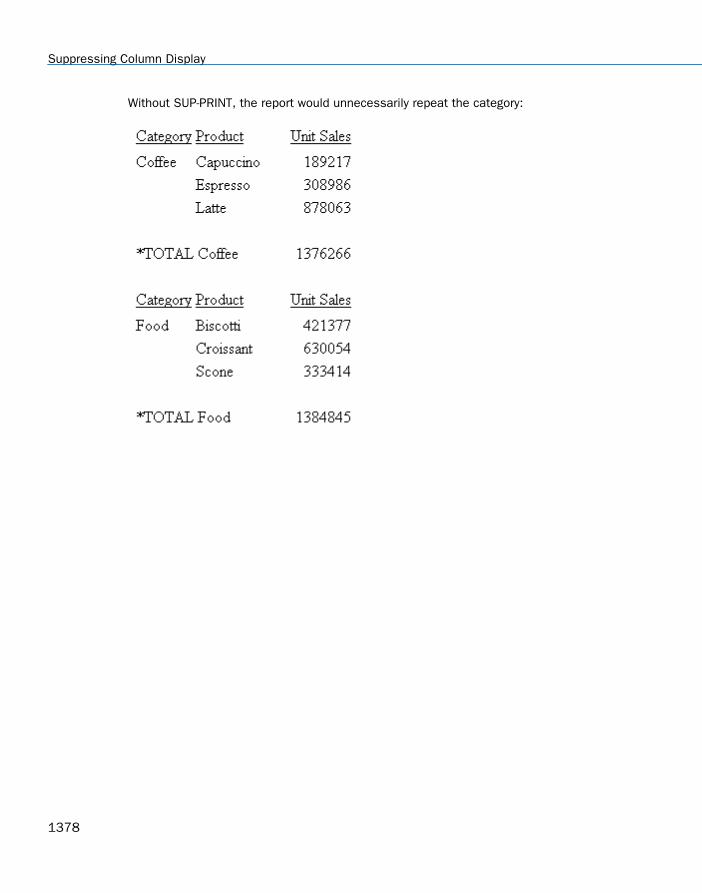
Without SUP-PRINT, the report would unnecessarily repeat the category:
Suppressing Column Display
1378

Example: Sorting Alphabetically
This request sorts last names alphabetically but avoids duplication of data by suppressing thesort field occurrence of LAST_NAME.
TABLE FILE EMPLOYEEPRINT LAST_NAME BY LAST_NAME NOPRINT ON TABLE SET PAGE-NUM OFFON TABLE SET STYLE *TYPE=REPORT, GRID=OFF, $ENDSTYLEEND
Last names are arranged alphabetically:
Inserting a Page Break
Use the PAGE-BREAK command to generate a new page each time the value of a specifiedvertical sort (BY) field changes. This helps to prevent related information from being presentedover multiple pages. When you use a page break, column titles and any page headings appearat the top of each new page. When the request has a PAGE-BREAK, the GRANDTOTAL is on apage by itself.
PAGE-BREAK does not apply when report output is stored in a HOLD, SAVE, or SAVB file.
21. Laying Out the Report Page
Creating Reports With TIBCO® WebFOCUS Language 1379

In an HTML report, PAGE-BREAK creates a new section of the report, with column titles and anincremented page number, on the same webpage. It does not, by itself, create a newwebpage. To create multiple webpages in an HTML report:
Burst the report, with each page corresponding to a different sort field value. For details,see Bursting Reports Into Multiple HTML Files on page 1031.
Use SET STYLEMODE=PAGED in conjunction with PAGE-BREAK. This is useful when you aredistributing a report via ReportCaster.
Use SET WEBVIEWER=ON, which accesses the WebFOCUS Viewer, in conjunction withPAGE-BREAK. For details, see the TIBCO WebFOCUS® Developing Reporting Applicationsmanual.
Reference: Page Break Commands
Command Description Applies to
PAGE-BREAK Generates new page. HTML
PS
NOSPLIT Prevents undesirable page break. PDF
PS
SET LINES Synchronizes report page with browserpage.
HTML
Reference: Working With Multi-Table HTML Reports
You can control where a report breaks using SET LINES or PAGE-BREAK in the request.
ON sortfield PAGE-BREAK or BY sortfield PAGE-BREAK overrides a SET LINES command andbreaks a report into multiple HTML tables whenever the sort field value changes.
Column titles are generated for every PAGE-BREAK or according to the SET LINESparameter.
Inserting a Page Break
1380

When a report is broken into multiple HTML tables, the browser displays each tableaccording to its own algorithm. Set SQUEEZE to OFF and/or WRAP to OFF to ensure thatHTML tables are aligned consistently across pages.
Syntax: How to Insert a Page Break
{ON|BY} fieldname PAGE-BREAK [REPAGE] [WHEN expression;]
where:
ON|BY
Is a vertical sort phrase. The terms are synonymous.
fieldname
Is the sort field on which the page break occurs. Specify the lowest level sort field at whichthe page break occurs. A page break occurs automatically whenever a higher level sortfield changes.
REPAGE
Resets the page number to 1 at each page break or, if combined with WHEN, whenever theWHEN criteria are met.
WHEN expression
Specifies a conditional page break in the printing of a report as determined by a logicalexpression. See Controlling Report Formatting on page 1221 for details.
Example: Inserting a Page Break
This request generates a new page whenever the value of the sort field SALARY changes.
TABLE FILE EMPLOYEEPRINT EMP_IDBY SALARY IN-GROUPS-OF 5000BY PCT_INC BY DAT_INC ON SALARY PAGE-BREAK ON TABLE SET ONLINE-FMT PDFON TABLE SET PAGE-NUM OFFEND
21. Laying Out the Report Page
Creating Reports With TIBCO® WebFOCUS Language 1381

The first two pages of the report are displayed to illustrate where the page breaks occur:
The second page is:
Inserting a Page Break
1382
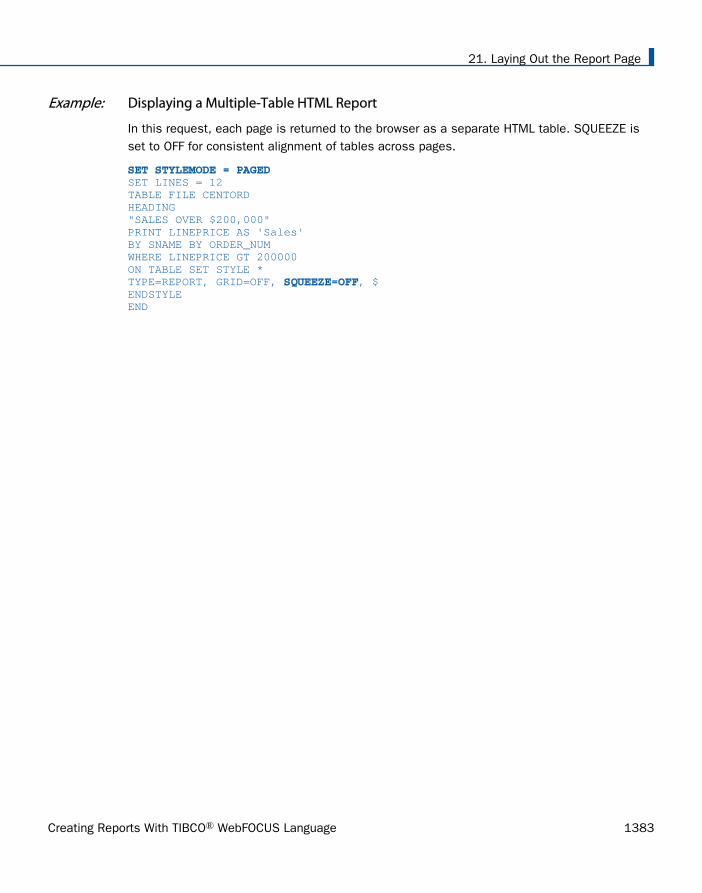
Example: Displaying a Multiple-Table HTML Report
In this request, each page is returned to the browser as a separate HTML table. SQUEEZE isset to OFF for consistent alignment of tables across pages.
SET STYLEMODE = PAGED SET LINES = 12TABLE FILE CENTORDHEADING"SALES OVER $200,000"PRINT LINEPRICE AS 'Sales'BY SNAME BY ORDER_NUMWHERE LINEPRICE GT 200000ON TABLE SET STYLE *TYPE=REPORT, GRID=OFF, SQUEEZE=OFF, $ENDSTYLEEND
21. Laying Out the Report Page
Creating Reports With TIBCO® WebFOCUS Language 1383

Two pages of the report follow, showing consistent alignment:
Inserting a Page Break
1384

The same two pages illustrate inconsistent alignment with SQUEEZE set to ON:
Preventing an Undesirable Split
A page break may occur in the middle of information logically grouped by a sort field, causingone or more group-related lines to appear by themselves on the next page or in the nextwindow. Use the NOSPLIT option to avoid this kind of break. When the value of the sort fieldchanges, the total number of lines related to the new value appear on a new page, includingsort headings, sort footings, and subtotals if applicable.
This feature applies to a PDF or PS report.
21. Laying Out the Report Page
Creating Reports With TIBCO® WebFOCUS Language 1385

If you use NOSPLIT with PAGE-BREAK, the PAGE-BREAK must apply to a higher-level sort field.Otherwise, NOSPLIT is ignored. NOSPLIT is also ignored when report output is stored in aHOLD, SAVE, or SAVB file. NOSPLIT is not compatible with the TABLEF command andgenerates an error message.
Syntax: How to Prevent an Undesirable Split
This syntax applies to a PDF or PS report. Use only one NOSPLIT per report request.
{ON|BY} fieldname NOSPLIT
where:
ON|BY
Is a vertical sort phrase. The terms are synonymous.
fieldname
Is the name of the sort field for which sort groups are kept together on the same page.
Example: Preventing an Undesirable Split
This request uses NOSPLIT to keep related information on the same page:
SET ONLINE-FMT = PDFTABLE FILE EMPLOYEEPRINT DED_CODE AND DED_AMTBY PAY_DATE BY LAST_NAME ON LAST_NAME NOSPLIT END
Inserting a Page Break
1386

When the value of LAST_NAME changes from STEVENS to CROSS, the lines related to CROSSdo not fit on the current page. With NOSPLIT, they appear on the next page:
21. Laying Out the Report Page
Creating Reports With TIBCO® WebFOCUS Language 1387

Inserting a Page Break
1388

Without NOSPLIT, the information for CROSS falls on the first and second pages:
21. Laying Out the Report Page
Creating Reports With TIBCO® WebFOCUS Language 1389

Inserting Page Numbers
By default, the first two lines of a report page are reserved. The first line contains the pagenumber in the top-left corner, and the second line is blank.
Note: The features in this section are not supported for Compound Reports.
You can:
Change the position of the default page number with the system variable TABPAGENO,which contains the current page number.
Insert the total page count using the TABLASTPAGE system variable.
Assign any number to the first page using the FOCFIRSTPAGE parameter.
Suppress the display of the default page number.
Note: The variables TABPAGENO and TABLASTPAGE cannot be used to define styling withconditional styling (WHEN).
Inserting Page Numbers
1390

If you enable Section 508 accessibility, a default page number is not included in the HTMLtable.
Reference: Page Number Commands
Command Description Applies to
<BYLASTPAGE Used with REPAGE. Inserts the total page countwithin the sort group that has the REPAGEoption.
HTML
PS
PPTX
REPAGE Resets page number to one. HTML
PS
PPTX
<TABPAGENO Inserts the current page number. TABPAGENOsuppresses the default page number, and thetop two lines of a page are blank.
HTML
PS
PPTX
<TABLASTPAGE Inserts the total page count in the report. HTML
PS
PPTX
SET FOCFIRSTPAGE Assigns the designated page number to the firstpage.
HTML
PS
PPTX
21. Laying Out the Report Page
Creating Reports With TIBCO® WebFOCUS Language 1391

Command Description Applies to
SET PAGE-NUM Controls page number display. HTML
PS
Syntax: How to Insert the Current Page Number
To add the current page number, add the following to your request.
<TABPAGENO
Example: Inserting the Current Page Number in a Sort Footing
This request generates a new page whenever the value of the sort field REGION changes. Ituses TABPAGENO to insert a page number in the sort footing.
TABLE FILE GGSALESSUM BUDDOLLARSBY REGION BY ST BY CITY ON REGION PAGE-BREAK SUBFOOT"Sales Quota for <REGION Cities""Page <TABPAGENO" ON TABLE SET ONLINE-FMT PDFEND
The first page of output is:
Inserting the Total Page Count
You can use the <TABLASTPAGE system variable to insert the total page count into your report.For example, if you wanted to add a footing in your report that said "Page 1 of 5", you coulduse the <TABLASTPAGE system variable in conjunction with the <TABPAGENO system variableto do so.
Inserting Page Numbers
1392
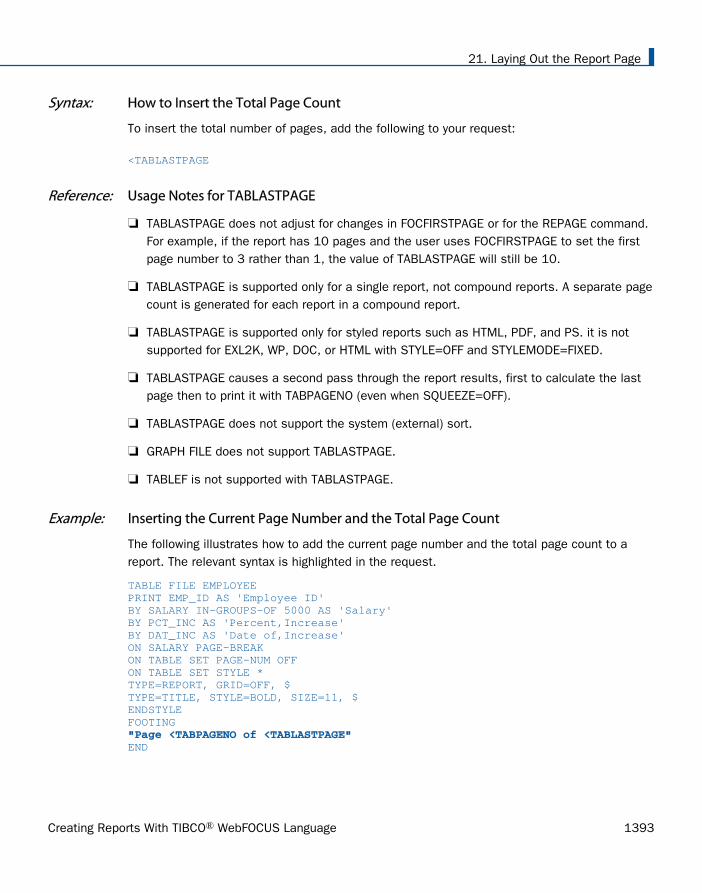
Syntax: How to Insert the Total Page Count
To insert the total number of pages, add the following to your request:
<TABLASTPAGE
Reference: Usage Notes for TABLASTPAGE
TABLASTPAGE does not adjust for changes in FOCFIRSTPAGE or for the REPAGE command.For example, if the report has 10 pages and the user uses FOCFIRSTPAGE to set the firstpage number to 3 rather than 1, the value of TABLASTPAGE will still be 10.
TABLASTPAGE is supported only for a single report, not compound reports. A separate pagecount is generated for each report in a compound report.
TABLASTPAGE is supported only for styled reports such as HTML, PDF, and PS. it is notsupported for EXL2K, WP, DOC, or HTML with STYLE=OFF and STYLEMODE=FIXED.
TABLASTPAGE causes a second pass through the report results, first to calculate the lastpage then to print it with TABPAGENO (even when SQUEEZE=OFF).
TABLASTPAGE does not support the system (external) sort.
GRAPH FILE does not support TABLASTPAGE.
TABLEF is not supported with TABLASTPAGE.
Example: Inserting the Current Page Number and the Total Page Count
The following illustrates how to add the current page number and the total page count to areport. The relevant syntax is highlighted in the request.
TABLE FILE EMPLOYEEPRINT EMP_ID AS 'Employee ID'BY SALARY IN-GROUPS-OF 5000 AS 'Salary'BY PCT_INC AS 'Percent,Increase'BY DAT_INC AS 'Date of,Increase'ON SALARY PAGE-BREAKON TABLE SET PAGE-NUM OFFON TABLE SET STYLE *TYPE=REPORT, GRID=OFF, $TYPE=TITLE, STYLE=BOLD, SIZE=11, $ENDSTYLEFOOTING "Page <TABPAGENO of <TABLASTPAGE" END
21. Laying Out the Report Page
Creating Reports With TIBCO® WebFOCUS Language 1393

The first two pages of output are:
Displaying the Total Page Count Within a Sort Group
The <BYLASTPAGE variable used in a heading or footing displays the number of pages ofoutput within each sort group when a report uses the REPAGE option to reset the pagenumbers for each sort group. This variable can only be used with styled output formats.
If the REPAGE option is not used in the report, the total number of pages in the report(<TABLASTPAGE variable) is used for <BYLASTPAGE.
Syntax: How to Display the Total Number of Pages Within Each Sort Group
The request must have the following syntax and hold the output in a styled output format:
BY sortfield REPAGE
The heading or footing can use the following syntax to display “Page x of y”
Inserting Page Numbers
1394

{HEADING|FOOTING} "Page <TABPAGENO of <BYLASTPAGE"
where:
sortfield
Is the sort field that has the REPAGE option. A PAGE-BREAK is required on the same sortfield or a lower level sort field. PAGE-BREAK starts a new page for each sort break.REPAGE resets the page number to 1 for each sort break.
<TABPAGENO
Is the current page number.
<BYLASTPAGE
Is the last page number before the repage.
Example: Paginating Within a Sort Group
The following request against the GGSALES data source sorts by product, region, category, andcity. It resets the pagination each time the product changes. The heading prints the currentpage number and the total within each product group.
Note that by default, the TABPAGENO and BYLASTPAGE variables have format I5, which leavesa lot of blank space before the page numbers. Therefore, you can use spot markers orCOMPUTE commands to move the page numbers to the left.
In the following example, a COMPUTE command creates a field named X that has the value ofTABPAGENO but stores it as an I2 field, and the spot marker in the heading moves theBYLASTPAGE page number four spaces to the left. The heading command must come after theCOMPUTE command or the field named X will not be recognized:
TABLE FILE GGSALES SUM UNITS COMPUTE X/I2 = TABPAGENO;BY PRODUCT NOPRINT REPAGE BY REGION PAGE-BREAK BY CATEGORY BY CITY HEADING CENTER "<PRODUCT : Page <X of <-4> <BYLASTPAGE "ON TABLE PCHOLD FORMAT PDF END
21. Laying Out the Report Page
Creating Reports With TIBCO® WebFOCUS Language 1395

The following partial output shows that the page number resets to 1 when the product changesand that the BYLASTPAGE variable displays the total number of pages for each product:
Inserting Page Numbers
1396

Assigning Any Page Number to the First Page
You can assign a page number to the first page of a report using the FOCFIRSTPAGEparameter. This feature is useful when a report is printed and assembled as part of anotherone.
You can also control the page numbering of multiple reports in the same procedure using theFOCFIRSTPAGE parameter with the &FOCNEXTPAGE variable.
If TABPAGENO is used, FOCFIRSTPAGE is ignored.
Syntax: How to Assign a Page Number to the First Page
For all report requests in a procedure
SET FOCFIRSTPAGE = {n|1|&FOCNEXTPAGE}
For one report request
ON TABLE SET FOCFIRSTPAGE {n|1|&FOCNEXTPAGE}
where:
n
Is an integer between 1 and 999999, which is the number assigned to the first page ofthe report.
1
Assigns the number 1 to the first page. 1 is the default value.
&FOCNEXTPAGE
Is a variable whose value is one more than the last page number of the previous report ina multiple request. The value is calculated at run time.
Example: Assigning a Page Number to the First Page
This request assigns the number 3 to the first page of the report.
SET FOCFIRSTPAGE = 3 TABLE FILE CENTORDHEADING"Sales By Store"SUM LINEPRICE AS 'Sales'BY SNAMEON TABLE SET STYLE *TYPE=REPORT, GRID=OFF, $ENDSTYLEEND
21. Laying Out the Report Page
Creating Reports With TIBCO® WebFOCUS Language 1397

The report is:
Example: Controlling Page Numbers in Consecutive Reports
This procedure contains two report requests. The second request sets FOCFIRSTPAGE to thevalue of &FOCNEXTPAGE.
SET FOCFIRSTPAGE = 3TABLE FILE CENTORDHEADING"Sales By Store"SUM LINEPRICE AS 'Sales'BY SNAMEWHERE SNAME EQ 'eMart'ON TABLE SET STYLE *TYPE=REPORT, GRID=OFF, $ENDSTYLEEND-RUN
SET FOCFIRSTPAGE = &FOCNEXTPAGE TABLE FILE CENTORDHEADING"Sales By Product"SUM LINEPRICE AS 'Sales'BY PRODCAT AS 'Product'WHERE PRODCAT EQ 'VCRs'ON TABLE SET STYLE *TYPE=REPORT, GRID=OFF, $ENDSTYLEEND
Inserting Page Numbers
1398

The first page of the second report is numbered 4, which is one more than the last page of theprevious report:
Controlling the Display of Page Numbers
By default, the first two lines of a report page are reserved. The first line displays the pagenumber in the top-left corner, and the second line is blank. To suppress the default display,use the PAGE-NUM parameter.
Syntax: How to Control the Display of Page Numbers
For all report requests in a procedure
SET PAGE[-NUM] = num_display
For one report request
ON TABLE SET PAGE[-NUM] num_display
where:
-NUM
Is optional. PAGE and PAGE-NUM are synonymous.
num_display
Is one of the following:
ON displays page numbers in the top-left corner, followed by a reserved blank line. ON isthe default value.
OFF suppresses default page numbers.
21. Laying Out the Report Page
Creating Reports With TIBCO® WebFOCUS Language 1399
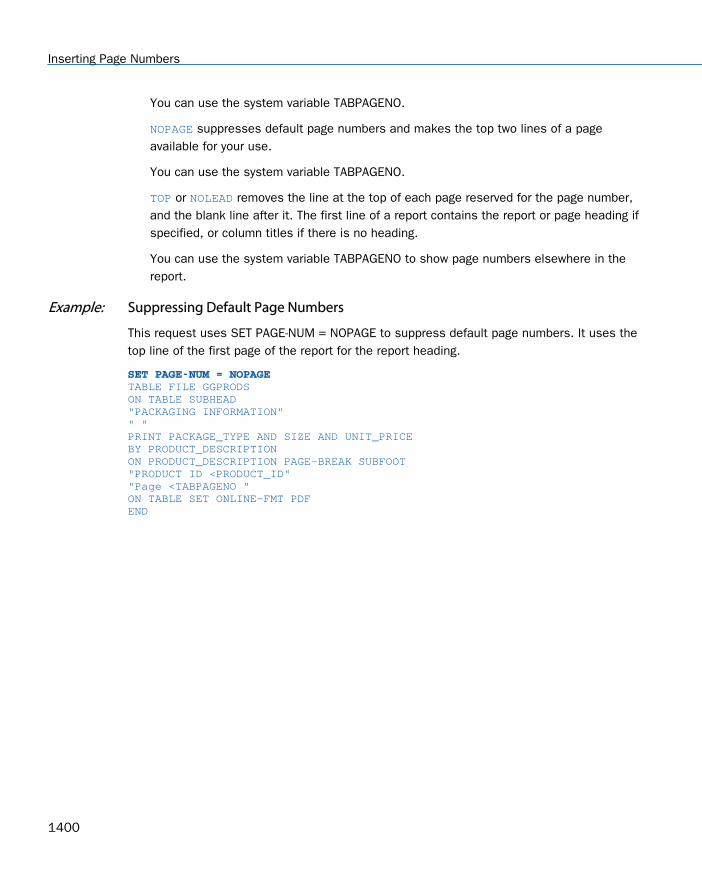
You can use the system variable TABPAGENO.
NOPAGE suppresses default page numbers and makes the top two lines of a pageavailable for your use.
You can use the system variable TABPAGENO.
TOP or NOLEAD removes the line at the top of each page reserved for the page number,and the blank line after it. The first line of a report contains the report or page heading ifspecified, or column titles if there is no heading.
You can use the system variable TABPAGENO to show page numbers elsewhere in thereport.
Example: Suppressing Default Page Numbers
This request uses SET PAGE-NUM = NOPAGE to suppress default page numbers. It uses thetop line of the first page of the report for the report heading.
SET PAGE-NUM = NOPAGE TABLE FILE GGPRODSON TABLE SUBHEAD"PACKAGING INFORMATION"" "PRINT PACKAGE_TYPE AND SIZE AND UNIT_PRICEBY PRODUCT_DESCRIPTIONON PRODUCT_DESCRIPTION PAGE-BREAK SUBFOOT"PRODUCT ID <PRODUCT_ID""Page <TABPAGENO "ON TABLE SET ONLINE-FMT PDFEND
Inserting Page Numbers
1400

TABPAGENO inserts the page number in the sort footing. The first page of the report is:
Setting the Number of Data Rows For Each Page in an AHTML Report Request
You can use the LINES-PER-PAGE StyleSheet attribute in an AHTML report request to set thenumber of data rows to display on each page in the report output.
Syntax: How to Set the Number of Data Rows For Each Page in an AHTML Report Request
To control the number of data rows to display on each page in the report output, use thefollowing StyleSheet syntax:
TYPE=REPORT, LINES-PER-PAGE={n|UNLIMITED},$
where:
n
Specifies the number of data rows to display on each page. The default value is 57 rows.
UNLIMITED
Specifies that you want to show all the results on one page.
Note:
In an AHTML report request, using the following SET command, you will see the samenumber of data rows as the LINES-PER-PAGE StyleSheet option:
ON TABLE SET LINES {n|UNLIMITED}
21. Laying Out the Report Page
Creating Reports With TIBCO® WebFOCUS Language 1401

In an HTML report request, using either the LINES-PER-PAGE StyleSheet option or the SETLINES command, you will see the number of lines, as opposed to the number of data rows.
Example: Setting the Number of Data Rows For Each Report Page
The following example uses the default WebFOCUS StyleSheet and displays 20 data rows oneach page of the report output.
TABLE FILE GGSALESHEADING"Sales Report"SUM UNITS DOLLARSBY CATEGORY BY PRODUCT BY DATE NOPRINTWHERE DATE GE 19960101 AND DATE LE 19960401ON TABLE PCHOLD FORMAT AHTMLON TABLE SET STYLE *INCLUDE=IBFS:/FILE/IBI_HTML_DIR/ibi_themes/Warm.sty,$TYPE=REPORT, GRID=OFF, LINES-PER-PAGE = 20, $ENDSTYLEEND
Inserting Page Numbers
1402

The following image shows the output for the first page.
21. Laying Out the Report Page
Creating Reports With TIBCO® WebFOCUS Language 1403
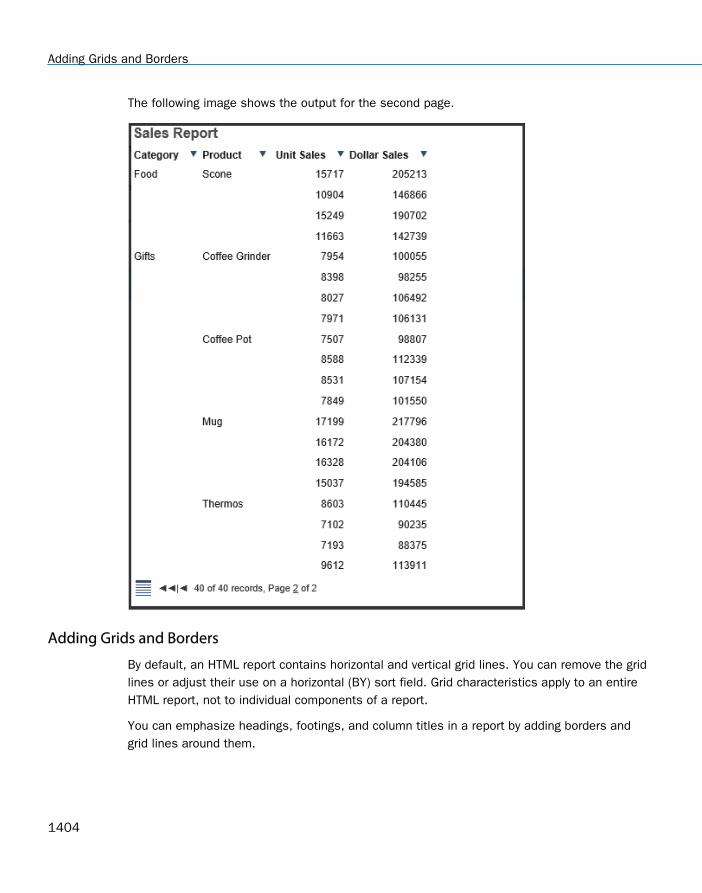
The following image shows the output for the second page.
Adding Grids and Borders
By default, an HTML report contains horizontal and vertical grid lines. You can remove the gridlines or adjust their use on a horizontal (BY) sort field. Grid characteristics apply to an entireHTML report, not to individual components of a report.
You can emphasize headings, footings, and column titles in a report by adding borders andgrid lines around them.
Adding Grids and Borders
1404

Borders: In a PDF, HTML, DHTML, XLSX, EXL2K, PPTX, PPT, or PS report, you can use BORDERattributes in a StyleSheet to specify the weight, style, and color of border lines. If you wish, youcan specify formatting variations for the top, bottom, left, and right borders.
For an example, see Inserting and Formatting a Border on page 1409.
The BORDERALL StyleSheet attribute supports a heading or footing grid with borders aroundeach individual heading or footing cell in PDF, DHTML, HTML, XLSX, and PPTX report output.Using this attribute along with BORDER attributes for individual objects in a heading or footingenables you to create borders around individual items.
Currently, with SQUEEZE=ON, the right margin border for subheadings and subfootings isdefined based on the maximum width of all heading, footing, subheading, and subfooting lines.The length of subheading and subfooting lines is tied to the lengths of the page heading andpage footing, not to the size of the data columns in the body of the report. You can use theALIGN-BORDERS=BODY attribute in a StyleSheet to align the subheadings and subfootings withthe report body on PDF report output instead of the other heading elements.
Grids: In an HTML report, you can use the GRID attribute in a StyleSheet to turn grid lines onand off for the entire report. When used in conjunction with internal cascading style sheets,GRID produces a thin grid line rather than a thick double line (the HTML default). In PDFreports you can use the HGRID and VGRID attributes to add horizontal or vertical grid lines andadjust their density.
Note: The SET GRID parameter, which applies to graphs, is not the same as the GRIDStyleSheet attribute.
Reference: Grid Display Attributes
Attribute Description Applies to
GRID Controls grid display. HTML
PS
DHTML
PPTX
PPT
21. Laying Out the Report Page
Creating Reports With TIBCO® WebFOCUS Language 1405

Attribute Description Applies to
HGRID Controls horizontal grid display and grid line density. PDF
PS
DHTML
PPTX
PPT
VGRID Control vertical grid display and grid line density. PDF
PS
DHTML
PPTX
PPT
Note: When viewing PDF reports with the Adobe Reader, GRID lines may appear thinner thanspecified if the view is not set to 100%. For example, if you view the document at the 50%setting, some GRID lines may be thinner than others.
Syntax: How to Control Grid Display in HTML Reports
[TYPE=REPORT,] GRID= option, $
where:
TYPE=REPORT
Applies the grid to the entire report. Not required, as it is the default.
option
Is one of the following:
ON applies a grid to a report. Does not apply grid lines to cells underneath a BY field valueuntil the value changes. Column titles are not underlined. ON is the default value.
OFF disables the default grid. Column titles are underlined. You can include blank linesand underlines. You cannot wrap cell data. With this setting, a report may be harder toread.
FILL applies grid lines to all cells of a report. Column titles are not underlined.
Adding Grids and Borders
1406

Syntax: How to Add and Format Borders
To request a uniform border, use this syntax:
TYPE=type, BORDER=option, [BORDER-STYLE=line_style,] [BORDER-COLOR={color|RGB(r g b)},] $
To specify different characteristics for the top, bottom, left, and/or right borders, use thissyntax:
TYPE=type, BORDER-position=option, [BORDER[-position]-STYLE=line_style,] [BORDER[-position]-COLOR={color|RGB(r g b)},] $
where:
type
Identifies the report component to which borders are applied. See Identifying a ReportComponent in a WebFOCUS StyleSheet on page 1251 for valid values.
option
Can be one of the following values:
ON turns borders on. ON generates the same line as MEDIUM.
Note: The MEDIUM line setting ensures consistency with lines created with GRIDattributes.
OFF turns borders off. OFF is the default value.
LIGHT specifies a thin line.
MEDIUM identifies a medium line. ON sets the line to MEDIUM.
HEAVY identifies a thick line.
width specifies the line width in points, where 72 pts=1 inch. Note that this option is notsupported with Excel 2003, which does not have an option for specifying a number toprecisely set the border width (thickness) in points.
Tip: Line width specified in points is displayed differently in HTML and PDF output. Foruniform appearance, regardless of display format, use LIGHT, MEDIUM, or HEAVY.
position
Specifies which border line to format. Valid values are: TOP, BOTTOM, LEFT, RIGHT.
You can specify a position qualifier for any of the BORDER attributes. This enables you toformat line width, line style, and line color individually, for any side of the border.
21. Laying Out the Report Page
Creating Reports With TIBCO® WebFOCUS Language 1407

line_style
Sets the style of the border line. WebFOCUS StyleSheets support all of the standardcascading style sheet line styles. Several 3-dimensional styles are available only in HTML,as noted by asterisks. Valid values are:
Style Description
NONE No border is drawn.
SOLID Solid line.
DOTTED Dotted line.
DASHED Dashed line.
DOUBLE Double line.
GROOVE* 3D groove. (Not supported with Excel 2003, which has no optionfor specifying this type of border.)
RIDGE* 3D ridge. (Not supported with Excel 2003, which has no optionfor specifying this type of border.)
INSET* 3D inset.
OUTSET* 3D outset.
color
Is one of the preset color values. The default value is BLACK.
If the display or output device does not support colors, it substitutes shades of gray. For acomplete list of available color values, see Formatting Report Data on page 1699.
RGB
Specifies the font color using a mixture of red, green, and blue.
(r g b)
Is the desired intensity of red, green, and blue, respectively. The values are on a scale of 0to 255, where 0 is the least intense and 255 is the most intense. Using the three colorcomponents in equal intensities results in shades of gray.
Adding Grids and Borders
1408

Note: Format EXL2K does not support the GRID=ON parameter.
Example: Inserting and Formatting a Border
This request generates an HTML report with a heavy red dotted line around the entire reportheading.
TABLE FILE GGSALESSUM BUDUNITS UNITS BUDDOLLARS DOLLARSBY CATEGORYON TABLE SUBHEAD"</1 Sales Report""**CONFIDENTIAL**""December 2002 </1"ON TABLE SET PAGE-NUM OFFON TABLE SET ONLINE-FMT HTMLON TABLE SET HTMLCSS ONON TABLE SET STYLESHEET *TYPE=REPORT, GRID=OFF, $ TYPE=TABHEADING, STYLE=BOLD, JUSTIFY=CENTER, BORDER=HEAVY, BORDER-COLOR=RED, BORDER-STYLE=DOTTED, $ ENDSTYLEEND
The output is:
Tip: You can use the same BORDER syntax to generate this output in a PDF or PS report.
21. Laying Out the Report Page
Creating Reports With TIBCO® WebFOCUS Language 1409

Example: Displaying the Default Grid on an HTML Report
This request uses the default setting GRID=ON.
TABLE FILE GGSALESSUM UNITS DOLLARSBY CATEGORY BY PRODUCTON TABLE SET PAGE-NUM OFFEND
The cells underneath the sort field CATEGORY do not have grid lines until the value changes(for example, from Coffee to Food):
Example: Applying Grid Lines to All Cells of an HTML Report
This request uses GRID=FILL to apply grid lines to all cells, including those underneath thesort field CATEGORY.
TABLE FILE GGSALESSUM UNITS DOLLARSBY CATEGORY BY PRODUCTON TABLE SET PAGE-NUM OFFON TABLE SET STYLE * TYPE=REPORT, GRID=FILL, $ ENDSTYLEEND
Adding Grids and Borders
1410

All cells have grid lines:
Example: Removing a Grid From an HTML Report
This request uses GRID=OFF to remove the default grid from a report.
TABLE FILE GGSALESSUM UNITS DOLLARSBY CATEGORY BY PRODUCTON TABLE SET PAGE-NUM OFFON TABLE SET STYLE * TYPE=REPORT, GRID=OFF, $ ENDSTYLEEND
21. Laying Out the Report Page
Creating Reports With TIBCO® WebFOCUS Language 1411

Column titles are underlined:
Reference: Adding Borders to Excel Report Output
Adding borders to Excel report output also may add blank rows.
The presence of any BORDER syntax (even BORDERS=OFF), whether it is in the inlineprocedure or in the referenced StyleSheet, places the procedure in BORDER mode where thestyling and spacing is adjusted and may result in extra blank rows.
Example: Adding Borders to FORMAT XLSX Report Output
The following request turns borders on and generates FORMAT XLSX report output.
TABLE FILE WF_RETAIL_LITESUM COGS_USBY PRODUCT_CATEGORYBY BUSINESS_REGIONHEADING"This is the heading"ON TABLE PCHOLD FORMAT XLSXON TABLE NOTOTALON TABLE SET STYLE *TYPE=REPORT,BORDER=ON,$ENDSTYLEEND
Adding Grids and Borders
1412

The output is shown in the following image. A blank row has been added after the heading.
21. Laying Out the Report Page
Creating Reports With TIBCO® WebFOCUS Language 1413

The following version of the request has no border attributes.
TABLE FILE WF_RETAIL_LITESUM COGS_USBY PRODUCT_CATEGORYBY BUSINESS_REGIONHEADING"This is the heading"ON TABLE PCHOLD FORMAT XLSXON TABLE NOTOTALEND
Adding Grids and Borders
1414

The output is shown in the following image. There is no blank row between the report headingand report body.
21. Laying Out the Report Page
Creating Reports With TIBCO® WebFOCUS Language 1415

Syntax: How to Insert Inner and Outer Borders Within Headings or Footings
BORDERALL is the quickest way to add borders to the entire heading grid. This feature issupported in PDF, DHTML, HTML, XLSX, and PPTX formats. Individual borders can be removedby explicitly turning the border off in individual items using BORDER, BORDER-LEFT, BORDER-RIGHT, BORDER-TOP, and BORDER-BOTTOM. For a given item that is bordered by BORDERALL,BORDER-LEFT=OFF presents the item with no left border, but the defined border style isretained for top, bottom, and right borders.
Three levels of borders for headings and footings are supported:
1. Individual cell borders.
BORDER-LEFT, BORDER-RIGHT, BORDER-TOP, and BORDER-BOTTOM can be used to set theindividual components of the external border of the heading or a selected item or cell.
2. All outer borders.
BORDER= is used to set the external borders within a heading or footing.
3. All outer and internal borders.
BORDERALL is used to apply border characteristics to both the internal and externalborders of the selected heading or footing.
Note: BORDERALL applies to the entire heading or footing element. It cannot be used forindividual lines or items within a heading or footing element.
To turn on all external and internal borders (a border grid):
TYPE=headfoot, BORDERALL=option, [BORDER-STYLE=line_style,] [BORDER-COLOR={color|RGB(r g b)},] $
where:
headfoot
Is the type of heading or footing. Valid values are TABHEADING, TABFOOTING, HEADING,FOOTING, SUBHEAD, and SUBFOOT.
Note: BORDERALL applies to the entire heading or footing element. It cannot be used forindividual lines or items within a heading or footing element.
optionCan be one of the following values:
ON turns borders on. ON generates the same line as MEDIUM.
Note: The MEDIUM line setting ensures consistency with lines created with GRIDattributes.
Adding Grids and Borders
1416

OFF turns borders off. OFF is the default value.
LIGHT specifies a thin line.
MEDIUM identifies a medium line. ON sets the line to MEDIUM.
HEAVY identifies a thick line.
Entering a numeric value specifies the line width in points, where 72 pts=1 inch. Notethat this option is not supported with Excel 2003, which does not have an option forspecifying a number to precisely set the border width (thickness) in points.
Tip: Line width specified in points is displayed differently in HTML and PDF output. Foruniform appearance, regardless of display format, use LIGHT, MEDIUM, or HEAVY.
To request a uniform border, use this syntax:
TYPE=headfoot, BORDER=option
To specify different characteristics for the top, bottom, left, and/or right borders, use thissyntax:
TYPE=headfoot, BORDER-position=option, [BORDER[-position]-STYLE=line_style,] [BORDER[-position]-COLOR={color|RGB(r g b)},] $
where:
headfoot
Identifies the heading, footing, subheading, or subfooting to which borders are applied.
position
Specifies which border line to format. Valid values are: TOP, BOTTOM, LEFT, RIGHT.
You can specify a position qualifier for any of the BORDER attributes. This enables you toformat line width, line style, and line color individually, for any side of the border.
optionCan be one of the following values:
ON turns borders on. ON generates the same line as MEDIUM.
Note: The MEDIUM line setting ensures consistency with lines created with GRIDattributes.
OFF turns borders off. OFF is the default value.
LIGHT specifies a thin line.
21. Laying Out the Report Page
Creating Reports With TIBCO® WebFOCUS Language 1417
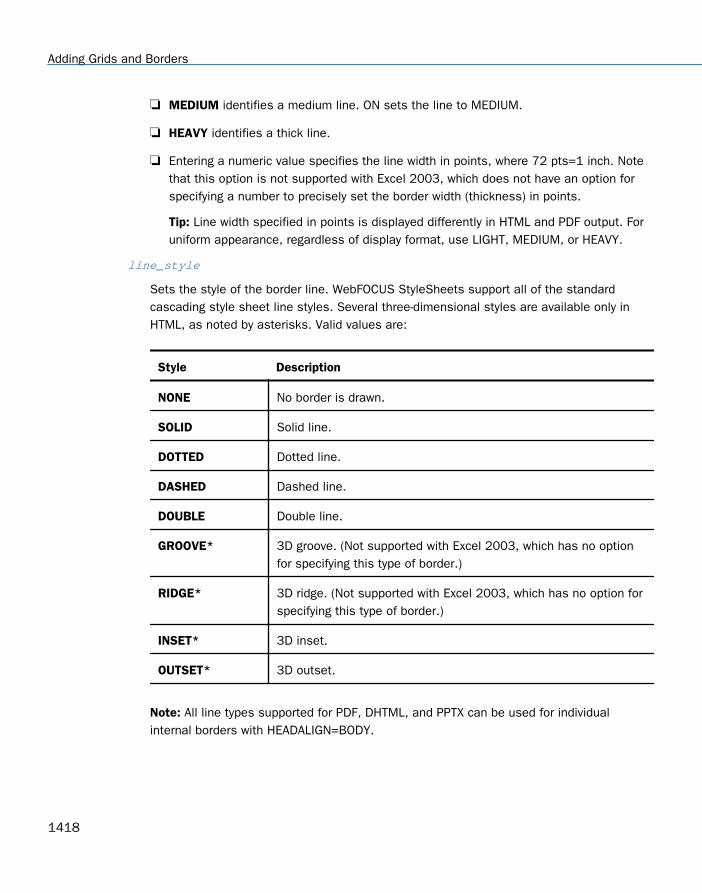
MEDIUM identifies a medium line. ON sets the line to MEDIUM.
HEAVY identifies a thick line.
Entering a numeric value specifies the line width in points, where 72 pts=1 inch. Notethat this option is not supported with Excel 2003, which does not have an option forspecifying a number to precisely set the border width (thickness) in points.
Tip: Line width specified in points is displayed differently in HTML and PDF output. Foruniform appearance, regardless of display format, use LIGHT, MEDIUM, or HEAVY.
line_style
Sets the style of the border line. WebFOCUS StyleSheets support all of the standardcascading style sheet line styles. Several three-dimensional styles are available only inHTML, as noted by asterisks. Valid values are:
Style Description
NONE No border is drawn.
SOLID Solid line.
DOTTED Dotted line.
DASHED Dashed line.
DOUBLE Double line.
GROOVE* 3D groove. (Not supported with Excel 2003, which has no optionfor specifying this type of border.)
RIDGE* 3D ridge. (Not supported with Excel 2003, which has no option forspecifying this type of border.)
INSET* 3D inset.
OUTSET* 3D outset.
Note: All line types supported for PDF, DHTML, and PPTX can be used for individualinternal borders with HEADALIGN=BODY.
Adding Grids and Borders
1418

color
Is one of the preset color values. The default value is BLACK.
If the display or output device does not support colors, it substitutes shades of gray. For acomplete list of available color values, see Color Values in a Report on page 1703.
RGB
Specifies the font color using a mixture of red, green, and blue.
(r g b)
Is the desired intensity of red, green, and blue, respectively, separated by spaces. Thevalues are on a scale of 0 to 255, where 0 is the least intense and 255 is the mostintense. Using the three color components in equal intensities results in shades of gray.
Example: Controlling Borders Within Heading and Footing Elements in PDF Report Output
The following request against the EMPLOYEE data source has a page heading, a subheading, asubfooting, and a report footing:
TABLE FILE EMPLOYEEHEADING" Department Report Page <TABPAGENO "PRINT LAST_NAME AS ''FIRST_NAME AS ''CURR_SAL AS ''CURR_JOBCODE AS ''BY DEPARTMENT AS ''WHERE CURR_SAL NE 0.0ON TABLE PCHOLD FORMAT PDFON DEPARTMENT SUBFOOT" ""Subtotal:<ST.CURR_SAL"" "ON DEPARTMENT SUBHEAD"Department <+0>Last Name <+0>First Name <+0>Salary<+0>Jobcode <+0>"ON TABLE SUBFOOT"Grand Total:<ST.CURR_SAL"ON TABLE SET HTMLCSS ONON TABLE SET STYLE *TYPE=REPORT, FONT=ARIAL, BORDER=ON, SQUEEZE=ON, $TYPE=REPORT, COLUMN=CURR_JOBCODE,SQUEEZE=.75, $TYPE = SUBHEAD, HEADALIGN=BODY, BORDERALL=ON,$TYPE = SUBFOOT, HEADALIGN=BODY,$TYPE = SUBFOOT, LINE=2, ITEM=1, COLSPAN=3, JUSTIFY=RIGHT,$TYPE = SUBFOOT, LINE=2, ITEM=2, JUSTIFY=RIGHT,$TYPE = TABFOOTING, HEADALIGN=BODY,$TYPE = TABFOOTING, ITEM=1, COLSPAN=3, JUSTIFY=RIGHT,$TYPE = TABFOOTING, ITEM=2, JUSTIFY=RIGHT,$ENDSTYLEEND
21. Laying Out the Report Page
Creating Reports With TIBCO® WebFOCUS Language 1419

The REPORT component has BORDER=ON, so the page heading has an external border.
The subheading has BORDERALL=ON and HEADALIGN=BODY, so the subheading grid alignswith the body grid, and each item within the subhead is presented as fully bordered individualcells.
The StyleSheet aligns the subfooting elements with the body of the report, and has the salarysubtotal on the second line aligned and justified with the CURR_SAL column.
The table footing has a border around the entire footing because the REPORT componentspecifies BORDER=ON. The grand total is aligned and justified with the CURR_SAL column onthe report.
The output is:
Syntax: How to Align Subheading and Subfooting Margins With the Report Body
Currently, with SQUEEZE=ON, the right margin border for subheadings and subfootings isdefined based on the maximum width of all heading, footing, subheading, and subfooting lines.The length of subheading and subfooting lines is tied to the lengths of the page heading andpage footing, not to the size of the data columns in the body of the report.
Adding Grids and Borders
1420
You can use the ALIGN-BORDERS=BODY attribute in a StyleSheet to align the subheadings andsubfootings with the report body on PDF report output instead of the other heading elements.
You can align subheading and subfooting margins with the report body either by adding theALIGN-BORDERS=BODY attribute to the StyleSheet declaration for the REPORT component, orplacing it in its own declaration without a TYPE attribute.
[TYPE=REPORT,] ALIGN-BORDERS={OFF|BODY} ,$
where:
OFF
Does not align the right margin of subheadings and subfootings with the report body.
BODY
Specifies that the width of subheading and subfooting lines is independent of heading,footing, tabheading, and tabfooting lines, and that the right border of the report body willbe aligned by either extending subheading and subfooting lines (if they are narrower thanthe data columns) or extending the data columns (if the data columns are narrower thanthe maximum width of subheadings and subfootings).
Reference: Considerations for Aligning Subheading and Subfooting Margins With the ReportBody
Without the ALIGN-BORDERS=BODY attribute, the width of the subheading and subfooting linesis determined by the largest width of all of the headings and footings (report, page,subheadings, and subfootings).
21. Laying Out the Report Page
Creating Reports With TIBCO® WebFOCUS Language 1421

The following image illustrates report output without the ALIGN-BORDERS=BODY attribute.
Adding Grids and Borders
1422

When the body lines are wider than the subheading and subfooting lines, the border andbackcolor of the subheading and subfooting lines are expanded to match the width of the datalines, as shown on the following report output.
21. Laying Out the Report Page
Creating Reports With TIBCO® WebFOCUS Language 1423
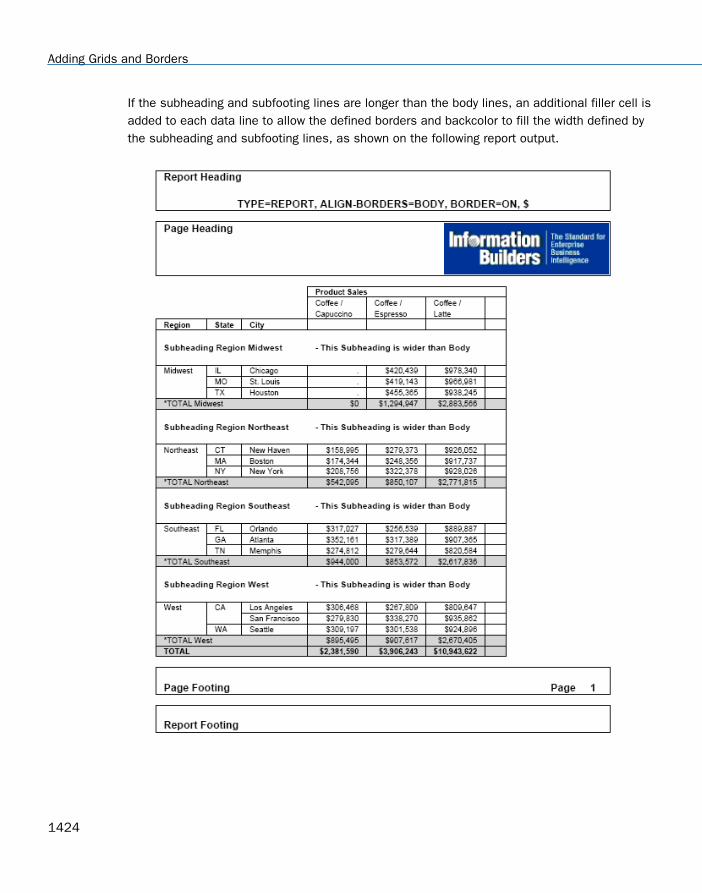
If the subheading and subfooting lines are longer than the body lines, an additional filler cell isadded to each data line to allow the defined borders and backcolor to fill the width defined bythe subheading and subfooting lines, as shown on the following report output.
Adding Grids and Borders
1424

ALIGN-BORDERS=BODY has been designed to work on:
Single panel reports (reports that do not panel horizontally).
Paneled reports where HEADPANEL has been turned on for all of the subheadings andsubfootings defined in the report.
Setting HEADPANEL ON causes the headings and footings from the first page of a Paneledreport to replicate on the subsequent panels. If HEADPANEL is not used, content can beplaced in the Paneled headings by explicitly positioning items within the headings using theStyleSheet attribute POSITION. In these situations, ALIGN-BORDERS=BODY is ignored.
Therefore, if HEADPANEL is turned on at the REPORT level and not explicitly turned off forany of the individual subheadings or subfootings, or if it is explicitly turned on for allsubheadings and subfootings, ALIGN-BORDERS=BODY will align the borders of allsubheadings and subfootings to the data. Otherwise, the borders will continue to exhibitthe default behavior of aligning with the page headings and footings.
21. Laying Out the Report Page
Creating Reports With TIBCO® WebFOCUS Language 1425

Example: Aligning Subheading and Subfooting Margins in a Single Panel PDF Report
The following request against the GGSALES data source has a report heading, report footing,page heading, page footing, and a subheading for each region. The margins of thesubheadings and subfootings are not aligned (ALIGN-BORDERS=OFF ,$):
DEFINE FILE GGSALESSHOWCATPROD/A30 = CATEGORY || (' / ' | PRODUCT);ENDTABLE FILE GGSALESSUM DOLLARS/I8M AS ''BY REGIONBY STBY CITYACROSS SHOWCATPROD AS 'Product Sales' ON REGION SUBHEAD" ""Subheading <+0>Region <REGION<+0> "" "ON REGION SUBTOTAL AS '*TOTAL'ON TABLE SUBHEAD"Report Heading"" ""TYPE=REPORT, ALIGN-BORDERS=OFF, BORDER=ON, $"HEADING"Page Heading "" "" "" "FOOTING" ""Page Footing<+0>Page <TABPAGENO "ON TABLE SUBFOOT" ""Report Footing"
Adding Grids and Borders
1426

WHERE CATEGORY EQ 'Coffee';ON TABLE SET PAGE-NUM OFF ON TABLE PCHOLD FORMAT PDFON TABLE SET HTMLCSS ONON TABLE SET STYLE * TYPE=REPORT, FONT='ARIAL', SIZE=9, LEFTMARGIN=.75, RIGHTMARGIN=.5, TOPMARGIN=.1, BOTTOMMARGIN=.1, ALIGN-BORDERS=OFF, BORDER=ON, SQUEEZE=ON,$$TYPE=TITLE, STYLE=BOLD,$TYPE=TABHEADING, SIZE=12, STYLE=BOLD,$TYPE=TABHEADING, LINE=3, JUSTIFY=CENTER,$TYPE=TABFOOTING, SIZE=12, STYLE=BOLD,$TYPE=HEADING, SIZE=12, STYLE=BOLD,$TYPE=HEADING, IMAGE=smplogo1.gif, POSITION=(+4.6000000 +0.03000000), JUSTIFY=RIGHT,$TYPE=FOOTING, SIZE=12, STYLE=BOLD,$TYPE=FOOTING, LINE=2, ITEM=2, OBJECT=TEXT, POSITION=6.3, SIZE=12, STYLE=BOLD,
21. Laying Out the Report Page
Creating Reports With TIBCO® WebFOCUS Language 1427
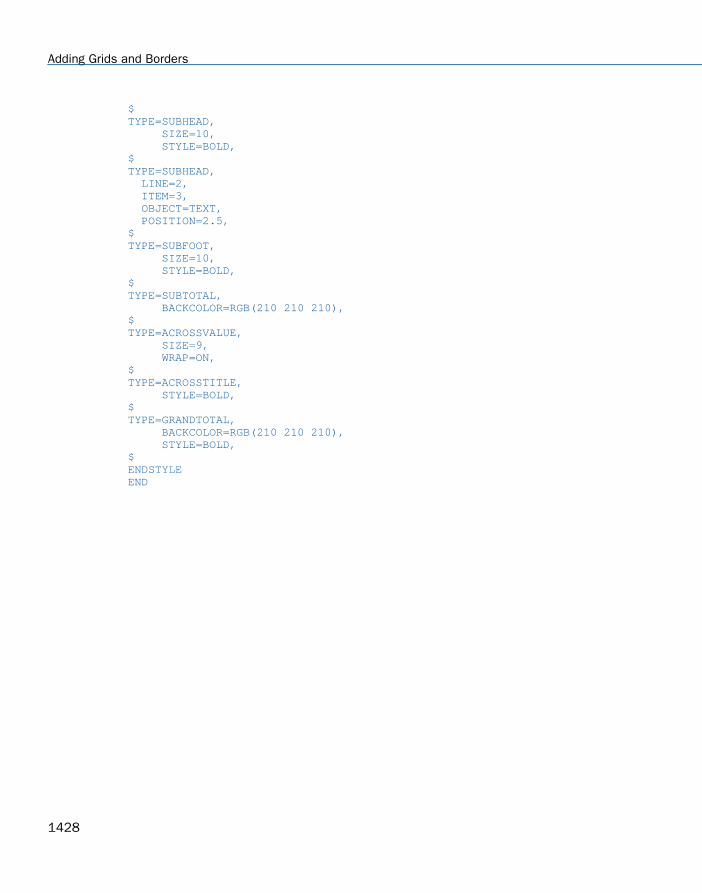
$TYPE=SUBHEAD, SIZE=10, STYLE=BOLD,$TYPE=SUBHEAD, LINE=2, ITEM=3, OBJECT=TEXT, POSITION=2.5,$TYPE=SUBFOOT, SIZE=10, STYLE=BOLD,$TYPE=SUBTOTAL, BACKCOLOR=RGB(210 210 210),$TYPE=ACROSSVALUE, SIZE=9, WRAP=ON,$TYPE=ACROSSTITLE, STYLE=BOLD,$TYPE=GRANDTOTAL, BACKCOLOR=RGB(210 210 210), STYLE=BOLD,$ENDSTYLEEND
Adding Grids and Borders
1428

The output shows that the subheading margins align with the heading, not with the reportbody.
21. Laying Out the Report Page
Creating Reports With TIBCO® WebFOCUS Language 1429

Now change the ALIGN-BORDERS attribute to ALIGN-BORDERS=BODY and rerun the request.The subheadings now align with the report body, as shown in the following image.
Adding Grids and Borders
1430

Example: Aligning Subheading and Subfooting Margins in a Multi-Panel Report
The following request has HEADPANEL=ON for all headings and footings. It also has the ALIGN-BORDERS=BODY attribute:
SET BYPANEL=ONDEFINE FILE GGSALESSHOWCATPROD/A30 = CATEGORY || (' / ' | PRODUCT);ENDTABLE FILE GGSALESSUM DOLLARS/I8M AS ''BY REGIONBY STBY CITYACROSS SHOWCATPROD AS 'Product Sales' ON REGION SUBHEAD" ""Subheading <+0>Region <REGION<+0> "" "ON REGION SUBTOTAL AS '*TOTAL'ON TABLE SUBHEAD"Report Heading"" ""TYPE=REPORT, ALIGN-BORDERS=BODY, HEADPANEL=ON, BORDER=ON, $"HEADING"Page Heading "" "" "" "FOOTING" ""Page Footing<+0>Page <TABPAGENO "ON TABLE SUBFOOT" ""Report Footing"
21. Laying Out the Report Page
Creating Reports With TIBCO® WebFOCUS Language 1431

WHERE CATEGORY NE 'Coffee';ON TABLE SET PAGE-NUM OFF ON TABLE PCHOLD FORMAT PDFON TABLE SET HTMLCSS ONON TABLE SET STYLE * UNITS=IN, SQUEEZE=ON, ORIENTATION=PORTRAIT,$TYPE=REPORT, FONT='ARIAL', SIZE=9, LEFTMARGIN=.75, RIGHTMARGIN=.5, TOPMARGIN=.1, BOTTOMMARGIN=.1, HEADPANEL=ON, ALIGN-BORDERS=BODY, BORDER=ON,$TYPE=TITLE, STYLE=BOLD,$TYPE=TABHEADING, SIZE=12, STYLE=BOLD,$TYPE=TABHEADING, LINE=3, JUSTIFY=CENTER,$TYPE=TABFOOTING, SIZE=12, STYLE=BOLD,$TYPE=HEADING, SIZE=12, STYLE=BOLD,$TYPE=HEADING, IMAGE=smplogo1.gif, POSITION=(+4.6000000 +0.03000000), JUSTIFY=RIGHT,
Adding Grids and Borders
1432
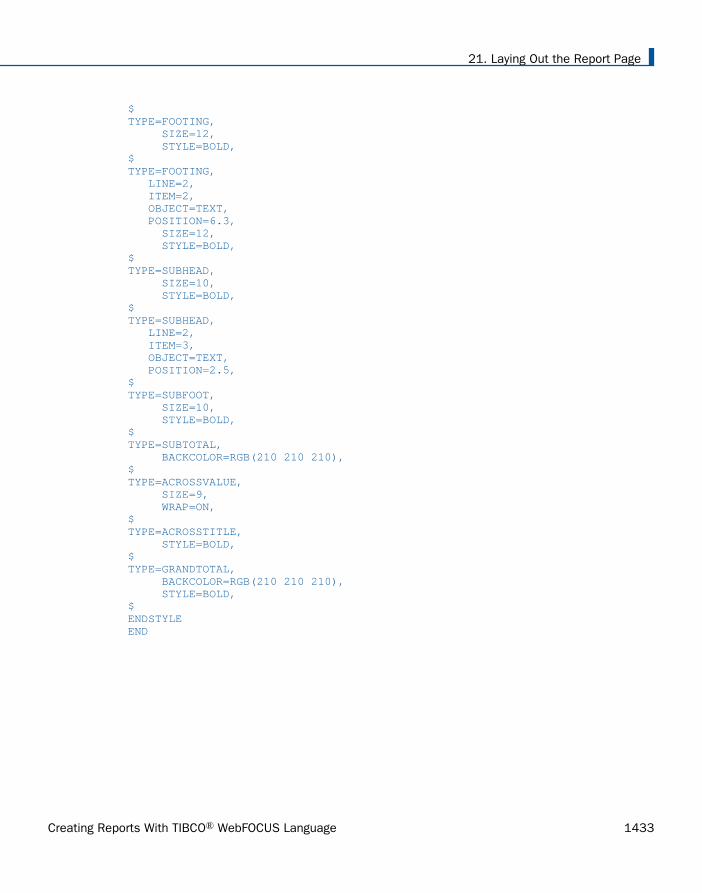
$TYPE=FOOTING, SIZE=12, STYLE=BOLD,$TYPE=FOOTING, LINE=2, ITEM=2, OBJECT=TEXT, POSITION=6.3, SIZE=12, STYLE=BOLD,$TYPE=SUBHEAD, SIZE=10, STYLE=BOLD,$TYPE=SUBHEAD, LINE=2, ITEM=3, OBJECT=TEXT, POSITION=2.5,$TYPE=SUBFOOT, SIZE=10, STYLE=BOLD,$TYPE=SUBTOTAL, BACKCOLOR=RGB(210 210 210),$TYPE=ACROSSVALUE, SIZE=9, WRAP=ON,$TYPE=ACROSSTITLE, STYLE=BOLD,$TYPE=GRANDTOTAL, BACKCOLOR=RGB(210 210 210), STYLE=BOLD,$ENDSTYLEEND
21. Laying Out the Report Page
Creating Reports With TIBCO® WebFOCUS Language 1433

The output shows that the subheadings are aligned with the data on each panel.
Syntax: How to Add and Adjust Grid Lines (PDF or PS)
This syntax applies to a PDF or PS report.
TYPE=type, {HGRID|VGRID}={ON|OFF|HEAVY}, $
where:
type
Identifies the report component to which grid lines are applied. See Identifying a ReportComponent in a WebFOCUS StyleSheet on page 1251 for valid values.
HGRID
Specifies horizontal grid lines.
VGRID
Specifies vertical grid lines.
ON
Applies light grid lines.
OFF
Suppresses grid lines. OFF is the default value.
Adding Grids and Borders
1434

HEAVY
Applies heavy grid lines.
Example: Applying Grid Lines to Report Data (PDF)
This request applies light, horizontal grid lines to report data.
SET ONLINE-FMT = PDFTABLE FILE GGDEMOGHEADING"State Statistics"" "SUM HH AS 'Number of,Households' AVGHHSZ98 AS 'Avg.,Size'MEDHHI98 AS 'Avg.,Income'BY STWHERE ST EQ 'CA' OR 'FL' OR 'NY'ON TABLE SET PAGE-NUM OFFON TABLE SET STYLE * TYPE=DATA, HGRID=ON, $ ENDSTYLEEND
In the PDF report, the lines make it easier to distinguish the data by state:
Defining Borders Around Boxes With PPTX and PDF Formats
In PPTX and PDF formats, the backcolor of a box may be defined independently of the bordercolor.
Borders Without Backcolor
When the border color is defined and there is no backcolor, only the border or outline of thebox is displayed in the border color specified, as shown in the example below.
21. Laying Out the Report Page
Creating Reports With TIBCO® WebFOCUS Language 1435

TABLE FILE GGSALESBY REGION NOPRINTON TABLE PCHOLD FORMAT PPTXON TABLE SET STYLE *TYPE=REPORT, OBJECT=BOX, POSITION=(1 1), DIMENSION=(2 1), BORDER-COLOR=GREEN,$ENDSTYLEEND
The output is shown in the following image.
Backcolor Without Borders
In PPTX format, when a backcolor is defined and there is no border (BORDER-STYLE=NONE),the box retains the color defined for the backcolor.
TABLE FILE GGSALESBY REGION NOPRINTON TABLE PCHOLD FORMAT PPTXON TABLE SET STYLE *TYPE=REPORT, OBJECT=BOX, POSITION=(1 1), DIMENSION=(2 1), BACKCOLOR=GREEN, BORDER-STYLE=NONE, $ENDSTYLEEND
The output is shown in the following image.
In PDF format, a gray outline appears around the backcolor, as shown in the following image.
Border Styles Supported
Border styles, except 3D border styles such as ridged, groove, inset, and outset, are supportedin PPTX and PDF formats.
Defining Borders Around Boxes With PPTX and PDF Formats
1436

TABLE FILE GGSALESBY REGION NOPRINTON TABLE PCHOLD FORMAT PPTXON TABLE SET STYLE *TYPE=REPORT, OBJECT=BOX, POSITION=(1 1), DIMENSION=(2 1), BORDER-COLOR=GREEN, BORDER-STYLE=DASHED, $ENDSTYLEEND
The output is shown in the following image.
Note: When OBJECT=BOX and BORDER-STYLE=DOUBLE is used with FORMAT PPTX andFORMAT PDF in StyleSheet syntax, a solid border, instead of a double border, is generated.
Displaying Superscripts On Data, Heading, and Footing Lines
Superscript characters are supported as a text style in text objects using HTML markup tags.The superscript markup tag is now supported in data columns, headings, and footings inHTML, PDF, PPTX, and PS output formats. Superscript values can be defined within the data,added to virtual fields, or added to text strings displayed in headings and footings.
In order to activate the translation of the HTML markup tags, in the StyleSheet setMARKUP=ON for any report component that will display superscripts. Without this attribute, themarkup tags will be treated as text, not tags.
Note: For XLSX output format, you can use superscript functionality in headings and footingsusing STYLE=SUPERSCRIPT syntax. STYLE=SUPERSCRIPT syntax is ignored for all other outputformats.
Syntax: How to Display Superscripts on Report Data, Heading, and Footing Lines
If the tags are not within the data itself, create a field that contains the text to be used as asuperscript. Also, turn markup tags on for the components that will display superscripts:
In a DEFINE or COMPUTE command, define a field that contains the text to be displayed asa superscript.
For a DEFINE FILE command, the syntax is:
21. Laying Out the Report Page
Creating Reports With TIBCO® WebFOCUS Language 1437

DEFINE FILE ...field/An = <sup>text</sup>;END
For a COMPUTE command or a DEFINE in a Master File, the syntax is:
{COMPUTE|DEFINE} field/An = <sup>text</sup>;
where:
n
Is the length of the string defining the superscript, including the text to be used as thesuperscript and the opening and closing markup tags (<sup> and </sup>).
text
Is the text to be used as the superscript.
In the StyleSheet, set MARKUP=ON for any report component that will display superscripts:
TYPE=component,MARKUP=ON ... ,$
where:
component
Is one of the following report components: DATA, HEADING, FOOTING, SUBHEAD,SUBFOOT, TABHEADING, TABFOOTING.
Example: Displaying Superscripts in Data and Footing Lines in PDF Output
The following request against the GGSALES data source defines two fields that will display assuperscripts. SUP1 and SUP2 consist of the numbers 1 and 2, respectively. SUPCOPYconsists of a copyright symbol. Note that the difference is the syntax as defined for a textvalue as opposed to a HEX value.
The COMPUTE command compares sales dollars to budgeted dollars. If the value calculated isless than a minimum defined, the superscript SUP1 is concatenated after the category name.If the value is greater, SUP2 is concatenated.
The superscript SUPCOPY is used to display the copyright symbol in the footing of the report.
The footing concatenates the superscript fields in front of their explanations.
In the StyleSheet, every component that will display a superscript has the attributeMARKUP=ON.
Displaying Superscripts On Data, Heading, and Footing Lines
1438

DEFINE FILE GGSALESSUP1/A12= '<SUP>1</SUP>';SUP2/A15= '<SUP>2</SUP>';SUPCOPY/A20= '<SUP>'||HEXBYT(169,'A2')||'</SUP>';ENDTABLE FILE GGSALESSUMCOMPUTE PROFIT/D12CM=DOLLARS-BUDDOLLARS; NOPRINTCOMPUTE SHOWCAT/A100=IF PROFIT LE -50000 THEN CATEGORY || SUP1 ELSE IF PROFIT GT 50000 THEN CATEGORY || SUP2 ELSE CATEGORY; AS CategoryBUDDOLLARS/D12CMDOLLARS/D12CMBY REGION BY CATEGORY NOPRINTHEADING"Analysis of Budgeted and Actual Sales"FOOTING"""<SUP1 Dollar sales $50,000 less than budgeted amount.""<SUP2 Dollar sales $50,000 greater than budgeted amount.""""Copyright<SUPCOPY 2012, by Information Builders, Inc " ON TABLE SET HTMLCSS ONON TABLE SET SQUEEZE ONON TABLE SET PAGE-NUM OFFON TABLE PCHOLD FORMAT PDFON TABLE SET STYLE *INCLUDE=IBFS:/FILE/IBI_HTML_DIR/javaassist/intl/EN/ENIADefault_combine.sty,$TYPE=DATA,MARKUP=ON,$TYPE=DATA,COLUMN=N5, COLOR=RED, WHEN=PROFIT LT -50000,$TYPE=DATA,COLUMN=N6, COLOR=GREEN, WHEN=PROFIT GT 50000,$TYPE=HEADING, JUSTIFY=LEFT,$TYPE=FOOTING, MARKUP=ON, JUSTIFY=LEFT,$TYPE=FOOTING, LINE=2,JUSTIFY=LEFT, COLOR=RED,$TYPE=FOOTING, LINE=3,JUSTIFY=LEFT, COLOR=GREEN,$ENDSTYLEEND
21. Laying Out the Report Page
Creating Reports With TIBCO® WebFOCUS Language 1439

The output is:
Displaying Superscripts On Data, Heading, and Footing Lines
1440

Example: Displaying Superscripts in Heading and Footing Lines in XLSX Output
The following request against the GGSALES data source defines superscripts for trademarkand copyright symbols in the heading and footing. COPYRIGHT consists of a copyright symbol.Note the STYLE = SUPERSCRIPT syntax in the heading and footing lines.
DEFINE FILE GGSALESCOPYRIGHT/A1= HEXBYT(169, 'A1');ENDTABLE FILE GGSALESSUM UNITS BY CATEGORY HEADING"Company-Trademark<+0>TM"" ""Company-Copyright<+0><COPYRIGHT" " "FOOTING"Company-Trademark<+0>TM"" ""Company-Copyright<+0><COPYRIGHT" " "ON TABLE PCHOLD FORMAT XLSXON TABLE SET STYLE *TYPE=HEADING, WRAP=OFF, $TYPE=HEADING, LINE=1, ITEM=2, OBJECT=TEXT, STYLE='SUPERSCRIPT+BOLD+ITALIC', COLOR=RED, $ TYPE=HEADING, LINE=3, ITEM=1, OBJECT=FIELD, STYLE='SUPERSCRIPT+BOLD', COLOR=GREEN, $ TYPE=FOOTING, LINE=1, ITEM=2, OBJECT=TEXT, STYLE='SUPERSCRIPT+BOLD+ITALIC', COLOR=RED, $ TYPE=FOOTING, LINE=3, ITEM=1, OBJECT=FIELD, STYLE='SUPERSCRIPT+BOLD', COLOR=GREEN, $ ENDSTYLEEND
21. Laying Out the Report Page
Creating Reports With TIBCO® WebFOCUS Language 1441
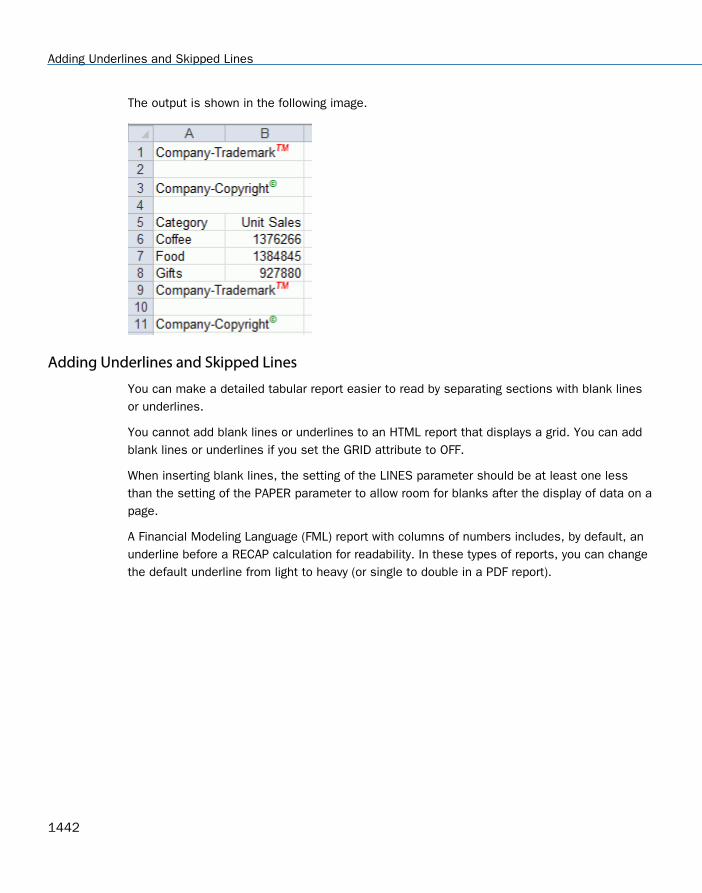
The output is shown in the following image.
Adding Underlines and Skipped Lines
You can make a detailed tabular report easier to read by separating sections with blank linesor underlines.
You cannot add blank lines or underlines to an HTML report that displays a grid. You can addblank lines or underlines if you set the GRID attribute to OFF.
When inserting blank lines, the setting of the LINES parameter should be at least one lessthan the setting of the PAPER parameter to allow room for blanks after the display of data on apage.
A Financial Modeling Language (FML) report with columns of numbers includes, by default, anunderline before a RECAP calculation for readability. In these types of reports, you can changethe default underline from light to heavy (or single to double in a PDF report).
Adding Underlines and Skipped Lines
1442

Reference: Section Separation Features
Feature Description Applies to
SKIP-LINE* Adds a blank line. HTML (requires GRID=OFF)
DHTML
PS
XLSX
EXL2K
TYPE=SKIPLINE Formats a blank line. DHTML
PS
UNDER-LINE* Underlines a sort group. HTML (requires GRID=OFF)
DHTML
PS
TYPE=UNDERLINE Formats an underline. DHTML
PS
STYLE={+|-}UNDERLINE* Adds an underline to areport component, orremoves an underline froma report component otherthan a column title.
HTML
DHTML
PS
XLSX
EXL2K
21. Laying Out the Report Page
Creating Reports With TIBCO® WebFOCUS Language 1443

Feature Description Applies to
STYLE={+|-}EXTUNDERLINE*
Extends the underline to orremoves the underline fromthe entire report column in astyled report.
DHTML
PS
PPT
PPTX
BAR AS '{-|=}'* Selects a single or doubleunderline in an FML report.
For HTML, selects a light orheavy underline in an FMLreport.
HTML
DHTML
PS
XLSX
EXL2K
* Not supported with border.
Syntax: How to Add a Blank Line
Use only one SKIP-LINE per report request.
display_command fieldname SKIP-LINE
or
{ON|BY} fieldname SKIP-LINE [WHEN expression;]
where:
display_command
Is a display command.
fieldname
Is the display or sort field after which a blank line is inserted.
SKIP-LINE used with a display field adds a blank line after every displayed line, in effect,double-spacing a report. Double-spacing is helpful when a report is reviewed, making iteasy for the reader to write comments next to individual lines.
Adding Underlines and Skipped Lines
1444

SKIP-LINE used with a sort field adds a blank line before every change in the value of thatfield. This is one of the only ON conditions that does not have to refer solely to a sort (BY)field.
ON|BY
Is a vertical sort phrase. The terms are synonymous.
WHEN expression
Specifies conditional blank lines in the display of a report as determined by a logicalexpression. See Using Expressions on page 429 for details on expressions.
Example: Adding a Blank Line Between Sort Groups
This request inserts a blank line before every change in value of the sort field EMP_ID.
DEFINE FILE EMPLOYEEINCREASE/D8.2M = .05*CURR_SAL;CURR_SAL/D8.2M=CURR_SAL;NEWSAL/D8.2M=CURR_SAL + INCREASE;END TABLE FILE EMPLOYEEPRINT CURR_SAL OVER INCREASE OVER NEWSALBY LOWEST 4 EMP_ID BY LAST_NAME BY FIRST_NAME ON EMP_ID SKIP-LINE ON TABLE SET PAGE-NUM OFFON TABLE SET ONLINE-FMT PDFEND
21. Laying Out the Report Page
Creating Reports With TIBCO® WebFOCUS Language 1445

The data for each employee stands out and is easy to read:
Syntax: How to Format a Blank Line
TYPE=SKIPLINE, attribute=value, $
where:
attribute
Is a valid StyleSheet attribute.
value
Is the value of the attribute.
Note: This option is supported for PDF, PS, and HTML reports (when used in conjunction withinternal cascading style sheets).
Adding Underlines and Skipped Lines
1446

Example: Adding Color to Blank Lines
In this request, blank lines are formatted to display as silver in the output. The relevantStyleSheet declaration is highlighted in the request.
SET ONLINE-FMT=PDFTABLE FILE CENTINVHEADING"Low Stock Report"" "SUM QTY_IN_STOCK WHERE QTY_IN_STOCK LT 5000BY PRODNAMEON PRODNAME SKIP-LINEON TABLE SET PAGE-NUM OFFON TABLE SET STYLE * TYPE=SKIPLINE, BACKCOLOR=SILVER, $ ENDSTYLEEND
The report is:
21. Laying Out the Report Page
Creating Reports With TIBCO® WebFOCUS Language 1447

Syntax: How to Underline a Sort Group
{ON|BY} fieldname UNDER-LINE [WHEN expression;]
where:
ON|BY
Is a vertical sort phrase. The terms are synonymous.
fieldname
Is the sort field to which the underline applies. UNDER-LINE adds an underline when thevalue of the sort field changes. An underline automatically displays after options such asRECAP or SUB-TOTAL but displays before page breaks.
WHEN expression
Specifies conditional underlines in the display of a report as determined by a logicalexpression. See Using Expressions on page 429 for details on expressions.
Example: Underlining a Sort Group
This request adds an underline when the value of the sort field BANK_NAME changes. It setsthe GRID attribute to OFF, as required by an HTML report.
TABLE FILE EMPLOYEEPRINT EMP_ID AND BANK_ACCT AND LAST_NAMEBY BANK_NAME ON BANK_NAME UNDER-LINE ON TABLE SET PAGE-NUM OFFON TABLE SET STYLE *TYPE=REPORT, GRID=OFF, $ENDSTYLEEND
Adding Underlines and Skipped Lines
1448

The data for each bank stands out and is easy to read:
Syntax: How to Format an Underline
TYPE=UNDERLINE ... COLOR={color|RGB} (r g b), $
where:
UNDERLINE
Denotes underlines generated by ON fieldname UNDER-LINE.
COLOR
Specifies the color of the underline. If the display or output device does not support colors,it substitutes shades of gray. The default value is black.
color
Is one of the supported color values. For a list of supported values, see Color Values in aReport on page 1703.
21. Laying Out the Report Page
Creating Reports With TIBCO® WebFOCUS Language 1449

RGB
Specifies the text color using a mixture of red, green, and blue.
(r g b)
Is the desired intensity of red, green, and blue, respectively. The values are on a scale of 0to 255, where 0 is the least intense and 255 is the most intense.
Note that using the three-color components in equal intensities results in shades of gray.
Note: This option is supported for PDF, PS, and HTML reports (when used in conjunction withinternal cascading style sheets).
Example: Formatting a Sort Group Underline
This request uses UNDERLINE to change the default color of an underline from black to red.
SET ONLINE-FMT = PDFTABLE FILE GGSALESSUM UNITS DOLLARSBY CATEGORY BY PRODUCTHEADING"Sales Report"" "ON CATEGORY UNDER-LINEON TABLE SET PAGE-NUM OFFON TABLE SET STYLE * TYPE=UNDERLINE, COLOR=RED, $ ENDSTYLEEND
The result is an eye-catching separation between sort group values. The online PDF report is:
Adding Underlines and Skipped Lines
1450

Syntax: How to Add or Remove a Report Component Underline
TYPE=type, [subtype,] STYLE=[+|-]UNDERLINE, $
where:
type
Is the report component. For valid values, see Identifying a Report Component in aWebFOCUS StyleSheet on page 1251.
subtype
Are additional attributes, such as COLUMN, ACROSS, or ITEM, needed to identify thereport component. For valid values, see Identifying a Report Component in a WebFOCUSStyleSheet on page 1251.
+
Adds an underline to the inherited text style or specifies a combination of text styles (forexample, STYLE=BOLD+UNDERLINE). This is the default value.
-
Removes an underline from an inherited text style.
Syntax: How to Remove an Underline From a Column Title
This syntax applies to an HTML report with internal cascading style sheet.
TYPE=TITLE, [COLUMN=column,] STYLE=-UNDERLINE, $
where:
COLUMN=column
Specifies a column. For valid values, see Identifying a Report Component in a WebFOCUSStyleSheet on page 1251.
21. Laying Out the Report Page
Creating Reports With TIBCO® WebFOCUS Language 1451

Example: Adding Column Underlines and Removing Column Title Underlines
This request adds underlines to the values of the column CATEGORY and removes the defaultunderlines from the column titles in an HTML report with internal cascading style sheet.
SET HTMLCSS = ON TABLE FILE MOVIESPRINT TITLE DIRECTORBY CATEGORYON TABLE SET PAGE-NUM OFFON TABLE SET STYLE *TYPE=REPORT, GRID=OFF, $ TYPE=TITLE, STYLE=-UNDERLINE, $TYPE=REPORT, COLUMN=CATEGORY, STYLE=UNDERLINE, $ ENDSTYLEEND
The partial report is:
Adding Underlines and Skipped Lines
1452

Syntax: How to Extend an Underline to the Entire Report Column
By default, underlines for column titles on a report extend only from the beginning to the end ofthe column title text. You can extend the underline to the entire report column in styled reportoutput using the EXTUNDERLINE option in your WebFOCUS StyleSheet. EXTUNDERLINE is anoption of the STYLE attribute for the TITLE report component. It is supported for formatsDHTML, PDF, PS, PPT, and PPTX.
TYPE = TITLE, [COLUMN = colspec,] STYLE = [+|-]EXTUNDERLINE ,$
where:
colspec
Is any valid column specification.
+EXTUNDERLINE
Adds the EXTUNDERLINE option to the inherited text style or specifies a combination oftext styles (for example, STYLE=BOLD+UNDERLINE).
-EXTUNDERLINE
Removes the EXTUNDERLINE option from the inherited text style.
Reference: Usage Notes for the EXTUNDERLINE Attribute
HTML format is not supported because the browser calculates the column width andrenders the report.
GRID=ON and EXTUNDERLINE are mutually exclusive since the GRID line spans the width ofthe column. GRID overrides any styling specified for the column title underline.
Example: Extending an Underline to the Entire Report Column
The following request against the GGSALES data source sums dollar sales by city and by date:
DEFINE FILE GGSALES YEAR/YY = DATE; MONTH/M = DATE;END TABLE FILE GGSALES SUM DOLLARS AS 'Sales' BY DATE BY CITYWHERE YEAR EQ 1997 WHERE MONTH FROM 01 TO 05WHERE CITY EQ 'Seattle' OR 'San Francisco' OR 'Los Angeles'ON TABLE SET PAGE NOPAGEON TABLE PCHOLD FORMAT DHTMLEND
21. Laying Out the Report Page
Creating Reports With TIBCO® WebFOCUS Language 1453

The output shows that only the column titles are underlined:
To underline entire columns, generate the output in a format that can be styled and use theEXTUNDERLINE option in the STYLE attribute for the TITLE component. For example, thefollowing request creates DHTML output in which the column titles are in boldface and leftjustified, and the underline is extended to the entire report column:
DEFINE FILE GGSALES YEAR/YY = DATE; MONTH/M = DATE;END TABLE FILE GGSALES SUM DOLLARS AS 'Sales' BY DATE BY CITYWHERE YEAR EQ 1997 WHERE MONTH FROM 01 TO 05WHERE CITY EQ 'Seattle' OR 'San Francisco' OR 'Los Angeles'ON TABLE SET PAGE NOPAGEON TABLE PCHOLD FORMAT DHTMLON TABLE SET STYLE * TYPE=TITLE, STYLE= BOLD +EXTUNDERLINE, JUSTIFY=LEFT, $ ENDSTYLEEND
Adding Underlines and Skipped Lines
1454

The output is:
The following version of the request makes the EXTUNDERLINE and JUSTIFY=LEFT options thedefault for the TITLE component, then makes the Date column title bold and removes theextended underline from that column:
DEFINE FILE GGSALES YEAR/YY = DATE; MONTH/M = DATE;END TABLE FILE GGSALES SUM DOLLARS AS 'Sales' BY DATE BY CITYWHERE YEAR EQ 1997 WHERE MONTH FROM 01 TO 05WHERE CITY EQ 'Seattle' OR 'San Francisco' OR 'Los Angeles'ON TABLE SET PAGE NOPAGEON TABLE PCHOLD FORMAT DHTMLON TABLE SET STYLE * TYPE=TITLE,STYLE= EXTUNDERLINE, JUSTIFY=LEFT ,$ TYPE=TITLE,COLUMN= DATE, STYLE= -EXTUNDERLINE +BOLD ,$ ENDSTYLE END
21. Laying Out the Report Page
Creating Reports With TIBCO® WebFOCUS Language 1455

The output is:
Syntax: How to Change Density of an Underline in a Financial Modeling Language (FML)Report
This syntax applies to an HTML report.
BAR [AS '{-|=}'] OVER
where:
-
Generates a light underline. Enclose the hyphen in single quotation marks. This is thedefault value.
=
Generates a heavy underline. Enclose the equal sign in single quotation marks.
Adding Underlines and Skipped Lines
1456

Example: Changing the Default Underline in a Financial Modeling Language (FML) Report(HTML)
This request changes the default light underline to a heavy underline in an FML report.
TABLE FILE LEDGERSUM AMOUNT FOR ACCOUNT1010 AS 'CASH ON HAND' OVER1020 AS 'DEMAND DEPOSITS' OVER1030 AS 'TIME DEPOSITS' OVER BAR AS '=' OVER RECAP TOTCASH = R1 + R2 + R3;ON TABLE SET PAGE-NUM OFFON TABLE SET STYLE *TYPE=REPORT, GRID=OFF, $ENDSTYLEEND
A heavy underline separates total cash from the detail data, making it stand out:
Example: Changing the Default Underline in a Financial Modeling Language (FML) Report (PDF)
This request changes the default single underline in a PDF report to a double underline.
TABLE FILE LEDGERSUM AMOUNT FOR ACCOUNT1010 AS 'CASH ON HAND' OVER1020 AS 'DEMAND DEPOSITS' OVER1030 AS 'TIME DEPOSITS' OVER BAR AS '=' OVER RECAP TOTCASH = R1 + R2 + R3;ON TABLE SET ONLINE-FMT PDFON TABLE SET PAGE-NUM OFFON TABLE SET STYLE *TYPE=REPORT, GRID=OFF, $ENDSTYLEEND
21. Laying Out the Report Page
Creating Reports With TIBCO® WebFOCUS Language 1457

The output is:
Removing Blank Lines From a Report
The DROPBLNKLINE parameter controls whether blank lines display in a WebFOCUS report.With the options provided, you can affect blank lines that are automatically generated indifferent locations within a report. You can choose to drop the blank lines around subtotals,subheadings and subfootings, as well as certain data lines that may be blank and appear asblank lines on the report output. Additionally, when using borders, you can select to removeblank lines inserted around the headings and footings. You can eliminate these blank linesfrom the report output using the SET DROPBLNKLINE options.
Syntax: How to Control Automatic Blank Lines on Report Output
SET DROPBLNKLINE={OFF|ON|BODY|HEADING|ALL}
or
ON TABLE SET DROPBLNKLINE {OFF|ON|BODY|HEADING|ALL}
where:
OFF
Inserts system-generated blank lines as well as empty data lines. OFF is the default value.
ON|BODY
Removes system-generated blank lines within the body of the report (for example, beforeand after subheads). In addition, certain data lines that may be blank and appear as blanklines on the report output will be removed from the output. BODY is a synonym for ON.
HEADING
Removes the blank lines between headings and titles and between the report body and thefooting. Works in positioned formats (PDF, PS, DHTML, PPT, and PPTX) when a request hasa border or backcolor StyleSheet attribute anywhere in the report.
Removing Blank Lines From a Report
1458

ALL
Provides both the ON and HEADING behaviors.
Reference: Usage Notes for SET DROPBLNKLINE=HEADING
In the positioned report formats (PDF, PS, DHTML, PPT, and PPTX) with borders orbackcolor, the system automatically generates a blank line below the heading and abovethe footing. This is done by design to make bordered lines work together. Generally, therule is that each line is responsible for the border setting for its top and left border.Therefore, the bottom border of the heading is set by the top border of the row beneath it.To ensure that the bottom of the heading border is complete and does not interfere withthe top of the column titles border, a blank filler line is automatically inserted. This fillerline contains the defined bottom border of the heading as its top border. The same is truebetween the bottom of the data and the top of the footing.
DROPBLNKLINE=HEADING removes the filler blank line by defining the height of the fillerline to zero. This causes the bottom border of the heading to become the top border of thecolumn titles. When backcolor is used without borders, this works well to close any blankgaps in color. However, WebFOCUS processing will not remediate between line styles, sousing different border styles between different report elements may create some contentionbetween the border styling definitions. To ensure that you have consistent border linestyling between different report elements, use a single line style between the elements thatpresent together in the report.
DROPBLNKLINE=HEADING is not supported with:
Different border styles between the heading and the column titles or the data and thefooting.
Reports that use the ACROSS sort phrase.
Usage Considerations:
In some reports, FOOTING BOTTOM requires the space added by the system-generatedblank line between the data and the footing in order to present the correct distancebetween the sections. In these instances, the top of the FOOTING BOTTOM may slightlyoverlap the bottom of the data grid. You can resolve this by adding a blank line to thetop of your footing.
21. Laying Out the Report Page
Creating Reports With TIBCO® WebFOCUS Language 1459
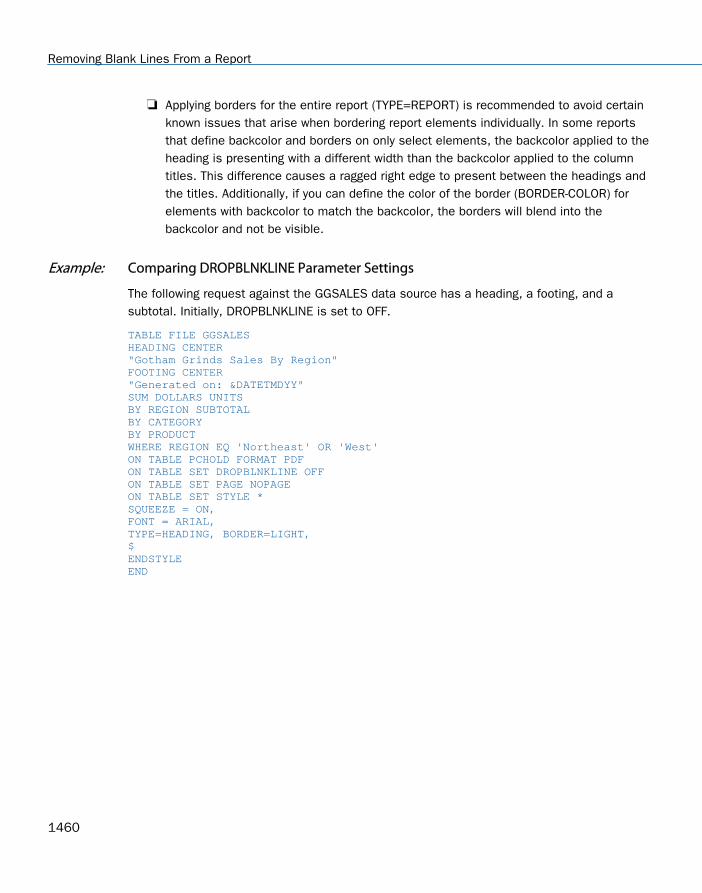
Applying borders for the entire report (TYPE=REPORT) is recommended to avoid certainknown issues that arise when bordering report elements individually. In some reportsthat define backcolor and borders on only select elements, the backcolor applied to theheading is presenting with a different width than the backcolor applied to the columntitles. This difference causes a ragged right edge to present between the headings andthe titles. Additionally, if you can define the color of the border (BORDER-COLOR) forelements with backcolor to match the backcolor, the borders will blend into thebackcolor and not be visible.
Example: Comparing DROPBLNKLINE Parameter Settings
The following request against the GGSALES data source has a heading, a footing, and asubtotal. Initially, DROPBLNKLINE is set to OFF.
TABLE FILE GGSALESHEADING CENTER"Gotham Grinds Sales By Region"FOOTING CENTER"Generated on: &DATETMDYY"SUM DOLLARS UNITSBY REGION SUBTOTALBY CATEGORYBY PRODUCTWHERE REGION EQ 'Northeast' OR 'West'ON TABLE PCHOLD FORMAT PDFON TABLE SET DROPBLNKLINE OFFON TABLE SET PAGE NOPAGEON TABLE SET STYLE *SQUEEZE = ON,FONT = ARIAL,TYPE=HEADING, BORDER=LIGHT,$ENDSTYLEEND
Removing Blank Lines From a Report
1460

The output has a blank line below the heading, above the footing, and above and below thesubtotal lines and the grand total line.
21. Laying Out the Report Page
Creating Reports With TIBCO® WebFOCUS Language 1461
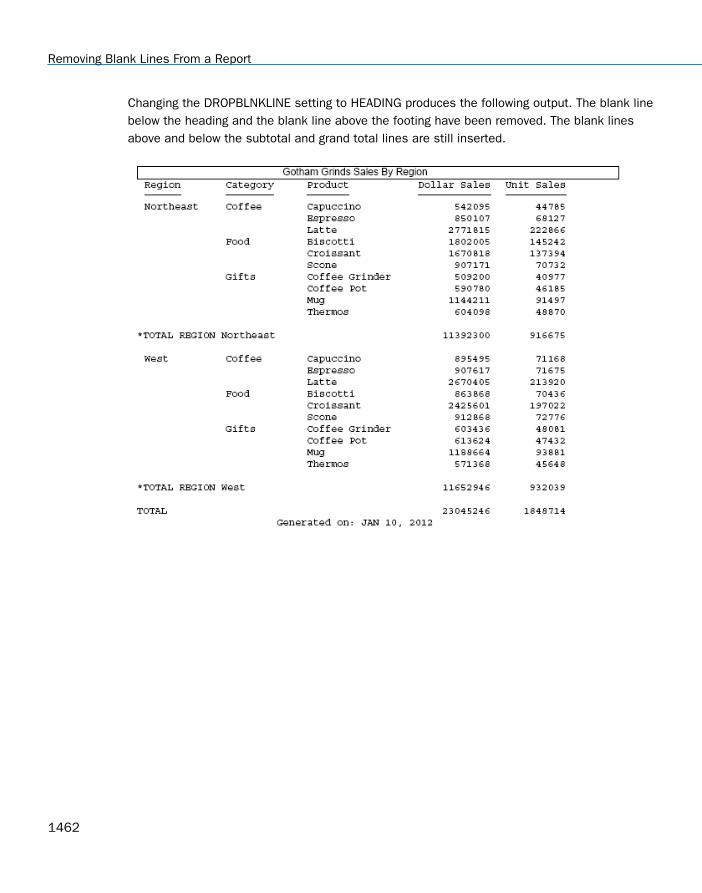
Changing the DROPBLNKLINE setting to HEADING produces the following output. The blank linebelow the heading and the blank line above the footing have been removed. The blank linesabove and below the subtotal and grand total lines are still inserted.
Removing Blank Lines From a Report
1462

Changing the DROPBLNKLINE setting to ON (or BODY) produces the following output in whichthe blank lines above and below the subtotal and grand total lines have been removed, but theblank lines below the heading and above the footing are still inserted.
21. Laying Out the Report Page
Creating Reports With TIBCO® WebFOCUS Language 1463
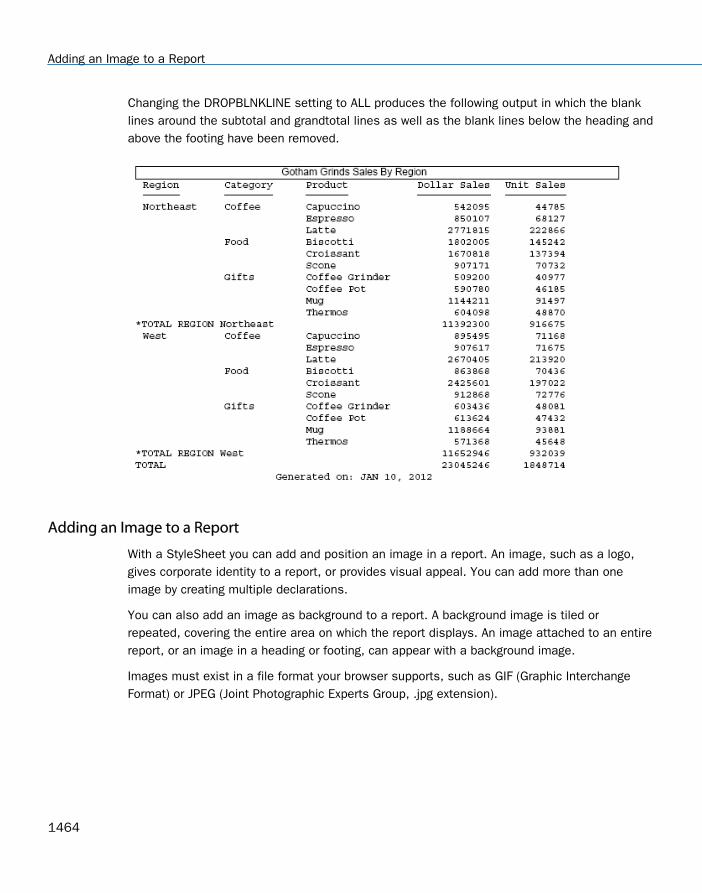
Changing the DROPBLNKLINE setting to ALL produces the following output in which the blanklines around the subtotal and grandtotal lines as well as the blank lines below the heading andabove the footing have been removed.
Adding an Image to a Report
With a StyleSheet you can add and position an image in a report. An image, such as a logo,gives corporate identity to a report, or provides visual appeal. You can add more than oneimage by creating multiple declarations.
You can also add an image as background to a report. A background image is tiled orrepeated, covering the entire area on which the report displays. An image attached to an entirereport, or an image in a heading or footing, can appear with a background image.
Images must exist in a file format your browser supports, such as GIF (Graphic InterchangeFormat) or JPEG (Joint Photographic Experts Group, .jpg extension).
Adding an Image to a Report
1464

Image support with WebFOCUS standard reporting formats
GIF and JPG images are supported in DHTML, HTML, PDF, PS, PPTX, XLSX, and PPTstandard report formats. JPEG images are only supported with HTML standard reportformat. For other report formats, you can change the extension of the image namefrom .jpeg to .jpg, and the image will be displayed in the report output.
PNG images are supported with DHTML, HTML, PPTX, and PDF standard report formats,while WebFOCUS generated SVG charts will display when inserted in HTML, PDF, and PSreport formats.
SVG images are supported only with HTML reports.
Center and right justification of images in PDF reports is only reflected if theJUSTIFY=CENTER or JUSTIFY=RIGHT StyleSheet attribute is explicitly set on the imagedeclaration attribute. By default, if JUSTIFY is not specified in the image declarationattribute, the image is left justified.
Images are not supported in EXL2K standard report format.
Image support in Compound Report syntax
GIF and JPG images are supported in DHTML, PDF, PPTX, and PPT Compound documentsyntax. JPEG images are not supported with any reporting format, but the images will workin these compound formats if the extension is changed from .jpeg to .jpg.
PNG images are supported with DHTML, PPT, PPTX, and PDF Compound documents.
SVG images are not supported with any WebFOCUS reporting format in Compounddocuments, while WebFOCUS generated SVG charts are supported only with PDFCompound documents.
Images are not supported in EXL2K Compound documents.
Note: Images in report components in Compound documents are supported as describedunder Image support with WebFOCUS standard reporting formats. This section, Image support inCompound Report syntax, refers to images inserted in the PAGELAYOUT sections of theCompound syntax.
For PDF, HTML, and DHTML output against data sources that support the Binary Large Object(BLOB) data type (Microsoft SQL Server, DB2, Oracle, Informix, and PostgreSQL, using itsBYTEA data type), an image can be stored in a BLOB field in the data source.
The image must reside on the WebFOCUS Reporting Server in a directory named on EDAPATHor APPPATH. If the file is not on the search path, supply the full path name.
21. Laying Out the Report Page
Creating Reports With TIBCO® WebFOCUS Language 1465

Note: For JPEG files, currently only the .jpg extension is supported. The .jpeg extension is notsupported.
Reference: Browser and Device Support for Images in HTML Documents
Support for presenting images and graphs in HTML and DHTML formatted standard reports andcompound documents is provided using an image embedding facility that allows 64-bit imagesto be encoded within a generated .htm file.
The SET HTMLEMBEDIMG command is designed to ensure that all WebFOCUS reportscontaining images can be accessed from any browser or device. By default, it is set to ON andembeds images within an .htm file.
SET HTMLEMBEDIMG={ON|OFF|AUTO}
where:
ON
Encodes images within the .htm file. ON is the default value, and overrides theHTMLARCHIVE settings.
OFF
Does not embed the image. If HTMLARCHIVE is set to ON, .mht files are generated.
AUTO
Determines which encoding algorithm to use, based on the browser of the client machinethat submits the report request. Where the browser is identified as an Internet Explorerbrowser, or the browser is unknown (such as reports distributed by ReportCaster),WebFOCUS will continue to generate Web Archive files (.mht). For all other browsers,WebFOCUS will encode the image into an HTML file (.htm).
Usage Notes for HTMLEMBEDIMG
When HTMLEMBEDIMG is set to ON (the default setting) and HTMLARCHIVE is set to ON,the HTMLEMBEDIMG ON setting overrides the HTMLARCHIVE ON setting, and an .htm file,in which the image is embedded, is generated.
When HTMLEMBEDIMG is set to ON (the default setting) and HTMLARCHIVE is set to OFF,an .htm file is generated and the image is embedded.
Setting HTMLEMBEDIMG to OFF and enabling HTMLARCHIVE generates an .mht file, whichcontain the encoded image.
When HTMLEMBEDIMG and HTMLARCHIVE are set to OFF, an .html file is generated, butthe image is not embedded.
Adding an Image to a Report
1466

The encoding algorithm that uses 64-bit encoding supported for images less than 32K insize is supported by Internet Explorer 8. For Internet Explorer 8, Information Buildersrecommends continuing to use the .mht format generated by HTMLARCHIVE. In InternetExplorer 9 and higher and browsers other than Internet Explorer, the new algorithm issupported for images of any size. See the browser vendor information to confirm 64-bitencoding support.
Reference: Image Attributes
Attribute Description
IMAGE Adds an image.
IMAGEALIGN Positions an image. This applies only to HTML reports.
POSITION Positions an image.
IMAGEBREAK Controls generation of a line break after an image. This appliesonly to HTML reports without internal cascading style sheets.
SIZE Sizes an image.
ALT Supplies a description of an image for compliance with Sectionaccessibility (Workforce Investment Act of 1998). ALT onlyapplies to HTML reports.
PRESERVERATIO ON specifies that the aspect ratio (ratio of height to width) ofthe image should be preserved when it is scaled to thespecified SIZE. This avoids distorting the appearance of theimage. The image is scaled to the largest size possible withinthe bounds specified by SIZE for which the aspect ratio can bemaintained. Supported for images in PDF and PostScript reportoutput.
BACKIMAGE Adds a background image.
21. Laying Out the Report Page
Creating Reports With TIBCO® WebFOCUS Language 1467

Syntax: How to Add an Image to an HTML Report
This syntax applies to an HTML report. For details on adding an image to a PDF, PS, or HTMLreport with an internal CSS, see How to Add an Image to a PDF, PS, or HTML Report With anInternal Cascading Style Sheet on page 1478.
TYPE={REPORT|heading}, IMAGE={url|(column)} [,IMAGEALIGN=position] [,IMAGEBREAK={ON|OFF}] [,ALT='description'], $
where:
REPORT
Embeds an image in the body of a report. REPORT is the default value.
Note: The IMAGE=(column) option is not supported with TYPE=REPORT.
heading
Embeds an image in a heading or footing. Valid values are TABHEADING, TABFOOTING,HEADING, FOOTING, SUBHEAD, and SUBFOOT.
url
Is the URL for the image file. The image must exist in a separate file in a format that yourbrowser supports, such as GIF or JPEG (.jpg). The file can be on your local web server, oron any server accessible from your network. For details, see Specifying a URL on page1469.
column
Is an alphanumeric field in a request (for example, a display field or a BY field) whosevalue is a URL that points to an image file. Specify a value using the COLUMN attributedescribed in Identifying a Report Component in a WebFOCUS StyleSheet on page 1251.Enclose column in parentheses.
This option enables you to add different images to a heading or footing, depending on thevalue of the field.
IMAGEALIGN = position
Is the position of the image.
Note: IMAGEALIGN is not supported with HTMLCSS=ON. With HTMLCSS=ON, you canposition images within a heading or footing by using the POSITION attribute to specify aposition relative to the upper-left corner of the heading or footing. For more informationabout the POSITION attribute, see How to Add an Image to a PDF, PS, or HTML Report Withan Internal Cascading Style Sheet on page 1478.
Adding an Image to a Report
1468

Valid values are:
TOP where the top right corner of the image aligns with heading or footing text. If the imageis attached to the entire report, it appears on top of the report.
MIDDLE where the image appears in the middle of the heading or footing text. If the imageis attached to the entire report, it appears in the middle of the report.
BOTTOM where the bottom right corner of the image aligns with heading or footing text. Ifthe image is attached to the entire report, it appears at the bottom of the report.
LEFT where the image appears to the left of heading or footing text. If the image isattached to the entire report, it appears to the left of the report.
RIGHT where the image appears to the right of heading or footing text. If the image isattached to the entire report, it appears to the right of the report.
IMAGEBREAK
Controls generation of a line break after the image. Valid values are:
ON which generates a line break after the image so that an element following it (such as,report heading text) appears on the next line.
OFF which suppresses a line break after the image so that an element following it is onthe same line. OFF is the default value.
description
Is a textual description of an image for compliance with Section 508 accessibility. Enclosethe description in single quotation marks.
Reference: Specifying a URL
The following guidelines are the same for IMAGE=url and IMAGE=(column) syntax. In the lattercase, they apply to a URL stored in a data source field.
Specify a URL by:
Supplying an absolute or relative address that points to an image file, for example:
TYPE=TABHEADING,IMAGE=http://www.tibco.com/images/logo_wf3.gif,$TYPE=TABHEADING, IMAGE=/ibi_apps/ibi_html/ggdemo/gotham.gif,$
Using the SET BASEURL parameter to establish a URL that is logically prefixed to allrelative URLs in the request. With this feature, you can add an image by specifying just itsfile name in the IMAGE attribute. For example:
21. Laying Out the Report Page
Creating Reports With TIBCO® WebFOCUS Language 1469

SET BASEURL=http://host:port/...TYPE=REPORT, IMAGE=gotham.gif,$
The following apply:
A base URL must end with a slash (/).
An absolute URL (which begins with http://) overrides a base URL.
A URL is case-sensitive when referring to a UNIX server.
If the name of the image file does not contain an extension, .GIF is used.
Example: Adding a GIF Image to an HTML Report Heading
This request adds the Gotham Grinds logo to a report heading. The logo is in a separate imagefile identified by a relative URL in the IMAGE attribute.
TABLE FILE GGORDERON TABLE SUBHEAD"PRODUCTS ORDERED ON 08/01/96"SUM QUANTITY AS 'Ordered Units' BY PRODUCTWHERE PRODUCT EQ 'Coffee Grinder' OR 'Coffee Pot'WHERE ORDER_DATE EQ '08/01/96'ON TABLE SET PAGE-NUM OFFON TABLE SET STYLE * TYPE=TABHEADING, IMAGE=/IBI_APPS/IBI_HTML/GGDEMO/GOTHAM.GIF, IMAGEBREAK=ON, $ ENDSTYLEEND
Adding an Image to a Report
1470

IMAGEBREAK, set to ON, generates a line break between the logo and the heading text:
Example: Creating a Report Heading With an Embedded JPEG Image
TABLE FILE EMPLOYEEON TABLE SUBHEAD"Employee Salary Information and Courses"" "" "" "" "" "" "" "" "" "PRINT CURR_SAL BY COURSE_NAMEON TABLE SET PAGE-NUM OFFON TABLE SET STYLE *TYPE=REPORT, GRID=OFF, $TYPE=TABHEADING, IMAGE=C:\IBI\APPS\IMAGES\Pencils.jpg, POSITION=(.5 .5), SIZE=(.5 .5), $ENDSTYLEEND
Note: The image used in this request is not distributed with WebFOCUS.
21. Laying Out the Report Page
Creating Reports With TIBCO® WebFOCUS Language 1471

The output is:
Adding an Image to a Report
1472

Example: Using a File Name in a Data Source Field in an HTML Report
The following illustrates how to embed an image in a SUBHEAD, and use a different image foreach value of the BY field on which the SUBHEAD occurs.
DEFINE FILE CARFLAG/A12=DECODE COUNTRY ( 'ENGLAND' 'uk' 'ITALY' 'italy' 'FRANCE' 'france' 'JAPAN' 'japan' );END
TABLE FILE CARPRINT FLAG NOPRINT AND MODEL AS '' BY COUNTRY NOPRINT AS '' BY CAR AS ''WHERE COUNTRY EQ 'ENGLAND' OR 'FRANCE' OR 'ITALY' OR 'JAPAN'ON COUNTRY SUBHEAD" <+0>Cars produced in <ST.COUNTRY"HEADING CENTER"Car Manufacturer Report"" "ON TABLE SET PAGE-NUM OFFON TABLE SET STYLE *TYPE=SUBHEAD, IMAGE=(FLAG), $TYPE=REPORT, GRID=OFF, $TYPE=HEADING, SIZE=12, STYLE=BOLD, $TYPE=SUBHEAD, STYLE=BOLD, $ENDSTYLEEND
21. Laying Out the Report Page
Creating Reports With TIBCO® WebFOCUS Language 1473

The output is:
Adding an Image to a Report
1474
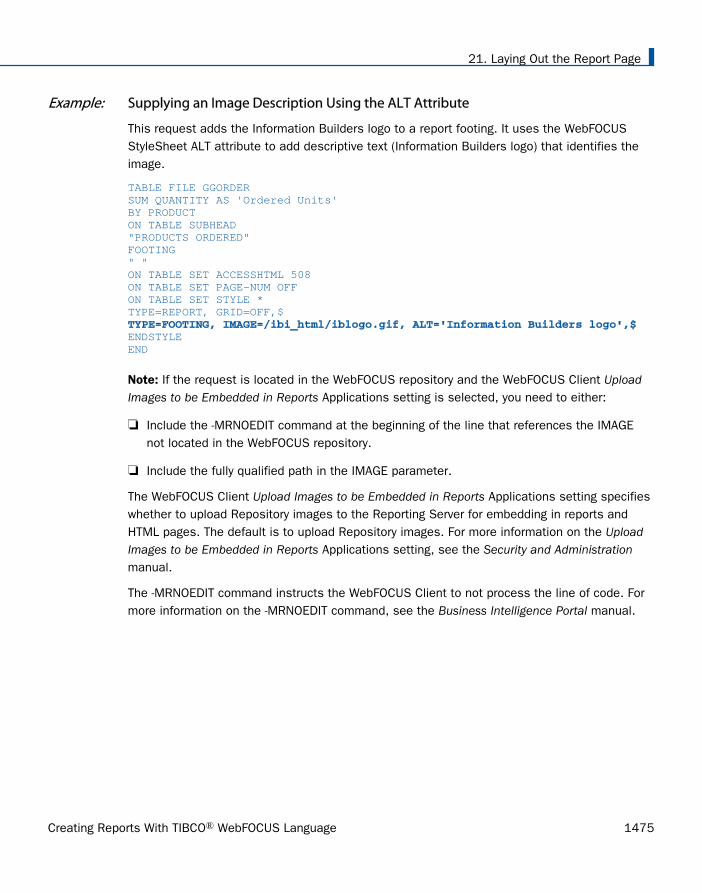
Example: Supplying an Image Description Using the ALT Attribute
This request adds the Information Builders logo to a report footing. It uses the WebFOCUSStyleSheet ALT attribute to add descriptive text (Information Builders logo) that identifies theimage.
TABLE FILE GGORDERSUM QUANTITY AS 'Ordered Units'BY PRODUCTON TABLE SUBHEAD"PRODUCTS ORDERED"FOOTING" "ON TABLE SET ACCESSHTML 508ON TABLE SET PAGE-NUM OFFON TABLE SET STYLE *TYPE=REPORT, GRID=OFF,$ TYPE=FOOTING, IMAGE=/ibi_html/iblogo.gif, ALT='Information Builders logo',$ENDSTYLEEND
Note: If the request is located in the WebFOCUS repository and the WebFOCUS Client UploadImages to be Embedded in Reports Applications setting is selected, you need to either:
Include the -MRNOEDIT command at the beginning of the line that references the IMAGEnot located in the WebFOCUS repository.
Include the fully qualified path in the IMAGE parameter.
The WebFOCUS Client Upload Images to be Embedded in Reports Applications setting specifieswhether to upload Repository images to the Reporting Server for embedding in reports andHTML pages. The default is to upload Repository images. For more information on the UploadImages to be Embedded in Reports Applications setting, see the Security and Administrationmanual.
The -MRNOEDIT command instructs the WebFOCUS Client to not process the line of code. Formore information on the -MRNOEDIT command, see the Business Intelligence Portal manual.
21. Laying Out the Report Page
Creating Reports With TIBCO® WebFOCUS Language 1475

When you run the request, the image displays below the report data, as shown in the followingimage.
When you hover the mouse over the image, the descriptive text displays in a box if yourbrowser image loader is turned off or if the browser does not display images.
WebFOCUS generates the following HTML code for the image:
<IMG SRC="/ibi_html/ibilogo.gif"ALT="Information Builders logo">
Syntax: How to Add a Background Image
This syntax applies to an HTML report.
[TYPE=REPORT,] BACKIMAGE=url, $
where:
TYPE=REPORT
Applies the image to the entire report. Not required, as it is the default.
Adding an Image to a Report
1476

url
Is the URL of a GIF or JPEG file (.jpg). Specify a file on your local web server, or on a serveraccessible from your network.
The URL can be an absolute or relative address. See Image Attributes on page 1467.
When specifying a GIF file, you can omit the file extension.
Example: Adding a Background Image
This request adds a background image to a report. The image file CALM_BKG.GIF resides inthe relative address shown.
TABLE FILE GGSALESSUM UNITS DOLLARSBY CATEGORY BY PRODUCTON TABLE SET PAGE-NUM OFFON TABLE SET STYLE *TYPE=REPORT, STYLE=BOLD, GRID=OFF, $ TYPE=REPORT, BACKIMAGE=/IBI_APPS/IBI_HTML/TEMPLATE/CALM_BKG.GIF, $ ENDSTYLEEND
The background is tiled across the report area:
21. Laying Out the Report Page
Creating Reports With TIBCO® WebFOCUS Language 1477

Syntax: How to Add an Image to a PDF, PS, or HTML Report With an Internal Cascading StyleSheet
This syntax applies to a PDF, PS, or HTML report with an internal cascading style sheet. Theimage can be in a separate file.
A report with an Internal cascading style sheet is an HTML page with an HTML cascading stylesheet (CSS) stored between the style tags within the HTML document.
TYPE={REPORT|heading}, IMAGE={url|file|(column)} [,BY=byfield][,POSITION=([+|-]x [+|-]y )] [,SIZE=(w h)] ,$
where:
REPORT
Embeds an image in the body of a report. The image appears in the background of thereport. REPORT is the default value.
heading
Embeds an image in a heading or footing. Valid values are TABHEADING, TABFOOTING,FOOTING, HEADING, SUBHEAD, and SUBFOOT.
Provide sufficient blank space in the heading or footing so that the image does not overlapthe heading or footing text. Also, you may want to place heading or footing text to the rightof the image using spot markers or the POSITION attribute in the StyleSheet.
url
HTML report with internal cascading style sheet:
Is the absolute or relative address for the image file. The image must exist in a separatefile in a format that your browser supports, such as GIF or JPEG (.jpg). The file can be onyour local web server, or on any server accessible from your network. For details, see Specifying a URL on page 1469.
file
PDF or PS report:
Is the name of the image file. It must reside on the WebFOCUS Reporting Server in adirectory named on EDAPATH or APPPATH. If the file is not on the search path, supply thefull path name.
When specifying a GIF file, you can omit the file extension.
Adding an Image to a Report
1478

column
Is an alphanumeric field in the data source that contains the name of an image file. Usethe COLUMN attribute described in Identifying a Report Component in a WebFOCUSStyleSheet on page 1251. Enclose column in parentheses.
The field containing the file name or image must be a display field or BY field referenced inthe request.
Note that the value of the field is interpreted exactly as if it were typed as the URL of theimage in the StyleSheet. If you omit the suffix, .GIF is supplied by default. SET BASEURLcan be useful for supplying the base URL of the images. If you do that, the value of thefield does not have to include the complete URL.
This syntax is useful, for example, if you want to embed an image in a SUBHEAD, and youwant a different image for each value of the BY field on which the SUBHEAD occurs.
byfield
Is the sort field that generated the subhead or subfoot.
POSITION
Is the starting position of the image.
+|-
Measures the horizontal or vertical distance from the upper-left corner of the reportcomponent in which the image is embedded.
x
Is the horizontal starting position of the image from the upper-left corner of the physicalreport page, expressed in the unit of measurement specified by the UNITS parameter.
Enclose the x and y values in parentheses. Do not include a comma between them.
y
Is the vertical starting position of the image from the upper-left corner of the physicalreport page, expressed in the unit of measurement specified by the UNITS parameter.
SIZE
Is the size of the image. By default, an image is added at its original size.
21. Laying Out the Report Page
Creating Reports With TIBCO® WebFOCUS Language 1479

w
Is the width of the image, expressed in the unit of measurement specified by the UNITSparameter.
Enclose the w and h values in parentheses. Do not include a comma between them.
h
Is the height of the image, expressed in the unit of measurement specified by the UNITSparameter.
Example: Adding a GIF Image to an HTML Report With Internal Cascading Style Sheet
A URL locates the image file GOTHAM.GIF on a server named WEBSRVR1. The TYPE attributeadds the image to the report heading. POSITION places the image one-quarter inch horizontallyand one-tenth inch vertically from the upper-left corner of the report page. The image is oneinch wide and one inch high as specified by SIZE.
SET HTMLCSS = ONTABLE FILE GGSALESSUM UNITS BY PRODUCTON TABLE SUBHEAD"REPORT ON UNITS SOLD"" "" "" "" "" "ON TABLE SET PAGE-NUM OFFON TABLE SET STYLE *TYPE=REPORT, GRID=OFF, $ TYPE=TABHEADING, IMAGE=HTTP://WEBSRVR1/IBI_APPS/IBI_HTML/GGDEMO/GOTHAM.GIF, POSITION=(.25 .10), SIZE=(1 1), $ ENDSTYLEEND
Adding an Image to a Report
1480

The company logo is positioned and sized in the report heading:
Example: Adding a GIF Image to a PDF Report
The image file for this example is GOTHAM.GIF. The POSITION attribute places the image one-quarter inch horizontally and one-quarter vertically from the upper-left corner of the report page.The image is one-half inch wide and one-half inch high as specified by SIZE.
SET ONLINE-FMT = PDFTABLE FILE GGSALESSUM UNITS BY PRODUCTON TABLE SUBHEAD"Report on Units Sold"" "" "" "" "" "ON TABLE SET PAGE-NUM OFFON TABLE SET STYLE * TYPE=TABHEADING, IMAGE=GOTHAM.GIF, POSITION=(.25 .25), SIZE=(.5 .5), $ ENDSTYLEEND
21. Laying Out the Report Page
Creating Reports With TIBCO® WebFOCUS Language 1481

The report is:
Example: Adding a PNG Image to a PDF Report
The image file for this sample is Ibi_logo.png. The POSITION attribute places the image to theupper-left corner of the report page. The image is one inch wide and half an inch high, asspecified by SIZE.
SET HTMLCSS = ONTABLE FILE GGSALESSUM UNITS BY PRODUCTON TABLE SUBHEAD"REPORT ON UNITS SOLD"" "" "" "" "" "ON TABLE SET PAGE-NUM OFFON TABLE PCHOLD FORMAT PDFON TABLE SET STYLE *TYPE=REPORT, GRID=OFF, $ TYPE=TABHEADING, IMAGE=Ibi_logo.png, POSITION=(0 .30), SIZE=(1 0.5), $ ENDSTYLEEND
Adding an Image to a Report
1482

The report is:
Syntax: How to Add an Image From a BLOB Field to a PDF, DHTML, or HTML Report
For PDF, HTML, and DHTML output against data sources that support the Binary Large Object(BLOB) data type (Microsoft SQL Server, DB2, Oracle, Informix, and PostgreSQL using itsBYTEA data type), an image can be stored in a BLOB field in the data source.
WebFOCUS StyleSheets used to produce report output in PDF, HTML, or DHTML format canaccess a BLOB field as an image source when an instance of the BLOB field contains an exactbinary copy of a GIF or JPG image. HTML and DHTML reports also support PNG images. Imagesof different formats (GIF, JPG, PNG) can be mixed within the same BLOB field. WebFOCUS candetermine the format from the header of the image. The image can be inserted in reportcolumns, headings, footings, subheadings, and subfootings.
The BLOB field must be referenced in a PRINT or LIST command in the request (aggregation isnot supported). Reports containing BLOB images are supported as components in CoordinatedCompound Reports.
With the following SET commands, BLOB images will work for both HTML and DHTML in allbrowsers:
SET HTMLEMBEDIMG=AUTO.
SET HTMLARCHIVE=ON (required to support Internet Explorer with images larger than 32K).
SET BASEURL='' (required to make embedded images work as it overrides the defaultsetting sent from the WebFOCUS Client).
21. Laying Out the Report Page
Creating Reports With TIBCO® WebFOCUS Language 1483

SET HTMLCSS=ON (required for image positioning in subheads in HTML reports). SettingHTMLCSS=ON creates an HTML report with an Internal cascading style sheet. A report withan Internal cascading style sheet is an HTML page with an HTML cascading style sheet(CSS) stored between the style tags within the HTML document.
TYPE={REPORT|heading}, IMAGE={url|file|(column)} [,BY=byfield][,POSITION=([+|-]x [+|-]y )] [,SIZE=(w h)] [,PRESERVERATIO={ON|OFF}],$
TYPE=DATA, COLUMN=imagefield, IMAGE=(imagefield), SIZE=(wh)[,PRESERVERATIO={ON|OFF}] ,$
where:
REPORT
Embeds an image in the body of a report. The image appears in the background of thereport. REPORT is the default value (not supported for images stored in BLOB fields, whichare supported for PDF output).
heading
Embeds an image in a heading or footing. Valid values are FOOTING, HEADING, SUBHEAD,and SUBFOOT.
If the image is to be embedded in a heading, subheading, footing, or subfooting ratherthan a column, the StyleSheet declaration is responsible for placing the image in theheading, subheading, footing, or subfooting. To make the BLOB image accessible to theStyleSheet, the BLOB field must be referenced in the PRINT or LIST command with theNOPRINT option. Do not reference the BLOB field name in the heading or footing itself.
Provide sufficient blank space in the heading or footing so that the image does not overlapthe heading or footing text. Also, you may want to place heading or footing text to the rightof the image using spot markers or the POSITION attribute in the StyleSheet.
file
Is the name of the image file. It must reside on the WebFOCUS Reporting Server in adirectory named on EDAPATH or APPPATH. If the file is not on the search path, supply thefull path name.
When specifying a GIF file, you can omit the file extension.
Adding an Image to a Report
1484

column
Is a BLOB field in the data source that contains an exact binary copy of a GIF or JPGimage. HTML and DHTML formats also support images in PNG format. Images of differentformats (GIF, JPG, PNG) can be mixed within the same BLOB field. WebFOCUS candetermine the format from the header of the image. The image can be inserted in reportcolumns, headings, footings, subheadings and subfootings. Use the COLUMN attributedescribed in Identifying a Report Component in a WebFOCUS StyleSheet on page 1251.Enclose column in parentheses.
The field containing the file name or image must be a display field or BY field referenced inthe request.
byfield
Is the sort field that generated the subhead or subfoot.
imagefield
Is any valid column reference for the BLOB field that contains the image. Note that theBLOB field must be referenced in a PRINT or LIST command in the request.
If omitted, the default size is 1 inch by 1 inch. The width of the column and the spacingbetween the lines is automatically adjusted to accommodate the image.
POSITION
Is the starting position of the image.
+|-
Measures the horizontal or vertical distance from the upper-left corner of the reportcomponent in which the image is embedded.
x
Is the horizontal starting position of the image from the upper-left corner of the physicalreport page, expressed in the unit of measurement specified by the UNITS parameter.
Enclose the x and y values in parentheses. Do not include a comma between them.
y
Is the vertical starting position of the image from the upper-left corner of the physicalreport page, expressed in the unit of measurement specified by the UNITS parameter.
SIZE
Is the size of the image. By default, an image is added at its original size. Note thatimages stored in BLOB fields are supported only for PDF, HTML, and DHTML output.
21. Laying Out the Report Page
Creating Reports With TIBCO® WebFOCUS Language 1485

w
Is the width of the image, expressed in the unit of measurement specified by the UNITSparameter.
Enclose the w and h values in parentheses. Do not include a comma between them.
h
Is the height of the image, expressed in the unit of measurement specified by the UNITSparameter.
If SIZE is omitted, the original dimensions of the image are used (any GIF, JPG, or PNGimage has an original, unscaled size based on the dimensions of its bitmap).
[PRESERVERATIO={ON|OFF}]
Not supported for images in PNG format. PRESERVERATIO=ON specifies that the aspectratio (ratio of height to width) of the image should be preserved when it is scaled to thespecified SIZE. This avoids distorting the appearance of the image. The image is scaled tothe largest size possible within the bounds specified by SIZE for which the aspect ratio canbe maintained. Supported for PDF and PS output. OFF does not maintain the aspect ratio.OFF is the default value.
The actual size of an image stored in a BLOB field may vary from image to image, andscaling the images to a designated size allows them to better fit into a columnar report.Note: Images stored in a BLOB field are supported only for PDF, HTML, and DHTML output.
Example: Inserting an Image From a BLOB Field Into a Report Column
The Microsoft SQL Server data source named retaildetail contains product information for asports clothing and shoe retailer. The Microsoft SQL Server data source named retailimagehas the same product ID field as retaildetail and has an image of each product stored in afield named prodimage whose data type is BLOB.
Adding an Image to a Report
1486

The following Master File describes the Microsoft SQL Server data source named retaildetail.
FILENAME=RETAILDETAIL, SUFFIX=SQLMSS , $ SEGMENT=SEG01, SEGTYPE=S0, $ FIELDNAME=FOCLIST, ALIAS=FOCLIST, USAGE=I5, ACTUAL=I4, $ FIELDNAME=PRODUCTID, ALIAS=ProductId, USAGE=A5, ACTUAL=A5, MISSING=ON, $ FIELDNAME=DEPARTMENT, ALIAS=Department, USAGE=A10, ACTUAL=A10, MISSING=ON, $ FIELDNAME=CATEGORY, ALIAS=Category, USAGE=A30, ACTUAL=A30, MISSING=ON, $ FIELDNAME=SPORTS, ALIAS=Sports, USAGE=A30, ACTUAL=A30, MISSING=ON, $ FIELDNAME=GENDER, ALIAS=Gender, USAGE=A10, ACTUAL=A10, MISSING=ON, $ FIELDNAME=BRAND, ALIAS=Brand, USAGE=A25, ACTUAL=A25, MISSING=ON, $ FIELDNAME=STYLE, ALIAS=Style, USAGE=A25, ACTUAL=A25, MISSING=ON, $ FIELDNAME=COLOR, ALIAS=Color, USAGE=A25, ACTUAL=A25, MISSING=ON, $ FIELDNAME=NAME, ALIAS=Name, USAGE=A80, ACTUAL=A80, MISSING=ON, $ FIELDNAME=DESCRIPTION, ALIAS=Description, USAGE=A1000, ACTUAL=A1000, MISSING=ON, $ FIELDNAME=PRICE, ALIAS=Price, USAGE=D7.2, ACTUAL=D8, MISSING=ON, $
The following Master File describes the Microsoft SQL Server data source named retailimage,which has the same product ID field as retaildetail and has an image of each product stored ina field named prodimage whose data type is BLOB.
FILENAME=RETAILIMAGE, SUFFIX=SQLMSS , $ SEGMENT=RETAILIMAGE, SEGTYPE=S0, $ FIELDNAME=PRODUCTID, ALIAS=PRODUCTID, USAGE=A5, ACTUAL=A5, $ FIELDNAME=PRODIMAGE, ALIAS=F02BLOB50000, USAGE=BLOB, ACTUAL=BLOB, MISSING=ON, $
21. Laying Out the Report Page
Creating Reports With TIBCO® WebFOCUS Language 1487

The following request joins the two data sources and prints product names and prices with thecorresponding image. The output is generated in DHTML format.
-* Rel 7705 DHTML and HTML supports including Image stored in -* BLOB field in report column, heading, footing, subhead, or -* subfoot-* Rel 769 supports PDF formatJOIN PRODUCTID IN RETAILDETAIL TO PRODUCTID IN RETAILIMAGETABLE FILE RETAILDETAILHEADING CENTER"Product List"" "PRINT NAME/A20 PRICE PRODIMAGE AS 'PICTURE'BY PRODUCTID NOPRINTBY NAME NOPRINTON NAME UNDER-LINEON TABLE SET PAGE NOPAGE-**************************-* Lines between asterisk lines required for BLOB image support -* for HTML and DHTML formats.ON TABLE SET HTMLEMBEDIMG AUTO-* Required to support IE8 with images larger than 32KON TABLE SET HTMLARCHIVE ON-*Required for image positioning in subheads in HTML reportsON TABLE SET HTMLCSS ON -**************************ON TABLE PCHOLD FORMAT DHTMLON TABLE SET STYLE *TYPE=REPORT,COLOR=BLUE,FONT=ARIAL, GRID=OFF,$TYPE=HEADING, SIZE = 18, COLOR=RED,$TYPE=DATA,COLUMN=PRODIMAGE,IMAGE=(PRODIMAGE),SIZE=(1 1),$ENDSTYLEEND
The image is placed in the report column using the following StyleSheet declaration, whichnames the image field, and establishes the size and position in the column for the image.
TYPE=DATA,COLUMN=PRODIMAGE,IMAGE=(PRODIMAGE),SIZE=(1 1),$
Adding an Image to a Report
1488

The partial output shows that DHTML format preserves the specified spacing.
21. Laying Out the Report Page
Creating Reports With TIBCO® WebFOCUS Language 1489

The following request generates the output in HTML format.
-* Rel 7705 DHTML and HTML supports including Image stored in -* BLOB field in report column, heading, footing, subhead, or-* subfoot-* Rel 769 supports PDF formatJOIN PRODUCTID IN RETAILDETAIL TO PRODUCTID IN RETAILIMAGETABLE FILE RETAILDETAILHEADING CENTER"Product List"" "PRINT NAME/A20 PRICE PRODIMAGE AS 'PICTURE'BY PRODUCTID NOPRINTBY NAME NOPRINTON NAME UNDER-LINEON TABLE SET PAGE NOPAGE-**************************-* Lines between asterisk lines required for BLOB image support -* for HTML and DHTML formats.ON TABLE SET HTMLEMBEDIMG AUTO-* Required to support IE8 with images larger than 32KON TABLE SET HTMLARCHIVE ON-*Required for image positioning in subheads in HTML reportsON TABLE SET HTMLCSS ON -**************************ON TABLE PCHOLD FORMAT HTMLON TABLE SET STYLE *TYPE=REPORT,COLOR=BLUE, GRID=OFF, FONT=ARIAL,$TYPE=HEADING, SIZE = 18, COLOR=RED,$TYPE=DATA,COLUMN=PRODIMAGE,IMAGE=(PRODIMAGE),SIZE=(1 1),$ENDSTYLEEND
Adding an Image to a Report
1490

The partial output shows that the spacing is different because the browser removes blankspaces for HTML report output.
21. Laying Out the Report Page
Creating Reports With TIBCO® WebFOCUS Language 1491

The following request generates the report output in PDF format.
-* Rel 7705 DHTML and HTML supports including Image stored in -* BLOB field in report column, heading, footing, subhead, or -* subfoot-* Rel 769 supports PDF formatJOIN PRODUCTID IN RETAILDETAIL TO PRODUCTID IN RETAILIMAGETABLE FILE RETAILDETAILHEADING CENTER"Product List"" "PRINT NAME/A20 PRICE PRODIMAGE AS 'PICTURE'BY PRODUCTID NOPRINTBY NAME NOPRINTON NAME UNDER-LINEON TABLE SET PAGE NOPAGE-**************************-* Lines between asterisk lines required for BLOB image support -* for HTML and DHTML formats.ON TABLE SET HTMLEMBEDIMG AUTO-* Required to support IE8 with images larger than 32KON TABLE SET HTMLARCHIVE ON-*Required for image positioning in subheads in HTML reportsON TABLE SET HTMLCSS ON -**************************ON TABLE PCHOLD FORMAT PDFON TABLE SET STYLE *TYPE=REPORT,COLOR=BLUE, GRID=OFF,$TYPE=HEADING, SIZE = 18, FONT = ARIAL, COLOR=RED,$TYPE=DATA,COLUMN=PRODIMAGE,IMAGE=(PRODIMAGE),SIZE=(1 1),$ENDSTYLEEND
Adding an Image to a Report
1492

The PDF partial output preserves specified spacing providing results similar to DHTML output.
21. Laying Out the Report Page
Creating Reports With TIBCO® WebFOCUS Language 1493

Example: Inserting an Image From a BLOB Field Into a Subheading
The Microsoft SQL Server data source named retaildetail contains product information for asports clothing and shoe retailer. The Microsoft SQL Server data source named retailimagehas the same product ID field as retaildetail and has an image of each product stored in afield named prodimage whose data type is BLOB.
The following request joins the two data sources and prints product images in a subheading.The output is generated in DHTML format. It can also be generated in HTML or PDF format.
-* Rel 7705 DHTML and HTML supports including Image stored in-* BLOB field in HTML report column, heading, footing, subhead,-* or subfoot-* Rel 769 supports PDF format-*SET BASEURL='' - Required for embedded images to work. Overrides default-* setting from WF Client.SET BASEURL='' JOIN PRODUCTID IN RETAILDETAIL TO PRODUCTID IN RETAILIMAGETABLE FILE RETAILDETAILHEADING CENTER"Product Catalog"" "PRINT NAME NOPRINT PRODIMAGE NOPRINTBY PRODUCTID NOPRINTON PRODUCTID SUBHEAD""" ID: <10<PRODUCTID "" Name: <10<NAME "" Price: <7<PRICE "" Image: """""""""""ON TABLE SET PAGE NOPAGE
-**************************-* Lines between asterisk lines required for BLOB image support -* for HTML and DHTML formats.ON TABLE SET HTMLEMBEDIMG AUTO-* Required to support IE8 with images larger than 32KON TABLE SET HTMLARCHIVE ON-*Required for image positioning in subheads in HTML reportsON TABLE SET HTMLCSS ON -**************************ON TABLE PCHOLD FORMAT DHTMLON TABLE SET STYLE *TYPE=REPORT,COLOR=BLUE,FONT = ARIAL,$TYPE=HEADING, COLOR = RED, SIZE = 16, JUSTIFY=CENTER,$TYPE=SUBHEAD,BY=PRODUCTID,IMAGE=(PRODIMAGE),SIZE=(1 1), POSITION=(+2 +1),$ENDSTYLEEND
Adding an Image to a Report
1494

The partial output is.
21. Laying Out the Report Page
Creating Reports With TIBCO® WebFOCUS Language 1495

Example: Sizing an Image From a BLOB Field
The Microsoft SQL Server data source named retaildetail contains product information for asports clothing and shoe retailer. The Microsoft SQL Server data source named retailimagehas the same product ID field as retaildetail and has an image of each product stored in afield named prodimage whose data type is BLOB.
The following request joins the two data sources and displays the same image on threecolumns of output using different sizes and different PRESERVERATIO settings. Note thatPRESERVERATIO=ON is not supported with images in PNG format.
The output is generated in DHTML format. It can also be generated in HTML or PDF format.
-* Rel 7705 DHTML and HTML supports including Image stored in-* BLOB field in report column, heading, footing, subhead, or-* subfoot-* Rel 769 supports PDF formatJOIN PRODUCTID IN RETAILDETAIL TO PRODUCTID IN RETAILIMAGETABLE FILE RETAILDETAILPRINT PRODIMAGE AS '' PRODIMAGE AS '' PRODIMAGE AS ''BY STYLE NOPRINTWHERE NAME CONTAINS 'Pant' OR 'Tank'ON STYLE UNDER-LINEON TABLE SET PAGE NOPAGE-**************************-* Lines between asterisk lines required for BLOB image support -* for HTML and DHTML formats.ON TABLE SET HTMLEMBEDIMG AUTO-* Required to support IE8 with images larger than 32KON TABLE SET HTMLARCHIVE ON-*Required for image positioning in subheads in HTML reportsON TABLE SET HTMLCSS ON -**************************ON TABLE PCHOLD FORMAT DHTMLON TABLE SET STYLE *TYPE=REPORT,COLOR=BLUE,FONT = ARIAL,$TYPE=DATA,COLUMN=P1,IMAGE=(PRODIMAGE),SIZE=(.75 .75),$TYPE=DATA,COLUMN=P2,IMAGE=(PRODIMAGE),SIZE=(.75 1),PRESERVERATIO=ON,$TYPE=DATA,COLUMN=P3,IMAGE=(PRODIMAGE),SIZE=(.75 1),PRESERVERATIO=OFF,$ENDSTYLEEND
Note that PRESERVERATIO=OFF is specified for the second column to preserve the imageheight and width ratio for that column even though the styling SIZE height specifies a differentvalue than the first column image styling. In addition, PRESERVERATIO=OFF is specified for thethird column, so for that column the image height to width ratio is not preserved and isrendered as specified by the styling SIZE height and width values specified in the request(FEX).
Adding an Image to a Report
1496

The partial output follows.
Example: Inserting an Image From a BLOB Field in a Summary Report
In order to insert an image from a BLOB field in a report that displays summary data, you mustinclude two display commands in the request, a SUM command for the summary informationand a PRINT or LIST command for displaying the image and any other detail data.
21. Laying Out the Report Page
Creating Reports With TIBCO® WebFOCUS Language 1497
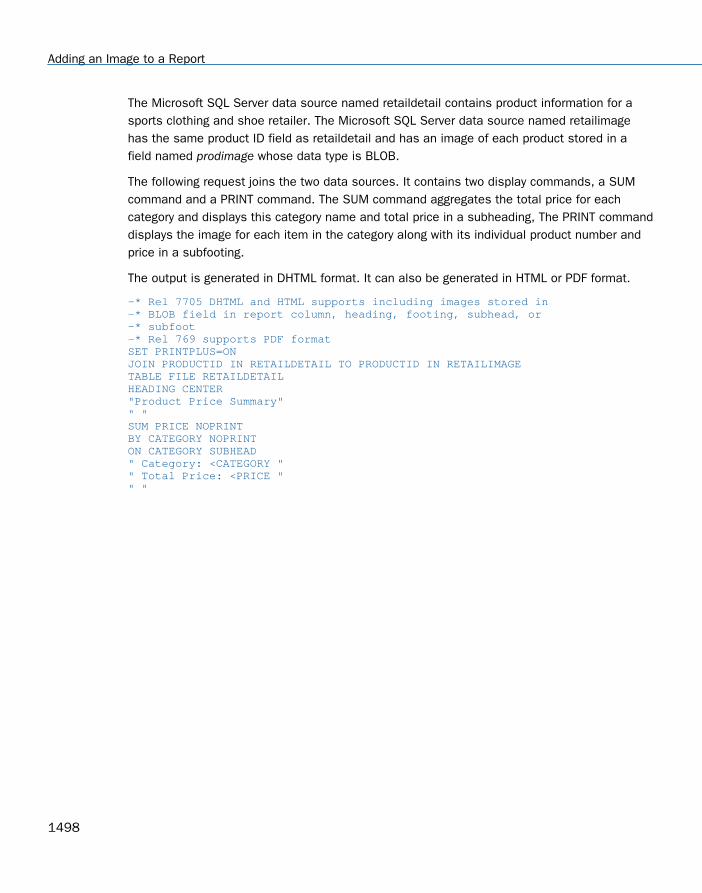
The Microsoft SQL Server data source named retaildetail contains product information for asports clothing and shoe retailer. The Microsoft SQL Server data source named retailimagehas the same product ID field as retaildetail and has an image of each product stored in afield named prodimage whose data type is BLOB.
The following request joins the two data sources. It contains two display commands, a SUMcommand and a PRINT command. The SUM command aggregates the total price for eachcategory and displays this category name and total price in a subheading, The PRINT commanddisplays the image for each item in the category along with its individual product number andprice in a subfooting.
The output is generated in DHTML format. It can also be generated in HTML or PDF format.
-* Rel 7705 DHTML and HTML supports including images stored in -* BLOB field in report column, heading, footing, subhead, or-* subfoot-* Rel 769 supports PDF formatSET PRINTPLUS=ONJOIN PRODUCTID IN RETAILDETAIL TO PRODUCTID IN RETAILIMAGETABLE FILE RETAILDETAILHEADING CENTER"Product Price Summary"" "SUM PRICE NOPRINTBY CATEGORY NOPRINTON CATEGORY SUBHEAD " Category: <CATEGORY "" Total Price: <PRICE "" "
Adding an Image to a Report
1498

PRINT PRICE NOPRINT PRODIMAGE NOPRINTBY CATEGORY NOPRINTBY PRODUCTID NOPRINTON PRODUCTID SUBFOOT" " " "" "" " " "" "" Product #: <PRODUCTID "" Name: <NAME "" Price: <FST.PRICE "ON TABLE SET PAGE NOPAGE-**************************-* Lines between asterisk lines required for BLOB image support -* for HTML and DHTML formats.ON TABLE SET HTMLEMBEDIMG AUTO-* Required to support IE8 with images larger than 32KON TABLE SET HTMLARCHIVE ON-*Required for image positioning in subheads in HTML reports]ON TABLE SET HTMLCSS ON -**************************ON TABLE PCHOLD FORMAT DHTMLON TABLE SET STYLE *TYPE=REPORT,COLOR=BLUE,FONT=ARIAL,$TYPE=HEADING, COLOR=RED, SIZE=14, STYLE=BOLD, JUSTIFY=CENTER,$TYPE=SUBHEAD, COLOR=RED, SIZE=12, STYLE=BOLD, JUSTIFY=CENTER,$TYPE=SUBFOOT,BY=PRODUCTID,IMAGE=(PRODIMAGE),SIZE=(1 1), POSITION=(0 0),$TYPE=SUBFOOT,BY=PRODUCTID,OBJECT=FIELD, ITEM=1, WRAP=5,$ENDSTYLEEND
21. Laying Out the Report Page
Creating Reports With TIBCO® WebFOCUS Language 1499

The output for the first category is:
Adding an Image to a Report
1500

Reference: File Size and Compression Considerations For Images in BLOB Fields
The actual size of an image stored in the BLOB field may vary from image to image, andscaling the images to a designated size allows them to better fit into a columnar report.
Files that contain many images can be large. Scaling the images to a smaller size using theSIZE attribute does not decrease the size of the file. Note also that using SETFILECOMPRESS=ON will not reduce the size of images in a PDF file, since images are alreadysaved in compressed form.
Associating Bar Graphs With Report Data
To make PDF, HTML, DHTML, PPTX, PPT, and PS reports more powerful, you can insert visualrepresentations of selected data directly into the report output. These visual representationsare in the form of vertical or horizontal bar graphs that make relationships and trends amongdata more obvious. You can add the following:
Vertical Bar Graph. You can apply a vertical bar graph to report columns associated with anACROSS sort field. The report output displays a vertical bar graph in a new row above theassociated data values, as shown in the following image.
Bar graphs that emanate above the zero line represent positive values, while bar graphsthat emanate below the zero line represent negative values.
To see how each of these types of reports is generated, see the example following How toAssociate Data Visualization Bar Graphs With Report Columns on page 1506.
21. Laying Out the Report Page
Creating Reports With TIBCO® WebFOCUS Language 1501

Horizontal Bar Graph. You can apply a horizontal bar graph to report columns. The reportoutput displays a horizontal bar graph in a new column to the right of the associated datavalues, as shown in the following image.
Bar graphs that emanate to the right of the zero line represent positive values, while bargraphs that emanate to the left of the zero line represent negative values.
The length of each vertical or horizontal bar graph is proportional to the magnitude of itsassociated data value. The shortest bar graph is displayed for the value with the minimummagnitude, the longest bar graph for the value with the maximum magnitude, and bar graphsof varying length are displayed for each value within the minimum-maximum magnitude range.Notice in the figure above that a value of 147,490.00 produces a longer horizontal bar graphthan a value of 50,153.00. Therefore, a complete row of vertical bar graphs or a completecolumn of horizontal bar graphs forms a bar chart.
You can only apply data visualization bar graphs to numeric report columns (integer, decimal,floating point single-precision, floating point double-precision, and packed). Bar graphs appliedto alphanumeric, date, or text field formats are ignored. For details about assigning fieldformats, see the Describing Data With TIBCO WebFOCUS® Language manual.
Associating Bar Graphs With Report Data
1502

You apply data visualization bar graphs to columns by adding a declaration to your WebFOCUSStyleSheet that begins with the GRAPHTYPE attribute. This attribute adds either a vertical orhorizontal bar graph to the specified data.
Note: Data visualization bar graphs are not supported in a request that includes the OVERoption.
Reference: Formatting Options for Data Visualization Bar Graphs
You can specify optional formatting attributes for data visualization bar graphs in theGRAPHTYPE declaration, for example, graph color, length, and width. The following table liststhe formatting attributes and a description of each:
Formatting Attribute Description
GRAPHBASE Sets whether the scale should start from zero or the minimumvalue.
GRAPHCOLOR Sets the color of the bar graphs.
GRAPHCOLORNEG Sets a color for the bar graphs that represent negative values.
GRAPHLENGTH Sets the length of the longest bar graph. The value forGRAPHLENGTH determines the length in measurement units(inches, centimeters, and so on) of the longest bar graph in avertical or horizontal bar graph.
The length value is expressed in the current units, which is setusing the UNITS StyleSheet attribute. The GRAPHLENGTH valueis then converted into pixels.
GRAPHSCALE Specifies the relative bar graph scaling for multiple reportcolumns under a common ACROSS sort field in which you haveapplied data visualization graphics. GRAPHSCALE is a report-level setting (TYPE=REPORT).
GRAPHWIDTH Sets the width of the bar graphs. The width value is expressedin the current units. See GRAPHLENGTH, above, for moreinformation about units.
21. Laying Out the Report Page
Creating Reports With TIBCO® WebFOCUS Language 1503

Syntax: How to Incorporate Data Visualization Formatting Attributes
TYPE=REPORT, [GRAPHSCALE={UNIFORM|DISTINCT}]TYPE=DATA, GRAPHTYPE=DATA, [{COLUMN|ACROSSCOLUMN|FIELD}=identifier], [GRAPHBASE={ZERO|MINIMUM},] [GRAPHCOLOR={color|RGB({r g b|#hexcolor}},] [GRAPHNEGCOLOR={color|RGB({r g b|#hexcolor}},] [GRAPHLENGTH=lengthvalue,] [GRAPHWIDTH=widthvalue,] $
Note: TYPE=DATA, GRAPHTYPE=DATA is the equivalent of GRAPHTYPE=DATA.
where:
GRAPHBASE
Specifies whether the scale should start at zero (the default) or the minimum value.GRAPHBASE=MINIMUM makes it easier to compare values that are not close to zero. Ifnegative values are present, GRAPHBASE=MINIMUM is ignored and will not be enabled.
GRAPHBASE=MINIMUM is visually indicated in the graph with a break in the bar (the smallpiece of the bar before the break symbolizes the compressed space between 0 and theminimum value).
Note: The minimum value is identified by a double bar of equal heights. For all valuesgreater than the minimum, the top bar grows proportionally taller. If the minimum value isactually zero, having this double bar may make it look as if the minimum value is not zero.Therefore, you should use the default (GRAPHBASE=ZERO) in your procedure if you expectto have zero values in the column.
GRAPHCOLOR
Specifies the color of the bar graphs. Black is the default color, if you omit this attributefrom the declaration.
color
Is one of the supported color values. In addition to the supported named colors, HEX orRGB color values are valid options. For a list of supported values, see Color Values in aReport on page 1703.
RGB(r g b)
Specifies the font color using a mixture of red, green, and blue. (r g b) is the desiredintensity of red, green, and blue, respectively. The values are on a scale of 0 to 255,where 0 is the least intense and 255 is the most intense. Note that using the three colorcomponents in equal intensities results in shades of gray.
Associating Bar Graphs With Report Data
1504

RGB(#hexcolor)
Is the hexadecimal value for the color. For example, FF0000 is the hexadecimal value forred. The hexadecimal digits can be in upper or lowercase, and must be preceded by apound sign (#).
GRAPHNEGCOLOR
Defines a color for the bar graphs that represent negative values.
GRAPHLENGTH
Specifies the length of the longest bar graph. The default length is 60 pixels for a verticalbar graph and 80 pixels for a horizontal bar graph.
lengthvalue
Sets the value used to display the vertical or horizontal bar graph for the maximum datavalue in the associated report column. This value must be a positive number.
This value is initially expressed in the current units (using the UNITS attribute). This valueis then converted into the corresponding number of pixels.
GRAPHSCALE
Specifies the relative bar graph scaling for multiple report columns under a commonACROSS sort field in which you have applied data visualization graphics. GRAPHSCALE is areport-level setting (TYPE=REPORT).
UNIFORM
Scales each vertical bar graph based on the minimum and maximum values of the entireset of values compiled from each ACROSS column in which you have applied datavisualization graphics
DISTINCT
Scales each vertical bar graph based on the distinct minimum and maximum values foreach ACROSS column in which you have applied data visualization graphics.
GRAPHWIDTH
Specifies the width of the bar graphs in a report.
widthvalue
Sets the value used to display the width of the bar graphs in a report. This value must be apositive number.
This value is initially expressed in the current units (defined by the UNITS attribute). Thisvalue is then converted into the corresponding number of pixels.
21. Laying Out the Report Page
Creating Reports With TIBCO® WebFOCUS Language 1505

Syntax: How to Associate Data Visualization Bar Graphs With Report Columns
To add data visualization graphics to report output, add the following declaration to yourWebFOCUS StyleSheet.
GRAPHTYPE=DATA, {COLUMN|ACROSSCOLUMN}=identifier, $
where:
GRAPHTYPE=DATA
Generates vertical or horizontal bar graphs for the data component of a report. Currently,you can only specify DATA as the report component.
COLUMN
Displays a horizontal bar graph to the right of the specified report column.
ACROSSCOLUMN
Displays a vertical bar graph above every occurrence of the data value associated with anACROSS sort field.
identifier
Is any valid identifier. For details, see Identifying a Report Component in a WebFOCUSStyleSheet on page 1251.
You can define WHEN conditions and bar graph features associated with those conditionsusing StyleSheet syntax. For details, see Formatting Report Data on page 1699.
Associating Bar Graphs With Report Data
1506

Example: Generating Data Visualization Bar Graphs in a Report
The following illustrates how to generate a bar graph for data in your report. Since this report issorted with the BY field CITY, horizontal bar graphs display in the output. You can change thisto vertical bars be changing the sort field to ACROSS CITY and the StyleSheet declaration toGRAPHTYPE=DATA, ACROSSCOLUMN=DIFFERENCE, $. Bar graphs that represent positivevalues display in the color blue. Bar graphs that represent negative values display in the colorred.
DEFINE FILE GGSALESDIFFERENCE/D7M=BUDDOLLARS-DOLLARS;END TABLE FILE GGSALESBY CITYSUM BUDDOLLARS/D7M DOLLARS/D7M DIFFERENCEON TABLE SET PAGE-NUM OFFON TABLE SET STYLE *GRID=OFF, $GRAPHTYPE=DATA, COLUMN=N4, GRAPHCOLOR=BLUE, GRAPHNEGCOLOR=RED, $ENDSTYLEEND
The output is:
21. Laying Out the Report Page
Creating Reports With TIBCO® WebFOCUS Language 1507

Controlling Bar Graph Scaling in Horizontal (ACROSS) Sort Fields
You can apply vertical bar graphs to different columns above a common ACROSS sort field. Theentire set of values for each column is grouped over an ACROSS sort field that has bar graphsapplied. Therefore, the longest bar graph corresponds to the maximum value of the entire setof values.
This action is acceptable for separate column values that have ranges that are close. Manytimes, however, there is a marked discrepancy between the sets of values for separatecolumns. The following image illustrates such a discrepancy.
As you can see from the figure above, the values for the Dollar Sales field ($11,392,310.00 to$11,710,379.00) is much larger in magnitude than the set of values for the Difference field($206,292.00 to -$184,622.00). Also notice that the vertical bar graphs associated with theDifference values all but disappear when graphed against the entire set of values.
To display separate vertical bar graphs based on the set of values for each column, use theGRAPHSCALE StyleSheet attribute. This attribute modifies data visualization graphics to usethe minimum and maximum values for each column below a common ACROSS sort field toconstruct a distinct vertical bar graph.
Syntax: How to Set Orientation for Visualization Bars
The VISBARORIENT parameter enables you to set horizontal or vertical orientation forvisualization bars for ACROSS columns.
Note: This parameter is only supported for HTML report output.
SET VISBARORIENT = {H|V}
where:
H
Indicates horizontal bar orientation for visualization bars.
V
Indicates vertical bar orientation for visualization bars. This is the default value.
Associating Bar Graphs With Report Data
1508

Example: Setting Orientation for Visualization Bars
The following report creates vertical bars for the ACROSS column values (DOLLARS,BUDDOLLARS, UNITS, BUDUNITS).
SET VISBARORIENT=VTABLE FILE GGSALESSUM DOLLARS BUDDOLLARS UNITS BUDUNITSBY REGIONACROSS CATEGORYWHERE CATEGORY EQ 'Coffee' OR 'Food'ON TABLE SET PAGE NOLEADON TABLE SET STYLE *TYPE =REPORT , BORDER=light,$GRAPHTYPE=DATA, ACROSSCOLUMN=DOLLARS, GRAPHCOLOR=GREEN,BACKCOLOR=RGB(#ffff00), $GRAPHTYPE=DATA, ACROSSCOLUMN=BUDDOLLARS, GRAPHCOLOR=RGB(255 0 0), $GRAPHTYPE=DATA, ACROSSCOLUMN=UNITS, GRAPHCOLOR=blue, $GRAPHTYPE=DATA, ACROSSCOLUMN=BUDUNITS, GRAPHCOLOR=thistle, $ENDSTYLEEND
The output is:
The following report creates horizontal bars for the ACROSS column values ( DOLLARS andBUDDOLLARS.
21. Laying Out the Report Page
Creating Reports With TIBCO® WebFOCUS Language 1509
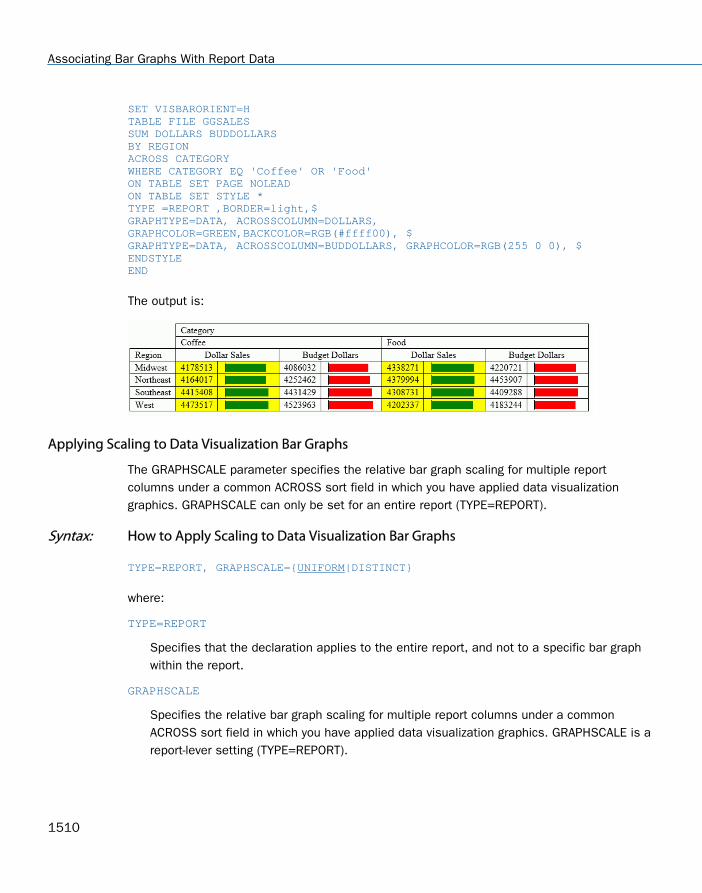
SET VISBARORIENT=HTABLE FILE GGSALESSUM DOLLARS BUDDOLLARS BY REGIONACROSS CATEGORYWHERE CATEGORY EQ 'Coffee' OR 'Food'ON TABLE SET PAGE NOLEADON TABLE SET STYLE *TYPE =REPORT ,BORDER=light,$GRAPHTYPE=DATA, ACROSSCOLUMN=DOLLARS, GRAPHCOLOR=GREEN,BACKCOLOR=RGB(#ffff00), $GRAPHTYPE=DATA, ACROSSCOLUMN=BUDDOLLARS, GRAPHCOLOR=RGB(255 0 0), $ENDSTYLEEND
The output is:
Applying Scaling to Data Visualization Bar Graphs
The GRAPHSCALE parameter specifies the relative bar graph scaling for multiple reportcolumns under a common ACROSS sort field in which you have applied data visualizationgraphics. GRAPHSCALE can only be set for an entire report (TYPE=REPORT).
Syntax: How to Apply Scaling to Data Visualization Bar Graphs
TYPE=REPORT, GRAPHSCALE={UNIFORM|DISTINCT}
where:
TYPE=REPORT
Specifies that the declaration applies to the entire report, and not to a specific bar graphwithin the report.
GRAPHSCALE
Specifies the relative bar graph scaling for multiple report columns under a commonACROSS sort field in which you have applied data visualization graphics. GRAPHSCALE is areport-lever setting (TYPE=REPORT).
Associating Bar Graphs With Report Data
1510

UNIFORM
Scales each vertical bar graph based on the minimum and maximum values of the entireset of values compiled from each ACROSS column in which you have applied datavisualization graphics.
DISTINCT
Scales each vertical bar graph based on the distinct minimum and maximum values foreach ACROSS column in which you have applied data visualization graphics.
Example: Using GRAPHSCALE to Display Distinct Vertical Bar Graphs
The following report request displays vertical bar graphs for two columns (DOLLARS andDIFFERENCE) associated with a common ACROSS field (REGION):
DEFINE FILE GGSALESDifference/D12.2M=DOLLARS-BUDDOLLARS;END TABLE FILE GGSALESSUM DOLLARS/D12.2M DifferenceACROSS REGIONON TABLE SET STYLE *TYPE=REPORT,GRID=OFF,$GRAPHTYPE=DATA, ACROSSCOLUMN=N1,$ GRAPHTYPE=DATA,ACROSSCOLUMN=N2,$ ENDSTYLEEND
This request produces the following report output:
Since the GRAPHSCALE attribute is not specified, the default setting UNIFORM is applied tothe report. This setting uses the entire set of values (values from Dollar Sales and Difference)to plot the bar graphs for both columns.
21. Laying Out the Report Page
Creating Reports With TIBCO® WebFOCUS Language 1511

The following request is the same as the above request, except it has theGRAPHSCALE=DISTINCT attribute included in the StyleSheet.
DEFINE FILE GGSALESDifference/D12.2M=DOLLARS-BUDDOLLARS;END TABLE FILE GGSALESSUM DOLLARS/D12.2M DifferenceACROSS REGIONON TABLE SET STYLE *GRAPHTYPE=DATA, ACROSSCOLUMN=N1,$GRAPHTYPE=DATA, ACROSSCOLUMN=N2,$ TYPE=REPORT, GRAPHSCALE=DISTINCT,$ ENDSTYLEEND
Notice the difference in the output:
Now each bar graph is plotted based on the set of values for each field.
Working With Mailing Labels and Multi-Pane Pages
You can print sheets of laser printer mailing labels by dividing each page into a matrix of sub-pages, each corresponding to a single label. Each page break in the report positions theprinter at the top of the next label.
Multi-pane printing places a whole report on a single printed page. You can create columns orrows so that when text overflows on one page, it appears in the next column or row on thesame page rather than on the next page.
These features apply to a PDF or PS report.
Working With Mailing Labels and Multi-Pane Pages
1512
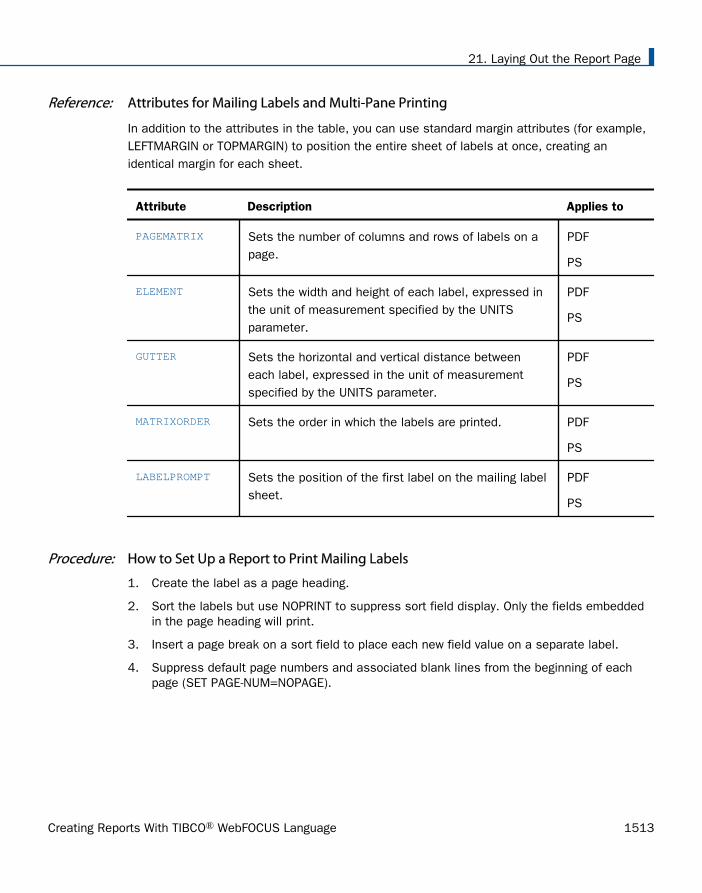
Reference: Attributes for Mailing Labels and Multi-Pane Printing
In addition to the attributes in the table, you can use standard margin attributes (for example,LEFTMARGIN or TOPMARGIN) to position the entire sheet of labels at once, creating anidentical margin for each sheet.
Attribute Description Applies to
PAGEMATRIX Sets the number of columns and rows of labels on apage.
PS
ELEMENT Sets the width and height of each label, expressed inthe unit of measurement specified by the UNITSparameter.
PS
GUTTER Sets the horizontal and vertical distance betweeneach label, expressed in the unit of measurementspecified by the UNITS parameter.
PS
MATRIXORDER Sets the order in which the labels are printed. PDF
PS
LABELPROMPT Sets the position of the first label on the mailing labelsheet.
PS
Procedure: How to Set Up a Report to Print Mailing Labels
1. Create the label as a page heading.
2. Sort the labels but use NOPRINT to suppress sort field display. Only the fields embeddedin the page heading will print.
3. Insert a page break on a sort field to place each new field value on a separate label.
4. Suppress default page numbers and associated blank lines from the beginning of eachpage (SET PAGE-NUM=NOPAGE).
21. Laying Out the Report Page
Creating Reports With TIBCO® WebFOCUS Language 1513

Syntax: How to Print Mailing Labels or a Multi-Pane Report
[TYPE=REPORT,] PAGEMATRIX=(c r), ELEMENT=(w h), [GUTTER=(x y),] [MATRIXORDER={VERTICAL|HORIZONTAL},] [LABELPROMPT={OFF|ON},] $
where:
TYPE=REPORT
Applies the settings to the entire report. Not required, as it is the default.
c
Is the number of columns of labels across the page.
Enclose the values c and r in parentheses, and do not include a comma between them.
r
Is the number of rows of labels down the page.
w
Is the width of each label.
Enclose the values w and h in parentheses, and do not include a comma between them.
h
Is the height of each label.
GUTTER
Is the distance between each label.
x
Is the horizontal distance between each label.
Enclose the values x and y in parentheses, and do not include a comma between them.
y
Is the vertical distance between each label.
MATRIXORDER
Is the order in which the labels are printed.
VERTICAL
Prints the labels down the page.
HORIZONTAL
Prints the labels across the page.
Working With Mailing Labels and Multi-Pane Pages
1514

LABELPROMPT
Is the position of the first label on the mailing label sheet.
OFF
Starts the report on the first label on the sheet. OFF is the default value.
ON
Prompts you at run time for the row and column number at which to start printing. Allremaining labels follow consecutively. This feature allows partially used sheets of labels tobe re-used.
Example: Printing Mailing Labels
The following report prints on 81/2 x 11 sheets of address labels.
SET ONLINE-FMT = PDFTABLE FILE EMPLOYEEBY LAST_NAME NOPRINT BY FIRST_NAME NOPRINTON FIRST_NAME PAGE-BREAKHEADING"<FIRST_NAME <LAST_NAME""<ADDRESS_LN1""<ADDRESS_LN2""<ADDRESS_LN3"ON TABLE SET PAGE-NUM NOPAGEON TABLE SET STYLE LABEMPEND
The labels have the following dimensions, defined in the StyleSheet LABEMP:
UNITS=IN, PAGESIZE=LETTER, LEFTMARGIN=0.256, TOPMARGIN=0.5,PAGEMATRIX=(2 5), ELEMENT=(4 1), GUTTER=(0.188 0), $
21. Laying Out the Report Page
Creating Reports With TIBCO® WebFOCUS Language 1515
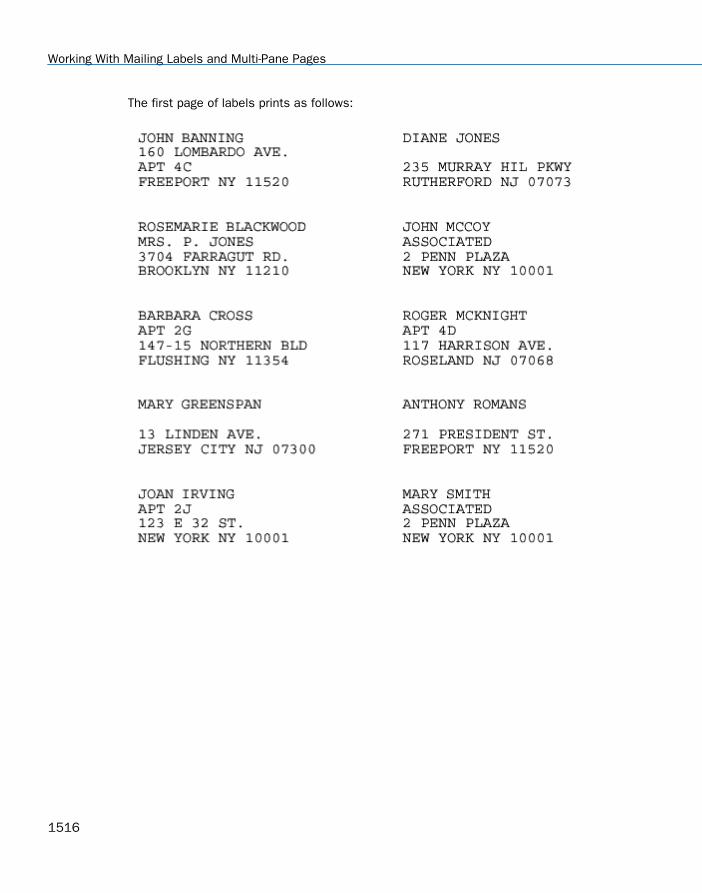
The first page of labels prints as follows:
Working With Mailing Labels and Multi-Pane Pages
1516
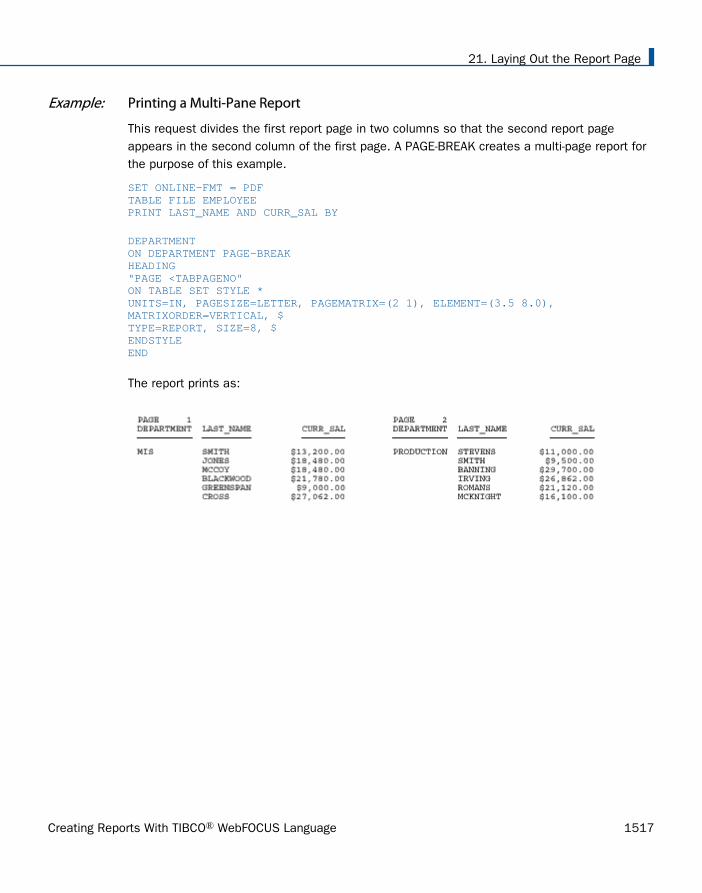
Example: Printing a Multi-Pane Report
This request divides the first report page in two columns so that the second report pageappears in the second column of the first page. A PAGE-BREAK creates a multi-page report forthe purpose of this example.
SET ONLINE-FMT = PDFTABLE FILE EMPLOYEEPRINT LAST_NAME AND CURR_SAL BY
DEPARTMENTON DEPARTMENT PAGE-BREAKHEADING"PAGE <TABPAGENO"ON TABLE SET STYLE *UNITS=IN, PAGESIZE=LETTER, PAGEMATRIX=(2 1), ELEMENT=(3.5 8.0),MATRIXORDER=VERTICAL, $TYPE=REPORT, SIZE=8, $ENDSTYLEEND
The report prints as:
21. Laying Out the Report Page
Creating Reports With TIBCO® WebFOCUS Language 1517

Working With Mailing Labels and Multi-Pane Pages
1518

Chapter22Using Headings, Footings, Titles, andLabels
After you have selected the data for a report, you can make it more meaningful by addingheadings, footings, titles, and labels. Headings and footings supply key information,such as the purpose of a report and its audience. They also provide structure, helpingthe user navigate to the detail sought. Titles and labels identify individual pieces of data,ensuring correct interpretation. These components supply context for data and enhancethe visual appeal of a report.
For information about adding contextual information to specialized report types, see Creating a Graph on page 1745, Creating Financial Reports With Financial ModelingLanguage (FML) on page 1817, and Creating a Free-Form Report on page 1899.
In this chapter:
Creating Headings and Footings
Including an Element in a Heading orFooting
Displaying Syntax Components inHeading and Footing Objects
Repeating Headings and Footings onPanels in PDF Report Output
Customizing a Column Title
Controlling Column Title UnderliningUsing a SET Command
Controlling Column Title UnderliningUsing a StyleSheet Attribute
Creating Labels to Identify Data
Formatting a Heading, Footing, Title, orLabel
Applying Font Attributes to a Heading,Footing, Title, or Label
Adding Borders and Grid Lines
Justifying a Heading, Footing, Title, orLabel
Choosing an Alignment Method forHeading and Footing Elements
Aligning a Heading or Footing Element inan HTML, XLSX, EXL2K, PDF, PPTX, orDHTML Report
Aligning a Heading or Footing ElementAcross Columns in an HTML or PDFReport
Aligning Content in a Multi-Line Headingor Footing
Positioning Headings, Footings, or ItemsWithin Them
Creating Reports With TIBCO® WebFOCUS Language 1519

Controlling the Vertical Positioning of aHeading or Footing
Placing a Report Heading or Footing onIts Own Page
Creating Headings and Footings
There are several types of headings and footings:
Report titles. These are titles you define that display in your browser's title bar when yourun a report or graph in HTML or, as the worksheet tab name in an EXL2K report. Fordetails see, Creating a Custom Report or Worksheet Title on page 1524.
A report heading, which appears at the top of the first page of a report and a report footing,which appears on the last page of a report. For details on report headings and footings,see Creating a Report Heading or Footing on page 1527.
A page heading, which appears at the top of every page of a report and a page footing,which appears at the bottom of every page of a report. For details on page headings andfootings, see Creating a Page Heading or Footing on page 1534.
A sort heading, which appears in the body of a report to identify the beginning of a group ofrelated data. And a sort footing, which appears in the body to identify the end of a group ofrelated data. For details on sort headings and footings, see Creating a Sort Heading orFooting on page 1545.
The following sample report contains a report heading at the beginning of the report and areport footing at the end of the report. It also contains a page heading and page footing onevery page of the report.
Creating Headings and Footings
1520
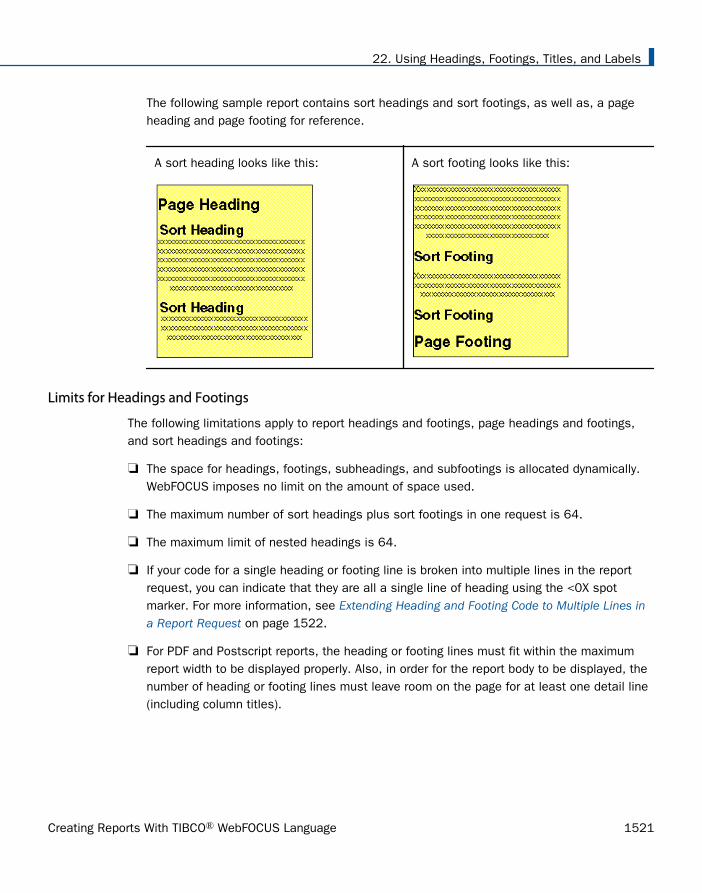
The following sample report contains sort headings and sort footings, as well as, a pageheading and page footing for reference.
A sort heading looks like this: A sort footing looks like this:
Limits for Headings and Footings
The following limitations apply to report headings and footings, page headings and footings,and sort headings and footings:
The space for headings, footings, subheadings, and subfootings is allocated dynamically.WebFOCUS imposes no limit on the amount of space used.
The maximum number of sort headings plus sort footings in one request is 64.
The maximum limit of nested headings is 64.
If your code for a single heading or footing line is broken into multiple lines in the reportrequest, you can indicate that they are all a single line of heading using the <0X spotmarker. For more information, see Extending Heading and Footing Code to Multiple Lines ina Report Request on page 1522.
For PDF and Postscript reports, the heading or footing lines must fit within the maximumreport width to be displayed properly. Also, in order for the report body to be displayed, thenumber of heading or footing lines must leave room on the page for at least one detail line(including column titles).
22. Using Headings, Footings, Titles, and Labels
Creating Reports With TIBCO® WebFOCUS Language 1521

Extending Heading and Footing Code to Multiple Lines in a Report Request
A single line heading or footing code, between double quotation marks, can be a maximum of32K characters. However, in some editors the maximum length of a line of code in a procedureis 80 characters. In cases like this, you can use the <0X spot marker to continue your headingonto the next line. The heading or footing content and spacing appears exactly as it would iftyped on a single line.
Even if you do not need to extend your code beyond the 80-character line limit, this techniqueoffers convenience, since shorter lines may be easier to read on screen and to print onprinters.
Procedure: How to Extend Heading or Footing Code to Multiple Lines in a Report Request
To extend the length of a single-line heading or footing beyond 80 characters:
1. Begin the heading or footing with double quotation marks (").
2. Split the heading or footing content into multiple lines of up to 76 characters each, usingthe <0X spot marker at any point up to the 76th character to continue your heading ontothe next line. (The four remaining spaces are required for the spot marker itself, and ablank space preceding it.)
3. The heading or footing line can contain a maximum of 410 characters, with each lineending in an <0X spot marker.
4. Place the closing double quotation marks at the end of the final line of heading or footingcode.
You can use this technique to create a report heading or footing, page heading or footing, orsort heading or footing of up to 410 characters.
Example: Extending Heading and Footing Code to Multiple Lines in a Report Request
This request creates a sort heading coded on two lines. The <0X spot marker positions thefirst character on the continuation line immediately to the right of the last character on theprevious line. (No spaces are inserted between the spot marker and the start of a continuationline.)
SET ONLINE-FMT = HTMLSET PAGE-NUM = OFFJOIN STORE_CODE IN CENTCOMP TO STORE_CODE IN CENTORD
Creating Headings and Footings
1522
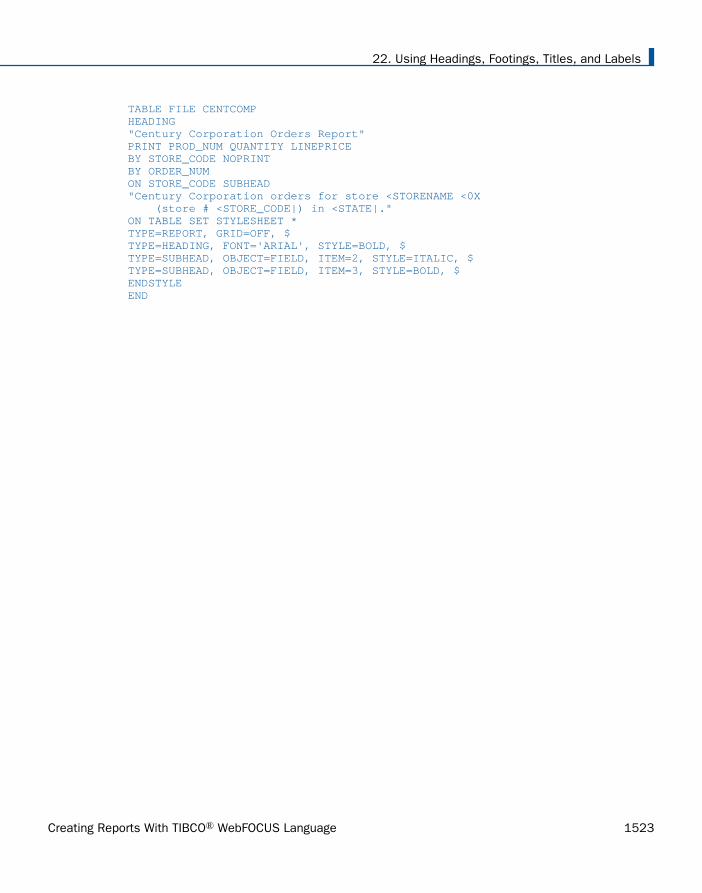
TABLE FILE CENTCOMPHEADING"Century Corporation Orders Report"PRINT PROD_NUM QUANTITY LINEPRICEBY STORE_CODE NOPRINTBY ORDER_NUMON STORE_CODE SUBHEAD"Century Corporation orders for store <STORENAME <0X (store # <STORE_CODE|) in <STATE|."ON TABLE SET STYLESHEET *TYPE=REPORT, GRID=OFF, $TYPE=HEADING, FONT='ARIAL', STYLE=BOLD, $TYPE=SUBHEAD, OBJECT=FIELD, ITEM=2, STYLE=ITALIC, $TYPE=SUBHEAD, OBJECT=FIELD, ITEM=3, STYLE=BOLD, $ENDSTYLEEND
22. Using Headings, Footings, Titles, and Labels
Creating Reports With TIBCO® WebFOCUS Language 1523
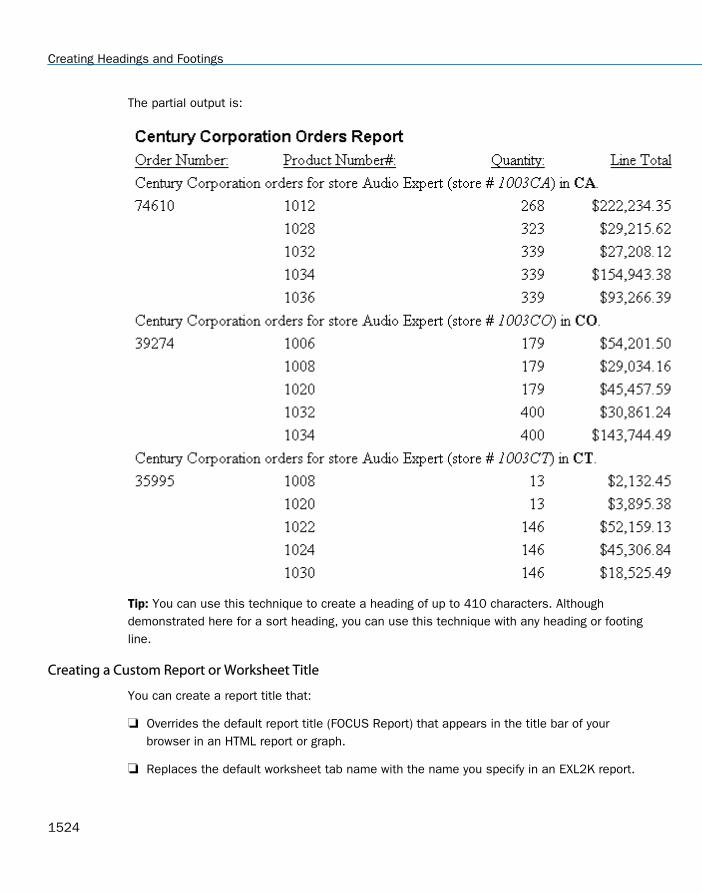
The partial output is:
Tip: You can use this technique to create a heading of up to 410 characters. Althoughdemonstrated here for a sort heading, you can use this technique with any heading or footingline.
Creating a Custom Report or Worksheet Title
You can create a report title that:
Overrides the default report title (FOCUS Report) that appears in the title bar of yourbrowser in an HTML report or graph.
Replaces the default worksheet tab name with the name you specify in an EXL2K report.
Creating Headings and Footings
1524

The worksheet tab names for an Excel Table of Contents report are the BY field values thatcorrespond to the data on the current worksheet. If the user specifies the TITLETEXT keywordin the stylesheet, it will be ignored.
Excel limits the length of worksheet titles to 31 characters. The following special characterscannot be used: ':', '?', '*', and '/'.
If you want to use date fields as the bursting BY field, you can include the - characterinstead of the / character. The - character is valid in an Excel tab title. However, if you douse the / character, WebFOCUS will substitute it with the - character.
Syntax: How to Create a Custom Report Title
Add the following declaration to your WebFOCUS StyleSheet:
TYPE=REPORT, TITLETEXT='title', $
where:
title
Is the text for your title.
The maximum number of characters for:
The worksheet tab name in an EXL2K report is 31. Any text that exceeds 31 characterswill be truncated.
The browser title for an HTML report or graph is 95. This is a limit imposed by thebrowser.
Text specified in the title is placed in the file as is and is not encoded. Specialcharacters, such as <, >, and &, should not be used since they have special meaningin HTML and may produce unpredictable results.
Note: The words "Microsoft Internet Explorer" are always appended to any HTML reporttitle.
22. Using Headings, Footings, Titles, and Labels
Creating Reports With TIBCO® WebFOCUS Language 1525

Example: Creating a Custom Report Title in an HTML Report
The following illustrates how you can replace the default report title in an HTML report usingthe TITLETEXT attribute in your StyleSheet.
TABLE FILE SHORTSUM PROJECTED REGIONBY REGIONON TABLE SET PAGE-NUM OFFON TABLE SET STYLE * TYPE=REPORT, TITLETEXT='1999 Sales Report', $ TYPE=REPORT, GRID=OFF, $ENDSTYLEEND
The output is:
Creating Headings and Footings
1526

Example: Creating a Custom Report Title in an EXL2K Report
The following illustrates how you can replace the default worksheet tab name in an EXL2Kreport using the TITLETEXT attribute in your StyleSheet.
TABLE FILE SHORTSUM PROJECTED_RETURNBY REGIONON TABLE PCHOLD FORMAT EXL2KON TABLE SET STYLE * TYPE=REPORT, TITLETEXT='1999 Sales Report', $ ENDSTYLEEND
The output is:
Creating a Report Heading or Footing
A report heading appears before the first page and is one of the most important componentsof a report. It provides a unique name to a report and identifies its purpose or content. A short,single-line report heading may meet the needs of your user, or you may include multiple linesof appropriate information.
A report footing appears after the last page of a report. You might add a report footing tosignal the end of data so the user knows that the report is complete. A report footing can alsoprovide other information, such as the author of the report.
A report heading or footing can include text, fields, Dialogue Manager variables, images, andspot markers.
22. Using Headings, Footings, Titles, and Labels
Creating Reports With TIBCO® WebFOCUS Language 1527
Syntax: How to Create a Report Heading
Include the following syntax in a request. Each heading or footing line must begin and end witha double quotation mark.
ON TABLE [PAGE-BREAK AND] SUBHEAD "content ... "["content ... "]...["content ... "]
where:
PAGE-BREAK
Is an optional command that creates the report heading on the first page by itself,followed by the page or pages of data. If you do not use PAGE-BREAK, the reportheading appears on the first page of the report, followed by a page heading if one issupplied, and column titles. For related information, see Placing a Report Heading orFooting on Its Own Page on page 1694.
SUBHEAD
Is the command required to designate a report heading.
contentHeading or footing content can include the following elements, between doublequotation marks. (If the ending quotation mark is omitted, all subsequent lines of therequest are treated as part of the report heading.)
textIs text that appears on the first page of a report. You can include multiple lines oftext.
The text must start on a line by itself, following the SUBHEAD command.
Text can be combined with variables and spot markers.
For related information, see Limits for Headings and Footings on page 1521.
variableCan be any one or a combination of the following:
Fields (real data source fields, virtual fields created with the DEFINE command in aMaster File or report request, calculated values created with the COMPUTE commandin a request, or a system field such as TABPAGENO). You can qualify data sourcefields with certain prefix operators.
Dialogue Manager variables.
Creating Headings and Footings
1528

Images. You can include images in a heading or footing.
For details, see Including an Element in a Heading or Footing on page 1559.
spot marker Enables you to position items, to identify items to be formatted, and to extendcode beyond the 80-character line limit of some text editors.
<+0> divides a heading or footing into items for formatting. For details, see Identifyinga Heading, Footing, Title, or FML Free Text on page 1275.
</n specifies skipped lines. For details, see Controlling the Vertical Positioning of aHeading or Footing on page 1687.
<-n to position the next character on the line. For details, see Using Spot Markers toRefine Positioning on page 1682.
<0X continues a heading or footing specification on the next line of the request. Fordetails, see Extending Heading and Footing Code to Multiple Lines in a Report Requeston page 1522.
Note: When a closing spot marker is immediately followed by an opening spot marker(><), a single space text item will be placed between the two spot markers (> <). Thismust be considered when applying formatting.
Blank lines
If you omit all text, variables, and spot markers, you have a blank heading or footingline (for example, " ") which you can use to skip a line in the heading or footing. (Youcan also skip a line using a vertical spot marker, such as </1.)
Example: Creating a Single-Line Report Heading
This request creates a single-line report heading that identifies the content of the report.
TABLE FILE GGSALESPRINT BUDDOLLARS DOLLARSBY STCDWHERE STCD EQ 'R1019' ON TABLE SUBHEAD"Sales Report for Store Code R1019" ON TABLE SET PAGE-NUM OFFON TABLE SET ONLINE-FMT HTMLON TABLE SET WEBVIEWER ONON TABLE SET STYLESHEET *TYPE=REPORT, GRID=OFF,$ENDSTYLEEND
22. Using Headings, Footings, Titles, and Labels
Creating Reports With TIBCO® WebFOCUS Language 1529
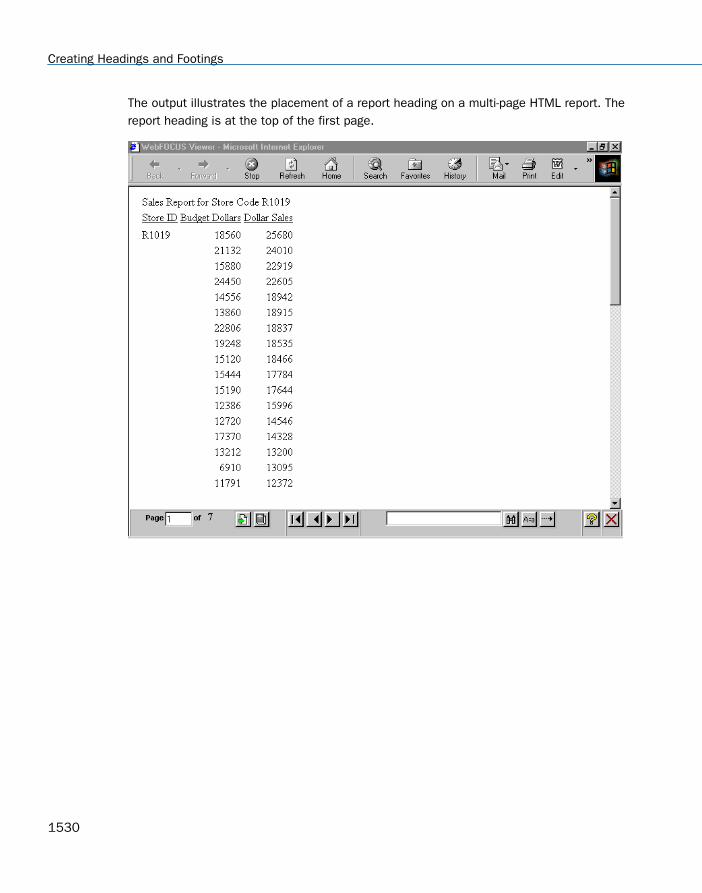
The output illustrates the placement of a report heading on a multi-page HTML report. Thereport heading is at the top of the first page.
Creating Headings and Footings
1530
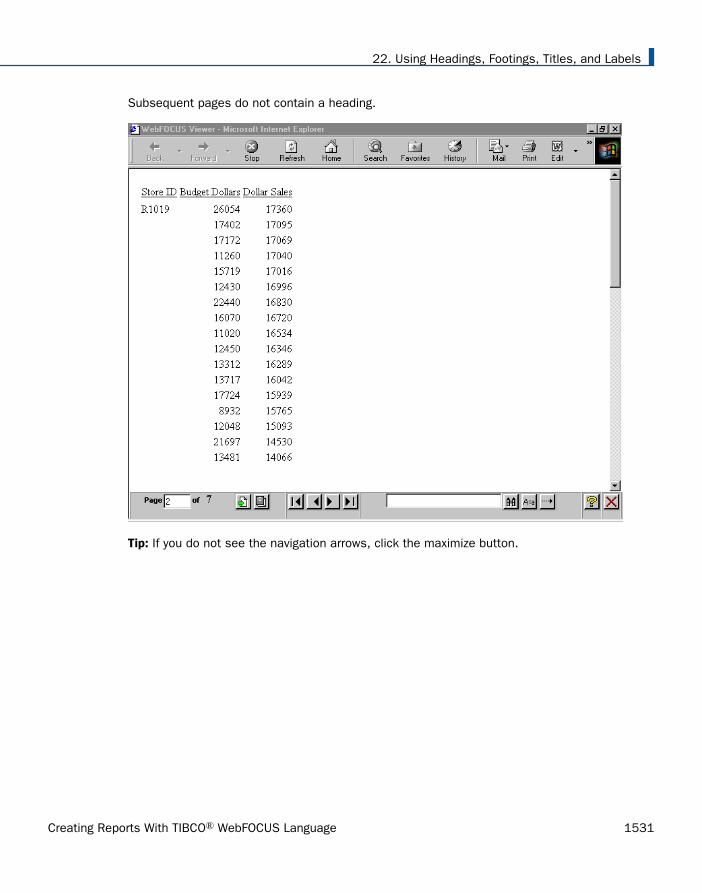
Subsequent pages do not contain a heading.
Tip: If you do not see the navigation arrows, click the maximize button.
22. Using Headings, Footings, Titles, and Labels
Creating Reports With TIBCO® WebFOCUS Language 1531

Syntax: How to Create a Report Footing
Include the following syntax in a request. Each heading or footing line must begin and end witha double quotation mark.
ON TABLE [PAGE-BREAK AND] SUBFOOT "content ... "["content ... "]...["content ... "]
where:
PAGE-BREAK
Is an optional command that creates the report footing after the last page by itself. Ifyou do not include PAGE-BREAK, the report footing appears as the last line of thereport. For related information, see Placing a Report Heading or Footing on Its OwnPage on page 1694.
SUBFOOT
Is the command required to designate a report footing.
contentHeading or footing content can include the following elements, between doublequotation marks. (If the ending quotation mark is omitted, all subsequent lines of therequest are treated as part of the report footing unless you are using the <0X spotmarker.)
textIs text that appears on the last page of a report. You can include multiple lines oftext.
The text must start on a line by itself, following the SUBFOOT command.
Text can be combined with variables and spot markers.
For related information, see Limits for Headings and Footings on page 1521.
variableCan be any one or a combination of the following:
Fields (real data source fields, virtual fields created with the DEFINE command in aMaster File or report request, calculated values created with the COMPUTE commandin a request, or a system field such as TABPAGENO). You can qualify data sourcefields with certain prefix operators.
Dialogue Manager variables.
Creating Headings and Footings
1532

Images. You can include images in a heading or footing.
For details, see Including an Element in a Heading or Footing on page 1559.
spot marker Enables you to position items, to identify items to be formatted, and to extendcode beyond the 80-character line limit of the text editor.
<+0> divides a heading or footing into items for formatting. For details, see Identifyinga Heading, Footing, Title, or FML Free Text on page 1275.
</n specifies skipped lines. For details, see Controlling the Vertical Positioning of aHeading or Footing on page 1687.
<-n to position the next character on the line. For details, see Using Spot Markers toRefine Positioning on page 1682.
<0X continues a heading or footing specification on the next line of the request. Fordetails, see Extending Heading and Footing Code to Multiple Lines in a Report Requeston page 1522.
Note: When a closing spot marker is immediately followed by an opening spot marker(><), a single space text item will be placed between the two spot markers (> <). Thismust be considered when applying formatting.
Blank lines
If you omit all text, variables, and spot markers, you have a blank heading or footingline (for example, " ") which you can use to skip a line in the heading or footing. (Youcan also skip a line using a vertical spot marker, such as </1.)
Example: Creating a Single-Line Report Footing
This request creates a single-line report footing that identifies the author of the report.
TABLE FILE GGSALESPRINT UNITSWHERE UNITS GE 1400BY STCD BY REGIONWHERE REGION EQ 'Northeast' ON TABLE SUBFOOT"AUTHOR: MARY SMITH" ON TABLE SET PAGE-NUM OFFON TABLE SET ONLINE-FMT HTMLON TABLE SET WEBVIEWER ONON TABLE SET STYLESHEET *TYPE=REPORT, GRID=OFF,$ENDSTYLEEND
22. Using Headings, Footings, Titles, and Labels
Creating Reports With TIBCO® WebFOCUS Language 1533

The output illustrates the placement of a report footing on a multi-page HTML report. Thereport footing follows the data on the last page.
Tip: If you do not see the navigation arrows, click the maximize button.
Creating a Page Heading or Footing
A page heading appears at the top of every page of a report, and a page footing appears at thebottom of every page.
Add a page heading to identify and reinforce the report content and purpose from page topage, or include a variable that customizes the heading on each page. For example, consider areport with employee bank account information, arranged by department. Information for eachdepartment appears on a separate page. The page heading for this report identifies thedepartment addressed on each page (for example, ACCOUNT REPORT FOR PRODUCTIONDEPARTMENT).
Creating Headings and Footings
1534

Add a page footing to supply information that warrants repetition on each page, such as thedate of the report, or a reminder that it is confidential. You can also use a page footing tosupply descriptive information about a report, such as PRELIMINARY or DRAFT COPY.
A page heading or footing can include text, fields, Dialogue Manager variables, images, andspot markers.
In addition, you can use page heading and footing syntax to create a free-form (non-tabular)report, in which you position data on a page using a layout of your own design. See Creating aFree-Form Report on page 1899 for details.
A TABLE request can have more than one page heading or footing. For each heading or footing,a WHEN clause against the data being retrieved can determine whether the heading or footingdisplays on the report output.
In a heading, the data for the WHEN clause and data field values displayed in the heading arebased on the first line on the page. In a footing, the data for the WHEN clause and the datafield values displayed in the footing are based on the last line on the page.
The CONDITION StyleSheet attribute enables you to identify a specific WHEN clause so thatyou can style each heading or footing separately. For information, see Identifying a Heading orFooting on page 1279.
Syntax: How to Create a Page Heading
Include the following syntax in a request. Each heading or footing line must begin and end witha double quotation mark.
[HEADING [CENTER]] "content ... "["content ... "]...["content ... "]
where:
HEADING
Is an optional command if you place the text before the first display command (forexample, PRINT or SUM); otherwise, it is required to identify the text as a pageheading.
CENTER
Is an optional command that centers the page heading over the report data. Fordetails, see How to Center a Page Heading or Footing Using Legacy Formatting on page1624.
22. Using Headings, Footings, Titles, and Labels
Creating Reports With TIBCO® WebFOCUS Language 1535

contentHeading or footing content can include the following elements, between doublequotation marks. (If the ending quotation mark is omitted, all subsequent lines of therequest are treated as part of the page heading.)
textIs text for the page heading. You can include multiple lines of text.
The text must start on a line by itself, following the HEADING command.
Text can be combined with variables and spot markers.
For related information, see Limits for Headings and Footings on page 1521.
variableCan be any one or a combination of the following:
Fields (real data source fields, virtual fields created with the DEFINE command in aMaster File or report request, calculated values created with the COMPUTE commandin a request, or a system field such as TABPAGENO). You can qualify data sourcefields with certain prefix operators.
Dialogue Manager variables.
Images. You can include images in a heading or footing.
For details, see Including an Element in a Heading or Footing on page 1559.
spot markerEnables you to position items, to identify items to be formatted, and to extendcode beyond the 80-character line limit of the text editor.
<+0> divides a heading or footing into items for formatting. For details, see Identifyinga Heading, Footing, Title, or FML Free Text on page 1275.
</n specifies skipped lines. For details, see Controlling the Vertical Positioning of aHeading or Footing on page 1687.
<-n to position the next character on the line. For details, see Using Spot Markers toRefine Positioning on page 1682.
<0X continues a heading or footing specification on the next line of the request. Fordetails, see Extending Heading and Footing Code to Multiple Lines in a Report Requeston page 1522.
Note: When a closing spot marker is immediately followed by an opening spot marker(><), a single space text item will be placed between the two spot markers (> <). Thismust be considered when applying formatting.
Creating Headings and Footings
1536

Blank lines
If you omit all text, variables, and spot markers, you have a blank heading or footingline (for example, " ") which you can use to skip a line in the heading or footing. (Youcan also skip a line using a vertical spot marker, such as </1.)
Example: Creating a Single-Line Page Heading
This request omits the command HEADING since the page heading text precedes the displaycommand PRINT. The page heading includes text and an embedded field.
TABLE FILE EMPLOYEE "ACCOUNT REPORT FOR DEPARTMENT <DEPARTMENT" PRINT CURR_SAL BY DEPARTMENT BY HIGHEST BANK_ACCTBY EMP_IDON DEPARTMENT PAGE-BREAKON TABLE SET PAGE-NUM OFFON TABLE SET ONLINE-FMT HTMLON TABLE SET STYLE *TYPE=REPORT, GRID=OFF,$ENDSTYLEEND
The output illustrates the placement of a page heading on a multi-page HTML report. The pageheading appears on both pages of the report, identifying the department to which the dataapplies. See How to Include a Field Value in a Heading or Footing on page 1560 forinformation on embedded field values. The first page of data applies to the MIS department.
22. Using Headings, Footings, Titles, and Labels
Creating Reports With TIBCO® WebFOCUS Language 1537

The second page of data applies to the PRODUCTION department.
Syntax: How to Create a Page Footing
Include the following syntax in a request. Each heading or footing line must begin and end witha double quotation mark.
FOOTING [CENTER] [BOTTOM] "content ... "["content ... "]...["content ... "]
where:
FOOTING
Is the required command that identifies the content as a page footing.
CENTER
Is an optional command that centers the page footing over the report data. For detailson CENTER, see How to Center a Page Heading or Footing Using Legacy Formatting onpage 1624.
BOTTOM
Is an optional command that places the footing at the bottom of the page. If you omitBOTTOM, the page footing appears two lines below the report data. For details onBOTTOM, see How to Position a Page Footing at the Bottom of a Page on page 1692.
contentHeading or footing content can include the following elements, between doublequotation marks. (If the ending quotation mark is omitted, all subsequent lines of therequest are treated as part of the footing unless you are using the <0X spot marker.)
textIs text for the page footing. You can include multiple lines of text.
Creating Headings and Footings
1538

The text must start on a line by itself, following the FOOTING command.
Text can be combined with variables and spot markers.
For related information, see Limits for Headings and Footings on page 1521.
variableCan be any one of, or a combination of the following:
Fields (real data source fields, virtual fields created with the DEFINE command in aMaster File or report request, calculated values created with the COMPUTE commandin a request, or a system field such as TABPAGENO). You can qualify data sourcefields with certain prefix operators.
Dialogue Manager variables.
Images. You can include images in a heading or footing.
For details, see Including an Element in a Heading or Footing on page 1559.
spot markerEnables you to position items, to identify items to be formatted, and to extendcode beyond the 80-character line limit of the text editor.
<+0> divides a heading or footing into items for formatting. For details, see Identifyinga Heading, Footing, Title, or FML Free Text on page 1275.
</n specifies skipped lines. For details, see Controlling the Vertical Positioning of aHeading or Footing on page 1687.
<-n positions the next character on the line. For details, see Using Spot Markers toRefine Positioning on page 1682.
<0X continues a heading or footing specification on the next line of the request. Fordetails, see Extending Heading and Footing Code to Multiple Lines in a Report Requeston page 1522.
Note: When a closing spot marker is immediately followed by an opening spot marker(><), a single space text item will be placed between the two spot markers (> <). Thismust be considered when applying formatting.
Blank lines
If you omit all text, variables, and spot markers, you have a blank heading or footingline (for example, " ") which you can use to skip a line in the heading or footing. (Youcan also skip a line using a vertical spot marker, such as </1.)
22. Using Headings, Footings, Titles, and Labels
Creating Reports With TIBCO® WebFOCUS Language 1539
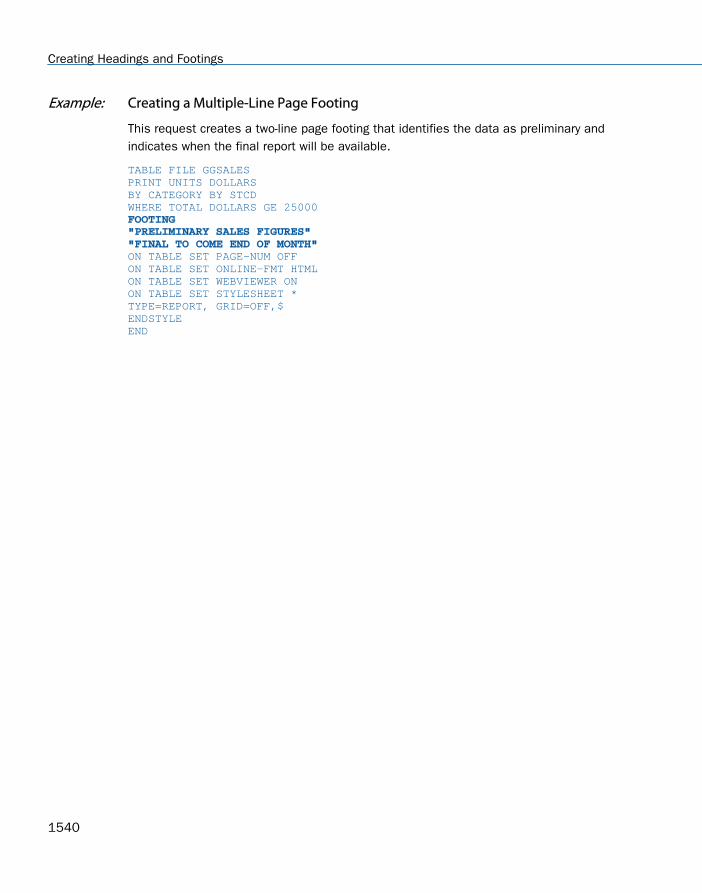
Example: Creating a Multiple-Line Page Footing
This request creates a two-line page footing that identifies the data as preliminary andindicates when the final report will be available.
TABLE FILE GGSALESPRINT UNITS DOLLARSBY CATEGORY BY STCDWHERE TOTAL DOLLARS GE 25000 FOOTING"PRELIMINARY SALES FIGURES""FINAL TO COME END OF MONTH" ON TABLE SET PAGE-NUM OFFON TABLE SET ONLINE-FMT HTMLON TABLE SET WEBVIEWER ONON TABLE SET STYLESHEET *TYPE=REPORT, GRID=OFF,$ENDSTYLEEND
Creating Headings and Footings
1540

The partial output illustrates the placement of page footings on a multi-page HTML report. Thepage footing appears on both pages of the report.
22. Using Headings, Footings, Titles, and Labels
Creating Reports With TIBCO® WebFOCUS Language 1541

Tip: If you do not see the navigation arrows, click the maximize button.
Syntax: How to Specify a Heading or Footing With a WHEN Clause
{HEADING [CENTER]|FOOTING}"text_and_data1" . . ."text_and_datan"WHEN expression
where:
text_and_data1, text_and_datan
Is the text and data for each heading or footing line.
expression
Is an expression that resolves to TRUE or FALSE (1 or 0). If its value resolves to TRUE, theheading or footing is displayed. If the expression resolves to FALSE, the heading or footingis not displayed.
Reference: Usage Notes for Multiple Headings
HEADING CENTER and FOOTING CENTER apply only to the specific heading or footing inwhich they are specified.
A request can have a total of 120 headings, 120 footings, 120 subheadings, and 120subfootings.
Once you use the BOTTOM option on a footing, all subsequent footings also go to thebottom of the page.
Freezing HTML and AHTML Headings, Footings, and Column Titles
You may want to scroll the data in a report while freezing headings, column titles, and footingsin order to see the context of the report output while scrolling.
Using StyleSheet attributes, you can set aside a scrollable area for HTML and AHTML reportoutput.
The HTML HFREEZE reporting feature is supported with the browser versions listed in WebBrowser Support for WebFOCUS. The HFREEZE feature is listed in the 8.1 Browser SupportMatrix in the HTML Reporting Features section JavaScript components row.
Creating Headings and Footings
1542

Reference: Usage Notes for HTMLARCHIVE With HFREEZE
WebFOCUS interactive reporting features must have a connection to the WebFOCUS client inorder to access the components required to operate successfully.
HTMLARCHIVE can be used to create self-contained HTML pages with user-defined imageswhen client access is not available.
To generate HTML pages containing user-defined images that can operate interactively, useone of the following commands:
SET HTMLEMBEDIMG=ONSET HTMLARCHIVE=ON
Define BASEURL to point directly to the host machine where these files can be accessed usingthe following syntax:
SET BASEURL=http://{hostname:portnumber}
For more information on SET BASEURL, see Specifying a Base URL on page 874.
Syntax: How to Create a Scrollable Area in an HTML Report
TYPE=REPORT,HFREEZE={OFF|ON|TOP|BOTTOM},[SCROLLHEIGHT={AUTO|nn[.n]}], $
where:
HFREEZE=OFF
Does not freeze the heading, column titles, grand totals, and footing. OFF is the default.
HFREEZE=ON
Freezes the heading, column titles, grand totals, and footing.
HFREEZE=TOP
Freezes the heading and column titles.
HFREEZE=BOTTOM
Freezes the grand totals and footing.
SCROLLHEIGHT=AUTO
In an HFREEZE report, the output will be responsive and automatically fit to the height ofthe output container when the size of the output container changes.
When AUTOFIT=ON, the report automatically fits to the size of the output container (bothvertically and horizontally) when the size of the output container changes.
Note: The AUTOFIT=ON setting will override the SCROLLHEIGHT setting.
22. Using Headings, Footings, Titles, and Labels
Creating Reports With TIBCO® WebFOCUS Language 1543

nn[.n]
Is the height, in inches, of the scrollable area. The default for non-mobile devices is 4inches.
Syntax: How to Create a Scrollable Area in an AHTML Report
TYPE=REPORT,HFREEZE={OFF|ON}, $
where:
HFREEZE=OFF
Does not freeze the heading, column titles, grand totals, and footing. OFF is the defaultvalue.
HFREEZE=ON
Freezes the heading, column titles, grand totals, and footing.
Reference: HFREEZE With Blank Column Titles
The HTML HFREEZE reporting feature supports blank column titles. The vertical HFREEZE scrollbar will be aligned with the first row of report data.
Reference: Usage Notes for Freezing Areas of HTML Report Output
Report headers and footers can be frozen, while the data lines scroll in HTML and AHTMLreports only. For all other output formats, the StyleSheet attribute HFREEZE is ignored. Therequest must include the setting ON TABLE SET HTMLCSS ON, which is the default.
The following HTML features are not supported with HFREEZE:
HFREEZE does not support the placement of images in subheadings and subfootings withinthe frozen area in Internet Explorer. HFREEZE does support the placement of images insubheadings and subfootings within the frozen area in Mozilla Firefox®, Google Chrome™,and Microsoft Edge®.
Accordion reports
WRAP StyleSheet attribute
Custom HTML tags or JavaScript
Compound Reports
Creating Headings and Footings
1544

Reference: Usage Notes for Freezing Areas of AHTML Report Output
Report headers and footers can be frozen, while the data lines scroll in AHTML and HTMLreports only. For all other output formats, the StyleSheet attribute HFREEZE is ignored. Therequest must include the setting ON TABLE SET HTMLCSS ON, which is the default.
The following AHTML features are not supported with HFREEZE:
SET SUBTOTALS=ABOVE and SET SUBTOTALS=BELOW
In a standard AHTML report, the subtotals display below the data lines and the grandtotalrow is anchored at the bottom of the frozen frame. This behavior occurs regardless ofwhether the SET SUBTOTALS command is used.
HFREEZE does not support the placement of images in subheadings and subfootings withinthe frozen area.
Accordion reports
Creating a Sort Heading or Footing
A sort heading is text that precedes a change in a sort field value, identifying the beginning ofa group of related data. A sort footing is text that follows a change in a sort field value,identifying the end of a group of related data.
A sort heading or footing, which appears in the body of a report, helps you identify differentareas of detail in a report. Sort headings or footings can include text, fields, Dialogue Managervariables, images, and spot markers.
By including a WHEN phrase in a request, you can generate a message, implemented as a sortheading or footing, for data that meets the criterion you define. For details on conditionalformatting, see Controlling Report Formatting on page 1221.
If you are using a RECAP command to create subtotal values in a calculation, you can replacethe default RECAP label with a more meaningful sort footing by following the RECAP commandfor a field with a SUBFOOT command for that field. For details about the RECAP command, see Including Totals and Subtotals on page 367.
If one or more data fields are embedded in the sort footing, you can omit a display commandfrom the report request since, by default, data fields in headings and footings are summed. If,however, a request does contain an explicit SUM command and a display field is also specifiedin the sort footing, the field in the sort footing is summed. You can omit the display commandfrom other types of headings and footings as well. Note that the data for headings is takenfrom the first sort group and the data for footings is taken from the last sort group. For relatedinformation, see Limits for Headings and Footings on page 1521.
22. Using Headings, Footings, Titles, and Labels
Creating Reports With TIBCO® WebFOCUS Language 1545

By default, WebFOCUS generates a blank line before a subheading or subfooting. You caneliminate these automatic blank lines by issuing the SET DROPBLNKLINE=ON command.
Reference: Alignment of Subheadings and Subfootings
By default, with SQUEEZE=ON, the right margin used for borders and backcolor forsubheadings and subfootings is defined based on the maximum width of all heading, footing,subheading, and subfooting lines. The length of subheading and subfooting lines is tied to thelengths of the page heading and page footing, not to the size of the data columns in the bodyof the report. The ALIGN-BORDERS=BODY attribute in a StyleSheet allows you to align thesubheadings and subfootings with the data/report body on PDF report output instead of theother heading elements.
Creating Headings and Footings
1546
Syntax: How to Create a Sort Heading
Each heading or footing line must begin and end with a double quotation mark, unless you areusing the line continuation spot marker (<ox).
BY fieldname SUBHEAD [NEWPAGE] "content ... "["content ... "]...["content ... "][WHEN expression;]BY fieldname ON fieldname SUBHEAD [NEWPAGE] "content ... "["content ... "]...["content ... "][WHEN expression;]
OR
BY fieldname ON fieldname SUBHEAD [NEWPAGE] "content ... "["content ... "]...["content ... "][WHEN expression;]
where:
fieldnameIs the sort field before which the heading text appears.
contentHeading or footing content can include the following elements, between doublequotation marks. (If the ending quotation mark is omitted, all subsequent lines of therequest are treated as part of the heading.)
textIs text for the sort heading. You can include multiple lines of text.
The text must start on a line by itself, following the SUBHEAD command.
Text can be combined with variables and spot markers.
For related information, see Limits for Headings and Footings on page 1521.
22. Using Headings, Footings, Titles, and Labels
Creating Reports With TIBCO® WebFOCUS Language 1547
variableCan be any one of, or a combination of, the following:
Fields (real data source fields, virtual fields created with the DEFINE command in aMaster File or report request, calculated values created with the COMPUTE commandin a request, or a system field such as TABPAGENO). You can qualify data sourcefields with certain prefix operators.
Dialogue Manager variables.
Images. You can include images in a heading or footing.
For details, see Including an Element in a Heading or Footing on page 1559.
spot markerEnables you to position items, to identify items to be formatted, and to extendcode beyond the 80-character line limit of the text editor.
<+0> divides a heading or footing into items for formatting. For details, see Identifyinga Heading, Footing, Title, or FML Free Text on page 1275.
</n specifies skipped lines. For details, see Controlling the Vertical Positioning of aHeading or Footing on page 1687.
<-n to position the next character on the line. For details, see Using Spot Markers toRefine Positioning on page 1682.
<0X continues a heading or footing specification on the next line of the request. Fordetails, see Extending Heading and Footing Code to Multiple Lines in a Report Requeston page 1522.
Note: When a closing spot marker is immediately followed by an opening spot marker(><), a single space text item will be placed between the two spot markers (> <). Thismust be considered when applying formatting.
WHEN expression Specifies a condition under which a sort heading is displayed, as determined by alogical expression. You must place the WHEN phrase on a line following the text.
For details on conditional formatting, see Controlling Report Formatting on page 1221. Forrelated information, see Using Expressions on page 429.
Blank lines
If you omit all text, variables, and spot markers, you have a blank heading or footingline (for example, " ") which you can use to skip a line in the heading or footing. (Youcan also skip a line using a vertical spot marker, such as </1.)
NEWPAGE
Inserts a new page after the sort heading. Column titles appear on every page.
Creating Headings and Footings
1548

You can use NEWPAGE with PDF reports.In HTML reports, blank space is added instead ofa new page.
Example: Creating a Sort Heading When a Product Description Changes
This request displays a sort heading each time the product description changes. The sortheading includes text and an embedded field.
TABLE FILE GGPRODSPRINT PACKAGE_TYPE AND UNIT_PRICEWHERE UNIT_PRICE GT 50BY PRODUCT_DESCRIPTION NOPRINT BY PRODUCT_ID ON PRODUCT_DESCRIPTION SUBHEAD"Summary for <PRODUCT_DESCRIPTION" ON TABLE SET PAGE-NUM OFFON TABLE SET ONLINE-FMT HTMLON TABLE SET STYLESHEET *TYPE=REPORT, GRID=OFF, $ENDSTYLEEND
The sort heading identifies the product that the next line of data applies to.
See Including a Field Value in a Heading or Footing on page 1560 for information onembedded field values.
22. Using Headings, Footings, Titles, and Labels
Creating Reports With TIBCO® WebFOCUS Language 1549

Example: Creating a Conditional Sort Heading
This request displays a sort heading for a category only if its sales fall below $17,000,000.
TABLE FILE GGSALESSUM DOLLARS BY CATEGORY SUBHEAD"<CATEGORY ALERT: SALES FALL BELOW $17,000,000"WHEN DOLLARS LT 17000000; ON TABLE SET PAGE-NUM OFFON TABLE SET ONLINE-FMT HTMLON TABLE SET STYLESHEET *TYPE=REPORT, GRID=OFF, $ENDSTYLEEND
Sales for the category Gifts fall below the specified amount, as the sort heading warns. Noother category is preceded by a sort heading.
See Including a Field Value in a Heading or Footing on page 1560 for information onembedded field values.
Creating Headings and Footings
1550

Syntax: How to Create a Sort Footing
Each heading or footing line must begin and end with a double quotation mark.
For a single sort field, use the syntax
BY fieldname SUBFOOT [WITHIN] [MULTILINES] [NEWPAGE] "content ... "["content ... "]...["content ... "][WHEN expression;]BY fieldname ON fieldname SUBFOOT [WITHIN] [MULTILINES] [NEWPAGE] "content ... "["content ... "]...["content ... "][WHEN expression;]
For multiple sort fields, use the syntax
BY fieldname ON fieldname SUBFOOT [MULTILINES] [NEWPAGE] "content ... "["content ... "]...["content ... "][WHEN expression;]
where:
fieldnameIs the sort field after which the footing text appears.
WITHIN
Causes the fields in the SUBFOOT to be calculated within each value of fieldname.Without this option, a field in the SUBFOOT is taken from the last line of report outputabove the subfooting.
MULTILINES
Suppresses the sort footing when there is only one line of data for a sort field value.(MULTI-LINES is a synonym for MULTILINES.)
22. Using Headings, Footings, Titles, and Labels
Creating Reports With TIBCO® WebFOCUS Language 1551

contentHeading or footing content can include the following elements, between doublequotation marks. (If the ending quotation mark is omitted, all subsequent lines of therequest are treated as part of the sort footing.)
textIs text that appears on the first page of a report. You can include multiple lines oftext.
The text must start on a line by itself, following the SUBFOOT command.
Text can be combined with variables and spot markers.
For related information, see Limits for Headings and Footings on page 1521.
variableCan be any one or a combination of the following:
Fields (real data source fields, a virtual fields created with the DEFINE command in aMaster File or report request, calculated values created with the COMPUTE commandin a request, a system field such as TABPAGENO). You can qualify data source fieldswith certain prefix operators.
Dialogue Manager variables.
Images. You can include images in a heading or footing.
For details, see Including an Element in a Heading or Footing on page 1559.
spot markerEnables you to position items, to identify items to be formatted, and to extendcode beyond the 80-character line limit of the text editor.
<+0> divides a heading or footing into items for formatting. For details, see Identifyinga Heading, Footing, Title, or FML Free Text on page 1275.
</n specifies skipped lines. For details, see Controlling the Vertical Positioning of aHeading or Footing on page 1687.
<-n to position the next character on the line. For details, see Using Spot Markers toRefine Positioning on page 1682.
<0X continues a heading or footing specification on the next line of the request. Fordetails, see Extending Heading and Footing Code to Multiple Lines in a Report Requeston page 1522.
Note: When a closing spot marker is immediately followed by an opening spot marker(><), a single space text item will be placed between the two spot markers (> <). Thismust be considered when applying formatting.
Creating Headings and Footings
1552

WHEN expression Specifies a condition under which a sort footing is displayed, as determined by alogical expression. You must place the WHEN phrase on a line following the text.
For details on conditional formatting, see Controlling Report Formatting on page 1221. Forrelated information, see Using Expressions on page 429.
Blank lines
If you omit all text, variables, and spot markers, you have a blank heading or footingline (for example, " ") which you can use to skip a line in the heading or footing. (Youcan also skip a line using a vertical spot marker, such as </1.)
NEWPAGE
Inserts a new page before the sort footing.
22. Using Headings, Footings, Titles, and Labels
Creating Reports With TIBCO® WebFOCUS Language 1553

Example: Creating a Sort Footing When a Product Description Changes
This request displays a sort footing each time the product description changes.
TABLE FILE GGPRODSPRINT PACKAGE_TYPE AND UNIT_PRICEWHERE UNIT_PRICE GT 50BY PRODUCT_DESCRIPTION NOPRINT BY PRODUCT_ID ON PRODUCT_DESCRIPTION SUBFOOT"Summary for <PRODUCT_DESCRIPTION" ON TABLE SET PAGE-NUM OFFON TABLE SET ONLINE-FMT HTMLON TABLE SET STYLESHEET *TYPE=REPORT, GRID=OFF, $ENDSTYLEEND
See How to Include a Field Value in a Heading or Footing on page 1560 for information onembedded field values.
Creating Headings and Footings
1554

Example: Creating a Conditional Sort Footing With Multiple Sort Options
This report lists orders, order dates, and order totals for the Century Corporation. It usesconditional sort footings to distinguish between orders that total more than $200,000 andless than $200,000.
Notice that one sort phrase (ON ORDER_NUM) specifies several sort-related options (twodifferent SUBFOOT phrases), and that each option has its own WHEN phrase.
TABLE FILE CENTORDHEADING"Order Revenue"" "SUM ORDER_DATE LINEPRICE AS 'Order,Total:'BY HIGHEST 5 ORDER_NUM ON ORDER_NUM SUBFOOT "--- Order total is less than $200,000 ---" " " WHEN LINEPRICE LT 200000; SUBFOOT "+++ Order total is greater than or equal to $200,000 +++" " " WHEN LINEPRICE GE 200000; ON TABLE SET PAGE-NUM OFFON TABLE SET ONLINE-FMT HTMLON TABLE SET STYLESHEET *TYPE=REPORT, GRID=OFF, $ENDSTYLEEND
22. Using Headings, Footings, Titles, and Labels
Creating Reports With TIBCO® WebFOCUS Language 1555

The following report appears.
Example: Suppressing a Sort Footing
This request suppresses the sort footing for any product that has only one line of data (that is,a product that was only ordered one time on 01/01/96).
TABLE FILE GGORDERPRINT QUANTITYBY PRODUCT_CODE NOPRINT BY PRODUCT_DESCRIPTIONWHERE ORDER_DATE EQ '01/01/96'WHERE STORE_CODE EQ 'R1019'WHERE PRODUCT_DESCRIPTION EQ 'Hazelnut' OR 'Biscotti' OR 'Croissant' ON PRODUCT_CODE SUBFOOT MULTILINES"<PRODUCT_DESCRIPTION has multiple orders." ON TABLE SET PAGE-NUM OFFON TABLE SET ONLINE-FMT HTMLON TABLE SET STYLESHEET *TYPE=REPORT, GRID=OFF, $ENDSTYLEEND
Creating Headings and Footings
1556

In the output, the sort footing for Biscotti is suppressed.
Example: Replacing the Default RECAP Label With a Sort Footing
In this request, a SUBFOOT command for the field DEPARTMENT follows a RECAP command forthat field. The RECAP command creates subtotal values for the calculation.
TABLE FILE SHORTSUM BALANCE AS 'Dollars' ENGLAND_POUND AS 'Sterling'BY REGIONWHERE REGION EQ 'FAR EAST' OR 'CENTRAL AMERICA' OR 'WESTERN EUROPE';BY COUNTRY NOPRINTRECAP EURO/D16=BALANCE * 1.03;SUBFOOT" ""Balance of investments for <COUNTRY> in Euros is <EURO>."" "END
22. Using Headings, Footings, Titles, and Labels
Creating Reports With TIBCO® WebFOCUS Language 1557

The sort footing text (for example, "Balance of investments for FRANCE in Euros is87,336,971.") replaces the default label for the RECAP value (** EURO 87,336,971).
Creating Headings and Footings
1558

Example: Omitting a Display Command in a Sort Footing
This request creates a complete report as a sort footing. It does not require a displaycommand because the sort footing content contains the data fields DEPARTMENT andSALARY. By default, the field SALARY is summed in the sort footing.
TABLE FILE EMPLOYEE BY DEPARTMENT NOPRINT SUBFOOT"<DEPARTMENT DEPARTMENT TOTAL SALARY IS <SALARY" ON TABLE SET PAGE-NUM OFFON TABLE SET ONLINE-FMT HTMLON TABLE SET STYLESHEET *TYPE=REPORT, GRID=OFF, $ENDSTYLEEND
The output is:
Reference: Usage Notes for Subfoots
SUBFOOT WITHIN is useful where a prefixed field within a sort break would result in a singlevalue (for example, AVE., MIN, MAX). Use of PCT. or APCT. displays only the last value fromthe sort group.
SUBFOOT WITHIN "<prefix.fieldname " does not result in the same value as SUBTOTALprefix. The SUBFOOT WITHIN creates a display field that operates on the original inputrecords. SUBTOTAL with a prefix operates on the internal matrix (so AVE. is the average ofthe SUMS or, if a display field had the prefix AVE., the average of the averages). SUBFOOTWITHIN "<AVE.field " generates an overall average.
Prefix operators are not supported on alphanumeric fields in a WITHIN phrase.
The ST. prefix operator is not supported in a SUBFOOT WITHIN phrase.
Including an Element in a Heading or Footing
You can customize a heading or footing by including:
A field value. See Including a Field Value in a Heading or Footing on page 1560 and Including a Text Field in a Heading or Footing on page 1567.
22. Using Headings, Footings, Titles, and Labels
Creating Reports With TIBCO® WebFOCUS Language 1559

A page number. See Including a Page Number in a Heading or Footing on page 1569.
A Dialogue Manager variable. See Including a Dialogue Manager Variable in a Heading orFooting on page 1569.
An image. See Including an Image in a Heading or Footing on page 1571.
Including a Field Value in a Heading or Footing
You can include a field name in heading or footing text. When the request is run, the outputincludes the field value. The result is a customized heading or footing with specific dataidentification for the user.
While you can use this technique in any report, it is essential if you are creating a free-formreport. For details, see Creating a Free-Form Report on page 1899.
For requests with multiple display and sort field sets, fields in a report heading or footing, orpage heading or footing, are evaluated as if they were objects of the first display command.Fields in a sort heading or footing are evaluated as part of the first display command in whichthey are referenced. If a field is not referenced, it is evaluated as part of the last displaycommand.
You can use a prefix operator to derive a field value in a heading or footing. However, the DST.,MDE., and MDN. prefix operators are not supported in headings or footings in requests thathave an ACROSS phrase or multiple display commands. For a list of operations you canperform with prefix operators, see Displaying Report Data on page 39.
Two operators are specifically designed for use with a sort footing:
ST. produces a subtotal value of a numeric field at a sort break in a report.
CT. produces a cumulative total of a numeric field.
Syntax: How to Include a Field Value in a Heading or Footing
<[prefix_operator]fieldname<fieldname[>]
or
<fieldname[>]
where:
<fieldnamePlaces the field value in the heading or footing, and suppresses trailing blanks in analphanumeric field for all values of SET STYLEMODE.
Including an Element in a Heading or Footing
1560
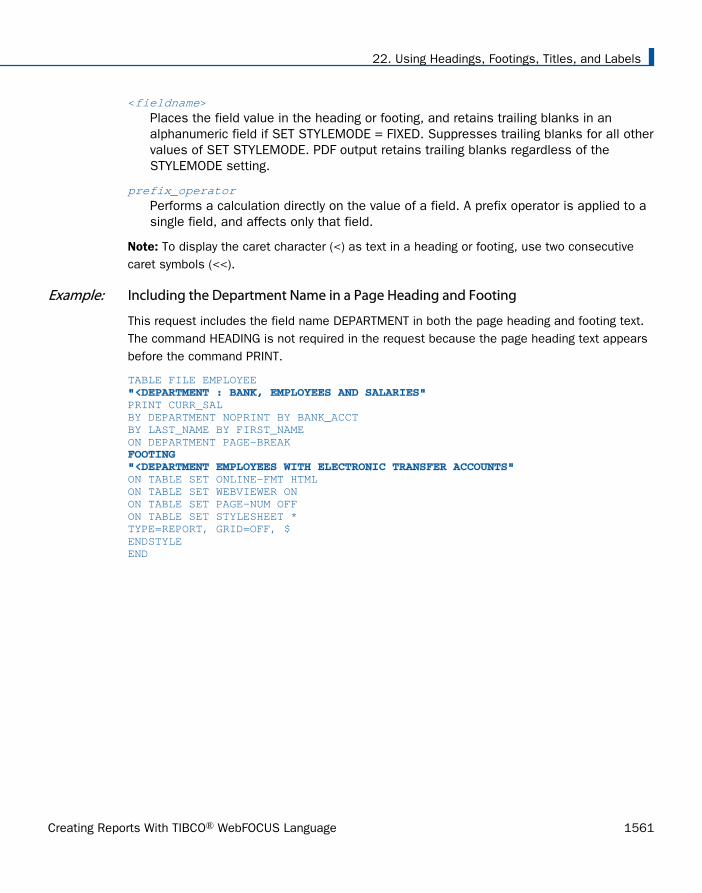
<fieldname>Places the field value in the heading or footing, and retains trailing blanks in analphanumeric field if SET STYLEMODE = FIXED. Suppresses trailing blanks for all othervalues of SET STYLEMODE. PDF output retains trailing blanks regardless of theSTYLEMODE setting.
prefix_operatorPerforms a calculation directly on the value of a field. A prefix operator is applied to asingle field, and affects only that field.
Note: To display the caret character (<) as text in a heading or footing, use two consecutivecaret symbols (<<).
Example: Including the Department Name in a Page Heading and Footing
This request includes the field name DEPARTMENT in both the page heading and footing text.The command HEADING is not required in the request because the page heading text appearsbefore the command PRINT.
TABLE FILE EMPLOYEE "<DEPARTMENT : BANK, EMPLOYEES AND SALARIES" PRINT CURR_SALBY DEPARTMENT NOPRINT BY BANK_ACCTBY LAST_NAME BY FIRST_NAMEON DEPARTMENT PAGE-BREAK FOOTING"<DEPARTMENT EMPLOYEES WITH ELECTRONIC TRANSFER ACCOUNTS" ON TABLE SET ONLINE-FMT HTMLON TABLE SET WEBVIEWER ONON TABLE SET PAGE-NUM OFFON TABLE SET STYLESHEET *TYPE=REPORT, GRID=OFF, $ENDSTYLEEND
22. Using Headings, Footings, Titles, and Labels
Creating Reports With TIBCO® WebFOCUS Language 1561
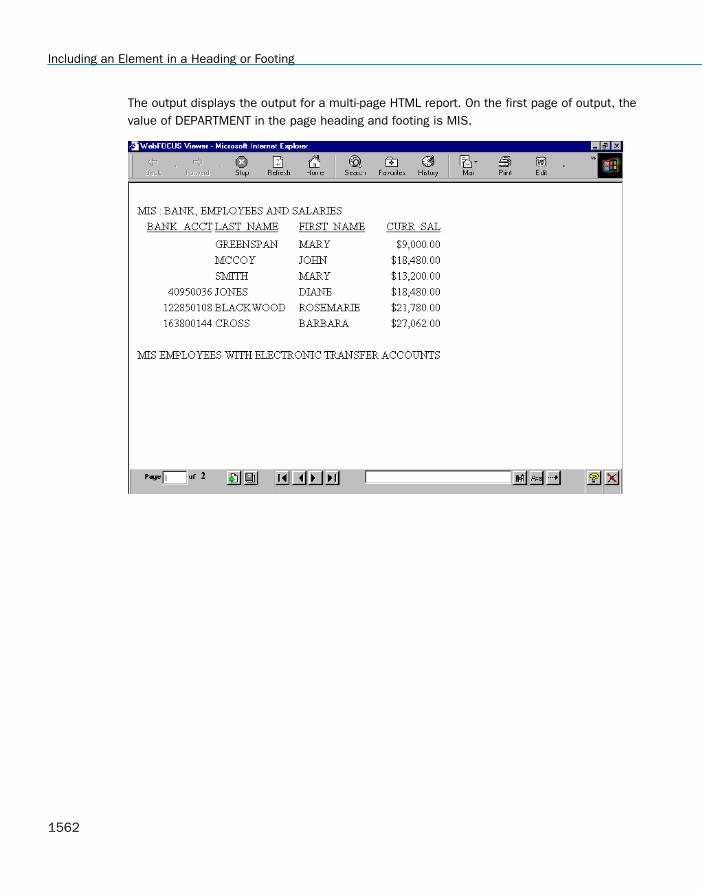
The output displays the output for a multi-page HTML report. On the first page of output, thevalue of DEPARTMENT in the page heading and footing is MIS.
Including an Element in a Heading or Footing
1562

On the second page of output, the value of DEPARTMENT is PRODUCTION.
Note: If you do not see the navigation arrows, click the maximize button.
Example: Displaying a Less Than Symbol in a Heading
The following request computes the difference between REVENUE_US and COGS_US anddisplays those rows in which the difference is less than 100,000.
TABLE FILE WF_RETAIL_LITEHEADING CENTER" Difference << 100,000"" "SUM COGS_US REVENUE_US COMPUTE Difference/D20.2 = REVENUE_US - COGS_US;BY PRODUCT_CATEGORYWHERE TOTAL Difference LT 100000ON TABLE SET PAGE NOLEADON TABLE SET STYLE *GRID=OFF,$ENDSTYLEEND
22. Using Headings, Footings, Titles, and Labels
Creating Reports With TIBCO® WebFOCUS Language 1563

The heading displays the text Difference < 100,000, as shown in the following image.
Example: Retaining Trailing Blanks in an Alphanumeric Field
Trailing blanks are not retained in standard HTML output. When the output type is HTML,STYLEMODE is set to FULL by default. To retain trailing blanks in the alphanumeric fieldDEPARTMENT, the STYLEMODE setting has been changed to FIXED in this request and thedelimiters < and > have been included around the field name in the sort footing text.
SET STYLEMODE = FIXEDTABLE FILE EMPLOYEESUM SALARY BY DEPARTMENT SUBFOOT"<DEPARTMENT> DEPARTMENT TOTAL SALARY IS <SALARY" ON TABLE SET PAGE-NUM OFFON TABLE SET ONLINE-FMT HTMLON TABLE SET STYLESHEET *TYPE=REPORT, GRID=OFF, $ENDSTYLEEND
Values for DEPARTMENT appear in the sort footing as MIS and PRODUCTION.
Note: SET STYLEMODE=FIXED turns off the HTML formatting of your browser for that report.The resulting report displays in a fixed font without colors and other web capabilities.
Including an Element in a Heading or Footing
1564
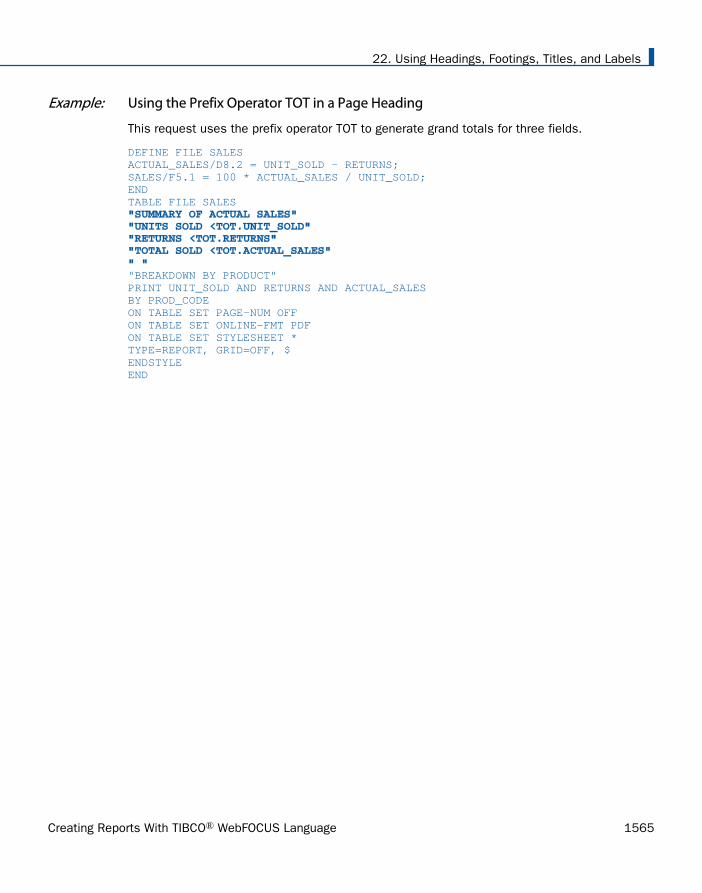
Example: Using the Prefix Operator TOT in a Page Heading
This request uses the prefix operator TOT to generate grand totals for three fields.
DEFINE FILE SALESACTUAL_SALES/D8.2 = UNIT_SOLD - RETURNS;SALES/F5.1 = 100 * ACTUAL_SALES / UNIT_SOLD;ENDTABLE FILE SALES "SUMMARY OF ACTUAL SALES""UNITS SOLD <TOT.UNIT_SOLD""RETURNS <TOT.RETURNS""TOTAL SOLD <TOT.ACTUAL_SALES"" " "BREAKDOWN BY PRODUCT"PRINT UNIT_SOLD AND RETURNS AND ACTUAL_SALESBY PROD_CODEON TABLE SET PAGE-NUM OFFON TABLE SET ONLINE-FMT PDFON TABLE SET STYLESHEET *TYPE=REPORT, GRID=OFF, $ENDSTYLEEND
22. Using Headings, Footings, Titles, and Labels
Creating Reports With TIBCO® WebFOCUS Language 1565

The totals appear in the page heading.
Example: Using Multiple Prefix Operators in a Page Heading
This request uses the prefix operators MAX, MIN, AVE, and TOT. It does not require a displaycommand because the page heading text contains data fields.
TABLE FILE SALES "MOST UNITS SOLD WERE <MAX.UNIT_SOLD""LEAST UNITS SOLD WERE <MIN.UNIT_SOLD""AVERAGE UNITS SOLD WERE <AVE.UNIT_SOLD""TOTAL UNITS SOLD WERE <TOT.UNIT_SOLD" ON TABLE SET PAGE-NUM OFFON TABLE SET ONLINE-FMT HTMLON TABLE SET STYLESHEET *TYPE=REPORT, GRID=OFF, $ENDSTYLEEND
Including an Element in a Heading or Footing
1566

The prefix operators generate summary data in the page heading.
Example: Using Multiple Prefix Operators in a Sort Footing
This request uses the prefix operators CNT and AVE in a sort footing. The output does notcontain columns of data. All data is included in the sort footing itself.
TABLE FILE EMPLOYEE BY DEPARTMENT NOPRINT SUBFOOT"NUMBER OF EMPLOYEES IN DEPARTMENT <DEPARTMENT = <CNT.LAST_NAME""WITH AVERAGE SALARY OF <AVE.CURR_SAL" ON TABLE SET ONLINE-FMT HTMLON TABLE SET PAGE-NUM OFFON TABLE SET STYLESHEET *TYPE=REPORT, GRID=OFF, $ENDSTYLEEND
The sort footing is a summary report on the number of employees in a department and theiraverage salary.
The prefix operators generate summary data in the page heading.
NUMBER OF EMPLOYEES IN DEPARTMENT MIS = 6WITH AVERAGE SALARY OF $18,000.33NUMBER OF EMPLOYEES IN DEPARTMENT PRODUCTION = 6WITH AVERAGE SALARY OF $19,047.00
Including a Text Field in a Heading or Footing
You can include one or more text fields in a heading or footing. A text field has the attributeFORMAT=TXn in a Master File.
Reference: Limits for Text Fields in a Heading or Footing
You cannot embed a text field in a Financial Modeling Language (FML) report. For details,see Creating Financial Reports With Financial Modeling Language (FML) on page 1817.
You cannot apply the StyleSheet attribute WRAP to a text field, since a text field isseparated into multiple lines by the character count specified in the FORMAT attribute inthe Master File.
22. Using Headings, Footings, Titles, and Labels
Creating Reports With TIBCO® WebFOCUS Language 1567

Syntax: How to Include a Text Field in a Heading or Footing
<TEXTFLD
Example: Including a Text Field in a Sort Footing
In this example, you create a Master File named TXTFLD.MAS and a corresponding FOCUS datasource named TXTFLD.FOC.
1. Create and save the Master File.
FILENAME = TXTFLD, SUFFIX = FOC,$SEGNAME=TXTSEG, SEGTYPE = S1,$ FIELDNAME = CATALOG, FORMAT = A10, $ FIELDNAME = TEXTFLD, FORMAT = TX50,$
2. Create and save the following MODIFY procedure. This procedure creates and populatesthe data source in a Windows environment.
CREATE FILE TXTFLDMODIFY FILE TXTFLDFIXFORM CATALOG/10 TEXTFLDDATACOURSE100 This course provides the junior programmerwith the skills needed to code simple reports.%$COURSE200 This course provides the advanced programmer withtechniques helpful in developing complexapplications.%$END
3. Run the MODIFY procedure to populate the data source.
4. Create and save the following report request.
TABLE FILE TXTFLD BY CATALOG SUBFOOT"<TEXTFLD" ON TABLE SET PAGE-NUM OFFON TABLE SET ONLINE-FMT HTMLON TABLE SET STYLESHEET *TYPE=REPORT, GRID=OFF,$ENDSTYLEEND
5. Run the report request.
Including an Element in a Heading or Footing
1568
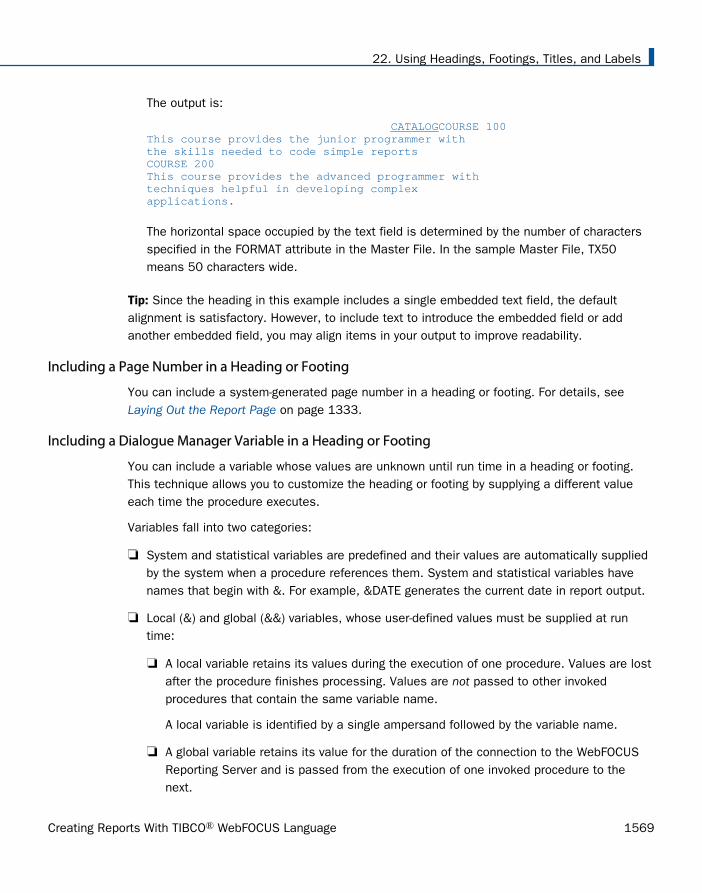
The output is:
CATALOGCOURSE 100This course provides the junior programmer withthe skills needed to code simple reportsCOURSE 200This course provides the advanced programmer withtechniques helpful in developing complex applications.
The horizontal space occupied by the text field is determined by the number of charactersspecified in the FORMAT attribute in the Master File. In the sample Master File, TX50means 50 characters wide.
Tip: Since the heading in this example includes a single embedded text field, the defaultalignment is satisfactory. However, to include text to introduce the embedded field or addanother embedded field, you may align items in your output to improve readability.
Including a Page Number in a Heading or Footing
You can include a system-generated page number in a heading or footing. For details, see Laying Out the Report Page on page 1333.
Including a Dialogue Manager Variable in a Heading or Footing
You can include a variable whose values are unknown until run time in a heading or footing.This technique allows you to customize the heading or footing by supplying a different valueeach time the procedure executes.
Variables fall into two categories:
System and statistical variables are predefined and their values are automatically suppliedby the system when a procedure references them. System and statistical variables havenames that begin with &. For example, &DATE generates the current date in report output.
Local (&) and global (&&) variables, whose user-defined values must be supplied at runtime:
A local variable retains its values during the execution of one procedure. Values are lostafter the procedure finishes processing. Values are not passed to other invokedprocedures that contain the same variable name.
A local variable is identified by a single ampersand followed by the variable name.
A global variable retains its value for the duration of the connection to the WebFOCUSReporting Server and is passed from the execution of one invoked procedure to thenext.
22. Using Headings, Footings, Titles, and Labels
Creating Reports With TIBCO® WebFOCUS Language 1569
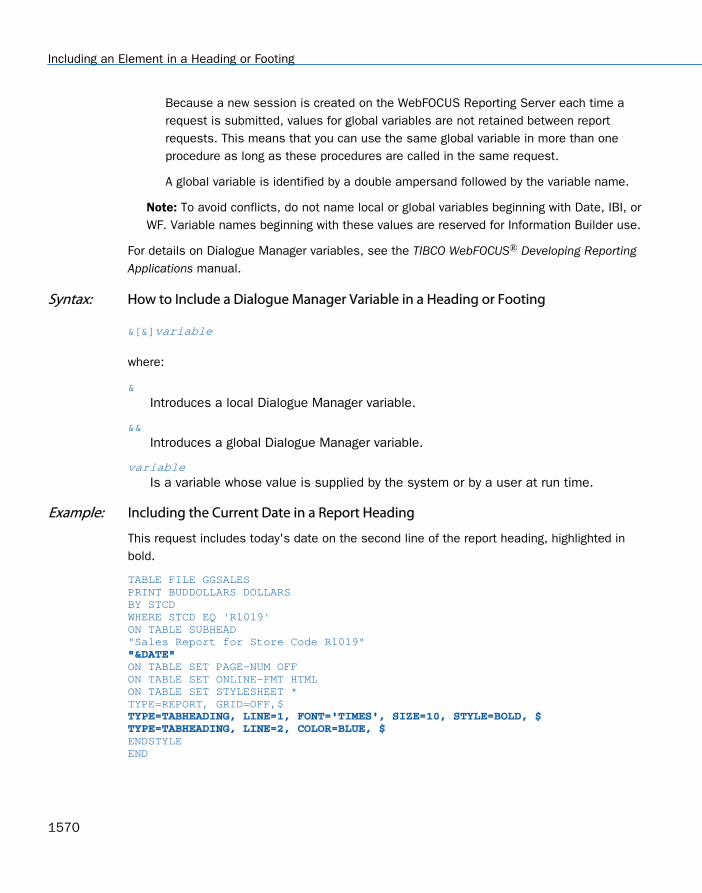
Because a new session is created on the WebFOCUS Reporting Server each time arequest is submitted, values for global variables are not retained between reportrequests. This means that you can use the same global variable in more than oneprocedure as long as these procedures are called in the same request.
A global variable is identified by a double ampersand followed by the variable name.
Note: To avoid conflicts, do not name local or global variables beginning with Date, IBI, orWF. Variable names beginning with these values are reserved for Information Builder use.
For details on Dialogue Manager variables, see the TIBCO WebFOCUS® Developing ReportingApplications manual.
Syntax: How to Include a Dialogue Manager Variable in a Heading or Footing
&[&]variable
where:
&
Introduces a local Dialogue Manager variable.
&&
Introduces a global Dialogue Manager variable.
variableIs a variable whose value is supplied by the system or by a user at run time.
Example: Including the Current Date in a Report Heading
This request includes today's date on the second line of the report heading, highlighted inbold.
TABLE FILE GGSALESPRINT BUDDOLLARS DOLLARSBY STCDWHERE STCD EQ 'R1019'ON TABLE SUBHEAD"Sales Report for Store Code R1019" "&DATE" ON TABLE SET PAGE-NUM OFFON TABLE SET ONLINE-FMT HTMLON TABLE SET STYLESHEET *TYPE=REPORT, GRID=OFF,$ TYPE=TABHEADING, LINE=1, FONT='TIMES', SIZE=10, STYLE=BOLD, $TYPE=TABHEADING, LINE=2, COLOR=BLUE, $ ENDSTYLEEND
Including an Element in a Heading or Footing
1570

The output is:
Note: You can modify the format of the date. Some formats are:
Variable Display Format
&DATEtrMMDYY 2002, December 11
&DATEMDYY 12/11/2002
&DATEtrMDYY December 11, 2002
&DATEQYY Q4 2002
Including an Image in a Heading or Footing
A StyleSheet enables you to include an image in a heading or footing. An image, such as alogo, gives corporate identity to a report, or provides visual appeal.
For details on adding and positioning images, see Laying Out the Report Page on page 1333.
22. Using Headings, Footings, Titles, and Labels
Creating Reports With TIBCO® WebFOCUS Language 1571

Displaying Syntax Components in Heading and Footing Objects
You can automatically display syntax components from your report or chart request in headingand footing objects by adding one or more of the following attributes:
<REQUEST.FILTERS. Lists the WHERE and IF conditions in the request.
<REQUEST.VERB_OBJECTS. Lists the display fields referenced in the request.
<REQUEST.SORT_KEYS. Lists all sort fields in the request.
<REQUEST.BYKEYS. Lists all BY sort fields in the request.
<REQUEST.ACROSSKEYS. Lists all ACROSS sort fields in the request.
<REQUEST.VERB_OBJECTS_CONTEXT. Lists the display command syntax used for eachdisplay field.
<REQUEST.SORT_KEYS_CONTEXT. Lists all sort phrases in the request.
Note: The syntax component breaks onto multiple lines if the heading line length extendsbeyond the width of the report or chart container.
Displaying Syntax Components in Heading and Footing Objects
1572

Example: Displaying Report Syntax Components
The following request displays all available syntax components from the report request in theheading. The spot markers (<+0>) are used to separate heading items so they can be styledseparately in the StyleSheet.
TABLE FILE WF_RETAIL_LITEHEADING"Display Objects: <+0> <REQUEST.VERB_OBJECTS""Sort Fields: <+0> <REQUEST.SORT_KEYS""BY Fields: <+0> <REQUEST.BYKEYS""ACROSS Fields: <+0> <REQUEST.ACROSSKEYS""Filters: <+0> <REQUEST.FILTERS"" ""Display Commands: <+0> <REQUEST.VERB_OBJECTS_CONTEXT""Sort Phrases: <+0> <REQUEST.SORT_KEYS_CONTEXT" "" "SUM COGS_US REVENUE_US COMPUTE RATIO/D12.2=REVENUE_US/COGS_US;BY PRODUCT_CATEGORY SUBTOTAL COGS_USACROSS BUSINESS_REGION ACROSS-TOTALWHERE BUSINESS_REGION NE 'Oceania'ON TABLE SET PAGE NOLEADON TABLE SET STYLE *TYPE=REPORT, COLOR = BLUE, SIZE=10, GRID=OFF,$TYPE=HEADING, ITEM=1, OBJECT=TEXT, FONT=Courier, COLOR=BLUE, STYLE=BOLD,$TYPE=HEADING, ITEM=2, FONT=Courier, COLOR=TEAL, STYLE=ITALIC,$TYPE=TITLE, FONT=ARIAL, STYLE=BOLD, COLOR=NAVY,$TYPE=ACROSSTITLE, FONT=ARIAL, STYLE=BOLD, COLOR=NAVY,$TYPE=ACROSSVALUE, FONT=ARIAL, STYLE=ITALIC, COLOR=NAVY, SIZE=10,$ENDSTYLEEND
22. Using Headings, Footings, Titles, and Labels
Creating Reports With TIBCO® WebFOCUS Language 1573
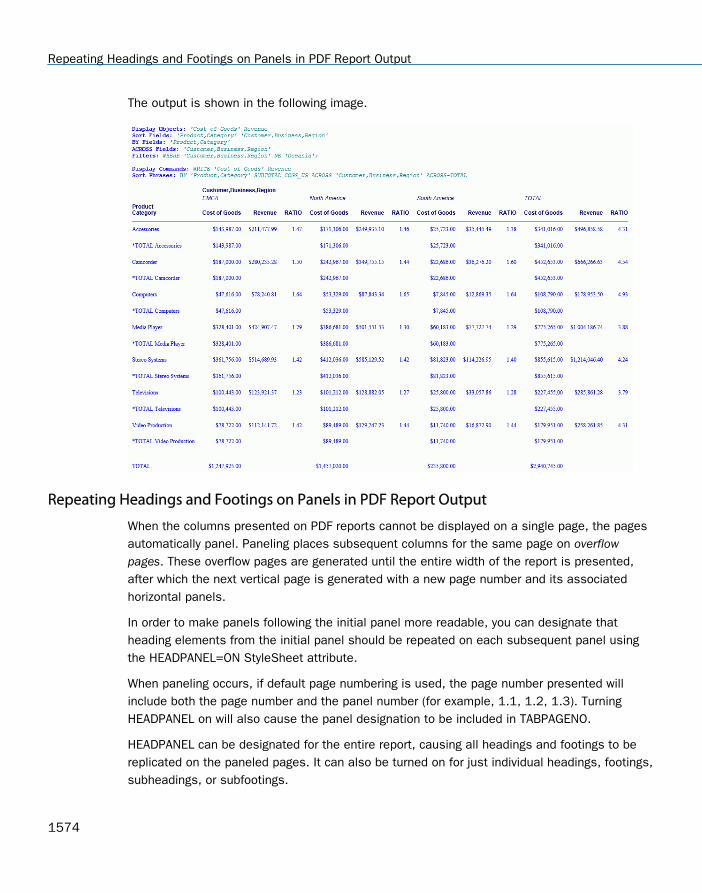
The output is shown in the following image.
Repeating Headings and Footings on Panels in PDF Report Output
When the columns presented on PDF reports cannot be displayed on a single page, the pagesautomatically panel. Paneling places subsequent columns for the same page on overflowpages. These overflow pages are generated until the entire width of the report is presented,after which the next vertical page is generated with a new page number and its associatedhorizontal panels.
In order to make panels following the initial panel more readable, you can designate thatheading elements from the initial panel should be repeated on each subsequent panel usingthe HEADPANEL=ON StyleSheet attribute.
When paneling occurs, if default page numbering is used, the page number presented willinclude both the page number and the panel number (for example, 1.1, 1.2, 1.3). TurningHEADPANEL on will also cause the panel designation to be included in TABPAGENO.
HEADPANEL can be designated for the entire report, causing all headings and footings to bereplicated on the paneled pages. It can also be turned on for just individual headings, footings,subheadings, or subfootings.
Repeating Headings and Footings on Panels in PDF Report Output
1574
HEADPANEL causes borders from the initial page to be replicated on the paneled pages.Additional control of subheading and subfooting borders can be gained through the use ofALIGN-BORDERS which allows for the designation that subitem borders should align with thebody of the data rather than the page or report headings. For more information about usingALIGN-BORDERS with HEADPANEL see How to Align Subheading and Subfooting Margins Withthe Report Body on page 1420.
Syntax: How to Repeat Heading Elements on Panels
TYPE={REPORT|headfoot [BY=sortcolumn]}, HEADPANEL={ON|OFF}, $
where:
REPORT
Repeats all report headings, footings, page headings, page footings, subheadings,and subfootings.
headfootIdentifies a heading or footing. Select from:
TABHEADING, which is a report heading. This appears once at the beginning of thereport and is generated by ON TABLE SUBHEAD.
TABFOOTING, which is a report footing. This appears once at the end of the report andis generated by ON TABLE SUBFOOT.
HEADING, which is a page heading. This appears at the top of every report page and isgenerated by HEADING.
FOOTING, which is a page footing. This appears at the bottom of every report page andis generated by FOOTING.
SUBHEAD, which is a sort heading. This appears at the beginning of a vertical (BY) sortgroup (generated by ON sortfield SUBHEAD).
SUBFOOT, which is a sort footing. This appears at the end of a vertical (BY) sort group(generated by ON sortfield SUBFOOT).
BY
When there are several sort headings or sort footings, each associated with adifferent vertical sort (BY) column, this enables you to identify which sort heading orsort footing you wish to format.
If there are several sort headings or sort footings associated with different vertical sort(BY) columns, and you omit this attribute and value, the formatting will be applied to all ofthe sort headings or footings.
22. Using Headings, Footings, Titles, and Labels
Creating Reports With TIBCO® WebFOCUS Language 1575

sortcolumnSpecifies the vertical sort (BY) column associated with one of the report sort headingsor sort footings.
ON
Repeats the specified heading or footing elements on each panel.
OFF
Displays heading or footing elements on the first panel only. OFF is the default value.
Note that the HEADPANEL=ON attribute can only be applied to the entire heading or footing,not individual lines or items within the heading or footing.
Example: Repeating All Headings and Footings on Report Panels
The following request against the GGSALES data source sums units sold, budgeted units sold,dollar sales, and budgeted sales by region, state, city, category, and product. The report has apage heading and, for each region, a subfooting.
TABLE FILE GGSALESHEADING"PRODUCT SALES REPORT""""Page<TABPAGENO"""SUM UNITS BUDUNITS DOLLARS BUDDOLLARSBY REGION NOPRINTBY ST BY CATEGORY BY PRODUCTON REGION SUBFOOT" "" SUBFOOT FOR REGION <REGION "" SUBTOTAL BUDDOLLARS: <ST.BUDDOLLARS SUBTOTAL DOLLARS: <ST.DOLLARS "" "ON TABLE SET BYPANEL ONON TABLE SET PAGE ONON TABLE PCHOLD FORMAT PDFON TABLE SET STYLE *TYPE=REPORT, GRID=OFF, $TYPE = REPORT, HEADPANEL=OFF,$ENDSTYLEEND
The request sets BYPANEL ON, so each panel displays the sort field values. However, sinceHEADPANEL=OFF for the entire report, the first panel for page 1 has the heading and thesubfooting, but the second panel does not.
Repeating Headings and Footings on Panels in PDF Report Output
1576

The output for page 1 panel 1 has the heading and subfooting, as shown in the followingimage. Note that with HEADPANEL=OFF, TABPAGENO does not include the panel number.
22. Using Headings, Footings, Titles, and Labels
Creating Reports With TIBCO® WebFOCUS Language 1577

The output for page 1 panel 2 does not have the heading or subfooting, as shown in thefollowing image.
Repeating Headings and Footings on Panels in PDF Report Output
1578

The following output shows panels 1 and 2 if the StyleSheet declaration is changed to setHEADPANEL=ON for the entire report (TYPE=REPORT, HEADPANEL=ON ,$). The heading andsubfooting are repeated on each panel. With HEADPANEL=ON, TABPAGENO includes the panelnumber.
22. Using Headings, Footings, Titles, and Labels
Creating Reports With TIBCO® WebFOCUS Language 1579

Repeating Headings and Footings on Panels in PDF Report Output
1580

Example: Repeating a Subfoot on Panels in PDF Report Output
The following request against the GGSALES data source specifies the HEADPANEL=ONattribute only for the subfoot, not for the entire report. Notice that this request uses thedefault page numbering (ON TABLE SET PAGE ON) rather than TABPAGENO to present the pagenumbers on each page.
TABLE FILE GGSALESHEADING" PRODUCT SALES REPORT" " "SUM UNITS BUDUNITS DOLLARS BUDDOLLARSBY REGION NOPRINTBY ST BY CITY BY CATEGORY BY PRODUCT ON REGION SUBFOOT" "" SUBFOOT FOR REGION <REGION "" SUBTOTAL BUDDOLLARS: <ST.BUDDOLLARS SUBTOTAL DOLLARS: <ST.DOLLARS "" "ON TABLE SET BYPANEL ONON TABLE SET PAGE ONON TABLE PCHOLD FORMAT PDFON TABLE SET STYLE *TYPE = SUBFOOT, HEADPANEL=ON,$ ENDSTYLEEND
22. Using Headings, Footings, Titles, and Labels
Creating Reports With TIBCO® WebFOCUS Language 1581

Panel 1 displays both the heading and the subfooting, as shown in the following image.
Repeating Headings and Footings on Panels in PDF Report Output
1582

Panel 2 displays only the subfooting, not the heading, as shown in the following image.
22. Using Headings, Footings, Titles, and Labels
Creating Reports With TIBCO® WebFOCUS Language 1583

Since the page heading is not repeated, if you use the <TABPAGENO system variable to placethe page number in the heading, it will not display the panel number and will not display on thesecond panel.
TABLE FILE GGSALESHEADING" PRODUCT SALES REPORT PAGE <TABPAGENO" " "SUM UNITS BUDUNITS DOLLARS BUDDOLLARSBY REGION NOPRINTBY ST BY CITY BY CATEGORY BY PRODUCT ON REGION SUBFOOT" "" SUBFOOT FOR REGION <REGION "" SUBTOTAL BUDDOLLARS: <ST.BUDDOLLARS SUBTOTAL DOLLARS: <ST.DOLLARS "" "ON TABLE SET BYPANEL ONON TABLE PCHOLD FORMAT PDFON TABLE SET STYLE *TYPE=REPORT, GRID=OFF, $TYPE = SUBFOOT, HEADPANEL=ON,$ ENDSTYLEEND
Repeating Headings and Footings on Panels in PDF Report Output
1584

The first panel displays the page number in the heading, without the panel number, as shownin the following image.
22. Using Headings, Footings, Titles, and Labels
Creating Reports With TIBCO® WebFOCUS Language 1585

The second panel does not display the heading and therefore, does not display the embeddedpage number, as shown in the following image.
Repeating Headings and Footings on Panels in PDF Report Output
1586

Example: Repeating Styled Headings and Footings on Paneled Pages
The following request against the GGSALES data source has a report heading, a page headingwith an image, a footing, a subheading, a subfooting, and a subtotal.
SET BYPANEL=ONDEFINE FILE GGSALESSHOWCATPROD/A30 = CATEGORY || ' / ' || PRODUCT;ENDTABLE FILE GGSALESSUM DOLLARS/I8M AS ''BY REGIONBY STBY CITYACROSS SHOWCATPROD AS 'Product Sales' ON REGION SUBHEAD" ""Subheading Region <REGION"" "ON REGION SUBTOTAL AS '*TOTAL'ON REGION SUBFOOT WITHIN " ""Subfooting Region <REGION"" "ON TABLE SUBHEAD"Report Heading"HEADING"Page <TABPAGENO "" "" "" "FOOTING" ""PAGE FOOTING "ON TABLE SUBFOOT" ""Report Footing"ON TABLE SET PAGE-NUM OFF -*ON TABLE NOTOTALON TABLE PCHOLD FORMAT PDFON TABLE SET HTMLCSS ONON TABLE SET STYLE * UNITS=IN, SQUEEZE=ON, ORIENTATION=PORTRAIT,$
22. Using Headings, Footings, Titles, and Labels
Creating Reports With TIBCO® WebFOCUS Language 1587

TYPE=REPORT, FONT='ARIAL', SIZE=9, HEADPANEL=ON, BORDER=ON,$TYPE=TITLE, STYLE=BOLD,$TYPE=TABHEADING, SIZE=20, STYLE=BOLD,$TYPE=TABFOOTING, SIZE=20, STYLE=BOLD,$TYPE=HEADING, SIZE=12, STYLE=BOLD,$TYPE=HEADING, LINE=1, JUSTIFY=RIGHT,$TYPE=HEADING, LINE=2, JUSTIFY=RIGHT,$TYPE=HEADING, LINE=3, JUSTIFY=RIGHT,$TYPE=HEADING, LINE=4, JUSTIFY=RIGHT,$TYPE=HEADING, LINE=5, JUSTIFY=RIGHT,$TYPE=HEADING, IMAGE=smplogo1.gif, POSITION=(+0.000000 +0.000000),$TYPE=FOOTING, SIZE=12, STYLE=BOLD, JUSTIFY=RIGHT,$TYPE=SUBHEAD, SIZE=10, STYLE=BOLD,$
Repeating Headings and Footings on Panels in PDF Report Output
1588
TYPE=SUBFOOT, SIZE=10, STYLE=BOLD,$TYPE=SUBTOTAL, BACKCOLOR=RGB(210 210 210),$TYPE=ACROSSVALUE, SIZE=9, WRAP=ON,$TYPE=ACROSSTITLE, STYLE=BOLD,$TYPE=GRANDTOTAL, BACKCOLOR=RGB(210 210 210), STYLE=BOLD,$ENDSTYLEEND
22. Using Headings, Footings, Titles, and Labels
Creating Reports With TIBCO® WebFOCUS Language 1589

Since HEADPANEL=ON for the entire report, both panels display all of the heading and footingelements.
The following image shows page 1 panel 1.
Repeating Headings and Footings on Panels in PDF Report Output
1590

The following image shows page 1 panel 2.
Customizing a Column Title
A column title identifies the data in a report. Use the AS phrase to change the default columntitle for customized data identification or more desirable formatting. You can change a columntitle:
In a request.
In a Master File.
A column title defaults to the field name in the Master File. For a calculated value (one createdwith COMPUTE), the title defaults to the field name in the request.
22. Using Headings, Footings, Titles, and Labels
Creating Reports With TIBCO® WebFOCUS Language 1591

Example: Using Default Column Titles
Consider this request:
TABLE FILE EMPDATASUM SALARYBY DEPTBY LASTNAMEWHERE DEPT IS 'SALES' OR 'CONSULTING' OR 'ACCOUNTING'ON TABLE SET PAGE-NUM OFFON TABLE SET STYLESHEET *TYPE=REPORT, GRID=OFF, $ENDSTYLEEND
The report output illustrates these default column titles:
The column title for the field named in the display command (SUM) is SALARY.
The column titles for the fields named in the BY phrases are DEPT and LASTNAME.
The output is:
Customizing a Column Title
1592

Reference: Limits for Column Titles
The width allotted for column titles has no limit other than the memory available.
A column title for a styled output format can contain up to 16 lines of text.
You can replace a column title for a field named in an ACROSS phrase by only one line oftext.
Syntax: How to Customize a Column Title in a Request
fieldname AS 'title_line_1 [,title_line_2,...]'
where:
fieldnameIs a field named in a display command (such as PRINT or SUM), ACROSS phrase, orBY phrase.
title_line_1,title_line_2Is the customized column title, enclosed in single quotation marks.
To specify a multiple-line column title, separate each line with a comma.
To customize a column title for a calculated value, use the syntax:
COMPUTE fieldname[/format] = expression AS 'title'
For related information, see Creating Temporary Fields on page 277.
Tip:
To suppress the display of a column title, enter two consecutive single quotation markswithout the intervening space. For example:
PRINT LAST_NAME AS ''
To display underscores, enclose blanks in single quotation marks.
If you use an AS phrase for a calculated value, repeat the COMPUTE command beforereferencing the next computed field.
Multi-line column titles created with the AS phrase are not supported for ACROSS fields.
22. Using Headings, Footings, Titles, and Labels
Creating Reports With TIBCO® WebFOCUS Language 1593

Example: Customizing Column Titles in a Request
This request customizes the column titles for the field named in the SUM command (SALARY),and the fields named in the BY phrases (DIV and DEPT).
TABLE FILE EMPDATASUM SALARY AS 'Total,Salary'BY DIV AS 'Division'BY DEPT AS 'Department'WHERE DIV EQ 'NE' OR 'SE' OR 'CORP'HEADING"Current Salary Report"ON TABLE SET STYLE *TYPE=REPORT,GRID=OFF,$ENDSTYLEEND
The output is:
Customizing a Column Title
1594

Example: Suppressing a Column Title
This request suppresses the column title for LAST_NAME. It also illustrates a multiple-linecolumn title (EMPLOYEE NUMBER) for the data for EMP_ID.
TABLE FILE EMPLOYEEPRINT FIRST_NAME AS 'NAME' AND LAST_NAME AS '' BY DEPARTMENTBY EMP_ID AS 'EMPLOYEE,NUMBER'ON TABLE SET PAGE-NUM OFFON TABLE SET ONLINE-FMT HTMLON TABLE SET STYLESHEET *TYPE=REPORT, GRID=OFF, $ENDSTYLEEND
The output is:
22. Using Headings, Footings, Titles, and Labels
Creating Reports With TIBCO® WebFOCUS Language 1595

Example: Customizing a Column Title for a Calculated Value
This request customizes the column title for the calculated value REV.
TABLE FILE SALESSUM UNIT_SOLD RETAIL_PRICE COMPUTE REV/D12.2M = UNIT_SOLD * RETAIL_PRICE;AS 'GENERATED REVENUE' BY PROD_CODEWHERE CITY EQ 'NEW YORK'ON TABLE SET PAGE-NUM OFFON TABLE SET ONLINE-FMT HTMLON TABLE SET STYLESHEET *TYPE=REPORT, GRID=OFF, $ENDSTYLEEND
The output is:
Customizing a Column Title in a Master File
You can change the default column title using the optional TITLE attribute for a field. Anyformatting you apply to the field will be applied to its customized title.
See the TIBCO WebFOCUS® Developing Reporting Applications manual for details on the TITLEattribute.
Distinguishing Between Duplicate Field Names
The command SET QUALTITLES determines whether or not duplicate field names appear asqualified column titles in report output. A qualified column title distinguishes between identicalfield names by including the segment.
Column titles specified in an AS phrase are used when duplicate field names are referenced ina MATCH command, or when duplicate field names exist in a HOLD file.
Customizing a Column Title
1596

Syntax: How to Distinguish Between Duplicate Field Names
SET QUALTITLES = {ON|OFF}
where:
ON
Enables qualified column titles when duplicate field names exist and SET FIELDNAMEis set to NEW (the default). For information on SET commands, see the TIBCOWebFOCUS® Developing Reporting Applications manual.
OFF
Disables qualified column titles. OFF is the default value.
Controlling Column Title Underlining Using a SET Command
The SET TITLELINE command allows you to control whether column titles are underlined forreport output.
Syntax: How to Control Column Title Underlining Using a SET Command
SET TITLELINE = (ON|OFF|SKIP)
ON TABLE SET TITLELINE (ON|OFF|SKIP)
where:
ON
Underlines column titles. ON is the default value.
OFF
Replaces the underline with a blank line.
SKIP
Omits both the underline and the line on which the underline would have displayed.
Note: ACROSSLINE is a synonym for TITLELINE.
Example: Controlling Column Title Underlining Using a SET Command
The following request has a BY and an ACROSS field.
SET TITLELINE=ONTABLE FILE GGSALESSUM UNITS BY PRODUCTACROSS REGIONON TABLE SET PAGE-NUM OFFON TABLE SET STYLE *INCLUDE=IBFS:/FILE/IBI_HTML_DIR/javaassist/intl/EN/ENIADefault_combine.sty,$ENDSTYLEEND
22. Using Headings, Footings, Titles, and Labels
Creating Reports With TIBCO® WebFOCUS Language 1597

With the default value (ON) for SET TITLELINE, the column titles are underlined.
With SET TITLELINE=OFF, the column titles are not underlined, but the blank line where theunderlines would have been is still there.
Controlling Column Title Underlining Using a SET Command
1598
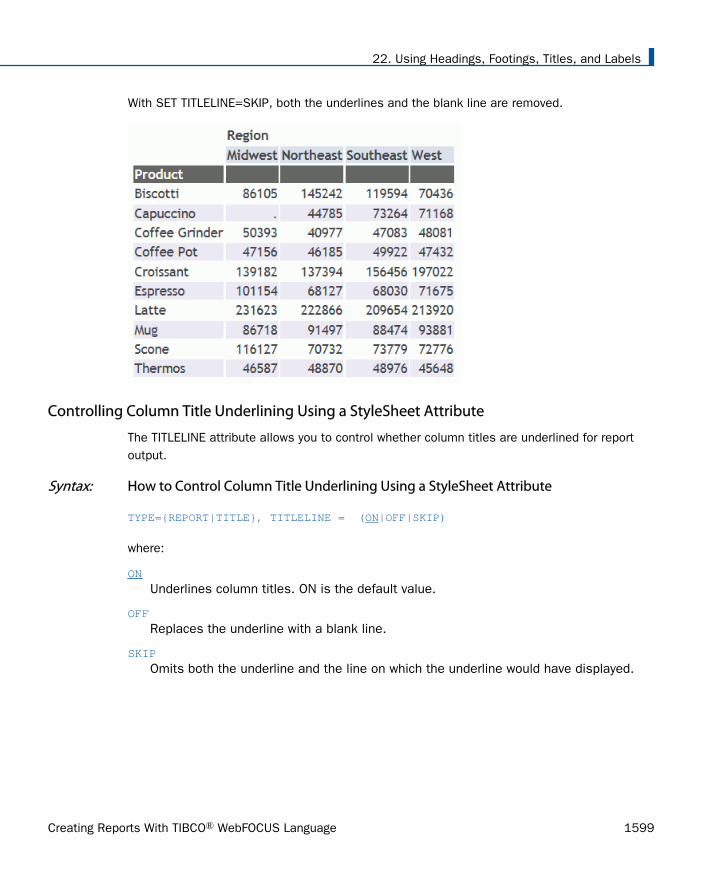
With SET TITLELINE=SKIP, both the underlines and the blank line are removed.
Controlling Column Title Underlining Using a StyleSheet Attribute
The TITLELINE attribute allows you to control whether column titles are underlined for reportoutput.
Syntax: How to Control Column Title Underlining Using a StyleSheet Attribute
TYPE={REPORT|TITLE}, TITLELINE = (ON|OFF|SKIP)
where:
ON
Underlines column titles. ON is the default value.
OFF
Replaces the underline with a blank line.
SKIP
Omits both the underline and the line on which the underline would have displayed.
22. Using Headings, Footings, Titles, and Labels
Creating Reports With TIBCO® WebFOCUS Language 1599

Example: Controlling Column Title Underlining Using a StyleSheet Attribute
The following request has a BY and an ACROSS field.
TABLE FILE GGSALESSUM UNITS BY PRODUCTACROSS REGIONON TABLE SET PAGE-NUM OFFON TABLE SET STYLE *TYPE=REPORT, TITLELINE=ON, GRID=OFF, FONT=ARIAL,$INCLUDE=IBFS:/FILE/IBI_HTML_DIR/javaassist/intl/EN/ENIADefault_combine.sty,$ENDSTYLEEND
With the default value (ON) for TITLELINE, the column titles are underlined.
Controlling Column Title Underlining Using a StyleSheet Attribute
1600
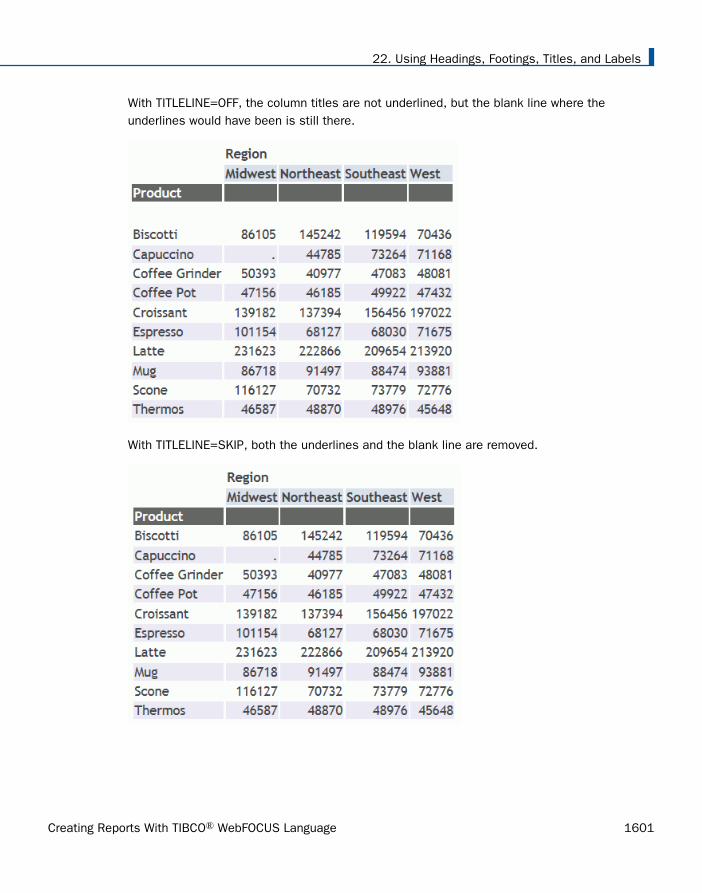
With TITLELINE=OFF, the column titles are not underlined, but the blank line where theunderlines would have been is still there.
With TITLELINE=SKIP, both the underlines and the blank line are removed.
22. Using Headings, Footings, Titles, and Labels
Creating Reports With TIBCO® WebFOCUS Language 1601

Creating Labels to Identify Data
Labels enable you to provide meaningful and distinct names for the following report elementsthat are otherwise identified by generic labels:
Row and column totals. See Creating a Label for a Row or Column Total on page 1602.
Subtotals for sort groups. See Creating a Label for a Subtotal and a Grand Total on page1604.
Rows in a financial report. See Creating a Label for a Row in a Financial Report on page1609.
Creating a Label for a Row or Column Total
A label for a row or column total identifies the sum of values for two or more fields. A labeldraws attention to the total. It is particularly important that you create a label for a row orcolumn total if you have both in one report.
For related information, see Including Totals and Subtotals on page 367.
Syntax: How to Create a Label for a Row or Column Total
fieldname [AND] ROW-TOTAL[/justification][/format] [AS 'label'] fieldname [AND] COLUMN-TOTAL[/justification] [AS 'label']
or
fieldname [AND] COLUMN-TOTAL[/justification] [AS 'label']
where:
fieldnameIs a field named in a display command.
justificationIs the alignment of the label. Valid values are:
L which left justifies the label.
R which right justifies the label.
C which centers the label.
For related information, see Justifying a Label for a Row or Column Total on page 1631.
formatIs the format of the row or column total. When fields with the same format aresummed, the format of the total is the same as the format of the fields. When fields
Creating Labels to Identify Data
1602
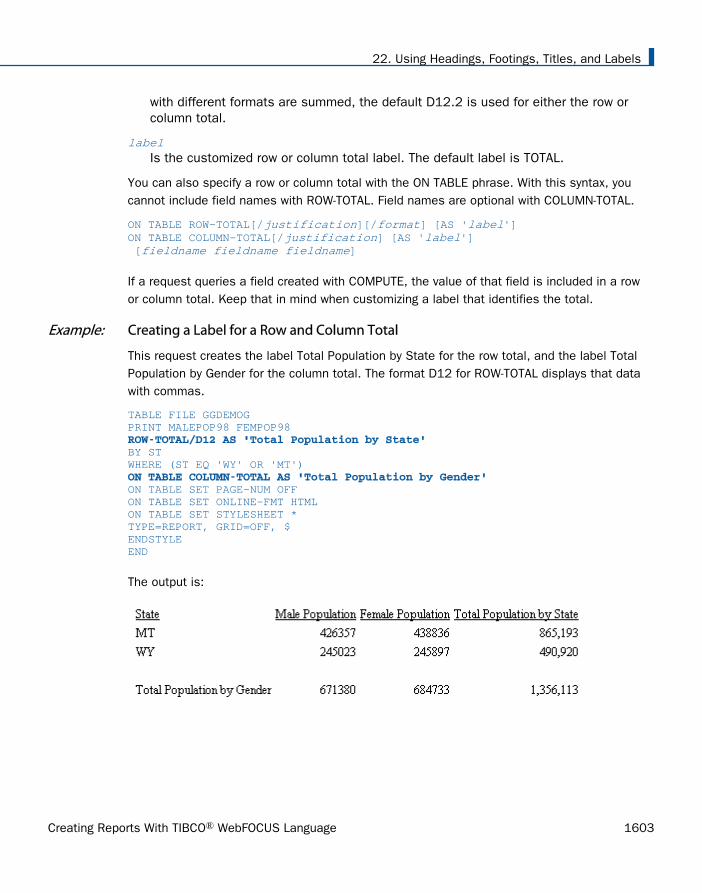
with different formats are summed, the default D12.2 is used for either the row orcolumn total.
labelIs the customized row or column total label. The default label is TOTAL.
You can also specify a row or column total with the ON TABLE phrase. With this syntax, youcannot include field names with ROW-TOTAL. Field names are optional with COLUMN-TOTAL.
ON TABLE ROW-TOTAL[/justification][/format] [AS 'label']ON TABLE COLUMN-TOTAL[/justification] [AS 'label'] [fieldname fieldname fieldname]
If a request queries a field created with COMPUTE, the value of that field is included in a rowor column total. Keep that in mind when customizing a label that identifies the total.
Example: Creating a Label for a Row and Column Total
This request creates the label Total Population by State for the row total, and the label TotalPopulation by Gender for the column total. The format D12 for ROW-TOTAL displays that datawith commas.
TABLE FILE GGDEMOGPRINT MALEPOP98 FEMPOP98 ROW-TOTAL/D12 AS 'Total Population by State' BY STWHERE (ST EQ 'WY' OR 'MT') ON TABLE COLUMN-TOTAL AS 'Total Population by Gender' ON TABLE SET PAGE-NUM OFFON TABLE SET ONLINE-FMT HTMLON TABLE SET STYLESHEET *TYPE=REPORT, GRID=OFF, $ENDSTYLEEND
The output is:
22. Using Headings, Footings, Titles, and Labels
Creating Reports With TIBCO® WebFOCUS Language 1603

Example: Creating a Row Total Label With ACROSS
This request adds the populations of two states, sorts the information using the ACROSSphrase, and labels the row totals as Total by Gender. There are two row totals within the Totalby Gender column, Male Population and Female Population.
TABLE FILE GGDEMOGSUM MALEPOP98/D12 FEMPOP98/D12 ROW-TOTAL AS 'Total by Gender' ACROSS STWHERE ST EQ 'WY' OR 'MT';ON TABLE SET PAGE-NUM OFFON TABLE SET ONLINE-FMT HTMLON TABLE SET STYLESHEET *TYPE=REPORT, GRID=OFF, $ENDSTYLEEND
The output is:
Creating a Label for a Subtotal and a Grand Total
Frequently, a report contains detailed information for a sort group, and it is useful to provide asubtotal for such a group, and a grand total for all groups at the end of the report.
For related information see Including Totals and Subtotals on page 367.
Syntax: How to Create a Label for a Subtotal or a Grand Total
{BY|ON} fieldname {SUB-TOTAL|SUBTOTAL|COLUMN-TOTAL} [MULTILINES] [field1 [AND] field2...] [AS 'label'] [WHEN expression;]
where:
fieldnameIs a sort field named on a BY or ON phrase.
MULTILINES
Suppresses a subtotal when there is only one value at a sort break. After it isspecified, MULTILINES suppresses the subtotal for every sort break with only onedetail line. MULTI-LINES is a synonym for MULTILINES.
Creating Labels to Identify Data
1604
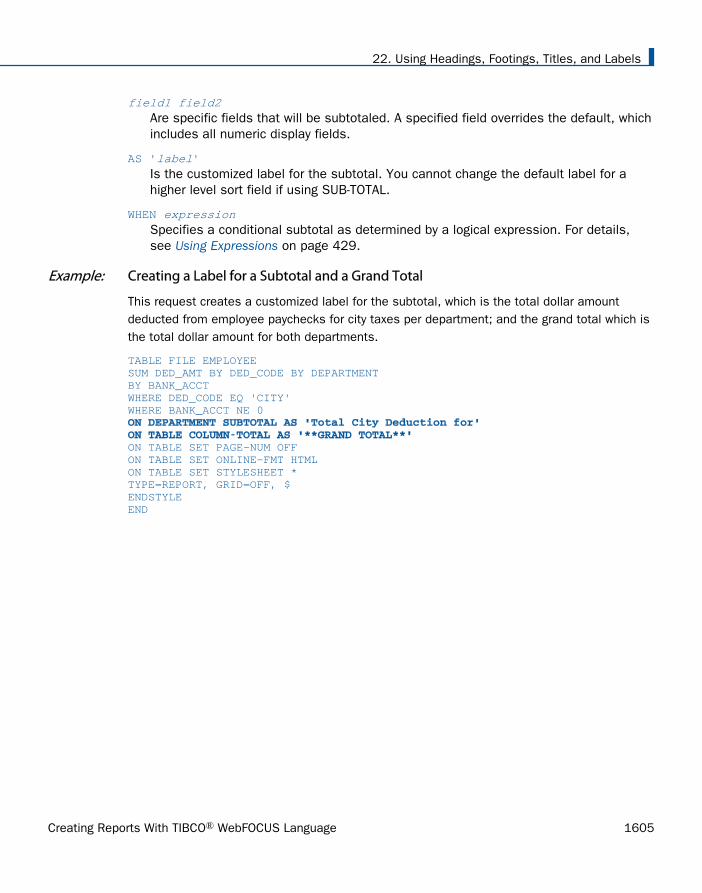
field1 field2Are specific fields that will be subtotaled. A specified field overrides the default, whichincludes all numeric display fields.
AS 'label'Is the customized label for the subtotal. You cannot change the default label for ahigher level sort field if using SUB-TOTAL.
WHEN expressionSpecifies a conditional subtotal as determined by a logical expression. For details,see Using Expressions on page 429.
Example: Creating a Label for a Subtotal and a Grand Total
This request creates a customized label for the subtotal, which is the total dollar amountdeducted from employee paychecks for city taxes per department; and the grand total which isthe total dollar amount for both departments.
TABLE FILE EMPLOYEESUM DED_AMT BY DED_CODE BY DEPARTMENTBY BANK_ACCTWHERE DED_CODE EQ 'CITY'WHERE BANK_ACCT NE 0 ON DEPARTMENT SUBTOTAL AS 'Total City Deduction for'ON TABLE COLUMN-TOTAL AS '**GRAND TOTAL**' ON TABLE SET PAGE-NUM OFFON TABLE SET ONLINE-FMT HTMLON TABLE SET STYLESHEET *TYPE=REPORT, GRID=OFF, $ENDSTYLEEND
22. Using Headings, Footings, Titles, and Labels
Creating Reports With TIBCO® WebFOCUS Language 1605

In the output, the department values MIS and PRODUCTION are included by default in thecustomized subtotal label.
Example: Creating a Label for the Subtotal of a Specific Field
This request creates a customized label, Order Total, for the subtotal for LINEPRICE. It usesthe default label TOTAL for the grand total.
TABLE FILE CENTORDPRINT PNUM QUANTITY LINEPRICE BY ORDER_NUM SUBTOTAL LINEPRICE AS 'Order Total' WHERE ORDER_NUM EQ '28003' OR '28004';ON TABLE SET PAGE-NUM OFFON TABLE SET ONLINE-FMT HTMLON TABLE SET STYLESHEET *TYPE=REPORT, GRID=OFF, $ENDSTYLEEND
Creating Labels to Identify Data
1606

The output is:
Syntax: How to Create a Label for the Subtotal of a Calculated Value
{BY|ON} fieldname {SUMMARIZE|RECOMPUTE} [MULTILINES] [field1 [AND] field2...] [AS 'label'] [WHEN expression;]ON TABLE {SUMMARIZE|RECOMPUTE}
where:
fieldnameIs a sort field named on a BY or ON phrase.
MULTILINES
Suppresses a subtotal when there is only one value at a sort break. After it isspecified, MULTILINES suppresses the subtotal for every sort break with only onedetail line. MULTI-LINES is a synonym for MULTILINES.
field1 field2Are specific fields that will be subtotaled. Specified fields override the default, whichincludes all numeric display fields.
22. Using Headings, Footings, Titles, and Labels
Creating Reports With TIBCO® WebFOCUS Language 1607
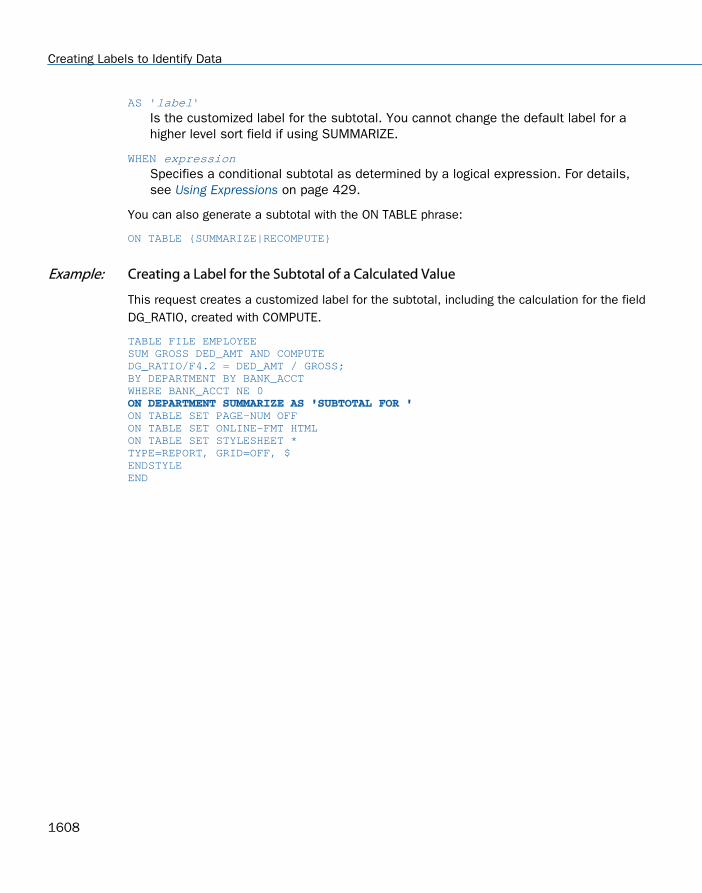
AS 'label'Is the customized label for the subtotal. You cannot change the default label for ahigher level sort field if using SUMMARIZE.
WHEN expressionSpecifies a conditional subtotal as determined by a logical expression. For details,see Using Expressions on page 429.
You can also generate a subtotal with the ON TABLE phrase:
ON TABLE {SUMMARIZE|RECOMPUTE}
Example: Creating a Label for the Subtotal of a Calculated Value
This request creates a customized label for the subtotal, including the calculation for the fieldDG_RATIO, created with COMPUTE.
TABLE FILE EMPLOYEESUM GROSS DED_AMT AND COMPUTEDG_RATIO/F4.2 = DED_AMT / GROSS;BY DEPARTMENT BY BANK_ACCTWHERE BANK_ACCT NE 0 ON DEPARTMENT SUMMARIZE AS 'SUBTOTAL FOR ' ON TABLE SET PAGE-NUM OFFON TABLE SET ONLINE-FMT HTMLON TABLE SET STYLESHEET *TYPE=REPORT, GRID=OFF, $ENDSTYLEEND
Creating Labels to Identify Data
1608

In the output, the department values MIS and PRODUCTION are included by default in thecustomized subtotal label. The default grand total label is TOTAL.
Creating a Label for a Row in a Financial Report
Financial Modeling Language (FML) meets the special needs associated with creating,calculating, and presenting financially oriented data. FML reports are structured on a row-by-row basis. This organization gives you greater control over the data incorporated into a reportand over its presentation.
You identify rows by labels that you can customize for accurate data identification and formatto enhance the visual appearance and clarity of the data.
For details on FML reports, see Creating Financial Reports With Financial Modeling Language(FML) on page 1817.
Formatting a Heading, Footing, Title, or Label
You can use a variety of strategies for enhancing the context-building elements in a report, thatis, the headings, footings, column and row titles, and labels you assign to row and columntotals and to subtotals. These additions enhance the visual appeal of a report andcommunicate a sense of completeness, using font and color for emphasis and distinctions,and alignment to add structural clarity and facilitate comprehension.
22. Using Headings, Footings, Titles, and Labels
Creating Reports With TIBCO® WebFOCUS Language 1609

You can:
Apply font characteristics to column and row titles, to headings, footing, and elements inthem, and to subtotals, grand totals, and subtotal calculations. For more information, see Applying Font Attributes to a Heading, Footing, Title, or Label on page 1611.
Add borders around headings and footings and grid lines around headings, footings, andcolumn titles. For more information, see Laying Out the Report Page on page 1333.
You can also add space between heading or footing content and grid lines. For moreinformation, see Controlling the Vertical Positioning of a Heading or Footing on page 1687.
Left-justify, right-justify, or center a heading, footing, or individual lines in a multi-lineheading or footing, column titles, and subtotals. For more information, see Justifying aHeading, Footing, Title, or Label on page 1618. See also How to Center a Page Heading orFooting Using Legacy Formatting on page 1624 and How to Justify a Column Title Using aStyleSheet on page 1627.
You can also justify a label for a row or column total. For more information, see Justifying aLabel for a Row or Column Total on page 1631.
Align a heading or footing, or elements within a heading or footing, based on:
Data column position in the main HTML table or on column position in an embeddedHTML table created for the heading or footing in the report. These alignment techniquesare supported for HTML reports. For more information, see Aligning a Heading or FootingElement in an HTML, XLSX, EXL2K, PDF, PPTX, or DHTML Report on page 1637.
Explicit width and justification specifications for multi-line headings and footings,including unit measurements (like inches) to enforce the alignment of decimal points instacked numeric or alphanumeric data. These alignment techniques are supported forHTML and PDF reports. For more information, see Aligning Content in a Multi-LineHeading or Footing on page 1661.
An absolute or relative starting position, defined by either a unit measurement (likeinches) or a column position. These alignment techniques are supported for PDFreports, although some features are also supported for HTML when used with aninternal cascading style sheet. For more information, see Positioning Headings, Footings,or Items Within Them on page 1673.
For assistance in determining which of these approaches best suits your needs, see Choosing an Alignment Method for Heading and Footing Elements on page 1635.
Control the vertical positioning of a heading or footing. For more information, see Controlling the Vertical Positioning of a Heading or Footing on page 1687.
Formatting a Heading, Footing, Title, or Label
1610

Position a report or sort heading or footing on a separate page. See Placing a ReportHeading or Footing on Its Own Page on page 1694.
Applying Font Attributes to a Heading, Footing, Title, or Label
You can specify font family, size, color, and style for any report element you can identify in aStyleSheet:
Row and column titles. Styling is applied to either the default title or a customized title.
Headings and footings, and elements within them, including specific lines in a multi-lineheading or footing, items in a line, text strings, and embedded fields. Note that you canalso specify background color for individual elements.
Labels for subtotals, grand totals, subtotal calculations, and row totals. Styling applies todefault or customized names.
Page numbers in a heading or footing.
Underlines and skipped lines (not supported in HTML reports).
For detailed syntax, see Identifying a Report Component in a WebFOCUS StyleSheet on page1251. For details on font options, including size, color, and style, see Formatting Report Dataon page 1699.
Example: Applying Font Characteristics to a Report Heading and Column Titles
This request uses a StyleSheet to select 12-point Arial bold for the report heading (SalesReport), and 10-point Arial italic for the default column titles (Category, Product, Unit Sales,Dollar Sales), based on the HTML point scale, which differs from standard point sizes. See Formatting Report Data on page 1699.
22. Using Headings, Footings, Titles, and Labels
Creating Reports With TIBCO® WebFOCUS Language 1611

For an HTML report, the font name must be enclosed in single quotation marks. TheStyleSheet attribute TYPE = TABHEADING identifies the report heading, and the attribute TYPE= TITLE identifies the column titles.
TABLE FILE GGSALESSUM UNITS DOLLARSBY CATEGORY BY PRODUCTON TABLE SUBHEAD"Sales Report"ON TABLE SET PAGE-NUM OFFON TABLE SET ONLINE-FMT HTMLON TABLE SET STYLESHEET *TYPE = REPORT, GRID=OFF, $ TYPE = TABHEADING, FONT = 'ARIAL', SIZE = 12, STYLE = BOLD, $TYPE = TITLE, FONT = 'ARIAL', SIZE = 10, STYLE = ITALIC, $ ENDSTYLEEND
The output is:
Applying Font Attributes to a Heading, Footing, Title, or Label
1612

Example: Setting Font Size for a Report Heading Using an Internal Cascading Style Sheet
An internal cascading style sheet enables you to specify an absolute size, measured in points,rather than the corresponding HTML point scale, thereby providing greater control over theappearance of fonts in a report. See Formatting Report Data on page 1699 and ControllingReport Formatting on page 1221.
This request generates an internal cascading style sheet and specifies font characteristics forthe report heading.
TABLE FILE GGSALESSUM UNITS DOLLARSBY CATEGORY BY PRODUCTON TABLE SUBHEAD"Sales Report"ON TABLE SET PAGE-NUM OFFON TABLE SET ONLINE-FMT HTML ON TABLE SET HTMLCSS ON ON TABLE SET STYLESHEET *TYPE = REPORT, GRID=OFF, $ TYPE = TABHEADING, FONT = 'ARIAL', SIZE = 12, STYLE = BOLD, $ TYPE = TITLE, FONT = 'ARIAL', SIZE = 10, STYLE = ITALIC, $ENDSTYLEEND
The output is:
22. Using Headings, Footings, Titles, and Labels
Creating Reports With TIBCO® WebFOCUS Language 1613

Example: Applying Font Styles to a System Variable in a Report Heading
This request includes the system variable &DATE in the heading. Styling is italic to distinguishit from the rest of the heading text, which is bold. The spot marker <+0> creates two items inthe heading so that each one can be formatted separately.
TABLE FILE GGSALESPRINT BUDDOLLARS DOLLARSBY STCDWHERE STCD EQ 'R1019'ON TABLE SUBHEAD "Sales Report for Store Code R1019 <+0>&DATE" ON TABLE SET PAGE-NUM OFFON TABLE SET ONLINE-FMT HTMLON TABLE SET STYLESHEET *TYPE=REPORT, GRID=OFF,$TYPE=TABHEADING, FONT='TIMES', SIZE=10, STYLE=BOLD,$TYPE=TABHEADING, ITEM=2, STYLE=ITALIC,$ENDSTYLEEND
The partial output is:
Applying Font Attributes to a Heading, Footing, Title, or Label
1614

Adding Borders and Grid Lines
You can add borders and grid lines to headings, footings, titles and labels. For detailed syntax,see Laying Out the Report Page on page 1333.
Example: Adding a Grid Around a Report Heading in a PDF Report
This request generates a PDF report with a grid around the heading, created with the GRIDattribute, to set the heading off from the body of the report.
TABLE FILE GGSALESSUM BUDUNITS UNITS BUDDOLLARS DOLLARSBY CATEGORYON TABLE SUBHEAD "SALES REPORT""**(CONFIDENTIAL)**""December 2001 </1" ON TABLE SET PAGE-NUM OFF ON TABLE SET ONLINE-FMT PDF ON TABLE SET SQUEEZE ONON TABLE SET STYLESHEET * TYPE = TABHEADING, JUSTIFY = CENTER, GRID=ON, $ ENDSTYLEEND
The output is:
22. Using Headings, Footings, Titles, and Labels
Creating Reports With TIBCO® WebFOCUS Language 1615
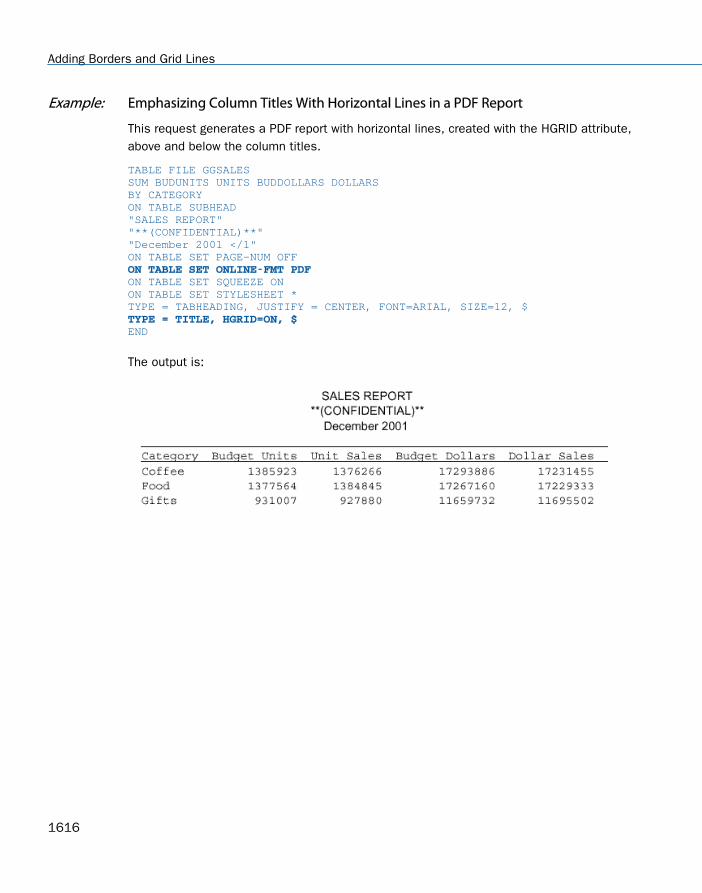
Example: Emphasizing Column Titles With Horizontal Lines in a PDF Report
This request generates a PDF report with horizontal lines, created with the HGRID attribute,above and below the column titles.
TABLE FILE GGSALESSUM BUDUNITS UNITS BUDDOLLARS DOLLARSBY CATEGORYON TABLE SUBHEAD"SALES REPORT""**(CONFIDENTIAL)**""December 2001 </1"ON TABLE SET PAGE-NUM OFF ON TABLE SET ONLINE-FMT PDF ON TABLE SET SQUEEZE ONON TABLE SET STYLESHEET *TYPE = TABHEADING, JUSTIFY = CENTER, FONT=ARIAL, SIZE=12, $ TYPE = TITLE, HGRID=ON, $ END
The output is:
Adding Borders and Grid Lines
1616

Example: Formatting a Border Around a Report Heading
This request generates an HTML report with a heavy red dotted line around the entire reportheading.
TABLE FILE GGSALESSUM BUDUNITS UNITS BUDDOLLARS DOLLARSBY CATEGORYON TABLE SUBHEAD"</1 Sales Report""**CONFIDENTIAL**""December 2002 </1"ON TABLE SET PAGE-NUM OFFON TABLE SET ONLINE-FMT HTMLON TABLE SET HTMLCSS ONON TABLE SET STYLESHEET *TYPE=REPORT, GRID=OFF, $ TYPE=TABHEADING, STYLE=BOLD, JUSTIFY=CENTER, BORDER=HEAVY, BORDER-COLOR=RED, BORDER-STYLE=DOTTED, $ ENDSTYLEEND
The output is:
Tip: You can use the same BORDER syntax to generate this output in a PDF or PS report.
22. Using Headings, Footings, Titles, and Labels
Creating Reports With TIBCO® WebFOCUS Language 1617
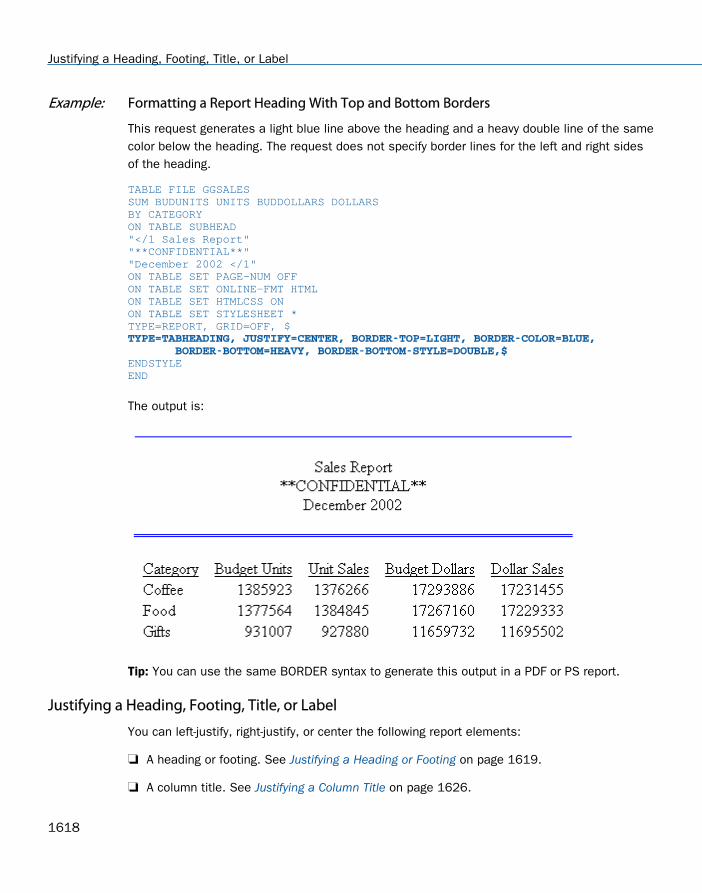
Example: Formatting a Report Heading With Top and Bottom Borders
This request generates a light blue line above the heading and a heavy double line of the samecolor below the heading. The request does not specify border lines for the left and right sidesof the heading.
TABLE FILE GGSALESSUM BUDUNITS UNITS BUDDOLLARS DOLLARSBY CATEGORYON TABLE SUBHEAD"</1 Sales Report""**CONFIDENTIAL**""December 2002 </1"ON TABLE SET PAGE-NUM OFFON TABLE SET ONLINE-FMT HTMLON TABLE SET HTMLCSS ONON TABLE SET STYLESHEET *TYPE=REPORT, GRID=OFF, $ TYPE=TABHEADING, JUSTIFY=CENTER, BORDER-TOP=LIGHT, BORDER-COLOR=BLUE, BORDER-BOTTOM=HEAVY, BORDER-BOTTOM-STYLE=DOUBLE,$ ENDSTYLEEND
The output is:
Tip: You can use the same BORDER syntax to generate this output in a PDF or PS report.
Justifying a Heading, Footing, Title, or Label
You can left-justify, right-justify, or center the following report elements:
A heading or footing. See Justifying a Heading or Footing on page 1619.
A column title. See Justifying a Column Title on page 1626.
Justifying a Heading, Footing, Title, or Label
1618

A label for a row or column total. See Justifying a Label for a Row or Column Total on page1631.
A label for a subtotal or grand total. See Justifying a Label for a Subtotal or Grand Total onpage 1633.
In addition, you can use justification syntax in combination with other StyleSheet syntax toalign headings and footings with other report elements, based on either unit measurements orrelationships to other report elements, such as columns. For a summary of these options, see Choosing an Alignment Method for Heading and Footing Elements on page 1635.
Justifying a Heading or Footing
You can left-justify, right-justify, or center a heading or footing in a StyleSheet. By default, aheading or footing is left justified. In addition, you can justify an individual line or lines in amultiple-line heading or footing.
To center a page heading or footing over the report data, you can use a legacy formattingtechnique that does not require a StyleSheet; simply include the CENTER command in aHEADING or FOOTING command.
Justification behavior in HTML and PDF. For HTML reports, justification is implemented withrespect to the report width. That means a centered heading is centered over the reportcontent. In contrast, for PDF reports the default justification area is the page width, rather thanthe report width, resulting in headings and footings that are not centered on the report. Inmost cases, you can achieve justification based on report width in a PDF report by adding thecommand SET SQUEEZE=ON to your request. This command improves the appearance of thereport by eliminating excessive white space between columns and implements justificationover the report content. However, if the heading is wider than the report, it will be centered onthe page, even when SQUEEZE=ON.
Tip: You can also use justification syntax in combination with other StyleSheet syntax to alignheadings, footings, and items in them with other report elements, based on either unitmeasurements or relationships to other columns. For a summary of these options, see Choosing an Alignment Method for Heading and Footing Elements on page 1635.
Syntax: How to Justify a Heading or Footing in a StyleSheet
TYPE = headfoot, [LINE = line_#,] JUSTIFY = option, $
where:
headfoot Is the type of heading or footing. Valid values are TABHEADING, TABFOOTING,HEADING, FOOTING, SUBHEAD, and SUBFOOT.
22. Using Headings, Footings, Titles, and Labels
Creating Reports With TIBCO® WebFOCUS Language 1619

line_#Optionally identifies a line by its position in the heading or footing so that you canindividually align it. If a heading or footing has multiple lines and you omit this option,the value supplied for JUSTIFY applies to all lines.
optionIs the type of justification. Valid values are:
LEFT which left justifies the heading or footing. LEFT is the default value.
RIGHT which right justifies the heading or footing.
CENTER which centers the heading or footing.
For an alternative way to center a page heading or footing without a StyleSheet, see Howto Center a Page Heading or Footing Using Legacy Formatting on page 1624.
Note: JUSTIFY is not supported with WRAP.
Example: Justifying a Report Heading
This request centers the report heading PRODUCT REPORT, using the attribute JUSTIFY =CENTER.
TABLE FILE GGPRODSSUM UNITS BY PRODUCT_DESCRIPTION BY PRODUCT_ID BY VENDOR_NAMEON TABLE SUBHEAD"PRODUCT REPORT"ON TABLE SET PAGE-NUM OFFON TABLE SET ONLINE-FMT HTMLON TABLE SET STYLESHEET *TYPE = REPORT, GRID=OFF, $TYPE = REPORT, COLUMN = VENDOR_NAME, JUSTIFY = CENTER, $ TYPE = TABHEADING, JUSTIFY = CENTER, $ ENDSTYLEEND
Justifying a Heading, Footing, Title, or Label
1620

The output is:
Tip: If you wish to run this report in PDF format, add the code ON TABLE SET SQUEEZE ON toeliminate excessive white space between columns and to center the heading over the report.
For more information on justifying a column title, see Justifying a Column Title on page 1626.
Example: Justifying Individual Lines in a Multiple-Line Report Heading
In this request, heading line 1 (SALES REPORT) is centered, heading line 2(**CONFIDENTIAL**) is also centered, and heading line 3 (December 2001) is right justified.
TABLE FILE GGSALESSUM BUDUNITS UNITS BUDDOLLARS DOLLARSBY CATEGORYON TABLE SUBHEAD"SALES REPORT""**(CONFIDENTIAL)**""December 2001"ON TABLE SET PAGE-NUM OFFON TABLE SET ONLINE-FMT HTMLON TABLE SET STYLESHEET *TYPE = REPORT, GRID=OFF, $ TYPE = TABHEADING, LINE = 1, JUSTIFY = CENTER, $TYPE = TABHEADING, LINE = 2, JUSTIFY = CENTER, $TYPE = TABHEADING, LINE = 3, JUSTIFY = RIGHT, $ ENDSTYLEEND
22. Using Headings, Footings, Titles, and Labels
Creating Reports With TIBCO® WebFOCUS Language 1621

The output is:
Tip: To run this report in PDF format, add the code ON TABLE SET SQUEEZE ON to eliminateexcessive white space between columns and to center the heading over the report.
Example: Centering All Lines in a Multiple-Line Report Heading
This request centers all lines in a multiple-line report heading using the single StyleSheetattribute for the entire heading.
TABLE FILE GGSALESSUM BUDUNITS UNITS BUDDOLLARS DOLLARSBY CATEGORYON TABLE SUBHEAD"SALES REPORT""**(CONFIDENTIAL)**""December 2001"ON TABLE SET PAGE-NUM OFFON TABLE SET ONLINE-FMT HTMLON TABLE SET STYLESHEET *TYPE = REPORT, GRID=OFF, $ TYPE = TABHEADING, JUSTIFY = CENTER, $ ENDSTYLEEND
Justifying a Heading, Footing, Title, or Label
1622

The output is:
Tip: To run this report in PDF format, add the code ON TABLE SET SQUEEZE ON to eliminateexcessive white space between columns and to center the heading over the report.
Reference: Justification Regions and Behavior
The region in which text is justified depends on the relationship of the sizes of certainelements in the report:
When SQUEEZE=ON, the maximum width of all the heading types in the report iscalculated. This value is called MaxHeadWidth.
If MaxHeadWidth is less than or equal to the total width of the columns of the report,headings are justified in the space over the report columns.
If MaxHeadWidth exceeds the total width of the columns of the report, headings arecentered and right-justified in the entire width of the page.
When SQUEEZE=OFF, the maximum width of all the headings are not pre-calculated.Headings are centered in the entire width of the page.
With a styled, multiple-panel report (in which the width exceeds one page), headings canonly appear in the first panel. Thus, the preceding calculations deal with the total width ofthe columns in the first panel rather than the total width of all the columns in the report.
22. Using Headings, Footings, Titles, and Labels
Creating Reports With TIBCO® WebFOCUS Language 1623

Syntax: How to Center a Page Heading or Footing Using Legacy Formatting
{HEADING|FOOTING} CENTER "content ... "["content ... "]...["content ... "]
where:
HEADING
Is a page heading.
FOOTING
Is a page footing.
CENTER
Centers the page heading or footing over or under the report data.
contentHeading or footing content can include the following elements, between doublequotation marks. If the ending quotation mark is omitted, all subsequent lines of therequest are treated as part of the heading or footing.
textIs text for the heading or footing. You can include multiple lines of text.
The text must start on a line by itself, following the HEADING or FOOTING command.
Text can be combined with variables and spot markers.
For related information, see Limits for Headings and Footings on page 1521.
variableCan be any one or a combination of the following:
Fields (real data source fields, a virtual fields created with the DEFINE command in aMaster File or report request, calculated values created with the COMPUTE commandin a request, a system field such as TABPAGENO). You can qualify data source fieldswith certain prefix operators.
Dialogue Manager variables.
Images. You can include images in a heading or footing.
For details, see Including an Element in a Heading or Footing on page 1559.
Justifying a Heading, Footing, Title, or Label
1624

spot markerEnables you to position items, to identify items to be formatted, and to extendcode beyond the 80-character line limit of the text editor.
<+0> divides a heading or footing into items for formatting. For details, see Identifyinga Heading, Footing, Title, or FML Free Text on page 1275.
</n specifies skipped lines. For details, see Controlling the Vertical Positioning of aHeading or Footing on page 1687.
<-n to position the next character on the line. For details, see Using Spot Markers toRefine Positioning on page 1682.
<0X continues a heading or footing specification on the next line of the request. Fordetails, see Extending Heading and Footing Code to Multiple Lines in a Report Requeston page 1522.
Note: When a closing spot marker is immediately followed by an opening spot marker(><), a single space text item will be placed between the two spot markers (> <). Thismust be considered when applying formatting.
Blank lines
If you omit all text, variables, and spot markers, you have a blank heading or footingline (for example, " ") which you can use to skip a line in the heading or footing. (Youcan also skip a line using a vertical spot marker, such as </1.)
Tip: Do not use the command CENTER with the StyleSheet attribute JUSTIFY = CENTER. Asingle method will generate the desired result.
Example: Centering a Page Heading
This request uses the command CENTER in the page heading syntax.
TABLE FILE EMPLOYEE HEADING CENTER "ACCOUNT REPORT FOR DEPARTMENT <DEPARTMENT"PRINT CURR_SAL BY DEPARTMENT BY HIGHEST BANK_ACCTBY EMP_IDON DEPARTMENT PAGE-BREAKON TABLE SET PAGE-NUM OFFON TABLE SET WEBVIEWER ONON TABLE SET ONLINE-FMT HTMLON TABLE SET STYLESHEET *TYPE=REPORT, SIZE=10, GRID=OFF,$ENDSTYLEEND
22. Using Headings, Footings, Titles, and Labels
Creating Reports With TIBCO® WebFOCUS Language 1625

The page heading is centered over the report data, as shown in the first page of output.
Tip: If you do not see the navigation arrows, click the maximize button.
Justifying a Column Title
You can left-justify, right-justify, or center a column title for a display field, BY field, ACROSSfield, or calculated value using a StyleSheet.
If a title is specified with an AS phrase in a request, or with the TITLE attribute in a Master File,that title will be justified, as specified for the field in StyleSheet syntax, if such syntax exists inthe request. For related information, see Customizing a Column Title on page 1591.
Justification behavior in HTML and PDF. For HTML reports, justification is implemented withrespect to the report width. That means a centered column title is centered over a reportcolumn. In contrast, for PDF reports the default justification area is the page width, rather thanthe report width, resulting in column titles that are not centered over the report column. Youcan achieve justification based on report width in a PDF report by adding the command SETSQUEEZE=ON to your request. This command improves the appearance of the report byeliminating excessive white space between columns and implements justification over thereport content.
Justifying a Heading, Footing, Title, or Label
1626

You can also justify a column title for a display or BY field using legacy formatting methods.However, when legacy formatting is applied to an ACROSS field, data values, not column titles,are justified as specified. See How to Justify a Column Title for a Display or BY Field UsingLegacy Formatting on page 1630.
Syntax: How to Justify a Column Title Using a StyleSheet
To justify a column title for a vertical sort column (generated by BY) or a display column(generated by PRINT, LIST, SUM, or COUNT), the StyleSheet syntax is
TYPE=TITLE, [COLUMN=column,] JUSTIFY=option, $TYPE=ACROSSTITLE, [ACROSS=column,] JUSTIFY=option, $TYPE=ACROSSVALUE, [COLUMN=column,] JUSTIFY=option, $
To justify a horizontal sort column title (generated by ACROSS), the StyleSheet syntax is
TYPE=ACROSSTITLE, [ACROSS=column,] JUSTIFY=option, $
To justify an ACROSS value or a ROW-TOTAL column title in an HTML report, use
TYPE=ACROSSVALUE, [COLUMN=column,] JUSTIFY=option, $
where:
TITLE
Specifies a vertical sort (BY) title or a display field title.
columnSpecifies the column whose title you wish to justify. If you omit this attribute andvalue, the formatting will be applied to all of the report's column titles. For details onidentifying columns, see Identifying a Report Component in a WebFOCUS StyleSheet onpage 1251.
ACROSSTITLE
Specifies a horizontal sort (ACROSS) title.
ACROSSVALUE
Specifies a horizontal sort (ACROSS) value or a ROW-TOTAL column title.
optionIs the type of justification. Valid values are:
22. Using Headings, Footings, Titles, and Labels
Creating Reports With TIBCO® WebFOCUS Language 1627

LEFT which left justifies the column title. This value is the default for an alphanumericfield.
RIGHT which right justifies the column title. This value is the default for a numeric or datefield.
CENTER which centers the column title. You cannot center an ACROSSTITLE in a PDFreport.
Note: JUSTIFY is not supported with WRAP.
Example: Using a StyleSheet to Justify Column Titles for Display and BY Fields
This request centers the column titles for STORE_NAME and ADDRESS1. The default columntitle for STORE_NAME is Store Name, as specified in the Master File with the TITLE attribute.The default column title for ADDRESS1 is Contact, also specified in the Master File. Therequest right-justifies the column title for STATE, which is specified in the AS phrase as St.Each column is identified by its field name and justified separately.
TABLE FILE GGSTORESPRINT STORE_NAME STATE AS 'St' BY ADDRESS1WHERE STATE EQ 'CA'ON TABLE SET PAGE-NUM OFFON TABLE SET ONLINE-FMT HTMLON TABLE SET SQUEEZE ONON TABLE SET STYLESHEET *TYPE = REPORT, GRID=OFF, $ TYPE=TITLE, COLUMN=STORE_NAME, JUSTIFY=CENTER, $TYPE=TITLE, COLUMN=STATE, JUSTIFY=RIGHT, $TYPE=TITLE, COLUMN=ADDRESS1, JUSTIFY=CENTER, $ ENDSTYLEEND
The output is:
Justifying a Heading, Footing, Title, or Label
1628
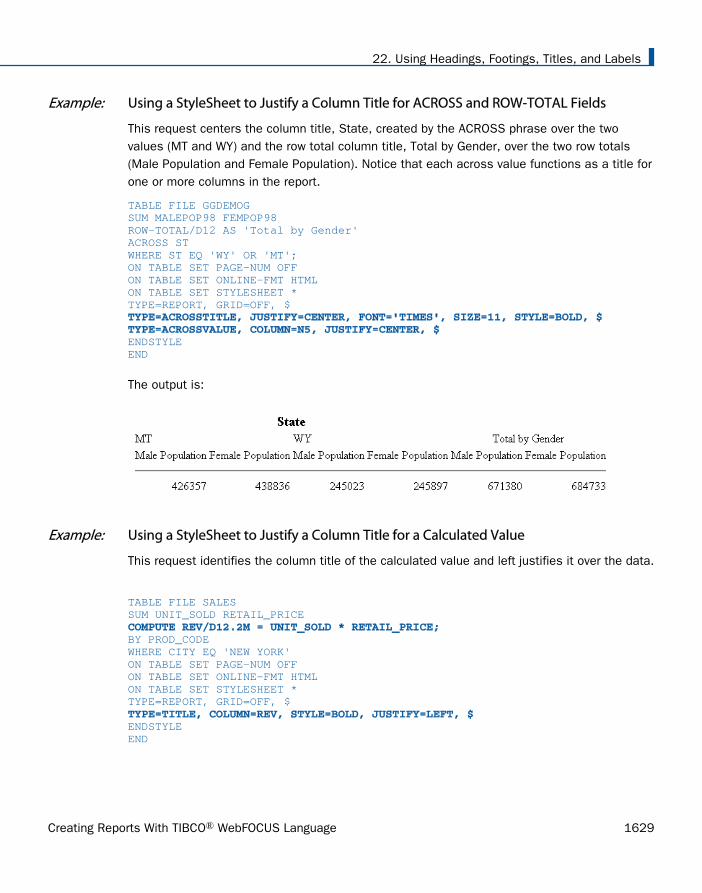
Example: Using a StyleSheet to Justify a Column Title for ACROSS and ROW-TOTAL Fields
This request centers the column title, State, created by the ACROSS phrase over the twovalues (MT and WY) and the row total column title, Total by Gender, over the two row totals(Male Population and Female Population). Notice that each across value functions as a title forone or more columns in the report.
TABLE FILE GGDEMOGSUM MALEPOP98 FEMPOP98ROW-TOTAL/D12 AS 'Total by Gender'ACROSS STWHERE ST EQ 'WY' OR 'MT';ON TABLE SET PAGE-NUM OFFON TABLE SET ONLINE-FMT HTMLON TABLE SET STYLESHEET *TYPE=REPORT, GRID=OFF, $ TYPE=ACROSSTITLE, JUSTIFY=CENTER, FONT='TIMES', SIZE=11, STYLE=BOLD, $TYPE=ACROSSVALUE, COLUMN=N5, JUSTIFY=CENTER, $ ENDSTYLEEND
The output is:
Example: Using a StyleSheet to Justify a Column Title for a Calculated Value
This request identifies the column title of the calculated value and left justifies it over the data.
TABLE FILE SALESSUM UNIT_SOLD RETAIL_PRICE COMPUTE REV/D12.2M = UNIT_SOLD * RETAIL_PRICE; BY PROD_CODEWHERE CITY EQ 'NEW YORK'ON TABLE SET PAGE-NUM OFFON TABLE SET ONLINE-FMT HTMLON TABLE SET STYLESHEET *TYPE=REPORT, GRID=OFF, $ TYPE=TITLE, COLUMN=REV, STYLE=BOLD, JUSTIFY=LEFT, $ ENDSTYLEEND
22. Using Headings, Footings, Titles, and Labels
Creating Reports With TIBCO® WebFOCUS Language 1629

The output is:
Note: To run this report in PDF format, add the code ON TABLE SET SQUEEZE ON to eliminateexcessive white space between columns and to justify column titles properly over the data.
Syntax: How to Justify a Column Title for a Display or BY Field Using Legacy Formatting
fieldname/justification [/format] [AS 'title']
where:
fieldnameIs the name of the field.
justificationIs the type of justification. Valid values are:
L which left justifies the column title. This value is the default for an alphanumeric field.
R which right justifies the column title. This value is the default for a numeric or date field.
C which centers the column title.
/formatIs an optional format specification for the field. For a display field, you can combinethe justification value with the format value (in either order) to adjust the width of thecolumn data or to specify display options.
AS 'title'Is an optional customized column title.
Tip: For an ACROSS field, this syntax justifies data values, not column titles. For syntax thatwill justify the title, see How to Justify a Column Title Using a StyleSheet on page 1627.
Justifying a Heading, Footing, Title, or Label
1630
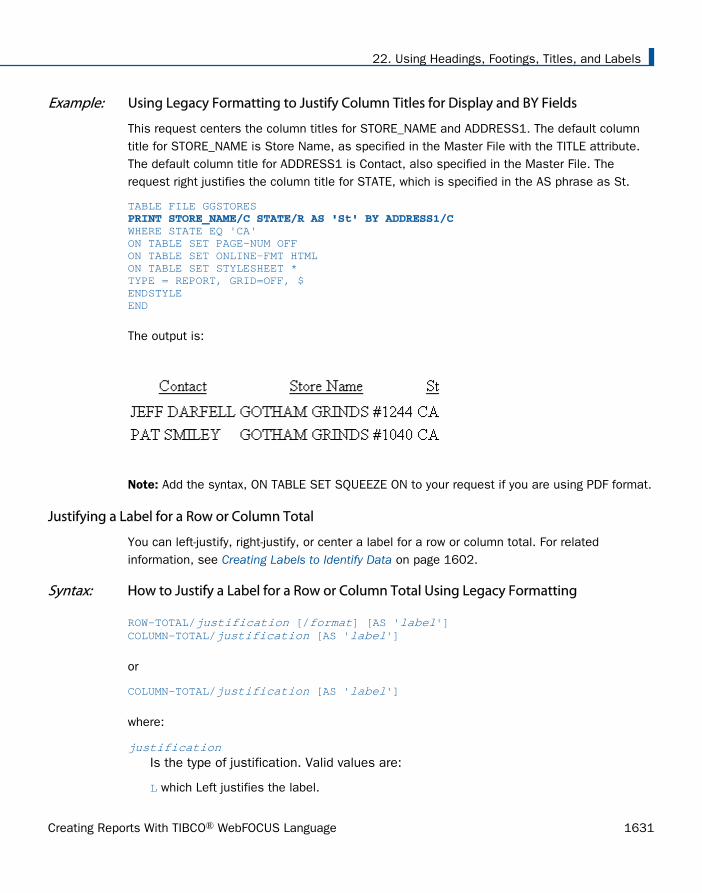
Example: Using Legacy Formatting to Justify Column Titles for Display and BY Fields
This request centers the column titles for STORE_NAME and ADDRESS1. The default columntitle for STORE_NAME is Store Name, as specified in the Master File with the TITLE attribute.The default column title for ADDRESS1 is Contact, also specified in the Master File. Therequest right justifies the column title for STATE, which is specified in the AS phrase as St.
TABLE FILE GGSTORES PRINT STORE_NAME/C STATE/R AS 'St' BY ADDRESS1/C WHERE STATE EQ 'CA'ON TABLE SET PAGE-NUM OFFON TABLE SET ONLINE-FMT HTMLON TABLE SET STYLESHEET *TYPE = REPORT, GRID=OFF, $ENDSTYLEEND
The output is:
Note: Add the syntax, ON TABLE SET SQUEEZE ON to your request if you are using PDF format.
Justifying a Label for a Row or Column Total
You can left-justify, right-justify, or center a label for a row or column total. For relatedinformation, see Creating Labels to Identify Data on page 1602.
Syntax: How to Justify a Label for a Row or Column Total Using Legacy Formatting
ROW-TOTAL/justification [/format] [AS 'label']COLUMN-TOTAL/justification [AS 'label']
or
COLUMN-TOTAL/justification [AS 'label']
where:
justificationIs the type of justification. Valid values are:
L which Left justifies the label.
22. Using Headings, Footings, Titles, and Labels
Creating Reports With TIBCO® WebFOCUS Language 1631

R which right justifies the label.
C which centers the label.
/formatIs an optional format specification for a row total. You can combine the alignmentvalue with the format value (in either order) to adjust the width of the column data orspecify display options.
AS 'label'Is an optional customized label.
Example: Centering a Label for a Row Total
This request creates the stacked label Total, Population, by State for the row total and centersit. The format D12 for ROW-TOTAL displays commas by default.
TABLE FILE GGDEMOGPRINT MALEPOP98 FEMPOP98 ROW-TOTAL/C/D12 AS 'Total,Population,by State' BY STWHERE (ST EQ 'WY' OR 'MT')ON TABLE COLUMN-TOTAL AS 'Total by Gender'ON TABLE SET PAGE-NUM OFFON TABLE SET ONLINE-FMT HTMLON TABLE SET STYLESHEET *TYPE = REPORT, GRID=OFF, $ENDSTYLEEND
The output is:
Justifying a Heading, Footing, Title, or Label
1632

Justifying a Label for a Subtotal or Grand Total
You cannot directly justify a customized label for a subtotal. However, for HTML, EXL2K, orXLSX report output, if columns are being totaled or subtotaled by the one subtotal command,and you do not specify a column in the StyleSheet, formatting is applied to the totals andsubtotals of all columns and to the labeling text that introduces the total and subtotal values.For related information, see Identifying a Report Component in a WebFOCUS StyleSheet on page1251.
Example: Justifying Subtotal and Grand Total Labels
This request subtotals the numeric columns in the report and right-justifies the output,including the text of the label that precedes the values for the subtotals. Since numeric outputis right-justified by default, in this example the justification specifications in the StyleSheet areused to reposition the labels. The default label for the automatically generated grand total isalso right-justified.
TABLE FILE EMPLOYEESUM DED_AMT BY DED_CODE BY DEPARTMENTBY BANK_ACCTWHERE DED_CODE EQ 'CITY'WHERE BANK_ACCT NE 0 ON DEPARTMENT SUBTOTAL AS 'Total City Deduction for' ON TABLE SET PAGE-NUM OFFON TABLE SET ONLINE-FMT HTMLON TABLE SET STYLESHEET *TYPE=REPORT, GRID=OFF, $ TYPE=SUBTOTAL, STYLE=BOLD, JUSTIFY=RIGHT,$TYPE=GRANDTOTAL, STYLE=BOLD, JUSTIFY=RIGHT,$ ENDSTYLEEND
22. Using Headings, Footings, Titles, and Labels
Creating Reports With TIBCO® WebFOCUS Language 1633

The output is:
Justifying a Heading, Footing, Title, or Label
1634

Choosing an Alignment Method for Heading and Footing Elements
To align text and data in headings and footings based on factors other than left/right/centerjustification, consider the following descriptions before deciding which alignment method bestsuits your needs.
Alignment Method Appliesto ...
When to use... RelatedMethods
1) StyleSheetAttributes:
HEADALIGN
COLSPAN
JUSTIFY
Details: See Aligninga Heading or FootingElement in an HTML,XLSX, EXL2K, PDF,PPTX, or DHTMLReport on page1637.
HTML
XLSX
EXL2K
PPTX
DHTML
To align heading or footing items inHTML and EXL2K reports: If youexpect to display reports in HTML orEXL2K format, use HEADALIGNoptions to align heading and footingitems with either columns in the HTMLtable for the body of the report or withcells in an embedded HTML table. Thebrowser handles alignment based onyour specifications, without requiringunit measurements, which arerequired with WIDTH and JUSTIFY.
To align heading or footing items inPDF reports: If you expect to displayreports in PDF format, use theHEADALIGN=BODY option to alignheading and footing items withcolumns in the report body.
To specify a heading or footing itemthat spans multiple columns: You cancombine HEADALIGN syntax with theCOLSPAN attribute to achieve thisresult. For details, see Aligning aHeading or Footing Element AcrossColumns in an HTML or PDF Report onpage 1655.
22. Using Headings, Footings, Titles, and Labels
Creating Reports With TIBCO® WebFOCUS Language 1635

Alignment Method Appliesto ...
When to use... RelatedMethods
2) StyleSheetAttributes:
WIDTH
JUSTIFY
Details: See AligningContent in a Multi-Line Heading orFooting on page1661.
HTML
PS
For portability between HTML andPDF: To code a request that can beused without revision to produceidentical output in HTML (with internalcascading style sheets) and in PDF,use WIDTH and JUSTIFY attributes inyour StyleSheet. These settings canbe applied to report, page, and sortheadings and footings.
To align heading or footing items:Used together, WIDTH and JUSTIFYallow you to align specific items in theheading, rather than entire headingsor footings or entire heading or footinglines, where the implied justificationwidth is the total width of the reportpanel. To right- or center-justify anitem in a heading or footing, you mustknow the width of the area you want tojustify it in. That information isprovided by the WIDTH attribute.
To align decimal points in a multi-lineheading or footing: Use this techniqueto align decimal points in data thathas varying numbers of decimalplaces. You define the width of thedecimal item, then you measure howfar in from the right side of a columnyou want to position the decimal point.This places the decimal point in thesame position in a column, regardlessof the number of decimal placesdisplayed to its right.
For anHTML, PDF,or EXL2Kreport, youcan alignspecificitems withHEADALIGNoptions.
Choosing an Alignment Method for Heading and Footing Elements
1636

Alignment Method Appliesto ...
When to use... RelatedMethods
3) StyleSheetAttribute:
POSITION
Details: See Positioning Headings,Footings, or ItemsWithin Them on page1673 and Laying Outthe Report Page onpage 1333.
PS
HTML(limited)
To set starting positions for headingsor footings, or items within them: UsePOSITION syntax to specify absoluteand relative starting positions.
In HTML, with an internal cascadingstyle sheet, you can use POSITION tospecify the starting point for a headingor footing line. You can also positionan image in a heading or footing.
To align heading and footing itemswith columns: Use POSITION syntax toalign a heading item with a columnposition. For example, the syntax
TYPE=SUBHEAD, LINE=1, ITEM=3,POSITION=SALES, $
places ITEM 3 of the sort heading atthe horizontal position where thecolumn SALES is.
For a PDFreport, youcanaccomplishmostpositioningwith WIDTHand JUSTIFY.
For an HTMLor PDFreport, youcan align aheading itemwith acolumn bysetting theHEADALIGNattribute toBODY.
Aligning a Heading or Footing Element in an HTML, XLSX, EXL2K, PDF, PPTX, or DHTMLReport
For HTML output (and for Excel 2000 output, which uses HTML alignment), you can positiontext and field items in headings and footings using HEADALIGN options. These options workwithin the limitations of HTML and browser technologies to provide a significant degree offormatting flexibility. Here is how HEADALIGN works.
For PDF output, you can use the HEADALIGN=BODY option to align heading and footingelements with the report body.
22. Using Headings, Footings, Titles, and Labels
Creating Reports With TIBCO® WebFOCUS Language 1637
For HTML or Excel 2000 output, when HEADALIGN is set either to BODY or INTERNAL, output islaid out as an HTML table, which means that the browser determines the widths of thecolumns, thereby limiting the precise positioning of items. A basic rule governs the placementof heading or footing items: each item (text or embedded field) is placed in sequence into thenext HTML table cell (<TD>). When HEADALIGN is set to NONE, the default, all the items in theheading or footing are strung together, inside a single cell. The browser stretches the headingtable and the report table to accommodate the length of the text.
You can exercise control over the placement of items by overriding the default and choosingeither BODY or INTERNAL:
HEADALIGN=BODY puts heading item cells in the same HTML table (for HTML or EXL2Koutput) as the body of the report, ensuring that the items in the heading and the data in thebody of the report line up naturally since they have the same column widths. For PDFoutput, HEADALIGN=BODY aligns heading items with data columns. This is a simple anduseful way to align heading items with columns of data. For example, suppose that youhave computed subtotal values that you want to include in a sort footing. UsingHEADALIGN=BODY, you can align the subtotals in the same columns as the data that isbeing totaled.
HEADALIGN=INTERNAL puts the heading items in an HTML table of its own. This allows theheading items to be aligned vertically with each other, independent of the data, since thewidths of the heading items do not affect the width of the report columns and vice versa.
In EXL2K formatted reports, with headings or footings containing multiple items that areseparated by spot markers without spaces, the spot marker adds an additional spacebetween the items within the text in the cell. The workaround is to use XLSX formattedreports, instead.
To compare sample output, see Comparing Output Generated With HEADALIGN Options on page1643.
To break a text string into multiple parts for manipulation across columns, you can use <+0>spot markers in the request. For details, see Identifying a Report Component in a WebFOCUSStyleSheet on page 1251.
You can use HEADALIGN options in conjunction with the COLSPAN attribute. COLSPAN allowsheading items to span multiple table columns, thereby providing additional flexibility in how youcan design your headings. For details, see Aligning a Heading or Footing Element AcrossColumns in an HTML or PDF Report on page 1655.
If there is more than one heading or footing type in a report, you can individually align anyelement within each of them using this syntax.
Aligning a Heading or Footing Element in an HTML, XLSX, EXL2K, PDF, PPTX, or DHTML Report
1638
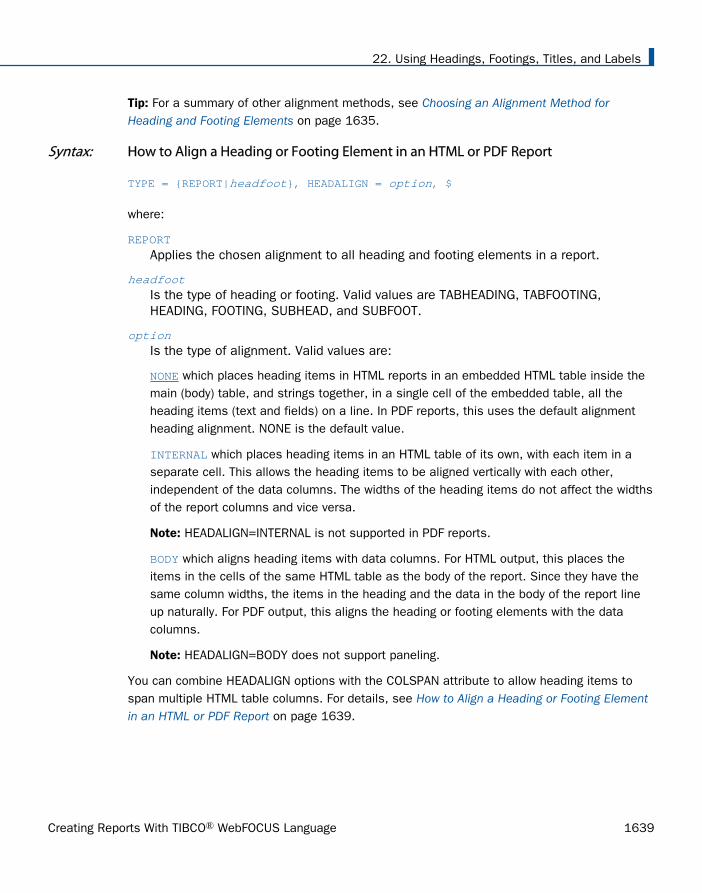
Tip: For a summary of other alignment methods, see Choosing an Alignment Method forHeading and Footing Elements on page 1635.
Syntax: How to Align a Heading or Footing Element in an HTML or PDF Report
TYPE = {REPORT|headfoot}, HEADALIGN = option, $
where:
REPORT
Applies the chosen alignment to all heading and footing elements in a report.
headfootIs the type of heading or footing. Valid values are TABHEADING, TABFOOTING,HEADING, FOOTING, SUBHEAD, and SUBFOOT.
optionIs the type of alignment. Valid values are:
NONE which places heading items in HTML reports in an embedded HTML table inside themain (body) table, and strings together, in a single cell of the embedded table, all theheading items (text and fields) on a line. In PDF reports, this uses the default alignmentheading alignment. NONE is the default value.
INTERNAL which places heading items in an HTML table of its own, with each item in aseparate cell. This allows the heading items to be aligned vertically with each other,independent of the data columns. The widths of the heading items do not affect the widthsof the report columns and vice versa.
Note: HEADALIGN=INTERNAL is not supported in PDF reports.
BODY which aligns heading items with data columns. For HTML output, this places theitems in the cells of the same HTML table as the body of the report. Since they have thesame column widths, the items in the heading and the data in the body of the report lineup naturally. For PDF output, this aligns the heading or footing elements with the datacolumns.
Note: HEADALIGN=BODY does not support paneling.
You can combine HEADALIGN options with the COLSPAN attribute to allow heading items tospan multiple HTML table columns. For details, see How to Align a Heading or Footing Elementin an HTML or PDF Report on page 1639.
22. Using Headings, Footings, Titles, and Labels
Creating Reports With TIBCO® WebFOCUS Language 1639

Example: Aligning Subfooting Items With Report Columns in PDF Report Output
In the following request against the GGORDER data source, the subfooting has a text object("Total") and a field object (ST.QUANTITY). The subfooting aligns the items with their reportcolumns using TYPE=SUBFOOT, HEADALIGN=BODY ,$. The text object is placed in the secondreport column using the <+0 spot marker, and the field object is placed in the third reportcolumn using another <+0 spot marker. Then the text item is left aligned (the default) with itsreport column. The field object is right aligned with its report column.
TABLE FILE GGORDERPRINT QUANTITYORDER_NUMBER ORDER_DATE STORE_CODE BY PRODUCT_CODE BY PRODUCT_DESCRIPTIONWHERE ORDER_DATE EQ '01/01/96'WHERE STORE_CODE EQ 'R1019' ON PRODUCT_CODE SUBFOOT" <+0 Total: <+0 <ST.QUANTITY" ON TABLE SET PAGE-NUM OFFON TABLE PCHOLD FORMAT PDFON TABLE SET STYLESHEET *TYPE = SUBFOOT,HEADALIGN=BODY, $TYPE = SUBFOOT,OBJECT=TEXT,STYLE = BOLD, $TYPE = SUBFOOT,OBJECT=FIELD,JUSTIFY=RIGHT,STYLE = BOLD, $ENDSTYLEEND
Aligning a Heading or Footing Element in an HTML, XLSX, EXL2K, PDF, PPTX, or DHTML Report
1640

The output shows that the text Total is aligned with the product names and the subtotal fieldobject is right aligned with the Ordered Units column.
Example: Using OVER With HEADALIGN=BODY in a PDF Report
When aligning heading elements with the data line using HEADALIGN=BODY, the first row offields serves as the anchor data row. Each heading line contains the number of columnspresented in the anchor data row. Any additional columns that may appear on other data linesare not presented. If the first row of data contains fewer data value cells than other data rows,you will be unable to add alignment columns within headings for these additional columns.
22. Using Headings, Footings, Titles, and Labels
Creating Reports With TIBCO® WebFOCUS Language 1641

In the following example, the first row (the anchor data row) contains a single value. Itemsplaced in headings to correspond with column two that appears on subsequent rows are notdisplayed.
SET LAYOUTGRID=ONTABLE FILE GGSALES"Product<+0>""Units<+0>Dollars"SUMPRODUCT AS ''OVERUNITS/D8C AS '' DOLLARS/D12.2CM AS ''BY PRODUCT NOPRINTON TABLE PCHOLD FORMAT PDFON TABLE SET STYLE *TYPE=REPORT, SQUEEZE=ON,FONT=ARIAL, SIZE=8, LEFTGAP=.1, RIGHTGAP=.1, GAPINTERNAL=ON, LEFTMARGIN=1,$TYPE=REPORT, BORDER=ON, $TYPE=HEADING, BORDERALL=ON, HEADALIGN=BODY, $TYPE=HEADING, LINE=1, ITEM=1, COLSPAN=2, WIDTH=2, JUSTIFY=LEFT, $TYPE=HEADING, LINE=2, ITEM=1, WIDTH=1, JUSTIFY=LEFT, $TYPE=HEADING, LINE=2, ITEM=2, WIDTH=1, JUSTIFY=LEFT, $TYPE=REPORT, COLUMN=PRODUCT(2), SQUEEZE=2, $TYPE=REPORT, COLUMN=UNITS, SQUEEZE=1, $TYPE=REPORT, COLUMN=DOLLARS, SQUEEZE=1, $END
Aligning a Heading or Footing Element in an HTML, XLSX, EXL2K, PDF, PPTX, or DHTML Report
1642

The output shows that the heading lines have one column each, while the data lines alternatebetween one column and two columns.
Example: Comparing Output Generated With HEADALIGN Options
The requests that follow illustrate the differences in alignment with each HEADALIGN setting.The grid lines are exposed in the output to help distinguish the HTML table created for thebody of the report from the embedded HTML tables created for the heading in some variations.
22. Using Headings, Footings, Titles, and Labels
Creating Reports With TIBCO® WebFOCUS Language 1643

All HEADALIGN settings are compatible with COLSPAN syntax, which allows heading items tospan multiple columns.
TABLE FILE CARSUM SALES BY COUNTRY BY CAR BY MODELON COUNTRY SUBHEAD"This is my subhead"" ""Country is:<COUNTRY Car is:<CAR""Model is:<MODEL"IF COUNTRY EQ 'ENGLAND'ON TABLE SET PAGE-NUM OFFON TABLE SET STYLESHEET * TYPE=SUBHEAD, HEADALIGN=OPTION, $ TYPE=SUBHEAD, LINE=1, ITEM=1, COLSPAN=4, JUSTIFY=CENTER, $ ENDSTYLEEND
HEADALIGN=NONE without the second TYPE=SUBHEAD declaration highlighted in the requestsyntax creates a separate table with default left alignment. The text and fields in each headingline are strung together in a single HTML table cell.
TYPE=SUBHEAD, HEADALIGN=NONE, $
Aligning a Heading or Footing Element in an HTML, XLSX, EXL2K, PDF, PPTX, or DHTML Report
1644
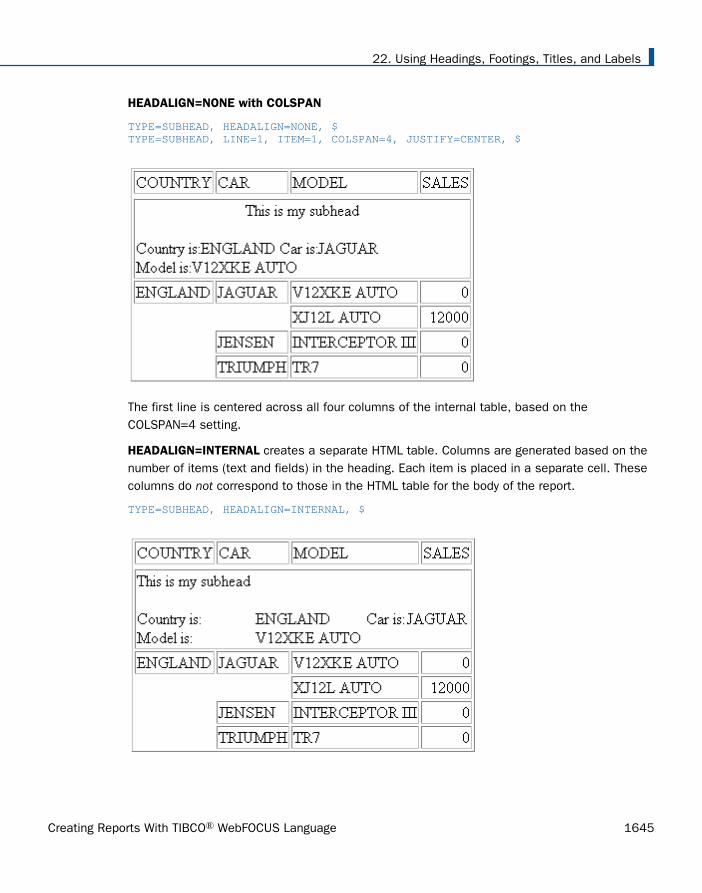
HEADALIGN=NONE with COLSPAN
TYPE=SUBHEAD, HEADALIGN=NONE, $TYPE=SUBHEAD, LINE=1, ITEM=1, COLSPAN=4, JUSTIFY=CENTER, $
The first line is centered across all four columns of the internal table, based on theCOLSPAN=4 setting.
HEADALIGN=INTERNAL creates a separate HTML table. Columns are generated based on thenumber of items (text and fields) in the heading. Each item is placed in a separate cell. Thesecolumns do not correspond to those in the HTML table for the body of the report.
TYPE=SUBHEAD, HEADALIGN=INTERNAL, $
22. Using Headings, Footings, Titles, and Labels
Creating Reports With TIBCO® WebFOCUS Language 1645
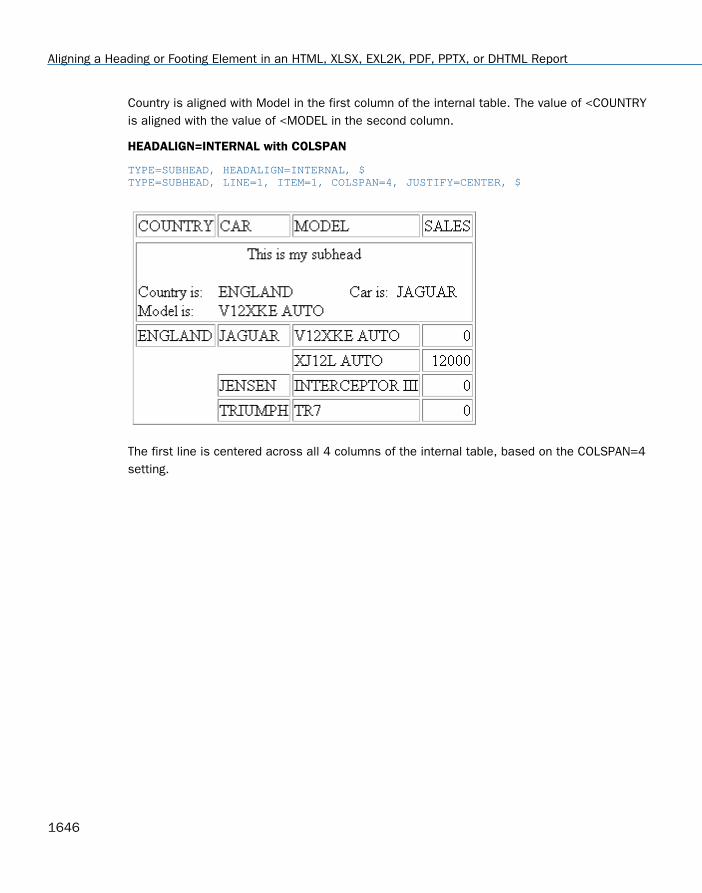
Country is aligned with Model in the first column of the internal table. The value of <COUNTRYis aligned with the value of <MODEL in the second column.
HEADALIGN=INTERNAL with COLSPAN
TYPE=SUBHEAD, HEADALIGN=INTERNAL, $TYPE=SUBHEAD, LINE=1, ITEM=1, COLSPAN=4, JUSTIFY=CENTER, $
The first line is centered across all 4 columns of the internal table, based on the COLSPAN=4setting.
Aligning a Heading or Footing Element in an HTML, XLSX, EXL2K, PDF, PPTX, or DHTML Report
1646
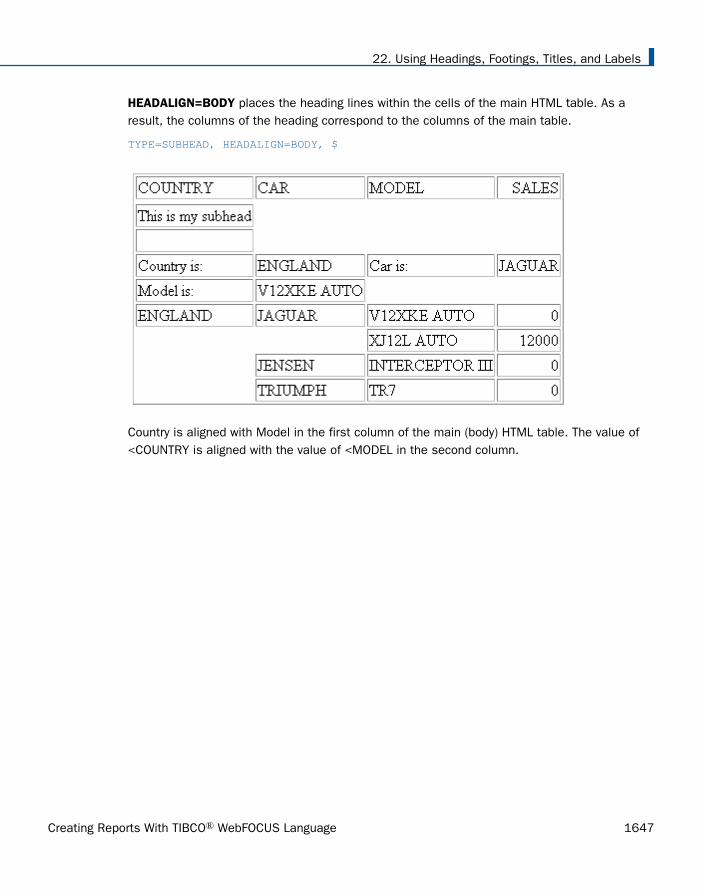
HEADALIGN=BODY places the heading lines within the cells of the main HTML table. As aresult, the columns of the heading correspond to the columns of the main table.
TYPE=SUBHEAD, HEADALIGN=BODY, $
Country is aligned with Model in the first column of the main (body) HTML table. The value of<COUNTRY is aligned with the value of <MODEL in the second column.
22. Using Headings, Footings, Titles, and Labels
Creating Reports With TIBCO® WebFOCUS Language 1647

HEADALIGN=BODY with COLSPAN
TYPE=SUBHEAD, HEADALIGN=BODY, $TYPE=SUBHEAD, LINE=1, ITEM=1, COLSPAN=4, JUSTIFY=CENTER, $
COLSPAN controls the cross-column alignment of the first row of the heading.
Example: Aligning Elements in a Sort Footing With Data Columns
This request creates an HTML report using HEADALIGN = BODY to align the two elements ofthe sort footing (TOTAL IS and the value) with each of the two data columns (Product andOrdered Units). JUSTIFY = RIGHT, which applies to the entire sort footing, right justifies eachsort footing element under the data column.
TABLE FILE GGORDERPRINT QUANTITYBY PRODUCT_CODE NOPRINT BY PRODUCT_DESCRIPTIONWHERE ORDER_DATE EQ '01/01/96'WHERE STORE_CODE EQ 'R1019'ON PRODUCT_CODE SUBFOOT "TOTAL IS: <ST.QUANTITY" ON TABLE SET PAGE-NUM OFFON TABLE SET ONLINE-FMT HTMLON TABLE SET STYLESHEET *TYPE = REPORT, GRID = OFF, $ TYPE = SUBFOOT, HEADALIGN = BODY, JUSTIFY = RIGHT, $ TYPE = SUBFOOT, OBJECT = FIELD, STYLE = BOLD, $ENDSTYLEEND
Aligning a Heading or Footing Element in an HTML, XLSX, EXL2K, PDF, PPTX, or DHTML Report
1648

The partial output is:
22. Using Headings, Footings, Titles, and Labels
Creating Reports With TIBCO® WebFOCUS Language 1649

Example: Aligning Elements in a Page Heading Using a Separate HTML Table
This request creates an embedded HTML table for a page heading, within the HTML table thatgoverns alignment in the body of the report. This table has three rows and three columns toaccommodate all the heading elements.
In the first line of the heading, a spot marker (<+0>) creates two text elements: the firstelement is blank, and the second element is Gotham Grinds, Inc. In the output, the secondelement appears in the second cell of the first row of the embedded table. For relatedinformation, see Identifying a Report Component in a WebFOCUS StyleSheet on page 1251.
The second and fourth lines of the heading are blank.
The spot markers in the third line of the heading split it into three text elements: OrdersReport, blank, Run on: &DATE. In the output, each element appears in a cell in the third row ofthe embedded HTML table, in the order specified in the request.
TABLE FILE GGORDERHEADING " <+0>Gotham Grinds, Inc."" ""Orders Report <+0> <+0> Run on: &DATE"" " PRINT ORDER_NUMBER ORDER_DATE STORE_CODE QUANTITYBY PRODUCT_CODE BY PRODUCT_DESCRIPTIONIF RECORDLIMIT EQ 10ON TABLE SET PAGE-NUM OFFON TABLE SET ONLINE-FMT HTMLON TABLE SET STYLESHEET * TYPE = REPORT, GRID = ON, $TYPE = HEADING, HEADALIGN = INTERNAL, STYLE = BOLD, $ ENDSTYLEEND
GRID=ON in the request enables you to see the embedded HTML table for the heading, andthe main HTML table for the body of the report.
Aligning a Heading or Footing Element in an HTML, XLSX, EXL2K, PDF, PPTX, or DHTML Report
1650

The output is:
22. Using Headings, Footings, Titles, and Labels
Creating Reports With TIBCO® WebFOCUS Language 1651

Notice that the positioning is maintained when the grid is hidden (off).
Aligning a Heading or Footing Element in an HTML, XLSX, EXL2K, PDF, PPTX, or DHTML Report
1652

Example: Aligning a Text Field With a Column in a Sort Footing
This example uses a Master File and the MODIFY procedure created in the example named Including a Text Field in a Sort Footing on page 1568. Rerun that example and return here toalign the text field.
The request uses HEADALIGN=BODY to align the text field lines in a sort footing. With thissetting, each element in the footing is aligned with a column in the main HTML table generatedfor the report: the first element (the text Course Description:) is aligned with the first datacolumn, CATALOG. The embedded field is aligned in a second column. The grid is turned on inthis example to make the alignment easier to see.
TABLE FILE TXTFLDBY CATALOG SUBFOOT "Course Description: <TEXTFLD" ON TABLE SET PAGE-NUM OFFON TABLE SET ONLINE-FMT HTMLON TABLE SET STYLESHEET *TYPE = REPORT, GRID = ON, $ TYPE = SUBFOOT, HEADALIGN = BODY, $ ENDSTYLEEND
The output displays a new value for the text field each time the value of CATALOG changes.
22. Using Headings, Footings, Titles, and Labels
Creating Reports With TIBCO® WebFOCUS Language 1653

Example: Aligning and Styling a Text Field in a Sort Footing
This example uses a Master File and the MODIFY procedure created in the example named Including a Text Field in a Sort Footing on page 1568. Rerun that example and return here toalign the text field. This request applies boldface type to the second line of a multiple-line sortfooting, which includes the text Course Description as well as the text of the field TEXTFLD.Line 1 of the sort footing is the text Evening Course.
TABLE FILE TXTFLDBY DESCRIPTION AS 'CATALOG' SUBFOOT "Evening Course""Course Description: <TEXTFLD" ON TABLE SET PAGE-NUM OFFON TABLE SET ONLINE-FMT HTMLON TABLE SET STYLESHEET *TYPE = REPORT, GRID = OFF, $ TYPE = SUBFOOT, HEADALIGN = BODY, $TYPE = SUBFOOT, LINE = 2, STYLE = BOLD, $ ENDSTYLEEND
The output is:
If the StyleSheet instead identifies the text field as an object for styling
TYPE = SUBFOOT, HEADALIGN = BODY, $TYPE = SUBFOOT, LINE = 2, OBJECT = FIELD, STYLE = BOLD, $
Aligning a Heading or Footing Element in an HTML, XLSX, EXL2K, PDF, PPTX, or DHTML Report
1654

then only the text in TEXTFLD is bold.
Aligning a Heading or Footing Element Across Columns in an HTML or PDF Report
With HEADALIGN=BODY, each heading or footing element is aligned with a data column in anHTML or PDF report. With HEADALIGN=INTERNAL, each element is continued in a column of anHTML table created and aligned specifically for the report heading or footing. By default, everyheading or footing element (ITEM) is placed in the first available column. However, you canposition an item to span multiple columns using the COLSPAN attribute. For details aboutHEADALIGN options, see Aligning a Heading or Footing Element in an HTML, XLSX, EXL2K, PDF,PPTX, or DHTML Report on page 1637.
You must specify the HEADALIGN and COLSPAN attributes in two separate StyleSheetdeclarations, since HEADALIGN applies to an entire heading or footing, while COLSPAN appliesto a specific item in a heading or footing.
Syntax: How to Align a Heading or Footing Element Across Columns in an HTML or PDF Report
TYPE = headfoot, [subtype,] COLSPAN = n, $
where:
headfoot
Is the type of heading or footing. Valid values are TABHEADING, TABFOOTING, HEADING,FOOTING, SUBHEAD, and SUBFOOT.
22. Using Headings, Footings, Titles, and Labels
Creating Reports With TIBCO® WebFOCUS Language 1655

subtype
Are additional attributes that identify the report component. These options can be usedseparately or in combination, depending upon the degree of specificity required to identifyan element. Valid values are:
LINE, which identifies a line by its position in a heading or footing. Identifying individuallines enables you to format each line differently.
If a heading or footing has multiple lines and you apply a StyleSheet declaration thatdoes not specify LINE, the declaration is applied to all lines. Blank lines are countedwhen interpreting the value of LINE.
OBJECT, which identifies an element in a heading or footing as a text string or fieldvalue. Valid values are TEXT or FIELD. TEXT may represent free text or a DialogueManager amper (&) variable.
It is not necessary to specify OBJECT=TEXT unless you are styling both text strings andembedded fields in the same heading or footing.
ITEM, which identifies an item by its position in a line. To divide a heading or footingline into items, you can use the <+0> spot marker. For more information, see Identifying a Report Component in a WebFOCUS StyleSheet on page 1251.
To determine the ITEM for an OBJECT, follow these guidelines:
When used with OBJECT=TEXT, count only the text strings from left to right.
When used with OBJECT=FIELD, count only values from left to right.
When used without OBJECT, count text strings and field values from left to right.
If you apply a StyleSheet declaration that specifies ITEM, the number is counted from thebeginning of each line in the heading or footing, not just from the beginning of the first line.
COLSPAN
Is an attribute that aligns an item in the width spanned by multiple columns.
nIs the column with which the specified item is aligned.
Aligning a Heading or Footing Element Across Columns in an HTML or PDF Report
1656
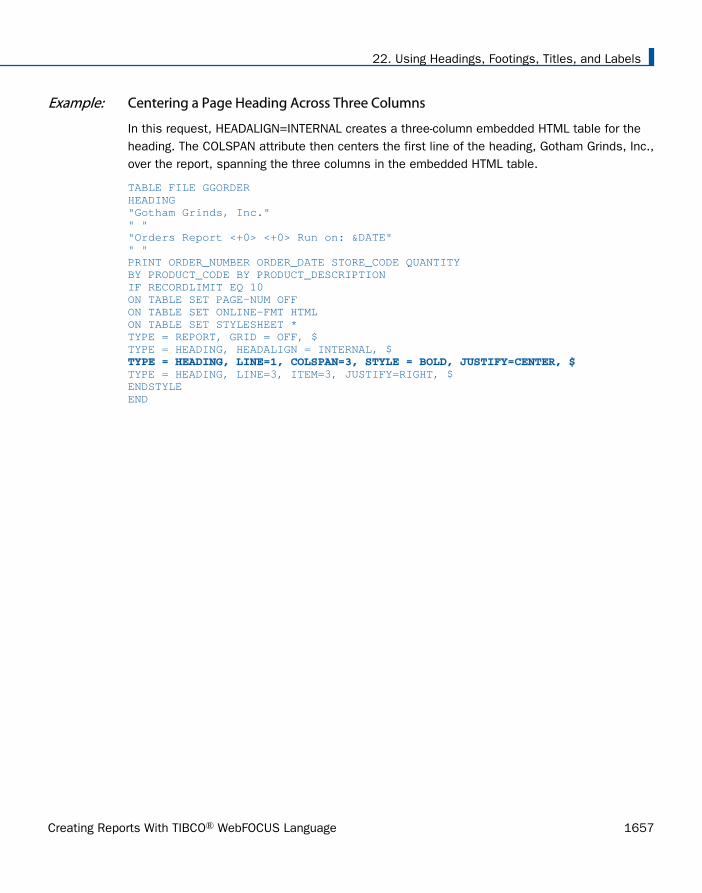
Example: Centering a Page Heading Across Three Columns
In this request, HEADALIGN=INTERNAL creates a three-column embedded HTML table for theheading. The COLSPAN attribute then centers the first line of the heading, Gotham Grinds, Inc.,over the report, spanning the three columns in the embedded HTML table.
TABLE FILE GGORDERHEADING"Gotham Grinds, Inc."" ""Orders Report <+0> <+0> Run on: &DATE"" "PRINT ORDER_NUMBER ORDER_DATE STORE_CODE QUANTITYBY PRODUCT_CODE BY PRODUCT_DESCRIPTIONIF RECORDLIMIT EQ 10ON TABLE SET PAGE-NUM OFFON TABLE SET ONLINE-FMT HTMLON TABLE SET STYLESHEET *TYPE = REPORT, GRID = OFF, $TYPE = HEADING, HEADALIGN = INTERNAL, $ TYPE = HEADING, LINE=1, COLSPAN=3, STYLE = BOLD, JUSTIFY=CENTER, $ TYPE = HEADING, LINE=3, ITEM=3, JUSTIFY=RIGHT, $ENDSTYLEEND
22. Using Headings, Footings, Titles, and Labels
Creating Reports With TIBCO® WebFOCUS Language 1657

The output is:
Aligning a Heading or Footing Element Across Columns in an HTML or PDF Report
1658

Example: Aligning a Field Value Across Multiple Columns
In this request, HEADALIGN=BODY aligns the sort footing in the same HTML table as the bodyof the report. COLSPAN = 5 positions the first item in the sort footing (the text Total) in thefifth column of the HTML table. The second item in the sort footing (the field <ST.QUANTITY) ispositioned in the next available column.
The HEADALIGN attribute is on a separate line from the COLSPAN attribute because it appliesto the entire sort footing (and consequently to both items), whereas COLSPAN applies to thesingle item Total.
TABLE FILE GGORDERPRINT ORDER_NUMBER ORDER_DATE STORE_CODE QUANTITYBY PRODUCT_CODE BY PRODUCT_DESCRIPTIONWHERE ORDER_DATE EQ '01/01/96'WHERE STORE_CODE EQ 'R1019' ON PRODUCT_CODE SUBFOOT"Total: <ST.QUANTITY" ON TABLE SET PAGE-NUM OFFON TABLE SET ONLINE-FMT HTMLON TABLE SET STYLESHEET *TYPE = REPORT, GRID = OFF, $ TYPE = SUBFOOT, HEADALIGN = BODY, JUSTIFY = RIGHT, STYLE = BOLD, $TYPE = SUBFOOT, OBJECT = TEXT, COLSPAN = 5, $ ENDSTYLEEND
The partial output is:
22. Using Headings, Footings, Titles, and Labels
Creating Reports With TIBCO® WebFOCUS Language 1659
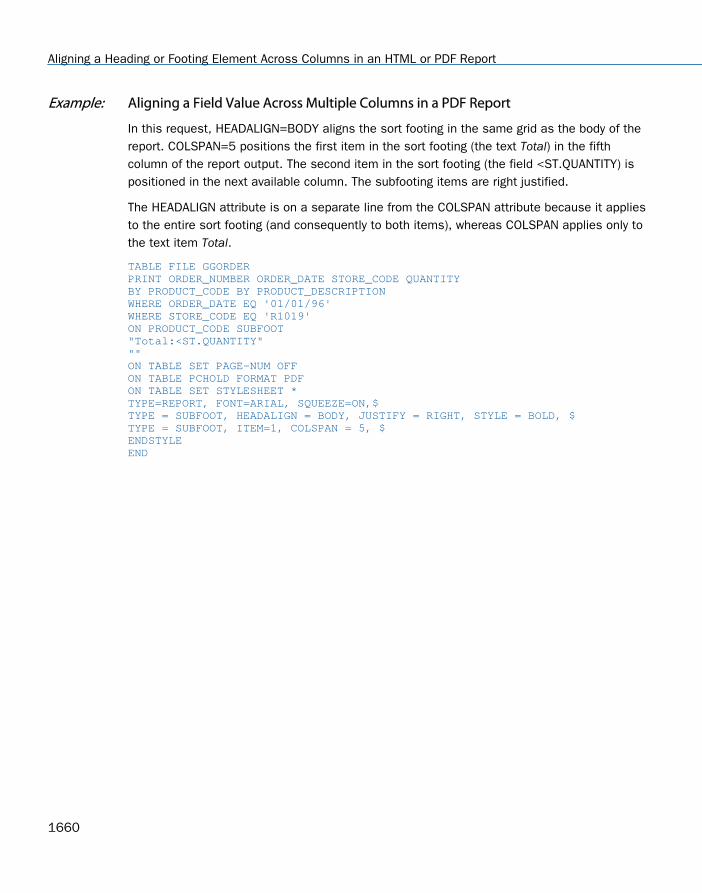
Example: Aligning a Field Value Across Multiple Columns in a PDF Report
In this request, HEADALIGN=BODY aligns the sort footing in the same grid as the body of thereport. COLSPAN=5 positions the first item in the sort footing (the text Total) in the fifthcolumn of the report output. The second item in the sort footing (the field <ST.QUANTITY) ispositioned in the next available column. The subfooting items are right justified.
The HEADALIGN attribute is on a separate line from the COLSPAN attribute because it appliesto the entire sort footing (and consequently to both items), whereas COLSPAN applies only tothe text item Total.
TABLE FILE GGORDERPRINT ORDER_NUMBER ORDER_DATE STORE_CODE QUANTITYBY PRODUCT_CODE BY PRODUCT_DESCRIPTIONWHERE ORDER_DATE EQ '01/01/96'WHERE STORE_CODE EQ 'R1019'ON PRODUCT_CODE SUBFOOT"Total:<ST.QUANTITY"""ON TABLE SET PAGE-NUM OFFON TABLE PCHOLD FORMAT PDFON TABLE SET STYLESHEET *TYPE=REPORT, FONT=ARIAL, SQUEEZE=ON,$ TYPE = SUBFOOT, HEADALIGN = BODY, JUSTIFY = RIGHT, STYLE = BOLD, $TYPE = SUBFOOT, ITEM=1, COLSPAN = 5, $ENDSTYLEEND
Aligning a Heading or Footing Element Across Columns in an HTML or PDF Report
1660

The output shows that the first item in the sort footing (the text Total) is in the fifth column ofthe report output. The second item in the sort footing (the field <ST.QUANTITY) is positioned inthe next available column.
Aligning Content in a Multi-Line Heading or Footing
The HEADALIGN and COLSPAN syntax described in Aligning a Heading or Footing Element in anHTML, XLSX, EXL2K, PDF, PPTX, or DHTML Report on page 1637 is specific to HTML reports.This topic describes how you can design reports that are printable across HTML and PDFformats. Using the WIDTH and JUSTIFY syntax in a StyleSheet, you can:
Align vertical sets of text or data as columnar units.
Combine columnar formatting with line-by-line formatting.
Align decimal points when the data displayed has varying numbers of decimal places. See Aligning Decimals in a Multi-Line Heading or Footing on page 1666.
You can apply WIDTH and JUSTIFY attributes to report headings and footings, page headingsand footings, and sort headings and footings, using either mono-space or proportional fonts.
22. Using Headings, Footings, Titles, and Labels
Creating Reports With TIBCO® WebFOCUS Language 1661

These techniques rely on internal cascading style sheets, which support WebFOCUSStyleSheet attributes that were not previously available for HTML reports. The syntaxassociated with these techniques resolves the problem of having to format headings differentlyfor HTML reports (using HEADALIGN and COLSPAN) and PDF and PS reports (using POSITIONand spot markers).
While the WIDTH and JUSTIFY attributes are particularly useful when you need to format amulti-line heading or footing, or align stacked decimals, you can also use this syntax toposition items in an individual heading or footing line.
Tip: For a summary of other alignment methods, see Choosing an Alignment Method forHeading and Footing Elements on page 1635.
Syntax: How to Align Heading Text and Data in Columns
For a multi-line report or page heading or footing, use the syntax:
TYPE=headfoot, WRAP=OFF, $TYPE=headfoot, [LINE=line_#,] ITEM=item_#, [OBJECT={TEXT|FIELD}], WIDTH=width, [JUSTIFY=option,] $
For a multi-line sort heading or footing, use the syntax:
TYPE=headfoot, WRAP=OFF, $TYPE={SUBHEAD|SUBFOOT}, [BY=sortfield] [LINE=line_#,] ITEM=item_#, [OBJECT={TEXT|FIELD}], WIDTH=width, [JUSTIFY=option,] $
where:
headfootIs the type of heading or footing. Valid values are TABHEADING, TABFOOTING,HEADING, FOOTING, SUBHEAD, and SUBFOOT.
sortfieldWhen TYPE=SUBHEAD or SUBFOOT, you can specify alignment for the sort heading orsort footing associated with a particular sort field. If no sort field is specified,formatting is applied to the sort headings or footings associated with all sort fields.
LINE
Is an optional entry that identifies a line by its position in a heading or footing.Identifying individual lines enables you to format each one differently.
If a heading or footing has multiple lines and you apply a StyleSheet declaration that doesnot specify LINE, the declaration is applied to all lines. Blank lines are counted wheninterpreting the value of LINE.
You can use LINE in combination with ITEM.
Aligning Content in a Multi-Line Heading or Footing
1662
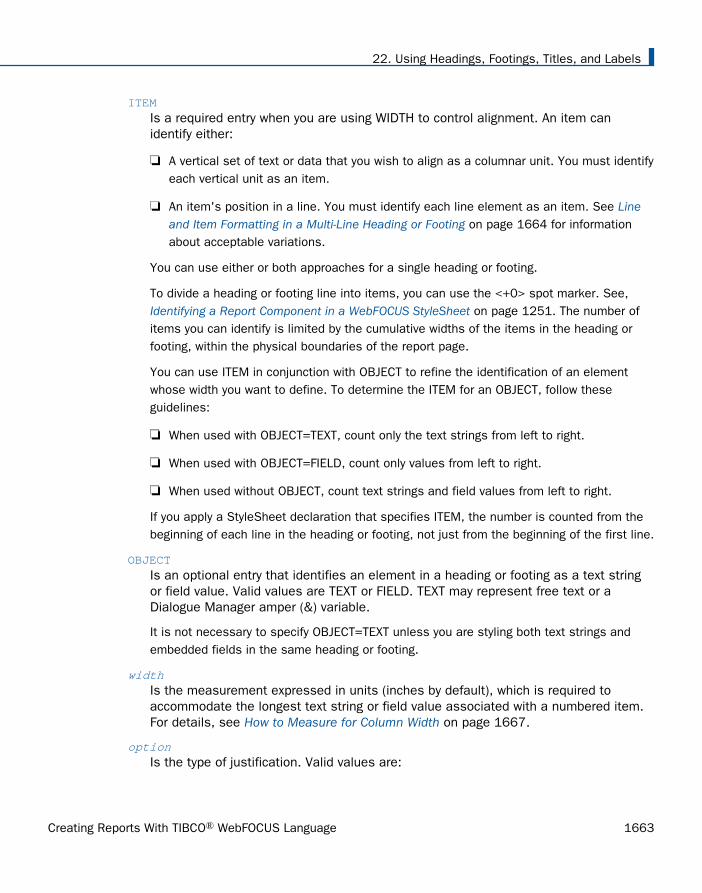
ITEM
Is a required entry when you are using WIDTH to control alignment. An item canidentify either:
A vertical set of text or data that you wish to align as a columnar unit. You must identifyeach vertical unit as an item.
An item's position in a line. You must identify each line element as an item. See Lineand Item Formatting in a Multi-Line Heading or Footing on page 1664 for informationabout acceptable variations.
You can use either or both approaches for a single heading or footing.
To divide a heading or footing line into items, you can use the <+0> spot marker. See, Identifying a Report Component in a WebFOCUS StyleSheet on page 1251. The number ofitems you can identify is limited by the cumulative widths of the items in the heading orfooting, within the physical boundaries of the report page.
You can use ITEM in conjunction with OBJECT to refine the identification of an elementwhose width you want to define. To determine the ITEM for an OBJECT, follow theseguidelines:
When used with OBJECT=TEXT, count only the text strings from left to right.
When used with OBJECT=FIELD, count only values from left to right.
When used without OBJECT, count text strings and field values from left to right.
If you apply a StyleSheet declaration that specifies ITEM, the number is counted from thebeginning of each line in the heading or footing, not just from the beginning of the first line.
OBJECT
Is an optional entry that identifies an element in a heading or footing as a text stringor field value. Valid values are TEXT or FIELD. TEXT may represent free text or aDialogue Manager amper (&) variable.
It is not necessary to specify OBJECT=TEXT unless you are styling both text strings andembedded fields in the same heading or footing.
widthIs the measurement expressed in units (inches by default), which is required toaccommodate the longest text string or field value associated with a numbered item.For details, see How to Measure for Column Width on page 1667.
optionIs the type of justification. Valid values are:
22. Using Headings, Footings, Titles, and Labels
Creating Reports With TIBCO® WebFOCUS Language 1663

LEFT which left justifies the heading or footing. LEFT is the default value.
RIGHT which right justifies the heading or footing.
CENTER which centers the heading or footing.
DECIMAL (n)Is the measurement expressed in units (inches by default), which specifies how far infrom the right side of a column to place the decimal point. With this specification, youcan locate the decimal point in the same position within a column, regardless of thenumber of decimal places displayed to its right.
The measurement will be a portion of the width specified for this item. For details, see How to Measure for Column Width on page 1667.
Note: JUSTIFY is not supported with WRAP.
Reference: Line and Item Formatting in a Multi-Line Heading or Footing
Line formatting maximizes your control over the items you identify on each line:
You can align and stack the same number of items with uniform widths. For example,
Line 1 Item 1 Item 2 Item 3
Line 2 Item 1 Item 2 Item 3
You can also align different numbers of items as long as the items on each line have thesame starting point and the same cumulative width.
Line 1
Line 2
Do not use HEADALIGN or COLSPAN syntax, which are specific to HTML reports and mayconflict with WIDTH and JUSTIFY settings.
For HTML reports, turn WRAP OFF (ON is the default) to ensure proper processing of WIDTHand JUSTIFY.
Example: Aligning Data and Text in a Multi-Line Heading or Footing
In the following free-form report, content is defined entirely in the sort heading, where text anddata are stacked to support comparison among countries. Each set of data is alignedvertically, to appear as a column. To achieve this affect, each vertical unit is identified as anitem: the first column of text is item 1, the next column of data is item 2, and so on.
Aligning Content in a Multi-Line Heading or Footing
1664

Note especially the last column, in which decimal data with different numbers of decimalplaces is lined up on the decimal point to facilitate reading and comparison.
The chart below breaks out the structure of the previous report:
Item1:
Text
Item 2:
Data values
Item 3:
Text
Item 4:
Values with decimal places
Country ARGENTINABRAZIL, and so on
Exchange Rate nn.dd
Type ST.NOTES Projected Return n.ddd
Holder COMM Balance nn,nnn,nnn.dd
22. Using Headings, Footings, Titles, and Labels
Creating Reports With TIBCO® WebFOCUS Language 1665

For each item, you specify the width of the column and the justification of its content, asillustrated in the following code.
DEFINE FILE SHORTBALANCE/D14.2=BALANCE;ENDTABLE FILE SHORTBY COUNTRY NOPRINT SUBHEAD "Country:<COUNTRY Exchange Rate:<EXCHANGE_RATE""Type:<TYPE Projected Return:<PROJECTED_RETURN""Holder:<HOLDER Balance:<BALANCE" ON TABLE SET PAGE-NUM OFFON TABLE SET ONLINE-FMT HTML ON TABLE SET HTMLCSS ON ON TABLE SET STYLESHEET *TYPE=REPORT, FONT='TIMES', $TYPE=REPORT, GRID=OFF, $ TYPE=SUBHEAD, ITEM=1, WIDTH=1.00, JUSTIFY=RIGHT, $TYPE=SUBHEAD, ITEM=2, WIDTH=1.25, JUSTIFY=RIGHT, $TYPE=SUBHEAD, ITEM=3, WIDTH=1.25, JUSTIFY=RIGHT,$TYPE=SUBHEAD, ITEM=4, WIDTH=1.5, JUSTIFY=DECIMAL(.6),$ ENDSTYLEEND
This procedure produces a three-line sort heading, broken out as four items, each with ameasured width and defined justification. The decimal item (4) uses a variation on standardjustification to line up the decimal points. For details, see How to Align Heading Text and Datain Columns on page 1662 and Aligning Decimals in a Multi-Line Heading or Footing on page1666.
Note: To take advantage of this feature for an HTML report, you must turn on internalcascading style sheets (SET HTMLCSS=ON). This command enables WebFOCUS StyleSheetattributes that were not previously available for HTML reports. This line of code is ignored for aPDF report.
Aligning Decimals in a Multi-Line Heading or Footing
The ability to align heading content in a multi-line heading based on width and justificationvalues has special benefit in reports that contain data with different numbers of decimalplaces. For example, if a figure is in dollars, it is formatted with a decimal point and two placesfor zeroes. If in Swiss francs, it is formatted with a decimal place and four zeroes. If in yen, thedecimal is at the end with no zeroes. In addition, sometimes the currency or units do not vary,but the number of digits of decimal precision varies.
Aligning Content in a Multi-Line Heading or Footing
1666

By aligning the decimal points in a vertical stack, you can more easily read and compare thesenumbers, as illustrated in the following output:
Floating decimal points Aligned decimal points
Bond ------------
Galosh Ltd.
Mukluk Inc.
Overshoe Inc.
Face Value ------------
22375.5784596
1212345.457
232.45484
Bond ------------
Galosh Ltd.
Mukluk Inc.
Overshoe Inc.
Face Value -------------
22375.5784596
1212345.457
232.45484
The technique uses a width specification for the item that contains decimals, combined with avariation on standard left/right/center justification to achieve the proper decimal alignment.For the syntax that generates this output, see How to Align Heading Text and Data in Columnson page 1662.
Procedure: How to Measure for Column Width
Determining the width of a heading or footing item is a three-step process:
1. Identify the maximum number of characters in a text string or field.
2. For a text string, simply count the characters. For a field, refer to the format specificationin the Master File or in a command such as a DEFINE.
3. Measure the physical space in units (for example, in inches) that is required to display thenumber of characters identified in step 1, based on the size of the font you are using. Forexample, the following value of the COUNTRY field would measure as follows:
Font Font size Comparison Inches
Helvetica 10 England .5
Times New Roman 10 England .44
Courier 10 England .56
Tip: Consider using a consistent set of fonts in your reports to make your measurementsreusable.
22. Using Headings, Footings, Titles, and Labels
Creating Reports With TIBCO® WebFOCUS Language 1667

Procedure: How to Measure for Decimal Alignment
After you have determined the width of an item, you can do a related measurement todetermine the physical space required to display decimal data with a varying number of digitsto the right of the decimal point.
1. Determine the maximum number of decimal places you need to accommodate to the rightof the decimal place, plus the decimal point itself.
2. Measure the physical space in units (for example, in inches) that is required to display thenumber of characters identified in step 1, based on the size of the font you are using.
Combining Column and Line Formatting in Headings and Footings
By combining column and line formatting, you can create complex reports in which differentranges of lines in the same heading or footing have different numbers of aligned columns indifferent locations.
Example: Combining Column and Line Formatting to Align Items in a Sort Heading
This request produces a free-form report in which content is defined in a seven-line sortheading. Text and data is stacked in two groupings:
The first grouping identifies the country and region (continent).
The second grouping provides financial information for each country/region pair.
Although this is a single sort heading, our goal is to format the information in each grouping abit differently to provide emphasis and facilitate comparison. The request also demonstrates acoding technique that makes formatting changes easier for the report designer. See theannotations following the code for details.
As you review the sample request, keep in mind that a heading can contain two kinds of items:text and embedded fields. A text item consists of any characters, even a single blank, betweenembedded fields and/or spot markers. In particular, if you have a single run of text that youwant to treat as two items, you can separate the two items using a <+0> spot marker. Forexample, in the heading line:
" <+0>Country:<COUNTRY"
item #1 is a single blank space.
item #2, separated by the <+0> spot marker, is the text Country:
item #3 is the embedded field <COUNTRY.
For details about the <+0> spot marker, see Identifying a Report Component in a WebFOCUSStyleSheet on page 1251.
Aligning Content in a Multi-Line Heading or Footing
1668

Request and annotations:
DEFINE FILE SHORT BALANCE/D14.2=BALANCE; END TABLE FILE SHORT BY COUNTRY NOPRINT SUBHEAD 1. " <+0>Country:<COUNTRY" 2. " <+0>Region:<REGION" " " 3. "Type:<TYPE <+0>Exchange Rate:<EXCHANGE_RATE" 4. "Holder:<HOLDER <+0>Projected Return:<PROJECTED_RETURN" 5. "Risk class:<RISK_CLASS <+0>Balance:<BALANCE" " " ON TABLE SET PAGE-NUM OFF 6. ON TABLE SET HTMLCSS ON ON TABLE SET STYLESHEET * TYPE=REPORT, FONT='TIMES', $ TYPE=REPORT, GRID=OFF, $ -* Bottom section of subhead: 7. TYPE=SUBHEAD, ITEM=1, WIDTH=1.00, JUSTIFY=RIGHT, $ 8. TYPE=SUBHEAD, ITEM=2, WIDTH=1.25, JUSTIFY=RIGHT, $ 9. TYPE=SUBHEAD, ITEM=3, WIDTH=.5, $ 10. TYPE=SUBHEAD, ITEM=4, WIDTH=1.25, JUSTIFY=RIGHT,$ 11. TYPE=SUBHEAD, ITEM=5, WIDTH=1.5, JUSTIFY=DECIMAL(.6),$ -* Top section of subhead (overrides above ITEM defaults -* for lines 1 and 2): 12. -SET &INDENT=1.5; 13. TYPE=SUBHEAD, LINE=1, ITEM=1, WIDTH=&INDENT, $ 14. TYPE=SUBHEAD, LINE=1, ITEM=2, WIDTH=1, JUSTIFY=LEFT, $ 15. TYPE=SUBHEAD, LINE=1, ITEM=3, SIZE=14, WIDTH=2, JUSTIFY=LEFT, $ 16. TYPE=SUBHEAD, LINE=2, ITEM=1, WIDTH=&INDENT, $ 17. TYPE=SUBHEAD, LINE=2, ITEM=2, WIDTH=1, JUSTIFY=LEFT, $ 18. TYPE=SUBHEAD, LINE=2, ITEM=3, WIDTH=2, JUSTIFY=LEFT, $ ENDSTYLE END
22. Using Headings, Footings, Titles, and Labels
Creating Reports With TIBCO® WebFOCUS Language 1669

The output highlights the key information and its relationship by aligning text and data,including decimal data in which decimal points are aligned for easy comparison.
Line # Description
1-2 Defines the content for the top, two-line section of the sort heading. Each linecontains three items: the first is a blank area (denoted by a space, separatedfrom the next item by a <+0> spot marker), the second contains text, the thirdcontains data values related to the text.
Aligning Content in a Multi-Line Heading or Footing
1670
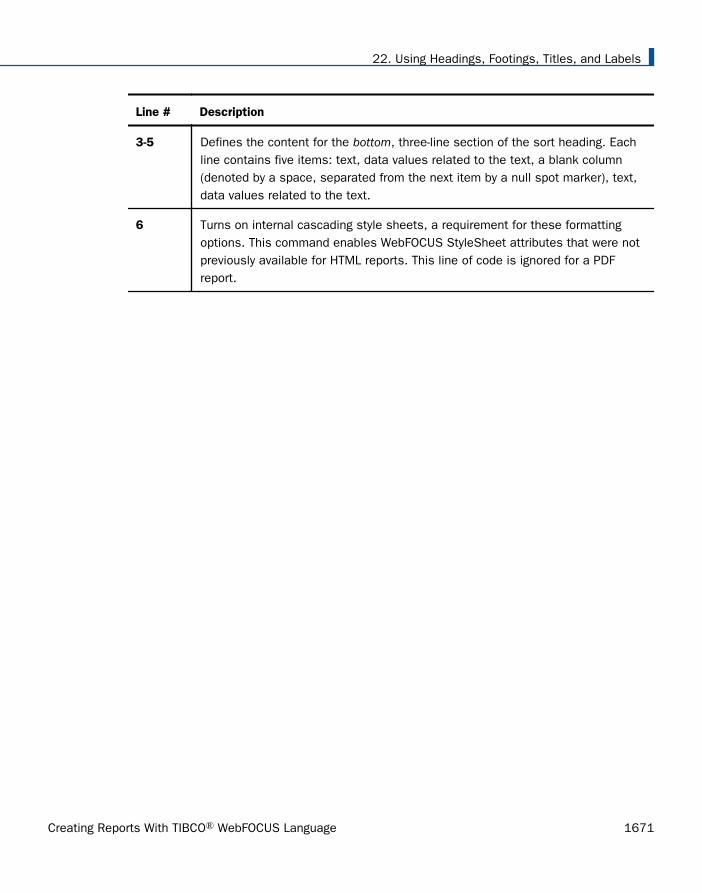
Line # Description
3-5 Defines the content for the bottom, three-line section of the sort heading. Eachline contains five items: text, data values related to the text, a blank column(denoted by a space, separated from the next item by a null spot marker), text,data values related to the text.
6 Turns on internal cascading style sheets, a requirement for these formattingoptions. This command enables WebFOCUS StyleSheet attributes that were notpreviously available for HTML reports. This line of code is ignored for a PDFreport.
22. Using Headings, Footings, Titles, and Labels
Creating Reports With TIBCO® WebFOCUS Language 1671

Line # Description
7-11 Specifies the basic formatting characteristics for the sort heading by breakingthe content into five columns, each identified as an item with a defined width,and justification information for all but the empty column.
Important: Had additional formatting code (annotated as 12-17) not beenincluded in the request, the specifications annotated as 7-11 would haveapplied to the entire sort heading (that is, the formatting of the three columns inthe top section of the heading would have been based on the specifications forthe first three columns described below). However, that is not the effect wewant to achieve, so a second section of StyleSheet code is defined to overridethis formatting for lines 1 and 2 of the sort heading. See annotations 12-18.
The formatting of the bottom, three-line section of the heading is controlled bythe following specifications:
Item 1 identifies a columnar unit that contains text (that is, Type, Holder, RiskClass). It has a defined width of 1 inch and the text is right justified.
Item 2 identifies a columnar unit that contains data values related to the text initem 1. It has a defined width of 1.25 inches and the data is right justified.
Item 3 identifies a columnar unit that contains blank space and serves as aseparator between columns. It has a width of .5 inches. Justification is notrelevant.
Item 4 identifies a columnar unit that contains text (e.g., Exchange Rate,Projected Return, Balance). It has a defined width of 1.25 inches and the text isright justified.
Item 5 identifies a columnar unit that contains a decimal value. The width of thecolumn that contains the value is 1.5 inches, with the decimal point anchored .6 inches in from the right edge of that column.
The common width and justification definitions enforce the proper alignment ofeach item.
Aligning Content in a Multi-Line Heading or Footing
1672

Line # Description
12 Defines a variable called &INDENT, with a width setting of 1.5 inches. Thisvariable defines the width of the blank area (item 1) at the beginning of lines 1and 2 of the sort heading.
Defining the width as a variable enables you to experiment with different widthssimply by changing the value in one location. For a complex report, thistechnique can potentially save a lot of development time. For details, see thedocumentation on Dialogue Manager in the TIBCO WebFOCUS® DevelopingReporting Applications manual.
13-18 Specifies line-by-line formatting for the top, two-line section of the sort heading.This code overrides the previous formatting for lines 1 and 2 of the sort headingbecause it specifies a line number.
Item 1 on each line refers to the blank area. The width is defined as a variableand implemented based on the current value of &INDENT.
Item 2 on each line refers to the text area. It has a defined width of 1 inch andthe text is left justified.
Item 3 on each line refers to the data values. It has a defined width of 2 inchesand the data is left justified.
The common width and justification definitions enforce the proper alignment ofeach item.
Notice that item 1 in line 15 defines a font size for the data values associatedwith the COUNTRY field. All other items on both lines use a default font. Line-by-line formatting enables you to define a unique characteristic for a single item.
Positioning Headings, Footings, or Items Within Them
For a PDF, PS, or HTML report, you can use the POSITION attribute in a StyleSheet to specify astarting position for a heading or footing, expressed as a unit measurement. For HTML, thiscapability requires an internal cascading style sheet. For details on selecting an alignmentmethod, see Choosing an Alignment Method for Heading and Footing Elements on page 1635.
22. Using Headings, Footings, Titles, and Labels
Creating Reports With TIBCO® WebFOCUS Language 1673

In addition, for a PDF or PS report, you can use the POSITION attribute to specify an absoluteor relative starting position for an element within a heading or footing or to align an item in aheading or footing with a report column. An absolute starting position is the distance from theleft margin of the report. A relative starting position is the distance from the preceding object.For the first item on a heading line this is the left margin of the report.
In an HTML report, you can use related syntax and an internal cascading style sheet toposition an image in a heading or footing. For details on images, see Laying Out the ReportPage on page 1333.
Syntax: How to Set a Starting Position for a Heading or Footing
Use the following syntax to specify a starting position for an entire heading or footing inrelation to the left margin of a report.
TYPE = headfoot, POSITION = position, $
where:
headfootIs the type of heading or footing. Valid values are TABHEADING, TABFOOTING,HEADING, FOOTING, SUBHEAD, and SUBFOOT.
positionIs the desired distance from the left, expressed by the UNITS attribute (the default isINCHES).
Note: In an HTML report, this syntax must be used in conjunction with an internal cascadingstyle sheet.
Example: Setting a Starting Position for a Report Heading in PDF
This request positions the report heading 1.25 inches from the left margin.
SET ONLINE-FMT=PDFTABLE FILE GGSALESPRINT BUDDOLLARS DOLLARSBY STCDWHERE BUDDOLLARS GE 25000WHERE STCD EQ 'R1019'ON TABLE SUBHEAD"Sales Report"" "ON TABLE SET PAGE-NUM OFFON TABLE SET SQUEEZE ONON TABLE SET STYLESHEET * TYPE = TABHEADING, POSITION = 1.25, $ ENDSTYLEEND
Positioning Headings, Footings, or Items Within Them
1674
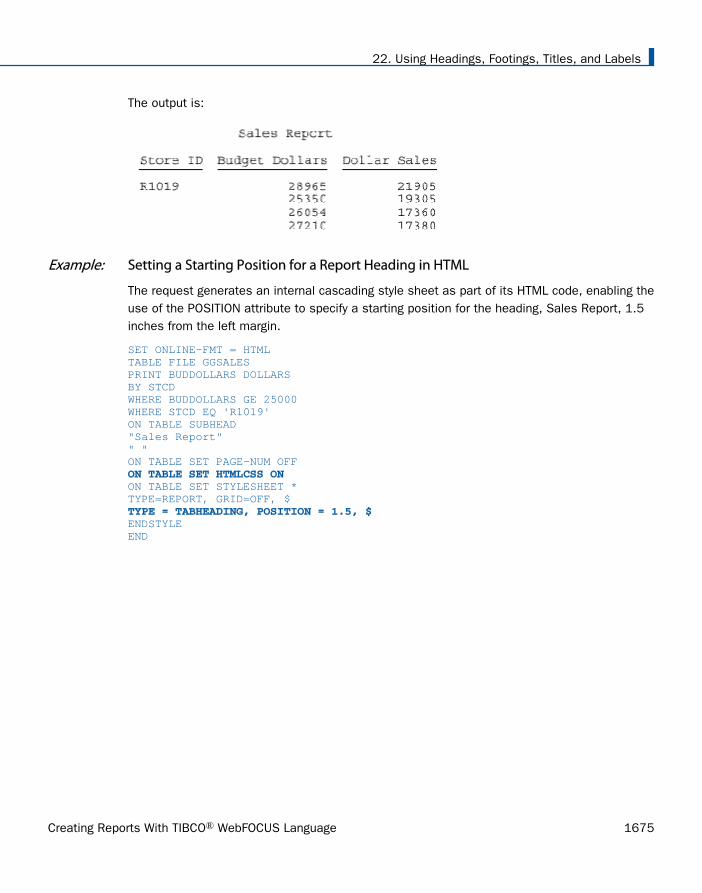
The output is:
Example: Setting a Starting Position for a Report Heading in HTML
The request generates an internal cascading style sheet as part of its HTML code, enabling theuse of the POSITION attribute to specify a starting position for the heading, Sales Report, 1.5inches from the left margin.
SET ONLINE-FMT = HTMLTABLE FILE GGSALESPRINT BUDDOLLARS DOLLARSBY STCDWHERE BUDDOLLARS GE 25000WHERE STCD EQ 'R1019'ON TABLE SUBHEAD"Sales Report"" "ON TABLE SET PAGE-NUM OFF ON TABLE SET HTMLCSS ON ON TABLE SET STYLESHEET *TYPE=REPORT, GRID=OFF, $ TYPE = TABHEADING, POSITION = 1.5, $ ENDSTYLEEND
22. Using Headings, Footings, Titles, and Labels
Creating Reports With TIBCO® WebFOCUS Language 1675

The output is:
Syntax: How to Set a Starting Position for a Heading or Footing Element
For a PDF or PS report, use the following syntax to specify a starting position for a heading orfooting element in relation to the preceding item
TYPE = headfoot, [subtype,] POSITION = {+|-}option, $
where:
headfoot
Is the type of heading or footing. Valid values are TABHEADING, TABFOOTING, HEADING,FOOTING, SUBHEAD, and SUBFOOT.
subtype
Are additional attributes that identify the report component. These options can be usedseparately or in combination, depending upon the degree of specificity you need to fullyidentify an element. Valid values are:
LINE, which identifies a line by its position in a heading or footing. Identifying individuallines enables you to format each line differently.
Positioning Headings, Footings, or Items Within Them
1676
If a heading or footing has multiple lines and you apply a StyleSheet declaration thatdoes not specify LINE, the declaration is applied to all lines. Blank lines are countedwhen interpreting the value of LINE.
ITEM, which identifies an item by its position in a line. To divide a heading or footingline into items, you can use the <+0> spot marker. For details, see Identifying a ReportComponent in a WebFOCUS StyleSheet on page 1251.
To determine an ITEM number for an OBJECT, follow these guidelines:
When used with OBJECT=TEXT, count only the text strings from left to right.
When used with OBJECT=FIELD, count only values from left to right.
When used without OBJECT, count text strings and field values from left to right.
If you apply a StyleSheet declaration that specifies ITEM, the number is counted fromthe beginning of each line in the heading or footing, not just from the beginning of thefirst line.
OBJECT, which identifies an element in a heading or footing as a text string or fieldvalue. Valid values are TEXT or FIELD. TEXT may represent free text or a DialogueManager amper (&) variable.
It is not necessary to specify OBJECT=TEXT unless you are styling both text strings andembedded fields in the same heading or footing.
option
Is the alignment method. Valid values are:
position, which is the desired distance, expressed by the UNITS attribute (the default isinches) for absolute positioning.
+, which starts the heading or footing element at the specified distance to the right ofthe preceding item. For the first item in a heading or footing, the preceding item is theleft margin of the report.
-, which starts the heading or footing element at the specified distance to the left of thepreceding item. This is useful if you want to overlap images in a heading.
column_title, which aligns the heading or footing element with the first character of thedesignated column.
22. Using Headings, Footings, Titles, and Labels
Creating Reports With TIBCO® WebFOCUS Language 1677

Example: Setting an Absolute Starting Position for a Heading Item
This request uses the spot marker <+0> to divide the report heading into three text strings. Itstarts the third text string, 1st Qtr 2001, 3 inches from the left report margin. This techniquecan be used in PDF as well as PS reports.
SET ONLINE-FMT = PDFTABLE FILE GGSALESSUM UNITS DOLLARS BY CATEGORY BY PRODUCTON TABLE SUBHEAD "Sales Report - <+0>All Products<+0> 1st Qtr 2001" " "ON TABLE SET PAGE-NUM OFFON TABLE SET SQUEEZE ONON TABLE SET STYLESHEET * TYPE = TABHEADING, OBJECT = TEXT, ITEM=1, SIZE = 12, STYLE = BOLD, $TYPE = TABHEADING, OBJECT = TEXT, ITEM=2, STYLE = BOLD, $TYPE = TABHEADING, OBJECT = TEXT, ITEM=3, POSITION = 3, $ ENDSTYLEEND
The output is:
Positioning Headings, Footings, or Items Within Them
1678

Example: Setting a Relative Starting Position for a Heading Item
This request uses the spot marker <+0> to divide the report heading into three text strings. Itstarts the third text string, 1st Qtr 2001, one inch to the right of the previous item on theheading line. Inches is the default unit of measure. This technique can be used in PDF as wellas PS reports.
SET ONLINE-FMT = PDFTABLE FILE GGSALESSUM UNITS DOLLARS BY CATEGORY BY PRODUCTON TABLE SUBHEAD "Sales Report - <+0>All Products<+0> 1st Qtr 2001" " "ON TABLE SET PAGE-NUM OFFON TABLE SET SQUEEZE ONON TABLE SET STYLESHEET * TYPE = TABHEADING, OBJECT = TEXT, ITEM=1, SIZE = 12, STYLE = BOLD, $TYPE = TABHEADING, OBJECT = TEXT, ITEM=2, STYLE = BOLD, $TYPE = TABHEADING, OBJECT = TEXT, ITEM=3, POSITION = +1, $ ENDSTYLEEND
The output is:
22. Using Headings, Footings, Titles, and Labels
Creating Reports With TIBCO® WebFOCUS Language 1679

Example: Aligning a Heading Item With a Column
This request uses the spot marker <+0> to divide the report heading into three text strings. Itstarts the second text string at the horizontal position where the column UNITS (Unit Sales) is.This technique can be used in PDF as well as PS reports.
SET ONLINE-FMT = PDFTABLE FILE GGSALESSUM UNITS DOLLARS BY CATEGORY BY PRODUCTON TABLE SUBHEAD "Sales Report - <+0>All Products<+0> 1st Qtr 2001" " "ON TABLE SET PAGE-NUM OFFON TABLE SET SQUEEZE ONON TABLE SET STYLESHEET * TYPE = TABHEADING, LINE=1, ITEM=2, POSITION=UNITS, $ ENDSTYLEEND
The output is:
Tip: In this request the column (UNITS) is identified by name. However, there are other ways toidentify a column that you wish to format. See Identifying a Report Component in a WebFOCUSStyleSheet on page 1251.
Using PRINTPLUS
PRINTPLUS includes enhancements to display alternatives offered by WebFOCUS. For example,you can place a FOOTING after a SUBFOOT in your report. PRINTPLUS provides the flexibility toproduce the exact report you desire.
Positioning Headings, Footings, or Items Within Them
1680

The PRINTPLUS parameter must be set to ON to use the following TABLE capabilities:
PAGE-BREAK is handled internally to provide the correct spacing of pages. For example, if anew report page is started and an instruction to skip a line at the top of the new page isencountered, WebFOCUS knows to suppress the blank line and start at the top of the page.
NOSPLIT is handled internally. (Use NOSPLIT to force a break at a specific spot.)
You can perform RECAPs in cases where pre-specified conditions are met.
A Report SUBFOOT now prints above the footing instead of below it.
Data displays correctly in subfoots when IF/WHERE TOTAL or BY HIGHEST is used.
BY field actions are linked with BY field options so they appear on the same page. Thefooting no longer splits on two pages.
Footings and Subfoots always appear on a page with at least one data item, and will neversplit between two pages.
Printing beyond the length of the page no longer occurs.
Splitting of fields linked by OVER onto separate pages no longer occurs.
There is no reserved space for conditional output. The output page is fully used.
The order of sort fields is no longer relevant.
Note: PRINTPLUS is not supported for StyleSheets. A warning message is generated in thiscase.
Syntax: How to Use PRINTPLUS
Issue the command
SET PRINTPLUS = {ON|OFF}
22. Using Headings, Footings, Titles, and Labels
Creating Reports With TIBCO® WebFOCUS Language 1681
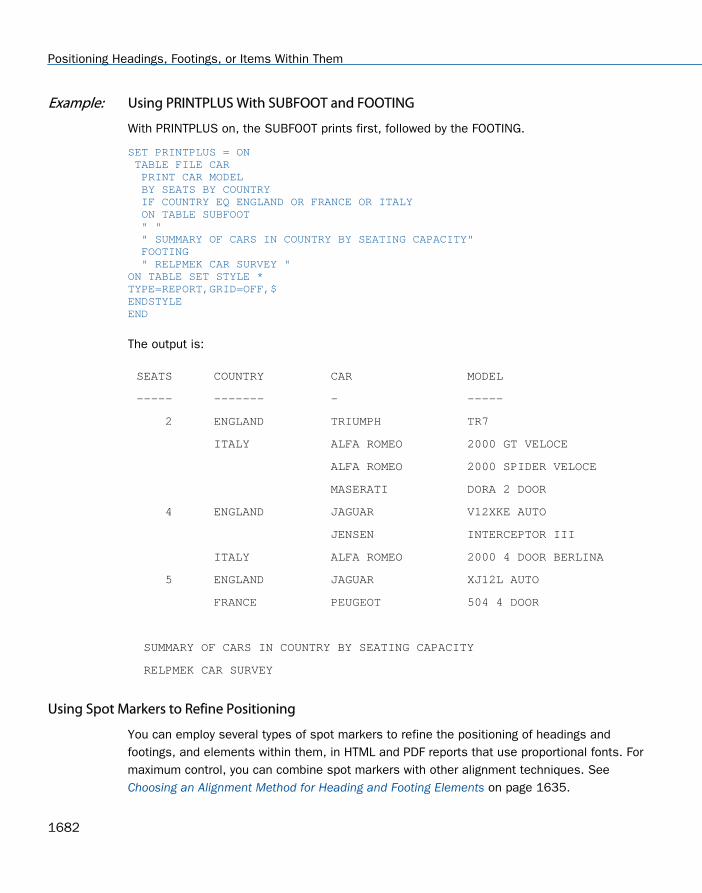
Example: Using PRINTPLUS With SUBFOOT and FOOTING
With PRINTPLUS on, the SUBFOOT prints first, followed by the FOOTING.
SET PRINTPLUS = ON TABLE FILE CAR PRINT CAR MODEL BY SEATS BY COUNTRY IF COUNTRY EQ ENGLAND OR FRANCE OR ITALY ON TABLE SUBFOOT " " " SUMMARY OF CARS IN COUNTRY BY SEATING CAPACITY" FOOTING " RELPMEK CAR SURVEY "ON TABLE SET STYLE *TYPE=REPORT,GRID=OFF,$ENDSTYLEEND
The output is:
SEATS COUNTRY CAR MODEL
----- ------- — -----
2 ENGLAND TRIUMPH TR7
ITALY ALFA ROMEO 2000 GT VELOCE
ALFA ROMEO 2000 SPIDER VELOCE
MASERATI DORA 2 DOOR
4 ENGLAND JAGUAR V12XKE AUTO
JENSEN INTERCEPTOR III
ITALY ALFA ROMEO 2000 4 DOOR BERLINA
5 ENGLAND JAGUAR XJ12L AUTO
FRANCE PEUGEOT 504 4 DOOR
SUMMARY OF CARS IN COUNTRY BY SEATING CAPACITY
RELPMEK CAR SURVEY
Using Spot Markers to Refine Positioning
You can employ several types of spot markers to refine the positioning of headings andfootings, and elements within them, in HTML and PDF reports that use proportional fonts. Formaximum control, you can combine spot markers with other alignment techniques. See Choosing an Alignment Method for Heading and Footing Elements on page 1635.
Positioning Headings, Footings, or Items Within Them
1682

The following spot markers enable you to position items and to identify items to be formatted:
<+0> divides a heading or footing into items for formatting.
To divide a heading or footing into items that can be formatted separately, place the <+0>spot marker after the text string or field you wish to specify. It will not add any additionalspaces to your heading or footing. For details, see Identifying a Report Component in aWebFOCUS StyleSheet on page 1251.
</n specifies skipped lines.
To specify skipped lines in a heading or footing, place the </n> spot marker on the sameline as the text in the request. If you place it on a line by itself, WebFOCUS counts the linethe spot marker is on plus the number of skip-lines you designate. For details, see Controlling the Vertical Positioning of a Heading or Footing on page 1687.
<-n controls the positioning of a character immediately following a field.
Note: When a closing spot marker is immediately followed by an opening spot marker (><), asingle space text item will be placed between the two spot markers (> <). This must beconsidered when applying formatting.
You can also use spot markers to position heading and footing elements at fixed and relativecolumn locations. Several spot markers control positioning based on the pre-defined width of acharacter in a monospace font. This is a legacy formatting technique that is not supported forproportional fonts.
Example: Positioning a Character Immediately After a Field in an HTML Report
This request generates an HTML report in which the closing parenthesis and the period in thesort heading follow immediately after the STORE_CODE and STATE fields, respectively. Thisbehavior is controlled by the <-1 spot markers, which indicate a relative starting position fromthe preceding object. Without these spot markers to indicate that the punctuation charactersshould follow the preceding objects, an extra space would appear in each of these positions inthe display.
SET ONLINE-FMT = HTMLSET PAGE-NUM = OFFJOIN STORE_CODE IN CENTCOMP TO STORE_CODE IN CENTORD
22. Using Headings, Footings, Titles, and Labels
Creating Reports With TIBCO® WebFOCUS Language 1683

TABLE FILE CENTCOMPHEADING"Century Corporation Orders Report </1"PRINT PROD_NUM QUANTITY LINEPRICEBY STORE_CODE NOPRINTBY ORDER_NUMON STORE_CODE SUBHEAD "Century Corporation orders for store <STORENAME <0X(store # <STORE_CODE<-1 ) in <STATE|.</1" ON TABLE SET STYLE *TYPE=REPORT, GRID=OFF, $ENDSTYLEEND
The partial output is:
Example: Positioning a Character Immediately After a Field in a PDF or PS Report
In a PDF report, an embedded field in a heading or footing must be followed by a space in therequest to be recognized for processing. However, in the output the space may not bedesirable. This example demonstrates two techniques for positioning punctuation charactersimmediately after a field in a PDF report.
Positioning Headings, Footings, or Items Within Them
1684

The first technique uses the POSITION attribute in a StyleSheet to position the closingparenthesis immediately after the STORE_CODE value. The second technique uses the <-1spot marker to position the period immediately after the STATE value. The POSITIONmeasurement is based on the UNITS designation POINTS. Experimentation demonstrated that-7 points moves the closing parenthesis to the proper location after the field, using the defaultproportional font and size.
SET ONLINE-FMT = PDFSET PAGE-NUM = OFFJOIN STORE_CODE IN CENTCOMP TO STORE_CODE IN CENTORD TABLE FILE CENTCOMPHEADING"Century Corporation Orders Report"PRINT PROD_NUM QUANTITY LINEPRICEBY STORE_CODE NOPRINTBY ORDER_NUMON STORE_CODE SUBHEAD"Century Corporation orders for store <STORENAME (store # <STORE_CODE ) in <0X <STATE <-1 . </1"ON TABLE SET STYLE *TYPE=REPORT, GRID=OFF, UNITS=POINTS, $ TYPE=SUBHEAD, OBJECT=TEXT, ITEM=3, POSITION= -7, $ENDSTYLEEND
The output is:
22. Using Headings, Footings, Titles, and Labels
Creating Reports With TIBCO® WebFOCUS Language 1685
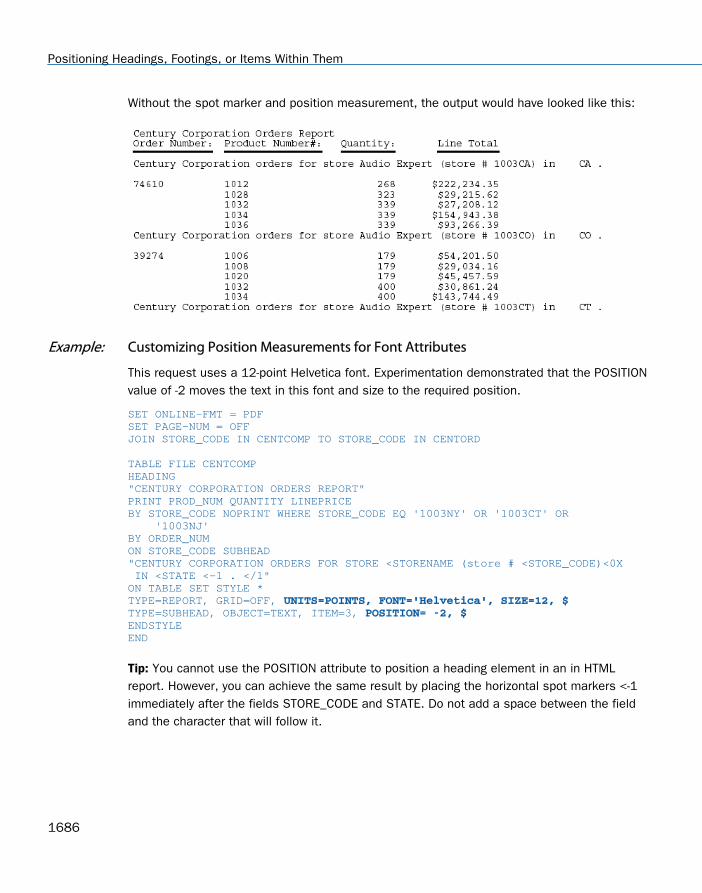
Without the spot marker and position measurement, the output would have looked like this:
Example: Customizing Position Measurements for Font Attributes
This request uses a 12-point Helvetica font. Experimentation demonstrated that the POSITIONvalue of -2 moves the text in this font and size to the required position.
SET ONLINE-FMT = PDFSET PAGE-NUM = OFFJOIN STORE_CODE IN CENTCOMP TO STORE_CODE IN CENTORD TABLE FILE CENTCOMPHEADING"CENTURY CORPORATION ORDERS REPORT"PRINT PROD_NUM QUANTITY LINEPRICEBY STORE_CODE NOPRINT WHERE STORE_CODE EQ '1003NY' OR '1003CT' OR '1003NJ'BY ORDER_NUMON STORE_CODE SUBHEAD"CENTURY CORPORATION ORDERS FOR STORE <STORENAME (store # <STORE_CODE)<0X IN <STATE <-1 . </1"ON TABLE SET STYLE *TYPE=REPORT, GRID=OFF, UNITS=POINTS, FONT='Helvetica', SIZE=12, $ TYPE=SUBHEAD, OBJECT=TEXT, ITEM=3, POSITION= -2, $ ENDSTYLEEND
Tip: You cannot use the POSITION attribute to position a heading element in an in HTMLreport. However, you can achieve the same result by placing the horizontal spot markers <-1immediately after the fields STORE_CODE and STATE. Do not add a space between the fieldand the character that will follow it.
Positioning Headings, Footings, or Items Within Them
1686

The output is:
Controlling the Vertical Positioning of a Heading or Footing
You can use several vertical positioning techniques to enhance the appearance and readabilityof a report:
In a report generated in HTML, PDF, or other report formats, you can add one or more linesabove or below heading or footing text using spot markers and free text lines. See How toAdd Blank Lines to a Heading or Footing on page 1688.
In a PDF report you can control the space above or below a heading or footing line or thedistance between text and the surrounding grid lines in a heading or footing line using theTOPGAP and BOTTOMGAP attributes in a StyleSheet. See How to Control Vertical Spacing ina Heading or Footing on page 1689. For full information on TOPGAP and BOTTOMGAP, see Laying Out the Report Page on page 1333.
In a PDF report, you can position a page footing at the bottom of a page, rather thandirectly after the report data. See How to Position a Page Footing at the Bottom of a Page onpage 1692.
22. Using Headings, Footings, Titles, and Labels
Creating Reports With TIBCO® WebFOCUS Language 1687

Syntax: How to Add Blank Lines to a Heading or Footing
Use the following syntax options to add blank lines above or below, or within a heading orfooting, where:
</nIs a spot marker that specifies the number of lines to skip. It is best to put the spotmarker on the same line as the text in the request. If you place the spot marker </non a line by itself, it will add that line in addition to the designated number of skippedlines.
" "
Indicates a separate line in the heading or footing, with blank content.
You can use these techniques separately or in combination.
Example: Adding Blank Lines Above and Below a Report Heading
This request creates an HTML report with one blank line between each line of the pageheading and two blank lines between the page heading and the actual report. The first blankline is added as an empty text line, The next blank lines are added with the skip-line spotmarker.
TABLE FILE GGSALESSUM BUDUNITS UNITS BUDDOLLARS DOLLARSBY CATEGORYON TABLE SUBHEAD"SALES REPORT" " ""**(CONFIDENTIAL)**</1""December 2002 </2" ON TABLE SET PAGE-NUM OFF ON TABLE SET ONLINE-FMT HTML ON TABLE SET HTMLCSS ONON TABLE SET STYLESHEET *TYPE=REPORT, GRID=OFF, TOPMARGIN=0, $TYPE = TABHEADING, JUSTIFY = CENTER, $ENDSTYLEEND
Controlling the Vertical Positioning of a Heading or Footing
1688

The output is:
Syntax: How to Control Vertical Spacing in a Heading or Footing
In a PDF report, you can use the TOPGAP and BOTTOMGAP attributes to control spacing aboveor below a heading or footing line or the distance between heading or footing text and the gridlines above and below them.
Note: You can use TOPGAP and BOTTOMGAP with multi-line headings. Keep in mind thatbetween heading lines the top and bottom gap will be inserted, making the spacing betweenlines greater than the spacing at the top and bottom of the heading.
TYPE=headfoot, {TOPGAP|BOTTOMGAP}=gap, $
where:
headfoot Is the type of heading or footing. Valid values are TABHEADING, TABFOOTING,HEADING, FOOTING, SUBHEAD, and SUBFOOT.
TOPGAP
Indicates how much space to add above a report component.
BOTTOMGAP
Indicates how much space to add below a report component.
gapIs the amount of blank space, in the unit of measurement specified by the UNITSparameter (inches, by default).
22. Using Headings, Footings, Titles, and Labels
Creating Reports With TIBCO® WebFOCUS Language 1689

In the absence of grids, the default value is 0.
In the presence of grids, the default value increases to provide space between the grid andthe text.
Example: Adding Blank Space to Separate Heading Text From Grid Lines in a PDF Report
This request generates a PDF report with blank space added above and below the reportheading to separate the text from the upper and lower grid lines. The space above is added bythe TOPGAP attribute. The space below is added by the BOTTOMGAP attribute.
TABLE FILE GGSALESSUM BUDUNITS UNITS BUDDOLLARS DOLLARSBY CATEGORYON TABLE SUBHEAD"SALES REPORT <+0>December 2001"ON TABLE SET PAGE-NUM OFFON TABLE SET ONLINE-FMT PDFON TABLE SET SQUEEZE ONON TABLE SET STYLESHEET *TYPE = TABHEADING, GRID=ON, JUSTIFY=CENTER, TOPGAP=.25, BOTTOMGAP=.25, $TYPE = TABHEADING, FONT='TIMES', SIZE=12, STYLE=BOLD, $TYPE = TABHEADING, ITEM=2, SIZE=10, STYLE=ITALIC, $ENDSTYLEEND
The output is:
Controlling the Vertical Positioning of a Heading or Footing
1690
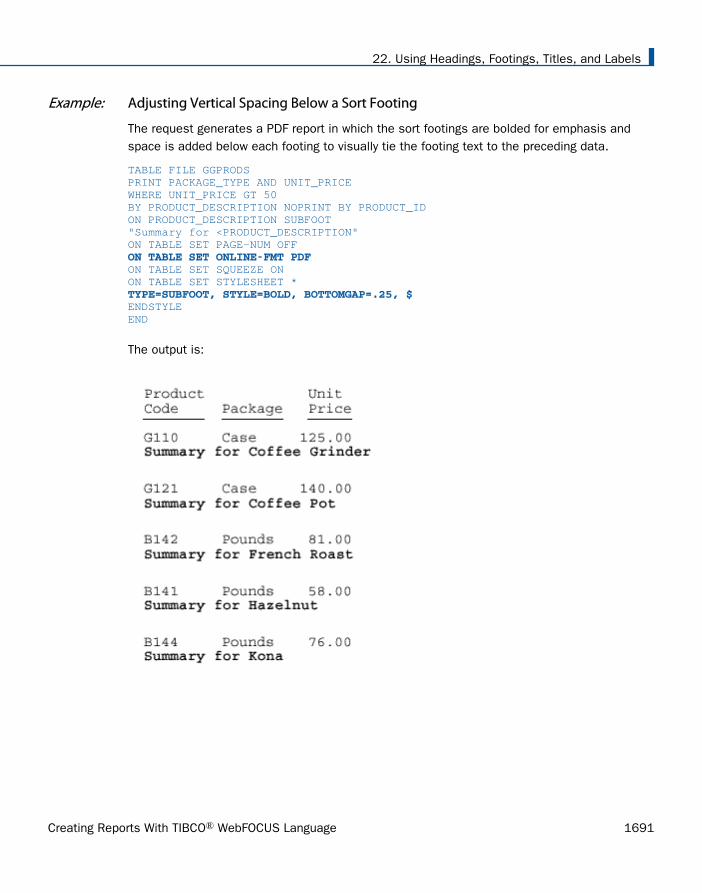
Example: Adjusting Vertical Spacing Below a Sort Footing
The request generates a PDF report in which the sort footings are bolded for emphasis andspace is added below each footing to visually tie the footing text to the preceding data.
TABLE FILE GGPRODSPRINT PACKAGE_TYPE AND UNIT_PRICEWHERE UNIT_PRICE GT 50BY PRODUCT_DESCRIPTION NOPRINT BY PRODUCT_IDON PRODUCT_DESCRIPTION SUBFOOT"Summary for <PRODUCT_DESCRIPTION"ON TABLE SET PAGE-NUM OFF ON TABLE SET ONLINE-FMT PDF ON TABLE SET SQUEEZE ONON TABLE SET STYLESHEET * TYPE=SUBFOOT, STYLE=BOLD, BOTTOMGAP=.25, $ ENDSTYLEEND
The output is:
22. Using Headings, Footings, Titles, and Labels
Creating Reports With TIBCO® WebFOCUS Language 1691

Syntax: How to Position a Page Footing at the Bottom of a Page
You can position a page footing at the bottom of a page. By default, a page footing appearstwo lines below the report data.
FOOTING [BOTTOM] "content ... "["content ... "]...["content ... "]
where:
FOOTING
Is the required command that identifies the content as a page footing.
BOTTOM
Is an optional command that places the footing at the bottom of the page. If you omitBOTTOM, the page footing appears two lines below the report data. Note: FOOTINGBOTTOM is not supported in an HTML report or by the WebFOCUS Viewer.
contentFooting content can include the following elements, between double quotation marks.(If the ending quotation mark is omitted, all subsequent lines of the request aretreated as part of the footing.)
textIs the footing text. You can include multiple lines of text.
The text must start on a line by itself, following the FOOTING command.
Text can be combined with variables and spot markers.
For related information, see Limits for Headings and Footings on page 1521.
variableCan be any one or a combination of the following:
Fields (real data source fields, virtual fields created with the DEFINE command in aMaster File or report request, calculated values created with the COMPUTE commandin a request, system fields such as TABPAGENO). You can qualify data source fieldswith certain prefix operators.
Dialogue Manager variables.
Images. You can include images in a heading or footing.
For details, see Including an Element in a Heading or Footing on page 1559.
Controlling the Vertical Positioning of a Heading or Footing
1692

spot markerEnables you to position items, to identify items to be formatted, and to extendcode beyond the 80-character line limit of the text editor.
<+0> divides a heading or footing into items for formatting. For details, see Identifyinga Report Component in a WebFOCUS StyleSheet on page 1251.
</n specifies skipped lines. For details, see Controlling the Vertical Positioning of aHeading or Footing on page 1687.
<-n to position the next character on the line. For details, see Using Spot Markers toRefine Positioning on page 1682.
<0X continues a heading or footing specification on the next line of the request. Fordetails, see Extending Heading and Footing Code to Multiple Lines in a Report Requeston page 1522.
Note: When a closing spot marker is immediately followed by an opening spot marker(><), a single space text item will be placed between the two spot markers (> <). Thismust be considered when applying formatting.
Blank lines
If you omit all text, variables, and spot markers, you have a blank heading or footingline (for example, " ") which you can use to skip a line in the heading or footing. (Youcan also skip a line using a vertical spot marker, such as </1.)
Note: The maximum number of sort headings and sort footings in one request is 33.
Example: Positioning a Page Footing at the Bottom of a Page
This request produces a PDF report in which the page footing appears at the bottom of thepage, rather than in its default position, two lines below the report data.
TABLE FILE GGSALESPRINT UNITS DOLLARSBY CATEGORY BY STCDWHERE TOTAL DOLLARS GE 25000FOOTING BOTTOM"PRELIMINARY SALES FIGURES"ON TABLE SET ONLINE-FMT PDFON TABLE SET PAGE-NUM OFFEND
22. Using Headings, Footings, Titles, and Labels
Creating Reports With TIBCO® WebFOCUS Language 1693

The following output shows the end of the report, with the footing.
Placing a Report Heading or Footing on Its Own Page
In a PDF report or an HTML report displayed in the WebFOCUS Viewer, you can request that areport heading or footing appear on its own page to set off important information. For example,you might want to create a cover page that flags salary information as Confidential and isseparate from the actual data.
Syntax: How to Position a Report Heading or Footing on Its Own Page
Each heading or footing line must begin and end with a double quotation mark.
ON TABLE PAGE-BREAK AND {SUBHEAD|SUBFOOT}"content ... "["content ... "]...["content ... "]
where:
PAGE-BREAK
Determines when a new page starts. Use with the SET LINES command to control thelength of a printed page.
SUBHEAD
Generates a report heading.
Placing a Report Heading or Footing on Its Own Page
1694
SUBFOOT
Generates a report footing.
contentHeading or footing content can include the following elements, between doublequotation marks. If the ending quotation mark is omitted, all subsequent lines of therequest are treated as part of the report heading.
textIs the heading or footing text. You can include multiple lines of text.
The text must start on a line by itself, following the SUBHEAD or SUBFOOT command.
Text can be combined with variables and spot markers.
For related information, see Limits for Headings and Footings on page 1521.
variableCan be any one or a combination of the following:
Fields (real data source fields, virtual fields created with the DEFINE command in aMaster File or report request, calculated values created with the COMPUTE commandin a request, system fields such as TABPAGENO). You can qualify data source fieldswith certain prefix operators.
Dialogue Manager variables.
Images. You can include images in a heading or footing.
For details, see Including an Element in a Heading or Footing on page 1559.
spot markerEnables you to position items, to identify items to be formatted, and to extendcode beyond the 80-character line limit of the text editor.
<+0> divides a heading or footing into items for formatting. For details, see Identifyinga Report Component in a WebFOCUS StyleSheet on page 1251.
</n specifies skipped lines. For details, see Controlling the Vertical Positioning of aHeading or Footing on page 1687.
<-n positions the next character on the line. For details, see Using Spot Markers toRefine Positioning on page 1682.
<0X continues a heading or footing specification on the next line of the request. Fordetails, see Extending Heading and Footing Code to Multiple Lines in a Report Requeston page 1522.
22. Using Headings, Footings, Titles, and Labels
Creating Reports With TIBCO® WebFOCUS Language 1695
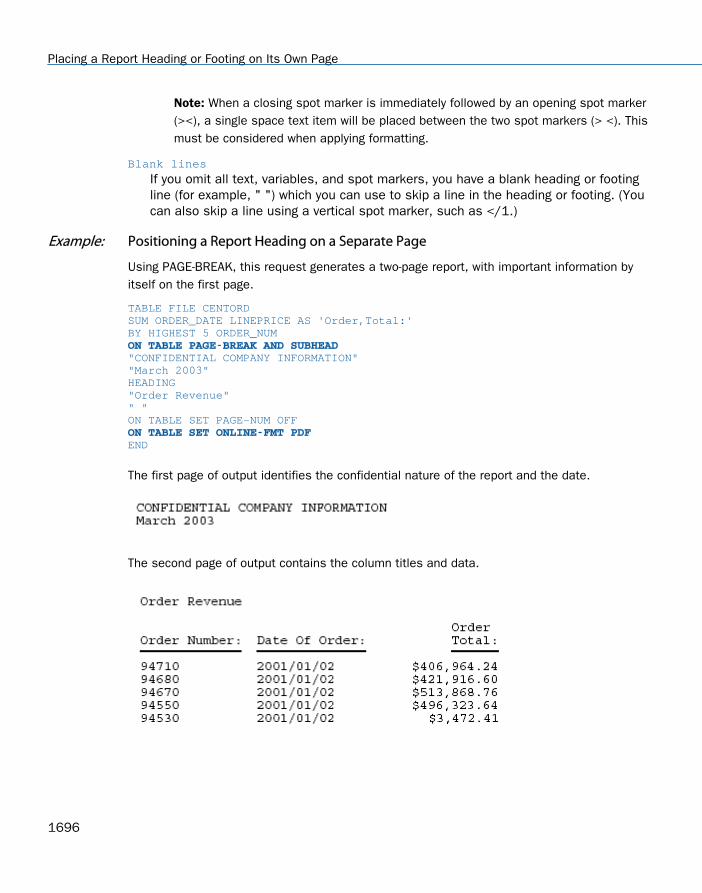
Note: When a closing spot marker is immediately followed by an opening spot marker(><), a single space text item will be placed between the two spot markers (> <). Thismust be considered when applying formatting.
Blank lines
If you omit all text, variables, and spot markers, you have a blank heading or footingline (for example, " ") which you can use to skip a line in the heading or footing. (Youcan also skip a line using a vertical spot marker, such as </1.)
Example: Positioning a Report Heading on a Separate Page
Using PAGE-BREAK, this request generates a two-page report, with important information byitself on the first page.
TABLE FILE CENTORDSUM ORDER_DATE LINEPRICE AS 'Order,Total:'BY HIGHEST 5 ORDER_NUM ON TABLE PAGE-BREAK AND SUBHEAD "CONFIDENTIAL COMPANY INFORMATION""March 2003"HEADING"Order Revenue"" "ON TABLE SET PAGE-NUM OFF ON TABLE SET ONLINE-FMT PDF END
The first page of output identifies the confidential nature of the report and the date.
The second page of output contains the column titles and data.
Placing a Report Heading or Footing on Its Own Page
1696

Tip: To produce comparable results in HTML, include the following code in the request to turnon the WebFOCUS Viewer.
ON TABLE SET ONLINE-FMT HTMLON TABLE SET WEBVIEWER ON ON TABLE SET STYLESHEET *TYPE=REPORT, GRID=OFF, $ENDSTYLEEND
The first page will display the report heading. You can navigate to the second page for thereport data.
Example: Positioning a Report Footing on a Separate Page
Using PAGE-BREAK, this request generates a two-page report with the report footing, whichsignals the end of the report, on a page by itself.
TABLE FILE CENTORDHEADING"Order Revenue"" "SUM ORDER_DATE LINEPRICE AS 'Order,Total:'BY HIGHEST 5 ORDER_NUM ON TABLE PAGE-BREAK AND SUBFOOT "END OF REPORT"ON TABLE SET PAGE-NUM OFFON TABLE SET ONLINE-FMT PDFEND
The first page of output contains the column titles and data.
The last page of output signals the end of the report.
22. Using Headings, Footings, Titles, and Labels
Creating Reports With TIBCO® WebFOCUS Language 1697

Note: To produce comparable results in HTML, include the following code in the request to turnon the WebFOCUS Viewer.
ON TABLE SET ONLINE-FMT HTMLON TABLE SET WEBVIEWER ON ON TABLE SET STYLESHEET *TYPE=REPORT, GRID=OFF, $ENDSTYLEEND
The first page of output will contain the column titles and data. You can navigate to the lastpage to see END OF REPORT.
Placing a Report Heading or Footing on Its Own Page
1698
Chapter23Formatting Report Data
This chapter covers information about formatting and positioning text in a report. You canselect the size, color, font, and style for the text of your report, in addition to being ableto adjust the position of text within a report.
In this chapter:
Specifying Font Format in a Report
Specifying Background Color in a Report
Alternating Background Color By Wrapped Line
Specifying Data Format in a Report
Positioning Data in a Report
Specifying Font Format in a Report
Using StyleSheet attributes, you can enhance the appearance of a report by specifying thefont, size, and color of the font. Font format can be designated for a report as a whole, or forheadings, footings, and columns individually.
Syntax: How to Specify Font Size in a Report
To specify a font size, use the following syntax within a StyleSheet.
TYPE = type, [subtype,] SIZE=pts, $
where:
typeIs the report component you wish to affect, such as REPORT, HEADING, or TITLE.
subtype Is any additional attribute, such as COLUMN, ACROSS, ITEM etc. that is needed toidentify the report component that you are formatting. See Identifying a ReportComponent in a WebFOCUS StyleSheet on page 1251 for more information about howto specify different report components.
Creating Reports With TIBCO® WebFOCUS Language 1699

ptsIs the size of the font in points. The default value is 10, which corresponds to theHTML default font size 3. For more information on the correlation between point sizeand html font size, see Usage Notes for Changing Font Size on page 1700.
Example: Specifying Font Size in a Report
In the following report request, the point size of column titles is set to 12:
TABLE FILE GGSALESON TABLE SET PAGE-NUM OFF SUM UNITS DOLLARS BY CATEGORYON TABLE SET STYLE * TYPE=TITLE, SIZE=12, $ TYPE=REPORT, GRID=OFF, $ENDSTYLEEND
The output is:
Reference: Usage Notes for Changing Font Size
Point size is fixed, except in an HTML report. Relative point size uses a different scale thanHTML font size. The following table lists the point size and the corresponding HTML font size:
Size in Points Corresponding HTML Font Size
8 or smaller 1
9 2
10 3
11 4
12 5
13 6
Specifying Font Format in a Report
1700

Size in Points Corresponding HTML Font Size
14 or larger 7
Syntax: How to Specify Bold or Italic Font Style in a Report
To specify a font style, use the following syntax within a StyleSheet.
TYPE=type, [subtype,] STYLE=[+|-]txtsty[{+|-}txtsty], $
where:
typeIs the report component you wish to affect, such as REPORT, HEADING, or TITLE.
subtypeIs any additional attribute, such as COLUMN, ACROSS, ITEM etc. that is needed toidentify the report component that you are formatting. See Identifying a ReportComponent in a WebFOCUS StyleSheet on page 1251 for more information about howto specify different report components.
txtstyIs one of the following values: NORMAL, BOLD, ITALIC. The default value is NORMAL.
Note that if you specify a style that is not supported for the font you are using, thespecified font will display without the style.
+
Enables you to specify a combination of font styles. You can add additional font stylesto an attribute that already has one or more font styles applied to it.
-
Enables you to remove a font style from an attribute.
Example: Specifying Font Style in a Report
In the following report, the column titles are specified to have bold and italic font styles:
TABLE FILE GGSALESSUM UNITS DOLLARS BY CATEGORY ON TABLE SET STYLE *TYPE=TITLE, STYLE=BOLD+ITALIC, $TYPE=REPORT, GRID=OFF, $ENDSTYLEEND
23. Formatting Report Data
Creating Reports With TIBCO® WebFOCUS Language 1701

The output is:
Example: Adding and Removing Inherited Font Style in a Report
In the following report request, the font styles bold and italics are specified for the entirereport. The inherited italics are removed from the heading, and both styles are removed fromthe column titles:
TABLE FILE GGSALESHEADING"Sales Report by Category"SUM UNITS DOLLARS BY CATEGORY ON TABLE SET STYLE * TYPE=REPORT, STYLE=BOLD+ITALIC, $TYPE=HEADING, STYLE=-ITALIC, $TYPE=TITLE, STYLE=-BOLD-ITALIC, $ TYPE=REPORT, GRID=OFF, $ENDSTYLEEND
The output is:
Specifying Font Format in a Report
1702

Syntax: How to Specify Font Color in a Report
To specify a color for the font of a report or a report component, use the following syntax withina StyleSheet.
TYPE=type, [subtype,] COLOR={color|RGB({r g b|#hexcolor})},$
where:
typeIs the report component you wish to affect, such as REPORT, HEADING, or TITLE.
subtypeIs any additional attribute, such as COLUMN, ACROSS, ITEM etc. that is needed toidentify the report component that you are formatting. See Identifying a ReportComponent in a WebFOCUS StyleSheet on page 1251 for more information about howto specify different report components.
colorIs one of the preset color values such as GREY or GOLD. If the display or outputdevice does not support colors, it substitutes shades of gray. The default value isBLACK. For a complete list of available color values, see Color Values in a Report onpage 1703.
RGB(r g b)Specifies the font color using a mixture of red, green, and blue.
(r g b) Is the desired intensity of red, green, and blue, respectively. The values are on ascale of 0 to 255, where 0 is the least intense and 255 is the most intense. Note thatusing the three color components in equal intensities results in shades of gray.
RGB(#hexcolor)Is the hexadecimal value for the color. For example, FF0000 is the hexadecimal valuefor red. The hexadecimal digits can be in upper or lower case and must be precededby a pound sign (#).
Reference: Color Values in a Report
The following chart lists all available color values that can be utilized with the syntax
COLOR=color, or BACKCOLOR=color,
where color is one of the following values:
AQUA (CYAN) MEDIUM FOREST GREEN (OLIVE)
23. Formatting Report Data
Creating Reports With TIBCO® WebFOCUS Language 1703

AQUAMARINE MEDIUM GOLDENROD
BLACK MEDIUM ORCHID
BLUE VIOLET MEDIUM SLATE BLUE
CADET BLUE MEDIUM SPRING GREEN
CORAL MEDIUM TURQUOISE
CORNFLOWER BLUE MEDIUM VIOLET RED
CYAN (AQUA) MIDNIGHT BLUE
DARK GREEN NAVY (NAVY BLUE)
DARK OLIVE GREEN OLIVE (MEDIUM FOREST GREEN)
DARK ORCHID ORANGE
DARK SLATE BLUE (PURPLE) ORANGE RED
DARK SLATE GREY ORCHID
DARK TURQUOISE PALE GREEN
DIM GREY (GRAY, GREY) PINK
FIREBRICK PLUM
FOREST GREEN (GREEN) PURPLE (DARK SLATE BLUE)
FUCHSIA (MAGENTA) RED
GOLD SALMON
GOLDENROD SEA GREEN
GRAY (DIM GREY, GREY) SIENNA
GREEN (FOREST GREEN) SILVER
Specifying Font Format in a Report
1704

GREEN YELLOW SKY BLUE
GREY (DIM GREY, GRAY) SLATE BLUE
INDIAN RED STEEL BLUE (TEAL)
KHAKI TAN
LIGHT BLUE TEAL (STEEL BLUE)
LIGHT GREY THISTLE
LIGHT STEEL BLUE TURQUOISE
LIME VIOLET
LIME GREEN VIOLET RED
MAGENTA (FUCHSIA) WHEAT
MAROON WHITE
MEDIUM AQUAMARINE YELLOW
MEDIUM BLUE YELLOW GREEN
Specifying Fonts for Reports
You can specify your own fonts in a report by using the FONT attribute in a StyleSheet. If youare specifying a font for an HTML report, the web browser must support the font. If the webbrowser does not support the font, it reverts to its default behavior of using the defaultproportional font.
Syntax: How to Specify Fonts in a Report
To specify a font for your report, use the following syntax within a StyleSheet.
TYPE=type, [subtype,] FONT='font[,font]',$
where:
typeIs the report component you wish to affect, such as REPORT, HEADING, or TITLE.
23. Formatting Report Data
Creating Reports With TIBCO® WebFOCUS Language 1705

subtypeIs any additional attribute, such as COLUMN, ACROSS, ITEM etc. that is needed toidentify the report component that you are formatting. See Identifying a ReportComponent in a WebFOCUS StyleSheet on page 1251 for more information about howto specify different report components.
fontIs the name of the font. You must enclose the value in single quotes. If you arecreating an HTML report, you can specify more than one font within the single quotesto accommodate more than one browser.
Note: In an HTML report, specifying different fonts for several different report componentssignificantly increases the size of the source code.
Example: Specifying Multiple Fonts in an HTML Report
To control how a report looks on more than one platform, you can specify both a commonWindows font and a common UNIX font in a request. The web browser searches for the firstfont in the list. If the browser does not find the first font, it searches for the next font in thelist. If none of the fonts are identified, the browser uses the default proportional font.
In this example, the web browser first searches for the Arial font. If the browser does not findArial, it searches for the Helvetica font. If neither font is identified, the browser uses thedefault proportional font.
TYPE=REPORT, FONT='ARIAL,HELVETICA',$
Syntax: How to Specify the Default Browser Fonts for HTML Reports
A browser assigns specific fonts as the default proportional and default monospaced fonts. Tospecify a default browser font for an HTML report, you use the reserved names, DEFAULT-PROPORTIONAL and DEFAULT-FIXED in the StyleSheet of your report. The browser displays thereport accordingly.
To select the default fixed or proportional font of the browser, use the following syntax. Notethat you must specify TYPE to indicate which report components you wish to affect.
FONT={DEFAULT-PROPORTIONAL|DEFAULT-FIXED},$
where:
DEFAULT-PROPORTIONAL
Specifies the default proportional font of the web browser.
DEFAULT-FIXED
Specifies the default monospaced font of the web browser.
Specifying Font Format in a Report
1706
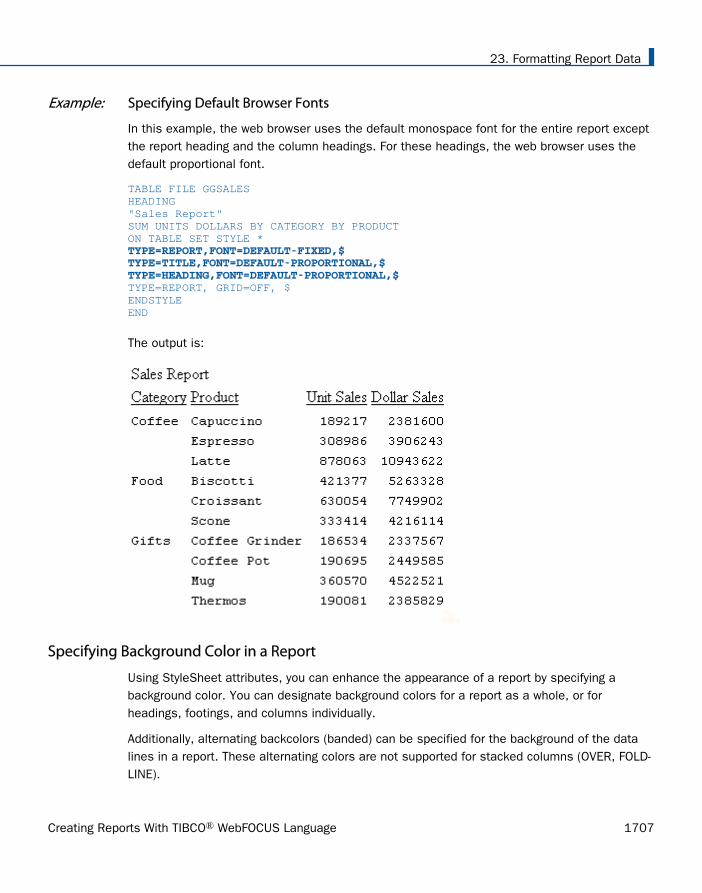
Example: Specifying Default Browser Fonts
In this example, the web browser uses the default monospace font for the entire report exceptthe report heading and the column headings. For these headings, the web browser uses thedefault proportional font.
TABLE FILE GGSALESHEADING"Sales Report"SUM UNITS DOLLARS BY CATEGORY BY PRODUCTON TABLE SET STYLE * TYPE=REPORT,FONT=DEFAULT-FIXED,$TYPE=TITLE,FONT=DEFAULT-PROPORTIONAL,$TYPE=HEADING,FONT=DEFAULT-PROPORTIONAL,$ TYPE=REPORT, GRID=OFF, $ENDSTYLEEND
The output is:
Specifying Background Color in a Report
Using StyleSheet attributes, you can enhance the appearance of a report by specifying abackground color. You can designate background colors for a report as a whole, or forheadings, footings, and columns individually.
Additionally, alternating backcolors (banded) can be specified for the background of the datalines in a report. These alternating colors are not supported for stacked columns (OVER, FOLD-LINE).
23. Formatting Report Data
Creating Reports With TIBCO® WebFOCUS Language 1707

Syntax: How to Specify Background Color in a Report
To specify a color for the background of a report, use the following syntax within a StyleSheet.
Note that when using BACKCOLOR in a PDF report, extra space is added to the top, bottom,right, and left of each cell of data in the report. This is for readability and to prevent truncation.
TYPE=type, [subtype,] BACKCOLOR={color|RGB({r g b|#hexcolor})}, $
where:
type
Is the report component you wish to affect, such as REPORT, HEADING, or TITLE. In aHEADING, FOOTING, SUBHEADING, or SUBFOOTING, you can specify a background color forindividual elements.
subtype
Is any additional attribute, such as COLUMN, ACROSS, ITEM, that is needed to identify thereport component that you are formatting. In a HEADING, FOOTING, SUBHEADING, orSUBFOOTING, you can specify a background color for individual elements. For moreinformation about how to specify different report components, see Identifying a ReportComponent in a WebFOCUS StyleSheet on page 1251.
color
Is the background color, which fills the space of the specified report component. Thedefault value is NONE. If you are creating a report in HTML format, background colors willonly appear in web browsers that support them.
RGB (r g b)
Specifies the font color using a mixture of red, green, and blue.
(r g b) Is the desired intensity of red, green, and blue, respectively. The values are on ascale of 0 to 255, where 0 is the least intense and 255 is the most intense. Note thatusing the three color components in equal intensities results in shades of gray.
RGB (#hexcolor)
Is the hexadecimal value for the color. For example, FF0000 is the hexadecimal value forred. The hexadecimal digits can be in upper or lower case and must be preceded by apound sign (#).
Specifying Background Color in a Report
1708
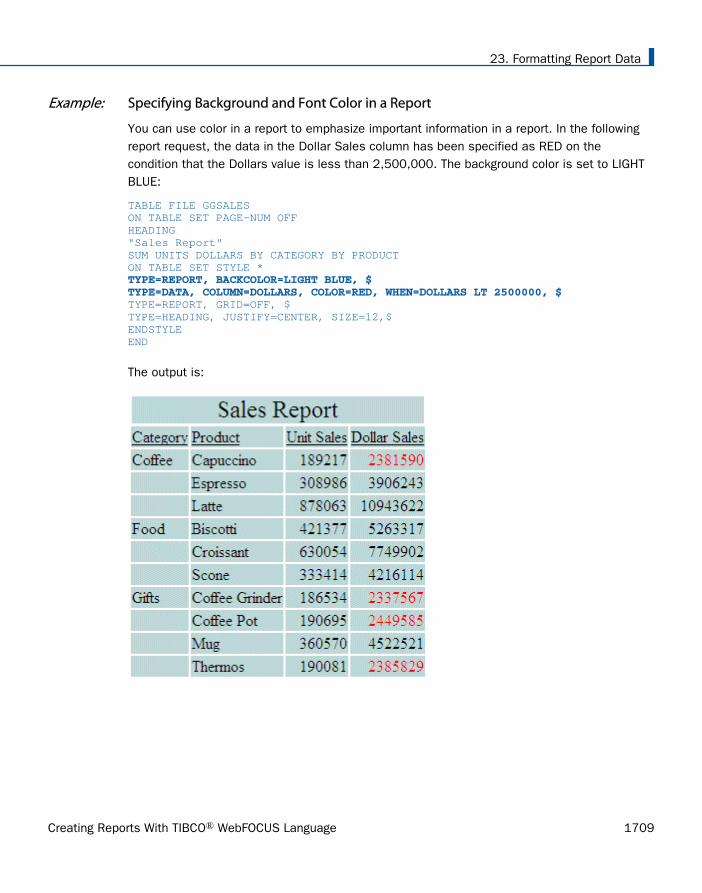
Example: Specifying Background and Font Color in a Report
You can use color in a report to emphasize important information in a report. In the followingreport request, the data in the Dollar Sales column has been specified as RED on thecondition that the Dollars value is less than 2,500,000. The background color is set to LIGHTBLUE:
TABLE FILE GGSALESON TABLE SET PAGE-NUM OFFHEADING"Sales Report"SUM UNITS DOLLARS BY CATEGORY BY PRODUCTON TABLE SET STYLE * TYPE=REPORT, BACKCOLOR=LIGHT BLUE, $TYPE=DATA, COLUMN=DOLLARS, COLOR=RED, WHEN=DOLLARS LT 2500000, $ TYPE=REPORT, GRID=OFF, $TYPE=HEADING, JUSTIFY=CENTER, SIZE=12,$ ENDSTYLEEND
The output is:
23. Formatting Report Data
Creating Reports With TIBCO® WebFOCUS Language 1709

Syntax: How to Specify Alternating Data Background Color in a Report
To specify alternating colors for the background of the data in a report, use the followingsyntax within a StyleSheet.
Note that when using BACKCOLOR in a PDF report, extra space is added to the top, bottom,right, and left of each cell of data in the report. This is for readability and to prevent truncation.
TYPE=DATA,BACKCOLOR=({c1|RGB({r1 g1 b1|#hc1})} {c2|RGB({r2 g2 b2|#hc2})}),$
where:
c1, c2Are the background colors for the data in the report. The default value is NONE. If youare creating a report in HTML format, background colors will only appear in webbrowsers that support them. Color names that contain a space must be enclosed insingle quotation marks, as a space is the delimiter between the alternating colorvalues.
RGB(r1 g1 b1), RGB(r2 g2 b2)Specifies the font colors using a mixture of red, green, and blue.
(r g b) Is the desired intensity of red, green, and blue, respectively. The values are on ascale of 0 to 255, where 0 is the least intense and 255 is the most intense. Note thatusing the three color components in equal intensities results in shades of gray.
RGB(#hc1), RGB(#hc2)Are the hexadecimal values for the colors. For example, FF0000 is the hexadecimalvalue for red. The hexadecimal digits can be in upper or lower case and must bepreceded by a pound sign (#).
Example: Specifying Alternating Background Colors for the Data Lines in a Report
The following request against the GGSALES data source produces alternating light blue andwhite data rows on the report output:
TABLE FILE GGSALESON TABLE SET PAGE-NUM OFFHEADING"Sales Report"SUM UNITS DOLLARSBY CATEGORYBY PRODUCTON TABLE PCHOLD FORMAT HTMLON TABLE SET STYLE *TYPE=REPORT, GRID=OFF, $ TYPE=DATA, BACKCOLOR=('LIGHT BLUE' WHITE),$ TYPE=HEADING, JUSTIFY=CENTER, SIZE=12,$ENDSTYLEEND
Specifying Background Color in a Report
1710

The output is:
Alternating Background Color By Wrapped Line
The ALTBACKPERLINE attribute alternates the background color by line for reports that usepositioned drivers, for example PDF, DHTML, PPT, and PPTX. This enables you to wrap a longfield value, and alternate the background color of each line for that value, independent ofborders. In order to apply alternating background color per line, you need to explicitly add theSET ALTBACKPERLINE=ON command to procedures that use WRAP.
Reference: Alternate Background Color By Wrapped Line
SET ALTBACKPERLINE = {ON|OFF}
where:
ON
Alternates background color by line.
OFF
Alternates background color by row. This is the default value.
23. Formatting Report Data
Creating Reports With TIBCO® WebFOCUS Language 1711

Example: Alternating Background Color By Wrapped Line
The following report request prints a COMPUTE field with a long line of text, using WRAP andwithout using the SET ALTBACKPERLINE command. The default alternating background color isapplied by row.
TABLE FILE WF_RETAIL PRINTCOMPUTE LONG_LINE/A1000 = 'This is a very long line of data, set up so that' |'it wraps onto the next line within a report' |'and to test the alternate color syntax' |'in style sheets.';BY PRODUCT_CATEGORY BY PRODUCT_SUBCATEG BY MODELON TABLE PCHOLD FORMAT PDFON TABLE SET PAGE OFFON TABLE SET STYLE *UNITS=IN, PAGESIZE='A4', LEFTMARGIN=0.19, TOPMARGIN=0.00, BOTTOMMARGIN=0.00, SQUEEZE=ON, ORIENTATION=LANDSCAPE, $TYPE=REPORT, FONT='ARIAL', SIZE=8, COLOR=BLACK, BACKCOLOR='NONE', STYLE=NORMAL, $TYPE=REPORT, COLUMN=N4, WRAP=1, $TYPE=DATA, COLUMN=N4, BACKCOLOR=(RGB(235 240 178) RGB(255 255 255)), $ENDSTYLEEND
Alternating Background Color By Wrapped Line
1712

The output is:
23. Formatting Report Data
Creating Reports With TIBCO® WebFOCUS Language 1713

With the SET ALTBACKPERLINE=ON command added to the request, the alternatingbackground color is applied by line, as shown in the following output.
Specifying Data Format in a Report
You can affect how data is represented in a report in several ways:
You can change the format of the numeric values that appear in a column.
You can determine whether or not you wish to use Continental Decimal Notation (CDN).
You can set a specific character or set of characters to represent fields that do not containdata.
Specifying Data Format in a Report
1714

Changing the Format of Values in a Report Column
A field format is defined in the Master File. You can, however, change the format of a reportcolumn. Field formats are described in full detail in the Describing Data With TIBCOWebFOCUS® Language manual.
Syntax: How to Change Format of Values in a Column
fieldname [alignment] [/format]
where:
fieldnameIs a display field—that is, a field displayed by the PRINT, LIST, SUM, or COUNTcommand, a row-total, or a column-total.
alignmentSpecifies the position of the column title.
/R specifies a right justified column title.
/L specifies a left justified column title.
/C specifies a centered column title.
formatIs any valid field format, preceded by a slash (/). Field formats are described in theDescribing Data With TIBCO WebFOCUS® Language manual. Field formats cannot beused with a column total.
Example: Changing the Format of Values in a Column
The UNIT_PRICE field has a format of D7.2 as defined in the GGPRODS Master File. To add afloating dollar sign to the display, the field format can be redefined as follows:
TABLE FILE GGPRODSPRINT UNIT_PRICE/D7.2MEND
23. Formatting Report Data
Creating Reports With TIBCO® WebFOCUS Language 1715
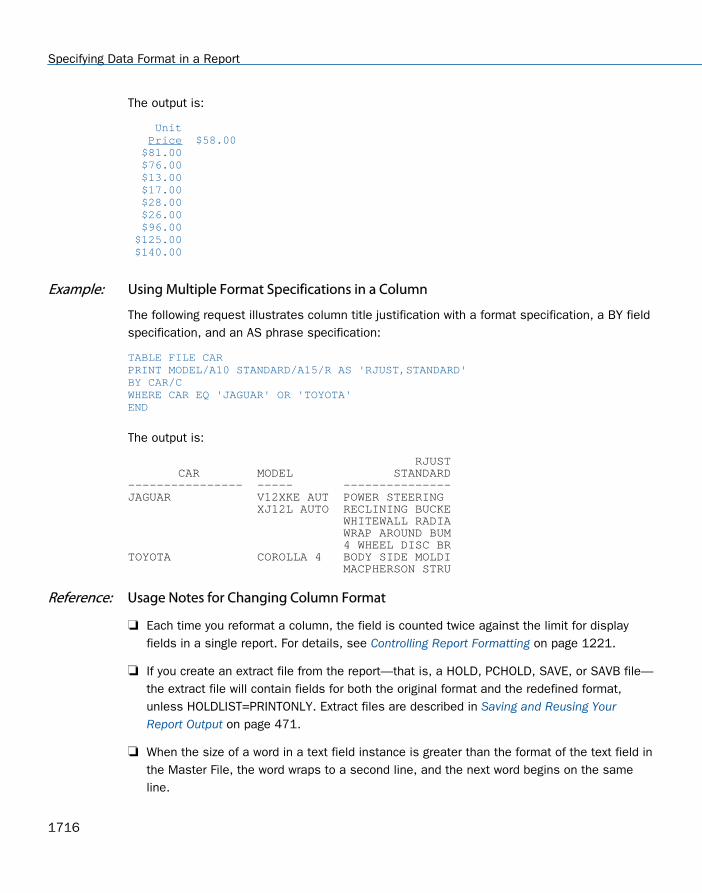
The output is:
Unit Price $58.00 $81.00 $76.00 $13.00 $17.00 $28.00 $26.00 $96.00 $125.00 $140.00
Example: Using Multiple Format Specifications in a Column
The following request illustrates column title justification with a format specification, a BY fieldspecification, and an AS phrase specification:
TABLE FILE CARPRINT MODEL/A10 STANDARD/A15/R AS 'RJUST,STANDARD' BY CAR/CWHERE CAR EQ 'JAGUAR' OR 'TOYOTA'END
The output is:
RJUST CAR MODEL STANDARD---------------- ----- ---------------JAGUAR V12XKE AUT POWER STEERING XJ12L AUTO RECLINING BUCKE WHITEWALL RADIA WRAP AROUND BUM 4 WHEEL DISC BRTOYOTA COROLLA 4 BODY SIDE MOLDI MACPHERSON STRU
Reference: Usage Notes for Changing Column Format
Each time you reformat a column, the field is counted twice against the limit for displayfields in a single report. For details, see Controlling Report Formatting on page 1221.
If you create an extract file from the report—that is, a HOLD, PCHOLD, SAVE, or SAVB file—the extract file will contain fields for both the original format and the redefined format,unless HOLDLIST=PRINTONLY. Extract files are described in Saving and Reusing YourReport Output on page 471.
When the size of a word in a text field instance is greater than the format of the text field inthe Master File, the word wraps to a second line, and the next word begins on the sameline.
Specifying Data Format in a Report
1716

You may specify justification for display fields, BY fields, and ACROSS fields. For ACROSSfields, data values, not column titles, are justified as specified.
For display commands only, the justification parameter may be combined with a formatspecification. The format specification may precede or follow the justification parameter.
If a title is specified with an AS phrase or in the Master File, that title will be justified asspecified in FORMAT.
When multiple ACROSS fields are requested, justification is performed on the lowestACROSS level only. All other justification parameters for ACROSS fields are ignored.
Controlling Missing Values for a Reformatted Field
When a field is reformatted in a request (for example, SUM field/format), an internal COMPUTEfield is created to contain the reformatted field value and display on the report output. If theoriginal field has a missing value, that missing value can be propagated to the internal field bysetting the COMPMISS parameter ON. If the missing value is not propagated to the internalfield, it displays a zero (if it is numeric) or a blank (if it is alphanumeric). If the missing value ispropagated to the internal field, it displays the missing data symbol on the report output.
Syntax: How to Control Missing Values in Reformatted Fields
SET COMPMISS = {ON|OFF}
where:
ON
Propagates a missing value to a reformatted field. ON is the default value.
OFF
Displays a blank or zero for a reformatted field.
Example: Controlling Missing Values in Reformatted Fields
The following procedure prints the RETURNS field from the SALES data source for store 14Z.With COMPMISS OFF, the missing values display as zeros in the column for the reformattedfield value.
Note: Before trying this example, you must make sure that the SALEMISS procedure, whichadds missing values to the SALES data source, has been run.
23. Formatting Report Data
Creating Reports With TIBCO® WebFOCUS Language 1717

SET COMPMISS = OFFTABLE FILE SALESPRINT RETURNS RETURNS/D12.2 AS 'REFORMATTED,RETURNS'BY STORE_CODEWHERE STORE_CODE EQ '14Z' END
The output is:
REFORMATTEDSTORE_CODE RETURNS RETURNS ---------- ------- -----------14Z 2 2.00 2 2.00 0 .00 . .00 4 4.00 0 .00 3 3.00 4 4.00 . .00 4 4.00
With COMPMISS ON, the column for the reformatted version of RETURNS displays the missingdata symbol when a value is missing:
SET COMPMISS = ON TABLE FILE SALES PRINT RETURNS RETURNS/D12.2 AS 'REFORMATTED,RETURNS'BY STORE_CODE WHERE STORE_CODE EQ '14Z' END
The output is:
REFORMATTED STORE_CODE RETURNS RETURNS ---------- ------- ----------- 14Z 2 2.00 2 2.00 0 .00 . . 4 4.00 0 .00 3 3.00 4 4.00 . . 4 4.00
Specifying Data Format in a Report
1718

Reference: Usage Notes for SET COMPMISS
If you create a HOLD file with COMPMISS ON, the HOLD Master File for the reformattedfield indicates MISSING = ON (as does the original field). With COMPMISS = OFF, thereformatted field does NOT have MISSING = ON in the generated Master File.
The COMPMISS parameter cannot be set in an ON TABLE command.
Using Commas vs. Decimals (Continental Decimal Notation)
The CDN parameter determines the characters used for punctuation in numbers. Forinformation about the CDN parameter values, see the TIBCO WebFOCUS® Developing ReportingApplications manual.
Setting Characters to Represent Null and Missing Values
You can alter the appearance of your report output by specifying your own string of charactersthat will appear when no data is available for a field.
Syntax: How to Set Characters to Represent a Null or Missing Value
To specify a string for NODATA fields, use the following syntax
ON TABLE SET NODATA character string
where:
NODATA
Indicates that a NODATA character will be set.
character stringIs the string of characters that you want to appear when no data is available for afield. The default value is a period (.).
Syntax: How to Set the NODATA Character as a SET Command
To specify a character for NODATA fields, use the following syntax
SET NODATA=character
where:
characterIs the character or characters that you want to appear when no data is available for afield. The maximum number of characters is 11. The default value is a period (.).
23. Formatting Report Data
Creating Reports With TIBCO® WebFOCUS Language 1719
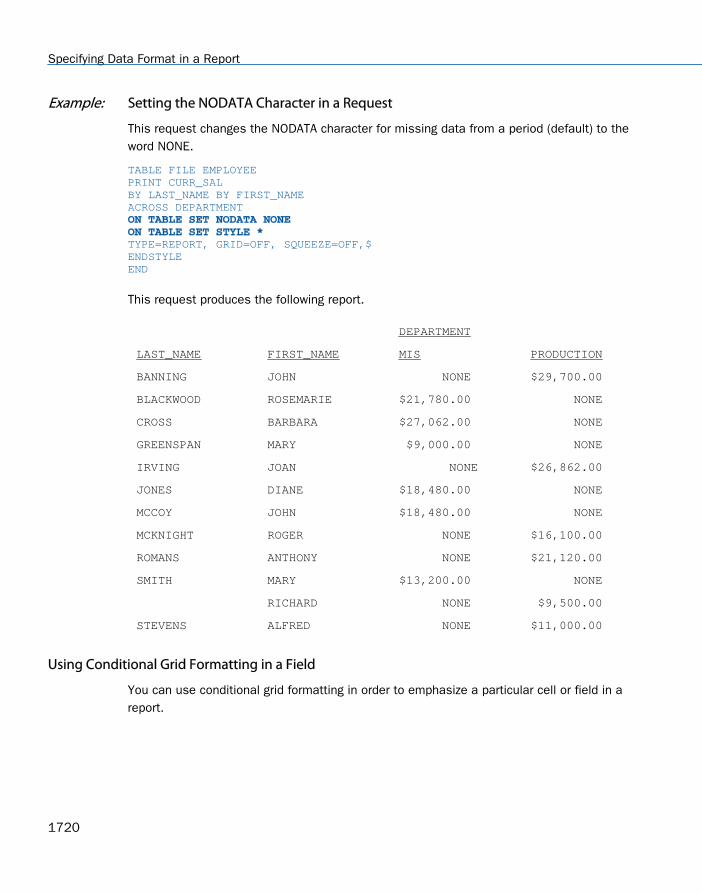
Example: Setting the NODATA Character in a Request
This request changes the NODATA character for missing data from a period (default) to theword NONE.
TABLE FILE EMPLOYEEPRINT CURR_SALBY LAST_NAME BY FIRST_NAMEACROSS DEPARTMENT ON TABLE SET NODATA NONEON TABLE SET STYLE * TYPE=REPORT, GRID=OFF, SQUEEZE=OFF,$ENDSTYLEEND
This request produces the following report.
DEPARTMENT
LAST_NAME FIRST_NAME MIS PRODUCTION
BANNING JOHN NONE $29,700.00
BLACKWOOD ROSEMARIE $21,780.00 NONE
CROSS BARBARA $27,062.00 NONE
GREENSPAN MARY $9,000.00 NONE
IRVING JOAN NONE $26,862.00
JONES DIANE $18,480.00 NONE
MCCOY JOHN $18,480.00 NONE
MCKNIGHT ROGER NONE $16,100.00
ROMANS ANTHONY NONE $21,120.00
SMITH MARY $13,200.00 NONE
RICHARD NONE $9,500.00
STEVENS ALFRED NONE $11,000.00
Using Conditional Grid Formatting in a Field
You can use conditional grid formatting in order to emphasize a particular cell or field in areport.
Specifying Data Format in a Report
1720

Example: Creating a Report Using Conditional Grid Formatting
TABLE FILE CARSUM SALES BY CARON TABLE SET STYLE *ON TABLE PCHOLD FORMAT PDFTYPE=DATA, COLUMN=SALES, GRID=HEAVY, WHEN=CAR EQ 'DATSUN', $ENDSTYLEEND
The output is:
Positioning Data in a Report
You can position data within a report by selecting a justification (right, left or center) of acolumn or by specifying whether or not you wish to have data wrap within a cell. For informationon positioning a column on the page, see Laying Out the Report Page on page 1333.
Controlling Wrapping of Report Data
You can control the wrapping of report data in a report, thus preventing line breaks withinreport cells. When using HTML output, most web browsers will, by default, wrap alphanumericreport data that does not fit on a single line in a cell.
This bumps the contents of the cell onto a second line. A web browser wraps data based onits algorithmic settings. Use the WRAP attribute if you wish to suppress a web browser datawrapping.
23. Formatting Report Data
Creating Reports With TIBCO® WebFOCUS Language 1721

By default, WRAP is set to ON for HTML output, allowing each individual browser to define thewidth of each column in the report. For PDF, PS, DHTML, PPT, and PPTX output, WRAP is setOFF by default. For these positioned output formats in which the location of each item in thereport is explicitly defined, WRAP = ON is not a valid value, except when specified forACROSSVALUE. For other elements of the report, such as headers, footers, titles, or data,define the width of wrapped lines by using a numerical value, as in WRAP = n.
In PDF and PostScript report output, you can control the line spacing in wrapped lines by usingthe WRAPGAP attribute.
Wrapping Data in PDF Reports That Use the OVER Phrase
OVER allows the presentation of a single data record across multiple lines within a report. Bydefault, when OVER is defined within a request, the report shifts from a columnar presentationto a row level presentation. The field titles are displayed to the left of each value, rather thanat the top of each column. This layout was not designed to be aligned in any specific fashionbut to allow for the presentation of multiple elements of data within a small area. In manycases, reports that place columns over each other use blank AS names in order to align thecolumns properly. You can use the WRAP attribute to wrap data in PDF reports that use OVERand this technique works well with blank AS names.
Wrapping Data in PDF Reports That Use the ACROSS Phrase
In a request that uses ACROSS, the output displays each value of the ACROSS field above theset of data columns applicable to that ACROSS value.
If the ACROSS value is longer than the width of its columns, you can wrap the ACROSS valuewithin the width of its underlying columns.
By default, the width of each ACROSS value group (the ACROSS value and the data columnswithin) is defined as the largest of either the sum of the width of the data columns or thelargest ACROSS value for that group. With wrapping, the size of each ACROSS wrap will bedefined by the width defined based on this rule including all data columns and any non-wrapped across fields.
The width of each ACROSS column for a given ACROSS group is defined as the length of thelargest value for that ACROSS group. A single width is used for each group so in groups wherethe values are shorter than the longest value, you will see a larger right gap within the cell.
For reports containing multiple ACROSS fields, you can wrap individual ACROSS fields or all ofthem. Each designated value will wrap within the defined ACROSS group.
Positioning Data in a Report
1722

Syntax: How to Control Wrapping of Report Data
To control wrapping of text inside a report, use the following syntax within a StyleSheet.
TYPE=type, [subtype,] WRAP=value, $
where:
type
Is the report component you wish to affect, such as REPORT, HEADING, or TITLE.
subtype
Is any additional attribute, such as COLUMN, ACROSS, ITEM etc. that is needed to identifythe report component that you are formatting. See Identifying a Report Component in aWebFOCUS StyleSheet on page 1251 for more information about how to specify differentreport components.
value
Is one of the following:
ON, which turns on data wrapping. ON is the default value for HTML report output. ForPDF, PS, DHTML, PPT, and PPTX report output, WRAP is set OFF by default. For thesepositioned output formats in which the location of each item in the report is explicitlydefined, WRAP = ON is not a valid value, except when specified for ACROSSVALUE. Forother elements of the report, such as headers, footers, titles, or data, define the widthof wrapped lines by using a numerical value, as in WRAP = n. For HTML reports, WRAPis supported with all fields. For PDF reports, WRAP is supported only with embeddedfields, not text.
Note: This setting is not supported when using WRAP with OVER in PDF report output.
OFF, which turns off data wrapping. This is the default value for PDF, PS, DHTML, PPT,and PPTX report output.
n, which represents a specific numeric value that the column width can be set to. Thevalue represents the measure specified with the UNITS parameter. This setting issupported for wrapping data in PDF reports that use the OVER phrase.
Note: WRAP=ON and WRAP=n are not supported with JUSTIFY.
23. Formatting Report Data
Creating Reports With TIBCO® WebFOCUS Language 1723

Example: Allowing the Web Browser to Wrap Report Data
The following example, with WRAP=ON, wraps report data based on the web browserfunctionality. Note that because this value is the default, there is no need to specify WRAP=ONin the report request syntax.
TABLE FILE GGPRODSPRINT SIZE UNIT_PRICE PACKAGE_TYPEVENDOR_CODE VENDOR_NAMEBY PRODUCT_ID BY PRODUCT_DESCRIPTIONON TABLE SET STYLE *TYPE=REPORT, GRID=ON, $ENDSTYLEEND
Note: Wrap is determined by the size of your browser window, so you may need to shrink yourwindow to see the example wrap the data as in the following image.
Notice that records in the Vendor Name column break to a second line.
Example: Suppressing the Wrapping of Report Data
The following report request, with WRAP=OFF, suppresses the web browser data wrapping:
TABLE FILE GGPRODSPRINT SIZE UNIT_PRICE PACKAGE_TYPEVENDOR_CODE VENDOR_NAMEBY PRODUCT_ID BY PRODUCT_DESCRIPTIONON TABLE SET STYLE * TYPE=REPORT, WRAP=OFF, $ TYPE=REPORT, GRID=ON, $ENDSTYLEEND
Positioning Data in a Report
1724

The output is:
Example: Wrapping Columns With OVER
The following request against the GGPRODS data source places the column VENDOR_NAME ona new line with the OVER phrase. By default, wrap is turned off and must be defined explicitlywithin the StyleSheet:
TABLE FILE GGPRODSPRINT SIZE UNIT_PRICE PACKAGE_TYPE OVERVENDOR_NAMEBY PRODUCT_ID BY PRODUCT_DESCRIPTIONON TABLE PCHOLD FORMAT PDFON TABLE SET STYLE *TYPE=REPORT, SQUEEZE=ON, $ENDSTYLEEND
23. Formatting Report Data
Creating Reports With TIBCO® WebFOCUS Language 1725
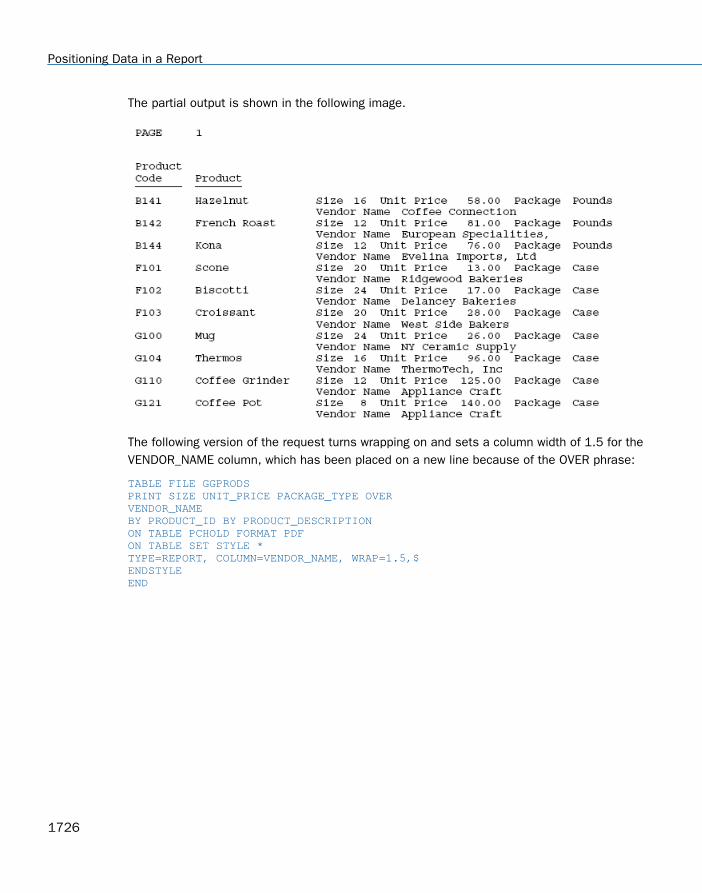
The partial output is shown in the following image.
The following version of the request turns wrapping on and sets a column width of 1.5 for theVENDOR_NAME column, which has been placed on a new line because of the OVER phrase:
TABLE FILE GGPRODSPRINT SIZE UNIT_PRICE PACKAGE_TYPE OVERVENDOR_NAMEBY PRODUCT_ID BY PRODUCT_DESCRIPTIONON TABLE PCHOLD FORMAT PDFON TABLE SET STYLE *TYPE=REPORT, COLUMN=VENDOR_NAME, WRAP=1.5,$ENDSTYLEEND
Positioning Data in a Report
1726

The partial output shows that the VENDOR_NAME column now wraps. Notice that turning WRAPON causes the OVER value, not the OVER TITLE, to wrap:
Syntax: How to Wrap ACROSS Values
Wrapping ACROSS Values is supported for HTML and PDF output formats.
TYPE=ACROSSVALUE, [ACROSS={fieldname|Nn|An}] WRAP={OFF|ON} ,$
where:
ACROSS
If you have a request with multiple ACROSS fields, you can identify each field usingthe ACROSS identifier. You only need to include the ACROSS identifier if you havemultiple ACROSS fields in your request.
fieldnameSpecifies a horizontal sort row by its field name.
NnIdentifies a column by its position in the report. To determine this value, count verticalsort (BY) fields, display fields, and ROW-TOTAL fields, from left to right, includingNOPRINT fields.
23. Formatting Report Data
Creating Reports With TIBCO® WebFOCUS Language 1727

AnSpecifies a horizontal sort row by its position in the sequence of horizontal sort rows.To determine this value, count horizontal sort (ACROSS) fields. Cannot be combinedwith a field name specification in the same StyleSheet.
OFF
Turns off wrapping of the ACROSS values. OFF is the default value.
ON
Turns on wrapping of the ACROSS values.
Note: WRAP=ON is not supported with JUSTIFY.
Example: Wrapping ACROSS Values in PDF Report Output
In the following request against the GGPRODS data source, VENDOR_NAME is an ACROSSfield:
TABLE FILE GGPRODSHEADING" PRODUCT REPORT" " "PRINT PRODUCT_ID UNIT_PRICE/D5ACROSS VENDOR_NAMEBY SIZEWHERE VENDOR_NAME GT 'B' AND VENDOR_NAME LT 'F'ON TABLE PCHOLD FORMAT PDFON TABLE SET STYLE *TYPE=REPORT, GRID=OFF, $TYPE=REPORT, COLUMN=PRODUCT_ID, WIDTH=.25, $TYPE=REPORT, COLUMN=UNIT_PRICE, WIDTH=.25, $ENDSTYLEEND
As shown in the following image, the output is too wide for one panel because some of theACROSS field values (vendor names) are longer than the sum of the product code and unitprice columns under them.
Positioning Data in a Report
1728

The following version of the request wraps the ACROSS values (TYPE=ACROSSVALUE,WRAP=ON ,$):
TABLE FILE GGPRODSHEADING" PRODUCT REPORT" " "PRINT PRODUCT_ID UNIT_PRICE/D5ACROSS VENDOR_NAMEBY SIZEWHERE VENDOR_NAME GT 'B' AND VENDOR_NAME LT 'F'ON TABLE PCHOLD FORMAT PDFON TABLE SET STYLE *TYPE=REPORT, GRID=OFF, $TYPE=REPORT, COLUMN=PRODUCT_ID, WIDTH=.25, $TYPE=REPORT, COLUMN=UNIT_PRICE, WIDTH=.25, $TYPE = ACROSSVALUE, WRAP=ON,$ ENDSTYLEEND
The report now fits on one panel, as shown in the following image.
Reference: OVER With Blank Column Titles
When OVER fields are defined with blank AS names (the value of the title of the column is setto empty ' '), they can be used to build a report with multiple data lines that present in analigned grid fashion.
In this type of report, the column titles are usually indicated by adding multiple correspondinglines to the page headings rather than using the default titles that display to the left of thecolumn field values. To present OVER fields with unique titles that take advantage of thesenew alignment features, you can place the column titles in independent fields and includethem as fields within the given request.
23. Formatting Report Data
Creating Reports With TIBCO® WebFOCUS Language 1729

Example: Using OVER and WRAP With Blank AS Names
The following example demonstrates using OVER with blank AS names and WRAP to build amulti-data line report:
TABLE FILE GGPRODSPRINT PACKAGE_TYPE AS '' SIZE AS '' OVERVENDOR_NAME AS '' BY PRODUCT_ID AS '' BY PRODUCT_DESCRIPTION AS ''ON TABLE SUBHEAD"Gotham Grinds""Products Details"HEADING " Code <+0>Description<+0>Size <+0>Package"-*" <+0> <+0>Vendor"" <+0>Vendor"ON TABLE PCHOLD FORMAT PDFON TABLE SET STYLE *TYPE=REPORT, FONT=ARIAL, SIZE=10, SQUEEZE=ON,$TYPE=REPORT, COLUMN=PACKAGE_TYPE, SQUEEZE=.5 ,$TYPE=REPORT, COLUMN=VENDOR_NAME, WRAP=1 ,$TYPE=REPORT, BORDER=ON, $TYPE=HEADING, LINE=1, ITEM=1, BORDER=ON, $TYPE=HEADING, LINE=1, ITEM=2, BORDER=ON, POSITION=PRODUCT_DESCRIPTION,$TYPE=HEADING, LINE=1, ITEM=3, BORDER=ON, POSITION=SIZE ,$TYPE=HEADING, LINE=1, ITEM=4, BORDER=ON, POSITION=PACKAGE_TYPE, $TYPE=HEADING, LINE=2, ITEM=1, BORDER=ON, $TYPE=HEADING, LINE=2, ITEM=2, BORDER=ON, POSITION=PACKAGE_TYPE,$ENDSTYLEEND
Positioning Data in a Report
1730

On the report output, the Package Type and Size have been placed over the vendor name. Thepage heading has the corresponding titles. In the heading, the titles Package and Size havealso been placed over the title Vendor Name. Note that the vendor name data wraps tomaintain the alignment.
Reference: OVER and WRAP With Non-Blank Column Titles
The width of both the column title and the column data for each OVER value is determined bythe single SQUEEZE or WRAP value. The title will automatically size to the same width as thewrapped data column. If the column title is wider than the width defined for the column wrap,you can either define a smaller title or add your titles as OVER fields that can be sizedindependently.
The following examples demonstrate how to build a report with OVER and WRAP that hascolumn titles longer than the designated WRAP size.
23. Formatting Report Data
Creating Reports With TIBCO® WebFOCUS Language 1731

Example: Using OVER and WRAP With Column Titles
The following request defines two virtual fields to contain the column titles for the ProductName and Vendor Name fields. It then prints each virtual field next to its related data field andgives each a blank AS name. The first virtual field and data field are placed over the secondvirtual field and data field:
DEFINE FILE GGPRODSTITLE_PROD/A20 = 'Product Description';TITLE_VEND/A20 = 'Vendor Name';ENDTABLE FILE GGPRODSPRINT TITLE_PROD AS '' PRODUCT_DESCRIPTION AS '' OVERTITLE_VEND AS '' VENDOR_NAME AS '' BY PRODUCT_ID AS '' ON TABLE SUBHEAD"Gotham Grinds""Products Details"ON TABLE PCHOLD FORMAT PDFON TABLE SET STYLE *TYPE=REPORT, FONT=ARIAL, SIZE=10, SQUEEZE=ON,$TYPE=REPORT, COLUMN=TITLE_PROD , SQUEEZE=1.25 ,$TYPE=REPORT, COLUMN=TITLE_VEND , SQUEEZE=1.25 ,$TYPE=REPORT, COLUMN=PRODUCT_DESCRIPTION, WRAP=.75 ,$TYPE=REPORT, COLUMN=VENDOR_NAME, WRAP=.75 ,$TYPE=REPORT, BORDER=ON, $ENDSTYLEEND
Positioning Data in a Report
1732
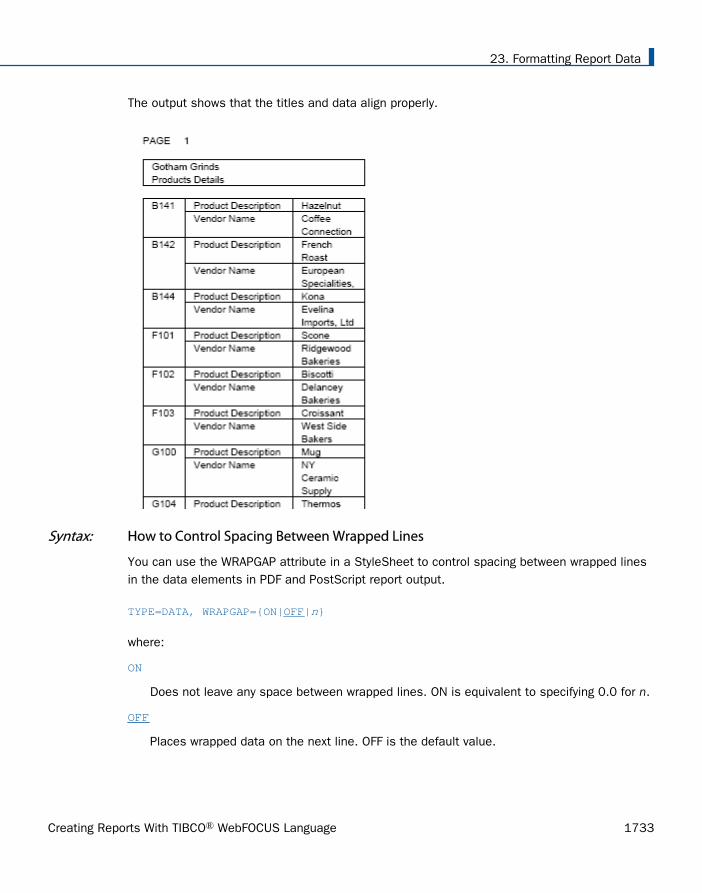
The output shows that the titles and data align properly.
Syntax: How to Control Spacing Between Wrapped Lines
You can use the WRAPGAP attribute in a StyleSheet to control spacing between wrapped linesin the data elements in PDF and PostScript report output.
TYPE=DATA, WRAPGAP={ON|OFF|n}
where:
ON
Does not leave any space between wrapped lines. ON is equivalent to specifying 0.0 for n.
OFF
Places wrapped data on the next line. OFF is the default value.
23. Formatting Report Data
Creating Reports With TIBCO® WebFOCUS Language 1733

n
Is a number greater than or equal to zero that specifies how much space to leave betweenwrapped lines (using the unit of measurement specified by the UNITS attribute). Setting nto zero does not leave any space between wrapped lines, and is equivalent to specifyingWRAPGAP=ON.
Example: Specifying Spacing for Wrapped Lines
In the following request, wrapping is turned on for the ADDRESS_LN3 column of the report:
TABLE FILE EMPLOYEE PRINT ADDRESS_LN3 BY LAST_NAME BY FIRST_NAME WHERE LAST_NAME LE 'CROSS' ON TABLE PCHOLD FORMAT PDF ON TABLE SET PAGE NOPAGE ON TABLE SET STYLE * type=report, grid=on, $ type=data, topgap=0.2, bottomgap=0.2, $ type=data, wrapgap=off, $ type=REPORT, column=ADDRESS_LN3, wrap=1.0 ,$ENDSTYLEEND
Positioning Data in a Report
1734

With WRAPGAP=OFF, each wrapped line is placed on the next report line:
23. Formatting Report Data
Creating Reports With TIBCO® WebFOCUS Language 1735

With WRAPGAP=ON, the wrapped lines are placed directly under each other:
Reference: Usage Notes for WRAPGAP
You can only specify WRAPGAP for columns that have wrapping enabled (WRAP attribute orparameter set to ON or a number). The TOPGAP and BOTTOMGAP attributes specify how muchvertical space to leave above and below a report component. Increasing the values or theseattributes makes a decrease in spacing between wrapped lines more noticeable.
Justifying Report Columns
You can adjust text within a column by specifying whether report columns are left justified,right justified, or centered. By default, alphanumeric columns are left justified, numericcolumns are right justified, and heading and footing elements are left justified. However, youcan change the default using the JUSTIFY attribute. For information on justifying column titlesusing /R /L and /C, see Using Headings, Footings, Titles, and Labels on page 1519.
Positioning Data in a Report
1736

Syntax: How to Justify a Report Column
To left justify, right justify, or center a column, use the following syntax within a StyleSheet.
TYPE=type, [subtype,] [COLUMN=column,] JUSTIFY=option, $
where:
type
Is the report component you wish to affect, such as REPORT, HEADING, or TITLE.
subtype
Is any additional attribute, such as COLUMN, ACROSS, ITEM etc. that is needed to identifythe report component that you are formatting. For more information about how to specifydifferent report components, see Identifying a Report Component in a WebFOCUSStyleSheet on page 1251.
column
Is the column or group of columns you wish to justify. This attribute is only necessary if youwish to justify a specific column or set of columns. Omitting this attribute justifies theentire report.
option
Is the justification you wish to select:
LEFT, which specifies that the column will be left justified.
RIGHT, which specifies that the column will be right justified.
CENTER, which specifies that the column will be centered.
Note: JUSTIFY is not supported with WRAP=ON or WRAP=n.
Example: Justifying Data in a Report Column
The following example displays the StyleSheet syntax used to center the data in the VendorName column. The header is also center justified.
TABLE FILE GGPRODSHEADING"PRODUCT REPORT"SUM UNITS BY PRODUCT_DESCRIPTION BY PRODUCT_ID BY VENDOR_NAMEON TABLE SET STYLE * TYPE=REPORT, COLUMN=VENDOR_NAME, JUSTIFY=CENTER, $TYPE=HEADING, JUSTIFY=CENTER, $ TYPE=REPORT, GRID=OFF, $ENDSTYLEEND
23. Formatting Report Data
Creating Reports With TIBCO® WebFOCUS Language 1737

The output is:
Field-Based Reformatting
Field-based reformatting allows you to apply different formats to each row in a single reportcolumn by using a field to identify the format that applies to each row. For example, you canuse this technique to apply the appropriate decimal currency formats when each rowrepresents a different country.
The field that contains the format specifications can be:
A real field in the data source.
A temporary field created with a DEFINE command.
A DEFINE in the Master File.
A COMPUTE command. If the field is created with a COMPUTE command, the commandmust appear in the request prior to using the calculated field for reformatting.
The field that contains the formats must be alphanumeric and be at least eight characters inlength. Only the first eight characters are used for formatting.
The field-based format may specify a length longer than the length of the original field.However, if the new length is more than one-third larger than the original length, the reportcolumn width may not be large enough to hold the value (indicated by asterisks in the field).
Positioning Data in a Report
1738

You can apply a field-based format to any type of field. However, the new format must becompatible with the original format:
A numeric field can be reformatted to any other numeric format with any edit formatoptions.
An alphanumeric field can be reformatted to a different length.
Any date field can be reformatted to any other date format type.
Any date-time field can be reformatted to any other date-time format.
If the field-based format is invalid or specifies an impermissible type conversion, the fielddisplays with plus signs (++++) on the report output. If the format field is blank or missing, thevalue is displayed without reformatting.
Syntax: How to Define and Apply a Format Field
With a DEFINE command:
DEFINE FILE filenameformat_field/A8 = expression;END
In a Master File:
DEFINE format_field/A8 = expression; $
In a request:
COMPUTE format_field/A8 = expression;
where:
format_field
Is the name of the field that contains the format for each row.
expression
Is the expression that assigns the format values to the format field.
23. Formatting Report Data
Creating Reports With TIBCO® WebFOCUS Language 1739

After the format field is defined, you can apply it in a report request:
TABLE FILE filenamedisplayfieldname/format_field[/just]END
where:
displayIs any valid display command.
fieldnameIs a field in the request to be reformatted.
format_fieldIs the name of the field that contains the formats. If the name of the format field isthe same as an explicit format, the explicit format will be used. For example, a fieldnamed I8 cannot be used for field-based reformatting because it will be interpreted asthe explicit format I8.
justIs a justification option, L, R, or C. The justification option can be placed before orafter the format field, separated from the format by a slash.
Example: Displaying Different Decimal Places for Currency Values
DEFINE FILE CARCFORMAT/A8 = DECODE COUNTRY('ENGLAND' 'D10.1' 'JAPAN' 'D10' ELSE 'D10.2');END TABLE FILE CARSUM SALES/CFORMAT/C DEALER_COST/CFORMATBY COUNTRYEND
The output is:
COUNTRY SALES DEALER_COST------- --------- -----------ENGLAND 12,000.0 37,853.0FRANCE .00 4,631.00ITALY 30,200.00 41,235.00JAPAN 78,030 5,512W GERMANY 88,190.00 54,563.00
Positioning Data in a Report
1740

Displaying Multi-Line An and AnV Fields
Using StyleSheet attributes, you can display An (character) and AnV (varchar) fields thatcontain line breaks on multiple lines in a PDF or PostScript report. Line breaks can be basedon line-feeds, carriage-returns, or a combination of both. If you do not add these StyleSheetattributes, all line-feed and carriage-return formatting within these fields will be ignored, and allcharacters will be displayed on one line that wraps to fit the width of the report.
Syntax: How to Display An and AnV Fields Containing Line Breaks on Multiple Lines
TYPE=REPORT,LINEBREAK='type',$
where:
REPORT
Is the type of report component. TYPE must be REPORT. Otherwise an error will result.
'type'Specifies that line breaks will be inserted in a report based on the following:
LF inserts a line break after each line-feed character found in all An and AnV fields.
CR inserts a line break after each carriage-return character found in all An and AnV fields.
LFCR inserts a line break after each combination of a line-feed character followed by acarriage-return character found in all An and AnV fields.
CRLF inserts a line break after each combination of a carriage-return character followed bya line-feed character found in all An and AnV fields.
Note: This feature is supported in PDF, PPTX, or PS formats.
23. Formatting Report Data
Creating Reports With TIBCO® WebFOCUS Language 1741

Example: Displaying an Alphanumeric Field With Line Breaks in a PDF Report
The following request defines an alphanumeric named ANLB field with a semicolon (in anEDCDIC environment) or a circumflex (in an ASCII environment) in the middle. The CTRANfunction then replaces the semicolon or circumflex with a carriage return character and storesthis string in a field named ANLBC. On the report output, this field displays on two lines:
DEFINE FILE EMPLOYEE ANLB/A40 ='THIS IS AN An FIELD;WITH A LINE BREAK.'; ANLBC/A40 = CTRAN(40, ANLB, 094, 013 , ANLBC); END TABLE FILE EMPLOYEE PRINT LAST_NAME ANLBC WHERE LAST_NAME EQ 'BLACKWOOD' ON TABLE HOLD FORMAT PDF ON TABLE SET STYLE * TYPE=REPORT,LINEBREAK='CR',$ ENDSTYLE END
The output is:
Example: Using an Alphanumeric Field With a Line Break in a Subfoot
The following request defines an alphanumeric named ANLB field with a semicolon in themiddle. The CTRAN function then replaces the semicolon (hex 094 in an EBCDIC environment,hex 059 in an ASCII environment) with a carriage return character and stores this string in afield named ANLBC. In the subfoot, this field displays on two lines.
The following report request is for an EBCDIC environment:
Positioning Data in a Report
1742

DEFINE FILE EMPLOYEEANLB/A40 ='THIS IS AN An FIELD;WITH A LINE BREAK.';ANLBC/A40 = CTRAN(40, ANLB, 094, 013 , ANLBC);ENDTABLE FILE EMPLOYEEPRINT FIRST_NAMEBY LAST_NAMEWHERE LAST_NAME EQ 'BLACKWOOD'ON LAST_NAME SUBFOOT " " " <ANLBC "ON TABLE HOLD FORMAT PDFON TABLE SET STYLE *TYPE=REPORT,LINEBREAK='CR',$ENDSTYLEEND
The following report request is for an ASCII environment:
DEFINE FILE EMPLOYEEANLB/A40 ='THIS IS AN An FIELD;WITH A LINE BREAK.';ANLBC/A40 = CTRAN(40, ANLB, 059, 013 , ANLBC);ENDTABLE FILE EMPLOYEEPRINT FIRST_NAMEBY LAST_NAMEWHERE LAST_NAME EQ 'BLACKWOOD'ON LAST_NAME SUBFOOT " " " <ANLBC "ON TABLE HOLD FORMAT PDFON TABLE SET STYLE *TYPE=REPORT,LINEBREAK='CR',$ENDSTYLEEND
The output is:
23. Formatting Report Data
Creating Reports With TIBCO® WebFOCUS Language 1743

Positioning Data in a Report
1744

Chapter24Creating a Graph
Graphs often convey meaning more clearly than data listed in tabular format. Using theGRAPH command, you can easily transform almost any type of data into an effectivegraph that you can customize to suit your needs.
You can link your graph to other resources, or feature conditional styling to highlightspecific data in your graph. You may also select from a multitude of graph styles, whichinclude the standard graph formats bar, line, pie, and scatter as well as many variationson these types.
You can also represent data graphically using data visualization. For details, see Displaying Report Data on page 39.
In this chapter:
Content Analysis: Determining GraphingObjectives
The GRAPH Command
Creating an HTML5 Graph
Selecting a Graph Type
Selecting Values for the X and Y Axes
Creating Multiple Graphs
Plotting Dates in Graphs
Refining the Data Set For Your Graph
Displaying Missing Data Values in aGraph
Applying Conditional Styling to a Graph
Linking Graphs to Other Resources
Adding Labels to a Graph
Applying Custom Styling to a Graph
Saving a Graph as an Image File
Printing a Graph
Content Analysis: Determining Graphing Objectives
WebFOCUS offers a range of reporting tools that allow you to create reports that deliver criticalinformation to your users. By selecting a tool that is well suited to your particular needs, youcan design the information you deliver to users. One effective option with almost any type ofdata is a graphic presentation.
Creating Reports With TIBCO® WebFOCUS Language 1745

Graphs allow you to display multivariate or complex data efficiently, precisely, and in a way thata viewer can intuitively grasp. A graph is an effective presentation tool because it presents avisual idea, communicating meaningful changes in data to a user in a memorable way. Byviewing your graph, a user can identify and track a change that you want them to notice.
Creating a meaningful graph is not simply a matter of applying aesthetics to your data. Instead,graphs allow you to design your presentation to capture the essential information in your data.
The first step in creating excellent graphics is determining your graphing objectives. You canbreak this process into several stages.
1. Assess your data:
Look for meaningful patterns or changes in the data. Does your data change mostdramatically over time or in relationship to some other value? Are there two sets of datathat you would like to compare to each other?
Determine what movement or changes you would like to highlight. Which of the patterns inthe data would you most want the viewer to picture?
2. Select the graph type that best suits your argument and the overall shape of your data.Determine what will lead viewers to the cognitive task or connection that you want them tomake.
3. Begin developing your graph.
4. Refine your graph:
Are the labels meaningful or useful?
How can the data be organized in a meaningful way? Consider customizing the scales youuse with your graph.
The GRAPH Command
GRAPH request syntax is similar to TABLE request syntax. To produce a graph instead of atabular report, you need only substitute the command GRAPH for TABLE in the request. Thus,you can produce graphs by simply converting TABLE requests to GRAPH requests.
However, not every TABLE facility has a GRAPH counterpart, and there are some practicallimitations on the amount of information that you can effectively display in a graph. When aTABLE request is converted in this manner, the various phrases that make up the body of therequest take on special meanings that determine the format and layout of the graph. The typeof graph produced by a GRAPH request depends on the display command used (SUM orPRINT), and the sort phrase(s) used (ACROSS or BY).
The GRAPH Command
1746

Similarities Between GRAPH and TABLE
The GRAPH request elements generally follow the same rules as their TABLE counterparts:
The word FILE and the file name must immediately follow the GRAPH command, unless theywere previously specified in a SET command:
SET FILE=filename
You can specify any file available to WebFOCUS, including joined or cross-referencedstructures.
You can concatenate unlike data source files in a GRAPH request with the MOREcommand. For details, see Universal Concatenation on page 1175.
The order of the phrases in the request does not affect the format of the graph. Forexample, the selection phrase may follow or precede the display command and sortphrase(s). The order of sort phrases does affect the format of a graph, just as the order ofsort phrases in TABLE requests affects the appearance of reports.
The word END must be on a line by itself to complete a request.
All dates are displayed in MDY format unless they are changed to alphanumeric fields.
Differences Between GRAPH and TABLE
There are a few notable syntactical differences between TABLE and GRAPH. Specifically, thefollowing restrictions apply:
A GRAPH request must contain a display command with at least one display field and atleast one sort phrase (BY or ACROSS) in order to generate a meaningful graph.
In GRAPH requests the object of the display command must always be a numeric field.
No more than five display fields are permitted in a GRAPH request. Standard graph formatsgenerally do not permit more variables to be displayed without rendering the graphunreadable.
Several BY phrases can be used in a request, in which case multiple graphs are created. Asingle ACROSS phrase is allowed in a GRAPH request, and requests for certain graph formscan contain both ACROSS and BY phrases.
The number of ACROSS values cannot exceed 64.
The RUN option is not available as an alternative to END.
24. Creating a Graph
Creating Reports With TIBCO® WebFOCUS Language 1747

Example: Converting a TABLE Request to a GRAPH Request
The following illustrates how a TABLE request can easily be converted into a GRAPH request bychanging the TABLE command to a GRAPH command.
TABLE FILE GGORDERHEADING CENTER"SAMPLE TABLE"SUM QUANTITYBY PRODUCT_DESC AS 'Coffee Types'WHERE PRODUCT_DESC EQ 'French Roast' OR 'Hazelnut' OR 'Kona'END
The output is:
SAMPLE TABLECoffee Types Ordered Units------------ -------------French Roast 285689Hazelnut 100427Kona 61498
The same request with a GRAPH command in place of the TABLE command is:
GRAPH FILE GGORDERHEADING CENTER"Sample Graph"SUM QUANTITYBY PRODUCT_DESC AS 'Coffee Types'WHERE PRODUCT_DESC EQ 'French Roast' OR 'Hazelnut' OR 'Kona'END
The GRAPH Command
1748

The output is:
Creating an HTML5 Graph
WebFOCUS supports a graph output format that takes advantage of the HTML5 standard. Thecharts are rendered in the browser as high quality interactive vector graphics using a built-inJavaScript engine. Note that older browsers do not support all of the features of the HTML5standard.
You can use the SET AUTOFIT command to make the HTML5 graph output resize to fit into thecontainer in which it is placed.
Syntax: How to Create HTML5 Graph Output
In your graph request, include the following commands
ON GRAPH PCHOLD FORMAT JSCHART
If the ON GRAPH PCHOLD FORMAT JSCHART command is not issued, server-side graphics aregenerated.
Example: Creating an HTML5 Vertical Bar Graph
The following request against the GGSALES data source creates an HTML5 vertical bar graph:
24. Creating a Graph
Creating Reports With TIBCO® WebFOCUS Language 1749

GRAPH FILE GGSALESSUM DOLLARS BUDDOLLARSBY REGIONON GRAPH PCHOLD FORMAT JSCHARTON GRAPH SET LOOKGRAPH VBAREND
The output is:
Syntax: How to Resize HTML5 Graph Output to Fit Its Container
ON GRAPH SET AUTOFIT {OFF|ON|RESIZE}
where:
OFF
Respects the dimensions specified by the HAXIS and VAXIS parameters.
ON
Always resizes the HTML5 graph output to fit its container.
RESIZE
Respects the dimensions specified by the HAXIS and VAXIS parameters initially, butresizes the graph output if the container is resized.
Creating an HTML5 Graph
1750

Selecting a Graph Type
When creating a graph, it is important to select the appropriate graph type with which todisplay your data. You may select from a number of basic graph types, as well as refinementson these types. Basic graph types include line graphs (connected point plots), bar graphs, piegraphs, and scatter graphs. Use the brief descriptions (see Graph Types on page 1751) toselect a graph type that suits the data set you are displaying and the change you want tohighlight. Keep in mind that the data are the sets of numbers that you are displaying, and thescales are the numbers or variable measures displayed along the axes of the graph.
Note: When using a stacked chart of any type at least 2 series are required.
Graph Types
Following are descriptions of the types of graphs you can create:
Line graphs. Line graphs are useful for emphasizing the movement or trend of numericaldata over time, since they allow a viewer to trace the evolution of a particular point byworking backwards or interpolating. Highs and lows, rapid or slow movement, or a tendencytowards stability are all types of trends that are well suited to a line graph.
Line graphs can also be plotted with two or more scales to suggest a comparison of thesame value, or set of values, in different time periods. The number of scales your graphhas depends on the type of graph you select. For details, see Determining Graph StylesUsing LOOKGRAPH on page 1761.
Bar graphs. A bar graph plots numerical data by displaying rectangular blocks against ascale. The length of a bar corresponds to a value or amount. Viewers can develop a clearmental image of comparisons among data series by distinguishing the relative heights ofthe bars. Use a bar graph to display numerical data when you want to present distributionsof data. You can create horizontal as well as vertical bar graphs.
Pie graphs. A pie graph emphasizes where your data fits in relation to a larger whole. Keepin mind that pie graphs work best when your data consists of several large sets. Too manyvariables divide the pie into small segments that are difficult to see. Use color or texture onindividual segments to create visual contrast.
Scatter graphs. Scatter graphs share many of the characteristics of basic line graphs. Datacan be plotted using variable scales on both axes. When you use a scatter graph, your datais plotted using a basic line pattern. Use a scatter graph to visualize the density ofindividual data values around particular points or to demonstrate patterns in your data. Anumeric X-axis, or sort field, will always yield a scatter graph by default.
24. Creating a Graph
Creating Reports With TIBCO® WebFOCUS Language 1751

It is important to note that scatter graphs and line graphs are distinguishable from oneanother only by virtue of their X-axis format. Line graphs can appear without connectinglines (making them look like scatter graphs) and scatter graphs can appear with connectinglines (making them look like line graphs).
Area graphs. Area graphs are similar to line graphs except that the area between the dataline and the zero line (or axis) is usually colored or textured. Area graphs allow you to stackdata on top of each other. Stacking allows you to highlight the relationship between dataseries, showing how some data series approach or shadow a second series.
3D graphs. 3D graphs add dimension to your graphing presentation. Dimensionality allowsyour viewers to recognize trends based on two or more data sets easily. 3D graphs alsoadd impact to your presentation.
Bipolar graphs. A bipolar graph is split along a horizontal line. This type of graph is usefulfor comparative trend analysis of widely disparate data values over time or other sortvalues.
Radar graphs. This is a type of circular graph used when categories are cyclical. Radargraphs are essentially analogous to a line chart, except that the scale wraps around. Radargraphs work well with any data that are cyclical, such as the months of a year.
Selecting Scales
After you have chosen a graph type, you should select an appropriate scale. A scale is aclassification scheme or series of measures that you select for application to the axes of yourgraph. The scale provides the framework against which your data are plotted. When youchoose an appropriate scale for your data, meaningful patterns can emerge, and when youmodify a scale, the overall shape of your graph changes.
Steps or measures in the scale are represented along the axes of your graph by marks. Thetype of scale you choose determines the number of divisions along the scale. There are twogeneral types of scales you can apply to the y-axis of your graph:
Linear scales
Logarithmic scales
A linear scale is a scale in which the values increase arithmetically. Each measure along thescale is one unit higher than the one that precedes it. Linear scales are useful when the datayou are plotting are relatively small in range.
Selecting a Graph Type
1752

A logarithmic scale is a scale in which the values increase logarithmically. Each measure alongthe scale represents an exponential increase in the data value. Logarithmic scales are usefulwhen you need to accommodate a large range of numbers.
Syntax: How to Select Scales
To use logarithmic scales in your graph, add the following to your GRAPH request:
ON GRAPH SET STYLE **GRAPH_SCRIPTsetY1LogScale(value);*ENDENDSTYLEEND
where:
value
Is one of the following:
true turns on logarithmic scaling.
false turns off logarithmic scaling. Linear scaling is used instead.
Determining Graph Styles With Display Commands and Sort Phrases
Each GRAPH request must include a sort phrase and at least one display field (up to five areallowed).
The fields, which are the subjects of the graph, may be real or virtual fields, with or withoutdirect operation prefixes (AVE., MIN., MAX., etc.). They may also be calculated values.
Note: Display fields used only for calculations need not appear in the graph. You can use theNOPRINT or SUP-PRINT phrases to suppress the display of such fields. For details, see SortingTabular Reports on page 87.
By default, a particular combination of display commands and sort phrases determines thegraph format. The combinations are:
Graph Type Display Command and Sort Phrase
Line graph PRINT A {ACROSS|BY} B
(where B is alphanumeric)
24. Creating a Graph
Creating Reports With TIBCO® WebFOCUS Language 1753

Graph Type Display Command and Sort Phrase
Vertical bar graph SUM A ACROSS B
(where B is alphanumeric)
Horizontal bar graph SUM A BY B
Pie graph SET LOOKGRAPH=PIESUM A {ACROSS|BY} B
or
SET PIE=ONSUM A {ACROSS|BY} B
Scatter graph (withoutconnecting lines)
PRINT A ACROSS B
(where B is numeric)
Scatter graph (with connectinglines)
SUM A ACROSS B
(where B is numeric)
You can override the default graph format using the LOOKGRAPH parameter. For details, see Determining Graph Styles Using LOOKGRAPH on page 1761.
Syntax: How to Create a Line Graph
To create a line graph, issue a GRAPH request with the following display command and sortfield combination
PRINT fieldname1 [AND] fieldname2...{ACROSS|BY} sortfield
where:
fieldname1...
Is the name of the field to be displayed on the Y-axis of the graph. There can be amaximum of 5 display fields in a GRAPH request.
AND
Is an optional phrase used to enhance readability. It can be used between any two fieldnames and does not affect the graph.
Selecting a Graph Type
1754

sortfield
Is the name of the field to be displayed on the X-axis of the graph. This must be analphanumeric field in order to generate a line graph. If the field specified is numeric, youcan still create a line graph by using the LOOKGRAPH=LINE parameter. For details, see Determining Graph Styles Using LOOKGRAPH on page 1761.
Example: Creating a Line Graph
The following illustrates how to create a line graph using the LOOKGRAPH command:
SET LOOKGRAPH = LINE, GRID=ONSET HAXIS=600, VAXIS=315GRAPH FILE GGORDERHEADING CENTER"Sample Line Graph"SUM QUANTITY ACROSS PRODUCT_DESCWHERE PRODUCT_DESC EQ 'French Roast' OR 'Hazelnut' OR 'Kona'END
The output is:
24. Creating a Graph
Creating Reports With TIBCO® WebFOCUS Language 1755

Syntax: How to Create a Horizontal Bar Graph
To create a horizontal bar graph, issue a GRAPH request with the following display commandand sort field combination
SUM fieldname1 [AND] fieldname2...BY sortfield
where:
fieldname1...
Is the name of a field to be displayed on the Y-axis of the graph. There can be a maximumof 5 display fields in a GRAPH request.
AND
Is an optional phrase used to enhance readability. It can be used between any two fieldnames and does not affect the graph.
sortfield
Is the name of a field to be displayed on the X-axis of the graph. A separate group of barsis created for each value of the BY field, and each group contains one bar for each displaycommand (SUM) object.
Syntax: How to Create a Vertical Bar Graph
To create a vertical bar graph, issue a GRAPH request with the following display command andsort field combination
SUM fieldname1 [AND] fieldname2...ACROSS sortfield
where:
fieldname1...
Is the name of the field to be displayed on the Y-axis of the graph. There can be amaximum of 5 display fields in a GRAPH request.
AND
Is an optional phrase used to enhance readability. It can be used between any two fieldnames and does not affect the graph.
sortfield
Is the name of an alphanumeric field to be displayed on the X-axis of the graph.
Selecting a Graph Type
1756

Example: Creating a Horizontal Bar Graph
The following illustrates how to create a horizontal bar graph:
GRAPH FILE GGORDERHEADING CENTER"Sample Horizontal Bar Graph"SUM QUANTITY BY PRODUCT_DESCWHERE PRODUCT_DESC EQ 'French Roast' OR 'Hazelnut' OR 'Kona'END
The output is:
Example: Creating a Vertical Bar Graph
The following illustrates how to create a vertical bar graph:
GRAPH FILE GGORDERHEADING CENTER"SAMPLE VERTICAL BAR GRAPH"SUM QUANTITY ACROSS PRODUCT_DESCWHERE PRODUCT_DESC EQ 'French Roast' OR 'Hazelnut' OR 'Kona'END
24. Creating a Graph
Creating Reports With TIBCO® WebFOCUS Language 1757

The output is:
Syntax: How to Create a Pie Graph
To create a pie graph, issue a GRAPH request with the following SET command and display andsort field combination
SET LOOKGRAPH=PIESUM fieldname1 [AND] fieldname2...{ACROSS|BY} sortfield
where:
fieldname1...
Is the name of the field to be displayed in the graph. There can be a maximum of 5 displayfields in a GRAPH request.
AND
Is an optional phrase used to enhance readability. It can be used between any two fieldnames and does not affect the graph.
Selecting a Graph Type
1758
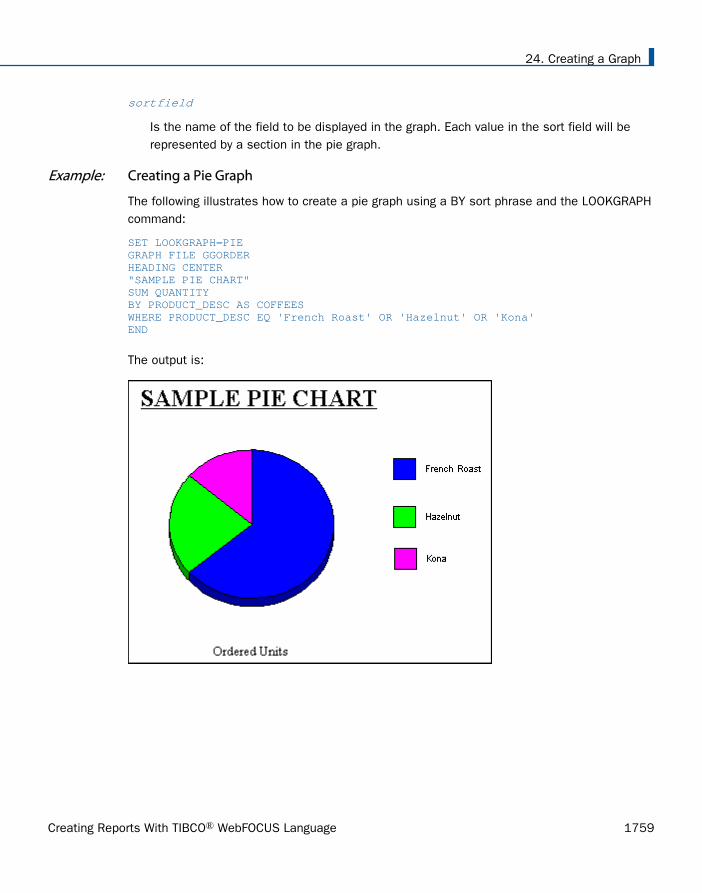
sortfield
Is the name of the field to be displayed in the graph. Each value in the sort field will berepresented by a section in the pie graph.
Example: Creating a Pie Graph
The following illustrates how to create a pie graph using a BY sort phrase and the LOOKGRAPHcommand:
SET LOOKGRAPH=PIEGRAPH FILE GGORDERHEADING CENTER"SAMPLE PIE CHART"SUM QUANTITY BY PRODUCT_DESC AS COFFEESWHERE PRODUCT_DESC EQ 'French Roast' OR 'Hazelnut' OR 'Kona'END
The output is:
24. Creating a Graph
Creating Reports With TIBCO® WebFOCUS Language 1759

Syntax: How to Create a Scatter Graph
To create a scatter graph, issue a GRAPH request with the following display command and sortfield combination
{PRINT|SUM} fieldname1 [AND] fieldname2...ACROSS sortfield
where:
fieldname
Is the name of the field to be displayed in the graph. There can be a maximum of 5 displayfields in a GRAPH request. When you specify more than one display field, they arerepresented by different symbols.
AND
Is an optional phrase used to enhance readability. It can be used between any two fieldnames and does not affect the graph.
sortfield
Is the name of the numeric field to be displayed on the X-axis of the graph.
Example: Creating a Scatter Graph
The following illustrates how to create a scatter graph:
GRAPH FILE GGORDERHEADING CENTER"Sample Scatter Graph"PRINT QUANTITY AS 'Quantity'ACROSS PRODUCT_CODEWHERE PRODUCT_CODE EQ 'B144'WHERE QUANTITY LT 51END
Selecting a Graph Type
1760

The output is:
Determining Graph Styles Using LOOKGRAPH
By default, a particular combination of display commands and sort phrases determines thegraph format. You can override the default graph format by using the LOOKGRAPH parameter.
The LOOKGRAPH parameter enables you to change the format of the graph without having toset individual control parameters or restructure the graph request. However, even if you useLOOKGRAPH, you can choose to set individual control parameters (for example, SETGRID=ON).
Syntax: How to Specify a Graph Style Using LOOKGRAPH
SET LOOKGRAPH= option
where:
option
Specifies the graph style. For details on graph styles, see:
Style Options for Line Graphs on page 1762.
Style Options for Bar Graphs on page 1763.
Style Options for Pie Graphs on page 1764.
Style Options for Scatter Graphs on page 1765.
24. Creating a Graph
Creating Reports With TIBCO® WebFOCUS Language 1761

Style Options for Three-Dimensional Graphs on page 1765.
Style Options for Area Graphs on page 1766.
Style Options for Stock Charts on page 1767.
Style Options for Polar Charts on page 1769.
Style Options for Radar Charts on page 1769.
Style Options for Bubble Charts on page 1769.
Style Options for Spectral Charts on page 1770.
Other Graph Types on page 1770.
Options for HTML5-Only Chart Types on page 1771.
Reference: Style Options for Line Graphs
Choose one of the following LOOKGRAPH values to change the style of connected point plots:
SET LOOKGRAPH= Description
LINE A vertical connected point plot graph.
HLINE A horizontal connected point plot graph.
HLINE2 A horizontal connected point plot graph with two axes.
HLINE2S A horizontal connected point plot graph with two separate axes.
HLINSTK A stacked horizontal connected point plot graph.
HLINSTK2 A stacked horizontal connected point plot graph with two axes.
HLNSTK2S A stacked horizontal connected point plot graph with two separateaxes.
HLNSTKPC A stacked horizontal connected point plot graph showingpercentages.
VLINE A vertical connected point plot graph.
Selecting a Graph Type
1762

SET LOOKGRAPH= Description
VLINE2 A vertical connected point plot graph with two axes.
VLINE2S A vertical connected point plot graph with two separate axes.
VLINSTK A stacked vertical connected point plot graph.
VLINSTK2 A stacked vertical connected point plot graph with two axes.
VLNSTK2S A stacked vertical connected point plot graph with two separateaxes.
VLNSTKPC A stacked vertical connected point plot graph showingpercentages.
Reference: Style Options for Bar Graphs
Choose one of the following LOOKGRAPH values to change the style of bar graphs:
SET LOOKGRAPH= Description
BAR A bar graph with the bars displayed beside each other.
STACK A bar graph with stacked bars.
VBAR A vertical bar graph.
VBAR2AX A vertical bar graph with two axes.
VBAR2AXS A vertical bar graph with two separate axes.
VBRSTK1 A stacked vertical bar graph.
VBRSTK2 A stacked vertical bar graph with two axes.
VBRSTK2S A stacked vertical bar graph with two separate axes.
VBRSTKPC A stacked vertical bar graph that shows percentages.
24. Creating a Graph
Creating Reports With TIBCO® WebFOCUS Language 1763
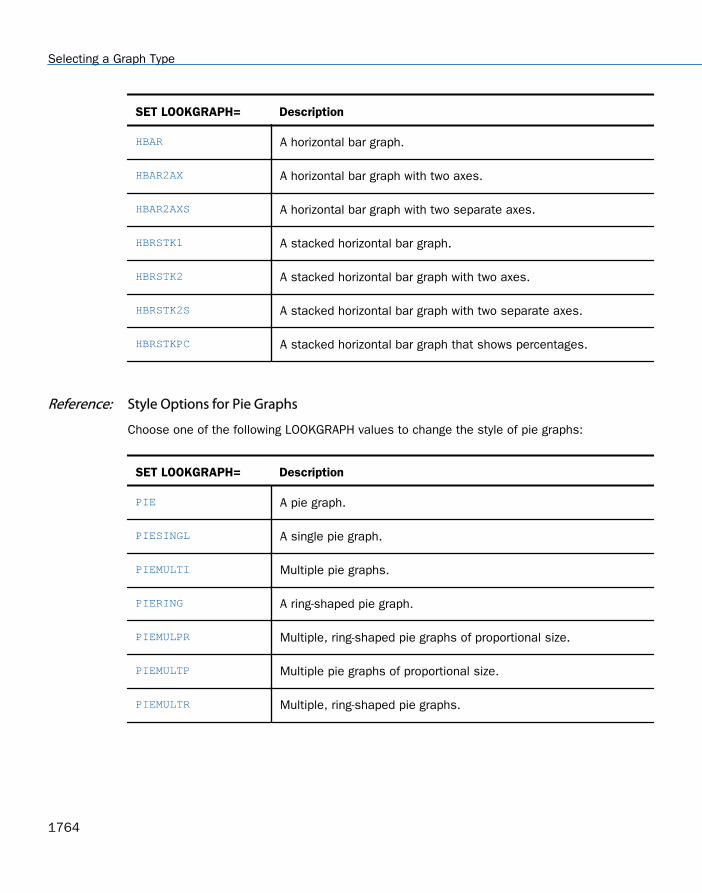
SET LOOKGRAPH= Description
HBAR A horizontal bar graph.
HBAR2AX A horizontal bar graph with two axes.
HBAR2AXS A horizontal bar graph with two separate axes.
HBRSTK1 A stacked horizontal bar graph.
HBRSTK2 A stacked horizontal bar graph with two axes.
HBRSTK2S A stacked horizontal bar graph with two separate axes.
HBRSTKPC A stacked horizontal bar graph that shows percentages.
Reference: Style Options for Pie Graphs
Choose one of the following LOOKGRAPH values to change the style of pie graphs:
SET LOOKGRAPH= Description
PIE A pie graph.
PIESINGL A single pie graph.
PIEMULTI Multiple pie graphs.
PIERING A ring-shaped pie graph.
PIEMULPR Multiple, ring-shaped pie graphs of proportional size.
PIEMULTP Multiple pie graphs of proportional size.
PIEMULTR Multiple, ring-shaped pie graphs.
Selecting a Graph Type
1764

Reference: Style Options for Scatter Graphs
Choose one of the following LOOKGRAPH values to change the style of scatter graphs:
SET LOOKGRAPH= Description
SCATTER Produces a scatter graph.
SCATTERD A dual scatter graph. Values from an additional data set aredisplayed on a second value (Y) axis.
SCATTRLS A scatter graph that labels each data point with its exact numericvalue.
SCATTRLD A dual scatter graph that labels each data point with its exactnumeric value.
Reference: Style Options for Three-Dimensional Graphs
Choose one of the following LOOKGRAPH values to change the style of three-dimensionalgraphs:
SET LOOKGRAPH= Description
3DAREAG A three-dimensional connected group area chart.
3DAREAS A three-dimensional connected series area chart.
3DBAR A two-dimensional bar graph with three-dimensional bars.
3D_BAR A three-dimensional chart with bars.
3DCUBE A three-dimensional bar graph in which all data points are blocksof identical size, hovering at the position that shows their datavalue.
3DGROUP A three-dimensional chart with bars.
3DOCTAGN A three-dimensional bar graph with octagon-shaped bars that haveno roots.
24. Creating a Graph
Creating Reports With TIBCO® WebFOCUS Language 1765

SET LOOKGRAPH= Description
3DPYRAMD A three-dimensional pyramid chart.
3DRIBBNG A three-dimensional connected group ribbon chart.
3DRIBBNS A three-dimensional connected series ribbon chart.
3DSPHERE A three-dimensional bar graph in which all data points are spheresof identical size, hovering at the position that shows their datavalue.
3DSTACK A two-dimensional stack chart with three-dimensional type bars.
3DSURFCE A three-dimensional surface chart that graphs all data points as athree-dimensional surface, like a rolling wave.
3DSURFHC A three-dimensional honeycomb surface chart that graphs all datapoints as a three-dimensional surface using a honeycomb effect.
3DSURFSD A three-dimensional surface chart with sides that graphs all datapoints as a three-dimensional surface with solid sides.
Reference: Style Options for Area Graphs
Choose one of the following LOOKGRAPH values to change the style of area graphs:
SET LOOKGRAPH= Description
VAREA A vertical area graph.
VAREASTK A stacked vertical area graph.
VAREAR2 A vertical area graph with two axes.
VARESTK2 A stacked vertical area graph with two axes.
VARESTKP A stacked vertical area graph that shows percentages.
HAREA A horizontal area graph.
Selecting a Graph Type
1766

SET LOOKGRAPH= Description
HAREAR2 A horizontal area graph with two axes.
HAREASTK A stacked horizontal area graph.
HARESTK2 A stacked horizontal area graph with two axes.
HARESTKP A stacked horizontal area graph that shows percentages.
Reference: Style Options for Stock Charts
Choose one of the following LOOKGRAPH values to change the style of stock charts:
SET LOOKGRAPH= Description
STOCK A stock chart.
STOCKH A high-low stock chart. Bars representing higher numeric valuesare placed behind bars representing lower numeric values. Onlythe top of the higher bar is visible, clearly illustrating thedifference in value.
The most popular application of this type of graph is to representstock prices. Each bar represents the highest and lowest pricesfor a given stock on a given day.
STOCKHB A bipolar high-low stock chart. Values from different data sets aredisplayed on separate poles.
STOCKHD A dual high-low stock chart. Values from an additional data setare displayed on a second value (Y) axis.
STOCKHCL A high-low-close stock chart. The most popular application of thistype of graph is to represent stock prices. Each bar representsthe highest, lowest, and closing prices for a given stock on agiven day.
24. Creating a Graph
Creating Reports With TIBCO® WebFOCUS Language 1767

SET LOOKGRAPH= Description
STOCKHCB A bipolar high-low-close stock chart. Values from different datasets are displayed on separate poles.
The most popular application of this type of graph is to representstock prices. Each bar represents the highest, lowest, and closingprices for a given stock on a given day.
STOCKHCD A dual high-low-close stock chart. Values from an additional dataset are displayed on a second value (Y) axis.
STOCKHOC A high-low-open-close stock chart.
The most popular application of this type of graph is to representstock prices. Each bar represents the highest, lowest, opening,and closing prices for a given stock on a given day.
STOCKHOB A bipolar high-low-open-close stock chart. Values from differentdata sets are displayed on separate poles.
STOCKHOD A dual high-low-open-close stock chart. Values from an additionaldata set are displayed on a second value (Y) axis.
STOCKHV A high-low-volume stock chart.
STOCKHOV A high-low-open-close-volume stock chart.
STOCKC A candle stock chart.
STOCKHC A high-low candle stock chart.
STOCKCV A volume candle stock chart.
STOCKHCV A high-low-volume candle stock chart.
Selecting a Graph Type
1768

Reference: Style Options for Polar Charts
Choose one of the following LOOKGRAPH values to change the style of polar charts:
SET LOOKGRAPH= Description
POLAR A polar chart that displays data points on a circle.
POLAR2 A dual polar chart. Values from an additional data set aredisplayed on a second value (Y) axis.
Reference: Style Options for Radar Charts
Choose one of the following LOOKGRAPH values to change the style of radar charts:
SET LOOKGRAPH= Description
RADARA A radar area chart.
RADARL A radar line chart.
RADARL2 A dual radar line chart. Values from an additional data set aredisplayed on a second value (Y) axis.
Reference: Style Options for Bubble Charts
Choose one of the following LOOKGRAPH values to change the style of bubble charts:
SET LOOKGRAPH= Description
BUBBLE A bubble chart.
BUBBLED A bubble chart with a dual axis.
BUBBLEDL A bubble chart with a dual axis and labels.
BUBBLEL A bubble chart with labels.
24. Creating a Graph
Creating Reports With TIBCO® WebFOCUS Language 1769

Reference: Style Options for Spectral Charts
Choose one of the following LOOKGRAPH values to change the style of spectral charts:
SET LOOKGRAPH= Description
SPECTRAL A spectral map chart. This is a chart with a row or column matrixof markers that is colored according to the data values.
Reference: Other Graph Types
SET LOOKGRAPH= Description
GANTT Provides a visual representation of project oriented time criticalevents. Gantt charts require six display fields and one sort field,in that order. Conditional styling and drill-down are not supportedfor GANTT charts.
POSITION Product position charts provide a visual representation of marketshare and growth versus revenue and measurement (past,present, future). Product position charts require a set of threedisplay fields.
VWATERFL Vertical waterfall graph.
HWATERFL Horizontal waterfall graph.
PARETO Displays data following Pareto 80:20 rule. Pareto charts requireonly one display field.
MULTI3YMULTI4YMULTI5Y
Stacks charts in order to make it easier to read, analyze andmanage them.
Selecting a Graph Type
1770
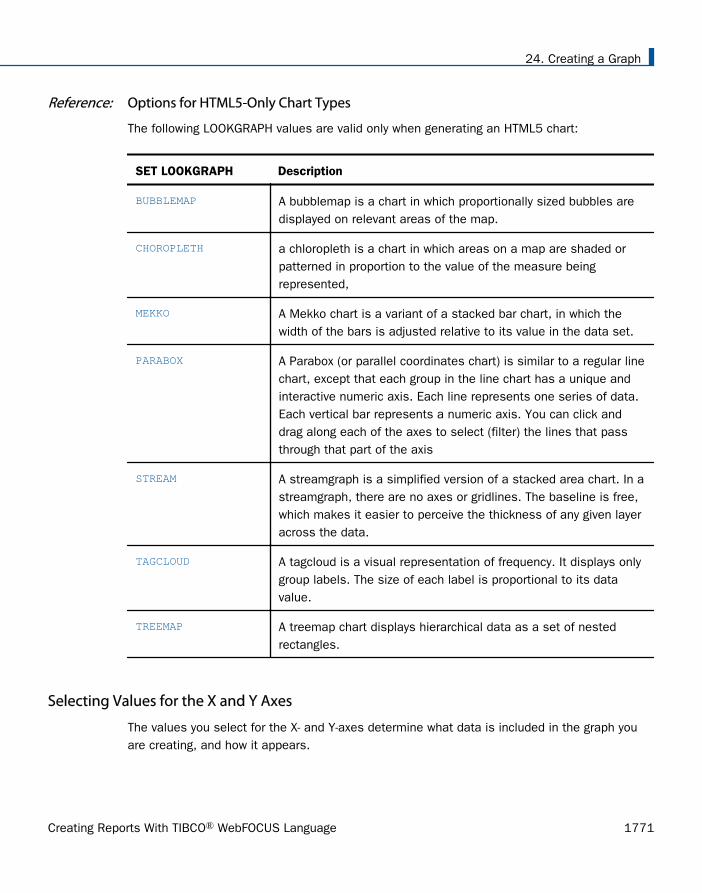
Reference: Options for HTML5-Only Chart Types
The following LOOKGRAPH values are valid only when generating an HTML5 chart:
SET LOOKGRAPH Description
BUBBLEMAP A bubblemap is a chart in which proportionally sized bubbles aredisplayed on relevant areas of the map.
CHOROPLETH a chloropleth is a chart in which areas on a map are shaded orpatterned in proportion to the value of the measure beingrepresented,
MEKKO A Mekko chart is a variant of a stacked bar chart, in which thewidth of the bars is adjusted relative to its value in the data set.
PARABOX A Parabox (or parallel coordinates chart) is similar to a regular linechart, except that each group in the line chart has a unique andinteractive numeric axis. Each line represents one series of data.Each vertical bar represents a numeric axis. You can click anddrag along each of the axes to select (filter) the lines that passthrough that part of the axis
STREAM A streamgraph is a simplified version of a stacked area chart. In astreamgraph, there are no axes or gridlines. The baseline is free,which makes it easier to perceive the thickness of any given layeracross the data.
TAGCLOUD A tagcloud is a visual representation of frequency. It displays onlygroup labels. The size of each label is proportional to its datavalue.
TREEMAP A treemap chart displays hierarchical data as a set of nestedrectangles.
Selecting Values for the X and Y Axes
The values you select for the X- and Y-axes determine what data is included in the graph youare creating, and how it appears.
24. Creating a Graph
Creating Reports With TIBCO® WebFOCUS Language 1771

The X-axis value is determined by the sort phrase (BY or ACROSS) used in your GRAPHrequest. At least one sort phrase is required in every GRAPH request. When there are multipleBY phrases or when an ACROSS and BY phrase are included in the same request, multiplegraphs are generated, one for each combination of values for the fields referenced in therequest. For details, see Creating Multiple Graphs on page 1774.
The Y-axis value is determined from the display field associated with the display command(SUM or PRINT) issued in your GRAPH request.
You can also:
Select a second horizontal category (X axis), which will produce multiple graphs. For details,see Creating Multiple Graphs on page 1774.
Temporarily hide the display of a Y-axis field. For details, see Hiding the Display of a Y-AxisField on page 1773.
Interpolate X and Y axis values using linear regression. For details, see Interpolating X andY Axis Values Using Linear Regression on page 1773.
Example: Selecting Values for the X and Y Axes
The following illustrates how to set the X-axis (PRODUCT_DESC) using an ACROSS phrase andthe Y-axis (QUANTITY) with the display command SUM:
GRAPH FILE GGORDERSUM QUANTITY AS 'Ordered Units'ACROSS PRODUCT_DESCEND
Selecting Values for the X and Y Axes
1772
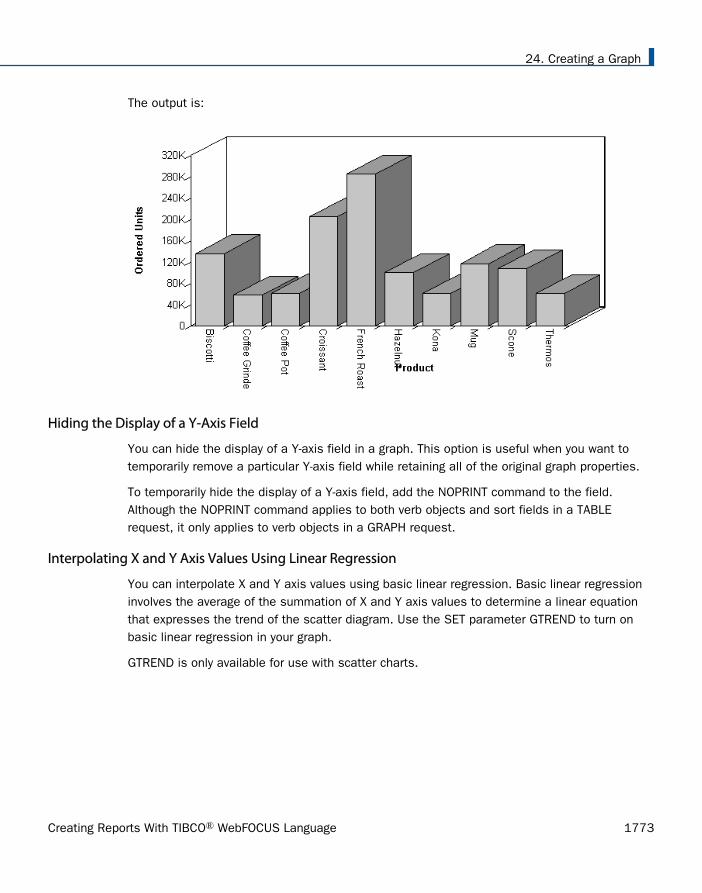
The output is:
Hiding the Display of a Y-Axis Field
You can hide the display of a Y-axis field in a graph. This option is useful when you want totemporarily remove a particular Y-axis field while retaining all of the original graph properties.
To temporarily hide the display of a Y-axis field, add the NOPRINT command to the field.Although the NOPRINT command applies to both verb objects and sort fields in a TABLErequest, it only applies to verb objects in a GRAPH request.
Interpolating X and Y Axis Values Using Linear Regression
You can interpolate X and Y axis values using basic linear regression. Basic linear regressioninvolves the average of the summation of X and Y axis values to determine a linear equationthat expresses the trend of the scatter diagram. Use the SET parameter GTREND to turn onbasic linear regression in your graph.
GTREND is only available for use with scatter charts.
24. Creating a Graph
Creating Reports With TIBCO® WebFOCUS Language 1773
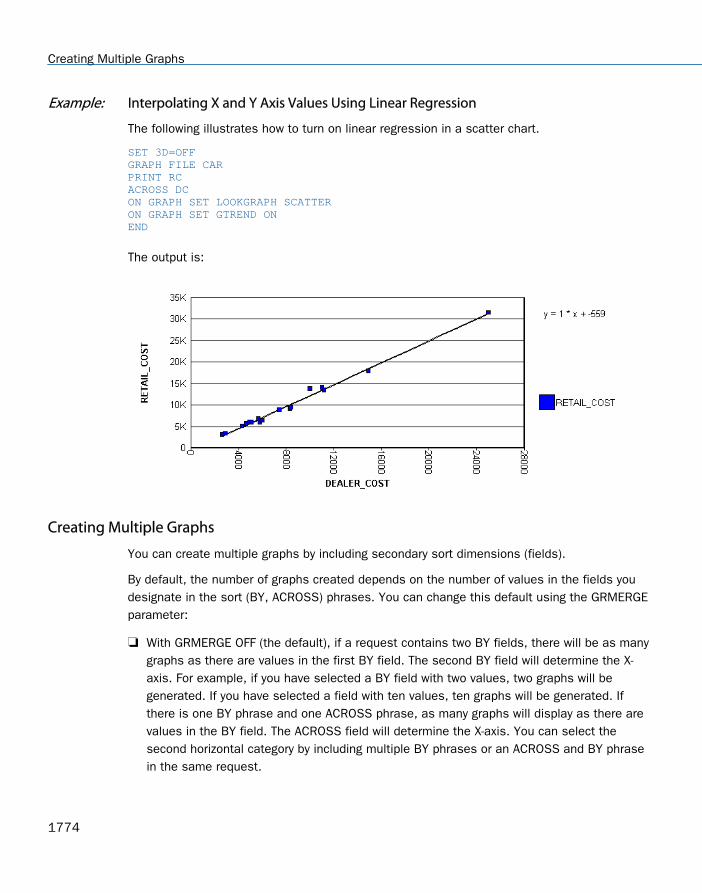
Example: Interpolating X and Y Axis Values Using Linear Regression
The following illustrates how to turn on linear regression in a scatter chart.
SET 3D=OFFGRAPH FILE CARPRINT RCACROSS DCON GRAPH SET LOOKGRAPH SCATTERON GRAPH SET GTREND ONEND
The output is:
Creating Multiple Graphs
You can create multiple graphs by including secondary sort dimensions (fields).
By default, the number of graphs created depends on the number of values in the fields youdesignate in the sort (BY, ACROSS) phrases. You can change this default using the GRMERGEparameter:
With GRMERGE OFF (the default), if a request contains two BY fields, there will be as manygraphs as there are values in the first BY field. The second BY field will determine the X-axis. For example, if you have selected a BY field with two values, two graphs will begenerated. If you have selected a field with ten values, ten graphs will be generated. Ifthere is one BY phrase and one ACROSS phrase, as many graphs will display as there arevalues in the BY field. The ACROSS field will determine the X-axis. You can select thesecond horizontal category by including multiple BY phrases or an ACROSS and BY phrasein the same request.
Creating Multiple Graphs
1774
With GRMERGE ON, WebFOCUS creates one merged graph.
With GRMERGE ADVANCED, WebFOCUS uses three parameters to determine:
How many graphs to generate (GRMULTIGRAPH).
How many sort fields should be placed on the graph legend (GRLEGEND).
How many sort fields should be placed on the X-axis (GRXAXIS).
Multiple graphs can be displayed in either merged format or in columns. For details, see Merging Multiple Graphs on page 1775 and Displaying Multiple Graphs in Columns on page1780.
Merging Multiple Graphs
By default, when you create a graph that has multiple BY fields, or a BY and ACROSS field,multiple graphs are generated. You can merge these graphs into a single graph or into multiplemerged graphs.
To do this, use the SET command GRMERGE.
Syntax: How to Merge Multiple Graphs
SET GRMERGE={ON|OFF|ADVANCED}
where:
ON
Turns on the merge graph option.
OFF
Turns off the merge graph option. This is the default.
ADVANCED
Turns on the advanced merge option. This option uses three parameters to determine howto merge the graphs:
GRMULTIGRAPH, which specifies how many sort fields to use to create multiple graphs.
GRLEGEND, which specifies how many sort fields to place on the graph legend.
GRXAXIS, which specifies how many sort fields to display on the X-axis. GRXAXIS mustbe at least 1 in order to plot the graph. A value greater than one creates nested X-axes.
Note: The sum of the sort fields used by GRMULTIGRAPH, GRLEGEND, and GRXAXIS mustequal the number of sort fields in the graph request.
24. Creating a Graph
Creating Reports With TIBCO® WebFOCUS Language 1775

The syntax for the GRMULTIGRAPH, GRLEGEND, and GRXAXIS parameters is:
ON GRAPHSET GRMULTIGRAPH n
Specifies how many sort fields (0 through 2) to use to break the output into multiplegraphs. The outermost sort fields are used to separate the graphs. When n is greaterthan zero, this is similar to GRMERGE=OFF, but allows an additional sort field.
ON GRAPH SET GRLEGEND n
Specifies how many of the remaining outermost sort fields (0 through 2), after theones used for GRMULTIGRAPH, to add to the graph legend. When n is greater thanzero, this is similar to GRMERGE=ON, but allows an additional sort field.
ON GRAPH SET GRXAXIS n
Specifies how many of the remaining sort fields (1 through 3) to display on the X-axis.When n is greater than 1, this creates nested X-axes.
Example: Merging Multiple Graphs With GRMERGE ON
The following illustrates a graph with two horizontal, or X-axes, categories (PRODUCT_ID andPACKAGE_TYPE) that have been merged.
SET GRMERGE=ONGRAPH FILE GGORDERSUM UNIT_PRICE ORDER_NUMBERACROSS PRODUCT_IDBY PACKAGE_TYPEEND
Creating Multiple Graphs
1776

The output is:
Example: Merging Multiple Graphs With GRMERGE ADVANCED
The following example generates a vertical bar graph that separates the outermost sort field(REGION) onto separate graphs, distinguishes the next two sort fields (ST and CATEGORY) bycombining them on the graph legend, and places the CATEGORY sort field on the X-axis:
GRAPH FILE GGSALESSUM DOLLARSBY REGION BY ST BY CATEGORY BY PRODUCTWHERE CATEGORY EQ 'Food' OR 'Gifts' WHERE PRODUCT EQ 'Coffee Pot' OR 'Biscotti' OR 'Mug'ON GRAPH SET GRMERGE ADVANCEDON GRAPH SET GRMULTIGRAPH 1ON GRAPH SET GRLEGEND 2ON GRAPH SET GRXAXIS 1ON GRAPH SET LOOKGRAPH VBAREND
24. Creating a Graph
Creating Reports With TIBCO® WebFOCUS Language 1777

The first graph is for region Midwest. The legend distinguishes State-Category combinations bycolor, and the PRODUCT sort field is repeated on the X-axis for each State-Categorycombination:
Merging Multiple OLAP Graphs
When you create an OLAP graph that has multiple BY fields, or a BY and ACROSS field,multiple graphs are generated. You can merge these graphs into a single graph.
To do this, use the SET command OLAPGRMERGE.
Syntax: How to Merge Multiple OLAP Graphs
SET OLAPGRMERGE={ON|OFF}
where:
ON
Turns on the merge graph option. With this setting AUTODRILL is disabled for the graph.
OFF
Turns off the merge graph option and creates a separate graph for every value of the outersort field. OFF is the default value.
Creating Multiple Graphs
1778
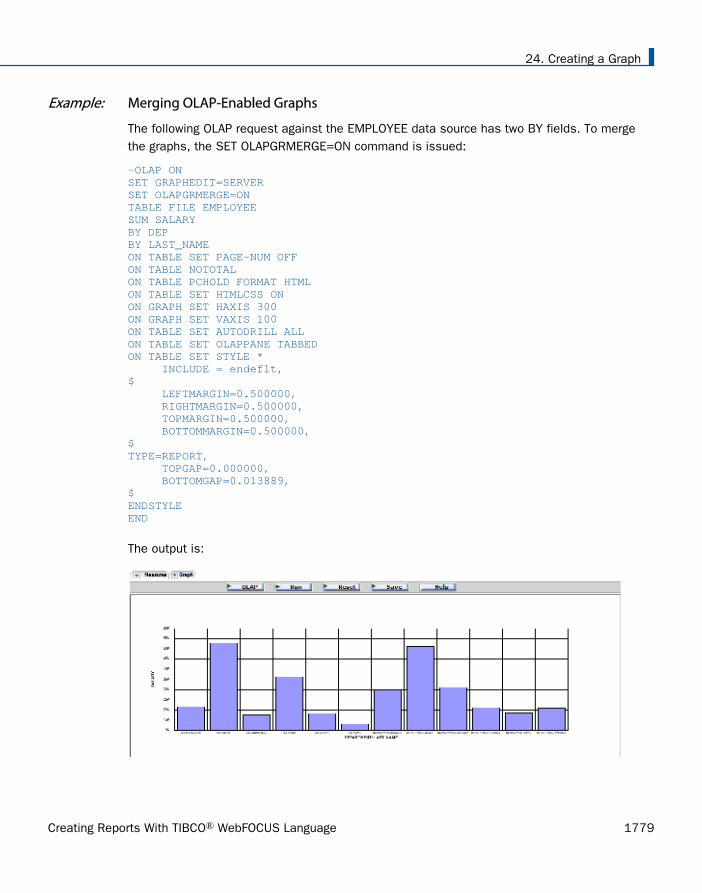
Example: Merging OLAP-Enabled Graphs
The following OLAP request against the EMPLOYEE data source has two BY fields. To mergethe graphs, the SET OLAPGRMERGE=ON command is issued:
-OLAP ONSET GRAPHEDIT=SERVERSET OLAPGRMERGE=ONTABLE FILE EMPLOYEESUM SALARYBY DEPBY LAST_NAMEON TABLE SET PAGE-NUM OFFON TABLE NOTOTALON TABLE PCHOLD FORMAT HTMLON TABLE SET HTMLCSS ONON GRAPH SET HAXIS 300ON GRAPH SET VAXIS 100ON TABLE SET AUTODRILL ALLON TABLE SET OLAPPANE TABBEDON TABLE SET STYLE * INCLUDE = endeflt,$ LEFTMARGIN=0.500000, RIGHTMARGIN=0.500000, TOPMARGIN=0.500000, BOTTOMMARGIN=0.500000,$TYPE=REPORT, TOPGAP=0.000000, BOTTOMGAP=0.013889,$ENDSTYLEEND
The output is:
24. Creating a Graph
Creating Reports With TIBCO® WebFOCUS Language 1779
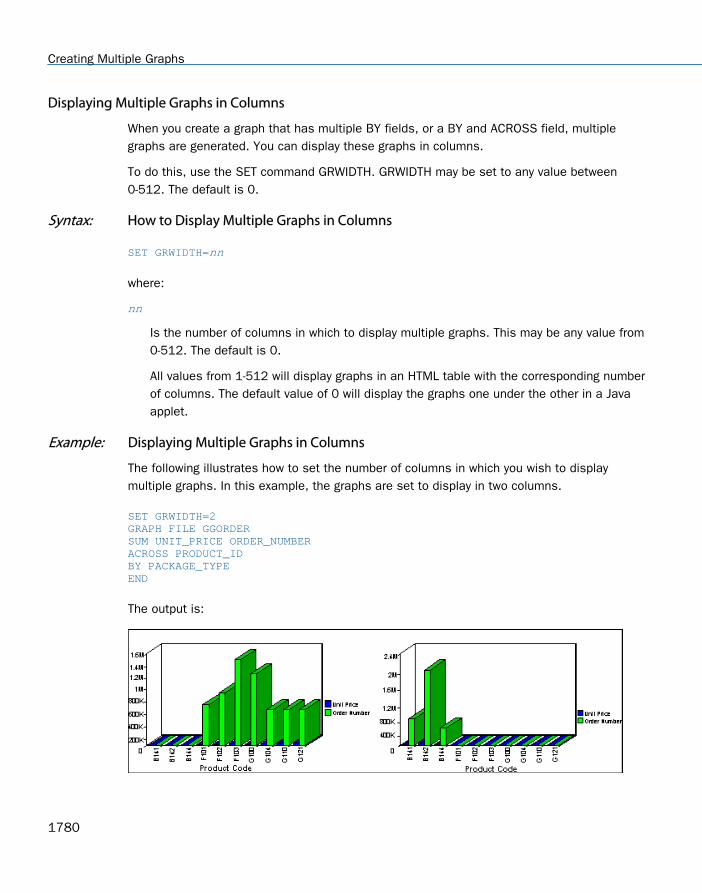
Displaying Multiple Graphs in Columns
When you create a graph that has multiple BY fields, or a BY and ACROSS field, multiplegraphs are generated. You can display these graphs in columns.
To do this, use the SET command GRWIDTH. GRWIDTH may be set to any value between0-512. The default is 0.
Syntax: How to Display Multiple Graphs in Columns
SET GRWIDTH=nn
where:
nn
Is the number of columns in which to display multiple graphs. This may be any value from0-512. The default is 0.
All values from 1-512 will display graphs in an HTML table with the corresponding numberof columns. The default value of 0 will display the graphs one under the other in a Javaapplet.
Example: Displaying Multiple Graphs in Columns
The following illustrates how to set the number of columns in which you wish to displaymultiple graphs. In this example, the graphs are set to display in two columns.
SET GRWIDTH=2GRAPH FILE GGORDERSUM UNIT_PRICE ORDER_NUMBERACROSS PRODUCT_IDBY PACKAGE_TYPEEND
The output is:
Creating Multiple Graphs
1780

Plotting Dates in Graphs
Numeric fields containing dates are recognized by the field formats specified in the MasterFile. Such fields can be used in ACROSS or BY phrases in GRAPH requests. To review thevarious format types, refer to the Describing Data With TIBCO WebFOCUS® Language manual.
Plotted dates are handled in the following manner:
If the date field named has a month-first format, it is plotted in ascending time order (evenif the file is not sorted in ascending date order). Hence, month/year values of 01/76,03/76, 09/75 will be plotted by month within year: 09/75, 01/76, 03/76.
Axis scaling is performed on the basis of days in the month and months in the year. Whenthe date format includes the day, the scale usually starts at the first day of the month, atthe "zero" axis point.
You can selectively combine groups of date point plots to reduce the number of separatepoints on the horizontal axis. You do this with the IN-GROUPS-OF option. For example, if thedate field format is I6YMD, you can display the data by month rather than by day by grouping itin 30-day increments:
ACROSS DATE IN-GROUPS-OF 30
This eliminates plot points for individual days. If your date format is YMD, you can redefine theformat and divide the field contents by 100 to eliminate the days:
DATE/I4YM=DATE/100
Example: Including Date Fields in a Graph
The following example illustrates how month-first formatted date fields are displayed in agraph.
SET GRMERGE = ONGRAPH FILE GGORDERSUM QUANTITYACROSS ORDER_DATEBY PRODUCT_DESCWHERE PRODUCT_DESC EQ 'French Roast' OR 'Hazelnut' OR 'Kona' ANDORDER_DATE GE '010197'END
24. Creating a Graph
Creating Reports With TIBCO® WebFOCUS Language 1781

The output is:
Basic Date Support for X and Y Axes
OLDDATES can be manipulated accordingly with the usage of YRTHRESH and DEFCENT SETparameters. If you do not specify the YRTHRESH and DEFCENT commands for dates with the Yformat (for example, YMD, MDY, DMY, YM, etc.), the code will assume the format 19XX.
Reference: Date Support Limitations
The following date formats are supported:
SHORT (18) is completely numeric, such as 12/13/52 or 3:30pm.
MEDIUM (19) is longer, such as Jan 12, 1952.
LONG (20) is longer, such as January 12, 1952 or 3:30:32pm.
FULL (21) is almost completely specified, such as Tuesday, April 12, 1952 AD or3:30:42pm PST.
The default date format for the X and Y axes is MEDIUM. You can overwrite the default byusing one of the following API calls (where xx is one of the numbers listed above):
setTextFormatPreset(getX1Label(),xx); // for X Axis
setTextFormatPreset(getY1Label(),xx); // for Y Axis
Plotting Dates in Graphs
1782

The default date format for Data Text is LONG. This only applies to graphs with dates onthe Y axis. Currently this format is not supported on the X axis. You can overwrite thedefault by using the following API call:
setDataTextFormat(xx);
For more information, see Customizing Graphs Using the Graph API and HTML5 JSONProperties on page 1808.
In a graph with dates on the X axis and numeric fields on the Y axis, the tool tip displaysthe data format of the graph by default. This means that a date value will display its rawGMT value in milliseconds. This does not occur for dates on the Y axis and strings on the Xaxis, because the data format is already in date format.
DATETIME is not fully supported.
The ability to set the start and end dates for the appropriate axis is not supported.
The ability to set the step for dates is not supported.
Formatting Dates for Y-Axis Values
You can display date-formatted numbers for Y-axis fields and on tool tips. The following dateformats are supported:
Display Format Corresponding WebFOCUS Format
yy/mm/dd YMD
yy/mm YM
mm/dd/yyyy MDYY
mm/dd/yy MDY
mm/dd MD
For complete details on date formats, see the Describing Data With TIBCO WebFOCUS®
Language manual.
Refining the Data Set For Your Graph
After selecting field values for the X and Y axes, you may wish to limit the data that displays inyour graph. You can do this by creating WHERE statements. A WHERE statement limits data bycreating parameters the data must satisfy before it is included in the data set.
24. Creating a Graph
Creating Reports With TIBCO® WebFOCUS Language 1783

For details on WHERE, WHERE TOTAL, and IF phrases, see Selecting Records for Your Reporton page 217.
Example: Specifying WHERE Criteria in a Graph Request
The syntax for WHERE, WHERE TOTAL, and IF phrases in a GRAPH request is identical to thatused in a TABLE request.
The following graph request shows data for specific product descriptions, namely FrenchRoast, Hazelnut, or Kona.
GRAPH FILE GGORDERSUM QUANTITY BY PRODUCT_DESCWHERE PRODUCT_DESC EQ 'French Roast' OR 'Hazelnut' OR 'Kona'END
The output is:
Displaying Missing Data Values in a Graph
You can display missing data values (in a bar graph, line graph, area graph, or any variation ofthese graph types) in one of the following formats:
Graph as zero. In bar graphs, a bar appears on the zero line. In line graphs, a solid lineconnects the missing value with the succeeding value. In area graphs, the area appears onthe zero line.
Graph as gap. In all graph types (bar, line, or area), missing values appear as a gap in thegraph.
Displaying Missing Data Values in a Graph
1784

Dotted line to zero. In line graphs, a dotted line connects the missing value with thesucceeding value. In 3D bar graphs, solid lines outline the flat bar corresponding to themissing value. In 2D bar graphs, a gap appears in the graph. In area graphs, a transparentarea extends down to the zero line and then up to the succeeding value.
Interpolated dotted line. In a line graph, missing values appear as an interpolated dottedline that connects the plot points immediately preceding and succeeding the missing value.In bar and area graphs, missing values display as an interpolated (transparent) bar or area.
Note: You can specify a default value (other than the default value of zero) to representmissing data. To do this use a DEFINE command. For details, see Handling Records WithMissing Field Values on page 1037.
Syntax: How to Display Missing Values in a Graph
GRAPH FILE filename ...SET VZERO={ON|OFF}ON GRAPH SET STYLE **GRAPH_SCRIPT API call *ENDENDSTYLEEND
where:
ON
Displays missing values as zero. An API call is not necessary when VZERO is set to ON.Alternatively, you can add ON GRAPH SET VZERO ON.
OFF
Displays missing values as a gap, a dotted line to zero, or, an interpolated dotted line,depending on the API call that is added. Alternatively, you can add ON GRAPH SET VZEROOFF.
API call
Determines how missing values display in the graph when VZERO is set to OFF. Possiblevalues are:
setFillMissingData(0); displays missing values as a gap.
setFillMissingData(1); displays missing values as a dotted line to zero.
24. Creating a Graph
Creating Reports With TIBCO® WebFOCUS Language 1785
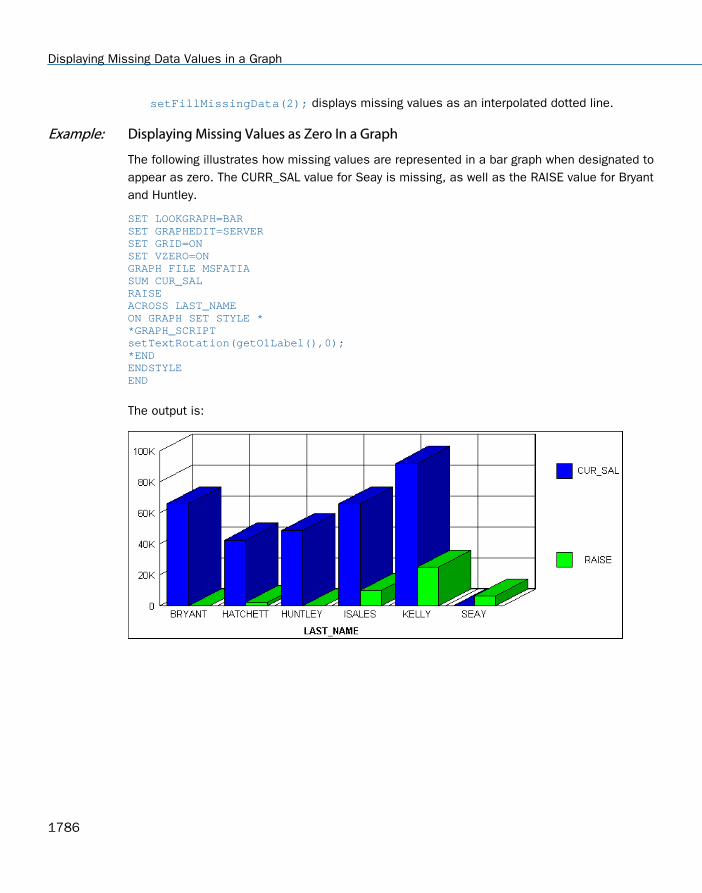
setFillMissingData(2); displays missing values as an interpolated dotted line.
Example: Displaying Missing Values as Zero In a Graph
The following illustrates how missing values are represented in a bar graph when designated toappear as zero. The CURR_SAL value for Seay is missing, as well as the RAISE value for Bryantand Huntley.
SET LOOKGRAPH=BARSET GRAPHEDIT=SERVERSET GRID=ONSET VZERO=ONGRAPH FILE MSFATIASUM CUR_SALRAISEACROSS LAST_NAMEON GRAPH SET STYLE **GRAPH_SCRIPTsetTextRotation(getO1Label(),0);*ENDENDSTYLEEND
The output is:
Displaying Missing Data Values in a Graph
1786

Example: Displaying Missing Values as a Gap
The following illustrates how missing values are represented in a bar graph when designated toappear as a gap. The CURR_SAL value for Seay is missing, as well as the RAISE value forBryant and Huntley.
SET LOOKGRAPH=BARSET GRAPHEDIT=SERVERSET GRID=ONSET VZERO=OFFGRAPH FILE MSFATIASUM CUR_SALRAISEACROSS LAST_NAMEON GRAPH SET STYLE **GRAPH_SCRIPTsetFillMissingData(0);setTextRotation(getO1Label(),0);*ENDENDSTYLEEND
The output is:
24. Creating a Graph
Creating Reports With TIBCO® WebFOCUS Language 1787
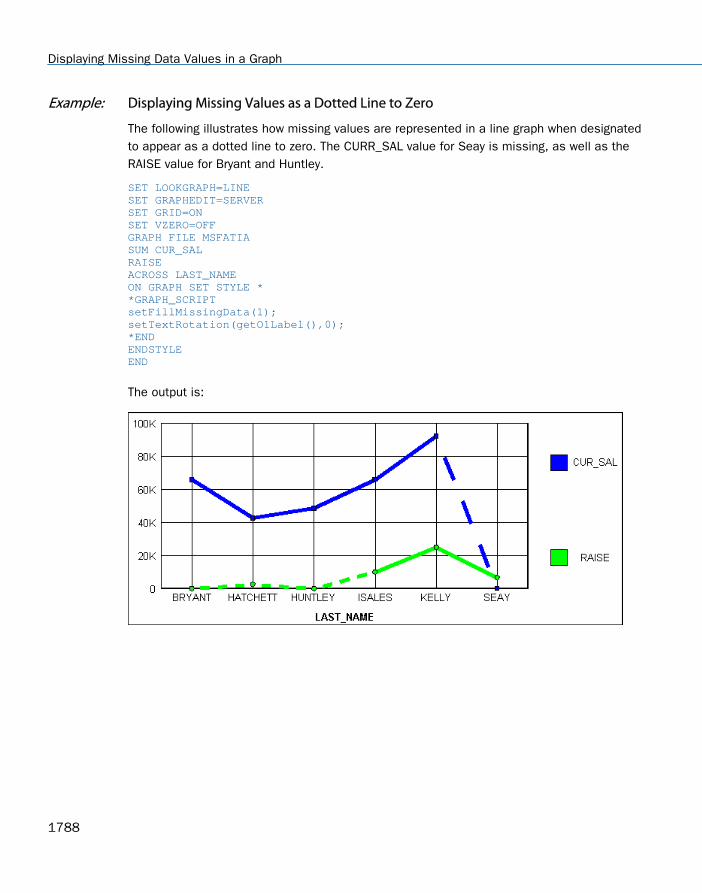
Example: Displaying Missing Values as a Dotted Line to Zero
The following illustrates how missing values are represented in a line graph when designatedto appear as a dotted line to zero. The CURR_SAL value for Seay is missing, as well as theRAISE value for Bryant and Huntley.
SET LOOKGRAPH=LINESET GRAPHEDIT=SERVERSET GRID=ONSET VZERO=OFFGRAPH FILE MSFATIASUM CUR_SALRAISEACROSS LAST_NAMEON GRAPH SET STYLE **GRAPH_SCRIPTsetFillMissingData(1);setTextRotation(getO1Label(),0);*ENDENDSTYLEEND
The output is:
Displaying Missing Data Values in a Graph
1788
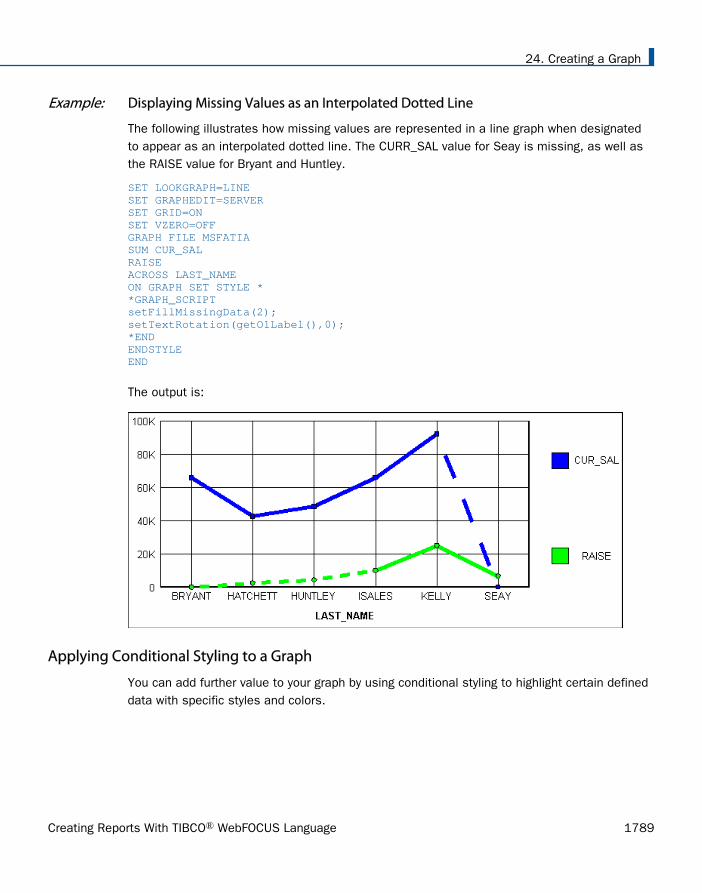
Example: Displaying Missing Values as an Interpolated Dotted Line
The following illustrates how missing values are represented in a line graph when designatedto appear as an interpolated dotted line. The CURR_SAL value for Seay is missing, as well asthe RAISE value for Bryant and Huntley.
SET LOOKGRAPH=LINESET GRAPHEDIT=SERVERSET GRID=ONSET VZERO=OFFGRAPH FILE MSFATIASUM CUR_SALRAISEACROSS LAST_NAMEON GRAPH SET STYLE **GRAPH_SCRIPTsetFillMissingData(2);setTextRotation(getO1Label(),0);*ENDENDSTYLEEND
The output is:
Applying Conditional Styling to a Graph
You can add further value to your graph by using conditional styling to highlight certain defineddata with specific styles and colors.
24. Creating a Graph
Creating Reports With TIBCO® WebFOCUS Language 1789

For example, you can apply the color red to all departments that did not reach their salesquotas and apply the color black to all departments that did reach their sales quotas. In thisexample, the user can view quickly which departments did or did not reach their quotas. Toexamine how the results of one department may impact the results of a second department,you may want to provide a drill-down to a report that examines this possibility.
You can apply color to the following graph types:
Bar graphs.
Three-dimensional graphs with noncontinuous plot points.
Pie graphs.
Stack charts.
You can apply conditional styling using StyleSheets.
Note: Conditional styling is only supported for Y-axis values.
Syntax: How to Apply Conditional Styling to a Graph
TYPE=DATA,[COLUMN|ACROSSCOLUMN=Nn,]COLOR=color, [WHEN=expression,]$
where:
DATA
Identifies data as the graph component to which color is being applied. This value mustappear at the beginning of the declaration.
COLUMN|ACROSSCOLUMN
Is the graph subcomponent to which you want to apply color. Valid graph subcomponentsare COLUMN and ACROSSCOLUMN.
Nn
Identifies a column by its position in the report. To determine this value, count BY fields,display fields, and ROW-TOTAL fields, from left to right, including NOPRINT fields. Fordetails, see Identifying a Report Component in a WebFOCUS StyleSheet on page 1251.
color
Identifies the color that you want to apply to the graph component or subcomponent. For alist of valid colors, see Formatting Report Data on page 1699.
Applying Conditional Styling to a Graph
1790

expression
Is any Boolean expression that specifies conditions for applying the specified color to thegraph component. The expression must be valid on the right side of a COMPUTEcommand. For details, see Using Expressions on page 429.
Note: IF... THEN ... ELSE logic is not necessary in a WHEN clause and is not supported.
All non-numeric literals in a WHEN expression must be specified within single quotationmarks.
Example: Applying Conditional Styling to a Graph
The following illustrates how you can apply conditional styling to a graph.
GRAPH FILE GGSALES SUM UNITS DOLLARS ACROSS PRODUCT ON GRAPH SET STYLE * 1. TYPE=DATA,COLOR=BLUE,$ 2. TYPE=DATA,ACROSSCOLUMN=N2,COLOR=FIREBRICK,$ 3. TYPE=DATA,ACROSSCOLUMN=N2,COLOR=SILVER,WHEN=N2 GT 5000000,$ 4. TYPE=DATA,ACROSSCOLUMN=N1,COLOR=LIME,WHEN=N1 LT 200000,$ ENDSTYLE END
1. This line specifies blue as the default data color.
2. This line specifies firebrick as the default color for the DOLLARS column.
3. This line specifies silver as the color for the DOLLARS column when the value for DOLLARSis greater than five million.
4. This line specifies lime as the UNITS column color when the number of UNITS is less thantwo hundred thousand.
24. Creating a Graph
Creating Reports With TIBCO® WebFOCUS Language 1791

The output is:
Linking Graphs to Other Resources
To drill down to a more detailed level of information in a graph, you can link a procedure(FOCEXEC) or a URL to one or more values in your graph. When you run your graph, theselected values become "hot spots" that invoke the underlying procedure, JavaScript function,or URL.
The JSURLS parameter includes JavaScript or VBScript files in an HTML graph. This allows youto customize the display of WebFOCUS HTML graphs with any JavaScript or VBScript functions.The JavaScript and VBScript files are the last files loaded, and are loaded in the order they arelisted, allowing complete customization of the HTML page.
This feature works with any graph format that outputs an HTML document, for exampleJSCHART and PCHOLD FORMAT PNG.
In addition, when a WebFOCUS graph is run, a set of pre-defined JavaScript functions isinvoked. Using JSURLS, you can disable or modify these default functions. To view the full setof pre-defined JavaScript functions, see /ibi/WebFOCUSxx/ibi_apps/ibi_html/javaassist/ibi/html/js/ibigl.js.
The syntax is:
SET JSURLS='/file1 [/file2] [/file3]...'
Linking Graphs to Other Resources
1792

where:
/file1 [/file2] [/file3]...
Are the files that contain JavaScript or VBScript. If there is more than one js file, thedelimiter is a blank and the values must be enclosed in single quotes. Files must be in alocation that is accessible by the web server. The total length of the value is limited to 256bytes.
You can reference files with a URL.
Syntax: How to Link a Graph to Another Request
TYPE=DATA,[COLUMN|ACROSSCOLUMN=Nn,]COLOR=color,[WHEN=expression,]FOCEXEC=fex[(parameters ...),]$
where:
DATA
Identifies Data as the graph component to which the user is applying the color. The TYPEattribute and its value must appear at the beginning of the declaration.
COLUMN|ACROSSCOLUMN
Is the graph subcomponent to which you want to apply color. Valid graph subcomponentsare COLUMN and ACROSSCOLUMN.
color
Identifies the color that you want to apply to the graph component or subcomponent. For alist of valid colors, see Formatting Report Data on page 1699.
Nn
Identifies a column by its position in the report. To determine this value, count BY fields,display fields, and ROW-TOTAL fields, from left to right, including NOPRINT fields. For moreinformation, see Identifying a Report Component in a WebFOCUS StyleSheet on page 1251.
FOCEXEC=fex
Identifies the file name of the linked procedure to run when a user selects the reportobject.
parameters
Are values to be passed to the procedure. You can pass one or more values, using anycombination of the following methods:
You can specify a constant value, enclosed in single quotation marks.
24. Creating a Graph
Creating Reports With TIBCO® WebFOCUS Language 1793

You can specify the name or the position of a graph column.
You can specify the name of a Dialogue Manager amper variable to pass its value.
You can use amper variables only in inline StyleSheets.
Note: The usual use of an amper variable is to pass a constant value, in which case, itwould have to be embedded in single quotation marks. For example:
'&ABC'.
The method you can use to pass values can vary, depending on the method you use toexecute the hyperlink. You can pass one or more values. The entire string of values mustbe enclosed in parentheses, and separated from each other by a blank space.
expression
Is any Boolean expression that specifies conditions for applying the specified color to thegraph component. The expression must be valid on the right side of a COMPUTEcommand. For details, see Using Expressions on page 429.
Note: IF ... THEN ... ELSE logic is not necessary in a WHEN clause and is not supported.
All non-numeric literals in a WHEN expression must be specified within single quotationmarks.
Example: Linking to Additional Reports or Graphs
In this example, when the value for UNITS is less than four hundred thousand, the color is limeand you can drill-down to a detail report.
GRAPH FILE GGSALESSUM UNITS DOLLARS ACROSS PRODUCTON GRAPH SET STYLE *TYPE=DATA,COLOR=SILVER,$TYPE=DATA,ACROSSCOLUMN=N1,COLOR=LIME,WHEN=N1 LT 400000,FOCEXEC=GRAPH2,$ENDSTYLEEND
Linking Graphs to Other Resources
1794

The output is:
Syntax: How to Link to a URL
You can define a link from any component to any URL including webpages, websites, Servletprograms, or non-World Wide Web resources, such as an email application. After you havedefined a link, you can select the component to access the URL.
The links you create can be dynamic. With a dynamic link, your selection passes the value ofthe selected component to the URL. The resource uses the passed value to dynamicallydetermine the results that are returned. You can pass one or more parameters. For details,see Creating Parameters on page 856.
TYPE=type, [subtype], URL=url[(parameters ...)], [TARGET=frame,] [ALT = 'description',] $
where:
type
Identifies the report or graph component that you select in the web browser to execute thelink. The TYPE attribute and its value must appear at the beginning of the declaration.
subtype
Are any additional attributes, such as COLUMN, LINE, or ITEM, that are needed to identifythe report component that you are formatting. For information on identifying components,see Identifying a Report Component in a WebFOCUS StyleSheet on page 1251.
24. Creating a Graph
Creating Reports With TIBCO® WebFOCUS Language 1795

url
Identifies any valid URL, including a URL that specifies a WebFOCUS Servlet program, orthe name of a report column enclosed in parentheses whose value is a valid URL to whichthe link will jump.
Note:
The maximum length of a URL=url argument, including any associated variable=objectparameters, is limited by the maximum number of characters allowed by the browser.For information about this limit for your browser, search on your browser vendor'ssupport site. The URL argument can span more than one line, as described in Creatingand Managing a WebFOCUS StyleSheet on page 1199.
Note that the length of the URL is limited by the maximum number of charactersallowed by the browser. For information about this limit for your browser, search on yourbrowser vendor’s support site.
If the URL refers to a WebFOCUS Servlet program that takes parameters, the URL mustend with a question mark (?).
parameters
Values that are passed to the URL. For details, see Creating Parameters on page 856.
frame
Identifies the target frame in the webpage in which the output from the drill-down link isdisplayed. For details, see Specifying a Target Frame on page 875.
description
Is a textual description of the link supported in an HTML report for compliance with Section508 accessibility. Enclose the description in single quotation marks.
The description also displays as a pop-up description when your mouse or cursor hoversover the link in the report output.
Syntax: How to Link to a JavaScript Function
You can use a StyleSheet to define a link to a JavaScript function from any report or graphcomponent. After you have defined the link, you can select the component to execute theJavaScript function.
Just as with drill-down links to procedures and URLs, you can specify optional parameters thatallow values of a component to be passed to the JavaScript function. The function will use thepassed value to dynamically determine the results that are returned to the browser. Fordetails, see Creating Parameters on page 856.
Linking Graphs to Other Resources
1796
Note:
JavaScript functions can, in turn, call other JavaScript functions.
You cannot specify a target frame if you are executing a JavaScript function. However, theJavaScript function itself can specify a target frame for its results.
TYPE=type, [subtype], JAVASCRIPT=function[(parameters ...)], $
where:
type
Identifies the report component that you select in the web browser to execute the link. TheTYPE attribute and its value must appear at the beginning of the declaration.
subtype
Are any additional attributes, such as COLUMN, LINE, or ITEM, that are needed to identifythe report component that you are formatting. See Identifying a Report Component in aWebFOCUS StyleSheet on page 1251 for details.
function
Identifies the JavaScript function to run when you select the report component.
The maximum length of a JAVASCRIPT=function argument, including any associatedparameters, is 2400 characters and can span more than one line. If you split a singleargument across a line, you need to use the \ character at the end of the first line, ascontinuation syntax. If you split an argument at a point where a space is required as adelimiter, the space must be before the \ character or be the first character on the nextline. The \ character does not act as the delimiter.
In this example,
JAVASCRIPT=myfunc(COUNTRY \CAR MODEL 'ABC'),$
the argument correctly spans two lines.
Note:
You can use the SET JSURLS command or the Dialogue Manager -HTMLFORMcommand to embed the chart into an HTML document in which the function is defined.
When you have an HTML document called by -HTMLFORM, ensure that the fileextension is .HTM (not .HTML).
24. Creating a Graph
Creating Reports With TIBCO® WebFOCUS Language 1797

For more information about the -HTMLFORM command, see the TIBCO WebFOCUS®
Developing Reporting Applications manual.
parameters
Values that are passed to the JavaScript function. For details, see Creating Parameters onpage 856.
Syntax: How to Create Multiple Drill-Down Links
TYPE=type, [subtype], DRILLMENUITEM='description'|'DrillDown n', type_of_link
where:
type
Identifies the component that you select in the web browser to execute the link. The TYPEattribute and its value must appear at the beginning of the declaration.
subtype
Are any additional attributes, such as COLUMN, LINE, or ITEM, that are needed to identifythe component that you are formatting. See Identifying a Report Component in aWebFOCUS StyleSheet on page 1251 for information on identifying report components.
description
Is the text that appears on the pop-up menu of drill-down options on the output. Thedefault value is DrillDown n, where n is a consecutive integer, such as DrillDown 1,DrillDown 2, and so on.
type_of_link
Is the type of link, for example, a link to a detail report or URL. For a summary of validvalues, see Summary of Drill-Down Links on page 849.
Reference: Syntax Guidelines
You can create multiple drill-down links from a component on a summary request, chosen fromany combination of supported actions. For example, you can create links to a detail report,chart, or Maintain procedure, a JavaScript function, and a URL. When you click a component inthe summary request, a pop-up menu appears listing the drill-down options.
This feature does not apply to headings or footings,
When you create multiple drill-down links, you cannot specify a single drill-down action (forexample, FOCEXEC or URL) before the first DRILLMENUITEM.
Linking Graphs to Other Resources
1798
The menu created by the DRILLMENUITEM keyword is styled using a Cascading Stylesheet file.The file is /ibi/WebFOCUSxx/ibi_apps/ibi_html/javaassist/ibi/html/js/multidrill.css, where xxis the version and major release number of WebFOCUS.
Tip: You can make changes to the /ibi/WebFOCUS82/ibi_apps/ibi_html/javaassist/ibi/html/js/multidrill.css file to affect the font, size, and color of the DRILLMENUITEM menu.
Make a backup of the /ibi/WebFOCUS82/ibi_apps/ibi_html/javaassist/ibi/html/js/multidrill.css file.
Modify the multidrill.css file, with the desired changes.
Rename the multidrill.css.gz file. This file resides in the same location as the multidrill.cssfile.
Clear cache.
Restart the Reporting Server.
Reference: Summary of Drill-Down Links
You can link to:
Another request. The StyleSheet attribute is FOCEXEC.
A URL. The StyleSheet attribute is URL. You pass a valid URL.
Note that the length of the URL is limited by the maximum number of characters allowed bythe browser. For information about this limit for your browser, search on the support site foryour browser vendor.
A URL from a field. The StyleSheet attribute is URL. You pass the name of a report columnwhose value is a valid URL to which the link will jump.
A JavaScript function. The StyleSheet attribute is JAVASCRIPT.
A WebFOCUS Maintain procedure. The StyleSheet attribute is URL with the keywordMNTCON EX. For details on the syntax, see Linking to a Maintain Data Procedure on page838.
A WebFOCUS compiled Maintain procedure. The StyleSheet attribute is URL with thekeyword MNTCON RUN. For details on the syntax, see Linking to a Maintain Data Procedureon page 838.
24. Creating a Graph
Creating Reports With TIBCO® WebFOCUS Language 1799

Creating Parameters
Parameters allow you to specify criteria and conditions for the linked (drill down) report. Bydefining parameters, you can control the amount and type of information to retrieve when youclick on a hot spot.
For complete details, see Linking a Report to Other Resources on page 821.
Adding Labels to a Graph
Adding labels to your graph helps provide important information about what the data in yourgraph represents. You may choose to add headings and/or footings to your graph, as well ashorizontal (X) and vertical (Y) axis labels.
You can add a heading or footing to your graph using the HEADING or FOOTING phrase. Thesyntax is the same as that used for headings and footings in TABLE requests. You can alsoembed field values in graph headings and footings. This capability is particularly useful forannotating graphs that contain multiple sort fields.
For details on headings, footings, and embedded fields, see Using Headings, Footings, Titles,and Labels on page 1519.
Note: If your graph labels or legends are not appearing correctly when you run your graph, see How to Change Color Settings on page 1816 for details on correcting this.
Example: Adding a Heading and Footing to a Graph
The following illustrates how to add a heading with an embedded field value to your graph. Inthis example, the heading is "Total Coffee Orders" with the embedded field TOT.QUANTITY.
GRAPH FILE GGORDERHEADING CENTER"Total Coffee Orders: <TOT.QUANTITY "SUM QUANTITY BY PRODUCT_DESCWHERE PRODUCT_DESC EQ 'French Roast' OR 'Hazelnut' OR 'Kona'FOOTING CENTER"For year-end orders"END
Adding Labels to a Graph
1800

The output is:
Adding Vertical (Y-axis) and Horizontal (X-axis) Labels to a Graph
Vertical (Y-axis) and horizontal (X-axis) graph labels are placed on the graph according to thedisplay fields and sort fields specified in the request. The titles that appear on the graph arethe titles that appear in the Master File for that particular field.
The vertical (Y-axis) title of the graph is determined by the display field. Note that when thenumber of Y-axis labels is greater than one, the labels do not appear along the Y-axis. Instead,the labels appear in a legend that provides the names of the fields being graphed.
The horizontal (X-axis) title of the graph is determined by the sort field.
You can replace a title by using an AS phrase in the GRAPH request.
Applying Custom Styling to a Graph
You can customize your graph using StyleSheets and SET commands. You can set the graphwidth and height, set fixed scales for the X and Y axes, enable the Graph Editor, and useGraph API calls to further customize your graph.
24. Creating a Graph
Creating Reports With TIBCO® WebFOCUS Language 1801

For details on customizing graph headings and footings, see Using Headings, Footings, Titles,and Labels on page 1519.
Setting the Graph Height and Width
The width (or horizontal axis) of each graph, which includes any surrounding text, isautomatically set to 760 pixels. When setting the graph width, you should allow for theinclusion of any text required for the vertical axis and its labels along the left margin.
To maximize display space, you can limit the size of your labels through the use of either ASphrases or DECODE expressions.
The height (or vertical axis) of your graph is automatically set to 405 pixels.
The vertical axis is automatically set (VAUTO=ON) to cover the total range of plotted values.The height of the axis is set as high as possible (taking into consideration the presence of anyheadings or footings and the need to provide suitably rounded vertical class markers). Therange is divided into intervals called "classes." The scale is normalized to provide class valuesrounded to the appropriate multiples and powers of 10 for the intervals plotted on the axis.
Syntax: How to Set the Graph Width
SET HAXIS={nn|760}
where:
{nn|760}
Is a positive numeric value. The default is 760 pixels.
Note: The maximum HAXIS size for SVG graphs is 40 inches.
Syntax: How to Set the Graph Height
SET VAXIS={nn|400}
where:
{nn|400}
Is a positive numeric value. The default is 400 pixels.
Note: The maximum VAXIS size for SVG graphs is 40 inches.
Customizing Graphs Using SET Parameters
The GRAPH environment includes a set of parameters that control the appearance of the graphand offer some additional control when you run the request.
Applying Custom Styling to a Graph
1802

For example, the BSTACK parameter enables you to specify that the bars on a bar graph are tobe stacked rather than placed side by side.
Syntax: How to Use SET Parameters With GRAPH Requests
To set the parameters that control the GRAPH environment, use the appropriate variation ofthe SET parameter.
SET parameter=value,parameter=value...
For a list of supported GRAPH parameters, see Values and Functions of SET Parameters forGraphs on page 1803.
Note:
Repeat the command SET on each new line.
When entering more than one parameter on a line, separate them with commas.
You can use unique truncations of parameter names. You must make sure that they areunique.
Example: Using SET Parameters With GRAPH Requests
The following shows how to set the height (Y-axis) and width (X-axis) for a graph.
SET HAXIS=75,VAXIS=40GRAPH FILE filename ...END
Reference: Values and Functions of SET Parameters for Graphs
Graph SET Parameter Values Parameter Function
3D ON|OFF When ON, a three-dimensionalchart is produced. When OFF, atwo-dimensional chart isproduced. ON is the default.
24. Creating a Graph
Creating Reports With TIBCO® WebFOCUS Language 1803

Graph SET Parameter Values Parameter Function
AUTOTICK ON|OFF When ON, tick mark intervals areautomatically set. ON is thedefault. (See also HTICK andVTICK.)
BARNUMB ON|OFF When ON, places the summaryvalues at the ends of the barson bar graphs or slices on piegraphs. OFF is the default.
BSTACK ON|OFF When ON, specifies that thebars on a bar graph are to bestacked rather than placed sideby side. OFF is the default.
GRAPHEDIT graphedit As of WebFOCUS 8.0, thisparameter has been deprecated.
GRID ON|OFF When ON, specifies that a grid isto be drawn on the graph at thehorizontal and vertical classmarks (see also VGRID). OFF isthe default.
HAUTO ON|OFF When ON, specifies automaticscaling of the horizontal axisunless overridden by the user. IfOFF, user must supply values forHMAX and HMIN. ON is thedefault.
HAXIS Specifies the width in charactersof the horizontal axis. Thisparameter can be adjusted forgraphs generated offline. HAXISis ignored for online displayssince the width of the graph isautomatically adjusted to thewidth of the display area.
Applying Custom Styling to a Graph
1804

Graph SET Parameter Values Parameter Function
HCLASS nnn Specifies the horizontal intervalmark when AUTOTICK=OFF (seealso HTICK).
HISTOGRAM ON|OFF When ON, a histogram is drawninstead of a curve when valueson the horizontal axis are notnumeric. ON is the default.
HMAX nnn Specifies the maximum value onthe horizontal axis when theautomatic scaling is not used(HAUTO=OFF).
HMIN nnn Specifies the minimum value onthe horizontal axis when theautomatic scaling is not used(HAUTO=OFF).
HSTACK ON|OFF When ON, specifies that thebars on a histogram are to bestacked rather than placed sideby side. OFF is the default.
HTICK nnn Specifies the horizontal axis tickmark interval when AUTOTICK isOFF (see also HCLASS).
LOOKGRAPH option Specifies the graph type. Formore information, see Determining Graph Styles UsingLOOKGRAPH on page 1761.
PIE ON|OFF When ON, specifies that a piegraph is desired. OFF is thedefault.
24. Creating a Graph
Creating Reports With TIBCO® WebFOCUS Language 1805

Graph SET Parameter Values Parameter Function
VAUTO ON|OFF When ON, specifies automaticscaling of the vertical axisunless overridden by the user. IfOFF, the user must supplyvalues for VMAX and VMIN. ONis the default.
VAXIS Specifies page length in lines.This parameter can be adjustedfor graphs generated offline.VAXIS is ignored for onlinedisplays since the height of thegraph is automatically adjustedto the display area.
VCLASS nnn Specifies the vertical intervalmark when AUTOTICK=OFF (seealso VTICK).
VGRID ON|OFF When ON, specifies that a grid isto be drawn on the graph at thehorizontal and vertical classmarks (see also GRID). OFF isthe default.
VMAX nnn Specifies the maximum value onthe vertical axis when theautomatic scaling is not used(VAUTO=OFF).
VMIN nnn Specifies the minimum value onthe vertical axis when theautomatic scaling is not used(VAUTO=OFF).
VTICK nnn Specifies the vertical axis tickmark interval when AUTOTICK isOFF (see also VCLASS).
Applying Custom Styling to a Graph
1806

Graph SET Parameter Values Parameter Function
VZERO ON|OFF Determines whether valuesalong the Y-axis are stored orignored. If ON, missing dataalong the Y-axis is treated aszero. If OFF, missing data alongthe Y-axis is ignored and valuesare not stored in the plot matrix.OFF is the default.
Setting Fixed Scales for the X-Axis
The horizontal scale is automatically set to cover the total range of values to be plotted(HAUTO=ON). The range is divided into intervals called "classes." The scale is normalized toprovide class values rounded to the appropriate multiples of 10 for the intervals plotted on theaxis.
To assign fixed upper and lower limits (useful when producing a series of graphs whereconsistent scales are needed), you can turn off the automatic scaling mechanism and set newlimit values by setting HAUTO=OFF.
Syntax: How to Set Fixed Scales for the X-Axis
SET HAUTO=OFF, HMAX=nn, HMIN=nn
where:
HAUTO
Is the automatic scaling facility. If HAUTO is ON, any values for HMAX and HMIN areoverridden.
HMAX=nn
Sets the upper limit on the horizontal axis. The default is 0.
HMIN=nn
Controls the lower limit on the horizontal axis when HAUTO is OFF. The default is 0.
Note:
When entering several SET parameters on one line, separate them with commas.
24. Creating a Graph
Creating Reports With TIBCO® WebFOCUS Language 1807

If you define limits that do not incorporate all of the data values, OVER or UNDER will bedisplayed to indicate that some of the data extracted is not reflected on the graph.
Setting Fixed Scales for the Y-Axis
To give the vertical scale fixed upper and lower limits (useful when producing a series ofgraphs where consistent scales are needed), you can turn off the automatic scalingmechanism and set fixed limits using the SET VAUTO=OFF command.
Syntax: How to Set Fixed Scales for the Y-Axis
SET VAUTO=OFF, VMAX=nn, VMIN=nn
where:
VAUTO
Is the automatic scaling facility. If VAUTO is ON, any values for VMAX and VMIN areoverridden.
VMAX=nn
Sets the upper limit on the vertical axis when VAUTO is OFF. The default is 0.
VMIN=nn
Controls the lower limit on the vertical axis when VAUTO is OFF. The default is 0.
Note:
When entering several SET parameters on one line, separate them with commas.
If you define limits that do not incorporate all of the data values, OVER or UNDER will bedisplayed to indicate that some of the data extracted is not reflected on the graph.
Customizing Graphs Using the Graph API and HTML5 JSON Properties
You can further enhance your graph output by manually adding API calls inside the ON GRAPHSET STYLE * and ENDSTYLE commands in the GRAPH request. If you are creating an HTML5graph, you can also include JavaScript Object Notation (JSON) methods and properties. Whenyou save changes the corresponding API calls and properties will be written to the graphStyleSheet.
For reference information about the Graph API, see the WebFOCUS Graphics manual.
Applying Custom Styling to a Graph
1808
When you include both JSON and API calls in the StyleSheet section of the request, the APIcalls are parsed first, then the JSON. Therefore, if the JSON sets the same property as an APIcall, the JSON will take precedence. In general, the later declarations overwrite the propertiesset in earlier declarations.
Syntax: How to Customize a Graph Using the Graph API
GRAPH FILE filename graph commands ON GRAPH SET STYLE **GRAPH_SCRIPT API calls *END
*GRAPH_JS JSON *END
WEBFOCUS StyleSheet commands ENDSTYLEEND
where:
filename
Specifies a data source for the graph.
API calls
Are API calls. They must be included in a GRAPH_SCRIPT block within *GRAPH_SCRIPT and*END declarations. A request can contain multiple GRAPH_SCRIPT blocks anywhere withinthe style section. For reference information about the Graph API, see the WebFOCUSGraphics manual.
JSON
Are JSON methods and properties that apply to HTML5 graph output. They must beincluded in a GRAPH_JS block within *GRAPH_JS *END declarations. A request cancontain multiple GRAPH_JS blocks anywhere within the style section. For referenceinformation about the JSON methods and properties, see the Creating HTML5 Charts WithTIBCO WebFOCUS® Language manual.
WEBFOCUS StyleSheet commands
For details on StyleSheet commands, see Creating and Managing a WebFOCUS StyleSheeton page 1199.
24. Creating a Graph
Creating Reports With TIBCO® WebFOCUS Language 1809
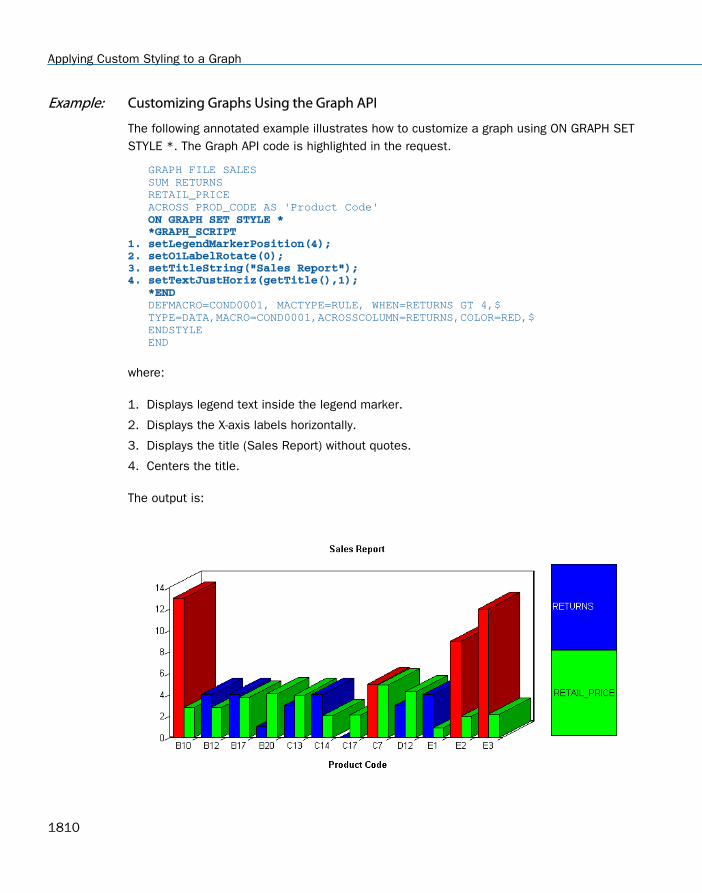
Example: Customizing Graphs Using the Graph API
The following annotated example illustrates how to customize a graph using ON GRAPH SETSTYLE *. The Graph API code is highlighted in the request.
GRAPH FILE SALES SUM RETURNS RETAIL_PRICE ACROSS PROD_CODE AS 'Product Code' ON GRAPH SET STYLE * *GRAPH_SCRIPT1. setLegendMarkerPosition(4);2. setO1LabelRotate(0);3. setTitleString("Sales Report");4. setTextJustHoriz(getTitle(),1); *END DEFMACRO=COND0001, MACTYPE=RULE, WHEN=RETURNS GT 4,$ TYPE=DATA,MACRO=COND0001,ACROSSCOLUMN=RETURNS,COLOR=RED,$ ENDSTYLE END
where:
1. Displays legend text inside the legend marker.
2. Displays the X-axis labels horizontally.
3. Displays the title (Sales Report) without quotes.
4. Centers the title.
The output is:
Applying Custom Styling to a Graph
1810

Saving a Graph as an Image File
You can save graph output to an image file using the GRAPHSERVURL parameter or theJSCOM3 configuration on the WebFOCUS Reporting Server. Saving graph output as an imagefile is useful when you want to create a single PDF or HTML report that contains multipleoutputs, such as output from a TABLE request and a GRAPH request. You can distribute thistype of report using ReportCaster.
For details, see Saving a Graph as an Image File Using GRAPHSERVURL on page 1811.
Saving a Graph as an Image File Using GRAPHSERVURL
The GRAPHSERVURL parameter enables users who are running against a server environmentwhere the WebFOCUS Reporting Server is installed on a z/OS, Windows, or UNIX machine tosave graph output as a GIF file. GIF images can be embedded in a PDF or HTML report.
The GRAPHSERVURL parameter sends an http request to the machine that has the WebFOCUSGraph Servlet. The graph image is created by the WebFOCUS Graph Servlet, and the image issent back to a temporary location on the WebFOCUS Reporting Server (if an Allocation has notbeen specified), or to the location specified in a FILEDEF command. You may use theAllocation Wizard to create a FILEDEF command.
Procedure: How to Save a Graph as an Image File Using GRAPHSERVURL
1. Install JDK as per the requirements in the TIBCO WebFOCUS® Installation and Configurationmanual for your platform.
2. Create a procedure that produces the image, and set GRAPHSERVURL in the procedure tothe URL that invokes the WebFOCUS Graph Servlet. For example,
SET GRAPHSERVURL=http://hostname/ibi_apps/IBIGraphServlet
where:
hostname
Is the name of the machine where WebFOCUS is installed.
For more details, see How to Save a Graph as an Image File on page 1812.
3. Run the procedure directly on the WebFOCUS Reporting Server, using a browser.
24. Creating a Graph
Creating Reports With TIBCO® WebFOCUS Language 1811
Syntax: How to Save a Graph as an Image File
[FILEDEF filename DISK drive:\...\filename.fmt]SET GRAPHSERVURL= graph_servlet_URL GRAPH FILE file graph commands ON GRAPH HOLD AS filename FORMAT fmt END
where:
FILEDEF
Saves the image file to the location you specify.
filename
Is the name you give the image file, which must match the FILEDEF command filename. Ifyou want to prompt for a filename, include an amper variable such as &FILENAME in theprocedure.
fmt
Is the type of image file in which to store the graph. Acceptable values are: PNG, SVG, GIF,or JPG.
graph_servlet_URL
Is the URL to invoke the WebFOCUS Graph Servlet. The maximum number of characters is256.
file
Is the name of the data source you wish to report against.
Note: To insert an image that resides in a permanent location, you must provide the fullyqualified path to the image file. For example, to insert a GIF file,
TYPE=REPORT, IMAGE=drive:\...\ filename.gif
where:
drive:\...\filename.gif
Is the path where the GIF file is located. The WebFOCUS Reporting server must beinstalled on that drive.
Saving a Graph as an Image File
1812

Example: Inserting a GIF Image Into a PDF Report
The following illustrates how you can create a GIF file from a graph request, and then embedthe GIF image into a PDF report.
1. Create the remote procedure in a location accessible to the EDA path or application path.For example, if you are running against your local server it may look like this:
SET GRAPHSERVURL= http://localhost/ibi_apps/IBIGraphServletGRAPH FILE CENTORDSUM LINEPRICEACROSS PLANTLNG AS 'Plant'ON GRAPH HOLD AS PLANT FORMAT GIFEND
TABLE FILE CENTORDSUM LINEPRICEBY PLANTLNG AS 'Plant'ON TABLE SET STYLE *TYPE=REPORT, IMAGE=plant.gif, POSITION=(4 0), SIZE=(5 3), $ENDSTYLEON TABLE PCHOLD FORMAT PDFEND
Note: If you are using JSCOM3, you can eliminate the SET GRAPHSERVURL parameter fromthe procedure.
2. Save the procedure as HOLDGIF.
3. Create an HTML file that calls the HOLDGIF WebFOCUS procedure from a hyperlink. Forexample,
<HTML><HEAD><TITLE> Inserting a GIF Image in a PDF Report </TITLE></HEAD><BODY><H4 ALIGN=CENTER>Report on Line Price by Plant</H4><HR><P><FONT SIZE=+2></FONT></P><UL TYPE=SQUARE<LI><A HREF="http://localhost/ibi_apps/WFServlet?IBIF_ex=holdgif"><H4 ALIGN=CENTER>Click Here to Launch a PDF Report with an Embedded GIF Image</H4></A></UL></BODY></HTML>
24. Creating a Graph
Creating Reports With TIBCO® WebFOCUS Language 1813

The resulting launch page looks like this:
You can now run the report from a browser. To distribute the report using ReportCaster, youwould schedule the actual procedure, in this case HOLDGIF, to distribute the report.
4. Click the link to run the report. The report looks like this:
Saving a Graph as an Image File
1814

Note: To run this procedure as a Managed Reporting Standard Report, add the -MRNOEDITcommand to the beginning of the StyleSheet declaration containing the IMAGE attribute. Thisprevents Managed Reporting from looking for the GIF file in the Managed Reporting Repository.The image that is specified must reside on the WebFOCUS Reporting Server.
The -MRNOEDIT syntax is not case-sensitive and it can be used on a single line or a block oflines. For example:
Single line
-MRNOEDIT TYPE=REPORT, IMAGE=PLANT.gif, POSITION=(4 0), SIZE=(5 3), $
or
-MRNOEDIT TYPE=REPORT, IMAGE=PLANT.gif,-MRNOEDIT POSITION=(4 0), SIZE=(5 3), $
Multiple lines
-MRNOEDIT BEGINTYPE=REPORT, IMAGE=PLANT.gif, POSITION=(4 0), SIZE=(5 3), $-MRNOEDIT END
Reference: Usage Notes for Saving a Graph
If you selected the Save Report check box in the configuration pane of the WebFOCUSAdministration Console (under Redirection Settings), you will be prompted whether to save oropen the output file. If the procedure contained a PCHOLD command that specified an ASname for the output file, the name is retained if you choose to save the file. If no AS namewas specified, a random filename is generated.
Important: You must do the following in the WebFOCUS Administration Console to utilize SaveReport functionality for WebFOCUS GRAPH requests (specified with a PNG, SVG, GIF, or JPGformat in the procedure):
Set Save Report to yes for the .htm Extension.
Running a server-side GRAPH request creates an HTM file that contains a link to the actualgraph output, which is stored as a temporary image file with a .jpg, .gif, .svg, or .pngextension.
When you execute a GRAPH request, if you select the Save option when prompted to Openor Save the output, the output is saved to an HTM file using only a reference to the graphimage, which will eventually expire and be deleted from the server (according to thetemporary file expiration settings in the WebFOCUS Client Configuration).
24. Creating a Graph
Creating Reports With TIBCO® WebFOCUS Language 1815

To preserve the output of the GRAPH request, open the saved HTM file, right-click the graphimage, and select Save Picture As to save it to disk permanently. You can then substitutean absolute reference to the saved image file in the returned HTM output file.
Click Save to save your changes in the Redirection Settings panel.
Printing a Graph
When you run your graph, you may print the output directly from the browser.
Note: If your graph labels or legends are not appearing correctly when you run your graph, see How to Change Color Settings on page 1816 for details on correcting this.
Procedure: How to Print Your Graph
1. Run your graph.
2. From the browser, select Print from the File menu.
Syntax: How to Send Graph Output Directly to a Printer
Add the following syntax to your GRAPH request:
ON GRAPH SET PRINT OFFLINE
Procedure: How to Change Color Settings
1. From the Windows Control Panel, select Display.
2. Click the Settings tab.
3. In the Color palette box, click the drop-down arrow and select True Color or High Color.
Note: If your version of Windows does not have these options, select 65536 or a highercolor count.
4. Click OK.
If you use different color settings from this recommended value, your graphs may appear ingrayscale format.
Printing a Graph
1816

Chapter25 Creating Financial Reports With FinancialModeling Language (FML)
The Financial Modeling Language (FML) is designed for the special needs associatedwith creating, calculating, and presenting financially oriented data, such as balancesheets, consolidations, or budgets. These reports are distinguished from other reportsbecause calculations are inter-row, as well as inter-column, and each row or linerepresents a unique entry or series of entries that can be aggregated directly from theinput data or calculated as a function of the data.
In this chapter:
Reporting With FML
Creating Rows From Data
Supplying Data Directly in a Request
Performing Inter-Row Calculations
Referring to Rows in Calculations
Referring to Columns in Calculations
Referring to Rows and Columns inCalculations
Referring to Cells in Calculations
Using Functions in RECAP Calculations
Inserting Rows of Free Text
Adding a Column to an FML Report
Creating a Recursive Model
Reporting Dynamically From a Hierarchy
Customizing a Row Title
Formatting an FML Report
Suppressing the Display of Rows
Saving and Retrieving IntermediateReport Results
Creating HOLD Files From FML Reports
Reporting With FML
FML is an integrated extension of the TABLE command. By adding the FOR phrase and theRECAP command, you can handle an expanded range of applications.
Note: MORE is not supported in FML requests.
In conjunction with Dialogue Manager, FML can evaluate "what if" scenarios and developcomplete decision support systems. These systems can take advantage of businessintelligence features, such as statistical analysis and graphics, in addition to standardfinancial statements.
Creating Reports With TIBCO® WebFOCUS Language 1817

Procedures using FML are not hard-wired to the data. As in any other report request, they caneasily be changed. FML includes the following facilities:
Row and column formatting. You can specify results in a row-by-row, column-by-columnfashion. For more information, see Performing Inter-Row Calculations on page 1831.
Intermediate results. You can post FML results to an external file and pick them up at alater time for analysis. This is useful when intermediate results are developed and a finalprocedure consolidates the results later. For more information, see Saving and RetrievingIntermediate Report Results on page 1894.
Inline data entry. FML enables you to specify constants from within the procedure, inaddition to the data values retrieved from your data source. For more information, see Supplying Data Directly in a Request on page 1829.
Recursive reporting. You can produce reports where the results from the end of one timeperiod or column become the starting balance in the next. For example, you can userecursive reports to produce a cash flow projection. For more information, see Creating aRecursive Model on page 1852.
Dynamic reporting from a chart of accounts or a similar hierarchy of information. You cancreate a report that changes as the organization of information changes, ensuring that youautomatically retrieve information that reflects the latest structure and its values. There isno need to alter either the Master File or the report request. For more information, see Reporting Dynamically From a Hierarchy on page 1853.
Example: Sample FML Request
This example produces a simple asset sheet, contrasting the results of two years. It illustratesmany key features of the Financial Modeling Language (FML). Numbers to the left of theprocedure lines correspond to explanations that follow the request.
Reporting With FML
1818

TABLE FILE FINANCE HEADING CENTER "COMPARATIVE ASSET SHEET </2" SUM AMOUNT ACROSS HIGHEST YEAR WHERE YEAR EQ '1983' OR '1982' 1. FOR ACCOUNT 2. 1000 AS 'UTILITY PLANT' LABEL UTP OVER 2. 1010 TO 1050 AS 'LESS ACCUMULATED DEPRECIATION' LABEL UTPAD OVER 3. BAR OVER 4. RECAP UTPNET = UTP-UTPAD; AS 'TOTAL PLANT-NET' OVER BAR OVER 2000 TO 3999 AS 'INVESTMENTS' LABEL INV OVER 5. "CURRENT ASSETS" OVER 4000 AS 'CASH' LABEL CASH OVER 5000 TO 5999 AS 'ACCOUNTS RECEIVABLE-NET' LABEL ACR OVER 6000 AS 'INTEREST RECEIVABLE' LABEL ACI OVER 6500 AS 'FUEL INVENTORY' LABEL FUEL OVER 6600 AS 'MATERIALS AND SUPPLIES' LABEL MAT OVER 6900 AS 'OTHER' LABEL MISC OVER BAR OVER RECAP TOTCAS=CASH+ACR+ACI+FUEL+MAT+MISC;AS 'TOTAL CURRENT ASSETS' OVER BAR OVER 7000 AS 'DEFERRED DEBITS' LABEL DEFDB OVER
BAR OVER 6. RECAP TOTAL = UTPNET+INV+TOTCAS+DEFDB; AS 'TOTAL ASSETS' OVER BAR AS '=' FOOTING "</2 *** PRELIMINARY ASSET SHEET BASED ON UNAUDITED FIGURES ***" END
1. FOR and OVER are FML phrases that enable you to structure the report on a row-by-rowbasis.
2. LABEL assigns a variable name to a row item for use in a RECAP calculation.
1000 and 1010 TO 1050 are tags that identify the data values of the FOR field, ACCOUNTin the FINANCE data source. A report row can be associated with a tag that represents asingle data value (like 1000), multiple data values, or a range of values (like 1010 TO1050).
3. BAR enables you to underline a column of numbers before performing a RECAP calculation.
4. The RECAP command creates a new value based on values already identified in the reportwith LABEL. In this case, the value UTPNET is derived from UTP and UTPAD and is renamedTOTAL PLANT-NET with an AS phrase to provide it with greater meaning in the report.
5. Free text can be incorporated at any point in an FML report, similar to underlines.
6. Notice that this RECAP command derives a total (TOTAL ASSETS) from values retrieveddirectly from the data source, and from values derived from previous RECAP computations(UTPNET and TOTCAS).
25. Creating Financial Reports With Financial Modeling Language (FML)
Creating Reports With TIBCO® WebFOCUS Language 1819

The output is shown as follows.
Creating Rows From Data
A normal TABLE request sorts rows of a report according to the BY phrase you use. The dataretrieved is sorted from either low-to-high or high-to-low, as requested. The rows may be limitedby a screening phrase to a specific subset, but:
They appear in a sort order.
Rows appear only for values that are retrieved from the file.
Creating Rows From Data
1820

You can only insert free text between rows when a sort field changes value, such as:
ON DIVISION SUBFOOT
You can only insert calculations between rows when a sort field changes value, such as:
ON DIVISION RECAP
In contrast, the FML FOR phrase creates a matrix in which you can structure your report row-by-row. This organization gives you greater control over the data that is incorporated into a report,and its presentation. You can:
Report on specific data values for a field in a data source and combine particular datavalues under a common label, for use in calculations.
Type data directly into the request to supplement data retrieved from the data source.
Include text, underlines, and calculations at points in the report that are not related to sortbreaks.
Perform recursive processing, in which the result of an interim calculation is saved andthen used as the starting point for a subsequent calculation.
Suppress the display of rows for which no data is retrieved.
Identify rows by labels and columns by numbers, addresses, and values so that you canpoint to the individual cells formed at each intersection (as on a spreadsheet).
Syntax: How to Retrieve FOR Field Values From a Data Source
The syntax for specifying rows is:
FOR fieldname [AS 'coltitle'] value [OR value OR...] [AS 'text'] [LABEL label] OVER...[value [OR value ...]] [AS 'text'] [LABEL label]END
where:
fieldname
Is the FOR field for the FML report.
coltitle
Is the column title for the FOR field on the report output.
25. Creating Financial Reports With Financial Modeling Language (FML)
Creating Reports With TIBCO® WebFOCUS Language 1821

value
Is the value (also known as a tag value) describing the data that is retrieved for this row ofthe report.
AS 'text'
Enables you to assign a name to a tag value, which replaces the tag value in the output.Enclose the text in single quotation marks.
label
Assigns a label to the row for reference in a RECAP expression. The label can be up to 66characters and cannot have blanks or special characters. Each explicit label you assignmust be unique.
Even if you assign an explicit label, the positional label (R1, R2, and so on) is retainedinternally.
By default, a tag value for a FOR field (like 1010) may be added only once to the FML matrix.However, if you wish to add the same value of a FOR field to the matrix more than once, youcan turn on the FORMULTIPLE parameter (the default setting is OFF). For more information, see How to Use the Same FOR Field Value in Multiple Rows on page 1826.
For more information about the FMLFOR, FMLLIST, and FMLINFO functions that return the tagvalues used in an FML request, see the TIBCO WebFOCUS® Using Functions manual.
Example: Creating Rows From Values in a Data Source
Assume you have a simple data source with financial data for each corporate account, asfollows:
CHART OF ACCOUNTS ACCOUNT DESCRIPTION 1010 CASH ON HAND1020 DEMAND DEPOSITS1030 TIME DEPOSITS1100 ACCOUNTS RECEIVABLE1200 INVENTORY. .. .. .
Using the FOR phrase in FML, you can issue the following TABLE request in which each valueof ACCOUNT is represented by a tag (1010, 1020, and so on), and displays as a separate row:
Creating Rows From Data
1822

TABLE FILE LEDGERSUM AMOUNTFOR ACCOUNT1010 OVER1020 OVER1030 OVER1100 OVER1200END
The output is shown as follows.
AMOUNT ------1010 8,7841020 4,4941030 7,9611100 18,8291200 27,307
Creating Rows From Multiple Records
There are different ways to combine multiple values from your data sources into an FML reportrow. You can use:
The OR phrase to sum the values of two or more tags in a single expression. For moreinformation, see How to Sum Values in Rows With the OR Phrase on page 1824.
The TO phrase to identify a range of tag values on which to report. For more information,see How to Identify a Range of Values With the TO Phrase on page 1825.
A mask to specify a group of tag values without having to name each one. For moreinformation, see How to Use Masking Characters to Retrieve Tag Values on page 1826.
By default, a FOR field value can only be included in a single row of an FML matrix. However, byturning on the FORMULTIPLE parameter, you can include the same data value in multiple rowsin the FML matrix. For example, the same value can exist as a solitary value in one row, bepart of a range in another row, and be used in a calculation in a third row. For moreinformation, see How to Use the Same FOR Field Value in Multiple Rows on page 1826.
In addition to these methods, you can extract multiple tags for a row from an external file.
25. Creating Financial Reports With Financial Modeling Language (FML)
Creating Reports With TIBCO® WebFOCUS Language 1823
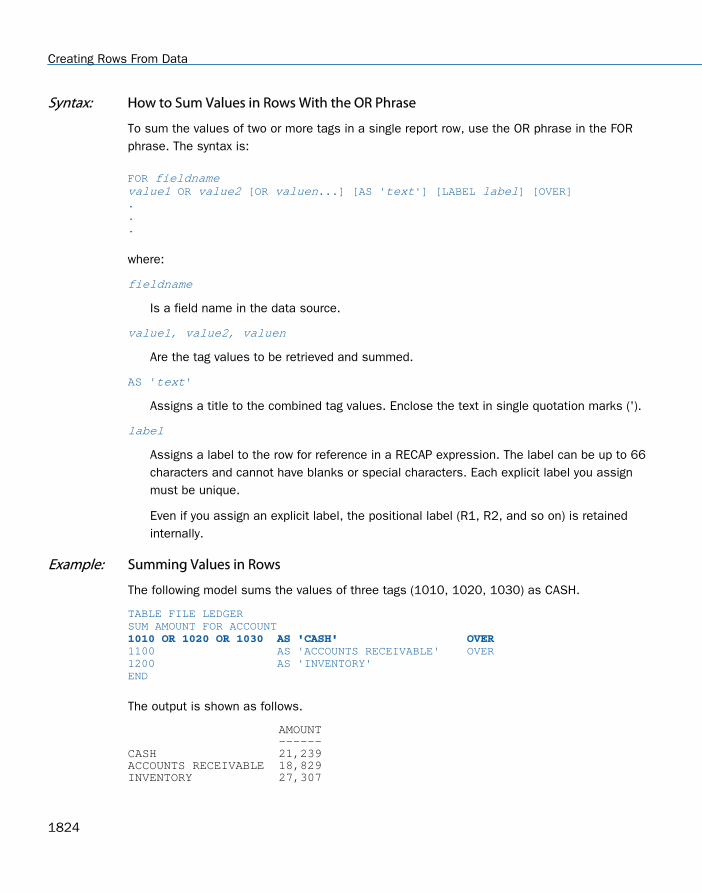
Syntax: How to Sum Values in Rows With the OR Phrase
To sum the values of two or more tags in a single report row, use the OR phrase in the FORphrase. The syntax is:
FOR fieldname value1 OR value2 [OR valuen...] [AS 'text'] [LABEL label] [OVER]...
where:
fieldname
Is a field name in the data source.
value1, value2, valuen
Are the tag values to be retrieved and summed.
AS 'text'
Assigns a title to the combined tag values. Enclose the text in single quotation marks (').
label
Assigns a label to the row for reference in a RECAP expression. The label can be up to 66characters and cannot have blanks or special characters. Each explicit label you assignmust be unique.
Even if you assign an explicit label, the positional label (R1, R2, and so on) is retainedinternally.
Example: Summing Values in Rows
The following model sums the values of three tags (1010, 1020, 1030) as CASH.
TABLE FILE LEDGERSUM AMOUNT FOR ACCOUNT 1010 OR 1020 OR 1030 AS 'CASH' OVER 1100 AS 'ACCOUNTS RECEIVABLE' OVER1200 AS 'INVENTORY'END
The output is shown as follows.
AMOUNT ------CASH 21,239ACCOUNTS RECEIVABLE 18,829INVENTORY 27,307
Creating Rows From Data
1824
Syntax: How to Identify a Range of Values With the TO Phrase
To sum the values of a range of tags in a single report row, use the TO phrase in the FORphrase. The syntax is:
FOR fieldname value1 TO value2 [AS 'text'] [LABEL label] [OVER]
where:
fieldname
Is a field name in the data source.
value1
Is the tag value at the lower limit of the range.
TO
Is the required phrase.
value2
Is the tag value at the upper limit of the range.
AS 'text'
Assigns a title to the combined tag values. Enclose the text in single quotation marks (').
label
Assigns a label to the row for reference in a RECAP expression. The label can be up to 66characters and cannot have blanks or special characters. Each explicit label you assignmust be unique.
Even if you assign an explicit label, the positional label (R1, R2, and so on) is retainedinternally.
Example: Identifying a Range of Values
Since CASH accounts in the LEDGER system are identified by the tags 1010, 1020, and 1030,you can specify the range 1010 to 1030:
TABLE FILE LEDGERSUM AMOUNT FOR ACCOUNT 1010 TO 1030 AS 'CASH' END
25. Creating Financial Reports With Financial Modeling Language (FML)
Creating Reports With TIBCO® WebFOCUS Language 1825

Syntax: How to Use Masking Characters to Retrieve Tag Values
If the tag field has a character (alphanumeric) format, you can perform a masked match. Usethe dollar sign character ($) as the mask. For instance,
A$$D
matches any four-character value beginning with A and ending with D. The two middle placescan be any character. This is useful for specifying a whole group of tag values without having toname each one.
Example: Using Masking Characters to Match a Group of Tags
In this example, the amounts associated with all four-character accounts that begin with 10,expressed with a mask as 10$$, are used to produce the CASH row of the report.
TABLE FILE LEDGERSUM AMOUNT FOR ACCOUNT 10$$ AS 'CASH' OVER 1100 AS 'ACCOUNTS RECEIVABLE' OVER1200 AS 'INVENTORY'END
The output is shown as follows.
AMOUNT ------CASH 21,239ACCOUNTS RECEIVABLE 18,829INVENTORY 27,307
Syntax: How to Use the Same FOR Field Value in Multiple Rows
You can use the same value of a FOR field in many separate rows (whether alone, as part of arange, or in a calculation) by including the following syntax before or within an FML request.
SET FORMULTIPLE={ON|OFF}
or
ON TABLE SET FORMULTIPLE {ON|OFF}
where:
ON
Enables you to reference the same value of a FOR field in more than one row in an FMLrequest.
With FORMULTIPLE set to ON, a value retrieved from the data source is included on everyline in the report output for which it matches the tag references.
Creating Rows From Data
1826

OFF
Does not enable you to include the same value in multiple rows. OFF is the default value.
With FORMULTIPLE set to OFF, multiple tags referenced in any of these ways (OR, TO, *)are evaluated first for an exact reference or for the end points of a range, then for a mask,and finally within a range. For example, if a value is specified as an exact reference andthen as part of a range, the exact reference is displayed. Note that the result isunpredictable if a value fits into more than one row whose tags have the same priority (forexample, an exact reference and the end point of a range).
For more information, see Reporting Dynamically From a Hierarchy on page 1853.
Example: Referencing the Same Value in More Than One Row
This request retrieves the tag values for accounts 1010, 1020, and 1030, and listscorresponding values individually. It then aggregates the same values and displays the sum asTOTAL CASH. Similarly, the tag values for accounts 1100 and 1200 displays as detail items,and then summarized as TOTAL NON-CASH ASSETS.
SET FORMULTIPLE=ON TABLE FILE LEDGERSUM AMOUNTFOR ACCOUNT 1010 AS 'CASH ON HAND' OVER 1020 AS 'DEMAND DEPOSITS' OVER 1030 AS 'TIME DEPOSITS' OVERBAR OVER 1010 OR 1020 OR 1030 AS 'TOTAL CASH' OVER " " OVER 1100 AS 'ACCOUNTS RECEIVABLE' OVER 1200 AS 'INVENTORY' OVERBAR OVER 1100 TO 1200 AS 'TOTAL NON-CASH ASSETS'END
The output is shown as follows.
AMOUNT ------CASH ON HAND 8,784DEMAND DEPOSITS 4,494TIME DEPOSITS 7,961 ------TOTAL CASH 21,239 ACCOUNTS RECEIVABLE 18,829INVENTORY 27,307 ------TOTAL NON-CASH ASSETS 46,136
25. Creating Financial Reports With Financial Modeling Language (FML)
Creating Reports With TIBCO® WebFOCUS Language 1827

Example: Using Tags From External Files
In this example, the values for a row of the FML report come from an external file calledCASHSTUF, which contains the following tags.
101010201030
The following TABLE request uses the tag values from the external file, summing the amountsin accounts 1010, 1020, and 1030 into the CASH row of the FML report.
TABLE FILE LEDGERSUM AMOUNT FOR ACCOUNT(CASHSTUF) AS 'CASH' OVER1100 AS 'ACCOUNTS RECEIVABLE'END
Notice that the file name must be enclosed in parentheses.
Using the BY Phrase in FML Requests
Only one FOR phrase is permitted in a TABLE request. It substitutes in part for a BY phrase,which controls the sort sequence. However, the request can also include up to 32 BY phrases.In general, BY phrases specify the major (outer) sort fields in FML reports, and the FOR phrasespecifies the minor (inner) sort field. Note that the BY ROWS OVER phrase is not supported ina request that uses the FOR phrase.
Creating Rows From Data
1828

Combining BY and FOR Phrases in an FML Request
In this example, the report results for ACCOUNT (the inner sort field) are sorted by REGION (theouter sort field).
DEFINE FILE REGIONCUR_YR=E_ACTUAL;LAST_YR=.831*CUR_YR;REGION/A4=IF E_ACTUAL NE 0 OR E_BUDGET NE 0 THEN 'EAST' ELSE 'WEST';END TABLE FILE REGIONHEADING CENTER"CURRENT ASSETS FOR REGION <REGION"" "SUM CUR_YR LAST_YR BY REGION NOPRINT FOR ACCOUNT 10$$ AS 'CASH' OVER1100 AS 'ACCOUNTS RECEIVABLE' OVER1200 AS 'INVENTORY' OVERBAR OVERRECAP CUR_ASSET/I5C = R1 + R2 + R3;END
The output is shown as follows.
CURRENT ASSETS FOR REGION EAST CUR_YR LAST_YR ------ -------CASH 9,511.00 7,903.64ACCOUNTS RECEIVABLE . .INVENTORY . . -------------- --------------CUR_ASSET 9,511 7,903
A sort field value can be used in a RECAP command to allow the model to take differentactions within each major sort break. For instance, the following calculation computes a non-zero value only for the EAST region.
RECAP X=IF REGION EQ 'EAST' THEN .25*CASH ELSE 0; AS 'AVAILABLE FOR DIVIDENDS'
For more information, see Performing Inter-Row Calculations on page 1831.
Supplying Data Directly in a Request
In certain cases, you may need to include additional constants (such as exchange rates orinflation rates) in your model. Not all data values for the model have to be retrieved from thedata source. Using FML, you can supply data directly in the request.
25. Creating Financial Reports With Financial Modeling Language (FML)
Creating Reports With TIBCO® WebFOCUS Language 1829

Syntax: How to Supply Data Directly in a Request
DATA value,[..., value],$ [AS 'text'] [LABEL label] OVER
where:
value
Specifies the values that you are supplying. Values in a list must be separated bycommas. The list must end with a comma and a dollar sign (,$).
AS 'text'
Enables you to assign a title to the data row. Enclose the text in single quotation marks.
Without this entry, the row title is blank on the report.
label
Assigns a name to the data row for use in RECAP calculations. The label can be up to 66characters and cannot have blanks or special characters. Each explicit label you assignmust be unique.
Example: Supplying Data Directly in a Request
In this example, two values (.87 and 1.67) are provided for the exchange rates of euros andpounds, respectively.
DEFINE FILE LEDGEREUROS/I5C=AMOUNT;POUNDS/I5C=3.2*AMOUNT;END TABLE FILE LEDGERSUM EUROS AS 'EUROPE,DIVISION'POUNDS AS 'ENGLISH,DIVISION'FOR ACCOUNT1010 AS 'CASH--LOCAL CURRENCY' LABEL CASH OVER DATA .87, 1.67 ,$ AS 'EXCHANGE RATE' LABEL EXCH OVER RECAP US_DOLLARS/I5C = CASH * EXCH;END
The values supplied are taken one column at a time for as many columns as the reportoriginally specified.
Supplying Data Directly in a Request
1830

The output is shown in the following image.
Performing Inter-Row Calculations
The RECAP command enables you to perform calculations on data in the rows of the report toproduce new rows. You must supply the name and format of the value that results from thecalculation, and an expression that defines the calculation you wish to perform. Since RECAPcalculations are performed among rows, each row in the calculation must be uniquelyidentified. FML supplies default row labels for this purpose (R1, R2, and so on). However, youmay assign more meaningful labels. For more information, see Referring to Rows inCalculations on page 1832.
Syntax: How to Define Inter-Row Calculations
RECAP calcname[/format]=expression; [AS 'text']
where:
RECAP
Is the required command name. It should begin on a line by itself.
calcname
Is the name you assign to the calculated value. The name can be up to 66 characterslong, and must start with an alphabetic character. This name also serves as an explicitlabel. For more information, see Referring to Rows in Calculations on page 1832.
format
Is the USAGE format of the calculated value. It cannot exceed the column width. Thedefault is the format of the column in which the calculated value is displayed.
expression
Can be any calculation available with the DEFINE command (including IF ... THEN ... ELSEsyntax, functions, excluding DECODE and EDIT, and fields in date format). The expressionmay extend to as many lines as it requires. A semicolon is required at the end of theexpression. For more information, see Using Functions in RECAP Calculations on page1845 and the TIBCO WebFOCUS® Using Functions manual.
25. Creating Financial Reports With Financial Modeling Language (FML)
Creating Reports With TIBCO® WebFOCUS Language 1831
The expression can include references to specific rows using the default FML positionallabels (R1, R2, and so on), or it can refer to rows, columns, and cells using a variety offlexible notation techniques. Note that Rn references can only be used for rows previouslyevaluated within the model. For more information, see Referring to Rows in Calculations onpage 1832, Referring to Columns in Calculations on page 1835, and Referring to Cells inCalculations on page 1843.
AS 'text'
Changes the default title of the row. By default, the name of the RECAP value is displayedas the row title in output. The AS phrase replaces the default. Enclose the text in singlequotation marks.
Reference: Usage Notes for RECAP
RECAP expressions refer to other rows in the model by their labels (either explicit ordefault). Labels referred to in a RECAP expression must also be specified in the reportrequest.
The format specified for the RECAP result overrides the format of the column. In thefollowing example,
RECAP TOTVAL/D6.2S=IF R1 GT R4 THEN R4 ELSE R1;AS 'REDUCED VALUE'
TOTVAL/D6.2S displays the result as six positions with two decimal places (and displaysblanks if the value was zero) in each column of the report, regardless of the format of thedata in the column. This feature can be used to display percentages in a column of wholenumbers.
Subtotals are not supported in FML.
In environments that support the RETYPE command, note that RETYPE does not recognizelabels in FML with field format redefinition.
Rn references (default positional row labels) can only be used for rows previously evaluatedwithin the model.
Referring to Rows in Calculations
FML assigns a default positional label to each TAG, DATA, RECAP, and PICKUP row. Thesepositional labels are automatically prefixed with the letter R, so that the first such row in themodel is R1, the second is R2, and so on. You can use these labels to refer to rows in RECAPexpressions.
Referring to Rows in Calculations
1832

Note: Default labels are not assigned to rows that contain underlines, blank lines, or free text,since these row types need not be referenced in expressions.
When you refer to rows in a RECAP expression, you can:
Use the positional row label assigned by FML.
Create an explicit row label of your own.
Note: You should not create an explicit label with a name of the form Rn, as that type ofname is used for default positional row labels assigned by FML and may cause problemswith subsequent RECAPs.
Mix positional and explicit row labels.
If you assign an explicit label, the positional label (R1, R2, and so on) is retained internally.
Note that an explicit label is not needed for a RECAP row, because the name of the calculatedvalue on the left of the equal sign can be used as a label.
In addition to their role in RECAP calculations, you can use labels to format rows in an FMLreport. For more information, see Formatting an FML Report on page 1871.
Syntax: How to Assign an Explicit Row Label
rowtype [AS 'text'] LABEL label [OVER]
where:
rowtype
Can be a TAG, DATA, or PICKUP row.
AS 'text'
Assigns a different name to the row for the report. Enclose the text in single quotationmarks (').
label
Assigns a label to a row for reference in a RECAP expression or a StyleSheet declaration.The label can be up to 66 characters and cannot have blanks or special characters. Eachexplicit label you assign must be unique.
Note: You should not create an explicit label with a name of the form Rn, as that type ofname is used for default positional row labels assigned by FML and may cause problemswith subsequent RECAPs.
25. Creating Financial Reports With Financial Modeling Language (FML)
Creating Reports With TIBCO® WebFOCUS Language 1833

Even if you assign an explicit label, the positional label (R1, R2, and so on) is retainedinternally.
Example: Referring to Default Row Labels in RECAP Expressions
In this example, FML assigns account 1010 the implicit label R1, account 1020, the implicitlabel R2, and account 1030, the implicit label R3. Since no label is assigned to a BAR row, theRECAP row is assigned the implicit label R4.
TABLE FILE LEDGERSUM AMOUNT FOR ACCOUNT1010 AS 'CASH ON HAND' OVER1020 AS 'DEMAND DEPOSITS' OVER1030 AS 'TIME DEPOSITS' OVERBAR OVER RECAP TOTCASH = R1 + R2 + R3; AS 'TOTAL CASH' END
The output is shown as follows.
AMOUNT ------CASH ON HAND 8,784DEMAND DEPOSITS 4,494TIME DEPOSITS 7,961 ------TOTAL CASH 21,239
Referring to Explicit Row Labels in RECAP Expressions
The following request assigns the labels CA, AR, and INV to three tag rows, which arereferenced in the RECAP expression.
TABLE FILE LEDGERSUM AMOUNT FOR ACCOUNT10$$ AS 'CASH' LABEL CA OVER1100 AS 'ACCOUNTS RECEIVABLE' LABEL AR OVER1200 AS 'INVENTORY' LABEL INV OVERBAR OVER RECAP CURASST/I5C = CA + AR + INV; END
The output is shown as follows.
AMOUNT ------CASH 21,239ACCOUNTS RECEIVABLE 18,829INVENTORY 27,307 ------CURASST 67,375
Note that the RECAP value could subsequently be referred to by the name CURASST, whichfunctions as an explicit label.
Referring to Rows in Calculations
1834

Using Labels to Repeat Rows
In certain cases, you may wish to repeat an entire row later in your report. For example, theCASH account can appear in the Asset statement and Cash Flow statement of a financialanalysis, as shown below.
TABLE FILE LEDGERSUM AMOUNT FOR ACCOUNT"ASSETS" OVER10$$ AS 'CASH' LABEL TOTCASH OVER.."CASH FLOW" OVERRECAP SAMECASH/I5C = TOTCASH; AS 'CASH'END
When you refer to the CASH row the second time, you can use a RECAP calculation (with a newname) and refer to the label, either explicitly (TOTCASH) or implicitly (R1), in the row whereCASH was first used.
Tip: If you set the FORMULTIPLE parameter ON, you can repeat the row without giving itanother name. For more information, see Creating Rows From Multiple Records on page 1823.
Referring to Columns in Calculations
An FML report can refer to explicit columns, as well as explicit rows. You can refer to columnsusing:
Column numbers.
Contiguous column notation in RECAP expressions. For example, (2,5) represents columns2 through 5.
Column addressing.
A factor to represent every other column, or every third column, and so on.
Column notation to control the creation of column reference numbers.
Column values.
Example: Applying Column Declarations in RECAP Expressions
The following request generates an FML matrix with four rows and three columns of data.
25. Creating Financial Reports With Financial Modeling Language (FML)
Creating Reports With TIBCO® WebFOCUS Language 1835

DEFINE FILE LEDGERCUR_YR/I5C=AMOUNT;LAST_YR/I5C=.87*CUR_YR - 142;END TABLE FILE LEDGERSUM CUR_YR AS 'CURRENT,YEAR' LAST_YR AS 'LAST,YEAR'COMPUTE CHANGE/I5C = CUR_YR - LAST_YR;FOR ACCOUNT1010 AS 'CASH ON HAND' OVER1020 AS 'DEMAND DEPOSITS' OVER1030 AS 'TIME DEPOSITS' OVERBAR OVER RECAP TOTCASH/I5C = R1 + R2 + R3; AS 'TOTAL CASH' END
Both the columns of the report, as well as the cells of the matrix, can be referenced in anotherFML report.
The output is shown in the following image.
For example, you could use the value 6,499 in another FML report by referring to column 2,row 3. For more information, see Referring to Cells in Calculations on page 1843.
Referring to Column Numbers in Calculations
You can perform a calculation for one column or for a specific set of columns. To identify thecolumns, place the column number in parentheses after the label name.
Referring to Columns in Calculations
1836
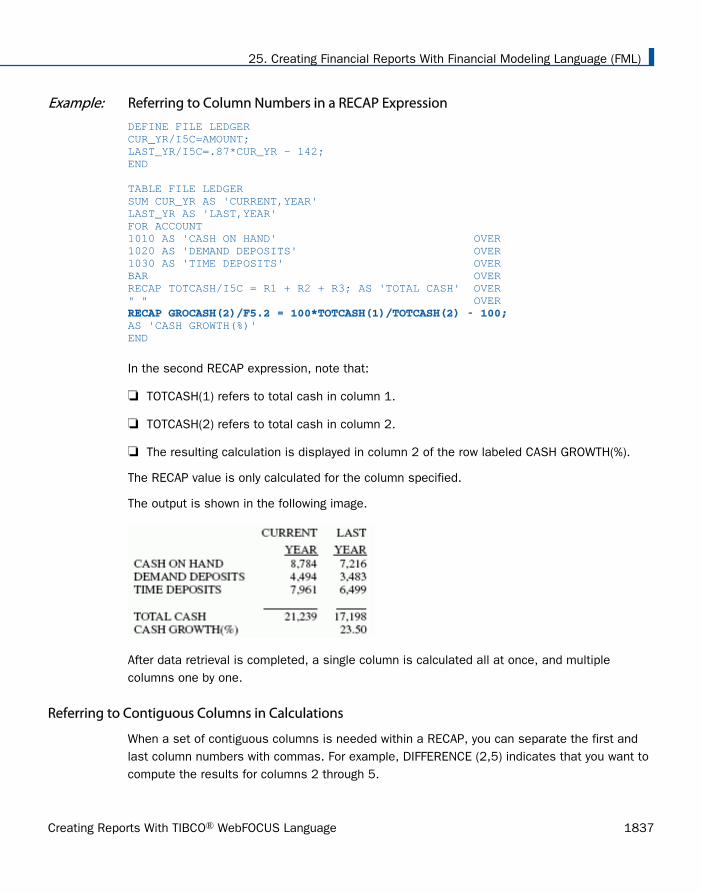
Example: Referring to Column Numbers in a RECAP Expression
DEFINE FILE LEDGERCUR_YR/I5C=AMOUNT;LAST_YR/I5C=.87*CUR_YR - 142;END TABLE FILE LEDGERSUM CUR_YR AS 'CURRENT,YEAR'LAST_YR AS 'LAST,YEAR'FOR ACCOUNT1010 AS 'CASH ON HAND' OVER1020 AS 'DEMAND DEPOSITS' OVER1030 AS 'TIME DEPOSITS' OVERBAR OVERRECAP TOTCASH/I5C = R1 + R2 + R3; AS 'TOTAL CASH' OVER" " OVER RECAP GROCASH(2)/F5.2 = 100*TOTCASH(1)/TOTCASH(2) - 100; AS 'CASH GROWTH(%)'END
In the second RECAP expression, note that:
TOTCASH(1) refers to total cash in column 1.
TOTCASH(2) refers to total cash in column 2.
The resulting calculation is displayed in column 2 of the row labeled CASH GROWTH(%).
The RECAP value is only calculated for the column specified.
The output is shown in the following image.
After data retrieval is completed, a single column is calculated all at once, and multiplecolumns one by one.
Referring to Contiguous Columns in Calculations
When a set of contiguous columns is needed within a RECAP, you can separate the first andlast column numbers with commas. For example, DIFFERENCE (2,5) indicates that you want tocompute the results for columns 2 through 5.
25. Creating Financial Reports With Financial Modeling Language (FML)
Creating Reports With TIBCO® WebFOCUS Language 1837

Example: Recapping Over Contiguous Columns
In this example, the RECAP calculation for ATOT occurs only for columns 2 and 3, as specifiedin the request. No calculation is performed for column 1.
DEFINE FILE LEDGERCUR_YR/I5C=AMOUNT;LAST_YR/I5C=.87*CUR_YR - 142;NEXT_YR/I5C=1.13*CUR_YR + 222;END TABLE FILE LEDGERSUM NEXT_YR CUR_YR LAST_YRFOR ACCOUNT10$$ AS 'CASH' OVER1100 AS 'ACCOUNTS RECEIVABLE' OVER1200 AS 'INVENTORY' OVERBAR OVER RECAP ATOT(2,3)/I5C = R1 + R2 + R3; AS 'ASSETS--ACTUAL'END
The output is shown in the following image.
Referring to Column Addresses in Calculations
When you need a calculation for every other or every third column instead of every column, youcan supply a factor, or column address, to do this. Column addressing is useful when severaldata fields are displayed within each value of a column sort.
Syntax: How to Use Column Addressing in a RECAP Expression
The left-hand side of the expression has the form:
value(s,e,i)[/format]=
where:
value
Is the name you assign to the result of the RECAP calculation.
s
Is the starting column.
Referring to Columns in Calculations
1838

e
Is the ending column (it may be * to denote all columns).
i
Is the increment factor.
format
Is the USAGE format of the calculated value. The default value is the format of the originalcolumn.
Example: Applying Column Addressing in a RECAP Expression
In the following statement, there are two columns for each month:
SUM ACTUAL AND FORECAST ACROSS MONTH
If you want to perform a calculation only for the ACTUAL data, control the placement of theresults with a RECAP in the form:
RECAP calcname(1,*,2)=expression;
The asterisk means to continue the RECAP for all odd-numbered columns (beginning in column1, with an increment of 2, for all columns).
Referring to Relative Column Addresses in Calculations
A calculation can use a specific column as a base, and refer to all other columns by theirdisplacement from that column. The column to the left of the base column has a displacementof -1 relative to the base column. The column to the right has a displacement of +1. Forexample,
COMP=FIX(*)-FIX(*-1);
can refer to the change in fixed assets from one period to the next. The reference toCOMP=FIX(*) is equivalent to COMP=FIX.
When referring to a prior column, the column must already have been retrieved, or its value iszero.
25. Creating Financial Reports With Financial Modeling Language (FML)
Creating Reports With TIBCO® WebFOCUS Language 1839

Applying Relative Column Addressing in a RECAP Expression
This example computes the change in cash (CHGCASH) for columns 1 and 2.
DEFINE FILE LEDGERCUR_YR/I5C=AMOUNT;LAST_YR/I5C=.87*CUR_YR - 142;NEXT_YR/I5C=1.13*CUR_YR + 222;END TABLE FILE LEDGERSUM NEXT_YR CUR_YR LAST_YRFOR ACCOUNT10$$ AS 'TOTAL CASH' LABEL TOTCASH OVER" " OVER RECAP CHGCASH(1,2)/I5SC = TOTCASH(*) - TOTCASH(*+1); AS 'CHANGE IN CASH' END
The output is shown in the following image.
Controlling the Creation of Column Reference Numbers
Column notation assigns a sequential column number to each column in the internal matrixcreated for a report request. If you want to control the creation of column reference numbersfor the columns that are used in your report, use the CNOTATION column notation command.
Because column numbers refer to columns in the internal matrix, they are assigned afterretrieval and aggregation of data are completed. Columns created and displayed in a report arestored in the internal matrix, and columns that are not displayed in a report may also begenerated and stored in the internal matrix. Columns stored in the internal matrix includecalculated values, reformatted field values, BY fields, fields with the NOPRINT option, andcertain RECAP calculations such as FORECAST and REGRESS. Every other column in theinternal matrix is assigned a column number by default, which means you have to account forall internally generated columns, if you want to refer to the appropriate column value in yourrequest.
You can change the default assignment of column reference numbers by using the SETCNOTATION=PRINTONLY command which assigns column numbers only to columns thatdisplay in the report output. You can use column notation in COMPUTE and RECAP commandsto refer to these columns in your request.
Referring to Columns in Calculations
1840
Syntax: How to Control the Creation of Column Reference Numbers
SET CNOTATION={ALL|PRINTONLY|EXPLICIT}
where:
ALL
Assigns column reference numbers to every column in the internal matrix. ALL is thedefault value.
PRINTONLY
Assigns column reference numbers only to columns that display in the report output.
EXPLICIT
Assigns column reference numbers to all fields referenced in the request, whetherdisplayed or not.
Note: CNOTATION is not supported in an ON TABLE phrase.
Referring to Column Values in Calculations
When a report is sorted using the ACROSS phrase, all of the retrieved values are aligned undertheir appropriate columns. Each column has a title consisting of one value of the ACROSSfield. The entire column of data can be addressed by this value in a RECAP calculation.
Example: Referring to a Column by Its Value in a RECAP Expression
The following request uses a factor that depends on the value of the ACROSS field (YEAR) tocalculate the inventory cost for each year. It then calculates the profit by summing the assetsand subtracting the inventory cost for each year.
TABLE FILE LEDGERSUM AMOUNT ACROSS YEARFOR ACCOUNT10$$ AS 'CASH' LABEL CASH OVER1100 AS 'ACCOUNTS RECEIVABLE' LABEL RECEIVE OVERBAR OVER1200 AS 'INVENTORY VALUE' LABEL INVENT OVER RECAP INVENTORY_FACTOR/F5.2 = IF YEAR LT '1986' THEN 1.1 ELSE 1.25; AS 'INVENTORY COST FACTOR' OVER RECAP INVENTORY_COST = INVENTORY_FACTOR * INVENT; AS 'INVENTORY COST' OVERBAR OVERRECAP PROFIT = CASH + RECEIVE - INVENTORY_COST;END
25. Creating Financial Reports With Financial Modeling Language (FML)
Creating Reports With TIBCO® WebFOCUS Language 1841

The output is shown in the following image.
Referring to Rows and Columns in Calculations
You can style multiple RECAP commands in a matrix when the RECAP statements are placedafter the last ACROSS value.
Referring to Rows and Columns in Calculations
1842

Example: Styling Multiple RECAP Statements in a Matrix
TABLE FILE GGSALESSUM UNITSBY PRODUCTACROSS REGIONRECAPTTL1/I8 = C1+C2+C3+C4;TTL2/D12.2 = TTL1*1.25;
ON TABLE SET STYLE *TYPE=DATA, COLUMN=TTL1 (*), COLOR=BLUE, BACKCOLOR=SILVER, STYLE=BOLD, $TYPE=DATA, COLUMN=TTL2 (*), COLOR=RED, BACKCOLOR=AQUA, STYLE=BOLD, $ENDSTYLEEND
The output is shown in the following image.
Referring to Cells in Calculations
You can refer to columns and rows using a form of cell notation that identifies the intersectionof a row and a column as (r, c).
25. Creating Financial Reports With Financial Modeling Language (FML)
Creating Reports With TIBCO® WebFOCUS Language 1843

Syntax: How to Use Cell Notation for Rows and Columns in a RECAP Expression
A row and column can be addressed in an expression by the notation:
E(r,c)
where:
E
Is a required constant.
r
Is the row number.
c
Is the column number. Use an asterisk (*) to indicate the current column.
Example: Referring to Columns Using Cell Notation in a RECAP Expression
In this request, two RECAP expressions derive VARIANCEs (EVAR and WVAR) by subtractingvalues in four columns (1, 2, 3, 4) in row three (PROFIT). These values are identified using cellnotation (r,c).
TABLE FILE REGIONSUM E_ACTUAL E_BUDGET W_ACTUAL W_BUDGETFOR ACCOUNT3000 AS 'SALES' OVER3100 AS 'COST' OVERBAR OVERRECAP PROFIT/I5C = R1 - R2; OVER" " OVER RECAP EVAR(1)/I5C = E(3,1) - E(3,2); AS 'EAST--VARIANCE' OVER RECAP WVAR(3)/I5C = E(3,3) - E(3,4); AS 'WEST--VARIANCE' END
The output is shown as follows.
E_ACTUAL E_BUDGET W_ACTUAL W_BUDGET -------- -------- -------- --------SALES 6,000 4,934 7,222 7,056COST 4,650 3,760 5,697 5,410 ------ ------ ------ ------PROFIT 1,350 1,174 1,525 1,646 EAST--VARIANCE 176 WEST--VARIANCE -121
Referring to Cells in Calculations
1844
Note: In addition to illustrating cell notation, this example demonstrates the use of columnnumbering. Notice that the display of the EAST and WEST VARIANCEs in columns 1 and 3,respectively, are controlled by the numbers in parentheses in the request: EVAR (1) and WVAR(3).
Using Functions in RECAP Calculations
You may provide your own calculation routines in RECAP rows to perform special-purposecalculations, a useful feature when these calculations are mathematically complex or requireextensive look-up tables.
User-written functions are coded as subroutines in any language that supports a call process,such as FORTRAN, COBOL, PL/1, and BAL. For information about creating your own functions,see the TIBCO WebFOCUS® Using Functions manual.
Syntax: How to Call a Function in a RECAP Command
RECAP calcname[(s,e,i)][/format]=function (input1,...,inputn,'format2');
where:
calcname
Is the name you assign to the calculated value.
(s,e,i)
Specify a start (s), end (e), and increment (i) value for the column where you want thevalue displayed. If omitted, the value appears in all columns.
format
The format for the calculation is optional. The default is the format of the column. If thecalculation consists of only the subroutine, make sure that the format of the subroutineoutput value (format2) agrees with the calculation format. If the calculation format is largerthan the column width, the value displays in that column as asterisks (*).
function
Is the name of the function, up to eight characters long. It must be different from any rowlabel and cannot contain any of the following special characters:
= -, / ()
25. Creating Financial Reports With Financial Modeling Language (FML)
Creating Reports With TIBCO® WebFOCUS Language 1845

input1, inputn
Are the input arguments for the call to the function. They may include numeric constants,alphanumeric literals, row and column references notation, E notation, or labels, or namesof other RECAP calculations.
Make sure that the values being passed to the function agree in number and type with thearguments as coded in the function.
format2
Is the format of the return value, which must be enclosed in single quotation marks.
Example: Calling a Function in a RECAP Command
Suppose you have a function named INVEST in your private collection of functions (INVEST isnot available in the supplied library), and it calculates an amount on the basis of cash onhand, total assets, and the current date. In order to create a report that prints an account ofcompany assets and calculates how much money the company has available to invest, youmust create a report request that invokes the INVEST function.
The current date is obtained from the &YMD system variable. The NOPRINT option beside itprevents the date from appearing in the report. The date is solely used as input for the nextRECAP statement.
Using Functions in RECAP Calculations
1846
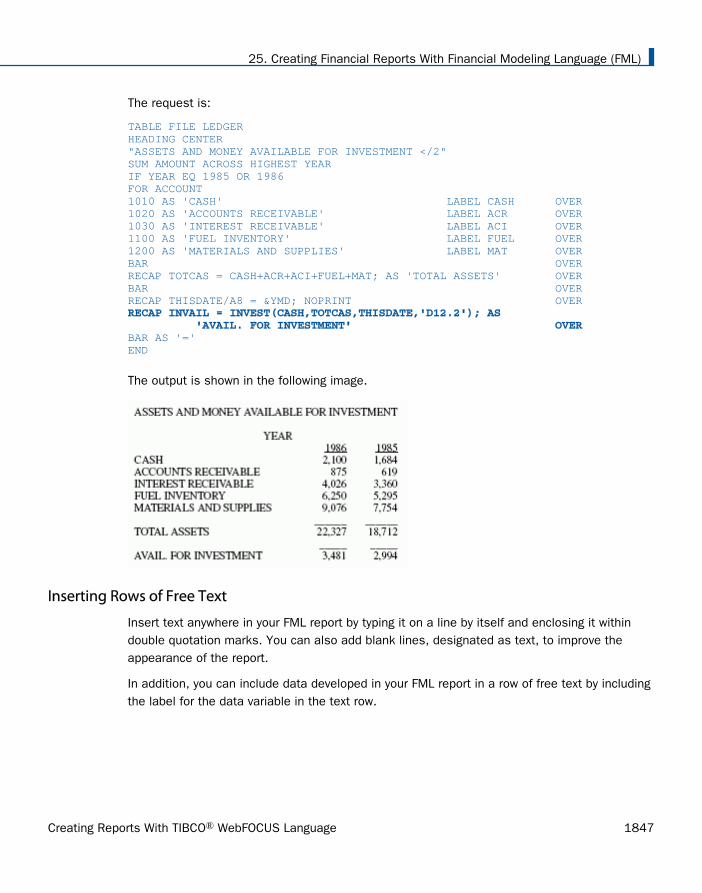
The request is:
TABLE FILE LEDGERHEADING CENTER"ASSETS AND MONEY AVAILABLE FOR INVESTMENT </2"SUM AMOUNT ACROSS HIGHEST YEARIF YEAR EQ 1985 OR 1986FOR ACCOUNT1010 AS 'CASH' LABEL CASH OVER1020 AS 'ACCOUNTS RECEIVABLE' LABEL ACR OVER1030 AS 'INTEREST RECEIVABLE' LABEL ACI OVER1100 AS 'FUEL INVENTORY' LABEL FUEL OVER1200 AS 'MATERIALS AND SUPPLIES' LABEL MAT OVERBAR OVERRECAP TOTCAS = CASH+ACR+ACI+FUEL+MAT; AS 'TOTAL ASSETS' OVERBAR OVERRECAP THISDATE/A8 = &YMD; NOPRINT OVER RECAP INVAIL = INVEST(CASH,TOTCAS,THISDATE,'D12.2'); AS 'AVAIL. FOR INVESTMENT' OVER BAR AS '='END
The output is shown in the following image.
Inserting Rows of Free Text
Insert text anywhere in your FML report by typing it on a line by itself and enclosing it withindouble quotation marks. You can also add blank lines, designated as text, to improve theappearance of the report.
In addition, you can include data developed in your FML report in a row of free text by includingthe label for the data variable in the text row.
25. Creating Financial Reports With Financial Modeling Language (FML)
Creating Reports With TIBCO® WebFOCUS Language 1847

Example: Inserting Free Text
In this example, three rows of free text are inserted, one blank and two text rows.
TABLE FILE LEDGERSUM AMOUNT FOR ACCOUNT " --- CASH ACCOUNTS ---" OVER 1010 AS 'CASH ON HAND' OVER1020 AS 'DEMAND DEPOSITS' OVER1030 AS 'TIME DEPOSITS' OVER" " OVER " --- OTHER CURRENT ASSETS ---" OVER 1100 AS 'ACCOUNTS RECEIVABLE' OVER1200 AS 'INVENTORY'END
The output is shown as follows.
AMOUNT ------ --- CASH ACCOUNTS --- CASH ON HAND 8,784 DEMAND DEPOSITS 4,494 TIME DEPOSITS 7,961 --- OTHER CURRENT ASSETS ---ACCOUNTS RECEIVABLE 18,829 INVENTORY 27,307
Notice that the blank row was created by enclosing a blank within double quotation marks on aseparate line of the report request.
Syntax: How to Insert Data Variables in Text Rows
"text <label[(c)][>]"
where:
<
Is a required left caret to bracket the label.
label
Is the explicit or implicit row label. (In a RECAP, the calculated value functions as thelabel.)
c
Is an optional cell identifier that indicates the column number of the cell. However, thisidentifier is required whenever there is more than one column in the report. If you use it,enclose it in parentheses.
Inserting Rows of Free Text
1848

>
Is an optional right caret that can be used to make the positioning clearer.
Example: Inserting a Data Variable in a Text Row
In this example, the RECAP value CURASST is suppressed by the NOPRINT command, andinserted instead as a data variable in the text row.
SET PAGE-NUM=OFFTABLE FILE LEDGERSUM AMOUNT FOR ACCOUNT10$$ AS 'Cash' LABEL CA OVER1100 AS 'Accounts Receivable' LABEL AR OVER1200 AS 'Inventory' LABEL INV OVERRECAP CURASST/I5C = CA + AR + INV; NOPRINT OVER "Current Assets: <CURASST" END
The output is shown in the following image.
AMOUNT ------Cash 21,239Accounts Receivable 18,829Inventory 27,307Current Assets: 67,375
Adding a Column to an FML Report
The request controls the number of columns in any report. For instance, if a request containsthe display command SUM AMOUNT AND FORECAST, the report contains two columns:AMOUNT and FORECAST.
Add columns in an FML request, just as in a TABLE request, using the COMPUTE command tocalculate a value or simply to allocate the space, column title, and format for a column.
Example: Adding a Column to an FML Report
This example uses a COMPUTE command to generate the calculated value CHANGE anddisplay it as a new column in the FML report. The following request generates an FML matrixwith four rows and three columns of data.
25. Creating Financial Reports With Financial Modeling Language (FML)
Creating Reports With TIBCO® WebFOCUS Language 1849

DEFINE FILE LEDGERCUR_YR/I5C=AMOUNT;LAST_YR/I5C=.87*CUR_YR - 142;END TABLE FILE LEDGERSUM CUR_YR AS 'CURRENT,YEAR' LAST_YR AS 'LAST,YEAR' COMPUTE CHANGE/I5C = CUR_YR - LAST_YR; FOR ACCOUNT1010 AS 'CASH ON HAND' OVER1020 AS 'DEMAND DEPOSITS' OVER1030 AS 'TIME DEPOSITS' OVERBAR OVERRECAP TOTCASH/I5C = R1 + R2 + R3; AS 'TOTAL CASH'END
The output is shown in the following image.
Note: The designated calculation is performed on each tag or RECAP row of the report. TheRECAP rows, however, may change the calculation.
Adding a New Time Period as a Column
The following request adds a future time period to a report.
DEFINE FILE LEDGERCUR_YR/P5C=AMOUNT;LAST_YR/P5C=.87*AMOUNT - 142;END TABLE FILE LEDGERSUM AMOUNT ACROSS YEAR AND COMPUTE 1999/P5C = 2.5*AMOUNT; FOR ACCOUNT1010 AS 'CASH ON HAND' OVER1020 AS 'DEMAND DEPOSITS' OVER1030 AS 'TIME DEPOSITS' OVERBAR OVERRECAP TOTCASH/P5C = R1 + R2 + R3; AS 'TOTAL CASH' OVERRECAP CHANGE(2,*) = TOTCASH(*) - TOTCASH(*-1);END
Adding a Column to an FML Report
1850

The output is shown as follows.
25. Creating Financial Reports With Financial Modeling Language (FML)
Creating Reports With TIBCO® WebFOCUS Language 1851
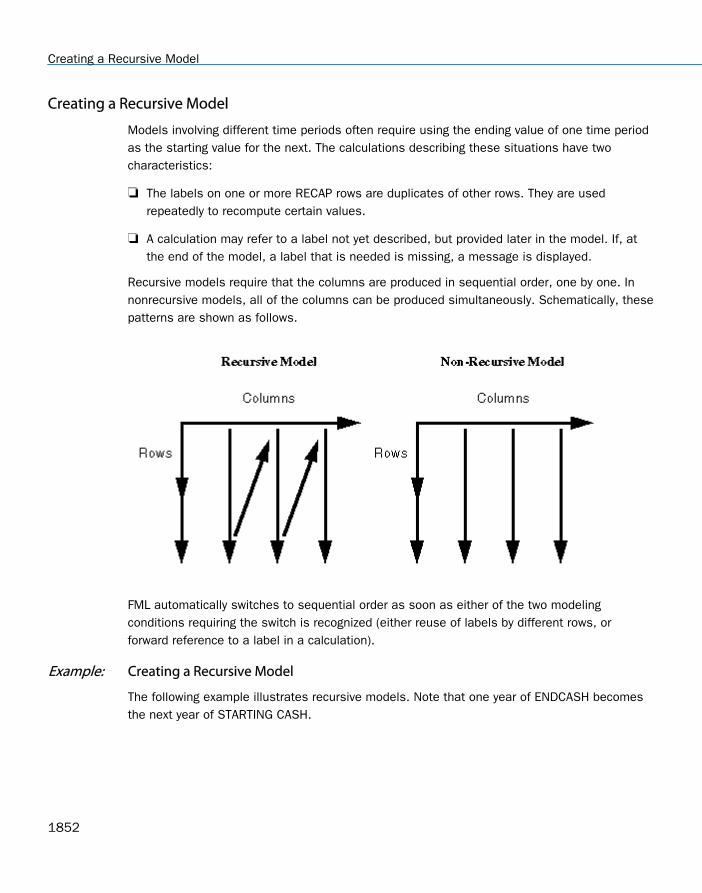
Creating a Recursive Model
Models involving different time periods often require using the ending value of one time periodas the starting value for the next. The calculations describing these situations have twocharacteristics:
The labels on one or more RECAP rows are duplicates of other rows. They are usedrepeatedly to recompute certain values.
A calculation may refer to a label not yet described, but provided later in the model. If, atthe end of the model, a label that is needed is missing, a message is displayed.
Recursive models require that the columns are produced in sequential order, one by one. Innonrecursive models, all of the columns can be produced simultaneously. Schematically, thesepatterns are shown as follows.
FML automatically switches to sequential order as soon as either of the two modelingconditions requiring the switch is recognized (either reuse of labels by different rows, orforward reference to a label in a calculation).
Example: Creating a Recursive Model
The following example illustrates recursive models. Note that one year of ENDCASH becomesthe next year of STARTING CASH.
Creating a Recursive Model
1852
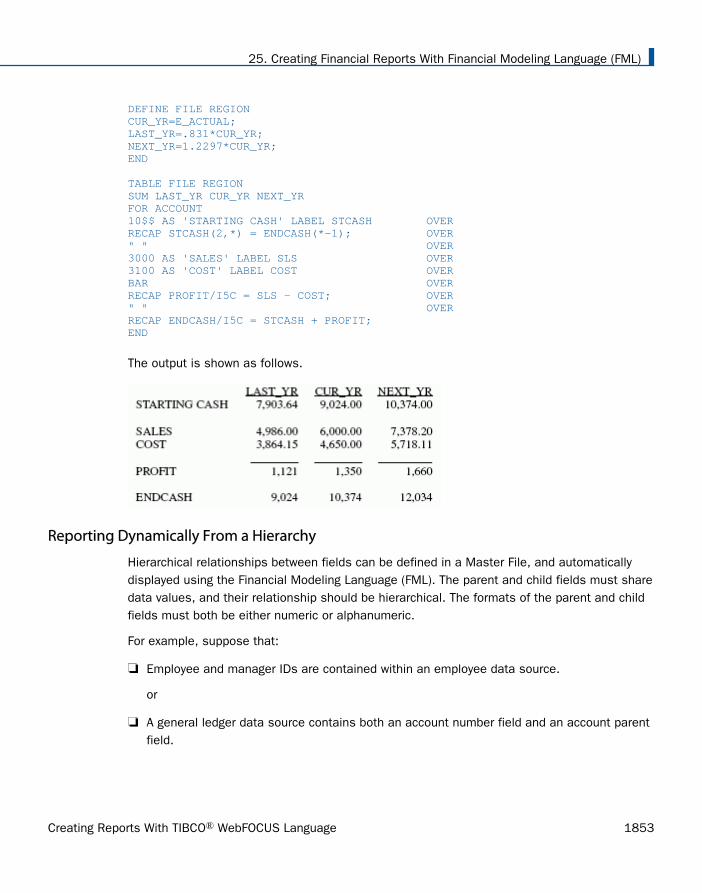
DEFINE FILE REGIONCUR_YR=E_ACTUAL;LAST_YR=.831*CUR_YR;NEXT_YR=1.2297*CUR_YR;END TABLE FILE REGIONSUM LAST_YR CUR_YR NEXT_YRFOR ACCOUNT10$$ AS 'STARTING CASH' LABEL STCASH OVERRECAP STCASH(2,*) = ENDCASH(*-1); OVER" " OVER3000 AS 'SALES' LABEL SLS OVER3100 AS 'COST' LABEL COST OVERBAR OVERRECAP PROFIT/I5C = SLS - COST; OVER" " OVERRECAP ENDCASH/I5C = STCASH + PROFIT;END
The output is shown as follows.
Reporting Dynamically From a Hierarchy
Hierarchical relationships between fields can be defined in a Master File, and automaticallydisplayed using the Financial Modeling Language (FML). The parent and child fields must sharedata values, and their relationship should be hierarchical. The formats of the parent and childfields must both be either numeric or alphanumeric.
For example, suppose that:
Employee and manager IDs are contained within an employee data source.
or
A general ledger data source contains both an account number field and an account parentfield.
25. Creating Financial Reports With Financial Modeling Language (FML)
Creating Reports With TIBCO® WebFOCUS Language 1853

By examining these fields, it is possible to construct the entire organization chart or chart ofaccounts structure. However, to print the chart in a traditional FML report, you need to list theemployee IDs or account numbers in the request syntax in the order in which they shouldappear on the report. If an employee or account is added, removed, or transferred, you have tochange the report request to reflect this change in organizational structure. For example:
TABLE FILE EMPLOYEEPRINT DEPARTMENT CURR_JOBCODEFOR EMP_ID999999999 OVER222222222 OVER . . .
In contrast, with FML hierarchies you can define the hierarchical relationship between twofields in the Master File and load this information into memory. The FML request can thendynamically construct the rows that represent this relationship and display them in the report,starting at any point in the hierarchy. In the example shown, EMP_ID is called the hierarchyfield.
Requirements for FML Hierarchies
1. In the Master File, use the PROPERTY=PARENT_OF and REFERENCE=hierarchyfld attributesto define the hierarchical relationship between two fields. For more information, see theDescribing Data With TIBCO WebFOCUS® Language manual.
The hierarchy must be loaded into memory. This loaded hierarchy is called a chart. If thehierarchy is defined in the Master File and referenced by the FML request, it is loadedautomatically. If you want to use a hierarchy defined in a Master File that is not eitherreferenced in the FML request or joined to the Master File referenced in the FML request,issue the LOAD CHART command before issuing the FML request.
The number of charts that can be loaded is 16. Charts are automatically unloaded whenthe session ends.
Reporting Dynamically From a Hierarchy
1854
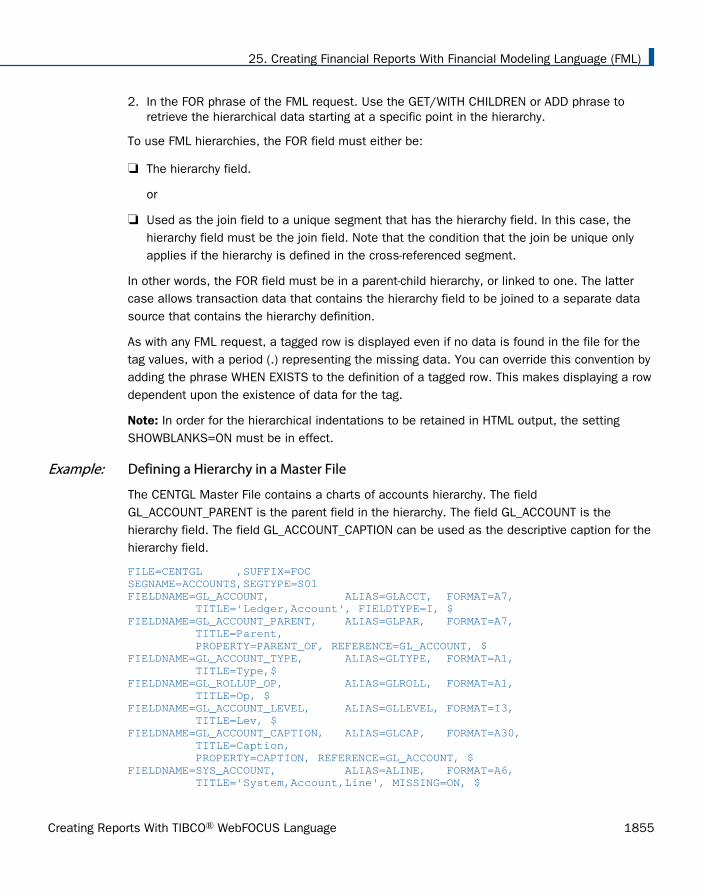
2. In the FOR phrase of the FML request. Use the GET/WITH CHILDREN or ADD phrase toretrieve the hierarchical data starting at a specific point in the hierarchy.
To use FML hierarchies, the FOR field must either be:
The hierarchy field.
or
Used as the join field to a unique segment that has the hierarchy field. In this case, thehierarchy field must be the join field. Note that the condition that the join be unique onlyapplies if the hierarchy is defined in the cross-referenced segment.
In other words, the FOR field must be in a parent-child hierarchy, or linked to one. The lattercase allows transaction data that contains the hierarchy field to be joined to a separate datasource that contains the hierarchy definition.
As with any FML request, a tagged row is displayed even if no data is found in the file for thetag values, with a period (.) representing the missing data. You can override this convention byadding the phrase WHEN EXISTS to the definition of a tagged row. This makes displaying a rowdependent upon the existence of data for the tag.
Note: In order for the hierarchical indentations to be retained in HTML output, the settingSHOWBLANKS=ON must be in effect.
Example: Defining a Hierarchy in a Master File
The CENTGL Master File contains a charts of accounts hierarchy. The fieldGL_ACCOUNT_PARENT is the parent field in the hierarchy. The field GL_ACCOUNT is thehierarchy field. The field GL_ACCOUNT_CAPTION can be used as the descriptive caption for thehierarchy field.
FILE=CENTGL ,SUFFIX=FOCSEGNAME=ACCOUNTS,SEGTYPE=S01FIELDNAME=GL_ACCOUNT, ALIAS=GLACCT, FORMAT=A7, TITLE='Ledger,Account', FIELDTYPE=I, $FIELDNAME=GL_ACCOUNT_PARENT, ALIAS=GLPAR, FORMAT=A7, TITLE=Parent, PROPERTY=PARENT_OF, REFERENCE=GL_ACCOUNT, $FIELDNAME=GL_ACCOUNT_TYPE, ALIAS=GLTYPE, FORMAT=A1, TITLE=Type,$FIELDNAME=GL_ROLLUP_OP, ALIAS=GLROLL, FORMAT=A1, TITLE=Op, $FIELDNAME=GL_ACCOUNT_LEVEL, ALIAS=GLLEVEL, FORMAT=I3, TITLE=Lev, $FIELDNAME=GL_ACCOUNT_CAPTION, ALIAS=GLCAP, FORMAT=A30, TITLE=Caption, PROPERTY=CAPTION, REFERENCE=GL_ACCOUNT, $FIELDNAME=SYS_ACCOUNT, ALIAS=ALINE, FORMAT=A6, TITLE='System,Account,Line', MISSING=ON, $
25. Creating Financial Reports With Financial Modeling Language (FML)
Creating Reports With TIBCO® WebFOCUS Language 1855

The CENTSYSF data source contains detail-level financial data. This is unconsolidated financialdata for a fictional corporation, CenturyCorp. It is designed to be separate from the CENTGLdatabase as if it came from an external accounting system. It uses a different account linesystem (SYS_ACCOUNT) which can be joined to the SYS_ACCOUNT field in CENTGL. Data usesnatural signs (expenses are positive, revenue negative).
FILE=CENTSYSF ,SUFFIX=FOCSEGNAME=RAWDATA ,SEGTYPE=S2FIELDNAME=SYS_ACCOUNT , ,A6 , FIELDTYPE=I, TITLE='System,Account,Line', $FIELDNAME=PERIOD , ,YYM , FIELDTYPE=I, $FIELDNAME=NAT_AMOUNT , ,D10.0 , TITLE='Month,Actual', $FIELDNAME=NAT_BUDGET , ,D10.0 , TITLE='Month,Budget', $FIELDNAME=NAT_YTDAMT , ,D12.0 , TITLE='YTD,Actual', $
Displaying an FML Hierarchy
The GET CHILDREN and WITH CHILDREN commands dynamically retrieve and displayhierarchical data on the FML report. GET CHILDREN displays only the children, not the parentvalue referenced in the command. WITH CHILDREN displays the parent and then the children.
Syntax: How to Display an FML Hierarchy
TABLE FILE filename{PRINT|SUM} ...FOR hierarchyfld parentvalue {GET|WITH} CHILD[REN] [n|ALL] [AS CAPTION|'text'] [LABEL label]...END
where:
filename
Is the name of the file to be used in the FML request. If the hierarchy for this requestcannot be loaded automatically, it must have been loaded previously by issuing the LOADCHART command.
hierarchyfld
Is the hierarchy field name. If the request references a joined structure, the name must bethe field name from the host file. The alias name is not supported.
parentvalue
Is the parent value for which the children are to be retrieved.
Reporting Dynamically From a Hierarchy
1856

GET CHILDREN
Displays the hierarchy starting from the first child of the specified parentvalue. It does notinclude the parent in the display. (This corresponds to the FML syntax CHILD1 OVERCHILD2 OVER ...)
WITH CHILDREN
Displays the hierarchy starting from the specified parentvalue. It includes the parent in thedisplay. (This corresponds to the FML syntax parentvalue OVER CHILD1 OVER CHILD2OVER ...).
n|ALL
Is a positive integer from 1 to 99, specifying the number of levels of the hierarchy todisplay. If a number greater than 99 is specified, a warning message is displayed and n isset to 99. The default value is 1. Therefore, if n is omitted, only direct children aredisplayed. GET or WITH CHILDREN 2 displays direct children and grandchildren. GET orWITH CHILDREN 99 displays children to 99 levels. ALL is a synonym for 99. Each childinstance is printed over the one that follows. Successive levels of the hierarchy field areindented two spaces from the previous level.
CAPTION
Indicates that the caption values to display should be taken from the field defined as theCAPTION in the Master File.
Note that the AS CAPTION phrase is supported for tagged rows, including those that do notuse the GET/WITH CHILDREN or ADD syntax. However, the hierarchy must be defined (byspecifying the PARENT_OF attribute) in order to load and display the caption values. If thehierarchy is not defined, the AS CAPTION phrase is ignored.
'text'
Is a text string to use as the row title for the hierarchy field values. The CAPTION fielddefined in the Master File is not used as the caption on the report output.
label
Is an explicit row label. Each generated row is labeled with the specified label text.
Note: The hierarchy is displayed sorted by the parent field and, within parent, sorted by thehierarchy field.
For information about the FMLFOR, FMLLIST, FMLCAP, and FMLINFO functions that return thetag values and captions used in an FML request, see the Describing Data With TIBCO WebFmanual.
25. Creating Financial Reports With Financial Modeling Language (FML)
Creating Reports With TIBCO® WebFOCUS Language 1857

Example: Displaying an FML Hierarchy
The following request displays two levels of account numbers, starting from account 3000:
SET SHOWBLANKS=ONTABLE FILE CENTGLPRINT GL_ACCOUNT_PARENTFOR GL_ACCOUNT 3000 WITH CHILDREN 2 END
The output is shown as follows.
Parent ------3000 1000 3100 3000 3110 3100 3120 3100 3130 3100 3140 3100 3200 3000 3300 3200 3400 3200 3500 3200 3600 3200 3700 3200 3800 3200 3900 3200
Note:
If the request specifies GET CHILDREN instead of WITH CHILDREN, the line for the parentvalue (3000) does not display on the report output.
In order to retain the indentations in HTML output, the SET SHOWBLANKS=ON commandmust be in effect.
Reporting Dynamically From a Hierarchy
1858
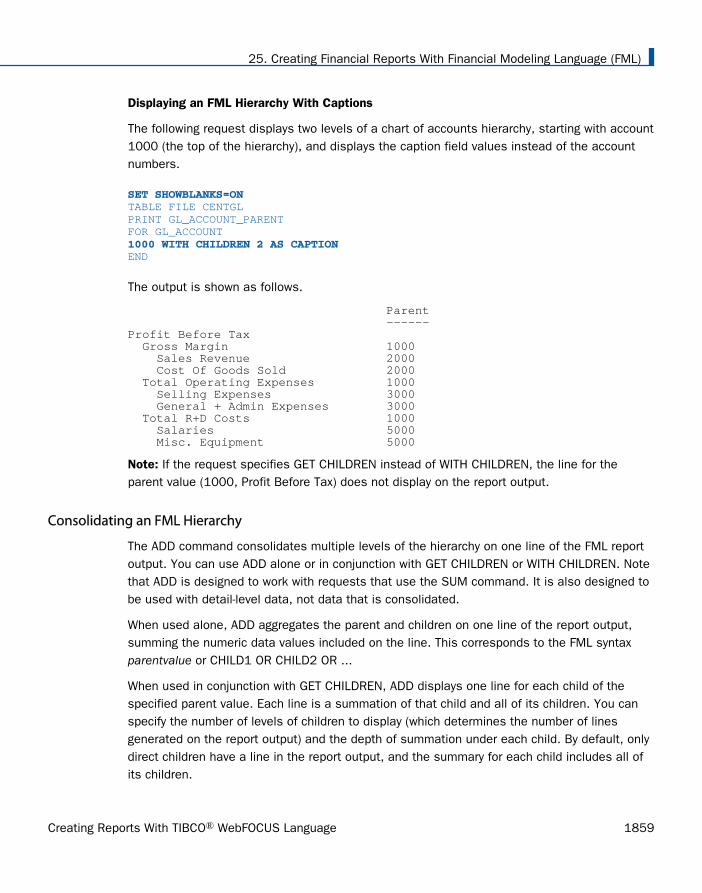
Displaying an FML Hierarchy With Captions
The following request displays two levels of a chart of accounts hierarchy, starting with account1000 (the top of the hierarchy), and displays the caption field values instead of the accountnumbers.
SET SHOWBLANKS=ON TABLE FILE CENTGLPRINT GL_ACCOUNT_PARENTFOR GL_ACCOUNT 1000 WITH CHILDREN 2 AS CAPTION END
The output is shown as follows.
Parent ------Profit Before Tax Gross Margin 1000 Sales Revenue 2000 Cost Of Goods Sold 2000 Total Operating Expenses 1000 Selling Expenses 3000 General + Admin Expenses 3000 Total R+D Costs 1000 Salaries 5000 Misc. Equipment 5000
Note: If the request specifies GET CHILDREN instead of WITH CHILDREN, the line for theparent value (1000, Profit Before Tax) does not display on the report output.
Consolidating an FML Hierarchy
The ADD command consolidates multiple levels of the hierarchy on one line of the FML reportoutput. You can use ADD alone or in conjunction with GET CHILDREN or WITH CHILDREN. Notethat ADD is designed to work with requests that use the SUM command. It is also designed tobe used with detail-level data, not data that is consolidated.
When used alone, ADD aggregates the parent and children on one line of the report output,summing the numeric data values included on the line. This corresponds to the FML syntaxparentvalue or CHILD1 OR CHILD2 OR ...
When used in conjunction with GET CHILDREN, ADD displays one line for each child of thespecified parent value. Each line is a summation of that child and all of its children. You canspecify the number of levels of children to display (which determines the number of linesgenerated on the report output) and the depth of summation under each child. By default, onlydirect children have a line in the report output, and the summary for each child includes all ofits children.
25. Creating Financial Reports With Financial Modeling Language (FML)
Creating Reports With TIBCO® WebFOCUS Language 1859

When used in conjunction with WITH CHILDREN, ADD first displays a line in the report outputthat consists of the summation of the parent value and all of its children. Then it displaysadditional lines identical to those displayed by GET CHILDREN ADD.
In order to use a data record in more than one line of an FML report (for example, to displayboth detail and summary lines or to consolidate detail data at multiple levels), the followingsetting is required:
SET FORMULTIPLE=ON
Syntax: How to Create One Summary Row for an FML Hierarchy
TABLE FILE filenameSUM ...FOR hierarchyfld parentvalue ADD [n|ALL] [AS CAPTION|'text'] [LABEL label]...END
where:
filename
Is the name of the file to be used in the FML request. If the hierarchy for this requestcannot be loaded automatically, it must have been loaded previously by issuing the LOADCHART command.
hierarchyfld
Is the hierarchy field name. If the request references a joined structure, the name must bethe field name from the host file. The alias name is not supported.
parentvalue
Is the parent value that determines the starting point in the hierarchy for the aggregation.
ADD
Displays the parent and n levels of its children on one row, summing the numeric datavalues displayed on the row. This corresponds to the FML syntax parentvalue or CHILD1OR CHILD2 OR CHILD3 and more, if applicable.
Reporting Dynamically From a Hierarchy
1860

To display the sum of just the children, you must display the parent row, display thesummary row, and use a RECAP to subtract the parent row from the sum. For example:
FOR ... parentvalue OVER parentvalue ADD 1 OVERRECAP CHILDSUM = R2-R1;
n|ALL
Is a positive integer from 1 to 99, specifying the number of levels of the hierarchy toaggregate. ALL is the default value. Therefore, if n is omitted, all children are included inthe sum. If n is 1, only direct children are included. If n is 2, direct children andgrandchildren are included. ADD 99 includes up to 99 levels of children. ALL is a synonymfor 99.
CAPTION
Indicates that the caption of the parent value displays for the total row.
Note that the AS CAPTION phrase is supported for tagged rows, including those that do notuse the GET CHILDREN or ADD syntax. However, the hierarchy must be defined (byspecifying the PARENT_OF attribute) in order to load and display the caption values. If thehierarchy is not defined, the AS CAPTION phrase is ignored.
'text'
Is a text string to use as the row title for the aggregate row. The CAPTION field defined inthe Master File is not used as the caption on the report output.
label
Is an explicit row label. Each generated row is labeled with the specified label text.
25. Creating Financial Reports With Financial Modeling Language (FML)
Creating Reports With TIBCO® WebFOCUS Language 1861

Example: Displaying One Summary Line for an FML Hierarchy
The CENTSYSF data source contains detail-level financial data. To use the account hierarchy inthe CENTGL data source with this financial data, the two data sources are joined. The data inCENTSYSF is stored with natural signs, which means, in financial terms, that revenues andliabilities are stored as negative numbers. The portion of the hierarchy used in this requestcontains only positive data.
Note that the join is not required to be unique, because the hierarchy is defined in the hostsegment.
First the WITH CHILDREN command displays the lines of the hierarchy starting with accountSelling Expenses (3100). Note that only accounts with no children are populated in this detail-level data source. The ADD command then creates one line that is the sum of account 3100and all of its children.
SET SHOWBLANKS=ON SET FORMULTIPLE=ONJOIN SYS_ACCOUNT IN CENTGL TO ALL SYS_ACCOUNT IN CENTSYSFTABLE FILE CENTGLSUM NAT_AMOUNT/D10.0 NAT_YTDAMT/D10.0FOR GL_ACCOUNT 3100 WITH CHILDREN ALL AS CAPTION OVER BAR OVER 3100 ADD AS CAPTION IF PERIOD EQ '2002/03'END
The output is shown as follows.
Reporting Dynamically From a Hierarchy
1862

Syntax: How to Consolidate FML Hierarchy Data to Any Level and Depth
TABLE FILE filename SUM ...FOR hierarchyfld parentvalue {GET|WITH} CHILD[REN] [n|ALL] ADD [m|ALL] [AS CAPTION|'text'] [LABEL label]...END
where:
filename
Is the name of the file used in the FML request. If the hierarchy for this request cannotload automatically, it previously loaded by issuing the LOAD CHART command.
hierarchyfld
Is the hierarchy field name. If the request references a joined structure, the name must bethe field name from the host file. The alias name is not supported.
parentvalue
Is the parent value that determines the starting point in the hierarchy for the aggregation.
GET|WITH
GET specifies that the first line generated on the report is the consolidated line for the firstchild of the parent value. WITH specifies that the first line generated on the report is theconsolidated line for the parent value, followed by the consolidated lines for each of itschildren, to the level specified by n.
n|ALL
Is a positive integer from 1 to 99, specifying the number of levels of children to display.The line of output for each child has the sum of that child and its children to the depthspecified for the ADD option. The default value is 1. Therefore, if n is omitted, each directchild has a line on the report. If n is 2, direct children and grandchildren each have a lineon the report output. ALL is a synonym for 99.
ADD
Sums the hierarchy to the depth specified by m for each line generated by the GET or WITHCHILDREN command.
25. Creating Financial Reports With Financial Modeling Language (FML)
Creating Reports With TIBCO® WebFOCUS Language 1863

m|ALL
Is a positive integer from 1 to 99, specifying the number of levels of children toconsolidate on each line of the report output. If a number greater than 99 is specified, awarning message is displayed and m is set to 99. The default value is ALL. Therefore, if mis omitted, the consolidated line sums all children. If m is 2, only direct children andgrandchildren are consolidated for each line on the report output. ADD 99 aggregateschildren to 99 levels. ALL is a synonym for 99.
CAPTION
Indicates that the caption of the parent value displays for the total row.
Note that the AS CAPTION phrase is supported for tagged rows, including those that do notuse the GET CHILDREN or ADD syntax. However, the hierarchy must be defined (byspecifying the PARENT_OF attribute) in order to load and display the caption values. If thehierarchy is not defined, the AS CAPTION phrase is ignored.
'text'
Is a text string to use as the row title for the aggregate row. The CAPTION field defined inthe Master File is not used as the caption on the report output.
label
Is an explicit row label. Each generated row is labeled with the specified label text.
Example: Consolidating FML Hierarchy Data
In the following request, the first WITH CHILD command displays the detail data for thehierarchy starting with account 3100. The next WITH CHILD command creates a consolidatedline for the parent account (3100) and each direct child.
SET SHOWBLANKS=ON SET FORMULTIPLE=ONJOIN SYS_ACCOUNT IN CENTGL TO ALL SYS_ACCOUNT IN CENTSYSFTABLE FILE CENTGLSUM NAT_AMOUNT/D10.0 NAT_YTDAMT/D10.0FOR GL_ACCOUNT 3100 WITH CHILDREN ALL AS CAPTION OVER " " OVERBAR AS = OVER" " OVER 3100 WITH CHILDREN ADD AS CAPTION IF PERIOD EQ '2002/03'END
Note that the join is not required to be unique, because the hierarchy is defined in the hostsegment.
Reporting Dynamically From a Hierarchy
1864

In the following output, the top portion shows the detail-level data. The bottom portion showsthe consolidated data. In the consolidated portion of the report:
There is one line for the parent that is the sum of itself plus all of its children to all levels.
There is one line for each direct child of account Selling Expenses (3100): Advertising,Promotional Expenses, Joint Marketing, and Bonuses/Commisions.
The line for Advertising is the sum of itself plus all of its children. If it has multiple levels ofchildren, they are all added into the sum. The other direct children of 3100 do notthemselves have children, so the sum on each of those lines consists of only the parentvalue.
25. Creating Financial Reports With Financial Modeling Language (FML)
Creating Reports With TIBCO® WebFOCUS Language 1865

Using GET CHILDREN instead of WITH CHILDREN eliminates the top line from each portion ofthe output. The remaining lines are the same.
Reporting Dynamically From a Hierarchy
1866
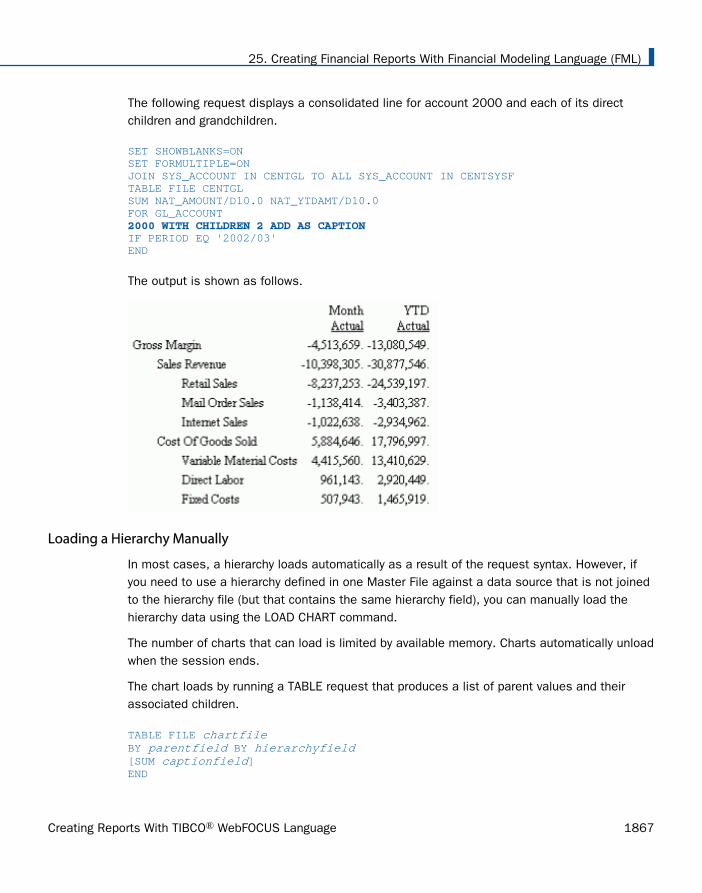
The following request displays a consolidated line for account 2000 and each of its directchildren and grandchildren.
SET SHOWBLANKS=ONSET FORMULTIPLE=ONJOIN SYS_ACCOUNT IN CENTGL TO ALL SYS_ACCOUNT IN CENTSYSFTABLE FILE CENTGLSUM NAT_AMOUNT/D10.0 NAT_YTDAMT/D10.0FOR GL_ACCOUNT 2000 WITH CHILDREN 2 ADD AS CAPTION IF PERIOD EQ '2002/03'END
The output is shown as follows.
Loading a Hierarchy Manually
In most cases, a hierarchy loads automatically as a result of the request syntax. However, ifyou need to use a hierarchy defined in one Master File against a data source that is not joinedto the hierarchy file (but that contains the same hierarchy field), you can manually load thehierarchy data using the LOAD CHART command.
The number of charts that can load is limited by available memory. Charts automatically unloadwhen the session ends.
The chart loads by running a TABLE request that produces a list of parent values and theirassociated children.
TABLE FILE chartfile BY parentfield BY hierarchyfield [SUM captionfield]END
25. Creating Financial Reports With Financial Modeling Language (FML)
Creating Reports With TIBCO® WebFOCUS Language 1867

The resulting chart contains the following information. It may also contain the associatedcaptions, depending on whether the AS CAPTION phrase was used in the request.
parentfield hierarchyfield ----------- -------------- parentvalue1 child1 parentvalue1 child2parentvalue2 child3 . . .
Syntax: How to Load a Hierarchy From One Master File for Use With a Separate Master File
You can manually load the hierarchy data, if you need to use a hierarchy defined in one MasterFile, against a data source that is not joined to the hierarchy file but that contains the samehierarchy field.
Available memory dictates the number of charts that can load. Charts automatically unloadwhen WebFOCUS terminates.
LOAD CHART chartfile[.sega].hierarchyfld [FOR requestfile[[.segb].fieldb]]
where:
chartfile
Is the name of the Master File that contains the hierarchy information.
sega
Is the name of the segment that contains the hierarchy field. The segment name is onlyrequired if a field in another segment in the structure has the same field name as thehierarchy field.
hierarchyfld
Is the hierarchy field. It is required because a Master File can define multiple hierarchies.
FOR
Loads a hierarchy defined in a Master File that is not used in the FML report request. Forexample, if Master File B contains the hierarchy information but Master File A is used inthe request (without a join between Master Files A and B), issue the following LOAD CHARTcommand prior to the FML request:
LOAD CHART B.FLDB FOR A.FLDATABLE FILE A ...
Reporting Dynamically From a Hierarchy
1868
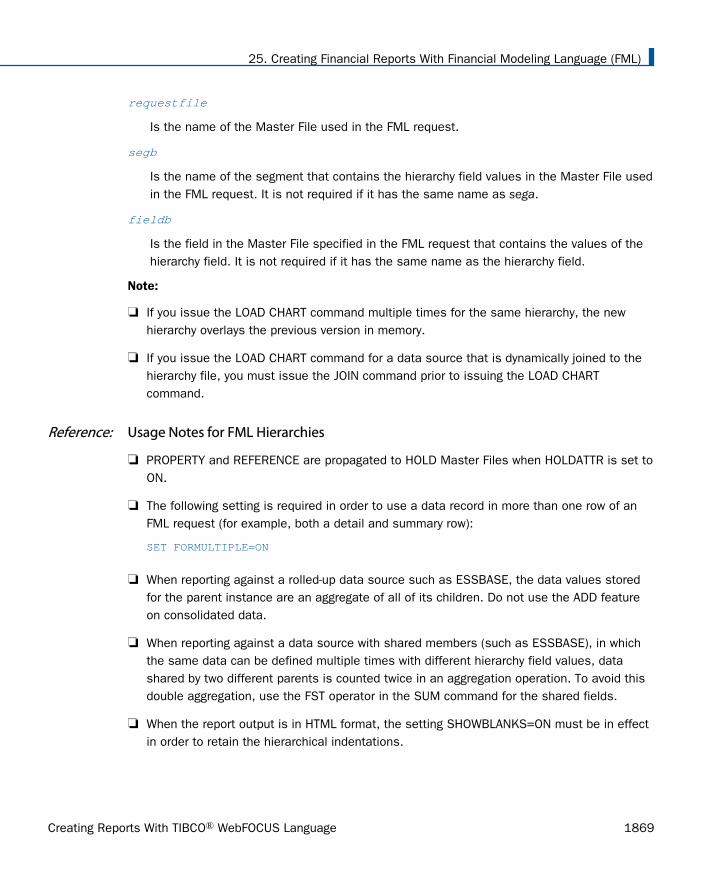
requestfile
Is the name of the Master File used in the FML request.
segb
Is the name of the segment that contains the hierarchy field values in the Master File usedin the FML request. It is not required if it has the same name as sega.
fieldb
Is the field in the Master File specified in the FML request that contains the values of thehierarchy field. It is not required if it has the same name as the hierarchy field.
Note:
If you issue the LOAD CHART command multiple times for the same hierarchy, the newhierarchy overlays the previous version in memory.
If you issue the LOAD CHART command for a data source that is dynamically joined to thehierarchy file, you must issue the JOIN command prior to issuing the LOAD CHARTcommand.
Reference: Usage Notes for FML Hierarchies
PROPERTY and REFERENCE are propagated to HOLD Master Files when HOLDATTR is set toON.
The following setting is required in order to use a data record in more than one row of anFML request (for example, both a detail and summary row):
SET FORMULTIPLE=ON
When reporting against a rolled-up data source such as ESSBASE, the data values storedfor the parent instance are an aggregate of all of its children. Do not use the ADD featureon consolidated data.
When reporting against a data source with shared members (such as ESSBASE), in whichthe same data can be defined multiple times with different hierarchy field values, datashared by two different parents is counted twice in an aggregation operation. To avoid thisdouble aggregation, use the FST operator in the SUM command for the shared fields.
When the report output is in HTML format, the setting SHOWBLANKS=ON must be in effectin order to retain the hierarchical indentations.
25. Creating Financial Reports With Financial Modeling Language (FML)
Creating Reports With TIBCO® WebFOCUS Language 1869

Customizing a Row Title
You can customize a row title in an FML report for accurate data identification. Using the ASphrase, you can provide new titles for TAG, DATA, RECAP, and PICKUP rows.
Syntax: How to Customize a Row Title in FML
For a TAG row, use the syntax:
value AS {'title'|CAPTION}
For a DATA or PICKUP row, use the syntax:
value AS 'title'
For a RECAP row, use the syntax:
RECAP calcname[/format]=expression; AS 'title'
where:
value
Is the value on which you are reporting, whether retrieved from a data source or externalfile (represented by a tag), supplied directly by a user in the request, or picked up from awork file.
title
Is the customized row title, enclosed in single quotation marks if it contains embeddedblanks.
In a TAG, DATA, or PICKUP row, the default row title is value.
In a RECAP row, the default title is calcname.
CAPTION
In the Master File of a hierarchical data source, CAPTION identifies a TAG row using acaption field. Note that the hierarchy in the Master File defines the PARENT-OF the FORfield.
calcname
Is the value that is derived by the RECAP calculation.
Example: Changing the Titles of Tag Rows
In the following example, the row titles CASH ON HAND and DEMAND DEPOSITS providemeaningful identifications for the corresponding tags.
Customizing a Row Title
1870

TABLE FILE LEDGERSUM AMOUNT FOR ACCOUNT 1010 AS 'CASH ON HAND' OVER1020 AS 'DEMAND DEPOSITS' END
Note that single quotation marks are necessary since the row title being assigned hasembedded blanks.
The output is shown as follows.
AMOUNT ------CASH ON HAND 8,784DEMAND DEPOSITS 4,494
If no AS phrase is included, the tag values are displayed in the report.
Customizing a Row Title for a RECAP Value
This request creates the title TOTAL CASH for the RECAP value TOTCASH.
TABLE FILE LEDGERSUM AMOUNT FOR ACCOUNT1010 AS 'CASH ON HAND' OVER1020 AS 'DEMAND DEPOSITS' OVER1030 AS 'TIME DEPOSITS' OVER RECAP TOTCASH = R1 + R2 + R3; AS 'TOTAL CASH' END
The output is shown as follows.
AMOUNT ------CASH ON HAND 8,784DEMAND DEPOSITS 4,494TIME DEPOSITS 7,961TOTAL CASH 21,239
If no AS phrases are included, the name of the RECAP value (TOTCASH) displays in the report.
Formatting an FML Report
Improve the readability and presentation of your FML report by:
Underlining numeric columns. Reports with columns of numbers frequently need to displayunderlines before some RECAP calculations. You can specify an underline character,introduced by the word BAR, in place of the tag value.
Adding page breaks. You can request a new page at any point in a report by placing theword PAGE-BREAK in place of the tag value.
25. Creating Financial Reports With Financial Modeling Language (FML)
Creating Reports With TIBCO® WebFOCUS Language 1871

Formatting rows, columns, and cells. You can apply StyleSheet attributes, such as FONT,SIZE, STYLE, and COLOR, to individual rows and columns, or to cells within those rows.
Adding borders around rows, columns, and cells. You can use BORDER attributes in aStyleSheet to specify the weight, style, and color of border lines around a row or cell. Youcan specify formatting variations for the top, bottom, left, and right borders.
Indenting text or numbers. You can indent a tag value, label text, or caption text aspecified number of spaces for an FML tag row, hierarchy, or RECAP row. If you apply theindent to rows in an FML hierarchy, the parent line of the hierarchy is indented the numberof spaces specified as the indent.
Note: For an HTML, PDF, or PostScript report, you can use the BLANKINDENT setting tospecify an indentation between levels of an FML hierarchy. See Indenting Row Titles in anFML Hierarchy on page 1889.
Syntax: How to Add an Underline Character for Columns
BAR [AS 'character'] OVER
where:
characterIs either the hyphen character (-) or the equal character (=). Enclose the character insingle quotation marks. The default character is the hyphen (-).
Example: Underlining Columns
This example uses the default underscore character (_).
TABLE FILE LEDGERSUM AMOUNT FOR ACCOUNT1010 AS 'CASH ON HAND' OVER1020 AS 'DEMAND DEPOSITS' OVER1030 AS 'TIME DEPOSITS' OVER BAR OVER RECAP TOTCASH = R1 + R2 + R3;END
The output is shown as follows.
AMOUNT ------CASH ON HAND 8,784DEMAND DEPOSITS 4,494TIME DEPOSITS 7,961 ------TOTCASH 21,239
Formatting an FML Report
1872

Notice that the BAR ... OVER phrase underlines only the column containing the display field.
Syntax: How to Specify a Page Break in an FML Report
Include the following syntax in the FML request in place of a tag value.
PAGE-BREAK OVER
Example: Specifying a Page Break in an FML Report
In this example, a page break is inserted after the first two RECAP commands to highlight eachcalculation.
TABLE FILE LEDGERSUM AMOUNT FOR ACCOUNT1010 AS 'CASH ON HAND' OVER1020 AS 'DEMAND DEPOSITS' OVER1030 AS 'TIME DEPOSITS' OVERBAR OVERRECAP TOTCASH = R1 + R2 + R3; AS 'TOTAL CASH' OVER PAGE-BREAK OVER 1100 AS 'ACCOUNTS RECEIVABLE' LABEL RECEIVE OVER1200 AS 'INVENTORY' LABEL INVENT OVERBAR OVERRECAP TOTASSET = RECEIVE + INVENT; AS 'TOTAL ASSETS' OVER PAGE-BREAK OVER RECAP TOTAL = TOTCASH + TOTASSET;END
25. Creating Financial Reports With Financial Modeling Language (FML)
Creating Reports With TIBCO® WebFOCUS Language 1873

The output is shown as follows.
Syntax: How to Format a Row, Column, or Cell in an FML Report
TYPE=type, [COLUMN=column] [LABEL={Rn|label}], format_def, $
where:
type
Identifies the component you wish to format. Valid values are:
REPORT denotes a row with the specified label.
DATA denotes a row with the specified label, which contains user-supplied data values.
FREETEXT denotes a free text or a blank row with the specified label.
Formatting an FML Report
1874

UNDERLINE denotes underlines generated by BAR. Formatting of an underline is supportedfor PDF and PS, but not for HTML reports.
column
Identifies a specific column. You can identify the column by its name or position in a row.
LABEL
Is the controlling factor in identifying and formatting an FML row.
Note that the label is used to identify a row for calculation or formatting. The label for aTAG or DATA row never appears in the report output. It is used only to identify rows withinthe FML code. For a RECAP row, the name of the calculated value serves as a label. Itappears in the report unless an alternate title is specified.
label is an explicit row label that you can assign to identify a row more clearly.
format_def
Is the formatting definition, such as FONT, SIZE, STYLE, and COLOR. See Formatting anFML Report on page 1871.
Note: To format a cell, identify the cell as the intersection of a column and a row usingCOLUMN= ... plus LABEL= ... in the same StyleSheet declaration.
Example: Formatting Rows in an FML Report
The following illustrates how to identify and format an entire FML row, consisting of the rowlabel and the row data. The LABEL attribute in the StyleSheet identifies the three TAG rows,which are styled here as italic.
SET PAGE-NUM=OFFTABLE FILE LEDGERSUM AMOUNT FOR ACCOUNT1010 AS 'CASH ON HAND' LABEL COH OVER1020 AS 'DEMAND DEPOSITS' LABEL DD OVER1030 AS 'TIME DEPOSITS' LABEL TD OVERBAR OVERRECAP TOTCASH = R1 + R2 + R3; AS 'TOTAL CASH' ON TABLE SET STYLESHEET *TYPE = REPORT, GRID = OFF, $ TYPE = REPORT, LABEL = COH, STYLE = ITALIC, $ TYPE = REPORT, LABEL = DD, STYLE = ITALIC, $ TYPE = REPORT, LABEL = TD, STYLE = ITALIC, $ ENDSTYLEEND
25. Creating Financial Reports With Financial Modeling Language (FML)
Creating Reports With TIBCO® WebFOCUS Language 1875

The output is shown in the following image.
Applying Boldface to a TAG Row in an FML Report
This request applies boldface to the customized row title, CASH, and to the related data in theAMOUNT column. The StyleSheet uses the explicit label CA to identify the component toformat.
SET PAGE-NUM=OFFTABLE FILE LEDGERSUM AMOUNT FOR ACCOUNT10$$ AS 'CASH' LABEL CA OVER1100 AS 'ACCOUNTS RECEIVABLE' LABEL AR OVER1200 AS 'INVENTORY' LABEL INV OVERRECAP CURASST/I5C = CA + AR + INV;ON TABLE SET STYLESHEET *TYPE = REPORT, GRID = OFF, $ TYPE = REPORT, LABEL = CA, STYLE = BOLD, $ ENDSTYLEEND
The output is shown in the following image.
Applying Boldface to a Cell in an FML Matrix
This request generates a report in which the data value for AMOUNT is bold in the row titledCASH. However, the row title CASH is not bold. This is accomplished by pinpointing the cell inthe StyleSheet declaration. In this case, the column (N2) within the row (CA).
Formatting an FML Report
1876

SET PAGE-NUM=OFFTABLE FILE LEDGERSUM AMOUNT FOR ACCOUNT10$$ AS 'CASH' LABEL CA OVER1100 AS 'ACCOUNTS RECEIVABLE' LABEL AR OVER1200 AS 'INVENTORY' LABEL INV OVERRECAP CURASST/I5C = CA + AR + INV;ON TABLE SET STYLESHEET *TYPE = REPORT, GRID = OFF, $ TYPE = REPORT, COLUMN = N2, LABEL = CA, STYLE = BOLD, $ ENDSTYLEEND
The output is shown in the following image.
Applying Boldface to a Column in an FML Report
This request identifies the AMOUNT column by name and formats its title and data in bold. Thesame result is achieved if the column is identified as N2.
SET PAGE-NUM=OFFTABLE FILE LEDGERSUM AMOUNT FOR ACCOUNT"---CASH ACCOUNTS---" OVER1010 AS 'CASH ON HAND' OVER1020 AS 'DEMAND DEPOSITS' OVER1030 AS 'TIME DEPOSITS' OVER" " OVER"---OTHER CURRENT ASSETS---" OVER1100 AS 'ACCOUNTS RECEIVABLE' OVER1200 AS 'INVENTORY'ON TABLE SET STYLESHEET *TYPE = REPORT, GRID = OFF, $ TYPE = REPORT, COLUMN = AMOUNT, STYLE = BOLD, $ ENDSTYLEEND
25. Creating Financial Reports With Financial Modeling Language (FML)
Creating Reports With TIBCO® WebFOCUS Language 1877

The output is shown in the following image.
Applying Boldface to a Free Text Row
This request styles the free text as bold. Since in this example the same styling applies toboth free text rows, labels are not required to distinguish between them.
SET PAGE-NUM=OFFTABLE FILE LEDGERSUM AMOUNT FOR ACCOUNT"---CASH ACCOUNTS---" LABEL CA OVER1010 AS 'CASH ON HAND' OVER1020 AS 'DEMAND DEPOSITS' OVER1030 AS 'TIME DEPOSITS' OVER" " OVER"---OTHER CURRENT ASSETS---" LABEL OCA OVER1100 AS 'ACCOUNTS RECEIVABLE' OVER1200 AS 'INVENTORY'ON TABLE SET STYLESHEET *TYPE = REPORT, GRID = OFF, $ TYPE = FREETEXT, STYLE = BOLD, $ ENDSTYLEEND
Formatting an FML Report
1878

The output is shown in the following image.
Formatting Free Text Rows Separately in an FML Report
This request uses the SIZE attribute to distinguish two lines of free text: CASH ACCOUNTS andOTHER CURRENT ASSETS. The labels CA and OCA are used to identify and format each rowseparately.
SET PAGE-NUM=OFFTABLE FILE LEDGERSUM AMOUNT FOR ACCOUNT " --- CASH ACCOUNTS ---" LABEL CA OVER 1010 AS 'CASH ON HAND' OVER1020 AS 'DEMAND DEPOSITS' OVER1030 AS 'TIME DEPOSITS' OVER" " OVER " --- OTHER CURRENT ASSETS ---" LABEL OCA OVER 1100 AS 'ACCOUNTS RECEIVABLE' OVER1200 AS 'INVENTORY'ON TABLE SET STYLESHEET *TYPE = REPORT, GRID = OFF, $ TYPE = FREETEXT, LABEL = CA, STYLE = BOLD, SIZE = 12, $ TYPE = FREETEXT, LABEL = OCA, STYLE = BOLD, SIZE = 10, $ ENDSTYLEEND
25. Creating Financial Reports With Financial Modeling Language (FML)
Creating Reports With TIBCO® WebFOCUS Language 1879

The output is shown in the following image.
Styling Text and a Variable in a Free Text Row
In this example, the text and variable components of the free text row are styled separately.The text, Current Assets, is italic and the value derived from the RECAP calculation is bold.
SET PAGE-NUM=OFFTABLE FILE LEDGERSUM AMOUNT AS 'Amount' FOR ACCOUNT10$$ AS 'Cash' LABEL CA OVER1100 AS 'Accounts Receivable' LABEL AR OVER1200 AS 'Inventory' LABEL INV OVERRECAP CURASST/I5C = CA + AR + INV; NOPRINT OVER"Current Assets: <CURASST"ON TABLE SET STYLESHEET *TYPE = REPORT, GRID=OFF, $ TYPE = FREETEXT, OBJECT = TEXT, ITEM = 1, SIZE = 12, STYLE = ITALIC, $ TYPE = FREETEXT, OBJECT = FIELD, ITEM = 1, STYLE = BOLD, $ ENDSTYLEEND
The output is shown in the following image.
Formatting an FML Report
1880

Applying Boldface to an FML RECAP Row
This request applies boldface to the row title and calculated value in a RECAP row. Notice thatthe RECAP label in the StyleSheet is TOTCASH. In a RECAP, the name assigned to thecalculated value serves as the explicit label.
SET PAGE-NUM=OFFTABLE FILE LEDGERSUM AMOUNT FOR ACCOUNT1010 AS 'CASH ON HAND' LABEL CASH OVER1020 AS 'DEMAND DEPOSITS' LABEL DD OVER1030 AS 'TIME DEPOSITS' LABEL TD OVERRECAP TOTCASH = R1 + R2 + R3; AS 'TOTAL CASH'ON TABLE SET STYLESHEET *TYPE = REPORT, GRID = OFF, $ TYPE = REPORT, LABEL = TOTCASH, STYLE = BOLD, $ TYPE = REPORT, LABEL = CASH, COLUMN = N1, STYLE = ITALIC, $TYPE = REPORT, LABEL = DD, COLUMN = N1, STYLE = ITALIC, $TYPE = REPORT, LABEL = TD, COLUMN = N1, STYLE = ITALIC, $ENDSTYLEEND
The output is shown in the following image.
Syntax: How to Add and Format Row and Cell Borders
To request a uniform border around a row or cell, use this syntax:
TYPE=REPORT, LABEL=row_label, [COLUMN=column,] BORDER=option,[BORDER-STYLE=line_style,] [BORDER-COLOR={color|RGB® g b)},] $
To specify different characteristics for the top, bottom, left, and/or right borders, use thissyntax:
TYPE=REPORT, LABEL=row_label, [COLUMN=column,] BORDER-position=option,[BORDER-[position-]STYLE=line_style,][BORDER-[position-]COLOR={color|RGB(r g b)},] $
To specify different characteristics for the top, bottom, left, and/or right borders, use thissyntax:
25. Creating Financial Reports With Financial Modeling Language (FML)
Creating Reports With TIBCO® WebFOCUS Language 1881
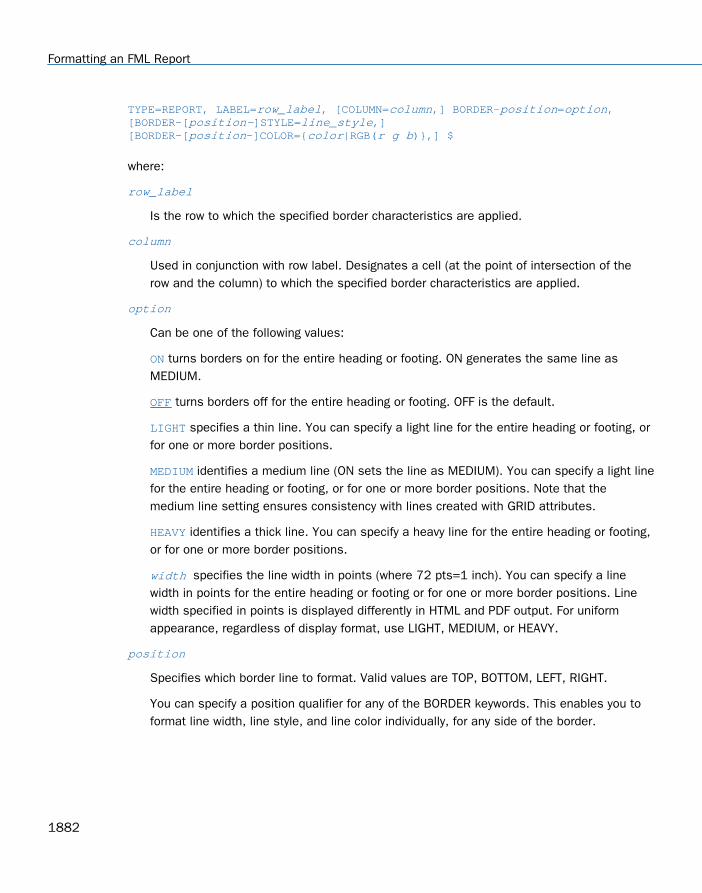
TYPE=REPORT, LABEL=row_label, [COLUMN=column,] BORDER-position=option,[BORDER-[position-]STYLE=line_style,][BORDER-[position-]COLOR={color|RGB(r g b)},] $
where:
row_label
Is the row to which the specified border characteristics are applied.
column
Used in conjunction with row label. Designates a cell (at the point of intersection of therow and the column) to which the specified border characteristics are applied.
option
Can be one of the following values:
ON turns borders on for the entire heading or footing. ON generates the same line asMEDIUM.
OFF turns borders off for the entire heading or footing. OFF is the default.
LIGHT specifies a thin line. You can specify a light line for the entire heading or footing, orfor one or more border positions.
MEDIUM identifies a medium line (ON sets the line as MEDIUM). You can specify a light linefor the entire heading or footing, or for one or more border positions. Note that themedium line setting ensures consistency with lines created with GRID attributes.
HEAVY identifies a thick line. You can specify a heavy line for the entire heading or footing,or for one or more border positions.
width specifies the line width in points (where 72 pts=1 inch). You can specify a linewidth in points for the entire heading or footing or for one or more border positions. Linewidth specified in points is displayed differently in HTML and PDF output. For uniformappearance, regardless of display format, use LIGHT, MEDIUM, or HEAVY.
position
Specifies which border line to format. Valid values are TOP, BOTTOM, LEFT, RIGHT.
You can specify a position qualifier for any of the BORDER keywords. This enables you toformat line width, line style, and line color individually, for any side of the border.
Formatting an FML Report
1882
line_style
Sets the style of the border line. WebFOCUS StyleSheets support all of the standardCascading Style Sheets line styles. Several 3-dimensional styles are only available inHTML, as noted by asterisks. Valid values are:
NONESOLIDDOTTEDDASHEDDOUBLE*GROOVE*RIDGE*INSET*OUTSET*
color
Is one of the preset color values. The default value is BLACK.
If the display or output device does not support colors, it substitutes shades of gray.
RGB
Specifies the font color using a mixture of red, green, and blue.
(r g b)
Is the desired intensity of red, green, and blue, respectively. The values are on a scale of 0to 255, where 0 is the least intense and 255 is the most intense. Note that using thethree color components in equal intensities results in shades of gray.
Note: For HTML reports, the BORDERS feature requires that cascading style sheets be turnedON. This code is not required for PDF and PS reports.
Example: Emphasizing a Row Using Uniform Border Lines
This example places a dashed border of medium thickness around the RECAP row identified bythe label TOTCASH. For HTML reports, the BORDERS feature requires that cascading stylesheets be turned ON.
25. Creating Financial Reports With Financial Modeling Language (FML)
Creating Reports With TIBCO® WebFOCUS Language 1883

SET PAGE-NUM=OFFTABLE FILE LEDGERSUM AMOUNT FOR ACCOUNT1010 AS 'CASH ON HAND' LABEL CASH OVER1020 AS 'DEMAND DEPOSITS' LABEL DD OVER1030 AS 'TIME DEPOSITS' LABEL TD OVERRECAP TOTCASH = R1 + R2 + R3; AS 'TOTAL CASH' ON TABLE SET ONLINE-FMT HTML ON TABLE SET HTMLCSS ON ON TABLE SET STYLESHEET *TYPE = REPORT, GRID = OFF, $ TYPE = REPORT, LABEL = TOTCASH, BORDER = MEDIUM, BORDER-STYLE = DASHED, $ ENDSTYLEEND
The output is shown in the following image.
Formatting an FML Report
1884

Example: Emphasizing a Row Using Different Top/Bottom and Left/Right Borders
This example places a heavy black border line above and below the RECAP row identified bythe label TOTCASH, and a thin silver dotted line to the left and right of each column in the row.
For HTML reports, the BORDERS feature requires that cascading style sheets be turned ON.
SET PAGE-NUM=OFFTABLE FILE LEDGERSUM AMOUNT FOR ACCOUNT1010 AS 'CASH ON HAND' LABEL CASH OVER1020 AS 'DEMAND DEPOSITS' LABEL DD OVER1030 AS 'TIME DEPOSITS' LABEL TD OVERRECAP TOTCASH = R1 + R2 + R3; AS 'TOTAL CASH' ON TABLE SET ONLINE-FMT HTML ON TABLE SET HTMLCSS ON ON TABLE SET STYLESHEET *TYPE = REPORT, GRID = OFF,$ TYPE = REPORT, LABEL = TOTCASH, BORDER-TOP = HEAVY, BORDER-BOTTOM = HEAVY, BORDER-LEFT = LIGHT, BORDER-RIGHT = LIGHT, BORDER-TOP-STYLE = SOLID, BORDER-BOTTOM-STYLE = SOLID, BORDER-LEFT-STYLE = DOTTED, BORDER-RIGHT-STYLE = DOTTED, BORDER-LEFT-COLOR = 'SILVER', BORDER-RIGHT-COLOR = 'SILVER', $ENDSTYLEEND
The output is shown in the following image.
Example: Adding Uniform Border Lines Around a Cell
This example places a border of medium thickness around the cell in the second column of therow identified by the label TOTCASH. The combined LABEL and COLUMN specifications areidentified in the cell. The BORDERS feature requires that cascading style sheets be turned ON.
25. Creating Financial Reports With Financial Modeling Language (FML)
Creating Reports With TIBCO® WebFOCUS Language 1885

SET PAGE-NUM=OFFTABLE FILE LEDGERSUM AMOUNT FOR ACCOUNT1010 AS 'CASH ON HAND' LABEL CASH OVER1020 AS 'DEMAND DEPOSITS' LABEL DD OVER1030 AS 'TIME DEPOSITS' LABEL TD OVERRECAP TOTCASH = R1 + R2 + R3; AS 'TOTAL CASH' ON TABLE SET ONLINE-FMT HTML ON TABLE SET HTMLCSS ON ON TABLE SET STYLESHEET *TYPE = REPORT, GRID = OFF,$ TYPE = REPORT, LABEL = TOTCASH, COLUMN = N2, BORDER = MEDIUM, $ ENDSTYLEEND
The output is shown in the following image.
Syntax: How to Specify an Indent for an FML Label, Tag, or Caption
FOR forfield [IN k]tag [[GET CHILDREN|WITH CHILDREN] n] INDENT m [AS ['text'|CAPTION]] [OVER]
or
RECAP fieldname[/format]=expression; INDENT m [AS 'text']
where:
forfield
Is a field in the data source whose values are included in the report.
k
Is the starting column for the FOR value in an FML report.
tag
Is a value of forfield to be displayed on a row of the FML report.
Formatting an FML Report
1886

n
Is the number of levels of an FML hierarchy to display on the FML report.
m
Is a positive integer (zero is not supported) specifying the number of spaces to indent thetag value, label, or caption of an FML row or hierarchy. The indentation starts from columnone if there is no IN phrase specified in the FOR command. If there is an IN phrase,indentation starts from the column specified in the IN phrase. The maximum indentation isthe same as the maximum length of an AS name.
If you indent an FML hierarchy, the parent line of the hierarchy is indented the number ofspaces specified as the indent. The hierarchy levels are indented two spaces from eachother. If the GET CHILDREN phrase is used, the first line of the hierarchy is indented anadditional two spaces because the hierarchy output begins with the first child rather thanthe parent. For more information about the use of GET CHILDREN, see Displaying an FMLHierarchy on page 1856.
'text'
Is a label to be displayed on a row of the FML report.
CAPTION
Indicates that a caption field has been defined in the Master File.
OVER
Indicates that this row is not the last row to be displayed.
fieldname
Is a name you assign to the value calculated by the RECAP command.
format
Is the USAGE format for RECAP field. It cannot exceed the column width. The default is theformat of the column in which the calculated value is displayed.
expression
Is the expression that describes how to calculate the field value for RECAP.
25. Creating Financial Reports With Financial Modeling Language (FML)
Creating Reports With TIBCO® WebFOCUS Language 1887

Example: Indenting a Tag Row in an FML Hierarchy
In the following request, the label of the second row for tag value 3000 is indented fivespaces. Because the GET CHILDREN phrase is used, the first line of the FML hierarchy, in thethird row for tag value 3000, is indented seven spaces (five + two).
SET FORMULTIPLE=ONTABLE FILE CENTGLPRINT GL_ACCOUNT_PARENTFOR GL_ACCOUNT3000 AS 'Not Indented' OVER3000 INDENT 5 AS 'Indented 5' OVER3000 GET CHILDREN 2 INDENT 5 AS 'Hierarchy Indented 5'END
The output is shown as follows.
Parent ------Not Indented 3000 Indented 5 3000 Hierarchy Indented 5 3000 Hierarchy Indented 5 3100 Hierarchy Indented 5 3100 Hierarchy Indented 5 3100 Hierarchy Indented 5 3100 Hierarchy Indented 5 3000 Hierarchy Indented 5 3200 Hierarchy Indented 5 3200 Hierarchy Indented 5 3200 Hierarchy Indented 5 3200 Hierarchy Indented 5 3200 Hierarchy Indented 5 3200 Hierarchy Indented 5 3200
Indenting FML RECAP Rows
The following request sums price, cost, and quantity in stock for digital and analog producttypes. The first RECAP command calculates the total for each column, and indents the labelfive spaces. The second RECAP command calculates the profit, and indents the label 10spaces.
SET FORMULTIPLE=ONTABLE FILE CENTINVSUM PRICE COST QTY_IN_STOCKFOR PRODTYPEDigital OVERAnalog OVERBAR OVERRECAP TOTAL = R1 + R2; INDENT 5 AS 'Total:' OVERBAR OVERRECAP PROFIT(2) = TOTAL(1) - TOTAL(2); AS 'Profit:' INDENT 10END
Formatting an FML Report
1888

The output is shown as follows.
Our Quantity Price: Cost: In Stock: ------ ----- ---------Digital 4,080.00 3,052.00 119143Analog 1,883.00 1,371.00 139345 ------------ ------------ ------- Total: 5,963.00 4,423.00 258488 ------------ ------------ ------- Profit: 1,540.00
Indenting Row Titles in an FML Hierarchy
To clarify relationships within an FML hierarchy, the captions (titles) of values are indented ateach level. Use the BLANKINDENT parameter in an HTML, PDF, or PostScript report to specifythe indentation between each level in the hierarchy. You can use the default indentation foreach hierarchy level or choose your own indentation value. To print indented captions in anHTML report, you must set the BLANKINDENT parameter to ON or to a number.
SET BLANKINDENT does not redefine the width of the indented column, if it is not wide enoughto accommodate the indented fields. Columns in table-based formats will automatically sizethemselves as needed, while columns in position-based formats, such as PDF, PostScript, orPPTX, shift out of alignment. You can use StyleSheet syntax to make the column wide enoughfor the indented values, and move the columns that follow it. Change the width of a columnusing the StyleSheet SQUEEZE = n attribute to supply the required space.
A related feature enables you to change the number of blank spaces before the parent line ofa hierarchy or before any FML tag or RECAP row in any FML request. For more information, see Formatting an FML Report on page 1871.
Syntax: How to Indent FML Hierarchy Captions in an HTML Report
SET BLANKINDENT={ON|OFF|n}ON TABLE SET BLANKINDENT {ON|OFF|n}
where:
ON
Indents FML hierarchy captions 0.125 units for each space that normally displays beforethe caption. For child levels in an FML hierarchy, it indents 0.125 units for each space thatnormally displays between this line and the line above it.
OFF
Turns off indentations for FML hierarchy captions in an HTML report. OFF is the defaultvalue. For other formats, uses the default indentation of two spaces.
25. Creating Financial Reports With Financial Modeling Language (FML)
Creating Reports With TIBCO® WebFOCUS Language 1889
n
Is an explicit measurement in the unit of measurement defined by the UNITS parameter.This measurement is multiplied by the number of spaces that normally displays before thecaption. For child levels in an FML hierarchy, it indents n units for each space that normallydisplays between this line and the line above it. The default number of spaces is two. Zero(0) produces the same report output as OFF. Negative values for n are not supported.
Example: Using the Default Indentation for FML Hierarchy Captions
The following request creates an HTML report with the default indentation:
SET PAGE-NUM=NOPAGESET BLANKINDENT=ONSET FORMULTIPLE=ONTABLE FILE CENTGLPRINT GL_ACCOUNT_PARENTFOR GL_ACCOUNT3000 AS CAPTION OVER3000 GET CHILDREN 2 AS CAPTION
ON TABLE SET ONLINE-FMT HTML ON TABLE SET HTMLCSS ONON TABLE SET STYLE *TYPE = REPORT, GRID = OFF, $ENDSTYLEEND
Formatting an FML Report
1890

The output is shown in the following image.
Example: Specifying an Indentation Value for FML Hierarchy Captions
The following request specifies an indentation of .25 for each level of an FML hierarchy. Thisnumber is expressed in the default unit of measurement, which is inches:
SET PAGE-NUM=NOPAGESET BLANKINDENT=.25SET FORMULTIPLE=ONTABLE FILE CENTGLPRINT GL_ACCOUNT_PARENTFOR GL_ACCOUNT3000 AS CAPTION OVER3000 GET CHILDREN 2 AS CAPTION
ON TABLE SET STYLE *TYPE = REPORT, GRID = OFF, $ENDSTYLEEND
25. Creating Financial Reports With Financial Modeling Language (FML)
Creating Reports With TIBCO® WebFOCUS Language 1891

The output is shown in the following image.
Suppressing the Display of Rows
You may sometimes wish to retrieve data in a TAG row solely for use in a calculation, withoutdisplaying the row in a report. To suppress the display of a tag row, add the word NOPRINT tothe row declaration, as in a TABLE request.
You may also wish to suppress the display of a TAG row if no data is found for the values. Formore information, see Suppressing Rows With No Data on page 1893.
In addition, you can suppress the display of RECAP rows by adding the word NOPRINT to theRECAP command, following the semicolon. This technique is useful to suppress the display ofan intermediate RECAP value, which is intended for use as input to other calculations.
Example: Suppressing the Display of a TAG Row
This example uses the value of COST in its computation, but does not display COST as a rowin the report.
Suppressing the Display of Rows
1892

DEFINE FILE REGIONAMOUNT/I5C=E_ACTUAL;END TABLE FILE REGIONSUM AMOUNT FOR ACCOUNT3000 AS 'SALES' LABEL SLS OVER 3100 AS 'COST' LABEL COST NOPRINT OVER RECAP PROFIT/I5C = SLS - COST; OVER" " OVERRECAP ROS/F6.2 = 100*PROFIT/SLS;AS 'RETURN ON SALES'END
The output is shown in the following image.
Suppressing Rows With No Data
The text for a tag row is displayed even if no data is found in the file for the tag values, with aperiod (.) representing the missing data. You can override this convention by adding the phraseWHEN EXISTS to the definition of a TAG row. This makes displaying a row dependent upon theexistence of data for the tag. This feature is useful, for example, when the same model isapplied to different divisions in a company.
Example: Suppressing Rows With No Data
In this example, assume that the variable DIVISION contains Division 1, a real estatesyndicate, and Division 2, a bank. The following request describes their balance sheets in oneFML report. Rows that are irrelevant for each division are not displayed.
TABLE FILE LEDGERHEADING CENTER"BALANCE SHEET FOR DIVISION <DIVISION"" "SUM AMOUNTBY DIVISION NOPRINTON DIVISION PAGE-BREAKFOR ACCOUNT 2000 AS 'LAND' WHEN EXISTS LABEL LD OVER 2100 AS 'CAR LOANS' WHEN EXISTS LABEL LOAN OVER . . .
25. Creating Financial Reports With Financial Modeling Language (FML)
Creating Reports With TIBCO® WebFOCUS Language 1893

Saving and Retrieving Intermediate Report Results
Many reports require results developed in prior reports. This can be accomplished only if aplace is provided for storing intermediate values. An example is the need to compute net profitin an Income Statement prior to calculating equity in a Balance Sheet. FML can save selectedrows from one or more models by posting them to a work file. The posted rows can then bepicked up from the work file and reused.
The default work file is FOCPOST. This is a comma-delimited file from which you can reportdirectly if a FOCPOST Master File is available. In order to use the work file in a request, youmust assign a physical name to the FOCPOST ddname before running the report that posts thedata, and again before running the report that picks up the data.
You can assign the physical name to the file by issuing a FILEDEF command on Windows andUNIX, or a TSO ALLOCATE or DYNAM ALLOCATE command on z/OS, before the request is run.You may create a FILEDEF command by using the Allocation Wizard.
While you cannot prepare an FML report entirely from data that you supply directly in yourrequest, you can prepare a report entirely from data that is stored in a comma-delimited workfile.
Posting Data
You can save any TAG, RECAP, or DATA row by posting the output to a file. You can use theserows as though they were provided in a DATA row.
The row is processed in the usual manner in the report, depending on its other options, andthen posted. The label of the row is written first, followed by the numeric values of thecolumns, each comma-separated, and ending with the terminator character ($). For moreinformation, see Posting Rows to a Work File on page 1895.
Note: Only fields that are actually displayed on the report output are posted. Fields that are notprinted (for example, fields specified with the NOPRINT option, extra fields that are createdwhen you reformat fields in the request, or fields implied by use in a calculation) are notposted.
Saving and Retrieving Intermediate Report Results
1894
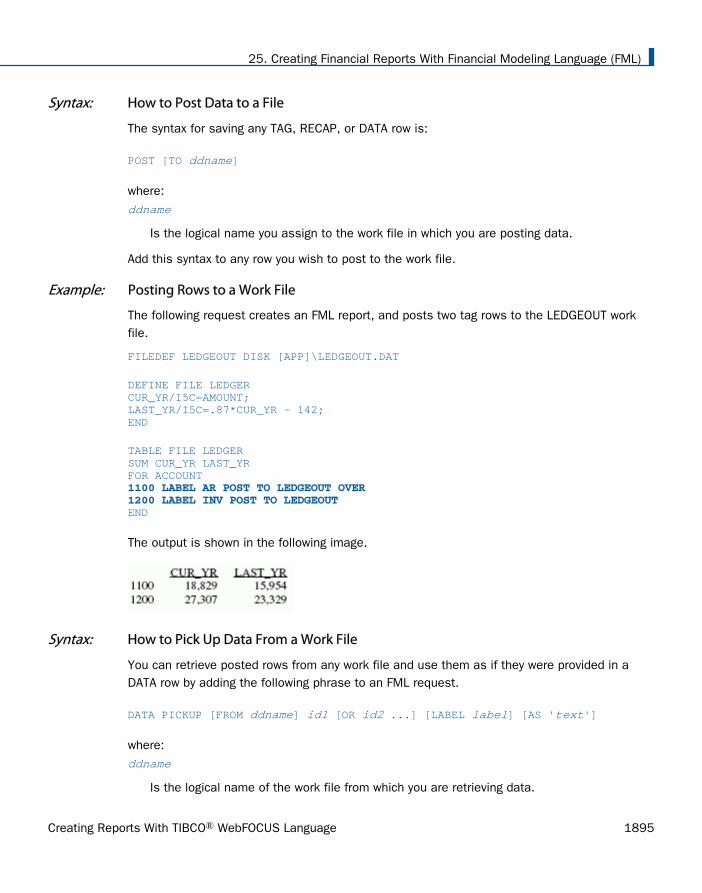
Syntax: How to Post Data to a File
The syntax for saving any TAG, RECAP, or DATA row is:
POST [TO ddname]
where:ddname
Is the logical name you assign to the work file in which you are posting data.
Add this syntax to any row you wish to post to the work file.
Example: Posting Rows to a Work File
The following request creates an FML report, and posts two tag rows to the LEDGEOUT workfile.
FILEDEF LEDGEOUT DISK [APP]\LEDGEOUT.DAT
DEFINE FILE LEDGERCUR_YR/I5C=AMOUNT;LAST_YR/I5C=.87*CUR_YR - 142;END
TABLE FILE LEDGERSUM CUR_YR LAST_YRFOR ACCOUNT 1100 LABEL AR POST TO LEDGEOUT OVER 1200 LABEL INV POST TO LEDGEOUT END
The output is shown in the following image.
Syntax: How to Pick Up Data From a Work File
You can retrieve posted rows from any work file and use them as if they were provided in aDATA row by adding the following phrase to an FML request.
DATA PICKUP [FROM ddname] id1 [OR id2 ...] [LABEL label] [AS 'text']
where: ddname
Is the logical name of the work file from which you are retrieving data.
25. Creating Financial Reports With Financial Modeling Language (FML)
Creating Reports With TIBCO® WebFOCUS Language 1895

id
Is the label that was assigned in the work file to the posted row of data that is now beingpicked up.
label
Is the label you wish to assign to the data you are picking up.
The label you assign to the picked data can, but is not required to, match the label (id) ofthe posted data.
You can include LABEL and AS phrases, but WHEN EXISTS is not supported.
Note: The retrieved fields are mapped to all fields (printed or not) in the memory repository(internal matrix) of the report. If the matrix contains columns that do not correspond to thefields in the posted file, the retrieved values may be misaligned. For example, if you reformat afield in the PICKUP request, that field will be represented by two columns in the internal matrix.However, the posted file will have only one value representing that field, and the retrievedvalues will not be mapped properly to the associated columns in the matrix.
Example: Picking Up Data From a Work File
In the following example, the data in the LEDGER data source and in the LEDGEOUT work fileare used in the RECAP calculation. To see how this file was created, refer to Posting Rows to aWork File on page 1895.
Tip: You must assign a logical name to the file by issuing a FILEDEF command on Windowsand UNIX, or a DYNAM ALLOCATE command on z/OS, before the request is run. You maycreate a FILEDEF command by using the Allocation Wizard.
DEFINE FILE LEDGERCUR_YR/I5C=AMOUNT;LAST_YR/I5C=.87*CUR_YR - 142;END
TABLE FILE LEDGERSUM CUR_YR LAST_YRFOR ACCOUNT1010 TO 1030 AS 'CASH' LABEL CASH OVER DATA PICKUP FROM LEDGEOUT AR AS 'ACCOUNTS RECEIVABLE' LABEL AR OVER DATA PICKUP FROM LEDGEOUT INV AS 'INVENTORY' LABEL INV OVERBAR OVERRECAP CUR_ASSET/I5C = CASH + AR + INV;END
Saving and Retrieving Intermediate Report Results
1896

The output is shown in the following image.
The following line can be used to pick up the sum of the two accounts from LEDGEOUT.
DATA PICKUP FROM LEDGEOUT AR OR INVAS 'ACCTS REC AND INVENTORY'
Note: Since the rows in a PICKUP file are stored in standard comma-delimited format, they canbe provided either from a prior posting, or directly by a user.
Creating HOLD Files From FML Reports
A report created with FML can be extracted to a HOLD file in the same way as all other reportscreated with the TABLE language.
In this case, you identify the set of tag values specified for each row by the description field(the AS text supplied in the model). When no text is given for a row, the first tag value is usedautomatically. Therefore, in simple models with only one tag per row and no text, the lines inthe HOLD file contain the single tag value. The rows derived from the RECAP calculation formpart of the HOLD file. Pure text rows (including BAR rows) are omitted.
For HOLD to be supported with RECAP, the format of the RECAP field must be the same as theformat of the original column.
This feature enables you to create new rows in the HOLD file that are the result of calculations.The augmented HOLD file may then be used in a variety of TABLE requests.
Note: You cannot reformat RECAP rows when creating HOLD files.
Example: Creating a Hold File From an FML Report
The following request creates a HOLD file that contains records for CASH, ACCOUNTSRECEIVABLE, INVENTORY, and the RECAP row CURRENT ASSETS.
TABLE FILE LEDGERSUM AMOUNT FOR ACCOUNT1010 TO 1030 AS 'CASH' OVER1100 AS 'ACCOUNTS RECEIVABLE' OVER1200 AS 'INVENTORY' OVERRECAP CA = R1 + R2 + R3; AS 'CURRENT ASSETS' ON TABLE HOLD END
25. Creating Financial Reports With Financial Modeling Language (FML)
Creating Reports With TIBCO® WebFOCUS Language 1897

Query the HOLD file:
>? HOLD DEFINITION OF HOLD FILE: HOLD FIELDNAME ALIAS FORMAT EO1 A 19AMOUNT EO2 I5C
Then report from the HOLD file as:
TABLE FILE HOLDPRINT E01 E02END
The output is shown in the following image.
AMOUNT ------CASH 21,239ACCOUNTS RECEIVABLE 18,829INVENTORY 27,307CURRENT ASSETS 67,375
Creating HOLD Files From FML Reports
1898

Chapter26Creating a Free-Form Report
You can present data in an unrestricted or free-form format using a layout of your owndesign.
Whereas tabular and matrix reports present data in columns and rows for the purpose ofcomparison across records, and graphic reports present data visually using charts andgraphs, free-form reports reflect your chosen positioning of data on a page. Free-formreporting meets your needs when your goal is to present a customized picture of a datasource record on each page of a report.
Note: You can create free-form reports with PDF, HTML, and Styled formats. HTML outputhas all report pages on one HTML page. Page breaks are retained in PDF output.
In this chapter:
Creating a Free-Form Report
Designing a Free-Form Report
Creating a Free-Form Report
You can create a free-form report from a TABLE request that omits the display commands thatcontrol columnar and matrix formatting (PRINT, LIST, SUM, and COUNT). Instead, the requestincludes the following report features:
Heading Contains the body of the report. It displays the text characters,graphic characters, and data fields that make up the report.
Footing Contains the footing of the report. This is the text that appears atthe bottom of each page of the report. The footing may display thesame characters and data fields as the heading.
Prefix operators Indicates field calculations and manipulation.
Temporary fields Derives new values from existing fields in a data source.
Creating Reports With TIBCO® WebFOCUS Language 1899
BY phrases Specifies the report sort order, and determines how many recordsare included on each page.
WHERE criteria Selects records for the report.
When creating a free-form report, you can:
Design your report to include text, data fields, and graphic characters. See Designing aFree-Form Report on page 1903.
Customize the layout of your report. See Laying Out a Free-Form Report on page 1905.
Select the sort order and the records that are included in your report. See Sorting andSelecting Records in a Free-Form Report on page 1906.
Example: Creating a Free-Form Report
Suppose that you are a Personnel Manager and it is your responsibility to administer yourcompany education policies. This education policy states that the number of hours of outsideeducation that an employee may take at the company expense is determined by the number ofhours of in-house education completed by the employee.
To do your job efficiently, you want a report that shows the in-house education history of eachemployee. Each employee information should display on a separate page so that it can beplaced in the employee personnel file and referenced when an employee requests approval totake outside courses.
To meet this requirement, you create the EMPLOYEE EDUCATION HOURS REPORT, whichdisplays a separate page for each employee. Notice that pages 1 and 2 of the report provideinformation about employees in the MIS department, while page 6 provides information for anemployee in the Production department.
Creating a Free-Form Report
1900
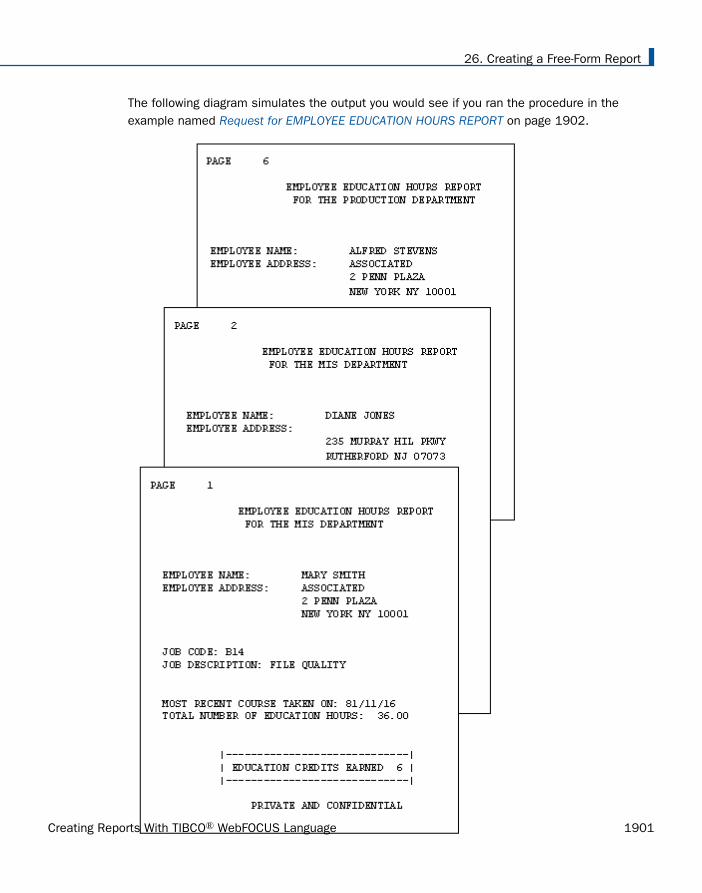
The following diagram simulates the output you would see if you ran the procedure in theexample named Request for EMPLOYEE EDUCATION HOURS REPORT on page 1902.
26. Creating a Free-Form Report
Creating Reports With TIBCO® WebFOCUS Language 1901

Example: Request for EMPLOYEE EDUCATION HOURS REPORT
The following request produces the EMPLOYEE EDUCATION HOURS REPORT. Numbers to theleft of the request correspond to numbers in the following annotations:
1. SET STYLE = OFF SET STYLEMODE=FIXED SET ONLINE-FMT = PDF 2. DEFINE FILE EMPLOYEE CR_EARNED/I2 = IF ED_HRS GE 50 THEN 9 ELSE IF ED_HRS GE 30 THEN 6 ELSE 3; END 3. TABLE FILE EMPLOYEE BY DEPARTMENT 4. HEADING " " "<13>EMPLOYEE EDUCATION HOURS REPORT" 5. "<14>FOR THE <DEPARTMENT DEPARTMENT" 6. "</2" "EMPLOYEE NAME: <23><FIRST_NAME <LAST_NAME>" "EMPLOYEE ADDRESS: <23><ADDRESS_LN1>" "<23><ADDRESS_LN2>" "<23><ADDRESS_LN3>" "</1" "JOB CODE: <JOBCODE>" "JOB DESCRIPTION: <JOB_DESC>" "</1" 7. "MOST RECENT COURSE TAKEN ON: <MAX.DATE_ATTEND>" "TOTAL NUMBER OF EDUCATION HOURS: <ED_HRS>" "</1" 8. "<10>|-------------------------------------|" 9. "<10>| EDUCATION CREDITS EARNED <CR_EARNED>|" "<10>|-------------------------------------|" 10.BY EMP_ID NOPRINT PAGE-BREAK 11.WHERE ED_HRS GT 0 12.FOOTING "<15>PRIVATE AND CONFIDENTIAL" END
The following explains the role of each line of the request in producing the sample report:
1. Two SET commands are required to view the desired display in a browser. The SET STYLE =OFF command enables a free-form design by ignoring default StyleSheet parameters. SETSTYLEMODE = FIXED turns off HTML formatting and allows the report designer to determinewhere items in the report are placed, using spot markers and skip-line commands.
2. The DEFINE command creates a virtual field for the report. The calculation reflects thecompany policy for earning outside education credits. The result is stored in CR_EARNEDand appears later in the report.
3. A free-form report begins with a standard TABLE FILE command. The sample report usesthe EMPLOYEE data source.
Creating a Free-Form Report
1902

4. The heading section, initiated by the HEADING command, defines the body of the report.Most of the text and data fields that display in the report are specified in the headingsection. In this request, the heading section continues until the second BY phrase BYEMP_ID NOPRINT PAGE-BREAK.
5. This line illustrates the following:
The second line of the text in the page heading.
A data field embedded in the text: <DEPARTMENT.
The start position of the line, column 14: <14>.
6. You can enhance the readability of a report using skip-line commands. The command </2,when coded on a line by itself, generates two blank lines, as seen between the pageheading and employee name.
7. This line illustrates how to perform a field calculation in a free-form report using a prefixoperator. In this case, we requested the date on which the most recent course was taken—that is, the maximum value for the DATE_ATTEND field.
8. The next three lines illustrate the use of special characters to create a graphic in thereport. The box around EDUCATION CREDITS EARNED may need adjustment for outputdisplayed in a proportional font.
9. The value of the field created by the DEFINE command displays in the box, highlighting thenumber of education credits an employee has earned. This line demonstrates that you candisplay a virtual field in the body of your report.
10.This line illustrates the use of sorting in a free-form report. The report specifications requirethat information for only one employee displays per page. This is achieved by using the BYand PAGE-BREAK commands. Note that in order to produce a report with page breaks, thereport output must be PDF.
11.You can specify record selection in a free-form report. As a result of the WHERE criterion,the report includes only employees who have accumulated in-house education credits.
12.Since we have designed a personnel report, it is important to have the words PRIVATE ANDCONFIDENTIAL at the end of each report page. The FOOTING command accomplishes this.
Designing a Free-Form Report
To design the body of a free-form report, use the HEADING and FOOTING commands. Theyenable you to:
Incorporate text, data fields, and graphic characters in your report.
Lay out your report by positioning text and data in exact column locations and skippinglines for readability.
26. Creating a Free-Form Report
Creating Reports With TIBCO® WebFOCUS Language 1903

Use the HEADING command to define the body of a free-form report, and the FOOTINGcommand to define what appears at the bottom of each page of a report. A footing is optional.You can define an entire report using just a heading.
Incorporating Text in a Free-Form Report
You can specify text anywhere in a free-form report, for a variety of purposes. In the samplerequest (see the example named Request for EMPLOYEE EDUCATION HOURS REPORT on page1902) text is used:
As a report title:
"<13>EMPLOYEE EDUCATION HOURS REPORT"
As a label for data fields:
"EMPLOYEE NAME: <FIRST_NAME <LAST_NAME>"
With a data field and graphic characters:
"<10>| EDUCATION CREDITS EARNED <CR_EARNED>|"
As a page footing:
"<15>PRIVATE AND CONFIDENTIAL"
Incorporating Data Fields in a Free-Form Report
The crucial element in any report, free-form or otherwise, is the data. The data fields availablein a request include data fields in the Master File, cross-referenced fields, and virtual fieldscreated with the DEFINE command.
The sample request (see Request for EMPLOYEE EDUCATION HOURS REPORT on page 1902)references all three types of data fields:
ED_HRS is found in the EMPLOYEE Master File:
"TOTAL NUMBER OF EDUCATION HOURS: <ED_HRS>"
DATE_ATTEND is found in the EDUCFILE Master File, which is cross-referenced in theEMPLOYEE Master File:
"MOST RECENT COURSE TAKEN ON: <MAX.DATE_ATTEND>"
CR_EARNED is created with the DEFINE command before the TABLE FILE command, and isreferenced as follows:
Designing a Free-Form Report
1904

"<10>| EDUCATION CREDITS EARNED <CR_EARNED>|"
You can also apply a prefix operator to a data field to select a particular value (for example,the maximum value within a sort group) or to perform a calculation (for example, to computethe average value of a field). You can use any available prefix operator in a free-form report.
In the sample request, the MAX prefix operator selects the most recent completion date of anin-house course:
"MOST RECENT COURSE TAKEN ON: <MAX.DATE_ATTEND>"
As is true with all types of reports, you must understand the structure of the data source touse the prefix operators correctly.
Incorporating Graphic Characters in a Free-Form Report
Graphics in a report can be as creative as your imagination. The sample report (see Creating aFree-Form Report on page 1899) uses special characters to enclose text and a virtual field in abox. Some other ideas include:
Highlighting key data fields using asterisks or other special characters available directlyfrom your keyboard, or using the HEXBYT function. See the TIBCO WebFOCUS® UsingFunctions manual for details on HEXBYT.
Enclosing the entire report in a box to give it a form-like appearance.
Using double lines to separate the body of the report from its page heading and pagefooting.
The use of special characters to create graphics is limited by what can be entered and viewedfrom your workstation and what can be printed on your printer. If you have difficulty producingthe graphics that you want, be sure to check with someone in your organization who knowswhat is available.
Laying Out a Free-Form Report
To provide spacing in a report and position text and data fields, use the spot marker feature ofthe HEADING and FOOTING commands.
Note: To take advantage of this feature in an HTML report, include the SET STYLEMODE=FIXEDcommand in your request.
26. Creating a Free-Form Report
Creating Reports With TIBCO® WebFOCUS Language 1905
The sample request (see the example named Request for EMPLOYEE EDUCATION HOURSREPORT on page 1902) illustrates this feature. The first two examples show how to positiontext and data fields on your report, while the third example shows how to skip lines:
The spot marker <13> positions the specified text in column 13 of the report:
"<13>EMPLOYEE EDUCATION HOURS REPORT"
The spot marker <23> positions the specified data field in column 23 of the report:
"<23><ADDRESS_LN2>"
The spot marker </1 on a line by itself skips two lines after displaying the job description:
"JOB DESCRIPTION: <JOB_DESC>""</1""MOST RECENT COURSE TAKEN ON: <MAX.DATE_ATTEND>"
When designing a free-form report, take advantage of sort field options, such as NOPRINT,PAGE-BREAK (PDF output only), and UNDER-LINE. The sample request uses PAGE-BREAK toplace each employee information on a separate page:
BY EMP_ID NOPRINT PAGE-BREAK
Sorting and Selecting Records in a Free-Form Report
As with tabular and matrix reports, you can both sort a report and conditionally select recordsfor it. Use the same commands as for tabular and matrix reports. For example, use the BYphrase to sort a report and define WHERE criteria to select records from the data source.
Designing a Free-Form Report
1906

Chapter27Using SQL to Create Reports
SQL users can issue report requests that combine SQL statements with TABLEformatting phrases to take advantage of a wide range of report preparation options.
These combined requests are supported through the SQL Translator, which convertsANSI Level 2 SQL statements into executable FOCUS requests.
You can use the SQL Translator to retrieve and analyze FOCUS and DBMS data.
In this chapter:
Supported and Unsupported SQL Statements
Using SQL Translator Commands
SQL Translator Support for Date, Time, and Timestamp Fields
Index Optimized Retrieval
TABLEF Optimization
SQL INSERT, UPDATE, and DELETE Commands
Supported and Unsupported SQL Statements
SQL Translation Services is compliant with ANSI Level 2. This facility supports many, but notall, SQL statements. The Reporting Server and specific RDBMS engines may also support thealpha1 CONCAT alpha2 syntax. See Supported SQL Statements on page 1908 and Unsupported SQL Statements on page 1909.
Many of the supported SQL statements are candidates for Dialect Translation. This featureenables a server to route inbound SQL requests to SQL-capable subservers and data adapterswhere possible. Dialect Translation avoids translation to the Reporting Server DataManipulation Language (DML), while maintaining data location transparency. It transforms astandard SQL statement into one that can be processed by the destination SQL engine, whilepreserving the semantic meaning of the statement.
Note: Because the SQL Translator is ANSI Level 2 compliant, some requests that worked inprior releases may no longer work.
Creating Reports With TIBCO® WebFOCUS Language 1907

Reference: Supported SQL Statements
SQL Translation Services supports the following:
SELECT, including SELECT ALL and SELECT DISTINCT.
CREATE TABLE. The following data types are supported for CREATE TABLE: REAL, DOUBLEPRECISION, FLOAT, INTEGER, DECIMAL, CHARACTER, SMALLINT, DATE, TIME, andTIMESTAMP.
INSERT, UPDATE, and DELETE for relational, IMS, and FOCUS data sources.
Equijoins and non-equijoins.
Outer joins, subject to certain restrictions. See SQL Joins on page 1913.
CREATE VIEW and DROP VIEW.
PREPARE and EXECUTE.
Delimited identifiers of table names and column names. Table and column namescontaining embedded blanks or other special characters in the SELECT list should beenclosed in double quotation marks.
Column names qualified by table names or by table tags.
The UNION [ALL], INTERSECT [ALL], and EXCEPT [ALL] operators.
Non-correlated subqueries for all requests in the WHERE predicate and in the FROM list.
Correlated subqueries for requests that are candidates for Dialect Translation to an RDBMSthat supports this feature. Note that correlated subqueries are not supported for FOCUSand other non-relational data sources.
Numeric constants, literals, and expressions in the SELECT list.
Scalar functions for queries that are candidates for Dialect Translation if the RDBMS enginesupports the scalar function type. These include: ABS, CHAR, CHAR_LENGTH, CONCAT,COUNTBY, DATE, DAY, DAYS, DECIMAL, EDIT, EXTRACT, FLOAT, HOUR, IF, INT, INTEGER,LCASE, LENGTH, LOG, LTRIM, MICROSECOND, MILLISECOND, MINUTE, MONTH, POSITION,RTRIM, SECOND, SQRT, SUBSTR (or SUBSTRING), TIME, TIMESTAMP, TRIM, VALUE,UCASE, and YEAR.
The concatenation operator, '||', used with literals or alphanumeric columns.
The following aggregate functions: COUNT, MIN, MAX, SUM, and AVG.
Supported and Unsupported SQL Statements
1908

The following expressions can appear in conditions: CASE, NULLIF, and COALESCE.
Date, time, and timestamp literals of several different formats. See SQL Translator Supportfor Date, Time, and Timestamp Fields on page 1921.
All requests that contain ANY, SOME, and ALL that do not contain =ALL, <>ANY, and<>SOME.
=ALL, <>ANY, and <>SOME for requests that are candidates for Dialect Translation if theRDBMS engine supports quantified subqueries.
The special registers USER, CURRENT_DATE, CURRENT_TIME, CURRENT_TIMESTAMP,CURRENT_EDASQLVERSION, and CURRENT_TIMEZONE.
NULL and NOT NULL predicates.
LIKE and NOT LIKE predicates.
IN and NOT IN predicates.
Date and time arithmetic.
EXISTS and NOT EXISTS predicates.
GROUP BY clauses expressed using explicit column names, AS names, or columnpositions.
ORDER BY clauses expressed using explicit column names or column numbers.
FOR FETCH ONLY feature to circumvent record locking.
Continental Decimal Notation (CDN) when the CDN variable is set.
National Language Support (NLS).
Reference: Unsupported SQL Statements
SQL Translation Services does not support the following:
More than 15 joins per SELECT. This limit is set by SQL. FOCUS supports up to 16 joins.
ALIAS names in Master Files and the use of formatting options to format output.
Unique truncations of column names.
Temporary defined columns. Permanent defined columns, defined in the Reporting ServerDynamic Catalog or in the Master File, are supported.
27. Using SQL to Create Reports
Creating Reports With TIBCO® WebFOCUS Language 1909

Correlated subqueries for DML Generation.
Reference: SQL Translator Reserved Words
The following words may not be used as field names in a Master File that is used with the SQLTranslator:
ALL
COUNT
SUM
MAX
MIN
AVG
CURRENT
DISTINCT
USER
Using SQL Translator Commands
The SQL command may be used to report from any supported data source or set of datasources. Standard TABLE phrases for formatting reports can be appended to the SQLstatements to take advantage of a wide range of report preparation options.
Note: If you need to join data sources for your request, you have two options: use the JOINcommand before you issue any SQL statements, or use the WHERE predicate in the SQLSELECT statement to join the required files dynamically. See SQL Joins on page 1913.
Syntax: How to Use SQL Translator Commands
SQL sql statement;[ECHO|FILE][TABLE phrases]END
where:
SQL
Is the SQL command identifier, which invokes the SQL Translator.
Using SQL Translator Commands
1910

Note: The SQL command components must appear in the order represented above.
sql statement
Is a supported SQL statement. The statement must be terminated by a semicolon (;). Itcan continue for more than one line. See Supported SQL Statements on page 1908.
Within the SQL statement, field names are limited to 48 characters (an ANSI standardLevel 2 limitation). View names generated through the SQL CREATE VIEW statement arelimited to 18 characters and subqueries can be nested up to 15 levels deep. Correlatedsubqueries are not supported by FOCUS and other non-relational data sources.
ECHO
Are optional debugging phrases that capture the generated TABLE request. These optionsare placed after the SQL statement.
FILE [name]
Writes the translated TABLE phrases to the named procedure. If you do not supply a filename, a default name is assigned when the request runs. The file is then deleted.
TABLE phrases
Are optional TABLE formatting phrases. See TABLE Formatting Phrases in SQL Requests onpage 1911.
END or QUIT
Is required to terminate the procedure.
Example: Using SQL Translator Commands
The following request contains an SQL statement and TABLE formatting commands:
SQLSELECT BODYTYPE, AVG(MPG), SUM(SALES)FROM CARWHERE RETAIL_COST > 5000GROUP BY BODYTYPE;TABLE HEADING CENTER"AVERAGE MPG AND TOTAL SALES PER BODYTYPE"END
Reference: TABLE Formatting Phrases in SQL Requests
You can include TABLE formatting phrases in an SQL request, subject to the following rules:
Use TABLE formatting phrases with SELECT and UNION only.
Introduce the formatting phrases with the word TABLE.
27. Using SQL to Create Reports
Creating Reports With TIBCO® WebFOCUS Language 1911

You may specify headings and footings, describe actions with an ON phrase, or use the ONTABLE SET command. Additionally, you can use ON TABLE HOLD or ON TABLE PCHOLD tocreate an extract file. You can also specify READLIMIT and RECORDLIMIT tests.
For details on headings and footings, see Using Headings, Footings, Titles, and Labels onpage 1519.
For details on ON TABLE HOLD or ON TABLE PCHOLD, see Saving and Reusing Your ReportOutput on page 471.
You cannot specify additional display fields, ACROSS fields, WHERE or IF criteria (otherthan READLIMIT or RECORDLIMIT tests), or calculated values. BY phrases are ignored.
The SQL SELECT Statement
The SQL SELECT statement translates into one or more TABLE PRINT or TABLE SUMcommands, depending on whether individual field display or aggregation is applied in therequest. See Displaying Report Data on page 39.
The SQL statement SELECT * translates to a PRINT of every field in the Master File, and usesall of the fields of the Cartesian product. This is a quick way to display a file, provided it fits ina reasonable number of screens for display, or provided you use ON TABLE HOLD or ON TABLEPCHOLD to retain retrieved data in a file for reuse. See Saving and Reusing Your Report Outputon page 471.
SQL functions (such as COUNT, SUM, MAX, MIN, AVG) are supported in SELECT lists andHAVING conditions. Expressions may be used as function arguments.
The function COUNT (*) translates to a count of the number of records produced by printing allfields in the Master File. This is the same as counting all rows in the Cartesian product thatresults from a SELECT on all fields.
Whenever possible, expressions in the SQL WHERE predicate are translated into correspondingWHERE criteria in the TABLE request. Expressions in SELECT lists generate virtual fields. TheSQL HAVING clauses also translate into corresponding WHERE TOTAL criteria in the TABLErequest. The SQL LIKE operator is translated directly into the corresponding LIKE operator inthe WHERE criteria of the TABLE request. For details on record selection in TABLE requests,see Selecting Records for Your Report on page 217.
Only subqueries based on equality, when the WHERE expression is compared to a subquery byusing an equal (=) sign, are supported. For example: WHERE field = (SELECT ...).
Using SQL Translator Commands
1912

The SQL UNION operator translates to a TABLE request that creates a HOLD file for each datasource specified, followed by a MATCH command with option HOLD OLD-OR-NEW, whichcombines records from both the first (old) data source and the second (new) data source. See Merging Data Sources on page 1157.
For related information, see Supported SQL Statements on page 1908 and How to Use SQLTranslator Commands on page 1910.
Using the SQL SELECT Statement Without a FROM Clause
SELECT without a FROM clause is supported for returning a one-row answer set consisting ofone or more constant values. No Master File is needed for issuing this type of SELECT. Oneuse for this syntax is to test functions. For example, the following SQL SELECT returns a literalvalue and the results of two function calls:
SQLSELECT 'MOD' AS FUNCTION, MOD(6,3) AS MOD1, MOD(5,3) AS MOD2;TABLEON TABLE SET PAGE NOLEADON TABLE SET STYLE *GRID=OFF,$ENDSTYLEEND
The output is shown in the following image.
SQL Joins
When performing SQL joins, the formats of the joined fields must be the same. Join fieldsneed not be indexed, and non-equijoins are supported.
Recursive, outer, and inner joins are supported. Inner join is the default.
Syntax: How to Create an Inner Join
Two syntax variations are supported for inner joins.
Variation 1
SQLSELECT fieldlist FROM file1 [alias1], file2 [alias2][WHERE where_condition];END
27. Using SQL to Create Reports
Creating Reports With TIBCO® WebFOCUS Language 1913

Variation 2
SQLSELECT fieldlist FROM file1 [alias1] INNER JOIN file2 [alias2]ON join_condition [INNER JOIN ...][WHERE where_condition];END
where:
fieldlist
Identifies which fields are retrieved from which data sources.
Joined fields in the SQL WHERE predicate must be qualified if the names are not unique.Specify them with their corresponding file names or file aliases. For example:
{file1|alias1}.field1, {file2|alias2}.field2
FROM
Introduces the data sources to be joined.
file1, file2
Are the data sources to be joined.
alias1, alias2
Are optional alternate names for the data sources to be joined.
where_condition
Is an optional selection condition for the joined answer set. Joined rows that do not satisfythis condition are eliminated from the returned answer set. If omitted in Variation 1, theanswer set is the Cartesian product of the two data sources.
join_condition
Is the join condition.
Using SQL Translator Commands
1914

Syntax: How to Create an Outer Join
SQLSELECT fieldlist FROM file1 {LEFT|RIGHT|FULL} JOIN file2 ON join_condition [{LEFT|RIGHT|FULL} JOIN ...]WHERE where_condition END
where:
fieldlist
Identifies which fields are to be retrieved from which data sources.
Joined fields in the SQL WHERE predicate must be qualified if the names are not unique.Specify them with their corresponding file names or file aliases. For example:
{file1|alias1}.field1, {file2|alias2}.field2
FROM
Introduces the data sources to be joined.
file1, file2
Are the data sources to be joined.
alias1, alias2
Are optional alternate names for the data sources to be joined.
join_condition
Is the join condition. The condition must specify equality. For example, T1.A=T2.B.
where_condition
Is an optional selection condition for the joined answer set. Joined rows that do not satisfythis condition are eliminated from the returned answer set.
Reference: Join Name Assignments From the SQL Translator
Joins issued by the SQL Translator are assigned names in the format:
SQLJNMnn
where:
SQLJNM
Is the SQL Translator join prefix.
27. Using SQL to Create Reports
Creating Reports With TIBCO® WebFOCUS Language 1915

nn
Is a number between 01 and 16 assigned in the order in which the joins are created(FOCUS supports a maximum of 16 joins). The first join has the AS name SQLJNM01, thesecond join is named SQLJNM02, and so on, up to SQLJNM16.
All joins are automatically created and cleared by the SQL Translator. No user-specified joinsare affected.
Example: Using Qualified Field Names in SQL Joins
In the following statement, T.A and U.B are qualified field names:
SQL SELECT T.A, T.B FROM T, U WHERE T.A = U.B;END
Example: Using Recursive SQL Joins
In the following statement, A and B are aliases for the same data source, CAR. The outputfrom CAR is pairs of B values that have the same A values:
SQL SELECT A.SEATS, B.SEATS FROM CAR A, CAR B WHERE A.MODEL = B.MODEL;END
Note that all field names in the SELECT clause must be unique or qualified.
Example: Using SQL Full Outer Joins
In the following statement, B, C, and D are aliases for different data sources:
SQLSELECT B.FIELD1 AS B_FIELD1, B.FIELD2 AS B_FIELD2, D.FIELD1 AS D_FIELD1, D.FIELD2 AS D_FIELD2 FROM ((FILE1 B FULL OUTER JOIN FILE2 C ON B.FIELD2 = C.FIELD2 ) FULL OUTER JOIN FILE3 D ON C.FIELD2 = D.FIELD2 ) WHERE B.FIELD1 < 2 END
Multiple FULL OUTER JOINS are supported. However, they generate from a few to manytemporary HOLD files.
Using SQL Translator Commands
1916

Reference: SQL Join Considerations
In standard SQL, WHERE field='a' selects records where the field has the value 'a' or 'A'.The SQL Translator is case-sensitive and returns the exact value requested (in this case,'a' only).
The SQL comparison operators ANY, SOME, and ALL are supported, with the exception of=ALL, <>ANY, and <>SOME.
Sub-selects are not supported in HAVING conditions.
In a multi-segment structure, parent segments are omitted from reports if no instances oftheir descendant segments exist. This is an inner join.
The SQL Translator applies optimization techniques when constructing joins. See IndexOptimized Retrieval on page 1926.
For related information about index optimization and optimized join statements, see yourServer documentation.
SQL CREATE TABLE and INSERT INTO Commands
SQL Translator supports the commands CREATE TABLE and INSERT INTO table:
CREATE TABLE creates a new data source table. It only generates single-segment MasterFiles.
INSERT INTO inserts a row or block of rows into a table or view. Single-record insert withactual data values is supported.
These commands enable you to create tables to enhance reporting efficiency.
Note: When applications are enabled, the Master File and data source are written to theAPPHOLD directory. When applications are disabled, the Master File and data source arewritten to the TEMP directory.
Reference: Usage Notes for CREATE TABLE and INSERT INTO Commands
According to normal SQL data definition syntax, each CREATE TABLE or INSERT INTOstatement must terminate with a semicolon.
The CREATE TABLE command supports the INTEGER, SMALLINT, FLOAT, CHARACTER,DATE, TIME, TIMESTAMP, DECIMAL, DOUBLE PRECISION and REAL data types. Decimalsare rounded in the DOUBLE PRECISION and REAL data types.
27. Using SQL to Create Reports
Creating Reports With TIBCO® WebFOCUS Language 1917

When using the CREATE TABLE and INSERT INTO commands, the data type FLOAT shouldbe declared with a precision and used in an INSERT INTO command without the 'E'designation. This requires the entire value to be specified without an exponent.
The CHECK and DEFAULT options are not supported with the CREATE TABLE command.
Example: Creating a Table With Single-Record Insert
The following shows a single-record insert, creating the table U with one record:
-* Single-record insert example.-*SQLCREATE TABLE U (A INT, B CHAR(6), C CHAR(6), X INT, Y INT);ENDSQLINSERT INTO U (A,B,C,X,Y) VALUES (10, '123456','654321', 10, 15);END
SQL CREATE VIEW and DROP VIEW Commands
A view is a transient object that inherits most of the characteristics of a table. Like a table, itis composed of rows and columns:
CREATE VIEW creates views. Note that it does not put the view in the system catalog.
DROP VIEW explicitly removes transient tables and views from the environment.
Tip: To use a view, issue a SELECT from it. You cannot issue a TABLE request against the viewbecause the view is not extracted as a physical FOCUS data source. To create a HOLD file forextracted data, specify ON TABLE HOLD after the SQL statements. For details on creatingHOLD files, see Saving and Reusing Your Report Output on page 471.
Using SQL Translator Commands
1918

Syntax: How to Create a View
The SQL Translator supports the following SQL statement:
CREATE VIEW viewname AS subquery ;
where:
viewname
Is the name of the view.
subquery
Is a SELECT statement that nests inside:
A WHERE, HAVING, or SELECT clause of another SELECT.
An UPDATE, DELETE, or INSERT statement.
Another subquery.
Example: Creating and Reporting From an SQL View
The following example creates a view named XYZ:
SQLCREATE VIEW XYZ AS SELECT CAR, MODEL FROM CAR;END
To report from the view, issue:
SQL SELECT CAR, MODEL FROM XYZ;END
According to normal SQL data definition syntax, each CREATE VIEW statement must terminatewith a semicolon.
Example: Dropping an SQL View
The following request removes the XYZ view:
SQL DROP VIEW XYZ;END
27. Using SQL to Create Reports
Creating Reports With TIBCO® WebFOCUS Language 1919

Cartesian Product Style Answer Sets
The SQL Translator automatically generates Cartesian product style answer sets unless youexplicitly turn this feature off. However, it is advisable to leave the CARTESIAN setting on,since turning it off does not comply with ANSI standards. For details on the SET CARTESIANcommand, see Merging Data Sources on page 1157.
Continental Decimal Notation (CDN)
Continental Decimal Notation displays numbers using a comma to mark the decimal positionand periods for separating significant digits into groups of three. This notation is available forSQL Translator requests.
Example: Using CDN to Separate Digits
The following example creates a column defined as 1.2 + SEATS:
SET CDN=ONSQL SELECT SEATS + 1,2 FROM CAR;END
Specifying Field Names in SQL Requests
Specify fields in an SQL request using:
Delimited identifiers. A field name may contain (but not begin with) the symbols ., #, @, _,and $. You must enclose such field names in double quotation marks when referring tothem.
Qualified field names. Qualify a field name with file and file alias names. File alias namesare described in the discussion of joins in SQL Joins on page 1913. See the DescribingData With TIBCO WebFOCUS® Languagemanual for more information.
Field names with embedded blanks and special characters. A SELECT list can specify fieldnames with embedded blanks or other special characters. You must enclose such fieldnames in double quotation marks. Special characters are any characters not listed asdelimited identifiers, and not contained in the national character set of the installed FOCUSenvironment.
Example: Specifying a Field Name With a Delimited Identifier
The following field identifier can be included in a request:
"COUNTRY.NAME"
Using SQL Translator Commands
1920
Example: Qualifying a Delimited Field Name
To qualify the delimited field name COUNTRY.NAME with its file name, use:
CAR."COUNTRY.NAME"
SQL UNION, INTERSECT, and EXCEPT Operators
The SQL UNION, INTERSECT, and EXCEPT operators generate MATCH logic. The number of filesthat can participate is determined by the MATCH limit. UNION with parentheses is supported.
SELECT A UNION SELECT B retrieves rows in A or B or both. (This is equivalent to theMATCH phrase OLD-OR-NEW.)
INTERSECT retrieves rows in both A and B. (This is equivalent to the MATCH phrase OLD-AND-NEW.)
EXCEPT retrieves rows in A, but not B. (This is equivalent to the MATCH phrase OLD-NOT-NEW.)
Match logic merges the contents of your data sources. See Merging Data Sources on page1157.
Numeric Constants, Literals, Expressions, and Functions
The SQL SELECT list, WHERE predicate, and HAVING clause can include numeric constants,literals enclosed in single quotation marks, expressions, and any scalar functions. Internally, avirtual field is created for each of these in the SELECT list. The value of the virtual field isprovided in the answer set.
SQL Translator Support for Date, Time, and Timestamp Fields
Several new data types have been defined for the SQL Translator to support date-time fields inthe WHERE predicate or field list of a SELECT statement.
In addition, time or timestamp columns can be defined in relational or FOCUS data sources,and are accessible to the translator. Values can be entered using INSERT and UPDATEstatements, and displayed in SELECT statements.
Time or timestamp data items (columns or literals) can be compared in conditions. Timevalues or timestamp values can be added to or subtracted from each other, with the resultbeing the difference in number of seconds. Expressions of the form T + 2 HOURS or TS + 5YEARS are allowed. These expressions are translated to calls to the date-time functionsdescribed in the TIBCO WebFOCUS® Using Functions manual.
27. Using SQL to Create Reports
Creating Reports With TIBCO® WebFOCUS Language 1921

All date formats for actual and virtual fields in the Master File are converted to the formYYYYMMDD. If you specify a format that lacks any component, the SQL Translator supplies adefault value for the missing component. To specify a portion of a date, such as the month,use a virtual field with an alphanumeric format.
Reference: SQL Translator Support for Date, Time, and Timestamp Fields
In the following chart, fff represents the second to three decimal places (milliseconds) andffffff represents the second to six decimal places (microseconds).
The following formats are allowed as input to the Translator:
Format USAGE Attribute inMaster File
Date Components
Date YYMD YYYY-MM-DD
Hour HH HH
Hour through minute HHI HH.MM
Hour through second HHIS HH.MM.SS
Hour through millisecond HHISs HH.MM.SS.fff
Hour through microsecond HHISsm HH.MM.SS.ffffff
Year through hour HYYMDH YYYY-MM-DD HH
Year through minute HYYMDI YYYY-MM-DD HH.MM
Year through second HYYMDS YYYY-MM-DD HH.MM.SS
Year through millisecond HYYMDs YYYY-MM-DD HH.MM.SS.fff
Year through microsecond HYYMDm YYYY-MM-DDHH.MM.SS.ffffff
Note:
Time information may be given to the hour, minute, second, or fraction of a second.
SQL Translator Support for Date, Time, and Timestamp Fields
1922

The separator within date information may be either a hyphen or a slash.
The separator within time information must be a colon.
The separator between date and time information must be a space.
Extracting Date-Time Components Using the SQL Translator
The SQL Translator supports several functions that return components from date-time values.Use the EXTRACT statement to extract components.
Use the TRIM function to remove leading and/or trailing patterns from date, time, andtimestamp values. See the TIBCO WebFOCUS® Using Functions manual.
Syntax: How to Use Date, Time, and Timestamp Functions Accepted by the SQL Translator
The following functions return date-time components as integer values. Assume x is a date-time value:
Function Return Value
YEAR(x) year
MONTH(x) month number
DAY(x) day number
HOUR(x) hour
MINUTE(x) minute
SECOND(x) second
MILLISECOND(x) millisecond
MICROSECOND(x) microsecond
27. Using SQL to Create Reports
Creating Reports With TIBCO® WebFOCUS Language 1923

Example: Using SQL Translator Date, Time, and Timestamp Functions
Using the timestamp column TS whose value is '1999-11-23 07:32:16.123456':
YEAR(TS) = 1999MONTH(TS) = 11DAY(TS) = 23HOUR(TS) = 7MINUTE(TS) = 32SECOND(TS) = 16MILLISECOND(TS) = 123MICROSECOND(TS) = 123456
Example: Using SQL Translator Date, Time, and Timestamp Functions in a SELECT Statement
Assume that a FOCUS data source called VIDEOTR2 includes a date-time field namedTRANSDATE.
SQLSELECT TRANSDATE,YEAR(TRANSDATE), MONTH(TRANSDATE),MINUTE(TRANSDATE)FROM VIDEOTR2;FILE VIDSQL END
The SQL Translator produces the following virtual fields for functions, followed by a TABLErequest to display the output:
SET COUNTWIDTH=ON-SET SQLERRNUM = 0;DEFINE FILEVIDEOTR2 TEMPSQLDEF01/I4 MISSING ON NEEDS ALL = HPART(TRANSDATE,'YEAR','I4');SQLDEF02/I2 MISSING ON NEEDS ALL = HPART(TRANSDATE,'MONTH','I2');SQLDEF03/I2 MISSING ON NEEDS ALL = HPART(TRANSDATE,'MINUTE','I2');ENDTABLEF FILE VIDEOTR2PRINT TRANSDATE SQLDEF01 AS 'SQLDEF01' SQLDEF02 AS 'SQLDEF02' SQLDEF03 AS 'SQLDEF03'ON TABLE SET CARTESIAN ONON TABLE SET ASNAMES ONON TABLE SET HOLDLIST PRINTONLYEND
SQL Translator Support for Date, Time, and Timestamp Fields
1924

The output is:
TRANSDATE SQLDEF02 SQLDEF04 SQLDEF051999/06/20 04:14 1999 6 141991/06/27 02:45 1991 6 451996/06/21 01:16 1996 6 161991/06/21 07:11 1991 6 111991/06/20 05:15 1991 6 151999/06/26 12:34 1999 6 341919/06/26 05:45 1919 6 451991/06/21 01:10 1991 6 101991/06/19 07:18 1991 6 181991/06/19 04:11 1991 6 111998/10/03 02:41 1998 10 411991/06/25 01:19 1991 6 191986/02/05 03:30 1986 2 301991/06/24 04:43 1991 6 431991/06/24 02:08 1991 6 81999/10/06 02:51 1999 10 511991/06/25 01:17 1991 6 17
Syntax: How to Use the SQL Translator EXTRACT Function to Extract Date-Time Components
Use the following ANSI standard function to extract date-time components as integer values:
EXTRACT(component FROM value)
where:
component
Is one of the following: YEAR, MONTH, QUARTER, DAY, WEEKDAY, HOUR, MINUTE,SECOND, MILLISECOND, or MICROSECOND.
value
Is a date-time, DATE, TIME, or TIMESTAMP field, constant or expression.
For example, the following are equivalent:
EXTRACT(YEAR FROM TS)YEAR(TS)
Example: Using the EXTRACT Function
SELECT D. EXTRACT(YEAR FROM D), EXTRACT(MONTH FROM D),EXTRACT(DAY FROM D) FROM T
This request produces rows similar to the following:
1999-01-01 1999 1 12000-03-03 2000 3 3
27. Using SQL to Create Reports
Creating Reports With TIBCO® WebFOCUS Language 1925

Index Optimized Retrieval
The SQL Translator improves query performance by generating optimized code that enables theunderlying retrieval engine to access the selected records directly, without scanning allsegment instances.
For more information about index optimization and optimized join statements, see your Serverdocumentation for your platform.
Optimized Joins
The SQL Translator accepts joins in SQL syntax. SQL language joins have no implied direction.The concepts of host and cross-referenced files do not exist in SQL.
The SQL Translator analyzes each join to identify efficient implementation. First, it assignscosts to the candidate joins in the query:
Cost = 1 for an equijoin to a field that can participate as a cross-referenced field accordingto FOCUS join rules. This is common in queries against relational tables with equijoinpredicates in the WHERE clause.
Cost = 16 for an equijoin to a field that cannot participate as a cross-referenced fieldaccording to FOCUS join rules.
Cost = 256 for a non-equijoin or an unrestricted Cartesian product.
The Translator then uses these costs to build a join structure for the query. The order of thetables in the FROM clause of the query influences the first two phases of the join analysis:
1. If there are cost=1 joins from the first table referenced in the FROM clause to the second,from the second table to the third, and so on, the Translator joins the tables in the orderspecified in the query. If not, it goes on to Phase 2.
2. If Phase 1 fails to generate an acceptable join structure, the Translator attempts togenerate a join structure without joining any table to a table that precedes it in the FROMclause. Therefore, this phase always makes the first table referenced in the query the hosttable. If there is no cost=1 join between two tables, or if using one requires changing thetable order, the Translator abandons Phase 2 and implements Phase 3.
3. The Translator generates the join structure from the lowest-cost joins first, and then fromthe more expensive joins as necessary. This sorting process may change the order in whichtables are joined. The efficiency of the join that this procedure generates depends on therelative sizes of the tables being joined.
Index Optimized Retrieval
1926

If the analysis results in joining to a table that cannot participate as a cross-referenced fileaccording to FOCUS rules (because it lacks an index, for example), the Translator generatescode to build an indexed HOLD file, and implements the join with this file. However, the HOLDfile does not participate in the analysis of join order.
TABLEF Optimization
To improve performance, the SQL Translator can be set to generate FOCUS TABLEF commandsinstead of TABLE commands. Take advantage of this optimization using the SET SQLTOPTTFcommand (SQL Translator OPTimization TableF). See Improving Report Processing on page1929.
Syntax: How to Improve Performance Using SQLTOPTTF
SET SQLTOPTTF = {ON|OFF}
where:
ON
Causes TABLEF commands to be generated when possible (for example, if there is no joinor GROUP BY phrase). ON is the default value.
OFF
Causes TABLE commands to be generated.
SQL INSERT, UPDATE, and DELETE Commands
The SQL INSERT, UPDATE, and DELETE commands enable SQL users to manipulate and modifydata:
The INSERT statement introduces new rows into an existing table.
The DELETE statement removes a row or combination of rows from a table.
The UPDATE statement enables users to update a row or group of rows in a table.
You can issue an SQL INSERT, UPDATE, or DELETE command against one segment instance(row) at a time. When you issue one of these commands against a multi-segment Master File:
All fields referenced in the command must be on a single path through the file structure.
The command must explicitly specify (in the WHERE predicate) every key value from the rootto the target segment instance, and this combination of key values must uniquely identifyone segment instance (row) to be affected by the command.
27. Using SQL to Create Reports
Creating Reports With TIBCO® WebFOCUS Language 1927
If you are modifying every field in the row, you can omit the list of field names from thecommand.
The SQL Translator supports subqueries, such as:
INSERT...INTO...SELECT...FROM...
Although each INSERT, UPDATE, or DELETE command can specify only one row, referentialintegrity constraints may produce the following modifications to the data source:
If you delete a segment instance that has descendant segment instances (children), thechildren are automatically deleted.
If you insert a segment for which parent segments are missing, the parent segments areautomatically created.
SQL INSERT, UPDATE, and DELETE Commands
1928

Chapter28Improving Report Processing
The following high-performance methods optimize data retrieval and report processing:
Temporary rotation of network and hierarchical data sources to create an alternateview of the data.
Automatic alternate file views with the AUTOPATH feature.
Automatic indexed retrieval (AUTOINDEX).
Retrieval of pre-sorted data using the TABLEF command.
Preserving the internal matrix of a report using the SAVEMATRIX parameter.
Compiling expressions into machine code to provide faster processing.
Note: These techniques may not be available for all data sources. See your data adapterdocumentation to determine if a technique is valid for your data source.
In this chapter:
Rotating a Data Structure for Enhanced Retrieval
Optimizing Retrieval Speed for TIBCO FOCUS Data Sources
Automatic Indexed Retrieval
Data Retrieval Using TABLEF
Compiling Expressions
Rotating a Data Structure for Enhanced Retrieval
If you are using certain network or hierarchical data sources such as IMS, CA-IDMS/DB, orFOCUS, you can rotate the data source, creating an alternate view which changes some of thesegment relationships and enables you to access the segments in a different order. Byreporting from an alternate view, you can do the following:
Change the access path. For example, you can access data in a lower segment morequickly by promoting that segment to a higher level.
Creating Reports With TIBCO® WebFOCUS Language 1929

Change the path structure of a data source. This option is especially helpful if you wish tocreate a report using several sort fields that are on different paths in the file. By changingthe view of the file hierarchy, all the desired sort fields can be on the same path.
It should be noted that retrieval is controlled by the minimum referenced subtree. For moreinformation, see Understanding the Efficiency of the Minimum Referenced Subtree in theDescribing a Group of Fields chapter in the Describing Data With TIBCO WebFOCUS® Languagemanual.
For example, consider the regular and alternate views below:
Since C is the root segment in the alternate view, particular instances of C can be selectedfaster.
Syntax: How to Request an Alternate View
To request an alternate view, add the name of a field found in the alternate root segment tothe file name in the TABLE command, separated by a period (.):
TABLE FILE filename.fieldname
Rotating a Data Structure for Enhanced Retrieval
1930

Reference: Usage Notes for Restructuring Data
If you use a non-indexed field, each segment instance is retrieved until the specified recordis found. Therefore, this process is less efficient than using an indexed field.
When you use the alternate view feature on a particular child segment, the data retrievedfrom that segment is retrieved in physical order, not logical order. This is because the childbecomes a root segment for the report request, and there are no logical pointers betweenthe child segments of different parents.
Alternate view on an indexed field is a special case that uses the index for retrieval. Whenyou perform an alternate view on an indexed field, you enhance the speed of retrieval.However, you must include an equality test on the indexed field, for example WHERE(MONTH EQ 1) OR (MONTH EQ 2), in order to benefit from the performance improvement.
A field name specified in an alternate file view may not be qualified or exceed 12characters.
Automatic Indexed Retrieval (AUTOINDEX) is never invoked in a TABLE request against analternate file view.
Example: Restructuring Data
Consider the following data structure, in which PROD_CODE is an indexed field:
28. Improving Report Processing
Creating Reports With TIBCO® WebFOCUS Language 1931

You could issue the following request to promote the segment containing PROD_CODE to thetop of the hierarchy, thereby enabling quicker access to the data in that segment.
TABLE FILE SALES.PROD_CODE"SALES OF B10 DISTRIBUTED BY AREA"SUM UNIT_SOLD AND RETAIL_PRICEBY AREAWHERE PROD_CODE EQ 'B10'ON TABLE COLUMN-TOTALEND
Optimizing Retrieval Speed for TIBCO FOCUS Data Sources
When the AUTOPATH parameter in set ON, an optimized retrieval path—that is, one in whichthe lowest retrieved segment is the entry point—is selected dynamically. It is equivalent to thealternate view syntax
TABLE FILE filename.fieldname
where:
fieldname
Is not indexed. Retrieval starts at the segment in which fieldname resides.
The system determines whether optimized retrieval is appropriate by analyzing the fieldsreferenced in a request and the data source structure. For more information on the AUTOPATHparameter, see the Developing Reporting Applications manual.
Automatic Indexed Retrieval
Automatic indexed retrieval (AUTOINDEX) optimizes the speed of data retrieval in FOCUS datasources. To take advantage of automatic indexed retrieval, a TABLE request must contain anequality or range test on an indexed field in the highest segment referenced in the request.
This method is not supported if a:
Range test applies to a packed data value.
Request specifies an alternate view (that is, TABLE FILE filename.fieldname).
Request contains the code BY HIGHEST or BY LOWEST.
For related information on AUTOINDEX, see the Developing Reporting Applications manual.
Optimizing Retrieval Speed for TIBCO FOCUS Data Sources
1932

Syntax: How to Use Indexed Retrieval
SET AUTOINDEX = {ON|OFF}
where:
ON
Uses indexed data retrieval for optimized speed when possible. The request must containan equality or range test on an indexed field in the highest segment referenced in therequest. ON is the default value.
OFF
Uses sequential data retrieval unless a request specifies an indexed view (TABLE FILEfilename.indexed_fieldname) and contains an equality test on indexed_fieldname. In thatcase, indexed data retrieval is automatically performed.
Reference: Usage Notes for Indexed Retrieval
AUTOINDEX is never invoked when the TABLE request contains an alternate file view (thatis, TABLE FILE filename.fieldname).
Even if AUTOINDEX is ON, indexed retrieval is not performed when the TABLE requestcontains BY HIGHEST or BY LOWEST phrases.
When a request specifies an indexed view (as in TABLE FILE filename.indexed_fieldname),indexed retrieval is implemented under the following circumstances:
AUTOINDEX is OFF and the request contains an equality test on the indexed field.
AUTOINDEX is ON and the request contains either an equality or a range (FROM ... TO)test against the indexed field.
28. Improving Report Processing
Creating Reports With TIBCO® WebFOCUS Language 1933

Example: Using Indexed Retrieval
The following Master File is referenced in the examples that follow:
FILENAME=SALES,SUFFIX=FOC, SEGNAME=STOR_SEG,SEGTYPE=S1, FIELDNAME=AREA,ALIAS=LOC,FORMAT=A1,$ SEGNAME=DATE_SEG,PARENT=STOR_SEG,SEGTYPE=SH1, FIELDNAME=DATE,ALIAS=DTE,FORMAT=A4MD, $ SEGNAME=DEPT,PARENT=DATE_SEG,SEGTYPE=S1, FIELDNAME=DEPARTMENT,ALIAS=DEPT,FORMAT=A5,FIELDTYPE=I,$ FIELDNAME=DEPT_CODE,ALIAS=DCODE,FORMAT=A3,FIELDTYPE=I,$ FIELDNAME=PROD_TYPE,ALIAS=PTYPE,FORMAT=A10,FIELDTYPE=I,$ SEGNAME=INVENTORY,PARENT=DEPT,SEGTYPE=S1,$ FIELDNAME=PROD_CODE,ALIAS=PCODE,FORMAT=A3,FIELDTYPE=I,$ FIELDNAME=UNIT_SOLD,ALIAS=SOLD,FORMAT=I5,$ FIELDNAME=RETAIL_PRICE,ALIAS=RP,FORMAT=D5.2M,$ FIELDNAME=DELIVER_AMT,ALIAS=SHIP,FORMAT=I5,$
The following procedure contains an equality test on DEPT_CODE and PROD_CODE.DEPT_CODE is used for indexed retrieval since it is in the higher of the referenced segments.
SET AUTOINDEX=ONTABLE FILE SALESSUM UNIT_SOLD RETAIL_PRICEIF DEPT_CODE EQ 'H01'IF PROD_CODE EQ 'B10'END
If your TABLE request contains an equality or range test against more than one indexed field inthe same segment, AUTOINDEX uses the first index referenced in that segment for retrieval.The following stored procedure contains an equality test against two indexed fields. SinceDEPT_CODE appears before PROD_TYPE in the Master File, AUTOINDEX uses DEPT_CODE forretrieval.
SET AUTOINDEX=ONTABLE FILE SALESSUM UNIT_SOLD AND RETAIL_PRICEIF PROD_TYPE EQ 'STEREO'IF DEPT_CODE EQ 'H01'END
Automatic Indexed Retrieval
1934
Indexed retrieval is not invoked if the equality or range test is run against an indexed field thatdoes not reside in the highest referenced segment. In the following example, indexed retrievalis not performed, because the request contains a reference to AREA, a field in the STOR_SEGsegment:
SET AUTOINDEX=ONTABLE FILE SALESSUM UNIT_SOLD AND RETAIL_PRICEBY AREAIF PROD_CODE EQ 'B10'IF PROD_TYPE EQ 'STEREO'END
Data Retrieval Using TABLEF
TABLEF is a variation of the TABLE command that provides a fast method of retrieving datathat is already stored in the order required for printing and requires no additional sorting.
Using TABLEF, records are retrieved in the logical sequence from the data source. Thestandard report request syntax applies, subject to the following rules:
Any BY phrases must be compatible with the logical sequence of the data source. BYphrases are used only to establish control breaks, not to change the order of the records.
ACROSS phrases are not permitted.
Multiple display commands are not permitted. Only one display command may be used.
After the report is executed, RETYPE, HOLD, and SAVE are not available. However, you canproduce an extract file if you include ON TABLE HOLD or ON TABLE SAVE as part of therequest.
NOSPLIT is not compatible with the TABLEF command, and produces a FOC037 errormessage.
TABLEF can be used with HOLD files and other non-FOCUS data sources when the naturalsort sequence of both the request and the data are the same.
The DST. prefix operator is not permitted.
BORDER styling is not supported with TABLEF.
TABLEF is not supported with SQUEEZE.
28. Improving Report Processing
Creating Reports With TIBCO® WebFOCUS Language 1935

Example: Printing Using Fast Table Retrieval
If you previously created a HOLD file from the EMPLOYEE data source, sorted by theCURR_SAL, LAST_NAME, and FIRST_NAME fields, you can issue the following TABLEF request:
TABLEF FILE HOLDPRINT CURR_SAL AND LAST_NAME AND FIRST_NAMEEND
Compiling Expressions
Compiling expressions into machine code provides faster processing.
Compiling Expressions Using the DEFINES Parameter
The SET DEFINES, SET COMPUTE, and SET MODCOMPUTE commands have been deprecated.Expressions are compiled unless environmental conditions prevent compilation.
Among the benefits of the compiling expressions are:
Compilation of only those expressions that are actually used in the TABLE request.
Much faster execution of expressions containing complex calculations on long packedfields.
Compilation of date expressions.
Reference: Usage Notes for Compiled Expressions
Any expression that cannot be compiled runs without compilation. This does not affectcompilation of other expressions. The following elements in an expression disablecompilation:
Functions. However, expressions that use the following functions can be compiled:YMD, DMY, INT, and DECODE.
CONTAINS, OMITS, LAST.
If compilation is not possible because of environmental conditions, the processing is handledwithout compilation. No message is generated indicating that compilation did not take place.To determine whether it did take place, issue the ? COMPILE command.
Compiling Expressions
1936

AppendixAMaster Files and Diagrams
This appendix contains descriptions and structure diagrams for the sample data sourcesused throughout the documentation.
In this appendix:
EMPLOYEE Data Source
JOBFILE Data Source
EDUCFILE Data Source
SALES Data Source
CAR Data Source
LEDGER Data Source
FINANCE Data Source
REGION Data Source
EMPDATA Data Source
TRAINING Data Source
COURSE Data Source
JOBHIST Data Source
JOBLIST Data Source
LOCATOR Data Source
PERSINFO Data Source
SALHIST Data Source
VIDEOTRK, MOVIES, and ITEMS DataSources
VIDEOTR2 Data Source
Gotham Grinds Data Sources
Century Corp Data Sources
EMPLOYEE Data Source
EMPLOYEE contains sample data about company employees. Its segments are:
EMPINFO
Contains employee IDs, names, and positions.
FUNDTRAN
Specifies employee direct deposit accounts. This segment is unique.
Creating Reports With TIBCO® WebFOCUS Language 1937

PAYINFO
Contains the employee salary history.
ADDRESS
Contains employee home and bank addresses.
SALINFO
Contains data on employee monthly pay.
DEDUCT
Contains data on monthly pay deductions.
EMPLOYEE also contains cross-referenced segments belonging to the JOBFILE and EDUCFILEfiles, also described in this appendix. The segments are:
JOBSEG (from JOBFILE)
Describes the job positions held by each employee.
SKILLSEG (from JOBFILE)
Lists the skills required by each position.
SECSEG (from JOBFILE)
Specifies the security clearance needed for each job position.
ATTNDSEG (from EDUCFILE)
Lists the dates that employees attended in-house courses.
EMPLOYEE Data Source
1938

COURSEG (from EDUCFILE)
Lists the courses that the employees attended.
EMPLOYEE Master File
FILENAME=EMPLOYEE, SUFFIX=FOC SEGNAME=EMPINFO, SEGTYPE=S1 FIELDNAME=EMP_ID, ALIAS=EID, FORMAT=A9, $ FIELDNAME=LAST_NAME, ALIAS=LN, FORMAT=A15, $ FIELDNAME=FIRST_NAME, ALIAS=FN, FORMAT=A10, $ FIELDNAME=HIRE_DATE, ALIAS=HDT, FORMAT=I6YMD, $ FIELDNAME=DEPARTMENT, ALIAS=DPT, FORMAT=A10, $ FIELDNAME=CURR_SAL, ALIAS=CSAL, FORMAT=D12.2M, $ FIELDNAME=CURR_JOBCODE, ALIAS=CJC, FORMAT=A3, $ FIELDNAME=ED_HRS, ALIAS=OJT, FORMAT=F6.2, $ SEGNAME=FUNDTRAN, SEGTYPE=U, PARENT=EMPINFO FIELDNAME=BANK_NAME, ALIAS=BN, FORMAT=A20, $ FIELDNAME=BANK_CODE, ALIAS=BC, FORMAT=I6S, $ FIELDNAME=BANK_ACCT, ALIAS=BA, FORMAT=I9S, $ FIELDNAME=EFFECT_DATE, ALIAS=EDATE, FORMAT=I6YMD, $ SEGNAME=PAYINFO, SEGTYPE=SH1, PARENT=EMPINFO FIELDNAME=DAT_INC, ALIAS=DI, FORMAT=I6YMD, $ FIELDNAME=PCT_INC, ALIAS=PI, FORMAT=F6.2, $ FIELDNAME=SALARY, ALIAS=SAL, FORMAT=D12.2M, $ FIELDNAME=JOBCODE, ALIAS=JBC, FORMAT=A3, $ SEGNAME=ADDRESS, SEGTYPE=S1, PARENT=EMPINFO FIELDNAME=TYPE, ALIAS=AT, FORMAT=A4, $ FIELDNAME=ADDRESS_LN1, ALIAS=LN1, FORMAT=A20, $ FIELDNAME=ADDRESS_LN2, ALIAS=LN2, FORMAT=A20, $ FIELDNAME=ADDRESS_LN3, ALIAS=LN3, FORMAT=A20, $ FIELDNAME=ACCTNUMBER, ALIAS=ANO, FORMAT=I9L, $ SEGNAME=SALINFO, SEGTYPE=SH1, PARENT=EMPINFO FIELDNAME=PAY_DATE, ALIAS=PD, FORMAT=I6YMD, $ FIELDNAME=GROSS, ALIAS=MO_PAY, FORMAT=D12.2M, $ SEGNAME=DEDUCT, SEGTYPE=S1, PARENT=SALINFO FIELDNAME=DED_CODE, ALIAS=DC, FORMAT=A4, $ FIELDNAME=DED_AMT, ALIAS=DA, FORMAT=D12.2M, $ SEGNAME=JOBSEG, SEGTYPE=KU, PARENT=PAYINFO, CRFILE=JOBFILE, CRKEY=JOBCODE,$ SEGNAME=SECSEG, SEGTYPE=KLU, PARENT=JOBSEG, CRFILE=JOBFILE, $ SEGNAME=SKILLSEG, SEGTYPE=KL, PARENT=JOBSEG, CRFILE=JOBFILE, $ SEGNAME=ATTNDSEG, SEGTYPE=KM, PARENT=EMPINFO, CRFILE=EDUCFILE, CRKEY=EMP_ID,$ SEGNAME=COURSEG, SEGTYPE=KLU, PARENT=ATTNDSEG, CRFILE=EDUCFILE,$
A. Master Files and Diagrams
Creating Reports With TIBCO® WebFOCUS Language 1939

EMPLOYEE Structure Diagram
The EMPLOYEE structure follows:
JOBFILE Data Source
JOBFILE contains sample data about company job positions. Its segments are:
JOBSEG
Describes what each position is. The field JOBCODE in this segment is indexed.
JOBFILE Data Source
1940
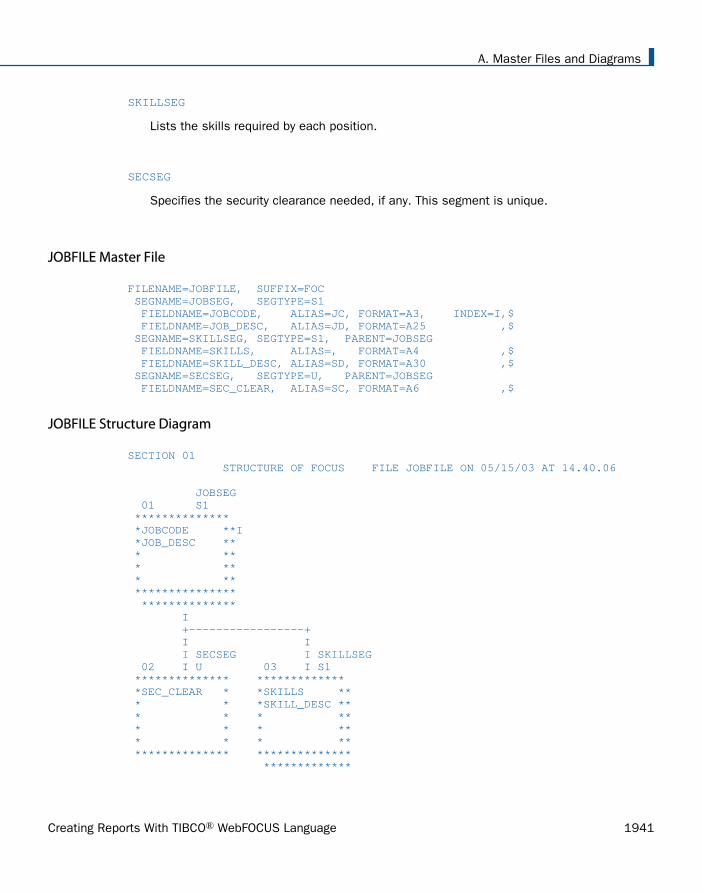
SKILLSEG
Lists the skills required by each position.
SECSEG
Specifies the security clearance needed, if any. This segment is unique.
JOBFILE Master File
FILENAME=JOBFILE, SUFFIX=FOC SEGNAME=JOBSEG, SEGTYPE=S1 FIELDNAME=JOBCODE, ALIAS=JC, FORMAT=A3, INDEX=I,$ FIELDNAME=JOB_DESC, ALIAS=JD, FORMAT=A25 ,$ SEGNAME=SKILLSEG, SEGTYPE=S1, PARENT=JOBSEG FIELDNAME=SKILLS, ALIAS=, FORMAT=A4 ,$ FIELDNAME=SKILL_DESC, ALIAS=SD, FORMAT=A30 ,$ SEGNAME=SECSEG, SEGTYPE=U, PARENT=JOBSEG FIELDNAME=SEC_CLEAR, ALIAS=SC, FORMAT=A6 ,$
JOBFILE Structure Diagram
SECTION 01 STRUCTURE OF FOCUS FILE JOBFILE ON 05/15/03 AT 14.40.06 JOBSEG 01 S1 ************** *JOBCODE **I *JOB_DESC ** * ** * ** * ** *************** ************** I +-----------------+ I I I SECSEG I SKILLSEG 02 I U 03 I S1 ************** ************* *SEC_CLEAR * *SKILLS ** * * *SKILL_DESC ** * * * ** * * * ** * * * ** ************** ************** *************
A. Master Files and Diagrams
Creating Reports With TIBCO® WebFOCUS Language 1941

EDUCFILE Data Source
EDUCFILE contains sample data about company in-house courses. Its segments are:
COURSEG
Contains data on each course.
ATTNDSEG
Specifies which employees attended the courses. Both fields in the segment are keyfields. The field EMP_ID in this segment is indexed.
EDUCFILE Master File
FILENAME=EDUCFILE, SUFFIX=FOC SEGNAME=COURSEG, SEGTYPE=S1 FIELDNAME=COURSE_CODE, ALIAS=CC, FORMAT=A6, $ FIELDNAME=COURSE_NAME, ALIAS=CD, FORMAT=A30, $ SEGNAME=ATTNDSEG, SEGTYPE=SH2, PARENT=COURSEG FIELDNAME=DATE_ATTEND, ALIAS=DA, FORMAT=I6YMD, $ FIELDNAME=EMP_ID, ALIAS=EID, FORMAT=A9, INDEX=I, $
EDUCFILE Data Source
1942

EDUCFILE Structure Diagram
SECTION 01 STRUCTURE OF FOCUS FILE EDUCFILE ON 05/15/03 AT 14.45.44 COURSEG 01 S1 ************** *COURSE_CODE ** *COURSE_NAME ** * ** * ** * ** *************** ************** I I I I ATTNDSEG 02 I SH2 ************** *DATE_ATTEND ** *EMP_ID **I * ** * ** * ** *************** **************
SALES Data Source
SALES contains sample data about a dairy company with an affiliated store chain. Itssegments are:
STOR_SEG
Lists the stores buying the products.
DAT_SEG
Contains the dates of inventory.
PRODUCT
Contains sales data for each product on each date. The PROD_CODE field is indexed. TheRETURNS and DAMAGED fields have the MISSING=ON attribute.
A. Master Files and Diagrams
Creating Reports With TIBCO® WebFOCUS Language 1943

SALES Master File
FILENAME=KSALES, SUFFIX=FOC SEGNAME=STOR_SEG, SEGTYPE=S1 FIELDNAME=STORE_CODE, ALIAS=SNO, FORMAT=A3, $ FIELDNAME=CITY, ALIAS=CTY, FORMAT=A15, $ FIELDNAME=AREA, ALIAS=LOC, FORMAT=A1, $ SEGNAME=DATE_SEG, PARENT=STOR_SEG, SEGTYPE=SH1, FIELDNAME=DATE, ALIAS=DTE, FORMAT=A4MD, $ SEGNAME=PRODUCT, PARENT=DATE_SEG, SEGTYPE=S1, FIELDNAME=PROD_CODE, ALIAS=PCODE, FORMAT=A3, FIELDTYPE=I,$ FIELDNAME=UNIT_SOLD, ALIAS=SOLD, FORMAT=I5, $ FIELDNAME=RETAIL_PRICE,ALIAS=RP, FORMAT=D5.2M,$ FIELDNAME=DELIVER_AMT, ALIAS=SHIP, FORMAT=I5, $ FIELDNAME=OPENING_AMT, ALIAS=INV, FORMAT=I5, $ FIELDNAME=RETURNS, ALIAS=RTN, FORMAT=I3, MISSING=ON,$ FIELDNAME=DAMAGED, ALIAS=BAD, FORMAT=I3, MISSING=ON,$
SALES Data Source
1944

SALES Structure Diagram
SECTION 01 STRUCTURE OF FOCUS FILE SALES ON 05/15/03 AT 14.50.28 STOR_SEG 01 S1 ************** *STORE_CODE ** *CITY ** *AREA ** * ** * ** *************** ************** I I I I DATE_SEG 02 I SH1 ************** *DATE ** * ** * ** * ** * ** *************** ************** I I I I PRODUCT 03 I S1 ************** *PROD_CODE **I *UNIT_SOLD ** *RETAIL_PRICE** *DELIVER_AMT ** * ** *************** **************
CAR Data Source
CAR contains sample data about specifications and sales information for rare cars. Itssegments are:
ORIGIN
Lists the country that manufactures the car. The field COUNTRY is indexed.
A. Master Files and Diagrams
Creating Reports With TIBCO® WebFOCUS Language 1945

COMP
Contains the car name.
CARREC
Contains the car model.
BODY
Lists the body type, seats, dealer and retail costs, and units sold.
SPECS
Lists car specifications. This segment is unique.
WARANT
Lists the type of warranty.
EQUIP
Lists standard equipment.
The aliases in the CAR Master File are specified without the ALIAS keyword.
CAR Data Source
1946

CAR Master File
FILENAME=CAR,SUFFIX=FOC SEGNAME=ORIGIN,SEGTYPE=S1 FIELDNAME=COUNTRY,COUNTRY,A10,FIELDTYPE=I,$ SEGNAME=COMP,SEGTYPE=S1,PARENT=ORIGIN FIELDNAME=CAR,CARS,A16,$ SEGNAME=CARREC,SEGTYPE=S1,PARENT=COMP FIELDNAME=MODEL,MODEL,A24,$ SEGNAME=BODY,SEGTYPE=S1,PARENT=CARREC FIELDNAME=BODYTYPE,TYPE,A12,$ FIELDNAME=SEATS,SEAT,I3,$ FIELDNAME=DEALER_COST,DCOST,D7,$ FIELDNAME=RETAIL_COST,RCOST,D7,$ FIELDNAME=SALES,UNITS,I6,$ SEGNAME=SPECS,SEGTYPE=U,PARENT=BODY FIELDNAME=LENGTH,LEN,D5,$ FIELDNAME=WIDTH,WIDTH,D5,$ FIELDNAME=HEIGHT,HEIGHT,D5,$ FIELDNAME=WEIGHT,WEIGHT,D6,$ FIELDNAME=WHEELBASE,BASE,D6.1,$ FIELDNAME=FUEL_CAP,FUEL,D6.1,$ FIELDNAME=BHP,POWER,D6,$ FIELDNAME=RPM,RPM,I5,$ FIELDNAME=MPG,MILES,D6,$ FIELDNAME=ACCEL,SECONDS,D6,$ SEGNAME=WARANT,SEGTYPE=S1,PARENT=COMP FIELDNAME=WARRANTY,WARR,A40,$ SEGNAME=EQUIP,SEGTYPE=S1,PARENT=COMP FIELDNAME=STANDARD,EQUIP,A40,$
A. Master Files and Diagrams
Creating Reports With TIBCO® WebFOCUS Language 1947

CAR Structure Diagram
LEDGER Data Source
LEDGER contains sample accounting data. It consists of one segment, TOP. This data sourceis specified primarily for FML examples. Aliases do not exist for the fields in this Master File,and the commas act as placeholders.
LEDGER Data Source
1948
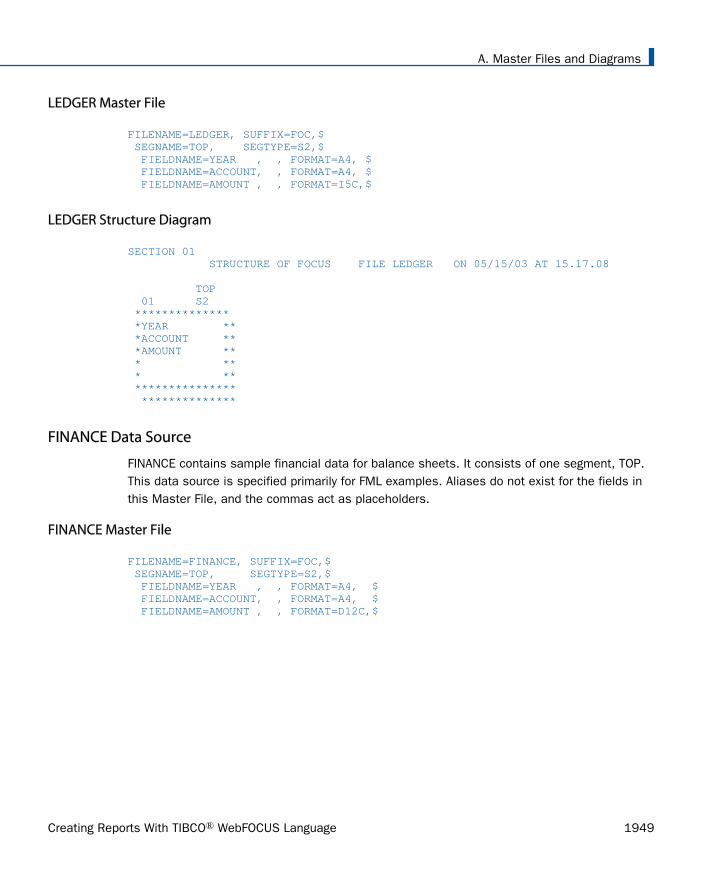
LEDGER Master File
FILENAME=LEDGER, SUFFIX=FOC,$ SEGNAME=TOP, SEGTYPE=S2,$ FIELDNAME=YEAR , , FORMAT=A4, $ FIELDNAME=ACCOUNT, , FORMAT=A4, $ FIELDNAME=AMOUNT , , FORMAT=I5C,$
LEDGER Structure Diagram
SECTION 01 STRUCTURE OF FOCUS FILE LEDGER ON 05/15/03 AT 15.17.08 TOP 01 S2 ************** *YEAR ** *ACCOUNT ** *AMOUNT ** * ** * ** *************** **************
FINANCE Data Source
FINANCE contains sample financial data for balance sheets. It consists of one segment, TOP.This data source is specified primarily for FML examples. Aliases do not exist for the fields inthis Master File, and the commas act as placeholders.
FINANCE Master File
FILENAME=FINANCE, SUFFIX=FOC,$ SEGNAME=TOP, SEGTYPE=S2,$ FIELDNAME=YEAR , , FORMAT=A4, $ FIELDNAME=ACCOUNT, , FORMAT=A4, $ FIELDNAME=AMOUNT , , FORMAT=D12C,$
A. Master Files and Diagrams
Creating Reports With TIBCO® WebFOCUS Language 1949

FINANCE Structure Diagram
SECTION 01 STRUCTURE OF FOCUS FILE FINANCE ON 05/15/03 AT 15.17.08 TOP 01 S2 ************** *YEAR ** *ACCOUNT ** *AMOUNT ** * ** * ** *************** **************
REGION Data Source
REGION contains sample account data for the eastern and western regions of the country. Itconsists of one segment, TOP. This data source is specified primarily for FML examples.Aliases do not exist for the fields in this Master File, and the commas act as placeholders.
REGION Master File
FILENAME=REGION, SUFFIX=FOC,$ SEGNAME=TOP, SEGTYPE=S1,$ FIELDNAME=ACCOUNT, , FORMAT=A4, $ FIELDNAME=E_ACTUAL, , FORMAT=I5C,$ FIELDNAME=E_BUDGET, , FORMAT=I5C,$ FIELDNAME=W_ACTUAL, , FORMAT=I5C,$ FIELDNAME=W_BUDGET, , FORMAT=I5C,$
REGION Structure Diagram
SECTION 01 STRUCTURE OF FOCUS FILE REGION ON 05/15/03 AT 15.18.48 TOP 01 S1 ************** *ACCOUNT ** *E_ACTUAL ** *E_BUDGET ** *W_ACTUAL ** * ** *************** **************
REGION Data Source
1950

EMPDATA Data Source
EMPDATA contains sample data about company employees. It consists of one segment,EMPDATA. The PIN field is indexed. The AREA field is a temporary field.
EMPDATA Master File
FILENAME=EMPDATA, SUFFIX=FOC SEGNAME=EMPDATA, SEGTYPE=S1 FIELDNAME=PIN, ALIAS=ID, FORMAT=A9, INDEX=I, $ FIELDNAME=LASTNAME, ALIAS=LN, FORMAT=A15, $ FIELDNAME=FIRSTNAME, ALIAS=FN, FORMAT=A10, $ FIELDNAME=MIDINITIAL, ALIAS=MI, FORMAT=A1, $ FIELDNAME=DIV, ALIAS=CDIV, FORMAT=A4, $ FIELDNAME=DEPT, ALIAS=CDEPT, FORMAT=A20, $ FIELDNAME=JOBCLASS, ALIAS=CJCLAS, FORMAT=A8, $ FIELDNAME=TITLE, ALIAS=CFUNC, FORMAT=A20, $ FIELDNAME=SALARY, ALIAS=CSAL, FORMAT=D12.2M, $ FIELDNAME=HIREDATE, ALIAS=HDAT, FORMAT=YMD, $$DEFINE AREA/A13=DECODE DIV (NE 'NORTH EASTERN' SE 'SOUTH EASTERN'CE 'CENTRAL' WE 'WESTERN' CORP 'CORPORATE' ELSE 'INVALID AREA');$
EMPDATA Structure Diagram
SECTION 01 STRUCTURE OF FOCUS FILE EMPDATA ON 05/15/03 AT 14.49.09 EMPDATA 01 S1 ************** *PIN **I *LASTNAME ** *FIRSTNAME ** *MIDINITIAL ** * ** *************** **************
TRAINING Data Source
TRAINING contains sample data about training courses for employees. It consists of onesegment, TRAINING. The PIN field is indexed. The EXPENSES, GRADE, and LOCATION fieldshave the MISSING=ON attribute.
A. Master Files and Diagrams
Creating Reports With TIBCO® WebFOCUS Language 1951

TRAINING Master File
FILENAME=TRAINING, SUFFIX=FOC SEGNAME=TRAINING, SEGTYPE=SH3 FIELDNAME=PIN, ALIAS=ID, FORMAT=A9, INDEX=I, $ FIELDNAME=COURSESTART, ALIAS=CSTART, FORMAT=YMD, $ FIELDNAME=COURSECODE, ALIAS=CCOD, FORMAT=A7, $ FIELDNAME=EXPENSES, ALIAS=COST, FORMAT=D8.2, MISSING=ON $ FIELDNAME=GRADE, ALIAS=GRA, FORMAT=A2, MISSING=ON, $ FIELDNAME=LOCATION, ALIAS=LOC, FORMAT=A6, MISSING=ON, $
TRAINING Structure Diagram
SECTION 01 STRUCTURE OF FOCUS FILE TRAINING ON 05/15/03 AT 14.51.28 TRAINING 01 SH3 ************** *PIN **I *COURSESTART ** *COURSECODE ** *EXPENSES ** * ** *************** **************
COURSE Data Source
COURSE contains sample data about education courses. It consists of one segment,CRSELIST.
COURSE Master File
FILENAME=COURSE, SUFFIX=FOC SEGNAME=CRSELIST, SEGTYPE=S1 FIELDNAME=COURSECODE, ALIAS=CCOD, FORMAT=A7, INDEX=I, $ FIELDNAME=CTITLE, ALIAS=COURSE, FORMAT=A35, $ FIELDNAME=SOURCE, ALIAS=ORG, FORMAT=A35, $ FIELDNAME=CLASSIF, ALIAS=CLASS, FORMAT=A10, $ FIELDNAME=TUITION, ALIAS=FEE, FORMAT=D8.2, MISSING=ON, $ FIELDNAME=DURATION, ALIAS=DAYS, FORMAT=A3, MISSING=ON, $ FIELDNAME=DESCRIPTN1, ALIAS=DESC1, FORMAT=A40, $ FIELDNAME=DESCRIPTN2, ALIAS=DESC2, FORMAT=A40, $ FIELDNAME=DESCRIPTN2, ALIAS=DESC3, FORMAT=A40, $
COURSE Data Source
1952

COURSE Structure Diagram
SECTION 01 STRUCTURE OF FOCUS FILE COURSE ON 05/15/03 AT 12.26.05 CRSELIST 01 S1***************COURSECODE **I*CTITLE ***SOURCE ***CLASSIF *** ***************** **************
JOBHIST Data Source
JOBHIST contains information about employee jobs. Both the PIN and JOBSTART fields arekeys. The PIN field is indexed.
JOBHIST Master File
FILENAME=JOBHIST, SUFFIX=FOCSEGNAME=JOBHIST, SEGTYPE=SH2 FIELDNAME=PIN, ALIAS=ID, FORMAT=A9, INDEX=I ,$ FIELDNAME=JOBSTART, ALIAS=SDAT, FORMAT=YMD, $ FIELDNAME=JOBCLASS, ALIAS=JCLASS, FORMAT=A8, $ FIELDNAME=FUNCTITLE, ALIAS=FUNC, FORMAT=A20, $
JOBHIST Structure Diagram
SECTION 01 STRUCTURE OF FOCUS FILE JOBHIST ON 01/22/08 AT 16.23.46 JOBHIST 01 SH2 ************** *PIN **I *JOBSTART ** *JOBCLASS ** *FUNCTITLE ** * ** *************** **************
JOBLIST Data Source
JOBLIST contains information about jobs. The JOBCLASS field is indexed.
A. Master Files and Diagrams
Creating Reports With TIBCO® WebFOCUS Language 1953

JOBLIST Master File
FILENAME=JOBLIST, SUFFIX=FOCSEGNAME=JOBSEG, SEGTYPE=S1 FIELDNAME=JOBCLASS, ALIAS=JCLASS, FORMAT=A8, INDEX=I ,$ FIELDNAME=CATEGORY, ALIAS=JGROUP, FORMAT=A25, $ FIELDNAME=JOBDESC, ALIAS=JDESC, FORMAT=A40, $ FIELDNAME=LOWSAL, ALIAS=LSAL, FORMAT=D12.2M, $ FIELDNAME=HIGHSAL, ALIAS=HSAL, FORMAT=D12.2M, $DEFINE GRADE/A2=EDIT (JCLASS,'$$$99');$DEFINE LEVEL/A25=DECODE GRADE (08 'GRADE 8' 09 'GRADE 9' 10'GRADE 10' 11 'GRADE 11' 12 'GRADE 12' 13 'GRADE 13' 14 'GRADE 14');$
JOBLIST Structure Diagram
SECTION 01 STRUCTURE OF FOCUS FILE JOBLIST ON 01/22/08 AT 16.24.52 JOBSEG 01 S1 ************** *JOBCLASS **I *CATEGORY ** *JOBDESC ** *LOWSAL ** * ** *************** **************
LOCATOR Data Source
JOBHIST contains information about employee location and phone number. The PIN field isindexed.
LOCATOR Master File
FILENAME=LOCATOR, SUFFIX=FOCSEGNAME=LOCATOR, SEGTYPE=S1, FIELDNAME=PIN, ALIAS=ID_NO, FORMAT=A9, INDEX=I, $ FIELDNAME=SITE, ALIAS=SITE, FORMAT=A25, $ FIELDNAME=FLOOR, ALIAS=FL, FORMAT=A3, $ FIELDNAME=ZONE, ALIAS=ZONE, FORMAT=A2, $ FIELDNAME=BUS_PHONE, ALIAS=BTEL, FORMAT=A5, $
LOCATOR Data Source
1954

LOCATOR Structure Diagram
SECTION 01 STRUCTURE OF FOCUS FILE LOCATOR ON 01/22/08 AT 16.26.55 LOCATOR 01 S1 ************** *PIN **I *SITE ** *FLOOR ** *ZONE ** * ** *************** **************
PERSINFO Data Source
PERSINFO contains employee personal information. The PIN field is indexed.
PERSINFO Master File
FILENAME=PERSINFO, SUFFIX=FOCSEGNAME=PERSONAL, SEGTYPE=S1 FIELDNAME=PIN, ALIAS=ID, FORMAT=A9, INDEX=I, $ FIELDNAME=INCAREOF, ALIAS=ICO, FORMAT=A35, $ FIELDNAME=STREETNO, ALIAS=STR, FORMAT=A20, $ FIELDNAME=APT, ALIAS=APT, FORMAT=A4, $ FIELDNAME=CITY, ALIAS=CITY, FORMAT=A20, $ FIELDNAME=STATE, ALIAS=PROV, FORMAT=A4, $ FIELDNAME=POSTALCODE, ALIAS=ZIP, FORMAT=A10, $ FIELDNAME=COUNTRY, ALIAS=CTRY, FORMAT=A15, $ FIELDNAME=HOMEPHONE, ALIAS=TEL, FORMAT=A10, $ FIELDNAME=EMERGENCYNO, ALIAS=ENO, FORMAT=A10, $ FIELDNAME=EMERGCONTACT, ALIAS=ENAME, FORMAT=A35, $ FIELDNAME=RELATIONSHIP, ALIAS=REL, FORMAT=A8, $ FIELDNAME=BIRTHDATE, ALIAS=BDAT, FORMAT=YMD, $
PERSINFO Structure Diagram
SECTION 01 STRUCTURE OF FOCUS FILE PERSINFO ON 01/22/08 AT 16.27.24 PERSONAL 01 S1 ************** *PIN **I *INCAREOF ** *STREETNO ** *APT ** * ** *************** **************
A. Master Files and Diagrams
Creating Reports With TIBCO® WebFOCUS Language 1955

SALHIST Data Source
SALHIST contains information about employee salary history. The PIN field is indexed. Both thePIN and EFFECTDATE fields are keys.
SALHIST Master File
FILENAME=SALHIST, SUFFIX=FOCSEGNAME=SLHISTRY, SEGTYPE=SH2 FIELDNAME=PIN, ALIAS=ID, FORMAT=A9, INDEX=I, $ FIELDNAME=EFFECTDATE, ALIAS=EDAT, FORMAT=YMD, $ FIELDNAME=OLDSALARY, ALIAS=OSAL, FORMAT=D12.2, $
SALHIST Structure Diagram
SECTION 01 STRUCTURE OF FOCUS FILE SALHIST ON 01/22/08 AT 16.28.02 SLHISTRY 01 SH2 ************** *PIN **I *EFFECTDATE ** *OLDSALARY ** * ** * ** *************** **************
VIDEOTRK, MOVIES, and ITEMS Data Sources
VIDEOTRK contains sample data about customer, rental, and purchase information for a videorental business. It can be joined to the MOVIES or ITEMS data source. VIDEOTRK and MOVIESare used in examples that illustrate the use of the Maintain Data facility.
SALHIST Data Source
1956
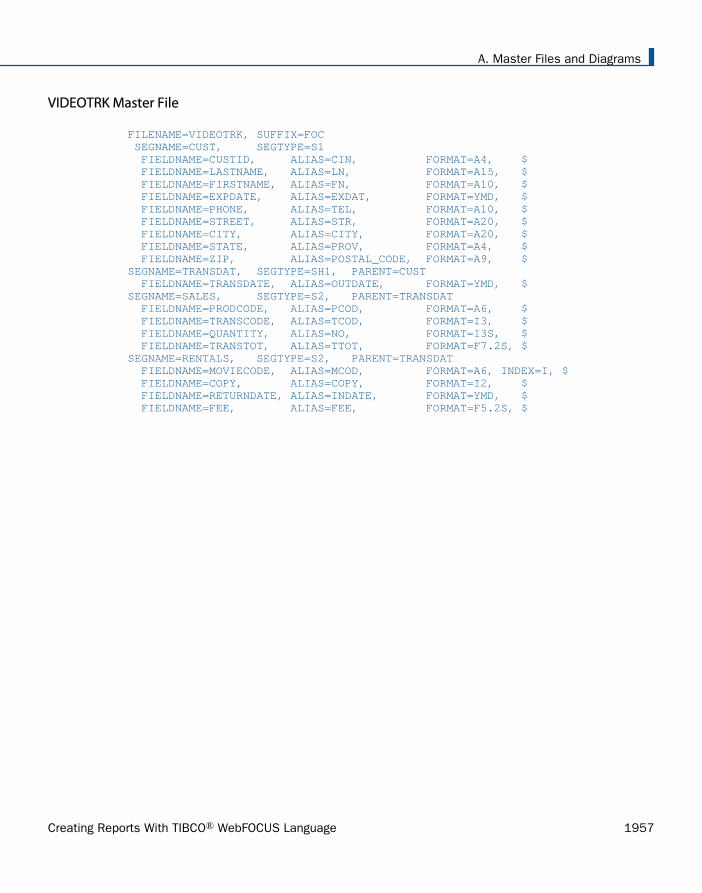
VIDEOTRK Master File
FILENAME=VIDEOTRK, SUFFIX=FOC SEGNAME=CUST, SEGTYPE=S1 FIELDNAME=CUSTID, ALIAS=CIN, FORMAT=A4, $ FIELDNAME=LASTNAME, ALIAS=LN, FORMAT=A15, $ FIELDNAME=FIRSTNAME, ALIAS=FN, FORMAT=A10, $ FIELDNAME=EXPDATE, ALIAS=EXDAT, FORMAT=YMD, $ FIELDNAME=PHONE, ALIAS=TEL, FORMAT=A10, $ FIELDNAME=STREET, ALIAS=STR, FORMAT=A20, $ FIELDNAME=CITY, ALIAS=CITY, FORMAT=A20, $ FIELDNAME=STATE, ALIAS=PROV, FORMAT=A4, $ FIELDNAME=ZIP, ALIAS=POSTAL_CODE, FORMAT=A9, $SEGNAME=TRANSDAT, SEGTYPE=SH1, PARENT=CUST FIELDNAME=TRANSDATE, ALIAS=OUTDATE, FORMAT=YMD, $SEGNAME=SALES, SEGTYPE=S2, PARENT=TRANSDAT FIELDNAME=PRODCODE, ALIAS=PCOD, FORMAT=A6, $ FIELDNAME=TRANSCODE, ALIAS=TCOD, FORMAT=I3, $ FIELDNAME=QUANTITY, ALIAS=NO, FORMAT=I3S, $ FIELDNAME=TRANSTOT, ALIAS=TTOT, FORMAT=F7.2S, $SEGNAME=RENTALS, SEGTYPE=S2, PARENT=TRANSDAT FIELDNAME=MOVIECODE, ALIAS=MCOD, FORMAT=A6, INDEX=I, $ FIELDNAME=COPY, ALIAS=COPY, FORMAT=I2, $ FIELDNAME=RETURNDATE, ALIAS=INDATE, FORMAT=YMD, $ FIELDNAME=FEE, ALIAS=FEE, FORMAT=F5.2S, $
A. Master Files and Diagrams
Creating Reports With TIBCO® WebFOCUS Language 1957

VIDEOTRK Structure Diagram
SECTION 01 STRUCTURE OF FOCUS FILE VIDEOTRK ON 05/15/03 AT 12.25.19 CUST 01 S1***************CUSTID ***LASTNAME ***FIRSTNAME ***EXPDATE *** ***************** ************** I I I I TRANSDAT 02 I SH1***************TRANSDATE *** *** *** *** ***************** ************** I +-----------------+ I I I SALES I RENTALS 03 I S2 04 I S2************** ***************PRODCODE ** *MOVIECODE **I*TRANSCODE ** *COPY ***QUANTITY ** *RETURNDATE ***TRANSTOT ** *FEE *** ** * ***************** *************** ************** **************
VIDEOTRK, MOVIES, and ITEMS Data Sources
1958

MOVIES Master File
FILENAME=MOVIES, SUFFIX=FOC SEGNAME=MOVINFO, SEGTYPE=S1 FIELDNAME=MOVIECODE, ALIAS=MCOD, FORMAT=A6, INDEX=I, $ FIELDNAME=TITLE, ALIAS=MTL, FORMAT=A39, $ FIELDNAME=CATEGORY, ALIAS=CLASS, FORMAT=A8, $ FIELDNAME=DIRECTOR, ALIAS=DIR, FORMAT=A17, $ FIELDNAME=RATING, ALIAS=RTG, FORMAT=A4, $ FIELDNAME=RELDATE, ALIAS=RDAT, FORMAT=YMD, $ FIELDNAME=WHOLESALEPR, ALIAS=WPRC, FORMAT=F6.2, $ FIELDNAME=LISTPR, ALIAS=LPRC, FORMAT=F6.2, $ FIELDNAME=COPIES, ALIAS=NOC, FORMAT=I3, $
MOVIES Structure Diagram
SECTION 01 STRUCTURE OF FOCUS FILE MOVIES ON 05/15/03 AT 12.26.05 MOVINFO 01 S1***************MOVIECODE **I*TITLE ***CATEGORY ***DIRECTOR *** ***************** **************
ITEMS Master File
FILENAME=ITEMS, SUFFIX=FOC SEGNAME=ITMINFO, SEGTYPE=S1 FIELDNAME=PRODCODE, ALIAS=PCOD, FORMAT=A6, INDEX=I, $ FIELDNAME=PRODNAME, ALIAS=PROD, FORMAT=A20, $ FIELDNAME=OURCOST, ALIAS=WCOST, FORMAT=F6.2, $ FIELDNAME=RETAILPR, ALIAS=PRICE, FORMAT=F6.2, $ FIELDNAME=ON_HAND, ALIAS=NUM, FORMAT=I5, $
A. Master Files and Diagrams
Creating Reports With TIBCO® WebFOCUS Language 1959

ITEMS Structure Diagram
SECTION 01 STRUCTURE OF FOCUS FILE ITEMS ON 05/15/03 AT 12.26.05 ITMINFO 01 S1***************PRODCODE **I*PRODNAME ***OURCOST ***RETAILPR *** ***************** **************
VIDEOTR2 Data Source
VIDEOTR2 contains sample data about customer, rental, and purchase information for a videorental business. It consists of four segments.
VIDEOTR2 Master File
FILENAME=VIDEOTR2, SUFFIX=FOC SEGNAME=CUST, SEGTYPE=S1 FIELDNAME=CUSTID, ALIAS=CIN, FORMAT=A4, $ FIELDNAME=LASTNAME, ALIAS=LN, FORMAT=A15, $ FIELDNAME=FIRSTNAME, ALIAS=FN, FORMAT=A10, $ FIELDNAME=EXPDATE, ALIAS=EXDAT, FORMAT=YMD, $ FIELDNAME=PHONE, ALIAS=TEL, FORMAT=A10, $ FIELDNAME=STREET, ALIAS=STR, FORMAT=A20, $ FIELDNAME=CITY, ALIAS=CITY, FORMAT=A20, $ FIELDNAME=STATE, ALIAS=PROV, FORMAT=A4, $ FIELDNAME=ZIP, ALIAS=POSTAL_CODE, FORMAT=A9, $ FIELDNAME=EMAIL, ALIAS=EMAIL, FORMAT=A18, $ SEGNAME=TRANSDAT, SEGTYPE=SH1, PARENT=CUST FIELDNAME=TRANSDATE, ALIAS=OUTDATE, FORMAT=HYYMDI, $ SEGNAME=SALES, SEGTYPE=S2, PARENT=TRANSDAT FIELDNAME=TRANSCODE, ALIAS=TCOD, FORMAT=I3, $ FIELDNAME=QUANTITY, ALIAS=NO, FORMAT=I3S, $ FIELDNAME=TRANSTOT, ALIAS=TTOT, FORMAT=F7.2S, $ SEGNAME=RENTALS, SEGTYPE=S2, PARENT=TRANSDAT FIELDNAME=MOVIECODE, ALIAS=MCOD, FORMAT=A6, INDEX=I, $ FIELDNAME=COPY, ALIAS=COPY, FORMAT=I2, $ FIELDNAME=RETURNDATE, ALIAS=INDATE, FORMAT=YMD, $ FIELDNAME=FEE, ALIAS=FEE, FORMAT=F5.2S, $
VIDEOTR2 Data Source
1960

VIDEOTR2 Structure Diagram
SECTION 01 STRUCTURE OF FOCUS FILE VIDEOTR2 ON 05/15/03 AT 16.45.48 CUST 01 S1 ************** *CUSTID ** *LASTNAME ** *FIRSTNAME ** *EXPDATE ** * ** *************** ************** I I I I TRANSDAT 02 I SH1 ************** *TRANSDATE ** * ** * ** * ** * ** *************** ************** I +-----------------+ I I I SALES I RENTALS 03 I S2 04 I S2 ************** ************** *TRANSCODE ** *MOVIECODE **I *QUANTITY ** *COPY ** *TRANSTOT ** *RETURNDATE ** * ** *FEE ** * ** * ** *************** *************** ************** **************
Gotham Grinds Data Sources
Gotham Grinds is a group of data sources that contain sample data about a specialty itemscompany.
GGDEMOG contains demographic information about the customers of Gotham Grinds, acompany that sells specialty items like coffee, gourmet snacks, and gifts. It consists of onesegment, DEMOG01.
GGORDER contains order information for Gotham Grinds. It consists of two segments,ORDER01 and ORDER02.
A. Master Files and Diagrams
Creating Reports With TIBCO® WebFOCUS Language 1961

GGPRODS contains product information for Gotham Grinds. It consists of one segment,PRODS01.
GGSALES contains sales information for Gotham Grinds. It consists of one segment,SALES01.
GGSTORES contains information for each of Gotham Grinds 12 stores in the United States.It consists of one segment, STORES01.
GGDEMOG Master File
FILENAME=GGDEMOG, SUFFIX=FOC SEGNAME=DEMOG01, SEGTYPE=S1 FIELD=ST, ALIAS=E02, FORMAT=A02, INDEX=I,TITLE='State', DESC='State',$ FIELD=HH, ALIAS=E03, FORMAT=I09, TITLE='Number of Households', DESC='Number of Households',$ FIELD=AVGHHSZ98,ALIAS=E04, FORMAT=I09, TITLE='Average Household Size', DESC='Average Household Size',$ FIELD=MEDHHI98, ALIAS=E05, FORMAT=I09, TITLE='Median Household Income', DESC='Median Household Income',$ FIELD=AVGHHI98, ALIAS=E06, FORMAT=I09, TITLE='Average Household Income', DESC='Average Household Income',$ FIELD=MALEPOP98,ALIAS=E07, FORMAT=I09, TITLE='Male Population', DESC='Male Population',$ FIELD=FEMPOP98, ALIAS=E08, FORMAT=I09, TITLE='Female Population', DESC='Female Population',$ FIELD=P15TO1998,ALIAS=E09, FORMAT=I09, TITLE='15 to 19', DESC='Population 15 to 19 years old',$ FIELD=P20TO2998,ALIAS=E10, FORMAT=I09, TITLE='20 to 29', DESC='Population 20 to 29 years old',$ FIELD=P30TO4998,ALIAS=E11, FORMAT=I09, TITLE='30 to 49', DESC='Population 30 to 49 years old',$ FIELD=P50TO6498,ALIAS=E12, FORMAT=I09, TITLE='50 to 64', DESC='Population 50 to 64 years old',$ FIELD=P65OVR98, ALIAS=E13, FORMAT=I09, TITLE='65 and over', DESC='Population 65 and over',$
Gotham Grinds Data Sources
1962

GGDEMOG Structure Diagram
SECTION 01 STRUCTURE OF FOCUS FILE GGDEMOG ON 05/15/03 AT 12.26.05 GGDEMOG 01 S1***************ST **I*HH ***AVGHHSZ98 ***MEDHHI98 *** ***************** **************
GGORDER Master File
FILENAME=GGORDER, SUFFIX=FOC,$ SEGNAME=ORDER01, SEGTYPE=S1,$ FIELD=ORDER_NUMBER, ALIAS=ORDNO1, FORMAT=I6, TITLE='Order,Number', DESC='Order Identification Number',$ FIELD=ORDER_DATE, ALIAS=DATE, FORMAT=MDY, TITLE='Order,Date', DESC='Date order was placed',$ FIELD=STORE_CODE, ALIAS=STCD, FORMAT=A5, TITLE='Store,Code', DESC='Store Identification Code (for order)',$ FIELD=PRODUCT_CODE, ALIAS=PCD, FORMAT=A4, TITLE='Product,Code', DESC='Product Identification Code (for order)',$ FIELD=QUANTITY, ALIAS=ORDUNITS, FORMAT=I8, TITLE='Ordered,Units', DESC='Quantity Ordered',$SEGNAME=ORDER02, SEGTYPE=KU, PARENT=ORDER01, CRFILE=GGPRODS, CRKEY=PCD,CRSEG=PRODS01 ,$
A. Master Files and Diagrams
Creating Reports With TIBCO® WebFOCUS Language 1963

GGORDER Structure Diagram
SECTION 01 STRUCTURE OF FOCUS FILE GGORDER ON 05/15/03 AT 16.45.48 GGORDER 01 S1 ************** *ORDER_NUMBER** *ORDER_DATE ** *STORE_CODE ** *PRODUCT_CODE** * ** *************** ************** I I I I ORDER02 02 I KU .............. :PRODUCT_ID :K :PRODUCT_DESC: :VENDOR_CODE : :VENDOR_NAME : : : :............:
GGPRODS Master File
FILENAME=GGPRODS, SUFFIX=FOC SEGNAME=PRODS01, SEGTYPE=S1 FIELD=PRODUCT_ID, ALIAS=PCD, FORMAT=A4, INDEX=I, TITLE='Product,Code', DESC='Product Identification Code',$ FIELD=PRODUCT_DESCRIPTION, ALIAS=PRODUCT, FORMAT=A16, TITLE='Product', DESC='Product Name',$ FIELD=VENDOR_CODE, ALIAS=VCD, FORMAT=A4, INDEX=I, TITLE='Vendor ID', DESC='Vendor Identification Code',$ FIELD=VENDOR_NAME, ALIAS=VENDOR, FORMAT=A23, TITLE='Vendor Name', DESC='Vendor Name',$ FIELD=PACKAGE_TYPE, ALIAS=PACK, FORMAT=A7, TITLE='Package', DESC='Packaging Style',$ FIELD=SIZE, ALIAS=SZ, FORMAT=I2, TITLE='Size', DESC='Package Size',$ FIELD=UNIT_PRICE, ALIAS=UNITPR, FORMAT=D7.2, TITLE='Unit,Price', DESC='Price for one unit',$
Gotham Grinds Data Sources
1964

GGPRODS Structure Diagram
SECTION 01 STRUCTURE OF FOCUS FILE GGPRODS ON 05/15/03 AT 12.26.05 GGPRODS 01 S1***************PRODUCT_ID **I*PRODUCT_DESC**I*VENDOR_CODE ***VENDOR_NAME *** ***************** **************
GGSALES Master File
FILENAME=GGSALES, SUFFIX=FOC SEGNAME=SALES01, SEGTYPE=S1 FIELD=SEQ_NO, ALIAS=SEQ, FORMAT=I5, TITLE='Sequence#', DESC='Sequence number in database',$ FIELD=CATEGORY, ALIAS=E02, FORMAT=A11, INDEX=I, TITLE='Category', DESC='Product category',$ FIELD=PCD, ALIAS=E03, FORMAT=A04, INDEX=I, TITLE='Product ID', DESC='Product Identification code (for sale)',$ FIELD=PRODUCT, ALIAS=E04, FORMAT=A16, TITLE='Product', DESC='Product name',$ FIELD=REGION, ALIAS=E05, FORMAT=A11, INDEX=I, TITLE='Region', DESC='Region code',$ FIELD=ST, ALIAS=E06, FORMAT=A02, INDEX=I, TITLE='State', DESC='State',$ FIELD=CITY, ALIAS=E07, FORMAT=A20, TITLE='City', DESC='City',$ FIELD=STCD, ALIAS=E08, FORMAT=A05, INDEX=I, TITLE='Store ID', DESC='Store identification code (for sale)',$ FIELD=DATE, ALIAS=E09, FORMAT=I8YYMD, TITLE='Date', DESC='Date of sales report',$ FIELD=UNITS, ALIAS=E10, FORMAT=I08, TITLE='Unit Sales', DESC='Number of units sold',$ FIELD=DOLLARS, ALIAS=E11, FORMAT=I08, TITLE='Dollar Sales', DESC='Total dollar amount of reported sales',$ FIELD=BUDUNITS, ALIAS=E12, FORMAT=I08, TITLE='Budget Units', DESC='Number of units budgeted',$ FIELD=BUDDOLLARS, ALIAS=E13, FORMAT=I08, TITLE='Budget Dollars', DESC='Total sales quota in dollars',$
A. Master Files and Diagrams
Creating Reports With TIBCO® WebFOCUS Language 1965

GGSALES Structure Diagram
SECTION 01 STRUCTURE OF FOCUS FILE GGSALES ON 05/15/03 AT 12.26.05 GGSALES 01 S1***************SEQ_NO ***CATEGORY **I*PCD **I*PRODUCT **I* ***************** **************
GGSTORES Master File
FILENAME=GGSTORES, SUFFIX=FOC SEGNAME=STORES01, SEGTYPE=S1 FIELD=STORE_CODE, ALIAS=E02, FORMAT=A05, INDEX=I, TITLE='Store ID', DESC='Franchisee ID Code',$ FIELD=STORE_NAME, ALIAS=E03, FORMAT=A23, TITLE='Store Name', DESC='Store Name',$ FIELD=ADDRESS1, ALIAS=E04, FORMAT=A19, TITLE='Contact', DESC='Franchisee Owner',$ FIELD=ADDRESS2, ALIAS=E05, FORMAT=A31, TITLE='Address', DESC='Street Address',$ FIELD=CITY, ALIAS=E06, FORMAT=A22, TITLE='City', DESC='City',$ FIELD=STATE, ALIAS=E07, FORMAT=A02, INDEX=I, TITLE='State', DESC='State',$ FIELD=ZIP, ALIAS=E08, FORMAT=A06, TITLE='Zip Code', DESC='Postal Code',$
GGSTORES Structure Diagram
SECTION 01 STRUCTURE OF FOCUS FILE GGSTORES ON 05/15/03 AT 12.26.05 GGSTORES 01 S1***************STORE_CODE **I*STORE_NAME ***ADDRESS1 ***ADDRESS2 *** ***************** **************
Gotham Grinds Data Sources
1966

Century Corp Data Sources
Century Corp is a consumer electronics manufacturer that distributes products throughretailers around the world. Century Corp has thousands of employees in plants, warehouses,and offices worldwide. Their mission is to provide quality products and services to theircustomers.
Century Corp is a group of data sources that contain financial, human resources, inventory,and order information. The last three data sources are designed to be used with chart ofaccounts data.
CENTCOMP Master File contains location information for stores. It consists of onesegment, COMPINFO.
CENTFIN Master File contains financial information. It consists of one segment, ROOT_SEG.
CENTHR Master File contains human resources information. It consists of one segment,EMPSEG.
CENTINV Master File contains inventory information. It consists of one segment, INVINFO.
CENTORD Master File contains order information. It consists of four segments, OINFO,STOSEG, PINFO, and INVSEG.
CENTQA Master File contains problem information. It consists of three segments,PROD_SEG, INVSEG, and PROB_SEG.
CENTGL Master File contains a chart of accounts hierarchy. The field GL_ACCOUNT_PARENTis the parent field in the hierarchy. The field GL_ACCOUNT is the hierarchy field. The fieldGL_ACCOUNT_CAPTION can be used as the descriptive caption for the hierarchy field.
CENTSYSF Master File contains detail-level financial data. CENTSYSF uses a differentaccount line system (SYS_ACCOUNT), which can be joined to the SYS_ACCOUNT field inCENTGL. Data uses "natural" signs (expenses are positive, revenue negative).
CENTSTMT Master File contains detail-level financial data and a cross-reference to theCENTGL data source.
CENTGLL Master File contains a chart of accounts hierarchy. The fieldGL_ACCOUNT_PARENT is the parent field in the hierarchy. The field GL_ACCOUNT is thehierarchy field. The field GL_ACCOUNT_CAPTION can be used as the descriptive caption forthe hierarchy field.
A. Master Files and Diagrams
Creating Reports With TIBCO® WebFOCUS Language 1967

CENTCOMP Master File
FILE=CENTCOMP, SUFFIX=FOC, FDFC=19, FYRT=00 SEGNAME=COMPINFO, SEGTYPE=S1, $ FIELD=STORE_CODE, ALIAS=SNUM, FORMAT=A6, INDEX=I, TITLE='Store Id#:', DESCRIPTION='Store Id#', $ FIELD=STORENAME, ALIAS=SNAME, FORMAT=A20, WITHIN=STATE, TITLE='Store,Name:', DESCRIPTION='Store Name', $ FIELD=STATE, ALIAS=STATE, FORMAT=A2, WITHIN=PLANT, TITLE='State:', DESCRIPTION=State, $ DEFINE REGION/A5=DECODE STATE ('AL' 'SOUTH' 'AK' 'WEST' 'AR' 'SOUTH' 'AZ' 'WEST' 'CA' 'WEST' 'CO' 'WEST' 'CT' 'EAST' 'DE' 'EAST' 'DC' 'EAST' 'FL' 'SOUTH' 'GA' 'SOUTH' 'HI' 'WEST' 'ID' 'WEST' 'IL' 'NORTH' 'IN' 'NORTH' 'IA' 'NORTH' 'KS' 'NORTH' 'KY' 'SOUTH' 'LA' 'SOUTH' 'ME' 'EAST' 'MD' 'EAST' 'MA' 'EAST' 'MI' 'NORTH' 'MN' 'NORTH' 'MS' 'SOUTH' 'MT' 'WEST' 'MO' 'SOUTH' 'NE' 'WEST' 'NV' 'WEST' 'NH' 'EAST' 'NJ' 'EAST' 'NM' 'WEST' 'NY' 'EAST' 'NC' 'SOUTH' 'ND' 'NORTH' 'OH' 'NORTH' 'OK' 'SOUTH' 'OR' 'WEST' 'PA' 'EAST' 'RI' 'EAST' 'SC' 'SOUTH' 'SD' 'NORTH' 'TN' 'SOUTH' 'TX' 'SOUTH' 'UT' 'WEST' 'VT' 'EAST' 'VA' 'SOUTH' 'WA' 'WEST' 'WV' 'SOUTH' 'WI' 'NORTH' 'WY' 'WEST' 'NA' 'NORTH' 'ON' 'NORTH' ELSE ' ');, TITLE='Region:', DESCRIPTION=Region, $
CENTCOMP Structure Diagram
SECTION 01 STRUCTURE OF FOCUS FILE CENTCOMP ON 05/15/03 AT 10.20.49 COMPINFO 01 S1 ************** *STORE_CODE **I *STORENAME ** *STATE ** * ** * ** *************** **************
Century Corp Data Sources
1968

CENTFIN Master File
FILE=CENTFIN, SUFFIX=FOC, FDFC=19, FYRT=00 SEGNAME=ROOT_SEG, SEGTYPE=S4, $ FIELD=YEAR, ALIAS=YEAR, FORMAT=YY, WITHIN='*Time Period', $ FIELD=QUARTER, ALIAS=QTR, FORMAT=Q, WITHIN=YEAR, TITLE=Quarter, DESCRIPTION=Quarter, $ FIELD=MONTH, ALIAS=MONTH, FORMAT=M, TITLE=Month, DESCRIPTION=Month, $ FIELD=ITEM, ALIAS=ITEM, FORMAT=A20, TITLE=Item, DESCRIPTION=Item, $ FIELD=VALUE, ALIAS=VALUE, FORMAT=D12.2, TITLE=Value, DESCRIPTION=Value, $ DEFINE ITYPE/A12=IF EDIT(ITEM,'9$$$$$$$$$$$$$$$$$$$') EQ 'E' THEN 'Expense' ELSE IF EDIT(ITEM,'9$$$$$$$$$$$$$$$$$$$') EQ 'R' THEN 'Revenue' ELSE 'Asset';, TITLE=Type, DESCRIPTION='Type of Financial Line Item',$ DEFINE MOTEXT/MT=MONTH;,$
CENTFIN Structure Diagram
SECTION 01 STRUCTURE OF FOCUS FILE CENTFIN ON 05/15/03 AT 10.25.52 ROOT_SEG 01 S4 ************** *YEAR ** *QUARTER ** *MONTH ** *ITEM ** * ** *************** **************
A. Master Files and Diagrams
Creating Reports With TIBCO® WebFOCUS Language 1969

CENTHR Master File
FILE=CENTHR, SUFFIX=FOC SEGNAME=EMPSEG, SEGTYPE=S1, $ FIELD=ID_NUM, ALIAS=ID#, FORMAT=I9, TITLE='Employee,ID#', DESCRIPTION='Employee Identification Number', $ FIELD=LNAME, ALIAS=LN, FORMAT=A14, TITLE='Last,Name', DESCRIPTION='Employee Last Name', $ FIELD=FNAME, ALIAS=FN, FORMAT=A12, TITLE='First,Name', DESCRIPTION='Employee First Name', $ FIELD=PLANT, ALIAS=PLT, FORMAT=A3, TITLE='Plant,Location', DESCRIPTION='Location of the manufacturing plant', WITHIN='*Location', $ FIELD=START_DATE, ALIAS=SDATE, FORMAT=YYMD, TITLE='Starting,Date', DESCRIPTION='Date of employment',$ FIELD=TERM_DATE, ALIAS=TERM_DATE, FORMAT=YYMD, TITLE='Termination,Date', DESCRIPTION='Termination Date', $ FIELD=STATUS, ALIAS=STATUS, FORMAT=A10, TITLE='Current,Status', DESCRIPTION='Job Status', $ FIELD=POSITION, ALIAS=JOB, FORMAT=A2, TITLE=Position, DESCRIPTION='Job Position', $ FIELD=PAYSCALE, ALIAS=PAYLEVEL, FORMAT=I2, TITLE='Pay,Level', DESCRIPTION='Pay Level', WITHIN='*Wages',$ DEFINE POSITION_DESC/A17=IF POSITION EQ 'BM' THEN 'Plant Manager' ELSE IF POSITION EQ 'MR' THEN 'Line Worker' ELSE IF POSITION EQ 'TM' THEN 'Line Manager' ELSE 'Technician'; TITLE='Position,Description', DESCRIPTION='Position Description', WITHIN='PLANT',$ DEFINE BYEAR/YY=START_DATE; TITLE='Beginning,Year', DESCRIPTION='Beginning Year', WITHIN='*Starting Time Period',$
Century Corp Data Sources
1970
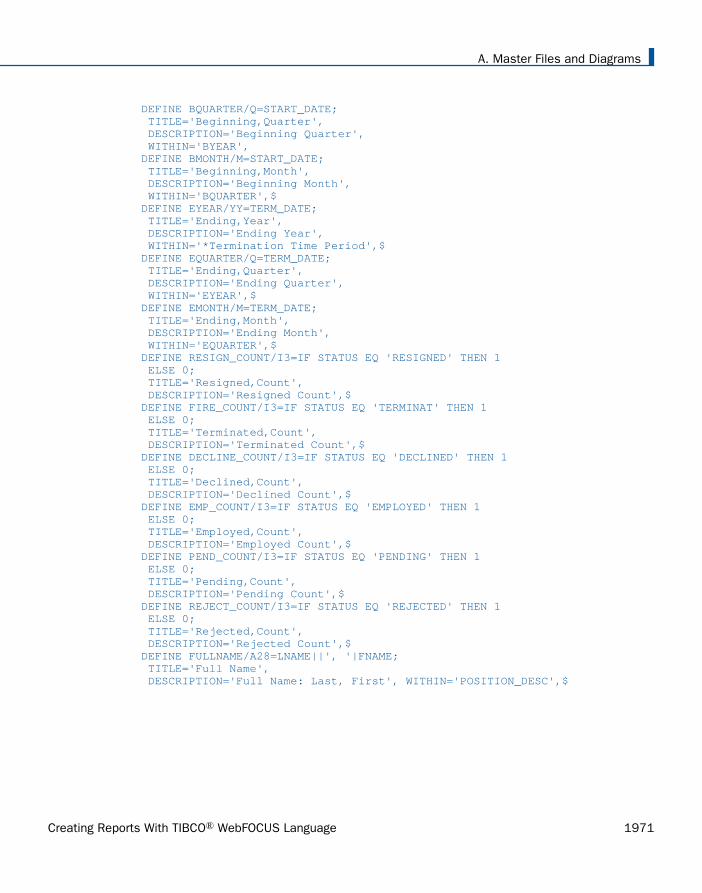
DEFINE BQUARTER/Q=START_DATE; TITLE='Beginning,Quarter', DESCRIPTION='Beginning Quarter', WITHIN='BYEAR', DEFINE BMONTH/M=START_DATE; TITLE='Beginning,Month', DESCRIPTION='Beginning Month', WITHIN='BQUARTER',$ DEFINE EYEAR/YY=TERM_DATE; TITLE='Ending,Year', DESCRIPTION='Ending Year', WITHIN='*Termination Time Period',$ DEFINE EQUARTER/Q=TERM_DATE; TITLE='Ending,Quarter', DESCRIPTION='Ending Quarter', WITHIN='EYEAR',$ DEFINE EMONTH/M=TERM_DATE; TITLE='Ending,Month', DESCRIPTION='Ending Month', WITHIN='EQUARTER',$ DEFINE RESIGN_COUNT/I3=IF STATUS EQ 'RESIGNED' THEN 1 ELSE 0; TITLE='Resigned,Count', DESCRIPTION='Resigned Count',$ DEFINE FIRE_COUNT/I3=IF STATUS EQ 'TERMINAT' THEN 1 ELSE 0; TITLE='Terminated,Count', DESCRIPTION='Terminated Count',$ DEFINE DECLINE_COUNT/I3=IF STATUS EQ 'DECLINED' THEN 1 ELSE 0; TITLE='Declined,Count', DESCRIPTION='Declined Count',$ DEFINE EMP_COUNT/I3=IF STATUS EQ 'EMPLOYED' THEN 1 ELSE 0; TITLE='Employed,Count', DESCRIPTION='Employed Count',$ DEFINE PEND_COUNT/I3=IF STATUS EQ 'PENDING' THEN 1 ELSE 0; TITLE='Pending,Count', DESCRIPTION='Pending Count',$ DEFINE REJECT_COUNT/I3=IF STATUS EQ 'REJECTED' THEN 1 ELSE 0; TITLE='Rejected,Count', DESCRIPTION='Rejected Count',$ DEFINE FULLNAME/A28=LNAME||', '|FNAME; TITLE='Full Name', DESCRIPTION='Full Name: Last, First', WITHIN='POSITION_DESC',$
A. Master Files and Diagrams
Creating Reports With TIBCO® WebFOCUS Language 1971

DEFINE SALARY/D12.2=IF BMONTH LT 4 THEN PAYLEVEL * 12321 ELSE IF BMONTH GE 4 AND BMONTH LT 8 THEN PAYLEVEL * 13827 ELSE PAYLEVEL * 14400;, TITLE='Salary', DESCRIPTION='Salary',$ DEFINE PLANTLNG/A11=DECODE PLANT (BOS 'Boston' DAL 'Dallas' LA 'Los Angeles' ORL 'Orlando' SEA 'Seattle' STL 'St Louis' ELSE 'n/a');$
CENTHR Structure Diagram
SECTION 01 STRUCTURE OF FOCUS FILE CENTHR ON 05/15/03 AT 10.40.34 EMPSEG 01 S1 ************** *ID_NUM ** *LNAME ** *FNAME ** *PLANT ** * ** *************** **************
Century Corp Data Sources
1972
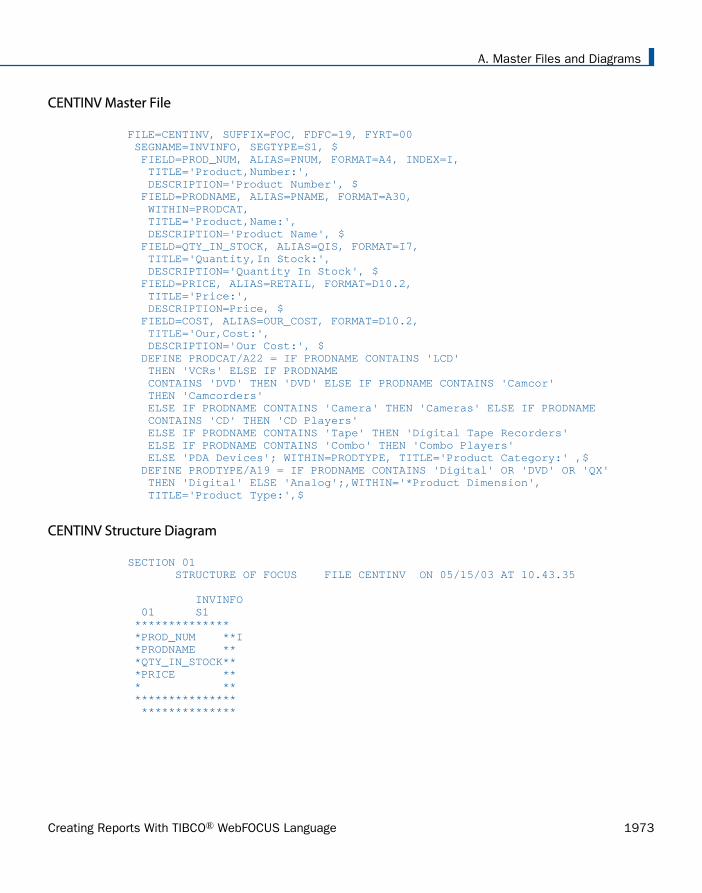
CENTINV Master File
FILE=CENTINV, SUFFIX=FOC, FDFC=19, FYRT=00 SEGNAME=INVINFO, SEGTYPE=S1, $ FIELD=PROD_NUM, ALIAS=PNUM, FORMAT=A4, INDEX=I, TITLE='Product,Number:', DESCRIPTION='Product Number', $ FIELD=PRODNAME, ALIAS=PNAME, FORMAT=A30, WITHIN=PRODCAT, TITLE='Product,Name:', DESCRIPTION='Product Name', $ FIELD=QTY_IN_STOCK, ALIAS=QIS, FORMAT=I7, TITLE='Quantity,In Stock:', DESCRIPTION='Quantity In Stock', $ FIELD=PRICE, ALIAS=RETAIL, FORMAT=D10.2, TITLE='Price:', DESCRIPTION=Price, $ FIELD=COST, ALIAS=OUR_COST, FORMAT=D10.2, TITLE='Our,Cost:', DESCRIPTION='Our Cost:', $ DEFINE PRODCAT/A22 = IF PRODNAME CONTAINS 'LCD' THEN 'VCRs' ELSE IF PRODNAME CONTAINS 'DVD' THEN 'DVD' ELSE IF PRODNAME CONTAINS 'Camcor' THEN 'Camcorders' ELSE IF PRODNAME CONTAINS 'Camera' THEN 'Cameras' ELSE IF PRODNAME CONTAINS 'CD' THEN 'CD Players' ELSE IF PRODNAME CONTAINS 'Tape' THEN 'Digital Tape Recorders' ELSE IF PRODNAME CONTAINS 'Combo' THEN 'Combo Players' ELSE 'PDA Devices'; WITHIN=PRODTYPE, TITLE='Product Category:' ,$ DEFINE PRODTYPE/A19 = IF PRODNAME CONTAINS 'Digital' OR 'DVD' OR 'QX' THEN 'Digital' ELSE 'Analog';,WITHIN='*Product Dimension', TITLE='Product Type:',$
CENTINV Structure Diagram
SECTION 01 STRUCTURE OF FOCUS FILE CENTINV ON 05/15/03 AT 10.43.35 INVINFO 01 S1 ************** *PROD_NUM **I *PRODNAME ** *QTY_IN_STOCK** *PRICE ** * ** *************** **************
A. Master Files and Diagrams
Creating Reports With TIBCO® WebFOCUS Language 1973

CENTORD Master File
FILE=CENTORD, SUFFIX=FOC SEGNAME=OINFO, SEGTYPE=S1, $ FIELD=ORDER_NUM, ALIAS=ONUM, FORMAT=A5, INDEX=I, TITLE='Order,Number:', DESCRIPTION='Order Number', $ FIELD=ORDER_DATE, ALIAS=ODATE, FORMAT=YYMD, TITLE='Date,Of Order:', DESCRIPTION='Date Of Order', $ FIELD=STORE_CODE, ALIAS=SNUM, FORMAT=A6, INDEX=I, TITLE='Company ID#:', DESCRIPTION='Company ID#', $ FIELD=PLANT, ALIAS=PLNT, FORMAT=A3, INDEX=I, TITLE='Manufacturing,Plant', DESCRIPTION='Location Of Manufacturing Plant', WITHIN='*Location',$ DEFINE YEAR/YY=ORDER_DATE;, WITHIN='*Time Period',$ DEFINE QUARTER/Q=ORDER_DATE;, WITHIN='YEAR',$ DEFINE MONTH/M=ORDER_DATE;, WITHIN='QUARTER',$ SEGNAME=PINFO, SEGTYPE=S1, PARENT=OINFO, $ FIELD=PROD_NUM, ALIAS=PNUM, FORMAT=A4,INDEX=I, TITLE='Product,Number#:', DESCRIPTION='Product Number#', $ FIELD=QUANTITY, ALIAS=QTY, FORMAT=I8C, TITLE='Quantity:', DESCRIPTION=Quantity, $ FIELD=LINEPRICE, ALIAS=LINETOTAL, FORMAT=D12.2MC, TITLE='Line,Total', DESCRIPTION='Line Total', $ DEFINE LINE_COGS/D12.2=QUANTITY*COST;, TITLE='Line,Cost Of,Goods Sold', DESCRIPTION='Line cost of goods sold', $ DEFINE PLANTLNG/A11=DECODE PLANT (BOS 'Boston' DAL 'Dallas' LA 'Los Angeles' ORL 'Orlando' SEA 'Seattle' STL 'St Louis' ELSE 'n/a'); SEGNAME=INVSEG, SEGTYPE=DKU, PARENT=PINFO, CRFILE=CENTINV, CRKEY=PROD_NUM, CRSEG=INVINFO,$ SEGNAME=STOSEG, SEGTYPE=DKU, PARENT=OINFO, CRFILE=CENTCOMP, CRKEY=STORE_CODE, CRSEG=COMPINFO,$
Century Corp Data Sources
1974
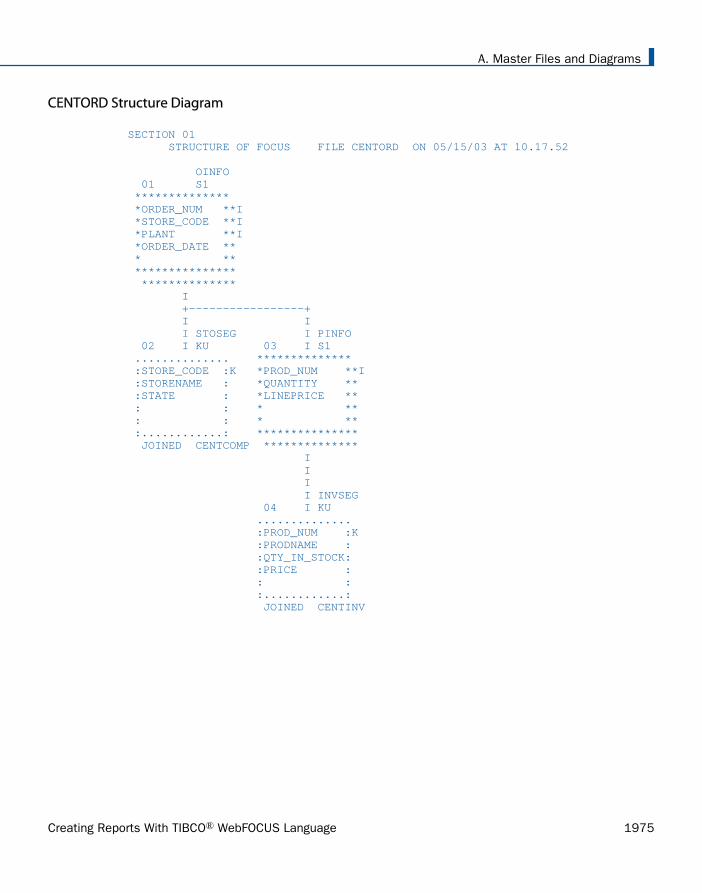
CENTORD Structure Diagram
SECTION 01 STRUCTURE OF FOCUS FILE CENTORD ON 05/15/03 AT 10.17.52 OINFO 01 S1 ************** *ORDER_NUM **I *STORE_CODE **I *PLANT **I *ORDER_DATE ** * ** *************** ************** I +-----------------+ I I I STOSEG I PINFO 02 I KU 03 I S1 .............. ************** :STORE_CODE :K *PROD_NUM **I :STORENAME : *QUANTITY ** :STATE : *LINEPRICE ** : : * ** : : * ** :............: *************** JOINED CENTCOMP ************** I I I I INVSEG 04 I KU .............. :PROD_NUM :K :PRODNAME : :QTY_IN_STOCK: :PRICE : : : :............: JOINED CENTINV
A. Master Files and Diagrams
Creating Reports With TIBCO® WebFOCUS Language 1975
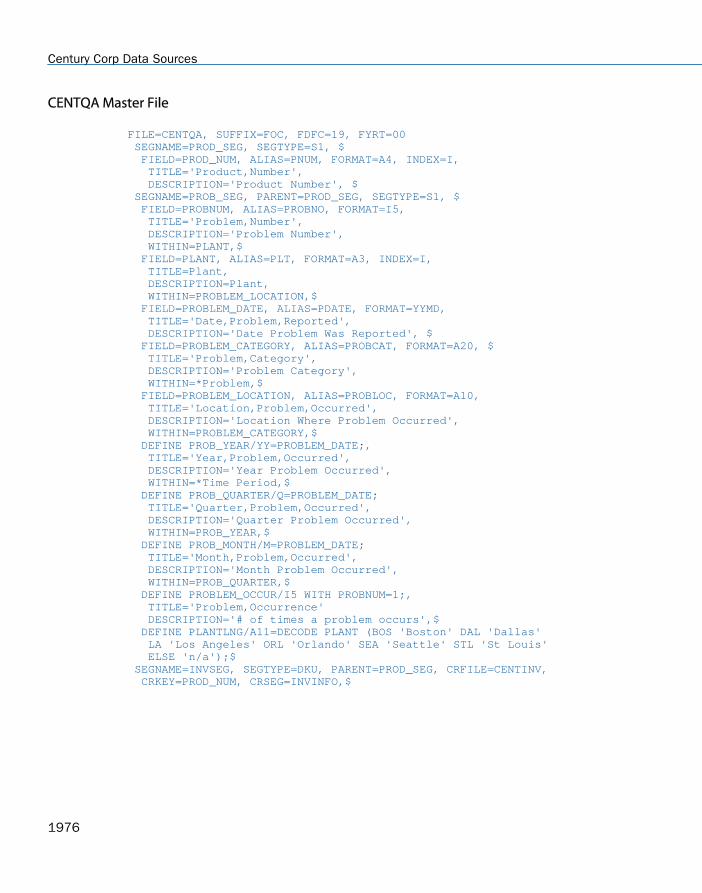
CENTQA Master File
FILE=CENTQA, SUFFIX=FOC, FDFC=19, FYRT=00 SEGNAME=PROD_SEG, SEGTYPE=S1, $ FIELD=PROD_NUM, ALIAS=PNUM, FORMAT=A4, INDEX=I, TITLE='Product,Number', DESCRIPTION='Product Number', $ SEGNAME=PROB_SEG, PARENT=PROD_SEG, SEGTYPE=S1, $ FIELD=PROBNUM, ALIAS=PROBNO, FORMAT=I5, TITLE='Problem,Number', DESCRIPTION='Problem Number', WITHIN=PLANT,$ FIELD=PLANT, ALIAS=PLT, FORMAT=A3, INDEX=I, TITLE=Plant, DESCRIPTION=Plant, WITHIN=PROBLEM_LOCATION,$ FIELD=PROBLEM_DATE, ALIAS=PDATE, FORMAT=YYMD, TITLE='Date,Problem,Reported', DESCRIPTION='Date Problem Was Reported', $ FIELD=PROBLEM_CATEGORY, ALIAS=PROBCAT, FORMAT=A20, $ TITLE='Problem,Category', DESCRIPTION='Problem Category', WITHIN=*Problem,$ FIELD=PROBLEM_LOCATION, ALIAS=PROBLOC, FORMAT=A10, TITLE='Location,Problem,Occurred', DESCRIPTION='Location Where Problem Occurred', WITHIN=PROBLEM_CATEGORY,$ DEFINE PROB_YEAR/YY=PROBLEM_DATE;, TITLE='Year,Problem,Occurred', DESCRIPTION='Year Problem Occurred', WITHIN=*Time Period,$ DEFINE PROB_QUARTER/Q=PROBLEM_DATE; TITLE='Quarter,Problem,Occurred', DESCRIPTION='Quarter Problem Occurred', WITHIN=PROB_YEAR,$ DEFINE PROB_MONTH/M=PROBLEM_DATE; TITLE='Month,Problem,Occurred', DESCRIPTION='Month Problem Occurred', WITHIN=PROB_QUARTER,$ DEFINE PROBLEM_OCCUR/I5 WITH PROBNUM=1;, TITLE='Problem,Occurrence' DESCRIPTION='# of times a problem occurs',$ DEFINE PLANTLNG/A11=DECODE PLANT (BOS 'Boston' DAL 'Dallas' LA 'Los Angeles' ORL 'Orlando' SEA 'Seattle' STL 'St Louis' ELSE 'n/a');$ SEGNAME=INVSEG, SEGTYPE=DKU, PARENT=PROD_SEG, CRFILE=CENTINV, CRKEY=PROD_NUM, CRSEG=INVINFO,$
Century Corp Data Sources
1976

CENTQA Structure Diagram
SECTION 01 STRUCTURE OF FOCUS FILE CENTQA ON 05/15/03 AT 10.46.43 PROD_SEG 01 S1 ************** *PROD_NUM **I * ** * ** * ** * ** *************** ************** I +-----------------+ I I I INVSEG I PROB_SEG 02 I KU 03 I S1 .............. ************** :PROD_NUM :K *PROBNUM ** :PRODNAME : *PLANT **I :QTY_IN_STOCK: *PROBLEM_DATE** :PRICE : *PROBLEM_CAT>** : : * ** :............: *************** JOINED CENTINV **************
CENTGL Master File
FILE=CENTGL ,SUFFIX=FOC SEGNAME=ACCOUNTS, SEGTYPE=S1 FIELDNAME=GL_ACCOUNT, ALIAS=GLACCT, FORMAT=A7, TITLE='Ledger,Account', FIELDTYPE=I, $ FIELDNAME=GL_ACCOUNT_PARENT, ALIAS=GLPAR, FORMAT=A7, TITLE=Parent, PROPERTY=PARENT_OF, REFERENCE=GL_ACCOUNT, $ FIELDNAME=GL_ACCOUNT_TYPE, ALIAS=GLTYPE, FORMAT=A1, TITLE=Type,$ FIELDNAME=GL_ROLLUP_OP, ALIAS=GLROLL, FORMAT=A1, TITLE=Op, $ FIELDNAME=GL_ACCOUNT_LEVEL, ALIAS=GLLEVEL, FORMAT=I3, TITLE=Lev, $ FIELDNAME=GL_ACCOUNT_CAPTION, ALIAS=GLCAP, FORMAT=A30, TITLE=Caption, PROPERTY=CAPTION, REFERENCE=GL_ACCOUNT, $ FIELDNAME=SYS_ACCOUNT, ALIAS=ALINE, FORMAT=A6, TITLE='System,Account,Line', MISSING=ON, $
A. Master Files and Diagrams
Creating Reports With TIBCO® WebFOCUS Language 1977

CENTGL Structure Diagram
SECTION 01 STRUCTURE OF FOCUS FILE CENTGL ON 05/15/03 AT 15.18.48 ACCOUNTS 01 S1 ************** *GL_ACCOUNT **I *GL_ACCOUNT_>** *GL_ACCOUNT_>** *GL_ROLLUP_OP** * ** *************** **************
CENTSYSF Master File
FILE=CENTSYSF ,SUFFIX=FOC SEGNAME=RAWDATA ,SEGTYPE=S2 FIELDNAME = SYS_ACCOUNT , ,A6 , FIELDTYPE=I, TITLE='System,Account,Line', $ FIELDNAME = PERIOD , ,YYM , FIELDTYPE=I,$ FIELDNAME = NAT_AMOUNT , ,D10.0 , TITLE='Month,Actual', $ FIELDNAME = NAT_BUDGET , ,D10.0 , TITLE='Month,Budget', $ FIELDNAME = NAT_YTDAMT , ,D12.0 , TITLE='YTD,Actual', $ FIELDNAME = NAT_YTDBUD , ,D12.0 , TITLE='YTD,Budget', $
CENTSYSF Structure Diagram
SECTION 01 STRUCTURE OF FOCUS FILE CENTSYSF ON 05/15/03 AT 15.19.27 RAWDATA 01 S2 ************** *SYS_ACCOUNT **I *PERIOD **I *NAT_AMOUNT ** *NAT_BUDGET ** * ** *************** **************
Century Corp Data Sources
1978

CENTSTMT Master File
FILE=CENTSTMT, SUFFIX=FOC SEGNAME=ACCOUNTS, SEGTYPE=S1 FIELD=GL_ACCOUNT, ALIAS=GLACCT, FORMAT=A7, TITLE='Ledger,Account', FIELDTYPE=I, $ FIELD=GL_ACCOUNT_PARENT, ALIAS=GLPAR, FORMAT=A7, TITLE=Parent, PROPERTY=PARENT_OF, REFERENCE=GL_ACCOUNT, $ FIELD=GL_ACCOUNT_TYPE, ALIAS=GLTYPE, FORMAT=A1, TITLE=Type,$ FIELD=GL_ROLLUP_OP, ALIAS=GLROLL, FORMAT=A1, TITLE=Op, $ FIELD=GL_ACCOUNT_LEVEL, ALIAS=GLLEVEL, FORMAT=I3, TITLE=Lev, $ FIELD=GL_ACCOUNT_CAPTION, ALIAS=GLCAP, FORMAT=A30, TITLE=Caption, PROPERTY=CAPTION, REFERENCE=GL_ACCOUNT, $ SEGNAME=CONSOL, SEGTYPE=S1, PARENT=ACCOUNTS, $ FIELD=PERIOD, ALIAS=MONTH, FORMAT=YYM, $ FIELD=ACTUAL_AMT, ALIAS=AA, FORMAT=D10.0, MISSING=ON, TITLE='Actual', $ FIELD=BUDGET_AMT, ALIAS=BA, FORMAT=D10.0, MISSING=ON, TITLE='Budget', $ FIELD=ACTUAL_YTD, ALIAS=AYTD, FORMAT=D12.0, MISSING=ON, TITLE='YTD,Actual', $ FIELD=BUDGET_YTD, ALIAS=BYTD, FORMAT=D12.0, MISSING=ON, TITLE='YTD,Budget', $
A. Master Files and Diagrams
Creating Reports With TIBCO® WebFOCUS Language 1979

CENTSTMT Structure Diagram
SECTION 01 STRUCTURE OF FOCUS FILE CENTSTMT ON 05/15/03 AT 14.45.44 ACCOUNTS 01 S1 ************** *GL_ACCOUNT **I *GL_ACCOUNT_>** *GL_ACCOUNT_>** *GL_ROLLUP_OP** * ** *************** ************** I I I I CONSOL 02 I S1 ************** *PERIOD ** *ACTUAL_AMT ** *BUDGET_AMT ** *ACTUAL_YTD ** * ** *************** **************
CENTGLL Master File
FILE=CENTGLL ,SUFFIX=FOCSEGNAME=ACCOUNTS ,SEGTYPE=S01FIELDNAME=GL_ACCOUNT, ALIAS=GLACCT, FORMAT=A7, TITLE='Ledger,Account', FIELDTYPE=I, $FIELDNAME=GL_ACCOUNT_PARENT, ALIAS=GLPAR, FORMAT=A7, TITLE=Parent, PROPERTY=PARENT_OF, REFERENCE=GL_ACCOUNT, $FIELDNAME=GL_ACCOUNT_TYPE, ALIAS=GLTYPE, FORMAT=A1, TITLE=Type,$FIELDNAME=GL_ROLLUP_OP, ALIAS=GLROLL, FORMAT=A1, TITLE=Op, $FIELDNAME=GL_ACCOUNT_LEVEL, ALIAS=GLLEVEL, FORMAT=I3, TITLE=Lev, $FIELDNAME=GL_ACCOUNT_CAPTION, ALIAS=GLCAP, FORMAT=A30, TITLE=Caption, PROPERTY=CAPTION, REFERENCE=GL_ACCOUNT, $FIELDNAME=SYS_ACCOUNT, ALIAS=ALINE, FORMAT=A6, TITLE='System,Account,Line', MISSING=ON, $
Century Corp Data Sources
1980

CENTGLL Structure Diagram
SECTION 01 STRUCTURE OF FOCUS FILE CENTGLL ON 05/15/03 AT 14.45.44 ACCOUNTS 01 S1 ************** *GL_ACCOUNT **I *GL_ACCOUNT_>** *GL_ACCOUNT_>** *GL_ROLLUP_OP** * ** *************** **************
A. Master Files and Diagrams
Creating Reports With TIBCO® WebFOCUS Language 1981

Century Corp Data Sources
1982

AppendixBError Messages
To see the text or explanation for any error message, you can display it or find it in anerrors file. All of the FOCUS error messages are stored in eight system ERRORS files.
For UNIX, Windows, and Open/VMS, the extension is .err.
For z/OS, the ddname is ERRORS.
In this appendix:
Displaying Messages
Displaying Messages
To display the text and explanation for any message, issue the following query command in astored procedure
? n
where:
n
Is the message number.
The message number and text appear, along with a detailed explanation of the message (ifone exists). For example, issuing the following command
? 210
displays the following:
(FOC210) THE DATA VALUE HAS A FORMAT ERROR:An alphabetic character has been found where all numerical digits are required.
Creating Reports With TIBCO® WebFOCUS Language 1983

Displaying Messages
1984

AppendixCTable Syntax Summary and Limits
This appendix summarizes WebFOCUS reporting commands and options.
In this appendix:
TABLE Syntax Summary
TABLEF Syntax Summary
MATCH Syntax Summary
FOR Syntax Summary
TABLE Limits
Creating Reports With TIBCO® WebFOCUS Language 1985

TABLE Syntax Summary
The syntax of a TABLE request is:
DEFINE FILE filename CLEAR|ADD tempfield [/format] [{DEFCENT|DFC} {cc|19} {YRTHRESH|YRT} {[-]yy|0}] [MISSING {ON|OFF} [NEEDS] {SOME|ALL} [DATA]] [(GEOGRAPHIC_ROLE = georole)] [WITH realfield] [TITLE 'line1[,line2 ...']] [DESCRIPTION 'description'] = expression; tempfield [/format] REDEFINES qualifier.fieldname = expression;...ENDTABLE FILE filename HEADING [CENTER]"text"{display_command} [SEG.] field [/R|/L|/C] [/format]{display_command} [prefixop.] [field] [/R|/L|/C] [/format] [NOPRINT|AS 'title1,...,title5'] [AND|OVER] [obj2...obj1024] [WITHIN field] [IN [+]n]COMPUTE field [/format] [(GEOGRAPHIC_ROLE = georole)] = expression; [AS 'title,...,title5'] [IN [+]n][AND] ROW-TOTAL [/R|/L|/C] [/format][AS 'name'][AND] COLUMN-TOTAL [/R|/L|/C] [AS 'name']ACROSS [HIGHEST] sortfieldn [IN-GROUPS-OF qty] [NOPRINT| AS 'title1,...,title5']BY [HIGHEST] sortfieldn [IN-GROUPS-OF qty] [NOPRINT| AS 'title1,...,title5']BY [HIGHEST|LOWEST{n}] TOTAL [prefix_operator] {field|code_value}RANKED [AS 'name'] BY {TOP|HIGHEST|LOWEST} [n] field [PLUS OTHERS AS 'othertext'] [IN-GROUPS-OF qty [TILES [TOP m]] [AS 'heading']] [NOPRINT|AS 'title1,...,title5']
{BY|ACROSS} sortfield IN-RANGES-OF value [TOP limit]ON sfld option1 [AND] option2 [WHEN expression;...]ON sfld RECAP fld1 [/fmt] = FORECAST (fld2, intvl, npredct, '{MOVAVE|EXPAVE}',npnt);
ON sfld RECAP fld1[/fmt] = FORECAST(fld2, interval, npredict, 'DOUBLEXP', npoint1, npoint2);
ON sfld RECAP fld1[/fmt] = FORECAST(fld2, interval, npredict, 'SEASONAL', nperiod, npoint1, npoint2, npoint3);
ON sfld RECAP fld1 [/fmt] = FORECAST (fld2, intvl, npredct, 'REGRESS');
TABLE Syntax Summary
1986
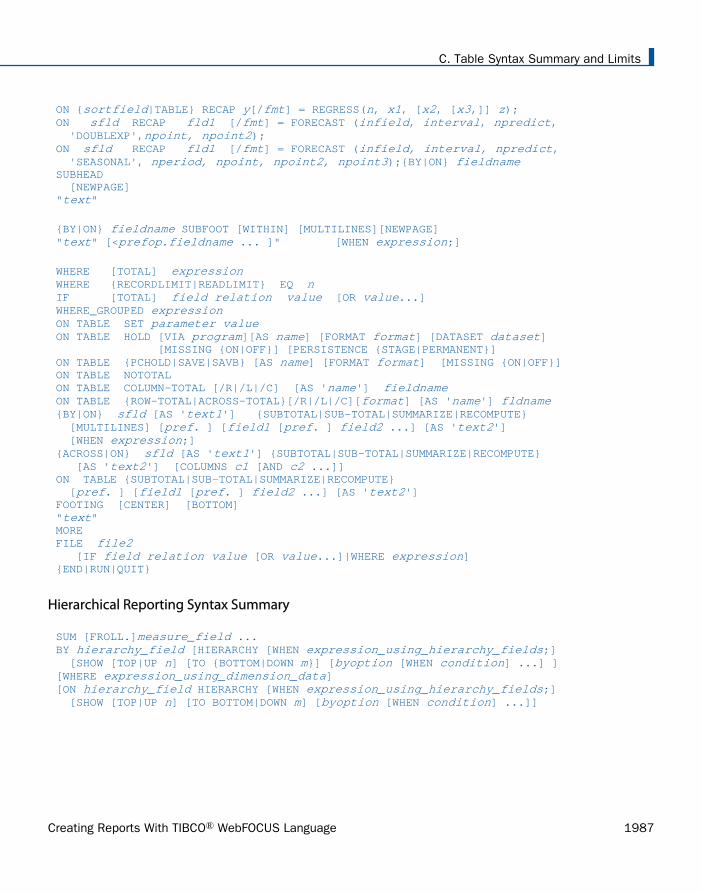
ON {sortfield|TABLE} RECAP y[/fmt] = REGRESS(n, x1, [x2, [x3,]] z);ON sfld RECAP fld1 [/fmt] = FORECAST (infield, interval, npredict, 'DOUBLEXP',npoint, npoint2);ON sfld RECAP fld1 [/fmt] = FORECAST (infield, interval, npredict, 'SEASONAL', nperiod, npoint, npoint2, npoint3);{BY|ON} fieldname SUBHEAD [NEWPAGE]"text"
{BY|ON} fieldname SUBFOOT [WITHIN] [MULTILINES][NEWPAGE]"text" [<prefop.fieldname ... ]" [WHEN expression;]
WHERE [TOTAL] expression WHERE {RECORDLIMIT|READLIMIT} EQ n IF [TOTAL] field relation value [OR value...]WHERE_GROUPED expressionON TABLE SET parameter value ON TABLE HOLD [VIA program][AS name] [FORMAT format] [DATASET dataset] [MISSING {ON|OFF}] [PERSISTENCE {STAGE|PERMANENT}]ON TABLE {PCHOLD|SAVE|SAVB} [AS name] [FORMAT format] [MISSING {ON|OFF}]ON TABLE NOTOTALON TABLE COLUMN-TOTAL [/R|/L|/C] [AS 'name'] fieldname ON TABLE {ROW-TOTAL|ACROSS-TOTAL}[/R|/L|/C][format] [AS 'name'] fldname {BY|ON} sfld [AS 'text1'] {SUBTOTAL|SUB-TOTAL|SUMMARIZE|RECOMPUTE} [MULTILINES] [pref. ] [field1 [pref. ] field2 ...] [AS 'text2'] [WHEN expression;]{ACROSS|ON} sfld [AS 'text1'] {SUBTOTAL|SUB-TOTAL|SUMMARIZE|RECOMPUTE} [AS 'text2'] [COLUMNS c1 [AND c2 ...]]ON TABLE {SUBTOTAL|SUB-TOTAL|SUMMARIZE|RECOMPUTE} [pref. ] [field1 [pref. ] field2 ...] [AS 'text2']FOOTING [CENTER] [BOTTOM]"text"MOREFILE file2 [IF field relation value [OR value...]|WHERE expression]{END|RUN|QUIT}
Hierarchical Reporting Syntax Summary
SUM [FROLL.]measure_field ...BY hierarchy_field [HIERARCHY [WHEN expression_using_hierarchy_fields;] [SHOW [TOP|UP n] [TO {BOTTOM|DOWN m}] [byoption [WHEN condition] ...] ][WHERE expression_using_dimension_data][ON hierarchy_field HIERARCHY [WHEN expression_using_hierarchy_fields;] [SHOW [TOP|UP n] [TO BOTTOM|DOWN m] [byoption [WHEN condition] ...]]
C. Table Syntax Summary and Limits
Creating Reports With TIBCO® WebFOCUS Language 1987
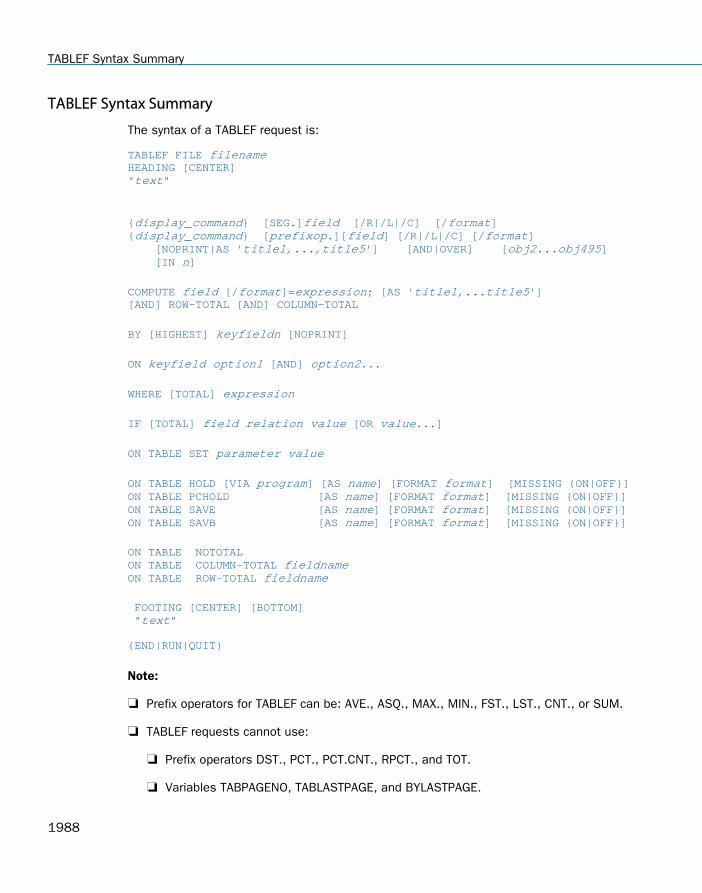
TABLEF Syntax Summary
The syntax of a TABLEF request is:
TABLEF FILE filename HEADING [CENTER]"text"
{display_command} [SEG.]field [/R|/L|/C] [/format] {display_command} [prefixop.][field] [/R|/L|/C] [/format] [NOPRINT|AS 'title1,...,title5'] [AND|OVER] [obj2...obj495] [IN n]
COMPUTE field [/format]=expression; [AS 'title1,...title5'][AND] ROW-TOTAL [AND] COLUMN-TOTAL
BY [HIGHEST] keyfieldn [NOPRINT]
ON keyfield option1 [AND] option2...
WHERE [TOTAL] expression
IF [TOTAL] field relation value [OR value...]
ON TABLE SET parameter value
ON TABLE HOLD [VIA program] [AS name] [FORMAT format] [MISSING {ON|OFF}]ON TABLE PCHOLD [AS name] [FORMAT format] [MISSING {ON|OFF}]ON TABLE SAVE [AS name] [FORMAT format] [MISSING {ON|OFF}]ON TABLE SAVB [AS name] [FORMAT format] [MISSING {ON|OFF}]
ON TABLE NOTOTALON TABLE COLUMN-TOTAL fieldname ON TABLE ROW-TOTAL fieldname
FOOTING [CENTER] [BOTTOM] "text" {END|RUN|QUIT}
Note:
Prefix operators for TABLEF can be: AVE., ASQ., MAX., MIN., FST., LST., CNT., or SUM.
TABLEF requests cannot use:
Prefix operators DST., PCT., PCT.CNT., RPCT., and TOT.
Variables TABPAGENO, TABLASTPAGE, and BYLASTPAGE.
TABLEF Syntax Summary
1988
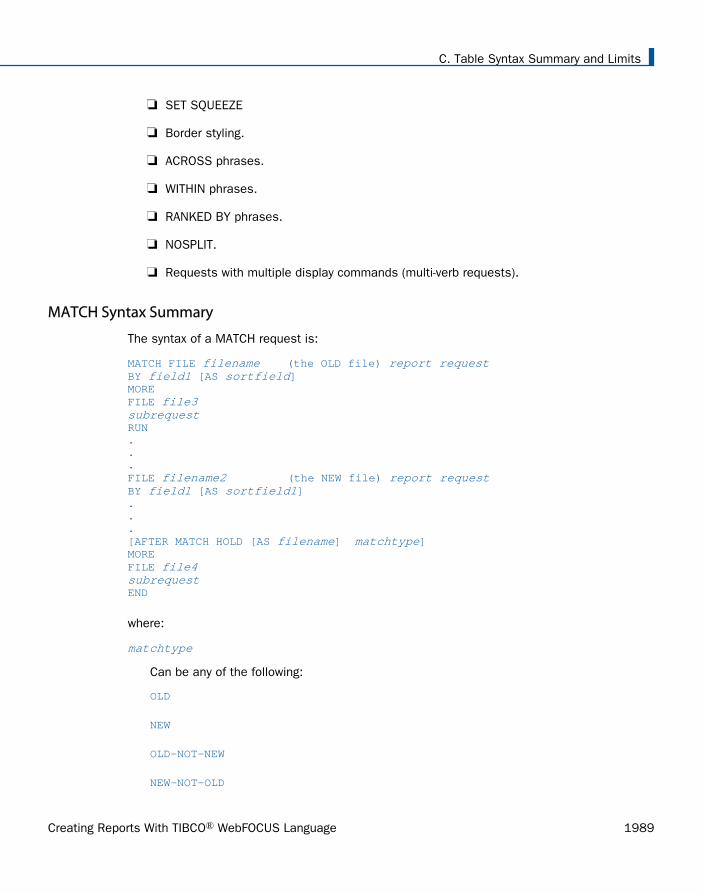
SET SQUEEZE
Border styling.
ACROSS phrases.
WITHIN phrases.
RANKED BY phrases.
NOSPLIT.
Requests with multiple display commands (multi-verb requests).
MATCH Syntax Summary
The syntax of a MATCH request is:
MATCH FILE filename (the OLD file) report request BY field1 [AS sortfield]MOREFILE file3subrequest RUN...FILE filename2 (the NEW file) report request BY field1 [AS sortfield1]...[AFTER MATCH HOLD [AS filename] matchtype]MOREFILE file4subrequest END
where:
matchtype
Can be any of the following:
OLD
NEW
OLD-NOT-NEW
NEW-NOT-OLD
C. Table Syntax Summary and Limits
Creating Reports With TIBCO® WebFOCUS Language 1989

OLD-AND-NEW
OLD-OR-NEW
OLD-NOR-NEW
FOR Syntax Summary
The formal syntax of the FOR statement is:
FOR fieldname [NOPRINT]row [OVER row]....END
where:
row
Can be any of the following:
tag [OR tag...][options] [fieldname] DATA n,[n,....] $ DATA PICKUP [FROM filename] tag [LABEL label] [AS 'text'] RECAP name[/format]=expression; BAR [AS 'character'] [OVER] "text" parentvalue {GET|WITH} CHILD[REN] [{n|ALL}] [ADD [m|ALL]] [AS {CAPTION|'text'}] [LABEL label]parentvalue ADD [{m|ALL}] [AS {CAPTION|'text'}] [LABEL label] PAGE-BREAK [OVER]
tag
Can be any of the following:
value [OR value...] value TO value
options
Can be any of the following:
FOR Syntax Summary
1990

AS 'text' [INDENT m] NOPRINT [LABEL label] WHEN EXISTS [POST [TO filename]]
TABLE Limits
The following limits apply to TABLE requests:
There is no limit to the number of verb objects in a TABLE request. However, an error canoccur if the report output format has a limit to the number of columns supported, theoperating system has a maximum record length that cannot fit all of the columns, or theamount of memory needed to store the output is not available.
Number of verb objects referenced in a MATCH request: 495
Number of columns of report output: 1024
Total length of all fields in the request or in a single Master File: 256K
Total number of sort fields (combined BY and ACROSS): 128
An internal sort will be generated automatically under some circumstances, and these haveto be counted in the total. HOLD FORMAT FOCUS/XFOCUS will add FOCLIST as a BY field inorder to ensure uniqueness.
Maximum size of the output record: 256K (FORMAT/USAGE)
Maximum size of the output file: FOCUS partition 2GB, XFOCUS 32GB
Maximum size of internal expression representation of a single DEFINE, COMPUTE, -SET, orWHERE phrase: 64K
The internal representation is generated in polish postfix notation, which is significantlysmaller than the entered expression. In addition, the constants in expressions (as inDECODE or IF…THEN..ELSE conditions) are stored outside of the expressionrepresentations, reducing the space requirement for the expression representation itself.
Maximum number of segments in a structure or file: 512.
This means that a total of 511 JOINs can be in effect at any one given time.
Note: FOCUS data sources are limited to 64 segments.
The maximum number of field pairs in a join is 128.
C. Table Syntax Summary and Limits
Creating Reports With TIBCO® WebFOCUS Language 1991

Maximum size of Alphanumeric fields: 4K characters ( in UTF, this means 12K bytes)
Maximum number of display commands in a TABLE request: 64.
TABLE Limits
1992

AppendixDReferring to Fields in a Report Request
When creating a report, you refer to fields in several parts of the request. For example, indisplay commands (PRINT, SUM), in sort phrases (BY, ACROSS), and in selection criteria(WHERE, WHERE TOTAL, IF).
Several methods are available for referring to a field. You can:
Refer to individual fields by using the alias specified in the Master File, referring tothe name defined in the Master File, or using the shortest unique truncation of thefield name or alias. For details, see Referring to an Individual Field on page 1993.
Refer to fields using qualified field names. For details, see Referring to Fields UsingQualified Field Names on page 1994.
Refer to all fields in a segment using only one field name. For details, see Referringto All of the Fields in a Segment on page 1995.
You can also view a list of all the fields that are included in the currently active datasource, or a specified Master File. For details, see the TIBCO WebFOCUS® DevelopingReporting Applications manual.
In this appendix:
Referring to an Individual Field
Referring to Fields Using Qualified Field Names
Referring to All of the Fields in a Segment
Displaying a List of Field Names
Referring to an Individual Field
You can refer to an individual field in any one of the following ways:
Using the field name defined in the Master File.
Using the alias (the field name synonym) defined in the Master File.
Using the shortest unique truncation of the field name or the alias. When a truncation isused, it must be unique. If it is not unique, an error message is displayed.
Creating Reports With TIBCO® WebFOCUS Language 1993

Adding the letter S to the end of a field name defined in the Master File.
Example: Referring to an Individual Field
In the following requests, DEPARTMENT is the complete field name, DPT is the alias, and DEPis a unique truncation of DEPARTMENT. All these examples produce the same output.
1. TABLE FILE EMPLOYEE PRINT DEPARTMENT END
2. TABLE FILE EMPLOYEE PRINT DPT END
3. TABLE FILE EMPLOYEE PRINT DEP END
Note: If you use a truncation that is not unique, the following message will appear:
(FOC016) THE TRUNCATED FIELDNAME IS NOT UNIQUE : D
Referring to Fields Using Qualified Field Names
Field names and aliases have a maximum length of 512 characters. They can also be qualifiedby prepending up to two qualifiers and qualification characters. However, text fields andindexed field names in Master Files for FOCUS data sources are limited to 12 characters,although the aliases for text and indexed fields can have the same length as general fieldnames. Field names are always displayed as column titles in reports, unless a TITLE attributeor an AS phrase is used to provide an alternative name. For related information, see UsingHeadings, Footings, Titles, and Labels on page 1519.
You may use the file name, segment name, or both as a qualifier for a specified field.
Syntax: How to Activate Long and Qualified Field Names
The SET FIELDNAME command enables you to activate long (up to 512 characters) andqualified field names.
SET FIELDNAME = fieldname
where:
fieldname
Specifies the activation status of long and qualified field names. Valid identifiers include:
Referring to Fields Using Qualified Field Names
1994
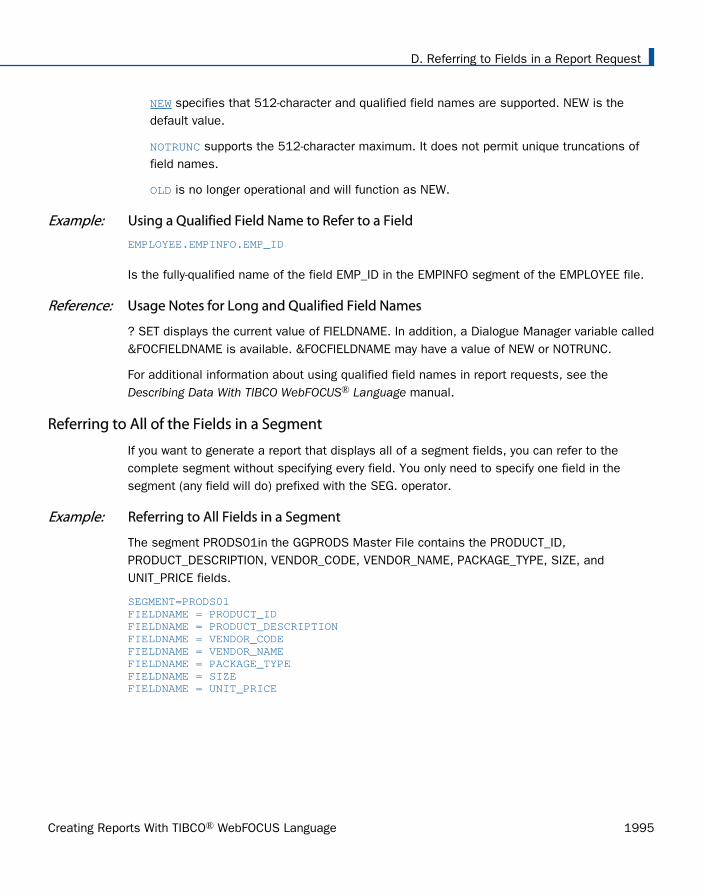
NEW specifies that 512-character and qualified field names are supported. NEW is thedefault value.
NOTRUNC supports the 512-character maximum. It does not permit unique truncations offield names.
OLD is no longer operational and will function as NEW.
Example: Using a Qualified Field Name to Refer to a Field
EMPLOYEE.EMPINFO.EMP_ID
Is the fully-qualified name of the field EMP_ID in the EMPINFO segment of the EMPLOYEE file.
Reference: Usage Notes for Long and Qualified Field Names
? SET displays the current value of FIELDNAME. In addition, a Dialogue Manager variable called&FOCFIELDNAME is available. &FOCFIELDNAME may have a value of NEW or NOTRUNC.
For additional information about using qualified field names in report requests, see theDescribing Data With TIBCO WebFOCUS® Language manual.
Referring to All of the Fields in a Segment
If you want to generate a report that displays all of a segment fields, you can refer to thecomplete segment without specifying every field. You only need to specify one field in thesegment (any field will do) prefixed with the SEG. operator.
Example: Referring to All Fields in a Segment
The segment PRODS01in the GGPRODS Master File contains the PRODUCT_ID,PRODUCT_DESCRIPTION, VENDOR_CODE, VENDOR_NAME, PACKAGE_TYPE, SIZE, andUNIT_PRICE fields.
SEGMENT=PRODS01FIELDNAME = PRODUCT_IDFIELDNAME = PRODUCT_DESCRIPTIONFIELDNAME = VENDOR_CODEFIELDNAME = VENDOR_NAMEFIELDNAME = PACKAGE_TYPEFIELDNAME = SIZEFIELDNAME = UNIT_PRICE
D. Referring to Fields in a Report Request
Creating Reports With TIBCO® WebFOCUS Language 1995

To write a report that includes data from every field in the segment, you can issue either of thefollowing requests:
1. TABLE FILE GGPRODS PRINT PRODUCT_ID AND PRODUCT_DESCRIPTION AND VENDOR_CODE AND VENDOR_NAME AND PACKAGE_TYPE AND SIZE AND UNIT_PRICE END
2. TABLE FILE GGPRODS PRINT SEG.PRODUCT_ID END
Displaying a List of Field Names
If you want to see a list of all the fields that are included in the currently active data source,you can issue the ?F field name query.
This is useful if you need to refer to a list of field names, or need to check the spelling of afield name, without exiting from the request process. It will also show you the entire 66-character field name.
You can issue the ?F query from the Editor in WebFOCUS.
More information on all of the query (?) commands appears in the Developing ReportingApplications manual.
Listing Field Names, Aliases, and Format Information
The ?FF query displays field name, alias, and format information for a specified Master File,grouped by segment.
You can issue the ?FF query from the Editor in WebFOCUS.
If your software supports MODIFY or FSCAN, you can also issue ?FF from these facilities.
Note:
If duplicate field names match a specified string, the display includes the field namequalified by the segment name with both ?F and ?FF.
Field names longer than 31 characters are truncated in the display, and a caret (>) isappended in the 32nd position to indicate that the field name is longer than the display.
Displaying a List of Field Names
1996

Legal and Third-Party Notices
SOME TIBCO SOFTWARE EMBEDS OR BUNDLES OTHER TIBCO SOFTWARE. USE OF SUCHEMBEDDED OR BUNDLED TIBCO SOFTWARE IS SOLELY TO ENABLE THE FUNCTIONALITY (ORPROVIDE LIMITED ADD-ON FUNCTIONALITY) OF THE LICENSED TIBCO SOFTWARE. THEEMBEDDED OR BUNDLED SOFTWARE IS NOT LICENSED TO BE USED OR ACCESSED BY ANYOTHER TIBCO SOFTWARE OR FOR ANY OTHER PURPOSE.
USE OF TIBCO SOFTWARE AND THIS DOCUMENT IS SUBJECT TO THE TERMS AND CONDITIONSOF A LICENSE AGREEMENT FOUND IN EITHER A SEPARATELY EXECUTED SOFTWARE LICENSEAGREEMENT, OR, IF THERE IS NO SUCH SEPARATE AGREEMENT, THE CLICKWRAP END USERLICENSE AGREEMENT WHICH IS DISPLAYED DURING DOWNLOAD OR INSTALLATION OF THESOFTWARE (AND WHICH IS DUPLICATED IN THE LICENSE FILE) OR IF THERE IS NO SUCHSOFTWARE LICENSE AGREEMENT OR CLICKWRAP END USER LICENSE AGREEMENT, THELICENSE(S) LOCATED IN THE "LICENSE" FILE(S) OF THE SOFTWARE. USE OF THIS DOCUMENTIS SUBJECT TO THOSE TERMS AND CONDITIONS, AND YOUR USE HEREOF SHALL CONSTITUTEACCEPTANCE OF AND AN AGREEMENT TO BE BOUND BY THE SAME.
This document is subject to U.S. and international copyright laws and treaties. No part of thisdocument may be reproduced in any form without the written authorization of TIBCO SoftwareInc.
TIBCO, the TIBCO logo, the TIBCO O logo, FOCUS, iWay, Omni-Gen, Omni-HealthData, andWebFOCUS are either registered trademarks or trademarks of TIBCO Software Inc. in theUnited States and/or other countries.
Java and all Java based trademarks and logos are trademarks or registered trademarks ofOracle Corporation and/or its affiliates.
All other product and company names and marks mentioned in this document are the propertyof their respective owners and are mentioned for identification purposes only.
This software may be available on multiple operating systems. However, not all operatingsystem platforms for a specific software version are released at the same time. See thereadme file for the availability of this software version on a specific operating system platform.
THIS DOCUMENT IS PROVIDED "AS IS" WITHOUT WARRANTY OF ANY KIND, EITHER EXPRESSOR IMPLIED, INCLUDING, BUT NOT LIMITED TO, THE IMPLIED WARRANTIES OFMERCHANTABILITY, FITNESS FOR A PARTICULAR PURPOSE, OR NON-INFRINGEMENT.
THIS DOCUMENT COULD INCLUDE TECHNICAL INACCURACIES OR TYPOGRAPHICAL ERRORS.CHANGES ARE PERIODICALLY ADDED TO THE INFORMATION HEREIN; THESE CHANGES WILLBE INCORPORATED IN NEW EDITIONS OF THIS DOCUMENT. TIBCO SOFTWARE INC. MAY MAKEIMPROVEMENTS AND/OR CHANGES IN THE PRODUCT(S) AND/OR THE PROGRAM(S)DESCRIBED IN THIS DOCUMENT AT ANY TIME.
1997

THE CONTENTS OF THIS DOCUMENT MAY BE MODIFIED AND/OR QUALIFIED, DIRECTLY ORINDIRECTLY, BY OTHER DOCUMENTATION WHICH ACCOMPANIES THIS SOFTWARE, INCLUDINGBUT NOT LIMITED TO ANY RELEASE NOTES AND "READ ME" FILES.
This and other products of TIBCO Software Inc. may be covered by registered patents. Pleaserefer to TIBCO's Virtual Patent Marking document (https://www.tibco.com/patents) for details.
Copyright © 2021. TIBCO Software Inc. All Rights Reserved.
1998

Index
_ masking character 248
- subtraction operator[/] 435
-n spot marker 1682
-SET command 429
? DEFINE command 287
? FILTER command 269, 270
? JOIN command 1153
? STAT command 190
?F command 1996
?FF command 1996
[F]DEFCENT attribute 451
[F]YRTHRESH attribute 451
* multiplication operator 432, 435
** exponentiation operator 435
/ division operator 432, 435
/n spot marker 1682
&FOCFIELDNAME variable 1995
% masking character 248, 250, 251
+ addition operator 435
$ masking character 248, 250
$* masking character 248, 250, 252
0X spot marker 1522
3D graphs 1751
508 compliance 1475
A
absolute starting positions 1678
ACCEPT attribute 495
Accordion By Column Reports 1019
Accordion Reports 991, 993, 1020
Accordion Reports and ACROSS phrase 991
Accordion Reports and BY phrase 991
Accordion Reports and distributing with
ReportCaster 993
Accordion Reports and drill-downs 993
Accordion Reports and HTML report 991
ACROSS attribute 1267, 1268
ACROSS COLUMNS AND phrase 152, 154, 155
ACROSS phrase 41, 63, 87, 94–96, 107, 301,
302, 991
ACROSS subtype 1267, 1276
ACROSS summary commands 413
ACROSS values 374, 375, 1275, 1277
ACROSS with ROW-TOTAL 371
ACROSS-TOTAL component 374, 375
ACROSSCOLUMN attribute 1254, 1256, 1506
ACROSSCOLUMN subtype 1507, 1790, 1793
ACROSSPRT parameter 107
ACROSSTITLE component 1276, 1277
ACROSSVALUE and drill-downs 1277
ACROSSVALUE component 1267, 1276, 1277
ACRSVRBTITL parameter 96
ADD command 50
ADD option 287
ADD parameter 1860
Creating Reports With TIBCO® WebFOCUS Language 1999
adding attributes to WebFOCUS StyleSheets 983,
985
adding blank lines to headings and footings 1688
adding blank rows 1847
adding blank spaces around a report 1345
adding calculated values in financial reports 1849
adding color to graphs 1790, 1791
adding columns to financial reports 1849
adding comments to WebFOCUS StyleSheets
1206
adding conditional styling to graphs 1791
adding declarations to font map files 626
adding dynamic tables of contents to headings
985
adding dynamic tables of contents to reports 971,
973, 974
adding dynamic tables of contents to WebFOCUS
StyleSheets 973, 974
adding dynamic TOCs (tables of contents) to
headings 983
adding fields to graph footings 1800
adding fields to graph headings 1800
adding fields to headings and footings 1800
adding financial data to reports 1829
adding fonts for PostScript (PS) format 624
adding fonts in PS (PostScript) format 584
adding footings to graphs 1800
adding graphics to a report 940, 1464, 1468,
1470, 1476, 1478, 1483
adding headings to graphs 1800
adding HTML reports to dynamic tables of
contents 971
adding HTML tables of contents to headings 985
adding HTML tables of contents to reports 973,
974
adding HTML tables of contents to WebFOCUS
StyleSheets 973, 974
adding HTML TOCs (tables of contents) to
headings 983
adding images to a report 1464, 1470
adding labels to graphs 1800, 1801
adding line breaks to text fields 1741
adding PostScript fonts 624
adding PostScript Type 1 fonts 624
adding PostScript Type1 fonts in Unix 626
adding PostScript Type1 fonts in Windows 626
adding PostScript Type1 fonts in z/OS 628
adding rows to financial reports 1820, 1823
adding tables of contents (TOCs) to HTML reports
971
adding tag rows to financial reports 1820, 1821,
1856
adding text rows to financial reports 1847
adding TOCs (tables of contents) to HTML reports
971
adding underlines 1451, 1452
adding underlines to columns 1456, 1457
adding underlines to financial reports 1872
adding values 51
adding values for numeric fields 51
Index
2000

adding virtual fields 287
addition operator 435
addressing columns 1839
aggregate values 226
aggregation 196
aggregation and external sorting 197, 198
AHTML format 512
AHTMLTAB format 512
aliases 1916, 1993, 1994
displaying 1996
aligning decimal points 1664, 1666, 1668
aligning footings 1668
aligning heading items 1680
aligning headings 1664, 1668
aligning headings and footings 1635, 1637,
1639, 1650, 1655
aligning sort headings 1668
aligning text fields 1653, 1654
aligning using HTML tables 1650
alignment methods 1635
alignment with OVER 1362
ALL parameter 226, 1061, 1075
ALL parameter and JOIN command 1074, 1075
ALL parameter and missing values 1061–1063
ALL parameters 1062
ALL prefix 1061
ALL prefix and missing values 1061
ALLOCATE command 472
ALPHA format 512
alphanumeric fields 247–255, 389
alphanumeric fields and text fields 360
ALT attribute 1467, 1468, 1475
alternate file views 1929–1931
alternate indexes 274
alternating background color 1710
amper variables 1792, 1800
AND operator 235, 465
AnV fields 460, 461
APDF display format 513
applying FORECAST command to conditional
formatting 1239
applying FORECAST command to conditional
styling 1225
applying graphs to columns 1501
applying graphs to report columns 1501
applying grids to a report 1434, 1435
applying macros 1207, 1208
applying selection criteria in graph requests 1783,
1800
area graphs 1751, 1766
arithmetic expressions 432
arithmetic operators 432, 435
around headings and footings of border 1407
AS CAPTION phrase 1856, 1857
AS phrase 473, 486
ascending sort order 150
ASNAMES command 484–488
ASQ calculations on field values 61
assigning cascading style sheet classes to report
components 1308, 1309
Index
Creating Reports With TIBCO® WebFOCUS Language 2001

assigning classes in cascading style sheets to
ACROSS values 1301
assigning classes in cascading style sheets to
report components 1306, 1309
assigning external cascading style sheet classes
to report components 1309
associating bar graphs with report columns 1501,
1506
associating graphs with columns 1506
associating graphs with report columns 1506
attribute inheritance 1209, 1210
attributes 822, 839, 875, 1204, 1510, 1798,
1872
augmenting attributes 1210
AUTOINDEX parameter 1932–1934
AUTOPATH parameter 1932
AUTOTABLEF parameter 65, 67
AVE field 60
AVE prefix operators 60
B
BACKCOLOR 1708, 1710
background color 1708
background color, alternating 1710
background images 1464, 1476, 1477
BACKIMAGE attribute 1464, 1467, 1476, 1477
bar graphs 1751, 1763
BAR
command 1456, 1457, 1872
rows 1872
base dates 440, 441
BASEURL SET parameter 874, 875
basic date support in graphs 1782
BINARY format 513
BINARY HOLD format 513
BINARY output file format 513
BINS parameter 190
bipolar graphs 1751
blank lines 1442, 1444, 1687
blank lines, removing 1458
blank rows 1847
blank spaces 1342
blank spaces above data values 1347
blank spaces between columns 1348
blanks 1052
BLEND-MODE parameter 1122
BLOB image in reports 1478, 1483
BODY element 1306
Boolean expressions 465, 466
Boolean operator 465
Boolean operators 465
BORDER attribute 1405, 1407, 1409, 1617,
1872
border colors 1407
border styles 1407
borders 1404, 1409, 1615, 1881
adding for cells 1881, 1885
adding for rows 1883, 1885
BOTTOM 208
bottom margins 1339
Index
2002

BOTTOMGAP attribute 1343, 1345, 1689
BOTTOMMARGIN attribute 1339, 1341
breaks 1379
browser fonts 1706, 1707
browser fonts in HTML Reports 1706
browser support for cascading style sheets 1325
browser support for HTML tables of contents 991
browser titles 1524
bubble charts 1769
bursting reports 1031, 1034
BY 91
BY HIERARCHY 208
BY phrase 41, 52, 63, 87–90, 139, 1258, 1828
with financial reports 1828, 1829
BY ROWS OVER phrase 152–154
BY subtype 1258, 1270, 1281
BY TOTAL phrase 174–176
BYLASTPAGE system variable 1391, 1394
byte precision 54, 55
C
calculated values 278–280, 301, 302, 367, 371,
383–385, 1591, 1849
sorting reports 302
calculating column and row totals 367, 368
calculating column Percentages 63
calculating column totals 367–371
calculating dates 441, 442
calculating MAX field values 61
calculating maximum field values 61
calculating maximum values for field values 61
calculating median of field values 62
calculating MIN field values 61
calculating minimum field values 61
calculating minimum values for field values 61
calculating mode of field values 62
calculating row Percentages 63
calculating row totals 367–370
calculating trends 357
calculating values for temporary fields 297
calculation on field values 65
calculations 1845
calculations and functions 1845, 1846
calculations counting field values 70
calculations on counting field values 70
calculations on field values 56, 60, 61, 139
calculations on sum numeric field values 70
calculations on SUM numeric field values 70
calculations on TOT field values 70
calculations on total field values 70
calling functions 1845, 1846
CAPTION parameter 1855, 1860, 1867, 1868
captions 1524
in a hierarchy 1859
in Master Files 1855, 1867, 1868
CAR data source 1945, 1947
carriage-returns 1741
Cartesian product 1186, 1187
Cartesian product answer sets 1920
Index
Creating Reports With TIBCO® WebFOCUS Language 2003

Cartesian product answer sets and SQL Translator
1920
cascading style sheet (CSS) 1195, 1222, 1223,
1295, 1304
browser support 1323, 1325, 1329
choosing 1305
class for ACROSS values 1301
classes 1296, 1306, 1325
conditional styling 1323
editing 1306
example 1302
external 1295
FAQS 1325
file location 1305
formatting 1308, 1310
images 1311, 1323
inheritance 1316, 1329
internal 1221
linking 1300, 1301, 1312–1315
location 1305
multiple 1305
multiple output formats 1318, 1320, 1322
naming classes 1307, 1309
personal 1329
refreshing 1306, 1329
report formatting 1298, 1300
requirements 1323
rules 1296, 1301, 1306, 1325
troubleshooting 1329
CDN (Continental Decimal Notation) 1719, 1920
CDN (Continental Decimal Notation) and SQL
Translator 1920
CDN parameter 1719
cells 1843, 1844
formatting 1871, 1874, 1876, 1881
notation 1844
CENTER command 1619
CENTFIN data source 1967
CENTHR data source 1967
CENTINV data source 1967
CENTORD data source 1967
CENTQA data source 1967
Century Corp data sources 1967
changing column order 1356
changing row titles 1870
PICKUP rows 1896
RECAP rows 1871
TAG rows 1870
character expressions 430, 456
character strings 247, 458
Chart of Accounts hierarchy 1853, 1855
charts 1751
charts of accounts 1856
CHECK FILE command 1152
CHECK FILE command and join structures 1152
CHECK PICTURE command 45
CHECK STYLE command 1202
choosing formatting reports style sheets 1195
choosing report formatting style sheets 1195
CLASS attribute 1301, 1308, 1309, 1325
Index
2004

clearing conditional join structures 1154
clearing join structures 1153, 1154
clearing virtual fields 287, 288
CMS requirements 189
CNOTATION SET parameter 302, 303, 1840,
1841
CNT prefix operator 70
collapsing PRINT with ACROSS 107
collation sequence 142
COLLATION SET parameter 142
COLOR attribute 1703
color graph settings 1816
color settings 1338
color settings in graphs 1816
color values 1703
color, background 1708
color, background, alternating 1710
COLSPAN attribute 1655
column and row totals in calculated values 367
COLUMN attribute 1254, 1255, 1266, 1506
column formats 1715
column notation 302, 303
column reference numbers 302
COLUMN subtype 1627, 1737, 1875
column titles 84, 1591, 1593, 1594, 1715
column titles for calculated values 1596
column total labels 1602
column totals 367, 370, 371
COLUMN-TOTAL phrase 367–369
column
addresses 1839
columns 1254, 1714
addresses 1838–1840
formatting 1874
in financial reports 1820
notation 1840, 1841
numbers 1836
reference numbers 1840
values 1841
COM format 514
COM HOLD format 514
COM output file format 514
COM PCHOLD format 514
COM SAVE format 514
combination of summary commands 408
combinations of subtotals 407
combining expressions 235
combining external cascading style sheets with
other formatting methods 1310, 1311
combining fields in date expressions 444, 445
combining mixed format reports 937, 938, 940,
941
combining multiple values 1823
combining PDF reports 937, 938
combining records 1823, 1824
combining report formats 941
combining report formatting cascading style
sheets and other formatting methods 1325
combining values 1823, 1824, 1826
Index
Creating Reports With TIBCO® WebFOCUS Language 2005

COMMA format 514
COMMA HOLD format 514
COMMA output file format 514
COMMA SAVE format 514
comma-delimited files 1073
command support for Accordion Reports 1019
commands 1206, 1207
comments 1204, 1206
comments in WebFOCUS StyleSheets 1204, 1206
common high-order sort fields 1168, 1169, 1171,
1182, 1183, 1185
comparing characters with masks 248–252
comparing decimal values 1666
comparing records 1160, 1166, 1167
compiling expressions 1936
compiling virtual fields 1936
complex expressions 429
COMPMISS parameter 1056, 1717
compound display formats for reports 879, 936
compound expressions 235
COMPOUND parameter 937
compound report display formats 879, 936
Compound report syntax
COMPONENT 883
displaying a grid 903
draw objects 897
example 886
page overflow 894
PAGELAYOUT 881
SECTION 880
compound reports 525, 879, 936
compound reports in PDF format 938
compressing PDF output files 586
COMPUTE command 52, 297–299, 301, 302,
383, 403, 421, 422, 424, 429
COMPUTE command expressions 429
COMPUTE component 1274
computing the average field values 60
COMT format 515
COMT HOLD format 515
COMT output file format 515
COMT PCHOLD format 515
COMT SAVE format 515
concatenated data sources and MATCH FILE
command 1180
concatenating character strings 458
concatenating data sources 1175–1177
concatenating data sources and field names 1179
concatenation 458
concatenation data sources 1177, 1180
concatenation for data sources 1175
concatenation operators 458
concatenation usage formats 1178
conditional drill-down 867–869
conditional drill-down and multiple links 855
conditional expression types 467
conditional expressions 430, 467, 468
conditional formatting 1555
conditional formatting and WHEN phrase 1241,
1243–1246, 1555
Index
2006

conditional grid formatting 1720, 1721
conditional join structures 1071, 1073, 1083,
1103, 1104, 1106, 1151
conditional operators 236, 243, 244
conditional sort headings 1550
conditional styling 855, 1221, 1224, 1241,
1243–1246, 1323
conditional styling and graphs 1790, 1791
conditional styling and style sheets 1227, 1236
conditional styling and WebFOCUS StyleSheets
1224, 1225, 1227, 1228, 1230, 1233, 1234,
1236
conditional text 427, 428
conditionally displaying page breaks 1243
conditionally displaying skipped lines 1243
conditionally displaying summary lines 1243
conditionally displaying underlines 1243
configuring PostScript fonts 626, 628
configuring PostScript fonts in z/OS 628
configuring PostScript Type 1 fonts 626
connected point plot graphs 1751, 1762
consolidating financial data 1856, 1859, 1860,
1862, 1863
in multiple rows 1863
single row 1860, 1862
constant dates 439, 443
constants 1830
in Financial Modeling Language (FML) 1829
in financial reports 1829
in FML (Financial Modeling Language) 1829
constants 1830
in FML requests 1829, 1830
CONTAINS operator 247
contiguous columns 1837
contiguous columns in financial reports 1837
Continental Decimal Notation (CDN) 1719, 1920
Continental Decimal Notation (CDN) and SQL
Translator 1920
controlling attributes 484, 490, 491, 495
controlling attributes and HOLD Master Files 492
controlling column order 1348, 1355, 1356
controlling column reference numbers 302, 1840
controlling column spacing 1348, 1354, 1355
controlling display of sort field values 991
controlling field names 485–488
controlling field names HOLD Master Files 485
controlling fields 490
converting data types for join structures 1103
converting TABLE requests 1746, 1748
converting TABLE requests to GRAPH requests
1746, 1748
COUNT * command 53, 54
COUNT command 52, 53, 88
COUNT command for unique segments 53
count of occurrences 70
counting field values 52
COUNTWIDTH SET parameter 52, 54, 55
COURSE data source 1952, 1953
CREATE TABLE command 1917, 1918
CREATE VIEW command 1918, 1919
Index
Creating Reports With TIBCO® WebFOCUS Language 2007

creating bar graphs 1756, 1757
creating calculated values 297, 299, 300
creating financial reports 1818, 1823
creating FOCUS data sources 479, 482–484
creating free-form reports 1899, 1900,
1902–1906
creating graphs 1745
creating HOLD files 473, 474, 476, 477, 479,
480, 482
creating horizontal bar graphs 1756, 1757
creating links 821, 822
creating matrix report with OVER 1357
creating matrix reports with OVER 1359
creating multiple virtual fields 287
creating numeric expressions 432
creating output files 473
creating parameters 856, 858, 860
creating parameters for drill-down reports 856
creating parameters for drill-downs 1800
creating PCHOLD files 509
creating pie graphs 1758, 1759
creating reports 32, 34
creating rows 1820–1822
from multiple records 1823
in financial reports 1820
creating SAVB files 508
creating SAVE files 506, 507
creating scatter graphs 1760
creating single-line footings 1533
creating single-line headings 1529, 1537
creating sort headings 1547
creating style sheets 1200
creating tag rows 1821, 1822
creating temporary fields with COMPUTE phrases
297
creating temporary fields with DEFINE FUNCTION
364
creating vertical bar graphs 1756, 1757
creating virtual fields 280–282, 284, 286, 290
creating WebFOCUS StyleSheets 1199, 1200
cross-century dates 442
cross-referenced fields 1094
cross-referenced files 1074, 1083
CSS (cascading style sheets) 1195, 1222, 1223
CSS location 1305
CSSURL (StyleSheets) attribute 1301
CSSURL attribute 1301, 1305, 1312, 1313
CSSURL attribute example 1314
CSSURL attribute HTMTABLE format 1312
CSSURL parameter 1301, 1305, 1312, 1315
CSSURL parameter HTMTABLE format 1312
CT. prefix operator 1560
custom report titles 1524
custom sort order 152
custom worksheet names 1524
customizing column titles in a Master File 1596
customizing graphs 1789, 1807
customizing reports 37, 1903
customizing sort order 152
Index
2008
D
data 1264, 1265
retrieval 1820, 1895, 1896
date constants 439
date expressions 439, 444
date fields 439
date formats 1921, 1922
date formats and SQL Translator 1921, 1922
date support in graphs 1782
date value formats 440
date values 440
date-time data types 450
date-time expression types 439
date-time expressions 439
date-time field formats 450
date-time format 454
date-time format and display fields 450
date-time values 439, 1923–1925
date-time values and SQL Translator 1923–1925
DATEFORMAT parameter 449, 450
DATEFORMAT setting 450
dates 441
dates in graphs 1782, 1783
DATREC format 516
Db2 format 516
Db2 HOLD format 516
Db2 output file format 516
DBAFILE attribute 1074
DBAJOIN 1143
DBASE format 517
DBASE HOLD format 517
DBASE output file format 517
decimal points 1664, 1666, 1668
decimal values 1664, 1668
declarations 1204, 1205
declaring filters 266
default browser type 1706
default column titles 1592
default font types 1705
default proportional fonts 1705
default StyleSheet values 1250
DEFAULT- FIXED attribute 1706
DEFAULT- PROPORTIONAL attribute 1706
DEFINE and dates 292, 293, 442
DEFINE attribute 429
DEFINE command 282, 284, 287, 429
DEFINE command and join structures 1096,
1097, 1099, 1146, 1147, 1149
DEFINE command and missing values 1040–1044
DEFINE command expressions 429
DEFINE compiler 1936
DEFINE FILE RETURN command 1149
DEFINE FILE SAVE command 291, 1149
DEFINE function 361
command 361
creating temporary fields 362
deleting 361, 366
displaying 361
displaying 365
limitations 361
Index
Creating Reports With TIBCO® WebFOCUS Language 2009

DEFINE function 361
limitations 363
querying 361
DEFINE functions 364
Define tool 287
defining custom groups 167, 168
defining field formats 1715
defining filters 265–267
defining macros 1208
defining virtual fields 284
DEFMACRO command 1206–1208
DEFMACRO commands 1206
DELETE command 1927
deleting underlines 1451, 1452
delimited file, creating 549
delimited output files 517
descending sort order 150, 151
designating missing values 1068
determining column width 1348–1352
DFIX 549
DFIX format 517
DFSORT utility 189
DHTML HOLD format 517
DHTML output format 517
Dialect Translation 1907
Dialogue Manager 429, 1817
Dialogue Manager variables 1559
FOCFIELDNAME 1995
DIF format 518
DIF output file format 518
DIF PCHOLD format 518
DIF SAVE format 518
direct percent 65
direct percent of counts (PCT.CNT) 65
display ADD command 50
display commands 39, 88, 1172
display commands and graph format 1753
display commands and MATCH FILE command
1172, 1173
display COUNT command 52, 88
display DOC formats for reports 644
display field values 41, 42
display fields 56, 57, 1716
display fields and graph format 1753
display fields for prefix operators 56
display formats for compound reports 941
display formats for EXCEL reports 576
display formats for EXL2K PIVOT reports 576
display formats for EXL2K reports 576, 578
display formats for HTML reports 578
display formats for PDF reports 578, 584, 585
display formats for PostScript reports 578, 584,
621, 623
display formats for reports 575, 576, 578, 579
display LIST * command 42
display LIST command 88
display LIST commands 39, 41
display PRINT * command 42
display PRINT command 88
display PRINT commands 39, 41
Index
2010

display SUM command 50, 51, 88
display SUM commands 39
display values 39
display WRITE command 50
displaying ADD command 50
displaying all fields in a segment 44
displaying all fields in segments 44
displaying captions 1856
displaying children 1856, 1858, 1859
displaying compound reports 937
displaying empty reports 1248
displaying error messages 193, 194
displaying excluded values 91
displaying field descriptions 84
displaying field names 1996
displaying field values 39, 41–43
displaying grand totals 375, 376
displaying graph data 1771
displaying hierarchy values as captions 1859
displaying HOLD Master Files 473, 477
displaying join structures 1151–1153
displaying LIST * command 42
displaying LIST command 41
displaying LIST commands 39
displaying missing values 1784
displaying missing values in graphs 1785
displaying parents and children 1856, 1858,
1859
displaying PRINT * command 42
displaying PRINT command 41
displaying PRINT commands 39
displaying reports 217, 575, 576, 578, 581, 584,
585, 621, 644
displaying reports as PDF 936
displaying reports as PostScript 936
displaying reports in a browser 581
displaying reports in PDFs 879
displaying reports in PostScripts 879
displaying reports in WebFOCUS Viewer 1023
displaying retrieval order 45
displaying retrieval order for multi-path data
sources 47
displaying structure for multi-path data sources
45, 46
displaying sub-totals 381–383
displaying subtotals 375–377, 380–383
displaying SUM command 50
displaying summary lines 428
displaying values 39
displaying WRITE command 50
distinct prefix operators 65, 66
division operator 432, 435
DOC format 518, 576, 644
DOC output file format 518
DOC PCHOLD format 518
DOC report display formats 644
DOC SAVE format 518
double exponential smoothing 324, 347, 348
FORECAST_DOUBLEXP 324
Index
Creating Reports With TIBCO® WebFOCUS Language 2011

drill through compound reports in PDF format
956–958, 961, 963, 969
drill through PDF compound reports 956–958,
961–963, 969
drill through reports 956–958, 961–963, 966,
969
drill-down reports 821, 822, 868, 869, 1798
drill-down reports compared 956
drill-downs 1798, 1800
drill-downs and ACROSSVALUE 1277
drill-downs and graphs 1792
drilling down graphs 1792, 1794
drilling down reports 822
DRILLMENUITEM attribute 1798
DRILLMETHOD 864
DRILLTHROUGH command 958
DROP VIEW command 1918
DROP VIEW command and SQL Translator 1919
DROPBLNKLINE parameter 1458
DST prefix operator 66
DST prefix operator restrictions 65
DST prefix operators 65
duplicate field names as column titles 1596,
1597
DUPLICATECOL parameter 182
dynamic reformatting 1738, 1739
dynamic reporting 1853
dynamic tables of contents 971
dynamic tables of contents for multiple sort
groups 978
dynamically formatting virtual fields 293, 294
E
editing font map files in Windows 626
editing font map files in z/OS 628
editing metrics files in Windows 626
editing metrics files in z/OS 628
EDUCFILE data source 1942, 1943
ELEMENT attribute 1513, 1514
elements in footings 1559
elements in headings 1559
embedded fields 1286, 1287
embedded fields in footings 1286
embedded quotation marks 457, 458
embedding compound reports graphs 940
embedding compound reports images 940
embedding graphics 940
embedding images 940
EMPDATA data source 1951
EMPLOYEE data source 1937, 1939, 1940
empty reports 1248
EMPTYREPORT SET parameter 1248
END command 34
ending a report request 34
EQ operator 246, 465
equijoins 1071, 1073, 1084
error files 1983
error messages 1983
escape characters 253–255
ESSBASE hierarchies 1853
Index
2012
establishing segment locations 290
estimating number of records 191
ESTLINES parameter 191
ESTRECORDS parameter 191
ex_forecast_dist 356
ex_forecast_mov 355
ex_forecast_mult 354
ex_regress_mult 359
Excel 2000 alignment 1637
Excel 2007
TOCs (tables of contents) 713
EXCEL display format 576
Excel formats 576
EXCEL report display format 576
Excel reports 713
EXCEPT operator 1921
EXCLUDES operator 256, 257
excluding missing values from tests 1053
existing data 246, 247
EXL07 display format
TOCs (tables of contents) 713
EXL2K alignment 1637
EXL2K display format 519, 576, 578
EXL2K FORMULA 520
EXL2K FORMULA display format 520, 576
EXL2K output file format 519
EXL2K PCHOLD format 519
EXL2K PIVOT 520
EXL2K PIVOT display format 576
EXL2K PIVOT format 520
EXL2K PIVOT report display format 576
EXL2K report display format 576
EXL2K SAVE format 519
EXL97 display format 520
EXPANDABLE command 991, 1020
expanding byte precision 55
expanding byte precision for COUNT command 54
expanding precision 55
explicit labels 1832–1834
EXPN and numeric functions 434
EXPN function 434
exponential moving average 313, 314, 320, 336,
337, 345
FORECAST_EXPAVE 320
exponentiation operator 435
exporting from data sources 473, 477
expression dates 430, 443
expression types 430
expressions 277, 429, 1921
expressions and SQL Translator 1921
expressions IF phrase 429
expressions, relational 466
EXTAGGR parameter 196
extending heading and footing code 1522
extending underlines 1453
external cascading style sheet class for ACROSS
values 1301
external cascading style sheet classes 1296
external cascading style sheet rules 1296, 1301
Index
Creating Reports With TIBCO® WebFOCUS Language 2013

external cascading style sheet rules BODY
element 1306
external cascading style sheet rules TD element
1306
external cascading style sheets 1195, 1297,
1304
benefits 1297
browser support 1323, 1325, 1329
choosing 1305
class names 1307
classes 1306, 1325
editing 1306
images 1323
linking to 1312
multiple 1305
multiple output formats 1318, 1320
report formatting 1298
requirements 1323
rules 1306, 1325
troubleshooting 1329
external files 1828
external report formatting cascading style sheets
1300
external sorting 189, 190, 193, 194
external sorting and aggregation 196
external sorting and HOLD files 199, 200
external sorting by aggregation 196–198
external sorting requirements 189
EXTHOLD parameter 200
extract files 472, 500, 503, 505, 564
extract files and missing values 1053, 1054
EXTRACT function 1925
extracting date components 444
EXTSORT parameter 189, 190
EXTUNDERLINE attribute 1453
F
FIELD attribute 1506
field dates 439
field format expressions 432
field formats 432, 443
field names 486–488, 1920, 1921, 1993
aliases 1993, 1994
displaying 1996
long 1994, 1995
qualified 1993–1995
truncated 1993, 1994
field padding 558–560
field references for COMPUTE command 301
field reformatting and missing values 1056, 1717
field values 39, 139, 1549, 1561
field values in headings and footings 1559–1561
field-based reformatting 292–294, 1738–1740
FIELDNAME command 1994
fields 277, 432, 1715, 1993
in report requests 1993, 1994
file location of external cascading style sheets
1305
file names 822
FILECOMPRESS parameter 586
Index
2014

FILEDEF command 472, 498
FILTER parameter 265–268
FILTER query command 265, 269, 270
filters 265, 266, 268–270, 272
FINANCE data source 1949, 1950
financial data 1859
retrieving 1894
retrieving values for rows 1821, 1822
Financial Modeling Language (FML) 1257, 1817,
1990
Financial Modeling Language (FML) and Dialogue
Manager 1817
Financial Report Painter 30
financial reports 30, 1189, 1817, 1853
adding data 1820, 1829
charts of accounts 1853, 1856, 1858, 1859
external files 1828
formatting 1871, 1872, 1874, 1876
formatting options 1871, 1874
hierarchies 1856, 1860, 1867–1869
HOLD files 1897
inserting text rows 1847
inserting variables in text rows 1848, 1849
inter-row calculations 1831, 1832
records in multiple rows 1827
recursive models 1852
repeating rows 1835
saving intermediate results 1894
sorting with BY 1828
sorting with FOR 1828
financial reports 30, 1189, 1817, 1853
supplying data as constants 1830
fixed scales 1802, 1807
FIXRETRIEVE parameter 496, 497
FLEX display format 521
FML (Financial Modeling Language) 1257, 1817,
1818, 1990
and Dialogue Manager 1817
FML hierarchies 1853, 1855, 1856, 1858, 1859
displaying 1853, 1856
indenting captions 1889
indenting row titles 1889
indenting text or numbers 1872
loading into memory 1867, 1868
FML Painter 30
FOCEXEC attribute 822
FOCEXEC attributes 822
FOCFIELDNAME variable 1995
FOCFIRSTPAGE SET parameter 1390, 1391, 1397
FOCHTMLURL parameter 993
pop-up field descriptions and 85
FOCPOST files 1894
FOCUS data sources 218, 479
FOCUS file structure 479, 481
FOCUS format 521
FOCUS StyleSheets 1871
FOLD-LINE command 1349, 1358
FONT attribute 1705, 1706
font attributes 1611, 1686
font colors 1699, 1703, 1708, 1710
Index
Creating Reports With TIBCO® WebFOCUS Language 2015
font file 626, 628
font files 624
font inherited styles 1702
font map files 624, 626
font sizes 1699, 1700
font styles 1701
fonts 624, 1609, 1699, 1705
fonts and labels 1611
fonts and system variables 1614
fonts and titles 1611
fonts in headings and footings 1611, 1613
fonts in HTML reports 1706
fonts in HTML Reports 1706
footing code 1522
FOOTING command 1538, 1619, 1903
FOOTING component 1279, 1281
footing limitations 1521
footings 1275, 1519, 1520, 1534, 1538
footings for bursted reports 1032
FOR field
reusing values 1826
FOR phrase 65, 67, 153, 167, 168, 1817, 1818,
1821, 1828, 1829
reusing values 1826
syntax 1990
FORECAST 314, 339, 354–356
calculating trends 336
double exponential smoothing 347, 348
exponential moving average 336, 337, 345
limit 315, 340
FORECAST 314, 339, 354–356
linear regression analysis 336, 337
linear regression equation 351, 353
predicting values 336
processing 314, 337
simple moving average 336, 337, 341, 343
triple exponential smoothing 349, 350
format ALPHA 512
format dates 440, 441
FORMAT DFIX 549
format DHTML 517
formatting blank lines 1446, 1447
formatting carriage-returns for text fields 1741
formatting cells 1871, 1874, 1876
formatting cells and labels 1876
formatting columns 1714–1716, 1871, 1874,
1877
formatting dates in graphs 1783
formatting fields 432, 443
formatting financial reports 1456, 1457
formatting footings 1609
formatting graphs 1761, 1762, 1774
formatting heading and footing lines 1664
formatting headings 1609
formatting HOLD files 473
formatting labels 1609
formatting line-feeds for text fields 1741
formatting output files 511
formatting PCHOLD files 509
Index
2016

formatting reports 1189, 1191, 1295, 1298,
1300, 1325, 1503, 1504, 1911
formatting reports and SQL Translator 1911
formatting reports in FML (Financial Modeling
Language) 1456, 1457
formatting rows 1871, 1874–1876, 1878
formatting rows and labels 1874–1876
formatting SAVB files 508
formatting SAVE files 506
formatting skipped lines 1446, 1447
formatting text 1880
formatting text fields 1654, 1741
formatting text rows 1879
formatting titles 1609
FORMULTIPLE parameter 1826, 1827
free text 1275, 1847, 1848, 1879
formatting 1874, 1878–1880
free-form reports 30, 1189, 1325, 1664, 1668,
1899, 1906
FREETEXT component 1278, 1279, 1879, 1880
freezing HTML headings 1542
FROM ... TO operator 243, 244
FST prefix operator 68, 69
full outer join 1107
functions 429, 1845
FYRTHRESH attribute
date-time data type and 450
G
Gantt charts 1770
GAPINTERNAL attribute 1362
GE operator 245, 465
generating TABLEF commands 1927
GET 864
GET CHILDREN parameter 1856, 1860
GGDEMOG data source 1961
GGORDER data source 1961
GGPRODS data source 1961
GGSALES data source 1961
GGSTORES data source 1961
GIF files 521
GIF format 521
Gotham Grinds data sources 1961
grand totals 375, 1604
GRANDTOTAL component 1258, 1259, 1269,
1270, 1272
GRAPH command 1746
GRAPH command compared to TABLE command
1747
graph footings 1800
graph formats 1753, 1761
graph formats and display commands 1753
graph formats and display fields 1753
graph formats and sort phrases 1753
graph formatting 1300
graph formatting BODY element 1306
graph formatting in external cascading style
sheets 1308, 1325
graph formatting TD element 1306
Index
Creating Reports With TIBCO® WebFOCUS Language 2017

graph formatting with external cascading style
sheets 1300
graph headings 1800
graph height 1802, 1803
graph SET parameters 1802
graph styling 1800, 1801
graph titles 1524
graph types 1751
graph width 1802, 1803
GRAPHBASE attribute 1504
GRAPHCOLOR attribute 1233, 1503, 1504
graphic elements 870, 872
graphics 870, 1571
graphics in footings 1571
graphics in headings 1571
GRAPHLENGTH attribute 1503, 1504
GRAPHNEGCOLOR attribute 1504
graphs 30, 1745, 1746
displaying multiple graphs in columns 1780
GRAPHSCALE attribute 1504, 1508, 1510, 1511
GRAPHSERVURL SET parameter 1811–1813
GRAPHTYPE attribute 1233, 1501, 1503, 1506
GRAPHWIDTH attribute 1503, 1504
GRID attribute 1405, 1406, 1410, 1411
grids 1404, 1406, 1410, 1434, 1435, 1615
GRMERGE parameter 1775, 1784
group fields 1095
group fields and join structures 1095
group key values 257, 258
grouping numeric data 164–168
grouping numeric data into tiles 168, 169,
171–173
grouping sort fields 971, 978
groups of values 1826
identifying 1826
GRWIDTH parameter 1780
GT operator 245, 246, 465
GTREND parameter 1773
GUTTER attribute 1513, 1514
H
H data type 450
HAUTO parameter 1807
HAXIS parameter 1802
HEADALIGN attribute 1637, 1639, 1643, 1648
heading code 1522
HEADING command 1535, 1619, 1903
HEADING component 1279, 1281, 1282
heading limitations 1521
headings 1275, 1519, 1520, 1534
headings and footings for HTML index pages 1032
headings for bursted reports 1032
headings for graphs 1800
headings on panels 1574
HEADPANEL attribute 1574
helper applications 579
HGRID attribute 1405, 1434, 1435, 1616
HIDENULLACRS parameter 110
hiding columns 1374, 1377
hiding display fields 1373
Index
2018

hiding fields 1374, 1377
hiding fields in y-axis 1773
hiding rows 1892, 1893
hiding sort field values 178, 991
hiding y-axis fields 1773
hierarchical reporting
BOTTOM 208
BY HIERARCHY 208
hierarchical sort 208
SHOW 208
TOP 208
using WHEN 208
hierarchies 1853, 1860, 1868, 1869
displaying 1853
hierarchy of sort fields 973
high-order sort fields 1168, 1169, 1171, 1182,
1183, 1185
HMAX parameter 1807
HMIN parameter 1807
HOLD AT CLIENT command 473, 509
HOLD command 472, 473
HOLD file INTERNAL format 560, 561
HOLD file JSON format 524
HOLD file keys and indexes 505
HOLD file structured 564
HOLD file suppressing field padding 558–560
HOLD file text fields 547, 548
HOLD files 472, 473, 481, 496, 497, 564, 1160
HOLD files and external sorting 199, 200
HOLD files and merge phrases 1160, 1166, 1167
HOLD files and missing values 1053, 1054
HOLD files for financial reports 1897
HOLD files text fields 511
HOLD format ALPHA 512
HOLD format DATREC 516
HOLD format DFIX 517
HOLD format GIF 521
HOLD format INGRES 522
HOLD format INTERNAL 523, 558–560
HOLD format JPEG 523
HOLD format PowerPoint 526
HOLD format Red Brick 526
HOLD format SQL_SCRIPT 527
HOLD format SQLDBC 527
HOLD format SQLINF 527
HOLD format SQLMAC 528
HOLD format SQLMSS 528
HOLD format SQLODBC 528
HOLD format SQLORA 528
HOLD format SQLPSTGR 528
HOLD format SQLSYB 529
HOLD format SYLK 529
HOLD format TAB 529
HOLD format TABT 530
HOLD FORMAT VISDIS 531
HOLD format WK1 531
HOLD format WP 532
HOLD format XFOCUS 533
HOLD format
XML 534
Index
Creating Reports With TIBCO® WebFOCUS Language 2019

HOLD formats 511
HOLD formats AHTML 512
HOLD formats AHTMLTAB 512
HOLD formats APDF 513
HOLD formats EXL97 520
HOLD formats FLEX 521
HOLD formats FOCUS 521
HOLD Master Files 473, 478, 484, 486–488,
490, 491, 495, 498
HOLDATTR command 484, 495
HOLDATTR parameter 495
HOLDLIST command 484, 490–492
horizontal bar graphs 1501
horizontal labels 1801
horizontal waterfall graphs 1770
host fields 1101
host files 1074, 1083
HTML alignment 1637
HTML display formats for reports 581
HTML format 522, 576, 578, 581
HTML heading freezing 1542
HTML index pages 1031
HTML report display formats 581
HTML reports 84, 971, 1024, 1706
JavaScript files 1792
pop-up field descriptions 85
VBScript files 1792
HTML tables of contents 971, 973
HTML tables of contents for multiple sort groups
978
HTML5-only charts 1771
HTMLCSS SET parameter 1222
HTMLFORM command 1312
HTMTABLE format 522, 1312
hyperlinks 1024, 1323
hyperlinks in HTML reports 1024
I
identifying across columns in a style sheet 1256
identifying ACROSS phrase sort data 1267
identifying across totals in a style sheet 1268
identifying ACROSS-TOTAL values 1268
identifying ACROSSVALUE component 1268
identifying cells 1843, 1844, 1874
identifying column report components 1254
identifying columns 1255, 1256, 1266, 1835,
1874
by address 1838, 1839
by number 1836
by relative address 1839
by value 1841
contiguous columns 1837
in financial reports 1835, 1836
identifying data 1263
identifying data report components 1264, 1265
identifying embedded fields in report components
1286, 1287
identifying footings in a style sheet 1279, 1281
identifying free text in FML reports 1279
identifying free text in report components 1279
Index
2020
identifying headings in a style sheet 1279, 1281,
1282
identifying page numbers in report components
1290–1292
identifying ranges of multiple values 1825
identifying report components 1251, 1252
identifying report components for totals and
subtotals 1258–1260, 1269, 1270, 1272
identifying rows 1832–1834, 1874
in financial reports 1833, 1834
in WebFOCUS StyleSheets 1874–1876
identifying skipped lines in report components
1290–1292
identifying sort value report components 1277
identifying sort values 1275, 1277
identifying subtotal calculations in a style sheet
1274
identifying subtotals in a style sheet 1272, 1273
identifying text strings in report components
1284, 1286
identifying title report components 1275–1278
identifying totals in a style sheet 1272
identifying underlines in report components 1290,
1291
IF command with LIKE or UNLIKE 249
IF operator 236, 239
IF phrase 218, 249, 259, 260, 429, 1784
IF phrase expressions 429
IF-THEN-ELSE expressions
and missing tests 1047
IF/THEN/ELSE statements 467
IMAGE attribute 870, 940, 1464, 1467–1469,
1477, 1478, 1483
IMAGEALIGN attribute 1467, 1468
IMAGEBREAK attribute 1467, 1468
images 870, 872, 1559, 1571
images and WebFOCUS StyleSheets 1468
images in footings 1559, 1571
images in headings 1559, 1571
improving performance 199, 1084, 1927, 1929
IN command 1370, 1371
IN-GROUPS-OF option 1781
IN-GROUPS-OF phrase 164, 165
IN-RANGES-OF phrase 164, 166
INCLUDES operator 256, 257
including JavaScript in an HTML report 582
indentation
specifying between levels 1889
indenting captions 1859
independent paths 221, 223
index optimized retrieval 1926
index pages 1031
index pages for headings and footings 1032
INGRES formats 522
inheritance in style sheets 1316, 1329
inheritance style sheets 1210
inheriting attributes 1209, 1210
inline StyleSheets 1200
inline WebFOCUS StyleSheets 1204
inner join 1071, 1087, 1092
Index
Creating Reports With TIBCO® WebFOCUS Language 2021

inner join structures 1092
INSERT command 1927
INSERT INTO command 1917
inserting blank lines 1442
inserting page breaks 1241
inserting skipped lines 1241
inserting summary lines 1241
inserting text in financial reports 1847, 1848
inserting underlines 1241, 1442
inserting variables in free text 1848, 1849
inter-row calculations 1831
internal cascading style sheets (CSS) 1222, 1223
internal cascading style sheets (CSS) and
StyleSheets 1311
INTERNAL format 523, 558–560
internal matrixes 302, 1840
internal storage and field formats 441
interpolating X and Y axis values 1773
INTERSECT operator 1921
irrelevant report data 1037, 1038
IS NOT operator 248, 249
IS operator 248, 249
ISO standard date-time formats 454
ITEM attribute 1284
ITEM subtype 1284, 1286, 1656
ITEMS data source 1959, 1960
J
JavaScript files 1792
JavaScript functions 835, 836, 1797
JavaScript functions in HTML reports 582
JavaScript requirements 993
JavaScript requirements for Accordion Reports
993
JavaScript
requirements for pop-up field descriptions 85
JOBFILE data source 1940, 1941
JOBHIST data source;sample data sources
JOBHIST 1953
JOBLIST data source;sample data sources
JOBLIST 1953
JOIN AS_ROOT 1117
JOIN CLEAR command 1154
JOIN command 1073, 1078, 1079, 1083, 1084,
1097, 1104, 1913, 1915–1917
JOIN command and ALL parameter 1074, 1075
JOIN command and SQL Translator 1913,
1915–1917
join structures 1073, 1083, 1084, 1094, 1103,
1913, 1915
join structures and CHECK FILE command 1152
join structures and DBA security 1074
join structures and DEFINE command 1096,
1097, 1099, 1146, 1147, 1149
join structures and group fields 1095
join structures and numeric data types 1103
join structures and qualified field names 1916
join structures and virtual fields 1096, 1097,
1099, 1147, 1149
join structures and WHERE phrase 1151
Index
2022

join types 1071
join
from multi-fact synonym 1126
full outer 1107
joining data sources 272, 1073, 1074, 1083,
1102
joining fields 1102, 1103
joins 1071
JPEG format 523
JSCHART format 523
JSON format 524
JSURL parameter 1792
JSURL SET parameter 582
justification regions 1623
JUSTIFY attribute 1619, 1620, 1627, 1667, 1736
justifying column titles 1626–1631
justifying columns 1736
justifying data 1721, 1737
justifying field values 1659
justifying footings 1618
justifying grand totals 1633
justifying headings 1618
justifying headings and footings 1618–1622,
1624, 1625, 1657
justifying labels 1618
justifying report columns 1736
justifying row totals 1631, 1632
justifying subtotals 1633
justifying titles 1618
K
KEEPDEFINES parameter 1146, 1147
KEEPFILTERS SET parameter 271, 272
key fields 479, 481
keyed retrieval 496, 497
L
LABEL attribute 1257, 1278, 1874–1876
LABEL subtype 1875, 1881
LABELPROMPT attribute 1513, 1514
labels 1512, 1514, 1515, 1519, 1602, 1832
for rows 1833, 1834
formatting rows 1879
lagging values 1076
landscape orientation 1337
last page number 1392
last page number in a sort group 1394
LE operator 245, 465
LEDGER data source 1948, 1949
left margins 1339
left outer join 1071, 1090
left outer join structures 1092
LEFTGAP attribute 1343, 1345, 1348
LEFTMARGIN attribute 1339, 1341, 1342
legacy features 1196
legacy report formatting 1196
LIKE operator 248, 249
limit FORECAST 315, 340
limitations for headings and footings 1521
limitations in display fields 55
Index
Creating Reports With TIBCO® WebFOCUS Language 2023

limitations of dynamic tables of contents 991
limitations of HTML tables of contents 991
limiting data for graphs 1783
limiting display fields 55
limits column titles 1593
limits for display fields 55
LINE attribute 1283
line breaks 1741
line graphs 1751, 1754, 1755, 1762
LINE subtype 1283, 1284, 1286, 1656
line termination characters 643
line-by-line formatting 1664
line-feeds 1741
linear regression 313, 357, 359
linear regression analysis 314, 336, 337
linear regression analysis FORECAST 336, 337
linear regression equation 331, 351, 353
FORECAST_LINEAR 331
linear regression in graphs 1773
linear scales 1752, 1753
LINES SET parameter 1380
LINK element 1300, 1301, 1312
linking from graphics 870
linking graphic elements 870, 872
linking graphs 1794
linking images 870, 872
linking report components 821, 822, 824, 827,
828, 835, 836, 867, 870, 872, 874, 875, 1795,
1797
linking report pages 1024
linking report pages and heading text 1027
linking report pages and images 1024
linking report pages and page numbers 1027
linking report pages in HTML reports 1024
linking reports 971, 1024, 1224
linking reports with WebFOCUS StyleSheets 1024
linking summary and detail data 956, 961
linking summary and detail data drill through
reports 957, 958
linking to a Maintain procedure 838, 839
linking to external cascading style sheets 1301,
1312
linking to JavaScript functions 835, 836, 1797
linking to Maintain procedures 839
linking to Uniform Resource Locators (URLs) 827,
828, 1795
linking to URLs (Uniform Resource Locators) 827,
828, 1795
linking with conditions 867–869
links 821, 822
LIST * command 42
LIST command 39, 41, 54, 88
list records 41
listing join structures 1153
listing records 41, 42
literals 1921
LOAD CHART command 1867, 1868
load procedures 1937
loading a hierarchy into memory 1867, 1868
Index
2024

LOCATOR data source;sample data sources
LOCATOR 1954
logarithmic scales 1752, 1753
logical expression types 465
logical expressions 235, 247, 430, 465
logical operator 247
logical operators 235, 236, 465
long field names 1993–1995
LOOKGRAPH parameter 1761, 1762
LOTUS format 524
LST prefix operator 68
LT operator 245, 246, 465
M
MACRO attribute 1207
macros 1196, 1206–1208
macros style sheets 1206, 1207
mailing labels 1512–1515
Maintain procedures 838, 839
maintaining across joins 272
maintaining filters 272
maintaining filters across joins 271
margins 1339, 1341
masked fields 248, 250
masking characters 248, 250, 1826
retrieving multiple values with 1826
retrieving values with 1826
masks 248, 249
Master Files 29, 246, 265, 1855, 1937
for financial reports 1855
Master Files 29, 246, 265, 1855, 1937
for FML hierarchies 1855, 1867, 1868
for hierarchies 1855
hierarchies in 1867, 1868
MATCH command 1158, 1160–1162, 1596,
1597, 1989
MATCH FILE command 1158, 1160, 1162, 1166,
1167
MATCH FILE command and concatenated data
sources 1180
MATCH FILE command and display commands
1172, 1173
MATCH FILE command and merge phrases 1160,
1166
MATCH FILE commands 1160
MATCHCOLUMNORDER parameter 1160
matrix reports 141, 142, 367, 370
matrix type reports 141
MATRIXORDER attribute 1513, 1514
MAX prefix operator 61
MAX prefix operators 61
maximum prefix operators 61
MDE prefix operator 62
MDN prefix operator 62
measurement units 1340
measuring fonts 1667
measuring for column width alignment 1667
measuring for decimal alignment 1667
merge phrases 1160, 1167
merge phrases and HOLD files 1160, 1166, 1167
Index
Creating Reports With TIBCO® WebFOCUS Language 2025

merge phrases and MATCH FILE command 1160,
1166
merging data sources 1158, 1160–1162,
1166–1169, 1171–1173, 1180, 1182, 1183,
1185
merging data sources and display commands
1172, 1173
merging data sources and PRINT command 1172,
1173
merging data sources and SUM command 1173
merging multiple graphs 1775
merging multiple OLAP graphs 1778
metrics file 624, 626, 628
MIME types 579
MIN prefix operator 61
MIN prefix operators 61
minimum prefix operators 61
MISSING attribute 246, 1038, 1051–1053
MISSING attribute and extract files 1054
MISSING attribute and Master Files 1040, 1041
MISSING attribute and virtual fields 1041
MISSING attribute limits 1041
missing descendants 1061–1063
missing instances 1038
missing value data sources 1037
missing values 246, 1037–1039, 1061, 1062,
1719, 1784
missing values and ALL parameter 1061–1063
missing values and ALL prefix 1061
missing values and DEFINE command 1040–1044
missing values and extract files 1054
missing values and segment instances 1038,
1058–1060
missing values and temporary fields 1042
missing values for reformatted fields 1056, 1717
missing
in IF-THEN-ELSE expressions 1047
MORE phrase 1175–1177, 1180
MORE phrase and universal concatenation 1176,
1177
MOVIES data source 1959
multi-fact synonym
and join 1117, 1126
multi-pane reports 1512, 1517
multi-path data sources 45–47, 50, 290
multi-segment data sources 256, 257
multi-segment files 256
multi-table HTML reports 1379, 1380, 1383
multi-verb requests 181
MULTILINES command 377, 383, 1604, 1607
multipath join structures 1092
MULTIPATH parameter 221–223, 226
multiple display commands 181
multiple display commands and ROW-TOTAL 371
multiple drill-down links and WHEN phrase 855
multiple drill-down links conditional styling 855
multiple drill-down reports 1798
multiple drill-downs 1798
multiple graphs 1774
multiple parameters 865
Index
2026
multiple records 1823
multiple sort fields 90, 91, 107, 181
multiple values 1823
multiple verbs 181
multiple virtual fields 286
multiple web pages 1379
multiple WHERE phrases 220
multiple Y-axis graphs 1770
multiple-line footings 1540
multiplication operator 432, 435
multivariate REGRESS 357–359
N
naming extract files 472
naming output files 472
naming StyleSheet files 1203
naming WebFOCUS StyleSheet files 1203
National Language Support (NLS) 189
native-mode arithmetic 437
navigating between reports 990
NE operator 246, 247, 465
NLS (National Language Support) 189
NOBREAK phrase 937
NODATA character 1037, 1038, 1068, 1069,
1719, 1720
non-numeric fields 50, 51
non-recursive models 1852
non-unique join structures 1071, 1074, 1075
NOPRINT command 178, 1374, 1377, 1773,
1892
NOSPLIT command 1385, 1386
NOT FROM ... TO operator 243, 244
NOT LIKE operator 248
NOT operator 465
NOTOTAL command 425, 426
null values 1719
numeric constants 1921
numeric data 164, 168
numeric data types 1102
numeric data types and join structures 1103
numeric expressions 430, 435–438
evaluating 437
numeric fields 50
numeric functions 434
numeric operator expressions 432, 435
O
OBJECT attribute 1284
OBJECT subtype 1656, 1662
OLAPGRMERGE parameter 1778
OMITS operator 247
ON phrase 1241
ON TABLE SET command 1315
on-demand paging 1021, 1023
ONFIELD SET parameter 1242
ONLINE-FMT parameter 578
operand formats 437, 438
operators 432, 465
operators prefix 57
optimized join structures 1926
Index
Creating Reports With TIBCO® WebFOCUS Language 2027

optimizing join structures 1926
optimizing sorting data 189
OR operator 235, 465, 1824
order of evaluation 435, 436
ORIENTATION attribute 1334, 1337, 1338
outer join 1071, 1122
output file AHTML format 512
output file AHTMLTAB format 512
output file format 512
output file format DATREC 516
output file format DFIX 517
output file format GIF 521
output file format HTML 522
output file format HTMTABLE 522
output file format INGRES 522
output file format INTERNAL 523
output file format JPEG 523
output file format JSCHART 523
output file format LOTUS 524
output file format PDF 524
output file format PDF OPEN/CLOSE 525
output file format PostScript (PS) 526
output file format PPT 526
output file format Red Brick 526
output file format SQL_SCRIPT 527
output file format SQLDBC 527
output file format SQLINF 527
output file format SQLMAC 528
output file format SQLMSS 528
output file format SQLODBC 528
output file format SQLORA 528
output file format SQLPSTGR 528
output file format SQLSYB 529
output file format SYLK 529
output file format TAB 529
output file format TABT 530
output file format WK1 531
output file format WP 532
output file format XFOCUS 533
output file formats 511, 520
XML 534
output file JSON format 524
output file text fields 547, 548
output files 472, 500
output files and missing values 1054
output files text fields 511
output format VISDIS 531
output formats 511
OVER and column alignment 1362
OVER command 1349, 1359
overriding attribute inheritance 1212
overriding macros 1208
P
padded fields 558–560
PAGE BREAK command 1873
page breaks 1379, 1381
page breaks in financial reports 1873
page colors 1334, 1338, 1339
page count 1392, 1394
Index
2028

page footings 1534, 1538, 1540
page headings 1534, 1535
page layout 1333
page margins 1339, 1341
page numbers 1290–1292, 1390, 1392, 1394,
1397, 1399
page numbers in footings 1559
page numbers in headings 1559
page numbers in headings and footings 1569
page orientation 1334, 1337, 1338
page size 1334, 1335
PAGE-BREAK command 1381, 1694
PAGE-NUM SET parameter 1390, 1391, 1399
PAGECOLOR attribute 1334, 1338, 1339
PAGEMATRIX attribute 1513, 1514
PAGENUM component 1290–1292
PAGESIZE attribute 1334, 1335
PAGESIZE option 622, 623
paginating a report 1379
panels, repeating headings 1574
paper size settings 622, 623
parameters 856, 858, 860, 865
parent instances 1061–1063
parent segments in qualified field values 256
Pareto graphs 1770
PCHOLD AHTML format 512
PCHOLD command 472, 509, 576, 644, 974
PCHOLD command and PDF format 938
PCHOLD file JSON format 524
PCHOLD files 509
PCHOLD format 512
PCHOLD format DFIX 517
PCHOLD format HTML 522
PCHOLD format HTMTABLE 522
PCHOLD format JSCHART 523
PCHOLD format LOTUS 524
PCHOLD format PDF 524
PCHOLD format PDF OPEN/CLOSE 525
PCHOLD format PS (PostScript) 526
PCHOLD format TAB 529
PCHOLD format TABT 530
PCHOLD format WK1 531
PCHOLD format WP 532
PCHOLD formats 511, 520, 963
PCHOLD formats APDF 513
PCHOLD formats FLEX 521
PCHOLD formats in PDF 961
PCHOLD formats PDF 966
PCHOLD formats PDF OPEN/CLOSE 966
PCSEND command 1031
PCT percent 63
PCT prefix operators 63
PCT.CNT prefix operator 65
PDF (Portable Document Format) 524
PDF compound reports 938
PDF display format 576, 578, 585
PDF display format for compound reports 879,
936
PDF format 576, 584
PDF format on UNIX 642
Index
Creating Reports With TIBCO® WebFOCUS Language 2029

PDF OPEN/CLOSE and PCHOLD formats 963
PDF OPEN/CLOSE format 525
PDF report display formats 576, 578, 585
PDFLINETERM parameter 642–644
percent (PCT) 63
percentiles 168
performance 189, 1927, 1929
performing calculations on dates 441
PERSINFO data source;sample data sources
PERSINFO 1955
PICTURE RETRIEVE command 45
pie graph 1758
pie graphs 1751, 1759, 1764
placing footings on a separate page 1694, 1696,
1697
placing headings on a separate page 1694, 1696,
1697
plotting dates 1781
plotting dates in graphs 1781
PLUS OTHERS phrase 91
polar charts 1769
pop-up field descriptions 84
JavaScript requirements 85
ReportCaster and 85
portrait orientation 1337
POSITION attribute 1343–1345, 1467, 1478,
1481–1483, 1673, 1674
positional column referenced calculated values
300
positional field references for COMPUTE command
301
positional labels 1832–1834
positional referencing for columns 301
positioning columns 1342–1344, 1348,
1369–1371
positioning columns for WebFOCUS StyleSheets
1736
positioning footings 1673, 1691–1693
positioning headings 1673, 1690
positioning headings and footings 1673–1676,
1693
positioning report components 1342, 1343
positioning reports for headers and footers 1736
positioning with spot markers 1682–1684
POST 864
POST command 1895
posted data
retrieving 1895, 1896
posting data 1894, 1895
in financial reports 1894
posting financial data 1894
PostScript (PS) format 526, 584
PostScript (PS) reports 622, 623
PostScript display format 576, 578, 621
PostScript display format for compound reports
879, 936
PostScript display formats for reports 622, 623
PostScript fonts 624, 626
PostScript fonts in UNIX 626
Index
2030

PostScript fonts in Windows 626
PostScript fonts in z/OS 628
PostScript format 576
PostScript formats 624
PostScript report display formats 578, 621–623
PostScript Type1 fonts 624
PowerPoint format 526
PPT format 526
precision 54
predicting values 357
prefix operators 56, 57, 389–391, 403, 405, 411,
413, 414, 1560
MDE 62
MDN 62
preserving field names 484
preserving missing values 1053, 1054, 1058
preserving virtual fields 291
preventing breaks 1385
preventing page breaks 1385
PRINT * command 42
PRINT command 39, 41–43, 88, 1172, 1173
PRINT command and merging data sources 1172,
1173
PRINT command unique segments 50
print display formats 584
PRINT OFFLINE parameter 1816
printing graphs 1816
printing labels 1512, 1513, 1515
printing multi-pane reports 1517
PRINTONLY parameter 490, 492
PRINTPLUS parameter 1680
procedures sorting data 189
producing a direct percent of a count 65
product position graphs 1770
protecting virtual fields 291
PS (PostScript) format 584
Q
qualified field names 1916, 1920, 1921,
1993–1995
qualified field names and SQL join structures
1916
qualified field names and SQL Translator 1920,
1921
qualified field values 139, 256
QUALTITLES command 1596, 1597
query ? STAT command 190
query commands
? DEFINE 287
?F 1996
?FF 1996
querying HOLD files 473, 477
querying sort types 190
QUIT command 34
quotation marks 457
quote-delimited string 457, 458
R
radar graphs 1751, 1769
Index
Creating Reports With TIBCO® WebFOCUS Language 2031

range of records
combining 1825
range of values 1825
combining 1825
range tests 243–246
ranges 164–168
specifying in financial reports 1825
RANKED BY phrase 158, 159
RANKED BY TOTAL phrase 157, 176
ranking columns 176
ranking sort field values 72, 157–159, 173, 174
reading selection values from a file 260–262
reading values from a file 262, 263
READLIMIT operator 258
READLIMIT relational operator 258
RECAP and sort footings 1557
RECAP command 421–424, 429, 1817, 1818,
1831, 1832
and FML reports 1831
RECAP component 1258, 1269, 1270, 1274
RECAP expressions 1832
creating 1831
RECAP rows 1831
formatting 1881
RECOMPUTE command 383, 385, 389, 390, 403,
407–409, 411–414
RECOMPUTE command and propagation to grand
total 397
RECOMPUTE prefix operators 413
RECORDLIMIT operator 258, 259
RECORDLIMIT relational operator 258, 259
records 41, 218, 1823
in multiple rows 1826, 1827
reusing 1826, 1827
recursive join structures 1078–1080, 1916
recursive models 1852
recursive structures 1078, 1079
Red Brick format 526
REDBRICK format 526
redefining formats for fields 1715
reducing report width 1357
ref_regress_usage 358
reformatting fields 292–294, 1738, 1739
REGION data source 1950
REGRESS method 357
relational expressions 235, 465, 466
relational operator 248
relational operators 236, 239, 243, 245–248,
250, 465
relative column addresses 1839, 1840
relative point sizes and HTML fonts 1700
relative starting positions 1679
removing grids 1411
renaming column titles 1591, 1593, 1594
renaming column totals 367, 1602
renaming HOLD files AS phrase 473
renaming PCHOLD files 509
renaming row totals 367, 1602
REPAGE command 1381, 1390, 1391
repeating fields 1078
Index
2032

repeating fields in join structures 1078
repeating rows 1835
report columns 174
REPORT component 1252, 1253
report components 822, 824, 827, 828, 835,
836, 867, 870, 872, 874, 875, 1204, 1251,
1300, 1699, 1795, 1797
report components, column 1251
report components, entire report 1251
report components, row 1251
report display EXL2K formats 578
report display formats 575, 576, 578, 579
report display PDF formats 584
report display PostScript formats 584
report footings 1527, 1532
report formatting 1189, 1191, 1196
report formatting in external cascading style
sheets 1308
report formatting methods 1193
report formatting with external cascading style
sheets 1295, 1298, 1300
report formatting, inheritance in style sheets 1316
report headings 1527, 1528
report navigating 1197
report output formats 1318, 1320, 1322
report pagination 1379
report requests 1907
report requests and SQL statements 1907
report styling 1295
report styling in external cascading style sheets
1308
report styling with external cascading style sheets
1295, 1298, 1300
report SUM columns 174
report titles 1524–1526
reporting against hierarchies 1853, 1856,
1858–1860, 1869
reporting commands 1985
reporting options 1985
reports 29, 32, 34, 822, 971, 1031, 1699, 1705,
1993
creating 29, 30, 35
creating requests 32
customizing 32, 37
displaying 38
displaying data 32
financial 30
free-form 30
output 32
printing 38
requests 34
running 34
saving 38
selecting data 32
sorting data 32
specifying fields 32
types 30
requirements for external sorting 189
reserved words 1910
Index
Creating Reports With TIBCO® WebFOCUS Language 2033

restricting sort field values 157, 159, 173, 174
restrictions for distinct prefix operators 65, 67
restrictions for DST prefix operators 67
restructuring data 1931
retrieval data 221, 223
retrieval limits 258, 259
retrieval logic 1929
retrieval order 197, 198
retrieving data 221, 223
retrieving HOLD Master Files 498
retrieving records 68, 69, 258, 259, 1084
returned fields 443
reusing output reports 471
reusing report output 471
right margins 1339
RIGHTGAP attribute 1343, 1345
RIGHTMARGIN attribute 1339, 1341
RNK. prefix operator 72
rotating data sources 1929
rounding numeric values 432
row formatting 1871, 1874
row labels 1832, 1834
row percent (RPCT) 63
row titles 1278, 1870, 1871
PICKUP rows 1896
RECAP rows 1871
TAG rows 1870
row total labels 1602
row totals 367, 370, 371, 374, 375, 1602
ROW-TOTAL phrase 367–369
ROW-TOTAL with ACROSS and multiple display
commands 371
rows 1257, 1258
retrieving values for 1821
ROWTOTAL attribute 1260
RPCT prefix operator 63
RPCT row percent 63
rules in external cascading style sheets 1301
RUN command 34
S
SALES data source 1943–1945
SALHIST data source;sample data sources
SALHIST 1956
SAME DB 500
SAME_DB extract files 500, 501, 503, 505
SAME_DB HOLD files 500, 501, 503, 505
SAME_DB HOLD format 500, 501, 503
SAME_DB HOLD format columns 505
SAME_DB output files 500, 501, 503, 505
sample data sources 1937
CAR 1945, 1947
Century Corp 1967
COURSE 1952, 1953
EDUCFILE 1942, 1943
EMPLOYEE 1937, 1939, 1940
FINANCE 1949, 1950
Gotham Grinds 1961
ITEMS 1959, 1960
JOBFILE 1940, 1941
Index
2034

sample data sources 1937
LEDGER 1948, 1949
MOVIES 1959
REGION 1950
SALES 1943–1945
TRAINING 1951, 1952
VIDEOTR2 1960, 1961
VideoTrk 1956–1958
SAVB command 506
SAVB files 506
SAVE AHTML format 512
SAVE AHTMLTAB format 512
SAVE command 472, 506
SAVE files 506
SAVE format 512
SAVE format EXL2K 520
SAVE format HTML 522
SAVE format HTMTABLE 522
SAVE format LOTUS 524
SAVE format PDF 524
SAVE format SYLK 529
SAVE format TAB 529
SAVE format TABT 530
SAVE format WP 532
SAVE formats 511, 520
saving drill-down reports with HTMTABLE 1798
saving graphs as GIF files 1811, 1813
saving graphs as GIF files using SET
GRAPHSERVURL 1811
saving HOLD Master Files 498, 499
saving intermediate report results 1894
saving output files 472
saving report output 471, 472
saving reports 471, 472
saving rows 1894, 1895
saving virtual fields 1145–1147, 1149
scalar functions 1921
scale graphs 1752, 1753
scales 1752, 1753
scaling 1508, 1510
scaling and vertical bar graphs 1511
scatter graphs 1751, 1760, 1765
screening conditions 265
screening segments 1151
screening values 302
scrollable area for HTML output 1542
search option of WebFOCUS Viewer 1023
SEG. operator 1995
segment instances 1037, 1061–1063
segment instances and missing values
1058–1060
segment locations 289
segment types 68, 69
segments 221, 226, 1038, 1995
SEGTYPE parameter 496
selecting graph types 1751
selecting paper size 622, 623
selecting paper size for PS (PostScript) format
584
selecting paper size for style sheets 623
Index
Creating Reports With TIBCO® WebFOCUS Language 2035

selecting paper size PostScript (PS) format 622
selecting PostScript (PS) format paper size 623
selecting records 217, 218, 221, 223, 226–228,
235, 236, 239, 243, 247, 248, 256–264, 274,
1906
selecting records with IF phrase 261, 262, 264
selecting records with VSAM 274
selecting sort procedures 190
selecting sort types 190
selecting style sheets 1195
selecting values using WHERE phrase 261
selecting values with IF phrase 264
selection criteria 217–221, 223, 236, 239, 243,
260–264, 427
selection values 263
selection values with IF phrase 264
sending graphs directly to a printer 1816
SEQUENCE attribute 1356
sequential conditional formatting 1225
SET ACROSSPRT 107
SET ALL parameter 1061–1063
SET ASNAMES parameter 484
SET AUTOINDEX parameter 1932
SET AUTOPATH parameter 1932
SET BLANKINDENT parameter 1889
SET BYTOC parameter 973
SET CDN parameter 1719
SET CNOTATION parameter 302, 303, 1840,
1841
SET commands 973, 974
SET COMPMISS parameter 1056, 1717
SET COMPOUND parameter 937
SET COMPUTE = NEW command 1936
SET COUNTWIDTH parameter 54
SET CSSURL command 1315
SET DATEFORMAT parameter 450
SET DEFINES command 1936
SET DUPLICATECOL command 182
SET EMPTYREPORT parameter 1248
SET EXPANDABLE parameter 991, 1020
SET EXTSORT parameter 189
SET FILECOMPRESS command 586
SET FILTER parameter 265, 268
SET FOCFIRSTPAGE parameter 1390
SET FORMULTIPLE parameter 1826, 1827
SET GRAPHSERVURL parameter 1811–1813
SET GRMERGE parameter 1775, 1784
SET GRWIDTH parameter 1780
SET GTREND parameter 1773
SET HAUTO parameter 1807
SET HAXIS parameter 1802
SET HMAX parameter 1807
SET HMIN parameter 1807
SET HOLDATTR parameter 484, 495
SET HOLDLIST parameter 484, 490–492
SET HOLDMISS parameter 1053
SET HTMLCSS parameter 1222
SET JSURL parameter 582
SET KEEPFILTER parameter 271, 272
SET LINES parameter 1380
Index
2036

SET LOOKGRAPH parameter 1761, 1762
SET NODATA command 1719
SET NODATA parameter 1719
SET OLAPGRMERGE parameter 1778
SET ONLINE-FMT parameter 578
SET PAGE-NUM parameter 1390
SET parameter ESTLINES 191
SET parameter ESTRECORDS 191
SET parameter EXTAGGR 196
SET parameter EXTHOLD 200
SET parameter NULL=ON 530
SET parameters 579, 642, 1200, 1890, 1932
ACRSVRBTITL 96
DBAJOIN 1143
DROPBLNKLINE 1458
DUPLICATECOL 182
FIELDNAME 1994
HIDENULLACRS 110
JSURL 1792
MATCHCOLUMNORDER 1160
SET PDFLINETERM parameter 642–644
SET PRINTPLUS parameter 1680
SET PSPAGESETUP parameter 622, 623
SET QUALITIES parameter 1596, 1597
SET SHOWBLANKS parameter 579
SET SPACES parameter 1349
SET SQLTOPTTF parameter 1927
SET STYLE * parameter 1807, 1808
SET STYLEMODE parameter 1380
SET STYLESHEET parameter 1202, 1250
SET SUMARYLINES parameter 397
SET SUMMARYLINES parameter 398, 408
SET UNITS parameter 1223
SET VAXIS parameter 1802
SET VMAX parameter 1808
SET VMIN parameter 1808
SET WEBVIEWER parameter 1379
SET WPMINWIDTH 533
setting conditions for linking reports 1224
setting fixed scales 1802, 1807, 1808
setting graph height 1802
setting graph height and width 1802
setting page colors 1339
setting paper size for PostScript (PS) reports 623
setting retrieval order 198
setting x-axis fixed scales 1802, 1807
setting y-axis fixed scales 1802, 1808
sheet names 1524
SHOW for SAP BW 208
SHOWBLANKS SET parameter 579
simple moving average 314, 315, 336, 337, 341,
343
FORECAST_MOVAVE 315
single-line footings 1533
single-line headings 1529
SIZE attribute 1467, 1478, 1481–1483
SKIP-LINE option 1442, 1444, 1445
SKIPLINE attribute 1446, 1447
SKIPLINE component 1290–1292
skipped lines 1290–1292, 1444, 1445
Index
Creating Reports With TIBCO® WebFOCUS Language 2037

sort field values 173
sort fields 87, 971, 974, 1828
sort fields for multi-path data sources 89
sort fields using multi-path data sources 95
sort footing limitations 1521
sort footings 1520, 1545, 1551, 1554
sort footings and RECAP 1557
sort footings omitting a display command 1559
sort heading limitations 1521
sort headings 1520, 1545, 1547, 1549, 1664
sort multiple fields 90, 107
sort order 90, 107, 164–168
sort phrases 41, 1753
sort phrases and graph format 1753
sort sequence 89, 95, 1828
sort temporary fields 89, 94
sort values 88, 89, 164
sorted by calculated values 176
sorting a hierarchy 208
sorting alphabetically 1379
sorting by calculated values 174–176
sorting by columns 95, 96, 107, 176
sorting by rows 89
sorting columns 175
sorting columns by 94
sorting data 91, 189, 190
sorting data by columns 95, 96
sorting data by multiple fields 90, 107
sorting data by rows 88–91
sorting report columns 174, 175
sorting reports 87, 88, 1906
sorting rows by 88–91
sorting with COMPUTE command 176
SORTWORK files 191
SPACES SET parameter 1349, 1355
spacing between columns 1348, 1354, 1355
specifying date-time values 450
specifying fields 32
specifying fonts for reports 1705
specifying sort order 150–155
specifying Uniform Resource Locators (URLs) 874
specifying URLs 1469
specifying URLs (Uniform Resource Locators) 874,
875
spectral charts 1770
spot markers 1286, 1522
SQL join structures 1913, 1915
SQL join structures and qualified field names
1916
SQL SELECT statement 1912
SQL statements 1907–1909
SQL statements and FOCUS TABLE requests
1907
SQL Translation Services 1907–1909
SQL Translator 1907
SQL Translator and aliases 1916
SQL Translator and Cartesian product answer sets
1920
SQL Translator and Continental Decimal Notation
(CDN) 1920
Index
2038

SQL Translator and CREATE TABLE command
1917, 1918
SQL Translator and CREATE VIEW command
1918, 1919
SQL Translator and date formats 1921, 1922
SQL Translator and date-time values 1923–1925
SQL Translator and DELETE command 1927
SQL Translator and DROP VIEW command 1918,
1919
SQL Translator and expressions 1921
SQL Translator and field names 1920, 1921
SQL Translator and index optimized retrieval 1926
SQL Translator and INSERT command 1927
SQL Translator and INSERT INTO command 1917
SQL Translator and JOIN command 1913,
1915–1917
SQL Translator and join structures 1926
SQL Translator and reserved words 1910
SQL Translator and SQLTOPTTF parameter 1927
SQL Translator and time and timestamp fields
1921, 1922
SQL Translator and UPDATE command 1927
SQL Translator commands 1910, 1912
SQL Translator commands and formatting
commands 1911
SQL_SCRIPT format 527
SQLDBC format 527
SQLINF format 527
SQLMAC formats 528
SQLMSS formats 528
SQLODBC formats 528
SQLORA formats 528
SQLPSTGR formats 528
SQLSYB formats 529
SQLTOPTTF parameter 1927
SQUEEZE attribute 1350–1352
ST. prefix operator 1560
stacking columns 1348, 1357
stacking columns with FOLD-LINE 1358
stacking columns with OVER 1359
STAT query 190
stock charts 1767
storing StyleSheet files 1203
storing WebFOCUS StyleSheet files 1203
structure diagrams 1937
structured HOLD files 564
STYLE * parameter 1807, 1808
STYLE attribute 1451, 1701
style sheet attributes 1300
style sheet CLASS attribute (StyleSheets) 1308,
1309
style sheet CSSURL attribute (StyleSheets) 1312,
1313
style sheet types 1222
style sheets 1192, 1199, 1223, 1699, 1871
cascading style sheets (CSS) 1295
multiple output formats 1322
STYLEMODE parameter 1323
STYLEMODE SET parameter 1380
StyleSheet attributes 1871
Index
Creating Reports With TIBCO® WebFOCUS Language 2039

StyleSheet CLASS attribute 1308, 1309
STYLESHEET command 1202
StyleSheet CSSURL attribute 1312, 1313
StyleSheet declarations 1205, 1206
StyleSheet files 1202, 1203
STYLESHEET parameter 983
STYLESHEET SET parameter 1250
StyleSheets and external CSS 1311
styling ACROSS-TOTAL component 1268
styling free-form reports 1325
styling graphs 1801
styling reports 1295, 1503, 1504
styling reports in external cascading style sheets
1308
styling reports with external cascading style
sheets 1295, 1298, 1300
sub-total calculated values 383
SUB-TOTAL command 377, 380–382, 389–391,
405, 407, 408, 410–413
SUB-TOTAL command and propagation to grand
total 397
SUB-TOTAL prefix operators 413
SUBFOOT command 1532
SUBFOOT command report footings 1532
SUBFOOT command sort footings 1551
SUBFOOT component 1279, 1281
SUBHEAD command 1528, 1547
report headings 1528
SUBHEAD component 1279, 1281
subquery file 527
subroutines 1845
subtotal calculated values 383
SUBTOTAL command 377, 380–382, 389–391,
405, 407, 409–413
SUBTOTAL command and propagation to grand
total 397
SUBTOTAL component 1258, 1269, 1270, 1273
subtotal labels 1604
SUBTOTAL prefix operators 413
SUBTOTAL SUMMARYLINES command 408
subtotals 383–385, 407, 408, 421–424,
1258–1260, 1269, 1270, 1602, 1604
subtraction operator 435
subtype attribute 822, 827, 835, 839, 1795,
1797, 1798
subtypes 822, 1656, 1875
SUM command 39, 50, 51, 88, 1172, 1173
SUM command and merging data sources 1172,
1173
SUM prefix operator 70
SUMMARIZE command 383, 384, 389, 390, 403,
405, 407, 408, 413
SUMMARIZE command and propagation to grand
total 397
SUMMARIZE prefix operators 413
summary commands 407, 411
summary lines 427, 428
summary values 389, 390, 414
SUMMARYLINES SET parameter 397, 398, 408
summing columns 175
Index
2040

summing field values 88
summing report columns 175
summing values 88
SUMPREFIX parameter 198
SUP-PRINT command 178, 1374, 1377
supplying data directly in FML 1829, 1830
supplying images descriptions for screen readers
1475
supported data sources 1073
suppressing column titles 1595
suppressing display fields 1373
suppressing display in financial reports 1892,
1893
suppressing field padding 558–560
suppressing grand totals 425, 426
suppressing page numbers 1400
suppressing rows 1892, 1893
suppressing rows in financial reports 1892, 1893
suppressing sort field values 178
suppressing sort footings 1556
suppressing wrapping data 1724
SYLK format 529
syn_regress_mult 357
SyncSort utility 189
T
TAB format 529
tab names 1527
tab-delimited output files 529, 530
TABFOOTING component 1279, 1281
TABHEADING component 1279, 1281
TABLASTPAGE system variable 1390–1393
TABLE command 1986
TABLE command compared to GRAPH command
1747
TABLE FILE command 32, 34
TABLE requests 1907
TABLEF command 1927, 1935, 1988
TABLEF command and data retrieval 1935, 1936
TABLEF command and SQL Translator 1927
tables of contents (TOCs) 971
TABPAGENO system variable 1390–1392
TABT format 530
tag names 1079
TAG rows 1892, 1893
suppressing display in financial reports 1892,
1893
tag values 1821
reusing 1821, 1826, 1827, 1860
TARGET attribute 875
target frames 875–878
TARGET parameter 993
TARGETFRAME SET parameter 875–878
TD element 1306
temporary fields 277–280
calculated values 297
creating 32
DEFINE FUNCTION 361
evaluation 279
types 278
Index
Creating Reports With TIBCO® WebFOCUS Language 2041

temporary sort fields 95
temporary tables 500, 503, 505
temporary tables extract files 501
temporary tables HOLD files 503, 505
temporary tables output files 501, 503, 505
testing character strings 247–255
testing data fields 248, 249
testing for blanks or zeros 1052
testing for existing data 246, 247, 1052
testing for missing segment instances 1068
testing for missing values 1050, 1051, 1068
testing multi-segment files 256
TEXT component 1284
text field output files 547, 548
text fields 89, 1654
text fields and alphanumeric fields 360
text fields in DEFINE and COMPUTE 360
text fields in headings and footings 1567, 1568
text fields output files 511
text rows 1847, 1848
formatting 1878
text strings 1286
three-dimensional graphs 1765
TILE column 168, 169, 172
tile fields 168, 169, 172, 173
TILES phrase 168, 169, 172, 173
time fields 1921
time fields and SQL Translator 1922
timestamp data type 450
timestamp fields 1921
timestamp fields and SQL Translator 1922
TITLE attribute 495, 1593, 1596
TITLE component 1276, 1277
titles 1275, 1519, 1520, 1524
titles of column 1277
titles of columns 1275, 1276
TITLETEXT attribute 1525, 1526
TO phrase 1825
TOCs (tables of contents) 971
TOP 208
top margins 1339
TOPGAP attribute 1343, 1345, 1347, 1689
TOPMARGIN attribute 1339, 1341
TOT prefix operator 70
total page count 1392
totals 367, 374, 375, 1258–1260, 1269, 1270
trailing blanks 1564
TRAINING data source 1951, 1952
treating as literal masking characters 253, 254
treating as literal wildcard characters 253, 254
treating literal masking characters 255
treating literal wildcard characters 255
triple exponential smoothing 326, 349, 350
FORECAST_SEASONAL 326
truncated field names 1993
truncating decimal values 438
TYPE attribute 822, 827, 835, 839, 1204, 1451,
1510, 1611, 1795, 1797, 1798
Index
2042

U
UNDER-LINE option 1442, 1448
UNDERLINE attribute 1449, 1450
UNDERLINE component 1290, 1291
underlines 1290, 1291, 1442
underlines in Financial Modeling Language (FML)
reports 1456, 1457
underlines in financial reports 1872
underlining values 1448–1450
Uniform Resource Locators (URLs) 827, 828,
874, 875, 1469, 1795
UNION operator 1921
unique join structures 1071, 1074, 1075, 1087
unique segments 42, 43, 53
unique segments for PRINT command 45
UNITS attribute 1223, 1339
units of measurement 1223, 1340
universal concatenation 1175
universal concatenation and field names 1178,
1179
universal concatenation and MORE phrase
1175–1177
UNIX 642–644
UNIX PDF files 642–644
UNIX PDF format 644
UNLIKE 249
UPDATE command 1927
URLs (Uniform Resource Locators) 827, 828,
874, 875, 1469, 1795
using ACROSS phrase with Accordion Reports 991
using ACROSSVALUE component for a numeric
column reference 1268
using BY phrase with Accordion Reports 991
using concatenation with AnV fields 461
using CONTAINS and OMITS with AnV fields 461
using drill-down reports conditions 868, 869
using drill-downs with Accordion Reports 993
using EDIT function with AnV fields 461
using LIKE fields with AnV fields 462
using multiple parameters 865
using operators with AnV fields 462
V
value dates 440
value format for dates 441
values 1824
for columns 1841
in multiple rows 1826, 1827
reusing 1827
variable length character expressions 460, 461
variables 357
dependent and independent 357
VAUTO parameter 1808
VAXIS parameter 1802
VBScript files 1792
VBScript in an HTML report 582
verbs 39, 88
verbs, multiple 181
VERBSET attribute 184
verifying external sorting 190
Index
Creating Reports With TIBCO® WebFOCUS Language 2043

vertical bar graphs 1501
vertical bar graphs and scaling 1508, 1510, 1511
vertical labels 1801
vertical scaling 1508, 1510, 1511
vertical spacing 1687, 1689, 1691
vertical waterfall graphs 1770
VGRID attribute 1405, 1434
VIDEOTR2 data source 1960, 1961
VideoTrk data source 1956–1958
viewing reports 971
virtual fields 265, 266, 278–280, 289, 290
calculated values 279
VISDIS 531
Visual Discovery format 531
VMAX parameter 1808
VMIN parameter 1808
VMSORT utility 189
VSAM data sources 274
VSAM record selection efficiencies 274
VZERO parameter 1785
W
waterfall graphs 1770
web browser support for cascading style sheets
1325
WebFOCUS font map files 626
WebFOCUS Font Map files 624
WebFOCUS inheritance StyleSheets 1209, 1210
WebFOCUS macros StyleSheets 1206, 1207
WebFOCUS style sheets 1204, 1206, 1209, 1210
WebFOCUS StyleSheet CLASS attribute 1301
WebFOCUS StyleSheet CSSURL attribute 1301
WebFOCUS StyleSheet declarations 1204–1206
WebFOCUS StyleSheet files 1202, 1203
WebFOCUS StyleSheets 971, 983, 985, 1024,
1195, 1199, 1200, 1224, 1503, 1506, 1699,
1736
WebFOCUS StyleSheets and adding graphics
1464, 1476
WebFOCUS StyleSheets and conditional styling
1224, 1225, 1227, 1228, 1230, 1233, 1234,
1236
WebFOCUS StyleSheets and data visualization
1501, 1503, 1504, 1506
WebFOCUS StyleSheets and graphics 1468,
1478, 1483
WebFOCUS StyleSheets and graphs 1789
WebFOCUS StyleSheets and links 821, 822
WebFOCUS StyleSheets and multi-pane reports
1512, 1517
WebFOCUS StyleSheets and parameters 856, 860
WebFOCUS StyleSheets macros 1206
WebFOCUS Viewer 971, 1021
WebFOCUS Viewer search option 1023
WEBVIEWER SET parameter 1379
WHEN attribute 1224, 1225
WHEN EXISTS phrase 1893
WHEN for SAP BW 208
WHEN phrase 378, 427, 429, 1243
Index
2044

WHEN phrase and conditional formatting 1241,
1243–1246, 1555
WHEN phrase expressions 429
WHEN=FORECAST attribute 315, 340, 1227
WHERE operator 236, 239, 245, 246
WHERE phrase 218–220, 226, 228, 235, 248,
250, 260, 261, 263, 429, 1784
WHERE phrase and existing data 1052
WHERE phrase and join structures 1151
WHERE phrase and missing values 1051, 1053
WHERE phrase expressions 429
WHERE tests 242
WHERE TOTAL phrase 226–228, 1784
WHERE_GROUPED 228
WHERE-based join structures 1071
WIDTH attribute 1667
width of borders 1407
width of columns 1349–1352, 1354
wildcard characters 248, 250
window titles 1524
WITH CHILDREN parameter 1856
WITHIN phrase 139
WK1 format 531
worksheet names 1527
worksheet titles 1524
WP display formats for reports 644
WP format 532, 576, 644
WP report display formats 644
WPMINWIDTH parameter 533
WRAP attribute 1721, 1723
wrapgap StyleSheet attribute 1733
wrapping data 1721
wrapping data by Web browser functionality 1724
wrapping data reports 1721
WRITE command 50
X
x-axis 1771, 1774
XFOCUS format 533
XLSX display format 519
XLSX output file format 519
XLSX PCHOLD format 519
XLSX SAVE format 519
XML format 534
Y
y-axis 1771
y-axis fields 1773
Y2K attributes in Master Files 450
Year 2000 attributes in Master Files 450
YRTHRESH attribute 450
Z
z/OS requirements 189
zeros 1052
Index
Creating Reports With TIBCO® WebFOCUS Language 2045

Index
2046