creating evolving user behavior profiles automatically
TRANSCRIPT

IEEE TRANSACTIONS ON KNOWLEDGE AND DATA ENGINEERING , VOL., NO., JUNE 2010 1
Creating Evolving User Behavior ProfilesAutomatically
Jose Antonio Iglesias, Plamen Angelov, Agapito Ledezma and Araceli Sanchis
Abstract—Knowledge about computer users is very beneficial for assisting them, predicting their future actions or detectingmasqueraders. In this paper, a new approach for creating and recognizing automatically the behavior profile of a computer user ispresented. In this case, a computer user behavior is represented as the sequence of the commands (s)he types during her/his work.This sequence is transformed into a distribution of relevant subsequences of commands in order to find out a profile that defines itsbehavior. Also, because a user profile is not necessarily fixed but rather it evolves/changes, we propose an evolving method to keep upto date the created profiles using an Evolving Systems approach.In this paper we combine the evolving classifier with a trie-based user profiling to obtain a powerful self-learning on-line scheme. Wealso develop further the recursive formula of the potential of a data point to become a cluster center using cosine distance, whichis provided in the Appendix. The novel approach proposed in this paper can be applicable to any problem of dynamic/evolving userbehavior modeling where it can be represented as a sequence of actions or events. It has been evaluated on several real data streams.
Index Terms—Evolving fuzzy systems, fuzzy-rule-based (FRB) classifiers, user modeling.
F
1 INTRODUCTION
R ECOGNIZING the behavior of others in real-time is asignificant aspect of different human tasks in many
different environments. When this process is carried out bysoftware agents or robots, it is known as user modeling. Therecognition of users can be very beneficial for assisting themor predicting their future actions. Most existing techniquesfor user recognition assume the availability of hand-crafteduser profiles, which encode the a-priori known behavioralrepertoire of the observed user. However, the construction ofeffective user profiles is a difficult problem for different rea-sons: human behavior is often erratic, and sometimes humansbehave differently because of a change in their goals. Thislast problem makes necessary that the user profiles we createevolve.
There exists several definitions for user profile [1]. It can bedefined as the description of the user interests, characteristics,behaviors and preferences. User profiling is the practice ofgathering, organizing and interpreting the user profile infor-mation. In recent years, significant work has been carried outfor profiling users; but most of the user profiles do not changeaccording to the environment and new goals of the user. Anexample of how to create these static profiles is proposed ina previous work [2].
• Plamen Angelov is with the Department of Communication Systems,InfoLab21, Lancaster University, UK. E-mail:[email protected].
• Jose A. Iglesias, Agapito Ledezma and Araceli Sanchis are withthe CAOS Group, Carlos III University of Madrid, Spain. E-mails:{jiglesia,ledezma,masm}@inf.uc3m.es.
• This work is partially supported by the Spanish Government under projectTRA2007-67374-C02-02.
In this paper, we propose an adaptive approach forcreating behavior profiles and recognizing computer users.We call this approach EVABCD (Evolving Agent behaviorClassification based on Distributions of relevant events) andit is based on representing the observed behavior of an agent(computer user) as an adaptive distribution of her/his relevantatomic behaviors (events). Once the model has been created,EVABCD presents an evolving method for updating andevolving the user profiles and classifying an observed user.The approach we present is generalizable to all kinds of userbehaviors represented by a sequence of events.
The UNIX operating system environment is used in thisresearch for explaining and evaluating EVABCD. A userbehavior is represented in this case by a sequence of UNIXcommands typed by a computer user in a command-lineinterface. Previous research studies in this environment [3],[4] focus on detecting masquerades (individuals who imper-sonate other users on computer networks and systems) fromsequences of UNIX commands. However, EVABCD createsevolving user profiles and classifies new users into one of thepreviously created profiles. Thus, the goal of EVABCD in theUNIX environment can be divided into two phases:
1) Creating and updating user profiles from the commandsthe users typed in a UNIX shell.
2) Classifying a new sequence of commands into the prede-fined profiles.
Because we use an evolving classifier, it is constantlylearning and adapting the existing classifier structure to ac-commodate the newly observed emerging behaviors. Once auser is classified, relevant actions can be done, however thistask is not addressed in this paper.
The creation of a user profile from a sequence of UNIX
IEEE TRANSACTIONS ON KNOWLEDGE AND DATA ENGINEERING , VOL., NO., JUNE 2010 2
commands should consider the consecutive order of thecommands typed by the user and the influence of his/herpast experiences. This aspect motivates the idea of automatedsequence learning for computer user behavior classification;if we do not know the features that influence the behaviorof a user, we can consider a sequence of past actionsto incorporate some of the historical context of the user.However, it is difficult, or in general, impossible, to builda classifier that will have a full description of all possiblebehaviors of the user, because these behaviors evolve withtime, they are not static and new patterns may emerge as wellas an old habit may be forgotten or stopped to be used. Thedescriptions of a particular behavior itself may also evolve,so we assume that each behavior is described by one or morefuzzy rules. A conventional system do not capture the newpatterns (behaviors) that could appear in the data stream oncethe classifier is built. In addition, the information producedby a user is often quite large. Therefore, we need to copewith large amounts of data and process this information inreal time, because storing the complete data set and analyzingit in an off-line (batch) mode, would be impractical. Inorder to take into account these aspects, we use an evolvingfuzzy-rule-based system that allows for the user behaviors tobe dynamic, to evolve.
This paper is organized as follows: Section 2 provides anoverview of the background and related work. The overallstructure of our approach, EVABCD, is explained in section3. Section 4 describes the construction of the user behaviorprofile. The evolving UNIX user classifier is detailed inSection 5. Section 6 describes the experimental setting andthe experimental results obtained. Finally, Section 7 containsfuture work and concluding remarks.
2 BACKGROUND AND RELATED WORK
Different techniques have been used to find out relevantinformation related to the human behavior in many differentareas. The literature in this field is vast; Macedo et al. [5]propose a system (WebMemex) that provides recommendedinformation based on the captured history of navigation froma list of known users. Pepyne et al. [6] describe a method usingqueuing theory and logistic regression modeling methods forprofiling computer users based on simple temporal aspects oftheir behavior. In this case, the goal is to create profiles forvery specialized groups of users, who would be expected to usetheir computers in a very similar way. Gody and Amandi [7]present a technique to generate readable user profiles thataccurately capture interests by observing their behavior on theWeb.
There is a lot of work focusing on user profiling in aspecific environment, but it is not clear that they can betransferred to other environments. However, the approachwe propose in this paper can be used in any domain inwhich a user behavior can be represented as a sequenceof actions or events. Because sequences play a crucial rolein human skill learning and reasoning [8], the problemof user profile classification is examined as a problem of
sequence classification. According to this aspect, Hormanand Kaminka [9] present a learner with unlabeled sequentialdata that discovers meaningful patterns of sequential behaviorfrom example streams. Popular approaches to such learninginclude statistical analysis and frequency based methods.Lane and Brodley [10] present an approach based on thebasis of instance-based learning (IBL) techniques, and severaltechniques for reducing data storage requirements of the userprofile.
Although the proposed approach can be applied to anybehavior represented by a sequence of events, we focus onthis research in a command-line interface environment. Relatedto this environment, Schonlau et al. [3] investigate a numberof statistical approaches for detecting masqueraders. Coullet al. [11] propose an effective algorithm that uses pair-wise sequence alignment to characterize similarity betweensequences of commands. Recently, Angelov and Zhou proposein [12] to use evolving fuzzy classifiers for this detection task.
In [13], Panda et al. compared the performance of differentclassification algorithms - Naive Bayesian (NB), C4.5 andIterative Dichotomizer 3 (ID3) - for network intrusiondetection. According to the authors, ID3 and C4.5 arerobust in detecting new intrusions, but NB performs betterthan all in terms of classification accuracy. Cufoglu etal. [14] evaluated the classification accuracy of NB, IB1,SimpleCART, NBTree, ID3, J48 and SMO algorithms withlarge user profile data. According to the simulation results,NBTree classifier performs best on user related information.
It should be emphasized that all of the above approachesignore the fact that user behaviors can change and evolve.However, this aspect needs to be taken into account in theproposed approach. In addition, owing to the characteristicsof the proposed environment, we need to extract some sortof knowledge from a continuous stream of data. Thus, itis necessary that the approach deals with the problem ofclassification of streaming data. Incremental algorithms buildand refine the model at different points in time, in contrastto the traditional algorithms which train the model in a batchmanner. It is more efficient to revise an existing hypothesisthan it is to generate hypothesis each time a new instanceis observed. Therefore, one possible solution to the proposedscenario is to use an incremental classifiers.
An incremental learning algorithm can be defined as onethat meets the following criteria [15]:
1) It should be able to learn additional information from newdata.
2) It should not require access to the original data, used totrain the existing classifier.
3) It should preserve previously acquired knowledge.4) It should be able to accommodate new classes that may
be introduced with new data.
Several incremental classifiers have been implemented usingdifferent frameworks:
• Decision trees. The problem of processing streamingdata in on-line has motivated the development of many

IEEE TRANSACTIONS ON KNOWLEDGE AND DATA ENGINEERING , VOL., NO., JUNE 2010 3
algorithms which were designed to learn decision trees in-crementally [16], [17]. Some examples of the algorithmswhich construct incremental decision trees are: ID4 [18],ID5 [19] and ID5R [20].
• Artificial Neural Networks (ANN). Adaptive ResonanceTheory (ART) networks [21] are unsupervised ANNsproposed by Carpenter that dynamically determine thenumber of clusters based on a vigilance parameter [22]. Inaddition, Kasabov proposed another incremental learningneural network architecture, called Evolving Fuzzy Neu-ral Network (EFuNN) [23]. This architecture does notrequire access to previously seen data and can accommo-date new classes. A new approach to incremental learningusing evolving neural networks is proposed by Seiponeet al [24]. This approach uses an evolutionary algorithmto evolve some MLP parameters. This process aims atdetermining the parameters to produce networks withbetter incremental abilities. However, it performs thisparameter optimization task off-line, based on separatetesting and validating data sets.
• Prototype-based supervised algorithms. Learning VectorQuantization (LVQ) is one of the well-known nearest pro-totype learning algorithms [25]. LVQ can be consideredto be a supervised clustering algorithm, in which eachweight vector can be interpreted as a cluster center. Usingthis algorithm, the number of reference vectors has to beset by the user. For this reason, Poirier et al. proposeda method to generate new prototypes dynamically. Thisincremental LVQ is known as DVQ (Dynamic VectorQuantization) [26]. However, this method lacks the gen-eralization capability, resulting in the generation of manyprototype neurons for applications with noisy data.
• Bayesian. Bayesian classifier is an effective methodologyfor solving classification problems when all features areconsidered simultaneously. However, when the featuresare added one by one in Bayesian classifier in batchmode in forward selection method huge computation isinvolved. For this reason, Agrawal et al. [27] proposedan incremental Bayesian classifier for multivariate nor-mal distribution datasets. Several incremental versions ofBayesian classifiers are proposed in [28]. They work wellwith data which have normal distributions or close tonormal ones.
• SVM. A Support Vector Machine (SVM) performsclassification by constructing a N-dimensional hyperplanethat optimally separates the data into two categories.Training an SVM “incrementally” on new data bydiscarding all previous data except their support vectors,gives only approximate results. Cauwenberghs et al. [29]consider incremental learning as an exact on-line methodto construct the solution recursively, one point at a time.In addition, Xiao et al. [30] propose an incrementalalgorithm which utilizes the properties of SV set, andaccumulates the distribution knowledge of the samplespace through some adjustable parameters. However,this provides an approximation of the optimal separationonly and works well for normally distributed data.
However, as this research focus on a command-lineinterface environment, it is necessary the approach to be ableto process streaming data in real-time and also cope with hugeamounts of data efficiently. Several incremental classifiers donot considered this last aspect. In addition, the structure of theincremental classifiers is usually not transparent/interpretableand is assumed to be fixed, and they can not address theproblem of so called concept drift and shift [31]. By driftthey refer to a modification of the concept over time, and shiftusually refers to sudden and abrupt changes in the streamingdata. To capture these changes, it is necessary not only totune parameters of the classifiers, but also to change theirstructure. A simple incremental algorithm does not evolvethe structure of the classifier. The interpretation of the resultsis also an important characteristic in a classifier, and severalincremental classifiers (such as ANN or SVM) are not goodin terms of interpretation of the results. They are very mucha “black box” type of approach which performs “numberfitting”. Finally, the computational efficiency of the proposedclassifier is very important, and some incremental algorithms(such SVM) have to solve quadratic optimization problemsmany times.
Taking all these aspects into account, we propose in thispaper an evolving fuzzy-rule-base system which satisfies allof the criteria of the incremental classifiers. However, theapproach has also important advantages which make it veryuseful in real environments:
1) It can cope with huge amounts of data very efficientlyand its complexity is linear;
2) Its evolving structure can capture sudden and abruptchanges in the stream of data efficiently;
3) Its structure meaning is very clear, as it is a rule-basedclassifier;
4) It is non-iterative and single pass; therefore, it is compu-tationally very efficient and fast;
5) Its structure is simple and interpretable (human-intelligible).
Thus, we present an approach for creating and recognizingautomatically the behavior profile of a computer user with thetime evolving structure in a very efficient way. To the best ofour knowledge, this is the first publication where user behavioris considered, treated and modeled as a dynamic and evolvingphenomenon. This is the most important contribution of thispaper.
3 THE PROPOSED APPROACH
This section introduces the proposed approach for automaticclustering, classifier design and classification of the behaviorprofiles of users. The novel evolving user behavior classifier isbased on Evolving Fuzzy Systems and it takes into account thefact that the behavior of any user is not fixed, but is ratherchanging. Although the proposed approach can be appliedto any behavior represented by a sequence of events, wedetail it using a command-line interface (UNIX commands)environment.

IEEE TRANSACTIONS ON KNOWLEDGE AND DATA ENGINEERING , VOL., NO., JUNE 2010 4
In order to classify an observed behavior, our approach, asmany other agent modeling methods [32], creates a librarywhich contains the different expected behaviors. However, inour case this library is not a pre-fixed one, but is evolving,learning from the observations of the users real behaviorsand, moreover, it starts to be filled in ’from scratch’ byassigning temporarily to the library the first observed useras a prototype. The library, called Evolving-Profile-Library(EPLib), is continuously changing, evolving influenced by thechanging user behaviors observed in the environment.
Thus, the proposed approach includes at each step thefollowing two main actions:
1) Creating and Evolving the classifier: This action in-volves in itself two sub-actions:
a) Creating the user behavior profiles. This sub-actionanalyzes the sequences of commands typed by differentUNIX users on-line (data stream), and creates the cor-responding profiles. This process is detailed in Section4.
b) Evolving the Classifier. This sub-action includes on-line learning and update of the classifier, including thepotential of each behavior to be a prototype, stored inthe EPLib. The whole process is explained in Section5.
2) User Classification: The user profiles created in theprevious action are associated with one of the prototypesfrom the EPLib, and they are classified into one of theclasses formed by the prototypes. This action is alsodetailed in Section 5.
4 CONSTRUCTION OF THE USER BEHAVIORPROFILE
In order to construct a user behavior profile in on-line modefrom a data stream, we need to extract an ordered sequenceof recognized events; in this case, UNIX commands. Thesecommands are inherently sequential, and this sequentiality isconsidered in the modeling process. According to this aspectand based on the work done in [2], in order to get themost representative set of subsequences from a sequence, wepropose the use of a trie data structure [33]. This structure wasalso used in [34] to classify different sequences and in [35],[36] to classify the behavior patterns of a RoboCup soccersimulation team.
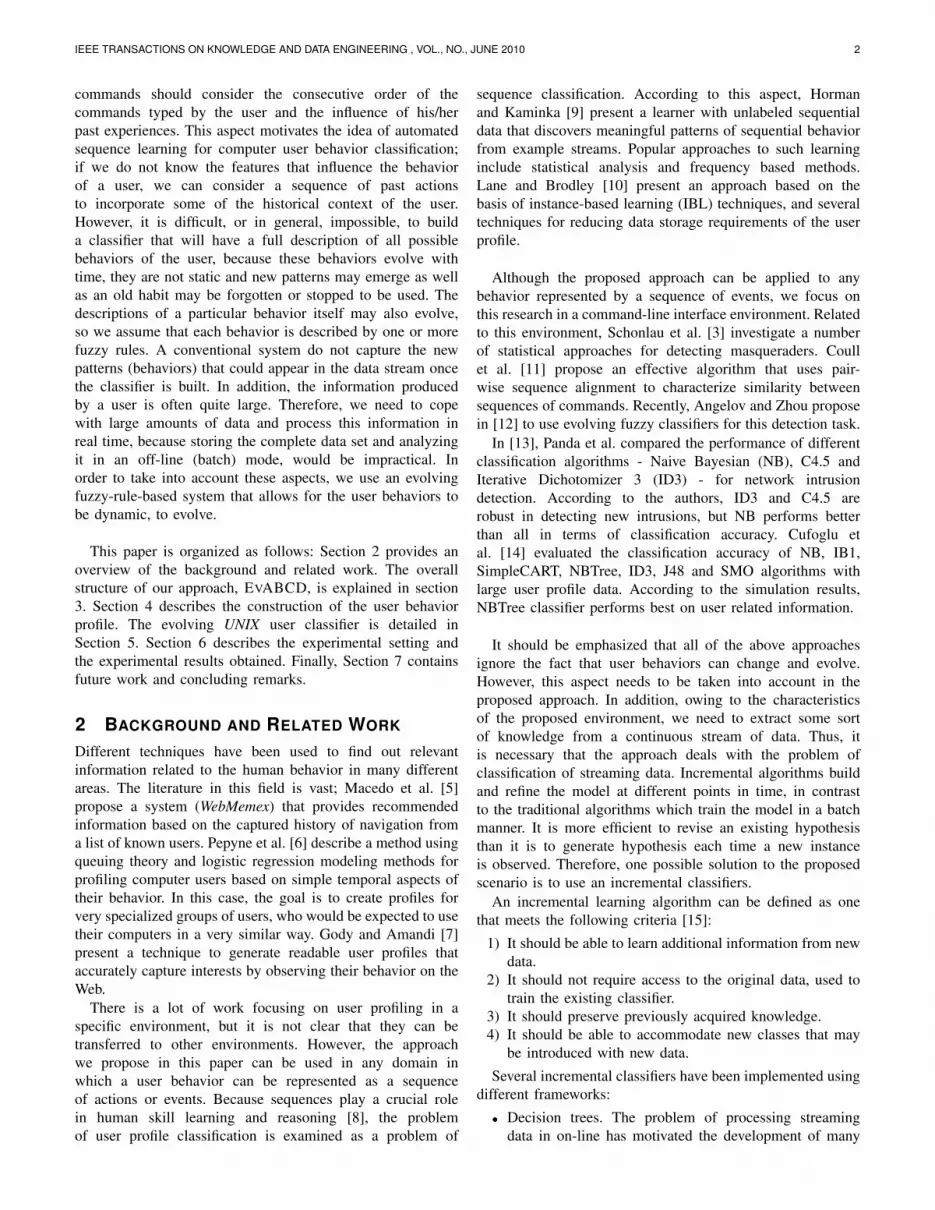
The construction of a user profile from a single sequenceof commands is done by a three step process:A. Segmentation of the sequence of commands.B. Storage of the subsequences in a trie.C. Creation of the user profile.
These steps are detailed in the following three subsections.For the sake of simplicity, let us consider the followingsequence of commands as an example: {ls → date → ls →date → cat}.
4.1 A. Segmentation of the sequence of commandsFirst, the sequence is segmented into subsequences of equallength from the first to the last element. Thus, the sequence
A=A1A2...An (where n is the number of commands of thesequence) will be segmented in the subsequences described byAi...Ai+length ∀ i,i=[1,n-length+1], where length is the size ofthe subsequences created. In the remainder of the paper, wewill use the term subsequence length to denote the value ofthis length. This value determines how many commands areconsidered as dependent.
In the proposed sample sequence ({ ls→ date→ ls→ date→ cat}), let 3 be the subsequence length, then we obtain:{ls→ date→ ls}, {date→ ls→ date}, {ls→ date→ cat}
4.2 B. Storage of the subsequences in a trie
The subsequences of commands are stored in a trie data-structure. When a new model needs to be constructed, wecreate an empty trie, and insert each sub-sequence of eventsinto it, such that all possible subsequences are accessibleand explicitly represented. Every trie-node represents an eventappearing at the end of a sub-sequence, and the nodes chil-dren represent the events that have appeared following thisevent. Also, each node keeps track of the number of times acommand has been recorded into it. When a new subsequenceis inserted into a trie, the existing nodes are modified and/ornew nodes are created. As the dependencies of the commandsare relevant in the user profile, the subsequence suffixes(subsequences that extend to the end of the given sequence)are also inserted.
Considering the previous example, the first subsequence ({ls→ date → ls}) is added as the first branch of the empty trie(Figure 1 a). Each node is labeled with the number 1 whichindicates that the command has been inserted in the node once(in Figure 1, this number is enclosed in square brackets). Then,the suffixes of the subsequence ({date → ls} and {ls}) arealso inserted (Figure 1 b). Finally, after inserting the threesubsequences and its corresponding suffixes, the completedtrie is obtained (Figure 1 c).
4.3 C. Creation of the user profile
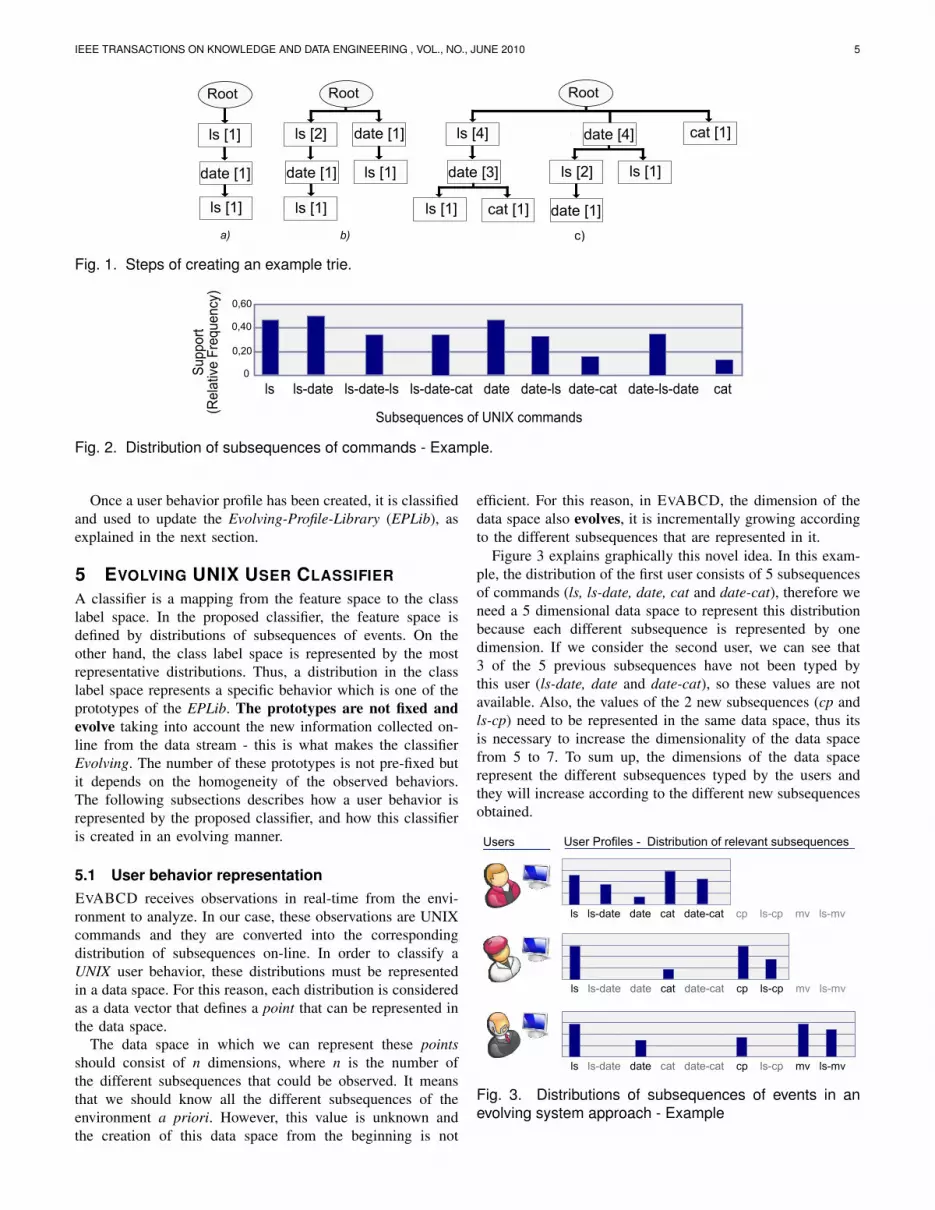
Once the trie is created, the subsequences that characterizethe user profile and its relevance are calculated by traversingthe trie. For this purpose, frequency-based methods areused. In particular, in EVABCD, to evaluate the relevanceof a subsequence, its relative frequency or support [37] iscalculated. In this case, the support of a subsequence is definedas the ratio of the number of times the subsequence has beeninserted into the trie and the total number of subsequences ofequal size inserted.
In this step, the trie can be transformed into a set ofsubsequences labeled by its support value. In EVABCD thisset of subsequences is represented as a distribution of relevantsubsequences. Thus, we assume that user profiles are n-dimensional matrices, where each dimension of the matrix willrepresent a particular subsequence of commands.
In the previous example, the trie consists of nine nodes;therefore, the corresponding profile consists of nine differentsubsequences which are labeled with its support. Figure 2shows the distribution of these subsequences.
IEEE TRANSACTIONS ON KNOWLEDGE AND DATA ENGINEERING , VOL., NO., JUNE 2010 5
Fig. 1. Steps of creating an example trie.
Fig. 2. Distribution of subsequences of commands - Example.
Once a user behavior profile has been created, it is classifiedand used to update the Evolving-Profile-Library (EPLib), asexplained in the next section.
5 EVOLVING UNIX USER CLASSIFIERA classifier is a mapping from the feature space to the classlabel space. In the proposed classifier, the feature space isdefined by distributions of subsequences of events. On theother hand, the class label space is represented by the mostrepresentative distributions. Thus, a distribution in the classlabel space represents a specific behavior which is one of theprototypes of the EPLib. The prototypes are not fixed andevolve taking into account the new information collected on-line from the data stream - this is what makes the classifierEvolving. The number of these prototypes is not pre-fixed butit depends on the homogeneity of the observed behaviors.The following subsections describes how a user behavior isrepresented by the proposed classifier, and how this classifieris created in an evolving manner.
5.1 User behavior representationEVABCD receives observations in real-time from the envi-ronment to analyze. In our case, these observations are UNIXcommands and they are converted into the correspondingdistribution of subsequences on-line. In order to classify aUNIX user behavior, these distributions must be representedin a data space. For this reason, each distribution is consideredas a data vector that defines a point that can be represented inthe data space.
The data space in which we can represent these pointsshould consist of n dimensions, where n is the number ofthe different subsequences that could be observed. It meansthat we should know all the different subsequences of theenvironment a priori. However, this value is unknown andthe creation of this data space from the beginning is not
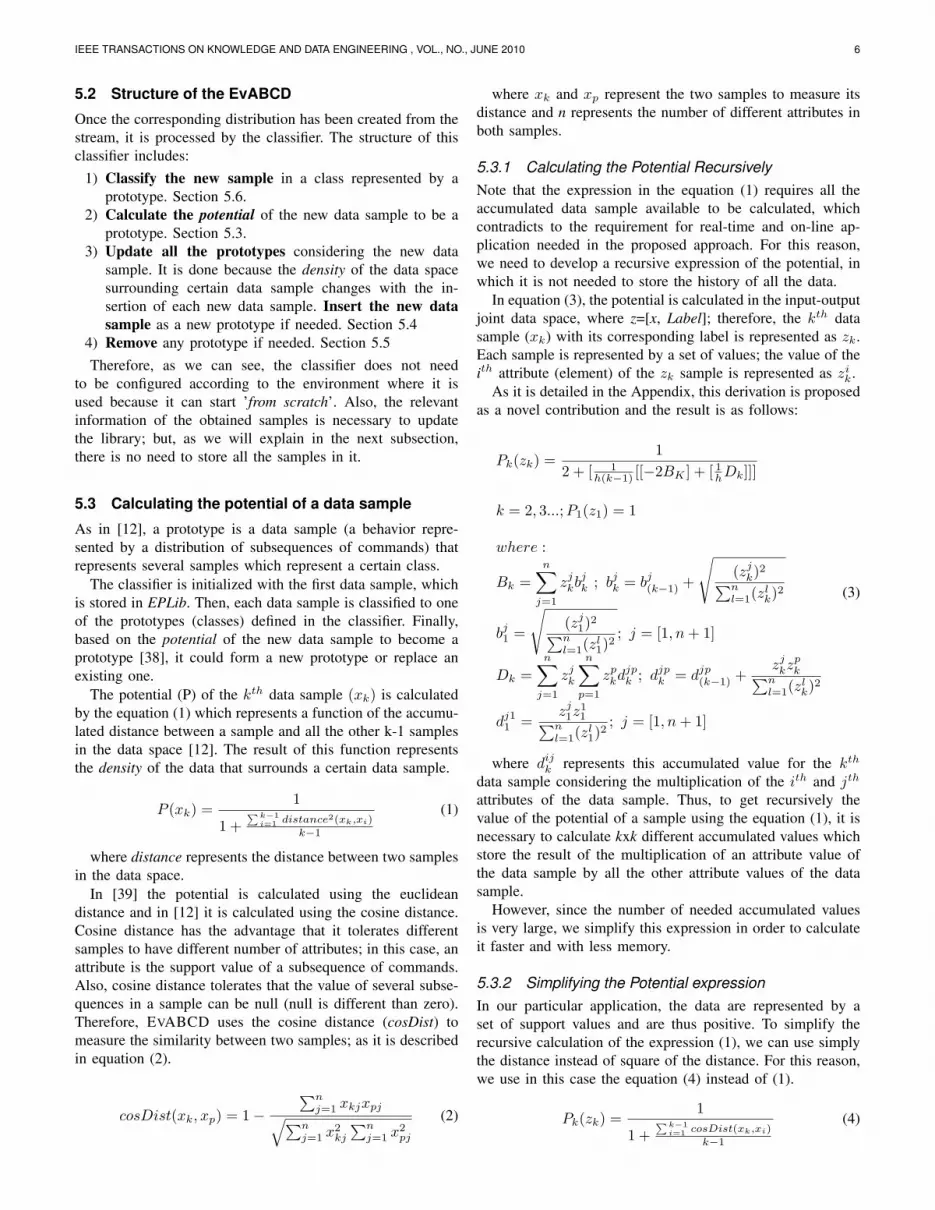
efficient. For this reason, in EVABCD, the dimension of thedata space also evolves, it is incrementally growing accordingto the different subsequences that are represented in it.
Figure 3 explains graphically this novel idea. In this exam-ple, the distribution of the first user consists of 5 subsequencesof commands (ls, ls-date, date, cat and date-cat), therefore weneed a 5 dimensional data space to represent this distributionbecause each different subsequence is represented by onedimension. If we consider the second user, we can see that3 of the 5 previous subsequences have not been typed bythis user (ls-date, date and date-cat), so these values are notavailable. Also, the values of the 2 new subsequences (cp andls-cp) need to be represented in the same data space, thus itsis necessary to increase the dimensionality of the data spacefrom 5 to 7. To sum up, the dimensions of the data spacerepresent the different subsequences typed by the users andthey will increase according to the different new subsequencesobtained.
Fig. 3. Distributions of subsequences of events in anevolving system approach - Example
IEEE TRANSACTIONS ON KNOWLEDGE AND DATA ENGINEERING , VOL., NO., JUNE 2010 6
5.2 Structure of the EvABCD
Once the corresponding distribution has been created from thestream, it is processed by the classifier. The structure of thisclassifier includes:
1) Classify the new sample in a class represented by aprototype. Section 5.6.
2) Calculate the potential of the new data sample to be aprototype. Section 5.3.
3) Update all the prototypes considering the new datasample. It is done because the density of the data spacesurrounding certain data sample changes with the in-sertion of each new data sample. Insert the new datasample as a new prototype if needed. Section 5.4
4) Remove any prototype if needed. Section 5.5Therefore, as we can see, the classifier does not need
to be configured according to the environment where it isused because it can start ’from scratch’. Also, the relevantinformation of the obtained samples is necessary to updatethe library; but, as we will explain in the next subsection,there is no need to store all the samples in it.
5.3 Calculating the potential of a data sample
As in [12], a prototype is a data sample (a behavior repre-sented by a distribution of subsequences of commands) thatrepresents several samples which represent a certain class.
The classifier is initialized with the first data sample, whichis stored in EPLib. Then, each data sample is classified to oneof the prototypes (classes) defined in the classifier. Finally,based on the potential of the new data sample to become aprototype [38], it could form a new prototype or replace anexisting one.
The potential (P) of the kth data sample (xk) is calculatedby the equation (1) which represents a function of the accumu-lated distance between a sample and all the other k-1 samplesin the data space [12]. The result of this function representsthe density of the data that surrounds a certain data sample.
P (xk) =1
1 +∑k−1i=1 distance2(xk,xi)
k−1
(1)
where distance represents the distance between two samplesin the data space.
In [39] the potential is calculated using the euclideandistance and in [12] it is calculated using the cosine distance.Cosine distance has the advantage that it tolerates differentsamples to have different number of attributes; in this case, anattribute is the support value of a subsequence of commands.Also, cosine distance tolerates that the value of several subse-quences in a sample can be null (null is different than zero).Therefore, EVABCD uses the cosine distance (cosDist) tomeasure the similarity between two samples; as it is describedin equation (2).
cosDist(xk, xp) = 1−∑n
j=1 xkjxpj√∑nj=1 x
2kj
∑nj=1 x
2pj
(2)
where xk and xp represent the two samples to measure itsdistance and n represents the number of different attributes inboth samples.
5.3.1 Calculating the Potential RecursivelyNote that the expression in the equation (1) requires all theaccumulated data sample available to be calculated, whichcontradicts to the requirement for real-time and on-line ap-plication needed in the proposed approach. For this reason,we need to develop a recursive expression of the potential, inwhich it is not needed to store the history of all the data.
In equation (3), the potential is calculated in the input-outputjoint data space, where z=[x, Label]; therefore, the kth datasample (xk) with its corresponding label is represented as zk.Each sample is represented by a set of values; the value of theith attribute (element) of the zk sample is represented as zi
k.As it is detailed in the Appendix, this derivation is proposed
as a novel contribution and the result is as follows:
Pk(zk) =1
2 + [ 1h(k−1) [[−2BK ] + [ 1
hDk]]]
k = 2, 3...;P1(z1) = 1
where :
Bk =n∑
j=1
zjkb
jk ; bjk = bj(k−1) +
√(zj
k)2∑nl=1(z
lk)2
bj1 =
√(zj
1)2∑nl=1(z
l1)2
; j = [1, n+ 1]
Dk =n∑
j=1
zjk
n∑p=1
zpkd
jpk ; djp
k = djp(k−1) +
zjkz
pk∑n
l=1(zlk)2
dj11 =
zj1z
11∑n
l=1(zl1)2
; j = [1, n+ 1]
(3)
where dijk represents this accumulated value for the kth
data sample considering the multiplication of the ith and jth
attributes of the data sample. Thus, to get recursively thevalue of the potential of a sample using the equation (1), it isnecessary to calculate kxk different accumulated values whichstore the result of the multiplication of an attribute value ofthe data sample by all the other attribute values of the datasample.
However, since the number of needed accumulated valuesis very large, we simplify this expression in order to calculateit faster and with less memory.
5.3.2 Simplifying the Potential expressionIn our particular application, the data are represented by aset of support values and are thus positive. To simplify therecursive calculation of the expression (1), we can use simplythe distance instead of square of the distance. For this reason,we use in this case the equation (4) instead of (1).
Pk(zk) =1
1 +∑k−1i=1 cosDist(xk,xi)
k−1
(4)

IEEE TRANSACTIONS ON KNOWLEDGE AND DATA ENGINEERING , VOL., NO., JUNE 2010 7
Using the equation (4), we develop a recursive expressionsimilar to the recursive expressions developed in [38], [39]using euclidean distance and in [12] using cosine distance.This formula is as follows:
Pk(zk) =1
2− 1k−1
1√∑nj=1(z
jk)
2Bk
; k = 2, 3, ...;P1(z1) = 1
where :
Bk =n∑
j=1
zjkb
jk ; bjk = bj(k−1) +
√(zj
k)2∑nl=1(z
lk)2
bj1 =
√(zj
1)2∑nl=1(z
l1)2
; j = [1, n+ 1]
(5)Using this expression, it is only necessary to calculate (n+1)
values where n is the number of different obtained subse-quences; this value is represented by b, where bjk, j = [1, n]represents the accumulated value for the kth data sample.
5.4 Creating new prototypesThe proposed evolving user behavior classifier, EVABCD,can start ’from scratch’ (without prototypes in the library)in a similar manner as eClass evolving fuzzy rule-basedclassifier proposed in [39], used in [40] for robotics and furtherdeveloped in [12]. The potential of each new data sample iscalculated recursively and the potential of the other prototypesis updated. Then, the potential of the new sample (zk) iscompared with the potential of the existing prototypes. A newprototype is created if its value is higher than any other existingprototype, as shown in equation (6).
∃i, i = [1, NumPrototypes] : P (zk) > P (Proti) (6)
Thus, if the new data sample is not relevant, the overallstructure of the classifier is not changed. Otherwise, if thenew data sample has high descriptive power and generalizationpotential, the classifier evolves by adding a new prototypewhich represents a part of the observed data samples.
5.5 Removing existing prototypesAfter adding a new prototype, we check whether any ofthe already existing prototypes are described well by thenewly added prototype [12]. By well we mean that the valueof the membership function that describes the closeness tothe prototype is a Gaussian bell function chosen due to itsgeneralization capabilities:
∃i, i = [1, NumPrototypes] : µi(zk) > e−1 (7)
For this reason, we calculate the membership functionbetween a data sample and a prototype which is defined as:
µi(zk) = e− 1
2 [cosDist(zk,Proti)
σi], i = [1, NumPrototypes]
(8)where cosDist(zk, P roti) represents the cosine distance
between a data sample (zk) and the ith prototype (Proti); σi
represents the spread of the membership function, which alsosymbolizes the radius of the zone of influence of the prototype.This spread is determined based on the scatter [41], [42] ofthe data. The equation to get the spread of the kth data sampleis defined as:
σi(k) =
√√√√1k
k∑j=1
cosDist(Proti, zk) ; σi(0) = 1 (9)
where k is the number of data samples inserted in the dataspace; cosDist(Proti, zk) is the cosine distance between thenew data sample (zk) and the ith prototype.
However, to calculate the scatter without storing all thereceived samples, this value can be updated recursively (asshown in [39]) by:
σi(k) =
=
√[σi(k − 1)]2 +
1k
[cosDist2(Proti, zk)− [σi(k − 1)]2](10)
5.6 Classification Method
In order to classify a new data sample, we compare it withall the prototypes stored in EPLib. This comparison is doneusing cosine distance and the smallest distance determines theclosest similarity. This comparison is shown in equation (11).
Class(xz) = Class(Prot∗);
Prot∗ = MINNumProti=1 (cosDist(xPrototypei , xz))
(11)
The time-consumed for classifying a new sample dependson the number of prototypes and its number of attributes.However, we can consider, in general terms, that both the time-consumed and the computational complexity are reduced andacceptable for real-time applications (in order of millisecondsper data sample).
5.7 Supervised and unsupervised learning
The proposed classifier has been explained taking into accountthat the observed data samples do not have labels; thus, usingunsupervised learning. In this case, the classes are createdbased on the existing prototypes and, thus, any prototyperepresents a different class (label). Such a technique is usedfor example in eClass0 [12], [39] which is a clustering-basedclassification.
However, the observed data samples can have a labelassigned to them a priori. In this case, using EVABCD, aspecific class is represented by several prototypes, becausethe previous process is done for each different class. Thus,each class has a number of prototypes that depends on howheterogeneous are the samples of the same class. In this case,a new data sample is classified in the class which belongsthe closest prototype. This technique is used for example ineClass1 [12], [39].
IEEE TRANSACTIONS ON KNOWLEDGE AND DATA ENGINEERING , VOL., NO., JUNE 2010 8
6 EXPERIMENTAL SETUP AND RESULTS
In order to evaluate EVABCD in the UNIX environment,we use a data set with the UNIX commands typed by 168real users and labeled in four different groups. Therefore, inthese experiments, we use supervised learning. The explainedprocess is applied for each of the four group (classes) and oneor more prototypes will be created for each group. EVABCDis applied in these experiments considering the data set aspseudo-on-line streams. However, only using data sets in anoff-line mode, the proposed classifier can be compared withother incremental and non-incremental classifiers.
6.1 Data Set
In these experiments, we use the command-line data collectedby Greenberg [43] using UNIX csh command interpreter. Thisdata are identified in four target groups which represent a totalof 168 male and female users with a wide cross-section ofcomputer experience and needs. Salient features of each groupare described below:
• Novice Programmers: The users of this group had little orno previous exposure to programming, operating systems,or UNIX-like command-based interfaces. These usersspent most of their time learning how to program anduse the basic system facilities.
• Experienced Programmers: These group members weresenior Computer Science undergraduates, expected tohave a fair knowledge of the UNIX environment. Theseusers used the system for coding, word processing, em-ploying more advanced UNIX facilities to fulfill courserequirements, and social and exploratory purposes.
• Computer Scientist: This group, graduates and re-searchers from the Department of Computer Science,had varying experience with UNIX, although all wereexperts with computers. Tasks performed were less pre-dictable and more varied than other groups, researchinvestigations, social communication, word-processing,maintaining databases, and so on.
• Non-programmers: Word-processing and documentpreparation was the dominant activity of the members ofthis group, made up of office staff and members of theFaculty of Environmental Design. Knowledge of UNIXwas the minimum necessary to get the job done.
The sample sizes (the number of people observed) and thetotal number of command lines are indicated in Table 1.
TABLE 1Sample group sizes and command lines recorded.
Group of users name Sample size Total numberof command lines
Novice Programmers 55 77.423Exper. Programmers 36 74.906Computer Scientists 52 125.691Non-Programmers 25 25.608Total 168 303.628
6.2 Comparison with other classifiers
In order to evaluate the performance of EVABCD, it iscompared with several different types of classifiers. This ex-periment focuses on using the well established batch classifiersdescribed as follows:
• The C5.0 algorithm [44] is a commercial version of theC4.5 [45] decision-tree based classifier.
• The Naive Bayes classifier (NB) is a simple probabilisticclassifier based on applying Bayes theorem with strong(naive) independence assumptions [46]. In this case, thenumeric estimator precision values are chosen based onthe analysis of the training data. For this reason, theclassifier is no-incremental [47].
• The K Nearest Neighbor classifier (kNN) is an instance-based learning technique for classifying objects basedon closest training examples in the feature space [48].The parameter k affects the performance of the kNNclassifier significantly. In these experiments, the valuewith which better results are obtained is k=1; thus asample is assigned to the class of its nearest neighbor.However, using this value, the corresponding classifiermay not be robust enough to the noise in the data sample.This classifier also does not have a clear structure.
• The AdaBoost (adaptive boosting) classifier [49] com-bines multiple weak learners in order to form an efficientand strong classifier. Each weak classifier uses a differentdistribution of training samples. Combining weak clas-sifiers take advantage of the so-called instability of theweak classifier. This instability causes the classifier toconstruct sufficiently different decision surfaces for minormodifications in their training datasets. In these experi-ments, we use a decision stump as a weak learner. Adecision stump is advantageous over other weak learnersbecause it can be calculated very quickly. In addition,there is a one-to-one correspondence between a weaklearner and a feature when a decision stump is used [50].
• The Support Vector Machine classifier (SVM) relieson the statistical learning theory. In this case, the algo-rithm SMO (Sequential Minimal Optimization) is usedfor training support vector machines by breaking a largequadratic programming (QP) optimization problem into aseries of smallest possible QP problems [51]. In addition,in order to determine the best kernel type for this task,we have performed several experiments using polynomialkernel function with various degrees and radial basisfunction. In this case, the polynomial kernel functionresults performed best in all experiments. Therefore, weuse polynomial kernel function of degree 1 for proposedexperiments.
• The Learning Vector Quantization classifier (LVQ) is asupervised version of vector quantization, which definesclass boundaries based on prototypes, a nearest-neighborrule and a winner-takes-all paradigm. The performanceof LVQ depends on the algorithm implementation. Inthese experiments, the enhanced version of LVQ1, theOLVQ1 implementation is used [52].

IEEE TRANSACTIONS ON KNOWLEDGE AND DATA ENGINEERING , VOL., NO., JUNE 2010 9
In addition, we compare EVABCD with two incrementalclassifiers which share a common theoretical basis with batchclassifiers. However, they can be incrementally updated as newtraining instances arrive; they do not have to process all thedata in one batch. Therefore, most of the incremental learningalgorithms can process data files that are too large to fit inmemory. The incremental classifiers used in these experimentsare detailed as follows:• Incremental Naive Bayes. This classifier uses a default
precision of 0.1 for numeric attributes when it is createdwith zero training instances.
• Incremental kNN. The kNN classifier adopts aninstance-based approach whose conceptual simplicitymakes its adaptation to an incremental classifierstraightforward. There is an algorithm called incrementalkNN as the number of nearest neighbors k needs notbe known in advance and it is calculated incrementally.However, in this case, the difference between IncrementalkNN and non-incremental kNN is the way all the dataare processed. Unlike other incremental algorithms,kNN stores entire dataset internally. In this case, theparameter k with which better results are obtained is k=1.
In these experiments, the classifiers were trained using afeature vector for each of the 168 users. This vector consistsof the support value of all the different subsequences of com-mands obtained for all the users; thus, there are subsequenceswhich do not have a value because the corresponding user hasnot typed those commands. In this case, in order to be ableto use this data for training the classifiers, we consider thisvalue as 0 (although its real value is null). In EVABCD weuse cosine distance which makes possible to take these valuesas ’null’.
6.3 Experimental DesignIn order to measure the performance of the proposed classifierusing the above data set, the well-established technique of 10-fold cross-validation is chosen. Thus, all the users (trainingset) are divided into 10 disjoint subsets with equal size. Eachof the 10 subsets is left out in turn for evaluation. It shouldbe emphasized that EVABCD does not need to work in thismode; this is done mainly in order to have comparable resultswith the established off-line techniques.
The number of UNIX commands typed by a user and usedfor creating his/her profile is very relevant in the classificationprocess. When EVABCD is carried out in the field, the behav-ior of a user is classified (and the evolving behavior libraryupdated) after s/he types a limited number of commands.In order to show the relevance of this value using the dataset already described, we consider different number of UNIXcommands for creating the classifier: 100, 500 and 1.000commands per user.
In the phase of behavior model creation, the length of thesubsequences in which the original sequence is segmented(used for creating the trie) is an important parameter: usinglong subsequences, the time consumed for creating the trieand the number of relevant subsequences of the corresponding
distribution increase drastically. In the experiments presentedin this paper, the subsequence length varies from 2 to 6.
Before showing the results, we should consider that thenumber of subsequences obtained using different streams ofdata is often very large. To get an idea of how this numberincreases, Table 2 shows the number of different subsequencesobtained using different number of commands for training(100, 500 and 1.000 commands per user) and subsequencelengths (3 and 5).
TABLE 2Total number of different subsequences obtained.
Number of Subsequence Number ofcommands per user Length different subsequences
100 3 11.4515 34.164
500 3 39.4285 134.133
1.000 3 63.3755 227.715
Using EVABCD, the number of prototypes per class is notfixed, it varies automatically depending on the heterogeneityof the data. To get an idea about it, Table 3 tabulates thenumber of prototypes created per group in each of the 10runs using 1.000 commands per user as training dataset and asubsequence length of 3.
TABLE 3EvABCD: Number of prototypes created per group using
10-fold cross-validation
Number of prototypes in each of the 10 runsGroup 1 2 3 4 5 6 7 8 9 10Novice Programmers 4 5 3 4 4 3 2 3 4 5Exp. Programmers 1 1 1 1 2 3 2 1 1 2Computer Scientists 1 1 1 1 1 1 2 2 2 2Non-Programmers 1 1 1 1 1 1 1 1 1 1
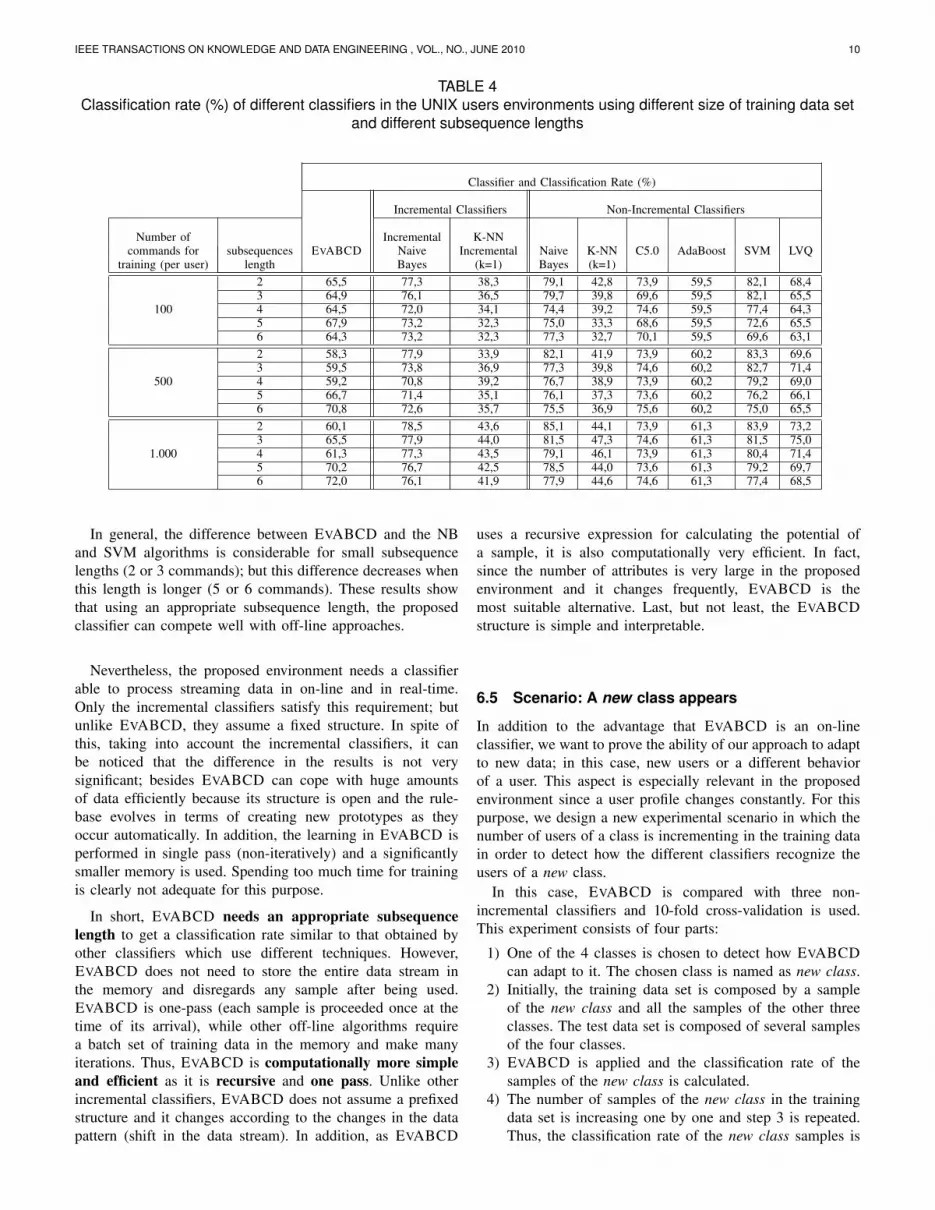
6.4 ResultsResults are listed in Table 4. Each major row corresponds toa training-set size (100, 500 and 1.000 commands) and eachsuch row is further sub-divided into experiments with differentsubsequence lengths for segmenting the initial sequence (from2 to 6 commands). The columns show the average classifica-tion rate using the proposed approach (EvABCD) and the other(incremental and non-incremental) classification algorithms.
According to this data, SVM and Non-Incremental NaiveBayes (NB) perform slightly better than the Incremental NBand C5.0 classifiers in terms of accuracy. The percentages ofusers correctly classified by EVABCD are higher than theresults obtained by LVQ and lower than the percentages ob-tained by NB, C5.0, and SVM. Both kNN classifiers performmuch worse than the others. Note that the changes in thesubsequence length do not modify the classification resultsobtained by AdaBoost. This is due to the fact that the classifiercreates the same classification rule (weak hypotheses) althoughthe subsequence length varies.
IEEE TRANSACTIONS ON KNOWLEDGE AND DATA ENGINEERING , VOL., NO., JUNE 2010 10
TABLE 4Classification rate (%) of different classifiers in the UNIX users environments using different size of training data set
and different subsequence lengths
Classifier and Classification Rate (%)
Incremental Classifiers Non-Incremental Classifiers
Number of Incremental K-NNcommands for subsequences EVABCD Naive Incremental Naive K-NN C5.0 AdaBoost SVM LVQ
training (per user) length Bayes (k=1) Bayes (k=1)2 65,5 77,3 38,3 79,1 42,8 73,9 59,5 82,1 68,43 64,9 76,1 36,5 79,7 39,8 69,6 59,5 82,1 65,5
100 4 64,5 72,0 34,1 74,4 39,2 74,6 59,5 77,4 64,35 67,9 73,2 32,3 75,0 33,3 68,6 59,5 72,6 65,56 64,3 73,2 32,3 77,3 32,7 70,1 59,5 69,6 63,12 58,3 77,9 33,9 82,1 41,9 73,9 60,2 83,3 69,63 59,5 73,8 36,9 77,3 39,8 74,6 60,2 82,7 71,4
500 4 59,2 70,8 39,2 76,7 38,9 73,9 60,2 79,2 69,05 66,7 71,4 35,1 76,1 37,3 73,6 60,2 76,2 66,16 70,8 72,6 35,7 75,5 36,9 75,6 60,2 75,0 65,52 60,1 78,5 43,6 85,1 44,1 73,9 61,3 83,9 73,23 65,5 77,9 44,0 81,5 47,3 74,6 61,3 81,5 75,0
1.000 4 61,3 77,3 43,5 79,1 46,1 73,9 61,3 80,4 71,45 70,2 76,7 42,5 78,5 44,0 73,6 61,3 79,2 69,76 72,0 76,1 41,9 77,9 44,6 74,6 61,3 77,4 68,5
In general, the difference between EVABCD and the NBand SVM algorithms is considerable for small subsequencelengths (2 or 3 commands); but this difference decreases whenthis length is longer (5 or 6 commands). These results showthat using an appropriate subsequence length, the proposedclassifier can compete well with off-line approaches.
Nevertheless, the proposed environment needs a classifierable to process streaming data in on-line and in real-time.Only the incremental classifiers satisfy this requirement; butunlike EVABCD, they assume a fixed structure. In spite ofthis, taking into account the incremental classifiers, it canbe noticed that the difference in the results is not verysignificant; besides EVABCD can cope with huge amountsof data efficiently because its structure is open and the rule-base evolves in terms of creating new prototypes as theyoccur automatically. In addition, the learning in EVABCD isperformed in single pass (non-iteratively) and a significantlysmaller memory is used. Spending too much time for trainingis clearly not adequate for this purpose.
In short, EVABCD needs an appropriate subsequencelength to get a classification rate similar to that obtained byother classifiers which use different techniques. However,EVABCD does not need to store the entire data stream inthe memory and disregards any sample after being used.EVABCD is one-pass (each sample is proceeded once at thetime of its arrival), while other off-line algorithms requirea batch set of training data in the memory and make manyiterations. Thus, EVABCD is computationally more simpleand efficient as it is recursive and one pass. Unlike otherincremental classifiers, EVABCD does not assume a prefixedstructure and it changes according to the changes in the datapattern (shift in the data stream). In addition, as EVABCD
uses a recursive expression for calculating the potential ofa sample, it is also computationally very efficient. In fact,since the number of attributes is very large in the proposedenvironment and it changes frequently, EVABCD is themost suitable alternative. Last, but not least, the EVABCDstructure is simple and interpretable.
6.5 Scenario: A new class appears
In addition to the advantage that EVABCD is an on-lineclassifier, we want to prove the ability of our approach to adaptto new data; in this case, new users or a different behaviorof a user. This aspect is especially relevant in the proposedenvironment since a user profile changes constantly. For thispurpose, we design a new experimental scenario in which thenumber of users of a class is incrementing in the training datain order to detect how the different classifiers recognize theusers of a new class.
In this case, EVABCD is compared with three non-incremental classifiers and 10-fold cross-validation is used.This experiment consists of four parts:
1) One of the 4 classes is chosen to detect how EVABCDcan adapt to it. The chosen class is named as new class.
2) Initially, the training data set is composed by a sampleof the new class and all the samples of the other threeclasses. The test data set is composed of several samplesof the four classes.
3) EVABCD is applied and the classification rate of thesamples of the new class is calculated.
4) The number of samples of the new class in the trainingdata set is increasing one by one and step 3 is repeated.Thus, the classification rate of the new class samples is
IEEE TRANSACTIONS ON KNOWLEDGE AND DATA ENGINEERING , VOL., NO., JUNE 2010 11
calculated in each increase.
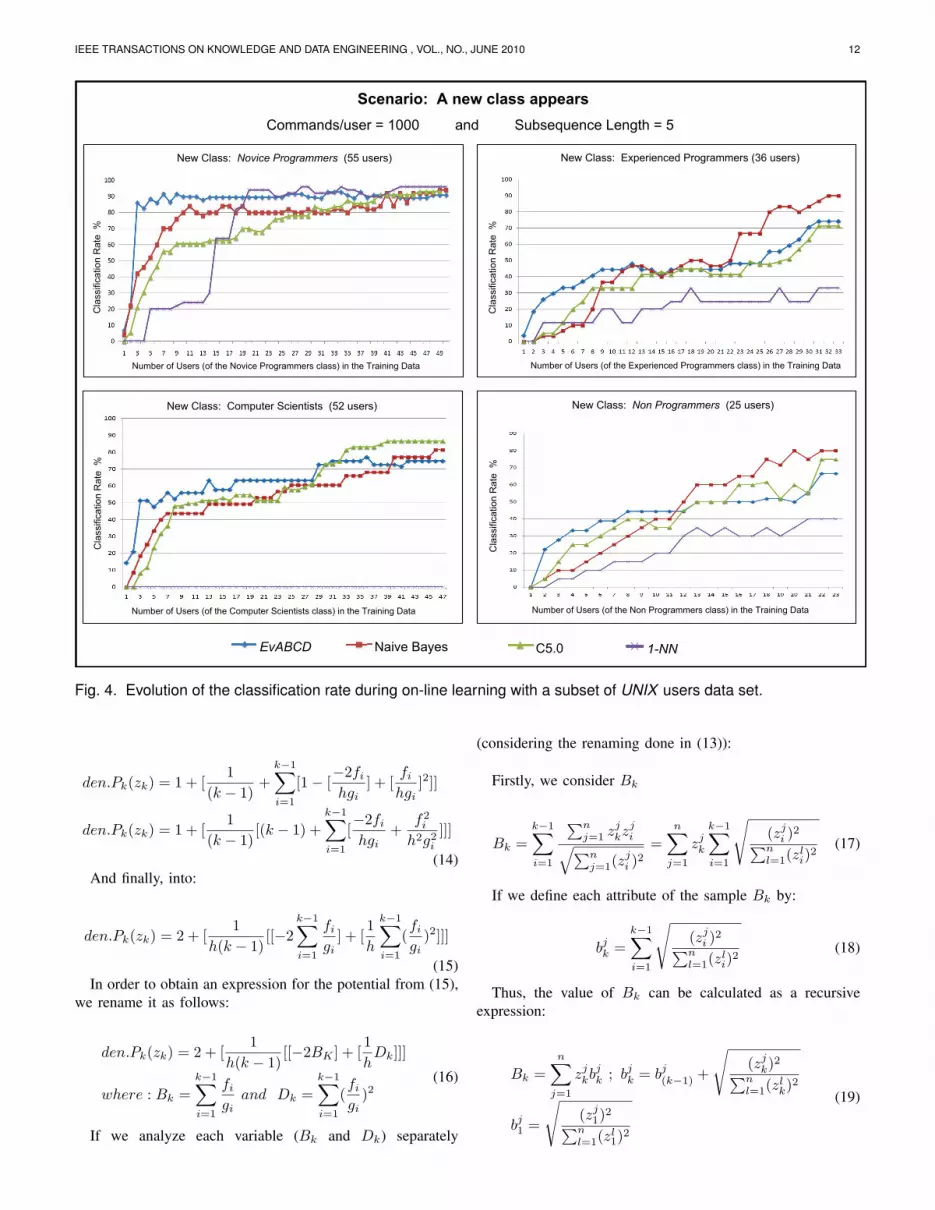
Figure 4 shows the four graphic results of this experimentconsidering in each graph one of the four classes as the newclass:• x-axis represents the number of users of the new class
that contains the training data set.• y-axis represents the percentage of users of the new class
correctly classified.In the different graphs, we can see how quickly EVABCD
evolves and adapts to the new class. If we consider the classNovice Programmers, it is remarkable that after analyzing 3users of this class, the proposed classifier is able to createa new prototype in which almost 90% of the test users arecorrectly classified. However, the other classifiers need a largernumber of samples for recognizing the users of this new class.Similar performance has been observed for the other 3 classes.Specially, C5.0 needs several samples for creating a suitabledecision-tree. As we can see in the graph which represents theclass Computer scientist as the new class, the percentages ofusers correctly in the 1-NN classifier is always 0 because allthe users of this class are classified in the Novice programmersclass. The increase in the classification rate is not perfectlysmooth because the new data bring useful information but alsonoise.
Taking into account these results, we would like to remarkthat the proposed approach is able to adapt to a new userbehavior extremely quick. In a changing and real-timeenvironment, as the proposed in this paper, this property isessential.
7 CONCLUSIONS
In this paper we propose a generic approach, EVABCD,to model and classify user behaviors from a sequence ofevents. The underlying assumption in this approach is thatthe data collected from the corresponding environment canbe transformed into a sequence of events. This sequence issegmented and stored in a trie and the relevant sub-sequencesare evaluated by using a frequency-based method. Then, adistribution of relevant sub-sequences is created. However, asa user behavior is not fixed but rather it changes and evolves,the proposed classifier is able to keep up to date the createdprofiles using an Evolving Systems approach. EVABCD isone pass, non-iterative, recursive and it has the potential to beused in an interactive mode; therefore, it is computationallyvery efficient and fast. In addition, its structure is simple andinterpretable.
The proposed evolving classifier is evaluated in anenvironment in which each user behavior is representedas a sequence of UNIX commands. Although EVABCDhas been developed to be used on-line, the experimentshave been performed using a batch data set in order tocompare the performance to established (incremental andnon-incremental) classifiers. The test results with a dataset of 168 real UNIX users demonstrates that, using an
appropriate subsequence length, EVABCD can performalmost as well as other well established off-line classifiers interms of correct classification on validation data. However,taking into account that EVABCD is able to adapt extremelyquickly to new data, and that this classifier can cope withhuge amounts of data in a real environment which changesrapidly, the proposed approach is the most suitable alternative.
Although, it is not addressed in this paper, EVABCD canalso be used to monitor, analyze and detect abnormalitiesbased on a time varying behavior of same users and to detectmasqueraders. It can also be applied to other type of userssuch as users of e-services, digital communications, etc.
APPENDIX ADERIVATION OF THE COSINE DISTANCE PO-TENTIAL RECURSIVELY
In this appendix the expression of the potential is transformedinto a recursive expression in which it is calculated usingonly the current data sample (zk). For this novel derivationwe combine the expression of the potential for a sample data(equation (1)) represented by a vector of elements and thedistance cosine expression (equation (2)).
Pk(zk) =1
1 + [ 1k−1
∑k−1i=1 [1−
∑nj=1 zjkzji√∑n
j=1(zjk)
2∑nj=1(z
ji )
2]2]
(12)where zk denotes the kth sample inserted in the data space.
Each sample is represented by a set of values; the value ofthe ith attribute (element) of the zk sample is represented as zi
k.
In order to explain the derivation of the expression step bystep; firstly, we consider the denominator of the equation (12)which is named as den.P (zk).
den.Pk(zk) =
= 1 + [1
k − 1
k−1∑i=1
[1−∑n
j=1 zjkz
ji√∑n
j=1(zjk)2
∑nj=1(z
ji )2
]2]
den.Pk(zk) = 1 + [1
k − 1
k−1∑i=1
[1− fi
h gi]2]
where :
fi =n∑
j=1
zjkz
ji , h =
√√√√ n∑j=1
(zjk)2 and gi =
√√√√ n∑j=1
(zji )2
(13)We can observe that the variables fi and gi depend on
the sum of all the data samples (all these data samples arerepresented by i); but the variable h represents the sum of theattribute values of the sample. Therefore, den.Pk(zk) can besimplified further into:
IEEE TRANSACTIONS ON KNOWLEDGE AND DATA ENGINEERING , VOL., NO., JUNE 2010 12
Fig. 4. Evolution of the classification rate during on-line learning with a subset of UNIX users data set.
den.Pk(zk) = 1 + [1
(k − 1)+
k−1∑i=1
[1− [−2fi
hgi] + [
fi
hgi]2]]
den.Pk(zk) = 1 + [1
(k − 1)[(k − 1) +
k−1∑i=1
[−2fi
hgi+
f2i
h2g2i
]]]
(14)And finally, into:
den.Pk(zk) = 2 + [1
h(k − 1)[[−2
k−1∑i=1
fi
gi] + [
1h
k−1∑i=1
(fi
gi)2]]]
(15)In order to obtain an expression for the potential from (15),
we rename it as follows:
den.Pk(zk) = 2 + [1
h(k − 1)[[−2BK ] + [
1hDk]]]
where : Bk =k−1∑i=1
fi
giand Dk =
k−1∑i=1
(fi
gi)2
(16)
If we analyze each variable (Bk and Dk) separately
(considering the renaming done in (13)):
Firstly, we consider Bk
Bk =k−1∑i=1
∑nj=1 z
jkz
ji√∑n
j=1(zji )2
=n∑
j=1
zjk
k−1∑i=1
√(zj
i )2∑nl=1(z
li)2
(17)
If we define each attribute of the sample Bk by:
bjk =k−1∑i=1
√(zj
i )2∑nl=1(z
li)2
(18)
Thus, the value of Bk can be calculated as a recursiveexpression:
Bk =n∑
j=1
zjkb
jk ; bjk = bj(k−1) +
√(zj
k)2∑nl=1(z
lk)2
bj1 =
√(zj
1)2∑nl=1(z
l1)2
(19)

IEEE TRANSACTIONS ON KNOWLEDGE AND DATA ENGINEERING , VOL., NO., JUNE 2010 13
Secondly, considering Dk with the renaming done in (13),we get:
Dk =k−1∑i=1
(
∑nj=1 z
jkz
ji√∑n
j=1(zji )2
)2 =k−1∑i=1
1∑nl=1(z
li)2
[n∑
j=1
zjkz
ji ]
2
Dk =n∑
j=1
zjk
n∑p=1
zpk
k−1∑i=1
zijk z
ipk
1∑nl=1(z
li)2
(20)If we define djp
k as each attribute of the sample Dk, we get:
djpk =
k−1∑i=1
zijk z
ipk
1∑nl=1(z
li)2
(21)
Therefore:
Dk =n∑
j=1
zjk
n∑p=1
zpkd
jpk ; djp
k = djp(k−1) +
zjkz
pk∑n
l=1(zlk)2
;
d1j1 =
zj1z
11∑n
l=1(zl1)2
; j = [1, n+ 1]
(22)Finally:
Pk(zk) =1
2 + [ 1h(k−1) [[−2BK ] + [ 1
hDk]]]
k = 2, 3...;P1(z1) = 1
(23)
where Bk is obtained as in (19), and Dk is described in (22).
Note that to get recursively the value of Bk, it is necessaryto calculate n accumulated values (in this case, n is thenumber of the different subsequences obtained). However, toget recursively the value of Dk we need to calculate nxndifferent accumulated values which store the result of multiplya value by all the other different values (these values arerepresented as dij
k ).
REFERENCES
[1] D. Godoy and A. Amandi, “User profiling in personal informationagents: a survey,” Knowledge Engineering Review, vol. 20, no. 4, pp.329–361, 2005.
[2] J. A. Iglesias, A. Ledezma, and A. Sanchis, “Creating user profilesfrom a command-line interface: A statistical approach,” in Proceedingsof the International Conference on User Modeling, Adaptation, andPersonalization (UMAP), 2009, pp. 90–101.
[3] M. Schonlau, W. Dumouchel, W. H. Ju, A. F. Karr, and Theus,“Computer Intrusion: Detecting Masquerades,” in Statistical Science,vol. 16, 2001, pp. 58–74.
[4] R. A. Maxion and T. N. Townsend, “Masquerade detection using trun-cated command lines,” in Proceedings of the International Conferenceon Dependable Systems and Networks (DSN), 2002, pp. 219–228.
[5] A. Alaniz-Macedo, K. N. Truong, J. A. Camacho-Guerrero, andM. Graca-Pimentel, “Automatically sharing web experiences through ahyperdocument recommender system,” in HYPERTEXT 2003. NewYork, NY, USA: ACM, 2003, pp. 48–56.
[6] D. L. Pepyne, J. Hu, and W. Gong, “User profiling for computersecurity,” in Proceedings of the American Control Conference, 2004,pp. 982–987.
[7] D. Godoy and A. Amandi, “User profiling for web page filtering,” IEEEInternet Computing, vol. 9, no. 4, pp. 56–64, 2005.
[8] J. Anderson, Learning and Memory: An Integrated Approach. NewYork: John Wiley and Sons., 1995.
[9] Y. Horman and G. A. Kaminka, “Removing biases in unsupervisedlearning of sequential patterns,” Intelligent Data Analysis, vol. 11, no. 5,pp. 457–480, 2007.
[10] T. Lane and C. E. Brodley, “Temporal sequence learning and datareduction for anomaly detection,” in Proceedings of the ACM conferenceon Computer and communications security (CCS). New York, NY,USA: ACM, 1998, pp. 150–158.
[11] S. E. Coull, J. W. Branch, B. K. Szymanski, and E. Breimer, “Intrusiondetection: A bioinformatics approach,” in Proceedings of the AnnualComputer Security Applications Conference (ACSAC), 2003, pp. 24–33.
[12] P. Angelov and X. Zhou, “Evolving fuzzy rule-based classifiers fromdata streams,” IEEE Transactions on Fuzzy Systems: Special issue onEvolving Fuzzy Systems, vol. 16, no. 6, pp. 1462–1475, 2008.
[13] M. Panda and M. R. Patra, “A comparative study of data miningalgorithms for network intrusion detection,” International Conferenceon Emerging Trends in Engineering & Technology, vol. 0, pp. 504–507,2008.
[14] A. Cufoglu, M. Lohi, and K. Madani, “A comparative study of selectedclassifiers with classification accuracy in user profiling,” in Proceedingsof the WRI World Congress on Computer Science and InformationEngineering (CSIE). IEEE Computer Society, 2009, pp. 708–712.
[15] R. Polikar, L. Upda, S. S. Upda, and V. Honavar, “Learn++: anincremental learning algorithm for supervised neural networks,” IEEETransactions on Systems, Man and Cybernetics, Part C (Applicationsand Reviews), vol. 31, no. 4, pp. 497–508, 2001. [Online]. Available:http://dx.doi.org/10.1109/5326.983933
[16] D. Kalles and T. Morris, “Efficient incremental induction of decisiontrees,” Machine Learning, vol. 24, no. 3, pp. 231–242, 1996.
[17] F. J. Ferrer-Troyano, J. S. Aguilar-Ruiz, and J. C. R. Santos, “Datastreams classification by incremental rule learning with parameterizedgeneralization,” in Proceedings of ACM Symposium on Applied Com-puting (SAC), 2006, pp. 657–661.
[18] J. C. Schlimmer and D. H. Fisher, “A case study of incremental conceptinduction,” in AAAI, 1986, pp. 496–501.
[19] P. E. Utgoff, “Id5: An incremental id3,” in Machine Learning, 1988, pp.107–120.
[20] P. E. Utgof, “Incremental induction of decision trees,” Machine Learn-ing, vol. 4, no. 2, pp. 161–186, 1989.
[21] G. A. Carpenter, S. Grossberg, and D. B. Rosen, “Art2-a: An adaptiveresonance algorithm for rapid category learning and recognition,” NeuralNetworks, vol. 4, pp. 493–504, 1991.
[22] G. A. Carpenter, S. Grossberg, N. Markuzon, J. H. Reynolds, and D. B.Rosen, “Fuzzy artmap: A neural network architecture for incrementalsupervised learning of analog multidimensional maps,” Neural Networks,IEEE Transactions on, vol. 3, no. 5, pp. 698–713, 2002.
[23] N. Kasabov, “Evolving fuzzy neural networks for super-vised/unsupervised online knowledge-based learning,” IEEETransactions on Systems, Man and Cybernetics - Part B: Cybernetics,vol. 31, no. 6, pp. 902–918, 2001.
[24] T. Seipone and J. A. Bullinaria, “Evolving improved incremental learn-ing schemes for neural network systems,” in Congress on EvolutionaryComputation, 2005, pp. 2002–2009.
[25] T. Kohonen, J. Kangas, J. Laaksonen, and K. Torkkola, “Lvq pak: Aprogram package for the correct application of learning vector quan-tization algorithms,” in International Conference on Neural Networks.IEEE, 1992, pp. 725–730.
[26] F. Poirier and A. Ferrieux, “DVQ: Dynamic vector quantization - anincremental LVQ,” in International Conference on Artificial NeuralNetworks, 1991, pp. 1333–1336.
[27] R. K. Agrawal and R. Bala, “Incremental bayesian classificationfor multivariate normal distribution data,” Pattern RecognitionLetters, vol. 29, no. 13, pp. 1873–1876, 2008. [Online]. Available:http://dx.doi.org/10.1016/j.patrec.2008.06.010
[28] K. M. A. Chai, H. L. Chieu, and H. T. Ng, “Bayesian online classifiersfor text classification and filtering,” in Proceedings of the InternationalConference on Research and Development in Information Retrieval(SIGIR), 2002, pp. 97–104.
[29] G. Cauwenberghs and T. Poggio, “Incremental and decremental supportvector machine learning,” in NIPS, 2000, pp. 409–415. [Online].Available: http://citeseer.ist.psu.edu/cauwenberghs00incremental.html
[30] R. Xiao, J. Wang, and F. Zhang, “An approach to incremental SVMlearning algorithm,” IEEE International Conference on Tools with Arti-ficial Intelligence, vol. 0, pp. 268–278, 2000.
[31] G. Widmer and M. Kubat, “Learning in the presence of concept driftand hidden contexts,” in Machine Learning, 1996, pp. 69–101.
IEEE TRANSACTIONS ON KNOWLEDGE AND DATA ENGINEERING , VOL., NO., JUNE 2010 14
[32] P. Riley and M. M. Veloso, “On behavior classification in adversarialenvironments,” in Proceedings of Distributed Autonomous Robotic Sys-tems (DARS), 2000, pp. 371–380.
[33] E. Fredkin, “Trie memory,” Comm. A.C.M., vol. 3, no. 9, pp. 490–499,1960.
[34] J. A. Iglesias, A. Ledezma, and A. Sanchis, “Sequence classificationusing statistical pattern recognition.” in Proceedings of Intelligent DataAnalysis (IDA), ser. LNCS, vol. 4723. Springer, 2007, pp. 207–218.
[35] G. A. Kaminka, M. Fidanboylu, A. Chang, and M. M. Veloso, “Learningthe sequential coordinated behavior of teams from observations,” inRoboCup, ser. LNCS, vol. 2752. Springer, 2002, pp. 111–125.
[36] J. A. Iglesias, A. Ledezma, and A. Sanchis, “A comparing method of twoteam behaviours in the simulation coach competition,” in Proceedings ofModeling Decisions for Artificial Intelligence (MDAI), ser. LNCS, vol.3885. Springer, 2006, pp. 117–128.
[37] R. Agrawal and R. Srikant, “Mining sequential patterns,” in InternationalConference on Data Engineering, Taipei, Taiwan, 1995, pp. 3–14.
[38] P. Angelov and D. Filev, “An approach to online identification oftakagi-sugeno fuzzy models,” IEEE Transactions on Systems, Man, andCybernetics, Part B, vol. 34, no. 1, pp. 484–498, 2004.
[39] P. Angelov, X. Zhou, and F. Klawonn, “Evolving fuzzy rule-basedclassifiers,” Computational Intelligence in Image and Signal Processing,2007. CIISP 2007. IEEE Symposium on, pp. 220–225, 2007.
[40] X. Zhou and P. Angelov, “Autonomous visual self-localization in com-pletely unknown environment using evolving fuzzy rule-based classi-fier,” Computational Intelligence in Security and Defense Applications,(CISDA), pp. 131–138, 2007.
[41] P. Angelov and D. Filev, “Simpl ets: a simplified method for learningevolving takagi-sugeno fuzzy models,” The IEEE International Confer-ence on Fuzzy Systems (IEEE-FUZZ)., pp. 1068–1073, 2005.
[42] P. Angelov and D. Filiv, “Flexible models with evolving structure,”International Journal of Intelligent Systems, vol. 19, no. 4, pp. 327–340, 2004.
[43] S. Greenberg, “Using unix: Collected traces of 168 users,” Master’sthesis, Department of Computer Science, University of Calgary, Alberta,Canada, 1988.
[44] J. Quinlan, “Data mining tools see5 and C5.0,” 2003 [online], available:http://www.rulequest.com/see5-info.html.
[45] J. R. Quinlan, C4.5: programs for machine learning. San Francisco,CA, USA: Morgan Kaufmann Publishers Inc., 1993.
[46] R. O. Duda and P. E. Hart, Pattern Classification and Scene Analysis.John Wiley & Sons Inc, 1973.
[47] G. John and P. Langley, “Estimating continuous distributions in bayesianclassifiers,” in In Proceedings of the Conference on Uncertainty inArtificial Intelligence, 1995, pp. 338–345.
[48] T. Cover and P. Hart, “Nearest neighbor pattern classification,” IEEETransactions on Information Theory, vol. 13, no. 1, pp. 21–27, 1967.
[49] Y. Freund and R. E. Schapire, “A decision-theoretic generalization ofon-line learning and an application to boosting,” Journal of Computerand System Sciences, vol. 55, no. 1, pp. 119–139, 1997.
[50] J. H. Morra, Z. Tu, L. G. Apostolova, A. Green, A. W. Toga, and P. M.Thompson, “Comparison of adaboost and support vector machines fordetecting alzheimer’s disease through automated hippocampal segmenta-tion,” IEEE Transactions on Medical Imaging, vol. 29, no. 1, pp. 30–43,2010.
[51] J. Platt, “Machines using sequential minimal optimization,” in Advancesin Kernel Methods - Support Vector Learning, B. Schoelkopf, C. Burges,and A. Smola, Eds. MIT Press, 1998.
[52] T. Kohonen, M. R. Schroeder, and T. S. Huang, Eds., Self-OrganizingMaps. Secaucus, NJ, USA: Springer-Verlag New York, Inc., 2001.
Jose Antonio Iglesias is a Teaching Assistant of computer scienceand member of the CAOS research group at Carlos III University ofMadrid (UC3M), Spain. He obtained his Ph.D. in Computer Sciencefrom UC3M in 2010. He has a B.S. in Computer Science (2002) fromValladolid University. He has published over 25 journal and conferencepapers and he takes part in several national research projects. He ismember of the Fuzzy Systems Technical Committee (IEEE/CIS) andcommittee member of several international conferences. His researchinterests include agent modeling, plan recognition, sequence learning,machine learning and evolving fuzzy systems.
Plamen Angelov received the M.Eng. degree in electronics and au-tomation from Sofia Technical University, Sofia, Bulgaria, in 1989 andthe Ph.D. degree in optimal control from Bulgaria Academy of Sciences,Sofia, Bulgaria, in 1993. He spent over ten years as a Research Fellowworking on computational intelligence and control. During 1995-1996,he was at Hans-Knoell Institute, Jena, Germany. In 1997, he was a Vis-iting Researcher at the Catholic University, Leuvain-la-neuve, Belgium.In 2007, he was a Visiting Professor at the University of Wolfenbuettel-Braunschweig, Germany. He is currently a Senior Lecturer (AssociateProfessor) at Lancaster University, Lancaster, U.K. He has authoredor coauthored over 140 peer-reviewed publications, including the bookEvolving Rule Based Models: A Tool for Design of Flexible AdaptiveSystems (Springer-Verlag, 2002), and over 40 journal papers, and isa holder of a patent (2006). He is the Editor-in-Chief of the SpringerJournal Evolving Systems. He is the Chair of Standards Committee,Computational Intelligence Society, IEEE. His current research interestsinclude adaptive and evolving (self-organizing) fuzzy systems as aframework of an evolving computational intelligence.
Agapito Ledezma is an Associate Professor of computer science andmember of the CAOS research group at Carlos III University of Madrid(UC3M). He obtained his Ph.D. in computer science from UC3M in2004. He has a B. S. in computer science (1997) from UniversidadLatinoamericana de Ciencia y Tecnologia (ULACIT) of Panama. Hehas contributed to several national research projects on data miningand image processing. His research interests span data mining, agentmodeling, ensemble of classifiers and cognitive robotics. He has writtenmore than 40 technical papers for computer science journals andconferences and he is a committee member of several internationalconferences.
Araceli Sanchis has been a University Associate Professor of computerscience at Carlos III University of Madrid (UC3M) since 1999. Shereceived her Ph.D. in physical chemistry from Complutense Universityof Madrid in 1994 and in computer science from Politecnic Universityof Madrid in 1998. She has a B. Sc. in chemistry (1991) from theComplutense University of Madrid. She had been Vice-Dean of theComputer Science degree at UC3M and, currently, she is head ofthe CAOS group (Grupo de Control, Aprendizaje y Optimizacin deSistemas) based on machine learning and optimization. She has ledseveral research projects founded by the Spanish Ministry of Educationand Science and also by the European Union. She has published over60 journal and conference papers mainly in the field of machine learning.Her topics of interests are multi-agent systems, agent modeling, datamining and cognitive robotics.