cpt site characterization for seismic hazards in the new madrid seismic zone
TRANSCRIPT
CPT site characterization for seismic hazards in the New
Madrid seismic zone
T. Liaoa,*, P.W. Maynea,1, M.P. Tuttleb, E.S. Schweigc, R.B. Van Arsdaled,2
aSchool of Civil and Environmental Engineering, Georgia Institute of Technology, 790 Atlantic Drive, Atlanta, GA 30332-0355, USAbM. Tuttle and Associates, 128 Tibbetts Lane, Georgetown, ME 04548, USA
cUS Geological Survey, 3876 Central Avenue, Ste. 2, Memphis, TN 38152-3050, USAdDepartment of Earth Sciences, The University of Memphis, 402 J.M. Smith Building, Memphis, TN 38152, USA
Abstract
A series of cone penetration tests (CPTs) were conducted in the vicinity of the New Madrid seismic zone in central USA for quantifying
seismic hazards, obtaining geotechnical soil properties, and conducting studies at liquefaction sites related to the 1811–1812 and prehistoric
New Madrid earthquakes. The seismic piezocone provides four independent measurements for delineating the stratigraphy, liquefaction
potential, and site amplification parameters. At the same location, two independent assessments of soil liquefaction susceptibility can be
made using both the normalized tip resistance ðqc1NÞ and shear wave velocity ðVs1Þ: In lieu of traditional deterministic approaches, the CPT
data can be processed using probability curves to assess the level and likelihood of future liquefaction occurrence.
q 2002 Elsevier Science Ltd. All rights reserved.
Keywords: Cone-penetration test; In situ tests; Site characterization; Liquefaction; Paleoliquefaction; Porewater pressures; Seismic hazard; Shear waves
1. Introduction
Hundreds of earthquake events occurred in the New
Madrid seismic zone (NMSZ) during December 1811 and
February 1812, with the three largest events estimated to
have moment magnitudes of 7.9, 7.6, and 8.0 [1]. This
historic earthquake sequence raised questions regarding the
earthquake potential of the seismic zone. Clearly a repeat of
such a New Madrid event today would be very damaging to
the infrastructure of the central US, as well as a significant
threat to the large population who live and work in this
region. In recent years, paleoseismology studies of earth-
quake-induced liquefaction features have provided valuable
data regarding the earthquake history and potential of the
NMSZ [2,3]. Recent research in Japan and western USA,
where earthquakes occur more frequently, notes the
important finding that sites that experience liquefaction
will likely liquefy again during events of similar magnitude
[4,5]. Therefore, it is desirable to have a reliable and
expedient means to evaluate the liquefaction potential over
large developed urban and suburban regions. Here, in
particular, the efforts are to quantify the seismic hazards
related to liquefaction in the NMSZ extending from
Memphis, TN up the Mississippi River to St Louis, MO.
The cone penetration test (CPT) offers three or more
continuous channels of logged readings, in comparison to
the standard penetration test (SPT) conducted at 1.5 m
intervals in soil borings, in order to profile the subsurface
strata and detect loose sands to silty sands that may be
subject to liquefaction. Normalized penetration readings
from both the SPT and CPT can be used for evaluating
liquefaction potential [6]. In the CPT, geophones can be
placed within the penetrometer to allow measurements of
downhole shear wave velocities for site amplification
analysis, as well as liquefaction studies.
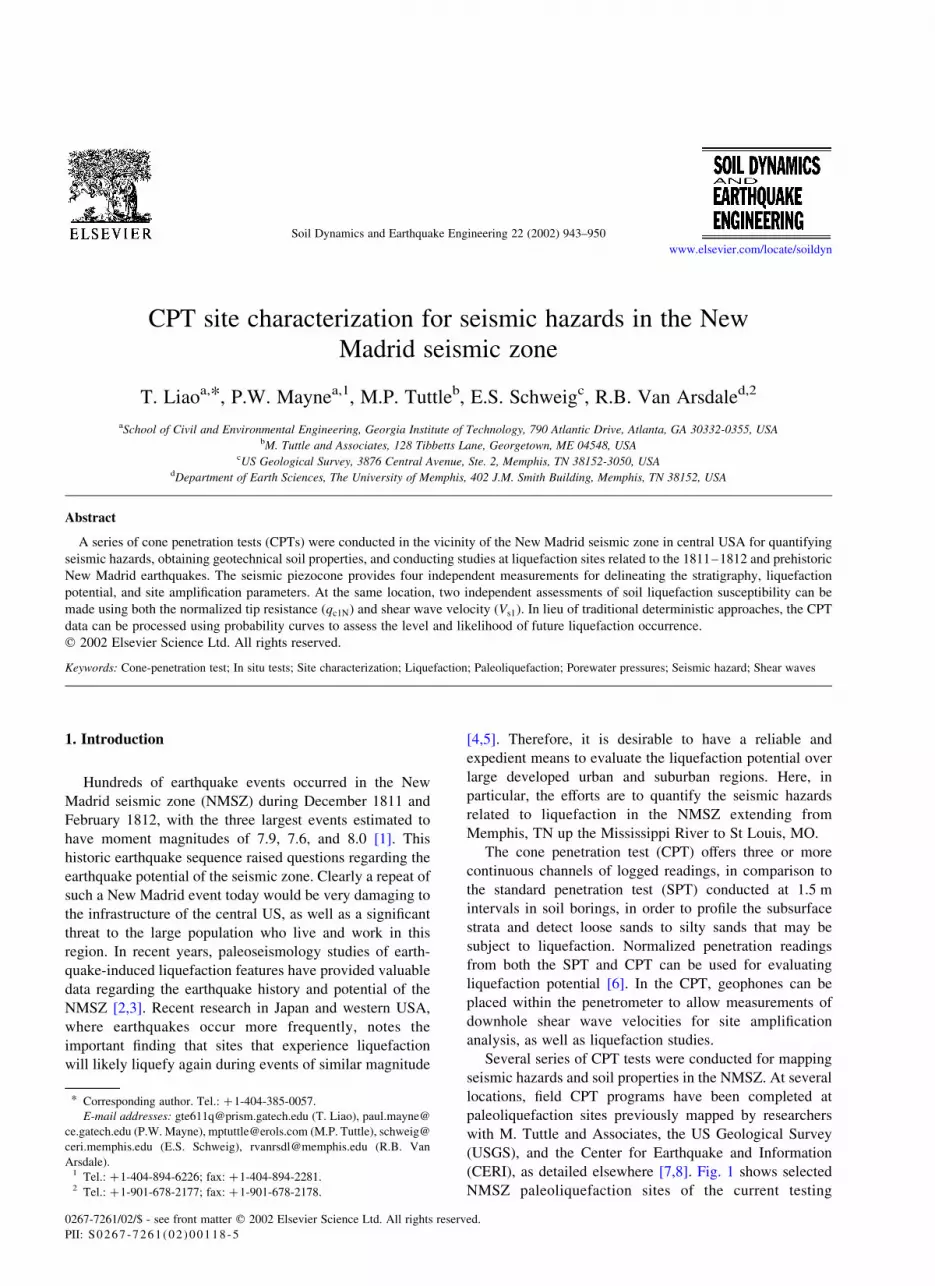
Several series of CPT tests were conducted for mapping
seismic hazards and soil properties in the NMSZ. At several
locations, field CPT programs have been completed at
paleoliquefaction sites previously mapped by researchers
with M. Tuttle and Associates, the US Geological Survey
(USGS), and the Center for Earthquake and Information
(CERI), as detailed elsewhere [7,8]. Fig. 1 shows selected
NMSZ paleoliquefaction sites of the current testing
0267-7261/02/$ - see front matter q 2002 Elsevier Science Ltd. All rights reserved.
PII: S0 26 7 -7 26 1 (0 2) 00 1 18 -5
Soil Dynamics and Earthquake Engineering 22 (2002) 943–950
www.elsevier.com/locate/soildyn
1 Tel.: þ1-404-894-6226; fax: þ1-404-894-2281.2 Tel.: þ1-901-678-2177; fax: þ1-901-678-2178.
* Corresponding author. Tel.: þ1-404-385-0057.
E-mail addresses: [email protected] (T. Liao), paul.mayne@
ce.gatech.edu (P.W. Mayne), [email protected] (M.P. Tuttle), schweig@
ceri.memphis.edu (E.S. Schweig), [email protected] (R.B. Van
Arsdale).
program, including the Walker Site in Marked Tree, AR, the
Yarbro and Haynes sites in Blytheville, AR, and the Wolf
River in Memphis, TN, and Caruthersville, MO [9]. The
collected CPT data have been used for site characterization
and liquefaction evaluation of the subsurface materials, as
well as to investigate the causes and sizes of the observed
liquefaction features (e.g. large sand blows 5–30 m in
diameter; large dikes, sills, subsidence). Relative sizes of
such features between nearby and adjacent liquefaction sites
depend not only on the sand type, its relative density, and
inplace consistency, but also on the thickness and condition
of the overlying clay–silt cap, groundwater conditions, and
other factors.
2. Cone penetration tests
The cone penetrometer system used in these tests included
an anchored truck-mounted hydraulic rig with field computer
data acquisition and three geophysics-type penetrometers
(5-, 10-, and 15-ton capacity). Each penetrometer consists
of a 608 angled apex at the tip instrumented to measure five
independent readings: tip resistance (qc), sleeve friction ( fs),
vertical inclination (i ), penetration porewater pressure
(either midface u1 or shoulder u2), and downhole shear
wave velocity (Vs). Shear waves are recorded at 1-m depth
intervals, whereas the other readings are obtained at a
constant logging rate, generally set between 1 and 5 cm/s.
The tip resistance (qc) is a point stress related to the soil
strength and the reading must be corrected for porewater
pressure effects on unequal areas [10], especially in clays
and silts. The corrected value is termed qT. The sleeve
resistance relates to the interface friction between the
penetrometer and soil. Magnitudes of porewater pressure
depend upon the permeability of the medium and the
shoulder filter element (or u2 position) is required for the tip
correction [11]. The tip resistance (qT), sleeve friction ( fs)
and pore pressure (u2) are used together to characterize the
subsurface layering, soil behavioral type, and strength
properties [10]. Particularly important in seismic investi-
gations, a cyclic stress-based analysis of liquefaction-prone
sediments is available using the qT data [6–8,12].
The seismic piezocone test (SCPTu) includes both
penetration readings and downhole geophysical measure-
ments in the same sounding, thus optimizing data collection
at a given location. Results from a representative SCPTu
sounding performed along the Wolf River in northeastern
Memphis, TN are shown in Fig. 2. In the test procedure, the
shear waves are generated by striking a horizontal steel
plank that is coupled to the ground under an outrigger. The
downhole geophone is oriented parallel to the plank to
detect vertically propagating, horizontally polarized shear
waves. From the measured wave train at each depth, a
pseudo-interval shear wave velocity (Vs) is determined as
the difference in travel distance between any two successive
events divided by the difference in travel times [13]. The
travel times are determined in two ways: (1) by visually
inspecting the recorded wave traces and subjectively
identifying the first arrival, and (2) by a rigorous post-
processing technique known as cross-correlation to deter-
mine the time shift between the entire wave trains from
successive paired records [14].
The shear wave velocities are useful for subsequent site
amplification studies, as well as the evaluation of soil
resistance to liquefaction susceptibility [15]. Notably, the
SCPTu is versatile as it provides both large-strain
penetration test data and small-strain shear wave velocity
measurements in a single sounding.
3. Soil classification
As no soil samples are obtained during the CPT, indirect
methods of assessing the soil type are required. For most
cases, simple ‘rules of thumb’ are sufficient: sands exhibit
qT . 30 atm ð1 atm ¼ 100 kPaÞ and clays qT , 20 atm:
Also, for sands, the u2 < u0; whereas for intact clays
Fig. 1. Representative CPT locations in New Madrid seismic zone.
T. Liao et al. / Soil Dynamics and Earthquake Engineering 22 (2002) 943–950944

u2 q u0; where u0 is the static porewater pressure. As a
consequence, the measured and corrected tip stresses in
sand are essentially the same value ðqT ¼ qcÞ:
In a more systematic or automated manner, a soil profile
can be generated using either soil behavior classification
charts or clustering methods. The soil behavioral charts
[16] are based on tip resistance (qT), friction ratio
ðFR ¼ fs=qTÞ; and porewater pressure ratio Bq ¼ ðu2 2 u0Þ=
ðqT 2 sv0Þ; where sv0 is the total vertical stress. Another
well-adopted chart is based on the normalized parameters
Q ¼ ðqT 2 sv0Þ=s0v0; F ¼ fs=ðqT 2 sv0Þ; and Bq [17]. An
alternative approach is the use of statistical cluster analysis
that can be used to analyze the stratigraphic vertical profile
of sediments [18]. It detects the inherent similarity between
data sets and then groups them together. Since piezocone
soundings provide thousands of data points, it is often
overwhelming to determine soil layering from simple
visual examination and routine data processing such as
spreadsheets. Clustering assists in a rational grouping of the
data to define strata boundaries.
4. Liquefaction evaluation
In liquefaction analyses, the level of ground shaking
from seismic loading is expressed in terms of the cyclic
stress ratio (CSR). For the conventional simplified pro-
cedures, the CSR is expressed as [19]:
CSR ¼tave
s0v0
¼ 0:65amax
g
� �sv0
s0v0
!rd ð1Þ
where tave is the average equivalent uniform shear stress
generated by the earthquake assumed to be 65% of the
maximum induced stress, amax is the peak ground accelera-
tion (PGA) in the same unit as g, g is the gravitational
acceleration constant ðg ¼ 9:8 m=s2Þ; sv0 and s0v0 are the
total and effective vertical stresses, respectively, and rd is a
stress reduction coefficient that accounts for the flexibility of
the model soil column. In this paper, the rd recommen-
dations of the NCEER Workshop on Evaluation of
Liquefaction Resistance of Soils [12] were followed. The
value amax is taken from the appropriate design events for a
given project (i.e. the 2, 5, or 10% probability earthquake
for a certain period of time; the maximum credible event for
a known fault located a certain distance from the site; or a
code-based response spectrum).
The cyclic resistance ratio (CRR) is the threshold for
liquefaction and used to compare the available soil
resistance with level of ground shaking represented by the
CSR. Therefore, if the CSR value is higher than the CRR,
the soil will likely liquefy; otherwise, it will not. The CRR
can be evaluated using the conventional deterministic
approaches, or alternatively, the probabilistic curves of
increasing likelihoods of liquefaction.
Deterministic approaches include procedures based on
normalized tip resistance [6,12,15] and/or normalized shear
wave velocity [8,12,15]. For the tip resistance-based method
shown in Fig. 3, the cone tip resistance is normalized as a
function of the effective stress (actual normalization criteria
depends upon the CPT soil classification) and is designated
qc1N: For clean quartz sands, qc1N ¼ qT=ðs0v0Þ
0:5; where the
tip resistance (qT) and effective overburden stress ðs0v0Þ are
both in atm. For silty sands, the stress-normalized cone tip
resistance qc1N is modified to the adjusted tip resistance
ðqc1NÞcs; which is its equivalent clean sand value, by the
relationship ðqc1NÞcs ¼ Kcqc1N; where Kc is the correction
factor for the apparent fines content and is empirically
calculated from the CPT Q and F data. For clean sands,
ðqc1NÞcs ¼ qc1N: The level of ground motion (CSR) and the
adjusted tip resistance ðqc1NÞcs are compared with the cyclic
resistance (CRR) to determine whether liquefaction will or
Fig. 2. Representative SCPTu sounding performed along Wolf River in Memphis, TN.
T. Liao et al. / Soil Dynamics and Earthquake Engineering 22 (2002) 943–950 945

will not occur. The CRR for clean sand is calculated by the
following equation for an earthquake moment-magnitude of
7.5 [12,20]:
CRR7:5 ¼ 93ððqc1NÞcs=1000Þ3 þ0:08; if 50# ðqc1NÞcs , 160
CRR7:5 ¼ 0:833ððqc1NÞcs=1000Þþ0:05; if ðqc1NÞcs , 50
ð2Þ
For liquefaction evaluation based on shear wave velocity, a
deterministic chart procedure is shown in Fig. 4. Here, the
shear wave velocity is stress-normalized to Vs1 ¼
Vs=ðs0v0Þ
0:25; where Vs is in m/s and s0v0 in atm. The CRR
for an earthquake moment-magnitude of 7.5 is found from
[12,15]:
CRR7:5 ¼ aðVs1=100Þ2 þb½1=ðVs1c 2VS1Þ21=Vs1c� ð3Þ
Fig. 3. Deterministic approach for liquefaction analysis of clean sand based
on tip resistance. After Robertson and Wride [20].
Fig. 4. Deterministic approach for liquefaction analysis of clean sand based
on shear wave velocity. After Andrus and Stokoe [15].
Fig. 5. Cyclic resistance ratios (CRRs) based on tip resistance at different
levels of probability. After Juang and Jiang [22].
Fig. 6. Cyclic resistance ratios (CRRs) based on shear wave velocity at
different levels of probability. After Juang et al. [23].
T. Liao et al. / Soil Dynamics and Earthquake Engineering 22 (2002) 943–950946

where a ¼ 0.03, b ¼ 0.9, Vs1 is the overburden stress-
normalized shear-wave velocity, and Vs1c is a limiting asymp-
tote value. From statistical database analyses, Andrus and
Stokoe [15] determined the following values for sands and
gravels related to fines contents: Vs1c ¼ 220 m=s for
FC # 5%; Vs1c¼210m=s for FC ¼ 20%; and Vs1c¼200m=s
for FC $ 35%.
Deterministic methods give only a binary evaluation of
liquefaction potential. A calculated factor of safety (Fs) can
be defined as Fs ¼ CRR/CSR for a particular earthquake
magnitude and set of data. In more recent evaluations, CRR
curves of different probabilities of occurrence have been
developed from the original databases.
Based on the normalized tip resistance, a mapping
function was proposed [21,22] to relate the safety factor Fs
to the liquefaction probability PL based on a database of 225
CPT-based cases reported by Juang and Jiang [22]:
PL ¼ 1=½1 þ ðFs=1:0Þ3:34� ð4Þ
Based on the shear wave velocity, there is a similar mapping
function [23]:
PL ¼ 1=½1 þ ðFs=0:72Þ3:1� ð5Þ
The CSR is calculated according to Eq. (1), and the CRR is
determined from Eq. (2) if it is based on the tip resistance, or
from Eq. (3) if it is based on the shear wave velocity. Curves
of CRR for different probabilities of liquefaction based on
normalized tip resistance are shown in Fig. 5. This provides
a more rational means of assessing the likelihood of
liquefaction for a particular CSR and soil resistance
measured by qc1N. The CRR curves at different probabilities
ranging from 10 to 90% are given in Fig. 6 for normalized
shear wave velocity, Vs1.
5. CPT tests performed in Marked Tree, AR
A series of CPT tests was performed at the Walker
paleoliquefaction site that is located near Marked Tree, AR.
This site was selected for a paleoseismology study because
sand blows were found in association with a Native
American occupation horizon, suggesting that the sand
blow was prehistoric in age [24]. The study included a large
scale surface resistivity survey to locate anomalies
indicating the exact location of the feeder dikes [25],
followed by excavation and documentation of the liquefac-
tion features and the cultural horizon [9]. On the basis of
radiocarbon dating and artifact analysis, the sand blows and
related dikes are thought to have formed during a large New
Madrid earthquake circa A.D. 1450 [24,26]. Although the
full extent of the A.D. 1450 liquefaction field has not yet
Fig. 7. Overview of the CPT locations at Marked Tree paleoliquefaction
site, AR.
Fig. 8. Interpreteted soil stratigraphy of the second series of soundings using clustering and CPT soil behavioral charts.
T. Liao et al. / Soil Dynamics and Earthquake Engineering 22 (2002) 943–950 947

been determined, this is the southernmost known occurrence
of sand blows of this age. At a later date (August 2000), the
CPT testing was performed in two linear arrays perpen-
dicular to the main direction of the sand dikes, as shown by
Fig. 7. The intention of these series was to provide
information on the subsurface stratigraphy and source
sands, explore lateral variability, and evaluate the potential
for re-liquefaction. The soil profiles for the second array of
soundings have been evaluated according to the soil
behavioral chart [17] and cluster analysis [18], as shown
in Fig. 8. It can be seen that the profiles mainly consist of
clay and silt for the upper 5 m. The remainder of the profiles
to depths of at least 16 m indicates the presence of sand that
may be prone to liquefaction during a similar large
earthquake event.
Results from a representative seismic piezocone sound-
ing (No. MTREE12) advanced to a depth of 26 m at the
Walker site are shown in Fig. 9. The readings indicate a
clayey layer in the upper 5 m underlain by an extensive
deposit of relatively clean sands with varying facies. The
profile corresponds similarly with the boring and geological
log of a nearby site reported by Liu et al. [27]. Since the
Walker Site is a well-documented paleoliquefaction site,
an earthquake magnitude of 8.0 has been used for the
liquefaction analysis. Fig. 10 shows the results of
liquefaction analysis for the sounding MTREE12 by
Fig. 9. Representative seismic piezocone results at Walker paleoliquefaction site near Marked Tree, AR (sounding MTREE12).
Fig. 10. Liquefaction analyses by deterministic approaches for Marked Tree sounding.
T. Liao et al. / Soil Dynamics and Earthquake Engineering 22 (2002) 943–950948

the deterministic approach. At a factor of safety of Fs ¼ 1.0
for liquefaction, the critical values of tip resistance and
shear wave velocity are derived by inversing the process of
calculating CRR. This critical value, which changes with
depth, is shown in the same graph as the measured value in
the figure. Liquefaction is likely whenever the measured
value is less than the critical value. The gaps in the critical
value data represent soil layers that are not susceptible to
liquefaction due to their classification (e.g. clayey soils for
which liquefaction analyses are not relevant).
Similarly, the CRR probability curves can be applied to
the CPT data from the Walker paleoliquefaction site. The
probabilistic procedure is presented as the different liquefac-
tion probabilities versus the corresponding depth in Fig. 11.
The probability is analyzed based on the independent critical
tip stress and the shear wave velocity, respectively, as well as
jointly. The combined probability can be calculated as the
average of the probabilities based on the two approaches.
From the combined liquefaction probability shown in Fig.
11, it can be seen that the region from 9 to 11 m is most
susceptible to liquefaction, and at selected other depths, e.g.
from 7 to 8 m, from 12 to 14 m, and from 17 to 18 m, the soils
also have a high probability of liquefying under an earth-
quake magnitude of 8.0. Other magnitude events can also be
investigated with this technique. This analysis reflects the
liquefaction potential of the sediments at the site today and
does not try to back-calculate the magnitude of the A.D. 1450
earthquake that produced the liquefaction features.
In future research efforts, an improved procedure would
be obtained by adopting a similar CRR form for both the
normalized cone tip resistance and shear wave velocities.
Consistency and a better compatibility of results would be
expected. A joint-probability curve based on ðqc1NÞcs and
Vs1 could also be developed from statistical analyses.
6. Conclusions
Geotechnical site characterization using CPT in the
NMSZ serves multiple purposes, including (1) identifying
soils with high potential to liquefaction; (2) providing data
for site amplification analysis; and (3) obtaining information
for ongoing paleoliquefaction studies. Of particular interest,
the SCPTu is an efficient way to assess the liquefaction
potential of soils, as it provides logging of tip stress, sleeve
friction, porewater pressure, and shear wave velocity in a
single sounding. These data can be processed to identify the
stratigraphy, layers susceptible to liquefaction, level of
ground shaking, and soil resistance to liquefaction.
Deterministic and/or probabilistic curves can be used with
the normalized tip resistance qc1N and shear wave velocity
Vs1 in evaluating soil liquefaction potential. The redundancy
information from two independent readings provides a
higher level of confidence in the conclusions on liquefaction
hazards.
Acknowledgments
Financial and technical support has been provided by the
US Geological Survey, the Mid-America Earthquake
Center, and the National Science Foundation.
References
[1] Johnston AC, Schweig ES. The enigma of the New Madrid
earthquakes of 1811–1812. Annual Rev Earth Planet Sci 1996;24:
339–84.
[2] Tuttle MP, Schweig ES. Archeological and pedological evidence for
large earthquakes in the New Madrid seismic zone, central United
States. Geology 1995;23:253–6.
Fig. 11. Liquefaction analyses by probabilistic approaches for Marked Tree sounding.
T. Liao et al. / Soil Dynamics and Earthquake Engineering 22 (2002) 943–950 949

[3] Tuttle MP, Schweig ES, Sims JD, Lafferty RH, Wolf LW, Haynes M.
The earthquake potential of the New Madrid seismic zone. Bull
Seismol Soc Am 2002; in press.
[4] Youd TL. Recurrence of liquefaction at the same site. Proceedings of
the Eighth World Conference on Earthquake Engineering, San
Francisco, vol. III; 1988. p. 231–38.
[5] Yasuda S, Tohno I. Sites of re-liquefaction caused by the 1983
Nihonkai-Chuba earthquake. Soils Foundations 1988;28(2):61–72.
[6] Stark TD, Olson SM. Liquefaction resistance using CPT and field case
histories. J Geotech Engng, ASCE 1995;121(12):859–69.
[7] Schneider JA, Mayne PW. Liquefaction response of soils in mid-
America evaluated by seismic cone tests. Innovations and applications
in geotechnical site characterization (GSP 97), Reston, VA: ASCE;
2000. p. 1–16.
[8] Schneider JA, Mayne PW, Rix GJ. Geotechnical site characterization
in the greater Memphis area using cone penetration tests. Engng Geol
2001;62(1–3):169–84.
[9] Tuttle MP. Late Holocene earthquakes and their implications for
earthquake potential of the New Madrid seismic zone, Central United
States. PhD Dissertation, University of Maryland, College Park; 1999.
p. 250.
[10] Lunne T, Robertson PK, Powell JJM. Cone penetration testing in
geotechnical practice. New York: Spon Press/Rutledge Publishers;
1997. p. 312.
[11] Mayne PW, Kulhawy FH, Kay JN. Observations on development of
pore water pressures during piezocone penetration. Can Geotech J
1990;27(4):418–28.
[12] Youd TL, Idriss IM. Liquefaction resistance of soils. Summary report
from NCEER/NSF workshops. J Geotech Geoenviron Engng 2001;
127(10):817–33.
[13] Campanella RG, Robertson PK, Gillespie D. Seismic cone penetration
tests. Use of in-situ tests in geotechnical engineering (GSP 6), Reston,
VA: ASCE; 1986. p. 116–30.
[14] Campanella RG, Stewart WP. Seismic cone analysis using digital
signal processing for dynamic site characterization. Can Geotech J
1992;29(3):477–86.
[15] Andrus RD, Stokoe KH. Liquefaction resistance of soils based on
shear wave velocity. J Geotech Geoenviron Engng 2000;126(11):
1015–26.
[16] Robertson PK, Campanella RG, Gillespie D, Grieg J. Use of
piezometer cone data. Use of in-situ tests in geotechnical engineering
(GSP 6), Reston, VA: ASCE; 1986. p. 1263–80.
[17] Robertson PK. Soil classification using the cone penetration test. Can
Geotech J 1990;27(1):151–8.
[18] Hegazy YA, Mayne PW. Delineating geostratigraphy by cluster
analysis of piezocone data. Geotechnical site characterization, vol. 2.
Rotterdam: Balkema; 1998. p. 1069–74.
[19] Seed HB, Idriss IM. Simplified procedure for evaluating soil
liquefaction potential. J Soil Mech Foundations Div, ASCE 1971;
97(9):1249–73.
[20] Robertson PK, Wride CE. Evaluating cyclic liquefaction potential
using the cone penetration test. Can Geotech J 1998;35(3):442–59.
[21] Chen CJ, Juang CH. Calibration of SPT- and CPT-based liquefaction
evaluation methods. Innovations and applications in geotechnical site
characterization (GSP 97), Reston, VA: ASCE; 2000.
[22] Juang CH, Jiang T. Assessing probabilistic methods for liquefaction
potential evaluation. Soil dynamics and liquefaction (GSP 107),
Reston, VA: ASCE; 2000.
[23] Juang CH, Chen CJ, Jiang T. Probabilistic framework for liquefaction
potential by shear wave velocity. J Geotech Geoenviron Engng,
ASCE 2001;127(8):670–8.
[24] Tuttle MP, Sims JD, Dyer-Williams K, Lafferty RH, Schweig ES.
Dating of liquefaction features in the New Madrid seismic zone. US
Nuclear Regulatory Commission, NUREG/GR-0018; 2000. p. 42.
[25] Wolf L, Collier J, Bodin P, Tuttle M, Barstow N, Gomberg J.
Geophysical and geological reconnaissance of seismically induced
sand dikes and related sand blows in the New Madrid seismic zone.
Seismol Res Lett 1996;97(2).
[26] Barnes AA. An interdisciplinary study of earthquake-induced
liquefaction features in the New Madrid seismic zone, central United
States. MS Thesis, Auburn University, Alabama; 2000. p. 266.
[27] Liu HP, Hu Y, Dorman J, Chang TS, Chiu JM. Upper Mississippi
embayment shallow seismic velocities measured in situ. Engng Geol
1997;46:313–30.
Tianfei Liao is a research assistant in the geotechnical engineering
group at Georgia Tech and has performed CPTs throughout the NMSZ.
Paul Mayne is a professor of geotechnical engineering at Georgia Tech
and chair of international committee TC 16 on in situ testing.
Martitia Tuttle is an internationally recognized expert on paleolique-
faction and performs geological mapping and evaluation for the USGS,
NSF, NRC, and other agencies.
Eugene Schweig is a geologist and the Central and Eastern US
Coordinator of the US Geological Survey’s Earthquake Hazard
Program.
Roy Van Arsdale is a geology professor with University of Memphis
and research investigator for USGS, CERI, and MAEC.
T. Liao et al. / Soil Dynamics and Earthquake Engineering 22 (2002) 943–950950