coverage improvement from experimental residence questions
TRANSCRIPT

BUREAU OF THE CENSUS
STATISTICAL RESEARCH DIVISION
RESEARCH REPORT SERIES
No. RR-93/09
COVERAGE IMPROVEMENT FROM EXPERIMENTAL
RESIDENCE QUESTIONS
by
Anne T. Kearney, Roger Tourangeau*,
Gary M. Shapiro, Lawrence R. Ernst
U.S. Bureau of the Census
Statistical Research Division
Washington, D.C. 20233
* National Opinion Research Center
Washington, DC 20036

2
Report Issued: 2/28/94
This series contains research reports, written by or in cooperation with staff members of
the Statistical Research Division, whose content may be of interest to the general
statistical research community. The views reflected in these reports are not necessarily
those of the Census Bureau nor do they necessarily represent Census Bureau statistical
policy or practice. Inquiries may be addressed to the author(s) or the SRD Report
Series Coordinator, Statistical Research Division, Bureau of the Census, Washington,
D.C. 20233.1. Introduction
Survey undercoverage is often thought to be an intractable problem. The surveys conducted
by the Bureau of the Census are widely believed to provide as good or better population
coverage than those carried out by other survey organizations, but its surveys miss high
percentages of people in certain groups. As a result, the Bureau is investigating various
methods to improve the coverage of its household surveys.
Undercoverage occurs in two main forms -- 1) entire households are missed and 2)
individuals are missed in households that are partially covered. Whole-household
undercoverage occurs when a household eligible for interview is excluded from the survey,
typically because the dwelling where the household resides has been omitted from the listing
of addresses for the area. Within-household undercoverage occurs when one or more
members of a sample household are omitted from the household roster.
This paper focuses on within-household undercoverage, which was the major topic of a study
conducted on behalf of the Bureau of the Census by the National Opinion Research Center
(NORC). Funding was provided primarily through the Survey of Income and Program
Participation (SIPP) with additional support by the National Center for Health Statistics. In
brief, the study used 3 questionnaire versions. One was a control version and the other two
used an expanded set of experimental roster questions. One of these experimental versions

3
required full names and the other allowed "anonymous" responses. The most important
findings are that the anonymous questionnaire resulted in a much higher average number of
Black males listed as usual household residents (on the order of 33% higher). There was no
evidence, however, that the expanded roster questions by themselves had any effect.
Brownrigg and Martin (1989), hypothesized the five main behavioral causes for
undercoverage:
• mobility;
• illiteracy and other language problems;
• deliberate concealment;
• irregular household structure or living arrangements;
• resistance as a strategy for dealing with the governmentand other persons from outside the community.
Others consider behavioral as well as operational causes. As Hainer and his coworkers
(Hainer, Hines, Martin, and Shapiro, 1988) put it:
One reason people are missed is motivational. Black (andHispanic) males are deliberately omitted from household rostersbecause of the potential loss of household income if the menwere known to authorities ... A second cause of undercoverage isthe lack of fit between the census definitions of household andresidency, and people’s actual living situations.
A number of variables are related to the degree of survey coverage. For example, coverage
ratios are the survey’s estimations of persons in age-sex-race or Hispanic origin categories
over independent estimates based on the most recent census adjusted for births, deaths,
immigration and emigration. It has been apparent since the Bureau began calculating
coverage ratios that coverage of young Black males is worse than coverage of older Black
males; similarly, young Black males are more likely to be missed than their non-Black

4
counterparts. Coverage of Black females is better than coverage of Black males, but is not as
good as coverage of non-Black females (Shapiro, Diffendal, and Cantor, 1993).
In most surveys, a person is counted as a resident of a particular dwelling if he or she
"usually" lives there. However, it may not be easy to obtain a household roster based on the
criterion of usual residence. Under current Census Bureau definitions, a person’s usual
residence is the dwelling where he or she lives and sleeps most of the time. Some
respondents may find it difficult to apply this standard; for example, it may be unclear
whether to count a person staying in the respondent’s home temporarily. In other cases, the
respondent may be confused about persons in their household who sometimes stay at other
places. People who float between several residences may be included or left off the roster at
the respondent’s discretion. Furthermore, Census Bureau procedures call for individuals with
no usual place of residence who are currently staying in the respondent’s residence to be
included in the final roster in addition to "usual residents," but the household respondents
themselves may often be unaware of this rule.
The Roster Research study carried out by NORC examines situations like this by
experimenting with alternative methods of developing a roster. This study is a follow-up to
two earlier studies. The results of these studies are reported in Shapiro, Diffendal, and Cantor
(1993). In the next section we describe the methodology for this study and provide an
overview of the analysis presented in Section 3 and 4.
2. Methodology
2.1 Sample Design
The sample for the experiment consisted of 644 occupied dwelling units spread across a total
of 49 blocks in three sites--the Chicago and Washington, D.C., metropolitan areas and the
City of Baltimore. The Field Division of the Census Bureau selected and listed blocks that
were predominantly Black and low income. Entire blocks did not have to be listed as long as

5
the listing of each block included at least 40 housing units. (For example, we did not request
a full listing of predominately Black and low income public housing or apartment buildings.)
Twenty-five blocks were selected in the Chicago area, 18 of them located within the city
limits and 7 of them from two nearby suburbs. Fifteen blocks were selected in the
Washington metropolitan area, eight of them within the city limits and the remaining seven
from nearby suburbs. All nine blocks in the Baltimore area were located within the City of
Baltimore. Based on listings of each of the 49 blocks, NORC staff selected 15 housing units
on each block using a systematic selection procedure; of the 735 dwellings selected in this
way, 644 turned out to be occupied and thus eligible for interview.
Interviews were completed at a total of 509 of these dwellings, for a response rate of 79.0%.
NORC interviewers collected information on 1949 individuals in the 509 interviews.
The experiment compared three versions of the questionnaire. The interviewers arranged the
questionnaires in a predetermined random sequence. The interviewers then administered the
questionnaires at each cooperating household in this random order. The interviewing took
place over a four-week period from November to December, 1992.
2.2 Questionnaires
Three versions of the questionnaires were developed, embodying different approaches to
developing a household roster. The first, or standard version of the questionnaire begins with
items drawn directly from the SIPP control card. In Version 1, an initial roster of residents is
compiled based on responses to thestandard roster questions("What are the names of all
persons living or staying here? Have I missed any babies or small children? ... Does
(NAME) usually live here?") and demographic information is collected for each person on the
roster. Next, we ask a series of experimental roster questions intended to identify residents
omitted from the initial roster; these experimental roster questions ask:
• How many people besides those you’ve already listed stayed here last night?
6
• Is there anyone else who stayed at least one night during the past month?
• Is there anyone else who usually stays here but was not here during the lastmonth?
• Is there anyone else who ate here at least once during the last week?
• Is there anyone else who usually eats here but who did not eat here during the lastweek?
• Is there anyone else who you consider to be a member of this household?
• Is there anyone else who considers himself or herself to be a member of thishousehold?
New people identified by the experimental roster questions were then added to the roster.
Once the roster was complete, Version 1 continued with a series of questions intended to
clarify the relation of each person listed to the household. These questions concern a number
of dimensions that respondents may consider in determining whether to count an individual as
a usual resident (Gerber, 1990):
• How many nights did NAME stay here during the last month?
• On how many days did NAME eat here during the last week?
• Does NAME contribute money, food, or other help to this household?
• Do you consider NAME to be a member of this household?
• Was NAME here at all during the last day?
• Does NAME consider himself/herself a member of this household?
• Does NAME usually live here?
• Does NAME have other places where he/she frequently stays?
Thesefollow-up itemsare then followed by a series of items on labor force participation.

7
The other two versions of the questionnaire contain essentially the same items as Version 1
but administer them in a different order. In Version 1, the standard roster questions come
first, then the experimental roster question, and finally the follow-up items; in Versions 2
and 3, the experimental roster questions are administered first, then the follow-up items, and
finally the standard roster questions. (Both the experimental roster questions and the standard
items have been reworded slightly in Versions 2 and 3 to fit their new context.) Like
Version 1, Versions 2 and 3 conclude with the labor force questions. Versions 2 and 3 differ
from each other in only one respect: Version 3 requires respondents to identify household
members by their full names, whereas Version 2 does not; Version 2 allows respondents to
use initials, nicknames, or other means of identifying individuals instead.
2.3 Generalizability of Results and Standard Errors
We took a purposive sample of blocks from three arbitrarily chosen sites (though we did
select equal probability samples of units within each sampled block). We chose to treat this
as a universe equally distributed among the 49 blocks. Thus, the results cannot be properly
generalized to any universe beyond that specified. We therefore computed standard errors
assuming a simple random sample of housing units, which is actually a conservative approach
for the defined universe since an equal number was of sample units selected in each of the 49
blocks ("strata"). If a reader wants to generalize these results to a larger universe, then under
most reasonable models, the standard errors we used underestimate the variability in the
estimates, and it’s possible that some results we claim as being significant would no longer be
so.
2.4 Overview of the Analysis
We analyzed the data from this study to determine which method, on the average, produced
more listed residents. In particular, the analysis considers two issues: 1) Did the experimental
roster questions increase the number of persons rostered relative to the standard SIPP roster
questions? and 2) Did anonymous interviewing (Version 2) increase the number of persons

8
rostered relative to full-name interviewing (Versions 1 and 3)? These issues are discussed
with respect to the total number of people initially rostered (Section 3.1), the total number of
respondents classified as "usual residents" (Section 3.2), and the total number of people on
the final roster under an experimental roster definition (Section 3.3).
We also looked at the effect of experimental roster questions in Version 1 (see Section 3.4)
and we tested models regarding the variables that predict whether a given person listed on the
roster is counted as a usual resident (see Section 3.5).
Finally, we sought to determine which specific questions account for any gains produced by
the experimental versions. For example, does asking about who eats in the household reveal
new usual residents? This issue is discussed in Section 4.
3. Analysis of Data on Rostered Persons
In this section, we compare the number of persons rostered under the three versions of the
questionnaire. There are several ways of doing this. One is to compare the average number
of total persons listed per housing unit across versions. Here we would certainly expect to
get larger averages for the experimental versions since these would include people with casual
connections to a unit, e.g., had a single meal at the household. Another method is to compare
averages of usual residentsacross versions. That is, we only count persons for whom we get
an affirmative answer to the question, "Does NAME usually live here?" (In Version 1, the
persons listed with the standard roster question were asked the question, "Does NAME
usually livehere?" while persons listed with the experimental roster questions were asked,
"Does NAME usually stayhere?") This is a simple way of deciding who we want to count
as belonging to the unit. This serves as a meaningful test of whether the experimental
versions were helpful. A final approach is to compare averages for other more complex
definitionsof who belongs to the housing unit. For reasons we explain in section 3.3, we
expect that reliance only on, "Does NAME usually live here?" will leave out a number of
people who should be included with the sample housing units.

9
Section 3.1 discusses results for total persons, Section 3.2 discusses results for usual residents,
and Section 3.3 for complex definitions. Some of the issues covered in these sections are
explained in more detail in a preliminary report on the project (Tourangeau, 1993). In
summary, as expected, the experimental versions did much better than Version 1 for total
persons. For both the usual residents’ definition and for the complex definitions, the
anonymous version (#2) did better than the other 2 versions for Black males, but all other
comparisons were not significant. Results for the complex definition are similar to the usual
resident definition. But, since there are a number of people under the complex definition who
weren’t defined as clearly meeting the definition or clearly failing to meet it (unlike the usual
resident definition), additional people may belong to the unit but have complex living
arrangements.
The results in the Non-Black Male and Non-Black Female categories do not reveal
noteworthy results. Although in some cases there were significant differences, the very small
numbers make Non-Black Males and Non-Black Females in the sample the analysis very
sensitive to race misclassification error. Therefore, it is very difficult to draw any conclusions
for Non-Black persons.
3.1 Number of Total Persons Rostered
The household rosters under Versions 2 and 3 included more persons on average than those
compiled using the standard items under Version 1. Overall, the average number of persons
listed in the household rosters was 2.90 for Version 1, 3.94 for Version 2, and 3.87 for
Version 3 (see Table 1). Thus, the two experimental versions of the roster questions added
about a person compared to the standard items. This is a highly significant difference; a one-
way analysis of variance yields anF(2,506) of 8.04 (p < .001). (In using the F test here, we
recognize that we are ignoring the lack of normality of the underlying distribution.) A
contrast comparing the Versions 2 and 3 with Version 1 also yields a highly significantt(506)
of 3.99 (p < .001). However, there is no evidence of a difference between Versions 2 and 3.
(In performing tests of individual contrasts, we made no adjustments to compensate for

10
making multiple comparisons. However, because thep value was so low for all the tests that
were significant, undoubtedly the same conclusions would hold even if we made such
adjustments.)

11
TABLE 1. Average Total Persons and Usual Residents Rostered by Version
Version 1(n=173)
Version 2(n=177)
Version 3(n=159)
TotalPersons
UsualResidents
TotalPersons
UsualResidents
TotalPersons
UsualResidents
Total 2.90 2.83 3.94 3.13 3.87 2.99
Black Males
Black Females
1.12
1.48
1.09
1.45
1.80
1.93
1.45
1.60
1.55
1.98
1.18
1.60
Non-Black Males
Non-Black Females
0.16
0.13
0.16
0.13
0.04
0.04
0.02
0.02
0.12
0.06
0.06
0.05
Note: Because of missing data, row entries within a column may not sum to the columntotal. Figures for Version 1 reflect only persons listed using the standard rostering questions.
Both of the experimental versions of the roster questions begin with the question, "How many
people stayed here last night?" This item differs in three obvious ways from the standard
rostering item ("What are the names of all persons living or staying here?"). First, it leaves
less room for confusion. Although difficulties may sometimes arise in determining who spent
the night, on the whole this appears to be an easier standard to understand and apply than
who lives or stays at the residence. For example, temporary residents may be easy to classify
by the stayed-last-night test but difficult to classify by the lives-or-stays test. Second, the
rostering items in the experimental versions may be seen as less threatening than those in the
standard versions, because they do not begin by asking for names. Finally, the initial
rostering items in the experimental versions invite respondents to cast a broad net; only later
do questions become more stringent as they seek to determine which of the persons listed are
usual residents of the dwelling. The standard questionnaire begins with a more stringent
criteria. This approach appears to net fewer persons.

12
The differences apparent for all persons listed are also apparent for both Black males and
females. The rosters compiled under Versions 2 and 3 included more Black males than those
compiled using the standard questions in Version 1. The mean number of Black males listed
was 1.80 per household under Version 2, 1.55 under Version 3, and 1.12 under Version 1.
Thus, Version 2 increased the number of Black males rostered per household by more than
60% relative to Version 1; the increase for Version 3 as compared to Version 1 was about
38%. The differences across versions are highly significant--F(2,506) of 7.88 (p < .001). A
contrast comparing Versions 2 and 3 with Version 1 also yields a highly significantt of 3.68
(p < .001), as does a contrast of Version 2 with Version 1 (t of 3.92,p < .001). A contrast
between Version 3 and Version 1 is also significant with at of 2.46 (p < .01). However,
there is no evidence of differences between versions 2 and 3.
Similar differences are apparent for Black females, where the means are 1.93 for Version 2,
1.98 for Version 3, and 1.48 for Version 1. The overall differences in the average number of
Black females listed per household are highly significant--F(2,506) of 5.19 (p < .01)--and the
contrast comparing Versions 2 and 3 with Version 1 is also highly significant (t=3.22,
p < .005). However, there is no evidence of differences between Versions 2 and 3.
3.2 Number of Usual Residents Rostered
All three versions of the questionnaire contain an item to distinguish usual residents from
others on the roster who are not household members. In each version, respondents were
asked, "Does NAME usually live here?" about each person on the roster. Those for whom
the answer was positive are considered usual residents. In Version 1, those who have no
usual residence elsewhere also meet the standard SIPP criteria.
Overall, there is no evidence of differences among the three versions. However, if we
examine the means for Black males--a group with a particularly high level of undercoverage--
there are some significant differences that do emerge. Version 2 had the highest mean
number of Black male usual residents, 1.45 per household; the corresponding figures for

13
Versions 1 and 3 are 1.09 and 1.18, respectively. Version 2 yields an increase of 33% in the
number of Black males relative to Version 1. Across all three versions, the differences in the
mean number of Black male usual residents is significant--F(2,506)=3.93 (p < .05). A
contrast comparing Version 2 (which did not require full names to be used) with the other
two versions (both of which did require full names) is also highly significant--t(506)=2.72
(p < .001). Thus, anonymous interviewing appears to substantially increase the number of
Black males reported as usual residents. However, there is no evidence that the experimental
roster questions had any effect.
The differences across versions in the number of usual residents reported did not extend to
Black females. The means are 1.45, 1.60, and 1.60 for the three versions (see Table 1); an
analysis of variance confirms that these are not significant differences--F(2,506) < 1.
The highly significant difference between Version 2 and the other two versions of the
questionnaire in the number of Black males reported as usual residents strongly suggests that
underreporting of Black males is the result of concealment rather than confusion; the only
difference between Versions 2 and 3 is that Version 2 does not require full names.
3.3 Complex Definitions for Residences
This section explores other definitions for the usual residents of a housing unit. We do not
expect the "usual resident" question to be the best way to determine which people belong to
the household for several reasons: 1) We expected that our broad-based coverage questions
may pull in people who we would regard as usual residents, but are not so considered by
respondents; 2) we also expect that respondents may be unwilling to acknowledge some
people as usual residents but will give us honest answers to other questions by which we can
classify them as belonging to the unit, 3) and we also expect the experimental roster questions
to net some people who have no usual place of residence and who therefore are not identified
as usual residents by the respondent but should be included in the final roster because they
are currently staying at the unit.
14
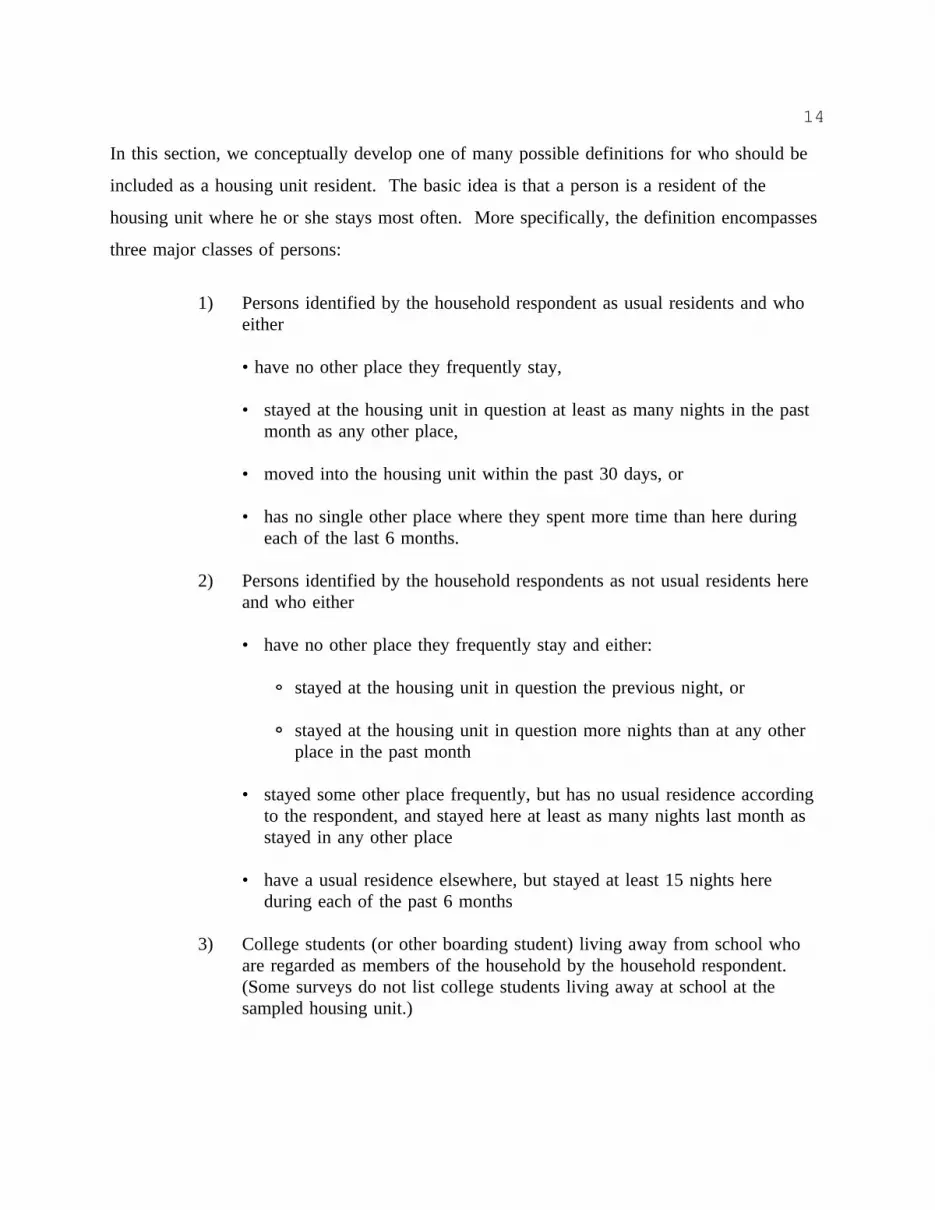
In this section, we conceptually develop one of many possible definitions for who should be
included as a housing unit resident. The basic idea is that a person is a resident of the
housing unit where he or she stays most often. More specifically, the definition encompasses
three major classes of persons:
1) Persons identified by the household respondent as usual residents and whoeither
• have no other place they frequently stay,
• stayed at the housing unit in question at least as many nights in the pastmonth as any other place,
• moved into the housing unit within the past 30 days, or
• has no single other place where they spent more time than here duringeach of the last 6 months.
2) Persons identified by the household respondents as not usual residents hereand who either
• have no other place they frequently stay and either:
stayed at the housing unit in question the previous night, or
stayed at the housing unit in question more nights than at any otherplace in the past month
• stayed some other place frequently, but has no usual residence accordingto the respondent, and stayed here at least as many nights last month asstayed in any other place
• have a usual residence elsewhere, but stayed at least 15 nights hereduring each of the past 6 months
3) College students (or other boarding student) living away from school whoare regarded as members of the household by the household respondent.(Some surveys do not list college students living away at school at thesampled housing unit.)

15
The questionnaires did not include all the items needed to classify every person in the sample
under this alternative definition. For example, none of the versions contain items asking
when each person moved in; moreover, none of the versions attempted to gather information
about the number of nights persons stayed at other households or if the other households were
their usual residence. Therefore, it was impossible for us to classify some of the persons
rostered as clearly meeting the definition or clearly failing to meet it. Results from the
Living Situation Survey (Schwede, 1993) may help us determine whether or not people whose
living arrangements we are currently uncertain about would meet the complex definition.
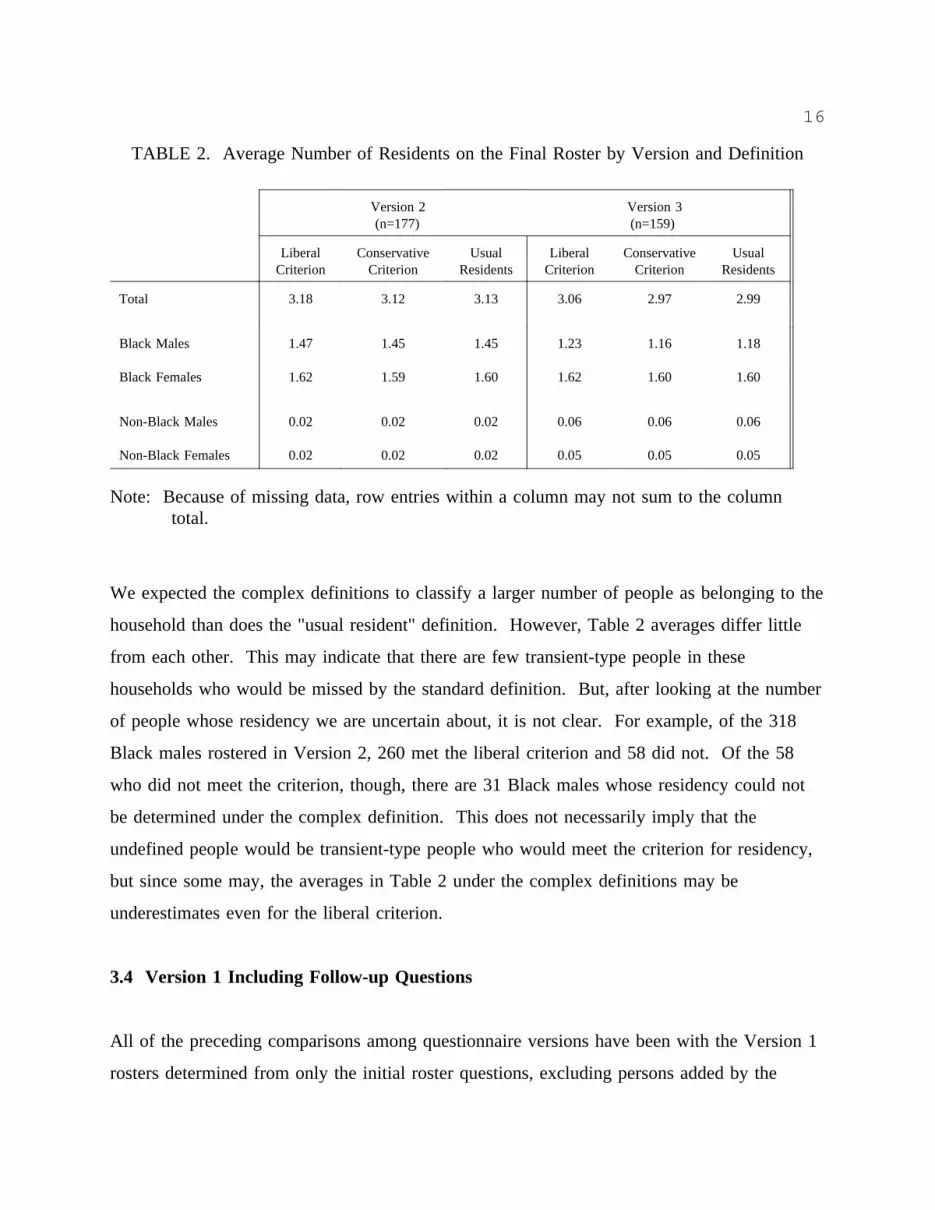
Table 2 shows the mean number of persons per household who met the definition above. The
"conservative" column includes persons who definitely met the criteria; the "liberal" column
includes persons who met the definition under the conservative criterion and all persons who
either were not usual residents of the sample unit and had no other place where they
frequently stayed or were usual residents of the sample unit but had another place where they
frequently stayed. The "usual residents" column includes persons with an affirmative answer
to the question, "Does NAME usually live here?"
Version 1 could not be classified under the complex definitions because we do not have
enough information on the persons rostered with the standard roster question (What are the
names of all persons living or staying here?). That is, for some cases in the complex
definition we need to know if a person stayed in the unit last night. In Versions 2 and 3, we
get this information from the first roster question, "How many people stayed here last night?",
by recording the roster-question number with their names. In Version 1, however, this
question isn’t asked until after the standard roster question, so we can’t determine if any of
the people from the standard question stayed last night.
16
TABLE 2. Average Number of Residents on the Final Roster by Version and Definition
Version 2 Version 3(n=177) (n=159)
LiberalCriterion
ConservativeCriterion
UsualResidents
LiberalCriterion
ConservativeCriterion
UsualResidents
Total 3.18 3.12 3.13 3.06 2.97 2.99
Black Males
Black Females
1.47
1.62
1.45
1.59
1.45
1.60
1.23
1.62
1.16
1.60
1.18
1.60
Non-Black Males
Non-Black Females
0.02
0.02
0.02
0.02
0.02
0.02
0.06
0.05
0.06
0.05
0.06
0.05
Note: Because of missing data, row entries within a column may not sum to the columntotal.
We expected the complex definitions to classify a larger number of people as belonging to the
household than does the "usual resident" definition. However, Table 2 averages differ little
from each other. This may indicate that there are few transient-type people in these
households who would be missed by the standard definition. But, after looking at the number
of people whose residency we are uncertain about, it is not clear. For example, of the 318
Black males rostered in Version 2, 260 met the liberal criterion and 58 did not. Of the 58
who did not meet the criterion, though, there are 31 Black males whose residency could not
be determined under the complex definition. This does not necessarily imply that the
undefined people would be transient-type people who would meet the criterion for residency,
but since some may, the averages in Table 2 under the complex definitions may be
underestimates even for the liberal criterion.
3.4 Version 1 Including Follow-up Questions
All of the preceding comparisons among questionnaire versions have been with the Version 1
rosters determined from only the initial roster questions, excluding persons added by the

17
follow-up questions. Thus, we compared the broader experimental roster questions
(Versions 2 and 3) to the standard questions (Version 1). Version 1 included the same
questions as Version 3, only the ordering of questions differed. Table 3 compares data for
Black males for these two versions, both for total persons and for usual residents. For neither
group is there a statistically significant difference. Since the numerical difference and the
standard errors are rather large for total persons, it is of course possible that the question
ordering in Version 1 results in fewer reported persons.
TABLE 3. Average Total Persons and Usual Residents"FULL" Version 1 vs Version 3
"FULL" Version 1(n=173)
Version 3(n=159)
Total Persons UsualResidents
Total Persons UsualResidents
Black Males 1.36 1.11 1.55 1.18
3.5 Models for Predicting Usual Residents
Altogether, the household rosters listed 1,939 persons for whom it was possible to determine
if they were usual residents. 1,526 of these people were identified by the household
informant as usually living at the dwelling. (For another 10 persons, the usual residence
variable was missing.) This section explores criteria that household respondents may have
used in making this judgment; it examines answers to the question, "Does NAME usually live
here" as a function of responses to the six follow-up items (i.e., How many nights did NAME
stay here during the last month?, On how many days did NAME eat here during the last
week?, Does NAME consider himself/herself a member of this household?, Does NAME
have other places where he/she frequently stays?, Does NAME contribute money, food, or
other help to this household?, and Was NAME here at all during the last day?). We fit

18
logistic regression models to the data to determine which of the follow-up items were
significantly related to responses to the usual residency item.
We tested an additive model that included all six follow-up items as predictors, as well as
main effect terms for the sex and age of the person. (Analyses of the data separately by
version yielded results similar to those given in the combined analysis; as a result, we present
only the latter here. This analysis includesall persons rostered under Version 1, including
those first reported in response to the special probes administered after the standard roster
questions.)
Four variables emerged from this analysis as significant predictors of whether the household
respondent classified a person as a usual resident--the number of nights the person had stayed
in the last month (the logistic regression coefficient for this variable was 0.21, with a standard
error of 0.03), whether the person contributed money or other help to the household (logistic
regression coefficient of 2.70, with a standard error of 0.69), whether the person had other
places where he or she stayed frequently (logistic regression coefficient of -2.37, with a
standard error of 0.59), and whether the person considered himself or herself a member of the
household (logistic regression coefficient of 6.68, with a standard error of 1.23).
Across all three versions of the questionnaire, people who spend the night at the dwelling
more often, who had no other place they frequently stayed, who contributed money or other
support to the household, and who considered themselves household members were more
likely to be labelled as usually living at the sample dwelling than their counterparts who slept
there less often, frequently stayed elsewhere, did not contribute money, or did not consider
themselves household members. Table 4 shows the percentage of persons identified as usual
residents by version and by each of the significant predictors in the logistic regression model.
Note in particular the very high correlation for "considers self a member."

19
TABLE 4. Percentage of Persons Rostered Labelled Usual Residents,by Selected Characteristics
Variable Values % Usual Residents n
Total 83.8 1939
Version Version 1
Versions 2 and 3
79.2
78.6
629
1310
Contributes
Money?
Yes
No
98.0
61.5
1008
905
Considers Self a
Member?
Yes
No
94.7
1.8
1605
331
Stays Often at
Other Places?
Yes
No
13.3
97.8
437
1475
Nights Stayed in
Last Month
6 nights or fewer
7-29
30 or more
6.8
79.2
99.5
368
109
1400
Note: Because of missing data, row entries sum to different totals.
4. Performance of the Roster Questions
This section evaluates the performance of the experimental roster questions in Versions 2
and 3. Table 5 examines the consistency between the household respondents’ answers to the
roster questions and their answers to the quantitative follow-up questions. A major purpose
for this analysis is to determine if there are a substantial number of individuals who are added

20
to the initial roster by the later rostering questions. We are particularly interested in the
people added by later roster items who should have been brought in earlier, (e.g. the
household respondent mentions a person for the first time on the "eating" question, but later
states that this person stayed at the unit 13 nights during the last month). We also discuss
which roster questions are most effective for future roster research in terms of bringing in
individuals who are retained on the final roster.
4.1 Examination of the On-diagonal and Off-diagonal Entries
In Table 5, the rows represent the roster questions and the columns represent the quantitative-
follow-up questions. The questions in the first four columns correspond to those in the first
four rows. See Section 2.2. The row questions appear in the first set of bullets, and the
column questions appear in the second set of bullets.
Note that the first two roster questions (How many people stayed here last night? How many
other people stayed here at least one night during the last month?) have been combined in the
first row because they correspond to a positive number answer to the Column 1 question
(How many nights did NAME stay here during the last month?). The questions listed in
Rows 5 and 6 of the table do not correspond to any column question. Consequently, the
questions in Section 2.2 have been reordered in the table to put these two questions last.
Rows 7 and 8 are for records with roster-question numbers that are meaningless or missing,
respectively.
Each individual is tabulated in the row corresponding to the question that brought him/her
into the roster. The column corresponds to the first quantitative-information question for
which the answer was a positive number or yes. For example, if the answers to the Column
1 and 2 questions were 0 and 5, respectively, for an individual, that individual would be
tallied in Column 2, irrespective of their answers to the Column 3 and 4 questions. An
individual is listed in Column 5 if the answers to the Column 1-4 questions were all either
zero or no. The last column lists all individuals who could not be classified in a preceding

21
column due to missing information. For example, missing information on the number of
nights in the household would make it impossible to place the record in a following column
since it’s unclear if the person actually spent any nights in the residence.
The top number in each cell is the number of people who met the criteria of that cell. The
number below it in parenthesis is the number of people who both met the criteria and are
considered usual residents by the respondent.
We first discuss here the top numbers in the cells formed by Rows 1-4 and Columns 1-5.
When there is consistency between the roster question and the quantitative information, the
entry falls on the diagonal. Inconsistencies fall off the diagonal. Column 5 entries are
inconsistent and considered above the diagonal.
For example, if a person comes onto the roster with the member question (Row 3) then, for
consistency, their first attachment to the household should be "Considered a Member"
(Column 3).

Tab
le5.
Ros
ter
Que
stio
nsB
yQ
uant
itativ
eF
ollo
w-U
pQ
uest
ions
for
Ver
sion
2an
dV
ersi
on3
Qua
ntita
tive
Fol
low
-Up
Que
stio
ns
Ros
ter
Que
stio
nsT
otal
Nig
hts
Sta
yed
>0
Day
sA
te>
0C
onsi
dere
da
Mem
ber
Con
side
rsS
elf
Mem
ber
All
Ent
ries
Zer
oor
No
Pro
blem
with
Bla
nks
Tot
al13
14(1
030)
1134
(101
3)96 (1
)29 (3
)3 (1)
24 (0)
28 (12)
Sta
yed
Last
Nig
ht/M
onth
1051
(957
)10
27(9
46)
5 (1)
3 (1)
1 (1)
3 (0)
12 (8)
Ate
Thi
sW
eek
127
(5)
32 (5)
68 (0)
4 (0)
013 (0
)10 (0
)
Mem
ber
Who
May
Be
Aw
ay28 (5
)9 (4)
7 (0)
10 (1)
1 (0)
1 (0)
0
Con
side
rsS
elf
Mem
ber
1 (0)
00
1 (0)
00
0
Usu
ally
Sta
ysB
utA
way
11 (5)
3 (2)
03 (1)
1 (0)
1 (0)
3 (2)
Usu
ally
Eat
s,N
otT
his
Wee
k34 (1
)6 (1)
16 (0)
7 (0)
05 (0)
0
Oth
er8 (7)
8 (8)
00
00
0
Mis
sing
54 (50)
49 (48)
01 (0)
01 (0)
3 (2)
Not
e:T
heto
pnu
mbe
rin
each
cell
isth
enu
mbe
rof
peop
lew
hom
etth
ecr
iteria
ofth
atce
ll.T
henu
mbe
rbe
low
itin
pare
nthe
sis
isth
enu
mbe
rof
peop
lew
hom
etth
ecr
iteria
and
are
cons
ider
edus
ualr
esid
ents
.

23
This is because the interviewer already asked the household respondent to list all the people who
stayed in the house during the month, and list everyone else who ate in the house during the
week. So, when we ask the quantitative questions, "How many nights did NAME stay here
during the last month?" and "How many days did NAME eat here at least once during the last
week?", we expect the answers to be zero. And we expect the answer to, "Do you consider
NAME to be a member of this household?" to be yes.
Overall, 93 percent (1105/1185) of the entries are on the diagonal. The people rostered with the
staying questions are 98 percent on the diagonal. The people rostered with the eating and member
questions are 54 and 36 percent on the diagonal, respectively.
Few entries (31) fall above the diagonal. The phrasing of the roster questions is slightly different
from the phrasing of the quantitative information questions, and may have prompted different
answers from the respondent, resulting in some of the above-diagonal entries (and also some of
the below-diagonal entries). For example, the roster question, "Is there anyone else who has eaten
here at least once during the last week?" corresponds to the quantitative question, "How many
days did NAME eat here at least once during the last week?"
Above the diagonal entries could also be the result of a household respondent who initially
admitted the attachment of a person to the household by adding them to the roster and then
minimized the attachment as the interview progressed into the quantitative questions. A possible
example of this situation is the 13 people rostered with the eating question who did not fit any
quantitative category (Row 2, Column 5). Ten of the 13 come from only two households. None
of the 13 people are usual residents of the households in which they are listed, and 12 have
another place where they frequently stay. The other attachments these people have to the
household are minimal. Since the interviewing period included the Thanksgiving holiday for a
few sample units, many of these people may have only been visiting for the holiday or were only
dinner guests. As the interviewing progressed, the respondents in these households may have
concluded that either further information was not wanted or should not be provided for these
people.

24
There were 49 below-diagonal entries. Of these 49 people, 41 stayed at least one night in the
residence. Thus, the eating and household membership questions may have reminded respondents,
in some cases, of other people who had also stayed there. In other cases, these questions may
have brought in people that the respondent purposely avoided mentioning when asked who stayed
in the house. Then, as the roster-building questions focused on eating or household membership
questions, they were willing to add other people to the roster. Later, the respondent admitted
greater attachments by revealing quantitative information about people on the roster who they
avoided in the early roster-building questions. Whether the respondent inadvertently or purposely
did not initially list these people as staying in the house, this makes asking the later roster
questions especially useful. That is, the additional experimental-roster questions served as probes,
and were used both to roster people with the attachment stated in the question and to roster people
who were missed by an earlier roster question(s), particularly the staying questions which should
be most closely related to inclusion in the final household roster.
The roster questions in Rows 5 and 6, regarding staying and eating in the household, cannot be on
the diagonal. This is because the quantitative questions regarding staying and eating in the
household refer to the last month and week, respectively, while the roster questions refer to prior
time periods. Because of the difference in reference period, the people rostered with these
questions should have an answer of zero to the quantitative questions. Since not every entry was
zero, some entries could be considered below the diagonal in the sense that they should have been
added to the roster by an earlier roster question. Of the 45 people rostered with these questions,
25 can be considered below the diagonal. Nine of the 25 stayed one or more nights in the house.
4.2 Usual Residents
The key purpose in asking a set of questions to build an initial roster is to obtain as complete a
final roster as possible. In this subsection, we consider the impact of each of the rostering
questions on the final roster. For purposes of this discussion, a person is defined to be on the
final roster if and only if the person is considered by the respondent to be a usual resident. The
discussion on usual residents in this section focuses on the row-total cells in all eight rows of

25
Table 5, and the results are at least partially dependent on the order in which the rostering
questions were asked.
Across all roster questions, 78 percent (1030/1314) of the people listed are usual residents. The
roster questions about people who stayed last month at the dwelling (Row 1) or usually stay
(Row 5) in the household bring in 93 percent (962/1030) of the usual residents. The roster
questions about people who ate last week (Row 2) or usually eat (Row 6) in the household added
only 1 percent (6/1030) of the usual residents, and the household membership questions (Rows 3
and 4) bring in fewer than 1 percent (5/1030).
Five percent (50/1030) of the usual residents cannot be tied to a specific roster question because
of missing information (Row 8). Forty-eight of these 50 people stayed in the households every
night of the month. The household respondents consider all of them members of the household
(with one exception for whom that information is missing). All 50 have no other place where
they frequently stay. Probably all 50 fit into the "Stayed Last Night/Month" category, a
reallocation which would raise the percentage of usual residents who are in Rows 1 and 5, from
93 percent to 98 percent.
We also note that while 91 percent (962/1062) of the people rostered by the staying questions
(Rows 1 and 5) were considered to be usual residents by the respondents, only 6 percent (11/190)
rostered by the eating or membership questions (Rows 2, 3, 4, and 6) were considered usual
residents. Furthermore, of the 11 usual residents in the latter group, 10 were listed as staying at
least one night last month in the quantitative information section. Thus, respondents clearly
equate usual residence with at least some period of staying in the residence.
4.3 Roster Questions that Worked and Didn’t Work
This section addresses the question: which roster-questions work the best? The staying questions
clearly worked. Of the 1051 people listed with these questions, 91 percent were usual residents,
who account for as many as 98 percent of all usual residents listed. This is not to ignore that the

26
first question asked would probably list the majority of usual residents anyway or the possibility
that another question asked first may have worked even better.
The eating questions, asked after the staying questions, rostered 161 extra people, but only 6 of
these were usual residents. The member question, asked after the eating questions, rostered 28
extra people and 5 of these were usual residents. We expected the eating question to bring in
more people overall than the member question because it’s broader and it’s asked sooner. The
eating question didn’t, however, bring in many usual residents. If we pursue the eating question
further, we will probably ask about only those people who ate in the house more than two days.
This approach may eliminate those people with very little attachment to the house, such as dinner
guests.
The eating questions may improve coverage for another reason. These questions may capture
those people who stayed some nights in the residence (Row 2, Column 1), but are not considered
usual residents, though they have no other place where they frequently stay. When these
conditions are met, we may want to roster them at this house because we wouldn’t capture them
in any other. Homeless people who spend some time with a relative are an example of this.
The roster question, "Is there anyone else who considers himself or herself a member of this
household?" added only one person overall, and this person wasn’t a usual resident. Most likely
this roster question won’t be used in follow-up studies.
5. Conclusions
Comparisons between questionnaire Version 2 and Version 1 showed about a 33% increase in
average number of Black males per housing unit for Version 2 in the respondent-classified usual
resident definitions of household belonging. This indicates considerable promise for improved
coverage of Black males by permitting anonymity in survey interviews. There was no evidence,
however, that the broader set of roster questions increased the average number of usual residents
reported, though it did increase the total number of people reported with at least casual household
27
associations. Since Version 2 had the broad set of questions as well as the anonymity feature, we
cannot be sure that anonymity by itself would achieve significant coverage gains.
There were a number of people in the sample who may have complex living arrangements. This
is indicated by a substantial group who did not unequivocally belong to the unit nor obviously not
belong. It is possible that many people of this type who were added through the broad set of
roster questions met the criteria of our complex definition of belonging to the unit, but
unfortunately we did not ask for sufficient information to classify them. For example, it may be
that many of the people who frequently stay elsewhere spend more nights at this unit than at other
units, but we could not ascertain if this was true. Or, perhaps people of this type have a usual
residence elsewhere, and therefore don’t belong to the household. Results from the Living
Situation Survey may help determine whether there are a substantial number of people who meet
this or other complex definitions of household belonging but are not considered usual residents by
the household respondent. This research survey is now being conducted by Research Triangle
Institute for the Census Bureau (Schwede, 1993).
Another finding in this paper is that answers to several questions are good predictors for usual
resident: persons who contribute money, consider themselves a member, do not stay often at
other places, and stayed many nights in the last month. Of the experimental roster questions we
asked, the eating question seemed to be least effective - a fairly large number of people were
added to the roster by this question, but very few of them appeared to really belong to the unit. If
we ask this question in future research, it would only be with some threshold on the minimum
number of days of eating in the residence.
We are planning additional testing for some type of anonymity in Census Bureau surveys. There
are of course, difficulties when full name is not collected, especially in longitudinal surveys like
Survey of Income and Program Participation which follows movers. We will have to weigh these
difficulties against the potential gains of improved coverage. At this point, the potential is high.
We would also like to conduct more testing of expanded roster questions. We will focus on

28
asking questions that can classify people with complex living arrangements under complex
definitions of household belonging.
6. Acknowledgements
We thank Randall J. Parmer, Michael J. Roebuck, and Lynn Weidman of the Census Bureau for
their useful comments. All errors and opinions, however, are solely the authors. We would also
like to thank Carol Macauley for her typing of this paper.
The design of this study grew out of a meeting held at NORC’s offices in Chicago. The
participants at that meeting were Gary Shapiro, Leslie Brownrigg, and Laurie Schwede of the U.S.
Bureau of the Census; Roger Tourangeau, Kenneth Rasinski, and Richard Kulka of NORC;
Seymour Sudman and Diane O’Rourke of the Survey Research Laboratory; and Peter Hainer of
Curry College

29
REFERENCES
Brownrigg, L., and Martin, E. (1993), "Proposed Study Plan for EthnographicEvaluation of the Behavioral Causes of Undercount." Paper prepared for the CensusAdvisory Committee of the American Statistical Association and the Census AdvisoryCommittee on Population Statistics on Population Statistics at the Joint AdvisoryCommittee Meeting, April 13-14, Alexandria, VA.
Gerber E.R., (1990), Calculating residence: A cognitive approach to household membershipjudgements among low income blacks. Unpublished report submitted to the U.S. Bureauof the Census.
Hainer, P., Hines, C., Martin, E., and Shapiro, G. (1988), "Research onImproving Coverage in Household Surveys," inProceedings of the Fourth AnnualResearch Conference, Washington, DC: U.S. Bureau of the Census, pp 513-539.
Schwede (1993), "An Experimental Test of Residence Rules: The Living Situation Survey," inProceedings of the Survey Research Methods Section of the Annual Meeting of theAmerican Statistical Association(forthcoming).
Shapiro, G., Diffendal, G., and Cantor, D. (1993). "Survey Undercoverage:Major Causes and New Estimates of Magnitude," inProceedings of the 1993 AnnualResearch Conference, Washington, DC: U.S. Bureau of the Census (forthcoming).
Tourangeau, R. (1993), Final Report: SIPP Roster Questions. Unpublished report submitted toGary Shapiro, U.S. Bureau of the Census.