coupled oceanic-atmospheric variability and u.s. streamflow
TRANSCRIPT

Coupled oceanic-atmospheric variability and U.S. streamflow
Glenn A. Tootle
Department of Civil and Architectural Engineering, University of Wyoming, Laramie, Wyoming, USA
Thomas C. Piechota
Department of Civil and Environmental Engineering, University of Nevada, Las Vegas, Nevada, USA
Ashok Singh
Department of Mathematical Sciences, University of Nevada, Las Vegas, Nevada, USA
Received 22 June 2005; revised 5 August 2005; accepted 23 September 2005; published 6 December 2005.
[1] A study of the influence of interdecadal, decadal, and interannual oceanic-atmospheric influences on streamflow in the United States is presented. Unimpairedstreamflow was identified for 639 stations in the United States for the period 1951–2002.The phases (cold/negative or warm/positive) of Pacific Ocean (El Nino–SouthernOscillation (ENSO) and Pacific Decadal Oscillation (PDO)) and Atlantic Ocean (AtlanticMultidecadal Oscillation (AMO) and North Atlantic Oscillation (NAO)) oceanic-atmospheric influences were identified for the year prior to the streamflow year (i.e., longlead time). Statistical significance testing of streamflow, based on the interdecadal,decadal, and interannual oceanic-atmospheric phase (warm/positive or cold/negative), wasperformed by applying the nonparametric rank-sum test. The results show that in additionto the well-established ENSO signal the PDO, AMO, and NAO influence streamflowvariability in the United States. The warm phase of the PDO is associated with increasedstreamflow in the central and southwest United States, while the warm phase of theAMO is associated with reduced streamflow in these regions. The positive phase of theNAO and the cold phase of the AMO are associated with increased streamflow in thecentral United States. Additionally, the coupled effects of the oceanic-atmosphericinfluences were evaluated on the basis of the long-term phase (cold/negative or warm/positive) of the interdecadal (PDO and AMO) and decadal (NAO) influences and ENSO.Streamflow regions in the United States were identified that respond to these climaticcouplings. The results show that the AMO may influence La Nina impacts in theSoutheast, while the NAO may influence La Nina impacts in the Midwest. By utilizing thestreamflow water year and the long lead time for the oceanic-atmospheric variables, usefulinformation can be provided to streamflow forecasters and water managers.
Citation: Tootle, G. A., T. C. Piechota, and A. Singh (2005), Coupled oceanic-atmospheric variability and U.S. streamflow, Water
Resour. Res., 41, W12408, doi:10.1029/2005WR004381.
1. Introduction
[2] There is an increasing awareness that the oceanic-atmospheric variability occurs on interannual, decadal andinterdecadal timescales. Furthermore, recent studies haveshown the influence of coupled oceanic-atmospheric vari-ability on climate of regions around the world. Informationgathered from such studies could be utilized in long leadtime forecasts of streamflow. The study presented hereinvestigates continental U.S. streamflow response to thecoupled influences of four oceanic-atmospheric modes ofvariability: El Nino – Southern Oscillation (ENSO),the Pacific Decadal Oscillation (PDO), the AtlanticMultidecadal Oscillation (AMO), and the North AtlanticOscillation (NAO).
[3] ENSO refers to the interaction of the periodic large-scale warming or cooling of the central eastern equatorialPacific Ocean with the Southern Oscillation, a large-scaleatmospheric pressure pattern across the tropical Pacific. Thewarm phase of ENSO is referred to as El Nino and the coolphase is referred to as La Nina [Philander, 1990] with aperiodicity of two (2) to seven (7) years. The PDO is aoceanic-atmospheric phenomena associated with persistent,bimodal climate patterns in the northern Pacific Ocean(poleward of 20� north) that oscillate with a characteristicperiod on the order of 50 years (a particular phase of thePDO will typically persist for about 25 years) [Mantua etal., 1997; Mantua and Hare, 2002]. The Atlantic Multi-decadal Oscillation (AMO) is defined as the leading modeof low-frequency, North Atlantic Ocean (0�–70�) seasurface temperature (SST) variability with a periodicity of65–80 years [Kerr, 2000; Gray et al., 2004]. The NorthAtlantic Oscillation (NAO) is associated with a meridionaloscillation in atmospheric mass between Iceland and the
Copyright 2005 by the American Geophysical Union.0043-1397/05/2005WR004381$09.00
W12408
WATER RESOURCES RESEARCH, VOL. 41, W12408, doi:10.1029/2005WR004381, 2005
1 of 11

Azores [Hurrell and Van Loon, 1995]. The NAO hasdisplayed quasi-biennial and quasi-decadal behavior sincethe late 1800s [Hurrell and Van Loon, 1995] and itsbehavior is generally referred to as decadal. Similar toENSO, the PDO, AMO and NAO have cold/negative andwarm/positive phases.[4] Recent research has focused on the coupling of the
interannual ENSO phenomenon with PDO, AMO andNAO. Gershunov and Barnett [1998] evaluated the PDO’sinfluence on ENSO for sea level pressures and heavy dailyprecipitation in the continental United States. El Nino (LaNina) signals were found to be strong and stable during thewarm (cold) PDO phase. Harshburger et al. [2002] deter-mined that the largest departures for Idaho spring stream-flow occurred during the La Nina/PDO cold phase. This isconsistent with the findings of Gershunov and Barnett[1998] that ENSO (El Nino or La Nina) is strongest duringthe similar PDO (warm or cold) phase. In forecastingColumbia River streamflow, Hamlet and Lettenmaier[1999] defined six climate categories for ENSO (warm,cold or neutral) and PDO (warm or cold). The utilization ofthe climate categories significantly improved long lead timeforecasts. Also in the Pacific Northwest, Beebee and Manga[2004] found significant relationships between seasonalstreamflow and, both ENSO and PDO. Pizarro and Lall[2002], when evaluating flood potential in the westernUnited States using partial correlation, identified coupledPDO-ENSO regions in the Pacific Northwest, upper Colo-rado River basin and Southwest.[5] Rajagopalan et al. [2000] examined the coupled
effects of ENSO, PDO, and the NAO on summer seasonPalmer drought severity index (PDSI) values for the UnitedStates and determined that PDO (or NAO) does not enhance(or dampen) ENSO’s effect on PDSI for the seasons (andperiod of record) evaluated. Hidalgo and Dracup [2001,2003] evaluated spring-summer streamflow and rainfall inthe upper Colorado River basin, considering the influenceof ENSO and PDO and acknowledged a possible ENSO –PDO modulation of cold season precipitation in thenorthern Rocky Mountains and the upper Colorado Riverbasin appears to be strongly influenced by the AMO.McCabe et al. [2004] attributed more than 50% of theUnited States spatial and temporal variance in multidecadaldrought frequency to the PDO and AMO. The largestdrought in the past 250 years (based on tree ring recon-structions) in the Yellowstone basin occurred during anAMO warm–PDO warm cycle [Hidalgo, 2004]. In evalu-ating the AMO’s impact on rainfall, Enfield et al. [2001]determined that the majority of the United States has lessthan normal rainfall during the AMO warm phase. Rogersand Coleman [2003] evaluated interactions between theAMO, ENSO, the Pacific North American (PNA) tele-connection pattern and streamflow in the United States.The streamflow response to the shift in phase of the AMOwas apparent in the upper Mississippi River basin, thenorthern Rocky Mountain region, and upper Colorado Riverbasin [Rogers and Coleman, 2003].[6] The goal of the research presented here was to
improve the understanding of how large-scale interannualand interdecadal ocean-atmosphere phenomena (both indi-vidually and coupled) influence hydrologic variability in thecontinental United States. Much of the prior research has
focused on specific regions of the United States and certainphenomenon; however, the comprehensive investigation oflarge regions (i.e., the entire continental United States) isimportant since it is expected that the large-scale oceanatmosphere phenomena (i.e., ENSO, PDO, AMO, andNAO) may influence hydrology at a large scale. Further-more, an updated continental U.S. streamflow data set wasdeveloped. This is important since the study of interdecadalinfluences requires an extended period of record. To attainthe research goal, nonparametric testing was utilized toevaluate the large-scale response of U.S. streamflow tothe phase of PDO, AMO, NAO, and ENSO. Additionally,the coupled response of PDO, AMO, or NAO with ENSOwas evaluated to determine if there was any influence ofhydrologic variability in regions impacted by ENSO.
2. Data
[7] The major data sets used to develop the relationshipsbetween oceanic-atmospheric variability and streamflowvariability are unimpaired streamflow data for the UnitedStates and oceanic-atmospheric data for the Pacific andAtlantic Oceans.
2.1. Streamflow Data
[8] Unimpaired streamflow stations for the United Stateswere identified from Wallis et al. [1991]. This data setconsists of average monthly streamflow for 1,009 unim-paired stations from 1948 to 1988. This data set wasupdated by obtaining current streamflow data from theU.S. Geological Survey (USGS) NWISWeb Data retrieval(http://waterdata.usgs.gov/nwis/). The revised data set con-sists of average monthly streamflow for 639 unimpairedstations from 1951 to 2002 (Figure 1). The reduction of 370(1009 minus 639) unimpaired streamflow stations was aresult of the data not being updated on the USGS websiteand missing data. A review of the USGS NWISWebresulted in 172 stations not having updated data, 184stations missing a year (or multiple years) of data and 14stations missing both updated and a year (or multiple years)of data. However, extending the period of record wasimportant because it provided both recent data and, in-creased the number of years used when performing theanalysis. The average monthly streamflow rates (in cubicfeet per second (cfs)) were averaged for the water year(October of the previous year to September of the currentyear) and converted into streamflow volumes (km3) withproper conversions. Water year streamflow data covering aperiod from 1951 to 2002 (52 years) were then used in thefollowing analysis. Interdecadal and interannual climaticindices were evaluated 1 year prior (1950–2001) to stream-flow and are described in the following sections.
2.2. Interdecadal and Decadal Oceanic Data(PDO, AMO, and NAO)
[9] Interdecadal and decadal oceanic-atmospheric indica-tors include the Pacific Decadal Oscillation (PDO), AtlanticMultidecadal Oscillation (AMO) and the North AtlanticOscillation (NAO). PDO Index values are availablefrom the Joint Institute for the Study of the Atmosphereand Ocean, University of Washington (http://tao.atmos.washington.edu/pdo/). For the period 1900 to present, thewarm phase (1925–1945 and from 1977 to present) of the
2 of 11
W12408 TOOTLE ET AL.: OCEANIC-ATMOSPHERIC VARIABILITY AND U.S. STREAMFLOW W12408

PDO Index was a positive numerical index value while thecold phase (1900–1925 and 1945–1977) was a negativenumerical value [Mantua et al., 1997; Hare and Mantua,2000]. A review of the PDO Index indicates a shift to thecold phase around 1999 or 2000.[10] The AMO index consists of detrended SST anoma-
lies for the previously defined Atlantic Ocean region. AMOindex values are available from the National Oceanic andAtmospheric Administration (NOAA) Climate DiagnosticsCenter (CDC) (http://www.cdc.noaa.gov/ClimateIndices/).From 1856 to present, the AMO exhibited a 65 to 80 yearcycle. The AMO is defined as being in a warm phase from1860 to 1880 and 1930 to 1960 and cool phases from 1905to 1925 and 1970 to 1990. Recent studies suggest that theAMO returned to a warm phase in 1995 [Enfield et al.,2001; McCabe et al., 2004; Gray et al., 2004]. WhileRogers and Coleman [2003] limited their evaluation ofthe AMO to the central core of the AMO warm (1936–1956) and the AMO cold (1968–1988), McCabe et al.[2004] evaluated coupled effects of PDO and AMO for fourperiods: PDO warm and AMO warm (1926–1943), PDOcold and AMO warm (1944–1963), PDO cold and AMOcold (1964–1976), and PDO warm and AMO cold (1977–1994). This analysis eliminates the two transitional periods
(1961–1969 and 1991–1994) of the AMO. The periods forthe PDO and AMO used in the McCabe et al. [2004] studywere adopted for this study. In addition, the recent changesof the PDO to cold in 2000 and the AMO to warm in 1995were used in this study (Table 1).[11] The NAO Index is defined as the difference in
normalized mean winter (December to March) sea levelpressure (SLP) anomalies between Iceland and Portugal[Hurrell, 1995]. The SLP anomalies were standardized bysubtracting the mean and dividing by the standard deviation.NAO index values were obtained from the National Centerfor Atmospheric Research (NCAR) Web site (http://www.cgd.ucar.edu/cas/jhurrell/indices.html). Since 1864,the NAO has displayed both interannual variability andlong-term persistence in a particular phase [Hurrell and VanLoon, 1995]. Hurrell and Van Loon [1995] applied a low-pass filter to the yearly NAO Index values to removefluctuations of less than four years. This resulted in anegative (low) phase during the early 1950s to 1970s, apositive/negative fluctuation during the 1970s to early1980s, and a positive (high) phase from the early 1980sto mid-1990s. When applying the low-pass filter to current(1996 to 2004) NAO Index values obtained from the NCARwebsite, the NAO has maintained a positive phase into the
Figure 1. Locations of unimpaired U.S. Geological Survey streamflow stations in the continentalUnited States.
Table 1. Years Identified as Warm/Positive or Cold/Negative for the PDO, AMO, NAO, and
ENSO (1950–2001)
PDO AMO NAO ENSO
ColdNegative
1950–1976,2000–2001
1964–1994 1952–1972,1977–1980
1950,a 1954,1955,a 1956,a
1964,a 1970,1971,a 1973,1974,a 1975,1981, 1988,a
1998, 1999a
WarmPositive
1977–1999 1950–1963,1995–2001
1950–1951,1973–1976,1981–2001
1953, 1957,1963, 1965,a
1969, 1972,a
1977, 1982,a
1987,a 1991,a
1993,a 1994,a
1997a
aDenotes core ENSO years per NOAA-CDC.
W12408 TOOTLE ET AL.: OCEANIC-ATMOSPHERIC VARIABILITY AND U.S. STREAMFLOW
3 of 11
W12408

early 2000s. The NAO Index phases, as defined by Hurrelland Van Loon [1995] were used in this study with the NAOremaining in a positive phase from 1995 until the end of theperiod of record (Table 1).
2.3. Interannual Oceanic Data (ENSO)
[12] Currently there is no single data set that is univer-sally accepted for the measurement of ENSO [Beebee andManga, 2004]. Two data sets typically used to evaluate themagnitude of ENSO include the Nino 3.4 [Trenberth, 1997]sea surface temperature (SST) region and the Troup South-ern Oscillation Index (SOI). The Nino 3.4 SST region islocated along the equatorial Pacific Ocean (5�S–5�N,170�–120�W) and monthly index data were obtained fromthe National Weather Service (NWS) Climate PredictionCenter (CPC) (http://www.cpc.ncep.noaa.gov/data/indices/).The Troup SOI, used by the Australian Bureau of Meteo-rology (ABOM), is the standardized anomaly of the meansea level pressure difference between Tahiti and Darwin.Monthly Troup SOI values were obtained from the ABOM(http://www.bom.gov.au).[13] The NOAA-CDC (http://www.cdc.noaa.gov/ENSO/
Compare/) defined the ENSO summer season as May toSeptember and identified core El Nino and La Nina years forthe summer season. The summer season was selected forENSO since it occurs prior to the beginning of the stream-flow water year and ENSO (e.g., an interannual oceanic-atmospheric phenomena) was better represented by a season.Various techniques were available to define the occurrenceof a summer season ENSO event. In identifying winter(December to February) ENSO events, Gershunov [1998]defined a winter El Nino (La Nina) as when the anomaly inthe Nino 3.4 SST region is greater (lesser) than 1.1 standarddeviations of the long-term mean. When evaluating ENSOand PDO, Gershunov and Barnett [1998] reduced the valueto 0.8 times the standard deviation. They concluded that thisvalue was high enough to exclude questionable ENSOevents and would allow for an adequate number of ENSOevents when combining the PDO [Gershunov and Barnett,1998]. Hamlet and Lettenmaier [1999] reduced this value to0.5 standard deviations. Harshburger et al. [2002] identifiedan ENSO event when the seasonal mean Nino 3.4 SSTanomalies are greater (less) than +0.5�C (�0.5�C). Rogersand Coleman [2003] identified extreme warm (El Nino) andcold (La Nina) events when the Nino 3.4 SST anomalyexceeded absolute 0.75�C.[14] For this study, the approach of Gershunov and
Barnett [1998] was applied to the Nino 3.4 index and TroupSOI index for the summer (May to September) season andthe results (summer season ENSO years identified) wereused to compliment the NOAA-CDC core summer seasonENSO year data set (i.e., recognize and incorporate addi-tional ENSO years). This provides an adequate numberof ENSO events to evaluate the impacts of the PDO, AMOand NAO while excluding questionable ENSO events[Gershunov and Barnett, 1998]. Table 1 summarizes theENSO events used in this study.
3. Methodology
[15] First, the individual impacts of the interdecadal ordecadal (PDO, AMO or NAO) oceanic-atmospheric influ-ence on continental U.S. streamflow (639 stations) was
evaluated. Next, the individual impact of the interannualENSO on continental U.S. streamflow was evaluated.Finally, an evaluation of the impacts of the coupling ofthe interdecadal (PDO, AMO or NAO) influence with theinterannual ENSO on continental U.S. streamflow wasperformed.[16] The nonparametric rank-sum test [Maidment, 1993]
was performed on the response of streamflow medians tochanges in oceanic- atmospheric phase, including coupling.The method compares two independent data sets anddetermines if one data set has significantly larger valuesthan the other data set. The rank-sum test assumes the twodata sets are identically distributed and there is no assump-tion of normality. Typically, streamflow is not normallydistributed. Additionally, this approach does not assume anyform of linear relationship as is inherent in correlationanalysis. A limitation of nonparametric analysis is that theinherent extremes in hydrologic data are not well repre-sented. For the analysis presented in this paper, the generalshift in streamflow data is of interest and not necessarily theoccurrence of extreme hydrologic events. Additionally, theassumption of identical distributions between the two datasets can sometimes be difficult to verify due to the limitednumber of years in each data set.
3.1. Nonparametric Testing of Interdecadal (PDO,AMO, or NAO) Phases (Cold or Warm) on Streamflow
[17] The phases (cold/negative or warm/positive) wereevaluated for the PDO, AMO or NAO such that significant(greater than 95%) differences in streamflow medians werereported. For each of the interdecadal influences, significantcontinental U.S. streamflow regions (i.e., Pacific Northwest)were identified. For each region, the individual stationswere identified and the yearly (water year) streamflowvolume (standardized anomaly) was determined. Finally,the yearly values for all stations in the region were averagedto produce a composite time series of yearly streamflow.
3.2. Nonparametric Testing of Interannual ENSOPhases (Cold, La Nina, or Warm, El Nino)on Streamflow
[18] The phases (cold, La Nina, and warm, El Nino) wereevaluated for ENSO such that significant (greater than 95%)differences in streamflow medians were reported. Similar tothe interdecadal evaluation in 3.1, significant continentalU.S. streamflow regions (i.e., Pacific Northwest) wereidentified. For each region, the individual stations wereidentified and the yearly (water year) streamflow volume(standardized anomaly) was determined. Finally, the yearlyvalues for all stations in the region were averaged toproduce a composite time series of yearly streamflow.
3.3. Nonparametric Testing of Couplingof Interdecadal (PDO, AMO, or NAO) andInterannual ENSO on Streamflow
[19] The impacts of the coupling of the interdecadal ordecadal (PDO, AMO or NAO) influence with the interan-nual ENSO on continental U.S. streamflow were performed.An evaluation was performed of the impact of the inter-decadal phase (e.g., PDO, cold, and PDO, warm) on aspecific phase (e.g., cold, La Nina) of ENSO. This analysisidentifies continental U.S. streamflow regions in which theinterdecadal phase influences La Nina (or El Nino). Each
4 of 11
W12408 TOOTLE ET AL.: OCEANIC-ATMOSPHERIC VARIABILITY AND U.S. STREAMFLOW W12408
data set tested consists of only La Nina (or El Nino) years. Iftesting was performed and a significant region (or regions)was identified, it was concluded that the interdecadal phasedoes impact La Nina (or El Nino). However, if a significantregion (or regions) was not identified, it was concluded thatthe interdecadal phase does not impact La Nina (or ElNino).
4. Results
[20] The results of the nonparametric testing are pre-sented in Figures 2–7. For the continental U.S. stream-flow maps, a solid (open) circle represents a positive(negative) test result at the 95% confidence level. Addi-tionally, plots (vertical bar charts) are provided represent-ing the average yearly streamflow (standardized anomaly)for all stations in a defined region. The black barsrepresent warm/positive years, and the gray bars representcold/negative years.
4.1. Interdecadal (PDO and AMO) and Decadal(NAO) Testing
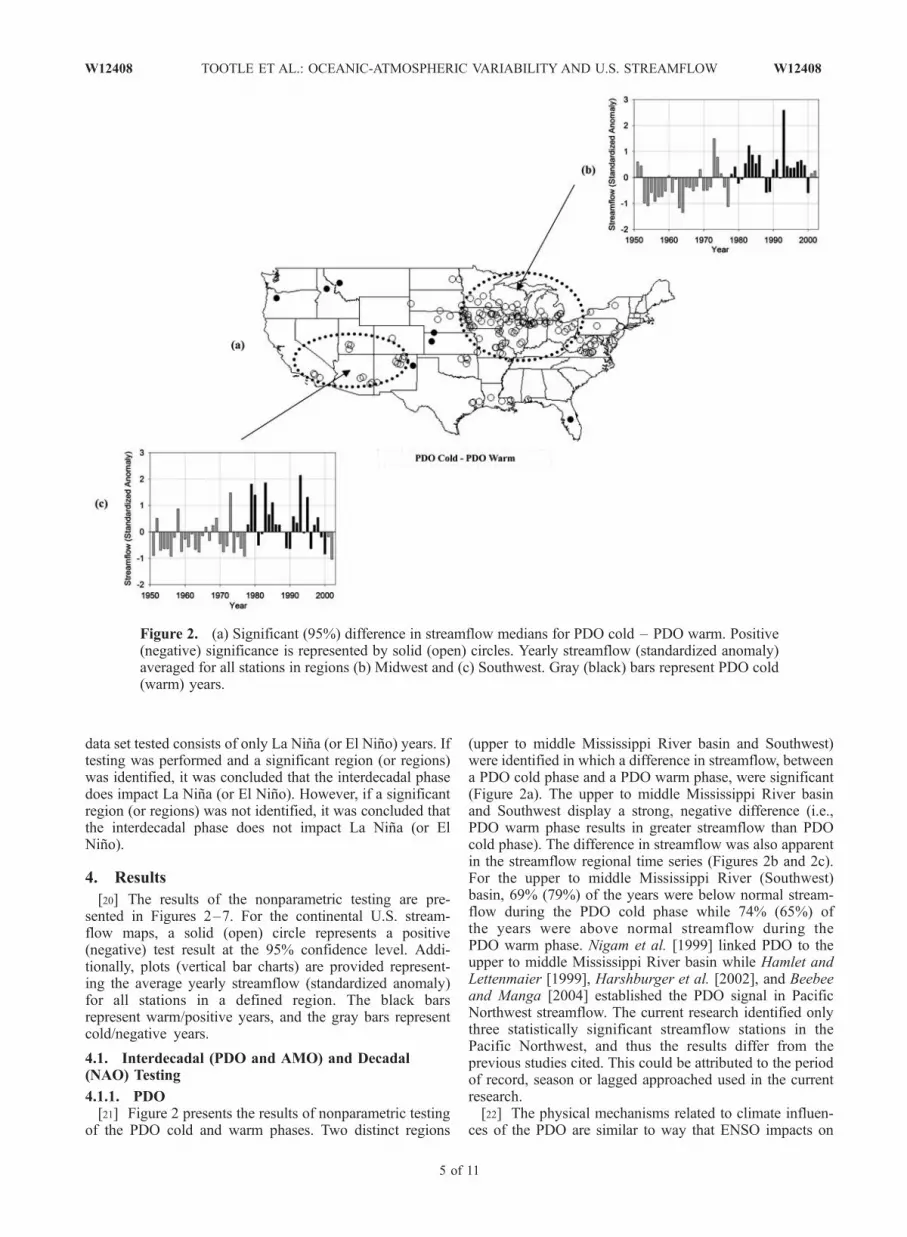
4.1.1. PDO[21] Figure 2 presents the results of nonparametric testing
of the PDO cold and warm phases. Two distinct regions
(upper to middle Mississippi River basin and Southwest)were identified in which a difference in streamflow, betweena PDO cold phase and a PDO warm phase, were significant(Figure 2a). The upper to middle Mississippi River basinand Southwest display a strong, negative difference (i.e.,PDO warm phase results in greater streamflow than PDOcold phase). The difference in streamflow was also apparentin the streamflow regional time series (Figures 2b and 2c).For the upper to middle Mississippi River (Southwest)basin, 69% (79%) of the years were below normal stream-flow during the PDO cold phase while 74% (65%) ofthe years were above normal streamflow during thePDO warm phase. Nigam et al. [1999] linked PDO to theupper to middle Mississippi River basin while Hamlet andLettenmaier [1999], Harshburger et al. [2002], and Beebeeand Manga [2004] established the PDO signal in PacificNorthwest streamflow. The current research identified onlythree statistically significant streamflow stations in thePacific Northwest, and thus the results differ from theprevious studies cited. This could be attributed to the periodof record, season or lagged approached used in the currentresearch.[22] The physical mechanisms related to climate influen-
ces of the PDO are similar to way that ENSO impacts on
Figure 2. (a) Significant (95%) difference in streamflow medians for PDO cold – PDO warm. Positive(negative) significance is represented by solid (open) circles. Yearly streamflow (standardized anomaly)averaged for all stations in regions (b) Midwest and (c) Southwest. Gray (black) bars represent PDO cold(warm) years.
W12408 TOOTLE ET AL.: OCEANIC-ATMOSPHERIC VARIABILITY AND U.S. STREAMFLOW
5 of 11
W12408

large-scale circulation patterns. During the PDO warmphase, there is an intensification of the Aleutian Low inthe North Pacific and higher sea level pressures in thewestern United States. This results in a southerly shift inthe jet stream and intensification of the subtropical jetstream that influences the southern United States [Mantuaand Hare, 2002].4.1.2. AMO[23] Figure 3 presents the results of nonparametric testing
of the AMO cold and warm phases. Significant positive(i.e., AMO cold phase results in increased streamflow whencompared to AMO warm phase) regions were identified inthe upper to middle Mississippi River basin, lower Appa-lachians/Gulf of Mexico, and Southwest (Figure 3a). Asignificant negative region was identified in the PacificNorthwest. The streamflow regional time series (Figures3b, 3c, 3d, and 3e) show the distinct difference in stream-flow response between the regions. During the initial (1950to 1963) AMO warm phase, the upper to middle MississippiRiver basin, the lower Appalachians/Gulf of Mexico andSouthwest experience below normal yearly streamflow for79%, 86% and 64% of the 14 year period of record,respectively, while the Pacific Northwest was above normal
for 64% for the same period. It is noteworthy that a largenumber of extreme (i.e., yearly streamflow anomaly greaterthan one) years occur in the Southwest (Figure 3d) and theAppalachians/Gulf of Mexico (Figure 3e) during the AMOcold phase. Each region experiences a significant (i.e.,greater than one) number of ‘‘flood’’ years during theAMO cold. While some of this variation can be attributedto ENSO, several extreme years were not influenced byENSO or, in the Southeast, hurricane activity. Rogers andColeman [2003] identified a positive region in the upperMississippi River basin for core years of the AMO cold andwarm phases. However, the Pacific Northwest (negativeregion) was not identified. This may be attributed to severalfactors including using only the core years of the AMO andusing the winter season streamflow (i.e., no snowmelt) inlieu of the water year. Enfield et al. [2001], when correlatingthe AMO with rainfall, identified a large pattern of signif-icantly negative correlations throughout the United States,except for positive correlations in the Pacific Northwest,thus demonstrating the opposite response to the AMO.Enfield et al. [2001] also discussed the physical mecha-nisms associated with the AMO phases and found that therewas an opposite response in winter cyclonic activity in the
Figure 3. (a) Significant (95%) difference in streamflow medians for AMO cold – AMO warm.Positive (negative) significance is represented by solid (open) circles. Yearly streamflow (standardizedanomaly) averaged for all stations in regions (b) Northwest, (c) Midwest, (d) Southwest, and(e) Southeast. Gray (black) bars represent AMO cold (warm) years.
6 of 11
W12408 TOOTLE ET AL.: OCEANIC-ATMOSPHERIC VARIABILITY AND U.S. STREAMFLOW W12408

Pacific Northwest and the Southwest as represented in the500 hPa geopotential heights.4.1.3. NAO[24] Figure 4 presents the results of nonparametric testing
of the NAO negative and positive phases. A distinct region(upper to middle Mississippi River basin) was identified inwhich a difference in streamflow, between a NAO negative(low) phase and a NAO positive (high) phase, was signif-icant (Figure 4a). The NAO positive phase results inincreased streamflow when compared to the NAO negativephase in the upper to middle Mississippi River basin(Figure 4b). Visbeck et al. [2001] observed that during apositive NAO, conditions are warmer and wetter thanaverage in the eastern United States. These climate impactsmay be due to the northern shift of the jet stream during theNAO positive phase [Visbeck et al., 2001]. The results ofthe current research did not identify statistically significantstreamflow stations in the eastern United States.
4.2. ENSO Testing
[25] Figure 5 presents the results of nonparametric testingof ENSO cold (La Nina) and warm (El Nino) phases. Thewell-established ENSO signal was displayed in Florida, theSouthwest and the Pacific Northwest (Figure 5a). Strongnegative (i.e., El Nino resulted in increased streamflow
when compared to La Nina) differences in streamflow forFlorida, Arizona and Southern California while the oppositeoccurs for the Pacific Northwest. These results were alsoapparent in the streamflow time series (Figures 5b, 5c, and5d). Kahya and Dracup [1993a, 1993b, 1994a, 1994b]established a lag between ENSO and streamflow responsein these regions. Zorn and Waylen [1997] and Schmidt et al.[2001] reported the ENSO signal in Florida while thepreviously cited studies of Hamlet and Lettenmaier[1999], Harshburger et al. [2002], and Beebee and Manga[2004] focused on the Pacific Northwest. Clark et al. [2001]investigated streamflow in the lower Colorado River basinand found that in El Nino years there is above-normalstreamflow. As noted earlier, the ENSO impacts can beexplained by the southerly shift in the jet stream during thewarm (El Nino) phase.
4.3. Coupling of Interdecadal (PDO, AMO, or NAO)and ENSO Testing
4.3.1. PDO and ENSO[26] The coupling of PDO and ENSO was evaluated by
examining streamflow relationships for PDO cold/El Nino– PDO warm/El Nino and PDO cold/La Nina – PDOwarm/La Nina. The results of the nonparametric rank-sumtesting provided minimal to no stations, and therefore the
Figure 4. (a) Significant (95%) difference in streamflow medians for NAO cold – NAO warm. Positive(negative) significance is represented by solid (open) circles. (b) Yearly streamflow (standardizedanomaly) averaged for all stations in the region Midwest. Gray (black) bars represent NAO negative(positive) years.
W12408 TOOTLE ET AL.: OCEANIC-ATMOSPHERIC VARIABILITY AND U.S. STREAMFLOW
7 of 11
W12408

impact of the PDO phase on El Nino (or La Nina) was notreported. Rajagopalan et al. [2000] determined that PDOdoes not enhance (or dampen) ENSO’s effect on summerseason PDSI in the continental United States. The results ofRajagopalan et al. [2000] differed from the winter precip-itation results of Gershunov et al. [1999]. At the 95%significance level, the current research did not identify aPDO impact of ENSO, however, if the significance levelwas reduced to 90% (results not provided), a region wasidentified in the upper to middle Mississippi River basin inwhich the PDO influences El Nino.4.3.2. AMO and ENSO[27] The coupling of AMO and ENSO was evaluated by
examining streamflow relationships for AMO cold/El Nino– AMO warm/El Nino and AMO cold/La Nina – AMOwarm/La Nina. For AMO cold/La Nina – AMO warm/LaNina, a large, positive spatial region of significant stream-flow stations was identified in the Southeast United States(Figure 6a). A La Nina (El Nino) event generally results indecreased (increased) streamflow in the Southeast (Figures5a), while the AMO cold (warm) phase results in increased(decreased) streamflow in this region (Figures 3a and 3e). Inthe Southeast, La Nina events occurring in an AMO cold(warm) phase result in significantly greater (lesser) stream-
flow than those occurring in an AMO warm phase. Thus aLa Nina during the AMO warm phase results in more severedroughts.[28] The significant difference in La Nina streamflow in
the Southeast region (Figure 6a) is displayed in Figure 6b.For the 14 La Ninas in the period of record, eight occurredduring an AMO cold phase while six occurred during anAMO warm phase. For the Southeast region, during theAMO cold phase, seven of eight La Ninas resulted in abovenormal streamflow while during the AMO warm phase, allsix La Ninas resulted in below normal streamflow. For thisregion, the average streamflow (i.e., standardized anomaly)for the AMO cold La Ninas was +0.40 while the averagestreamflow for the AMO warm La Ninas was �0.89 (almostone standard deviation below normal). For all La Ninas theaverage streamflow was �0.16. Given the current AMOwarm phase, the development of a La Nina could severelyimpact (i.e., drought) the southeastern United States.[29] A physical explanation of the AMO-ENSO coupling
is challenging. The southeastern United States was influ-enced by both the AMO (section 4.1.2) and ENSO(section 4.2). The AMO cold phase appears to dominateLa Nina such that streamflow was above normal whentypically La Nina results in below normal streamflow. This
Figure 5. (a) Significant (95%) difference in streamflow medians for La Nina – El Nino. Positive(negative) significance is represented by solid (open) circles. Yearly streamflow (standardized anomaly)averaged for all stations in regions (b) Northwest, (c) Southwest, and (d) Southeast. Gray (black) barsrepresent ENSO cold (warm) years while white bars represent neutral years.
8 of 11
W12408 TOOTLE ET AL.: OCEANIC-ATMOSPHERIC VARIABILITY AND U.S. STREAMFLOW W12408

may be due to the spatial location of the southeastern UnitedStates, being adjacent to the Atlantic Ocean and thusimpacted more by Atlantic Ocean SST variability. Theresults of the nonparametric rank-sum testing of AMOcold/El Nino – AMO warm/El Nino provided minimalstations and therefore was not reported.4.3.3. NAO and ENSO[30] The coupling of NAO and ENSO was evaluated by
examining streamflow relationships for NAO negative/ElNino – NAO positive/El Nino and NAO negative/La Nina– NAO positive/La Nina. For NAO negative/La Nina –NAO positive/La Nina, a large, negative spatial region ofsignificant streamflow stations was identified in the mid-western United States (Figure 7a). The negative resultindicates that a La Nina during an NAO positive phaseresults in significantly more streamflow than a La Ninaduring an NAO negative phase (Figure 7b). For the 14 LaNinas in the period of record, six occurred during an NAO
negative phase while eight occurred during an NAO posi-tive phase. All six La Ninas during the NAO negative phaseresulted in below normal streamflow (i.e., standardizedanomaly) with an average of �0.65. During the NAOpositive phase, six (of eight) La Ninas were above normalwith an average streamflow of +0.45. The average of all 14La Ninas in this region was �0.02.[31] Figure 7a is similar to Figure 4a (i.e., NAO negative
– NAO positive) except far fewer stations were identified.Physically, the NAO impacts the jet stream such that it shiftsnorth during the positive phase and shifts south during thenegative phase (NOAA, Climate factors helping to shapewinter 2004–2005, NOAA News, http://www.noaanews.noaa.gov/stories2004/s2326b.htm). La Nina influencedevents track easterly from the Pacific Ocean and thus areimpacted by such a shift in the jet stream. Kahya andDracup [1993a, 1994b] identified a Midwest region (similarto Figures 4a and 7a) in which La Nina results in reduced
Figure 6. (a) Significant (95%) difference in streamflow medians for AMO cold/La Nina – AMOwarm/La Nina. Positive (negative) significance is represented by solid (open) circles. (b) La Nina yearstreamflow (standardized anomaly) averaged for all stations in the region Southeast. Gray (black) barsrepresent La Ninas during AMO cold (warm) years.
W12408 TOOTLE ET AL.: OCEANIC-ATMOSPHERIC VARIABILITY AND U.S. STREAMFLOW
9 of 11
W12408
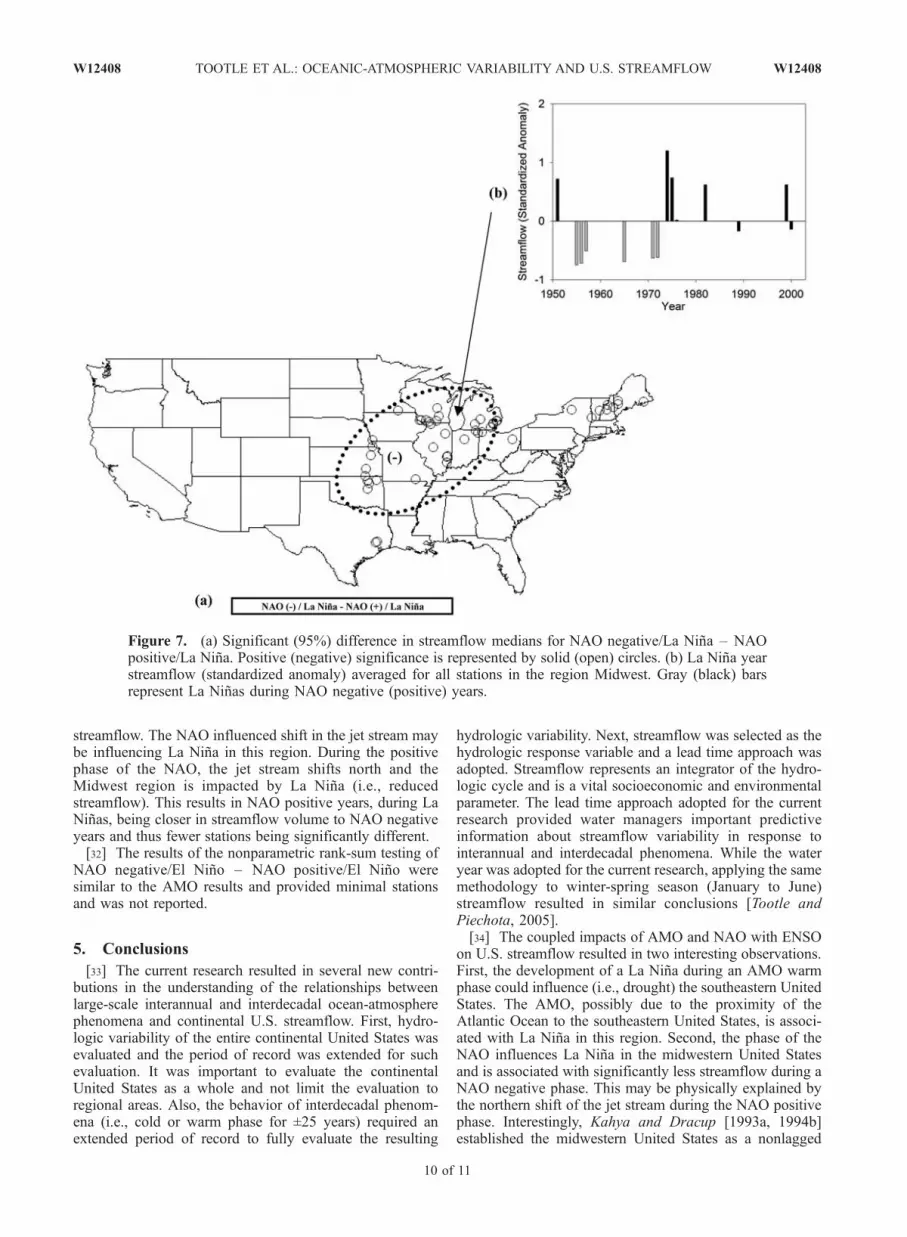
streamflow. The NAO influenced shift in the jet stream maybe influencing La Nina in this region. During the positivephase of the NAO, the jet stream shifts north and theMidwest region is impacted by La Nina (i.e., reducedstreamflow). This results in NAO positive years, during LaNinas, being closer in streamflow volume to NAO negativeyears and thus fewer stations being significantly different.[32] The results of the nonparametric rank-sum testing of
NAO negative/El Nino – NAO positive/El Nino weresimilar to the AMO results and provided minimal stationsand was not reported.
5. Conclusions
[33] The current research resulted in several new contri-butions in the understanding of the relationships betweenlarge-scale interannual and interdecadal ocean-atmospherephenomena and continental U.S. streamflow. First, hydro-logic variability of the entire continental United States wasevaluated and the period of record was extended for suchevaluation. It was important to evaluate the continentalUnited States as a whole and not limit the evaluation toregional areas. Also, the behavior of interdecadal phenom-ena (i.e., cold or warm phase for ±25 years) required anextended period of record to fully evaluate the resulting
hydrologic variability. Next, streamflow was selected as thehydrologic response variable and a lead time approach wasadopted. Streamflow represents an integrator of the hydro-logic cycle and is a vital socioeconomic and environmentalparameter. The lead time approach adopted for the currentresearch provided water managers important predictiveinformation about streamflow variability in response tointerannual and interdecadal phenomena. While the wateryear was adopted for the current research, applying the samemethodology to winter-spring season (January to June)streamflow resulted in similar conclusions [Tootle andPiechota, 2005].[34] The coupled impacts of AMO and NAO with ENSO
on U.S. streamflow resulted in two interesting observations.First, the development of a La Nina during an AMO warmphase could influence (i.e., drought) the southeastern UnitedStates. The AMO, possibly due to the proximity of theAtlantic Ocean to the southeastern United States, is associ-ated with La Nina in this region. Second, the phase of theNAO influences La Nina in the midwestern United Statesand is associated with significantly less streamflow during aNAO negative phase. This may be physically explained bythe northern shift of the jet stream during the NAO positivephase. Interestingly, Kahya and Dracup [1993a, 1994b]established the midwestern United States as a nonlagged
Figure 7. (a) Significant (95%) difference in streamflow medians for NAO negative/La Nina – NAOpositive/La Nina. Positive (negative) significance is represented by solid (open) circles. (b) La Nina yearstreamflow (standardized anomaly) averaged for all stations in the region Midwest. Gray (black) barsrepresent La Ninas during NAO negative (positive) years.
10 of 11
W12408 TOOTLE ET AL.: OCEANIC-ATMOSPHERIC VARIABILITY AND U.S. STREAMFLOW W12408

ENSO influenced streamflow region, which responds toENSO in a similar manner as the Southwest and Southeast(e.g., El Nino, increased streamflow, and La Nina, de-creased streamflow).[35] The individual impacts of the PDO, AMO and NAO
resulted in several new observations. The phase of the AMOmay indicate streamflow trends in the Pacific Northwest,Southwest, Midwest and Southeast while the NAO influen-ces the Midwest streamflow. Unlike previous studies, thePacific Northwest was (was not) identified as an AMO(PDO) influenced region and the NAO was (was not)identified in the midwestern (eastern) United States. Thiscould be a result of the lead times and season (water year)selected.[36] The results indicate that the phase of the PDO may
prove to be a strong indicator of upper to middle MississippiRiver and southwest U.S. streamflow. At the 95% confi-dence level established for the current research, PDO-ENSOcoupling provided similar results (no significant regions) asthe previous drought study of Rajagopalan et al. [2000].However, at the 90% confidence level, the PDO influencesEl Nino in the upper to middle Mississippi River basin.
[37] Acknowledgments. This research is supported by the U.S.Geological Survey State Water Resources Research Program, NationalScience Foundation award CMS-0239334, and the National ScienceFoundation, State of Nevada EPSCOR Fellowship. The authors wish tothank Hugo Hidalgo of the Scripps Institute of Oceanography for his reviewof this manuscript and comments. Additionally, the three anonymousreviewers and the Associate Editor are thanked for their useful comments.
ReferencesBeebee, R. A., and M. Manga (2004), Variation in the relationship betweensnowmelt runoff in Oregon and ENSO and PDO, J. Am. Water Resour.Assoc., 40(4), 1011–1024.
Clark, M. P., M. C. Serreze, and G. J. McCabe (2001), Historical effects ofEl Nino and La Nina events on seasonal evolution of the montane snow-pack in the Columbia and Colorado river basins, Water Resour. Res.,37(3), 741–757.
Enfield, D. B., A. M. Mestas-Nunez, and P. J. Trimble (2001), The Atlanticmultidecadal oscillation and its relation to rainfall and river flows in thecontinental U.S., Geophys. Res. Lett., 28(10), 2077–2080.
Gershunov, A. (1998), ENSO influence on influence on intraseasonal ex-treme rainfall and temperature frequencies in the contiguous UnitedStates: Implications for long-range predictability, J. Clim., 11, 3192–3203.
Gershunov, A., and T. P. Barnett (1998), Interdecadal modulation of ENSOteleconnections, Bull. Am. Meteorol. Soc., 79, 2715–2725.
Gershunov, A., T. P. Barnett, and D. R. Cayan (1999), North Pacific inter-decadal oscillation seen as factor in ENSO-related North American cli-mate anomalies, Eos Trans. AGU, 80(3), 25–36.
Gray, S. T., L. J. Graumlich, J. L. Betancourt, and G. T. Pederson (2004), Atree-ring based reconstruction of the Atlantic Multidecadal Oscillationsince 1567 A.D., Geophys. Res. Lett., 31, L12205, doi:10.1029/2004GL019932.
Hamlet, A. F., and D. P. Lettenmaier (1999), Columbia River streamflowforecasting based on ENSO and PDO climate signals, J. Water Resour.Plann. Manage., 125(6), 333–341.
Hare, S., and N. Mantua (2000), Empirical evidence for North Pacificregime shifts in 1977 and 1989, Prog. Oceanogr., 47, 103–145.
Harshburger, B., H. Ye, and J. Dzialoski (2002), Observational evidence ofthe influence of Pacific sea surface temperatures on winter precipitationand spring stream discharge in Idaho, J. Hydrol., 264(1–4), 157–169.
Hidalgo, H. G. (2004), Climate precursors of multidecadal drought varia-bility in the western United States, Water Resour. Res., 40, W12504,doi:10.1029/2004WR003350.
Hidalgo, H. G., and J. A. Dracup (2001), Evidence of the signature of NorthPacific multidecadal processes on precipitation and streamflow variationsin the upper Colorado River basin, paper presented at the 6th BiennialConference of Research on the Colorado River Plateau, U.S. Geol. Surv.,Phoenix, Ariz.
Hidalgo, H. G., and J. A. Dracup (2003), ENSO and PDO effects onhydroclimatic variations of the upper Colorado River basin, J. Hydro-meteorol., 4(1), 5–23.
Hurrell, J. W. (1995), Decadal trends in the North Atlantic Oscillation:Regional temperatures and precipitation, Science, 269(5224), 676–679.
Hurrell, J. W., and H. Van Loon (1995), Decadal variations in climateassociated with the North Atlantic Oscillation, Clim. Change, 31,301–326.
Kahya, E., and J. A. Dracup (1993a), U.S. streamflow patterns in relation tothe El Nino/Southern Oscillation, Water Resour. Res., 29(8), 2491–2503.
Kahya, E., and J. A. Dracup (1993b). The relationships between ENSOevents and California streamflows, in The World at Risk: NaturalHazards and Climate Change, pp. 86–95, Am. Inst. of Phys., Melville,N. Y.
Kahya, E., and J. A. Dracup (1994a), The influences of type 1 El Nino andLa Nina events on streamflows in the Pacific southwest of the UnitedStates, J. Clim., 7(6), 965–976.
Kahya, E., and J. A. Dracup (1994b), The relationships between U.S.streamflow and La Nina events, Water Resour. Res., 30(7), 2133–2141.
Kerr, R. A. (2000), A North Atlantic climate pacemaker for the centuries,Science, 228, 1984–1986.
Maidment, D. R. (1993), Handbook of Hydrology, McGraw-Hill, NewYork.
Mantua, N. J., and S. R. Hare (2002), The Pacific Decadal Oscillation,J. Oceanogr., 59(1), 35–44.
Mantua, N. J., S. R. Hare, Y. Zhang, J. M. Wallace, and R. C. Francis(1997), A Pacific interdecadal climate oscillation with impacts on salmonproduction, Bull. Am. Meteorol. Soc., 78, 1069–1079.
McCabe, G. J., M. A. Palecki, and J. L. Betancourt (2004), Pacific andAtlantic ocean influences on multidecadal drought frequency in the Uni-ted States, Proc. Natl. Acad. Sci. U.S.A., 101(12), 4136–4141.
Nigam, S., M. Barlow, and E. H. Berbery (1999), Analysis links Pacificvariability to drought and streamflow in United States, Eos Trans. AGU,80(61), 621.
Philander, S. G. (1990), El Nino, La Nina and the Southern Oscillation,Elsevier, New York.
Pizarro, G., and U. Lall (2002), El Nino-induced flooding in the U.S. west:What can we expect?, Eos Trans. AGU, 83(32), 349, 352.
Rajagopalan, B., E. Cook, U. Lall, and B. K. Ray (2000), Spatiotemporalvariability of ENSO and SST teleconnections to summer drought overthe United States during the twentieth century, J. Clim., 13, 4244–4255.
Rogers, J. C., and J. S. M. Coleman (2003), Interactions between theAtlantic Multidecadal Oscillation, El Nino/La Nina, and the PNA inwinter Mississippi Valley stream flow, Geophys. Res. Lett., 30(10),1518, doi:10.1029/2003GL017216.
Schmidt, N., E. K. Lipp, J. B. Rose, and M. E. Luther (2001), ENSOinfluences on seasonal rainfall and river discharge in Florida, J. Clim.,14, 615–628.
Tootle, G. A., and T. C. Piechota (2005), Interdecadal and interannualoceanic/atmospheric variability and United States seasonal streamflow,paper presented at the World Water and Environmental Resources Con-gress 2005, Am. Soc. of Civ. Eng., Anchorage, Alaska, 16–20 May.
Trenberth, K. E. (1997), The definition of El Nino, Bull. Am. Meteorol.Soc., 78, 2271–2777.
Visbeck, M., J. Hurrell, L. Polvani, and H. Cullen (2001), The NorthAtlantic Oscillation, present, past and future, Proc. Natl. Acad. Sci.U. S. A., 98, 12,876–12,877.
Wallis, J. R., D. P. Lettenmaier, and E. F. Wood (1991), A daily hydro-climatological data set for the continental United States, Water Resour.Res., 27(7), 1657–1663.
Zorn, M. R., and P. R. Waylen (1997), Seasonal response of mean monthlystreamflow to El Nino/Southern Oscillation in north central Florida, Prof.Geogr., 49, 51–62.
����������������������������T. C. Piechota, Department of Civil and Environmental Engineering,
University of Nevada, Las Vegas, 4505 Maryland Parkway, Box 454015,Las Vegas, NV 89154-4015, USA. ([email protected])
A. Singh, Department of Mathematical Sciences, University of Nevada,Las Vegas, 4505 Maryland Parkway, Box 454020, Las Vegas, NV 89154-4015, USA. ([email protected])
G. A. Tootle, Department of Civil and Architectural Engineering,University of Wyoming, 1000 East University Avenue, Laramie, WY82071, USA. ([email protected])
W12408 TOOTLE ET AL.: OCEANIC-ATMOSPHERIC VARIABILITY AND U.S. STREAMFLOW
11 of 11
W12408