cost estimation
TRANSCRIPT
Automation in Construction 27 (2012) 67–77
Contents lists available at SciVerse ScienceDirect
Automation in Construction
j ourna l homepage: www.e lsev ie r .com/ locate /autcon
Early stage multi-level cost estimation for schematic BIM models
Franco K.T. Cheung a,⁎, Jonathan Rihan a, Joseph Tah a, David Duce b, Esra Kurul a
a Department of Real Estate and Construction, Oxford Brookes University, UKb Department of Computing and Communication Technologies, Oxford Brookes University, UK
⁎ Corresponding author.E-mail addresses: [email protected] (F.K.T. Che
(J. Rihan), [email protected] (J. Tah), daduce@[email protected] (E. Kurul).
0926-5805/$ – see front matter © 2012 Elsevier B.V. Alldoi:10.1016/j.autcon.2012.05.008
a b s t r a c t
a r t i c l e i n f oArticle history:Accepted 9 May 2012Available online 9 June 2012
Keywords:BIMEarly stage designCost modelNRM3D CAD
Previous studies reveal the need for a tool to evaluate various aspects of building design in early design stages.This paper proposes a multi-attribute based tool to address this need. The tool allows users to evaluate thefunctionality, economics and performance of buildings concurrently with building design. To illustrate themechanics of the tool, the paper details the cost estimation module that enables quick and intuitive explora-tion of early stage design in a popular 3D modelling environment. Measurements are automatically extractedfrom 3D models and profile driven estimates are revised in real-time. The data model uses a flexible unit ratesystem that can easily be extended to other estimate dimensions such as carbon estimates and waste estima-tion. The approach illustrated in this paper is applicable to 3Dmodelling environments that support free formgeometry for massing purposes other than the one chosen for this study.
© 2012 Elsevier B.V. All rights reserved.
1. Introduction
Building Information Modelling (BIM) as an emerging process andtechnology has attracted many initiatives across the globe recently.BIM is a digital representation of the geometric and non-geometricdata of a facility [27]. In contrast to the conventional design and con-struction approach in which individual professionals predominantlywork in their own specialised arena, the BIM approach to building de-sign and construction emphasises on knowledge sharing in the formof a single data repository that develops throughout the life cycle of abuilding. The ability to store different types of information from variousstakeholders at different building stages makes building models rich ininformation. BIM is considered to benefit the architecture, engineeringand construction (AEC) industry in terms of improving production effi-ciency in the design and construction processes through shared infor-mation and collaborative working amongst project participants, anddelivering buildings with better performance by taking into accountvarious attributes including whole life cost and environmental issues asdesign develops [9]. Actual benefits in measurable terms are evidentfrom 32 case studies [15]. The applications of BIM are well documented[9,3] and are expanding further to contract management such as e-procurement [16] and facility management such as the facilitation of de-signer–user communication applications [36].
BIM was first proposed during the late eighties to early nineties [8].Its impact on the AEC industry is immense [38] although the adoptionhas been considerably slower than expected [4]. Recent surveys reveal
ung), [email protected] (D. Duce),
rights reserved.
that the industry adoption rate varies geographically. The SmartMarketReport [25,26] suggests that there is a strong growth of adoption ratefrom 28% in 2007 to 48% in 2009 in the US AEC community. A similarsurvey by buildingSMART Australasia also reveals high adoption ratesamongst various stakeholders in Australia but the resultwas consideredto be heavily biased and the actual adoption rates were recommendedto be a lot lower by the experts [1]. In a different survey by the NationalBuilding Specification [28] looking at construction professionals in theUK, predominantly architects from small andmedium-sized enterprises(SMEs), revealed that only 13% of the respondents are currently usingBIM. Major potential barriers for adoption have been identified in theliterature which includes the lack of standards; presence of skill gaps;hesitation to embrace technological changes within organisations; pres-ence of externalities; ambiguity in data ownership and legal risks; andhigh investment cost [4,3,17,1]. Although it is evident that the adoptionrate is increasing, many argue that only large-scale projects implementBIM and the use by SMEs remains limited [1,2]. The situation is alarmingas themajority of theAEC industry ismade up of SMEs. For instance, 97%of the construction industry in the EU have less than 20 employees and93% have less than 10 [34].
BIM tools are widely available with comprehensive tools primarilydesigned for architectural design such as Revit and ArchiCAD, and spe-cialised tools such as Tekla and Structuralworks for structural designand fabrication, DesignEst Pro and Vico for cost estimating, and Design-builder and VE Pro for energy assessment. Interoperability is the key un-derpinning the concept of BIM that allows various stakeholders toworktogether and software to exchange information seamlessly. BIM toolsdeveloped by individual software companies have been criticized as ad-dressing interoperability mainly amongst their own products ratherthan other vendors' applications [18]. Although there are evolving stan-dards such as the Industry Foundation Classes (IFC) to ensure effective
68 F.K.T. Cheung et al. / Automation in Construction 27 (2012) 67–77
interoperability, errors have been found in exchanges between toolsdue to the lack of uniformity between the object schemas adopted byindividual BIM tool and the IFC objects and properties [31,30,19,32].One approach to reducing these errors is through the introduction ofbest practices for using each of the tools. However, care needs to betaken to ensure the resulting best practices are not counter-intuitiveas rigid restrictions imposed to approaches to design problems ordesigner's preferred workflows could render a BIM tool unpopular[40]. The dilemma is that in order to give informative feedback on de-sign, e.g. on its cost and performance, BIM tools need some level offormalised input but design is an intuitive and unstructured process inparticular at early design stages. Apart from that, while a lot of commer-cial BIM tools are very powerful and contain a variety of add-onmodulesto help in handling very specialised tasks, these tools and their add-onscan be expensive to acquire.Many SMEs struggle just to survive throughthe current recession and cannot afford to invest on expensive BIM tools.An alternative approach to deliver BIM is required to meet the needs ofthe industry comprising mainly of SMEs.
Cavieres et al. [6] argue that the current BIM tools are less able tohandle concurrency and integration at early design stages. The authorsurge the need for a re-distribution of efforts towards early knowledgeintegration and the provision of computational support during earlydecision-making based on the arguments developed from three differ-ent studies; 1) knowledge on design economics and life cycle costneeds to be fed in the conceptual design stages to maximise the use ofknowledge [11] (as cited in [6]), 2) the potential impact for computa-tional tools to support decision is higher in the conceptual designstage than the later stages [41] (as cited in [6]), and 3) the ability of de-cisions to affect costs and performance is higher and the cost of designchanges is lower in the conceptual design stage than the later stages[29] (as cited in [6]). In response to the need for tools at early designstages, Cavieres and others developed knowledge-based parametrictools for concrete masonry walls. This study follows the argumentssupporting the need for early design stage tools but focuses on even ear-lier and potentiallymore crucial design tasks; massing exercise and lay-out design.
In computer applications, it is rather common for users to employone tool to deal with a type of task and another tool for a different typeof task even though the two tools may have overlapping functions tohandle both tasks. In the NBS BIM survey [28], a majority of the respon-dentswere found to use AutodeskAutoCAD as their primary software toproduce CAD drawings while more than half of the respondents usedGoogle SketchUp as their secondary software to produce 3D drawings.An informal investigation by the authors following the result revealsthat a lot of architectural practices useGoogle SketchUp to study variouspotential schemes via 3D SketchUp models during the conceptualdesign phase and develop detailed drawings mainly for the sake ofproduction information using other drafting tools such as AutoCAD.The latter are often considered as more functional but less flexibleto use.
SketchUp, on the other hand, is generally considered as an intuitive,simple and easy-to-use 3D design tool. It has a free version which hasbeen widely used by designers across different disciplines. Designersacross various disciplines including architecture, urban design, interiordesign and product design make use of SketchUp to carry out prelimi-nary modelling exercise. Due to its popularity, relevant plug-ins havebeen developed by the common BIM tools to import SketchUp files totheir environment to develop BIM models. Although BIM models canbe created from imported SketchUp model files, the authors arguethat the workflow may create redundancy in definitions and more im-portant, may lose the opportunity to optimize the building designsince as described, earlier design decisions significantly influence theperformance and life cycle cost of buildings. Also, design purely basedon intuition and experiences is likely to be problematic [12].
SketchUp is primarily a visualisation tool. It can be linked to GoogleEarth and Google Maps to obtain the geographical information, and to
Google 3D warehouse to share and download SketchUp models. Itsinteroperability potential has not been fully exploited. This papersummarises part of the results from a funded research project on the de-velopment of innovative BIM decision making tools under the SketchUpenvironment. This paper first introduces the multi-attribute knowledge-based tool, the Low Impact Design Explorer (or LIDX), that assists designersto evaluate early stage architectural models and provide feedback si-multaneously during the design process. The decision tool that containsa number ofmodules assessing various aspects of building design is cur-rently under development. The focus of the paper is to explain the com-pleted cost estimatingmodule in LIDX as building cost is well perceivedas one primary concern in development and designers are constantlyunder pressure in designing to a cost limit. The novelty of the tool liesin its ability to extract thehighest level of geometric data from schematicdrawings to give real time cost estimate. The tool is able to update theestimate seamlessly as the designer defines the building envelop and in-terior layout.
2. The LIDX approach
Fig. 2 shows the flowchart of a conventional design managementapproach focusing on design to work within a budget in conceptualdesign stage. Often, a cost planner is appointed to estimate buildingcost based on sketch drawings produced by the designer. Similarly,it may involve other professionals to give advice on the functionalityand performance of the design. As design is an evolving process, thetime-lags between various assessment feedbacks, such as cost esti-mate and environmental performance assessment, and design develop-ment make the conventional approach iterative, time-consuming andineffective.
The lack of a holistic assessment makes it difficult to achieve anoptimal design solution considering that the design task is multi-criteria based with increasing need to take environmental performanceinto account at early design stages. There are tools in the market to as-sess the cost and performance of conceptual models. For instance,DProfiler by Beck Technology gives building cost estimates with ref-erence to schematic building models. It can import 3D models fromvarious design tools and has 3D modelling function. Simultaneousestimates can be generated by buildings modelled in DProfiler. Con-trast to DProfiler which focuses estimating function in conceptualdesign stage, Vico Cost Planner by Vico Software allow users to planand estimate building cost as design evolves. Vico's cost estimates canbe updated automatically with reference to imported building models.Both DProfiler and Vico Cost Planner are primarily evaluation tools.They provide solutions that depend on import and export of modelsto facilitate interoperability. Some design tools also have functions toevaluate cost and performance. For example, Conceptual Design Envi-ronment in Revit allows users to obtain quantities from mass models,create formulae and generate building estimates in real time. It doesnot however contain built-in cost databases. Also, it requires knowledgeof cost models to build them properly in the tool. In practice, it is not un-common for designers to use very coarsemethods to carry out the neces-sary assessment or to use judgement by referring to their rules of thumbto evaluate their design for small sized projects due to the lack of budgetfor seeking advice from other consultants. There is a clear need for adesigner-focused system that can give simultaneous design assessmenton various aspects in the conceptual design stage.
This paper proposes the use of a knowledge based tool, Low Im-pact Design Explorer (LIDX), for design assessment under the popularGoogle SketchUp environment. LIDX is a plug-in to SketchUp whichallows users to define building models and performs concurrentmulti-attribute assessment (see Fig. 3). The evolving nature of designis inherent in the ethos of LIDX in that the system assists designers tobuild SketchUp BIMmodels to suit the different needs in the conceptualdesign stage. For instance, a designer may need to first establish themass layout plan by carrying out a massing exercise, then configure
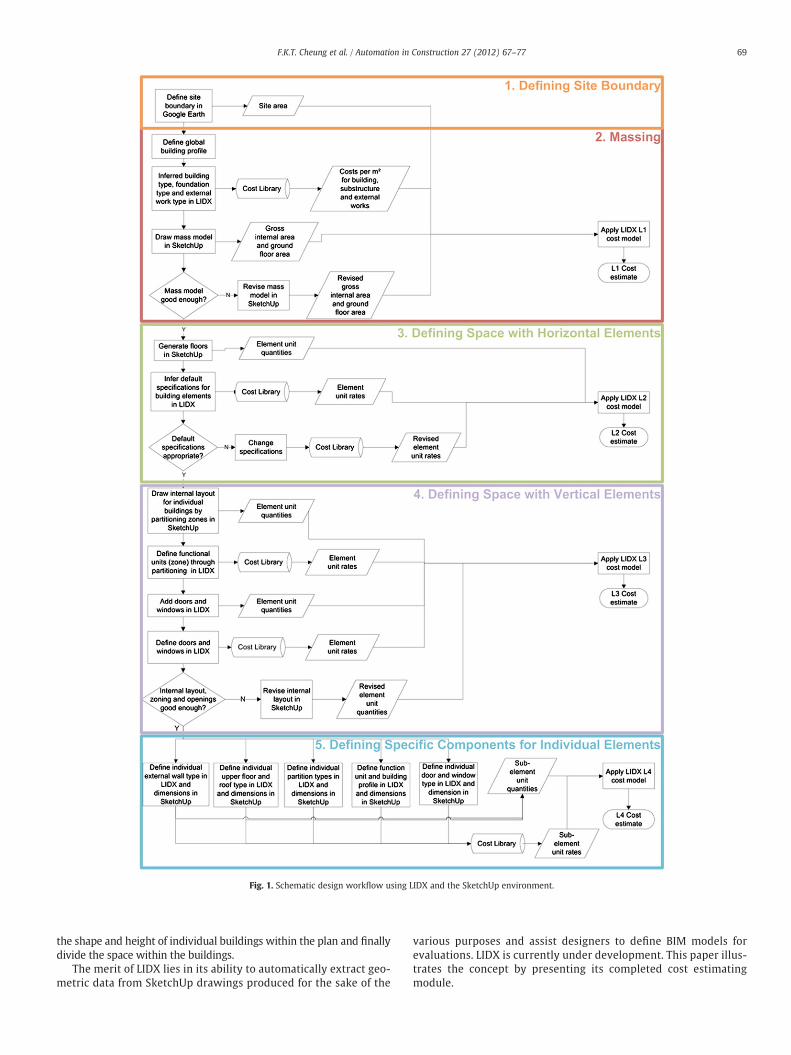
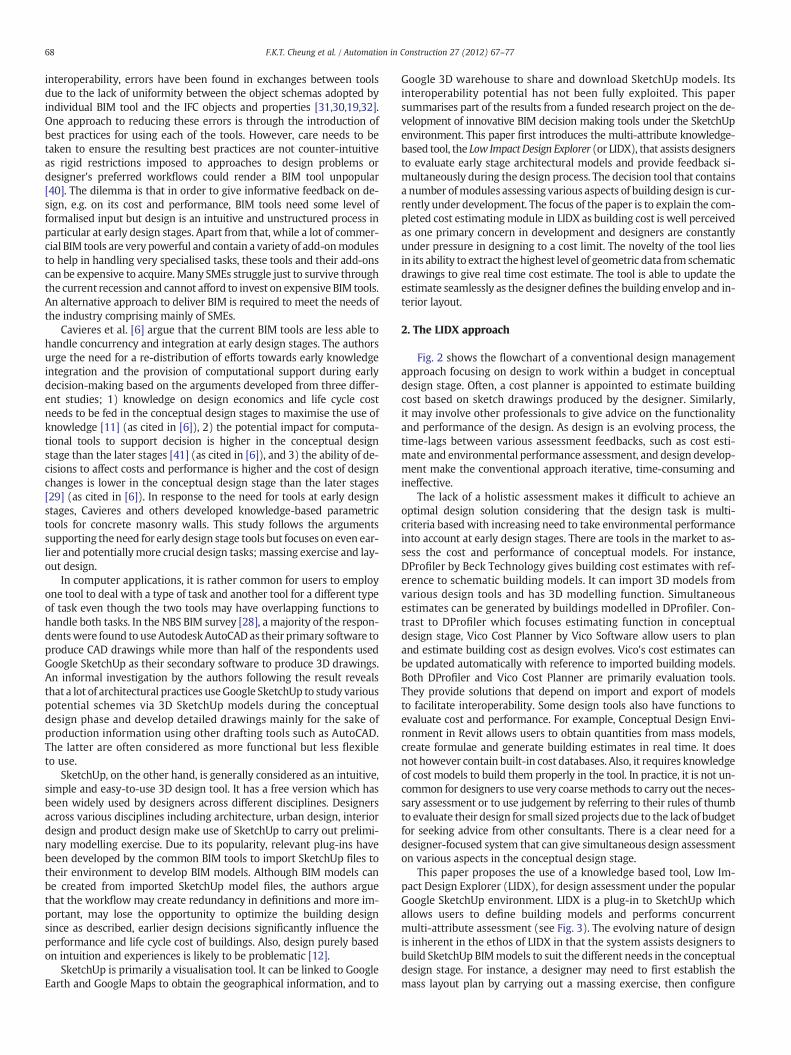
Fig. 1. Schematic design workflow using LIDX and the SketchUp environment.
69F.K.T. Cheung et al. / Automation in Construction 27 (2012) 67–77
the shape and height of individual buildings within the plan and finallydivide the space within the buildings.
The merit of LIDX lies in its ability to automatically extract geo-metric data from SketchUp drawings produced for the sake of the
various purposes and assist designers to define BIM models forevaluations. LIDX is currently under development. This paper illus-trates the concept by presenting its completed cost estimatingmodule.
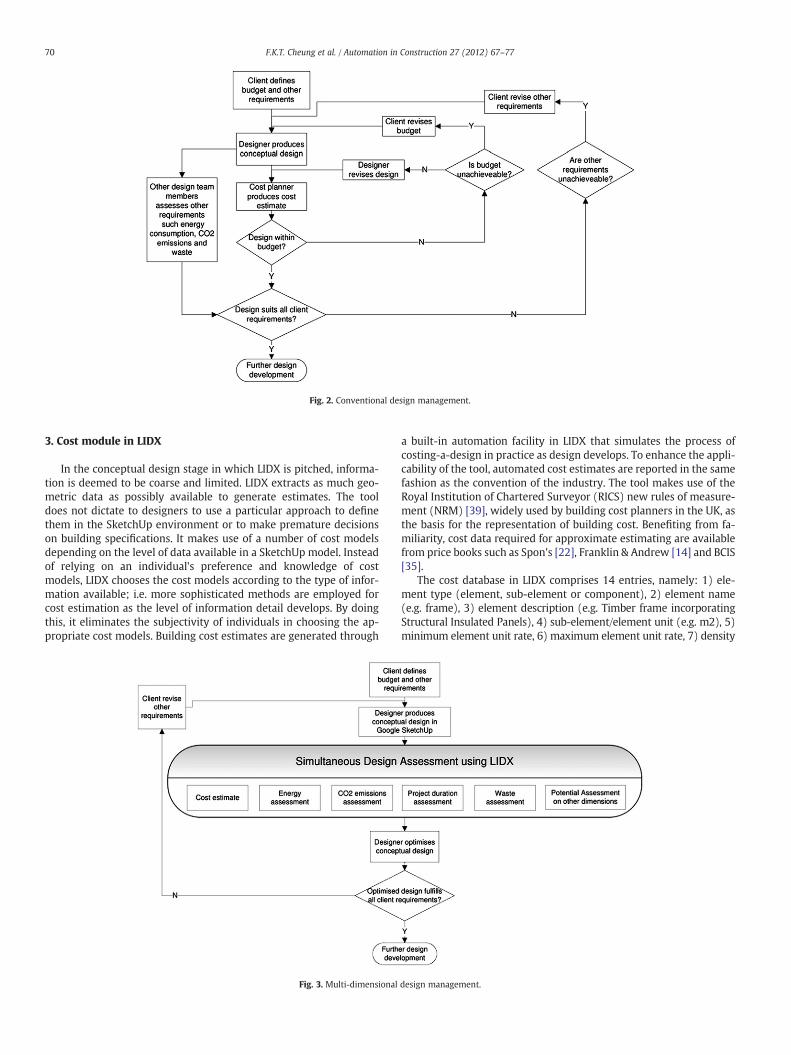
Fig. 2. Conventional design management.
70 F.K.T. Cheung et al. / Automation in Construction 27 (2012) 67–77
3. Cost module in LIDX
In the conceptual design stage in which LIDX is pitched, informa-tion is deemed to be coarse and limited. LIDX extracts as much geo-metric data as possibly available to generate estimates. The tooldoes not dictate to designers to use a particular approach to definethem in the SketchUp environment or to make premature decisionson building specifications. It makes use of a number of cost modelsdepending on the level of data available in a SketchUp model. Insteadof relying on an individual's preference and knowledge of costmodels, LIDX chooses the cost models according to the type of infor-mation available; i.e. more sophisticated methods are employed forcost estimation as the level of information detail develops. By doingthis, it eliminates the subjectivity of individuals in choosing the ap-propriate cost models. Building cost estimates are generated through
Fig. 3. Multi-dimensional
a built-in automation facility in LIDX that simulates the process ofcosting-a-design in practice as design develops. To enhance the appli-cability of the tool, automated cost estimates are reported in the samefashion as the convention of the industry. The tool makes use of theRoyal Institution of Chartered Surveyor (RICS) new rules of measure-ment (NRM) [39], widely used by building cost planners in the UK, asthe basis for the representation of building cost. Benefiting from fa-miliarity, cost data required for approximate estimating are availablefrom price books such as Spon's [22], Franklin & Andrew [14] and BCIS[35].
The cost database in LIDX comprises 14 entries, namely: 1) ele-ment type (element, sub-element or component), 2) element name(e.g. frame), 3) element description (e.g. Timber frame incorporatingStructural Insulated Panels), 4) sub-element/element unit (e.g. m2), 5)minimum element unit rate, 6) maximum element unit rate, 7) density
design management.
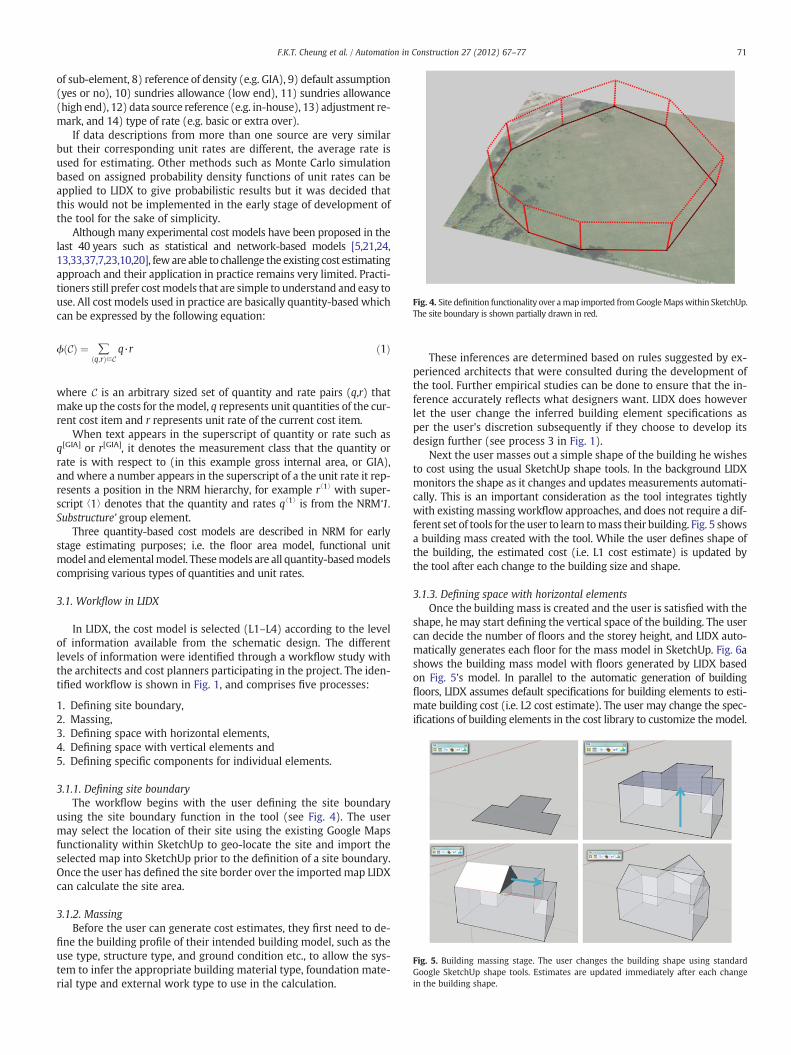
Fig. 4. Site definition functionality over amap imported fromGoogleMapswithin SketchUp.The site boundary is shown partially drawn in red.
Fig. 5. Building massing stage. The user changes the building shape using standardGoogle SketchUp shape tools. Estimates are updated immediately after each changein the building shape.
71F.K.T. Cheung et al. / Automation in Construction 27 (2012) 67–77
of sub-element, 8) reference of density (e.g. GIA), 9) default assumption(yes or no), 10) sundries allowance (low end), 11) sundries allowance(high end), 12) data source reference (e.g. in-house), 13) adjustment re-mark, and 14) type of rate (e.g. basic or extra over).
If data descriptions from more than one source are very similarbut their corresponding unit rates are different, the average rate isused for estimating. Other methods such as Monte Carlo simulationbased on assigned probability density functions of unit rates can beapplied to LIDX to give probabilistic results but it was decided thatthis would not be implemented in the early stage of development ofthe tool for the sake of simplicity.
Although many experimental cost models have been proposed in thelast 40 years such as statistical and network-based models [5,21,24,13,33,37,7,23,10,20], feware able to challenge the existing cost estimatingapproach and their application in practice remains very limited. Practi-tioners still prefer costmodels that are simple to understand and easy touse. All cost models used in practice are basically quantity-based whichcan be expressed by the following equation:
ϕ Cð Þ ¼ ∑q;rð Þ∈C
q·r ð1Þ
where C is an arbitrary sized set of quantity and rate pairs (q,r) thatmake up the costs for themodel, q represents unit quantities of the cur-rent cost item and r represents unit rate of the current cost item.
When text appears in the superscript of quantity or rate such asq[GIA] or r[GIA], it denotes the measurement class that the quantity orrate is with respect to (in this example gross internal area, or GIA),and where a number appears in the superscript of a the unit rate it rep-resents a position in the NRM hierarchy, for example r⟨1⟩ with super-script ⟨1⟩ denotes that the quantity and rates q⟨1⟩ is from the NRM‘1.Substructure’ group element.
Three quantity-based cost models are described in NRM for earlystage estimating purposes; i.e. the floor area model, functional unitmodel and elementalmodel. Thesemodels are all quantity-basedmodelscomprising various types of quantities and unit rates.
3.1. Workflow in LIDX
In LIDX, the cost model is selected (L1–L4) according to the levelof information available from the schematic design. The differentlevels of information were identified through a workflow study withthe architects and cost planners participating in the project. The iden-tified workflow is shown in Fig. 1, and comprises five processes:
1. Defining site boundary,2. Massing,3. Defining space with horizontal elements,4. Defining space with vertical elements and5. Defining specific components for individual elements.
3.1.1. Defining site boundaryThe workflow begins with the user defining the site boundary
using the site boundary function in the tool (see Fig. 4). The usermay select the location of their site using the existing Google Mapsfunctionality within SketchUp to geo-locate the site and import theselected map into SketchUp prior to the definition of a site boundary.Once the user has defined the site border over the importedmap LIDXcan calculate the site area.
3.1.2. MassingBefore the user can generate cost estimates, they first need to de-
fine the building profile of their intended building model, such as theuse type, structure type, and ground condition etc., to allow the sys-tem to infer the appropriate building material type, foundation mate-rial type and external work type to use in the calculation.
These inferences are determined based on rules suggested by ex-perienced architects that were consulted during the development ofthe tool. Further empirical studies can be done to ensure that the in-ference accurately reflects what designers want. LIDX does howeverlet the user change the inferred building element specifications asper the user's discretion subsequently if they choose to develop itsdesign further (see process 3 in Fig. 1).
Next the user masses out a simple shape of the building he wishesto cost using the usual SketchUp shape tools. In the background LIDXmonitors the shape as it changes and updates measurements automati-cally. This is an important consideration as the tool integrates tightlywith existing massing workflow approaches, and does not require a dif-ferent set of tools for the user to learn tomass their building. Fig. 5 showsa building mass created with the tool. While the user defines shape ofthe building, the estimated cost (i.e. L1 cost estimate) is updated bythe tool after each change to the building size and shape.
3.1.3. Defining space with horizontal elementsOnce the building mass is created and the user is satisfied with the
shape, he may start defining the vertical space of the building. The usercan decide the number of floors and the storey height, and LIDX auto-matically generates each floor for the mass model in SketchUp. Fig. 6ashows the building mass model with floors generated by LIDX basedon Fig. 5's model. In parallel to the automatic generation of buildingfloors, LIDX assumes default specifications for building elements to esti-mate building cost (i.e. L2 cost estimate). The user may change the spec-ifications of building elements in the cost library to customize the model.
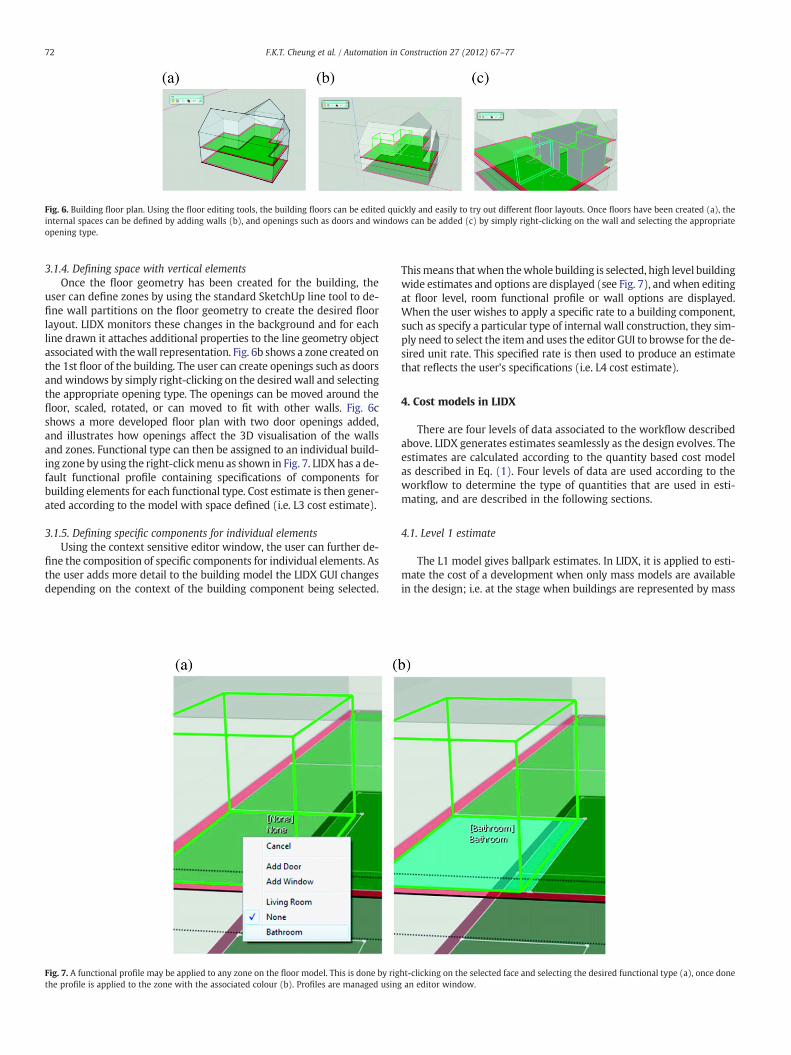
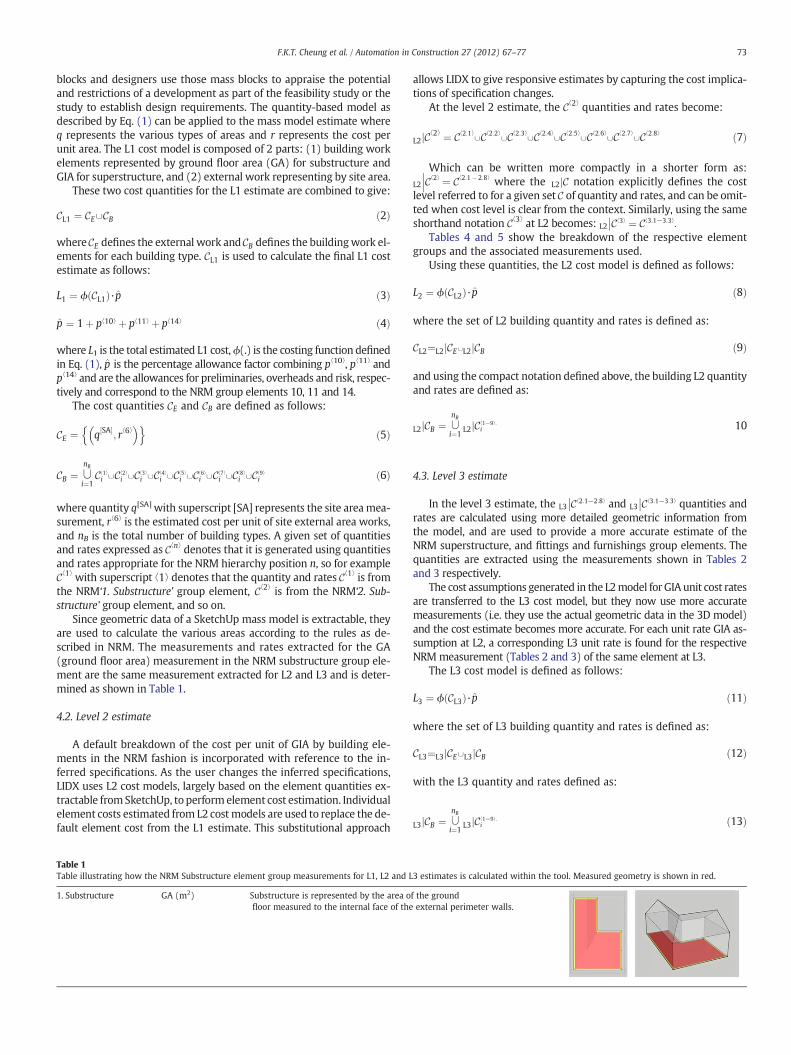
Fig. 6. Building floor plan. Using the floor editing tools, the building floors can be edited quickly and easily to try out different floor layouts. Once floors have been created (a), theinternal spaces can be defined by adding walls (b), and openings such as doors and windows can be added (c) by simply right-clicking on the wall and selecting the appropriateopening type.
72 F.K.T. Cheung et al. / Automation in Construction 27 (2012) 67–77
3.1.4. Defining space with vertical elementsOnce the floor geometry has been created for the building, the
user can define zones by using the standard SketchUp line tool to de-fine wall partitions on the floor geometry to create the desired floorlayout. LIDX monitors these changes in the background and for eachline drawn it attaches additional properties to the line geometry objectassociatedwith thewall representation. Fig. 6b shows a zone created onthe 1st floor of the building. The user can create openings such as doorsand windows by simply right-clicking on the desired wall and selectingthe appropriate opening type. The openings can be moved around thefloor, scaled, rotated, or can moved to fit with other walls. Fig. 6cshows a more developed floor plan with two door openings added,and illustrates how openings affect the 3D visualisation of the wallsand zones. Functional type can then be assigned to an individual build-ing zone by using the right-clickmenu as shown in Fig. 7. LIDX has a de-fault functional profile containing specifications of components forbuilding elements for each functional type. Cost estimate is then gener-ated according to the model with space defined (i.e. L3 cost estimate).
3.1.5. Defining specific components for individual elementsUsing the context sensitive editor window, the user can further de-
fine the composition of specific components for individual elements. Asthe user adds more detail to the building model the LIDX GUI changesdepending on the context of the building component being selected.
Fig. 7. A functional profile may be applied to any zone on the floor model. This is done by rigthe profile is applied to the zone with the associated colour (b). Profiles are managed using
Thismeans thatwhen thewhole building is selected, high level buildingwide estimates and options are displayed (see Fig. 7), andwhen editingat floor level, room functional profile or wall options are displayed.When the user wishes to apply a specific rate to a building component,such as specify a particular type of internal wall construction, they sim-ply need to select the item and uses the editor GUI to browse for the de-sired unit rate. This specified rate is then used to produce an estimatethat reflects the user's specifications (i.e. L4 cost estimate).
4. Cost models in LIDX
There are four levels of data associated to the workflow describedabove. LIDX generates estimates seamlessly as the design evolves. Theestimates are calculated according to the quantity based cost modelas described in Eq. (1). Four levels of data are used according to theworkflow to determine the type of quantities that are used in esti-mating, and are described in the following sections.
4.1. Level 1 estimate
The L1 model gives ballpark estimates. In LIDX, it is applied to esti-mate the cost of a development when only mass models are availablein the design; i.e. at the stage when buildings are represented by mass
ht-clicking on the selected face and selecting the desired functional type (a), once donean editor window.
73F.K.T. Cheung et al. / Automation in Construction 27 (2012) 67–77
blocks and designers use those mass blocks to appraise the potentialand restrictions of a development as part of the feasibility study or thestudy to establish design requirements. The quantity-based model asdescribed by Eq. (1) can be applied to the mass model estimate whereq represents the various types of areas and r represents the cost perunit area. The L1 cost model is composed of 2 parts: (1) building workelements represented by ground floor area (GA) for substructure andGIA for superstructure, and (2) external work representing by site area.
These two cost quantities for the L1 estimate are combined to give:
CL1 ¼ CE∪CB ð2Þ
whereCE defines the external work andCB defines the buildingwork el-ements for each building type. CL1 is used to calculate the final L1 costestimate as follows:
L1 ¼ ϕ CL1ð Þ·p̂ ð3Þ
p̂ ¼ 1þ p⟨10⟩ þ p⟨11⟩ þ p⟨14⟩ ð4Þ
where L1 is the total estimated L1 cost,ϕ(.) is the costing function definedin Eq. (1), p̂ is the percentage allowance factor combining p⟨10⟩, p⟨11⟩ andp⟨14⟩ and are the allowances for preliminaries, overheads and risk, respec-tively and correspond to the NRM group elements 10, 11 and 14.
The cost quantities CE and CB are defined as follows:
CE ¼ q SA½ �; r⟨6⟩
� �n oð5Þ
CB ¼ ∪nB
i¼1Ci
⟨1⟩∪Ci⟨2⟩∪Ci
⟨3⟩∪Ci⟨4⟩∪Ci
⟨5⟩∪Ci⟨6⟩∪Ci
⟨7⟩∪Ci⟨8⟩∪Ci
⟨9⟩ ð6Þ
where quantity q[SA] with superscript [SA] represents the site areamea-surement, r⟨6⟩ is the estimated cost per unit of site external area works,and nB is the total number of building types. A given set of quantitiesand rates expressed as C⟨n⟩ denotes that it is generated using quantitiesand rates appropriate for the NRM hierarchy position n, so for exampleC⟨1⟩ with superscript ⟨1⟩ denotes that the quantity and rates C⟨1⟩ is fromthe NRM‘1. Substructure’ group element, C⟨2⟩ is from the NRM‘2. Sub-structure’ group element, and so on.
Since geometric data of a SketchUp mass model is extractable, theyare used to calculate the various areas according to the rules as de-scribed in NRM. The measurements and rates extracted for the GA(ground floor area) measurement in the NRM substructure group ele-ment are the same measurement extracted for L2 and L3 and is deter-mined as shown in Table 1.
4.2. Level 2 estimate
A default breakdown of the cost per unit of GIA by building ele-ments in the NRM fashion is incorporated with reference to the in-ferred specifications. As the user changes the inferred specifications,LIDX uses L2 cost models, largely based on the element quantities ex-tractable fromSketchUp, to perform element cost estimation. Individualelement costs estimated from L2 costmodels are used to replace the de-fault element cost from the L1 estimate. This substitutional approach
Table 1Table illustrating how the NRM Substructure element group measurements for L1, L2 and L
1. Substructure GA (m2) Substructure is represented by the area ofloor measured to the internal face of the
allows LIDX to give responsive estimates by capturing the cost implica-tions of specification changes.
At the level 2 estimate, the C⟨2⟩ quantities and rates become:
L2jC⟨2⟩ ¼ C⟨2:1⟩∪C⟨2:2⟩
∪C⟨2:3⟩∪C⟨2:4⟩
∪C⟨2:5⟩∪C⟨2:6⟩
∪C⟨2:7⟩∪C⟨2:8⟩ ð7Þ
Which can be written more compactly in a shorter form as:L2 C⟨2⟩ ¼ C⟨2:1� 2:8⟩��� where the L2 Cj notation explicitly defines the cost
level referred to for a given set C of quantity and rates, and can be omit-ted when cost level is clear from the context. Similarly, using the sameshorthand notation C⟨3⟩ at L2 becomes: L2 C⟨3⟩ ¼ C⟨3:1−3:3⟩:
��Tables 4 and 5 show the breakdown of the respective element
groups and the associated measurements used.Using these quantities, the L2 cost model is defined as follows:
L2 ¼ ϕ CL2ð Þ·p̂ ð8Þ
where the set of L2 building quantity and rates is defined as:
CL2¼L2 CE∪L2j jCB ð9Þ
and using the compact notation defined above, the building L2 quantityand rates are defined as:
L2jCB ¼ ∪nB
i¼1L2jCi
⟨1−9⟩: 10
4.3. Level 3 estimate
In the level 3 estimate, the L3 C⟨2:1−2:8⟩�� and L3 C⟨3:1−3:3⟩
�� quantities andrates are calculated using more detailed geometric information fromthe model, and are used to provide a more accurate estimate of theNRM superstructure, and fittings and furnishings group elements. Thequantities are extracted using the measurements shown in Tables 2and 3 respectively.
The cost assumptions generated in the L2model for GIA unit cost ratesare transferred to the L3 cost model, but they now use more accuratemeasurements (i.e. they use the actual geometric data in the 3D model)and the cost estimate becomes more accurate. For each unit rate GIA as-sumption at L2, a corresponding L3 unit rate is found for the respectiveNRMmeasurement (Tables 2 and 3) of the same element at L3.
The L3 cost model is defined as follows:
L3 ¼ ϕ CL3ð Þ·p̂ ð11Þ
where the set of L3 building quantity and rates is defined as:
CL3¼L3 CE∪L3j jCB ð12Þ
with the L3 quantity and rates defined as:
L3jCB ¼ ∪nB
i¼1L3jCi
⟨1−9⟩: ð13Þ
3 estimates is calculated within the tool. Measured geometry is shown in red.
f the groundexternal perimeter walls.
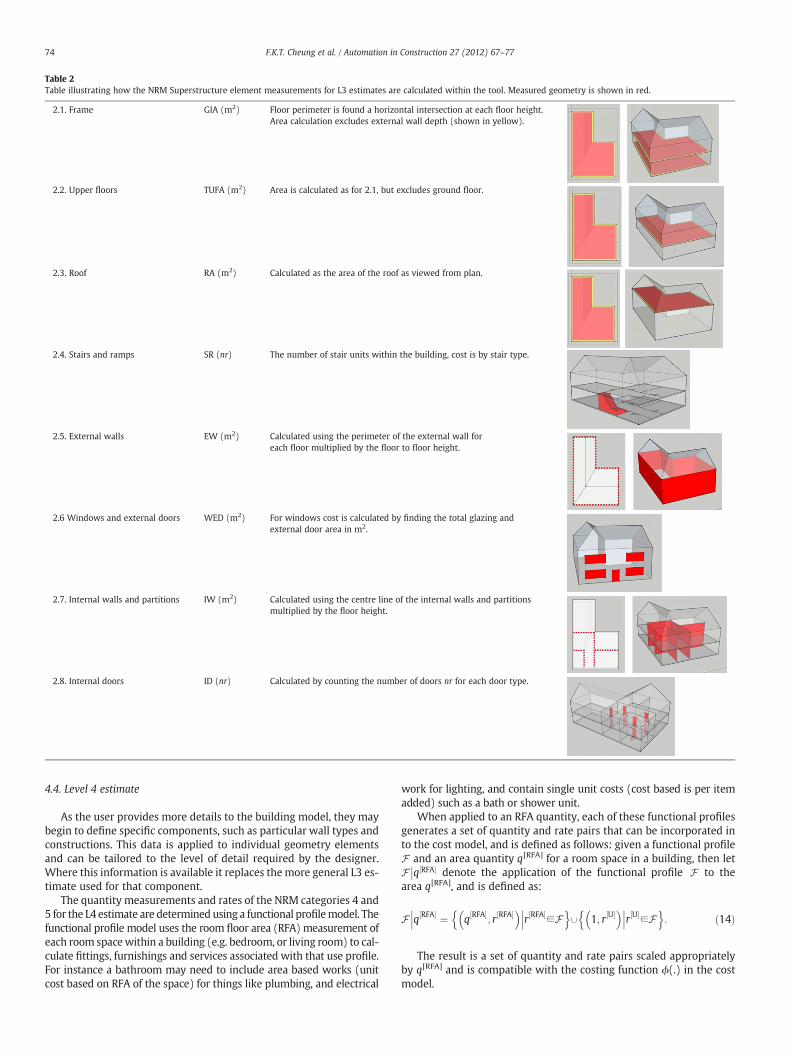
Table 2Table illustrating how the NRM Superstructure element measurements for L3 estimates are calculated within the tool. Measured geometry is shown in red.
2.1. Frame GIA (m2) Floor perimeter is found a horizontal intersection at each floor height.Area calculation excludes external wall depth (shown in yellow).
2.2. Upper floors TUFA (m2) Area is calculated as for 2.1, but excludes ground floor.
2.3. Roof RA (m2) Calculated as the area of the roof as viewed from plan.
2.4. Stairs and ramps SR (nr) The number of stair units within the building, cost is by stair type.
2.5. External walls EW (m2) Calculated using the perimeter of the external wall foreach floor multiplied by the floor to floor height.
2.6 Windows and external doors WED (m2) For windows cost is calculated by finding the total glazing andexternal door area in m2.
2.7. Internal walls and partitions IW (m2) Calculated using the centre line of the internal walls and partitionsmultiplied by the floor height.
2.8. Internal doors ID (nr) Calculated by counting the number of doors nr for each door type.
74 F.K.T. Cheung et al. / Automation in Construction 27 (2012) 67–77
4.4. Level 4 estimate
As the user provides more details to the building model, they maybegin to define specific components, such as particular wall types andconstructions. This data is applied to individual geometry elementsand can be tailored to the level of detail required by the designer.Where this information is available it replaces the more general L3 es-timate used for that component.
The quantity measurements and rates of the NRM categories 4 and5 for the L4 estimate are determined using a functional profilemodel. Thefunctional profile model uses the room floor area (RFA) measurement ofeach room spacewithin a building (e.g. bedroom, or living room) to cal-culate fittings, furnishings and services associated with that use profile.For instance a bathroom may need to include area based works (unitcost based on RFA of the space) for things like plumbing, and electrical
work for lighting, and contain single unit costs (cost based is per itemadded) such as a bath or shower unit.
When applied to an RFA quantity, each of these functional profilesgenerates a set of quantity and rate pairs that can be incorporated into the cost model, and is defined as follows: given a functional profileF and an area quantity q[RFA] for a room space in a building, then letF q RFA½ ��� denote the application of the functional profile F to thearea q[RFA], and is defined as:
F q RFA½ � ¼ q RFA½ �; r RFA½ �� �
r RFA½ �∈F���
o∪ 1; r U½ �� �
r U½ �∈F���
o:
nn��� ð14Þ
The result is a set of quantity and rate pairs scaled appropriatelyby q[RFA] and is compatible with the costing function ϕ(.) in the costmodel.
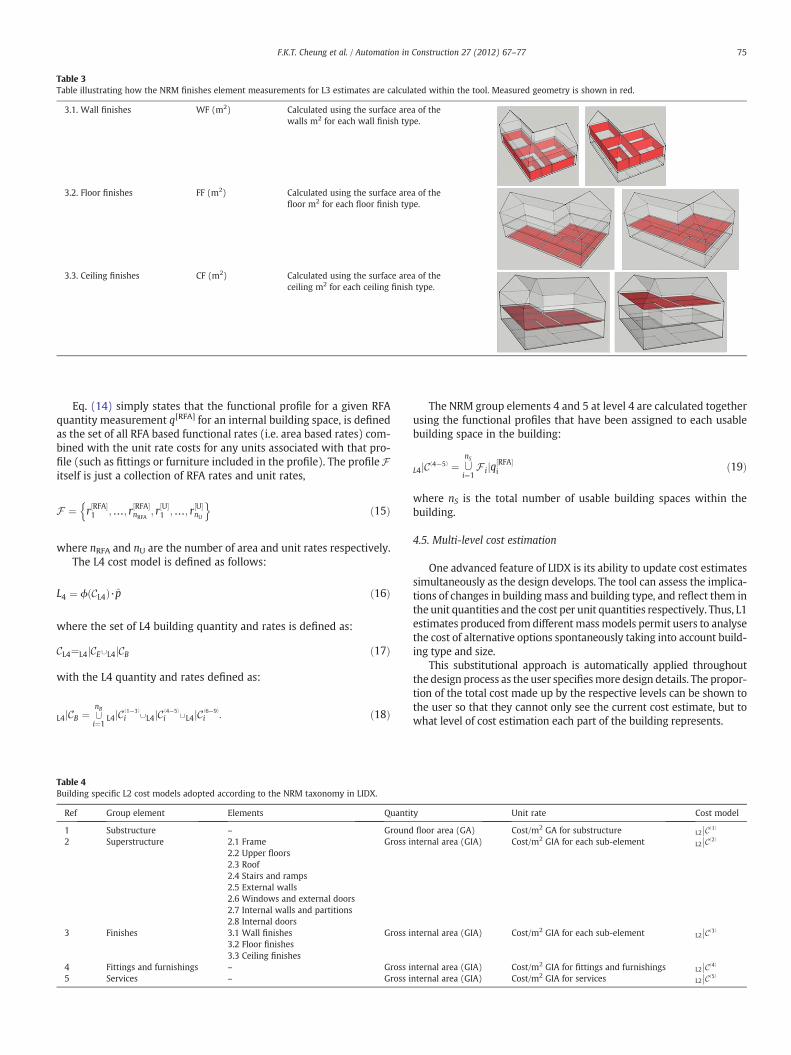
Table 3Table illustrating how the NRM finishes element measurements for L3 estimates are calculated within the tool. Measured geometry is shown in red.
3.1. Wall finishes WF (m2) Calculated using the surface area of thewalls m2 for each wall finish type.
3.2. Floor finishes FF (m2) Calculated using the surface area of thefloor m2 for each floor finish type.
3.3. Ceiling finishes CF (m2) Calculated using the surface area of theceiling m2 for each ceiling finish type.
75F.K.T. Cheung et al. / Automation in Construction 27 (2012) 67–77
Eq. (14) simply states that the functional profile for a given RFAquantity measurement q[RFA] for an internal building space, is definedas the set of all RFA based functional rates (i.e. area based rates) com-bined with the unit rate costs for any units associated with that pro-file (such as fittings or furniture included in the profile). The profileFitself is just a collection of RFA rates and unit rates,
F ¼ r RFA½ �1 ;…; r RFA½ �
nRFA; r U½ �
1 ;…; r U½ �nU
n oð15Þ
where nRFA and nU are the number of area and unit rates respectively.The L4 cost model is defined as follows:
L4 ¼ ϕ CL4ð Þ·p̂ ð16Þ
where the set of L4 building quantity and rates is defined as:
CL4¼L4 CE∪L4j jCB ð17Þ
with the L4 quantity and rates defined as:
L4jCB ¼ ∪nB
i¼1L4jCi⟨1−3⟩
∪L4jCi⟨4−5⟩∪L4jCi⟨6−9⟩
: ð18Þ
Table 4Building specific L2 cost models adopted according to the NRM taxonomy in LIDX.
Ref Group element Elements Quanti
1 Substructure – Ground2 Superstructure 2.1 Frame Gross i
2.2 Upper floors2.3 Roof2.4 Stairs and ramps2.5 External walls2.6 Windows and external doors2.7 Internal walls and partitions2.8 Internal doors
3 Finishes 3.1 Wall finishes Gross i3.2 Floor finishes3.3 Ceiling finishes
4 Fittings and furnishings – Gross i5 Services – Gross i
The NRM group elements 4 and 5 at level 4 are calculated togetherusing the functional profiles that have been assigned to each usablebuilding space in the building:
L4jC⟨4−5⟩ ¼ ∪nS
i¼1F ijq RFA½ �
i ð19Þ
where nS is the total number of usable building spaces within thebuilding.
4.5. Multi-level cost estimation
One advanced feature of LIDX is its ability to update cost estimatessimultaneously as the design develops. The tool can assess the implica-tions of changes in buildingmass and building type, and reflect them inthe unit quantities and the cost per unit quantities respectively. Thus, L1estimates produced from differentmassmodels permit users to analysethe cost of alternative options spontaneously taking into account build-ing type and size.
This substitutional approach is automatically applied throughoutthe design process as the user specifiesmore design details. The propor-tion of the total cost made up by the respective levels can be shown tothe user so that they cannot only see the current cost estimate, but towhat level of cost estimation each part of the building represents.
ty Unit rate Cost model
floor area (GA) Cost/m2 GA for substructure L2 C⟨1⟩��
nternal area (GIA) Cost/m2 GIA for each sub-element L2 C⟨2⟩��
nternal area (GIA) Cost/m2 GIA for each sub-element L2 C⟨3⟩��
nternal area (GIA) Cost/m2 GIA for fittings and furnishings L2 C⟨4⟩��
nternal area (GIA) Cost/m2 GIA for services L2 C⟨5⟩��
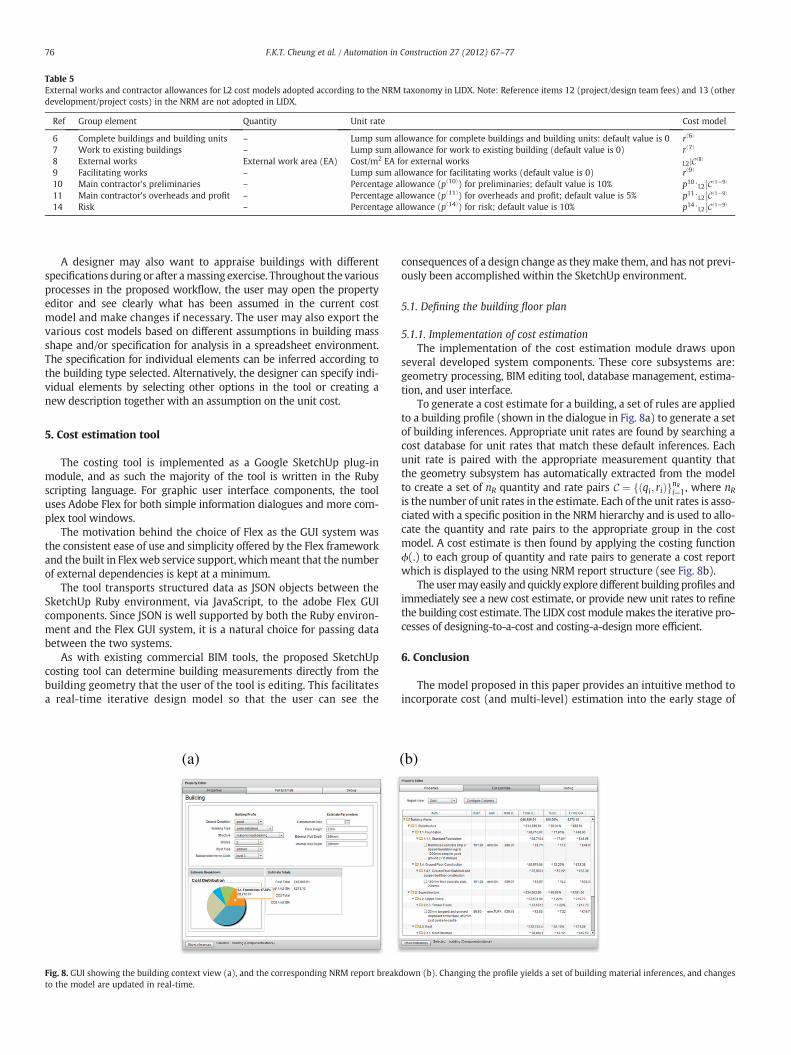
Table 5External works and contractor allowances for L2 cost models adopted according to the NRM taxonomy in LIDX. Note: Reference items 12 (project/design team fees) and 13 (otherdevelopment/project costs) in the NRM are not adopted in LIDX.
Ref Group element Quantity Unit rate Cost model
6 Complete buildings and building units – Lump sum allowance for complete buildings and building units: default value is 0 r⟨6⟩
7 Work to existing buildings – Lump sum allowance for work to existing building (default value is 0) r⟨7⟩
8 External works External work area (EA) Cost/m2 EA for external works L2jC⟨8⟩
9 Facilitating works – Lump sum allowance for facilitating works (default value is 0) r⟨9⟩
10 Main contractor's preliminaries – Percentage allowance (p⟨10⟩) for preliminaries; default value is 10% p10⋅L2 C⟨1−9⟩��
11 Main contractor's overheads and profit – Percentage allowance (p⟨11⟩) for overheads and profit; default value is 5% p11⋅L2 C⟨1−9⟩��
14 Risk – Percentage allowance (p⟨14⟩) for risk; default value is 10% p14⋅L2 C⟨1−9⟩��
76 F.K.T. Cheung et al. / Automation in Construction 27 (2012) 67–77
A designer may also want to appraise buildings with differentspecifications during or after amassing exercise. Throughout the variousprocesses in the proposed workflow, the user may open the propertyeditor and see clearly what has been assumed in the current costmodel and make changes if necessary. The user may also export thevarious cost models based on different assumptions in building massshape and/or specification for analysis in a spreadsheet environment.The specification for individual elements can be inferred according tothe building type selected. Alternatively, the designer can specify indi-vidual elements by selecting other options in the tool or creating anew description together with an assumption on the unit cost.
5. Cost estimation tool
The costing tool is implemented as a Google SketchUp plug-inmodule, and as such the majority of the tool is written in the Rubyscripting language. For graphic user interface components, the tooluses Adobe Flex for both simple information dialogues and more com-plex tool windows.
The motivation behind the choice of Flex as the GUI system wasthe consistent ease of use and simplicity offered by the Flex frameworkand the built in Flexweb service support, whichmeant that the numberof external dependencies is kept at a minimum.
The tool transports structured data as JSON objects between theSketchUp Ruby environment, via JavaScript, to the adobe Flex GUIcomponents. Since JSON is well supported by both the Ruby environ-ment and the Flex GUI system, it is a natural choice for passing databetween the two systems.
As with existing commercial BIM tools, the proposed SketchUpcosting tool can determine building measurements directly from thebuilding geometry that the user of the tool is editing. This facilitatesa real-time iterative design model so that the user can see the
(a)
Fig. 8. GUI showing the building context view (a), and the corresponding NRM report breakto the model are updated in real-time.
consequences of a design change as theymake them, and has not previ-ously been accomplished within the SketchUp environment.
5.1. Defining the building floor plan
5.1.1. Implementation of cost estimationThe implementation of the cost estimation module draws upon
several developed system components. These core subsystems are:geometry processing, BIM editing tool, database management, estima-tion, and user interface.
To generate a cost estimate for a building, a set of rules are appliedto a building profile (shown in the dialogue in Fig. 8a) to generate a setof building inferences. Appropriate unit rates are found by searching acost database for unit rates that match these default inferences. Eachunit rate is paired with the appropriate measurement quantity thatthe geometry subsystem has automatically extracted from the modelto create a set of nR quantity and rate pairs C ¼ qi; rið Þf gnRi¼1, where nRis the number of unit rates in the estimate. Each of the unit rates is asso-ciated with a specific position in the NRM hierarchy and is used to allo-cate the quantity and rate pairs to the appropriate group in the costmodel. A cost estimate is then found by applying the costing functionϕ(.) to each group of quantity and rate pairs to generate a cost reportwhich is displayed to the using NRM report structure (see Fig. 8b).
The usermay easily and quickly explore different building profiles andimmediately see a new cost estimate, or provide new unit rates to refinethe building cost estimate. The LIDX cost modulemakes the iterative pro-cesses of designing-to-a-cost and costing-a-design more efficient.
6. Conclusion
The model proposed in this paper provides an intuitive method toincorporate cost (and multi-level) estimation into the early stage of
(b)
down (b). Changing the profile yields a set of building material inferences, and changes

77F.K.T. Cheung et al. / Automation in Construction 27 (2012) 67–77
design. This prototype system has been implemented as a modulewithin the free version of Google SketchUp, however the paradigmcan be easily applied in other editing environments, and could be in-tegrated into higher end systems for early stage estimation.
This study has also demonstrated that the SketchUp environmentcan be augmented to include a simple early stage BIM system, withthe intention of addressing the misconception that it is impossible touse as a BIM tool, and potentially paving theway formore developmentof similar BIM tools in this area.
LIDX is composed of a number of modules. For instance, thegbXML module from within LIDX is able to export building data di-rectly into the other energy simulation software (e.g. DesignBuilder)for energy assessment, to demonstrate interoperability. To do this theinternal LIDX representation of an early stage building designed usingthe LIDX tool (which is modelled internally as a hierarchy of buildingobjects and components) is interpreted for export into the gbXML for-mat. From this representation, the building's 3D geometry is automati-cally created from the 2D schematic floor representation using aconstructive geometry inspired approach and building part associationsand properties. However, given that this paper focuses on presentingthe early stage design cost module from within LIDX, the implementa-tion details of the other modules are left for discussion in future work.More information about the modules in the LIDX system can be foundin the video demonstrations published on the project's YouTube chan-nel, http://www.youtube.com/user/tsbLIB/videos.
In future versions of the prototype, the early stage BIM data struc-tures created using the tool could also be exported in a format thatcan then be imported by other tools such as Revit using standardssuch as IFC. The exported model can then be developed further withinthe design tools, allowing themodel to be carried through the completedesign process.
Acknowledgements
This researchwas supported by theDesign and Decision Tools for LowImpact Buildings grant (Project No. 400151) from the UK TechnologyStrategy Board (TSB) and Engineering and Physical Sciences ResearchCouncil (EPSRC). The authors would also like to thank the participatingindustrial partners of the research project, Best Foot Forward, ZedfactoryLtd., DesignBuilder Software Ltd. and advisor it sO works, for their contri-bution to the study.
References
[1] Allen Consulting Group, Productivity in the buildings network: assessing the im-pacts of building information models, Report to the Built Environment Innovationand Industry Council, October 2010.
[2] Y. Arayici, P. Coates, L. Koskela, M. Kagioglou, C. Usher, K. O'Reilly, Technologyadoption in the BIM implementation for lean architectural practice, Automationin Construction (2010).
[3] S. Azhar, M. Hein, B. Sketo, Building information modeling (BIM): benefits, risks andchallenges, Proceedings of the 44th ASC Annual Conference, Auburn, Alabama,2-5 Apr 2008, pp. 627–634.
[4] P.G. Bernstein, J.H. Pittman, Barriers to the Adoption of Building InformationModeling in the Building Industry, Autodesk Building Solutions, San Rafael, CA,2004.
[5] J. Buchanan, Development of a cost model for the reinforced concrete frame of abuilding, M. Sc. Project Report, Department of Civil Engineering, LoughboroughUniversity of Technology, 1969.
[6] A. Cavieres, R. Gentry, T. Al-Haddad, Knowledge-based parametric tools for con-crete masonry walls: conceptual design and preliminary structural analysis, Au-tomation in Construction 20 (6) (2011) 716–728.
[7] K. Chau, Monte Carlo simulation of construction costs using subjective data, Con-struction Management and Economics 13 (5) (1995) 369–383.
[8] C. Eastman, Modeling of buildings: evolution and concepts, Automation in Con-struction 1 (2) (1992) 99–109.
[9] C. Eastman, P. Teicholz, R. Sacks, K. Liston, BIM Handbook: A Guide to Building In-formation Modeling for Owners, Managers, Architects, Engineers, Contractors,and Fabricators, John Wiley and Sons, NJ, 2008.
[10] M. Emsley, D. Lowe, A. Duff, A. Harding, A. Hickson, Data modelling and the appli-cation of a neural network approach to the prediction of total construction costs,Construction Management and Economics 20 (6) (2002) 465–472.
[11] W. Fabrycky, B. Blanchard, Life-cycle Cost and Economic Analysis, Prentice Hall,1991.
[12] S. Fenves, H. Rivard, N. Gomez, Seed-config: a tool for conceptual structuraldesign in a collaborative building design environment, Artificial Intelligence inEngineering 14 (3) (2000) 233–247.
[13] R. Flanagan, G. Norman, The relationship between construction price and height,Chartered Surveyor Building and Quantity Surveying Quarterly 5 (4) (1978)68–71.
[14] Franklin andAndrews, UKBuilding Blackbook: The Cost and CarbonGuideHutchins:2011, Franklin and Andrews, 2010.
[15] J. Gao, M. Fischer, Framework and Case Studies Comparing Implementations andImpacts of 3D/4D Modeling across Projects, Center for Integrated Facility Engi-neering Technical Report #TR172, March 2008, Stanford University.
[16] A. Grilo, R. Jardim-Goncalves, Challenging electronic procurement in the AEC sec-tor: a BIM-based integrated perspective, Automation in Construction 20 (2)(2011) 107–114.
[17] N. Gu, K. London, Understanding and facilitating BIM adoption in the AEC indus-try, Automation in Construction 19 (8) (2010) 988–999.
[18] R. Jardim-Goncalves, A. Grilo, Building information modeling and interoperabili-ty, Automation in Construction 19 (4) (2010) 388–397.
[19] Y. Jeong, C. Eastman, R. Sacks, I. Kaner, Benchmark tests for BIM data exchanges ofprecast concrete, Automation in Construction 18 (4) (2009) 469–484.
[20] G. Kim, J. Yoon, S. An, H. Cho, K. Kang, Neural network model incorporating a ge-netic algorithm in estimating construction costs, Building and Environment 39(11) (2004) 1333–1340.
[21] V. Kouskoulas, E. Koehn, Predesign cost-estimation function for buildings, Journalof the Construction Division 100 (4) (1974) 589–604.
[22] D. Langdon, Spon's Architects' and Builders' Price Book 2011, , 2010.[23] H. Li, Neural networks for construction cost estimation, Building Research & In-
formation 23 (5) (1995) 279–284.[24] R. McCaffer, Some examples of the use of regression analysis as an estimating
tool, The Quantity Surveyor 8 (1975) 1–6.[25] McGraw Hill Construction, Interoperability in the Construction Industry.
SmartMarket Report, Interoperability Issue, , 2007.[26] McGraw Hill Construction, Interoperability in the Construction Industry.
SmartMarket Report — The Business Value of BIM, 2009.[27] National Institute of Building Sciences, United States National Building Information
Modeling Standard Version 1 - Part 1: Overview, Principles, and Methodologies,Final Report, December 2007.
[28] S. Hamil,What BIM is andHow It is Being Used, CIBSE BIM:who benefits? conferencepresentation. 2nd December 2010.
[29] The American Institute of Architects, Integrated Project Delivery: A Guide, Version 1,2007.
[30] J. Plume, J. Mitchell, Collaborative design using a shared IFC building model —learning from experience, Automation in Construction 16 (1) (2007) 28–36.
[31] R. Sacks, C. Eastman, G. Lee, Parametric 3D modeling in building constructionwith examples from precast concrete, Automation in Construction 13 (3)(2004) 291–312.
[32] R. Sacks, I. Kaner, C. Eastman, Y. Jeong, The Rosewood experiment — building in-formation modeling and interoperability for architectural precast facades, Auto-mation in Construction 19 (4) (2010) 419–432.
[33] A. Saeed Karshenas, Predesign cost estimating method for multistory buildings,Journal of Construction Engineering and Management 110 (1984) 79.
[34] F. Schultmann, N. Sunke, Study on the Future Opportunities and Challenges ofEU-China Trade and Investment Relations — Study 9: Construction, EuropeanCommission Trade, 2007.
[35] Service, B. C. I., BCIS Wessex Comprehensive Building Price Book 2011–2012,Royal Institution of Chartered Surveyors (RICS), 2011.
[36] W. Shen, Q. Shen, Q. Sun, Building informationmodeling-based user activity simula-tion and evaluationmethod for improving designer–user communications, Automa-tion in Construction 21 (1) (2012) 148–160.
[37] R. Skitmore, B. Patchell, Developments in contract price forecasting and biddingtechniques, Quantity Surveying Techniques: New Directions, BSP ProfessionalBooks, London, 1990, pp. 75–120.
[38] Stanford University Centre for Integrated Facility Engineering, Specific ReportNeeded. Center for Integrated Engineering: CIFE Technical Reports, , 2007.
[39] R. Tilyard, RICS New Rules of Measurement, Royal Institution of Chartered Sur-veyors (RICS), 2009.
[40] Ž. Turk, Phenomenologial foundations of conceptual product modelling in archi-tecture, engineering and construction, Artificial Intelligence in Engineering 15(2) (2001) 83–92.
[41] L. Wang, W. Shen, H. Xie, J. Neelamkavil, A. Pardasani, Collaborative conceptualdesign — state of the art and future trends, Computer-Aided Design 34 (13)(2002) 981–996.