no-cost/low-cost energy savings guide - sustainable
TRANSCRIPT
No-Cost/Low-Cost Energy Savings Guide
Christine DoonanEditorBuilding Operator Certification Program’s BOC Bulletin
Alan Kakaley, PEPrincipalDemand Side Engineering, P.S.
Jim Volkman, PEPrincipalStrategic Energy Group
Brad L. Weaver, PEPrincipalNorthwest Energy Consulting
Sustainability “How-To Guide” Series
i
2010 IFMA Foundation
SUSTAINABILIT Y GUIDE - NO-COST/LOW-COST ENERGY SAVINGS GUIDE
TABLE OF CONTENTS
Acknowledgements . . . . . . . . . . . . . . . . . . . . . . . . . . . . . . . . . . . . . . . . . . . . . . . . . . . . . . . . . . . . . . . . . . . . . . . . . . . . . . . . . . . . . . 1
About the Authors . . . . . . . . . . . . . . . . . . . . . . . . . . . . . . . . . . . . . . . . . . . . . . . . . . . . . . . . . . . . . . . . . . . . . . . . . . . . . . . . . . . . . . . . 2
Forward . . . . . . . . . . . . . . . . . . . . . . . . . . . . . . . . . . . . . . . . . . . . . . . . . . . . . . . . . . . . . . . . . . . . . . . . . . . . . . . . . . . . . . . . . . . . . . 3
Part 1: Executive Summary. . . . . . . . . . . . . . . . . . . . . . . . . . . . . . . . . . . . . . . . . . . . . . . . . . . . . . . . . . . . . . . . . . . . . . . . . . . . . . . . . 5
Part 2: Introduction . . . . . . . . . . . . . . . . . . . . . . . . . . . . . . . . . . . . . . . . . . . . . . . . . . . . . . . . . . . . . . . . . . . . . . . . . . . . . . . . . . . . . . . 7
2.1 Key Practices to Start: Develop a Building Systems Operations Map . . . . . . . . . . . . . . . . . . . . . . . . . . . . . . . . . . . . . 7 2.2 Sample Templates . . . . . . . . . . . . . . . . . . . . . . . . . . . . . . . . . . . . . . . . . . . . . . . . . . . . . . . . . . . . . . . . . . . . . . . . . . . . 9
Part 3: Detailed Findings: The Top Four Savings Opportunities . . . . . . . . . . . . . . . . . . . . . . . . . . . . . . . . . . . . . . . . . . . . . . . . . . . . 13
3.1 Equipment Scheduling . . . . . . . . . . . . . . . . . . . . . . . . . . . . . . . . . . . . . . . . . . . . . . . . . . . . . . . . . . . . . . . . . . . . . . . . 13 3.1.1 Lighting . . . . . . . . . . . . . . . . . . . . . . . . . . . . . . . . . . . . . . . . . . . . . . . . . . . . . . . . . . . . . . . . . . . . . . . . . . . . . . . . . . 13 3.1.2 Plug and Process Loads . . . . . . . . . . . . . . . . . . . . . . . . . . . . . . . . . . . . . . . . . . . . . . . . . . . . . . . . . . . . . . . . . . . . . 14 3.1.3 Fan Systems . . . . . . . . . . . . . . . . . . . . . . . . . . . . . . . . . . . . . . . . . . . . . . . . . . . . . . . . . . . . . . . . . . . . . . . . . . . . . . 14 3.1.4 Chiller and Boiler Availability . . . . . . . . . . . . . . . . . . . . . . . . . . . . . . . . . . . . . . . . . . . . . . . . . . . . . . . . . . . . . . . . . . 14 3.1.5 Pumps . . . . . . . . . . . . . . . . . . . . . . . . . . . . . . . . . . . . . . . . . . . . . . . . . . . . . . . . . . . . . . . . . . . . . . . . . . . . . . . . . . . 15
3.2 Sensor Error . . . . . . . . . . . . . . . . . . . . . . . . . . . . . . . . . . . . . . . . . . . . . . . . . . . . . . . . . . . . . . . . . . . . . . . . . . . . . . . 15
3.3 Simultaneous Heating and Cooling . . . . . . . . . . . . . . . . . . . . . . . . . . . . . . . . . . . . . . . . . . . . . . . . . . . . . . . . . . . . . . 16 3.3.1 Example of Normal Operation: Temperature . . . . . . . . . . . . . . . . . . . . . . . . . . . . . . . . . . . . . . . . . . . . . . . . . . . . . 16 3.3.2 Example of Abnormal Operation: Temperature Problem . . . . . . . . . . . . . . . . . . . . . . . . . . . . . . . . . . . . . . . . . . . . . 16 3.3.3 Example of Normal Operation: Controlled Building Pressure . . . . . . . . . . . . . . . . . . . . . . . . . . . . . . . . . . . . . . . . . 17 3.3.4 Example of Abnormal Operation: Pressure Problem . . . . . . . . . . . . . . . . . . . . . . . . . . . . . . . . . . . . . . . . . . . . . . . 17
3.4 Outside Air Usage . . . . . . . . . . . . . . . . . . . . . . . . . . . . . . . . . . . . . . . . . . . . . . . . . . . . . . . . . . . . . . . . . . . . . . . . . . . 18 3.4.1 Economizers . . . . . . . . . . . . . . . . . . . . . . . . . . . . . . . . . . . . . . . . . . . . . . . . . . . . . . . . . . . . . . . . . . . . . . . . . . . . . . 18 3.4.2 Scheduling . . . . . . . . . . . . . . . . . . . . . . . . . . . . . . . . . . . . . . . . . . . . . . . . . . . . . . . . . . . . . . . . . . . . . . . . . . . . . . . . 18 3.4.3 Demand Controlled Ventilation . . . . . . . . . . . . . . . . . . . . . . . . . . . . . . . . . . . . . . . . . . . . . . . . . . . . . . . . . . . . . . . . 18 3.4.4 Fixed Air Systems . . . . . . . . . . . . . . . . . . . . . . . . . . . . . . . . . . . . . . . . . . . . . . . . . . . . . . . . . . . . . . . . . . . . . . . . . . 18 3.4.5 Energy Impacts . . . . . . . . . . . . . . . . . . . . . . . . . . . . . . . . . . . . . . . . . . . . . . . . . . . . . . . . . . . . . . . . . . . . . . . . . . . . 18
3.5 No-Cost and Low-Cost Energy Saving Strategies . . . . . . . . . . . . . . . . . . . . . . . . . . . . . . . . . . . . . . . . . . . . . . . . . . . 19 3.5.1 Using the Energy Use Index (EUI) and Benchmarking . . . . . . . . . . . . . . . . . . . . . . . . . . . . . . . . . . . . . . . . . . . . . . 19 3.5.2 The Benefits of Developing a Strategic Energy Management Plan (SEMP) . . . . . . . . . . . . . . . . . . . . . . . . . . . . . 19
Part 4: Making the Business Case . . . . . . . . . . . . . . . . . . . . . . . . . . . . . . . . . . . . . . . . . . . . . . . . . . . . . . . . . . . . . . . . . . . . . . . . . . 20
Part 5: Case Studies . . . . . . . . . . . . . . . . . . . . . . . . . . . . . . . . . . . . . . . . . . . . . . . . . . . . . . . . . . . . . . . . . . . . . . . . . . . . . . . . . . . . . 21
5.1 Kaiser Permanente . . . . . . . . . . . . . . . . . . . . . . . . . . . . . . . . . . . . . . . . . . . . . . . . . . . . . . . . . . . . . . . . . . . . . . . . . . . 21 5.1.1 Building Tune-Up . . . . . . . . . . . . . . . . . . . . . . . . . . . . . . . . . . . . . . . . . . . . . . . . . . . . . . . . . . . . . . . . . . . . . . . . . . . 21 5.1.2 Enhanced Operations and Maintenance . . . . . . . . . . . . . . . . . . . . . . . . . . . . . . . . . . . . . . . . . . . . . . . . . . . . . . . . . 21 5.1.3 Results. . . . . . . . . . . . . . . . . . . . . . . . . . . . . . . . . . . . . . . . . . . . . . . . . . . . . . . . . . . . . . . . . . . . . . . . . . . . . . . . . . . 22 5.1.4 Future Plans . . . . . . . . . . . . . . . . . . . . . . . . . . . . . . . . . . . . . . . . . . . . . . . . . . . . . . . . . . . . . . . . . . . . . . . . . . . . . . 22
5.2 Boston Edison Building. . . . . . . . . . . . . . . . . . . . . . . . . . . . . . . . . . . . . . . . . . . . . . . . . . . . . . . . . . . . . . . . . . . . . . . . 22
5.3 Joe Serna Jr. Building. . . . . . . . . . . . . . . . . . . . . . . . . . . . . . . . . . . . . . . . . . . . . . . . . . . . . . . . . . . . . . . . . . . . . . . . . 23
5.4 Conclusion . . . . . . . . . . . . . . . . . . . . . . . . . . . . . . . . . . . . . . . . . . . . . . . . . . . . . . . . . . . . . . . . . . . . . . . . . . . . . . . . . 24
Part 6: Appendices . . . . . . . . . . . . . . . . . . . . . . . . . . . . . . . . . . . . . . . . . . . . . . . . . . . . . . . . . . . . . . . . . . . . . . . . . . . . . . . . . . . . . . 25
6.1 Appendix A: References . . . . . . . . . . . . . . . . . . . . . . . . . . . . . . . . . . . . . . . . . . . . . . . . . . . . . . . . . . . . . . . . . . . . . . . 25
6.2 Appendix B: Additional Resources . . . . . . . . . . . . . . . . . . . . . . . . . . . . . . . . . . . . . . . . . . . . . . . . . . . . . . . . . . . . . . . 26
6.3 Appendix C: Glossary . . . . . . . . . . . . . . . . . . . . . . . . . . . . . . . . . . . . . . . . . . . . . . . . . . . . . . . . . . . . . . . . . . . . . . . . . 26
1
2010 IFMA Foundation
SUSTAINABILIT Y GUIDE - NO-COST/LOW-COST ENERGY SAVINGS GUIDE
This guide has been compiled from information provided by a collective of contributing writers to the BetterBricks Web site . BetterBricks is the commercial building initiative of the Northwest Energy Efficiency Alliance (NEEA), which is supported by local electric utilities in the Northwest. Through the BetterBricks initiative, NEEA advocates for changes to energy-related business practices in the area’s buildings, includ-ing a specific effort targeting building operations professionals in the use of best practices to maxi-mize building performance. In this era of height-
ened appreciation for the impact climate change is having on our environment and our economy, en-ergy efficiency is a crucial component to address global warming. The goal of the BetterBricks initiative is to provide building professionals with information, tools, training and resources to help them make energy efficiency a core strategy of building operations and the financial bottom line.
— Christine Doonan, Alan Kakaley, Jim Volkman, Brad L. Weaver
ACKNOWLEDGEMENTS
External Reviewer:Cynthia Putnam, Northwest Energy Efficiency Council
Editorial Board:Eric Teicholz, Executive Editor, IFMA Fellow, President, Graphic Systems John McGee, Chief Operating Officer, Ice Energy Andrea Sanchez, Director of Communications, Editor-in-Chief, Facility Management Journal, IFMA Craig Zurawski, Executive Director, Alliance for Sustainable Built Environments (ASBE) Chris Hodges, PE, LEED AP, CFM, IFMA Fellow, Principal, Facility Engineering Associates Shari Epstein, Director, Research, IFMA Charlie Claar, PE, CFM, CFMJ, Director, Academic Affairs, IFMA FoundationIsilay Civan, PhD2 , LEED AP, Strategic Planner, HOK
Advisory BoardNancy Sanquist, IFMA Fellow, Director of Marketing, Manhattan/Centerstone Cynthia Putnam, CSBA, Project Director, Northwest Energy Efficiency CouncilMarc Liciardello, CFM, MBA CM, Vice President, Corporate Services, ARAMARK
Editorial Assistant Angela Lewis, LEED AP, PhD Candidate, University of Reading
Production International Facility Management AssociationDerek Jayson Rusch, Director of Marketing, Kayhan InternationalPat Turnbull, LEED AP, President, Kayhan International Michael Flockhart, Flockhart Design, Inc. Lisa Berman, Editing and Writing Consultant
2
2010 IFMA Foundation
SUSTAINABILIT Y GUIDE - NO-COST/LOW-COST ENERGY SAVINGS GUIDE
Compiled by Christine Doonan, editor of the Build-ing Operator Certification program’s BOC Bulletin, this manual represents only a portion of the work of the many expert contributing writers for Better-Bricks: Bottom Line Thinking on Energy. The main contributing authors are listed below.
Alan Kakaley PE, Principal, Demand Side Engineering, P.S., Sammamish, Washington
Alan Kakaley is a licensed Professional Engineer with 21 years of experience in commercial building energy engineering. Alan began his career at Ohio State University, developing a preventive main-tenance system to audit and test HVAC systems and steam traps in over 400 campus buildings. In 1992 he founded Demand Side Engineering, P.S. to provide energy consulting services throughout the Northwest. He has performed energy analysis on over 500 commercial projects in western Washing-ton, has taught DOE-2 computer modeling, and per-formed numerous building energy and operations and maintenance (O&M) audits. His analysis of the Seattle Space Needle led to the Energy User News Certificate of Merit Award in building automation.
Alan was the lead energy consultant in develop-ing the Seattle Schools Best Management Prac-tices Handbook of sustainable building design and resource conservation. This document is used as the model guideline for operating procedures, renovations and new construction in all Seattle city schools. The California Collaborative for High Performance Schools is also largely based on this handbook. Alan developed the energy calculations used as the basis of Puget Sound Energy’s cur-rent New Construction Prescriptive Incentives and similar programs currently under development for Seattle City Light.
Jim Volkman PE, Principal, Strategic Energy Group, Portland, Oregon
Jim has more than 20 years of experience in developing and implementing regional resource conservation projects. Over the last several years he has worked with public and private entities sup-
porting development and implementation of market transformation initiatives and resource acquisition programs. Jim’s recent work has focused on build-ing operating performance and improved building performance through operational tune-ups and sustained performance through tracking, trending and responding to variances in performance.
A graduate of Oregon State University, Jim holds a Bachelor of Science in mechanical engineering, and is a registered Professional Engineer in the State of Washington. He has completed more than 400 resource conservation projects throughout the na-tion in commercial, institutional, manufacturing and industrial facilities. Jim’s varied experience includes developing and delivering industrial manufacturing performance contract projects, and managing the privatized delivery and development of the commer-cial, industrial and residential energy conservation programs.
Brad L. WeaverPE, Principal, Northwest Energy Consulting
Graduating from the University of New Mexico with a Bachelor of Science in mechanical engineering, Brad has over two decades of mechanical engi-neering experience. His primary areas of interest and expertise are energy conservation as related to HVAC and DDC systems design and systems com-missioning. He has served as mechanical designer and project manager for a broad range of projects in Washington, Alaska, Oregon, California, Florida and Georgia, and has performed peer reviews, energy audits and analysis for a variety of building types. Further experience includes design of HVAC, plumbing and fire protection and DDC systems for casinos, broadcasting facilities, industrial facilities and office buildings.
An advisor to BetterBricks, Brad has conducted multiple presentations to architectural firms in the Puget Sound region on such topics as integrated design, climate responsive design and LEED. His more recent focus has been energy and water con-servation and conducting audits. Recent projects have been analyses on a variety of facilities in both Washington and California, which include install-ing portable data loggers for trend logging HVAC operations.
ABOUT THE AUTHORS
Northwest Energy Efficiency Alliance (NEEA) BetterBricks 529 SW Third Avenue, Suite 600 Portland, Oregon 97204 800-411-0834www.betterbricks.comwww.nwalliance.org
This Publication is Sponsored by:
3
2010 IFMA Foundation
SUSTAINABILIT Y GUIDE - NO-COST/LOW-COST ENERGY SAVINGS GUIDE
IFMA Sustainability Committee (ISC)
The IFMA Association’s ISC is charged with developing and implementing strategic and tactical sustain-ability initiatives. A current initiative involves working with the IFMA Foundation on the development of a series of “How-To Guides” that will help educate facility management professionals and others with similar interests in a wide variety of topics associated with sustainability and the built environment.
The general objectives of these “How-To Guides” are as follows:
1. To provide data associated with a wide range of subjects related to sustainability, energy savings and the built environment
2. To provide practical information associated with how to implement the steps being recommended
3. To present a business case and return-on-investment (ROI) analysis, wherever possible, justifying each green initiative being discussed
4. To provide information on how to sell management on the implementation of the sustainability technology under discussion
5. To provide case studies of successful examples of implementing each green initiative
6. To provide references and additional resources (e.g., Web sites, articles, glossary) where readers can go for additional information
7. To work with other associations for the purpose of sharing and promoting sustainability content
The guides are reviewed by an editorial board, an advisory board and, in most cases, by invited external reviewers. Once the guides are completed, they are distributed via the IFMA Foundation’s Web site www.ifmafoundation.org free of charge.
FORWARD
4
2010 IFMA Foundation
SUSTAINABILIT Y GUIDE - NO-COST/LOW-COST ENERGY SAVINGS GUIDE
ISC Members
Eric Teicholz, Chair, IFMA Fellow, President, Graphic Systems, Inc.
Charlie Claar, PE, CFM, CFMJ, Director, Academic Affairs, IFMA Foundation
Isilay Civan, PhD2, LEED AP, Strategic Planner, HOK
Bill Conley, CFM, CFMJ, LEED AP, IFMA Fellow, Managing Director, Sustainable Development,
Pacific Building Care
Laurie Gilmore, PE, CFM, LEED AP, Associate, Facility Engineering Associates
Chris Hodges, PE, CFM, LEED AP, IFMA Fellow, Principal, Facility Engineering Associates
Angela Lewis, LEED AP, PhD Candidate, University of Reading
Marc S. Liciardello, CFM, MBA CM, Vice President, Corporate Services, ARAMARK
John McGee, Chief Operating Officer, Ice Energy
Robert S. Mihos, CFM, Conservation Programs Manager, Holland Board of Public Works
Patrick Okamura, CFM, CSS, CIAQM, LEED AP, Facility Manager, General Dynamics
C4 Systems
Cathy Pavick, Vice President of Education, IFMA
Cynthia Putnam, CSBA, Project Director, Northwest Energy Efficiency Council
Andrea Sanchez, Director of Communications, Editor-in-Chief, Facility Management Journal,
IFMA
Jon Seller, Optegy Group
Sarah Slaughter, Professor, MIT Sloan School of Management
Jeffrey J. Tafel, CAE, Director of Councils, IFMA
Craig Zurawski, Executive Director, Alliance for Sustainable Built Environments (ASBE)
January 2010
IFMA Foundation
1 E. Greenway Plaza, Suite 1100 Houston, TX 77046-0194 Phone: 713-623-4362
www.ifmafoundation.org
The mission of the IFMA Foundation is to promote and support scholarships, educational and research opportunities for the advancement of facility management worldwide.
Established in 1990 as a nonprofit, 501(c)(3) corporation, the IFMA Foundation is supported by the generosity of a community of individuals—IFMA members, chapters, councils, corporate sponsors and private contributors— and is proud to be an instrument of information and opportunities for the profession and its representatives.
A separate entity from IFMA, the IFMA Foundation receives no funding from annual membership dues to carry out its mission. Supported by the generosity of the FM commu-nity, the IFMA Foundation provides education, research and scholarships for the benefit of FM professionals and students. Foundation contributors share the belief that education and research improve the FM profession.
5
2010 IFMA Foundation
SUSTAINABILIT Y GUIDE - NO-COST/LOW-COST ENERGY SAVINGS GUIDE
1 EXECUTIVE SUMMARY
This No-Cost/Low-Cost Energy Savings guide is principally derived from the BetterBricks article Common Opportunities: The Top Four, which can be found at the BetterBricks Web site, www.BetterBricks.com, under Building Opera-tions. The goal of the guide is to provide facility operations personnel with a practical document that will provide the resources to initiate no-cost/low-cost energy-efficiency measures at their sites. This is not a theoretical piece, but aims to present specific maintenance targets in a “here’s where to go, here’s what to look for” format. The Web site articles from which this guide was derived have several bullet lists that can be translated to spreadsheet templates and used as checklists for facilities managers to reference. Many templates and software tools are also available for down-load, as noted in Appendix A: References in this guide (BetterBricks 2009a).
Another of the IFMA Foundation Sustainability “How-To Guides,” Getting Started: A Guide to Sustainability in Existing Buildings by Chris Hodges (Hodges 2009) provides greater detail about planning to achieve sustainability in an existing facility and the associated cost benefits. The driving concept, and thus the difference, be-hind this manual is to provide facilities managers with the tools to get started on identifying problem areas and implementing no-cost/low-cost solu-tions. While there is an investment of time taken to explore the possibilities, the payoff/payback will be significant in terms of savings in energy usage and, therefore, in energy costs.
Targeting four specific areas as the best sources of potential problems, and thus potential efficiency gains, the guide provides lists that can essentially be used as checklists for facilities personnel, giving them starting points to gradually chip away at various efficiency projects. The top four areas of potential efficiency improvements discussed include:
Equipment scheduling: This section details the process of determining where energy is being wasted in areas that are not in use. Specific areas for examination are: lighting, plug and process loads, fan systems, chiller and boiler availability, and pumps. The section answers the question: Are these service items reflective of a facility’s occupancy?
Sensor error: The use of sensors has increased over the years, but often the settings are out of synch with what they are supposed to be monitor-ing. This can be caused by incorrect placement, failed sensors, errors in set up or even changes in usage patterns that have not been recalibrated as needed. This section demonstrates what to look for, how to make the changes and also how to set up a logical schedule to monitor settings.
Simultaneous heating and cooling: Most heat-ing, ventilating and air conditioning (HVAC) systems use some form of reheat, but if the settings are off for the air handler that pulls in the primary supply air, it can mean excessive reheating, using unneed-ed energy. A setting off by just 1 degree on a sys-tem with 20,000 cfm (cubic feet per minute) (9,400 liters per second) operating 10 hours a day, five days a week would cost an extra $1,000/year (US dollars) in electric reheat (using $0.06 per kWh). This section targets problems in various HVAC systems: VAV with reheat, constant-volume with reheat and dual duct, multizone fan and central air conditioner (AC) with perimeter heating.
Outside air usage: To provide proper indoor air quality (IAQ) requires efficient ventilation, which in turn requires that the outdoor air be treated. Ven-tilation systems can experience many problems such as dampers stuck open or closed or improp-er sensor calibration. This section outlines the potential issues and details the various symptoms to look for to achieve optimum IAQ, while lowering energy use.
‘Expand knowledge of the built environment, in a changing world, through scholarships, education and research’
The Vision Statement of the IFMA Foundation

6
2010 IFMA Foundation
SUSTAINABILIT Y GUIDE - NO-COST/LOW-COST ENERGY SAVINGS GUIDE
While these four areas offer immediate benefits to energy efficiency, the manual concludes by offering information on energy unit indexing (EUI), benchmarking and the benefits of developing a strategic energy management plan (SEMP), for which many tools and templates are available.
7
2010 IFMA Foundation
SUSTAINABILIT Y GUIDE - NO-COST/LOW-COST ENERGY SAVINGS GUIDE
2 INTRODUCTION
To save energy through improved building opera-tion fi rst requires determining frequent problems that have the largest savings. Most operations and maintenance (O&M) related energy waste falls into four major categories:
Equipment scheduling: Equipment runs when it is not needed.
Sensor error: Erroneous sensor data causes in-creased heating, cooling or equipment operation, which can affect occupant comfort.
Simultaneous heating and cooling: The same air gets heated and cooled, or hot and cold air streams get mixed together to make warm air.
Outside air usage: Economizer does not func-tion optimally, or excessive outside air causes increased heating and/or mechanical cooling, and sometimes too little outdoor air compromises indoor air quality.
This guide provides a roadmap for attacking these issues, providing checklists of where to look, what questions to ask, where to fi nd solutions and how to implement energy saving measures.
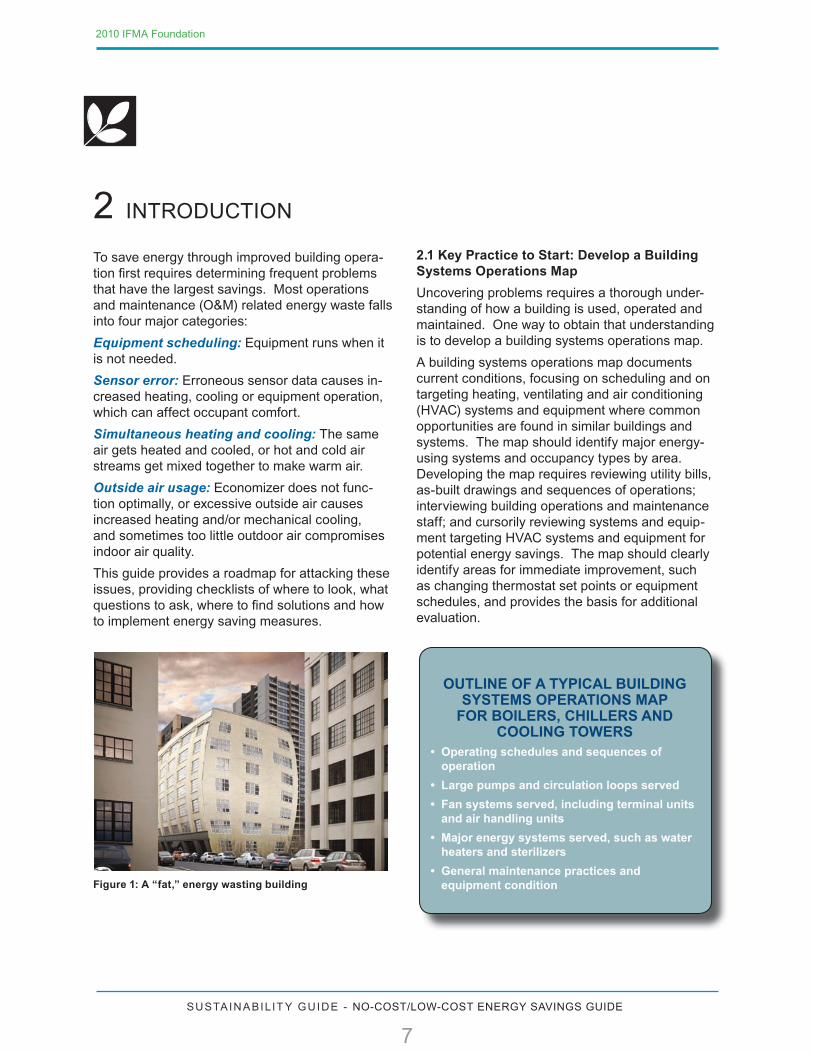
Figure 1: A “fat,” energy wasting building
2.1 Key Practice to Start: Develop a Building Systems Operations Map
Uncovering problems requires a thorough under-standing of how a building is used, operated and maintained. One way to obtain that understanding is to develop a building systems operations map.
A building systems operations map documents current conditions, focusing on scheduling and on targeting heating, ventilating and air conditioning (HVAC) systems and equipment where common opportunities are found in similar buildings and systems. The map should identify major energy-using systems and occupancy types by area. Developing the map requires reviewing utility bills, as-built drawings and sequences of operations; interviewing building operations and maintenance staff; and cursorily reviewing systems and equip-ment targeting HVAC systems and equipment for potential energy savings. The map should clearly identify areas for immediate improvement, such as changing thermostat set points or equipment schedules, and provides the basis for additional evaluation.
OUTLINE OF A TYPICAL BUILDING SYSTEMS OPERATIONS MAP
FOR BOILERS, CHILLERS AND COOLING TOWERS
• Operating schedules and sequences of operation
• Large pumps and circulation loops served
• Fan systems served, including terminal units and air handling units
• Major energy systems served, such as water heaters and sterilizers
• General maintenance practices and equipment condition
8
2010 IFMA Foundation
SUSTAINABILIT Y GUIDE - NO-COST/LOW-COST ENERGY SAVINGS GUIDE
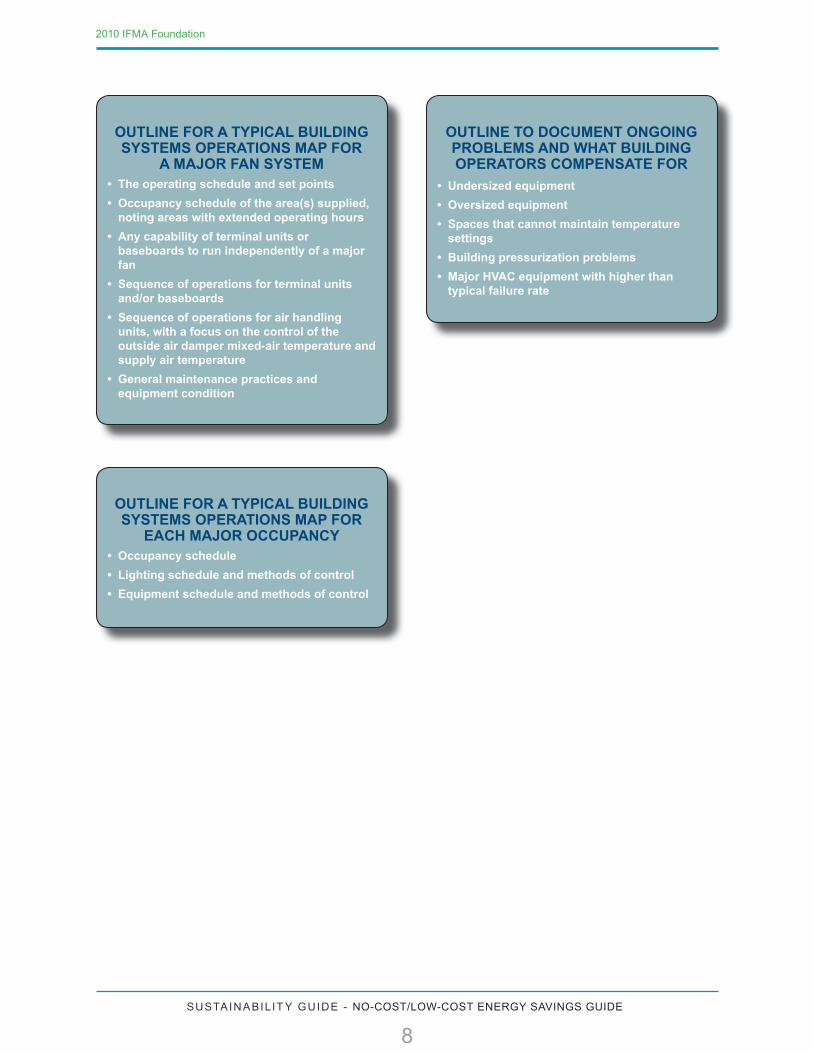
OUTLINE FOR A TYPICAL BUILDING SYSTEMS OPERATIONS MAP FOR
A MAJOR FAN SYSTEM• The operating schedule and set points
• Occupancy schedule of the area(s) supplied, noting areas with extended operating hours
• Any capability of terminal units or baseboards to run independently of a major fan
• Sequence of operations for terminal units and/or baseboards
• Sequence of operations for air handling units, with a focus on the control of the outside air damper mixed-air temperature and supply air temperature
• General maintenance practices and equipment condition
OUTLINE FOR A TYPICAL BUILDING SYSTEMS OPERATIONS MAP FOR
EACH MAJOR OCCUPANCY • Occupancy schedule
• Lighting schedule and methods of control
• Equipment schedule and methods of control
OUTLINE TO DOCUMENT ONGOING PROBLEMS AND WHAT BUILDING OPERATORS COMPENSATE FOR
• Undersized equipment
• Oversized equipment
• Spaces that cannot maintain temperature settings
• Building pressurization problems
• Major HVAC equipment with higher than typical failure rate
9
2010 IFMA Foundation
SUSTAINABILIT Y GUIDE - NO-COST/LOW-COST ENERGY SAVINGS GUIDE
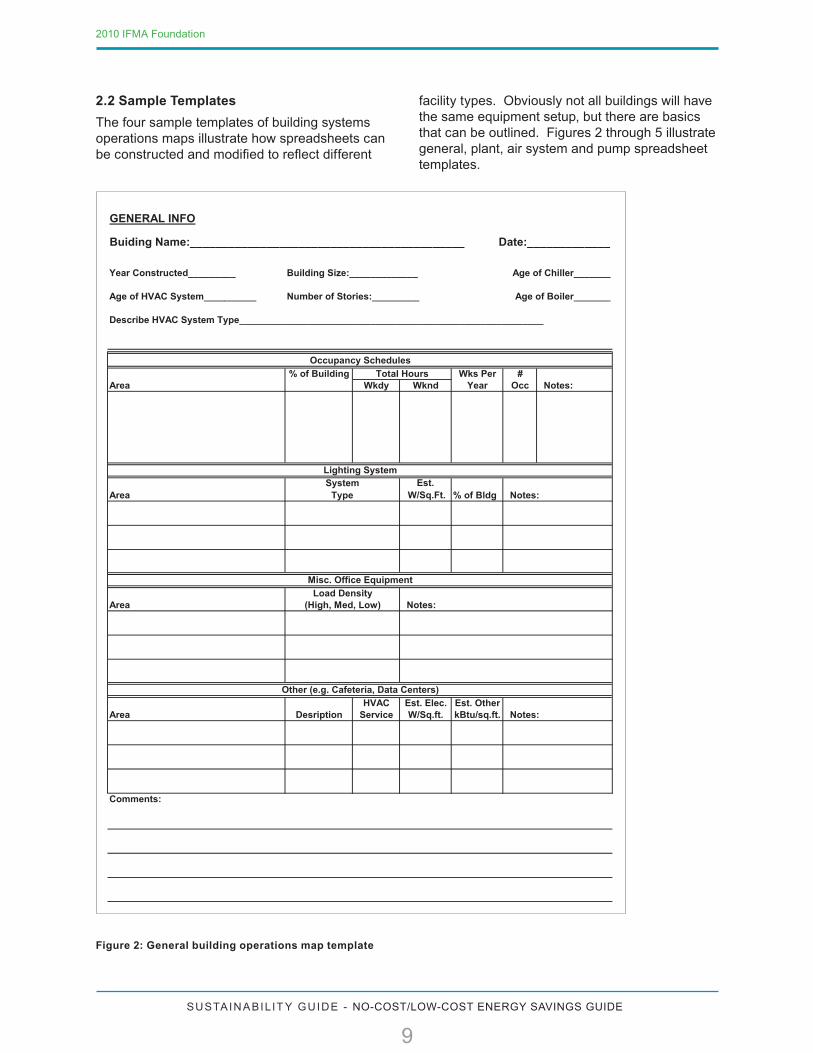
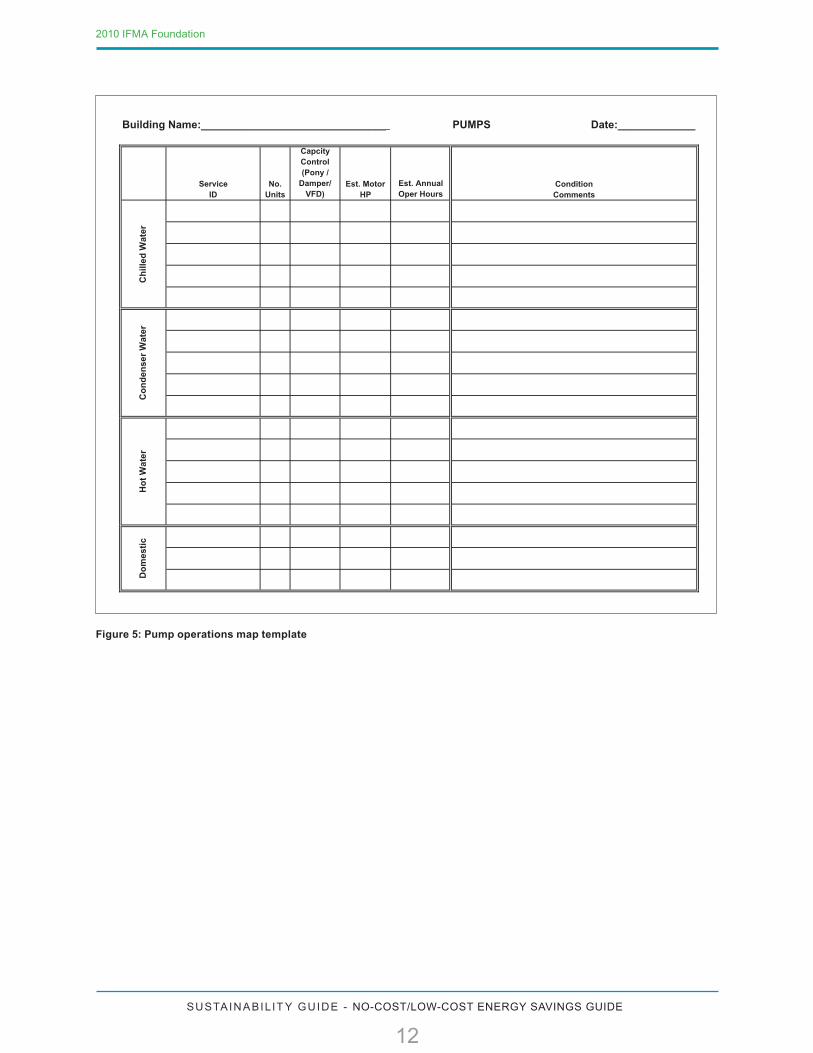
2.2 Sample Templates
The four sample templates of building systems operations maps illustrate how spreadsheets can be constructed and modified to reflect different
facility types. Obviously not all buildings will have the same equipment setup, but there are basics that can be outlined. Figures 2 through 5 illustrate general, plant, air system and pump spreadsheet templates.
GENERAL INFO
Buiding Name:___________________________________________ Date:_____________
Year Constructed_________ Building Size:_____________ Age of Chiller_______
Age of HVAC System__________ Number of Stories:_________ Age of Boiler_______
Describe HVAC System Type__________________________________________________________
% of Building Wks Per #Area Wkdy Wknd Year Occ Notes:
AreaEst.
W/Sq.Ft. % of Bldg
Area
HVAC Est. Elec. Est. OtherArea Desription Service W/Sq.ft. kBtu/sq.ft.
Comments:
Other (e.g. Cafeteria, Data Centers)
SystemType
Misc. Office Equipment
Notes:
Load Density
Notes:
(High, Med, Low) Notes:
Occupancy Schedules
Total Hours
Lighting System
Figure 2: General building operations map template
10
2010 IFMA Foundation
SUSTAINABILIT Y GUIDE - NO-COST/LOW-COST ENERGY SAVINGS GUIDE
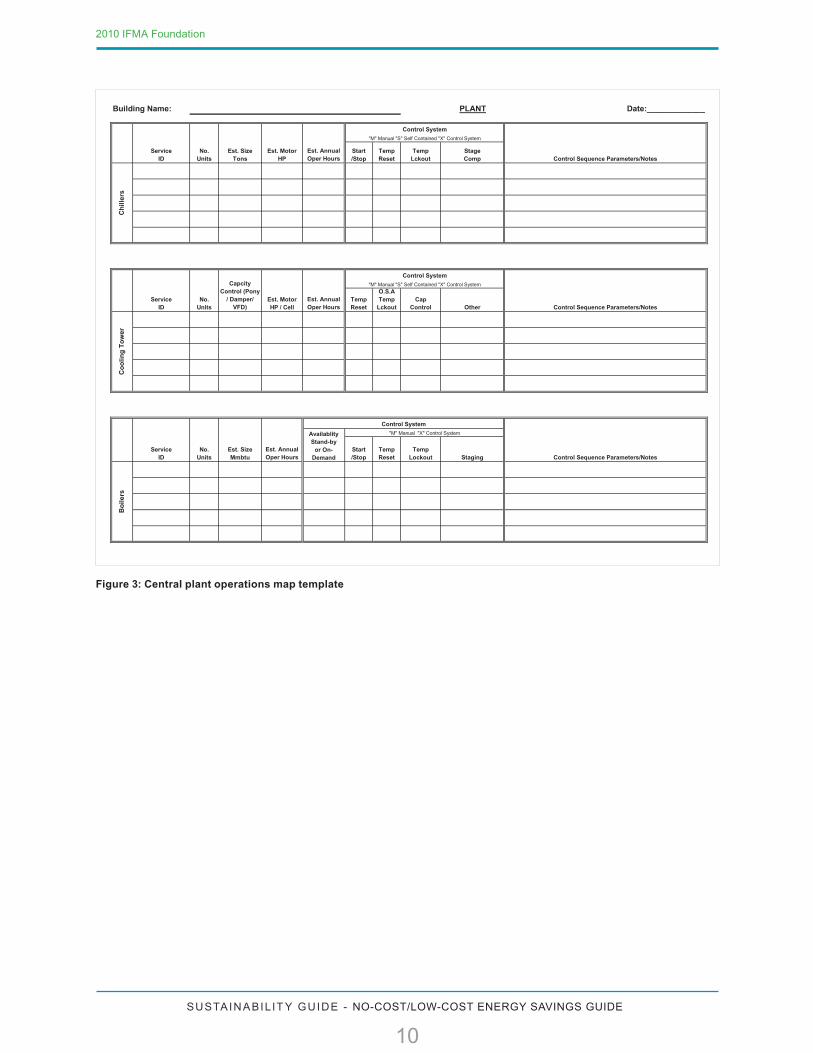
Figure 3: Central plant operations map template
Building Name: PLANT Date:_____________
ServiceID
No.Units
Est. Size Tons
Est. MotorHP
Start/Stop
TempReset
TempLckout
Stage Comp Control Sequence Parameters/Notes
ServiceID
No.Units
Est. MotorHP / Cell
Temp Reset
O.S.A Temp
LckoutCap
Control Other Control Sequence Parameters/Notes
ServiceID
No.Units
Est. Size Mmbtu
Start/Stop
TempReset
TempLockout Staging Control Sequence Parameters/Notes
Co
oli
ng
To
we
r
AvailablityStand-by
or On-Demand
Control System
"M" Manual "X" Control System
Est. AnnualOper Hours
Est. AnnualOper Hours
Control System
"M" Manual "S" Self Contained "X" Control System
Bo
ile
rsControl System
"M" Manual "S" Self Contained "X" Control System
Est. AnnualOper Hours
Capcity Control (Pony
/ Damper/ VFD)
Ch
ille
rs
11
2010 IFMA Foundation
SUSTAINABILIT Y GUIDE - NO-COST/LOW-COST ENERGY SAVINGS GUIDE
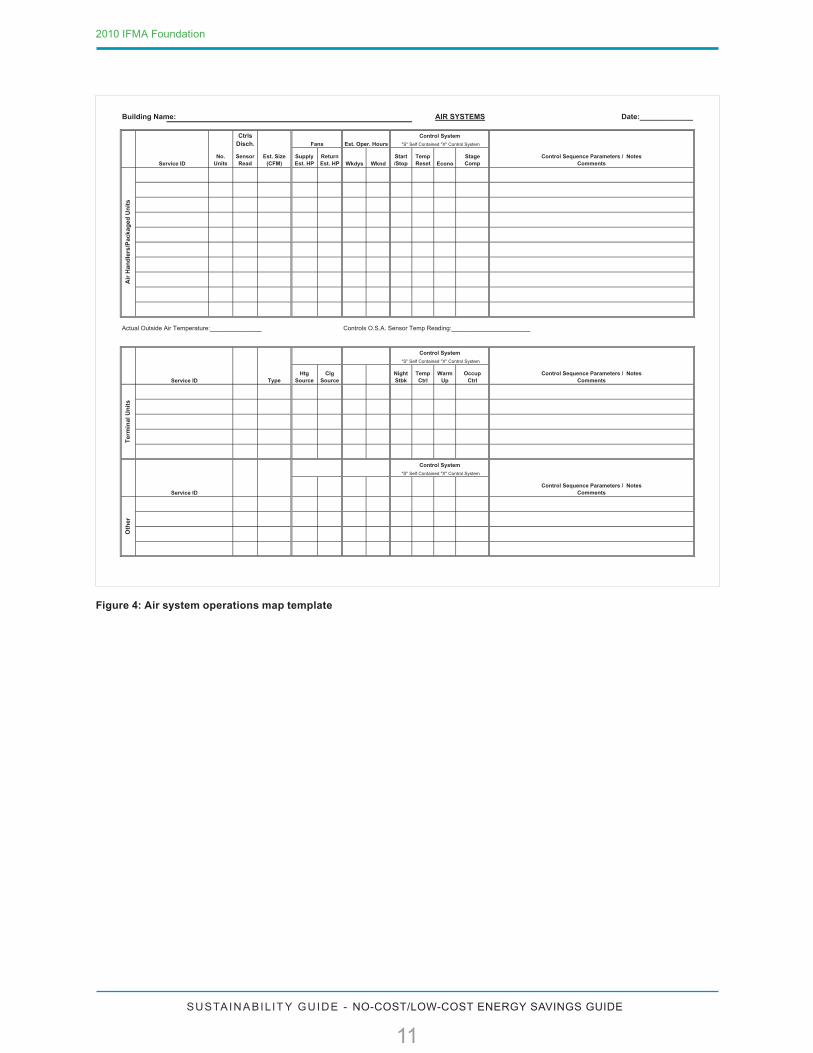
Figure 4: Air system operations map template
Building Name: AIR SYSTEMS Date:_____________
CtrlsDisch.
No.Units
SensorRead
Est. Size (CFM)
SupplyEst. HP
ReturnEst. HP Wkdys Wknd
Start/Stop
TempReset Econo
StageComp
Control Sequence Parameters / NotesComments
Actual Outside Air Temperature:_______________ Controls O.S.A. Sensor Temp Reading:_______________________
TypeHtg
SourceClg
SourceNightStbk
TempCtrl
WarmUp
OccupCtrl
Control Sequence Parameters / NotesComments
Control Sequence Parameters / NotesComments
Control System
"S" Self Contained "X" Control System
Est. Oper. Hours
Control System
"S" Self Contained "X" Control SystemFans
Air
Han
dle
rs/P
acka
ged
Un
its
Ter
min
al U
nit
sO
ther
Control System
"S" Self Contained "X" Control System
Service ID
Service ID
Service ID
12
2010 IFMA Foundation
SUSTAINABILIT Y GUIDE - NO-COST/LOW-COST ENERGY SAVINGS GUIDE
Building Name:________________________________ PUMPS Date:_____________
ServiceID
No.Units
Est. MotorHP
Est. AnnualOper Hours
Ho
t W
ater
Co
nd
ense
r W
ater
Ch
illed
Wat
erCapcityControl(Pony /
Damper/VFD)
ConditionComments
Do
mes
tic
Figure 5: Pump operations map template
13
2010 IFMA Foundation
SUSTAINABILIT Y GUIDE - NO-COST/LOW-COST ENERGY SAVINGS GUIDE
3 DETAILED FINDINGS:
After the initial step of developing a building sys-tems operations map, it is necessary to determine where energy effi ciencies can be affected. The information in this section outlines what to look for in the “Top Four” areas of no-cost/low-cost energy effi ciency: equipment scheduling, sensor error, simultaneous heating and cooling, and outside air usage.
3.1 Equipment Scheduling
Occupants rarely complain when equipment runs longer than needed, so it is easy for this prob-lem to go unnoticed. A plan or procedure should be put in place to check occupant requirements and re-evaluate equipment operating schedules regularly. Typically, the plan should be performed twice a year and whenever there is a major tenant change.
Poor equipment scheduling has many negative impacts:
• Energy use increases proportionally to operating hours for most non-modulating equipment such as lighting, plug loads and constant volume fans.
• Ventilation or exhaust fans usually use more en-ergy at night because the ventilation or makeup air is colder.
• Staging equipment to reduce demand charges can actually increase energy costs. For exam-ple, some facilities may stage equipment over an hour or two to avoid demand spikes. The spike in current required to start motors does not last long enough to affect billing demand,
typically measured over 15- or 30-minute inter-vals. The equipment comes online earlier than necessary, increasing consumption and having no effect on the demand charge.
• Longer operating hours result in shorter equip-ment life and more frequent replacement of lamps, ballasts, fi lters, belts, electric heating coils, contactors, relays, motors, pumps, chillers, boilers, compressors and other equipment.
• Increased operating hours of a building increas-es the cleaning frequency for chiller bundles, boiler tubes, fan coils, evaporator coils and condenser coils.
Walking through the building when it is unoccu-pied is a good fi rst step in identifying unnecessary equipment operation. If equipment is running, look for a reason. It is usually obvious that a lamp or printer should be off, but HVAC equipment may be running to supply a computer room that needs continuous conditioning, or to condition a process load (BetterBricks 2009b, BetterBricks 2009c).
Systems that often experience scheduling prob-lems include:
• Lighting
• Plug and process loads
• Fan systems
• Chillers and boilers
• Pumps
3.1.1 Lighting
Manually controlled wall switch lights are usually turned on by occupants as they arrive, but not always turned off as they leave. Occupants may not hesitate to turn off lights in a small room, but are reluctant to turn off large banks of lights if they think someone else might still be in the space.
THE TOP FOUR SAVINGS OPPORTUNITIES
The easiest way to save energy from equipment operation is to shut it off.
14
2010 IFMA Foundation
SUSTAINABILIT Y GUIDE - NO-COST/LOW-COST ENERGY SAVINGS GUIDE
Things to look for include:
• Is a specific person responsible for turning off the lights?
• Does the custodial staff turn off lights after hours as they go through the building?
• Do the light switches have turn off labels?
If lighting is controlled by a time clock, things to look for include:
• Does the programming match the occupant schedule?
• Does the schedule account for holidays and weekends?
• Is someone responsible for checking the pro-gramming regularly to make sure it meets cur-rent occupancy requirements?
• Do the lights actually turn off as programmed?
• Have temporary, special event schedules been reprogrammed back to normal schedules?
If there are motion sensors, things to look for include:
• Are they properly oriented to sense occupants?
• Has the time interval to switch the lights off after occupancy been properly set?
If there are daylight controls, things to look for include:
• Are the sensors situated properly?
• Are the appropriate light levels set?
If problems are suspected, you can attach a data logger to the lighting circuit and take readings at 15-minute intervals to identify the extent of the problem.
3.1.2 Plug and Process Loads
Plug and process loads are generally manually controlled by occupants. Like manually controlled lighting, these loads are normally turned on by occupants, but are often left on longer than neces-sary. Unlike lighting, custodial staff is not usually empowered to turn off plug loads like computers or medical equipment as they go through a build-ing each evening. Some equipment such as serv-ers, fax machines and medical equipment may need to run continuously.
Typical scheduling problems to look for include:
• Does the tenant or IT department have a policy or system in place to make sure computers with an ENERGY STAR power saving mode have it enabled?
• Does the tenant have a policy to encourage employees to turn off their equipment when leaving?
• Are computer monitors turned off when not in use?
• Are printers and scanners turned off when not in use?
3.1.3 Fan Systems
Most fan systems are controlled by a building automation system (BAS) or time clock. Typical scheduling problems to look for include:
• Do the programmed schedules match occupan-cy requirements?
• Do programmed schedules accommodate holi-days and weekends?
• Are systems checked to make sure fans actually turn off when programming indicates they are off?
• Are the fans running after hours for minimal ten-ant occupancy?
• Is optimum start and stop utilized?
• If optimum start/stop is not available, are start times adjusted seasonally by the building opera-tor?
• Can fan-powered variable air volume (VAV) boxes operate independently of the air handling unit? If so, are they programmed to match oc-cupancy?
• Are exhaust fans interlocked with the air han-dling unit or controlled separately?
• Can baseboards operate independently from the fan system? If so, are they programmed to match occupancy?
3.1.4 Chiller and Boiler Availability
Typical scheduling issues with chillers and boilers include:
• Are chillers locked out when the outside air tem-perature is low?
• Are boilers locked out when the outside air tem-perature is high?
15
2010 IFMA Foundation
SUSTAINABILIT Y GUIDE - NO-COST/LOW-COST ENERGY SAVINGS GUIDE
• Are chillers and boilers prevented from operating at the same time?
• Are there controls to shut off the boiler or chiller when there is no load?
3.1.5 Pumps
Typical scheduling issues for pumps include:
• Are domestic hot water circulating pumps sched-uled off when the building is unoccupied?
• Are hot water pumps scheduled off when the building is unoccupied and the boiler is off?
• Are chilled water pumps scheduled off when the building is unoccupied and the chiller is off?
• Are condenser pumps scheduled off when the building is unoccupied and the chiller is off?
• Are hot water pumps controlled to run only when there is a demand for hot water or when the outside air is cool?
• Are chilled water pumps controlled to run only when there is a demand for chilled water or when the outside air is warm?
• Are condenser pumps interlocked to run only when there is a coil or process demand for chilled water?
3.2 Sensor Error
Sensor error can increase energy use, compro-mise occupant comfort, and prevent plant and system loads from being met (BetterBricks 2009b, BetterBricks 2009d). This is most often caused by calibrated sensors that have not been calibrated. However, it can also be due to incorrectly placed sensors, failed sensors or mistakes in control setup.
While building systems use many sensors, critical control sensors are the most likely to cause se-vere energy penalties. For example, while space temperature sensors result in energy waste and comfort problems, the effect on energy is usually minor and restricted to one zone. On the other hand, errors from a critical control sensor, such as the temperature of return air at the air handling unit, can cause large energy penalties affecting many zones, yet may not cause comfort issues. Sensor error is hard to detect unless the sensors are calibrated regularly.
A wide variety of sensor types are available for HVAC use. Many can be calibrated and others need to be replaced periodically. It is important to know the specifications of the specific sensor in order to maintain it. Older carbon dioxide sen-sors need to be calibrated as often as every two months, and some newer sensors are guaranteed to be accurate for the service life of the sensor, between 5 and 15 years.
Control sensors with the most potential to have a significant effect on energy use are gener-ally those used to implement resets and control outside air at air handling units and central plants. While the impacts can be huge, the fix is simple — regular calibration.
Critical control sensors include:
• Mixed air temperature sensor
• Return air temperature sensor
• Outside air temperature sensor
• Supply air temperature sensor
• Chilled water temperature sensor
• Hot water temperature sensor
• Carbon dioxide sensor
• Carbon monoxide sensor
Some questions to ask include:
• Are sensors calibrated at least annually?
• Are critical control sensors calibrated at least twice a year?
• Are critical control sensors replaced on a regular schedule as the end of the service life is ap-proached?
Many sensor problems can appear to be other is-sues, for example:
• Plant and system loads not met
• Reset schedule not working
• Outside air economizer not functioning properly
• Boilers and chillers on when not needed
• Equipment not modulating as expected
• Simultaneous heating and cooling
16
2010 IFMA Foundation
SUSTAINABILIT Y GUIDE - NO-COST/LOW-COST ENERGY SAVINGS GUIDE
3.3 Simultaneous Heating and Cooling
Central fan systems are designed to supply space conditioning to multiple areas in a building. Each area has its own space conditioning needs. Typi-cally a central fan supplies cool air to one or more zones. To meet the conditioning requirement of each zone, most central HVAC fan systems use some form of reheat. At the zone level, the quanti-ty of air is usually modulated to satisfy the cooling load or may be reheated to meet a heating load. A typical office building floor will have electric or hydronic coils installed in the ductwork or in the fan boxes serving the perimeter areas, while the central area is cooled only (BetterBricks 2009b, BetterBricks 2009e). The temperature of the cool air leaving the air handler at the primary supply determines the amount of reheat required in the various zones. Control strategies optimize the supply air temperature and reduce reheat. Usually the supply air is reset to the highest temperature that can still meet the largest cooling load. If the control strategy is not optimized, the supply air will be cooler than necessary and reheating it will use more energy than necessary.
For example, if the primary air temperature was off by just 1 degree from optimum, it would cost ap-proximately $1,000 per year (US dollars) in electric reheat at $0.06/kWh (US dollars) on a system with 20,000 cfm (9,400 L/s) of primary air operating 10 hours per day, five days per week.
There are many variations of central HVAC fan systems that have similar problems of simulta-neous heating and cooling. The following are systems that should be targeted for energy saving O&M opportunities:
• VAV systems with reheat
• Constant volume systems with reheat
• Dual duct systems
• Multizone fans
• Central air conditioning systems with perimeter heating
To determine if there are problems, generate a trend log for the system. Trend the following:
• Outside air temperature (OAT)
• Return air temperature (RAT)
• Mixed air temperature (MAT)
• Supply air temperature (SAT)
• Economizer damper position, if positive feed-back is available
Also graph the temperatures and see how the MAT varies with respect to the SAT, the RAT and the OAT. Then, see if the MAT curve changes slope when the dampers go to minimum position.
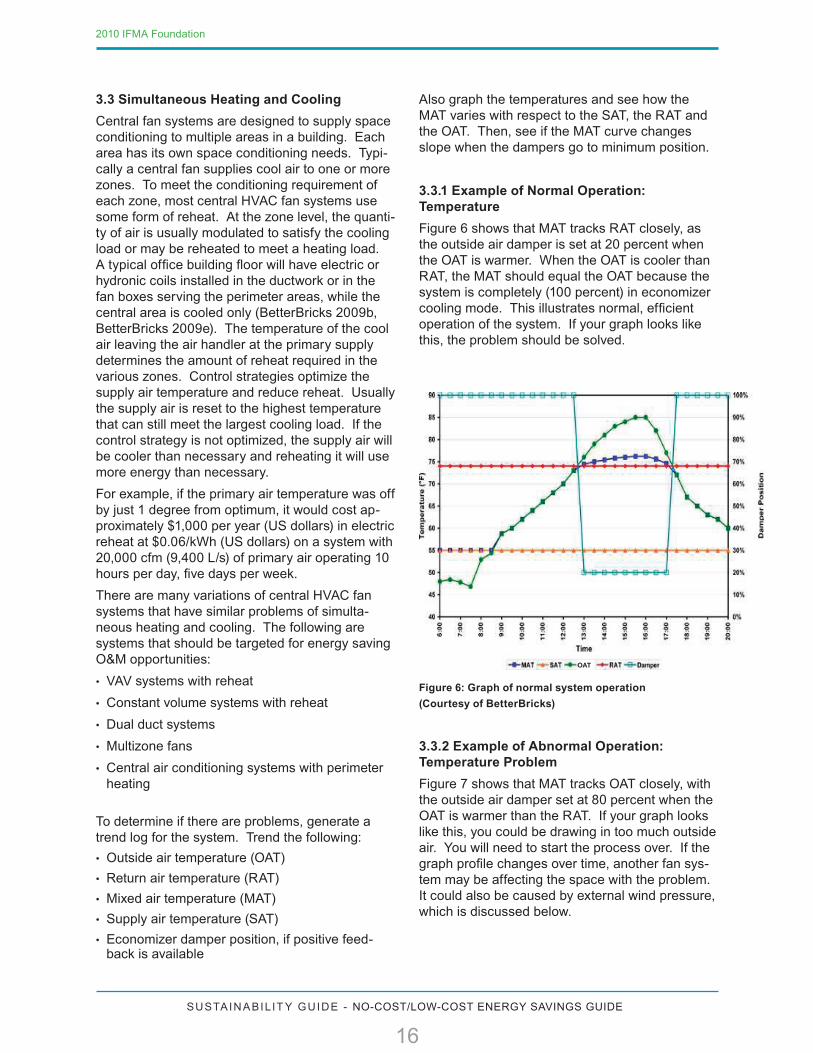
3.3.1 Example of Normal Operation: Temperature
Figure 6 shows that MAT tracks RAT closely, as the outside air damper is set at 20 percent when the OAT is warmer. When the OAT is cooler than RAT, the MAT should equal the OAT because the system is completely (100 percent) in economizer cooling mode. This illustrates normal, efficient operation of the system. If your graph looks like this, the problem should be solved.
Figure 6: Graph of normal system operation
(Courtesy of BetterBricks)
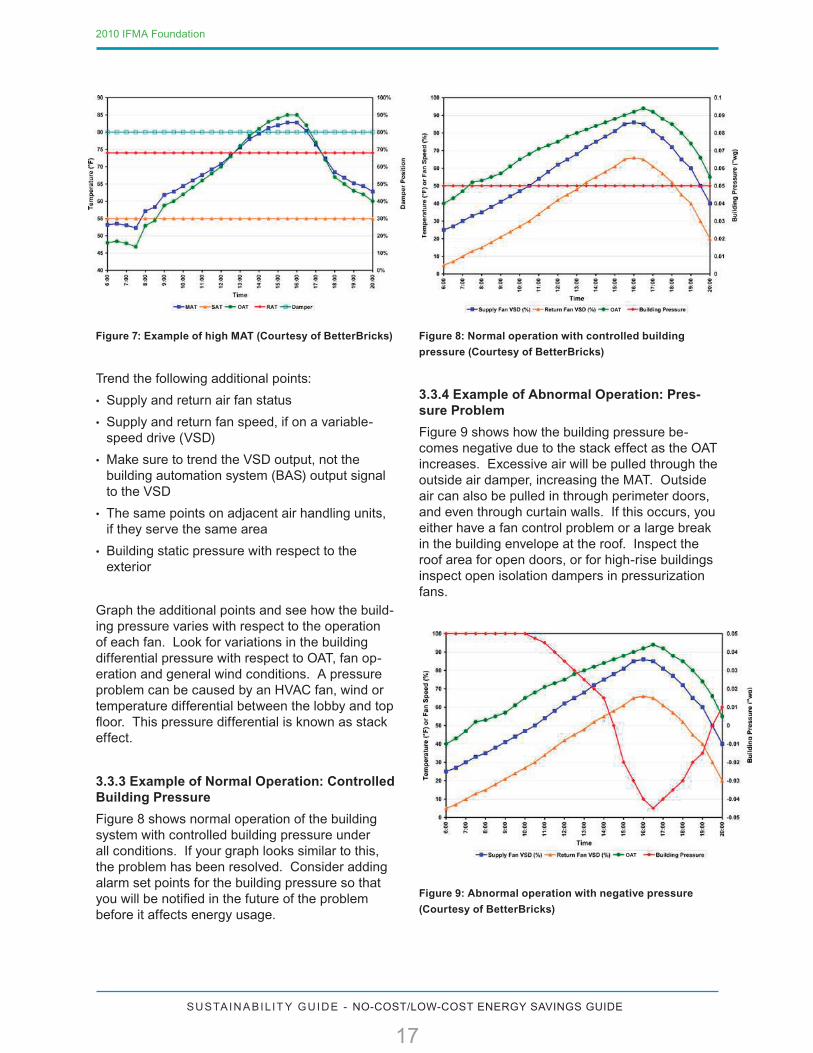
3.3.2 Example of Abnormal Operation: Temperature Problem
Figure 7 shows that MAT tracks OAT closely, with the outside air damper set at 80 percent when the OAT is warmer than the RAT. If your graph looks like this, you could be drawing in too much outside air. You will need to start the process over. If the graph profile changes over time, another fan sys-tem may be affecting the space with the problem. It could also be caused by external wind pressure, which is discussed below.
OAT
17
2010 IFMA Foundation
SUSTAINABILIT Y GUIDE - NO-COST/LOW-COST ENERGY SAVINGS GUIDE
Figure 7: Example of high MAT (Courtesy of BetterBricks)
Trend the following additional points:
• Supply and return air fan status
• Supply and return fan speed, if on a variable-speed drive (VSD)
• Make sure to trend the VSD output, not the building automation system (BAS) output signal to the VSD
• The same points on adjacent air handling units, if they serve the same area
• Building static pressure with respect to the exterior
Graph the additional points and see how the build-ing pressure varies with respect to the operation of each fan. Look for variations in the building differential pressure with respect to OAT, fan op-eration and general wind conditions. A pressure problem can be caused by an HVAC fan, wind or temperature differential between the lobby and top floor. This pressure differential is known as stack effect.
3.3.3 Example of Normal Operation: Controlled Building Pressure
Figure 8 shows normal operation of the building system with controlled building pressure under all conditions. If your graph looks similar to this, the problem has been resolved. Consider adding alarm set points for the building pressure so that you will be notified in the future of the problem before it affects energy usage.
Figure 8: Normal operation with controlled building
pressure (Courtesy of BetterBricks)
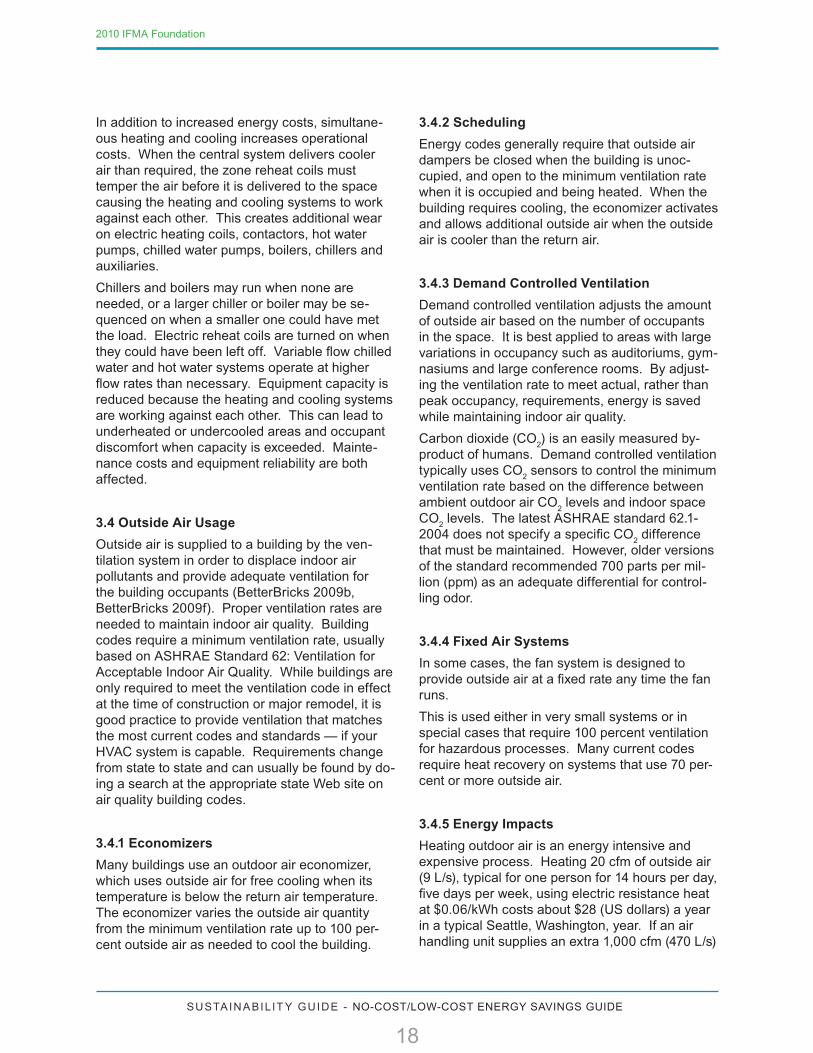
3.3.4 Example of Abnormal Operation: Pres-sure Problem
Figure 9 shows how the building pressure be-comes negative due to the stack effect as the OAT increases. Excessive air will be pulled through the outside air damper, increasing the MAT. Outside air can also be pulled in through perimeter doors, and even through curtain walls. If this occurs, you either have a fan control problem or a large break in the building envelope at the roof. Inspect the roof area for open doors, or for high-rise buildings inspect open isolation dampers in pressurization fans.
Figure 9: Abnormal operation with negative pressure
(Courtesy of BetterBricks)
OAT OAT
OAT
18
2010 IFMA Foundation
SUSTAINABILIT Y GUIDE - NO-COST/LOW-COST ENERGY SAVINGS GUIDE
In addition to increased energy costs, simultane-ous heating and cooling increases operational costs. When the central system delivers cooler air than required, the zone reheat coils must temper the air before it is delivered to the space causing the heating and cooling systems to work against each other. This creates additional wear on electric heating coils, contactors, hot water pumps, chilled water pumps, boilers, chillers and auxiliaries.
Chillers and boilers may run when none are needed, or a larger chiller or boiler may be se-quenced on when a smaller one could have met the load. Electric reheat coils are turned on when they could have been left off. Variable flow chilled water and hot water systems operate at higher flow rates than necessary. Equipment capacity is reduced because the heating and cooling systems are working against each other. This can lead to underheated or undercooled areas and occupant discomfort when capacity is exceeded. Mainte-nance costs and equipment reliability are both affected.
3.4 Outside Air Usage
Outside air is supplied to a building by the ven-tilation system in order to displace indoor air pollutants and provide adequate ventilation for the building occupants (BetterBricks 2009b, BetterBricks 2009f). Proper ventilation rates are needed to maintain indoor air quality. Building codes require a minimum ventilation rate, usually based on ASHRAE Standard 62: Ventilation for Acceptable Indoor Air Quality. While buildings are only required to meet the ventilation code in effect at the time of construction or major remodel, it is good practice to provide ventilation that matches the most current codes and standards — if your HVAC system is capable. Requirements change from state to state and can usually be found by do-ing a search at the appropriate state Web site on air quality building codes.
3.4.1 Economizers
Many buildings use an outdoor air economizer, which uses outside air for free cooling when its temperature is below the return air temperature. The economizer varies the outside air quantity from the minimum ventilation rate up to 100 per-cent outside air as needed to cool the building.
3.4.2 Scheduling
Energy codes generally require that outside air dampers be closed when the building is unoc-cupied, and open to the minimum ventilation rate when it is occupied and being heated. When the building requires cooling, the economizer activates and allows additional outside air when the outside air is cooler than the return air.
3.4.3 Demand Controlled Ventilation
Demand controlled ventilation adjusts the amount of outside air based on the number of occupants in the space. It is best applied to areas with large variations in occupancy such as auditoriums, gym-nasiums and large conference rooms. By adjust-ing the ventilation rate to meet actual, rather than peak occupancy, requirements, energy is saved while maintaining indoor air quality.
Carbon dioxide (CO2) is an easily measured by-
product of humans. Demand controlled ventilation typically uses CO
2 sensors to control the minimum
ventilation rate based on the difference between ambient outdoor air CO
2 levels and indoor space
CO2 levels. The latest ASHRAE standard 62.1-
2004 does not specify a specific CO2 difference
that must be maintained. However, older versions of the standard recommended 700 parts per mil-lion (ppm) as an adequate differential for control-ling odor.
3.4.4 Fixed Air Systems
In some cases, the fan system is designed to provide outside air at a fixed rate any time the fan runs.
This is used either in very small systems or in special cases that require 100 percent ventilation for hazardous processes. Many current codes require heat recovery on systems that use 70 per-cent or more outside air.
3.4.5 Energy Impacts
Heating outdoor air is an energy intensive and expensive process. Heating 20 cfm of outside air (9 L/s), typical for one person for 14 hours per day, five days per week, using electric resistance heat at $0.06/kWh costs about $28 (US dollars) a year in a typical Seattle, Washington, year. If an air handling unit supplies an extra 1,000 cfm (470 L/s)
19
2010 IFMA Foundation
SUSTAINABILIT Y GUIDE - NO-COST/LOW-COST ENERGY SAVINGS GUIDE
of outside air it would cost approximately $1,400 (US dollars) per year.
Ideally, a building’s ventilation system will provide only the minimum outside air to meet occupant air quality needs, except when it can be used for cooling. Ventilation systems can experience many problems. Some typical problems include:
• Minimum ventilation rate is never adjusted for a change in occupancy
• Minimum ventilation rate is set by damper posi-tion, rather than a measured airflow
• Damper leaks when in unoccupied mode
• Damper does not close when in unoccupied mode
• Damper stuck in one position
• Temperature sensors used when system is in economizer mode are out of calibration or have failed
• CO2 sensor is improperly located
3.5 No-Cost and Low-Cost Energy Saving Strategies
This guide is designed to help facilities personnel implement the top four energy efficiency possibili-ties. Some recommendations for starting to imple-ment no- or low-cost energy saving activities that can be easily performed are summarized below (BetterBricks 2009b, BetterBricks 2009h).
3.5.1 Using the Energy Use Index (EUI) and Benchmarking
The energy use index (EUI) is the amount of ener-gy used by a building per unit area of building floor area. By normalizing energy use to floor area, buildings can be benchmarked and compared for relative energy performance. The EUI can be based on whole building energy use or on specific end uses such as lighting or heating. A whole building EUI is a good measure of overall energy savings potential. Much data is available on whole building EUI for many building types. A building with a higher EUI than the average similar building is more likely to have energy-saving opportunities and the magnitude of the difference hints at the magnitude of potential savings.
Comparing the past performance of a building to current energy performance can provide further insight and might lead to additional energy sav-ings. Questions to ask include:
• Has the EUI increased over time?
• Can the increase be correlated to a change in hours of occupancy, a decrease in vacant space, equipment additions or equipment changes?
If not, it probably indicates an opportunity to re-duce energy use.
3.5.2 The Benefits of Developing a Strategic Energy Management Plan (SEMP)
A strategic energy management plan (SEMP) involves six steps:
• Assess: Take a look at where you are
• Commit: Obtain executive buy-in for a plan
• Plan: Understand staffing and funding require-ments and develop a plan
• Secure: Obtain executive approval
• Implement: Get it done
• Recognize: Track progress and reward efforts (BetterBricks 2009b, BetterBricks 2009g)
To develop your SEMP, here is a partial list of what is available:
• Energy practice checklist: Gets you started with a list of information you will need to gather: www.betterbricks.com/track.aspx?link=graphics/assets/documents/EnergyPracticeChecklist%28Step1%29v2%282%29.xls
• ENERGY STAR Portfolio Manager: An interac-tive energy management tool to track and ana-lyze consumption: www.energystar.gov/index.cfm?c=evaluate_performance.bus_ portfoliomanager
• SEMP templates: For forming an energy management plan: www.betterbricks.com/ DetailPage.aspx?ID=943
• Financial tools: To assess life cycle cost analysis
• Sample SEMP PowerPoint presentation: To help you sell your plan to management: www.better bricks.com/DetailPage.aspx?ID=943
Energy efficiency has become a major part of what facilities management entails. It is no longer just the good and responsible thing to do — it is necessary.
20
2010 IFMA Foundation
SUSTAINABILIT Y GUIDE - NO-COST/LOW-COST ENERGY SAVINGS GUIDE
4In a recent article from Foreign Policy magazine entitled “The Seven Myths About Alternative En-ergy” (September/October 2009), environmental journalist Michael Grunwald breaks down the vi-ability of the various methods put forth as potential means of energy production, from nuclear energy to biofuels to wind and solar power. Grunwald highlights the problems with some alternatives, such as being years away from economic viability or the inefficient use of farmland for energy pro-duction, instead of food production. While some ideas show promise, in the near term he con-cludes that the two most effective means to lower energy consumption that can be accomplished are efficiency and behavioral changes.
“Efficiency isn’t sexy,” writes Grunwald (2009), so it does not get the attention the more exotic solu-tions receive. But it works. He continues, “’Nega-watts’ saved by efficiency initiatives generally cost 1 to 5 cents per kilowatt-hour versus projections ranging from 12 to 30 cents per kilowatt-hour from new nukes.” (Grunwald 2009). So not only can you get cost-saving results for less money, you can get them soon.
Energy management delivers bottom line results so that money saved can be used in other critical business areas, such as new textbooks for chil-dren in schools or additional personnel in under-staffed hospitals.
Here is what you can expect to accomplish:
• Lower operations and maintenance expenses
• Increased occupant comfort and satisfaction
• Reduced pollution and emissions generated via energy production
• Positive public relations and marketing for your company
• Shared community values with the public and elected officials
• Increased productivity, reduced absenteeism and increased morale through improved comfort and indoor air quality
• A reputation of innovation
• A legacy of achievement
MAKING THE BUSINESS CASE
21
2010 IFMA Foundation
SUSTAINABILIT Y GUIDE - NO-COST/LOW-COST ENERGY SAVINGS GUIDE
Three case studies are presented. The fi rst, Kaiser Permanente, discusses a successful build-ing tune-up and enhanced operations and main-tenance pilot project. The second, the Boston Edison Building, demonstrates how lighting codes can have a very large impact on building energy consumption. The third case study, the Joe Serna Jr. Building, briefl y discusses how daytime clean-ing can reduce energy consumption and improve tenant satisfaction.
5.1 Kaiser Permanente
When Tony Moiso took over as facilities mainte-nance manager at Kaiser Permanente, he inher-ited 43 buildings in a region that stretches from Longview, Washington, to Salem, Oregon. Man-aging such far-fl ung facilities presents a signifi cant challenge. He decided to upgrade the building controls to provide remote access and a central-ized view of the building systems. He also wanted to maximize the investment by making sure the buildings were operating as effi ciently as possible.
Karl Friesen, senior account executive at Control Contractors, Inc., a West Coast control system installation and integration contractor, suggested
using the building performance services (BPS) ap-proach to identify the most cost-effective oppor-tunities for building improvements. This combina-tion of a building tune-up with ongoing enhanced operations and maintenance efforts usually results in signifi cant savings for building owners. Mr. Friesen presented a proposal to bundle the BPS services with the control system upgrade. The 30-year-old Kaiser Permanente East Interstate Medical Offi ce was selected for the pilot project as it offered a host of HVAC energy-effi ciency opportunities.
5.1.1 Building Tune-Up
The BPS approach included a building tune-up: a systematic examination of the building’s mechani-cal system to fi nd opportunities for energy savings and improved performance. The project included the following:
• Checking the air handling units for mechanical failures
• Documenting the sequences of operations
• Examining schedules and set points
• Verifying connectivity of equipment
• Evaluating sensor functioning
• Establishing trend data
During the tune-up, the team identifi ed and fi xed several problems: stuck dampers, disconnected reheat coils and miscellaneous issues with the variable air volume (VAV) boxes.
5.1.2 Enhanced Operations and Maintenance
Kaiser Permanente’s strategy for maintaining building performance over time was to appoint Marty Zapp, chief engineer at the East Interstate Medical Offi ce, as the HVAC system and controls
5 CASE STUDIES
KAISER PERMANENTE Location: Portland, Oregon
Building type: Urgent care medical offi ce building
Size: 51,000 square feet (4,700 square meters)
Project: Building tune-up
Electric utility: Portland General Electric
22
2010 IFMA Foundation
SUSTAINABILIT Y GUIDE - NO-COST/LOW-COST ENERGY SAVINGS GUIDE
champion. As champion, Mr. Zapp is in charge of:
• Proactively identifying and solving system-relat-ed problems
• Educating himself and his team about proper system maintenance
• Tracking and managing system performance
• Communicating system performance to man-agement
Mr. Zapp and his team use the upgraded interface to the control systems to complete these tasks. With remote access, a visual overview and graphi-cal controls, Mr. Zapp and his team very proac-tively maintain the building systems.
5.1.3 Results
Improved quality of care: Since the BPS pro-cess was implemented, Kaiser Permanente has reduced its occupant complaints by nearly 23 percent. With a comfortable building, both staff and patients can relax and focus on the important work of getting well.
Cost and energy savings: The building tune-up identifi ed several opportunities for Kaiser Perma-nente to save both money and energy. Such sav-ings could allow Kaiser to purchase new medical equipment related to patient care. Yet the success of this project does not just benefi t Kaiser Perma-nente and its patients. The energy Kaiser saves is enough to power 46 average Oregon homes.
Continuous improvement: The facilities team and the control systems contractor are now better equipped to identify and track down problems. They have already identifi ed and fi xed a number of additional issues. With the systems in better working order and a graphical overview of the building, the team can respond to complaints more quickly and even anticipate problems before someone calls.
5.1.4 Future Plans
The pilot project was such a success that Kaiser Permanente is performing the same process to nine more buildings. Over the next three to four years, Kaiser plans to extend this approach to all 43 buildings. To maintain the performance, they will conduct building tune-ups on each building every three to fi ve years.
The implications of the pilot are signifi cant — especially in the energy-intensive, not-for-profi t health care industry. Every dollar saved can be channeled directly into patient care and mission critical goals. The energy saved becomes avail-able to the rest of the community. With better building performance, these hospitals and clinics are not only supporting the health of their patients, they are supporting the health of their communi-ties on both a local and global scale.
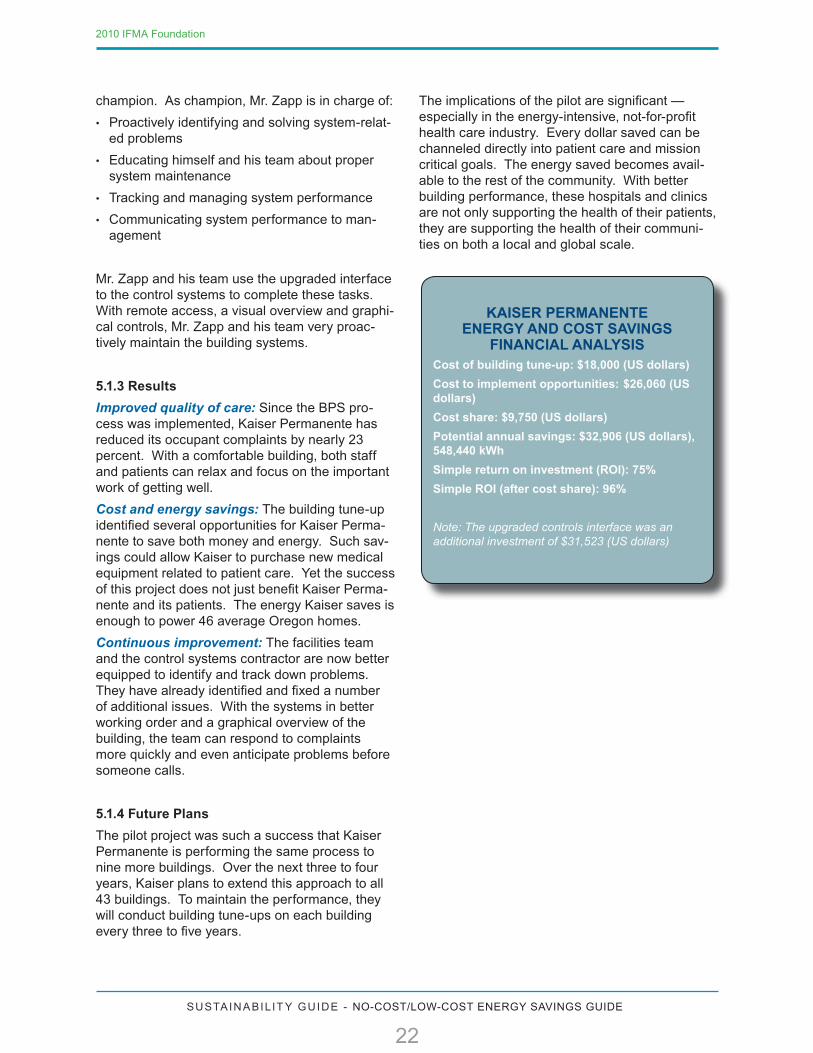
KAISER PERMANENTE ENERGY AND COST SAVINGS
FINANCIAL ANALYSIS Cost of building tune-up: $18,000 (US dollars)
Cost to implement opportunities: $26,060 (US dollars)
Cost share: $9,750 (US dollars)
Potential annual savings: $32,906 (US dollars), 548,440 kWh
Simple return on investment (ROI): 75%
Simple ROI (after cost share): 96%
Note: The upgraded controls interface was an additional investment of $31,523 (US dollars)
23
2010 IFMA Foundation
SUSTAINABILIT Y GUIDE - NO-COST/LOW-COST ENERGY SAVINGS GUIDE
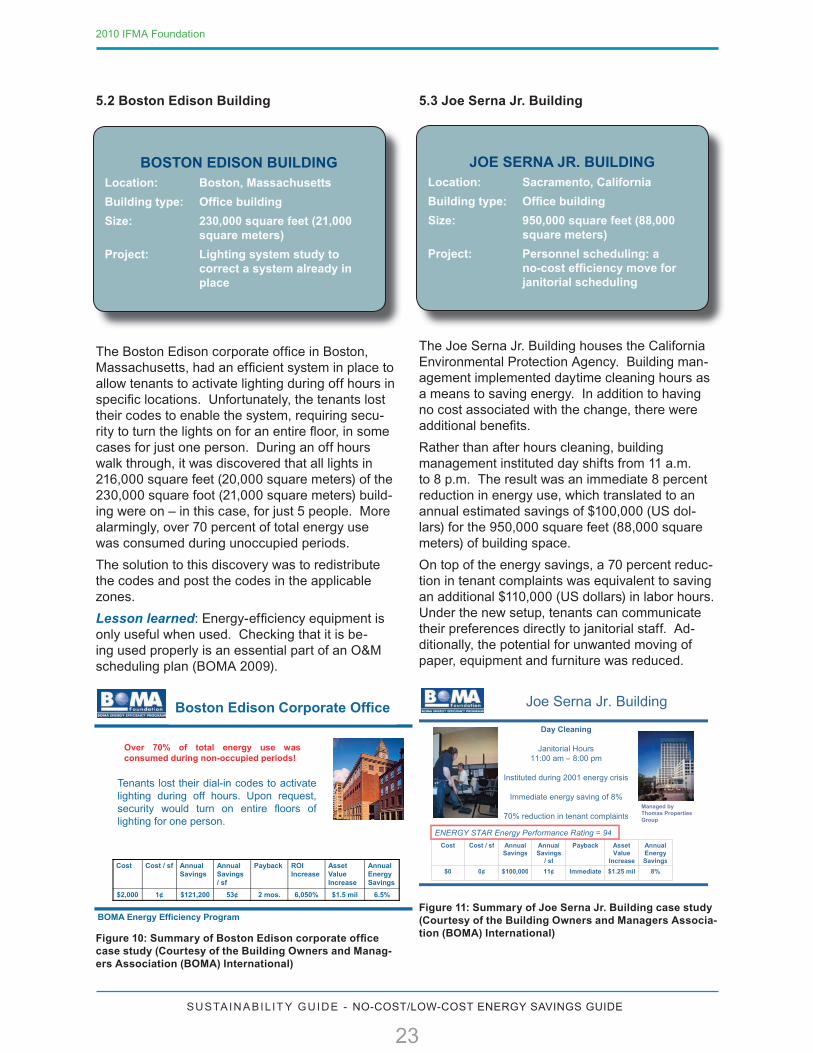
5.2 Boston Edison Building
The Boston Edison corporate offi ce in Boston, Massachusetts, had an effi cient system in place to allow tenants to activate lighting during off hours in specifi c locations. Unfortunately, the tenants lost their codes to enable the system, requiring secu-rity to turn the lights on for an entire fl oor, in some cases for just one person. During an off hours walk through, it was discovered that all lights in 216,000 square feet (20,000 square meters) of the 230,000 square foot (21,000 square meters) build-ing were on – in this case, for just 5 people. More alarmingly, over 70 percent of total energy use was consumed during unoccupied periods.
The solution to this discovery was to redistribute the codes and post the codes in the applicable zones.
Lesson learned: Energy-effi ciency equipment is only useful when used. Checking that it is be-ing used properly is an essential part of an O&M scheduling plan (BOMA 2009).
Figure 10: Summary of Boston Edison corporate offi ce case study (Courtesy of the Building Owners and Manag-ers Association (BOMA) International)
5.3 Joe Serna Jr. Building
The Joe Serna Jr. Building houses the California Environmental Protection Agency. Building man-agement implemented daytime cleaning hours as a means to saving energy. In addition to having no cost associated with the change, there were additional benefi ts.
Rather than after hours cleaning, building management instituted day shifts from 11 a.m. to 8 p.m. The result was an immediate 8 percent reduction in energy use, which translated to an annual estimated savings of $100,000 (US dol-lars) for the 950,000 square feet (88,000 square meters) of building space.
On top of the energy savings, a 70 percent reduc-tion in tenant complaints was equivalent to saving an additional $110,000 (US dollars) in labor hours. Under the new setup, tenants can communicate their preferences directly to janitorial staff. Ad-ditionally, the potential for unwanted moving of paper, equipment and furniture was reduced.
Figure 11: Summary of Joe Serna Jr. Building case study (Courtesy of the Building Owners and Managers Associa-tion (BOMA) International)
BOMA Energy Efficiency Program
Boston Edison Corporate Office
Tenants lost their dial-in codes to activatelighting during off hours. Upon request,security would turn on entire floors oflighting for one person.
Cost Cost / sf Annual Savings
Annual Savings / sf
Payback ROIIncrease
Asset Value Increase
Annual Energy Savings
$2,000 1¢ $121,200 53¢ 2 mos. 6,050% $1.5 mil 6.5%
Over 70% of total energy use wasconsumed during non-occupied periods!
JOE SERNA JR. BUILDING Location: Sacramento, California
Building type: Offi ce building
Size: 950,000 square feet (88,000 square meters)
Project: Personnel scheduling: a no-cost effi ciency move for janitorial scheduling
Day Cleaning
Janitorial Hours 11:00 am – 8:00 pm
Instituted during 2001 energy crisis
Immediate energy saving of 8%
70% reduction in tenant complaints
Joe Serna Jr. Building
Cost Cost / sf Annual Savings
Annual Savings
/ sf
Payback Asset Value
Increase
Annual Energy Savings
$0 0 ¢ $100,000 11 ¢ Immediate $1.25 mil 8%
Managed by Thomas Properties Group
ENERGY STAR Energy Performance Rating = 94
BOSTON EDISON BUILDING Location: Boston, Massachusetts
Building type: Offi ce building
Size: 230,000 square feet (21,000 square meters)
Project: Lighting system study to correct a system already in place
24
2010 IFMA Foundation
SUSTAINABILIT Y GUIDE - NO-COST/LOW-COST ENERGY SAVINGS GUIDE
5.4 Conclusion
While there are numerous innovative technologi-cal options that can increase energy efficiency, in an environment of tight budgets and escalating energy costs, as well as a heightened awareness of the importance of energy conservation, the no-cost/low-cost approach is more than appropri-ate for the majority of facilities managers — it is essential. Energy management is a key aspect of a building’s day-to-day operations. Energy management must be viewed with a wider eye that examines many aspects of usage — occupant pat-terns, equipment efficiency and weather patterns. This guide is intended to help make the process of implementing an energy plan accessible to all facilities managers.
25
2010 IFMA Foundation
SUSTAINABILIT Y GUIDE - NO-COST/LOW-COST ENERGY SAVINGS GUIDE
6 APPENDICES
6.1 Appendix A: References ASHRAE (2007). ASHRAE Standard 62: Ventilation for Acceptable Indoor Air Quality.
BetterBricks (2009a). BetterBricks Web site, see Tools & Resources section under each main heading: www.BetterBricks.com
BetterBricks (2009b). Common Opportunities: The Top Four: www.betterbricks.com/DetailPage.aspx?ID=492
BetterBricks (2009c). BetterBricks Web site, see Energy Performance Symptoms for Equipment Schedul-ing section: www.betterbricks.com/DetailPage.aspx?ID=689
BetterBricks (2009d). BetterBricks Web site, see Energy Performance Symptoms for Sensor Error page: www.betterbricks.com/detailPage.aspx?ID=829#SensorError BetterBricks (2009e). BetterBricks Web site, see Tools and Technical Advice, under the Building Opera-tions tab, Energy Performance Symptoms for Simultaneous Heating and Cooling page: www.betterbricks.com/detailPage.aspx?ID=829#SimultaneousHeatingAndCooling
BetterBricks (2009f). BetterBricks Web site, see Tools and Technical Advice, under the Building Opera-tions tab, Energy Performance Symptoms for Outside-Air Usage page: www.betterbricks.com/detailPage.aspx?ID=829#OutsideAirUsage
BetterBricks (2009g). BetterBricks Web site, see Tools and Technical Advice, under the Building Opera-tions tab, Performance Indicators page: www.betterbricks.com/DetailPage.aspx?ID=491
BetterBricks (2009h). BetterBricks Web site, see Tools & Resources, Hospitals & Healthcare section: www.betterbricks.com/subHomePage.aspx?ID=1&PID=detailpage
BOMA (2009). Building Owners and Managers Association (BOMA) International, unpublished study.
Grunwald, M. (2009). “The Seven Myths About Alternative Energy.” Foreign Policy, September/October 2009.
Hodges (2009). Getting Started, IFMA Foundation Sustainability “How-To Guide” Series: www.ifmafoundation.org/files/sustain_wp/GettingStarted.pdf
26
2010 IFMA Foundation
SUSTAINABILIT Y GUIDE - NO-COST/LOW-COST ENERGY SAVINGS GUIDE
6.2 Appendix B: ADDITIONAL RESOURCES
ENERGY STAR: www.energystar.gov home page provides energy management guidelines, tools, a resources library, expert help sources and much more. United States Department of Energy Federal Energy Management Program (FEMP): www1.eere.energy.gov/femp includes the O&M Best Practices Guide for free download. American Society of Heating, Refrigerating and Air-Conditioning Engineers (ASHRAE): www.ashrae.org provides links to many resources as well as operations and performance management certification. Database of State Incentives for Renewables and Energy Efficiency: www.dsireusa.org can be used to find local utility resources for operations and maintenance topics.
6.3 Appendix C: GLOSSARY
Benchmarking: Comparing the energy performance of one building with the performance of: (1) the same building from a previous time period, (2) the performance of other buildings in the same campus or management portfolio, or (3) the average performance of buildings in a broad regional or national data-base.
Bullhead tee: The name given to the installation of a tee fitting where the primary supply water flow en-ters the side tap and exits through the ends.
Cavitation: A condition occurring when the inlet pressure at the pump is less than the vapor pressure of the liquid being pumped, causing the liquid to vaporize into bubbles in the suction stream. The bubbles collapse upon entering the pump housing with the rotating impeller, preventing the pump from effectively moving the liquid. This creates a very distinct sound, like marbles being shaken in a tin can. Each pump has its own characteristic net positive suction head required (NPSHR) to prevent this condition.
Cell: The smallest cooling tower subdivision with independent air and water flow. It is enclosed by exte-rior walls or partition walls. Each cell may have one or more fans and one or more distribution systems.
Chilled water reset schedule: Automated control logic that raises or lowers the supply temperature of the chilled water leaving the chiller in response to another variable such as outside air temperature.
Coil: Used to heat and cool an air stream by transferring heat to or from another medium. Coils can be bare tube type or have an extended fin surface. Coils may use water, steam, refrigerant or electricity as a source for heat transfer.
Compressor: A mechanical device used to compress a gas.
Condenser: A portion of a refrigeration system in which hot refrigerant vapor is cooled by water or air, allowing the refrigerant vapor to condense back to liquid form.
Evaporator: A device in which a liquid refrigerant draws heat from chilled water and vaporizes it into a gaseous state.
27
2010 IFMA Foundation
SUSTAINABILIT Y GUIDE - NO-COST/LOW-COST ENERGY SAVINGS GUIDE
Expansion valve: A component of the refrigeration system that regulates the rate of flow of liquid refriger-ant into the evaporator.
Fan coil unit: A small terminal air handling unit with a fan and coil(s) to heat and/or cool the airstream.
Fill: The portion of a cooling tower that provides a large air-water interface area for heat transfer allowing a small amount of water to evaporate into the airstream, cooling the remaining water.
Impeller: The rotating part of a centrifugal pump, compressor or fan designed to move a fluid by rotational force. It is usually made up of a disc with multiple vanes attached to it.
Magnetic bearing technology: A centrifugal compressor with a rotor shaft and impeller that levitates dur-ing rotation while suspended in a magnetic field.
Makeup water: Water added to a circulating water system to replace water lost by evaporation, blowdown or leakage.
Notched belt: A belt with teeth (notches) used to mechanically link two or more rotating pulleys. The notches increase grip, help cool the belt and relieve stress as the belt bends around small diameter pul-leys. This belt type improves drive efficiency.
Pony motor: A small secondary cooling tower fan motor that operates instead of the primary cooling tower fan motor in light load conditions.
Predictive maintenance: Maintenance practices using specialized diagnostic equipment at regular intervals to detect the onset of deterioration of machinery. The aim of predictive maintenance is to extend service life by reducing degradation.
Preventive maintenance: A maintenance activity performed at a regular time period or run-hours interval to prevent systems from failing.
Process load: A cooling or heating load not related to maintaining occupant comfort, such as file server rooms and specialized diagnostic equipment in the health care sector. The loads may be intermittent or continuous.
Pump head: The differential pressure of a fluid generated by a pump between the inlet and outlet. This pressure may be expressed in feet of water or pounds per square inch (psi) in English units or kilopascals (kPa).
Refrigerant: A substance producing a refrigerating effect by expanding or vaporizing.
Subcooling: The process of cooling a liquid to a temperature at which it will condense at a constant pressure.
Superheat: Energy removed from the refrigerant in the condenser to make the vapor 100 percent saturated.
Terminal unit: The final piece of HVAC equipment in a distribution system capable of modifying the temperature in a conditioned space.
28
2010 IFMA Foundation
SUSTAINABILIT Y GUIDE - NO-COST/LOW-COST ENERGY SAVINGS GUIDE
Trend logging/trend log: Recording system variables, such as temperature, volume, pressure or power, at time intervals to monitor equipment operation and help identify and/or diagnose problems. Logging is accomplished using portable data loggers, electrical meters or a direct digital control (DDC) system.
Ton of cooling: The amount of energy necessary to melt one ton of 32°F (0°C) ice into 32°F (0°C) water in 24 hours. One ton of cooling equals 12,000 Btu/hour (3,516 watts).
Two-way valve: A valve regulating flow between no flow (closed) and full flow (open). It can either modu-late or operate as a two-position valve in response to an external input signal. A two-way valve does not have a bypass, like a three-way valve.
Variable-speed drive (VSD): An electronic device that controls the rotational speed of an alternating cur-rent (AC) electric motor by controlling the frequency of the electrical power supplied to the motor.
V-belt: A belt used to mechanically link two or more rotating pulleys. The “V” shape of the belt tracks in a mating groove in the pulley or sheave.
Water-to-air heat pump: A heat pump that heats or cools air by either taking heat from or rejecting heat to a closed circulating water loop and then transfers the conditioned air to the space.
Waterside economizer: An economizer added to a standard chilled water system to provide air condi-tioning without operating a chiller. The system includes chiller bypass piping, associated valves and a heat exchanger. Under certain outside air conditions and internal load conditions, water from the cooling tower bypasses the chiller to a heat exchanger connected to the chilled water supply loop.
Wet bulb temperature: A measurement of air temperature relative to the water content of the air. The bulb of a wet bulb thermometer is covered with a wetted wick. The water on the wick evaporates less in humid conditions and more in drier conditions. At 100 percent relative humidity, the wet bulb temperature is equal to the dry bulb temperature. At dry bulb temperatures where humidity is less than 100 percent, the wet bulb temperature is less than the dry bulb temperature. At any given dry bulb temperature, lower relative humidity will result in a greater difference between the two temperatures.
29
2010 IFMA Foundation
SUSTAINABILIT Y GUIDE - NO-COST/LOW-COST ENERGY SAVINGS GUIDE
This publication was made possible by the support of people like you through the IFMA Foundation.
Established in 1990 as a nonprofit, 501(c)(3) corporation, and separate entity from IFMA, the IFMA Foundation works for the public good to promote priority research and educational opportunities for the advancement of facility management. The IFMA Foundation is supported by the generosity of the facility management community including IFMA members, chapters, councils, corporate sponsors and private contributors who share the belief that education and research improve the facility management profession.
By increasing the body of knowledge available to facility professionals, the IFMA Foundation advances the profession and potential career opportunity.
IFMA Foundation contributions are used to:
Underwrite research — to generate knowledge • that directly benefits the profession
Fund educational programs — to keep facility • managers up-to-date on the latest techniques and technology
Provide scholarships — to educate the future • of the facility management profession
Without the support of workplace professionals, the IFMA Foundation would be unable to contribute to the future development and direction of facility management. That is why we need your help. If you are interested in improving the profession and your career potential, we encourage you to make a donation or get involved in a fundraising event. To learn more about the good works of the IFMA Foundation, visit www.ifmafoundation.org.
If you find this publication useful, there is something you should know…
Guides can be downloaded, free of charge, on the IFMA Foundation Web site1 E. Greenway Plaza, Suite 1100 | Houston, Texas 77046 USA | +1.281.974.5600 | www.ifmafoundation.org
Platinum Sponsors LA Chapter of IFMAGreater Philadelphia Chapter of IFMACorporate Facilities Council of IFMA Steelcase Inc.Utilities Council of IFMA
Gold Sponsors ARAMARK Management ServicesAcuity BrandsGreater New York Chapter of IFMAGraphic Systems, Inc.Denver Chapter of IFMAKayhan International LimitedFacility Engineering Associates, P.C.Greater Triangle Chapter of IFMA - Scholarship Sponsor
Silver SponsorsCentral Pennsylvania Chapter of IFMA - Scholarship SponsorDallas Fort Worth Chapter of IFMA - Scholarship SponsorEast Bay Chapter of IFMAKent Miller, FMPKimball Office Furniture Co.NW Energy Efficiency AllianceSan Francisco Chapter of IFMASan Diego Chapter of IFMASoCal Office TechnologiesSodexo Inc. - Scholarship SponsorWest Michigan Chapter of IFMA - Scholarship Sponsor
2009 – 2010 IFMA Foundation
Major Benefactors Bentley Prince Street

30
2010 IFMA Foundation
SUSTAINABILIT Y GUIDE - NO-COST/LOW-COST ENERGY SAVINGS GUIDE
The IFMA Foundation would like to thank its Corporate Contributors, the IFMA chapters, councils and members, as well as other organizations and individuals for their sponsorship. Your generous support helps to make the foundation’s education, research and scholarship initiatives possible.