coronary artery segmentation in angiographic videos utilizing
TRANSCRIPT
Wang et al. BMCMedical Imaging (2020) 20:110 https://doi.org/10.1186/s12880-020-00509-9
RESEARCH ARTICLE Open Access
Coronary artery segmentation inangiographic videos utilizingspatial-temporal informationLu Wang1,2, Dongxue Liang1* , Xiaolei Yin1,2, Jing Qiu1, Zhiyun Yang3, Junhui Xing4, Jianzeng Dong3,4
and Zhaoyuan Ma1
Abstract
Background: Coronary artery angiography is an indispensable assistive technique for cardiac interventional surgery.Segmentation and extraction of blood vessels from coronary angiographic images or videos are very essentialprerequisites for physicians to locate, assess and diagnose the plaques and stenosis in blood vessels.
Methods: This article proposes a novel coronary artery segmentation framework that combines a three–dimensional(3D) convolutional input layer and a two–dimensional (2D) convolutional network. Instead of a single input image inthe previous medical image segmentation applications, our framework accepts a sequence of coronary angiographicimages as input, and outputs the clearest mask of segmentation result. The 3D input layer leverages the temporalinformation in the image sequence, and fuses the multiple images into more comprehensive 2D feature maps. The2D convolutional network implements down–sampling encoders, up–sampling decoders, bottle–neck modules, andskip connections to accomplish the segmentation task.
Results: The spatial–temporal model of this article obtains good segmentation results despite the poor quality ofcoronary angiographic video sequences, and outperforms the state–of–the–art techniques.
Conclusions: The results justify that making full use of the spatial and temporal information in the image sequenceswill promote the analysis and understanding of the images in videos.
Keywords: Coronary artery angiography, Image segmentation, Video segmentation
BackgroundPhysicians have been practicing interventional surgeriesto diagnose and treat cardiovascular diseases for sev-eral decades. They locate, assess and diagnose the bloodvessel stenosis and plaques by directly watching the angio-graphic videos with naked eyes during the surgeries.Based on their experiences, the physicians quickly makea qualitative judgment on the patient’s coronary arterycondition and plan the treatment. This direct methodis greatly affected by human factors and lacks accuracy,
*Correspondence: [email protected] Future Laboratory, Tsinghua University, 100084 Beijing, ChinaFull list of author information is available at the end of the article
objectivity and consistency. Automated cardiovascularsegmentation will help reduce the diagnostic inaccura-cies for physicians. Many blood vessel extraction methodsbased on image segmentation have emerged driven bythis motivation. Recently, with the development of deeplearning, various deep neural network architectures havebeen proposed and applied in the medical image segmen-tation field [1–4]. Early deep learning–based approachesused the image patches and a sliding window block to tra-verse the image [5]. But the sliding window method castsa huge amount of computation, andmisses the global con-texts of the image at the same time. Yang et al. [6] usedtwo convolutional neural networks (CNN) to process the
© The Author(s). 2020 Open Access This article is licensed under a Creative Commons Attribution 4.0 International License,which permits use, sharing, adaptation, distribution and reproduction in any medium or format, as long as you give appropriatecredit to the original author(s) and the source, provide a link to the Creative Commons licence, and indicate if changes weremade. The images or other third party material in this article are included in the article’s Creative Commons licence, unlessindicated otherwise in a credit line to the material. If material is not included in the article’s Creative Commons licence and yourintended use is not permitted by statutory regulation or exceeds the permitted use, you will need to obtain permission directlyfrom the copyright holder. To view a copy of this licence, visit http://creativecommons.org/licenses/by/4.0/. The CreativeCommons Public Domain Dedication waiver (http://creativecommons.org/publicdomain/zero/1.0/) applies to the data madeavailable in this article, unless otherwise stated in a credit line to the data.
Wang et al. BMCMedical Imaging (2020) 20:110 Page 2 of 10
patches and the whole image to obtained good perfor-mance in the segmentation of coronary artery vessels inangiograms, but it is very time–consuming. In 2015, fully–convolutional network [7], encoder–decoder network [8],and U–Net [9] were proposed and achieved good results.Since then, various methods based on U–Net architec-ture have sprung up. M–Net added a multi–scale inputimage and deep supervision [10]. Newmodules have beenproposed to replace some blocks in the U–Net architec-ture to enhance the feature learning ability. Gibson et al.,proposed a dense connection in the encoder block [11].Zhao et al., introduced a modified U–Net by adding aspatial pyramid pooling [12]. Gu et al., inserted a denseatrous convolution (DAC) block and a residual multi–kernel pooling (RMP) block into the bottle–neck part,to extract and preserve more spatial context, and this itthe state–of–the–art model, the CE–Net [13]. Zhang etal. introduced an attention-guided network to improvethe performance of retina vessel segmentation [14]. Adual encoding U–Net was proposed to replace the skip–connections with attention modules to further promote ofretinal vessel segmentation [15].Nevertheless, some essential problems are associated
with the blood vessel segmentation tasks in cardiovascularangiographic images. First, the shape of the cardiac bloodvessels is complex and easily deformed. Coronary arter-ies have a tubular curved structure, and some can block,cover or entangle with one another, making the semanticinformation confusing in the images. Second, the angio-graphic images contain not only blood vessels, but alsoother organs and tissues which have similar shape andgrayscale values, making it evenmore difficult to correctlyextract the object [16]. Third, in order to minimize thedamage to the health of the patients and physicians duringthe surgery, it is inevitable to reduce the dose of X–rays[17, 18], which results in low illumination and insufficientsignal–to-noise ratio of the images [19], making the seg-mentation tasks even more challenging. Considering thatthe angiographic video is composed of a series of time–continuous image sequences, combining and processingseveral consecutive frames of images may provide a goodinsight for solving these problems. Intuitively, the bloodvessels inter-blocking each other in one frame may beseparated in another one. The problem of low signal–to–noise ratio caused by low illumination may be eliminatedby the accumulation of multiple images. Therefore, thetemporal dimension of the video also contains rich con-textual information. Utilizing the time domain informa-tion to segment blood vessels from angiographic videosbecomes a topic worthy of study.In the mean time, since 2D CNN has achieved
good results in image processing tasks, researchers haveextended their interests to the video classification and seg-mentation field. The temporal information in the video is
regarded as the third dimension, and 3D CNN is intro-duced as an important tool. The Inception 3D (I3D) archi-tecture proposed by Carreira et al. is one of the pioneer 3Dmodels [20], which inflates all the 2D convolutional ker-nels in the Inception V1 architecture [21] into 3D kernels,and is trained on the large–scale Kinetics dataset of videos[22]. However, the computational cost of 3D convolutionis extremely high, so a variety of mixed convolutionalmodels based on ResNet architecture have been proposedto resolve this dilemma. Another way to reduce the com-putational cost is to replace the 3D convolution withseparable convolutions. In order to effectively make use ofthe temporal dimension, [23] proposed a R(2+1)D convo-lutional neural network, and [24] proposed a model calledthe pseudo 3D network.In this article, we consider combining the advantages of
3D and 2D convolution to accomplish the task of bloodvessel segmentation from coronary angiographic videos.Based on the architecture of 2D U–Net and its derivativeCE–Net, we propose a 3D–2D network. The 3D convolu-tional layer mainly serves to extract and process temporalinformation in the video, and the 2D network extractsthe spatial information. Our main contributions are asfollows:
• A novel deep learning architecture combining 3Dand 2D convolution to extract both temporal andspatial information from videos.
• A new application of deep learning–based videosegmentation algorithm in the medical imaging field.
MethodsIn this section, the role of 3D convolution in volumetricimage segmentation, and in video processing is investi-gated briefly. Then we give a detailed elaboration of the 3Dlayer and the 2D network design, and the determinationof an important hyper–parameter in the end.
Volumetric images and image sequence3D convolution has been widely used in the volumetricmedical image processing, such as tumor segmentationfrom layered scanned organic computerized tomography(CT) [25, 26]. The CT renders a series of layered 2Dimages, and the layers are stacked into a 3D volumetricimage. The physical meaning of the spatial dimensions(width, height, depth) of this volumetric image is veryclear, and the correlation between the layers constitutesthe spatial context information of the image data. There-fore, it is a natural approach to apply 3D convolutionalnetworks to volumetric image segmentation tasks.However, coronary angiography is fundamentally dif-
ferent from CT scan imaging. Coronary angiographyobtains a two–dimensional image whose spatial depthinformation has been squeezed. There are only two spatial
Wang et al. BMCMedical Imaging (2020) 20:110 Page 3 of 10
dimensions, ie., width and height. The traditional coro-nary artery segmentation task is to process an indepen-dent contrast image, and a 2D convolutional neural net-work is used to extract the spatial details and contextinformation from the image. We cannot directly apply 3Dconvolutional networks to such image segmentation tasks.It should be noted that coronary angiography is a continu-ous imaging process, and the sequence of moving contrastimages forms a video. Thus the video contains informa-tion in three dimensions, ie., two spatial dimensions, andone temporal dimension. Previous work proved that thetemporal dimension in the videos contains rich imagesemantic representations [23]. Making full use of thetemporal information can greatly benefit image seman-tic segmentation, and enhance the performance of taskssuch as scene understanding and target recognition. 3Dconvolutional networks have been widely applied in thesetasks.
3D–2D networkThis article is inspired by the work of deep learn-ing based video processing and 2D medical imagesegmentation methods. The sequential frames of thecoronary angiographic video are stacked to form 3Ddata. We use a combination of 3D convolutional lay-ers and a 2D network for the blood vessel segmenta-tion task. The 3D and 2D convolutions are not sim-ply combined applications, but each has its own pur-pose, and the order of the two operations cannot bereversed.
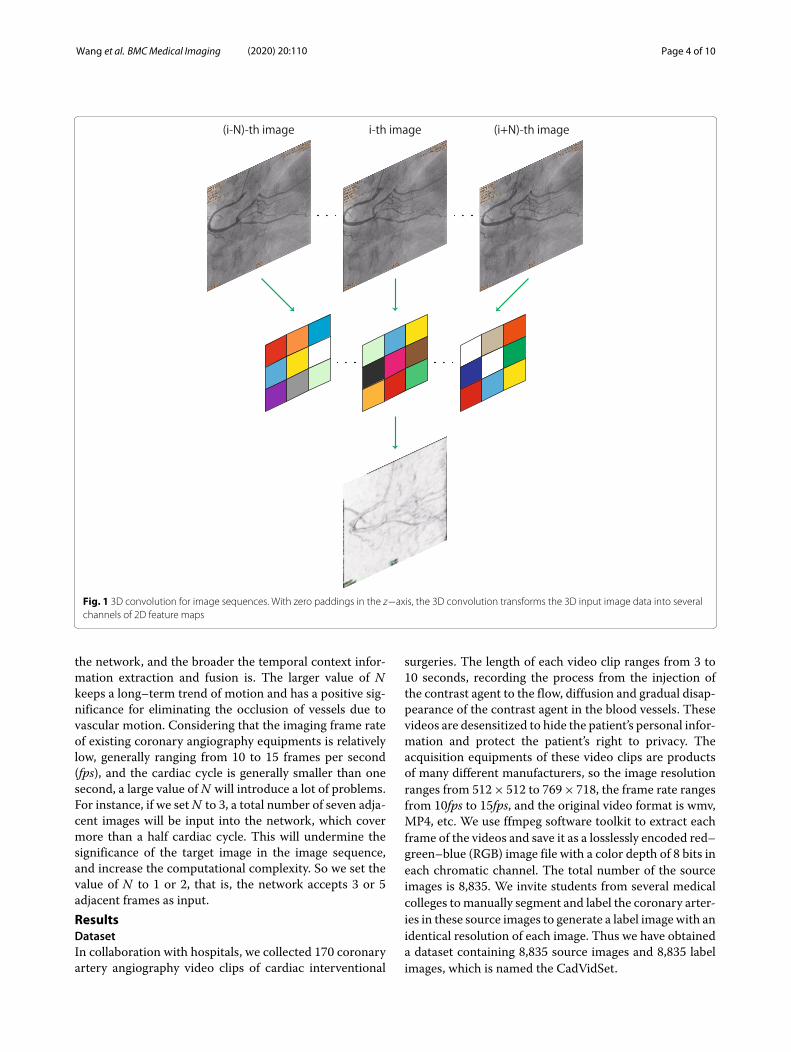
3D input layerIn our design, the network accepts several consecutiveframes of image as input, and then outputs the segmen-tation mask corresponding to the middle frame. This isa task where multiple inputs correspond to one output,and the transformation of the number of images is imple-mented by the 3D input layer. We define the image tobe segmented as the target image, and the temporallyadjacent 2N images are referred to as auxiliary images,which containN images before and after the target image,respectively. The 2N + 1 input images form 3D data witha resolution of (2N + 1)×W ×H . The spatial dimensionsof the 3D data is annotated as x and y, and the temporaldimension as z. The 3D input data are extracted and fusedby the 3D convolution layer to obtain several channels of2D feature maps, with a resolution ofW ×H , whereas thedepth of z reduced to 1. Dimension reduction is achievedby a special design of the 3D convolutional kernel, that is,the size of the 3D kernel is (2N + 1) × 3× 3, the paddingsin the x−, y− and z− axes are 1, 1, 0, respectively, and thestrides are all 1 in the three axes. A brief illustration of the3D convolution operated on image sequences is given inFig. 1 and Eq. 1.
g(x, y) =N∑
t=−N
1∑
w=−1
1∑
h=−1w(t,w, h)f (i+ t, x+w, y+h),
(1)
where the i-th image in the sequence is the target image,and the neighboring 2N images are taken into account forthe convolution in the z−axis.Because the 3D convolutional layer has a small kernel
size in the spatial dimensions x and y, the receptive fieldin the spatial dimensions is limited. As a consequence,the 3D convolutional operation is mainly used to extractand fuse the time domain information and the tempo-ral correlations between successive frames in the video.Weighted combinations of the pixel values of the multi–frame images are then merged into 2D feature maps.Another 2D convolutional layer followed by a 2D maxpooling layer is inserted right after the input 3D layer, toadjust the channel number as well as reducing the resolu-tion of the feature maps to 1/2, to fit the dimensions of thefirst encoder module of the subsequent 2D network.
2D networkThe 2D CE–Net [13], which is composed of down–sampling encoder modules, up–sampling decoder mod-ules, bottle–neck (DAC and RMP modules), and skip–connections, is used as the backbone network in ourarchitecture. It is intended to extract several levels of spa-tial correlation in different scales in the fused 2D featuremaps, and identify the foreground and the backgroundpixels in the target image.
Network architectureThe network architecture, as well as the input imagesequence and the output mask are illustrated in Fig. 2.The detailed structures of the encoder and decoder areillustrated in Fig. 3. The main innovation and contribu-tion of this article lie in the use of 3D and 2D convolutionsto process different domains of information, as explainedearlier, as well as the limitation of the computational com-plexity to an acceptable range by this 3D and 2D hybridnetwork design, which is going to be elaborated in the“Results” section.
Choice of NAs the heart beats cyclically, the cardiovascular vesselsexpand and contract in cycles accordingly. In the processof vessel motion, mutual blocking between blood vesselsand deformations will inevitably occur. The value of N isan important hyperparameter. The smallerN is, the fewerinput neighboring images are captured, and the extractedtemporal context information is confined to a small range,but more accurate spatial details are retained. The largerthe value of N is, the more adjacent images are input into
Wang et al. BMCMedical Imaging (2020) 20:110 Page 4 of 10
Fig. 1 3D convolution for image sequences. With zero paddings in the z−axis, the 3D convolution transforms the 3D input image data into severalchannels of 2D feature maps
the network, and the broader the temporal context infor-mation extraction and fusion is. The larger value of Nkeeps a long–term trend of motion and has a positive sig-nificance for eliminating the occlusion of vessels due tovascular motion. Considering that the imaging frame rateof existing coronary angiography equipments is relativelylow, generally ranging from 10 to 15 frames per second(fps), and the cardiac cycle is generally smaller than onesecond, a large value ofN will introduce a lot of problems.For instance, if we setN to 3, a total number of seven adja-cent images will be input into the network, which covermore than a half cardiac cycle. This will undermine thesignificance of the target image in the image sequence,and increase the computational complexity. So we set thevalue of N to 1 or 2, that is, the network accepts 3 or 5adjacent frames as input.ResultsDatasetIn collaboration with hospitals, we collected 170 coronaryartery angiography video clips of cardiac interventional
surgeries. The length of each video clip ranges from 3 to10 seconds, recording the process from the injection ofthe contrast agent to the flow, diffusion and gradual disap-pearance of the contrast agent in the blood vessels. Thesevideos are desensitized to hide the patient’s personal infor-mation and protect the patient’s right to privacy. Theacquisition equipments of these video clips are productsof many different manufacturers, so the image resolutionranges from 512× 512 to 769× 718, the frame rate rangesfrom 10fps to 15fps, and the original video format is wmv,MP4, etc. We use ffmpeg software toolkit to extract eachframe of the videos and save it as a losslessly encoded red–green–blue (RGB) image file with a color depth of 8 bits ineach chromatic channel. The total number of the sourceimages is 8,835. We invite students from several medicalcolleges tomanually segment and label the coronary arter-ies in these source images to generate a label image with anidentical resolution of each image. Thus we have obtaineda dataset containing 8,835 source images and 8,835 labelimages, which is named the CadVidSet.
Wang et al. BMCMedical Imaging (2020) 20:110 Page 5 of 10
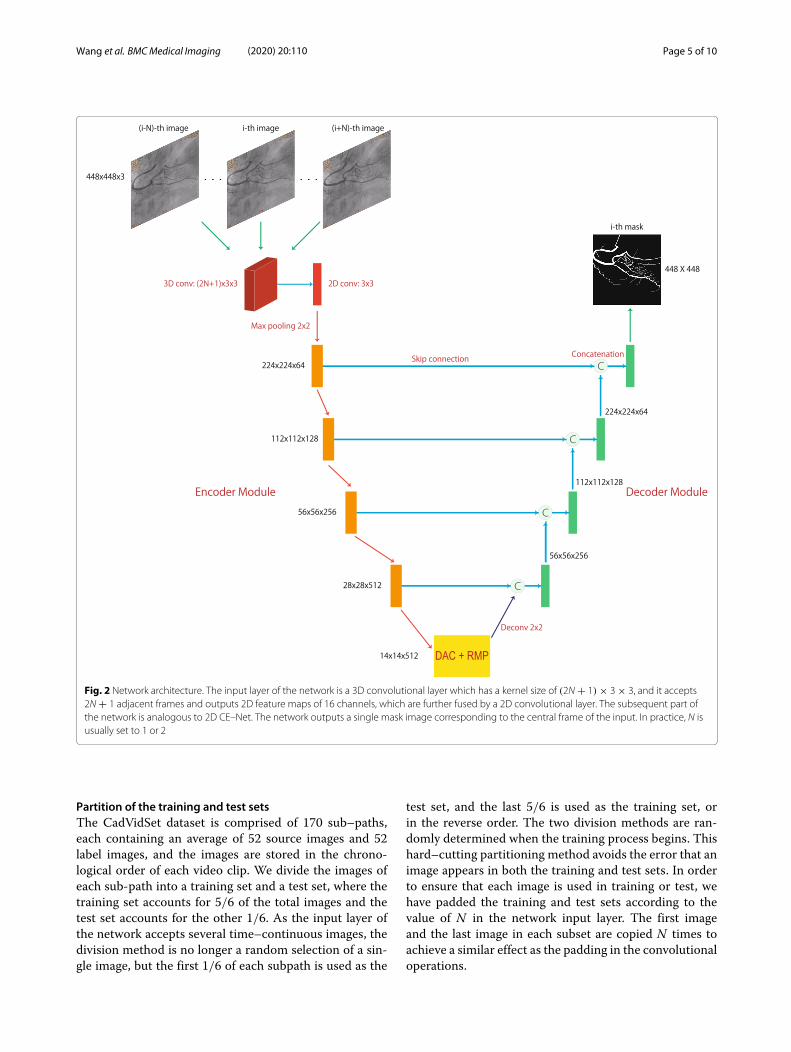
Fig. 2 Network architecture. The input layer of the network is a 3D convolutional layer which has a kernel size of (2N + 1) × 3 × 3, and it accepts2N + 1 adjacent frames and outputs 2D feature maps of 16 channels, which are further fused by a 2D convolutional layer. The subsequent part ofthe network is analogous to 2D CE–Net. The network outputs a single mask image corresponding to the central frame of the input. In practice, N isusually set to 1 or 2
Partition of the training and test setsThe CadVidSet dataset is comprised of 170 sub–paths,each containing an average of 52 source images and 52label images, and the images are stored in the chrono-logical order of each video clip. We divide the images ofeach sub-path into a training set and a test set, where thetraining set accounts for 5/6 of the total images and thetest set accounts for the other 1/6. As the input layer ofthe network accepts several time–continuous images, thedivision method is no longer a random selection of a sin-gle image, but the first 1/6 of each subpath is used as the
test set, and the last 5/6 is used as the training set, orin the reverse order. The two division methods are ran-domly determined when the training process begins. Thishard–cutting partitioning method avoids the error that animage appears in both the training and test sets. In orderto ensure that each image is used in training or test, wehave padded the training and test sets according to thevalue of N in the network input layer. The first imageand the last image in each subset are copied N times toachieve a similar effect as the padding in the convolutionaloperations.
Wang et al. BMCMedical Imaging (2020) 20:110 Page 6 of 10
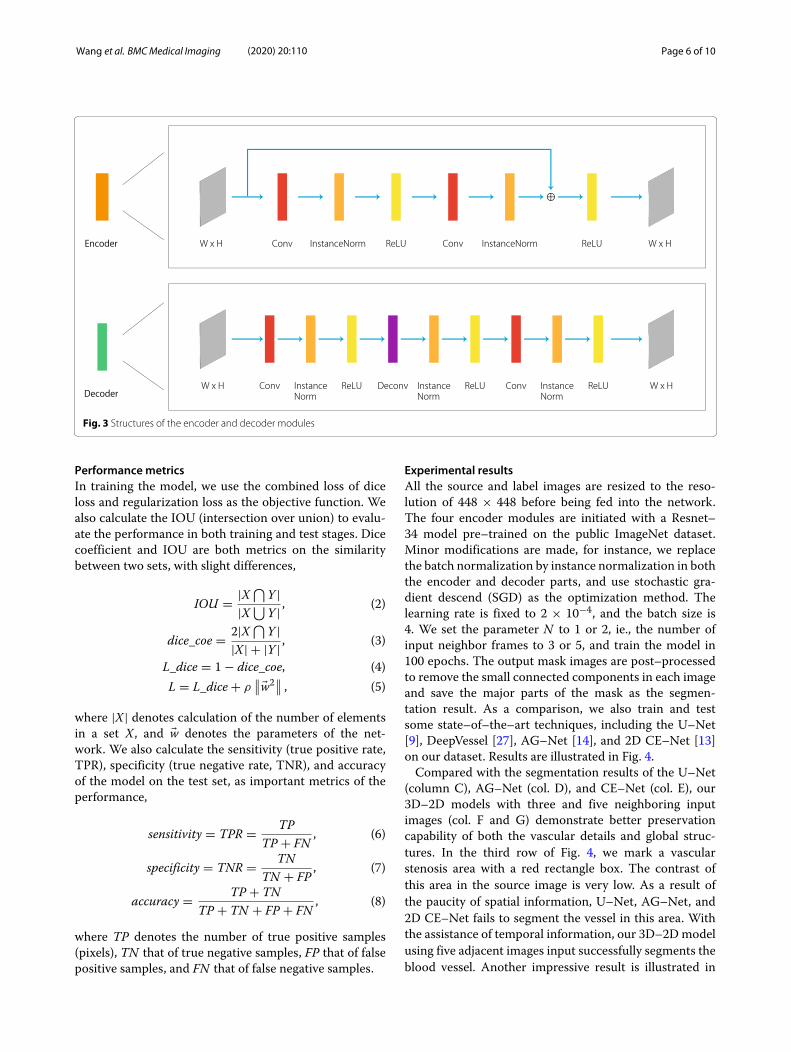
Fig. 3 Structures of the encoder and decoder modules
Performance metricsIn training the model, we use the combined loss of diceloss and regularization loss as the objective function. Wealso calculate the IOU (intersection over union) to evalu-ate the performance in both training and test stages. Dicecoefficient and IOU are both metrics on the similaritybetween two sets, with slight differences,
IOU = |X ⋂Y |
|X ⋃Y | , (2)
dice_coe = 2|X ⋂Y |
|X| + |Y | , (3)
L_dice = 1 − dice_coe, (4)L = L_dice + ρ
∥∥�w2∥∥ , (5)
where |X| denotes calculation of the number of elementsin a set X, and �w denotes the parameters of the net-work. We also calculate the sensitivity (true positive rate,TPR), specificity (true negative rate, TNR), and accuracyof the model on the test set, as important metrics of theperformance,
sensitivity = TPR = TPTP + FN
, (6)
specificity = TNR = TNTN + FP
, (7)
accuracy = TP + TNTP + TN + FP + FN
, (8)
where TP denotes the number of true positive samples(pixels), TN that of true negative samples, FP that of falsepositive samples, and FN that of false negative samples.
Experimental resultsAll the source and label images are resized to the reso-lution of 448 × 448 before being fed into the network.The four encoder modules are initiated with a Resnet–34 model pre–trained on the public ImageNet dataset.Minor modifications are made, for instance, we replacethe batch normalization by instance normalization in boththe encoder and decoder parts, and use stochastic gra-dient descend (SGD) as the optimization method. Thelearning rate is fixed to 2 × 10⁻⁴, and the batch size is4. We set the parameter N to 1 or 2, ie., the number ofinput neighbor frames to 3 or 5, and train the model in100 epochs. The output mask images are post–processedto remove the small connected components in each imageand save the major parts of the mask as the segmen-tation result. As a comparison, we also train and testsome state–of–the–art techniques, including the U–Net[9], DeepVessel [27], AG–Net [14], and 2D CE–Net [13]on our dataset. Results are illustrated in Fig. 4.Compared with the segmentation results of the U–Net
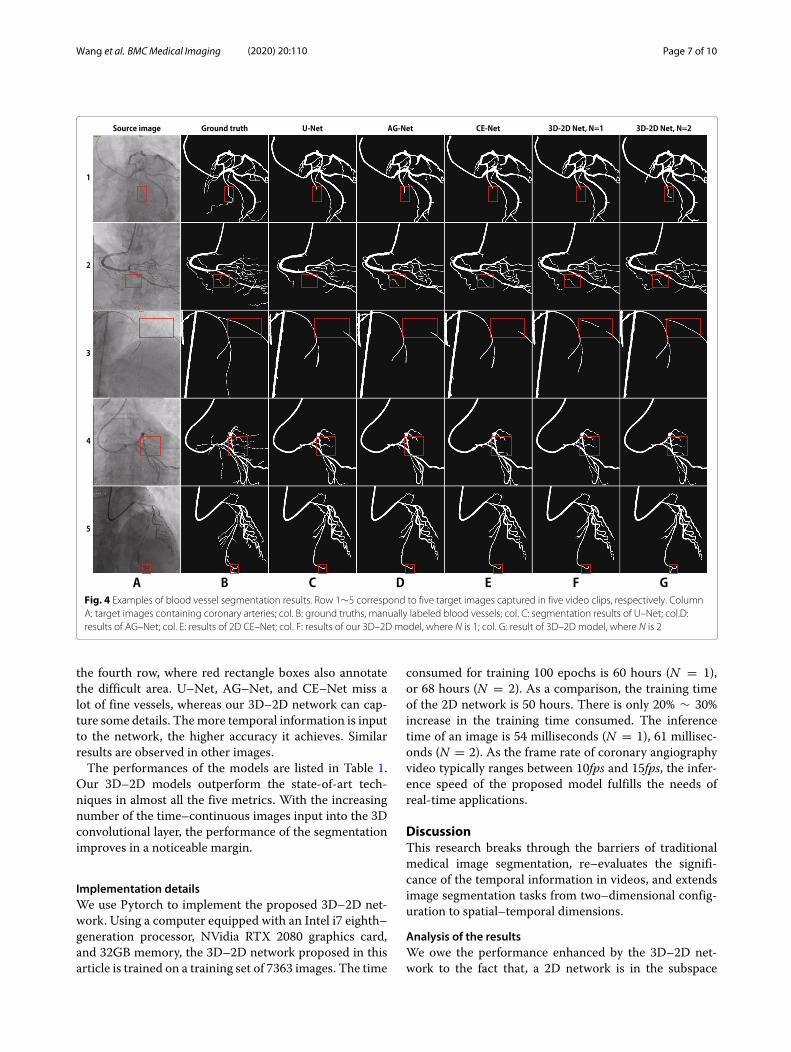
(column C), AG–Net (col. D), and CE–Net (col. E), our3D–2D models with three and five neighboring inputimages (col. F and G) demonstrate better preservationcapability of both the vascular details and global struc-tures. In the third row of Fig. 4, we mark a vascularstenosis area with a red rectangle box. The contrast ofthis area in the source image is very low. As a result ofthe paucity of spatial information, U–Net, AG–Net, and2D CE–Net fails to segment the vessel in this area. Withthe assistance of temporal information, our 3D–2Dmodelusing five adjacent images input successfully segments theblood vessel. Another impressive result is illustrated in
Wang et al. BMCMedical Imaging (2020) 20:110 Page 7 of 10
Fig. 4 Examples of blood vessel segmentation results. Row 1∼5 correspond to five target images captured in five video clips, respectively. ColumnA: target images containing coronary arteries; col. B: ground truths, manually labeled blood vessels; col. C: segmentation results of U–Net; col.D:results of AG–Net; col. E: results of 2D CE–Net; col. F: results of our 3D–2D model, where N is 1; col. G: result of 3D–2D model, where N is 2
the fourth row, where red rectangle boxes also annotatethe difficult area. U–Net, AG–Net, and CE–Net miss alot of fine vessels, whereas our 3D–2D network can cap-ture some details. Themore temporal information is inputto the network, the higher accuracy it achieves. Similarresults are observed in other images.The performances of the models are listed in Table 1.
Our 3D–2D models outperform the state-of-art tech-niques in almost all the five metrics. With the increasingnumber of the time–continuous images input into the 3Dconvolutional layer, the performance of the segmentationimproves in a noticeable margin.
Implementation detailsWe use Pytorch to implement the proposed 3D–2D net-work. Using a computer equipped with an Intel i7 eighth–generation processor, NVidia RTX 2080 graphics card,and 32GB memory, the 3D–2D network proposed in thisarticle is trained on a training set of 7363 images. The time
consumed for training 100 epochs is 60 hours (N = 1),or 68 hours (N = 2). As a comparison, the training timeof the 2D network is 50 hours. There is only 20% ∼ 30%increase in the training time consumed. The inferencetime of an image is 54 milliseconds (N = 1), 61 millisec-onds (N = 2). As the frame rate of coronary angiographyvideo typically ranges between 10fps and 15fps, the infer-ence speed of the proposed model fulfills the needs ofreal-time applications.
DiscussionThis research breaks through the barriers of traditionalmedical image segmentation, re–evaluates the signifi-cance of the temporal information in videos, and extendsimage segmentation tasks from two–dimensional config-uration to spatial–temporal dimensions.
Analysis of the resultsWe owe the performance enhanced by the 3D–2D net-work to the fact that, a 2D network is in the subspace
Wang et al. BMCMedical Imaging (2020) 20:110 Page 8 of 10
Table 1 Comparison of the performances of the state–of–the–art models, and the proposed 3D–2D CE–Net with N = 1 and N = 2 onthe CadVidSet
Model N sensitivity specificity accuracy IOU (vessel) IOU (background)
U–Net (2015) [9] 0.7031 0.9798 0.9704 0.6594 0.9685
DeepVessel (2016) [27] 0.7102 0.9813 0.9722 0.6665 0.9717
AG–Net (2019) [14] 0.7256 0.9862 0.9776 0.6837 0.9765
CE–Net (2019) [13] 0.7606 0.9943 0.9813 0.6983 0.9845
3D–2D CE–Net (ours) 1 0.7921 0.9935 0.9854 0.7109 0.9846
3D–2D CE–Net (ours) 2 0.7993 0.9939 0.9855 0.7137 0.9847
of the 3D–2D network parametric space. Consider anextreme case: suppose that the 3D–2D network cannotlearn the correlation in the time domain at all, or theimage sequence has no temporal correlations betweensuccessive images at all, so the 3D convolutional kernelof the input layer has a special weight distribution – onlythe layer corresponding to the target image has non–zerovalue weights, whereas the layers corresponding to otherimages in the time domain have zero value weights. In thispeculiar situation, a 3D convolutional kernel degeneratesinto a 2D kernel, and the 3D–2D network degenerates intoa 2D network. This demonstrates that the 2D network isa subspace of the 3D–2D network parametric space. Thisimplies that, theoretically speaking, the performance ofthe 2D network is the lower bound of the performanceof the 3D–2D network for image segmentation tasks. Inthe absence of temporal correlations between successiveimages, a 3D–2D network is expected to perform as wellas a 2D network, and to outperform the latter with theassistance of time–domain correlations. The experimentshave confirmed that the performance of the proposed 3D–2D network is better than the 2D models. This furtherjustifies the temporal correlations in image sequences orvideos make a great contribution to the understanding ofimage semantic contents.
Limitations of the methodThere are still two major limitations of the 3D–2Dmethod. The first one is the choice of N . N should not
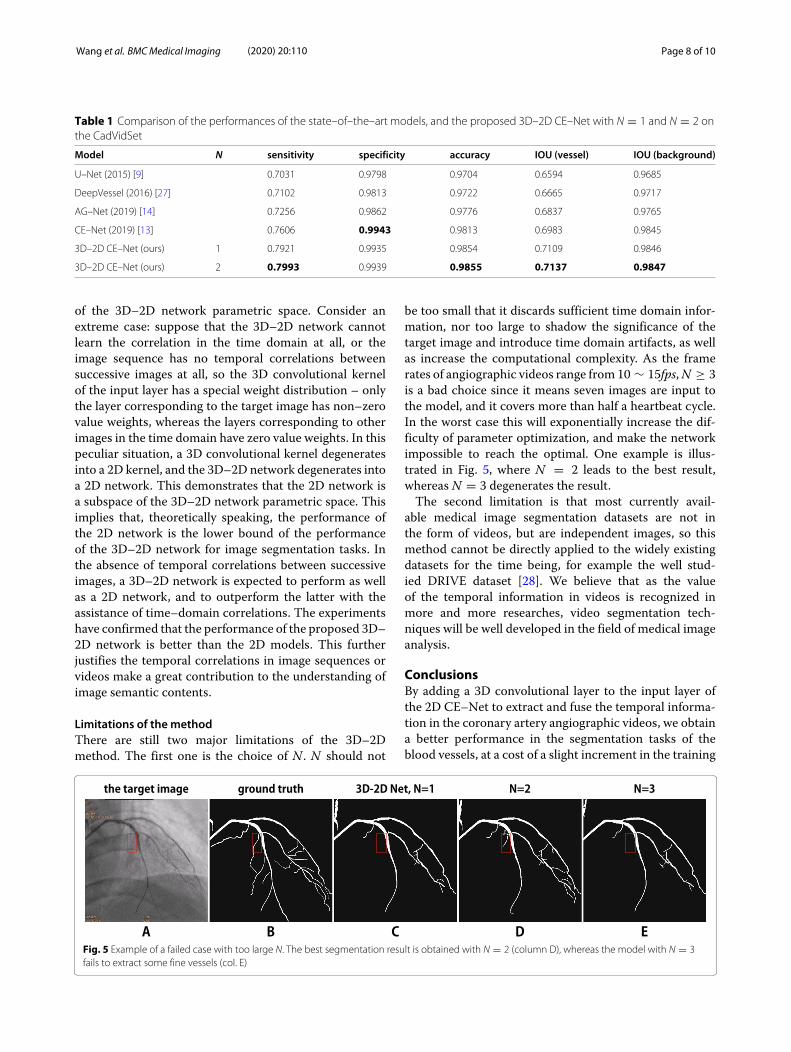
be too small that it discards sufficient time domain infor-mation, nor too large to shadow the significance of thetarget image and introduce time domain artifacts, as wellas increase the computational complexity. As the framerates of angiographic videos range from 10 ∼ 15fps,N ≥ 3is a bad choice since it means seven images are input tothe model, and it covers more than half a heartbeat cycle.In the worst case this will exponentially increase the dif-ficulty of parameter optimization, and make the networkimpossible to reach the optimal. One example is illus-trated in Fig. 5, where N = 2 leads to the best result,whereas N = 3 degenerates the result.The second limitation is that most currently avail-
able medical image segmentation datasets are not inthe form of videos, but are independent images, so thismethod cannot be directly applied to the widely existingdatasets for the time being, for example the well stud-ied DRIVE dataset [28]. We believe that as the valueof the temporal information in videos is recognized inmore and more researches, video segmentation tech-niques will be well developed in the field of medical imageanalysis.
ConclusionsBy adding a 3D convolutional layer to the input layer ofthe 2D CE–Net to extract and fuse the temporal informa-tion in the coronary artery angiographic videos, we obtaina better performance in the segmentation tasks of theblood vessels, at a cost of a slight increment in the training
Fig. 5 Example of a failed case with too large N. The best segmentation result is obtained with N = 2 (column D), whereas the model with N = 3fails to extract some fine vessels (col. E)
Wang et al. BMCMedical Imaging (2020) 20:110 Page 9 of 10
and inference time. Experiments demonstrate that for theframe rate of the angiographic video, feeding five suc-cessive images into the 3D–2D network renders the bestsegmentation results. This work justifies that the time–domain information of videos has practical significancefor image segmentation and interpretation, and is worthyof further study.
Abbreviations2D: Two-dimensional; 3D: Three-dimensional; CNN: Convolutional neuralnetwork; IOU: Intersection over union; DAC: Dense atrous convolution; RMP:Residual multi–kernel pooling; CT: Computerized tomography; fps: Frame persecond; RGB: Red–green–blue; TPR: True positive rate; FPRL: False positive rate;TNRL: True negative rate; FNR: False negative rate; SGD: Stochastic gradientdescend; col.: Column.
AcknowledgementsNot applicable.
Authors’ contributionsLW designed the network architecture, wrote the computer program, did thetraining and test, and wrote the manuscript. Dr. DXL co–wrote the program,and did the training and test. XLY designed the dataset separation method,and contributed to the training and test. JQ also contributed to the design ofthe dataset separation method. ZYY collected the dataset and conducted thelabelling. Dr. JHX also contributed to the dataset labelling. Prof. JZD supervisedthe dataset labelling, and gave advises to the method design. Prof. ZYMproposed the research project, gave advises to the method design, andreviewed the manuscript. All authors read and approved the final manuscript.
FundingNot applicable.
Availability of data andmaterialsData related to the current study are available from the corresponding authoron reasonable request.
Ethics approval and consent to participateAll enrolled patients were provided written informed consent after receivingdetailed explanations. The access permission to the angiographic videosassessed in this study was authorized and supervised by the Capital MedicalUniversity Ethics (No.2006003X), and also approved by the Ethics Committeeof the First Affiliated Hospital of Zhengzhou University.
Consent for publicationNot applicable.
Competing interestsThe authors declare that they have no competing interests.
Author details1The Future Laboratory, Tsinghua University, 100084 Beijing, China.2Department of Information Art and Design, Academy of Arts and Design,Tsinghua University, 100084 Beijing, China. 3Center for Cardiology, BeijingAnzhen Hospital, Capital Medical University, 100029 Beijing, China. 4The FirstAffiliated Hospital of Zhengzhou University, 450052 Zhengzhou, China.
Received: 25 May 2020 Accepted: 13 September 2020
References1. Krizhevsky A, Sutskever I, Hinton G. Imagenet classification with deep
convolutional neural networks. In: Advances in Neural InformationProcessing Systems; 2012. p. 1097–105.
2. Wang Z, Yin Y, Shi J, Fang W, Li H, Wang X. Zoom–in–net: Deep mininglesions for diabetic retinopathy detection. In: Proceedings of theInternational Conference on Medical Image Computing and ComputerAssisted Intervention; 2017. p. 267–75.
3. Cherukuri V, Kumar BGV, Bala R, Monga V. Deep retinal imagesegmentation with regularization under geometric priors. IEEE TransImage Process. 2020;29:2552–67.
4. Hiasa Y, Otake Y, Takao M, Ogawa T, Sugano N, Sato Y. Automatedmuscle segmentation from clinical CT using Bayesian U–net forpersonalized musculoskeletal Modeling. IEEE Trans Med Imaging.2020;39(4):1030–40.
5. Ciresan D, Giusti A, Gambardella LM, Schmidhuber J. Deep neuralnetworks segment neuronal membranes in electron microscopy images.Neural Inf Process Syst. 2012;2843–51.
6. Yang S, Yang J, Wang Y, Yang Q, Ai D, Wang Y. Automatic coronaryartery segmentation in X–ray angiograms by multiple convolutionalneural networks. In: Proceedings of the 3rd International Conference onMultimedia and Image Processing; 2018. p. 31–5.
7. Shelhamer E, Long J, Darrell T. Fully convolutional networks for semanticsegmentation. IEEE Trans Pattern Anal Mach Intell. 2017;39(4):640–51.
8. Noh H, Hong S, Han B. Learning deconvolution network for semanticsegmentation. In: Proceedings of the IEEE International Conference onComputer Vision; 2015. p. 1520–8.
9. Ronneberger O, Fischer P, Brox T. U–net: Convolutional networks forbiomedical image segmentation. Int Conf Med Image ComputComput-Assist Interv. 2015;234–41.
10. Fu H, Cheng J, Xu Y, Wong DWK, Liu J, Cao X. Joint optic disc and cupsegmentation based on multi-label deep network and polartransformation. IEEE Trans Med Imaging. 2018;37(7):1597–605.
11. Gibson E, Giganti F, Hu Y, Bonmati E, Bandula S, Gurusamy K, DavidsonB, Pereira SP, Clarkson MJ, Barratt DC. Automatic multi-organsegmentation on abdominal CT with dense v-networks. IEEE Trans MedImaging. 2018;37(8):1822–34.
12. Zhao H, Shi J, Qi X, Wang X, Jia J. Pyramid scene parsing network. In:Proceedings of the IEEE Conference on Computer Vision and PatternRecognition; 2017. p. 6230–39.
13. Gu Z, Cheng J, Fu H, Zhou K, Hao H, Zhao Y, Zhang T, Gao S, Liu J.Ce–net: Context encoder network for 2d medical image segmentation.IEEE Trans Med Imaging. 2019;38(10):2281–92.
14. Zhang S, Fu H, Yan Y, Zhang Y, Wu Q, Yang M, Tan M, Xu Y. Attentionguided network for retinal image segmentation. Int Conf Med ImageComput Comput-Assist Interv. 2019;797–805.
15. Wang B, Qiu S, He H. Dual encoding u–net for retinal vesselsegmentation. Int Conf Med Image Comput Comput-Assist Interv.2019;84–92.
16. Lyu C, Hu G, Wang D. HRED–net: High–resolution encoder–decodernetwork for fine–grained image segmentation. IEEE Access. 2020;8:38210–20.
17. Pyne CT, Gadey G, Jeon C, Piemonte T, Waxman S, Resnic F. Effect ofreduction of the pulse rates of fluoroscopy and CINE–acquisition on x-raydose and angiographic image quality during invasive cardiovascularprocedures. Circ Cardiovasc Interv. 2014;7:441–5.
18. Ferrari P, Becker F, Jovanovic Z, Khan S, Bakhanova E, Principi S, KrsticD, Pierotti L, Mariotti F, Faj D, Turk T, Nikezic D, Bertolini M. Simulationof H p (10) and effective dose received by the medical staff ininterventional radiology procedures. J Radiol Prot. 2019;39(3):809–24.
19. Eloot L, Thierens H, Taeymans Y, Drieghe B, De Pooter J, Van PeteghemS, Buytaert D, Gijs T, Lapere R, Bacher K. Novel X–ray imagingtechnology enables significant patient dose reduction in interventionalcardiology while maintaining diagnostic image quality. CatheterCardiovasc Interv. 2015;86:205–12.
20. Carreira J, Zisserman A. Quo vadis, action recognition? a new model andthe kinetics dataset. In: Proceedings of the IEEE Conference on ComputerVision and Pattern Recognition; 2017. p. 6299–308.
21. Szegedy C, Liu W, Jia Y, Sermanet P, Reed S, Anguelov D, Erhan D,Vanhoucke V, Rabinovich F. Going deeper with convolutions. In: The IEEEConference on Computer Vision and Pattern Recognition; 2015. p. 1–9.
22. Kay W, Carreira J, Simonyan K, Zhang B, Hillier C, Vijayanarasimhan S,Viola F, Green T, Back T, Natsev P, Suleyman M, Zisserman A. Thekinetics human action video dataset. arXiv:1705.06950. 2017.
23. Tran D, Wang H, Torresani L, Ray J, LeCun Y, Paluri M. A closer look atspatiotemporal convolutions for action recognition. In: Proceedings ofthe IEEE Conference on Computer Vision and Pattern Recognition; 2018.p. 6450–9.
Wang et al. BMCMedical Imaging (2020) 20:110 Page 10 of 10
24. Qiu Z, Yao T, Mei T. Learning deconvolution network for semanticsegmentation. International Conference on Computer Vision.2015;1520–28.
25. Milletari F, Navab N, Ahmadi S. V–net: Fully convolutional neuralnetworks for volumetric medical image segmentation. In: 2016 FourthInternational Conference on 3D Vision (3DV); 2016. p. 565–71.
26. Cicek O, Abdulkadir A, Lienkamp SS, Brox T, Ronneberger O. 3D U-Net:learning dense volumetric segmentation from sparse annotation. In:International Conference on Medical Image Computing andComputer-Assisted Intervention; 2016. p. 424–32.
27. Fu H, Xu Y, Lin S, Kee WDW, Liu J. Deepvessel: Retinal vesselsegmentation via deep learning and conditional random field. In:International Conference on Medical Image Computing andComputer–Assisted Intervention; 2016. p. 132–9.
28. Staal J, Abramoff MD, Niemeijer M, Viergever MA, Ginneken B.Ridge–based vessel segmentation in color images of the retina. IEEE TransMed Imaging. 2004;23(4):501–9.
Publisher’s NoteSpringer Nature remains neutral with regard to jurisdictional claims inpublished maps and institutional affiliations.