coordinating vertical and horizontal scaling for achieving
TRANSCRIPT

Coordinating vertical andhorizontal scaling for achievingdifferentiated QoSOrchestrating resource allocation for real-time vsnon-real-time QoS services using hybrid controller modelBilal AhmadMaster’s Thesis Spring 2016


Coordinating vertical and horizontal scalingfor achieving differentiated QoS
Bilal Ahmad
May 23, 2016

ii

Acknowledgements
I wish to express my sincere appreciation and gratitude to the followingpeople for their support and help during my work on this thesis:
• My supervisors Anis Yazidi and Hårek Haurgeud for their encour-agement, support and guidance during the whole thesis period.
• Amir Maqbool Ahmed for providing me great advice and technicalsupport to overcome difficulties during the project.
• To Kyrre Begnum for his inspiring lectures and assignments duringthe master program.
• To all my fellow master students with whom I share many goodmemories with, for being supportive and helping me to develop newideas.
• Finally, I wish to express my sincere appreciation to my family fortheir unconditional support and motivation.
iii

iv

Abstract
The growth in popularity of cloud computing, along with the rapid devel-opment of internet based technologies, has led to a paradigm shift in theway computing resources are provisioned. Computing resources are to alarger extent offered as services, and exposed via the internet in models aspay-as-you-go and on-demand. Cloud service providers are trying to re-duce their operating costs while offering their services with higher qualityby resorting to the concept of elasticity. However, this is challenging be-cause of heterogeneous applications running on their infrastructure witharbitrary requirements in terms of resources.
This thesis investigates how this problem can be addressed by design-ing and implementing an autonomic provisioning controller based on el-ements from control theory to coordinate between real-time and non-real-time applications. Traditional approaches perform elasticity-decisions ei-ther based on monitoring the resource usage or merely based on the QoSof, solely, latency-critical applications, particularly web servers. Neverthe-less, a broad class of applications have different SLA-constraints that doesnot fall under the same class of latency-critical applications. For instancebatch processing is becoming more popular and posses QoS requirementsthat are defined in different manner than latency-critical applications. Thenovelty of this study is the focus on how to coordinate resource allocationbetween real-time and non-real-time applications. Furthermore, our ap-proach is hybrid as it relies on both resource usage and QoS-requirementsin the same time to drive the elasticity decisions. Another novelty of ourwork is orchestrating both vertical and horizontal scaling under the sameframework.
v

vi

Contents
1 Introduction 11.1 Problem statement . . . . . . . . . . . . . . . . . . . . . . . . 3
2 Background 52.1 Cloud computing . . . . . . . . . . . . . . . . . . . . . . . . . 5
2.1.1 Software as a service (SaaS) . . . . . . . . . . . . . . . 52.1.2 Platform as a service (PaaS) . . . . . . . . . . . . . . . 62.1.3 Infrastructure as a service (IaaS) . . . . . . . . . . . . 62.1.4 Cloud platforms and providers . . . . . . . . . . . . . 6
2.2 Virtualization . . . . . . . . . . . . . . . . . . . . . . . . . . . 72.2.1 Types of virtualization . . . . . . . . . . . . . . . . . . 72.2.2 Para-virtualization . . . . . . . . . . . . . . . . . . . . 82.2.3 Partial virtualization . . . . . . . . . . . . . . . . . . . 82.2.4 Full virtualization . . . . . . . . . . . . . . . . . . . . . 82.2.5 Hypervisors . . . . . . . . . . . . . . . . . . . . . . . . 8
2.3 Xen and KVM . . . . . . . . . . . . . . . . . . . . . . . . . . . 92.3.1 Architecture . . . . . . . . . . . . . . . . . . . . . . . . 92.3.2 CPU schedulers . . . . . . . . . . . . . . . . . . . . . . 10
2.4 Vertical and horizontal scaling . . . . . . . . . . . . . . . . . . 132.4.1 Vertical scaling capabilities of popular hypervisors . 14
2.5 Control theory . . . . . . . . . . . . . . . . . . . . . . . . . . . 152.5.1 Libvirt . . . . . . . . . . . . . . . . . . . . . . . . . . . 16
2.6 HAProxy . . . . . . . . . . . . . . . . . . . . . . . . . . . . . . 172.7 HandBrakeCLI . . . . . . . . . . . . . . . . . . . . . . . . . . 172.8 Loader.io . . . . . . . . . . . . . . . . . . . . . . . . . . . . . . 182.9 Httpmon . . . . . . . . . . . . . . . . . . . . . . . . . . . . . . 182.10 Web-applications . . . . . . . . . . . . . . . . . . . . . . . . . 192.11 Related research . . . . . . . . . . . . . . . . . . . . . . . . . . 19
2.11.1 Performance-based Vertical Memory Elasticity . . . . 192.11.2 Coordinating CPU and Memory Elasticity Con-
trollers to Meet Service Response Time Constraints . 192.11.3 Quality of Service Control Mechanisms in Cloud
Computing Environments . . . . . . . . . . . . . . . . 202.11.4 Heracles: Improving Resource Efficiency at Scale . . 212.11.5 Towards Faster Response Time Models for Vertical
Elasticity . . . . . . . . . . . . . . . . . . . . . . . . . . 212.11.6 Proactive Memory Scaling of Virtualized Applications 22
vii

2.11.7 Vertical scaling for prioritized VMs provisioning . . . 22
3 Approach 233.1 Objectives . . . . . . . . . . . . . . . . . . . . . . . . . . . . . 243.2 Challenges with cloud infrastructure management . . . . . . 253.3 Design stage . . . . . . . . . . . . . . . . . . . . . . . . . . . . 25
3.3.1 Controller models . . . . . . . . . . . . . . . . . . . . 263.3.2 Decision model . . . . . . . . . . . . . . . . . . . . . . 263.3.3 Controller metrics . . . . . . . . . . . . . . . . . . . . 273.3.4 Expected results . . . . . . . . . . . . . . . . . . . . . . 28
3.4 Implementation stage . . . . . . . . . . . . . . . . . . . . . . . 283.4.1 Experimental setup . . . . . . . . . . . . . . . . . . . . 283.4.2 Tools . . . . . . . . . . . . . . . . . . . . . . . . . . . . 293.4.3 Application level metrics . . . . . . . . . . . . . . . . 303.4.4 Workload patterns . . . . . . . . . . . . . . . . . . . . 303.4.5 Autonomic provisioning controller . . . . . . . . . . . 313.4.6 Initial experiments . . . . . . . . . . . . . . . . . . . . 32
3.5 Measurements and analysis stage . . . . . . . . . . . . . . . . 333.5.1 Experiments . . . . . . . . . . . . . . . . . . . . . . . . 333.5.2 Control interval . . . . . . . . . . . . . . . . . . . . . . 343.5.3 Resource conflict - Web server and batch (vertical
scaling) . . . . . . . . . . . . . . . . . . . . . . . . . . . 343.5.4 Resource conflict - Web server and batch (horizontal
scaling) . . . . . . . . . . . . . . . . . . . . . . . . . . . 343.5.5 Data collection . . . . . . . . . . . . . . . . . . . . . . 353.5.6 Data plotting . . . . . . . . . . . . . . . . . . . . . . . 353.5.7 Analysis . . . . . . . . . . . . . . . . . . . . . . . . . . 36
4 Result I - Design and models 374.1 Controller models . . . . . . . . . . . . . . . . . . . . . . . . . 374.2 Decision model . . . . . . . . . . . . . . . . . . . . . . . . . . 394.3 Controller metrics . . . . . . . . . . . . . . . . . . . . . . . . . 39
5 Result II - Implementation and Experiments 435.1 Experimental setup . . . . . . . . . . . . . . . . . . . . . . . . 43
5.1.1 Network and virtual machine setup . . . . . . . . . . 445.1.2 Experimental overview . . . . . . . . . . . . . . . . . 46
5.2 Workload patterns . . . . . . . . . . . . . . . . . . . . . . . . 485.3 Autonomic provisioning controller . . . . . . . . . . . . . . . 495.4 Experiments . . . . . . . . . . . . . . . . . . . . . . . . . . . . 52
5.4.1 Testing and experiments . . . . . . . . . . . . . . . . 525.4.2 Initial experiments . . . . . . . . . . . . . . . . . . . . 535.4.3 Main experiments . . . . . . . . . . . . . . . . . . . . 54
5.5 Results from initial experiments . . . . . . . . . . . . . . . . . 555.5.1 Parallel computing . . . . . . . . . . . . . . . . . . . . 555.5.2 CPU hot-plugging . . . . . . . . . . . . . . . . . . . . 565.5.3 Memory hot-plugging . . . . . . . . . . . . . . . . . . 58
viii
6 Result III - Measurements and Analysis 616.1 Control interval . . . . . . . . . . . . . . . . . . . . . . . . . . 616.2 Resource conflict - Web server and batch (vertical scaling) . . 636.3 Resource conflict - Web server and batch (horizontal scaling) 646.4 Analysis . . . . . . . . . . . . . . . . . . . . . . . . . . . . . . 65
6.4.1 Control interval . . . . . . . . . . . . . . . . . . . . . . 656.4.2 Resource conflict - Web server and batch (vertical
scaling) . . . . . . . . . . . . . . . . . . . . . . . . . . . 676.4.3 Resource conflict - Web server and batch (horizontal
scaling) . . . . . . . . . . . . . . . . . . . . . . . . . . . 68
7 Discussion 717.1 The problem statement . . . . . . . . . . . . . . . . . . . . . . 717.2 Evaluation . . . . . . . . . . . . . . . . . . . . . . . . . . . . . 727.3 Implementation of the autonomic provisioning controller . . 72
7.3.1 Challenges during the implementation . . . . . . . . 737.3.2 Other considerations and limitations . . . . . . . . . . 74
7.4 Future work and improvement suggestions . . . . . . . . . . 757.5 Potential impact of the thesis . . . . . . . . . . . . . . . . . . 76
8 Conclusion 77
Appendices 85
A Autonomic provisioning controller 87
B Parallel computing 95
C HAProxy configuration file 97
D Xen - VM creation file 99
ix

x
List of Figures
2.1 Architecture of type 1 and 2 hypervisors . . . . . . . . . . . . 92.2 Architecture of KVM and Xen . . . . . . . . . . . . . . . . . . 102.3 O(1) scheduler - priority levels . . . . . . . . . . . . . . . . . 122.4 Vertical and horizontal scaling . . . . . . . . . . . . . . . . . . 132.5 Feedback control loop . . . . . . . . . . . . . . . . . . . . . . 16
4.1 Capacity- and performance-based controller . . . . . . . . . 384.2 The feedback control loop for the hybrid controller . . . . . . 39
5.1 Overview of the infrastructure design . . . . . . . . . . . . . 445.2 Experimental overview . . . . . . . . . . . . . . . . . . . . . . 465.3 Spiky workload pattern . . . . . . . . . . . . . . . . . . . . . 495.4 Trend workload pattern . . . . . . . . . . . . . . . . . . . . . 495.5 An activity diagram showing the decision logic determining
whether or not to scale based on QoS-requirements. . . . . . 515.6 Parallel computing from 1 to 16 vCPUs . . . . . . . . . . . . 565.7 CPU hot-plugging when appending and removing vCPUs
by one for each iteration . . . . . . . . . . . . . . . . . . . . . 575.8 CPU hot-plugging when appending and removing vCPUs
by three for each iteration . . . . . . . . . . . . . . . . . . . . 575.9 Memory hot-plugging of 64 MB for each iteration . . . . . . 595.10 Memory hot-plugging of 1 GB for each iteration . . . . . . . 59
6.1 Running the controller every 5 seconds with spiky-basedworkload pattern . . . . . . . . . . . . . . . . . . . . . . . . . 62
6.2 Running the controller every 15 seconds with spiky-basedworkload pattern . . . . . . . . . . . . . . . . . . . . . . . . . 62
6.3 Web server 1 - response time in relation to vCPUs . . . . . . 636.4 Batch-processing - FPS in relation to vCPUs . . . . . . . . . . 646.5 Web server 1 and 2 - response time in relation to vCPUs . . . 656.6 Batch-processing - FPS in relation to vCPUs . . . . . . . . . . 656.7 Control interval experiment - Average utilization of re-
sources . . . . . . . . . . . . . . . . . . . . . . . . . . . . . . . 666.8 Vertical scaling experiment - Average utilization of resources 676.9 Horizontal scaling experiment - Average utilization of re-
sources . . . . . . . . . . . . . . . . . . . . . . . . . . . . . . . 69
xi

xii

List of Tables
2.1 Comparison of vertical scaling capabilities between Xen,KVM, VMware and Microsoft’s Hyper-V [30]. . . . . . . . . 15
4.1 SLA: Web server . . . . . . . . . . . . . . . . . . . . . . . . . 404.2 SLA: Batch-job . . . . . . . . . . . . . . . . . . . . . . . . . . . 404.3 Utilization of resources . . . . . . . . . . . . . . . . . . . . . . 41
5.1 PM specifications . . . . . . . . . . . . . . . . . . . . . . . . . 435.2 Network overview . . . . . . . . . . . . . . . . . . . . . . . . 445.3 Controller parameters . . . . . . . . . . . . . . . . . . . . . . 50
6.1 Web server metrics with 5 and 15 seconds control interval . . 666.2 Web server metrics with vertical scaling . . . . . . . . . . . . 676.3 Web server metrics with horizontal scaling . . . . . . . . . . 68
xiii

xiv

Chapter 1
Introduction
Cloud computing is an emerging technology and is becoming more popu-lar, due to advantages such as elasticity and infinite computing resources.Companies are increasingly taking advantage of the benefits and movingtheir infrastructure to the cloud for reduced operational cost. Despite theadvantages, cloud technologies poses security and privacy concerns [1].
Cloud technologies has been widely adopted by small and medium-sizedenterprises (SMB). It is estimated that 78 % of small businesses in USA willhave fully adopted cloud computing by 2020 [2].
Modern virtualization technologies such as Kernel-based Virtual Machine(KVM)1, VMware2 and Xen3 allow virtual machines (VMs) with differentoperating systems and multiple services to run on a single physical hard-ware. The technologies provides functionality to consolidate servers to op-timize efficiency, reduce power consumption and the environmental im-pact. Several studies that have been conducted show an average serverutilization of resources in data centers ranges between 10 % and 50 % [3, 4,5, 6, 7].
According to a study (2014) performed by Natural Resources DefenseCouncil the main issue for energy saving is under-utilization of data cen-ters. In addition, data centers has the fastest growing consumption of elec-tricity in United States [8]. It is estimated that Google websearch serversoften has a idleness of 30 % over 24 hour period [9]. If we imagine a clusterof 20,000 servers, this would mean the capacity of 6,000 servers is wasted.From a business perspective maximizing server consolidation would cutunnecessary energy and operation costs and increase return on investment(ROI).
1http://www.linux-kvm.org/2http://www.vmware.com/products/vsphere/3http://www.xenproject.org/
1
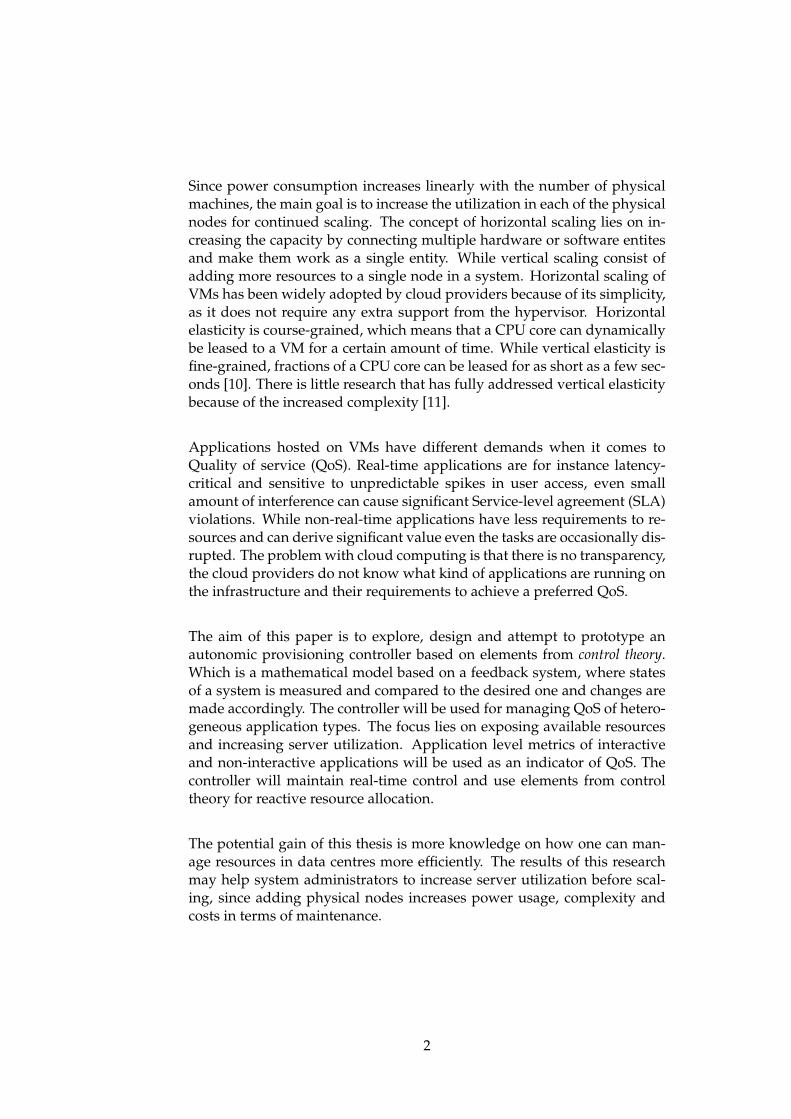
Since power consumption increases linearly with the number of physicalmachines, the main goal is to increase the utilization in each of the physicalnodes for continued scaling. The concept of horizontal scaling lies on in-creasing the capacity by connecting multiple hardware or software entitesand make them work as a single entity. While vertical scaling consist ofadding more resources to a single node in a system. Horizontal scaling ofVMs has been widely adopted by cloud providers because of its simplicity,as it does not require any extra support from the hypervisor. Horizontalelasticity is course-grained, which means that a CPU core can dynamicallybe leased to a VM for a certain amount of time. While vertical elasticity isfine-grained, fractions of a CPU core can be leased for as short as a few sec-onds [10]. There is little research that has fully addressed vertical elasticitybecause of the increased complexity [11].
Applications hosted on VMs have different demands when it comes toQuality of service (QoS). Real-time applications are for instance latency-critical and sensitive to unpredictable spikes in user access, even smallamount of interference can cause significant Service-level agreement (SLA)violations. While non-real-time applications have less requirements to re-sources and can derive significant value even the tasks are occasionally dis-rupted. The problem with cloud computing is that there is no transparency,the cloud providers do not know what kind of applications are running onthe infrastructure and their requirements to achieve a preferred QoS.
The aim of this paper is to explore, design and attempt to prototype anautonomic provisioning controller based on elements from control theory.Which is a mathematical model based on a feedback system, where statesof a system is measured and compared to the desired one and changes aremade accordingly. The controller will be used for managing QoS of hetero-geneous application types. The focus lies on exposing available resourcesand increasing server utilization. Application level metrics of interactiveand non-interactive applications will be used as an indicator of QoS. Thecontroller will maintain real-time control and use elements from controltheory for reactive resource allocation.
The potential gain of this thesis is more knowledge on how one can man-age resources in data centres more efficiently. The results of this researchmay help system administrators to increase server utilization before scal-ing, since adding physical nodes increases power usage, complexity andcosts in terms of maintenance.
2
1.1 Problem statement
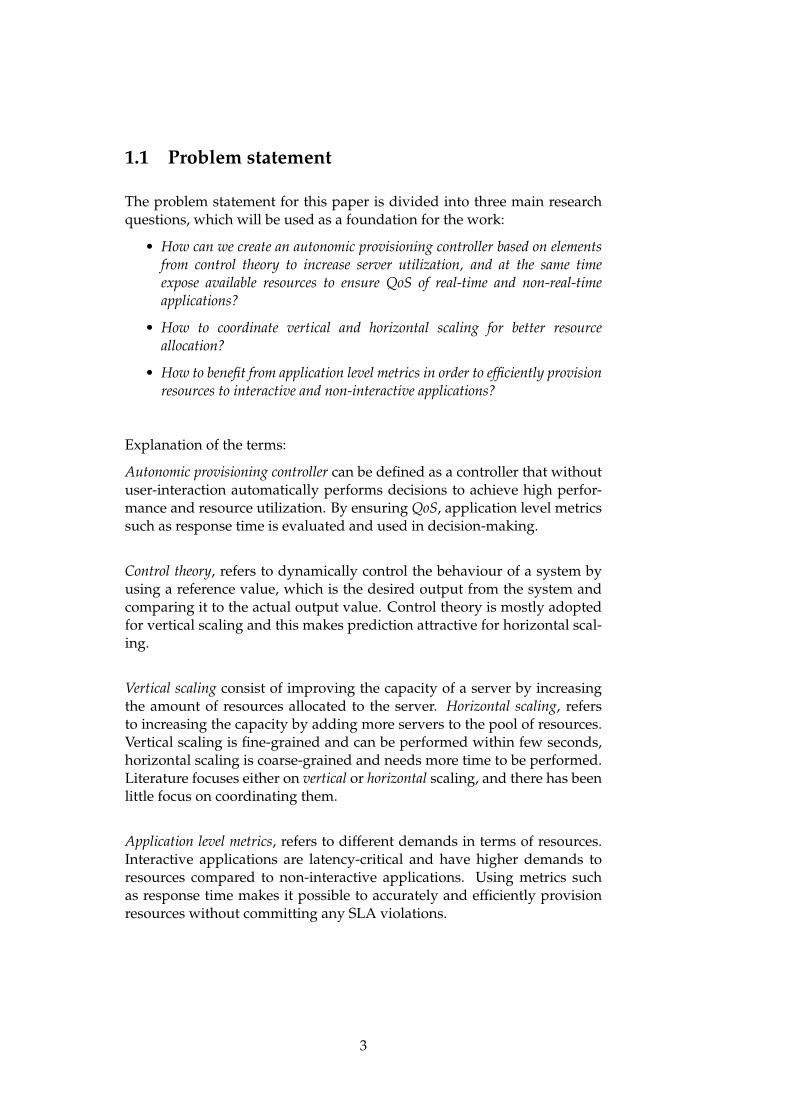
The problem statement for this paper is divided into three main researchquestions, which will be used as a foundation for the work:
• How can we create an autonomic provisioning controller based on elementsfrom control theory to increase server utilization, and at the same timeexpose available resources to ensure QoS of real-time and non-real-timeapplications?
• How to coordinate vertical and horizontal scaling for better resourceallocation?
• How to benefit from application level metrics in order to efficiently provisionresources to interactive and non-interactive applications?
Explanation of the terms:
Autonomic provisioning controller can be defined as a controller that withoutuser-interaction automatically performs decisions to achieve high perfor-mance and resource utilization. By ensuring QoS, application level metricssuch as response time is evaluated and used in decision-making.
Control theory, refers to dynamically control the behaviour of a system byusing a reference value, which is the desired output from the system andcomparing it to the actual output value. Control theory is mostly adoptedfor vertical scaling and this makes prediction attractive for horizontal scal-ing.
Vertical scaling consist of improving the capacity of a server by increasingthe amount of resources allocated to the server. Horizontal scaling, refersto increasing the capacity by adding more servers to the pool of resources.Vertical scaling is fine-grained and can be performed within few seconds,horizontal scaling is coarse-grained and needs more time to be performed.Literature focuses either on vertical or horizontal scaling, and there has beenlittle focus on coordinating them.
Application level metrics, refers to different demands in terms of resources.Interactive applications are latency-critical and have higher demands toresources compared to non-interactive applications. Using metrics suchas response time makes it possible to accurately and efficiently provisionresources without committing any SLA violations.
3

4
Chapter 2
Background
In this chapter a brief introduction will be given of the technologies thatwill be applied later as a part of this paper. In addition, a thorough reviewof related research will be presented.
2.1 Cloud computing
Cloud computing can be described as resources and services offered throughthe Internet [12]. There has been observed an increased popularity in cloudcomputing within few years due to the many benefits offered. Cloud com-puting services are delivered from data centres all around the world to fa-cilitate the customers. Some of the benefits has been cost savings in termsof outsourcing hardware installation, operations services and maintenance.The increased reliability where most cloud providers offers an SLA whichguarantees 99.99 % availability, and the ability to scale on-demand has beenimportant factors for most enterprises.
2.1.1 Software as a service (SaaS)
Software as a service, or SaaS, also referred as "on-demand software"where applications and services are provided directly to the user. This ismostly done through the browser where the user interact with the softwarewithout any need to install, maintain or update the software. SaaS providesbenefits such as global accessibility, where the software is accessible fromall around the world. Cross device compatibility, the software is accessibleand equally formatted throughout different devices such as tablets, phonesand computers. There are many examples of different SaaS softwares suchas Office 365, Google Docs, Gliffy and Facebook just to mention a few.
5

2.1.2 Platform as a service (PaaS)
Platform as a service, or PaaS, is a category of cloud computing services,where platforms are provided to users. This could either be develop-ment platforms where users can develop applications without the needto setup and maintain a local infrastructure. PaaS services are hosted onthe providers servers and maintained by the provider. The user is able toaccess the services through the web browser and billing is mostly subscrip-tion based (pay-per-use). The benefit with PaaS services is that applicationsare up-to-date, in addition provides features such as scalability and relia-bility.
2.1.3 Infrastructure as a service (IaaS)
Infrastructure as a service, or IaaS, refers to providing servers, storagedevices and network devices such as load balancers and switches tocustomers. The cloud provider is responsible to maintain the physicalservers with electricity, upgrades and air conditioning. IaaS offers highlyscalable resources that can be adjusted on-demand. IaaS providers oftenbill the customers with the pay-per-use model. Some of the IaaS providersare Windows Azure, Rackspace Open Cloud and Amazon AWS, just tomention a few.
2.1.4 Cloud platforms and providers
There are mainly three different types of cloud platforms; public, privateand hybrid.
Public cloud is a cloud computing model where service providers managesthe hardware of the infrastructure, this includes operation, maintenanceand upgrading hardware components. The providers are also responsibleof the security and providing isolation between the customers, which is amajor challenge due to the fact of having millions of customers and pro-viding an SLA-agreement of 99.99 % uptime [13]. Public clouds providebenefits such as inexpensive set-up and scalability upon demand and pay-as-you-go model. There are number of public cloud providers, the largestand most popular one is Amazon with Amazon Web Services 1. Microsofthas its own public cloud called Microsoft Azure 2, RackSpace with Man-aged Cloud Services 3 and Google with Google Cloud Platform 4.
1https://aws.amazon.com/2https://azure.microsoft.com3https://www.rackspace.com/cloud4https://cloud.google.com/
6
Private cloud is another cloud computing model where an organization orcompany usually manage their own cloud infrastructure. Unlike publicclouds, the company usually manage, operate and upgrades the hardwarein the infrastructure by them self. This gives them the ability to have con-trol over the cloud environment and manage both the physical- and net-work security of the private cloud. There are numerous of alternative cloudplatforms used in a private cloud, such as OpenStack 5, Eucalyptus 6 andcommercial solutions as VMWare vSphere 7.
Hybrid cloud is is a cloud environment where a combination of distinctcloud platforms are used to orchestrate a cluster. This combination pro-vides many benefits as on-demand resources from a public cloud while stillhaving a secure private cloud. This gives the possibility to move workloadsbetween cloud platforms and overall increases flexibility, furthermore a hy-brid cloud can also provide redundancy of the infrastructure. One of thetools which gives the possibility to set-up a hybrid cloud is Apache Mesos 8.
2.2 Virtualization
The history of virtualization began in 1960’s, when IBM spent a lot of re-sources in developing time-sharing solutions. Which refers to sharing ofresources among many users at the same time, the goal was to increasethe efficiency of the computer resources [14]. Later this developed to be aparadigm shift in computer technology and is now known as virtualiza-tion.
Virtualization refers to creating a virtual version of a device or resource,such as network resources, hardware platform, storage devices or evenan operating system. Explained in easier terms virtualization is softwaretechnology which makes it possible to run multiple operating systems andapplications at the same time on a single server. Today’s data centres usevirtualization to create abstraction of the physical hardware and create apool of resources which are offered to customers in the form of consolidatedand scalable VMs.
2.2.1 Types of virtualization
There are mainly three different types of virtualization, these will be brieflyexplained in the next sections.
5https://www.openstack.org/6http://www8.hp.com/us/en/cloud/helion-eucalyptus.html7https://www.vmware.com/cloud-computing/private-cloud8http://mesos.apache.org/
7

2.2.2 Para-virtualization
Para-virtualization, also referred as PV, is a technique where the guestoperating system is modified and is aware of being virtualized. Some of thebenefits with PV is that there is no virtualization extensions requirementson the host CPU and this enables virtualization on hardware architectures.The guest OS sends hypercalls directly to the virtual machine manager(VMM), this also includes critical kernel operations. The result of this isincreased efficiency and performance compared to full virtualization. Thedrawback with this type of virtualization is the OS kernel modifications,which could result in maintenance and support problems.
2.2.3 Partial virtualization
Partial virtualization is a virtualization technique where the VMs simulatesthe underlying hardware environment. This means the entire operatingsystem cannot run in a VM, in the same way as full virtualization.Address space virtualization is one of the forms used where each VM hasindependent address space. The hypervisor type is classified as type 2 andwith partial virtualization the guest OS runs as an application on the hostmachine. Partial virtualization is acknowledged to be an important steptowards full virtualization.
2.2.4 Full virtualization
Full virtualization is another virtualization technique where the guestoperating system runs on top of the VMM, this removes the burden ofhaving an extra layer between hardware and the guest operating system.The user code is executed directly on the hardware. In this type ofvirtualization compared to para-virtualization, the guest OS is not awareof running in a virtualized environment. This means that it is possible toinstall most operating systems since they do not need to be modified.
2.2.5 Hypervisors
Hypervisor, also referred as virtual machine monitor (VMM) makes it pos-sible to run multiple operating systems and share the resources of a singlephysical hardware. The hypervisor is responsible to monitor, allocate theneeded resources and isolate the virtual machines from each other. Thereare multiple popular hypervisors, to mention a few: KVM, Xen, Microsoft’sHyper-V and VMWare ESX/ESXi.
There are essentially two main types of hypervisors, type 1 and type 2, seefigure 2.1. The type 1 hypervisor, also called bare-metal or native runs di-rectly on top of the hardware without any layer between. It monitors, con-
8

trols the hardware and the guest operating systems running above, someexamples are Xen, VMWare ESX, Microsoft Hyper-V and Oracle VM.
Type 2 hypervisor, also known as hosted runs on top of traditional operatingsystems, such as Linux and Microsoft Windows. In difference from type 1,type 2 has one extra layer on top of the hosted operating system, whichmakes the guest operating system the third layer above the hardware.Some examples of type 2 hypervisors are: Oracle VM VirtualBox, VMWareServer and Workstation and KVM.
Figure 2.1: Architecture of type 1 and 2 hypervisors
2.3 Xen and KVM
In this section the main focus will be on the open source hypervisors Xenand KVM, a thorough analysis on the two hypervisors will be conducted.Moreover, how their architectures are built up and how they perform CPUscheduling.
2.3.1 Architecture
The KVM hypervisor, as visualized in figure 2.2 was merged with the Linux2.6.20 kernel in 2007. The result of this was support for virtualization [15]and KVM has been maintained as part of the kernel since. The KVM mod-ule requires the CPU of host OS to support Intel VT / AMD-V hardwarevirtualization extensions. Running the Linux Kernel as a hypervisor in dif-ference from Xen, makes it possible to use existing components such asthe memory manager and scheduler. In addition, Xen architecture requiresmaintenance of the Xen hypervisor and Dom0, which will be explained indetails later. As figure 2.2 illustrates, the KVM is a kernel module and runs
9

on the Linux kernel, while each of the virtual machines runs as a Linuxprocess. A lightly modified Qemu process is used to provide emulation fordevices such as BIOS, USB bus, network cards and disk controllers. Quemuis unprivileged and isolated, it uses SELinux for security to provide isola-tion between processes.
Xen, on the other hand has a different architecture, it runs as type 1hypervisor. The terminology in Xen can be explained as the host OS isreferred to as Domain 0 (dom0), while the guest OS is referred to as DomainU (domU). The host OS runs above the Xen hypervisor with virtual CPUs(vCPUs) and virtual memory [16]. Even though, it is privileged and hascontrol interface to the hypervisor. Dom0 provides device drivers for thehost hardware which consist of different controllers, network card andmanagement tools such as Virsh.
Figure 2.2: Architecture of KVM and Xen
2.3.2 CPU schedulers
The shared resources such as memory and disk can easily be adjusted inrun-time, while CPU is fine-grained and requires to be adjusted by a sched-uler. Xen has in the past used different CPU schedulers, however since Xen3.0 the Credit scheduler is used by default [17]. This is because of improvedscheduling on multiprocessors and better QoS controls [18]. It is also possi-ble to choose among other schedulers such as Simple Earliest Deadline First(SEDF) and Borrowed Virtual Time (BVT).
In contrast to Xen, KVM leaves the scheduling to the Linux kernel. The cur-rent Linux kernel is a multi-tasking kernel and uses Completely Fair Sched-uler (CFS) as default. The Linux kernel has earlier used the O(1) scheduler.
10
Xen - CPU schedulers
Credit scheduler is a proportional scheduler based on fairness. The schedulerworks in most cases in the same as the Linux scheduler, to minimize thewaste of CPU cycles and provide fairness to the domains [19]. One draw-back with the credit scheduler is that since all of the domains are equallyscheduled, the dom0 may in some cases be subjected to low CPU cycles ifthe domain is not assigned high enough weight.
The credit scheduler uses metrics such as weight, where each domain is as-signed with a weight. If for instance a domain gets a weight of 512 thatmeans it will get twice much CPU power as a domain with 256 (default).Cap is optionally assigned which limits the amount of CPU a domain canuse. The values are expressed in percentage of one physical CPU, e.g 100for one 1 physical CPU and 300 for 3 physical CPUs. The default value is 0,which means there is no upper limit [19].
Borrowed Virtual Time (BVT) scheduler is a fairness scheduler based on theconcept of virtual time, where CPU is leased out based on weights. In dif-ference from credit scheduler, BVT is a work conserving scheduler. Thismeans that if one domain is idle, the second domain gets all the CPU with-out considering weight [20].
Simple Earliest Deadline First (SEDF) scheduler support both work-conserving and non work-conserving modes, which means that each vC-PUs is consumed when running, and preserved when not running. SEDFguarantees that resources are allocated based on a domain’s slice and period.A domain will be given resources as long as it is executed for the time givenin the slice for each period [21].
KVM - CPU schedulers
The O(1) scheduler and CFS were both introduced by Ingo Molnár [22].O(1) became a part of the Linux kernel 2.6 prior to 2.6.23. The scheduler isbased on achieving fairness, interactivity and performance. The scheduleris preemptive and priority-based, where 0 is the highest priority and 140 isthe lowest as visualized in figure 2.3. Real-time tasks falls between 0 and99, while other tasks falls between 100 and 139 in a so called time-sharingtask group. The nice value affects the priority of a process. Each of the pri-orities corresponds to a nice value where the default value is 0, the highestpriority value is -20, while lowest priority value is 19 [23]. Processes withhigher priority gets more CPU time, while those with low priority receiveless CPU time. This calculation of time-slices are performed dynamically
11

to avoid starvation of processes. The scheduler uses two types of arrays,an active array and an expired array. The active array contains all the pro-cesses which has CPU time left, while the expired contains those have usedtheir CPU time-slice. Before a process time-slice is used up a recalculationis performed to find the new priority.
Figure 2.3: O(1) scheduler - priority levels
CFS as the name of the scheduler reveals is completely based on fairness toprovide equal CPU time to tasks. CFS has since Linux kernel version 2.6.23been the default scheduler and replaced O(1) [24]. Ideally the goal of CFSis to provide equally CPU share among the running processes and balanceprocesses between multiple cores in Symmetric Multiprocessing (SMP) sys-tems. The biggest change with CFS compared to the previous schedulersis use of a runnable processes list, the previous schedulers had a imple-mentation of using linked list based queues [25]. CFS uses the concept ofred-black tree which is mainly self-balancing, by removing and adding en-tries to maintain balanced. CFS manages meta-information about tasks invirtual runtime, which record the amount of CPU time each task has beenpermitted. The smaller the value, this indicates the higher need for moreCPU time.
One of the main features which was introduced with CFS (Linux kernel2.6.24) is group scheduling where connected processes are split into groups.This provided the possibility to ensure the groups were given the fairamount of CPU time instead of single processes [22]. Because of this CFSbrought optimized scheduling to both desktops and servers.
12

2.4 Vertical and horizontal scaling
In this section vertical and horizontal scaling will be explained, further-more analysis on vertical scaling capabilities of popular hypervisors, suchas Xen, KVM, VMware and Hyper-V.
Vertical and horizontal scaling is a concept in cloud computing where de-cisions for scaling are based on workload, illustrated in figure 2.4. Verti-cal scaling typically means to add more resources to an existing VM in theform of CPU, RAM and disk. The use of vertical scaling requires additionalinvestment of physical hardware, support from the hypervisor and can inmany cases result in single point of failure. If the VM goes down for anyreason, the service provided will not be available for the users. The ad-vantages with vertical scaling is less overhead, since there is only a singleVM running. While with horizontal scaling there are multiple VMs withthe overhead from the operating systems and different services running oneach of them which consumes resources.
On the other hand we have horizontal scaling, which requires less supportfrom the Hypervisor in comparison to vertical scaling. With horizontalscaling the concept lies on increasing the number of nodes to distributethe workload across multiple VMs. Typically, horizontal scaling is used forapplications that have a clustered architecture with a gateway or masternode that distributes the load [26]. The benefit with horizontal scalingis that there is no single point of failure which improves performance,reliability and availability. This can in many cases also cause complexity,since user sessions between the nodes needs to be synchronized. Also, tonot have the issue with single point of failure, there is a need of at least twogateways or master nodes which also requires a synchronization betweenthem. In this thesis the approach is to coordinate between vertical andhorizontal scaling depending on the workload and other metrics.
Figure 2.4: Vertical and horizontal scaling
13
2.4.1 Vertical scaling capabilities of popular hypervisors
Hot-plugging is a concept of appending or removing resources to a run-ning system without having to switch it off [27]. This can be performed onthe hypervisor or directly on the operating system. In this thesis the focuswill be on the hypervisor, by dynamically adding or removing resources onVMs.
CPU hotplug
CPU hot-plug refers to adding or removing CPU cores to a single ormultiple VMs. The support of CPU hot-plug differs between hypervisors.Table 2.1 shows the comparison of vertical capabilities between Xen, KVM,VMware and Hyper-V. Xen has support for both adding and removingCPU cores in run-time. On the other hand, currently KVM and VMwareonly have support for adding CPU cores, and does not yet have a featureto unplug CPU cores [28]. Microsoft’s Hyper-V does not offer adding orremoving of CPU cores.
Memory hotplug
Adding or removing memory without having to reboot the system is calledhotplugging. There has to be support in the hypervisor to be able to performhot add or remove on virtual machines. With the hypervisor it is possible toreallocate resources between VMs in order to handle load-bursts. Howevermemory is not immediately released like CPU, since applications are notimmediately garbage collected [29]. Both KVM and Xen have supportfor adding or removing memory, while VMware and Hyper-V only havesupport for adding and not removing memory.
Hot disk add or remove and extend and shrink
The concept of adding or removing disks to a running system is essen-tial in production environments. The two hypervisors Xen and KVM havesupport for both of the features. VMware has support for removing disk,and partial support for adding, Hyper-V has partial support for the fea-tures. Overall there is little support for extending and shrinking disk-sizebetween the hypervisors.
This makes Xen reasonable to use because of capabilities for both adding,removing CPU and memory in run-time. The first point is essentialsince there will be a need to dynamically reallocate resources in run-timedepending on the workload and performance metrics.
14

Table 2.1: Comparison of vertical scaling capabilities between Xen, KVM,VMware and Microsoft’s Hyper-V [30].
Options Xen KVM VMware Hyper-V
CPU coreAdd /Remove
Yes/Yes
Yes/No
Yes/No
No/No
MemoryAdd /Remove
Yes/Yes
Yes/Yes
Yes/No
Yes/No
DiskAdd /Remove
Yes/Yes
Yes/Yes
Partly/Yes
Partly/Partly
Extend /Shrink
Partly/No
No/No
Yes/Partly
Partly/Partly
Memory ballooning
In difference to hot memory add or remove, the concept of memory balloon-ing lies on dynamically adjusting physical memory address space used bya VM. Instead of allocating static values of physical memory address spaceto each VM, memory ballooning reduces the chance of performance degra-dation. Each VM has a balloon driver in the VM’s kernel, which creates abridge between the hypervisor and the VM. With for instance Xen, the hy-pervisor allocates the memory defined in the configuration file, but in mostcases the VMs do not need the entire memory at any given time [31]. Withthe memory ballooning techniques the hypervisor is able to remove thenecessary memory pages from the VM when it’s unused. The VM will notknow that memory has been removed, it will just be empty space, hence"balloon" [32]. If the hypervisor for instance wants to increase memory al-located to a VM, then it would map the memory pages to the VM’s space,this gives the balloon driver more access to memory. Further, the balloondriver can release it to the VM’s kernel and within a short period, the VMreflects the changes .
In contrast to hot CPU/memory add or remove, memory ballooning has somelimitations, maximum memory needs to be defined. Memory ballooning issupported by all of the Linux kernels, which makes it an attractive way toperform vertical scaling.
2.5 Control theory
Control theory (CT) is a concept from machine learning, and is used to au-tomate management of different types of information processing systems(IPS) [33]. There are different kinds of IPS systems, such as web server,database and message queuing systems.
Karl Astrom, one of the bigger contributors to control theory, stated that
15
"magic of feedback" is that one can create a system that works well withcomponents that lack in performance [34]. He mentioned that this is doneby adding a new element, a controller that adjusts the behaviour of one ormore elements based on the measured outputs of the system [35].
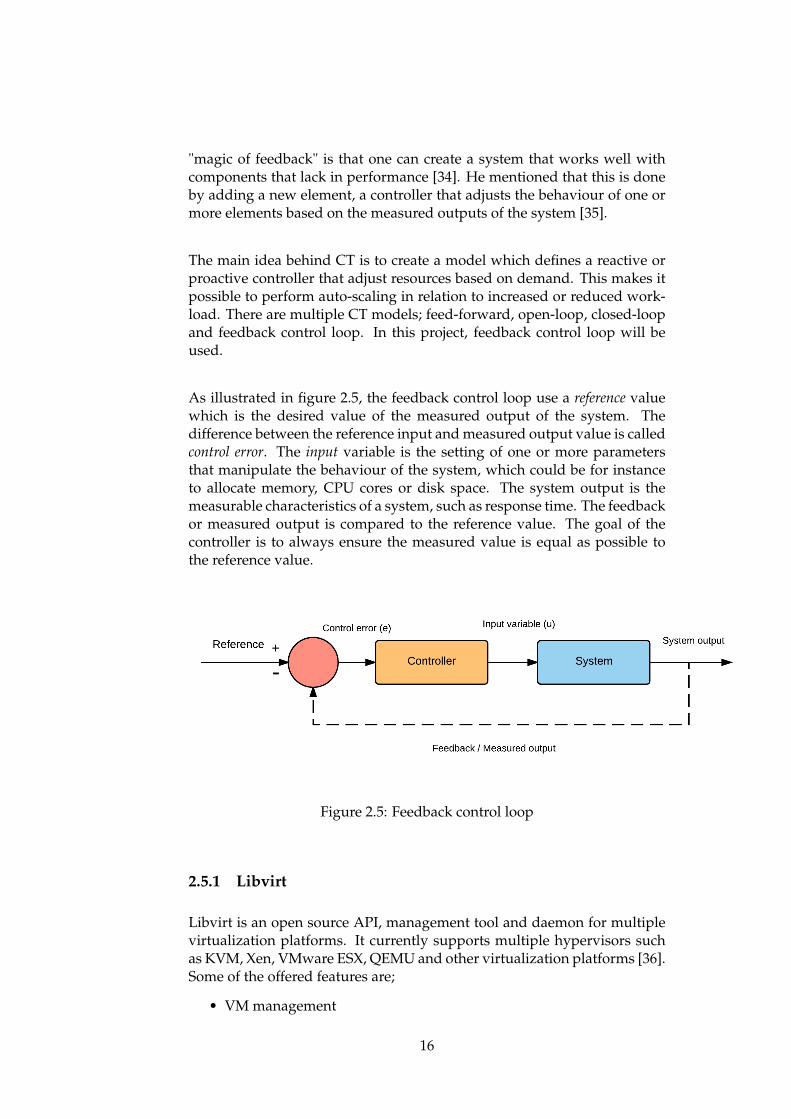
The main idea behind CT is to create a model which defines a reactive orproactive controller that adjust resources based on demand. This makes itpossible to perform auto-scaling in relation to increased or reduced work-load. There are multiple CT models; feed-forward, open-loop, closed-loopand feedback control loop. In this project, feedback control loop will beused.
As illustrated in figure 2.5, the feedback control loop use a reference valuewhich is the desired value of the measured output of the system. Thedifference between the reference input and measured output value is calledcontrol error. The input variable is the setting of one or more parametersthat manipulate the behaviour of the system, which could be for instanceto allocate memory, CPU cores or disk space. The system output is themeasurable characteristics of a system, such as response time. The feedbackor measured output is compared to the reference value. The goal of thecontroller is to always ensure the measured value is equal as possible tothe reference value.
Figure 2.5: Feedback control loop
2.5.1 Libvirt
Libvirt is an open source API, management tool and daemon for multiplevirtualization platforms. It currently supports multiple hypervisors suchas KVM, Xen, VMware ESX, QEMU and other virtualization platforms [36].Some of the offered features are;
• VM management
16
• Network interface management
• Remote machine support
• Virtual NAT and Route based networking
2.6 HAProxy
HAProxy9 (High Availability Proxy) is an Open-source TCP/HTTP load-balancing proxy server, and is widely adopted in order to achieve faulttolerance to guarantee availability and reliability of critical services [37].HAProxy offers layer 4 (transport layer) and 7 (application layer) loadbalancing. Several load balancing algorithms are offered, to mention a fewcommonly used algorithms:
• RoundRobin the back-end are served in turns, this is the defaultalgorithm.
• Leastconn as the name may tell, selection is based on choosing theserver with the least number of connection. This algorithm is oftenused for longer sessions.
• Source algorithm performs balancing based on the hash of the userssource IP, this ensures the user is connected to the same back-endserver.
Load balancing is often implemented to provide a scalable infrastructureand clustering of for instance web servers is a method to achieve that.Workload is distributed across the pool of servers to maximize performanceand optimize resource usage. HAProxy has built-in functionality for healthchecking of the back-end servers before the traffic is forwarded.
2.7 HandBrakeCLI
HandBrakeCLI10 is a command-line driven interface to several built-inlibraries for performing encoding, decoding and conversion of audio andvideo streams to multiple of formats. HandBrakeCLI is multi-threadedwhich makes it possible to perform simultaneously encoding on multiplecores.
9http://www.haproxy.org/10https://trac.handbrake.fr/wiki/CLIGuide
17

2.8 Loader.io
Loader.io11, also refereed as Loader is a cloud-based load testing and scal-ability service. Loader provides functionality to perform automated test-ing of web services to measure potentially SLA violations by cloud serviceproviders. Loader also provides a RESTful application programming inter-face (API), which makes it possible to perform testing of web-applicationsexternally. The tool allows to perform load testing and monitoring of thetraffic in real-time.
Three types of tests are offered [38]:
• Maintain client load - A constant client count will be maintainedthroughout the test duration.
• Clients per second - Client requests made each second.
• Client per test - Clients will be distributed evenly throughout the testduration.
2.9 Httpmon
Httpmon12 is a web-site monitoring and workload generator tool. Httpmongenerates HTTP-requests to a single URL based on an open or closedmodel. In the open model, the requests are completely random withoutdepending on the response time. In the closed model, each clients waitfor a response from the web-server before making a new one. In addition,httpmon also make statistics based on the results from [39]:
• Response time
• 95 and 99-percentile latency
• Requests per second
• Queue length, number of requests vs received reply
• Rate and number of requests - option 1
• Rate and number of requests - option 2
11https://loader.io/12http://www.httpmon.com/
18
2.10 Web-applications
In this thesis, two different interactive benchmark applications will be con-sidered, RUBiS 13 and RUBBoS 14. These two are popular interactive cloudbenchmarking applications and widely used in research experiments [40,41, 42, 43]. The RUBBoS web-application, is a bulletin board applicationthat models slashdot.org. The RUBBoS’s database consist of five tables,containing information about comments, stories and submissions [42]. RU-BiS is an online auction site modeled after eBay.com, it is possible to useclient workload generators to emulate user browsing and bidding. The ar-chitecture consist of a web-server service with PHP and a database in theback-end [44].
2.11 Related research
The concept of self-adaptive cloud environments is not new, it covers a broadarea of research fields, where there is still ongoing extensive research. Be-cause of the increased use of cloud computing [45], cloud service providersare encountering new challenges to ensure SLA- and QoS requirements.There are conducted multiple research experiments to achieve increasedefficiency and better resource management.
2.11.1 Performance-based Vertical Memory Elasticity
The research study [40] was performed to explore vertical elasticityfeatures in cloud computing environments. The focus in the study wascompletely on scaling memory using control theory based on changes inthe workload. Control theory with feedback loops is used as decisionmaker to compare the desired and actual response time (RT) of theapplication. The application performance is mainly the focus and based onthe RT the controller would make changes by either increasing or reducingthe memory size of the VM. The results of the experiments shows that theymanaged to increase memory efficiency by at least 47 %.
2.11.2 Coordinating CPU and Memory Elasticity Controllers toMeet Service Response Time Constraints
This research work [29] is a continuation of the work mentioned in theprevious section. Since applications in most cases are dependent ofan arbitrary combination of memory and CPU, a coordination betweenthe resources is essential for efficient resource utilization. The paper
13http://rubis.ow2.org/14http://jmob.ow2.org/rubbos.html
19
describes the novelty of the research by using a fuzzy control approach as aresource coordinator between memory and CPU controller. The applicationperformance is measured in response time as a decision maker. The studyshows that without having any coordination between the memory andCPU controller, the VM is in most cases under- or over-provisioned withresources. By using Fuzzy logic and implementing Fuzzy rules whichcontains; RT, utilization of CPU and memory as a performance vector.Comparing the results of using fuzzy controller and non-fuzzy controllershows that without having any coordination between the controllers mostof the times one of the controller over-provisions resources. With acoordination between the controllers, right amount of resources is allocatedto meet the desired response time of the application.
2.11.3 Quality of Service Control Mechanisms in Cloud Comput-ing Environments
This study is a PhD dissertation conducted by the same author as in theprevious two sections [46].
Cloud providers do not yet offer any performance guarantees, despite ofhaving availability guarantees. The reason for not having any performanceguarantees is because of the increased complexity, and how this can beaddressed in a cost-effective way from the cloud providers and customerspoint of view. There is no-linearity between workloads and the requiredresources, this makes it challenging to meet the desired performance.Controlling the trade-off between QoS and cost is the main focus in thethesis. The scope of the thesis lies on investigating models, algorithms andmechanisms to handle these two perspectives. In more details;
• The first approach looks from the cloud providers point of view tooffer a distributed infrastructure placement of virtual machines. Inthis approach Bayesian network model is used to perform decisionmaking.
• In the second approach, the author looks at the trade-off betweenQoS and cost from the cloud customers point of view. The conceptof Fuzzy controller is used to coordinate the resource controllers tomeet the performance in a cost-effective way.
The results from the study shows that with the trade-off between QoS andcost for the cloud provider. The proposed approach managed to decreasethe energy cost in the infrastructure by up to 69 % in comparison to the firststate-of-the-art baseline algorithm, and 45 % in comparison to the secondalgorithm.
In the second approach; controlling the trade-off between QoS and cost forthe cloud customers. Several experiments were conducted with real-worldworkload traces. They managed to efficiently save at least 47 % memory
20

usage while keeping the desired performance level. In the experiments,having coordination between resources with the Fuzzy controller, theymanaged to reduce the memory usage by up-to 60 % in one of the scenariosand up-to 56 % less CPU usage in another one, compared to not having anycoordination between the controllers.
2.11.4 Heracles: Improving Resource Efficiency at Scale
This study is conducted by researchers from Stanford University andGoogle [47]. The main focus in the study lies on increasing resourceefficiency by reusing resources of underutilized servers in a productionenvironment. They present a feed-based controller, named Heracles, whichcoordinate resources between best-efforts tasks and latency-critical services(LC). The desired goal is to keep the service level objectives (SLO),since small interference could cause SLO violations for the latency-criticalservice. The focus is to maintain and guarantee that LC service receivesenough amount of shared-resources; memory, CPU and network I/O.Results from the work showed that Heracles managed to increase averageutilization of 90 % across different scenarios without any SLO violation forLC tasks in a production environment.
2.11.5 Towards Faster Response Time Models for Vertical Elastic-ity
Resource provisioning is typically coarse-grained, this means that CPUcores are typically leased for periods as long as one hour. Vertical scalinghas improved resource efficiency, resources can be provisioned for as leastas few seconds. The study [10] present an empirical study where meanof response time is used to measure QoS of popular cloud applications.The interesting points made in the study is that response time is not ina linear relationship with capacity. By presenting a model called QueueLength Model, the relationship is presented as:
q = λ · R
As shown, q is is the average queue length, λ is the arrival rate and R isthe response time. The second model is called Inverse model, where therelationship between an application’s mean response time (R) and capacityallocated is represented as:
R = β/c
The parameter β is the model parameter, and as in the queue model, earliermeasurements of capacity and response time is used to calculate β, c is thecapacity and R is the response time. The tool httpmon was used as workloadgenerator, with both open and closed system models for emulating useraccess. The results showed that both of the models described above
21

managed to predict the needed capacity. With a high desired response timeboth of the models delivers, while knowing a low response time as targetthe invese modele was more stable than queue.
2.11.6 Proactive Memory Scaling of Virtualized Applications
Applications in cloud environments are often subjected to varying work-loads, and instead of over-provisioning with resources to accommodatespikes in the workloads. A study performed by researchers from VMwareand University of Würzburg [48], developed a solution for proactive scal-ing of memory on virtualized applications. The researches used statisticalforecasting to predict future workloads and scale precisely based on theneeded resources. By using real-world traces to create real scenarios, andcomparing both a reactive and proactive controller, the researchers man-aged to show that performance increased with more than 80 % using aproactive controller.
2.11.7 Vertical scaling for prioritized VMs provisioning
The research study is performed by researchers from the Universityof Dresden in Germany [49]. The aim of the study was to developa controller to perform elastic provisioning of resources to prioritizedVMs and avoid SLA-violations. The paper also evaluates the benefitsof performing vertical scaling of prioritized VMs. They use real-worldworkload traces from WorldCup 98 with the web-application RUBis onlineauction benchmark. CPU scaling was performed with CPU cap by usingXen credit-scheduler to adjust the resources. The results from the papershows that they managed to improve CPU usage efficiency without havingany major SLA violations. The developed controller achieved a higherthroughout in comparison to a statistical provisioned VM. In addition,they managed to have a stable low response time for the latency criticalapplication running on the prioritized VM.
22
Chapter 3
Approach
This chapter provides an overview of the methodology and the stepsneeded to answer the research questions defined as part of the problemstatement:
• How can we create an autonomic provisioning controller based on elementsfrom control theory to increase server utilization, and at the same timeexpose available resources to ensure QoS of real-time and non-real-timeapplications?
• How to coordinate vertical and horizontal scaling for better resourceallocation?
• How to benefit from application level metrics in order to efficiently provisionresources to interactive and non-interactive applications?
The research questions defines several main aspects, which will be usedas foundation for the thesis. The research questions are divided into threephases of the study, consisting of creating an autonomic controller to in-crease server utilization using concepts from control theory. In addition tousing concepts as vertical and horizontal scaling to improve resource allo-cation. The key feature in this study is on QoS of the applications and howapplication level metrics can be used to better decision making.
The aspects of the approach consist of:
• Design of model
• Implementation of the model
• Experiments with different scenarios
• Expected results
23

3.1 Objectives
The objectives for this thesis is outlined in the problem statement consist-ing of mainly three sub-questions that needs to be answered to address thewhole problem statement. By using terms and concept described in thebackground chapter as foundation for the work to design and prototype anautonomic provisioning controller.
The motivation for the approach is to provide experimental scenarios,which can relate to production environments, in addition to increasingserver utilization by using control theory. Using two types of applications,namely a interactive and a non-interactive, in order to maximize server uti-lization. Taking advantage of under-utilized servers to launch batch pro-cessing on them is a promising way to increase resource efficiency. Thisrequires a better way to coordinate and fulfil the applications demands interms of resources. The assumptions made is that by dynamically coor-dinating resources to applications, without over- or under-provisioning ofresources. By doing so, the QoS of the applications will in most cases notviolate the SLA-requirements, keeping the desired performance on varyingtraffic load.
The objectives in this study consist of three main phases, which are essen-tial to adequately answer the problem statement:
1. Design
(a) Controller models
(b) Decision model
(c) Controller metrics
(d) Expected results
2. Implementation for experiments
(a) Experimental setup
(b) Workload patterns
(c) Experiments
(d) Autonomic provisioning controller
(e) Testing and experiments
(f) Results from initial experiments
3. Measurement and analysis
(a) Results from main experiments
(b) Data collection
24
(c) Data plotting
(d) Analysis and comparison
These three phases will be thoroughly explained and visualized for betterunderstanding of the concepts. The first stage of the preliminary phaseconsist of creating the architecture and the features. This stage is thefoundation for the next phases, the second and the third phase will havemore focus on the practical part such as the models, prerequisites and flowcharts.
3.2 Challenges with cloud infrastructure manage-ment
Efficient management of large-scale infrastructures requires insight in theservices and technologies running on the application layer in the datacenters. Low resource utilization in data centers is one of the mainchallenges due to resource stranding and fragmentation [50]. To achieveefficient management of cloud infrastructures, requires solid investmentof time in configuration of physical servers and virtual machines. Usingconcepts as resource elasticity, which can be defined as to dynamicallyadjust attributes in response to changes in the workloads.
Managing cloud infrastructures is a complex task today because of therapid increase in usage. To create a production-ready prototype of thecontroller requires it to be tested in a real environment. The controller willnot only monitor one single VM, but several VMs simultaneously. Themodel of the controller will have several attributes which are collectedfrom the applications running on the VMs and actions are performedreactively. To document the effects of the controller and the increasedperformance achieved, resource utilization needs to be monitored on eachof the VMs. The logs needs to be accurate and precise, and further analyzedin a controlled environment, which is one of the prerequisites for futurework.
3.3 Design stage
The design phase is the initial phase for the approach and is also amajor part of the thesis study. The steps in the design are divided intoseveral stages which builds on top of each other. The first stage exploresthe different controller models and the requirements. The second stageexplores how concepts from control theory will be applied in the modelof the controller, and how the expected behaviour will be in differentscenarios. The last stage outlines the technical infrastructure for theexperiments.
25
3.3.1 Controller models
The first step in the design stage consist of evaluating the available con-troller models for the protoype of the autonomic provisioning controller.The drawbacks and benefits with the models should be outlined, in rela-tion to if their behaviour is proactive or reactive. Two types of models willbe looked at: Capacity- and performance-based models and the desired char-acteristics of the controller model includes the following:
• Adaptive: Since real-time applications are latency-critical and havestrict SLA-requirements. The controller has to be able to bothproactively and reactively act to changes in the environment.
• Scalable: The controller should be able to perform both vertical andhorizontal scaling, in terms of resources and VMs. Using techniquesto perform cost-effective decisions in real-time without violating theSLA requirements to a greater extent.
• Rapid: The controller should run in a high phase to be able toquickly pick up changes in the environment and monitor resourceconsumption of the VMs.
• Reliable and robust: The controller has to be able to perform preciseand accurate decisions based on changing load dynamics. Oneof the important characteristic lies on not over- or under-provisionresources.
3.3.2 Decision model
The prototype of the controller will be designed as part of the controllermodel, to provide an overview of all the characteristic and functionalities.The prototype models consist of four sub-models working simultaneously.By using concepts from control theory to define the communication be-tween the models and achieve high performance. There are several param-eters which are necessary when performing decision making, and those arecollected from the VMs and will be thoroughly outlined in implementationsection.
The controller will have the abilities to trigger the following actions:
• Collect information of the state
• Decide to perform vertical scaling
– Increase or reduce resources
• Decide to perform horizontal scaling
– Add new VM
• Confirm the state of the environment
26
The decision model uses control theory as a foundation for the actions andto illustrate the different states of the environment. The first action per-forms collection of performance and utilization metrics from the VMs, thevalues are then compared to desired metrics. Based on this the controllereither perform vertical or horizontal scaling. The first one is to increase sin-gle or multiple resources, and the second consist of adding a new VM tothe pool. In the end, the state is checked to confirm the state based on theactions.
By using control theory to model the different states of the environment,actions are compared to the desired state of the environment. Controltheory ensures that the state of the environment stays at the desired statewithout causing the result to diverge from the desired.
3.3.3 Controller metrics
To perform accurate and precise actions, the metrics which the controllerrelies on are important for the behaviour. The metrics will be collected fromseveral VMs simultaneously, the metrics are important for the controllerto trigger the correct actions. The real-time application, web-server islatency-critical and therefore requires the state to be checked more often, incomparison to the non-real-time application, batch job. The metrics listedbelow are essential for the controller:
• Web server response time
• Video encoding - frames per second (FPS)
• RAM memory usage and allocated
• CPU usage and allocated cores
The response time for the web server can be in short terms be described asthe total amount of time it takes to respond to a request for service. On theother hand, the batch processing software heavily relies on CPU power toperform video encoding. The QoS of the application is measured in framesper second, also known as frame frequency.
The resources can be divided into used and the allocated resources. ForRAM and CPU, the allocated resources will be monitored in relation to theusage to be able to measure whether or not the VMs are over- or under-provisioned with resources. Throughout the experiments, the controllerwill use these metrics to perform decision making and this gives the abilityperform forensic on the performance and resource logs, which will beexplained in more details in the measurements and analysis section.
27

3.3.4 Expected results
The expected results for the design stage consist of performing a successfulanalysis of the experimental environment. Several designs of the controllerwill be proposed and implemented, to analyze the expected behaviour andcharacteristics. The focus will be on the problem statement, to find an idealsolution which can fit a production environment and give potential valuewithin the research field.
3.4 Implementation stage
For the implementation stage there are several tasks that needs to be com-pleted before the experimentation stage. The implementation stage in-cludes the following tasks:
• Experimental setup
• Tools to build the models
• Application level metrics
• Workload patterns
• Autonomic provisioning controller
• Initial experiments
3.4.1 Experimental setup
After completing designing the controller, architecture of the infrastructurehas to be outlined. The physical servers that are going to be used in thethesis needs to be properly configured and maintained in terms of security,reliability and performance.
Since the infrastructure consist of two equal servers, their configuration hasto be as similar as possible. The Xen hypervissor requires the disk partition-ing to be performed during instalment of the operating system. The easiestwill be to set the disk with Logical Volume Manager (LVM) which gives flex-ibility in the later stages when creating VMs. Since the Dom0 is the initialdomain and is started by the Xen hypervisor on boot, it will require its ownLVM-partition.
The next steps in the process will be to configure the networking, whichincludes to create a separate subnet for the the VMs, and also a connectionbetween the servers to achieve high performance. The guest VM images
28
will be manually configured to fit the purpose of the experiments. One ofthe servers will be hosting the VMs:
• Database
• Webserver
• Batch
The Database will be hosting the data storage tier (DS), while the Webserverwill host the presentation tier and business logic (BL) tier based on the 3-tier pattern [51]. The Batch VM will be hosting the batch processing job.The main requirement for the infrastructure as earlier described is security,where the focus lies on isolating the domains from each other. In addition,using Secure Shell (SSH) keys for authenticating and accessing the VMs.Furthermore, achieving reliability and high performance is also beneficialfor the experiments.
3.4.2 Tools
To build the autonomic provisioning controller in an stable and reliable en-vironment. Multiple tools will be used to set up the environment and toachieve the desired state. The measures used to find the appropriate toolswhich can be applied in the project lies on functionality and how easily thetool can be adapted.
Configuring the environment will require manual effort, while during theexperiments automation will be in focus. Documentation of configurationfiles and scripts is one of the objectives for future research, and to have anenvironment that is reproducible by anyone.
When choosing the tools, open-source has been in focus because of inter-operability and flexibility. The following tools have been chosen for theproject:
• Apache - as web server
• Git - as a version control
• HAProxy - as an load balancer
• HandBrakeCLI - as a batch processing software
• Libvirt - as a VM management interface
• Loader - as a web traffic simulation and benchmarking tool
• RUBBoS - as an benchmark application
• Python - as scripting language
29
3.4.3 Application level metrics
The application level metrics are essential for the project, since the focuslies on the QoS. The web server will be the interactive application, whilethe HandBrakeCLI will be running as the non-interactive application.
The application level metric for web server is response time, that can be de-fined as; The elapsed time from sending the first byte of the request to receivingthe last byte of the reply. The main goal is to keep the response time within adesired interval to reduce SLA violations. There are many factors that cancause high response time, which may be everything from slow databasequeries, slow routing, CPU or memory starvation. All of these have to beconsidered when trying to find the reason behind a high response time.
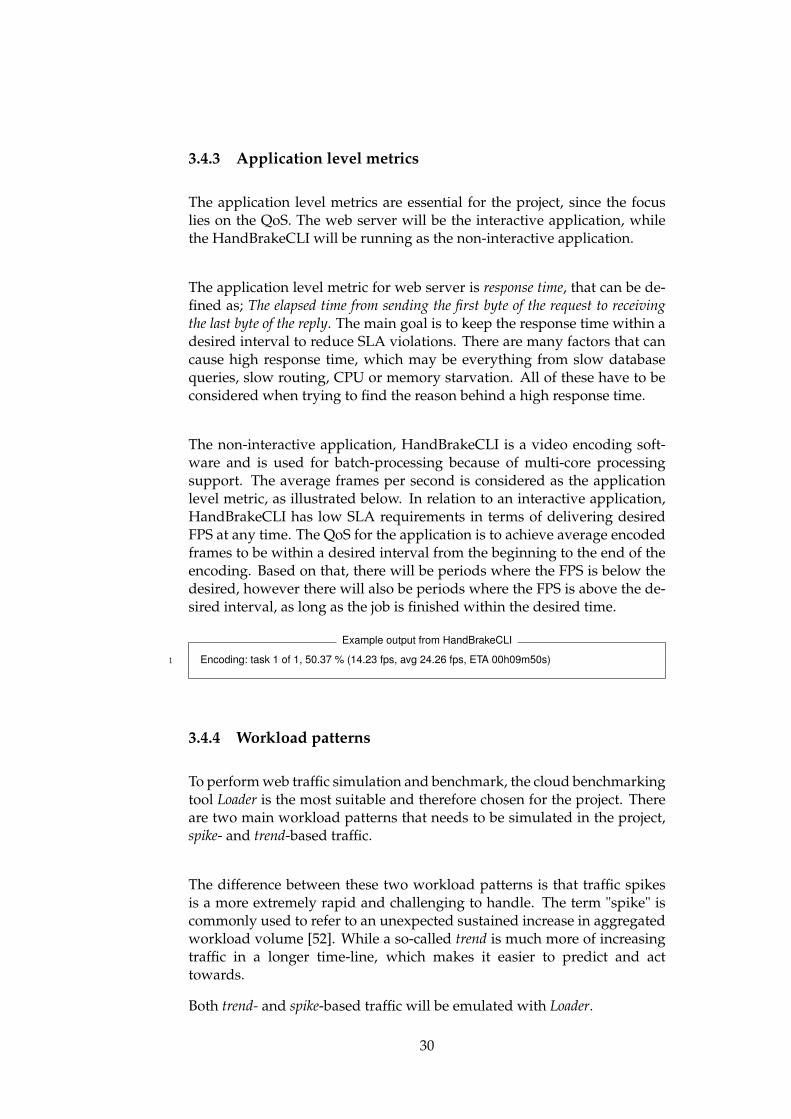
The non-interactive application, HandBrakeCLI is a video encoding soft-ware and is used for batch-processing because of multi-core processingsupport. The average frames per second is considered as the applicationlevel metric, as illustrated below. In relation to an interactive application,HandBrakeCLI has low SLA requirements in terms of delivering desiredFPS at any time. The QoS for the application is to achieve average encodedframes to be within a desired interval from the beginning to the end of theencoding. Based on that, there will be periods where the FPS is below thedesired, however there will also be periods where the FPS is above the de-sired interval, as long as the job is finished within the desired time.
Example output from HandBrakeCLI
1 Encoding: task 1 of 1, 50.37 % (14.23 fps, avg 24.26 fps, ETA 00h09m50s)
3.4.4 Workload patterns
To perform web traffic simulation and benchmark, the cloud benchmarkingtool Loader is the most suitable and therefore chosen for the project. Thereare two main workload patterns that needs to be simulated in the project,spike- and trend-based traffic.
The difference between these two workload patterns is that traffic spikesis a more extremely rapid and challenging to handle. The term "spike" iscommonly used to refer to an unexpected sustained increase in aggregatedworkload volume [52]. While a so-called trend is much more of increasingtraffic in a longer time-line, which makes it easier to predict and acttowards.
Both trend- and spike-based traffic will be emulated with Loader.
30

3.4.5 Autonomic provisioning controller
The main purpose of this study consist of designing and developing an au-tonomic provisioning controller by using concepts from control theory asstated in the problem statement. The foundation of the study relies on in-creasing server utilization, while achieving a desired QoS of the interactive-and non-interactive- applications.
The controller script will be developed in the programming languagePython as specified in section 3.4.2. There are some few obstacles that mightcreate issues and needs to be looked into before the implementation of thecontroller. Using techniques such as hot-plugging is essential for the con-troller, resources needs to be provisioned immediately, the threshold is <1seconds. Before implementing the controller, some initial experiments willbe performed on CPU and memory, these will be thoroughly explained inthe experimentation stage.
The controller will perform decisions based on the application level metricsand collect those from the applications running on the VMs. The decisionswill be based on whether the metrics are within the desired interval. Thecontroller will also proactively monitor the state of the server to locate lackof resources in an early stage.
Scaling will be performed both vertical and horizontal; the logic will beto perform vertical scaling until there are not any lack of resources on theserver. Vertical scaling will be performed until server utilization reaches80 % of the available resources. Horizontal scaling will be performed rightbefore the server reaches its maximum resources. The second server willbe booted up, and the VM will either be live-migrated or a new web serverwill be created, the load balancer will reroute the traffic to both of the webservers. The solution for performing horizontal scaling will be based ontechnical difficulties and time constraints.
Since there will be running batch-processing on one VM, and web-server on another. The time-interval for how often the controller willcheck the application level metrics will also have to be considered.Checking the metrics too often would result in an unstable controllerand environment, while performing checks too rarely will not make itpossible to detect spikes in traffic. To find the ideal time-interval, differentscenarios needs to be tested and the behaviour of the controller needs to beanalysed, furthermore tuning of the behaviour will be needed based on theresults.
31
3.4.6 Initial experiments
There will be performed three initial experiments that are essential for theproject and creates a foundation for the main experiments. The first exper-iment will be on the CPU performance when performing parallel comput-ing. The second and third experiment lies on how quickly a VM managesto map CPU cores and memory when it is added or removed.
• Initial experiments
– Parallel computing
– Memory hotplug
– CPU hotplug
Parallel computing
In this experiment, the focus lies on measuring how much the performanceimproves when increasing the number of CPU cores. The results from thisexperiment is beneficial when implementing the autonomic resource con-troller.
The experiment will be performed by running a parallel computing CPU-intensive script. This will be done while measuring how long time ittakes to perform the prime number calculation with two, three, four etcCPU cores. The expected result from the experiment is to observe a linearincrease in the performance when performing parallel computing.
Memory hotplug
The experiment, memory hotplug focuses on adding or removing memoryon a VM from the hypervisor without the need to reboot in order to reflectthe changes.
The main purpose of this experiment is to observe how long time it takesfor a VM to reflect the added or removed memory. The experiments willbe performed in two intervals, first with 64 MB segments and then with 1GB segments. The expected result for this experiment is that it will take abit longer time for the VM to reflect 1 GB of added or removed memorycompared to 64 MB. This is because of the kernel level operations whichconsist of virtual memory mapping and the page table.
32
CPU hotplug
This experiment uses the same concept as the memory hotplug experiment.The focus lies on adding and removing CPU cores to a VM and measurethe amount of time it takes until the cores is available and can be used bythe VM.
This experiment will also be performed in two phases, first increasing in ainterval with one CPU core at a time, and also removing at the same rate.The second phase will be to do the same but with a interval of three CPUcores.
3.5 Measurements and analysis stage
The last part of the project consist of performing the experiments and gath-ering performance metrics from the experiments. The results from the ex-periments are an essential part to illustrate the aspects of the controller. Thedata will be gathered from multiple sources, this will require accuracy andplanning in order to safely store the data. In the end, the data will be usedto plot charts for illustration and comparison.
These steps will be performed in the last stage of the project work:
• Performing the main experiments
• Data collection
• Data plotting
• Analyzing the obtained data and charts
3.5.1 Experiments
In the section, the experiments will be explained and their prerequisites willalso be listed. The initial experiments are going to be conducted first, whichare intended to give proof of concept for the main experiments. Before con-ducting the main experiments, several experiments will be proposed andeach of them will be built on each other based on the results.
The structure for the experimentation stage includes the following experi-ments:
• Control interval
• Resource conflict - Web server and batch (vertical scaling)
• Resource conflict - Web server and batch (horizontal scaling)
33
3.5.2 Control interval
Before performing the main experiments, some experiments will be per-formed to find the most stable control interval for the controller on thereal-time application. The main purpose is to have a stable and adaptivecontroller, that manages to detect different workload patterns at an early aspossible stage.
The autonomic provisioning controller will be tested running at theseintervals:
• Every 5 seconds
• Every 15 seconds
While for the non-real-time application, the batch job, the average FPS willbe calculated every 5 minutes.
3.5.3 Resource conflict - Web server and batch (vertical scal-ing)
In this experiment both of the applications will be running concurrently,and the workload for the web server will be emulated as spiky. This willin the end create a resource conflict when there are no resources left. Thelatency critical application will then "steal" resources from the batch job tomeet desired throughput without SLA violations. While, when the work-load reduces, the web server will release the unused resources, which willbe available for the batch job. The batch job will then be able to take by thelost encoded frames and reach the desired state.
The main purpose of this experiment is to observe how the autonomicprovisioning controller maintains the desired throughput for the latency-critical application without SLA-violations. In the same time the batch jobwill have reduced resources for some time, but when there is no resourceshortage the batch job will able to fulfil the desired FPS throughput.
3.5.4 Resource conflict - Web server and batch (horizontal scal-ing)
With this experiment the same violations as the experiment above will hap-pen. The difference in this case will be that the workload will be high fora longer period on both of the applications, which will require horizontalscaling.
A new web server will then be spawn up in the second physical server andadded to the configuration file of the load balancer - HAProxy. The load
34
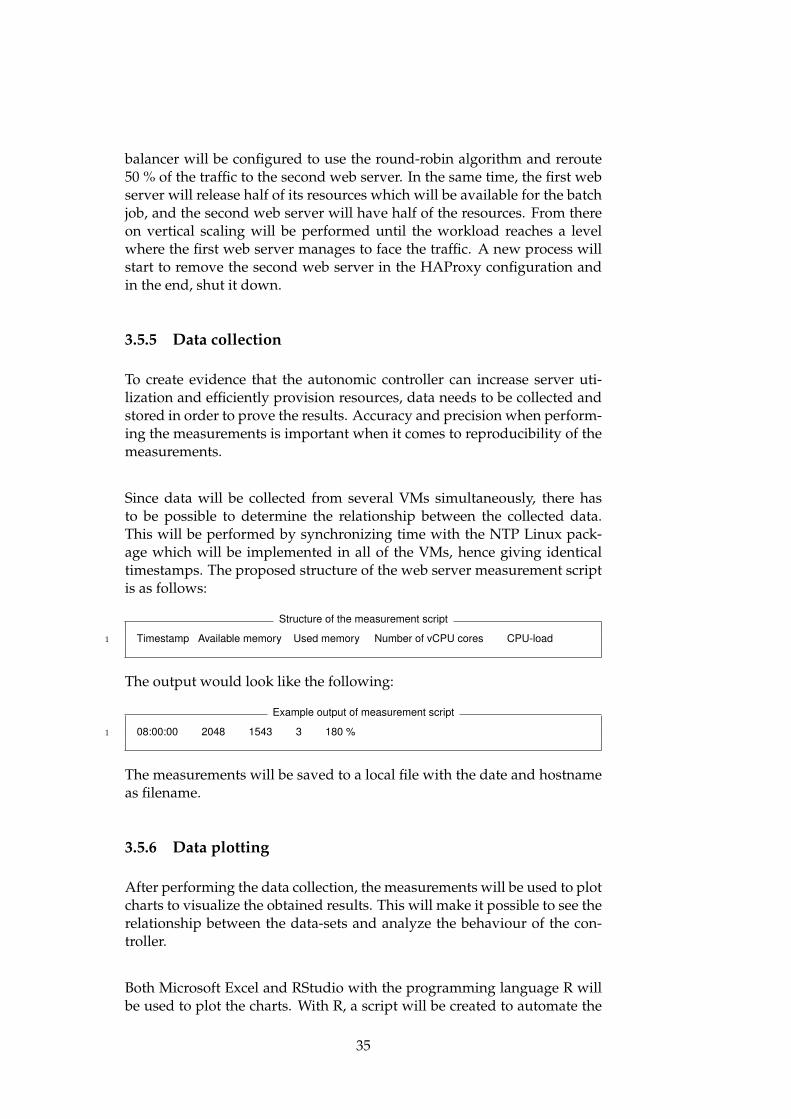
balancer will be configured to use the round-robin algorithm and reroute50 % of the traffic to the second web server. In the same time, the first webserver will release half of its resources which will be available for the batchjob, and the second web server will have half of the resources. From thereon vertical scaling will be performed until the workload reaches a levelwhere the first web server manages to face the traffic. A new process willstart to remove the second web server in the HAProxy configuration andin the end, shut it down.
3.5.5 Data collection
To create evidence that the autonomic controller can increase server uti-lization and efficiently provision resources, data needs to be collected andstored in order to prove the results. Accuracy and precision when perform-ing the measurements is important when it comes to reproducibility of themeasurements.
Since data will be collected from several VMs simultaneously, there hasto be possible to determine the relationship between the collected data.This will be performed by synchronizing time with the NTP Linux pack-age which will be implemented in all of the VMs, hence giving identicaltimestamps. The proposed structure of the web server measurement scriptis as follows:
Structure of the measurement script
1 Timestamp Available memory Used memory Number of vCPU cores CPU-load
The output would look like the following:
Example output of measurement script
1 08:00:00 2048 1543 3 180 %
The measurements will be saved to a local file with the date and hostnameas filename.
3.5.6 Data plotting
After performing the data collection, the measurements will be used to plotcharts to visualize the obtained results. This will make it possible to see therelationship between the data-sets and analyze the behaviour of the con-troller.
Both Microsoft Excel and RStudio with the programming language R willbe used to plot the charts. With R, a script will be created to automate the
35

plotting of the data-sets to charts, while in Excel, manual effort is requiredto plot the charts.
3.5.7 Analysis
The last task will consist of performing analysis on the charts and plotsto compare the results and draw a conclusion. The results from the experi-ments will be essential to illustrate the expected behaviour of the controller.
When analyzing the results from the experiments, the results will be com-pared to each other. The main consideration would be if the controllermanages to perform decisions in a rapid and adaptive way. In addition,determine that the controller does not under- or over-provision resourcesand manages to keep the desired QoS without violating SLA.
The following violations will be calculated for each experiment:
• Average amount of violations
• % of violations = SLA > 500 ms
• % of desired = percentage of responses which is between the desiredinterval
36
Chapter 4
Result I - Design and models
In this chapter the results from the tasks described in the design stage areoutlined. The structure of this chapter is presented in subsections, firstcontaining the two proposed controller models, then a overview of thedecisions models. In addition, the controller metrics are reviewed, and inthe end an overview of the infrastructure is presented.
4.1 Controller models
After reviewing the desired characteristics described in section 3.3.1, twocontroller models are proposed. The behaviour of the controller and de-cisions must be based on the evaluation criteria. Two controller models,performance- and capacity-based controller will in this section be outlined.Furthermore, the reason for choosing a combination of the two controllermodels as foundation for the prototype will also be described in detail.
Capacity-based controller is built upon the concept of allocating resourcesbased on the level of utilization. Capacity-based vertical scaling has beenwidely adopted by cloud providers because of its simplicity. Utilizationof resources are used to estimate the required resources in real-time. Thisdoes not give any indication on QoS of the applications, and can in mostcases lead to over-provisioning of resources. Since applications requires anarbitrary combination of resources to reduce the chances of violating SLA,application level metrics can give a better understanding if the applicationis suffering.
Performance-based controller emphasis on the QoS rather than on the uti-lization of resources to perform decision making. The performance is gath-ered from the application level metrics, such as response time and the met-rics gives an indication on the latency of the application. The controller hasdefined levels of acceptable and non-acceptable values and those are usedwhen performing decision making. There are some few research studies
37
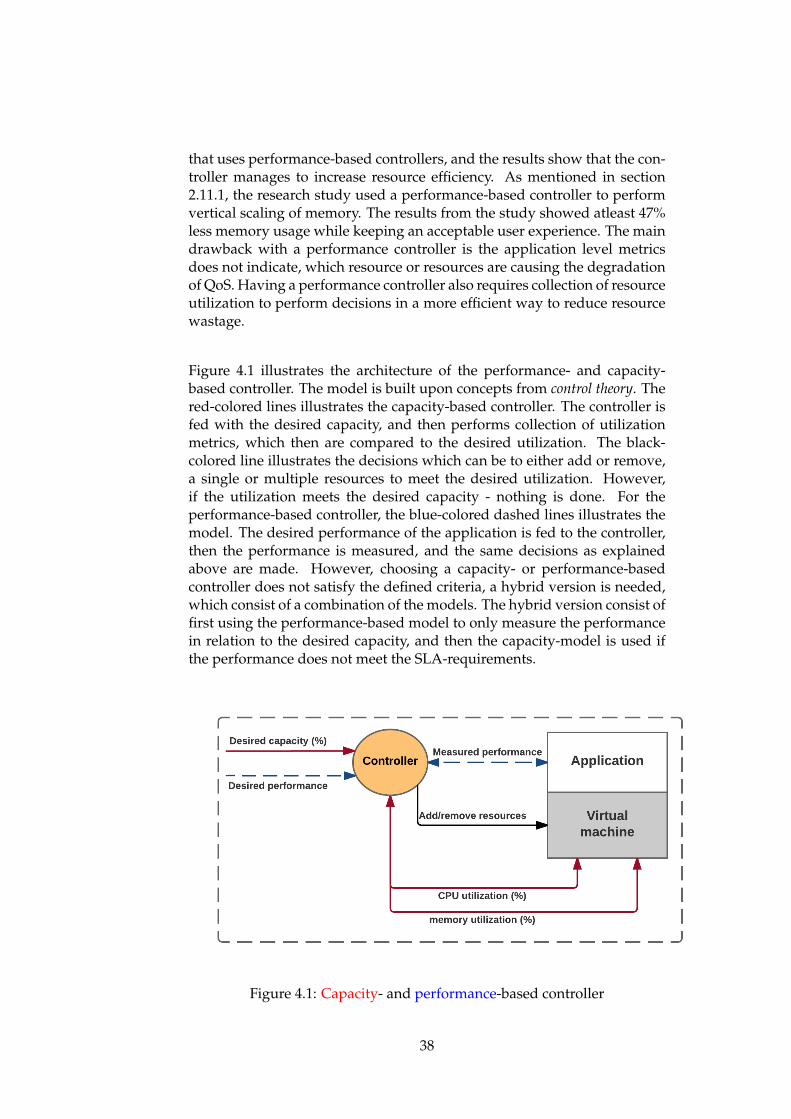
that uses performance-based controllers, and the results show that the con-troller manages to increase resource efficiency. As mentioned in section2.11.1, the research study used a performance-based controller to performvertical scaling of memory. The results from the study showed atleast 47%less memory usage while keeping an acceptable user experience. The maindrawback with a performance controller is the application level metricsdoes not indicate, which resource or resources are causing the degradationof QoS. Having a performance controller also requires collection of resourceutilization to perform decisions in a more efficient way to reduce resourcewastage.
Figure 4.1 illustrates the architecture of the performance- and capacity-based controller. The model is built upon concepts from control theory. Thered-colored lines illustrates the capacity-based controller. The controller isfed with the desired capacity, and then performs collection of utilizationmetrics, which then are compared to the desired utilization. The black-colored line illustrates the decisions which can be to either add or remove,a single or multiple resources to meet the desired utilization. However,if the utilization meets the desired capacity - nothing is done. For theperformance-based controller, the blue-colored dashed lines illustrates themodel. The desired performance of the application is fed to the controller,then the performance is measured, and the same decisions as explainedabove are made. However, choosing a capacity- or performance-basedcontroller does not satisfy the defined criteria, a hybrid version is needed,which consist of a combination of the models. The hybrid version consist offirst using the performance-based model to only measure the performancein relation to the desired capacity, and then the capacity-model is used ifthe performance does not meet the SLA-requirements.
Figure 4.1: Capacity- and performance-based controller
38

4.2 Decision model
As previously discussed in the design stage, control theory is used as afoundation for the decision making. The control feedback loop in figure 4.2is based on the feedback control loop described in section 2.5.
The desired QoS can be defined as rtk, and the measured QoS as rti.The control error (ei) is the difference between these two values in eachinterval. Umemi and Ucpui are equivalent to utilization of memory andCPU, respectively. While memi and cpui, is the amount of CPU or memoryadded. The workload is observed as disturbance, and since the controllerhas no control over the workload, it adjusts the resources in order to meetthe desired QoS.
Figure 4.2: The feedback control loop for the hybrid controller
This model is adopted both for the real-time application and non-real-time application, with Response time and frames per second as metrics.As mentioned in the previous section, the hybrid controller utilizes theperformance- and capacity-based controller models. The metrics used bythe controller will be explained in the section.
4.3 Controller metrics
The controller metrics used in this project can be divided into response timeand frames per second. These two SLA-parameters are defined in table 4.1and 4.2, respectively.
Defining how fast the application should respond is not an easy task, sincethere are not any specific industry standards. However, based on earlierresearch on human reaction [53]:
• 0.1 second is the limit for the user to feel that system is reactinginstantaneously.
39

• 1.0 second is the limit for the user to notice the delay.
Based on the research, the SLA policy for the web-server is to keep the av-erage response time to be within the interval of 100 and 500 ms. Each timethe response time exceeds 500 ms it is recorded as SLA-violation. Whenperforming the experiments, the violations of SLA will be monitored. Ifthe average response time drops below 100 ms, this means the workload isreducing and therefore the allocated resources needs to be reduced.
The batch-job’s SLA policy has lower priority compared to the web-server,the desired average frames per second is defined to be within a interval of15 and 20. There is a limit of max FPS set to 23 FPS. However if the averageframes per second drops below 15 there is not any violation. There willbe a need for increased resources to make up for the lost encoded frames.Therefore having an average frames per second which exceeds 20 for sometime is not critical. The desired time of the batch is to finish the job approx-imately within a time-period of 25 minutes.
Table 4.1: SLA: Web server
Average response time SLAFast <100 msMedium 100-500 msSlow >500 ms
Table 4.2: SLA: Batch-job
Average frames per second SLAFast >20 FPSMedium 15-20 FPSSlow <15 FPS
The two resource metrics that are also taken into consideration by the con-troller is utilization of CPU and memory, as illustrated in figure 4.2. Toreduce the chances of either over- and under-provisioning, the controllerhas defined a level containing minimum- and maximum resources, this isillustrated in table 4.3.
The controller always has the state of the VM monitored, containing theusage of CPU and memory. Using those metrics, when performing verti-cal down-scaling the minimum resources is defined as the memory usedplus a buffer of 512 MB. When scaling down there will never be a issue thatused memory is removed and causing memory segmentation faults. TheVM will always have a buffer to grow into when needed. In addition, ifthere is no load or the load is manageable with 1 vCPU, then that will bethe least possible allocated vCPU.
When performing vertical up-scaling, resources is added when the utiliza-tion reaches 80 % of the allocated resources, e.g. if a VM has 5 vCPUs andthe CPU usage is above 400 %, a new vCPU is added. With horizontal up-scaling, the same concept is used, however it is based on the total usage ofthe server. If the total usage exceeds 80 % of available resources, horizontalup-scaling is performed to distribute the load among the servers.
40

Table 4.3: Utilization of resources
Resources Minimum resources Maximum resourcesMemory UsedMemory + 512 MB 80 % of available resourcesCPU 1 vCPU 80 % of available resources
41

42

Chapter 5
Result II - Implementation andExperiments
5.1 Experimental setup
The physical equipment where the experiments was conducted consist oftwo Dell PowerEdge R610 physical machines (PMs) placed at Oslo andAkershus University College. Having access to the physical hardwaresimplifies the control of the resources and how they are allocated. Both ofthe servers have equal specifications and are running the operating systemUbuntu 12.04.5 LTS. Based on table 2.1, Xen was the only hypervisor withsupport for all of the needed features, especially CPU hot-unplugging,and therefore chosen. The PMs have the latest available Xen version4.1.6.1 configured and installed. Table 5.1 illustrates the specifications ofPMs.
Table 5.1: PM specifications
2xR610
CPU 2xQuad-core Xeon E5530 2.40 GHz
Memory 24 GB (1066 MHz)
Disk 2x146 GB (146 GB in RAID 1)
Network 8xEthernet ports
The main resources which will be used with vertical scaling are CPU andmemory, there are in total 16 vCPUs with hyper-threading enabled and 24GB of memory. These resources will be the limitations when performingvertical scaling.
The PMs are as illustrated in figure 5.1, connected together throughthe interface eth1 with a bandwidth capacity of 1 Gbps. This gives
43
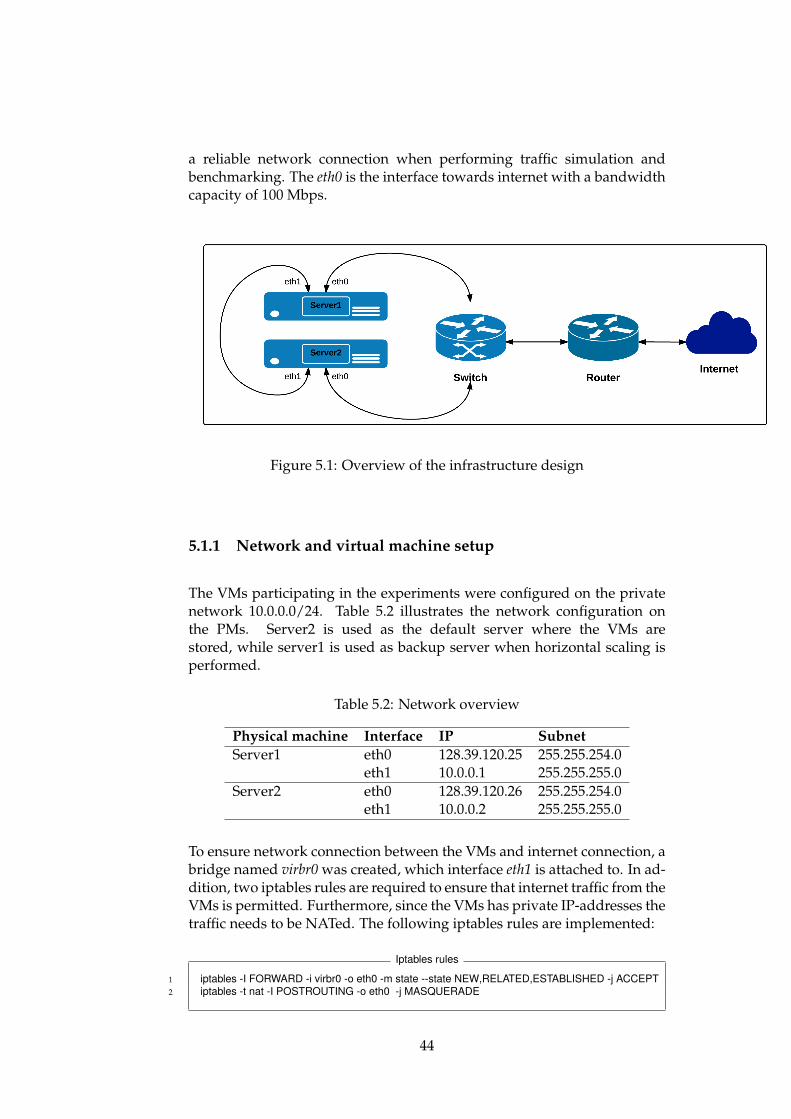
a reliable network connection when performing traffic simulation andbenchmarking. The eth0 is the interface towards internet with a bandwidthcapacity of 100 Mbps.
Figure 5.1: Overview of the infrastructure design
5.1.1 Network and virtual machine setup
The VMs participating in the experiments were configured on the privatenetwork 10.0.0.0/24. Table 5.2 illustrates the network configuration onthe PMs. Server2 is used as the default server where the VMs arestored, while server1 is used as backup server when horizontal scaling isperformed.
Table 5.2: Network overview
Physical machine Interface IP SubnetServer1 eth0 128.39.120.25 255.255.254.0
eth1 10.0.0.1 255.255.255.0Server2 eth0 128.39.120.26 255.255.254.0
eth1 10.0.0.2 255.255.255.0
To ensure network connection between the VMs and internet connection, abridge named virbr0 was created, which interface eth1 is attached to. In ad-dition, two iptables rules are required to ensure that internet traffic from theVMs is permitted. Furthermore, since the VMs has private IP-addresses thetraffic needs to be NATed. The following iptables rules are implemented:
Iptables rules
1 iptables -I FORWARD -i virbr0 -o eth0 -m state --state NEW,RELATED,ESTABLISHED -j ACCEPT2 iptables -t nat -I POSTROUTING -o eth0 -j MASQUERADE
44
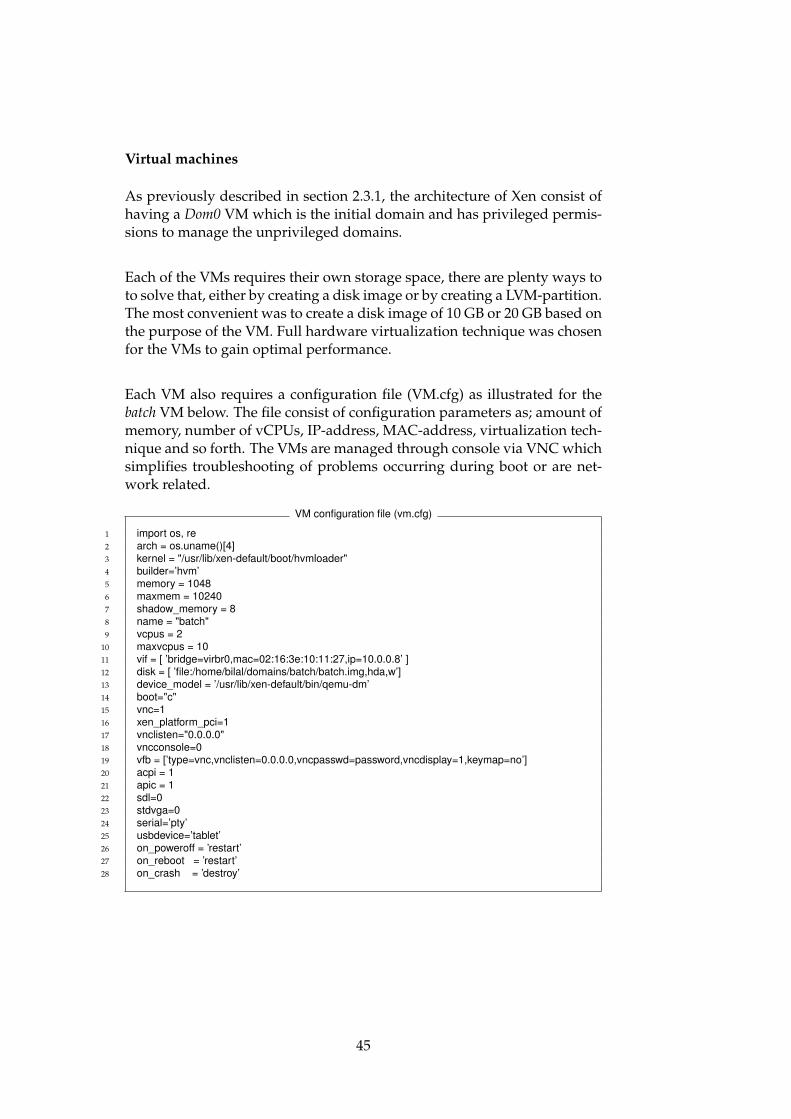
Virtual machines
As previously described in section 2.3.1, the architecture of Xen consist ofhaving a Dom0 VM which is the initial domain and has privileged permis-sions to manage the unprivileged domains.
Each of the VMs requires their own storage space, there are plenty ways toto solve that, either by creating a disk image or by creating a LVM-partition.The most convenient was to create a disk image of 10 GB or 20 GB based onthe purpose of the VM. Full hardware virtualization technique was chosenfor the VMs to gain optimal performance.
Each VM also requires a configuration file (VM.cfg) as illustrated for thebatch VM below. The file consist of configuration parameters as; amount ofmemory, number of vCPUs, IP-address, MAC-address, virtualization tech-nique and so forth. The VMs are managed through console via VNC whichsimplifies troubleshooting of problems occurring during boot or are net-work related.
VM configuration file (vm.cfg)
1 import os, re2 arch = os.uname()[4]3 kernel = "/usr/lib/xen-default/boot/hvmloader"4 builder=’hvm’5 memory = 10486 maxmem = 102407 shadow_memory = 88 name = "batch"9 vcpus = 2
10 maxvcpus = 1011 vif = [ ’bridge=virbr0,mac=02:16:3e:10:11:27,ip=10.0.0.8’ ]12 disk = [ ’file:/home/bilal/domains/batch/batch.img,hda,w’]13 device_model = ’/usr/lib/xen-default/bin/qemu-dm’14 boot="c"15 vnc=116 xen_platform_pci=117 vnclisten="0.0.0.0"18 vncconsole=019 vfb = [’type=vnc,vnclisten=0.0.0.0,vncpasswd=password,vncdisplay=1,keymap=no’]20 acpi = 121 apic = 122 sdl=023 stdvga=024 serial=’pty’25 usbdevice=’tablet’26 on_poweroff = ’restart’27 on_reboot = ’restart’28 on_crash = ’destroy’
45
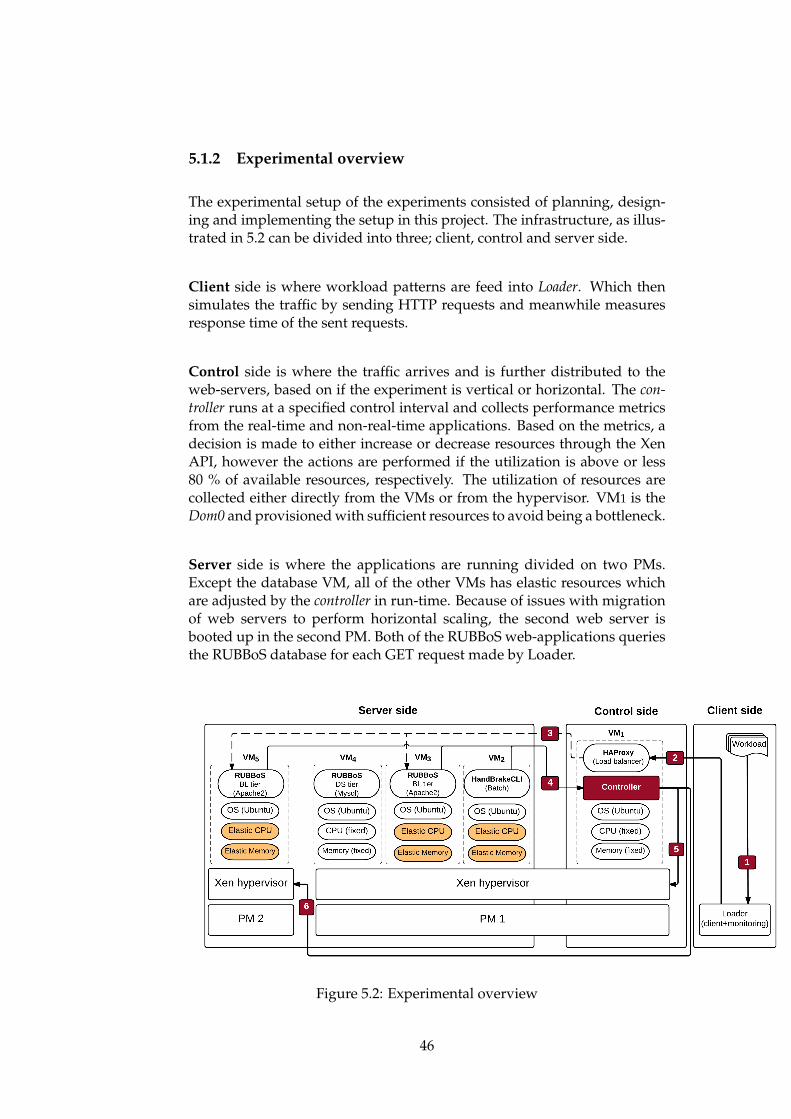
5.1.2 Experimental overview
The experimental setup of the experiments consisted of planning, design-ing and implementing the setup in this project. The infrastructure, as illus-trated in 5.2 can be divided into three; client, control and server side.
Client side is where workload patterns are feed into Loader. Which thensimulates the traffic by sending HTTP requests and meanwhile measuresresponse time of the sent requests.
Control side is where the traffic arrives and is further distributed to theweb-servers, based on if the experiment is vertical or horizontal. The con-troller runs at a specified control interval and collects performance metricsfrom the real-time and non-real-time applications. Based on the metrics, adecision is made to either increase or decrease resources through the XenAPI, however the actions are performed if the utilization is above or less80 % of available resources, respectively. The utilization of resources arecollected either directly from the VMs or from the hypervisor. VM1 is theDom0 and provisioned with sufficient resources to avoid being a bottleneck.
Server side is where the applications are running divided on two PMs.Except the database VM, all of the other VMs has elastic resources whichare adjusted by the controller in run-time. Because of issues with migrationof web servers to perform horizontal scaling, the second web server isbooted up in the second PM. Both of the RUBBoS web-applications queriesthe RUBBoS database for each GET request made by Loader.
Figure 5.2: Experimental overview
46

HAProxy
HAProxy was configured to balance the web traffic load between the avail-able web servers. In the first main experiment, with vertical scaling there isonly one web server. While in the second experiment with horizontal scal-ing the traffic is distributed to both of the web servers on the PMs. Since theweb traffic is simulated from the internet with the tool Loader, Dom0 runsthe load balancers. The algorithm roundrobin is used which distributes thetraffic equally to both of the web servers. In addition, a statistics front-endis enabled on the default port 1937, this gives real-time overview of theavailable web servers statistics data. An excerpt from the HAProxy config-uration file is shown below, the full configuration file is contained in theappendix section.
HAProxy configuration file (haproxy.cfg)
1 frontend http-in2 bind *:803 default_backend web4
5 listen statistics6 bind *:19367 mode http8 stats enable9 stats uri /
10 stats auth user:password11
12 backend web13 balance roundrobin14 mode http15 server webserver2 10.0.0.11:80 check16 server webserver1 10.0.0.10:80 check
RUBBoS
Setting up the RUBBoS web-application was a fairly involving task, it re-quires first installing a web server, database server and then initializing thedatabase.
RUBBoS, as earlier described is a bulletin board application, which enablesusers to browse and submit stories and comments. The application wasdeployed on a separate VM which runs as a web-server, several packageswere needed. Apache 2.0 with PHP5 was enabled. In addition the VMwas configured to have no memory consumption limit for Apache. Further-more, the multi-processing module Apache MPM prefork was used, whichis thread safe and highly suitable with PHP applications. The Keep alivetimeout is set to 5 seconds. The parameters for MaxClients and ServerLimitis set to relatively high values, i.e. 15 000 in the experiments. The valuesare well above the number of concurrent requests Apache has to deal withduring the experiments. RUBBoS was configured to display a random web-page which consist of an random item for each request, and each request
47
requires an SQL-query towards the database. The web-page URL was usedby the benchmarking tool, Loader when performing the experiments.
The database setup consisted of deploying a separate VM where Mysqldatabase was installed. To avoid the VM being a bottleneck, it was pro-visioned with sufficient CPU cores and memory during the experiments.The database table consisted of 1 GB of data and was loaded into theMysql database. The VM had enough allocated memory to avoid disk ac-tivity.
HandBrakeCLI
For batch-processing HandBrakeCLI was configured on a separate VM. Avideo file of 3.1 GB was loaded into the VM and a process of convertingthe file from .mp4 to .mkv was done in the experiments. HandBrakeCLI is aCPU intensive tool and is able to perform multi-processing with of all theavailable CPU cores. The command shown below was used during the ex-periments. The option -T stands for turbo and increases the performancewhen encoding. Progress of the encoding was followed by looking at theaverage FPS in the output.
HandBrakeCLI command
1 HandBrakeCLI -i input.mp4 -o output.mkv -e x264 -T
5.2 Workload patterns
Two types of workload patterns were simulated during the experiments,trend- and spiky-based traffic.
The spiky workload pattern, illustrated in figure 5.3 has two variables whichare used as metrics, the number of clients and requests. The simulation ofthe traffic consist of sudden spikes in the number of requests, being around20 most of the time and suddenly increasing up to 130 after one, three andand four minutes. There are also some few smaller spikes after the firstlarge spike. The number of clients increases more linearly from zero andup-to in total 120 simultaneous clients. During the experiments, the samespikes are emulated, however when the spiky traffic occurs it varies in timeto make it unpredictable. The simulated traffic last for five minutes.
The trend workload pattern, illustrated in figure 5.4 is a traffic pattern withmore linearly increase in number of clients, from zero and up-to 2900 overten minutes. The number of requests has a stable increase until six minutes
48
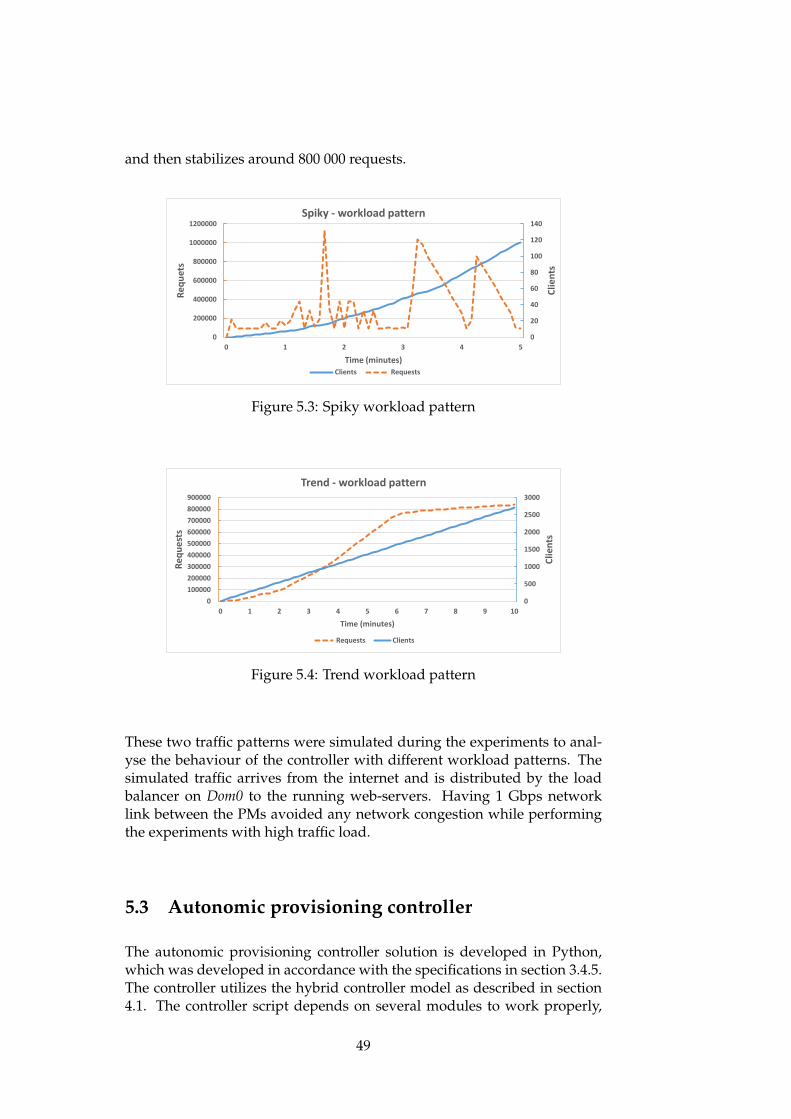
and then stabilizes around 800 000 requests.
0
20
40
60
80
100
120
140
0
200000
400000
600000
800000
1000000
1200000
0 1 2 3 4 5
Clie
nts
Req
uet
s
Time (minutes)
Spiky - workload pattern
Clients Requests
Figure 5.3: Spiky workload pattern
0
500
1000
1500
2000
2500
3000
0
100000
200000
300000
400000
500000
600000
700000
800000
900000
0 1 2 3 4 5 6 7 8 9 10
Clie
nts
Re
qu
est
s
Time (minutes)
Trend - workload pattern
Requests Clients
Figure 5.4: Trend workload pattern
These two traffic patterns were simulated during the experiments to anal-yse the behaviour of the controller with different workload patterns. Thesimulated traffic arrives from the internet and is distributed by the loadbalancer on Dom0 to the running web-servers. Having 1 Gbps networklink between the PMs avoided any network congestion while performingthe experiments with high traffic load.
5.3 Autonomic provisioning controller
The autonomic provisioning controller solution is developed in Python,which was developed in accordance with the specifications in section 3.4.5.The controller utilizes the hybrid controller model as described in section4.1. The controller script depends on several modules to work properly,
49

especially Libvirt and some other primary modules which are listed in themain script located in Appendix.
The script contains several functions that are dependant of each other, frommeasuring the response time to performing actions as to increase resources.The controller runs at an interval of five seconds for the web-applicationand every five minutes for the batch-job.
There are several parameters that needs to be defined for the controller,as illustrated in table 5.3, minimum-, maximum resources for CPU andmemory. The resource parameters are defined for each of the VMs, e.g.the batch-VM is able to allocate in total 10 vCPUs. The minimum memoryis defiend as usage plus 512 MB as a buffer, when performing down-scaling. The local url’s for the web-servers, desired RT with minimum andmaximum interval levels are also defined, the same for the batch-job withFPS.
Table 5.3: Controller parameters
Variable Valuemin_vCPU 1max_vCPU 10max_memory (MB) 12000url http://10.0.0.11/PHP/RandomStory.phpmin_RT (seconds) 0.1max_RT (seconds) 0.5min_desired_fps 15max_desired_fps 23max_fps 25
Because of technical issues with migration of VMs between the PMs, theconcept of booting up a new VM on the second PM was adopted. The logicbehind performing horizontal scaling lies on achieving desired QoS even ifthere is a limitation of resources on the first PM, then horizontal scaling isperformed on the second PM. For vertical scaling of resources Xen-API isused for hot-plugging of memory and vCPUs with the following commands,respectively:
Memory and CPU hot-plugging
1 xm mem-set [domain-id] [count in MB]2
3 xm vcpu-set [domain-id] [count in cores]
The decisions in the autonomic provisioning controller script is based ontwo experiments that has been conducted. The first one is vertical scaling,where there is a conflict of resources on PM and a reallocation is neededto satisfy QoS of the applications. The second is based on horizontal scal-ing because of resource limitations and each of the experiments covered a
50

unique use case which is interesting in a scaling scenario.
The decision logic for some of the functionality is illustrated in figure 5.5,starting with measuring the response time and performing decision basedon that. Then checking if the maximum resources of the PM is reached, ifnot vertical scaling is performed based on utilization of the VM. However,if the batch VM is not running with the minimum defined resources,resources are stolen for an amount of time to satisfy QoS-requirements ofthe real-time application. However for the second experiment, if there areno available resources left, horizontal scaling is performed by booting up anew web-server on the second PM and distributing the traffic between thetwo web servers. This is done until the simulated traffic comes back to alevel where one web server is able to handle the traffic load, then down-scaling is performed.
Figure 5.5: An activity diagram showing the decision logic determiningwhether or not to scale based on QoS-requirements.
The controller has defined control interval for the interactive and non-interactive application. Since the batch-job is less latency critical it is mea-sured every 5 minutes, while the latency-critical application is measuredeither 5 or 15 seconds based on the initial results. As previously mentioned,Xen API is used for vertical scaling of resources. Resources is added and
51
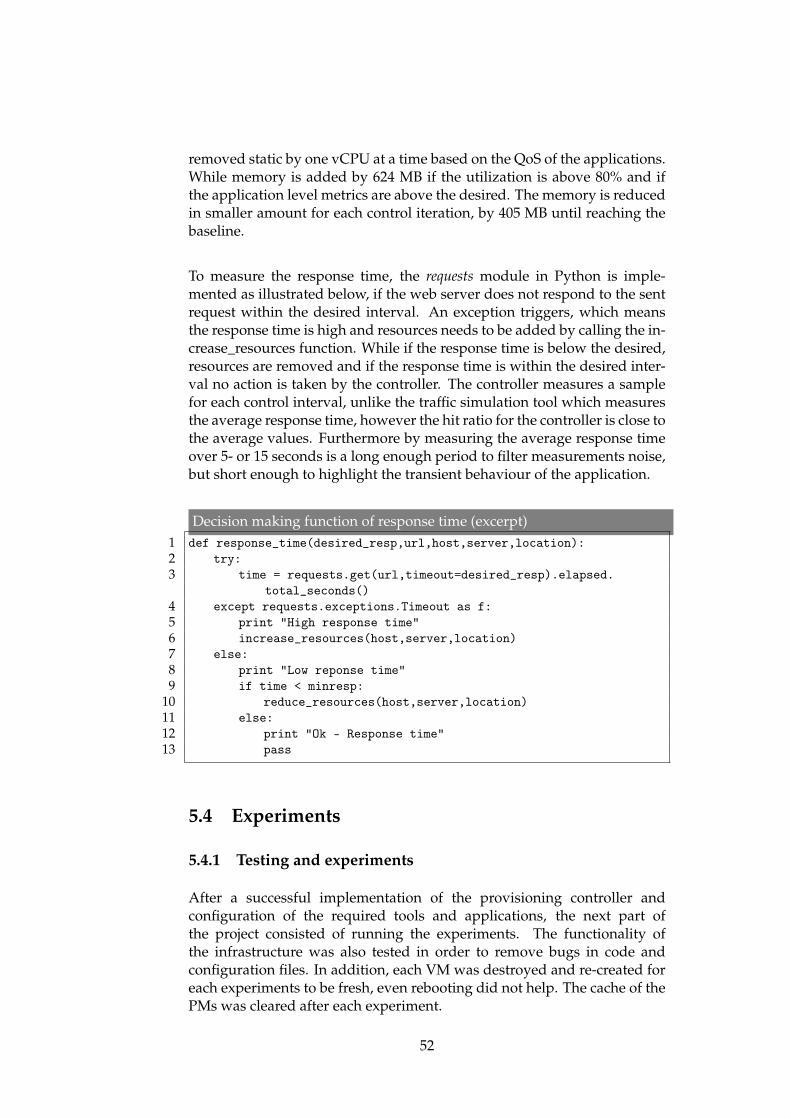
removed static by one vCPU at a time based on the QoS of the applications.While memory is added by 624 MB if the utilization is above 80% and ifthe application level metrics are above the desired. The memory is reducedin smaller amount for each control iteration, by 405 MB until reaching thebaseline.
To measure the response time, the requests module in Python is imple-mented as illustrated below, if the web server does not respond to the sentrequest within the desired interval. An exception triggers, which meansthe response time is high and resources needs to be added by calling the in-crease_resources function. While if the response time is below the desired,resources are removed and if the response time is within the desired inter-val no action is taken by the controller. The controller measures a samplefor each control interval, unlike the traffic simulation tool which measuresthe average response time, however the hit ratio for the controller is close tothe average values. Furthermore by measuring the average response timeover 5- or 15 seconds is a long enough period to filter measurements noise,but short enough to highlight the transient behaviour of the application.
Decision making function of response time (excerpt)1 def response_time(desired_resp,url,host,server,location):2 try:3 time = requests.get(url,timeout=desired_resp).elapsed.
total_seconds()4 except requests.exceptions.Timeout as f:5 print "High response time"6 increase_resources(host,server,location)7 else:8 print "Low reponse time"9 if time < minresp:
10 reduce_resources(host,server,location)11 else:12 print "Ok - Response time"13 pass
5.4 Experiments
5.4.1 Testing and experiments
After a successful implementation of the provisioning controller andconfiguration of the required tools and applications, the next part ofthe project consisted of running the experiments. The functionality ofthe infrastructure was also tested in order to remove bugs in code andconfiguration files. In addition, each VM was destroyed and re-created foreach experiments to be fresh, even rebooting did not help. The cache of thePMs was cleared after each experiment.
52
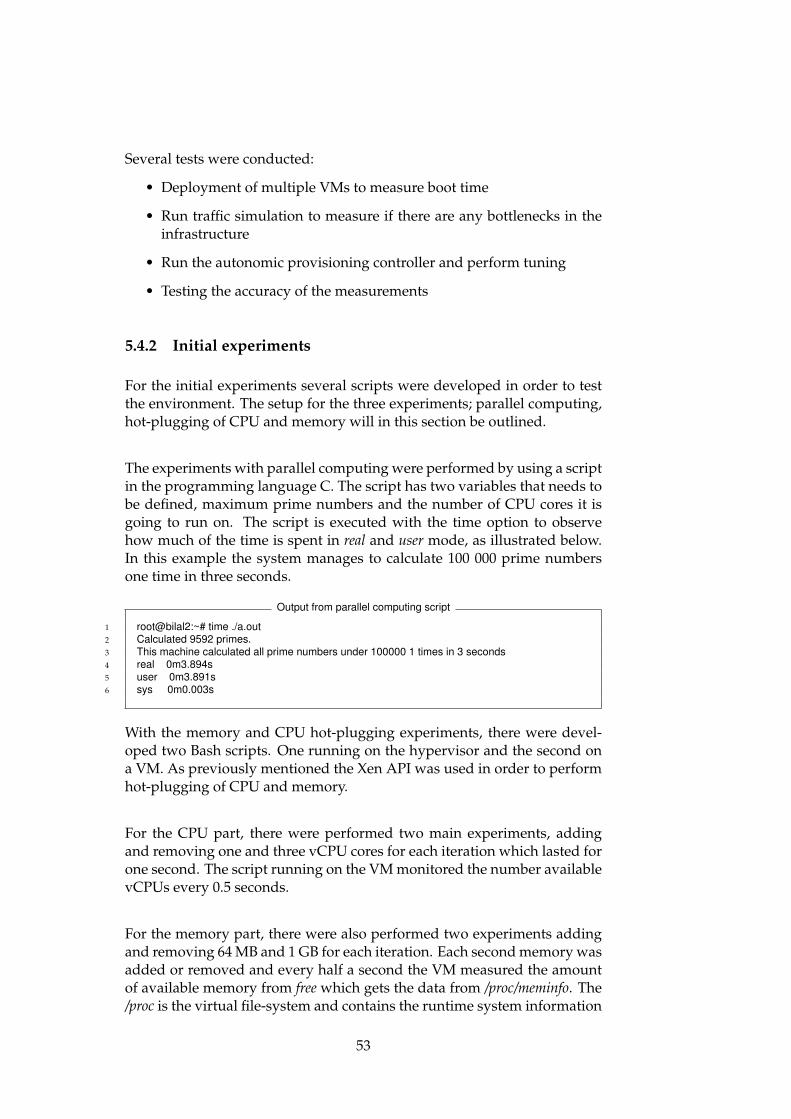
Several tests were conducted:
• Deployment of multiple VMs to measure boot time
• Run traffic simulation to measure if there are any bottlenecks in theinfrastructure
• Run the autonomic provisioning controller and perform tuning
• Testing the accuracy of the measurements
5.4.2 Initial experiments
For the initial experiments several scripts were developed in order to testthe environment. The setup for the three experiments; parallel computing,hot-plugging of CPU and memory will in this section be outlined.
The experiments with parallel computing were performed by using a scriptin the programming language C. The script has two variables that needs tobe defined, maximum prime numbers and the number of CPU cores it isgoing to run on. The script is executed with the time option to observehow much of the time is spent in real and user mode, as illustrated below.In this example the system manages to calculate 100 000 prime numbersone time in three seconds.
Output from parallel computing script
1 root@bilal2:~# time ./a.out2 Calculated 9592 primes.3 This machine calculated all prime numbers under 100000 1 times in 3 seconds4 real 0m3.894s5 user 0m3.891s6 sys 0m0.003s
With the memory and CPU hot-plugging experiments, there were devel-oped two Bash scripts. One running on the hypervisor and the second ona VM. As previously mentioned the Xen API was used in order to performhot-plugging of CPU and memory.
For the CPU part, there were performed two main experiments, addingand removing one and three vCPU cores for each iteration which lasted forone second. The script running on the VM monitored the number availablevCPUs every 0.5 seconds.
For the memory part, there were also performed two experiments addingand removing 64 MB and 1 GB for each iteration. Each second memory wasadded or removed and every half a second the VM measured the amountof available memory from free which gets the data from /proc/meminfo. The/proc is the virtual file-system and contains the runtime system information
53
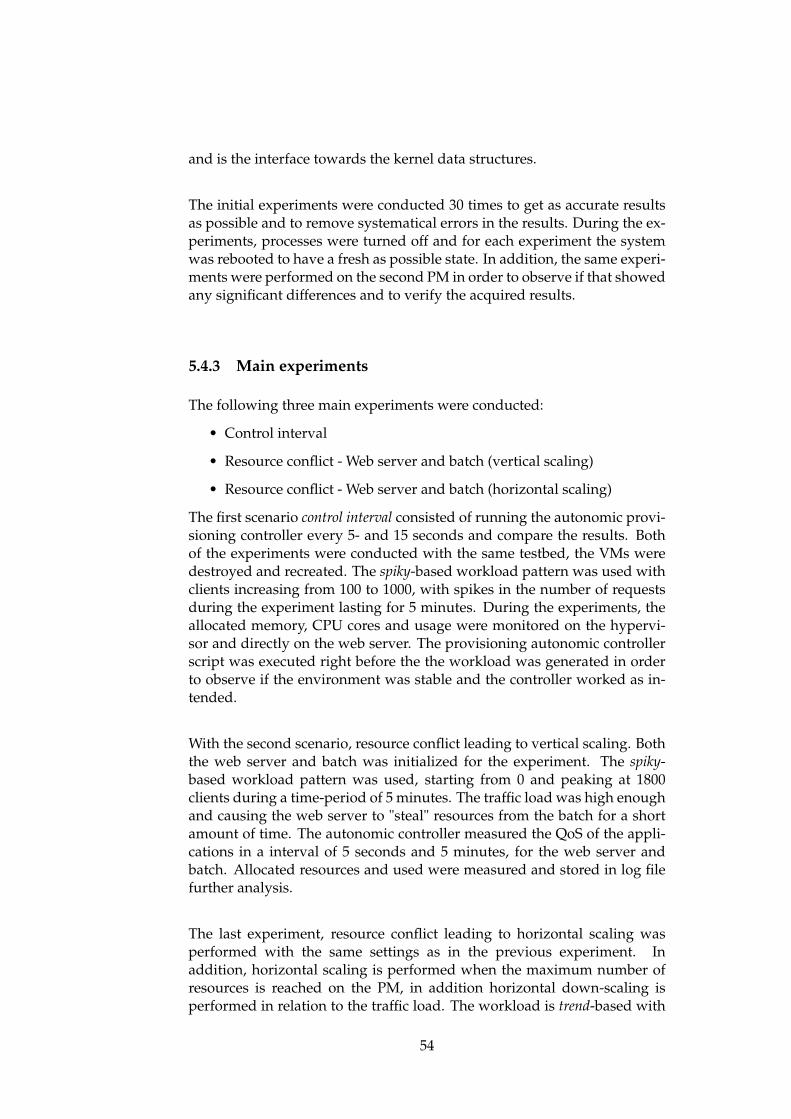
and is the interface towards the kernel data structures.
The initial experiments were conducted 30 times to get as accurate resultsas possible and to remove systematical errors in the results. During the ex-periments, processes were turned off and for each experiment the systemwas rebooted to have a fresh as possible state. In addition, the same experi-ments were performed on the second PM in order to observe if that showedany significant differences and to verify the acquired results.
5.4.3 Main experiments
The following three main experiments were conducted:
• Control interval
• Resource conflict - Web server and batch (vertical scaling)
• Resource conflict - Web server and batch (horizontal scaling)
The first scenario control interval consisted of running the autonomic provi-sioning controller every 5- and 15 seconds and compare the results. Bothof the experiments were conducted with the same testbed, the VMs weredestroyed and recreated. The spiky-based workload pattern was used withclients increasing from 100 to 1000, with spikes in the number of requestsduring the experiment lasting for 5 minutes. During the experiments, theallocated memory, CPU cores and usage were monitored on the hypervi-sor and directly on the web server. The provisioning autonomic controllerscript was executed right before the the workload was generated in orderto observe if the environment was stable and the controller worked as in-tended.
With the second scenario, resource conflict leading to vertical scaling. Boththe web server and batch was initialized for the experiment. The spiky-based workload pattern was used, starting from 0 and peaking at 1800clients during a time-period of 5 minutes. The traffic load was high enoughand causing the web server to "steal" resources from the batch for a shortamount of time. The autonomic controller measured the QoS of the appli-cations in a interval of 5 seconds and 5 minutes, for the web server andbatch. Allocated resources and used were measured and stored in log filefurther analysis.
The last experiment, resource conflict leading to horizontal scaling wasperformed with the same settings as in the previous experiment. Inaddition, horizontal scaling is performed when the maximum number ofresources is reached on the PM, in addition horizontal down-scaling isperformed in relation to the traffic load. The workload is trend-based with
54
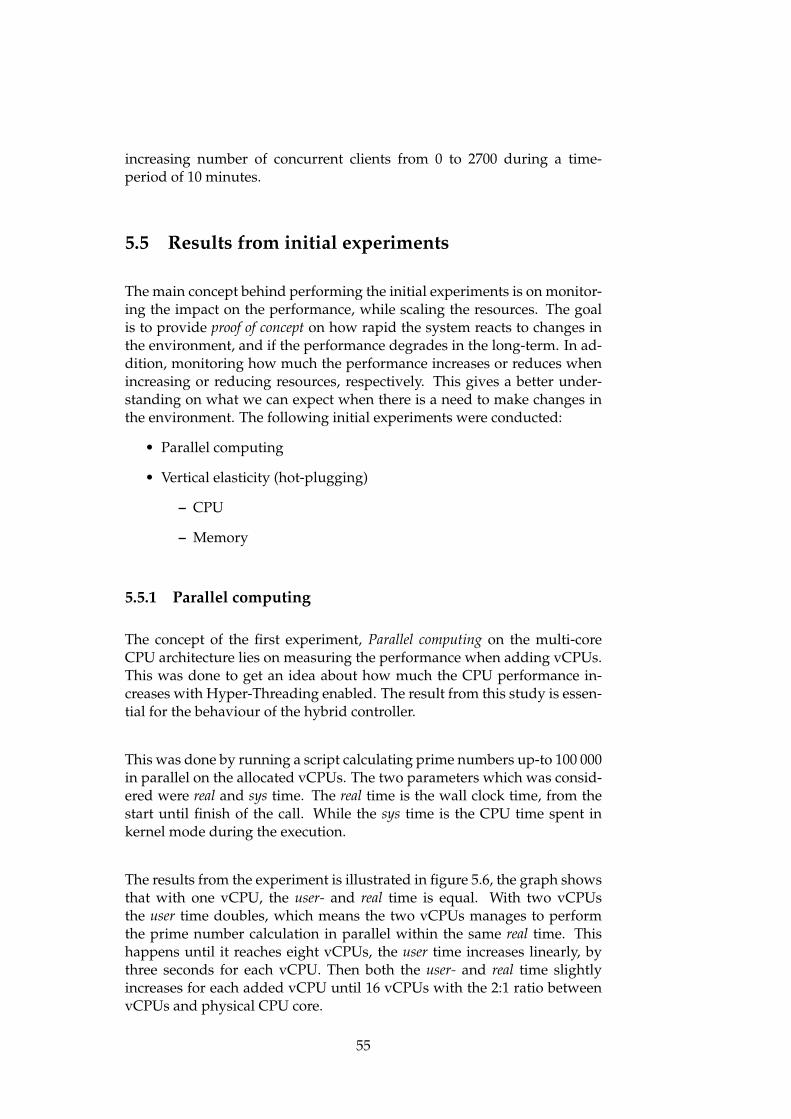
increasing number of concurrent clients from 0 to 2700 during a time-period of 10 minutes.
5.5 Results from initial experiments
The main concept behind performing the initial experiments is on monitor-ing the impact on the performance, while scaling the resources. The goalis to provide proof of concept on how rapid the system reacts to changes inthe environment, and if the performance degrades in the long-term. In ad-dition, monitoring how much the performance increases or reduces whenincreasing or reducing resources, respectively. This gives a better under-standing on what we can expect when there is a need to make changes inthe environment. The following initial experiments were conducted:
• Parallel computing
• Vertical elasticity (hot-plugging)
– CPU
– Memory
5.5.1 Parallel computing
The concept of the first experiment, Parallel computing on the multi-coreCPU architecture lies on measuring the performance when adding vCPUs.This was done to get an idea about how much the CPU performance in-creases with Hyper-Threading enabled. The result from this study is essen-tial for the behaviour of the hybrid controller.
This was done by running a script calculating prime numbers up-to 100 000in parallel on the allocated vCPUs. The two parameters which was consid-ered were real and sys time. The real time is the wall clock time, from thestart until finish of the call. While the sys time is the CPU time spent inkernel mode during the execution.
The results from the experiment is illustrated in figure 5.6, the graph showsthat with one vCPU, the user- and real time is equal. With two vCPUsthe user time doubles, which means the two vCPUs manages to performthe prime number calculation in parallel within the same real time. Thishappens until it reaches eight vCPUs, the user time increases linearly, bythree seconds for each vCPU. Then both the user- and real time slightlyincreases for each added vCPU until 16 vCPUs with the 2:1 ratio betweenvCPUs and physical CPU core.
55

Parallel computing
Number of vCPUs
CP
U ti
me
(sec
onds
)
1 2 3 4 5 6 7 8 9 10 11 12 13 14 15 16
10
20
30
40
50
60
70
80 User
Real
Figure 5.6: Parallel computing from 1 to 16 vCPUs
5.5.2 CPU hot-plugging
In the second part of the initial experiments, the focus lies on measuring thetime it takes from allocating vCPUs and until the VM maps the cores. Themain purpose of this experiment is to measure the performance betweenthe time vCPUs is added or removed until it is usable by the VM.
The results from the CPU hot-plugging are illustrated in figure 5.7 and 5.8,accordingly. In the first experiment, one vCPU was added to a VM in a se-quence of one second from two to sixteen vCPUs. Meanwhile the VM mea-sured the number of available vCPUs every half a second. As the figureshows, when appending vCPUs from two to five vCPUs, the cores are im-mediately mapped on the VM. From six to eight cores, the mapping takeshalf a second. The time is increasing, and in the last sequence the mappingis one and half second.
In the second part of the experiment, vCPUs were removed with one foreach iteration from sixteen to two. As the results shows, for the firstsix iterations the cores are immediately mapped by the VM. For the nextfour iterations the reflections took half a second, while for the last partthe mapping took one second. Similar to when adding, removal of vCPUcores is in the first part immediately mapped, while in the second half thetime increases up-to one and half seconds when adding. The total time foradding is sixteen seconds and for removal, the time is fifteen seconds.
56

CPU hotplug [ + ] 1 vCPU
Time in seconds
Num
ber
of v
CP
Us
0 2 4 6 8 10 12 14 16
2
4
6
8
10
12
14
16Mapped vCPUs
Added vCPUs(1 per iteration)
CPU hotplug [ − ] 1 vCPU
Time in seconds
Num
ber
of v
CP
Us
2
4
6
8
10
12
14
16
0 2 4 6 8 10 12 14
Mapped vCPUs
Removed vCPUs (1 per iteration)
Figure 5.7: CPU hot-plugging when appending and removing vCPUs byone for each iteration
When performing the same experiment, but in this case with three vCPUsfor each iteration. The results as illustrated in figure 5.8 starting with fourand up-to sixteen vCPUs. As the chart shows, the VM manages to imme-diately map the added vCPUs from four to sixteen. The VM observes anincrease of twelve vCPUs within a four seconds time-period.
CPU hotplug [ + ] 3 vCPU
Time in seconds
Num
ber
of v
CP
Us
Mapped vCPUs
Added vCPUs(3 per iteration)
4
6
8
10
12
14
16
0 0.5 1 1.5 2 2.5 3 3.5 4
CPU hotplug [ − ] 3 vCPU
Time in seconds
Num
ber
of v
CP
Us
Mapped vCPUs
Removed vCPUs(3 per iteration)
4
6
8
10
12
14
16
0 0.5 1 1.5 2 2.5 3 3.5 4
Figure 5.8: CPU hot-plugging when appending and removing vCPUs bythree for each iteration
57
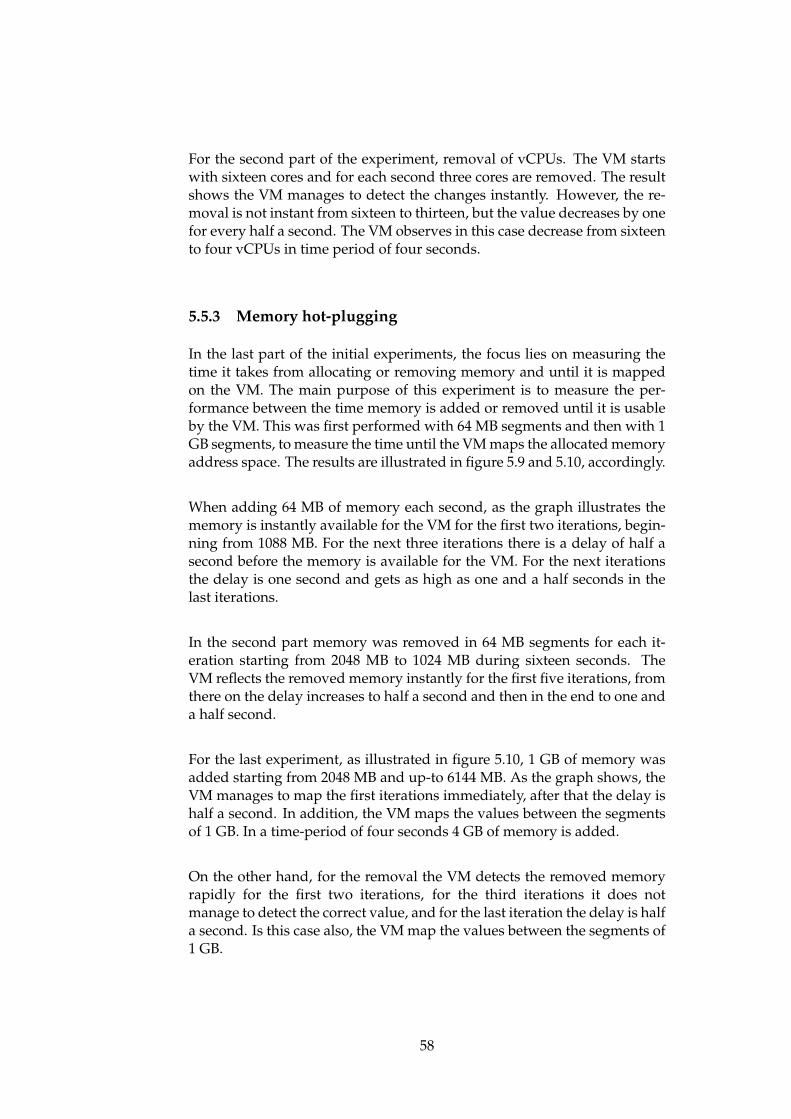
For the second part of the experiment, removal of vCPUs. The VM startswith sixteen cores and for each second three cores are removed. The resultshows the VM manages to detect the changes instantly. However, the re-moval is not instant from sixteen to thirteen, but the value decreases by onefor every half a second. The VM observes in this case decrease from sixteento four vCPUs in time period of four seconds.
5.5.3 Memory hot-plugging
In the last part of the initial experiments, the focus lies on measuring thetime it takes from allocating or removing memory and until it is mappedon the VM. The main purpose of this experiment is to measure the per-formance between the time memory is added or removed until it is usableby the VM. This was first performed with 64 MB segments and then with 1GB segments, to measure the time until the VM maps the allocated memoryaddress space. The results are illustrated in figure 5.9 and 5.10, accordingly.
When adding 64 MB of memory each second, as the graph illustrates thememory is instantly available for the VM for the first two iterations, begin-ning from 1088 MB. For the next three iterations there is a delay of half asecond before the memory is available for the VM. For the next iterationsthe delay is one second and gets as high as one and a half seconds in thelast iterations.
In the second part memory was removed in 64 MB segments for each it-eration starting from 2048 MB to 1024 MB during sixteen seconds. TheVM reflects the removed memory instantly for the first five iterations, fromthere on the delay increases to half a second and then in the end to one anda half second.
For the last experiment, as illustrated in figure 5.10, 1 GB of memory wasadded starting from 2048 MB and up-to 6144 MB. As the graph shows, theVM manages to map the first iterations immediately, after that the delay ishalf a second. In addition, the VM maps the values between the segmentsof 1 GB. In a time-period of four seconds 4 GB of memory is added.
On the other hand, for the removal the VM detects the removed memoryrapidly for the first two iterations, for the third iterations it does notmanage to detect the correct value, and for the last iteration the delay is halfa second. Is this case also, the VM map the values between the segments of1 GB.
58

Memory hotplug [ + ] 64 MB
Time in seconds
Mem
ory
in M
B
1100
1200
1300
1400
1500
1600
1700
1800
1900
2000
0 2 4 6 8 10 12 14 16
Mapped memory
Added memory(64 MB segments)
Memory hotplug [ − ] 64 MB
Time in seconds
Mem
ory
in M
B
1000
1100
1200
1300
1400
1500
1600
1700
1800
1900
2000
0 2 4 6 8 10 12 14 16 18
Mapped memory
Removed memory(64 MB segments)
Figure 5.9: Memory hot-plugging of 64 MB for each iteration
Memory hotplug [ + ] 1 GB
Time in seconds
Mem
ory
in M
B
2000
3000
4000
5000
6000
0 1 2 3 4
Mapped memory
Added memory(1 GB segments)
Memory hotplug [ − ] 1 GB
Time in seconds
Mem
ory
in M
B
2000
3000
4000
5000
6000
0 1 2 3 4
Mapped memory
Removed memory(1 GB segments)
Figure 5.10: Memory hot-plugging of 1 GB for each iteration
59

60

Chapter 6
Result III - Measurements andAnalysis
This chapter covers the results for all the conducted experiments. The con-trol interval experiment are first presented before the main experiments. Theresults from the experiments are based on each other and will be presentedin that order.
After the experimentation process, analysis on the acquired measurementsfrom each VM will be presented in graphs to ease the readability. Thedata is collected during the experiments and contains utilization metrics.Sometimes other methods will be used if that is deemed necessary.
6.1 Control interval
The control interval experiments were performed in two iterations, with 5and 15 seconds interval with the controller. The results are illustrated infigure 6.1 and 6.2, with the main metrics, average response time and vC-PUs. The min and max response time are visualized with straight dottedlines, the desired response time is within the interval of 100 ms and 500 ms.The experiment lasted for 5 minutes with increasing traffic from 100 to 1000clients. The spiky-based workload pattern was chosen for this experiment,as previously described in section 5.2.
Starting with the 5 seconds interval, there are three main spikes in theresponse time and this can relate to spikes at the same moment in theworkload patterns. The number of vCPUs increases in relation to responsetime and manages to reduce the time to within the desired interval in all ofthe three spikes. In the first two spikes there are allocated at maximumthree vCPUs and for the last, five are allocated. For the last spike theresponse time rise rapidly and reaches right below 1600 ms.
61

0
1
2
3
4
5
0
500
1000
1500
2000
0 1 2 3 4 5
Nu
mb
er
of
vCP
Us
Ave
rage
re
spo
nse
tim
e (
ms)
Time (minutes)
Control interval - 5 seconds
Response time Min response time Max response time vCPUs
Figure 6.1: Running the controller every 5 seconds with spiky-basedworkload pattern
For the 15 seconds interval, as illustrated in figure 6.2, there are two mainspikes in the response time. The first one reaches 800 ms, while the secondone reaches right above 1200 ms. For the first spike three vCPUs areallocated and for the second spike four vCPUs are allocated in relation tothe response time.
0
1
2
3
4
5
0
500
1000
1500
2000
0 1 2 3 4 5
Nu
mb
er
of
vCP
Us
Ave
rage
re
spo
nse
tim
e (
ms)
Time (minutes)
Control interval - 15 seconds
Response time Min response time Max response time vCPUs
Figure 6.2: Running the controller every 15 seconds with spiky-basedworkload pattern
62
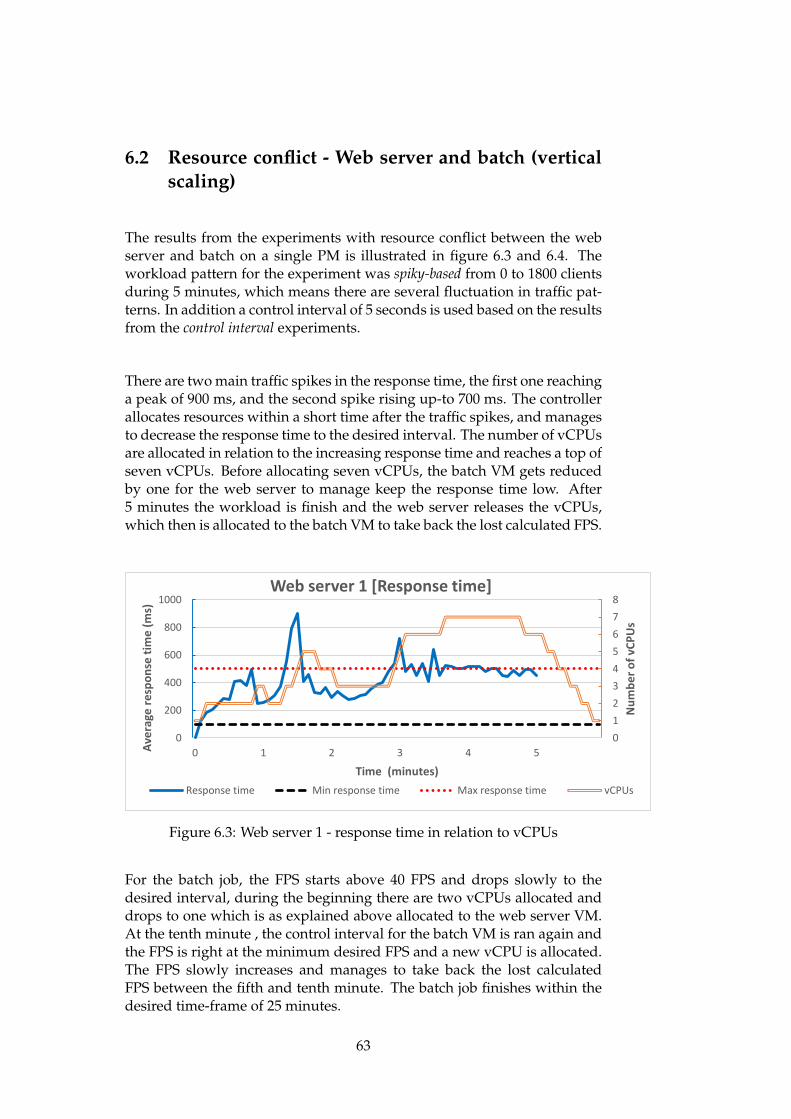
6.2 Resource conflict - Web server and batch (verticalscaling)
The results from the experiments with resource conflict between the webserver and batch on a single PM is illustrated in figure 6.3 and 6.4. Theworkload pattern for the experiment was spiky-based from 0 to 1800 clientsduring 5 minutes, which means there are several fluctuation in traffic pat-terns. In addition a control interval of 5 seconds is used based on the resultsfrom the control interval experiments.
There are two main traffic spikes in the response time, the first one reachinga peak of 900 ms, and the second spike rising up-to 700 ms. The controllerallocates resources within a short time after the traffic spikes, and managesto decrease the response time to the desired interval. The number of vCPUsare allocated in relation to the increasing response time and reaches a top ofseven vCPUs. Before allocating seven vCPUs, the batch VM gets reducedby one for the web server to manage keep the response time low. After5 minutes the workload is finish and the web server releases the vCPUs,which then is allocated to the batch VM to take back the lost calculated FPS.
0
1
2
3
4
5
6
7
8
0
200
400
600
800
1000
0 1 2 3 4 5
Nu
mb
er
of
vCP
Us
Ave
rage
re
spo
nse
tim
e (
ms)
Time (minutes)
Web server 1 [Response time]
Response time Min response time Max response time vCPUs
Figure 6.3: Web server 1 - response time in relation to vCPUs
For the batch job, the FPS starts above 40 FPS and drops slowly to thedesired interval, during the beginning there are two vCPUs allocated anddrops to one which is as explained above allocated to the web server VM.At the tenth minute , the control interval for the batch VM is ran again andthe FPS is right at the minimum desired FPS and a new vCPU is allocated.The FPS slowly increases and manages to take back the lost calculatedFPS between the fifth and tenth minute. The batch job finishes within thedesired time-frame of 25 minutes.
63

0
1
2
3
4
0
10
20
30
40
50
Nu
mb
er
of
vCP
Us
Ave
rage
FP
S
Time (minutes)
Batch-processing [Frames per second]
FPS Min desired FPS Max FPS Max desired FPS CPU cores
Figure 6.4: Batch-processing - FPS in relation to vCPUs
6.3 Resource conflict - Web server and batch (horizon-tal scaling)
With the second main experiment, resource conflict between web serverand batch leading to horizontal scaling. The trend-based workload patternis simulated in this experiment from 0 to 2700 clients during 10 minutes,which means the traffic increases up to 2700 simultaneous clients by theend of the test.
As illustrated in figure 6.5 and 6.6, the response time jumps to 3000 ms and4000 ms after three minutes, the number of vCPUs increases in relation tothe spikes in response time. Before allocating seven vCPUs, one core is re-moved from the batch VM, but still the response time is high and a newweb server is created on the second PM. The vCPUs then gets reduced tothe half, and the second web server get the same number of vCPU. Thenthe number of vCPUs increases on both of the web servers and manages todecrease the response time to the desired interval.
The batch VM starts right below 45 FPS, but the number of FPS reducesafter the web server takes one vCPU. The core is allocated back at the nextcontrol interval for the batch job. However the FPS is below the desired atthe tenth minute and then another vCPU is allocated. The FPS increasessteady and manages to take back the lost calculated FPS. The batch job fin-ishes within the desired time-frame of 25 minutes.
64
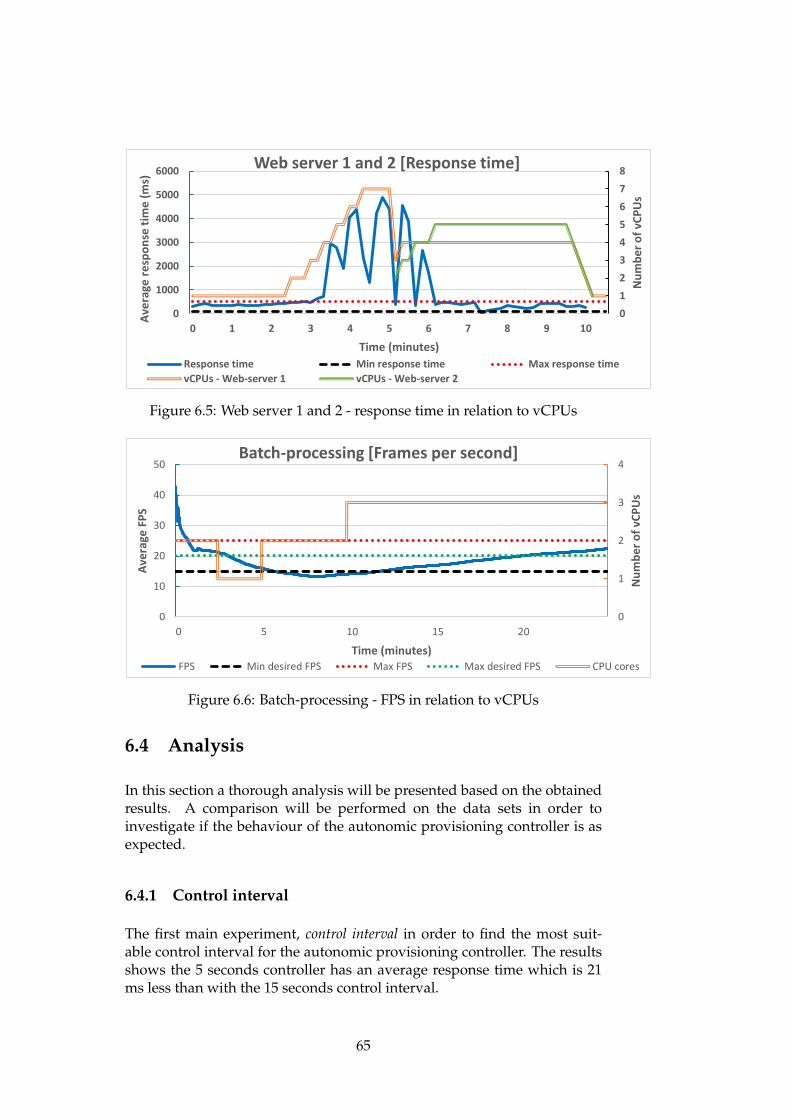
0
1
2
3
4
5
6
7
8
0
1000
2000
3000
4000
5000
6000
0 1 2 3 4 5 6 7 8 9 10
Nu
mb
er
of
vCP
Us
Ave
rage
re
spo
nse
tim
e (
ms)
Time (minutes)
Web server 1 and 2 [Response time]
Response time Min response time Max response time
vCPUs - Web-server 1 vCPUs - Web-server 2
Figure 6.5: Web server 1 and 2 - response time in relation to vCPUs
0
1
2
3
4
0
10
20
30
40
50
Nu
mb
er
of
vCP
Us
Ave
rage
FP
S
Time (minutes)
Batch-processing [Frames per second]
FPS Min desired FPS Max FPS Max desired FPS CPU cores
Figure 6.6: Batch-processing - FPS in relation to vCPUs
6.4 Analysis
In this section a thorough analysis will be presented based on the obtainedresults. A comparison will be performed on the data sets in order toinvestigate if the behaviour of the autonomic provisioning controller is asexpected.
6.4.1 Control interval
The first main experiment, control interval in order to find the most suit-able control interval for the autonomic provisioning controller. The resultsshows the 5 seconds controller has an average response time which is 21ms less than with the 15 seconds control interval.
65
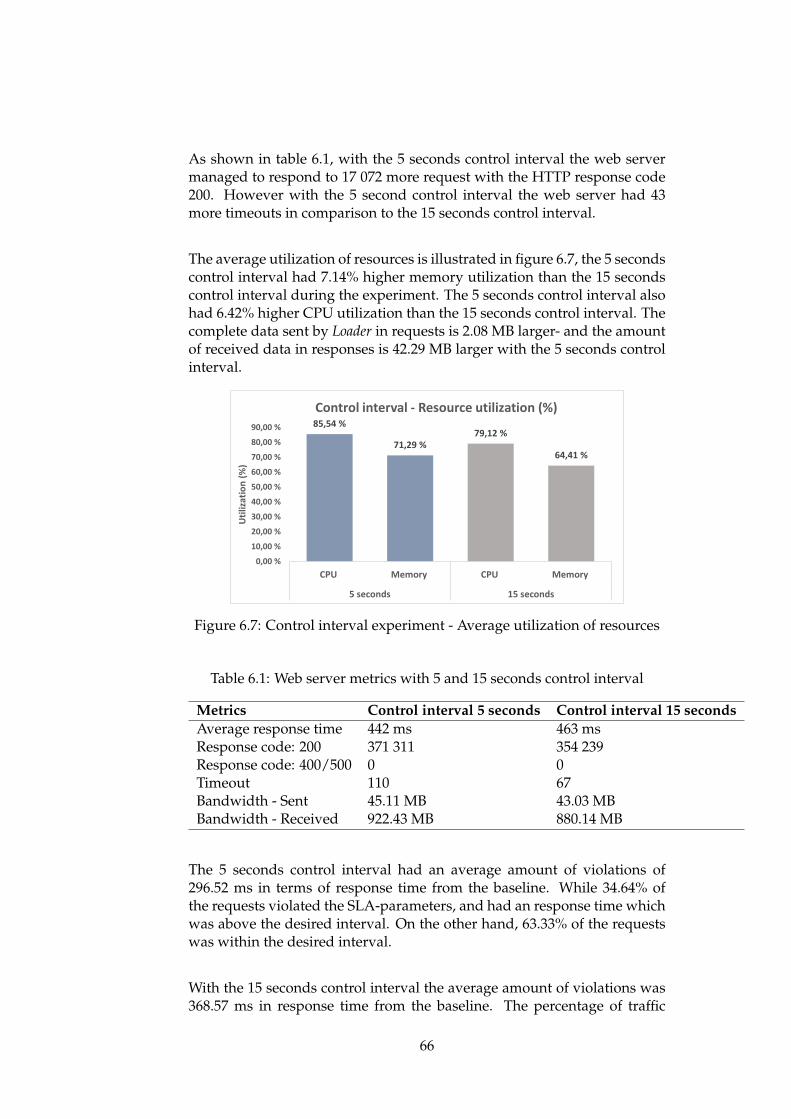
As shown in table 6.1, with the 5 seconds control interval the web servermanaged to respond to 17 072 more request with the HTTP response code200. However with the 5 second control interval the web server had 43more timeouts in comparison to the 15 seconds control interval.
The average utilization of resources is illustrated in figure 6.7, the 5 secondscontrol interval had 7.14% higher memory utilization than the 15 secondscontrol interval during the experiment. The 5 seconds control interval alsohad 6.42% higher CPU utilization than the 15 seconds control interval. Thecomplete data sent by Loader in requests is 2.08 MB larger- and the amountof received data in responses is 42.29 MB larger with the 5 seconds controlinterval.
85,54 %
71,29 %79,12 %
64,41 %
0,00 %
10,00 %
20,00 %
30,00 %
40,00 %
50,00 %
60,00 %
70,00 %
80,00 %
90,00 %
CPU Memory CPU Memory
5 seconds 15 seconds
Uti
lizat
ion
(%
)
Control interval - Resource utilization (%)
Figure 6.7: Control interval experiment - Average utilization of resources
Table 6.1: Web server metrics with 5 and 15 seconds control interval
Metrics Control interval 5 seconds Control interval 15 secondsAverage response time 442 ms 463 msResponse code: 200 371 311 354 239Response code: 400/500 0 0Timeout 110 67Bandwidth - Sent 45.11 MB 43.03 MBBandwidth - Received 922.43 MB 880.14 MB
The 5 seconds control interval had an average amount of violations of296.52 ms in terms of response time from the baseline. While 34.64% ofthe requests violated the SLA-parameters, and had an response time whichwas above the desired interval. On the other hand, 63.33% of the requestswas within the desired interval.
With the 15 seconds control interval the average amount of violations was368.57 ms in response time from the baseline. The percentage of traffic
66
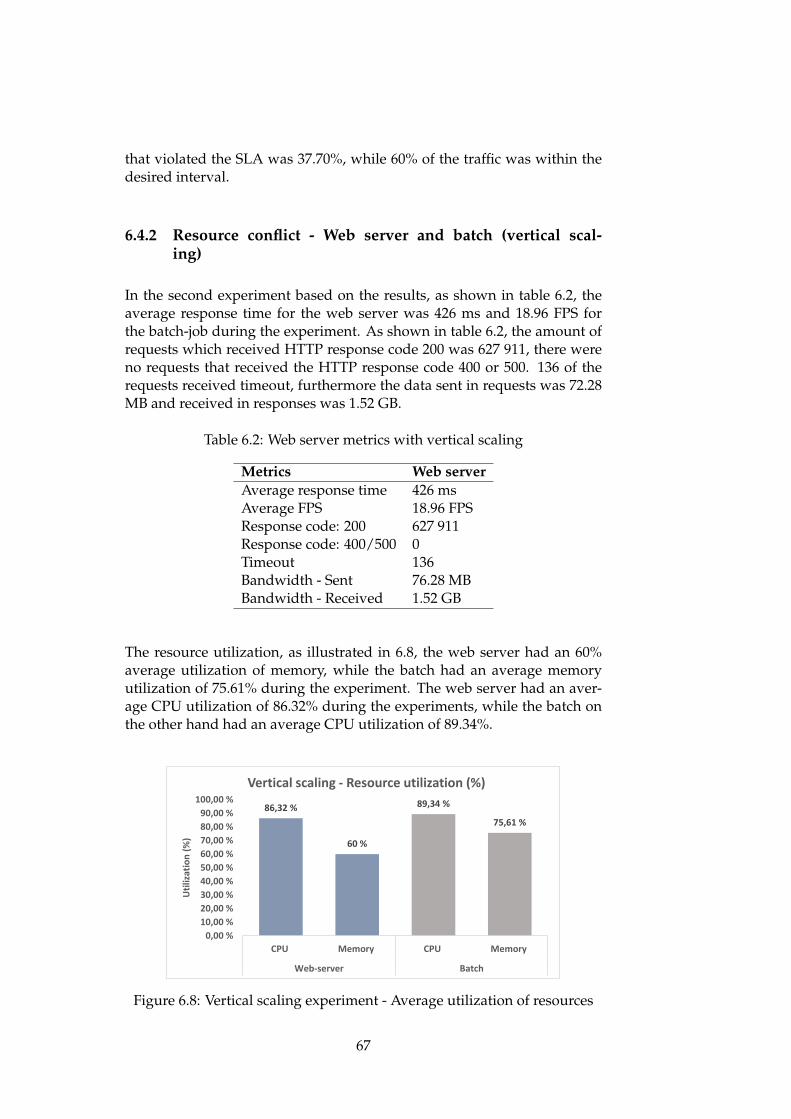
that violated the SLA was 37.70%, while 60% of the traffic was within thedesired interval.
6.4.2 Resource conflict - Web server and batch (vertical scal-ing)
In the second experiment based on the results, as shown in table 6.2, theaverage response time for the web server was 426 ms and 18.96 FPS forthe batch-job during the experiment. As shown in table 6.2, the amount ofrequests which received HTTP response code 200 was 627 911, there wereno requests that received the HTTP response code 400 or 500. 136 of therequests received timeout, furthermore the data sent in requests was 72.28MB and received in responses was 1.52 GB.
Table 6.2: Web server metrics with vertical scaling
Metrics Web serverAverage response time 426 msAverage FPS 18.96 FPSResponse code: 200 627 911Response code: 400/500 0Timeout 136Bandwidth - Sent 76.28 MBBandwidth - Received 1.52 GB
The resource utilization, as illustrated in 6.8, the web server had an 60%average utilization of memory, while the batch had an average memoryutilization of 75.61% during the experiment. The web server had an aver-age CPU utilization of 86.32% during the experiments, while the batch onthe other hand had an average CPU utilization of 89.34%.
86,32 %
60 %
89,34 %
75,61 %
0,00 %
10,00 %
20,00 %
30,00 %
40,00 %
50,00 %
60,00 %
70,00 %
80,00 %
90,00 %
100,00 %
CPU Memory CPU Memory
Web-server Batch
Uti
lizat
ion
(%
)
Vertical scaling - Resource utilization (%)
Figure 6.8: Vertical scaling experiment - Average utilization of resources
67
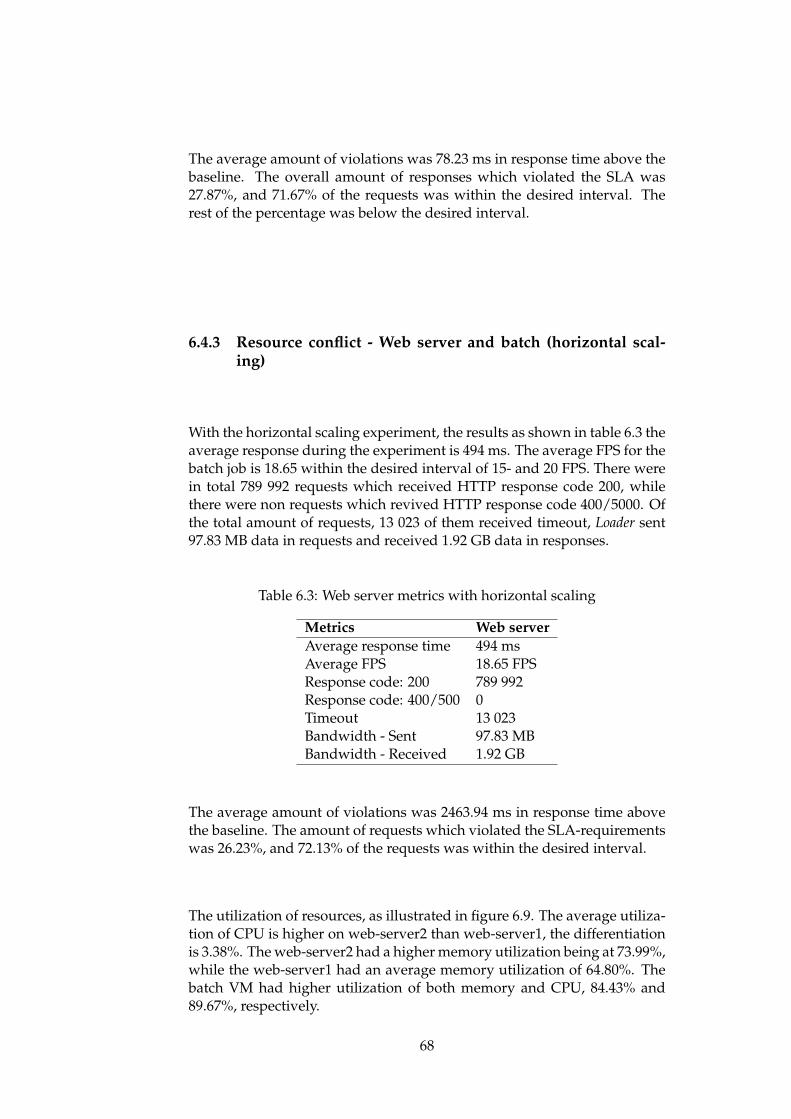
The average amount of violations was 78.23 ms in response time above thebaseline. The overall amount of responses which violated the SLA was27.87%, and 71.67% of the requests was within the desired interval. Therest of the percentage was below the desired interval.
6.4.3 Resource conflict - Web server and batch (horizontal scal-ing)
With the horizontal scaling experiment, the results as shown in table 6.3 theaverage response during the experiment is 494 ms. The average FPS for thebatch job is 18.65 within the desired interval of 15- and 20 FPS. There werein total 789 992 requests which received HTTP response code 200, whilethere were non requests which revived HTTP response code 400/5000. Ofthe total amount of requests, 13 023 of them received timeout, Loader sent97.83 MB data in requests and received 1.92 GB data in responses.
Table 6.3: Web server metrics with horizontal scaling
Metrics Web serverAverage response time 494 msAverage FPS 18.65 FPSResponse code: 200 789 992Response code: 400/500 0Timeout 13 023Bandwidth - Sent 97.83 MBBandwidth - Received 1.92 GB
The average amount of violations was 2463.94 ms in response time abovethe baseline. The amount of requests which violated the SLA-requirementswas 26.23%, and 72.13% of the requests was within the desired interval.
The utilization of resources, as illustrated in figure 6.9. The average utiliza-tion of CPU is higher on web-server2 than web-server1, the differentiationis 3.38%. The web-server2 had a higher memory utilization being at 73.99%,while the web-server1 had an average memory utilization of 64.80%. Thebatch VM had higher utilization of both memory and CPU, 84.43% and89.67%, respectively.
68

82,15 %
64,80 %
85,38 %
73,99 %
89,67 %84,32 %
0,00 %
10,00 %
20,00 %
30,00 %
40,00 %
50,00 %
60,00 %
70,00 %
80,00 %
90,00 %
100,00 %
CPU Memory CPU Memory CPU Memory
Web-server1 Web-server2 Batch
Uti
lizat
ion
(%
)Horizontal scaling - Resource utilization (%)
Figure 6.9: Horizontal scaling experiment - Average utilization of resources
69

70

Chapter 7
Discussion
This chapters reflects the results from the different stages described in thisstudy, furthermore highlighting both theoretical and practical challengesduring the project. In addition, improvements of the developed autonomicprovisioning controller are suggested and future work is proposed.
7.1 The problem statement
First of all, the main goal of this project was to design and implement aautonomic provisioning controller, as described in the approach chapter 3.The problem statement has been the main focus during the project periodand for convenience the research questions have been listed below:
• How can we create an autonomic provisioning controller based on elementsfrom control theory to increase server utilization, and at the same time exposeavailable resources to ensure QoS of real-time and non-real applications?
• How to coordinate vertical and horizontal scaling for better resourceallocation?
• How to benefit from application level metrics in order to efficiently provisionresources to interactive and non-interactive applications?
In order to adequately answer the problem statement, several approacheshave been considered during the design stage of the project. To addressthe problem statement, an autonomic provisioning controller has beendesigned and implemented based on elements from control theory withthe focus on the QoS of the applications. Several initial experimentshas been conducted to have a fully understanding of the environmentcapabilities.
71
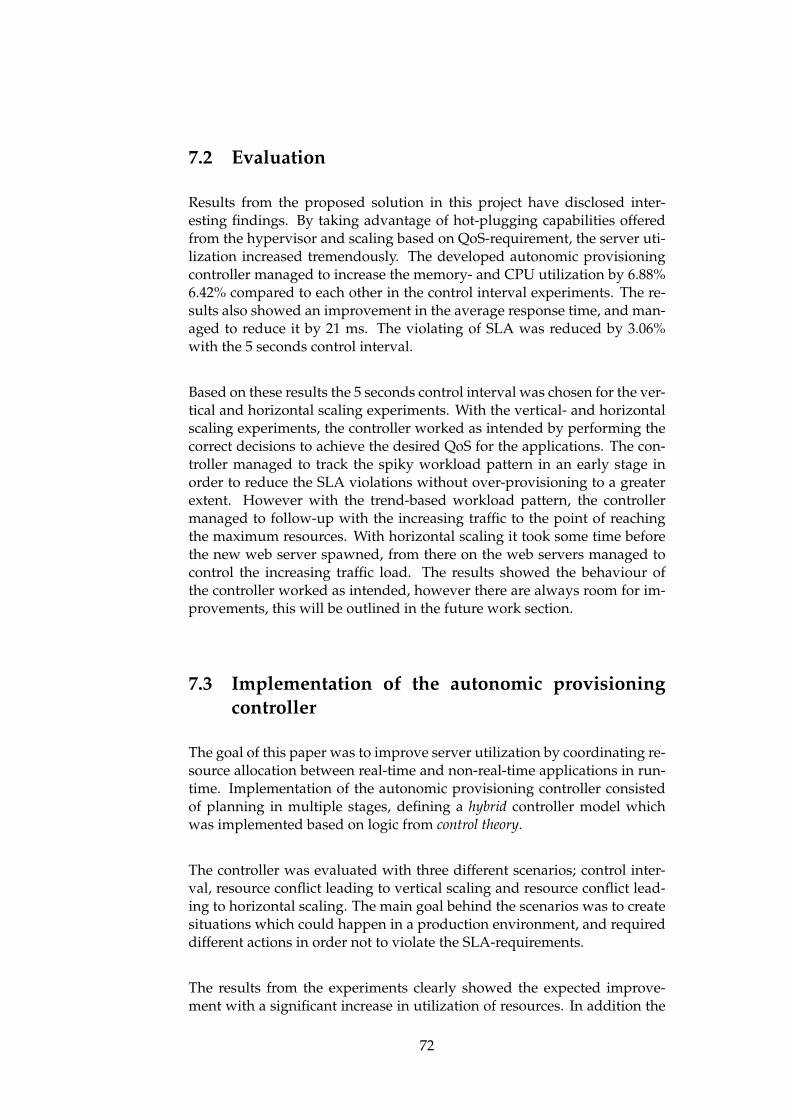
7.2 Evaluation
Results from the proposed solution in this project have disclosed inter-esting findings. By taking advantage of hot-plugging capabilities offeredfrom the hypervisor and scaling based on QoS-requirement, the server uti-lization increased tremendously. The developed autonomic provisioningcontroller managed to increase the memory- and CPU utilization by 6.88%6.42% compared to each other in the control interval experiments. The re-sults also showed an improvement in the average response time, and man-aged to reduce it by 21 ms. The violating of SLA was reduced by 3.06%with the 5 seconds control interval.
Based on these results the 5 seconds control interval was chosen for the ver-tical and horizontal scaling experiments. With the vertical- and horizontalscaling experiments, the controller worked as intended by performing thecorrect decisions to achieve the desired QoS for the applications. The con-troller managed to track the spiky workload pattern in an early stage inorder to reduce the SLA violations without over-provisioning to a greaterextent. However with the trend-based workload pattern, the controllermanaged to follow-up with the increasing traffic to the point of reachingthe maximum resources. With horizontal scaling it took some time beforethe new web server spawned, from there on the web servers managed tocontrol the increasing traffic load. The results showed the behaviour ofthe controller worked as intended, however there are always room for im-provements, this will be outlined in the future work section.
7.3 Implementation of the autonomic provisioningcontroller
The goal of this paper was to improve server utilization by coordinating re-source allocation between real-time and non-real-time applications in run-time. Implementation of the autonomic provisioning controller consistedof planning in multiple stages, defining a hybrid controller model whichwas implemented based on logic from control theory.
The controller was evaluated with three different scenarios; control inter-val, resource conflict leading to vertical scaling and resource conflict lead-ing to horizontal scaling. The main goal behind the scenarios was to createsituations which could happen in a production environment, and requireddifferent actions in order not to violate the SLA-requirements.
The results from the experiments clearly showed the expected improve-ment with a significant increase in utilization of resources. In addition the
72

average response time was in all cases within the desired specified interval.Furthermore, the violation varied between the experiments. However dueto high load in all of the experiments in a short amount of time was thereason for a somehow high violation in some cases.
The implementation of the controller in the design stage had an early focuson coordinating the memory and CPU sub-controllers with the proposedhybrid controller model in order to efficiently provision resources to the in-teractive and non-interactive applications. The resource utilization duringthe experiments was in most cases between 70% and 80%. The validity ofthe results was confirmed during the initial experiments, e.g. the actualachieved performance when allocating vCPU cores with Hyper-Threadingenabled. In addition, performing the experiments on both of the PMs andanalyzing the collected measurement metrics.
The implementation of the controller also consisted of a lot of time spent intesting and performing optimizing. The decisions made were not alwayscorrect, as resources were reduced when the response time was above de-sired. In order to achieve the desired state of the environment before per-forming each experiment, several actions needed to be conducted from de-stroying the VMs and recreating them to cleaning log files.
However the results were not easily achieved as several challenges had tobe faced during the project in order to properly configure the environmentand get the behaviour of the controller to work as intended.
7.3.1 Challenges during the implementation
During the project period there has been a lot of technical challengeswith the implementation. One of the most challenging problems duringthe project was developing and debugging the code, the amount of if-statements required a lot of logic to be in place in the initial design beforethe actual development.
During the configuration of the environment the network set-up for theVMs was challenging and different solutions had to be thought out. Sincethe BIOS version of the PMs did not support Ubuntu 14.04 LTS, the 12.04version had to be installed. The 12.04 version of Ubuntu only supportedXen version up-to 4.1, while Open vSwitch is supported from Xen 4.3 andonwards. Because of this limitation, a bridge between the PMs had to becreated with its own subnet.
73
7.3.2 Other considerations and limitations
Migration limitations
The initial plan of the project was to perform horizontal scaling by livemigrating VMs to the second PM. This required a shared-storage to becreated where the disk-images had to be placed. A NFS share was createdin order to accommodate the VMs on both of the PMs, however duringthe experimental phase, the VMs started to break down due to errors inmemory, when the live-migration was performed. After asking questionsin communities and getting replies that the bugfix for the error did notmake it into the version of Xen version that was used. This was a hugesetback for the project since horizontal scaling was a huge part of it, afterfurther discussion a new plan was made. The solution was then to spawna web-server on the second PM instead of performing live-migration whenthere was a limit of resources on the first PM. However, a lot of time waslost in implementing the solution and preparing the environments and thisreduced the overall progress of the work. In retrospect, migration of theweb server would not been an ideal solution since spawning a new on thesecond PM is faster to perform, however migration of the batch VM couldhave been a solution when there is a limit of resources.
Hyper-Threading
The PMs used in the thesis, both had Intel processor with Hyper-Threading, which consisted of 8 physical- and 8 logical CPUs. When per-forming vertical scaling there was no control whether a virtual or physicalCPU was allocated. Even though initial experiment on parallel comput-ing was performed to observe how much the performance increased, andthe results showed that it took double the time to execute a task in parallelfrom 8 to 16 vCPUs in comparison to 1 to 8 vCPUs. If there had been moretime in the project, a comparison by performing the experiments on a AMDprocessor would been highly suggested in order to observe how much theresults varied.
Workload patterns
To create more realistic workload patterns and for a longer time-period.Since web-traffic varies during a day with peaks at specific times. It wouldbe ideally to create some similar scenarios in order to reduce the violationrate. The conducted experiments for the web server lasted for 5 and 10minutes with high load during the experiment period.
74

7.4 Future work and improvement suggestions
There are always a potential for improvement and this work certainly isnot an exception. Several features and functions can be be developed in or-der to improve and expand the capabilities of the autonomic provisioningcontroller.
Some main improvements of the autonomic controller consist of more logicinto the controller, scaling is performed static, but this has shown good re-sults. However implementing solutions as PID controller as explained be-low would help in terms of allocating resources based on the QoS metrics.To illustrate, e.g, if the response time increases by 200 ms every second, aproportional based logic can be implemented to predict and allocate theneeded resources for the next seconds. This would help to remove some ofthe spikes in response time as observed in the results.
In addition with horizontal scaling, instead of using round-robin-based dis-tribution of traffic with the load-balancing, a solution for weight-based dis-tribution based on capacity of the web servers. This solution would bemore ideally, proportional-based distribution would reduce the fluctuationin the response time. Traffic will be distributed equally based on amountof resources and this would give a better QoS of the applications. Anothersolution would be to distribute the traffic load based on each of the webservers local response time. If the response time is low more traffic can bedistributed to the server, while if the response time is high less traffic is dis-tributed.
Machine learning could be implemented in order to perform peak-detection,the approach in this thesis focuses on reactive actions, however in order todetect peaks in the traffic and to achieve proactive decisions to limit theSLA violations, prediction has to be implemented with machine learning.
Bin packing can be used in order to improve consolidation when perform-ing horizontal down-scaling. However this requires a method to knowwhen the system is stable before the consolidation is performed. Whenthe applications are satisfying the QoS requirements, the consolidating canbe performed from two to one web server.
PID is an acronym for the mathematical terms proportional–integral–derivative,and the PID controller works as control theory with a control loop feedbackmechanism. Implementing PID controller in order to adjust resources, thecontroller provides formal guarantees on the properties of the controller.However the problem with PID controller is that the same actions are per-formed if the measured value is above or below the action point. In ourcase the more important is to at any cost reduce SLA violations, in addi-
75

tion PID requires a lot of testing and the values has to be tuned in order toachieve the desired results.
Reinforcement learning (RL) is a technique which consist of trial-and-errors methods [54]. Using RL, different actions are performed duringnumerous system states and learns from the consequences of each action.In this project scaling is performed based on performance and capacity,however since applications needs an arbitrary combination of resourcesin order to achieve the desired SLA-requirements. RL can be adoptedto dynamic environments to support distributed controllers in order tosuit complex, and large-scale systems. RL offers potential benefits inautonomic computing and this is highly needed in the context of a webserver environment.
7.5 Potential impact of the thesis
This thesis started with the desire to increase server utilization in data cen-tres by using techniques such as, hot-plugging to perform efficient decision-making. Vertical elasticity is recognized as a key enabler for efficient re-source utilization of cloud infrastructure due to fine-grained resource pro-visioning, fractions of a CPU can be leased for as short as a few seconds.However, at the time of writing there is still limited hot-plugging supportoffered by several hypervisor vendors, as illustrated in table 2.1.
In this thesis, an autonomic provisioning controller has been designed, im-plemented and tested in several scenarios. The controller has been eval-uated in terms of improvements and future work. The controller is SLA-driven by facilitating QoS of heterogeneous applications using a hybridcontroller model. Both vertical- and horizontal scaling has been evaluated.While some recent work has focused on vertical scaling (section 2.11) to im-prove QoS of applications, however the proposed solution is scalable andtakes horizontal scaling of the environment into consideration.
It is worth mentioning that we currently are working on a research articlein order to disseminate the results of the current work.
76
Chapter 8
Conclusion
The aim of this thesis was to investigate how server utilization in data cen-tres could be improved by coordinating vertical and horizontal scaling. Themain purpose was to find out how resources could be managed more effi-ciently.
The problem statement was addressed by designing and implementing anautonomic provisioning controller based on elements from control theory.The hybrid controller model was chosen as a foundation for the controllerafter evaluating several models. The experiments were conducted on twophysical machines running Xen Hypervisor with support for hot-pluggingof resources to tackle load bursts of heterogeneous applications. Several ex-periments were conducted, consisting of both vertical and horizontal scal-ing to achieve the desired QoS of the real-time and non-real-time applica-tions. The application level metrics were used in decision-making in orderto efficiently provision resources to the applications.
The analysis of the results showed that the proposed solution was able toachieve the desired average response time for the web application across allof the experiments. In addition, the batch job managed to finish the work-load within the desired time. However, due to high traffic load during theexperiments, violation of SLA was somehow high. The average utiliza-tion of CPU across all experiments was 83.70% for the web application and89.51% for the batch, while average memory utilization was 67.52% and74.78% for the web server and batch, respectively.
Further testing with more diverse workload patterns and several improve-ments have been suggested for the future work , such as adopting reinforce-ment learning into the controller to achieve prediction-based detection oftraffic flows.
77

78
Bibliography
[1] Minqi Zhou et al. “Security and Privacy in Cloud Computing:A Survey.” In: Semantics Knowledge and Grid (SKG), 2010 SixthInternational Conference on. Nov. 2010, pp. 105–112. DOI: 10.1109/SKG.2010.19.
[2] Louis Columbus. Roundup Of Small & Medium Business Cloud Com-puting Forecasts And Market Estimates, 2015. May 2015. URL: http://www.forbes.com/sites/louiscolumbus/2015/05/04/roundup-of- small-medium - business - cloud - computing - forecasts - and - market - estimates -2015/#4ae123a81646.
[3] Kaplan M. James, Forrest William and Kindler Noah. Revolutionizingdata center efficiency. July 2008. URL: http : / / www . mckinsey . com /clientservice / bto / pointofview / pdf / revolutionizing _ data _ center _efficiency.pdf.
[4] A. Vasan et al. “Worth their watts? - an empirical study of datacenterservers.” In: High Performance Computer Architecture (HPCA), 2010IEEE 16th International Symposium on. Jan. 2010, pp. 1–10. DOI: 10 .1109/HPCA.2010.5463056.
[5] Charles Reiss et al. “Heterogeneity and Dynamicity of Clouds atScale: Google Trace Analysis.” In: Proceedings of the Third ACMSymposium on Cloud Computing. SoCC ’12. San Jose, California: ACM,2012, 7:1–7:13. ISBN: 9781450317610. DOI: 10.1145/2391229.2391236.URL: http://doi.acm.org/10.1145/2391229.2391236.
[6] Urs Hoelzle and Luiz Andre Barroso. The Datacenter As a Computer:An Introduction to the Design of Warehouse-Scale Machines. 1st. Mor-gan and Claypool Publishers, 2009, pp. 54–57. ISBN: 159829556X,9781598295566.
[7] Marcus Carvalho et al. “Long-term SLOs for Reclaimed CloudComputing Resources.” In: Proceedings of the ACM Symposium onCloud Computing. SOCC ’14. Seattle, WA, USA: ACM, 2014, 20:1–20:13. ISBN: 9781450332521. DOI: 10.1145/2670979.2670999. URL: http://doi.acm.org/10.1145/2670979.2670999.
[8] Whitney Josh and Delforge Pierre. Data Center Efficiency Assessment.Aug. 2014. URL: http : / / www . nrdc . org / energy / files / data - center -efficiency-assessment-IP.pdf.
79

[9] David Lo et al. “Towards Energy Proportionality for Large-scaleLatency-critical Workloads.” In: Proceeding of the 41st Annual Inter-national Symposium on Computer Architecuture. ISCA ’14. Minneapolis,Minnesota, USA: IEEE Press, 2014, pp. 301–312. ISBN: 9781479943944.URL: http://dl.acm.org/citation.cfm?id=2665671.2665718.
[10] E.B. Lakew et al. “Towards Faster Response Time Models for VerticalElasticity.” In: Utility and Cloud Computing (UCC), 2014 IEEE/ACM7th International Conference on. Dec. 2014, pp. 560–565. DOI: 10.1109/UCC.2014.86.
[11] Germán Moltó et al. “Elastic Memory Management of VirtualizedInfrastructures for Applications with Dynamic Memory Require-ments.” In: Procedia Computer Science 18 (2013). 2013 InternationalConference on Computational Science, pp. 159–168. ISSN: 1877-0509.DOI: http : / / dx . doi . org / 10 . 1016 / j . procs . 2013 . 05 . 179. URL: http ://www.sciencedirect.com/science/article/pii/S1877050913003220.
[12] F.B. Shaikh and S. Haider. “Security threats in cloud computing.”In: Internet Technology and Secured Transactions (ICITST), 2011 Inter-national Conference for. Dec. 2011, pp. 214–219.
[13] P. Hofmann and D. Woods. “Cloud Computing: The Limits of PublicClouds for Business Applications.” In: Internet Computing, IEEE 14.6(Nov. 2010), pp. 90–93. ISSN: 1089-7801. DOI: 10.1109/MIC.2010.136.
[14] Oracle. Brief History of Virtualization. URL: https://docs.oracle.com/cd/E26996_01/E18549/html/VMUSG1010.html.
[15] diegocalleja. Linux 2 6 20. Sept. 2007. URL: http://kernelnewbies.org/Linux_2_6_20.
[16] S.G. Soriga and M. Barbulescu. “A comparison of the performanceand scalability of Xen and KVM hypervisors.” In: Networking inEducation and Research, 2013 RoEduNet International Conference 12thEdition. Sept. 2013, pp. 1–6. DOI: 10.1109/RoEduNet.2013.6714189.
[17] Sisu Xi et al. “RT-Xen: towards real-time hypervisor schedulingin xen.” In: Embedded Software (EMSOFT), 2011 Proceedings of theInternational Conference on. IEEE. 2011, pp. 39–48.
[18] Emmanuel Ackaouy. [Xen-devel] New CPU scheduler w/ SMP loadbalancer. May 2006. URL: http : / / old - list - archives . xenproject . org /archives/html/xen-devel/2006-06/msg00935.html.
[19] Wiki Xen. Credit Scheduler. [Online; accessed 3-February-2016]. 2016.URL: http://wiki.xen.org/wiki/Credit_Scheduler.
[20] Diwaker Gupta, Rob Gardner, and Ludmila Cherkasova. “Xenmon:Qos monitoring and performance profiling tool.” In: Hewlett-PackardLabs, Tech. Rep. HPL-2005-187 (2005).
80

[21] Diego Ongaro, Alan L. Cox, and Scott Rixner. “Scheduling I/Oin Virtual Machine Monitors.” In: Proceedings of the Fourth ACMSIGPLAN/SIGOPS International Conference on Virtual Execution Envi-ronments. VEE ’08. Seattle, WA, USA: ACM, 2008, pp. 1–10. ISBN:9781595937964. DOI: 10.1145/1346256.1346258. URL: http://doi.acm.org/10.1145/1346256.1346258.
[22] M. Tim Jones. Inside the Linux 2.6 Completely Fair Scheduler. Dec. 2009.URL: http://www.ibm.com/developerworks/library/l- completely- fair-scheduler/.
[23] C.S. Wong et al. “Fairness and interactive performance of O(1) andCFS Linux kernel schedulers.” In: Information Technology, 2008. ITSim2008. International Symposium on. Vol. 4. Aug. 2008, pp. 1–8. DOI: 10.1109/ITSIM.2008.4631872.
[24] Ingo Molnar. [patch] Modular Scheduler Core and Completely FairScheduler [CFS]. [Online; accessed 7-February-2016]. Apr. 2007. URL:http://lwn.net/Articles/230501/.
[25] Sangar Jitendra. Scheduling : O(1) and Completely Fair Scheduler(CFS). [Online; accessed 8-February-2016]. Mar. 2014. URL: http : //algorithmsandme . in / 2014 / 03 / scheduling - o1 - and - completely - fair -scheduler-cfs/.
[26] S. Dutta et al. “SmartScale: Automatic Application Scaling in Enter-prise Clouds.” In: Cloud Computing (CLOUD), 2012 IEEE 5th Interna-tional Conference on. June 2012, pp. 221–228. DOI: 10 .1109/CLOUD.2012.12.
[27] Narayanan Gopalakrishnan. Hot-Plugging CPU’s to conserve power.[Online; accessed 10-February-2016]. Jan. 2013. URL: http : / /linuxforthenew.blogspot.no/2013/01/hot- plugging- cpus- to- conserve-power.html.
[28] Zhu Guihua. [libvirt] [RFC PATCH v2 00/12] qemu: add support tohot-plug/unplug cpu device. [Online; accessed 10-February-2016]. Feb.2015. URL: https://www.redhat.com/archives/libvir-list/2015-February/msg00084.html.
[29] S. Farokhi et al. “Coordinating CPU and Memory Elasticity Con-trollers to Meet Service Response Time Constraints.” In: Cloud andAutonomic Computing (ICCAC), 2015 International Conference on. Sept.2015, pp. 69–80. DOI: 10.1109/ICCAC.2015.20.
[30] Marian Turowski and Alexander Lenk. “Service-Oriented Comput-ing - ICSOC 2014 Workshops: WESOA; SeMaPS, RMSOC, KASA,ISC, FOR-MOVES, CCSA and Satellite Events, Paris, France, Novem-ber 3-6, 2014, Revised Selected Papers.” In: ed. by Farouk Toumaniet al. Cham: Springer International Publishing, 2015. Chap. VerticalScaling Capability of OpenStack, pp. 351–362. ISBN: 9783319228853.DOI: 10.1007/978-3-319-22885-3_30. URL: http://dx.doi.org/10.1007/978-3-319-22885-3_30.
81
[31] Jui-Hao Chiang, Han-Lin Li, and Tzi-cker Chiueh. “Working Set-based Physical Memory Ballooning.” In: Proceedings of the 10thInternational Conference on Autonomic Computing (ICAC 13). San Jose,CA: USENIX, 2013, pp. 95–99. ISBN: 9781931971027. URL: https : / /www .usenix . org/ conference/ icac13/ technical - sessions /presentation/chiang.
[32] George Dunlap. Ballooning, rebooting, and the feature you’ve never heardof. [Online; accessed 16-February-2016]. Feb. 2014. URL: https://blog.xenproject . org /2014/02/14/ballooning - rebooting - and - the - feature -youve-never-heard-of/.
[33] Tania Lorido-Botran, Jose Miguel-Alonso, and Jose A. Lozano. “AReview of Auto-scaling Techniques for Elastic Applications in CloudEnvironments.” In: Journal of Grid Computing 12.4 (2014), pp. 559–592.ISSN: 1572-9184. DOI: 10.1007/s10723-014-9314-7. URL: http://dx.doi.org/10.1007/s10723-014-9314-7.
[34] Karl Johan Åström. “Challenges in control education.” In: Proceedingsof the 7th IFAC Symposium on Advances in Control Education (ACE)’,Madrid, Spain. 2006.
[35] Tarek Abdelzaher et al. “Performance Modeling and Engineering.”In: ed. by Zhen Liu and Cathy H. Xia. Boston, MA: Springer US,2008. Chap. Introduction to Control Theory And Its Application toComputing Systems, pp. 185–215. ISBN: 9780387793610. DOI: 10.1007/978-0-387-79361-0_7. URL: http://dx.doi.org/10.1007/978-0-387-79361-0_7.
[36] Wiki Archlinux. libvirt. [Online; accessed 12-February-2016]. n.d.URL: https://wiki.archlinux.org/index.php/Libvirt.
[37] Anju Bala and Inderveer Chana. “Fault tolerance-challenges, tech-niques and implementation in cloud computing.” In: IJCSI Interna-tional Journal of Computer Science Issues 9.1 (2012), pp. 1694–0814.
[38] Lorin. Understanding the different test types. July 2014. URL: https ://loader.io/blog/2014/07/16/understanding-different-test-types/.
[39] Cristian Klein. Closed and open HTTP traffic generator. [Online; ac-cessed 12-February-2016]. (n.d.) URL: https : / / github . com / cloud -control/httpmon.
[40] S. Farokhi et al. “Performance-Based Vertical Memory Elasticity.” In:Autonomic Computing (ICAC), 2015 IEEE International Conference on.July 2015, pp. 151–152. DOI: 10.1109/ICAC.2015.51.
[41] Tao Chen and Rami Bahsoon. “Self-adaptive and Sensitivity-awareQoS Modeling for the Cloud.” In: Proceedings of the 8th InternationalSymposium on Software Engineering for Adaptive and Self-ManagingSystems. SEAMS ’13. San Francisco, California: IEEE Press, 2013,pp. 43–52. ISBN: 9781467344012. URL: http : / / dl . acm . org / citation .cfm?id=2663546.2663556.
82

[42] S. Sivasubramanian. “Scalable hosting of web applications.” Doctoraldissertation. VU University Amsterdam, Netherlands, 2007. URL:http://hdl.handle.net/1871/10753.
[43] C. Stewart, M. Leventi, and Kai Shen. “Empirical examination of acollaborative web application.” In: Workload Characterization, 2008.IISWC 2008. IEEE International Symposium on. Sept. 2008, pp. 90–96.DOI: 10.1109/IISWC.2008.4636094.
[44] Timothy Wood et al. “Profiling and Modeling Resource Usage of Vir-tualized Applications.” In: Proceedings of the 9th ACM/IFIP/USENIXInternational Conference on Middleware. Middleware ’08. Leuven, Bel-gium: Springer-Verlag New York, Inc., 2008, pp. 366–387. ISBN:3540898557. URL: http://dl.acm.org/citation.cfm?id=1496950.1496973.
[45] Rajkumar Buyya et al. “Cloud computing and emerging {IT} plat-forms: Vision, hype, and reality for delivering computing as the 5thutility.” In: Future Generation Computer Systems 25.6 (2009), pp. 599–616. ISSN: 0167-739X. DOI: http : / / dx . doi . org / 10 . 1016 / j . future .2008 . 12 . 001. URL: http : / /www . sciencedirect . com/ science / article /pii/S0167739X08001957.
[46] Soodeh Farokhi. “Quality of service control mechanism in cloudcomputing environments.” Doctoral dissertation. Vienna Universityof Technology, Dec. 2015.
[47] David Lo et al. “Heracles: Improving Resource Efficiency at Scale.”In: SIGARCH Comput. Archit. News 43.3 (June 2015), pp. 450–462.ISSN: 0163-5964. DOI: 10 . 1145 / 2872887 . 2749475. URL: http : / / doi .acm.org/10.1145/2872887.2749475.
[48] S. Spinner et al. “Proactive Memory Scaling of Virtualized Applica-tions.” In: Cloud Computing (CLOUD), 2015 IEEE 8th International Con-ference on. June 2015, pp. 277–284. DOI: 10.1109/CLOUD.2015.45.
[49] L. Yazdanov and C. Fetzer. “Vertical Scaling for Prioritized VMsProvisioning.” In: Cloud and Green Computing (CGC), 2012 SecondInternational Conference on. Nov. 2012, pp. 118–125. DOI: 10.1109/CGC.2012.108.
[50] Albert Greenberg et al. “The Cost of a Cloud: Research Problemsin Data Center Networks.” In: SIGCOMM Comput. Commun. Rev.39.1 (Dec. 2008), pp. 68–73. ISSN: 0146-4833. DOI: 10.1145/1496091.1496103. URL: http://doi.acm.org/10.1145/1496091.1496103.
[51] Nikolay Grozev and Rajkumar Buyya. “Multi-Cloud Provisioningand Load Distribution for Three-Tier Applications.” In: ACM Trans.Auton. Adapt. Syst. 9.3 (Oct. 2014), 13:1–13:21. ISSN: 1556-4665. DOI:10.1145/2662112. URL: http://doi.acm.org/10.1145/2662112.
[52] Peter Bodik et al. “Characterizing, Modeling, and Generating Work-load Spikes for Stateful Services.” In: Proceedings of the 1st ACM Sym-posium on Cloud Computing. SoCC ’10. Indianapolis, Indiana, USA:ACM, 2010, pp. 241–252. ISBN: 9781450300360. DOI: 10.1145/1807128.1807166. URL: http://doi.acm.org/10.1145/1807128.1807166.
83

[53] Clay James. Forget application response time “standards” – it’s all aboutthe human reaction. May 2014. URL: http ://me. riverbed .com/blogs/human-reaction-drives-application-response-time-standards.html.
[54] G. Tesauro et al. “A Hybrid Reinforcement Learning Approachto Autonomic Resource Allocation.” In: 2006 IEEE InternationalConference on Autonomic Computing. June 2006, pp. 65–73. DOI: 10 .1109/ICAC.2006.1662383.
84

Appendices
85

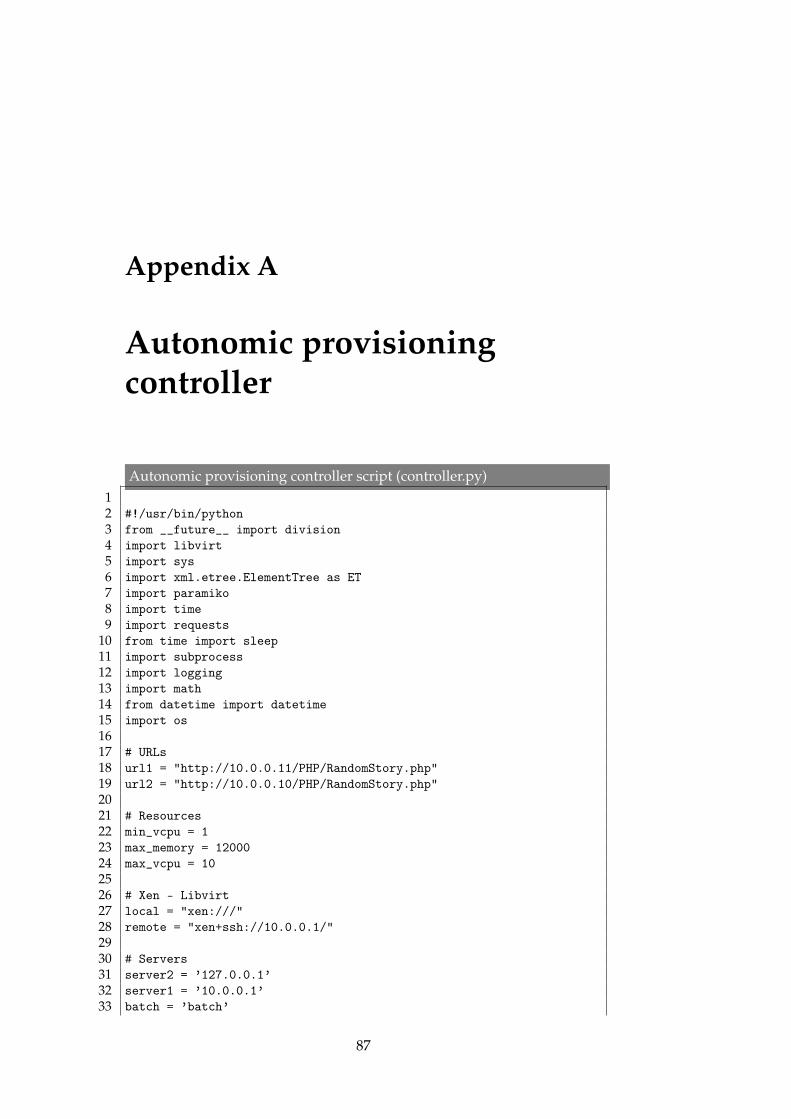
Appendix A
Autonomic provisioningcontroller
Autonomic provisioning controller script (controller.py)12 #!/usr/bin/python3 from __future__ import division4 import libvirt5 import sys6 import xml.etree.ElementTree as ET7 import paramiko8 import time9 import requests
10 from time import sleep11 import subprocess12 import logging13 import math14 from datetime import datetime15 import os1617 # URLs18 url1 = "http://10.0.0.11/PHP/RandomStory.php"19 url2 = "http://10.0.0.10/PHP/RandomStory.php"2021 # Resources22 min_vcpu = 123 max_memory = 1200024 max_vcpu = 102526 # Xen - Libvirt27 local = "xen:///"28 remote = "xen+ssh://10.0.0.1/"2930 # Servers31 server2 = ’127.0.0.1’32 server1 = ’10.0.0.1’33 batch = ’batch’
87
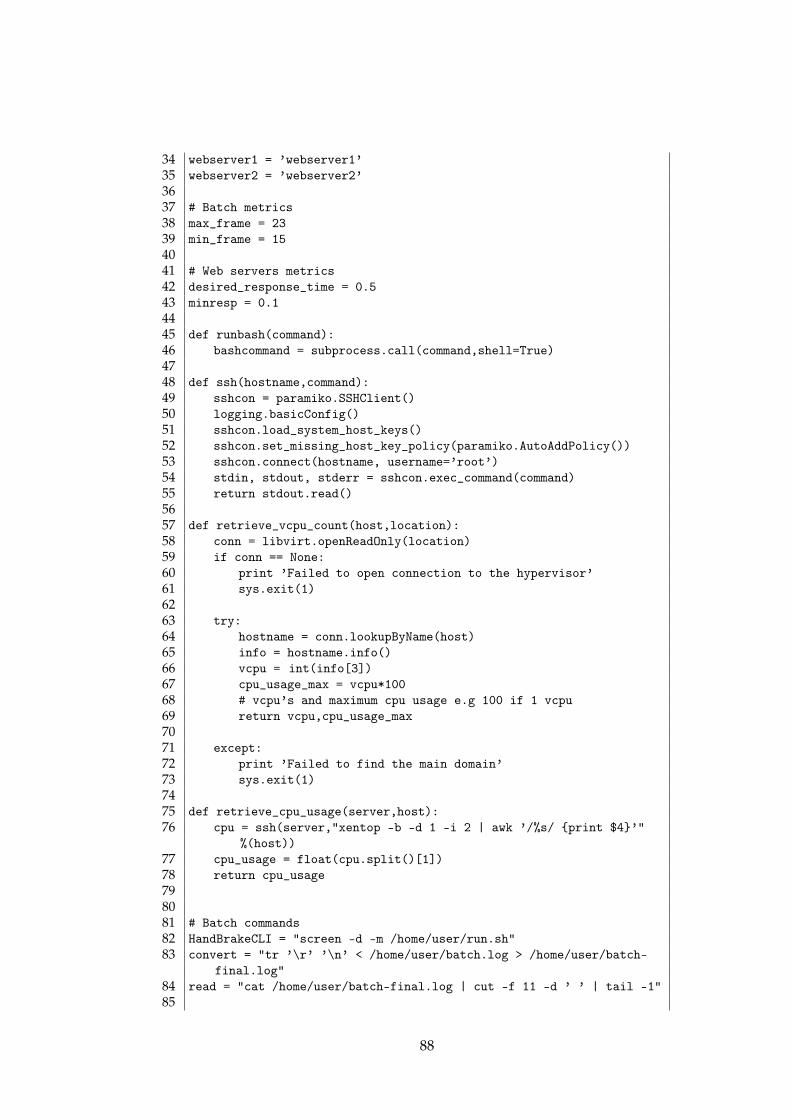
34 webserver1 = ’webserver1’35 webserver2 = ’webserver2’3637 # Batch metrics38 max_frame = 2339 min_frame = 154041 # Web servers metrics42 desired_response_time = 0.543 minresp = 0.14445 def runbash(command):46 bashcommand = subprocess.call(command,shell=True)4748 def ssh(hostname,command):49 sshcon = paramiko.SSHClient()50 logging.basicConfig()51 sshcon.load_system_host_keys()52 sshcon.set_missing_host_key_policy(paramiko.AutoAddPolicy())53 sshcon.connect(hostname, username=’root’)54 stdin, stdout, stderr = sshcon.exec_command(command)55 return stdout.read()5657 def retrieve_vcpu_count(host,location):58 conn = libvirt.openReadOnly(location)59 if conn == None:60 print ’Failed to open connection to the hypervisor’61 sys.exit(1)6263 try:64 hostname = conn.lookupByName(host)65 info = hostname.info()66 vcpu = int(info[3])67 cpu_usage_max = vcpu*10068 # vcpu’s and maximum cpu usage e.g 100 if 1 vcpu69 return vcpu,cpu_usage_max7071 except:72 print ’Failed to find the main domain’73 sys.exit(1)7475 def retrieve_cpu_usage(server,host):76 cpu = ssh(server,"xentop -b -d 1 -i 2 | awk ’/%s/ {print $4}’"
%(host))77 cpu_usage = float(cpu.split()[1])78 return cpu_usage798081 # Batch commands82 HandBrakeCLI = "screen -d -m /home/user/run.sh"83 convert = "tr ’\r’ ’\n’ < /home/user/batch.log > /home/user/batch-
final.log"84 read = "cat /home/user/batch-final.log | cut -f 11 -d ’ ’ | tail -1"85
88
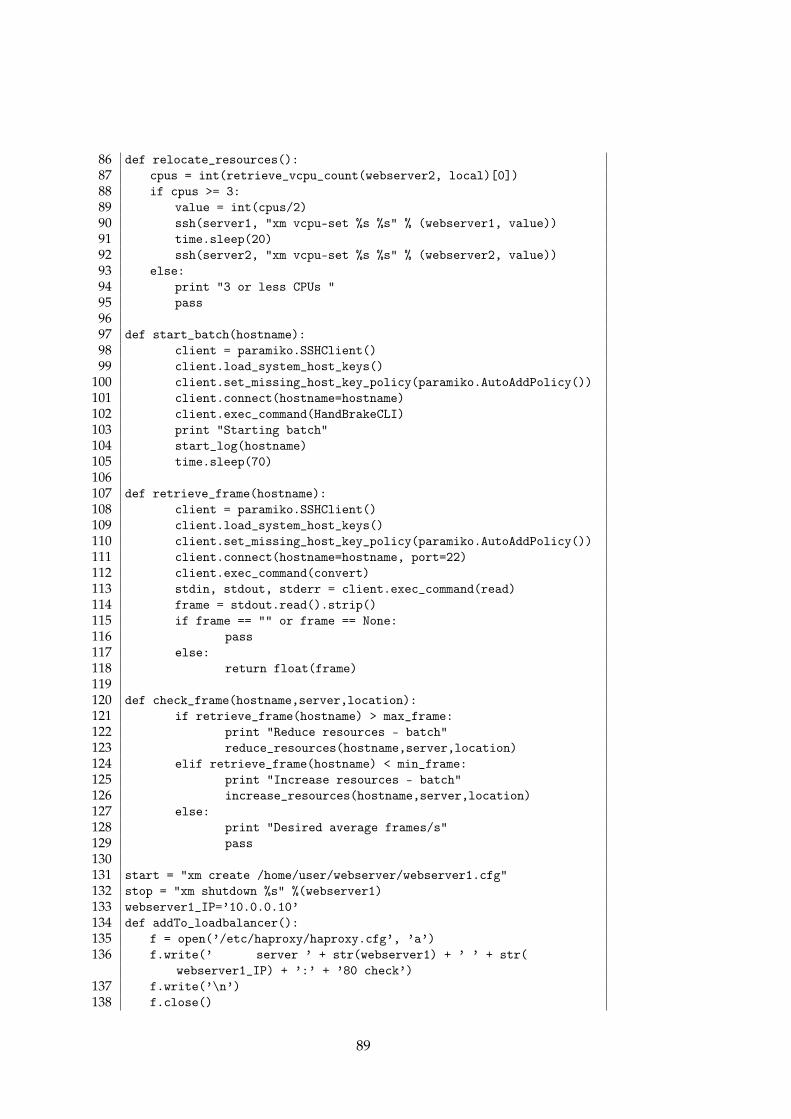
86 def relocate_resources():87 cpus = int(retrieve_vcpu_count(webserver2, local)[0])88 if cpus >= 3:89 value = int(cpus/2)90 ssh(server1, "xm vcpu-set %s %s" % (webserver1, value))91 time.sleep(20)92 ssh(server2, "xm vcpu-set %s %s" % (webserver2, value))93 else:94 print "3 or less CPUs "95 pass9697 def start_batch(hostname):98 client = paramiko.SSHClient()99 client.load_system_host_keys()
100 client.set_missing_host_key_policy(paramiko.AutoAddPolicy())101 client.connect(hostname=hostname)102 client.exec_command(HandBrakeCLI)103 print "Starting batch"104 start_log(hostname)105 time.sleep(70)106107 def retrieve_frame(hostname):108 client = paramiko.SSHClient()109 client.load_system_host_keys()110 client.set_missing_host_key_policy(paramiko.AutoAddPolicy())111 client.connect(hostname=hostname, port=22)112 client.exec_command(convert)113 stdin, stdout, stderr = client.exec_command(read)114 frame = stdout.read().strip()115 if frame == "" or frame == None:116 pass117 else:118 return float(frame)119120 def check_frame(hostname,server,location):121 if retrieve_frame(hostname) > max_frame:122 print "Reduce resources - batch"123 reduce_resources(hostname,server,location)124 elif retrieve_frame(hostname) < min_frame:125 print "Increase resources - batch"126 increase_resources(hostname,server,location)127 else:128 print "Desired average frames/s"129 pass130131 start = "xm create /home/user/webserver/webserver1.cfg"132 stop = "xm shutdown %s" %(webserver1)133 webserver1_IP=’10.0.0.10’134 def addTo_loadbalancer():135 f = open(’/etc/haproxy/haproxy.cfg’, ’a’)136 f.write(’ server ’ + str(webserver1) + ’ ’ + str(
webserver1_IP) + ’:’ + ’80 check’)137 f.write(’\n’)138 f.close()
89
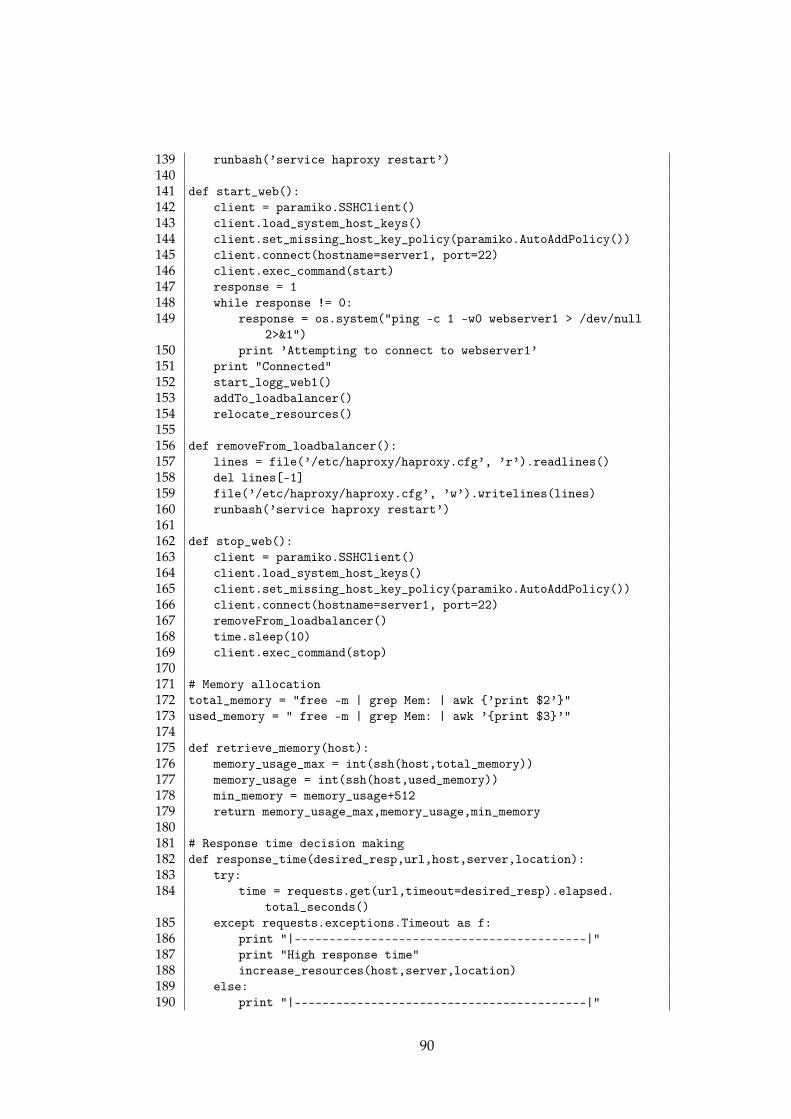
139 runbash(’service haproxy restart’)140141 def start_web():142 client = paramiko.SSHClient()143 client.load_system_host_keys()144 client.set_missing_host_key_policy(paramiko.AutoAddPolicy())145 client.connect(hostname=server1, port=22)146 client.exec_command(start)147 response = 1148 while response != 0:149 response = os.system("ping -c 1 -w0 webserver1 > /dev/null
2>&1")150 print ’Attempting to connect to webserver1’151 print "Connected"152 start_logg_web1()153 addTo_loadbalancer()154 relocate_resources()155156 def removeFrom_loadbalancer():157 lines = file(’/etc/haproxy/haproxy.cfg’, ’r’).readlines()158 del lines[-1]159 file(’/etc/haproxy/haproxy.cfg’, ’w’).writelines(lines)160 runbash(’service haproxy restart’)161162 def stop_web():163 client = paramiko.SSHClient()164 client.load_system_host_keys()165 client.set_missing_host_key_policy(paramiko.AutoAddPolicy())166 client.connect(hostname=server1, port=22)167 removeFrom_loadbalancer()168 time.sleep(10)169 client.exec_command(stop)170171 # Memory allocation172 total_memory = "free -m | grep Mem: | awk {’print $2’}"173 used_memory = " free -m | grep Mem: | awk ’{print $3}’"174175 def retrieve_memory(host):176 memory_usage_max = int(ssh(host,total_memory))177 memory_usage = int(ssh(host,used_memory))178 min_memory = memory_usage+512179 return memory_usage_max,memory_usage,min_memory180181 # Response time decision making182 def response_time(desired_resp,url,host,server,location):183 try:184 time = requests.get(url,timeout=desired_resp).elapsed.
total_seconds()185 except requests.exceptions.Timeout as f:186 print "|------------------------------------------|"187 print "High response time"188 increase_resources(host,server,location)189 else:190 print "|------------------------------------------|"
90

191 print "Low reponse time"192 if time < minresp:193 reduce_resources(host,server,location)194 else:195 print "Ok - Response time"196 pass197198 def reduce_check_cpu(cpu, max_cpu):199 if cpu < max_cpu * 1:200 return False201 else:202 return True203204 # Check CPU usage205 def check_cpu(cpu,max_cpu):206 if cpu > max_cpu*0.8:207 return True208 else:209 return False210211 # Check memory usage212 def check_memory(memory,max_memory):213 if memory > max_memory*0.8:214 return True215 else:216 return False217218 def check_total_CPU_usage():219 if retrieve_vcpu_count(batch,local)[0] > 2:220 print "Removing CPU cores"221 ssh(server2,"xm vcpu-set %s %s" % (batch, retrieve_vcpu_count
(batch,local)[0] - 1))222 ssh(server2,"xm vcpu-set %s %s" % (webserver2,
retrieve_vcpu_count(webserver2,local)[0] + 1))223 else:224 print "Adding new web-server to pool"225 start_web()226227 def increase_resources(hostname,server,location):228 if check_cpu(retrieve_cpu_usage(server,hostname),
retrieve_vcpu_count(hostname,location)[1]) == True andcheck_memory(retrieve_memory(hostname)[1],retrieve_memory(hostname)[0]) == True:
229230 print "Increasing CPU cores and memory"231232 if retrieve_vcpu_count(hostname,location)[0] < max_vcpu and
retrieve_memory(hostname)[1] < max_memory:233 sum = int(retrieve_vcpu_count(webserver2, local)[0]) +
int(retrieve_vcpu_count(batch, local)[0])234 if sum >= 8:235 print "Trying to remove from batch"236 check_total_CPU_usage()237 else:
91

238 return ssh(server,"xm vcpu-set %s %s && xm mem-set %s%s" %(hostname,retrieve_vcpu_count(hostname,location)[0]+2,hostname,retrieve_memory(hostname)[0]+1024))
239 else:240 print "Error: Maximum CPU cores and memory reached -
Reducing from batch"241 check_total_CPU_usage()242243 elif check_cpu(retrieve_cpu_usage(server,hostname),
retrieve_vcpu_count(hostname,location)[1]) == True:244245 print "Increasing CPU cores"246247 if retrieve_vcpu_count(hostname,location)[0] < max_vcpu:248 sum = int(retrieve_vcpu_count(webserver2, local)[0]) +
int(retrieve_vcpu_count(batch, local)[0])249 print sum250 if sum >= 8:251 print "Removing CPU cores"252 check_total_CPU_usage()253 else:254 return ssh(server,"xm vcpu-set %s %s" %(hostname,
retrieve_vcpu_count(hostname,location)[0]+2))255256 else:257 print "Maximum CPU cores reached - Reducing from batch"258 check_total_CPU_usage()259260 elif check_memory(retrieve_memory(hostname)[1],retrieve_memory(
hostname)[0]) == True:261 print "Increasing memory"262 if retrieve_memory(hostname)[1] < max_memory:263 return ssh(server,"xm mem-set %s %s" %(hostname,
retrieve_memory(hostname)[0]+1024))264 else:265 print "Error: Maximum memory reached"266 else:267 print "No lack of resources causing high response time"268269 def reduce_resources(hostname,server,location):270 if reduce_check_cpu(retrieve_cpu_usage(server,hostname),
retrieve_vcpu_count(hostname,location)[1]) == False andcheck_memory(retrieve_memory(hostname)[1],retrieve_memory(hostname)[0]) == False:
271 print "Reducing resources"272273 if retrieve_vcpu_count(hostname,location)[0] > min_vcpu and
retrieve_memory(hostname)[0] > retrieve_memory(hostname)[2]:
274 print "Reducing CPU and memory"275 return ssh(server,"xm vcpu-set %s %s && xm mem-set %s %s"
%(hostname,retrieve_vcpu_count(hostname,location)[0]-1,hostname,retrieve_memory(hostname)[0]))
92

276277 elif retrieve_vcpu_count(hostname,location)[0] > min_vcpu:278 print "Reducing CPU cores"279 return ssh(server,"xm vcpu-set %s %s" %(hostname,
retrieve_vcpu_count(hostname, location)[0]-1))280281 elif retrieve_memory(hostname)[0] > retrieve_memory(hostname)
[2]:282 print "Reducing memory"283 return ssh(server,"xm mem-set %s %s" %(hostname,
retrieve_memory(hostname)[0]))284 else:285 print "Minimum memory and CPU reached"286 list=ssh(server1, "xm list")287 if "webserver1" in list:288 print "Removing Webserver1"289 stop_web()290 else:291 pass292293 elif reduce_check_cpu(retrieve_cpu_usage(server,hostname),
retrieve_vcpu_count(hostname,location)[1]) == False:294 print "Reduce resources"295296 if retrieve_vcpu_count(hostname,location)[0] > min_vcpu:297 print "Reducing CPU cores"298 return ssh(server,"xm vcpu-set %s %s" %(hostname,
retrieve_vcpu_count(hostname,location)[0]-1))299 else:300 print "Minimum CPU cores used"301302 elif check_memory(retrieve_memory(hostname)[1],retrieve_memory(
hostname)[0]) == False:303304 if retrieve_memory(hostname)[0] > retrieve_memory(hostname)
[2]:305 print "Reducing memory"306 ssh(server,"xm mem-set %s %s" %(hostname,retrieve_memory(
hostname)[1]))307 else:308 print "Minimum memory is reached"309 else:310 print "Minimum CPU and memory reached"311312313 start_batch(batch)314315 while True:316 print "|------- Batch -----------|"317 check_frame(batch,server2,local)318 i=1319 while i <= 60:320 print "|------- Webserver2 -----------|"
93
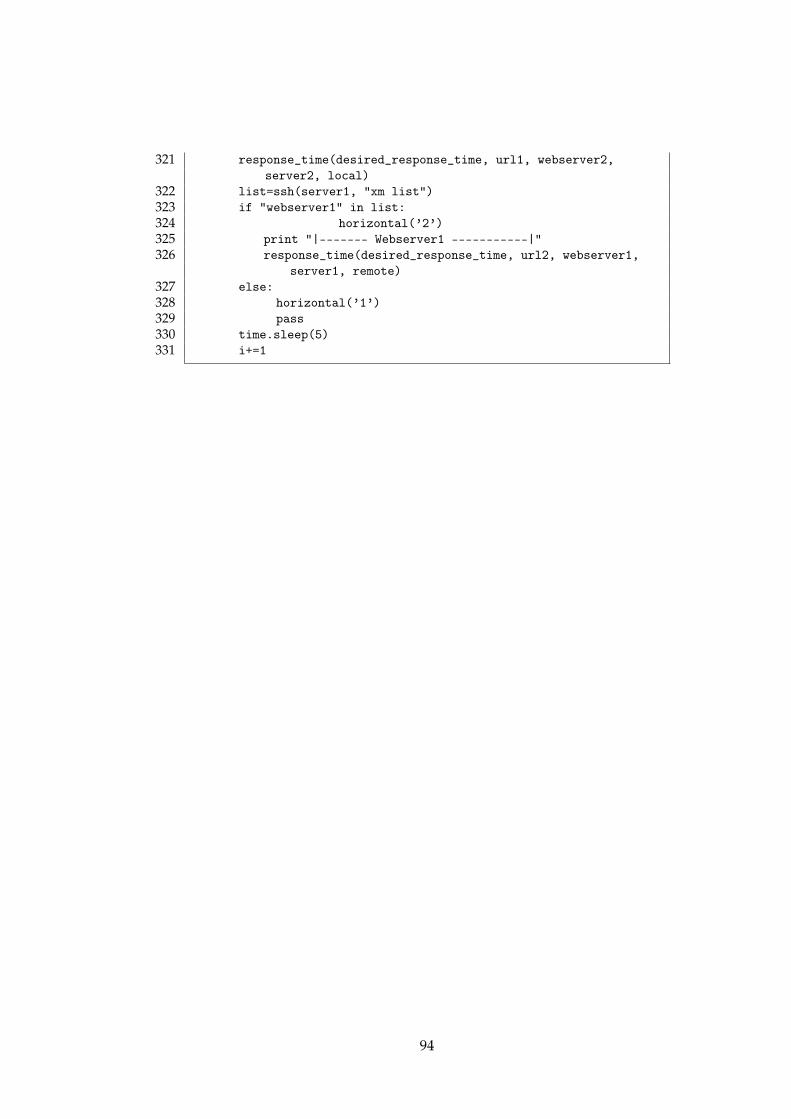
321 response_time(desired_response_time, url1, webserver2,server2, local)
322 list=ssh(server1, "xm list")323 if "webserver1" in list:324 horizontal(’2’)325 print "|------- Webserver1 -----------|"326 response_time(desired_response_time, url2, webserver1,
server1, remote)327 else:328 horizontal(’1’)329 pass330 time.sleep(5)331 i+=1
94
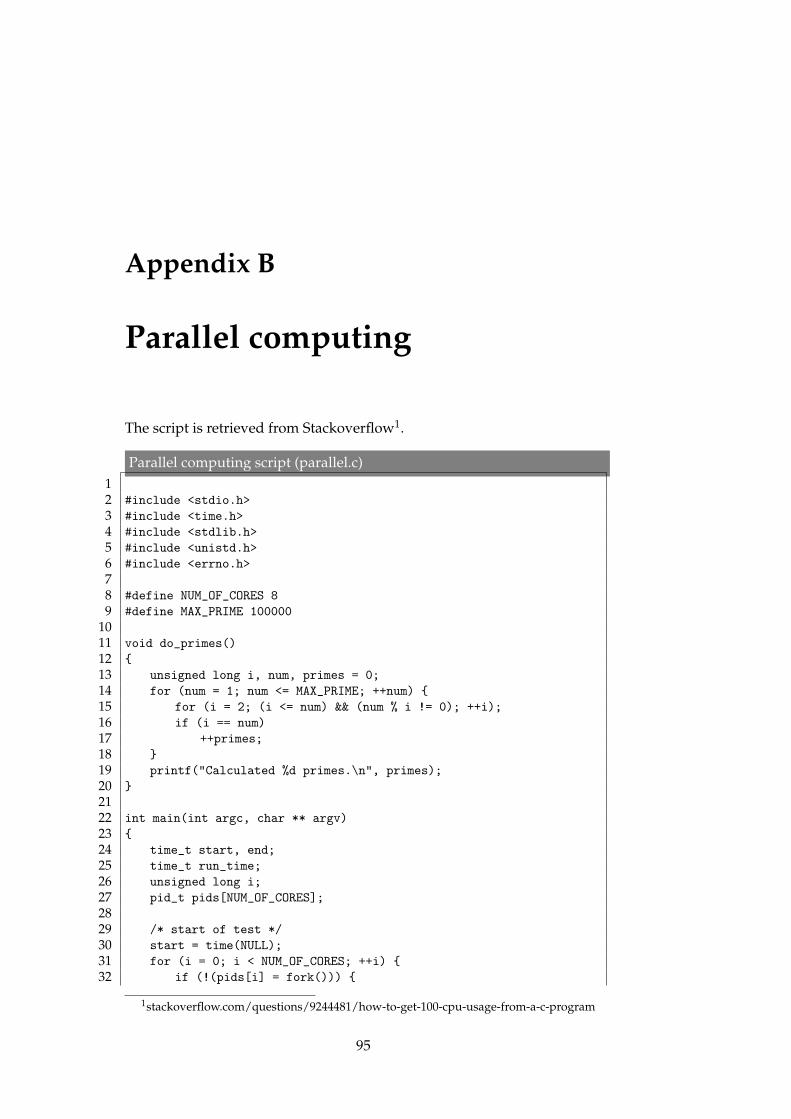
Appendix B
Parallel computing
The script is retrieved from Stackoverflow1.
Parallel computing script (parallel.c)12 #include <stdio.h>3 #include <time.h>4 #include <stdlib.h>5 #include <unistd.h>6 #include <errno.h>78 #define NUM_OF_CORES 89 #define MAX_PRIME 100000
1011 void do_primes()12 {13 unsigned long i, num, primes = 0;14 for (num = 1; num <= MAX_PRIME; ++num) {15 for (i = 2; (i <= num) && (num % i != 0); ++i);16 if (i == num)17 ++primes;18 }19 printf("Calculated %d primes.\n", primes);20 }2122 int main(int argc, char ** argv)23 {24 time_t start, end;25 time_t run_time;26 unsigned long i;27 pid_t pids[NUM_OF_CORES];2829 /* start of test */30 start = time(NULL);31 for (i = 0; i < NUM_OF_CORES; ++i) {32 if (!(pids[i] = fork())) {
1stackoverflow.com/questions/9244481/how-to-get-100-cpu-usage-from-a-c-program
95

33 do_primes();34 exit(0);35 }36 if (pids[i] < 0) {37 perror("Fork");38 exit(1);39 }40 }41 for (i = 0; i < NUM_OF_CORES; ++i) {42 waitpid(pids[i], NULL, 0);43 }44 end = time(NULL);45 run_time = (end - start);46 printf("This machine calculated all prime numbers under %d %d
times "47 "in %d seconds\n", MAX_PRIME, NUM_OF_CORES, run_time);48 return 0;49 }
96
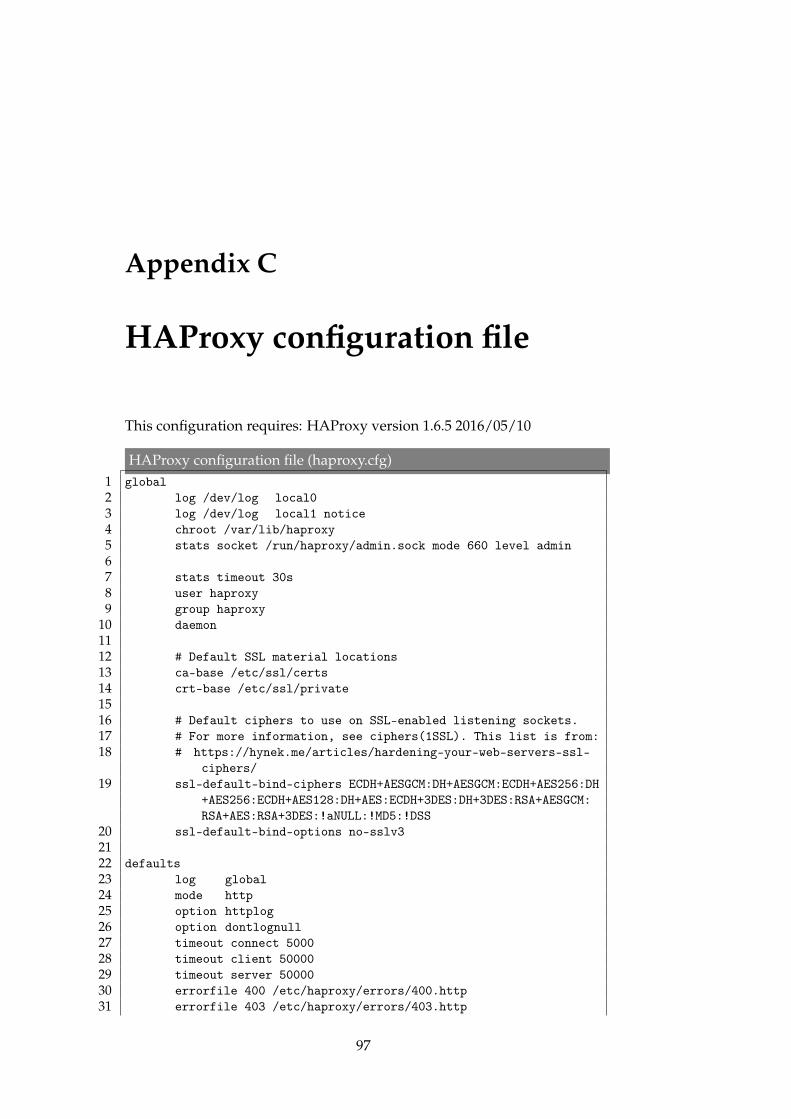
Appendix C
HAProxy configuration file
This configuration requires: HAProxy version 1.6.5 2016/05/10
HAProxy configuration file (haproxy.cfg)1 global2 log /dev/log local03 log /dev/log local1 notice4 chroot /var/lib/haproxy5 stats socket /run/haproxy/admin.sock mode 660 level admin67 stats timeout 30s8 user haproxy9 group haproxy
10 daemon1112 # Default SSL material locations13 ca-base /etc/ssl/certs14 crt-base /etc/ssl/private1516 # Default ciphers to use on SSL-enabled listening sockets.17 # For more information, see ciphers(1SSL). This list is from:18 # https://hynek.me/articles/hardening-your-web-servers-ssl-
ciphers/19 ssl-default-bind-ciphers ECDH+AESGCM:DH+AESGCM:ECDH+AES256:DH
+AES256:ECDH+AES128:DH+AES:ECDH+3DES:DH+3DES:RSA+AESGCM:RSA+AES:RSA+3DES:!aNULL:!MD5:!DSS
20 ssl-default-bind-options no-sslv32122 defaults23 log global24 mode http25 option httplog26 option dontlognull27 timeout connect 500028 timeout client 5000029 timeout server 5000030 errorfile 400 /etc/haproxy/errors/400.http31 errorfile 403 /etc/haproxy/errors/403.http
97
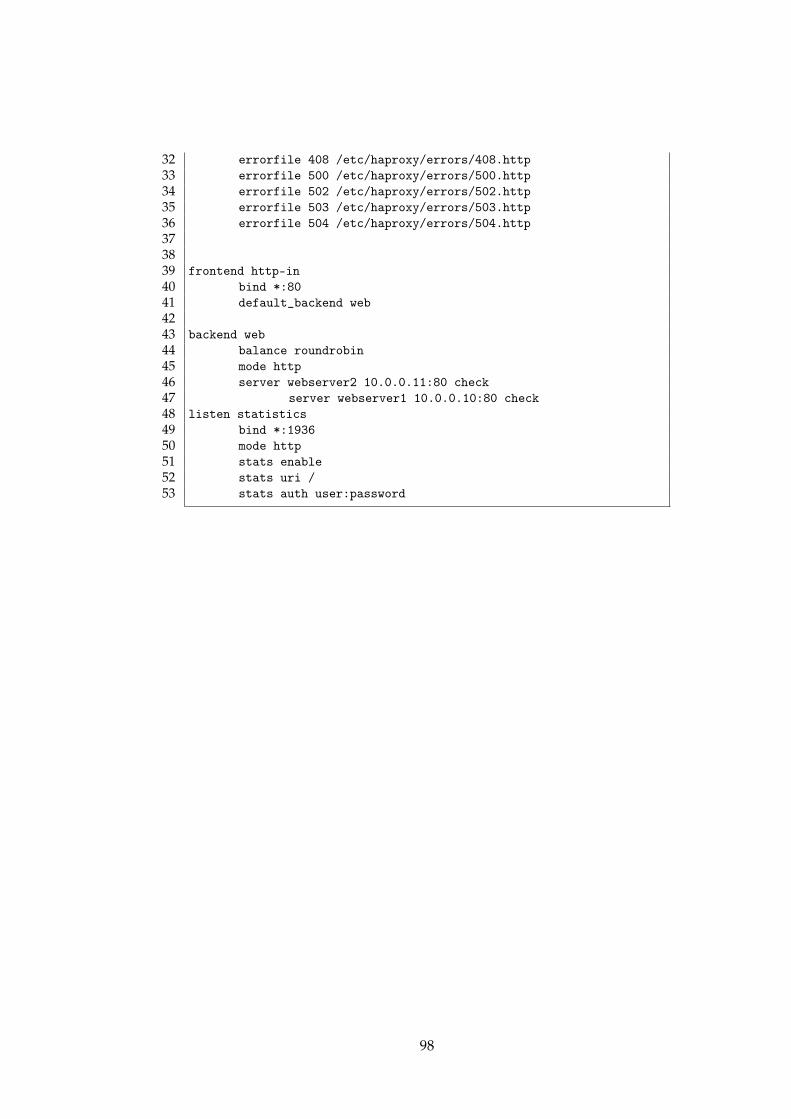
32 errorfile 408 /etc/haproxy/errors/408.http33 errorfile 500 /etc/haproxy/errors/500.http34 errorfile 502 /etc/haproxy/errors/502.http35 errorfile 503 /etc/haproxy/errors/503.http36 errorfile 504 /etc/haproxy/errors/504.http373839 frontend http-in40 bind *:8041 default_backend web4243 backend web44 balance roundrobin45 mode http46 server webserver2 10.0.0.11:80 check47 server webserver1 10.0.0.10:80 check48 listen statistics49 bind *:193650 mode http51 stats enable52 stats uri /53 stats auth user:password
98

Appendix D
Xen - VM creation file
Xen - VM creation file (vm.cfg)1 import os, re2 arch = os.uname()[4]3 kernel = "/usr/lib/xen-default/boot/hvmloader"4 builder=’hvm’5 memory = 24496 maxmem = 204807 shadow_memory = 88 name = "batch"9 vcpus = 1
10 maxvcpus = 1011 vif = [ ’bridge=virbr0,mac=02:16:3e:10:11:27,ip=10.0.0.8’ ]12 disk = [ ’file:/home/bilal/domains/batch/batch.img,hda,w’]13 device_model = ’/usr/lib/xen-default/bin/qemu-dm’14 boot="c"15 #boot="d"16 vnc=117 xen_platform_pci=118 vnclisten="0.0.0.0"19 vncconsole=020 vfb = [’type=vnc,vnclisten=0.0.0.0,vncpasswd=test123,vncdisplay=1,
keymap=no’]21 acpi = 122 apic = 123 sdl=024 stdvga=025 serial=’pty’26 usbdevice=’tablet’27 on_poweroff = ’restart’28 on_reboot = ’restart’29 on_crash = ’restart’
99