convertible debt issues and convertible arbitrage–issue characteristics, underpricing and short...
TRANSCRIPT

Convertible debt issues and convertible arbitrage – issue
characteristics, underpricing and short sales
Igor Loncarski1, Jenke ter Horst2, and Chris Veld3
Abstract We study convertible bond arbitrage for the Canadian market. Convertible bond arbitrage is
the combination of a long position in underpriced convertible bonds and a short position in
the underlying stock. First, we find a downward pressure on cumulative average abnormal
returns of the underlying stocks between the announcement and the issuance dates of the
convertible bonds. This effect is strongest for equity-like convertible bonds. Second, we find
that the convertible bonds are underpriced at the issuance dates, with the equity-like
convertibles being more underpriced than debt-like convertible bond issues. Third, we find
increased short sales for equity-like convertibles before and after the issuance dates. These
short positions remain quite persistent over longer period of time, which suggests that
arbitrageurs (hedgers) are more likely to be taking those positions than speculative
investors. Finally, we find that in a simple convertible arbitrage setting more equity-like
convertibles earned 15 percentage points higher return over a one year period than debt-like
convertibles, in particular due to gains on the short position in stock.
This version: April, 2006
JEL codes: G12, G14, G24, G32
Keywords: convertible arbitrage, short sales, underpricing, convertible bonds,
abnormal returns
1 Corresponding author: Tilburg University, Department of Finance, P.O.Box 90153, 5000LE Tilburg, The Netherlands, tel.: +31 13 466 36 14, fax.: +31 13 466 28 75, email: [email protected] 2 Tilburg University, Department of Finance, P.O.Box 90153, 5000LE Tilburg, The Netherlands, tel.: +31 13 466 82 11, fax.: +31 13 466 28 75, email: [email protected] 3 Simon Fraser University, 8888 University Drive, Burnaby, B.C. Canada. V5A 1S6, tel.: +1 604 268 67 90, email: [email protected] Chris Veld gratefully recognizes the financial support of the Social Sciences and Humanities Research Council of Canada. We thank seminar participants at Simon Fraser University, University of Victoria and Tilburg University for valuable comments. We especially thank Peter Klein, Steven Ongena, Bas Werker and Chendi Zhang.

1
1. Introduction
It is well documented that convertible bonds are undervalued relative to their
theoretical value (see, e.g., King, 1986, Kang and Lee, 1996, Ammann et al., 2003
and Chan and Chen, 2005). According to Lhabitant (2002), the underpricing can be
explained by three reasons. First of all, the majority of the issuers are below
investment grade, and this reduces their liquidity on the market. Second,
convertible issues are small in size, and are hardly followed by analysts. Finally, it
appears that convertibles are very difficult to price due to the complex structure of
convertibles.
Convertibles combine characteristics of both straight debt and equity through a call
option written on the issuing firm’s equity. In a simulation experiment,
Arshanapalli, Fabozzi, Switzer and Gosselin (2004) show that a convertible
arbitrage strategy can be highly profitable, especially in down equity markets. A
convertible arbitrage strategy usually involves a long position in a convertible
security and hedged equity risk by short-selling the underlying stock. The number of
stocks sold short depends on the conversion ratio, the delta of the embedded call
option, and the sensitivity of delta to changes in the stock price.
Convertible arbitrage trades currently represent more than half of the secondary
market trading in convertible securities (see, Lhabitant, 2002), with hedge funds as
the most important player in this market. Convertible arbitrage has been one of the
most successful hedge fund strategies of the end of the nineties and the beginning of
2000’s. Using a survivorship free hedge fund dataset of Tass-Tremont, we find that
the number of convertible arbitrage hedge funds grew from about 26 in 1994 to
about 145 in May 2003. As of that moment the number of convertible arbitrage
hedge funds dropped to about 126 in November 2004. In the same period the assets
under management grew from about 0.7 billion in January 1994 (i.e. about 2.2% of
the total assets under management in the hedge fund industry) to about 11.5 billion
in May 2003 (i.e. about 2.8% of the total assets under management) and to 13.9
billion in November 2004 (i.e. about 1.9% of the total assets under management).

2
The average annual return over the period 1994 – 2004 was 9.40% with an annual
standard deviation of 4.66%. For comparison, during the same period the average
annual return of the S&P 500 was 11.68% with a corresponding standard deviation
of 15.24%. This indicates that the risk-reward trade-off for the convertible arbitrage
strategy was much better than that of a pure equity strategy.
Although successful in the past, convertible arbitrage strategies have shown a much
weaker performance more recently. In the popular press it is often argued that the
decrease in returns is related to the increased competition among hedge funds, and
the lower volatility in the capital market. In this paper we argue that next to the
aforementioned reasons, another more important reason for the decreasing returns
is that the structure of the convertible issues has changed over time. Using a sample
of convertible bond issues in the Canadian market between 1998 and 2004, we show
that convertible issues are more debt-like nowadays. Using the binomial tree
approach to pricing convertible bonds, as introduced by Tsiveriotis and Fernandes
(1998), we show that more debt-like convertible issues induce less underpricing and
therefore provide less opportunities for convertible arbitrage.
This paper contributes to the literature in the following three ways. First of all, we
examine the pattern of the wealth effects between the announcement and the actual
issuance date of the convertible bonds. We observe persistent downward pressure on
cumulative average abnormal returns between the announcement and issuance
dates. As far as we know Arshanapalli et al. (2004) is the only paper that also
examines the issue day effect of convertible bonds. However, they do not distinguish
between debt-like or equity-like issues nor do they examine patterns in the short
positions of the underlying stock. We find that the downward effect in cumulative
average abnormal returns is more pronounced for the issues that are more equity-
like. Second, by using information on aggregated bi-monthly short positions on the
Toronto Stock Exchange (TSX), we argue that the downward pressure on cumulative
average abnormal returns is due to the activities of hedge funds or other investors
that engage in convertible arbitrage strategies. Ackert and Athanassakos (2005) find
a negative relationship between abnormal returns and short sales in the Canadian
market in general, although this effect is diminished for the companies that have

3
convertible bonds outstanding. We observe significant increases in the short
positions of the underlying stocks after the announcement of a convertible bond
issue, and the increased aggregated short position remains stable after the issue of
the convertible. This indicates that hedge funds or other participants that are
involved in convertible arbitrage strategies are building their position immediately
after the announcement of a convertible issue. Finally, we show that convertible
bond issues are more debt-like nowadays, and this could explain why the
performance of convertible arbitrage hedge funds is deteriorating more recently.
The remainder of the paper is structured as follows. In Section 2 we describe in more
detail the valuation model for convertible debt and present a general set-up of
convertible arbitrage, as well as the role of hedge funds. In Section 3 we describe our
data sample. Section 4 is devoted to the analysis of wealth effects associated with
announcement and issued dates of convertible debt offerings. This is followed with
the main analysis regarding the relationship between the mispricing, short sales
and abnormal returns of issuers’ stocks in Section 5. In Section 6 we provide some
insights into the discussion regarding the reasons for the decline in convertible
arbitrage returns. Section 7 concludes.
2. Valuation of convertible debt and convertible arbitrage
2.1. Convertible Arbitrage Hedge Funds
According to Lhabitant (2002), convertible arbitrage trades currently represent more
than half of the secondary market trading in convertible securities. This indicates
that hedge funds are a very important liquidity provider in the convertible market,
since they are highly involved in convertible arbitrage strategies. The hedge fund
industry has grown enormously. Hedge funds differ from mutual funds and other
investment vehicles by their lack of regulation, with limited transparency and
disclosure, and by their internal structure (see, e.g., Fung and Hsieh, 1997). For
example, most hedge funds try to achieve an absolute return target, irrespective of
global market movements, while hedge fund managers typically have incentive-

4
based contracts. Accordingly, hedge funds have a broad flexibility in the type of
securities they hold and the type of positions they take. On the other hand, investors
in hedge funds are often confronted with lockup periods and redemption notice
periods. Such restrictions on withdrawals imply smaller cash fluctuations, and give
fund managers more freedom in setting up long-term or illiquid positions.
The non-standard features make hedge funds an interesting investment vehicle for
investors with potential diversification benefits. From an investor point of view, it
appears that a convertible arbitrage strategy offers a huge diversification benefit
due to a low correlation between a convertible arbitrage strategy and a pure equity
index like the S&P500. During the period 1994 – 2004 this correlation was about
0.126. Using a sample of Japanese convertible bonds, Agarwal, Fung, Loon and Naik
(2004) show that most of the return variation in convertible arbitrage hedge fund
indices can be explained by three risk factors. The implied interest rate, the implied
credit spread, and the implied option price, are the three main factors that capture
the return characteristics of convertible arbitrage strategies. It has to be noticed
that these three components also make the pricing of convertibles complex, and that
might explain the observed underpricing of convertibles.
2.2. Valuation of convertible debt
In general, a convertible bond can be considered as a bundle of a straight bond and a
call written on the underlying equity. There are two theoretical approaches to
valuing convertible debt. The so-called structural models use the value of the firm as
the underlying state variable4, while in the so called reduced form models the value
of the firm’s equity or rather the default probability is modeled as underlying state
variable5. The reduced form models have been adopted in most of the recent
literature on the pricing of convertible debt.
Grimwood and Hodges (2002) argue that the most widely adopted model among
practitioners for valuing convertible debt is the one first considered by Goldman
4 See for example Ingersoll (1977), Brennan and Schwartz (1977 and 1980), Nyborg (1996) 5 See for example Jarrow and Turnbull (1995), Tsiveriotis and Fernandes (1998)

5
Sachs (1994) and then formalized by Tsiveriotis and Fernandes (1998). They use a
binomial tree approach to model the stock price process and decompose the total
value of a convertible bond (CB) in the equity part and the straight debt part (so-
called Cash Only part of a Convertible Bond – COCB). The holder of the hypothetical
COCB receives all the cash flows, but no equity flows. The value of the COCB is
determined by the convertible bond price, the underlying stock price and the time to
maturity, since these so-called early exercise parameters define the boundary
conditions. In other words, since early call, put or conversion are possible, the stock
prices (which change in time) that trigger these events represent the so-called free
boundaries that affect the COCB and CB values. Since the COCB is risky, the
pricing equation (Black-Scholes) must include the issuer’s risk or the credit spread
to account for the relevant risk. The difference between the value of the convertible
bond and COCB is the payment in equity. Since the firm can always deliver its own
equity, this part can be discounted using the risk-free rate. In this paper we use the
methodology of Tsiveriotis and Fernandes to calculate the model prices of
convertible debt issues in our sample, since this approach can take into account any
call, put and conversion features of convertible debt.
2.3. Evidence of convertible debt underpricing
Convertible debt underpricing has been studied in two contexts – at the issue and
following the issue of convertible bonds (Kang and Lee, 1996 and Chan and Chen,
2005) and in the cross section of convertible bonds in the market at a given point in
time (King, 1986, Ammann et al., 2003, etc.).
King (1986) studies a sample of 103 U.S. convertible bond issues in 1977 and finds
an average underpricing of between 3 and 4.5 percent. He finds deeply out-of-the-
money convertible bonds to be underpriced and in-the-money convertible bonds
slightly overpriced. Similarly, the bonds associated with lower variance in stock
returns are overpriced and those with higher variance in stock returns underpriced.

6
Carayannopoulos and Kalimipalli (2003) report similar results as King (1986) for a
sample of 434 monthly price observations between January 2001 and September
2002 for 25 non-financial issuing firms in the U.S. market. They argue that the
overpricing bias for in-the-money convertibles is the result of non-optimal call
policies for convertibles, where they tend to be called late. On the other hand the
out-of-the money underpricing bias is supposed to indicate systematic underpricing
of convertible bonds.
Ammann, Kind and Wilde (2003) investigate the pricing of convertible bonds in the
French market in the period between February 1999 and September 2000. On a
daily data for a sample of 21 convertible bonds they incorporate the credit risk using
the approach of Tsiveriotis and Fernandes (1998). They document an average 3
percent underpricing of convertible bonds in their sample. For other models, which
they do not report in detail, they document underpricing in the range of 5.6 to 8.7
percent. Similarly to previous studies they find underpricing to decrease in
moneyness and to increase in maturity. Amman et al. conclude that the mispricing
can to a certain degree be attributed to the illiquidity in the convertibles market.
Chan and Chen (2005) investigate pricing on a sample of 107 U.S. convertible bond
issues in the period from May 1999 to August 2003. Contrary to previous studies
they investigate pricing at and subsequent to the issue of convertible bonds. They
find underpricing at the issue of around 8 percent, being higher for the issues that
have a higher probability of renegotiation or default on some of the covenants. They
argue that actual prices converge to their theoretical prices within the first 500
weekdays for convertible bond issues of firms that do not experience rating
downgrades. This means that underpricing is mostly limited to the seasoning
process and imminent financial distress of the issuer.
Kang and Lee (1996) analyze the excess returns on a sample of 91 new convertible
bond issues in the U.S. market in the period between 1988 and 1992. They compute
initial raw returns of convertible bonds at the first day of public trading by
comparing the closing market price to the offer price of the convertible bond. They
find 1.31 percent mean initial raw return and 1.11 percent mean excess return over

7
the benchmark index (Merrill Lynch Convertible Bond Index). The ex ante
uncertainty about the market clearing price of a new issue, proxied by the age of the
firm, and volatility of the stock returns prior to the issue announcement, are found
to affect the degree of underpricing, as younger companies experience more
underpricing. In addition to this determinant of underpricing, typically put forward
in the IPO literature, Kang and Lee also investigate the effect of risk associated with
the debt and equity component on the underpricing. They only find support for the
equity component risk, which, measured by the company's beta, positively affects the
degree of underpricing. They interpret their results in line with differential
information models, which state that the degree of underpricing depends on the
information available to the market. According to those models, equity IPO
underpricing should be the highest, as the market has the least amount of pricing-
related information available for those. SEOs and straight debt offerings should
exhibit the least underpricing, as previous security prices are known or not required
for the pricing. In the case of convertibles, positive excess returns, as argued by
Kang and Lee, can be considered as a premium for the estimation risk regarding the
value of the equity component. Similarly to the evidence of Chan and Chen (2005),
Kang and Lee show that initial underpricing dissipates (relative to the benchmark
portfolio) after 250 trading days. They argue that this is due to the improved
information and decrease in estimation risk.
2.4. Convertible arbitrage
The classical convertible arbitrage involves a long position (purchase) in a
convertible bond and a short position (sale) in the underlying stock. Similar results
can be achieved by warrant hedging (long position in warrant, short position in
underlying stock), reverse hedging (short position in warrant, long position in
underlying stock), capital structure arbitrage (a technique aimed at exploiting
pricing inefficiencies in the capital structure of the firm), and other techniques
(Calamos, 2005). In this paper we focus on the classical convertible arbitrage, since
we explore the relationship between pricing of convertible bonds, short sales and
wealth effects associated with the issue of convertible debt.

8
The beginnings of convertible arbitrage, albeit not as refined and computationally
sound as today, go as far back as to the second half of the nineteenth century, when
convertible securities were already being issued (Calamos, 2005). The “arbitrage”
setup at that time was based on the same principle as today, taking the long position
in bonds and short position in underlying stock.
As already mentioned, in order to establish an arbitrage position, a certain amount
of stock has to be sold short. The amount is a function of the conversion ratio
(number of stocks into which the convertible bond converts), the sensitivity of the
convertible bond price to changes in the price of underlying equity (the so-called
delta measure), and the sensitivity of the delta measure to changes in the price of
underlying equity (the so-called gamma measure).
The delta is defined as the change in the value of the convertible bond due to the
change in the value of the underlying equity. This delta is derived from the option
pricing model of Black and Scholes (1973), adjusted for continuous dividend
payments in the way suggested by Merton (1973):
CBdelta=S
∂∂
(1)
δ
σδ
σ− −
⎡ ⎤⎛ ⎞⎛ ⎞⎛ ⎞ + − + ⋅⎢ ⎥⎜ ⎟⎜ ⎟⎜ ⎟⎝ ⎠ ⎝ ⎠⎝ ⎠⎢ ⎥Δ = ⋅⎢ ⎥⋅⎢ ⎥⎢ ⎥⎣ ⎦
(T t )
Sln r TX
e NT
2
2 (2)
S is the current price of the underlying stock, X is the conversion price, δ is the
continuously compounded dividend yield, r is the continuously compounded yield on
a selected “risk-free” bond, σ is the annualized stock return volatility, T is the
initial maturity of the bond and N(.) is the cumulative standard normal probability
distribution. The delta measure always takes value between 0 and 1. Values closer
to 1 indicate a high sensitivity of the convertible bond value to the underlying equity
(stock) value, implying a high probability of conversion.

9
Convertible arbitrage provides cash inflows from coupon payments, which are
enhanced with the short interest credit from the short stock account; while dividend
payments on shorted stock represent cash outflows (this is also the reason why non-
dividend paying stock is more desirable). In addition, if, at the time of the arbitrage
setup, the convertible bonds are underpriced, there is a potential for arbitrage
profits.
The hedge ratio and the convertible arbitrage setup are time varying, since they
depend on the stock price. When the stock price approaches the conversion price, the
delta of a convertible bond increases, since the bond becomes more equity-like (e.g.
the price of the bond becomes more sensitive to the changes in the value of the
underlying equity). This means that more stock needs to be shorted in order to
maintain the neutral hedge ratio, which is defined as a product of the conversion
ratio and delta. The opposite holds if the stock price goes down.
As stated in Calamos (2005), convertible arbitrageurs in general look for convertible
bonds that are more equity-like (have high volatility, which translates into a higher
value of the equity option, a low conversion premium and a high gamma), stocks
that pay low or no stock dividend, stocks that are undervalued, liquid and stock that
can be easily sold short. Additionally, zero coupon convertible bonds or so-called
LYONs (Liquid Yield Option Notes7) are said to be less desirable for convertible
arbitrage per se, as they do not pay coupons and therefore lack coupon component of
cash inflows. For the purpose of this paper we only look into a simple (stylized) setup
for convertible arbitrage, where a neutral hedge ratio is determined with the delta
measure. We ignore any higher “greeks” or moments in sensitivity of the convertible
bond value with respect to changes in the value of the underlying equity. This
provides us with the simple and intuitive framework for analyzing the relationship
between underpricing, convertible arbitrage and wealth effects associated with the
issue of convertible debt.
7 LYONs are zero coupon convertible bonds that are also callable and putable.

10
3. Data
We investigate the convertible debt issues in the Canadian market between 1998
and 2004. Data regarding the issues and their characteristics is obtained from the
SDC New Issues database and prospectuses of the issuers (available on the SEDAR
web site8). Data on stock and bond prices, market indices, government bond yields,
dividends, number of shares outstanding and convertible bond prices is obtained
from Datastream. Data on short interest (short sales) was obtained from TSX. TSX
provides the information on consolidated short positions for stocks traded on TSX
and TSX Venture exchanges twice a month (every 15th and the last day of the
month), as reported by brokers. The data on consolidated short positions provides us
a unique opportunity to examine patterns in the number of stocks sold short of the
underlying equity of a convertible issue immediately after announcing or issuing the
convertible. Furthermore, short sales are not allowed in many markets. Moreover,
short sales in the Canadian market are supposed to be easier (less limitation) and
less costly to execute than in the U.S. market for example, especially for the stocks
of the companies with options or convertible bonds outstanding. This makes
Canadian market particularly suitable setting for the investigation of short sales.
3.1. Sample selection
As mentioned, we have obtained the data on convertible bond issues in the Canadian
market between 1998 and 2004 from the raw SDC New Issues dataset as the basis
for our sample formation. In total, there were 88 new public convertible bond issues
denominated in Canadian Dollars and issued registered in SDC during that period.
Next, we excluded all exchangeable bonds9 and zero coupon bonds and also imposed
the requirement that announcement and issuance dates (completion of the offer)
were verifiable in company announcements and prospectuses on the SEDAR web-
site or in Lexis Nexis. These requirements reduced our sample to 72 convertibles.
Finally, all our bonds in the sample should have stock price and bond price data 8 The SEDAR stands for “System for Electronic Document Analysis and Retrieval” and is a service of CSA (Canadian Securities Administration) providing public securities filings. (http://www.sedar.com/) 9 Exchangeable bonds are bonds that are convertible into some other asset than the (equity) stock of the issuing company.

11
available on Datastream, as well as all the details of the issue provided in the
prospectus. This has left us with a final sample of 61 convertible bond issues.
In Table 1 we present descriptive statistics for the sample, broken down by year of
the convertible bond issue. In the table we can observe that changes in volatility
and delta over time closely correspond. In particular, the average values of delta
have decreased over time, from 0.58 in 1998 to 0.14 in 2004. This implies that,
according to the delta measure, at the beginning of our sample period the average
issue was much more equity-like than at the end of our sample period. At the same
time the average volatility of the issuer’s stock price also decreased from 0.48 in
1998 to 0.2 in 2004. Another interesting observation is the average dividend yield,
which was between 3 and 4 percent in the years 1998 and 2001, corresponding to the
years that also observe more equity-like convertible issues (average delta of 0.58 and
0.61 respectively). In contrast, the average dividend yield increases to more than 9
percent in 2003 and 2004, corresponding to the average delta of 0.21 and 0.14
respectively. The average maturity of the issues is rather constant at around 6
years. The size of the issues on the other hand exhibits some variation, ranging from
around 30 million Canadian Dollars in 1999 to about 100 million Canadian Dollars
in 2003. Towards the end of the sample period there are no extremely small issues
as for example in 1998 (3 million Canadian Dollars) or 2001 (7 million Canadian
Dollars).
<Insert Table 1 here>
Given these differences in time we argue that issue characteristics or rather
universe of issuers has changed in time. One might of course claim the opposite,
namely that the decrease in market volatility caused the decrease in the delta by
construction of the delta measure. In other words, it is not because of the changed
characteristics of the issue that we observe lower delta values, but rather because of
the overall market-wide decrease in volatility. Although we conceive that overall
volatility in the market has declined after 2000, we believe that changes in dividend
yield, issue size and conversion premium provide enough evidence to substantiate
our premise. As already shown, the average dividend yield increased over time.

12
Typically, companies in more mature industries pay higher dividends or even pay
any dividends at all. These are also less risky companies (lower volatility) with more
stable cash flows and fewer growth opportunities. It has been shown previously that
such companies are more likely to issue debt-like convertibles (see for example
Lewis et al., 1999) similarly as they would be more likely to issue straight debt than
equity. Additionally we have investigated conversion premiums, defined as a
difference between conversion price and stock price at the issue relative to the stock
price. Conversion premiums are inversely related to the conversion ratio. Higher
conversion ratios (lower conversion premiums) indicate more equity-like convertibles
(Kim, 1990) and vice-versa, since a convertible bond with a lower conversion
premium is more likely to become in-the-money (all else equal) and be converted into
equity. The conversion ratio (or conversion price) on which conversion premium
depends is the only parameter in Equation 2 which companies can arbitrary choose.
The average conversion premium in our sample of convertible bonds has declined
from 0.21 in 1998 to between 0.12 and 0.11 in 2003 and 2004 respectively. This
indicates that issuers tried to offset the effect of lower volatility by lowering the
conversion premium as convertibles would be even more debt-like otherwise. We see
this as an additional evidence that the universe of issuers (other characteristics of
issues) that changed over time had an important impact on the delta measure.
4. Wealth effects between the announcement and issue of convertible bonds
We first investigate shareholder wealth effects related to the periods between
announcement and more importantly the issuance dates of convertible debt issues.
Previous literature10 on the wealth effects typically focuses on a short event window
around the announcement and / or issue dates. In contrast to that, we investigate
the wealth effects between the announcement and issue dates of convertible debt
issues, as we are interested in the evolution of abnormal returns during this period,
and the pattern in the short positions of the underlying stocks.
10 For the summary of previous empirical research on announcement effects see Loncarski, ter Horst and Veld (2006).

13
In Figure 1 we present the cumulative average abnormal returns related to the
announcement (first plot) and issuance date (second plot) of convertible debt issues.
The wealth effects are presented for split subsamples according to the delta
measure, where a delta higher than 0.5 denotes more equity-like issues and a delta
lower than 0.5 denotes more debt-like issues. On average, the time between the
announcement and issuance date is around 19 trading days (or approximately one
calendar month).
<Insert Figure 1 here>
The first thing that can be observed in both plots in Figure 1 is the downward
pressure on the cumulative average abnormal returns (CAAR) between the
announcement date (this is between days -20 and -15 relative to the issuance date)
and the issue date. The second and even more important observation is the fact, that
this effect is more pronounced for more equity-like convertibles. Next, the inspection
of the first plot shows that the large negative wealth effect of around 6 percent
associated with the announcement of the equity-like convertible bond issues is
absorbed by the market quite instantaneously, within one to two days following the
announcement. However, there is an additional downward pressure in CAAR of
around 4 percent following the absorption of the announcement effect. Finally, the
investigation of the second plot, where time equal to zero denotes the issue date,
reveals that CAAR rebound after the issue, offsetting the prior negative effect within
the following month.
<Insert Table 2 here>
In Table 2 we present results of standard tests for statistical significance of CAAR,
where under the null CAAR equals zero. The wealth effects are significantly
negative in the period between the announcement and the issuance date of issues.
Equity-like convertible issuers experience around 5 percent negative CAAR in the 15
day period leading to the issue date versus less than about 1 percent negative CAAR
for debt-like convertible issuers. The difference is significant for the window (-20,0),
where some announcement date effects can still be included. For the later dates, in

14
particular windows (-18,0) and (-15,0), the difference is marginally significant. It
seems that most of the wealth effect or the downward pressure on the CAAR is
concentrated in the time up to 10 calendar days before the issue (this is five to eight
days after the issue announcement). Finally, the downward pressure trend on the
CAAR reverses in ten to fifteen days after the issue. The more equity-like
convertibles issuers experience on average a significant 1.5 percent positive CAAR in
the period of 15 to 20 days after the issue, while this effect is smaller for the more
debt-like convertible bond issuer (0.6 percent).
These results are in line with the findings of Arshanapalli et al. (2004), who
investigate announcement and issue date wealth effects for a sample of 229
convertible issues in the U.S. market in the period between 1993 and 2001.
Arshanapalli et al. document a significant negative CAAR of 3.8 percent in the
period of five days before the convertible bond issue. This negative effect is only
limited to a period of a few days around the issue date. Similarly to our findings,
they also document the rebound in returns following the issue date. Note that they
do not investigate the whole period between the announcement and the issue date
and do not differentiate between more equity-like and more debt-like convertibles.
5. (Under)Pricing of convertible bonds and short sales
5.1. Pricing of convertible bonds
As mentioned in Section 2.2, we have used the valuation approach suggested by
Tsiveriotis and Fernandes (1998). In order to calculate the theoretical (model) price
of a convertible bond we have used the following inputs. For the risk-free rate we
have used the yield on government bonds (Canadian) of comparable maturity as the
convertible bond. Static spread corresponding to the credit risk of the issue is used to
accommodate for the credit risk of the issue. Where the data on credit risk was not

15
available, we have assumed that the company was of the BBB risk11. In Datastream,
only Scotia Capital provides Canadian corporate bond benchmarks for different
maturities and different credit ratings. They cover BBB, A and AA rankings of short,
medium and long term. Based on the maturities we have extrapolated the following
maturities: 1 year (equivalent to short term), 3 years (between short and medium
term), 5 years (medium term), 7 years (between medium and long term), 10 years
and more (long term). Based on the rankings, we also extrapolated the rankings
lower than BBB (BB and B) by adding a spread to BBB. This spread is relative to
the spread between BBB and A, but is relatively increasing in lower credit quality
and maturity. The price of the underlying stock at the valuation date was taken
from Datastream, where we took the average stock price between days -12 and -2
relative to the announcement date of the issue. With respect to the number of steps
in the tree, we took a number of months to maturity. Coupon rate, number of
coupons per year, conversion ratio and call schedules were obtained from
prospectuses. With respect to dividend information, we have assumed a constant
dividend yield.
In Table 3 we present the summary statistics for mispricing, based on both the
trading and offer prices, and a ratio between equity and debt components. Misp is
the mispricing based on the trading price, mispo is the mispricing based on the offer
price and mispto is the mispricing computed as the relative difference between the
trading price and the offer price. The mispricing is computed as:
( )t tt
t
model price trading pricemisp =trading price
− (3)
or
( )tt
model price offer pricemispo =offer price
− (4)
or
11 We have also computed model prices by taking the lowest possible credit quality for the issues with no credit risk information available. The mispricing was on average somewhat lower, but it did not affect the results significantly. The calculations are available upon the request.

16
( )tt
trading price offer pricemispto =offer price
− (5)
The model price at time t represents the price computed using the binomial tree
approach to convertible bond valuation as previously described. Trading price
denotes the market price of a convertible bond at time t and offer price represents
the price, at which the issue was initially offered to investors at time of subscription.
Based on the model and observed prices at the issuance date and offer prices
obtained from the SDC New Issues database, we have computed the two mispricing
measures at one point in time, at the issuance date. In addition, we have also
computed the ratio between estimated equity and debt components. Similarly as the
delta measure, this ratio indicates, whether the issue is more equity or more debt
like, as one can expect the ratio to be significantly higher for the convertible debt
issues that are more equity-like compared to more debt-like convertible bond issues.
<Insert Table 3 here>
In Table 3 we present the descriptive statistics for the mispricing measures, delta
and equity-to-debt component ratio. In the whole sample the convertible bonds
exhibit significant underpricing (the model price is on average higher than the
observed trading price) by around 10 percent (see Panel A). As expected, the
underpricing is significantly higher for more equity-like convertibles (delta>0.5)
than in the case of more debt-like convertibles (delta<0.5) by about 20 percentage
points (see Panel D). The same conclusion can be reached with respect to the other
measure of mispricing where, instead of the trading price, the offer price is used to
calculate the mispricing. The offer price is the price at which the convertible bond
issue was offered to the public in the subscription process (as reported in the SDC
database). As expected, the equity-to-debt component ratio is significantly higher in
the case of more equity-like convertibles. This implies that the delta measure
appropriately captures the equity vs. debt-likeness characteristic of a convertible
bond issue. Finally, the mispricing measure mispto, which is defined as a difference

17
between the first trading price and the offer price relative to the offer price, shows
that the underpricing is not significantly different from zero in total and both sub-
samples.
Next we investigate the distributions of mispricing measures. Figure 2 shows kernel
density estimations (distributions) for different mispricing measures based on the
observed prices (the first trading prices) and offer prices for the split samples
according to the delta measure. The first plot in Figure 2 is a distribution estimate
for mispricing as defined in Equation 3, that is the relative difference between model
price and the first trading price. As can be observed, the mispricing is higher for the
more equity-like convertibles (as we already established based on the summary
statistics in Table 3) and more importantly it is also more widely dispersed and more
equally distributed around its mean of 0.239. Contrary to that, the more debt-like
convertibles exhibit a lower degree of underpricing, which is mostly concentrated
around its mean.
<Insert Figure 2 here>
The second plot in Figure 2 shows a distribution estimate for mispricing as defined
in Equation 4, that is the relative difference between the model price and the offer
price. Conclusions based on this plot are almost identical to the ones based on the
first plot. The mispricing (underpricing) for more equity-like convertible bond issues
is on average higher than for debt-like convertibles, with more variation to it.
Finally, the third plot in Figure 2 shows distribution estimate for mispricing as
defined in Equation 5. The distributions of this measure for subsamples of more
equity and debt-like convertibles are quite similar, which suggests very little
difference on average between the first trading and offer price.
So far we have established that convertible bonds in our sample seem to be
underpriced. This result is in line with the previous literature on underpricing (see
for example Chan and Chen, 2005 and others) at the issue. Moreover, we have
shown that the underpricing is higher for the more equity-like convertibles.

18
Next, we look into the correlations for the whole sample between different measures
of mispricing, the equity-to-debt component ratio and the delta measure. These are
shown in Table 4.
<Insert Table 4 here>
In Table 4 we observe that the delta measure and the equity-to-debt component ratio
are significantly positively correlated with a correlation coefficient of 0.37. More
importantly, we observe that the delta measure and the equity-to-debt component
ratio, which relate to the characteristics of convertible debt issues, are significantly
positively correlated with both mispricing measures, with a correlation coefficient of
around 0.76 for the measure based on the comparison between the model and the
trading price and a coefficient of 0.66 for the measure based on the comparison
between the model and the offer price. This provides further evidence that more
equity-like issues, which have both a higher delta and equity-to-debt component
ratio than more debt-like issues, are more mispriced (underpriced). This supports
the idea that the higher the delta, the larger the equity component of the convertible
issue compared to the debt component, which makes the issue more difficult to
value. In addition, the mispricing measure based on the comparison between the
first day trading price and the offer price is not significantly correlated with the
delta measure. This suggests that mispricing at the first trading date, compared to
the offer price, does not depend on the structure of the issue. However, it is
significantly negatively correlated with the other mispricing measure, which
compares model price to the trading price. It seems that different factors affect these
two mispricing measures.
Given the CAAR plot of the announcement effects between the announcement date
and issuance date in Figure 1, we have speculated that the CAARs could be related
to the activity of investors (hedge funds) that engage in convertible arbitrage. First,
we present some indirect evidence for that. A significant negative relationship
between mispricing and CAARs, in particular for those between the announcement
date and up to the issuance date (+10 to 20 trading days on average after the
19
announcement), would give some support to the hypothesis. To investigate that, we
run regressions between cumulative average abnormal returns for different event
windows and mispricing measures.
<Insert Table 5 here>
In Panel B of Table 5, the regression results for different CAAR dates and
mispricing estimates based on trading prices at the issuance date are presented. The
table shows that mispricing is significantly negatively associated with cumulative
average abnormal returns for all different windows after announcements of
convertible debt issues. We see this as indirect evidence to support our premise that
convertible arbitrage activities of investors (in particular hedge funds) might cause
the downward pressure on the CAAR. The economic impact of mispricing here is also
quite significant. For example, an increase in mispricing by 10 percentage points
(one standard deviation of the whole sample) leads to an increase in the negative
CAAR of around 2.2 percentage points in the event window (0,18).
In Panel A of Table 5 the model statistics are presented. Based on the results, we
conclude that mispricing has some explanatory power with respect to the CAAR, as
it explains around 12 percent of the variance of CAARs in the period between the
announcement and issuance dates of convertible bond issues.
Finally, we investigate mispricing of the convertible bond issues during the first
year of trading. Volatility estimates are based on a rolling window sample of the
past 250 trading days, delta is estimated for every individual trading day, as well as
risk free rate and spread. Stock prices are matched to every individual trading day
as well. We used constant dividend yields, computed as the average dividend yield of
the past 250 trading days.
<Insert Figure 3 here>
In Figure 3 we present the degree of mispricing for the sub-samples of equity-like
and debt-like convertible bonds. Firstly, as before we observe that mispricing is
20
much higher for the equity-like convertibles than for debt-like convertibles over the
longer period following the issue of the bond. Secondly, we see that mispricing on
average declines in the first 15 trading days following the issue, with a decline of
about 7 to 8 percentage points in the case of equity-like convertibles and about 3
percentage points in the case of debt-like convertibles. Interestingly, it increases
afterwards for debt-like convertibles and remains at 5 percent, while in the case of
equity-like convertibles shows slight downward trend. In the first 15 trading days
the decreases in mispricing also coincides with the largest trading volume (demand)
of convertible bonds (not reported here).
In Figure 4 we present the degree of mispricing based on the comparison between
trading prices and reported offer prices for the convertible bonds.
<Insert Figure 4 here>
From Figure 4 we firstly observe that on average both equity- and debt-like
convertibles are underpriced compared to the offer price at the issue. Following the
issue, the degree of (offer) mispricing increases for both types of convertibles bonds.
Secondly, this increase occurs during the first 15 trading days, similary as
mispricing diminishes during the same period if the model and trading prices are
compared, since market prices of convertible bonds increase. In the first 15 trading
days for example, prices of the equity-like convertibles increase by about 5 percent
compared to the offer price, while the increase is between 2 and 3 percent for the
more debt-like convertibles. The “offer price” mispricing peaks to about 7 percent for
equity-like convertibles in 25 days after the issue and after 100 days starts declining
and becomes negative in half a year after the issue due to sharp decline in
convertible bond prices. Contrary to that, prices of debt-like convertibles steadily
increase.
We find mispricing developments during the initial trading period particularly
important for our analysis, as it shows that convertible bond prices are mispriced at
the issue. The mispricing does decrease immediately following the issue, but

21
remains present over longer period of time afterwards. This suggests that major
activities related to convertible arbitrage take place closely around the issue date.
So far, we have shown that more equity-like convertible bond issues are more
underpriced and exhibit more negative cumulative average abnormal returns. Since
more underpriced issues are potentially more profitable candidates for convertible
arbitrage, we believe that this provides evidence that convertible arbitrage activities
further negatively affect cumulative average abnormal returns between
announcement and issuance dates of convertible debt issues. Next we turn to
evidence based on short sales.
5.2. Short sales and underpricing
One of the basic principles of convertible arbitrage is to short sell the underlying
assets (stock) of the convertible bond, while purchasing the convertible bonds at the
same time. If short selling activities of the underlying stock increase at and after the
announcement of convertible bond issues compared to levels before the
announcement, this can be interpreted as additional (and more direct) evidence that
convertible arbitrage strategies are affecting the cumulative average abnormal
returns between the announcement and issuance dates of convertible bond issues.
For the purpose of investigating the relationship between short sales, characteristics
of the issue, mispricing and cumulative average abnormal returns, we define a
relative measure of short sales as a ratio between the short interest in a given period
and potential number of shares that are to be issued if the convertible bond issue is
converted into shares12. In Table 6 we present the summary statistics for both the
level of relative short sales and changes between consecutive periods.
<Insert Table 6 here>
12 We have also investigated the second relative measure of short sales defined as a ratio between the short interest in a given time period and the corresponding total number of shares outstanding. The results, which are available upon the request, are very similar and downscaled only.

22
With respect to the summary statistics for the measure of a level of short interest
(Panels A and B in Table 6), we observe that in the case of more equity-like issues
the average short interest increases from around 4.5 percent just before the
announcement of the issue to 25 percent of the new potential shares issued in 4
weeks following the announcement date. In the case of more debt-like convertibles
the mean relative short interest increases slightly from around 9 percent prior to the
announcement to 11 percent following the announcement. It declines back to around
9 percent of the new potential shares issued in 4 weeks following the announcement.
The difference at AD+1 (approximately two weeks after the announcement of the
issue) is statistically significant at the 5 percent level. The difference continues to
increase up to the three months following the announcement to about 29 percentage
points and then declines to about 18 percentage points after 8 months following the
issue announcement (as shown in Panel C). Even after 12 months following the
issue, the mean relative short interest for equity-like convertible issuers is higher by
around 15 percentage points compared to the short interest of debt-like issuers.
In Panels D and E results for the changes in short interest between consecutive
periods are presented. These are again based on the short interest relative to the
potentially newly issued shares in case of full convertible issue conversion into
equity. From these results we conclude that the highest increase in the short
interest for the equity-like convertibles is in at the announcement of the issue and
the immediate subsequent period (average increase of 6.3 and 9.7 percentage points
respectively). This is followed by a more moderate increase in a period between two
weeks and one month after the announcement (just prior to the issue) of around 5
percentage points. Afterwards, the short interest keeps increasing, but at the lower
pace of between 2 to 3 percentage points relative to the issue size per two weeks.
Contrary to that, companies that issue debt-like convertibles experience an average
1.7 percentage point increase in short positions just after the announcement of the
issue and 2 percentage points (complete off-set) decline just after the issue of the
bond (AD+3).
In Figure 5 we present mean (first plot) and median (second plot) values of relative
short interest in time, based on the potential number of newly issued shares as the

23
denominator. We observe that after the announcement short interest gradually
increases for more equity-like convertibles and remains almost unchanged for more
debt-like convertibles. This corresponds to previous evidence on mispricing and
characteristics of convertible bond issues. Moreover, the persistence in the level of
open short positions indicates that investors who take the short position do so over
the longer period of time, which is consistent with investors that engage in
convertible arbitrage rather than investors that short the stock since they perceive it
to be overvalued. If indeed this latter group of investors was shorting the stock, we
would observe a decline in short positions after the stock price or rather abnormal
returns rebound after the initial downward pressure between the announcement
and the issue dates. However, this is not the case, as can be observed from both plots
in Figure 5.
<Insert Figure 5 here>
We interpret this as a more direct evidence of convertible arbitrage activities
subsequent to the announcements of convertible bond issues. Furthermore, we look
into the correlations between mispricing and relative short interest. The results are
presented in Table 7.
<Insert Table 7 here>
The results in Table 7 suggest that two different mispricing measure are differently
related to the short interest. Mispto measure, which measures mispricing between
the first day trading price and offer price is significantly positively related to short
interest in a period between the announcement of the offering and the issue date.
The second mispricing measure, comparing the model price to the first day trading
price (misp), is significantly positively related to the level of short interest only after
the issue of the bond. Here, we observe significance of the correlation coefficient
immediately after the issue. First, the positive correlation is in line with our
expectations, as a higher degree of underpricing (and a higher delta) induces higher
relative short interest. Secondly, it seems that the mispricing has two dimensions.
They seem to be negatively correlated, as we already pointed out before. The

24
mispricing between the first day trading price and the offer price might be related to
inefficiencies and risk of the subscription process, where this can be seen as a risk
premia that goes to the underwriter of the issue. The second mispricing measure
(comparison between the model price and the first day trading price) in our view
relates to the valuation uncertainty of convertible bond and the seasoning process up
to the first coupon payment of the bond (which is six months after the issue for
typical semi-annual coupon bonds). While the difference between the first day
trading price and the offer price seems to affect the level of short interest prior to the
issue, the difference between the model price and the first day trading price affects
the level of short interest after the issue. This is to say that the hedging activities,
related either to the underwriting process or convertible arbitrage, seem to affect the
level of short interest.
The relationship between short sales, structure of convertible bond issues and
underpricing yields evidence that supports our hypothesis from the introduction.
More equity-like convertible bond issues are more underpriced and thus more
interesting for arbitrageurs. Since in such cases more stock has to be sold short,
there is more downward pressure on cumulative average abnormal returns between
the announcement date and the issuance date (and beyond). Ackert and
Athanassakos (2005) demonstrate a significant negative relationship between short
sales and abnormal returns in the Canadian market. They however also show that
this negative relationship is mitigated when companies have options or convertible
bonds outstanding. This suggests that information about short sales is evaluated on
the basis of other accompanying information, especially when short sales might arise
due to hedging activities.
6. Convertible arbitrage returns
The performance of hedge funds that are involved in convertible arbitrage strategies
has been decreasing. Based on the figures presented in Table 8 we can observe that,
apart from two setbacks in 1994 and 1998, returns on HEDG Convertible Arbitrage
index have for the most part been above 15 percent. This performance has however
deteriorated in later years. The popular press provides different explanations for

25
this, ranging from stable equity markets, rising interest rates, withdrawals from
funds, to increased competition in the hedge fund industry and lower volatilities in
the main capital markets. Given the set-up of convertible arbitrage strategy, these
factors may indeed contribute to a decreased performance. However, we believe that
explanation, which is probably overlooked, may play an important role as well.
<Insert Table 8 here>
An important part of the return in the convertible arbitrage strategy represents the
profit from mispricing of convertible bond issues. Here, we argue that convertible
arbitrage performance may critically depend on the degree of mispricing of
convertible bond issues, which has shown to be to a large extent determined by
characteristics of any particular issue. In other words, equity-like convertible bonds
are likely to be more underpriced than debt-like convertible bonds, as we have
shown in previous sections. If the structure of the convertible bond issues changes
over time from more equity-like to more debt-like, we may expect to see less
underpricing and less true arbitrage opportunities for convertible arbitrage
strategies.
In Table 9 we provide mean and median statistics for delta and mispricing values,
broken down by the year of convertible debt issue. We do not have any issues that
fulfill our inclusion criteria for the year 2000, but the numbers for the other years do
provide some evidence to support our premise.

26
<Insert Table 9 here>
The first thing that can be observed in Table 9 is that the mispricing of convertible
bond issues declined over time. We formally test this and present the results in
Panel B in Table 9. Note that the difference in the average mispricing is significant
if we compare 2004 with 2002 and 2001, 2003 with 2001 and 2001 with 1998. This is
mostly due to the fact that average structure of convertible bond issues changed
from predominantly equity-like issues in late 1990s to more debt-like issues in 2003
and 2004 (as measured by delta). We have shown in previous sections that delta and
mispricing are significantly positively correlated. Secondly, this change towards
more debt-like issues corresponds in time to the decline in convertible arbitrage
returns in Table 8. Although we cannot provide direct evidence, since we do not have
data on particular hedge fund holdings, we see this as an additional explanation for
the deteriorating performance of convertible arbitrage.
Next, we look into convertible arbitrage returns in the case of our convertible bond
sample. We employ the simple convertible arbitrage strategy, where we go long in
one convertible bond at the issue date and short the appropriate number of
underlying stock (corresponding to conversion ratio) to achieve delta neutral hedge
at the issue date. We check two specifications of such portfolio. The first specification
is with the short position rebate included:
(6)
tCAP denotes convertible arbitrage portfolio at time t, tCBp denotes convertible
bond price at time t, tAInt denotes accrued interest at time t, 0Δ denotes delta value
of the convertible bond issue at time 0 (issue date), CR denotes conversion ratio, sitc
denotes short interest coverage ratio (maintenance coverage in the short account),
sirr denotes short interest rebate rate (we assume it is 75 percent of the yield on
comparable government bond) per period t, tS denotes stock price at time t and
tDiv denotes dividend at time t. In this strategy we do not rebalance the short

27
position as the delta changes over time and we also do not consider the so-called
short interest rebate. Short interest rebate refers to interest paid on the share of
proceeds of sale of shorted stock that needs to be kept with the broker as coverage
for future delivery of shorted stock. The second specification is without the short
position rebate:
(7)
We compute returns on convertible arbitrage portfolios as:
t t t-1rCAP =ln(CAP )-ln(CAP ) (8)
In Figure 6 we present the cumulative average return (buy at the issue and hold
strategy) for two sub-sample of more equity-like (delta>0.5) and more debt-
like(delta<0.5) convertibles for different portfolio strategies.
<Insert Figure 6 here>
From Figure 6 we observe that returns on convertible arbitrage are positive over
different time periods in cases of both equity- and debt-like convertibles. In the case
of equity-like convertibles convertible arbitrage earns a return of around 30 percent
in one year, while in the case of debt-like convertibles this is around 18 percent. This
result is driven by the very negative return on stock of around 35 percent in the case
of equity-like convertibles. This, coupled with higher delta, generates the positive
return difference for convertible arbitrage for equity-like convertibles. The returns
on the long position in convertible bonds, although positive for the first six months
(120 trading days) after the issue, turn negative after to –4 percent at the end of the
first year after the issue compared to the issue date price. In the case of debt-like
convertibles, which have very low delta, convertible arbitrage returns are higher
than returns on convertible bond by about 2 percentage points at the end of the first
year of trading. Contrary to the equity-like convertibles, the returns on convertible

28
bonds are positive for more debt-like convertibles. These results are consistent with
the returns on convertible arbitrage index presented in Table 8, where the highest
returns were recorded in downward pressured or stagnating stock markets and
years in which most of the issues were more equity-like (end of the nineties). Note
that returns on portfolio with included short interest rebate is as expected higher
with the difference of about 3 percentage points at the end of the first year of
convertible bond trading in the case of equity-like convertibles. In the case of debt-
like convertibles the difference between the two portfolio specifications is negligible
and not visible in Figure 6.
We have also inspected the returns on convertible arbitrage portfolio with time
varying delta and the results remain very much the same, as delta on average does
not vary much in time.
7. Conclusion
In this paper we investigate three issues. With respect to the wealth effects
associated with announcements and issues of convertible bonds we find sustained
downward pressure on cumulative average abnormal returns between the
announcement and the issuance date of the bond for more equity-like convertible
bonds (higher delta).
Secondly, we investigate whether the activities of investors engaged in convertible
arbitrage depress cumulative average abnormal returns between the announcement
and issuance dates. Since hedge funds do not report their holdings, we rely on series
of other evidence. Firstly, we investigate whether the convertible bonds in our
sample are underpriced as previously found in other studies. Next, we investigate a
link between the structure of the issue and underpricing. Finally, we investigate the
effect of underpricing on short sales of the underlying stock.
The reasoning we provide is the following. The arbitrage opportunity in the
convertible arbitrage strategy arises due to mispricing (underpricing) of the
convertible bond. The arbitrageur has to short sell delta stock to establish the so-

29
called neutral hedge. For more equity-like convertible bonds, which have higher
delta, this means relatively higher short interest than for more debt-like
convertibles. We first find that delta and underpricing are significantly positively
correlated. Additionally, we show that underpricing and cumulative average
abnormal returns between the announcement and issuance dates of a convertible
bond issue significantly negatively correlated. Finally, we show that underpricing
and relative short interest, measured as the ratio between short interest and
number of potentially newly issued shares in conversion, are significantly positively
correlated. In our opinion this constitutes several pieces of evidence to support our
premise that convertible arbitrage activities negatively affect cumulative average
abnormal returns between announcement and issuance dates. Convertible bond
issues with higher delta (more equity-like) exhibit higher degree of underpricing.
Higher delta of the issue and higher underpricing are significantly negatively
related to the cumulative average abnormal returns and significantly positively
related to short interest.
Finally, we argue that decreasing convertible arbitrage performance can also be
explained by changes in the structure of convertible debt issues in time, as
convertible bond issues have become increasingly more debt-like in the past several
years.

30
8. References
Ackert, L.F., and G. Athanassakos. The relationship between short interest and
stock returns in the Canadian market. Journal of Banking and Finance, 29:
1729-1749, 2005.
Ammann, M., A. Kind, and C. Wilde. Are convertible bonds underpriced? An
analysis of the French market. Journal of Banking and Finance, 27: 635-653,
2003.
Arshanapalli B., F. J. Fabozzi, L. N. Switzer, and G. Gosselin. New evidence on
the market impact of convertible bond issues in the U.S. Working paper, Indiana
University Northwest, Yale University and Concordia University, 2004.
Black, F., and Scholes, M. The pricing of options and corporate liabilities.
Journal of Political Economy, 81: 637-659, 1973.
Brennan, M.J., and E.S. Schwartz. Convertible bonds: Valuation and optimal
strategies for call and conversion. The Journal of Finance, 32: 1699–1715, 1977.
Brennan, M.J., and E.S. Schwartz. Analyzing convertible bonds. Journal of
Financial and Quantitative Analysis, 15: 907–929, 1980.
Calamos, N. P. Convertible Arbitrage: Insights and techniques for successful
hedging. John Wiley & Sons, Ltd, Hoboken, New Jersey, 2005.
Carayannopoulos, P., and M. Kalimipalli. Convertible bond prices and inherent
biases. The Journal of Fixed Income, 64-73, 2003.
Chan, A.W.H., and N.-F. Chen. Convertible bond underpricing: Renegotiable
covenants, seasoning and convergence. Working paper, The University of Hong
Kong and University of California, Irvine, 2005.
Fung, W., and D.A. Hsieh. Empirical characteristics of dynamic trading
strategies: the case of hedge funds. Review of Financial Studies, 10:275-302,
1997.
Grimwood, R. and S. Hodges. The valuation of convertible bonds: A Study of
Alternative Pricing Models. Working paper, Warwick University, 2002.
Ingersoll, J. A contingent-claims valuation of convertible securities. Journal of
Financial Economics, 4: 289-321, 1977.

31
Jarrow, R., and S. Turnbull. Pricing options and financial securities subject to
default risk. The Journal of Finance, 50: 53-86, 1995.
Kang, J.-K., and Y.W. Lee. The pricing of convertible debt offerings. Journal of
Financial Economics, 41: 231-248, 1996.
Kim, Y. O. Informative conversion ratios: A signaling approach. Journal of
Financial and Quantitative Analysis 25(2), 229–243, 1990.
King, R. Convertible bond valuation: An empirical test. The Journal of Financial
Research, 9: 53–69, 1986.
Lewis, M., Rogalski, R. J. and Seward, J. K. Is convertible debt a substitute for
straight debt or for common equity? Financial Management 28(3), 5–27, 1999.
Lhabitant, F.-S. Hedge Funds: Myths and limits. John Wiley & Sons, Ltd,
Chichester, 2002.
Loncarski, I., J. ter Horst, and C. Veld. Why do companies issue convertible
bonds? A review of theory and empirical evidence. forthcoming in Advances in
Corporate Finance and Asset Pricing, L.D.R. Renneboog (ed.), Elsevier,
Amsterdam, 2006.
Lummer S.L., and M.W. Riepe. Convertible bonds as an asset class: 1957-1992.
The Journal of Fixed Income, 47-56, 1993.
Merton, R.C. Theory of rational option pricing. Bell Journal of Economics and
Management Science, 4: 141-183, 1973.
Nyborg, K. The use and pricing of convertible bonds. Applied Mathematical
Finance, 3:167-190, 1996.
Tsiveriotis, K., and C. Fernandes. Valuing convertible bonds with credit risk. The
Journal of Fixed Income, 95-102, 1998.

32
Table 1 Descriptive statistics for maturity (in years), principal size (in millions Canadian Dollars), coupon rate,
delta, dividend yield, risk-free rate and volatility. Sd represents standard deviation, p25, p50 and p75
denote 25th, 50th and 75th percentile respectively. year variable N mean min max sd p25 p50 p75
maturity 9 8.605 5.017 10.156 2.270 6.969 10.147 10.147principal 9 71.222 3.000 100.000 38.842 75.000 80.000 100.000coupon 9 0.071 0.053 0.100 0.016 0.059 0.070 0.080delta 7 0.579 0.151 0.990 0.292 0.407 0.491 0.826dividend yield 7 0.032 0.000 0.142 0.052 0.000 0.000 0.044risk free rate 9 0.058 0.052 0.073 0.006 0.057 0.057 0.060volatility 9 0.485 0.244 1.309 0.417 0.257 0.279 0.349maturity 3 4.438 3.003 5.211 1.244 3.003 5.100 5.211principal 3 31.667 25.000 40.000 7.638 25.000 30.000 40.000coupon 3 0.107 0.100 0.120 0.012 0.100 0.100 0.120delta 3 0.269 0.247 0.307 0.033 0.247 0.253 0.307dividend yield 3 0.133 0.101 0.185 0.046 0.101 0.112 0.185risk free rate 3 0.056 0.051 0.067 0.009 0.051 0.052 0.067volatility 3 0.350 0.235 0.533 0.160 0.235 0.282 0.533maturity 7 5.755 5.078 7.117 0.947 5.097 5.142 7.103principal 7 47.429 7.000 150.000 51.300 12.500 20.000 75.000coupon 7 0.076 0.060 0.090 0.010 0.068 0.075 0.083delta 7 0.614 0.152 0.899 0.331 0.156 0.757 0.882dividend yield 7 0.035 0.000 0.115 0.052 0.000 0.000 0.103risk free rate 7 0.055 0.054 0.058 0.002 0.054 0.055 0.057volatility 7 0.548 0.155 1.064 0.367 0.165 0.412 0.850maturity 12 5.210 5.081 5.586 0.168 5.101 5.126 5.263principal 12 65.667 23.000 150.000 33.722 50.000 55.000 80.000coupon 12 0.089 0.078 0.100 0.006 0.085 0.088 0.094delta 12 0.368 0.000 0.859 0.286 0.150 0.289 0.598dividend yield 12 0.085 0.000 0.222 0.072 0.011 0.099 0.138risk free rate 12 0.052 0.044 0.056 0.005 0.045 0.055 0.055volatility 12 0.389 0.114 0.907 0.225 0.239 0.339 0.465maturity 11 6.344 3.800 10.181 1.801 5.097 5.531 7.597principal 11 100.028 25.000 220.000 67.638 40.000 77.813 150.000coupon 11 0.078 0.050 0.098 0.014 0.068 0.083 0.090delta 11 0.213 0.018 0.675 0.229 0.056 0.142 0.248dividend yield 11 0.090 0.013 0.178 0.055 0.024 0.094 0.120risk free rate 11 0.048 0.041 0.054 0.005 0.042 0.051 0.052volatility 11 0.228 0.093 0.503 0.142 0.139 0.178 0.308maturity 19 6.729 5.072 10.275 1.954 5.214 5.575 7.175principal 19 71.079 30.000 135.000 28.376 50.000 57.500 100.000coupon 19 0.073 0.060 0.090 0.009 0.065 0.070 0.080delta 18 0.142 0.003 0.683 0.162 0.040 0.118 0.186dividend yield 18 0.111 0.000 0.182 0.049 0.084 0.101 0.159risk free rate 19 0.047 0.041 0.056 0.006 0.042 0.043 0.053volatility 19 0.200 0.130 0.426 0.066 0.143 0.197 0.224maturity 61 6.413 3.003 10.275 1.951 5.103 5.331 7.136principal 61 70.603 3.000 220.000 44.508 40.000 60.000 100.000coupon 61 0.079 0.050 0.120 0.014 0.068 0.080 0.090delta 57 0.321 0.000 0.929 0.297 0.072 0.188 0.598dividend yield 58 0.084 0.000 0.222 0.062 0.023 0.093 0.127risk free rate 61 0.051 0.041 0.073 0.007 0.044 0.052 0.055volatility 61 0.331 0.093 1.309 0.262 0.175 0.235 0.350
2003
2004
Total
1998
1999
2001
2002

33
Table 2 Wealth effect associated with issuance dates of convertible debt issues for split subsamples according to
the delta measure. The CAAR window is relative to the issuance date (issuance date = 0), bold values
represent values, which are significantly different from zero, where zero denotes no effect. Difference in
means is computed as one-sided test, where under null CAAR for the more debt-like convertibles
(delta<0.5) are less or equal to CAAR for the mode equity-like convertibles (delta>0.5).
p-value CAAR p-value CAAR p-value CAAR-20 0 0.003 -0.58% 0.000 -6.11% 0.030 -5.52%-18 0 0.010 -0.49% 0.000 -4.82% 0.066 -4.33%-15 0 0.000 -0.89% 0.000 -4.62% 0.081 -3.74%-10 0 0.000 -0.97% 0.045 -1.49% 0.382 -0.52%-5 0 0.010 -0.37% 0.080 -1.25% 0.270 -0.88%-2 0 0.286 -0.08% 0.189 -0.70% 0.293 -0.62%0 1 0.000 -0.60% 0.301 -0.42% 0.615 0.18%0 3 0.278 -0.11% 0.446 0.09% 0.580 0.20%0 5 0.277 0.10% 0.129 -0.93% 0.237 -1.03%0 10 0.101 0.27% 0.498 0.00% 0.439 -0.26%0 15 0.003 0.59% 0.048 1.24% 0.387 0.65%0 20 0.217 0.17% 0.031 1.57% 0.360 1.40%
Delta > 0.5Delta < 0.5CAAR window
Difference in means
Table 3 Descriptive statistics for delta, different measures of mispricing (denoted misp, mispo and mispto) and
equity-to-debt component ratio (denoted ed). Sd represents standard deviation, cv represents coefficient
of variation, p25, p50 and p75 denote 25th, 50th and 75th percentile respectively. *** - denotes
significance at level below 1 percent; ** - denotes significance at the level below 5 percent. Under the
null means are equal to zero.
Panel A: Total sample of issues variable N mean min max sd cv p25 p50 p75delta 57 0.321 *** 0.000 0.929 0.297 0.925 0.072 0.188 0.598misp 51 0.097 *** -0.067 0.500 0.124 1.281 0.017 0.065 0.119mispo 55 0.101 *** -0.049 0.476 0.124 1.223 0.019 0.086 0.134mispto 50 0.003 -0.050 0.056 0.024 8.209 -0.005 0.000 0.018ed 61 1.065 *** 0.045 23.163 2.968 2.788 0.316 0.513 0.916
Panel B: subsample of issues with delta > 0.5 variable N mean min max sd cv p25 p50 p75delta 17 0.739 *** 0.575 0.929 0.122 0.165 0.619 0.757 0.856misp 13 0.239 *** 0.021 0.500 0.149 0.625 0.139 0.184 0.370mispo 15 0.218 *** -0.030 0.476 0.159 0.730 0.095 0.167 0.378mispto 12 0.003 -0.050 0.056 0.034 11.693 -0.015 0.000 0.028ed 17 2.296 ** 0.074 23.163 5.397 2.350 0.835 0.974 1.297

34
Panel C: subsample of issues with delta < 0.5 variable N mean min max sd cv p25 p50 p75delta 40 0.144 *** 0.000 0.422 0.112 0.778 0.044 0.149 0.201misp 36 0.040 *** -0.067 0.188 0.052 1.298 0.003 0.041 0.080mispo 38 0.052 *** -0.049 0.209 0.063 1.224 0.006 0.047 0.096mispto 36 0.004 -0.050 0.040 0.020 4.598 -0.005 0.001 0.019ed 40 0.411 *** 0.045 1.279 0.240 0.584 0.252 0.403 0.549
Panel D: difference in means between the subsamples (Panel C – Panel B) variable t p-valuedelta -0.665 -0.524 -17.213 0.000misp -0.290 -0.107 -4.696 0.000mispo -0.257 -0.077 -3.933 0.000mispto -0.021 0.023 0.134 0.552ed -4.661 0.890 -1.440 0.085
-0.1670.001-1.885
difference in means 95% confidence interval-0.595-0.198
Table 4 Correlations between different measures of mispricing, equity-to-debt component ratio and delta
measure. The first number in each field is coefficient of correlation, the second number is p-value and
the third number is number of observations respectively.
delta ed misp mispo misptodelta
ed 0.3705*0.005
57misp 0.7581* 0.5152*
0.000 0.00049 51
mispo 0.6614* 0.4984* 0.9756*0.000 0.000 0.000
53 55 50mispto -0.137 -0.177 -0.099 0.121
0.354 0.220 0.496 0.40448 50 50 50

35
Table 5 OLS regressions of cumulative average abnormal returns (CAAR) of windows between 0 up to 30 days
after the issue announcement on mispricing.
Panel A: model statistics
Panel B: model results
Event window Obs R2 F-test p-value0,7 51 0.142 8.131 0.00640,11 51 0.142 8.083 0.00650,14 51 0.161 9.396 0.00350,18 51 0.119 6.613 0.01320,22 51 0.098 5.314 0.02540,30 51 0.009 0.444 0.5081
coef. SE t p-value0,7 misp -0.1890 0.0663 -2.85 0.01 -0.3221 -0.0558
_cons -0.0095 0.0103 -0.92 0.36 -0.0303 0.01120,11 misp -0.1908 0.0671 -2.84 0.01 -0.3256 -0.0559
_cons -0.0145 0.0105 -1.38 0.17 -0.0355 0.00660,14 misp -0.2319 0.0757 -3.07 0.00 -0.3839 -0.0799
_cons -0.0181 0.0118 -1.53 0.13 -0.0418 0.00560,18 misp -0.2213 0.0860 -2.57 0.01 -0.3942 -0.0484
_cons -0.0174 0.0134 -1.30 0.20 -0.0443 0.00960,22 misp -0.2093 0.0908 -2.31 0.03 -0.3917 -0.0268
_cons -0.0095 0.0142 -0.67 0.50 -0.0380 0.01890,30 misp -0.0685 0.1028 -0.67 0.51 -0.2751 0.1381
_cons -0.0163 0.0160 -1.02 0.31 -0.0485 0.0159
[95% Conf. interval]Event window
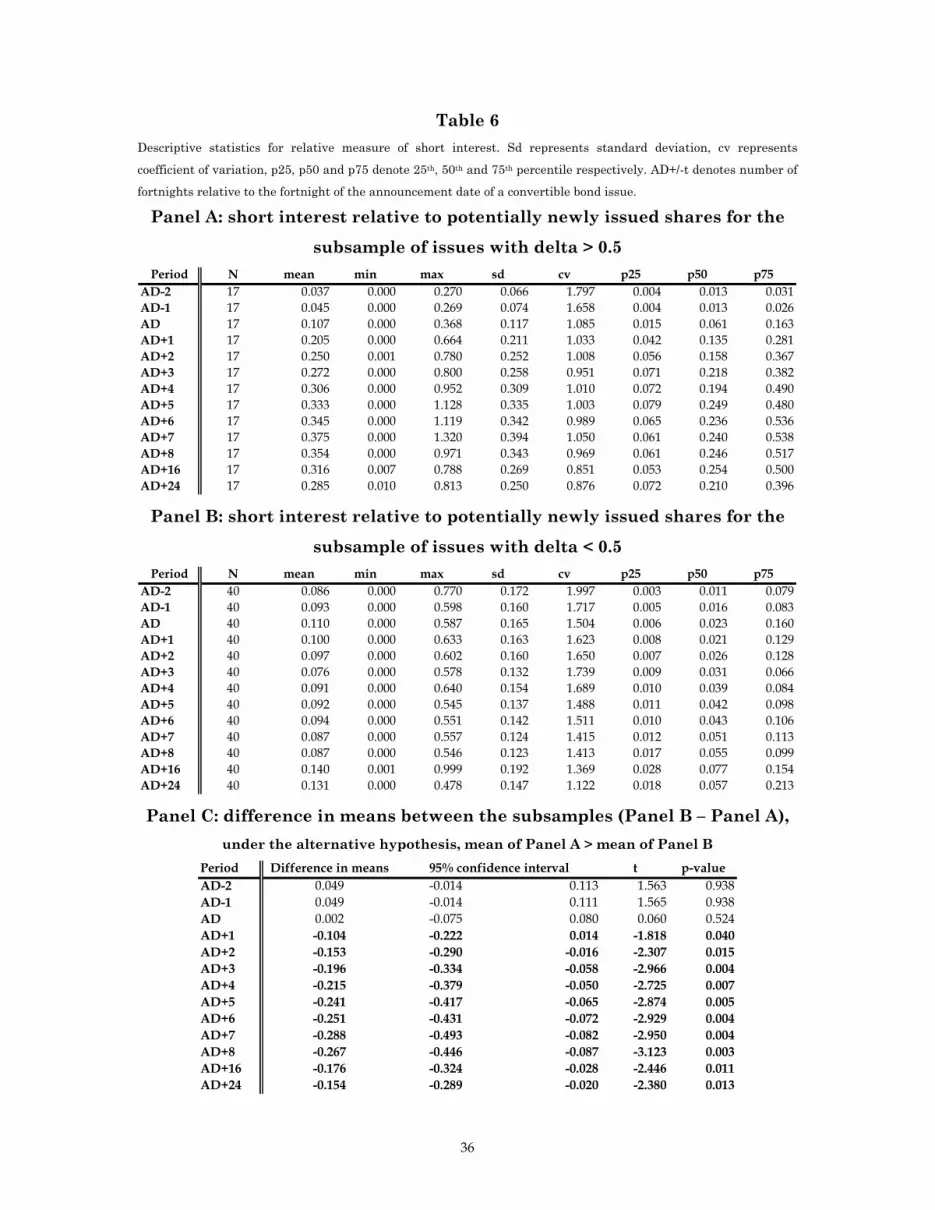
36
Table 6 Descriptive statistics for relative measure of short interest. Sd represents standard deviation, cv represents
coefficient of variation, p25, p50 and p75 denote 25th, 50th and 75th percentile respectively. AD+/-t denotes number of
fortnights relative to the fortnight of the announcement date of a convertible bond issue.
Panel A: short interest relative to potentially newly issued shares for the
subsample of issues with delta > 0.5 Period N mean min max sd cv p25 p50 p75
AD-2 17 0.037 0.000 0.270 0.066 1.797 0.004 0.013 0.031AD-1 17 0.045 0.000 0.269 0.074 1.658 0.004 0.013 0.026AD 17 0.107 0.000 0.368 0.117 1.085 0.015 0.061 0.163AD+1 17 0.205 0.000 0.664 0.211 1.033 0.042 0.135 0.281AD+2 17 0.250 0.001 0.780 0.252 1.008 0.056 0.158 0.367AD+3 17 0.272 0.000 0.800 0.258 0.951 0.071 0.218 0.382AD+4 17 0.306 0.000 0.952 0.309 1.010 0.072 0.194 0.490AD+5 17 0.333 0.000 1.128 0.335 1.003 0.079 0.249 0.480AD+6 17 0.345 0.000 1.119 0.342 0.989 0.065 0.236 0.536AD+7 17 0.375 0.000 1.320 0.394 1.050 0.061 0.240 0.538AD+8 17 0.354 0.000 0.971 0.343 0.969 0.061 0.246 0.517AD+16 17 0.316 0.007 0.788 0.269 0.851 0.053 0.254 0.500AD+24 17 0.285 0.010 0.813 0.250 0.876 0.072 0.210 0.396
Panel B: short interest relative to potentially newly issued shares for the
subsample of issues with delta < 0.5 Period N mean min max sd cv p25 p50 p75
AD-2 40 0.086 0.000 0.770 0.172 1.997 0.003 0.011 0.079AD-1 40 0.093 0.000 0.598 0.160 1.717 0.005 0.016 0.083AD 40 0.110 0.000 0.587 0.165 1.504 0.006 0.023 0.160AD+1 40 0.100 0.000 0.633 0.163 1.623 0.008 0.021 0.129AD+2 40 0.097 0.000 0.602 0.160 1.650 0.007 0.026 0.128AD+3 40 0.076 0.000 0.578 0.132 1.739 0.009 0.031 0.066AD+4 40 0.091 0.000 0.640 0.154 1.689 0.010 0.039 0.084AD+5 40 0.092 0.000 0.545 0.137 1.488 0.011 0.042 0.098AD+6 40 0.094 0.000 0.551 0.142 1.511 0.010 0.043 0.106AD+7 40 0.087 0.000 0.557 0.124 1.415 0.012 0.051 0.113AD+8 40 0.087 0.000 0.546 0.123 1.413 0.017 0.055 0.099AD+16 40 0.140 0.001 0.999 0.192 1.369 0.028 0.077 0.154AD+24 40 0.131 0.000 0.478 0.147 1.122 0.018 0.057 0.213 Panel C: difference in means between the subsamples (Panel B – Panel A),
under the alternative hypothesis, mean of Panel A > mean of Panel B Period t p-valueAD-2 -0.014 0.113 1.563 0.938AD-1 -0.014 0.111 1.565 0.938AD -0.075 0.080 0.060 0.524AD+1 -0.222 0.014 -1.818 0.040AD+2 -0.290 -0.016 -2.307 0.015AD+3 -0.334 -0.058 -2.966 0.004AD+4 -0.379 -0.050 -2.725 0.007AD+5 -0.417 -0.065 -2.874 0.005AD+6 -0.431 -0.072 -2.929 0.004AD+7 -0.493 -0.082 -2.950 0.004AD+8 -0.446 -0.087 -3.123 0.003AD+16 -0.324 -0.028 -2.446 0.011AD+24 -0.289 -0.020 -2.380 0.013
Difference in means 95% confidence interval0.0490.0490.002-0.104-0.153-0.196
-0.267-0.176-0.154
-0.215-0.241-0.251-0.288

37
Panel D: changes in short interest compared to the previous period for the
subsample of issues with delta > 0.5 (short interest relative to potentially
newly issued shares) Period N mean min max sd cv p25 p50 p75
AD-1 17 0.008 -0.015 0.109 0.029 3.731 -0.001 0.000 0.002AD 17 0.063 -0.002 0.228 0.069 1.106 0.007 0.054 0.096AD+1 17 0.097 0.000 0.328 0.103 1.061 0.018 0.070 0.157AD+2 17 0.045 -0.008 0.153 0.053 1.167 0.001 0.020 0.085AD+3 17 0.022 -0.027 0.105 0.036 1.658 0.000 0.007 0.026AD+4 17 0.034 -0.105 0.457 0.122 3.544 0.000 0.001 0.021AD+5 17 0.027 -0.016 0.175 0.049 1.777 0.000 0.005 0.037AD+6 17 0.012 -0.064 0.066 0.031 2.633 -0.001 0.008 0.023AD+7 17 0.030 -0.166 0.647 0.166 5.580 -0.010 0.000 0.009AD+8 17 -0.021 -0.393 0.038 0.097 -4.594 -0.006 0.000 0.003
Panel D: changes in short interest compared to the previous period for the
subsample of issues with delta < 0.5 (short interest relative to potentially
newly issued shares) Period N mean min max sd cv p25 p50 p75
AD-1 40 0.007 -0.358 0.306 0.079 11.419 -0.002 0.001 0.011AD 40 0.017 -0.186 0.251 0.071 4.265 -0.005 0.001 0.017AD+1 40 -0.009 -0.379 0.320 0.091 -9.685 -0.018 0.000 0.007AD+2 40 -0.003 -0.560 0.330 0.117 -37.750 -0.003 0.000 0.007AD+3 40 -0.021 -0.486 0.040 0.087 -4.080 -0.010 0.000 0.008AD+4 40 0.015 -0.041 0.348 0.059 3.835 -0.005 0.000 0.017AD+5 40 0.001 -0.537 0.342 0.105 134.931 -0.006 0.000 0.011AD+6 40 0.002 -0.074 0.114 0.032 17.266 -0.008 0.000 0.009AD+7 40 -0.007 -0.418 0.127 0.077 -11.637 -0.004 0.000 0.017AD+8 40 0.000 -0.123 0.053 0.030 -249.111 -0.005 0.000 0.011

38
Table 7 Correlations between different measures of mispricing and relative short interest (measured as a ratio between short interest and potential number of
newly issued shares). AD+/-t denotes fortnights relative to the fortnight of the announcement date. The first number in each field is coefficient of
correlation and the second number is a p-value respectively. misp mispto AD+1 AD+2 AD+3 AD+4 AD+5 AD+6 AD+7 AD+8 AD+9 AD+10 AD+11 AD+12
misp
mispto -0.01720.9055
AD+1 0.1678 0.2674*0.2392 0.0529
AD+2 0.2133 0.3049* 0.8499*0.1329 0.0264 0
AD+3 0.3030* 0.222 0.8423* 0.9247*0.0307 0.1101 0 0
AD+4 0.3288* 0.194 0.7853* 0.8818* 0.9315*0.0185 0.1639 0 0 0
AD+5 0.3831* 0.1822 0.8143* 0.8511* 0.9095* 0.9267*0.0055 0.1917 0 0 0 0
AD+6 0.3808* 0.1691 0.8067* 0.8293* 0.9012* 0.9186* 0.9914*0.0058 0.2261 0 0 0 0 0
AD+7 0.3255* 0.1751 0.7495* 0.7930* 0.8928* 0.8854* 0.9064* 0.9063*0.0198 0.2098 0 0 0 0 0 0
AD+8 0.3729* 0.1908 0.7920* 0.8285* 0.9291* 0.9212* 0.9438* 0.9391* 0.9794*0.007 0.1711 0 0 0 0 0 0 0
AD+9 0.4219* 0.1759 0.7777* 0.8036* 0.9151* 0.9072* 0.9393* 0.9345* 0.8771* 0.9462*0.002 0.2077 0 0 0 0 0 0 0 0
AD+10 0.4174* 0.1905 0.7541* 0.7899* 0.8957* 0.9055* 0.9208* 0.9152* 0.8652* 0.9225* 0.9798*0.0023 0.1719 0 0 0 0 0 0 0 0 0
AD+11 0.4002* 0.1978 0.7518* 0.7681* 0.8751* 0.8781* 0.9063* 0.9094* 0.8589* 0.9156* 0.9716* 0.9687*0.0036 0.1556 0 0 0 0 0 0 0 0 0 0
AD+12 0.4161* 0.1891 0.7591* 0.7702* 0.8731* 0.8685* 0.9104* 0.9161* 0.8519* 0.9076* 0.9680* 0.9611* 0.9867*0.0024 0.1749 0 0 0 0 0 0 0 0 0 0 0

39
Table 8 Convertible arbitrage performance index and equity indices. Data provided by CFSB/Tremont
HedgeIndex (http://www.hedgeindex.com)
Year HEDG CA MSCI World Index S&P 500 2005 -3.48% 7.61% 4.88% 2004 1.98% 15.25% 10.88% 2003 12.90% 33.76% 28.68% 2002 4.05% -19.54% -22.10% 2001 14.58% -16.52% -11.89% 2000 25.64% -12.92% -9.10% 1999 16.04% 25.34% 21.04% 1998 -4.41% 24.80% 28.58% 1997 14.48% 16.23% 33.36% 1996 17.87% 14.00% 22.96% 1995 16.57% 21.32% 37.58% 1994 -8.07% 5.58% 1.32%
Table 9 Mean and median values of delta and mispricing across years.
Panel A: Mean and median values of delta and mispricing across years.
year variable N mean median
delta 7 0.613 0.760misp 5 0.072 0.089delta 3 0.270 0.255misp 1 0.093 0.093delta 7 0.613 0.757misp 6 0.276 0.318delta 12 0.368 0.288misp 10 0.129 0.092delta 11 0.239 0.141misp 11 0.061 0.059delta 17 0.111 0.117misp 18 0.047 0.021delta 57 0.321 0.188misp 51 0.097 0.065
2001
1999
1998
Total
2004
2003
2002

40
Panel B: difference in means between different years (year 1 – year 2)
year 1 year 2 difference t p-value1998 2001 -0.204 -0.408 0.001 -2.467 0.0251998 2002 -0.056 -0.153 0.041 -1.250 0.1171998 2003 0.011 -0.047 0.070 0.420 0.3401998 2004 0.025 -0.030 0.080 0.957 0.1762001 2002 0.148 -0.058 0.353 1.636 0.0692001 2003 0.215 0.011 0.419 2.594 0.0212001 2004 0.229 0.024 0.433 2.771 0.0172002 2003 0.068 -0.030 0.165 1.482 0.0802002 2004 0.081 -0.015 0.178 1.809 0.0462003 2004 0.013 -0.043 0.070 0.494 0.313
95% confidence intervaldifference in means

41
Figure 1 Wealth effects associated with announcement and issuance dates of convertible debt issues for split
subsamples according to the delta measure
-30 -20 -10 0 10 20 30 40 50 60-0.08
-0.06
-0.04
-0.02
0
0.02
0.04
0.06
Announcement date - t
CA
AR
Delta < 0.5Delta > 0.5
-30 -20 -10 0 10 20 30 40 50-0.07
-0.06
-0.05
-0.04
-0.03
-0.02
-0.01
0
0.01
0.02
0.03
Issue date - t
CA
AR
Delta < 0.5Delta > 0.5

42
Figure 2 Kernel density plots for the split sample according to the delta measure
02
46
8ke
rnel
den
sity
-.2 0 .2 .4 .6model price compared to the 1st trading price
Delta>0.5 Delta<0.5
02
46
kern
el d
ensi
ty
-.2 0 .2 .4 .6model price compared to the offer price
Delta>0.5 Delta<0.5
05
1015
20ke
rnel
den
sity
-.05 0 .051st trading price compared to the offer price
Delta>0.5 Delta<0.5
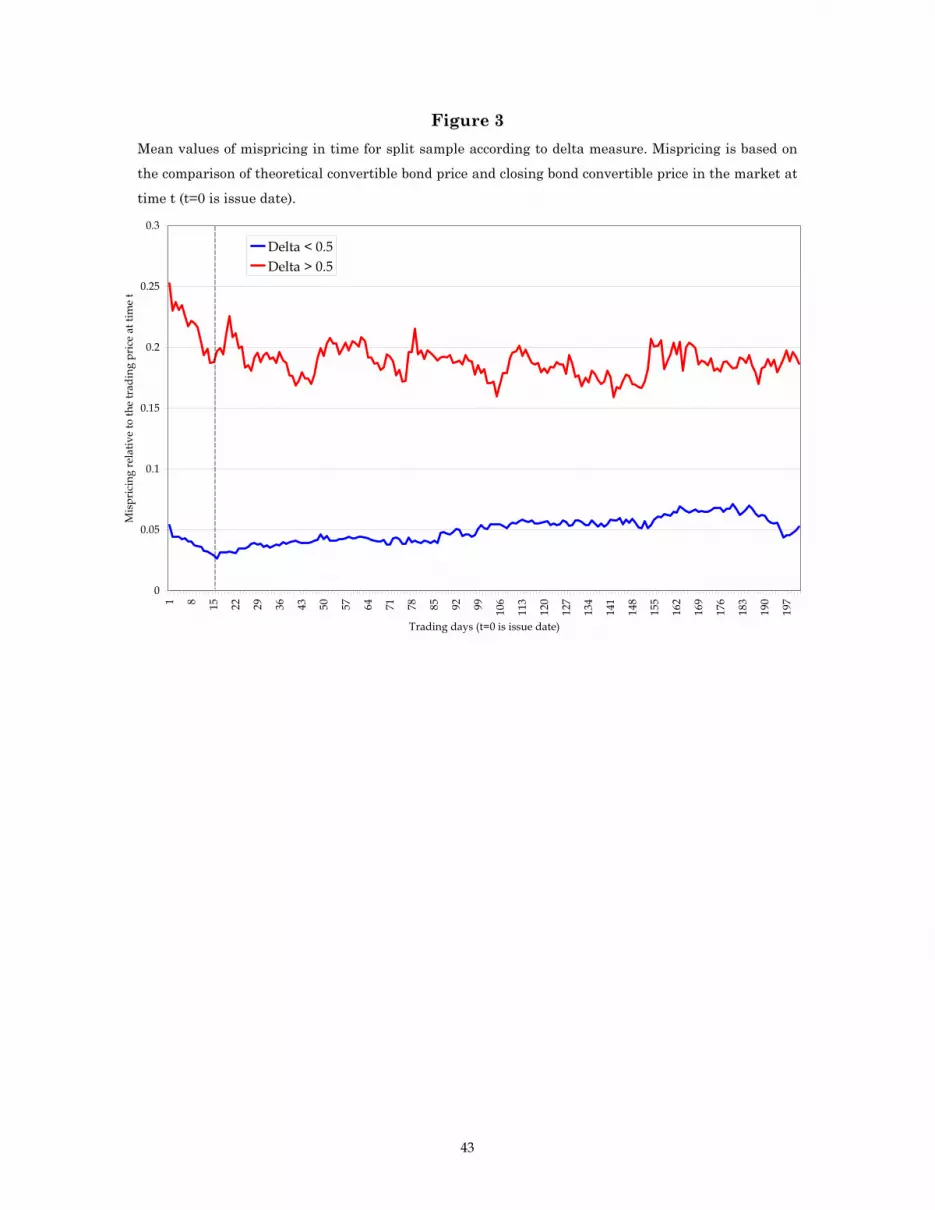
43
Figure 3 Mean values of mispricing in time for split sample according to delta measure. Mispricing is based on
the comparison of theoretical convertible bond price and closing bond convertible price in the market at
time t (t=0 is issue date).
0
0.05
0.1
0.15
0.2
0.25
0.3
1 8 15 22 29 36 43 50 57 64 71 78 85 92 99 106
113
120
127
134
141
148
155
162
169
176
183
190
197
Trading days (t=0 is issue date)
Mis
pric
ing
rela
tive
to th
e tr
adin
g pr
ice
at ti
me
t
Delta < 0.5Delta > 0.5

44
Figure 4 Mean values of mispricing in time for split sample according to delta measure. Mispricing is based on
the comparison of closing convertible bond trading price in the market and offer price at time t (t=0 is
issue date).
-0.08
-0.06
-0.04
-0.02
0
0.02
0.04
0.06
0.08
0.1
0.12
1 7 13 19 25 31 37 43 49 55 61 67 73 79 85 91 97 103
109
115
121
127
133
139
145
151
157
163
169
175
181
187
193
199
Trading days (t=0 is issue date)
Mis
pric
ing
rela
tive
to th
e of
fer p
rice
at t
ime
t=0
Delta > 0.5Delta < 0.5

45
Figure 5 Median and mean values of short interest (measured as a ratio between short interest and potential
number of newly issued shares) in time for split sample according to delta measure. AD+/-t denotes
fortnights relative to the fortnight of the announcement date.
0
0.05
0.1
0.15
0.2
0.25
0.3
0.35
AD-2AD-1 AD
AD+1AD+2
AD+3AD+4
AD+5AD+6
AD+7AD+8
AD+9
AD+10
AD+11
AD+12
AD+13
AD+14
AD+15
AD+16
AD+17
AD+18
AD+19
AD+20
AD+21
AD+22
AD+23
AD+24
Rel
ativ
e sh
are
of th
e is
sue
- med
ian
valu
es
Delta > 0.5Delta < 0.5
time between the announcement and the issue
after the issue
0
0.05
0.1
0.15
0.2
0.25
0.3
0.35
0.4
AD-2AD-1 AD
AD+1AD+2
AD+3AD+4
AD+5AD+6
AD+7AD+8
AD+9
AD+10
AD+11
AD+12
AD+13
AD+14
AD+15
AD+16
AD+17
AD+18
AD+19
AD+20
AD+21
AD+22
AD+23
AD+24
Rel
ativ
e sh
are
of th
e is
sue
- mea
n va
lues
Delta>0.5Delta<0.5
time between the announcement and the issue
after the issue

46
Figure 6 Cumulative average convertible bond returns, raw stock price returns and convertible arbitrage
returns for convertible arbitrage portfolio as defined in equations (6) and (7) for the sub-samples based
on the constant delta value.
0 50 100 150 200 250-0.5
-0.4
-0.3
-0.2
-0.1
0
0.1
0.2
0.3
0.4
Trading days relative to issue date (t=0)
Cum
ulat
ive
Ave
rage
Ret
urn
Stock RAWR delta<0.5Stock RAWR delta > 0.5CB Arbitrage delta < 0.5CB Arbitrage delta > 0.5Long CB delta < 0.5Long CB delta > 0.5CB Arbitrage w. short interest rebate delta > 0.5