controlling hydrocracker temperature excurions
TRANSCRIPT
Controlling Hydrocracker Temperature Excursions
2011 Q&A; PD-11-01 Page 1 of 27 Updated 06Oct2011
NPRA Q&A and Technology Forum Plant Automation & Decision Support October 9-12, 2011 JW Marriott Hill Country Resort & Spa San Antonio, TX
PD-11-01 Controlling Hydrocracker Temperature Excursions
Presented By: Gregory W Hampton Paul R. Robinson Advanced Process Control Engineer Senior Engineer, Hydrocracker Technical Service CITGO Petroleum Corporation Criterion Catalysts & Technologies LP Lake Charles, LA Houston, TX
Controlling Hydrocracker Temperature Excursions
2011 Q&A; PD-11-01 Page 2 of 27 Updated 06Oct2011
Abstract The hydrocracker at the CITGO Lake Charles Manufacturing Complex in Louisiana upgrades gas oils and cycle oils to naphtha, jet fuel and diesel fuel in the presence of hydrogen. The unit has eight fixed catalyst beds in series – three beds in a pretreat reactor and five beds in two cracking reactors. The inlet temperature of the first cracking bed is controlled with a hydrogen heater and a recycle oil heater. The remaining bed inlet temperatures are controlled with hydrogen quench. Overall, hydrocracking reactions are highly exothermic, so design and operation revolve around heat control. A high temperature excursion can lead to loss of hydrocarbon containment, catalyst deactivation and lost production. Excursions can be avoided with hydrogen quench, reduced heater firing and reduced preheat. The last resort is unit depressurization, which is very disruptive to operations. Conventional quench control strategies have a bed inlet temperature controller for each bed. Here each cracking bed has a bed inlet temperature controller with overrides for three constraints: peak temperature, quench demand and output negative rate of change. The quench demand of each bed is calculated based on the peak bed temperature and the bed rate of change in °F/min. The quench demand constraint provides early detection of a temperature excursion with the appropriate preemptive action.
Controlling Hydrocracker Temperature Excursions
2011 Q&A; PD-11-01 Page 3 of 27 Updated 06Oct2011
What Is a Temperature Excursion? In hydroprocessing units, a temperature excursion is a sudden and large temperature increase caused by chemical reactions. In practical terms, an excursion can be defined as high rate of rise in temperature (2nd derivative expression) that exceeds a predefined limit. In the absence of a rate-of-rise calculation and an associated alarm, an excursion becomes apparent when it triggers high or high-high temperature alarms. In addition to notifying operators, certain alarms induce automatic remedial action, such as increased quench-gas flow upstream from the high temperature reading(s), reduced heater firing, and/or emergency depressuring. Related process parameters—related because they can and have been associated with excursions—include limits on peak temperatures, limits on axial temperature rise, and limits on radial temperature distribution. Most hydroprocessing temperature excursions occur in hydrocrackers—all kinds, including fixed-bed, ebullating bed, and slurry phase units. They can also occur in hydrotreaters, especially those that process feeds containing large amounts of highly reactive compounds such as olefins and ethers. The initial wetting of catalysts during a startup can cause temperature spikes, but wetting is a physical, not a chemical phenomenon. It poses a risk only when it triggers cracking reactions. Consequences The consequences of a temperature excursion can be severe. As stated in the preamble of Reference [1]: “On January 21, 1997, an explosion and fire occurred at the Hydrocracker Unit of the Tosco Refinery at Martinez, California.” “The accident involved the release and autoignition of a mixture of flammable hydrocarbons and hydrogen under high temperature and pressure.” Relevant Chemistry Why are hydrocrackers more susceptible to temperature excursions than hydrotreaters? To answer to this common question, one can consider four factors—heats of reaction, relative concentrations of reactants, activation energy, and “putting on the brakes.”
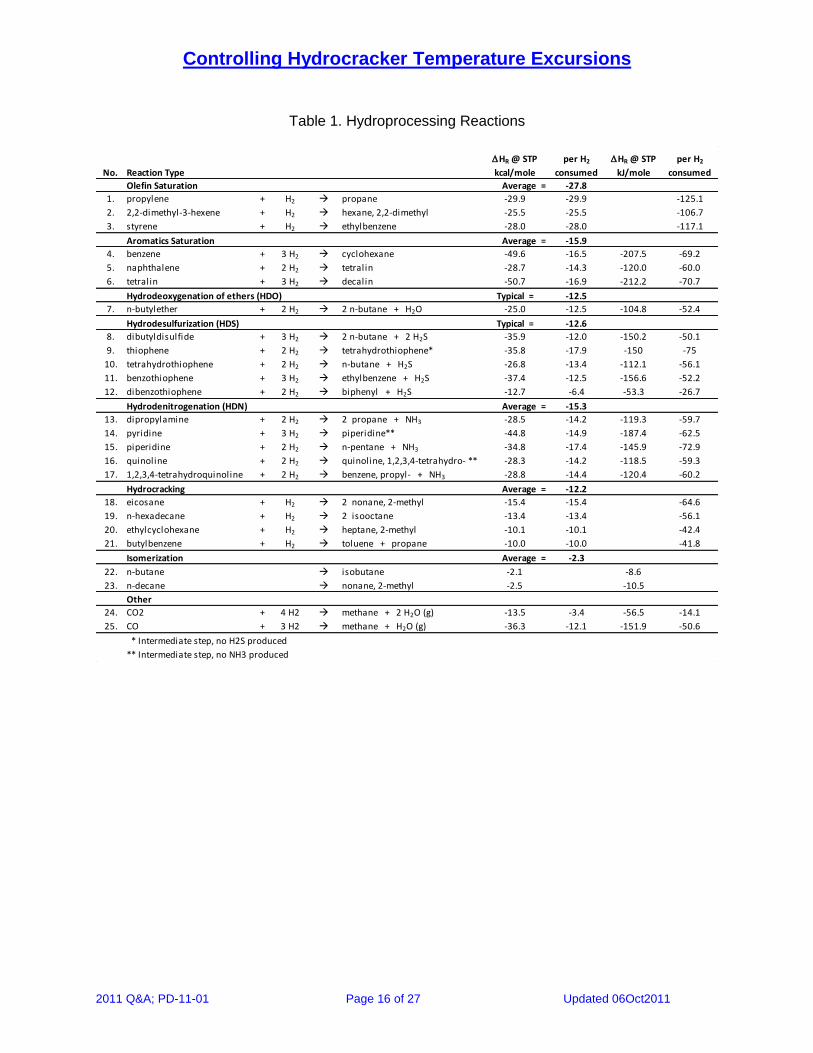
1. Heats of reaction. Hydrotreating reactions include olefin saturation (OSAT), aromatic saturation (ASAT), hydrodesulfurization (HDS), hydrodenitrogenation (HDN) and hydrodeoxygenation (HDO). We define hydrocracking reactions as those that rupture carbon-carbon bonds. Table 1 shows standard heats of reaction per mole of consumed hydrogen for selected hydrotreating and hydrocracking reactions. The heats of reaction in the table were calculated based on standard enthalpies of formation from the NIST Chemistry WebBook [2]. The calculations should be used with caution, because heats of reaction—especially for reactions involving the saturation and polymerization of aromatics—vary with temperature.
Isomerization and coking also occur in hydrotreating units. Isomerization does not consume hydrogen, but it does release some heat. Coking due to the condensation of poly-ring compounds leads to catalyst deactivation. Calculations show that during a typical two-year catalyst cycle with a light VGO feedstock, about 5-10 wppm of the feed
Controlling Hydrocracker Temperature Excursions
2011 Q&A; PD-11-01 Page 4 of 27 Updated 06Oct2011
ends up as coke on the main catalysts [3]. Coking is endothermic and produces hydrogen, but during normal operation in hydrocrackers, it occurs to such a small extent that its impact on heat balance can be neglected.
At standard conditions, olefin saturation produces the most heat, about 28 kcal/mole per mole of consumed hydrogen. The other reactions in the table, including hydrocracking, produce between 10-16 kcal/mole. Therefore, in the absence of other factors, relative heats of reaction do not explain why hydrocracking is more susceptible to temperature excursions.
2. Relative concentrations of reactants. Feeds contain finite, small amounts of sulfur,
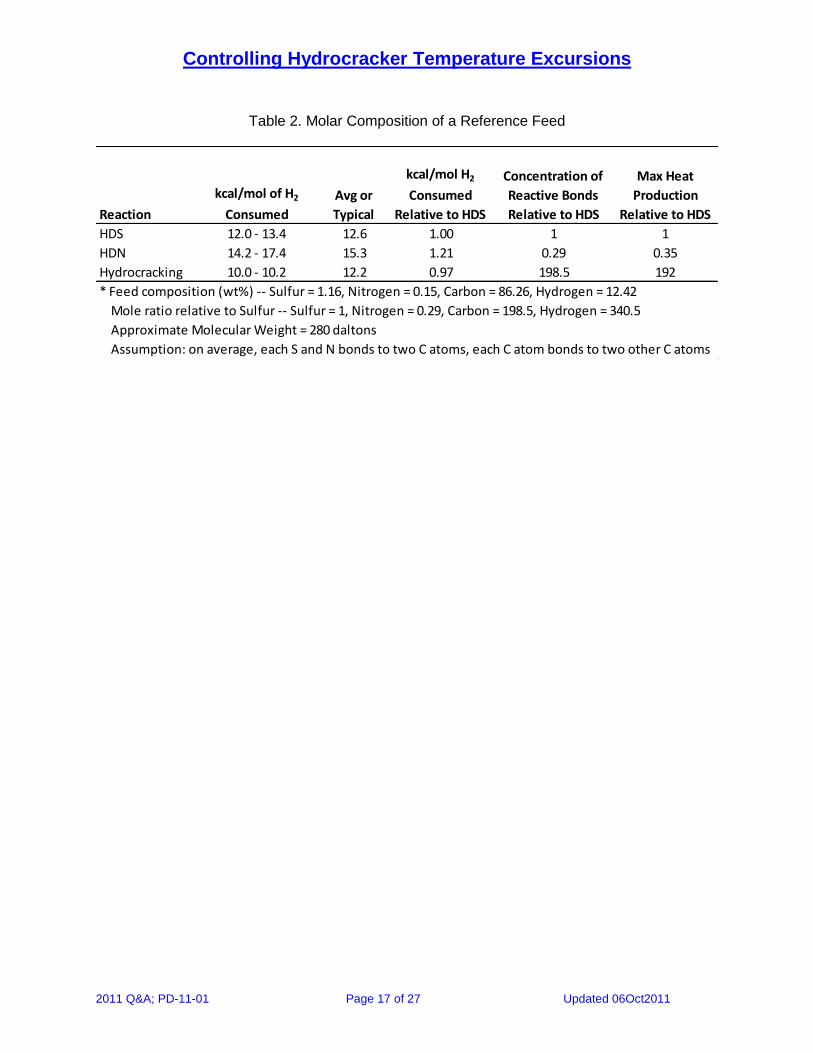
nitrogen, olefins, and aromatics, but they contain a virtually “unlimited” supply of crackable carbon-carbon bonds. Consider a reference feed with the properties shown in Table 2. If the average molecular weight of the feed is 280 daltons, the ratio of carbon/sulfur atoms is about 200 to 1. If one assumes that, on average, each sulfur atom in a hydrotreater feedstock is bound to two carbon atoms, and each carbon atom is bound to two other carbon atoms, “ultimate hydrocracking”—converting all of the carbon to methane—could release about 200 times more heat than “ultimate HDS”—converting all of the sulfur into H2S.
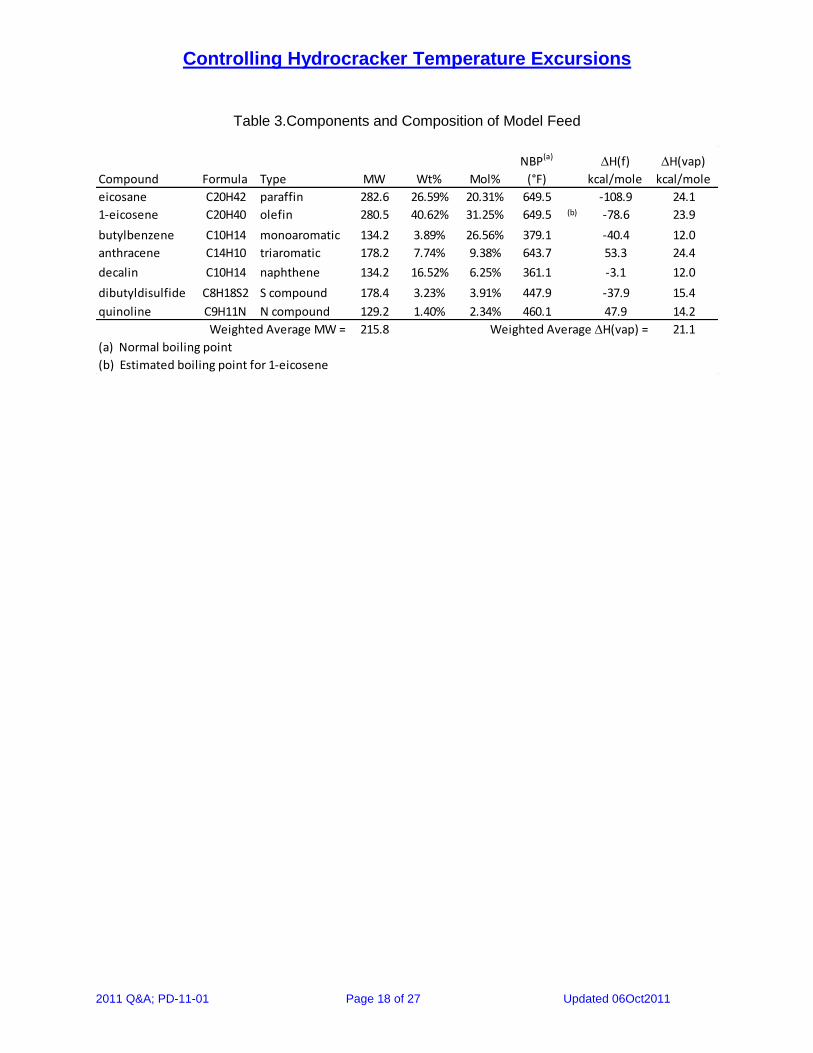
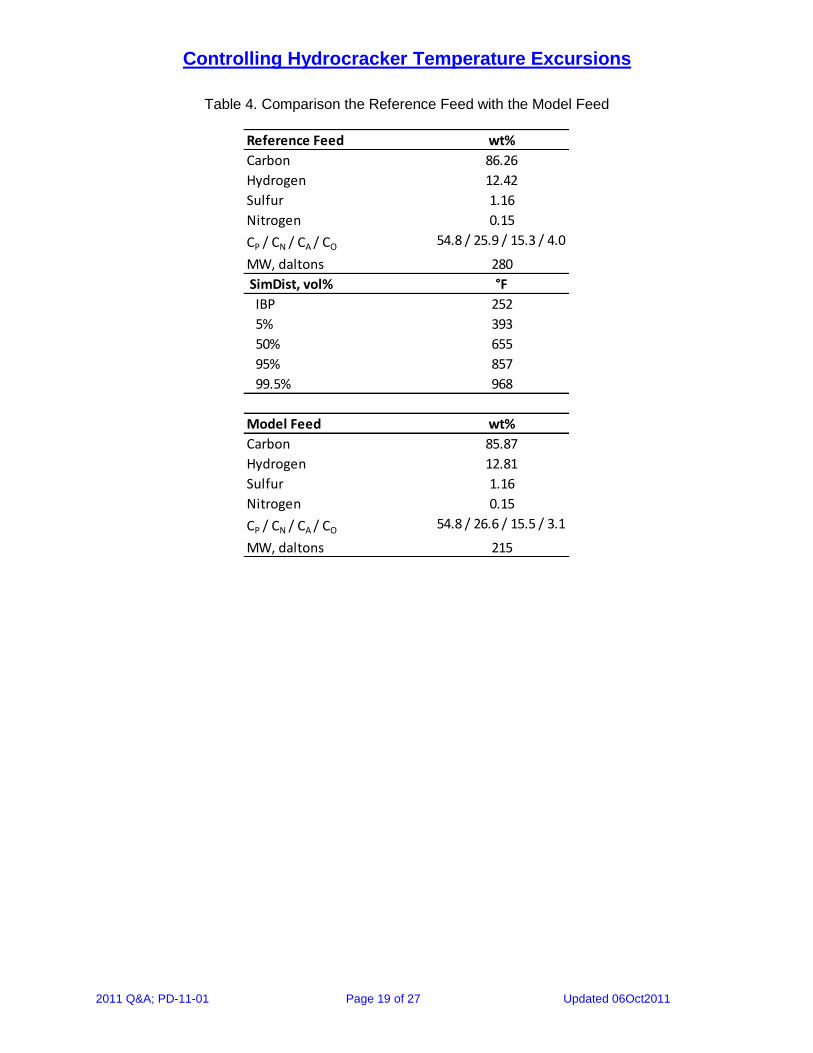
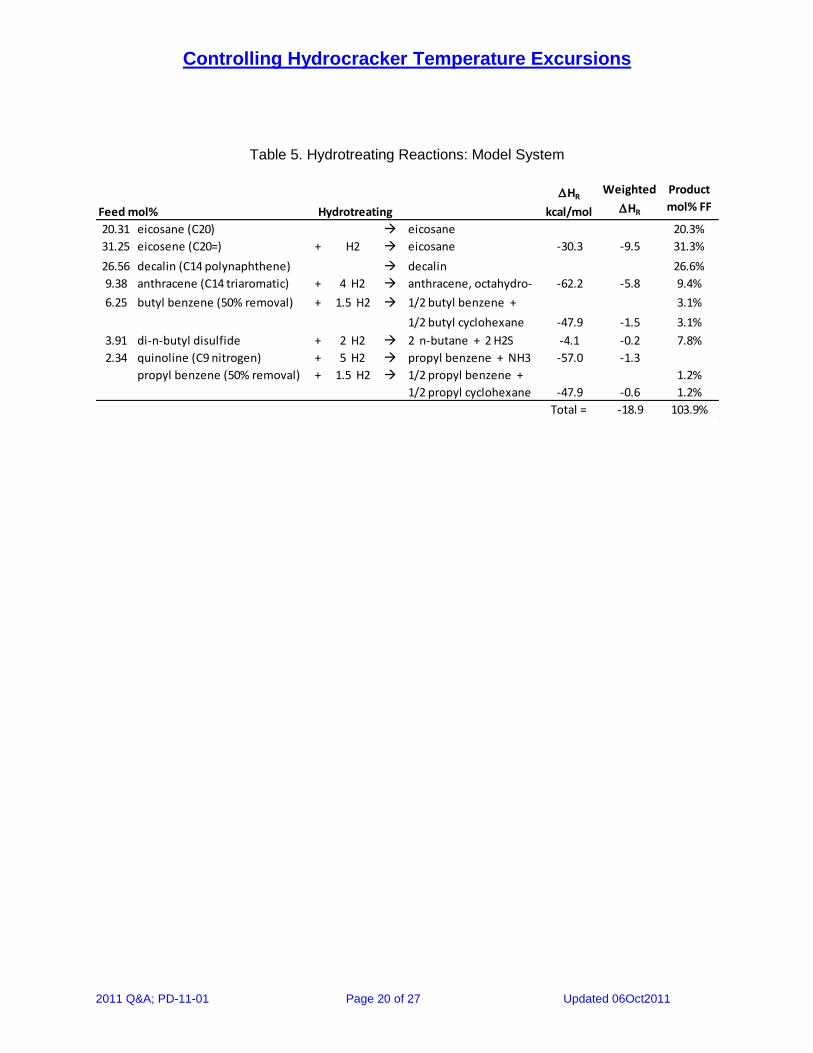
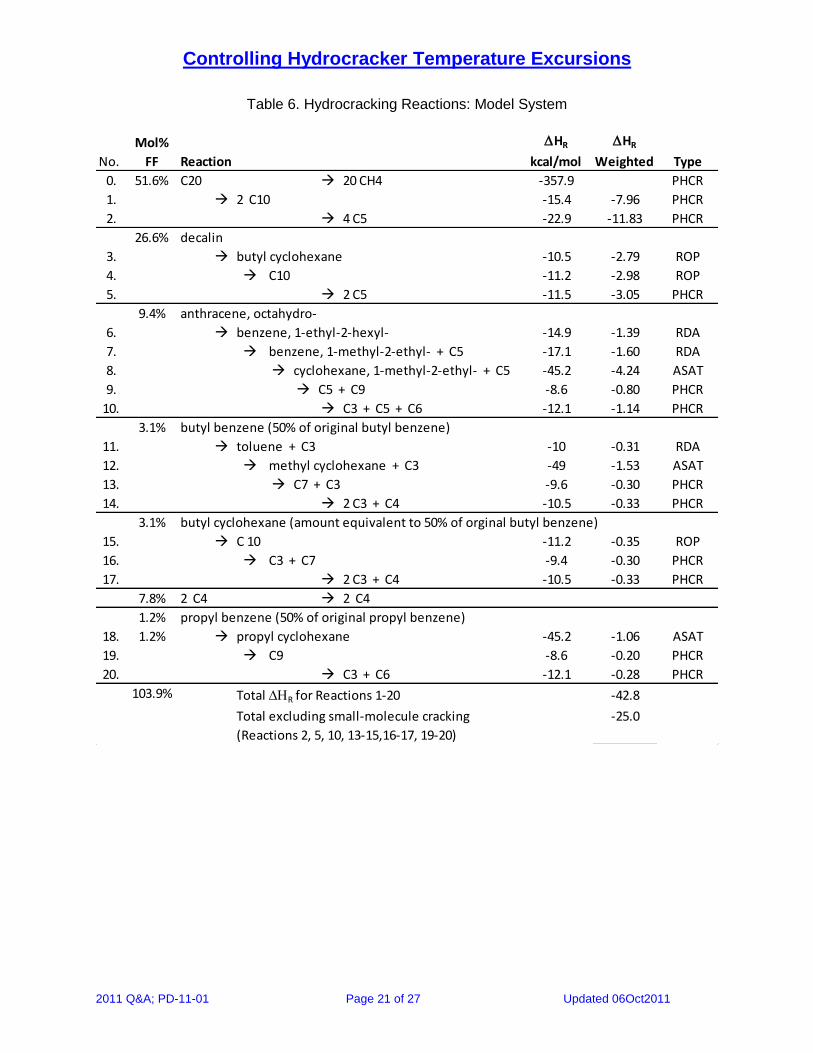
Ultimate HDS occurs in hydroprocessing units that make ULSD. But ultimate hydrocracking is (thankfully) impractical. To model the problem in a more useful way, we performed heat-of-reaction calculations on a theoretical blend of seven pure components. Table 3 presents the heats of formation, normal boiling points and heats of vaporization of the model components. Table 4 compares the weighted average properties of the model feed to a reference feed. The weighted average C, H, S, N and olefin contents of the model feed match the reference feed fairly well. There is also a good match for CP, CN, CA, and CO, which in this case are the relative percents of carbon atoms in paraffins groups, naphthene rings, aromatic rings, and olefinic bonds. The weighted average molecular weight of the model mixture is low—215 daltons versus 280 daltons—mostly because we needed a naphthene, and decalin (MW = 134.2) was the largest one for which we could find heat-of-formation data. Tables 5 and 6 present the results of model-feed heat-of-reaction calculations for hydrotreating and hydrocracking reactions, respectively. For hydrotreating, the weighted average heat of reaction is -18.9 kcal/mole of fresh feed. The feed for the hydrocracking table is the product stream from the hydrotreating table. Interestingly, the weighted average heat of vaporization for the model feed is roughly equivalent to the heat of reaction for hydrotreating. Hence, it is an important factor for heat balance. For hydrocracking, the weighted average heat of reaction is -42.8 kcal/mole for Reactions 1-20, which represent the cracking all of the larger compounds into C3-C7 products. The weighted average heat of reaction is -25.0 kcal/mole for Reactions 1, 3-4, 6-9, 11-12, 15, and 18-19, which corresponds to cracking the feed into C9-C10 products. For comparison, Table 6 shows a Reaction 0 entry, which corresponds to cracking all of the C20 eicosane into methane. The heat release for this reaction is -357.9 kcal/mole.
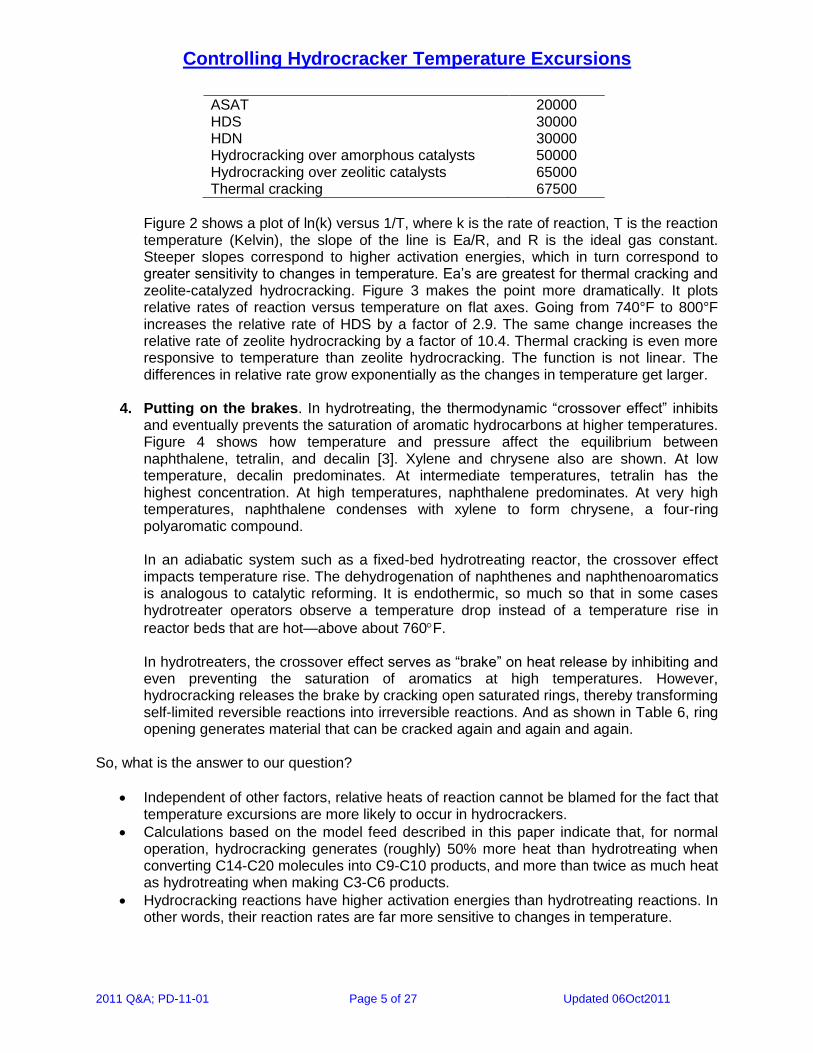
3. Activation energy and relative reaction rates. To calculate relative reaction rates, we
used the following Arrhenius activation energies (Ea):
Reaction Ea, cal/mol
Controlling Hydrocracker Temperature Excursions
2011 Q&A; PD-11-01 Page 5 of 27 Updated 06Oct2011
ASAT 20000 HDS 30000 HDN 30000 Hydrocracking over amorphous catalysts 50000 Hydrocracking over zeolitic catalysts 65000 Thermal cracking 67500
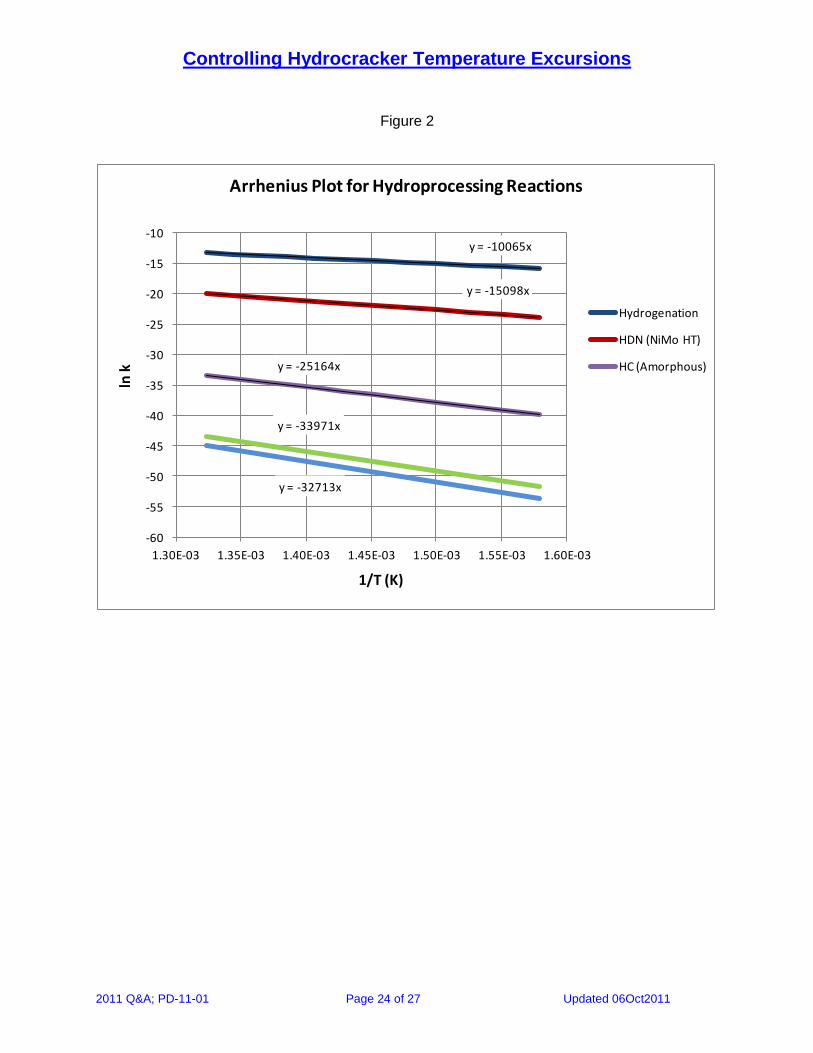
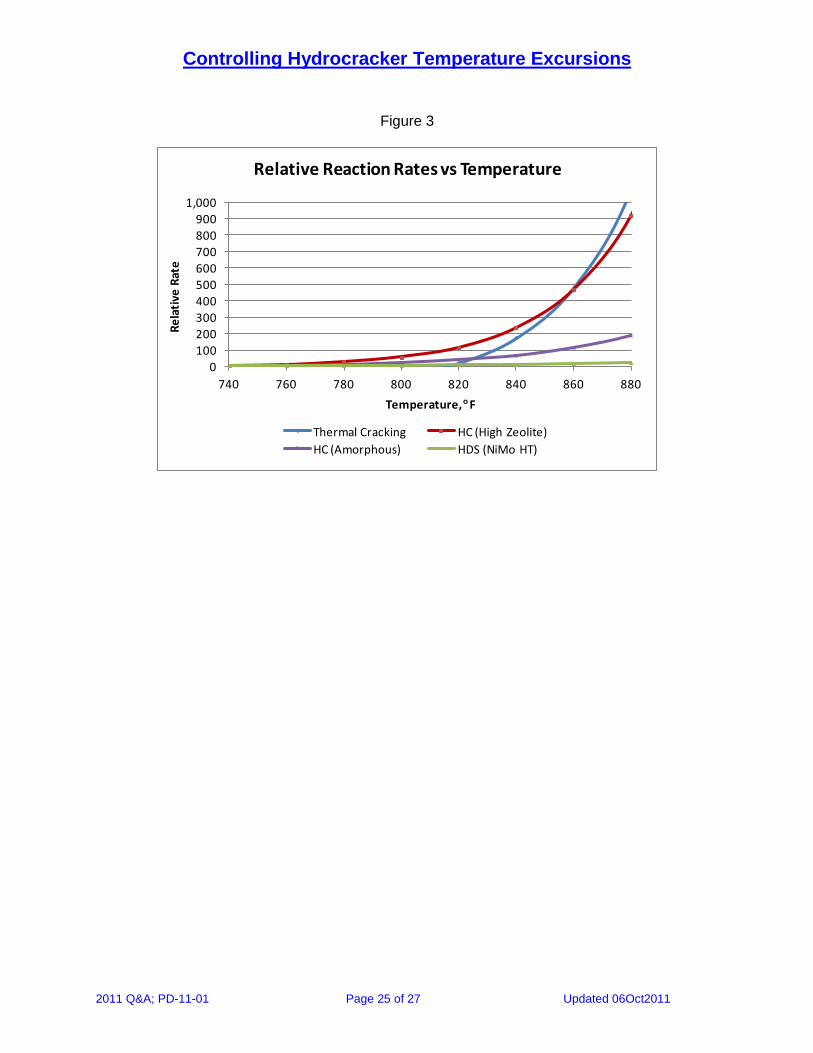
Figure 2 shows a plot of ln(k) versus 1/T, where k is the rate of reaction, T is the reaction temperature (Kelvin), the slope of the line is Ea/R, and R is the ideal gas constant. Steeper slopes correspond to higher activation energies, which in turn correspond to greater sensitivity to changes in temperature. Ea’s are greatest for thermal cracking and zeolite-catalyzed hydrocracking. Figure 3 makes the point more dramatically. It plots relative rates of reaction versus temperature on flat axes. Going from 740°F to 800°F increases the relative rate of HDS by a factor of 2.9. The same change increases the relative rate of zeolite hydrocracking by a factor of 10.4. Thermal cracking is even more responsive to temperature than zeolite hydrocracking. The function is not linear. The differences in relative rate grow exponentially as the changes in temperature get larger.
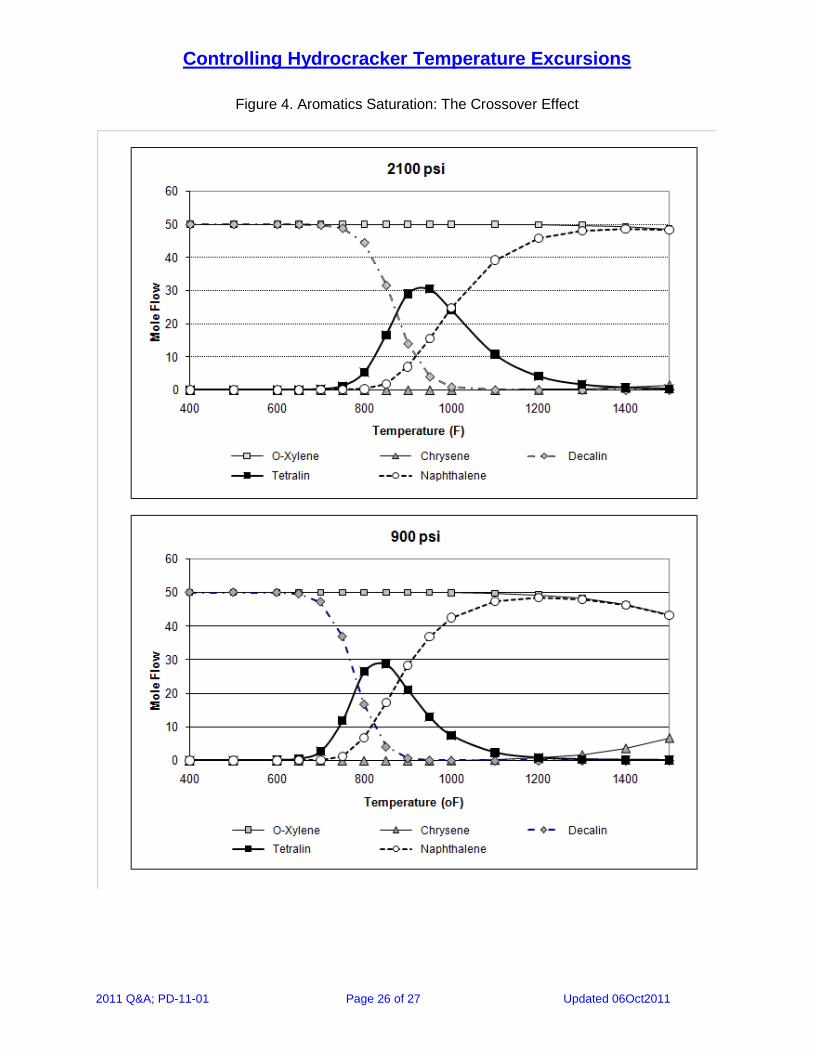
4. Putting on the brakes. In hydrotreating, the thermodynamic “crossover effect” inhibits and eventually prevents the saturation of aromatic hydrocarbons at higher temperatures. Figure 4 shows how temperature and pressure affect the equilibrium between naphthalene, tetralin, and decalin [3]. Xylene and chrysene also are shown. At low temperature, decalin predominates. At intermediate temperatures, tetralin has the highest concentration. At high temperatures, naphthalene predominates. At very high temperatures, naphthalene condenses with xylene to form chrysene, a four-ring polyaromatic compound.
In an adiabatic system such as a fixed-bed hydrotreating reactor, the crossover effect impacts temperature rise. The dehydrogenation of naphthenes and naphthenoaromatics is analogous to catalytic reforming. It is endothermic, so much so that in some cases hydrotreater operators observe a temperature drop instead of a temperature rise in
reactor beds that are hot—above about 760F.
In hydrotreaters, the crossover effect serves as “brake” on heat release by inhibiting and even preventing the saturation of aromatics at high temperatures. However, hydrocracking releases the brake by cracking open saturated rings, thereby transforming self-limited reversible reactions into irreversible reactions. And as shown in Table 6, ring opening generates material that can be cracked again and again and again.
So, what is the answer to our question?
Independent of other factors, relative heats of reaction cannot be blamed for the fact that temperature excursions are more likely to occur in hydrocrackers.
Calculations based on the model feed described in this paper indicate that, for normal operation, hydrocracking generates (roughly) 50% more heat than hydrotreating when converting C14-C20 molecules into C9-C10 products, and more than twice as much heat as hydrotreating when making C3-C6 products.
Hydrocracking reactions have higher activation energies than hydrotreating reactions. In other words, their reaction rates are far more sensitive to changes in temperature.
Controlling Hydrocracker Temperature Excursions
2011 Q&A; PD-11-01 Page 6 of 27 Updated 06Oct2011
In hydrotreaters, the cross-over effect “puts on the brakes” by inhibiting the generation of heat due to ASAT. Hydrocracking counters this inhibition by opening saturated rings, thereby transforming saturation from a reversible into an irreversible process.
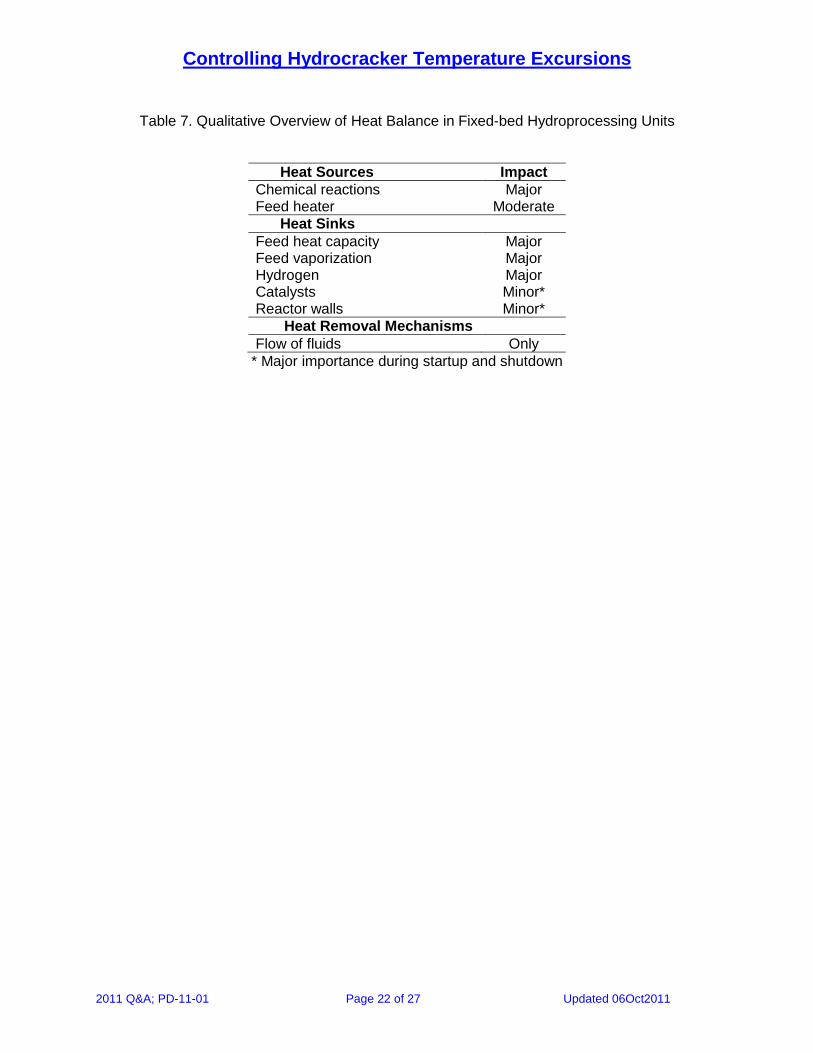
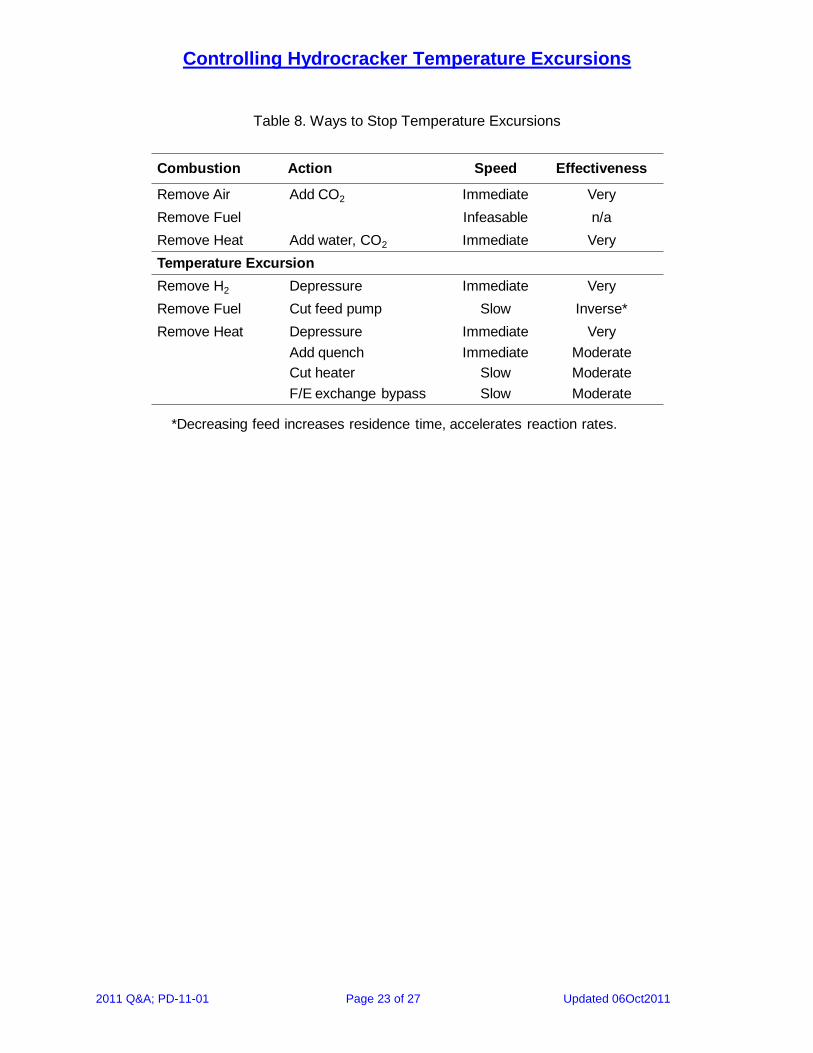
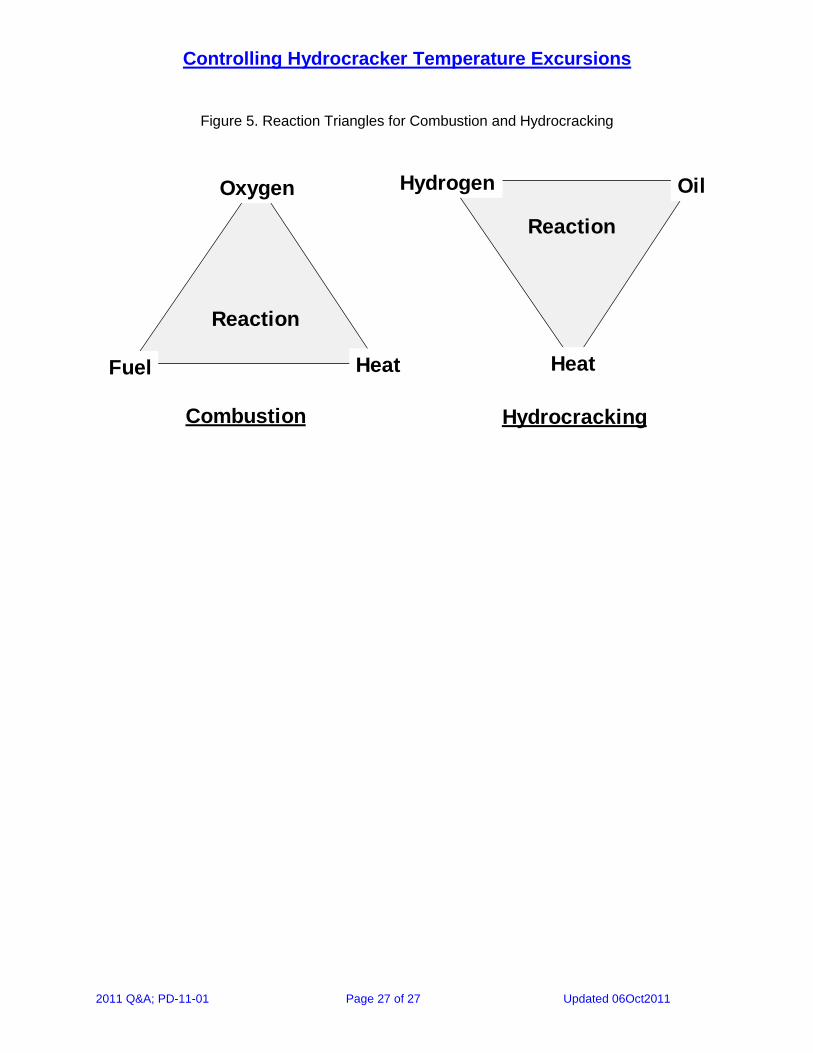
Causes of Excursions Table 7 presents a simplified overview of heat balance in a hydrocracker. Any event that upsets heat balance can lead to an excursion. Equipment failure is the most common root cause. The flow of fluids is the primary mechanism for removing heat from the reactors, and on a molar basis, especially at high pressure, hydrogen is the more abundant fluid. Therefore, with respect to safety, the recycle gas compressor is the most important piece of equipment in the unit. Other causes include inadequate or poorly maintained instrumentation, poorly designed control schemes, and operator error. In-house experts and process licensors are good sources of guidance on these matters. Reference [1] addresses the importance of training and culture. Stopping Excursions Figure 7 shows reaction triangles for combustion and hydrocracking. Combustion requires fuel, oxygen and heat. Hydrocracking requires feed, hydrogen, and heat. In both cases, removing one of the three required factors stops the reaction. Table 8 summarizes different ways to remove required factors. In hydrocracking, emergency depressuring (EDP) removes hydrogen and heat, it is always effective, and its impact is immediate. Unfortunately, EDP shuts down a unit completely, and it can take several days to return it to normal operation. Other actions—manipulating quench gas flow, cutting heater firing and by-passing the feed/effluent exchanger—are slower-acting and less effective than EDP, but they are far less drastic. If used soon enough and in the right way, they can stop an excursion before it becomes serious enough to require EDP. At first glance, it seems like cutting feed rate should stop an excursion. However, this can have an inverse effect. At lower feed rate, the effective space velocity goes down—the average residence time goes up—which accelerates reaction rates. Preventing Excursions Hardware, software, equipment maintenance, process monitoring, operating procedures, operator training, and control systems: All of these play a role in decreasing the likelihood of temperature excursions. In the rest of this paper, we discuss the control system now in use at CITGO Lake Charles Unicracking unit. Hydrocracker Process Description The hydrocracker unit at the CITGO Lake Charles Manufacturing Complex in Louisiana upgrades gas oils and cycle oils to naphtha, jet fuel and diesel fuel in the presence of hydrogen and catalyst. The unit also produces light ends, which are separated into butane, propane, and fuel gas. The hydrocracker unit has one pretreat (hydrotreating) reactor, followed by two hydrocracking reactors. The hydrotreating catalyst is nickel and molybdenum, while the hydrocracking catalyst is nickel and tungsten. Hydrocarbon flow is from top to bottom in each reactor. Most of the
Controlling Hydrocracker Temperature Excursions
2011 Q&A; PD-11-01 Page 7 of 27 Updated 06Oct2011
heavy hydrocarbon fraction from the fractionator is recycled to the first hydrocracking reactor to enhance overall conversion. The remainder of the heavy fraction is called bleed oil, which is typically used for FCC unit feed. Several heat exchangers are used to recover heat from the final hydrocracking reactor. These preheat exchangers are used to preheat fresh feed to the hydrotreating reactor and the hydrogen to both hydrogen heaters. Some of the preheat exchangers have bypass control valves so that preheat can be regulated. The hydrotreating section has one reactor with three fixed beds. The heat balance is controlled by the preheat bypasses, the first hydrogen heater, and hydrogen quenches at the inlet of the middle bed and the inlet of the bottom bed. The first hydrotreating bed is the only bed without hydrogen quench. The hydrotreating reactor quench valves are typically open 10-60%. The first hydrogen heater is used during start-up, and when additional temperature is needed in the hydrotreating reactor, typically during the second half of a catalyst run. The hydrocracking section has a reactor with three fixed beds followed by a reactor with two fixed beds. The heat balance is controlled by the outlet temperature of the hydrotreating reactor, the second hydrogen heater, the recycle oil heater, and the hydrogen quenches at the inlet of each bed. The quench valve to the first hydrocracking bed is called emergency quench and is normally closed. The hydrogen quench valves to the remaining hydrocracking beds are typically open 20-60%.
Controlling Hydrocracker Temperature Excursions
2011 Q&A; PD-11-01 Page 8 of 27 Updated 06Oct2011
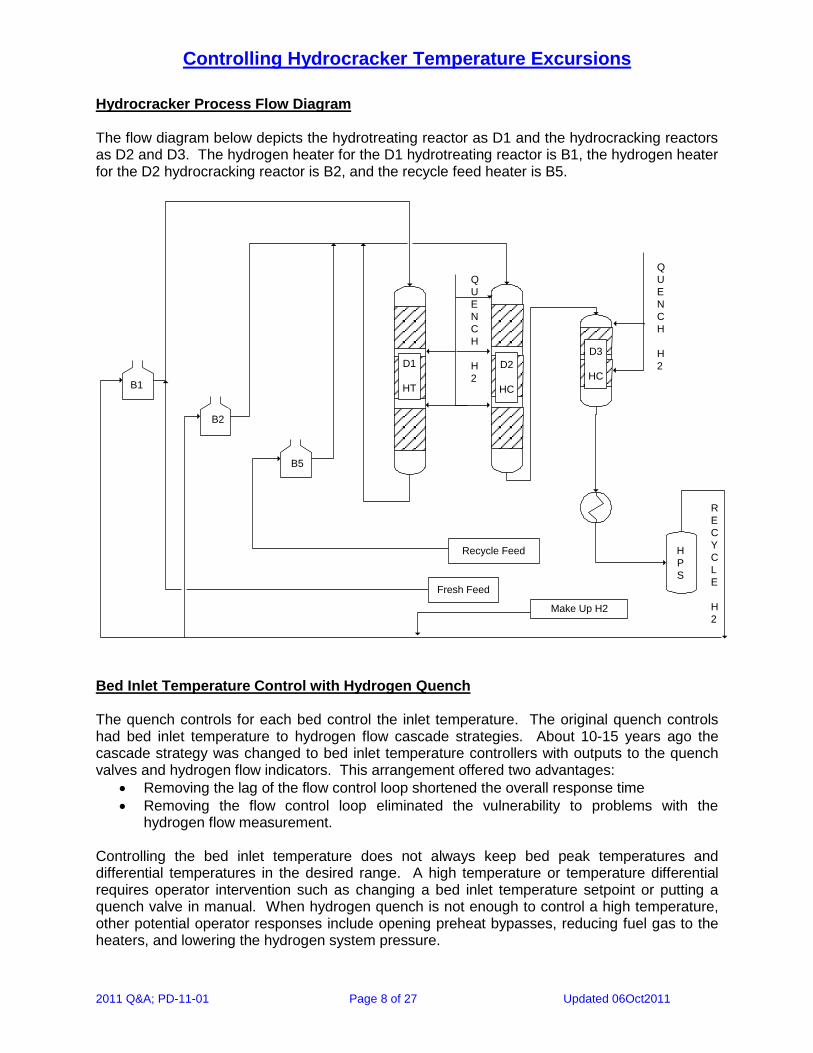
Hydrocracker Process Flow Diagram The flow diagram below depicts the hydrotreating reactor as D1 and the hydrocracking reactors as D2 and D3. The hydrogen heater for the D1 hydrotreating reactor is B1, the hydrogen heater for the D2 hydrocracking reactor is B2, and the recycle feed heater is B5.
Fresh Feed
Make Up H2
H
P
S
R
E
C
Y
C
L
E
H
2
D1
HT
Recycle Feed
B1
B2
B5
Q
U
E
N
C
H
H
2
Q
U
E
N
C
H
H
2D2
HC
D3
HC
Bed Inlet Temperature Control with Hydrogen Quench The quench controls for each bed control the inlet temperature. The original quench controls had bed inlet temperature to hydrogen flow cascade strategies. About 10-15 years ago the cascade strategy was changed to bed inlet temperature controllers with outputs to the quench valves and hydrogen flow indicators. This arrangement offered two advantages:
Removing the lag of the flow control loop shortened the overall response time
Removing the flow control loop eliminated the vulnerability to problems with the hydrogen flow measurement.
Controlling the bed inlet temperature does not always keep bed peak temperatures and differential temperatures in the desired range. A high temperature or temperature differential requires operator intervention such as changing a bed inlet temperature setpoint or putting a quench valve in manual. When hydrogen quench is not enough to control a high temperature, other potential operator responses include opening preheat bypasses, reducing fuel gas to the heaters, and lowering the hydrogen system pressure.
Controlling Hydrocracker Temperature Excursions
2011 Q&A; PD-11-01 Page 9 of 27 Updated 06Oct2011
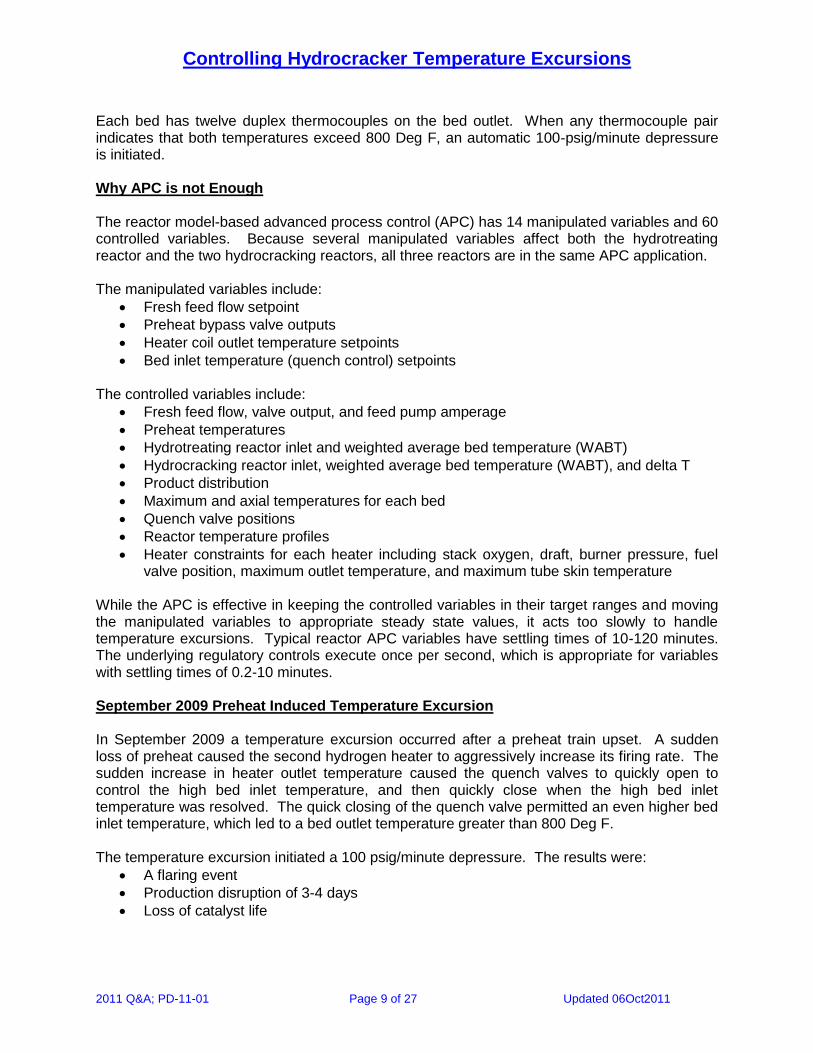
Each bed has twelve duplex thermocouples on the bed outlet. When any thermocouple pair indicates that both temperatures exceed 800 Deg F, an automatic 100-psig/minute depressure is initiated. Why APC is not Enough The reactor model-based advanced process control (APC) has 14 manipulated variables and 60 controlled variables. Because several manipulated variables affect both the hydrotreating reactor and the two hydrocracking reactors, all three reactors are in the same APC application. The manipulated variables include:
Fresh feed flow setpoint
Preheat bypass valve outputs
Heater coil outlet temperature setpoints
Bed inlet temperature (quench control) setpoints The controlled variables include:
Fresh feed flow, valve output, and feed pump amperage
Preheat temperatures
Hydrotreating reactor inlet and weighted average bed temperature (WABT)
Hydrocracking reactor inlet, weighted average bed temperature (WABT), and delta T
Product distribution
Maximum and axial temperatures for each bed
Quench valve positions
Reactor temperature profiles
Heater constraints for each heater including stack oxygen, draft, burner pressure, fuel valve position, maximum outlet temperature, and maximum tube skin temperature
While the APC is effective in keeping the controlled variables in their target ranges and moving the manipulated variables to appropriate steady state values, it acts too slowly to handle temperature excursions. Typical reactor APC variables have settling times of 10-120 minutes. The underlying regulatory controls execute once per second, which is appropriate for variables with settling times of 0.2-10 minutes. September 2009 Preheat Induced Temperature Excursion In September 2009 a temperature excursion occurred after a preheat train upset. A sudden loss of preheat caused the second hydrogen heater to aggressively increase its firing rate. The sudden increase in heater outlet temperature caused the quench valves to quickly open to control the high bed inlet temperature, and then quickly close when the high bed inlet temperature was resolved. The quick closing of the quench valve permitted an even higher bed inlet temperature, which led to a bed outlet temperature greater than 800 Deg F. The temperature excursion initiated a 100 psig/minute depressure. The results were:
A flaring event
Production disruption of 3-4 days
Loss of catalyst life
Controlling Hydrocracker Temperature Excursions
2011 Q&A; PD-11-01 Page 10 of 27 Updated 06Oct2011
An investigation team was formed to determine what happened and the appropriate corrective action. There were several worthwhile ideas including:
Switch the heater controls and quench controls to the Honeywell PID Equation C (proportional action on PV, integral action on error, and derivative action on PV) to avoid an output kick on a setpoint change
Use setpoint tolerance and output tolerance to limit the size of changes that can be entered without a warning and having to press the enter key a second time
Tune the heater controls to make them less aggressive
Add a quench override for when a bed peak outlet temperature exceeds its setpoint
Make the quench override more aggressive when the bed temperature is rising faster than 1 Deg F per minute.
Limit how quickly the quench controls can decrease hydrogen quench without limiting how quickly they can increase hydrogen quench
Limit how quickly the heater controls can increase fuel gas without limiting how quickly they can decrease fuel gas
Implementation of these ideas was straightforward, except the handling of a temperature rise in excess of 1 Deg F per minute. The initial concept was custom code that would aggressively increase quench valve output based on the bed peak temperature and its rate of change. A steady peak outlet temperature of 770 Deg F would have the same control response as:
A peak outlet temperature of 765 Deg F increasing at 1 Deg F per minute
A peak outlet temperature of 760 Deg F increasing at 2 Deg F per minute
A peak outlet temperature of 755 Deg F increasing at 3 Deg F per minute There were concerns with using custom code for this type of application including:
Gracefully backing out quench when the high temperature has been resolved
How to enable operator intervention
Support by the process control engineers and analysts that have callout duty nights, weekends, and holidays
Quench Demand Calculation The concerns about dealing with high bed peak temperatures and temperature rates of change were addressed by a calculated variable called quench demand. Quench demand = Peak temperature + 5 * bed rate of change The engineering units are Deg F for quench demand, Deg F for peak temperature, and Deg F per minute for bed rate of change. Each bed has a row of inlet thermocouples, one or two rows of mid bed thermocouples, and one row of outlet thermocouples. Average rates of change are calculated for the inlet, middle, and outlet elevations. The greatest of the three is used in the quench demand calculation. In the actual calculation the rate of change is clamped between -1 and +4 Deg F per minute and subjected to a first order filter with a time constant of 1 minute. Quench Overrides The quench overrides are an advanced regulatory control strategy that is executed once per second in a Honeywell High Performance Process Manager (HPM). The only custom code is the data validation routine that detects faulty thermocouples and calculates the peak and average temperatures. Everything else including the rate of change calculations, the quench
Controlling Hydrocracker Temperature Excursions
2011 Q&A; PD-11-01 Page 11 of 27 Updated 06Oct2011
demand calculations, the PID gain scheduling, and the mode logic are all performed with built in functions. The quench overrides for each bed include four primary loops, a high output selector, and an analog output to the quench valve. The primary loops are:
1. Bed Inlet Temperature, the dominant primary active > 99% of the time 2. Bed Peak Outlet Temperature 3. Quench Demand Temperature (Peak temperature + 5 * bed rate of change 4. Output Negative Rate of Change Controller
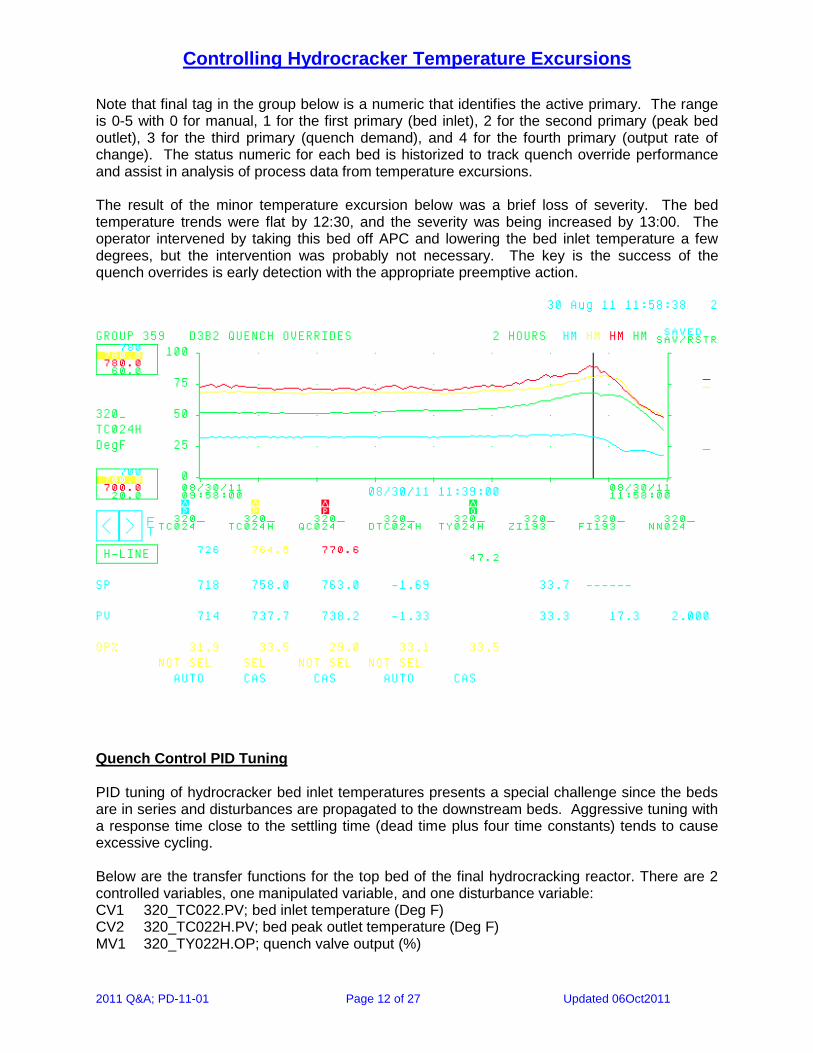
All four calculated outputs are sent to a high selector. The highest output is selected and sent to the analog output point. Each analog output point performs output inversion (since the quench valves are fail open) and linearization (per the entered valve characterization table) before sending the final output to the quench valve. Mode logic and bias control The bed inlet temperature controllers are normally in the cascade mode with their setpoints being moved by the reactor advanced process control (APC). When the controller is in the automatic mode, the operator can move the setpoint. When the controller is in the manual mode, the other three primary loops are disabled, and the operator can move the quench valve output without interference from any of the overrides for that bed. The bed peak outlet temperature is normally in the cascade mode on bias control. The setpoint moves up and down with a bias 40 Deg F greater than the bed inlet temperature setpoint (subject to setpoint high limits). The quench demand controller works the same way with a bias of 45 Deg F. The output rate of change controller is normally in the automatic mode with a constant setpoint. Each bed has a different output rate of change calculated to limit the bed outlet temperature rise to 1 Deg F per minute. If any of the three overrides (bed peak outlet temperature, quench demand, or output rate of change) are put in the manual mode, that override is disabled, while any remaining overrides not in the manual mode are still active. These convenience features, which were recommended by console operators and other engineers, greatly contributed to operator acceptance. The quench overrides have a utilization factor greater than 99%. Typical Trend of Quench Override Below is a Honeywell Total Plant Solutions (TPS) group display showing the key tags involved in the quench overrides for one bed. This example is for the final hydrocracking bed, which is Reactor D3, Bed 2. The 2-hour trend below is from 9:58 to 11:58 on the morning of August 30, 2011. Each time division is 15 minutes. Note that the bed inlet temperature in cyan was flat and the quench valve output in green started to gradually increase around 10:30. Between 11:00 and 11:15 the bed peak temperature in yellow and the quench demand both started to increase. Shortly after 11:30 the quench demand override became active for 2-3 minutes to give more quench. After that the temperature rise dropped to less than 1 Deg F per minute, and the peak outlet temperature override took over for several minutes. Shortly past noon the normal bed inlet temperature control resumed.
Controlling Hydrocracker Temperature Excursions
2011 Q&A; PD-11-01 Page 12 of 27 Updated 06Oct2011
Note that final tag in the group below is a numeric that identifies the active primary. The range is 0-5 with 0 for manual, 1 for the first primary (bed inlet), 2 for the second primary (peak bed outlet), 3 for the third primary (quench demand), and 4 for the fourth primary (output rate of change). The status numeric for each bed is historized to track quench override performance and assist in analysis of process data from temperature excursions. The result of the minor temperature excursion below was a brief loss of severity. The bed temperature trends were flat by 12:30, and the severity was being increased by 13:00. The operator intervened by taking this bed off APC and lowering the bed inlet temperature a few degrees, but the intervention was probably not necessary. The key is the success of the quench overrides is early detection with the appropriate preemptive action.
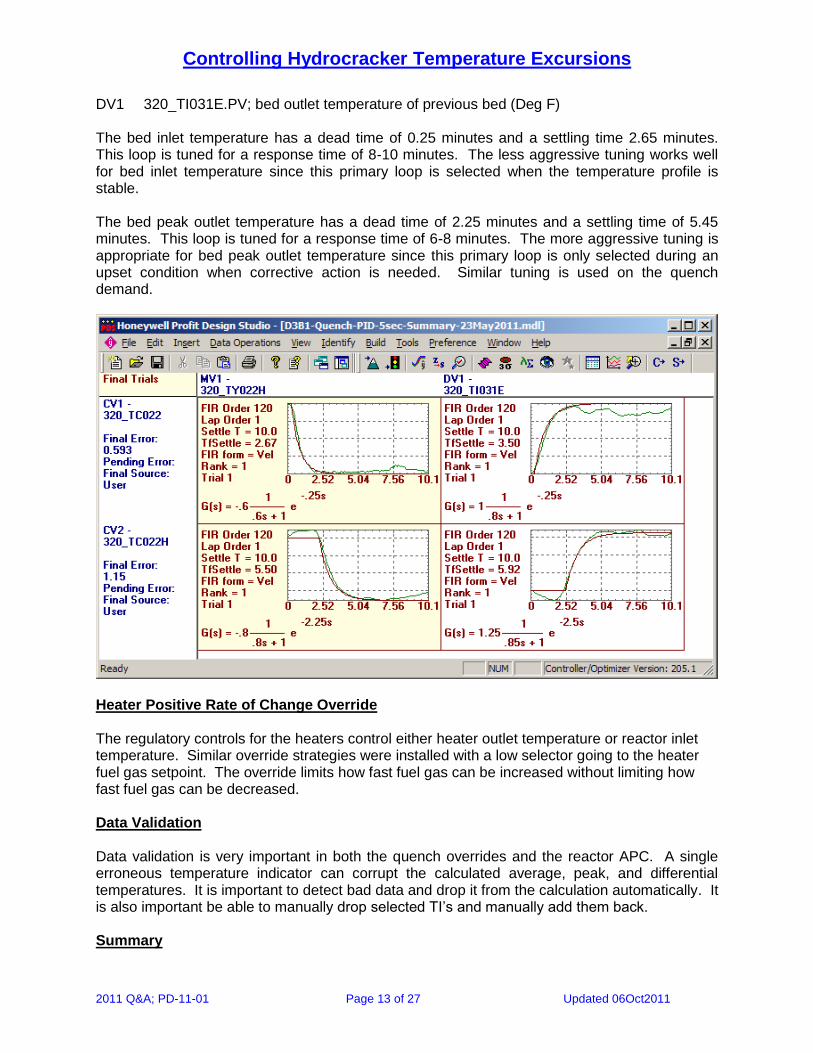
Quench Control PID Tuning PID tuning of hydrocracker bed inlet temperatures presents a special challenge since the beds are in series and disturbances are propagated to the downstream beds. Aggressive tuning with a response time close to the settling time (dead time plus four time constants) tends to cause excessive cycling. Below are the transfer functions for the top bed of the final hydrocracking reactor. There are 2 controlled variables, one manipulated variable, and one disturbance variable: CV1 320_TC022.PV; bed inlet temperature (Deg F) CV2 320_TC022H.PV; bed peak outlet temperature (Deg F) MV1 320_TY022H.OP; quench valve output (%)
Controlling Hydrocracker Temperature Excursions
2011 Q&A; PD-11-01 Page 13 of 27 Updated 06Oct2011
DV1 320_TI031E.PV; bed outlet temperature of previous bed (Deg F) The bed inlet temperature has a dead time of 0.25 minutes and a settling time 2.65 minutes. This loop is tuned for a response time of 8-10 minutes. The less aggressive tuning works well for bed inlet temperature since this primary loop is selected when the temperature profile is stable. The bed peak outlet temperature has a dead time of 2.25 minutes and a settling time of 5.45 minutes. This loop is tuned for a response time of 6-8 minutes. The more aggressive tuning is appropriate for bed peak outlet temperature since this primary loop is only selected during an upset condition when corrective action is needed. Similar tuning is used on the quench demand.
Heater Positive Rate of Change Override The regulatory controls for the heaters control either heater outlet temperature or reactor inlet temperature. Similar override strategies were installed with a low selector going to the heater fuel gas setpoint. The override limits how fast fuel gas can be increased without limiting how fast fuel gas can be decreased. Data Validation Data validation is very important in both the quench overrides and the reactor APC. A single erroneous temperature indicator can corrupt the calculated average, peak, and differential temperatures. It is important to detect bad data and drop it from the calculation automatically. It is also important be able to manually drop selected TI’s and manually add them back. Summary
Controlling Hydrocracker Temperature Excursions
2011 Q&A; PD-11-01 Page 14 of 27 Updated 06Oct2011
The quench overrides are effective in detecting temperature excursions before they become a significant event. They take the appropriate preemptive action without operator intervention and return to normal bed inlet temperature control after the situation is resolved. They add hydrogen quench during high temperature excursions, then limit how quickly the quench flow can be reduced so that a repeat excursion is avoided. Console operators, operations supervision, and process engineering were involved from initial concept through commissioning. Their involvement has contributed greatly to operator acceptance and the quench overrides being in service more than 99% of the time. The APC is usually turned off during excursions, and the bed inlet temperature setpoints are moved by the operators with the entire quench override strategy left in closed loop. It is very rare for the quench valves to ever be put in manual since the quench overrides were commissioned. The financial benefits of the quench overrides are difficult to quantify. They will reduce the frequency and severity of temperature excursions, which will permit longer catalyst runs. The quench overrides will also prevent costly shutdowns resulting from reactor depressure events. In the previously mentioned theoretical 30,000 BPD unit with a margin of $10 per barrel, a day of production is worth $300,000 per day before consideration of the impact on other refinery units.
Controlling Hydrocracker Temperature Excursions
2011 Q&A; PD-11-01 Page 15 of 27 Updated 06Oct2011
References [1] EPA 550-R-98-009, EPA Chemical Accident Investigation Report (November 1998). www.epa.gov/oem/docs/chem/tosco.pdf [2] NIST Standard Reference Database Number 69: NIST Chemistry Web Book http://webbook.nist.gov/chemistry [3] Paul R. Robinson, “Deactivation of Hydroprocessing Catalysts: Thermochemistry of Coke Formation,” presented at the Second International Symposium on Hydrotreating / Hydrocracking Technologies, American Chemical Society National Meeting, San Francisco, CA, September 10, 2006
Controlling Hydrocracker Temperature Excursions
2011 Q&A; PD-11-01 Page 16 of 27 Updated 06Oct2011
Table 1. Hydroprocessing Reactions
No. Reaction Type
DHR @ STP
kcal/mole
per H2
consumed
DHR @ STP
kJ/mole
per H2
consumed
Olefin Saturation Average = -27.8
1. propylene + H2 propane -29.9 -29.9 -125.1
2. 2,2-dimethyl-3-hexene + H2 hexane, 2,2-dimethyl -25.5 -25.5 -106.7
3. styrene + H2 ethylbenzene -28.0 -28.0 -117.1
Aromatics Saturation Average = -15.9
4. benzene + 3 H2 cyclohexane -49.6 -16.5 -207.5 -69.2
5. naphthalene + 2 H2 tetralin -28.7 -14.3 -120.0 -60.0
6. tetralin + 3 H2 decalin -50.7 -16.9 -212.2 -70.7
Hydrodeoxygenation of ethers (HDO) Typical = -12.5
7. n-butylether + 2 H2 2 n-butane + H2O -25.0 -12.5 -104.8 -52.4
Hydrodesulfurization (HDS) Typical = -12.6
8. dibutyldisulfide + 3 H2 2 n-butane + 2 H2S -35.9 -12.0 -150.2 -50.1
9. thiophene + 2 H2 tetrahydrothiophene* -35.8 -17.9 -150 -75
10. tetrahydrothiophene + 2 H2 n-butane + H2S -26.8 -13.4 -112.1 -56.1
11. benzothiophene + 3 H2 ethylbenzene + H2S -37.4 -12.5 -156.6 -52.2
12. dibenzothiophene + 2 H2 biphenyl + H2S -12.7 -6.4 -53.3 -26.7
Hydrodenitrogenation (HDN) Average = -15.3
13. dipropylamine + 2 H2 2 propane + NH3 -28.5 -14.2 -119.3 -59.7
14. pyridine + 3 H2 piperidine** -44.8 -14.9 -187.4 -62.5
15. piperidine + 2 H2 n-pentane + NH3 -34.8 -17.4 -145.9 -72.9
16. quinoline + 2 H2 quinoline, 1,2,3,4-tetrahydro- ** -28.3 -14.2 -118.5 -59.3
17. 1,2,3,4-tetrahydroquinoline + 2 H2 benzene, propyl- + NH3 -28.8 -14.4 -120.4 -60.2
Hydrocracking Average = -12.2
18. eicosane + H2 2 nonane, 2-methyl -15.4 -15.4 -64.6
19. n-hexadecane + H2 2 isooctane -13.4 -13.4 -56.1
20. ethylcyclohexane + H2 heptane, 2-methyl -10.1 -10.1 -42.4
21. butylbenzene + H2 toluene + propane -10.0 -10.0 -41.8
Isomerization Average = -2.3
22. n-butane isobutane -2.1 -8.6
23. n-decane nonane, 2-methyl -2.5 -10.5
Other
24. CO2 + 4 H2 methane + 2 H2O (g) -13.5 -3.4 -56.5 -14.1
25. CO + 3 H2 methane + H2O (g) -36.3 -12.1 -151.9 -50.6
* Intermediate step, no H2S produced
** Intermediate step, no NH3 produced
Controlling Hydrocracker Temperature Excursions
2011 Q&A; PD-11-01 Page 17 of 27 Updated 06Oct2011
Table 2. Molar Composition of a Reference Feed
Reaction
kcal/mol of H2
Consumed
Avg or
Typical
kcal/mol H2
Consumed
Relative to HDS
Concentration of
Reactive Bonds
Relative to HDS
Max Heat
Production
Relative to HDS
HDS 12.0 - 13.4 12.6 1.00 1 1
HDN 14.2 - 17.4 15.3 1.21 0.29 0.35
Hydrocracking 10.0 - 10.2 12.2 0.97 198.5 192
* Feed composition (wt%) -- Sulfur = 1.16, Nitrogen = 0.15, Carbon = 86.26, Hydrogen = 12.42
Mole ratio relative to Sulfur -- Sulfur = 1, Nitrogen = 0.29, Carbon = 198.5, Hydrogen = 340.5
Approximate Molecular Weight = 280 daltons
Assumption: on average, each S and N bonds to two C atoms, each C atom bonds to two other C atoms
Controlling Hydrocracker Temperature Excursions
2011 Q&A; PD-11-01 Page 18 of 27 Updated 06Oct2011
Table 3.Components and Composition of Model Feed
Compound Formula Type MW Wt% Mol%
NBP(a)
(°F)
DH(f)
kcal/mole
DH(vap)
kcal/mole
eicosane C20H42 paraffin 282.6 26.59% 20.31% 649.5 -108.9 24.1
1-eicosene C20H40 olefin 280.5 40.62% 31.25% 649.5 (b) -78.6 23.9
butylbenzene C10H14 monoaromatic 134.2 3.89% 26.56% 379.1 -40.4 12.0
anthracene C14H10 triaromatic 178.2 7.74% 9.38% 643.7 53.3 24.4
decalin C10H14 naphthene 134.2 16.52% 6.25% 361.1 -3.1 12.0
dibutyldisulfide C8H18S2 S compound 178.4 3.23% 3.91% 447.9 -37.9 15.4
quinoline C9H11N N compound 129.2 1.40% 2.34% 460.1 47.9 14.2
Weighted Average MW = 215.8 Weighted Average DH(vap) = 21.1
(a) Normal boiling point
(b) Estimated boiling point for 1-eicosene
Controlling Hydrocracker Temperature Excursions
2011 Q&A; PD-11-01 Page 19 of 27 Updated 06Oct2011
Table 4. Comparison the Reference Feed with the Model Feed
Reference Feed wt%
Carbon 86.26
Hydrogen 12.42
Sulfur 1.16
Nitrogen 0.15
CP / CN / CA / CO54.8 / 25.9 / 15.3 / 4.0
MW, daltons 280
SimDist, vol% °F
IBP 252
5% 393
50% 655
95% 857
99.5% 968
Model Feed wt%
Carbon 85.87
Hydrogen 12.81
Sulfur 1.16
Nitrogen 0.15
CP / CN / CA / CO54.8 / 26.6 / 15.5 / 3.1
MW, daltons 215
Controlling Hydrocracker Temperature Excursions
2011 Q&A; PD-11-01 Page 20 of 27 Updated 06Oct2011
Table 5. Hydrotreating Reactions: Model System
Feed mol%
DHR
kcal/mol
Weighted
DHR
Product
mol% FF
20.31 eicosane (C20) eicosane 20.3%
31.25 eicosene (C20=) + H2 eicosane -30.3 -9.5 31.3%
26.56 decalin (C14 polynaphthene) decalin 26.6%
9.38 anthracene (C14 triaromatic) + 4 H2 anthracene, octahydro- -62.2 -5.8 9.4%
6.25 butyl benzene (50% removal) + 1.5 H2 1/2 butyl benzene + 3.1%
1/2 butyl cyclohexane -47.9 -1.5 3.1%
3.91 di-n-butyl disulfide + 2 H2 2 n-butane + 2 H2S -4.1 -0.2 7.8%
2.34 quinoline (C9 nitrogen) + 5 H2 propyl benzene + NH3 -57.0 -1.3
propyl benzene (50% removal) + 1.5 H2 1/2 propyl benzene + 1.2%
1/2 propyl cyclohexane -47.9 -0.6 1.2%
Total = -18.9 103.9%
Hydrotreating
Controlling Hydrocracker Temperature Excursions
2011 Q&A; PD-11-01 Page 21 of 27 Updated 06Oct2011
Table 6. Hydrocracking Reactions: Model System
No.
Mol%
FF
DHR
kcal/mol
DHR
Weighted Type
0. 51.6% C20 20 CH4 -357.9 PHCR
1. 2 C10 -15.4 -7.96 PHCR
2. 4 C5 -22.9 -11.83 PHCR
26.6% decalin
3. butyl cyclohexane -10.5 -2.79 ROP
4. C10 -11.2 -2.98 ROP
5. 2 C5 -11.5 -3.05 PHCR
9.4% anthracene, octahydro-
6. benzene, 1-ethyl-2-hexyl- -14.9 -1.39 RDA
7. benzene, 1-methyl-2-ethyl- + C5 -17.1 -1.60 RDA
8. cyclohexane, 1-methyl-2-ethyl- + C5 -45.2 -4.24 ASAT
9. C5 + C9 -8.6 -0.80 PHCR
10. C3 + C5 + C6 -12.1 -1.14 PHCR
3.1% butyl benzene (50% of original butyl benzene)
11. toluene + C3 -10 -0.31 RDA
12. methyl cyclohexane + C3 -49 -1.53 ASAT
13. C7 + C3 -9.6 -0.30 PHCR
14. 2 C3 + C4 -10.5 -0.33 PHCR
3.1% butyl cyclohexane (amount equivalent to 50% of orginal butyl benzene)
15. C 10 -11.2 -0.35 ROP
16. C3 + C7 -9.4 -0.30 PHCR
17. 2 C3 + C4 -10.5 -0.33 PHCR
7.8% 2 C4 2 C4
1.2% propyl benzene (50% of original propyl benzene)
18. 1.2% propyl cyclohexane -45.2 -1.06 ASAT
19. C9 -8.6 -0.20 PHCR
20. C3 + C6 -12.1 -0.28 PHCR
103.9% Total DHR for Reactions 1-20 -42.8
Total excluding small-molecule cracking -25.0
(Reactions 2, 5, 10, 13-15,16-17, 19-20)
Reaction
Controlling Hydrocracker Temperature Excursions
2011 Q&A; PD-11-01 Page 22 of 27 Updated 06Oct2011
Table 7. Qualitative Overview of Heat Balance in Fixed-bed Hydroprocessing Units
Heat Sources Impact
Chemical reactions Major Feed heater Moderate
Heat Sinks
Feed heat capacity Major Feed vaporization Major Hydrogen Major Catalysts Minor* Reactor walls Minor*
Heat Removal Mechanisms
Flow of fluids Only
* Major importance during startup and shutdown
Controlling Hydrocracker Temperature Excursions
2011 Q&A; PD-11-01 Page 23 of 27 Updated 06Oct2011
Table 8. Ways to Stop Temperature Excursions
Combustion Action Speed Effectiveness
Remove Air Add CO2 Immediate Very
Remove Fuel Infeasable n/a
Remove Heat Add water, CO2 Immediate Very
Temperature Excursion
Remove H2 Depressure Immediate Very
Remove Fuel Cut feed pump Slow Inverse*
Remove Heat Depressure
Add quench
Cut heater
F/E exchange bypass
Immediate
Immediate
Slow
Slow
Very
Moderate
Moderate
Moderate
*Decreasing feed increases residence time, accelerates reaction rates.
Controlling Hydrocracker Temperature Excursions
2011 Q&A; PD-11-01 Page 24 of 27 Updated 06Oct2011
Figure 2
y = -10065x
y = -15098x
y = -32713x
y = -25164x
y = -33971x
-60
-55
-50
-45
-40
-35
-30
-25
-20
-15
-10
1.30E-03 1.35E-03 1.40E-03 1.45E-03 1.50E-03 1.55E-03 1.60E-03
ln k
1/T (K)
Arrhenius Plot for Hydroprocessing Reactions
Hydrogenation
HDN (NiMo HT)
HC (Amorphous)
Controlling Hydrocracker Temperature Excursions
2011 Q&A; PD-11-01 Page 25 of 27 Updated 06Oct2011
Figure 3
0
100
200
300
400
500
600
700
800
900
1,000
740 760 780 800 820 840 860 880
Re
lati
ve R
ate
Temperature, F
Relative Reaction Rates vs Temperature
Thermal Cracking HC (High Zeolite)
HC (Amorphous) HDS (NiMo HT)
Controlling Hydrocracker Temperature Excursions
2011 Q&A; PD-11-01 Page 26 of 27 Updated 06Oct2011
Figure 4. Aromatics Saturation: The Crossover Effect
Controlling Hydrocracker Temperature Excursions
2011 Q&A; PD-11-01 Page 27 of 27 Updated 06Oct2011
Figure 5. Reaction Triangles for Combustion and Hydrocracking
Reaction
Heat
Oxygen
Fuel
Combustion
Reaction
Heat
Hydrogen Oil
Hydrocracking