contribution of correlation and spectral analyses to the regional study of a large karst aquifer...
TRANSCRIPT
Journal of Hydrology
E L S E V I E R Journal of Hydrology 205 (1998) 217-231
Contribution of correlation and spectral analyses to the regional study of a large karst aquifer (Charente, France)
M. Larocque a'*, A. Mangin h, M. Razack a, O. B a n t o n c
"Laboratory of Hydrogeology, UMR CNRS 6532, University of Poitiers, 40 ave. Recteur Pineau, 86022 Poitiers" Cedex, France bLaboratoire Souterrain du CNRS, Moulis 09200, St-Girons, France
ClNRS-Eau, University of Quebec, 2800 Einstein, C.P. 7500, Ste-Foy, Quebec, Canada G1V 4C7
Received 20 June 1997; revised 26 November 1997; accepted 26 November 1997
Abstract
The purpose of the study is to demonstrate that correlation and spectral analyses can contribute to the regional study of a large karst aquifer. An example is presented for the La Rochefoucauld karst aquifer (Charente, France). Different types of spatially distributed time series provide valuable spatio-temporal information for the karst aquifer. The available time series consist of the spring flow rates, the flow rates at different locations in sinking streams, the piezometric levels, the electrical conductivity and temperature of the water, the atmospheric pressure and the precipitation, The analysis of the flow rates at the springs shows that the aquifer empties very slowly and has a large storage capacity. Hydrodynamic links were established between three of the four rivers flowing on the aquifer and the springs. The results also demonstrate the important spatial heterogeneity of the aquifer and indicate that the most rapid flow occurs in the northern part of the aquifer. Hourly piezometric and electrical conductivity time series indicate that the transmissivity of the aquifer varies when some conductive channels become desaturated during the low water period. The delays between the distributed recharge and the piezometric level, between the localized river input and the flow rates at the springs and between the electrical conductivities in rivers and the main spring provide information on the travel times in the aquifer. The observation of earth tides and barometric effects indicate that this apparently unconfined aquifer has a confined behaviour. © 1998 Elsevier Science B.V. All rights reserved.
Keywords: Karst; Time series analysis; Correlation; Spectral analysis; Regional scale
1. Introduct ion
The regional study of a karst aquifer is challenging, primarily because of highly heterogeneous charac- teristics. The term 'karst aquifer ' includes a wide variety of more or less karstified l imestone from the less developed or diffuse flow aquifers to the highly localized or conduit flow aquifers (White,
* Corresponding author. Tel: 001 418 654 2694; fax: 001 418 654 2600; e-mail: [email protected]
0022-16941981519.00 © 1998 Elsevier Science B.V. All rights reserved. PII S0022-1694(97)00155 - 8
1969; Atkinson, 1977). Most karst aquifers have both types of flow but it is difficult to characterize the degree of karstification of a given aquifer and the relative importance of the different flows. Classi- cal investigation techniques such as aquifer pump- ing tests (Thrailkill, 1988; McConnell , 1993; Bangoy and Drogue, 1994) or tracer tests (Thrailkill, 1985; Smart, 1988) are essential for characterizing any type of aquifer. However, because of the l imited investigation scale of these techniques, they do not always provide sufficient information on the
218 M. Larocque et aL/Journal of Hydrology 205 (1998) 217-231
different types of flow, their location and temporal variations.
Preliminary studies must therefore be performed to get a basic understanding of the aquifer in order to orient field work. In hydrology, this screening approach is often performed using time series analy- sis. Time series (Box et al., 1994), are especially use- ful in karstic environments (Soulios, 1991; Moore, 1992; Padilla et al., 1994; Clarke, 1996) because they use easily available data which are relatively inexpensive to collect. Correlation and spectral analyses are one form of time series analysis which is usually easy to implement and often provides good insight into an aquifer. Correlation and spectral analyses are based on a system approach as they relate inputs to outputs through the use of statistical functions. Mangin (1984a) developed a methodology using these analyses in the study of input-output relationships in karst aquifers. The aquifer is con- sidered a filter which transforms, retains, or eliminates the input signal in the creation of an output signal. The degree of transformation of the input signal therefore provides valuable information on the nature of flow in the system. Mangin (1984a), Padilla and Pulido-Bosch (1995) and Morales-Juberias et al. (1996) demonstrated how this method can be used with spring flow rates and precipitation data to better comprehend the global flow dynamics in karst aquifers.
However, different types of time series data other than spring flow rates can also be collected relatively easily and have the potential of carrying valuable information. The objective of this study was to show that correlation and spectral analyses are valuable tools when used with various spatially distributed time series data to acquire regional (rather than only global) information on a karst aquifer. The analysis of spatially distributed time series such as river and spring flow rates, piezometric levels and chemical data provides valuable infor- mation on the hydrodynamic characteristics of the aquifer such as the study of the spring hydrograph, the limits of the aquifer, the spatial and temporal variability, the delays between inputs and outputs and the specific storage and porosity of the aquifer. An application is presented for the La Rochefoucauld karst (Charente, France) for which a large number of spatially distributed time series are available.
2. Materials and methods
A very short overview of the theory of correlation and spectral analyses is presented here to facilitate the comprehension of the results. More detailed explanations and the complete theoretical develop- ment have been established by Max (1980), Mangin (1984a) and Box et al. (1994).
2.1. Simple correlation and spectral analyses
The simple correlation analysis quantifies the linear dependency of successive values over a time period. The correlogram, C(k), outlines the memory of the system. If an event has a long-term influence on the time series, the slope of the auto-correlation func- tion, r(k), decreases slowly:
r(k)- C(k) (1) c(o)'
l n - k c(k)=- E (xt-~)(x,÷k-~), (2)
n t = l
where k is the time lag (k = 0 to m), n is the length of the time series, x, is a single event, x is the mean of the events and m is the cutting point. The cutting point determines the interval in which the analysis is carried out and is usually chosen to circumscribe a given behaviour like annual or long-term effects.
The simple spectral analysis is complementary to the correlation analysis. The spectral density function corresponds to a change from a time mode to a fre- quency mode through a Fourier transformation of the auto-correlation function. The interpretation of the spectral density function, SO'), through the identification of the different peaks representing periodical phenomena, leads to the characterization of the system:
S( f )=2 [1 +2 k=l ~ D(k)r(k)c°s(27rfk)l' (3)
1 + cos ~r
D(k) = 2 ' (4)
where f =fl2mj = 1 to m, fis the frequency and D(k) ensures that the S(D estimated values are not biased (Tukey filter).
M. Larocque et al./Journal of Hydrology 205 (1998) 217-231 219
The spectral density function also determines the regulation time, Treg:
s(f =0) (5) T~g- 2
The regulation time is similar to the passing band in a signal treatment. It defines the duration of the influ- ence of the input signal and it gives an indication of the length of the impulse response of the system.
2.2. Cross-correlation and cross-spectral analyses
The cross-correlation analysis is used to establish a link between the input time series, xt and the output time series, Yr. If the input time series is random, the cross-correlation function, rxy(k), corresponds to the impulse response of the system. In other cases, the cross-correlation function provides information on the causal and non-causal relationships between the input and the output as well as the importance of these relationships. The cross-correlation function is not symmetrical [rzy(k) :# ryx(k)] and if k < 0, x replaces y and vice versa in eqns (6) and (7). If rxy(k) > 0 for k > 0, the input influences the output, while if rxy(k) > 0 for k < 0, the output influences the input. A perfectly symmetrical cross-correlation function centred at k = 0 indicates that both the input and the output signals react at the same time to a third independent signal, precipitation for example. In this case, the input does not influence the output. The delay is defined as the time lag between k = 0 and the maximum r~y(k). Usually, the shorter the delay, the faster the transfer. For k > 0:
czy(k) rzy(k) - , (6)
axay
l n - k Czy(k)=- Y (x,-~)(y,+k-~), (7)
nt=l
where C,:y(k) is the cross-correlogram, and ax and Oy are the standard deviations of the time series.
The cross-spectral density function, Szy(t), corres- ponds to the Fourier transform of the cross-correlation function. It is expressed as a function of the cospec- trum, h~y(f) and the quadrature spectrum, Xxy(])
Szy(f) = hzy(f)- iXxy(f), (8)
h,:y(f)=2[rzy(O)+~(rzy(k)+ryx(k))D(k)cos(27rfk) 1 ,
(9)
XxY(f)=2[ rzy(0)+ ~ (rxy(k ) + ryx(k ) )D(k ) sin( 27rfk ) ]
(10)
In polar coordinates, the cross-spectrum can also be expressed as a function of the amplitude, LS~y(3')l and phase, Oxy(t):
Szy(f) = ISxy(f)le -iOxy(£) . (11)
The amplitude function identifies the way in which the input signal has been modified by the system. In the frequency domain, it represents the input-output covariance:
Iszy(f)l = v/h2xy(f) + X2zy(f). (12)
The phase function indicates the dephasing between the input and the output functions:
Xzy(f) 0zy(f) = arctan hxy(f)" (13)
In the time mode, the dephasing, r is:
0zy(f) r = - - (14)
2rf
The coherence function, COxy(D, expresses the linearity of the input-output relationship and depends on the simple and cross-spectral density functions, Sx, Sy and S~y:
s~(f) COzy(f)= 4 S x ( f ) S y ( f ). (15)
A system is linear, COxyO') -~ 1, when a change in the input function creates a proportional change of the output function. Non-linearity means that other factors must be taken into account in the definition of the system.
The gain function, gxy(f), expresses an amplification (>1) or an attenuation (<1) of the output signal in comparison with the input signal. In a karstic environment, this phenomenon can be related to the storage Of water during the high water period and
22O
the release of water during the dry period:
S~y(f) ~Y(f) = Sx(f)"
M. Larocque et aL/Journal of Hydrology 205 (1998) 217-231
3. Descript ion of the La Roehefoueauld kars t
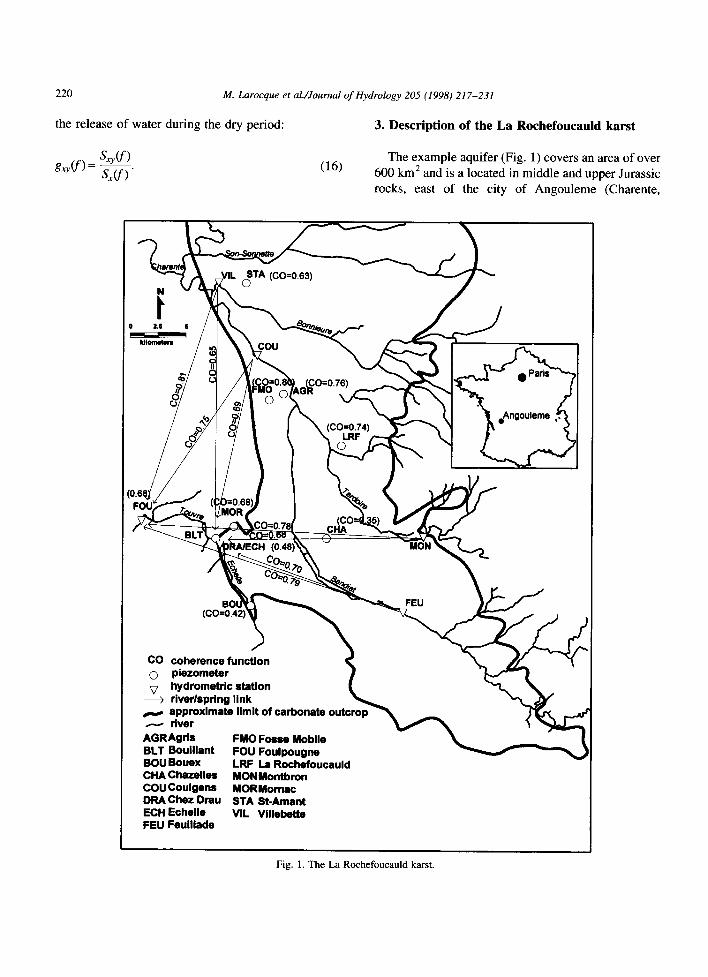
The example aquifer (Fig. 1) covers an area of over (16) 600 km 2 and is a located in middle and upper Jurassic
rocks, east of the city of Angouleme (Charente,
N
t 0 2.8 8
kllometom
ffTA (C0=0.63)
COU
(CO=0.74) eAngouleme
(CO=0.42 FEU
CO coherence function O piezometer L V hydrometric station
) river/spring link approximate limit of carbonate outcrop
.---- river AGRAgrle FMO Fosse Mobile BLT Bouillant FOU Foulpougne BOUBouex LRF La Rochefoucauld CHA Chazelles MON Montbron COU CouIgens MORMomac DRA Chez Drau STA St-Amant ECH Echelle VIL Villebetl~ FEU Feuillade
Fig. 1. The La Rochefoucauld karst.
M. Larocque et al./Journal of Hydrology 205 (1998) 217-231 221
Table 1
Data used for the analyses
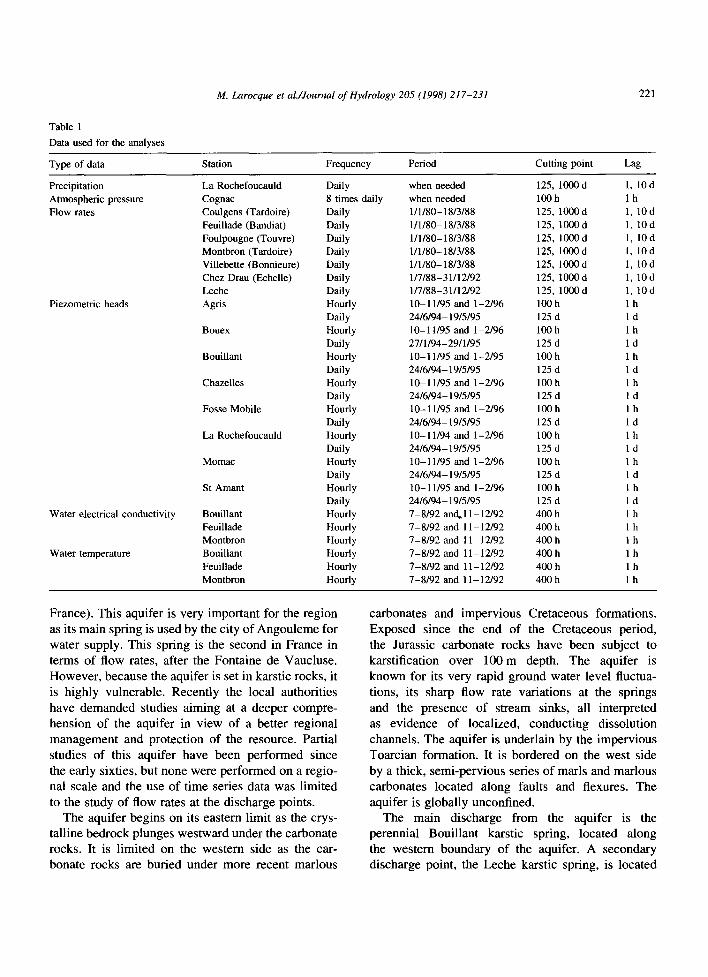
Type of data Station Frequency Period Cutting point Lag
Precipitation Atmospheric pressure Flow rates
Piezometric heads
Water electrical conductivity
Water temperature
La Rochefoucauld Daily when needed 125, 1000 d 1, 10 d Cognac 8 times daily when needed 100 h 1 h Coulgens (Tardoire) Daily 1/1/80-18/3/88 125, 1000 d 1, 10 d Feuillade (Bandiat) Daily 1/1/80-18/3/88 125, 1000 d 1, 10 d Foulpougne (Touvre) Daily 1/1/80-18/3/88 125, 1000 d 1, 10 d Montbron (Tardoire) Daily 1/1/80-18/3/88 125, 1000 d 1, 10 d Villebette (Bonnieure) Daily 1/1/80-18/3/88 125, 1000 d 1, 10 d Chez Drau (Echelle) Daily 1/7/88-31/12/92 125, 1000 d 1, 10 d Leche Daily 1/7/88-31/12/92 125, 1000 d 1, 10 d Agris Hourly 10-11/95 and 1-2/96 100 h 1 h
Daily 24/6/94-19/5/95 125 d 1 d Bouex Hourly 10-11/95 and 1-2/96 100 h 1 h
Daily 2711/94-2911/95 125 d 1 d Bouillant Hourly 10-11/95 and 1-2/95 100 h 1 h
Daily 24/6/94-19/5/95 125 d 1 d Chazelles Hourly 10-11/95 and 1-2/96 100 h 1 h
Daily 24/6/94-19/5/95 125 d 1 d Fosse Mobile Hourly 10-11/95 and 1-2/96 100 h 1 h
Daily 24/6/94-19/5/95 125 d 1 d La Rochefoucauld Hourly 10-11/94 and 1-2/96 100 h 1 h
Daily 24/6/94-19/5/95 125 d 1 d Momac Hourly 10-11/95 and 1-2/96 100 h 1 h
Daily 24/6/94-19/5/95 125 d 1 d St Amant Hourly 10-11/95 and 1-2/96 100 h 1 h
Daily 24/6/94-19/5/95 125 d 1 d Bouillant Hourly 7-8/92 and,11-12/92 400 h 1 h Feuillade Hourly 7-8/92 and 11-12/92 400 h 1 h Montbron Hourly 7-8/92 and 11-12/92 400 h 1 h Bouillant Hourly 7-8/92 and 11-12/92 400 h 1 h Feuillade Hourly 7-8/92 and 11-12/92 400 h 1 h Montbron Hourly 7-8/92 and 11-12/92 400 h 1 h
France). This aquifer is very important for the region
as its main spring is used by the city o f A n g o u l e m e for
water supply. This spring is the second in France in
terms of f low rates, after the Fonta ine de Vaucluse.
Howeve r , because the aquifer is set in karstic rocks, it
is h igh ly vulnerable . Recen t ly the local authori t ies
have demanded studies a iming at a deeper compre -
hens ion o f the aquifer in v i ew of a better regional
m a n a g e m e n t and protect ion o f the resource. Partial
studies o f this aquifer have been pe r fo rmed since
the early sixties, but none were pe r fo rmed on a regio-
nal scale and the use o f t ime series data was l imi ted
to the study of f low rates at the d ischarge points.
The aquifer begins on its eastern l imit as the crys- tal l ine bedrock p lunges wes tward under the carbonate
rocks. It is l imi ted on the western side as the car-
bonate rocks are bur ied under more recent marlous
carbonates and imperv ious Cre taceous formations.
Exposed since the end of the Cre taceous period,
the Jurassic carbonate rocks have been subject to
karst if ication over 1 0 0 m depth. The aquifer is
known for its very rapid ground water level fluctua-
tions, its sharp f low rate var iat ions at the springs
and the presence o f s t ream sinks, all interpreted
as ev idence o f local ized, conduc t ing dissolut ion
channels . The aquifer is under la in by the imperv ious
Toarc ian format ion. It is bordered on the west side
by a thick, semi-perv ious series o f marls and marlous
carbonates located a long faults and flexures. The
aquifer is g lobal ly unconfined.
The main d ischarge f rom the aquifer is the perennial Boui l lant karstic spring, located along
the western boundary o f the aquifer. A secondary
discharge point, the Leche karstic spring, is located
222 M. Larocque et al./Journal of Hydrology 205 (1998) 217-231
500 m from the Bouillant spring. Along with the Echelle River, these springs form the Touvre River. with flow rates varying from 1.5 to 40 m 3 s -1. The contribution from the Leche spring and the Echelle River is relatively small with average flow rates of 0.73 and 0.17 m 3 s -~, respectively.
Four rivers flow on the carbonate formation. The Bandiat and Tardoire rivers are losing streams formed by runoff over the crystalline bedrock. These rivers dry out every summer as they flow over the carbonate rocks. The annual water budget of the aquifer shows that water lost from these rivers represents 51% of the average flow of the Bouillant and the Leche springs. The Bonnieure and the Echelle rivers are perennial and flow over the northern part and the south-western limit of the domain, respectively. Because of the absence of upstream hydrometric stations, water lost from these rivers is unknown and it is not sure whether or not they contribute all year to the karstic springs. However, the flow net- work, characterized using the piezometric data, shows that during the low water period, part of the Bonnieure River 's flow contributes to the Bouillant and the Leche springs. During the high water period, the Bonnieure River drains mostly towards the Charente River.
Fig. 1 illustrates the location of the different measurement stations which are named after nearby villages or towns. Six hydrometric stations measure
flow rates on the different rivers: before the main water losses of the Bandiat River (Feuillade) and Tardoire River (Montbron); after the main water losses on the Tardoire River (Coulgens); downstream on the Bonnieure River (Villebette) and on the Echelle River (Chez Drau); and downstream from the springs on the Touvre River (Foulpougne). Eight piezometric stations intercept the carbonate rock and are measured continuously. Table 1 presents the available data, the cutting points, m, and the lag times, k, used for the different analyses.
4. R e s u l t s
4.1. Study o f the springs' hydrographs
In a karst aquifer, it is assumed that the spring hydrograph provides an integrated representation of the network of stores and passages delivering water to the aquifer outflow point (Ford and Williams, 1989; Bonacci, 1993). It is therefore important to begin the study of time series with this global information. A daily composite measure of both springs, combined with the Echelle River is available at the Foulpougne station on the Touvre river, downstream from the discharge zone and is used to represent the global behaviour of the aquifer including the Bouillant spring. The flow rates at the Leche spring are also
1 r(k)
0,8
0,6
0,4
0,2
o
-0,2
-0,4
he
• --x,,X/X~../X_. ~ ~ ,a A _,,x \ . . . .
so 7s 12s
k (days)
S(0
50.
4 0 . - i
30.
20.
o
Foulpougne
0,1 0,2 0,3 0,4 f 0,5
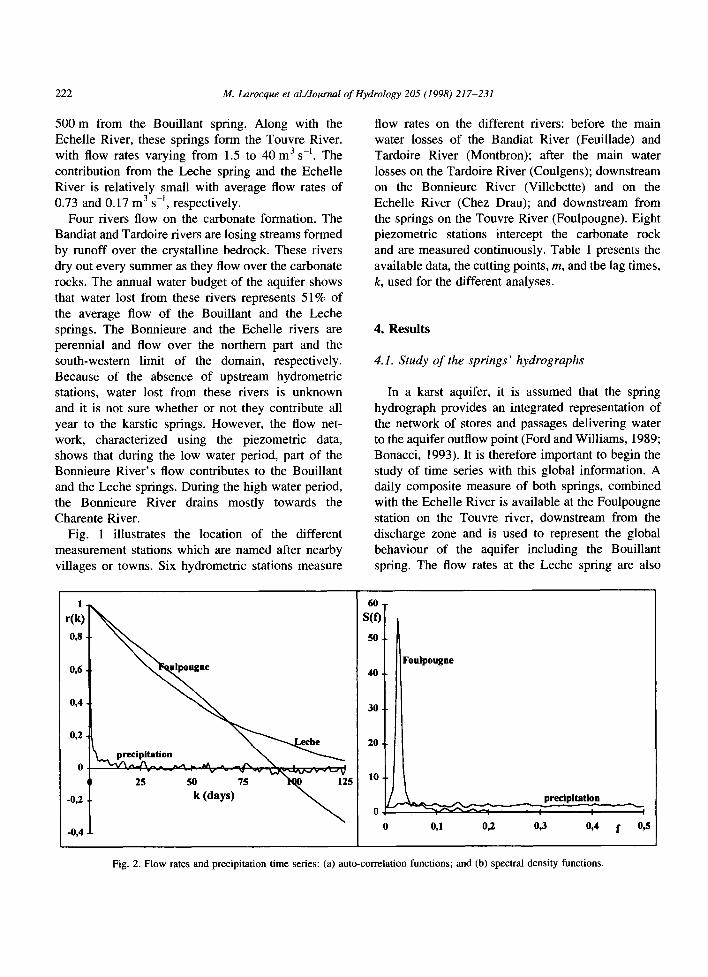
Fig. 2. Flow rates and precipitation time series: (a) auto-correlation functions; and (b) spectral density functions.
M. Larocque et al./Journal of Hydrology 205 (1998) 217-231 223
measured individually on a daily basis and are used separately to study the part of the aquifer drained by this spring.
Correlation and spectral analysis were performed on all the flow rates time series. Fig. 2(a) illustrates the auto-correlation functions, r(k), for the flow rates at both springs. The auto-correlations for the flow rates at Foulpougne and the Leche spring diminish very slowly when the time lag increases. This shows that the entire aquifer and the part drained by the Leche spring both have a large storage capacity which is emptied over a long period of time. The spectral density function for these time series have a regulation time, Trig, of 76.4 and 72.9 days for the Foulpougne and the Leche springs, respectively. These Treg values indicate that the aquifer's impulse response is very long. For comparison, Mangin (1984b) found Treg values of 14, 22.5, 50 and 70 days for karst aquifers in the French Pyrenees, the last one being considered as having considerable storage. Morales-Juberias et al. (1996) found a Treg value of 9.9 for a karst aquifer with low storage located in the north-west of Spain.
The Foulpougne station has an annual cycle shown by negative r(k) after 90 days (the river stations at Feuillade, Montbron, Coulgens and Villebette present a similar behaviour, but are not shown for clarity of the figures). The Foulpougne flow rates were analysed on a long-term basis using a longer m and a larger k. Fig. 2(b) presents the long-term simple spectral density functions for the flow rates at Foulpougne. A large peak between 333 and 400 days (f = 0.025 to 0.030) confirms the presence of an important annual cycle which is not visible in the longterm precipitation spectral density function. Similar results were obtained for river flow rates (not shown). This annual cycle can be explained by the annual recharge cycle of the aquifer. For the Foulpougne station, the annual recharge cycle is enhanced by the annual variations of the river flow rates since they form an important component of the output. The storage capacity of the aquifer reproduces the precipitation and river flow annual cycles. Water is stored in the aquifer during the recharge period and is later released during the dry season. This behaviour would not be observed in a highly karstified aquifer which would simply not store as much water. No annual cycle was observed at the Leche
spring or on the Echelle River, probably because of too short a time series.
For the Foulpougne and Leche stations, the gain function, g,~,0'), shows that the system amplifies the precipitation signal after 73.7 and 72.8 days for Foulpougne and the Leche spring, respectively. In a karst aquifer, the signal is amplified when water flowing at the spring comes, with a delay, from the release of storage water. The observed amplification is another indication of the aquifer's large storage capacity. The high storage of this aquifer could be explained by the presence of many small fissures which do not directly contribute to the spring flow during the high water period, but which store water that is released later when the highly transmissive fractures are desaturated.
4.2. Limits o f the aquifer
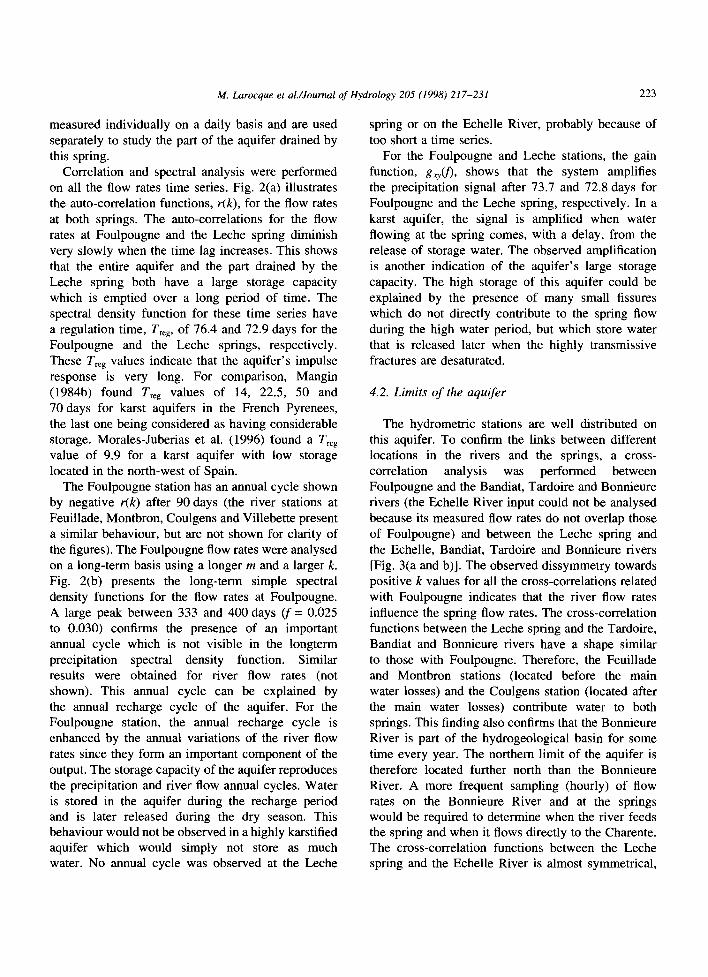
The hydrometric stations are well distributed on this aquifer. To confirm the links between different locations in the rivers and the springs, a cross- correlation analysis was performed between Foulpougne and the Bandiat, Tardoire and Bonnieure rivers (the Echelle River input could not be analysed because its measured flow rates do not overlap those of Foulpougne) and between the Leche spring and the Echelle, Bandiat, Tardoire and Bonnieure rivers [Fig. 3(a and b)]. The observed dissymmetry towards positive k values for all the cross-correlations related with Foulpougne indicates that the river flow rates influence the spring flow rates. The cross-correlation functions between the Leche spring and the Tardoire, Bandiat and Bonnieure rivers have a shape similar to those with Foulpougne. Therefore, the Feuillade and Montbron stations (located before the main water losses) and the Coulgens station (located after the main water losses) contribute water to both springs. This finding also confirms that the Bonnieure River is part of the hydrogeological basin for some time every year. The northern limit of the aquifer is therefore located further north than the Bonnieure River. A more frequent sampling (hourly) of flow rates on the Bonnieure River and at the springs would be required to determine when the river feeds the spring and when it flows directly to the Charente. The cross-correlation functions between the Leche spring and the Echelle River is almost symmetrical,
224 M. Larocque et al./Journal of Hydrology 205 (1998) 217-231
1 r(k)
O,S
1;5 l;o .
-0,6
VTbette
25 50 75 100 125 k (days)
1 r(k)
0,8
0,6
-0,2
-0,4
-0,6
25 50 75 100 125 k (days)
Fig. 3. Cross-correlation functions of river flow rates as input and (a) Foulpougne flow rates as output; (b) Leche spring flow rates as output.
indicating a very weak link between the two time series.The Echelle River therefore contributes very little to the flow rates of this spring and lies outside the limits of the aquifer.
The cross-correlation functions with Foulpougne have a maximum r~y(k) between 0.70 and 0.78 while those with the Echelle River have a lower maximum r~y(k), from 0.51 to 0.53 (excluding the Leche station). The signal is weaker between the rivers and the Leche spring than between the rivers and the entire aquifer, indicating that the area of the aquifer drained by the Leche spring transforms the input more than the aquifer does on a global scale.
4.3. Spatial variability
The coherence function, CO~y, expresses the inten- sity of the input-output link and its linearity. As linearity is a characteristic of highly karstified aqui- fers, COxy indicates qualitatively the importance of karstification over the aquifer. The study of this function at different locations provides insight on the spatial variability of the karstification and by extension of the hydrodynamic characteristics (Fig. 1).
The average CO~y for the precipitation-flow rate relationship are 0.68 for Foulpougne and 0.48 for the Leche spring. The average CO~y for the river flow rates-Foulpougne flow rates system are between 0.75 and 0.81, i.e. close to linearity. The CO~y for the
river flow rates-Leche spring flow rates and the Leche spring are somewhat smaller, between 0.65 and 0.70. These values indicate that the part of the aquifer drained by the Bouillant spring behaves almost linearly in response to the precipitation and river losses inputs. The part of the aquifer drained by the Leche spring behaves less linearly to these inputs and filters out part of the signal during its passage in the aquifer. This behaviour is probably due to the presence of less karstified rocks. These sub-aquifers are, however, not entirely independent and tracer tests (Quelennec et al., 1971) have shown that both are interconnected.
Physically, piezometric heads are not inputs or outputs of the system. However, because they are influenced by precipitation and water losses from the rivers, they serve as indicators of the state of the system at different locations in the aquifer. They provide information on the dynamics of the water level changes in the aquifer and on the origin and dynamics of infiltration. Cross-correlation and cross- spectral analyses were performed using precipitation as input and piezometric heads as output. The average CO~y varies spatially and is the lowest for the Cha- zelles and Bouex piezometers. It seems that the area around these piezometers reacts differently to distrib- uted recharge through precipitation than the rest of the aquifer. The Chazelles piezometer has a particu- larly low CO~y that could be related to the limited
M. Larocque et al./Journal of Hydrology 205 (1998) 217-231 225
karstification in the area. The part of the aquifer around Agris and Fosse Mobile transmits the precipi- tation input signal more linearly to the water table. This can be related to an area of low storage due to an important karstification and to a low storage capa- city of the unsaturated zone or epikarst.
4.4. Temporal variability
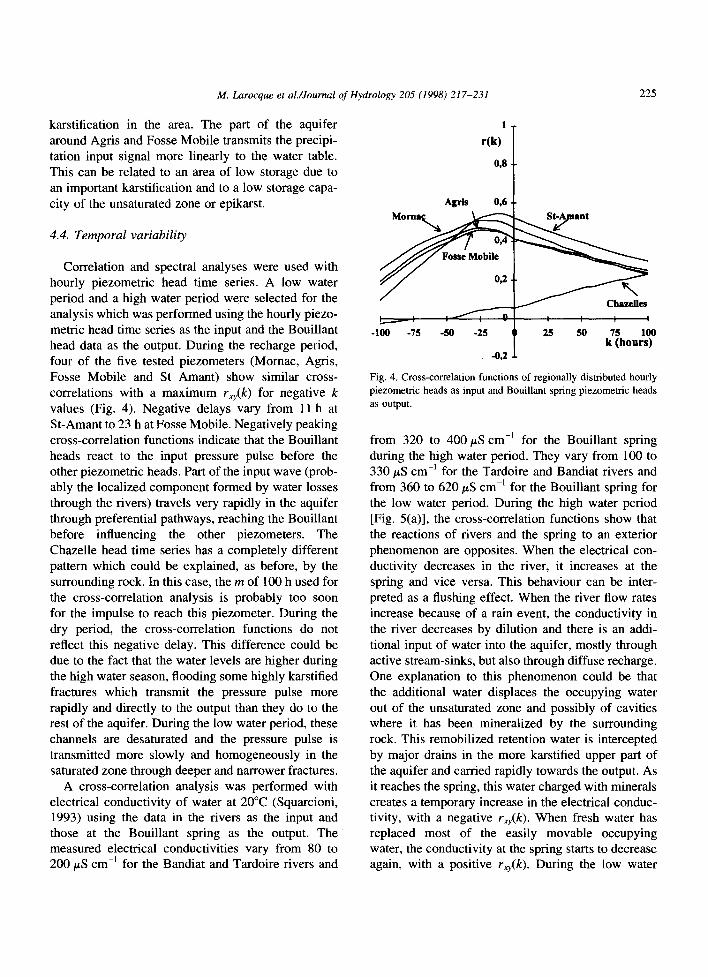
Correlation and spectral analyses were used with hourly piezometric head time series. A low water period and a high water period were selected for the analysis which was performed using the hourly piezo- metric head time series as the input and the Bouillant head data as the output. During the recharge period, four of the five tested piezometers (Mornac, Agris, Fosse Mobile and St Amant) show similar cross- correlations with a maximum rxy(k) for negative k values (Fig. 4). Negative delays vary from 11 h at St-Amant to 23 h at Fosse Mobile. Negatively peaking cross-correlation functions indicate that the Bouillant heads react to the input pressure pulse before the other piezometric heads. Part of the input wave (prob- ably the localized component formed by water losses through the rivers) travels very rapidly in the aquifer through preferential pathways, reaching the Bouillant before influencing the other piezometers. The Chazelle head time series has a completely different pattern which could be explained, as before, by the surrounding rock. In this case, the m of 100 h used for the cross-correlation analysis is probably too soon for the impulse to reach this piezometer. During the dry period, the cross-correlation functions do not reflect this negative delay. This difference could be due to the fact that the water levels are higher during the high water season, flooding some highly karstified fractures which transmit the pressure pulse more rapidly and directly to the output than they do to the rest of the aquifer. During the low water period, these channels are desaturated and the pressure pulse is transmitted more slowly and homogeneously in the saturated zone through deeper and narrower fractures.
A cross-correlation analysis was performed with electrical conductivity of water at 20°C (Squarcioni, 1993) using the data in the rivers as the input and those at the Bouillant spring as the output. The measured electrical conductivities vary from 80 to 200 t~S cm -1 for the Bandiat and Tardoire rivers and
1 r(k)
o,g
Agris 0,6
i . . . . . . . ~ i : ~ ! I J [ I i I t
-100 -75 -50 -25 Ip 25 50 75 100 I k (hours)
-0,2 .l.
Fig. 4. Cross-correlation functions of regionally distributed hourly piezometric heads as input and Bouillant spring piezometric heads as output.
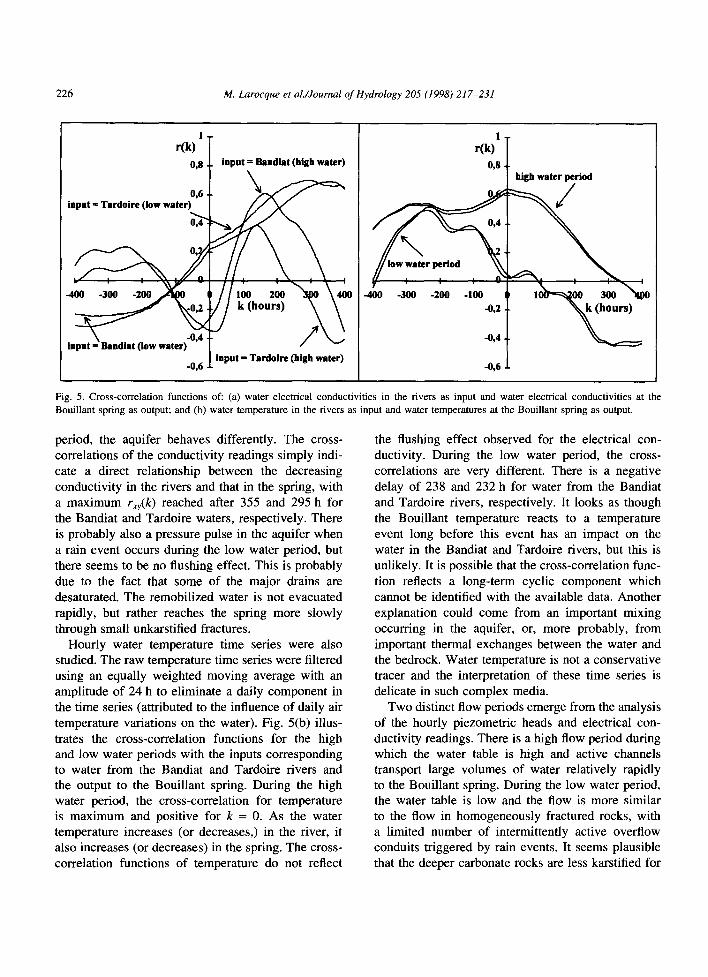
from 320 to 400/~S cm -1 for the Bouillant spring during the high water period. They vary from 100 to 330/~S cm -l for the Tardoire and Bandiat rivers and from 360 to 620/~S cm -l for the Bouillant spring for the low water period. During the high water period [Fig. 5(a)], the cross-correlation functions show that the reactions of rivers and the spring to an exterior phenomenon are opposites. When the electrical con- ductivity decreases in the river, it increases at the spring and vice versa. This behaviour can be inter- preted as a flushing effect. When the river flow rates increase because of a rain event, the conductivity in the fiver decreases by dilution and there is an addi- tional input of water into the aquifer, mostly through active stream-sinks, but also through diffuse recharge. One explanation to this phenomenon could be that the additional water displaces the occupying water out of the unsaturated zone and possibly of cavities where it has been mineralized by the surrounding rock. This remobilized retention water is intercepted by major drains in the more karstified upper part of the aquifer and carried rapidly towards the output. As it reaches the spring, this water charged with minerals creates a temporary increase in the electrical conduc- tivity, with a negative rxy(k). When fresh water has replaced most of the easily movable occupying water, the conductivity at the spring starts to decrease again, with a positive r,~,(k). During the low water
226 M. Larocque et al./Journal of Hydrology 205 (1998) 217-231
1 r(k)
0,8 input = Bandiat (high water)
input = Turdoire (l°w water )~ 4
1 r(k)
0,8
7 -400 -300 -200 -I00
-0,2
-0,4
-0,6
high water period
Fig. 5. Cross-correlation functions of: (a) water electrical conductivities in the rivers as input and water electrical conductivities at the Bouillant spring as output; and (b) water temperature in the rivers as input and water temperatures at the Bouillant spring as output.
period, the aquifer behaves differently. The cross- correlations of the conductivity readings simply indi- cate a direct relationship between the decreasing conductivity in the rivers and that in the spring, with a maximum rxy(k) reached after 355 and 295 h for the Bandiat and Tardoire waters, respectively. There is probably also a pressure pulse in the aquifer when a rain event occurs during the low water period, but there seems to be no flushing effect. This is probably due to the fact that some of the major drains are desaturated. The remobilized water is not evacuated rapidly, but rather reaches the spring more slowly through small unkarstified fractures.
Hourly water temperature time series were also studied. The raw temperature time series were filtered using an equally weighted moving average with an amplitude of 24 h to eliminate a daily component in the time series (attributed to the influence of daily air temperature variations on the water). Fig. 5(b) illus- trates the cross-correlation functions for the high and low water periods with the inputs corresponding to water from the Bandiat and Tardoire rivers and the output to the Bouillant spring. During the high water period, the cross-correlation for temperature is maximum and positive for k = 0. As the water temperature increases (or decreases,) in the river, it also increases (or decreases) in the spring. The cross° correlation functions of temperature do not reflect
the flushing effect observed for the electrical con- ductivity. During the low water period, the cross- correlations are very different. There is a negative delay of 238 and 232 h for water from the Bandiat and Tardoire rivers, respectively. It looks as though the Bouillant temperature reacts to a temperature event long before this event has an impact on the water in the Bandiat and Tardoire rivers, but this is unlikely. It is possible that the cross-correlation func- tion reflects a long-term cyclic component which cannot be identified with the available data. Another explanation could come from an important mixing occurring in the aquifer, or, more probably, from important thermal exchanges between the water and the bedrock. Water temperature is not a conservative tracer and the interpretation of these time series is delicate in such complex media.
Two distinct flow periods emerge from the analysis of the hourly piezometric heads and electrical con- ductivity readings. There is a high flow period during which the water table is high and active channels transport large volumes of water relatively rapidly to the Bouillant spring. During the low water period, the water table is low and the flow is more similar to the flow in homogeneously fractured rocks, with a limited number of intermittently active overflow conduits triggered by rain events. It seems plausible that the deeper carbonate rocks are less karstified for
M. Larocque et al./Journal of Hydrology 205 (1998) 217-231 227
two reasons: first the deeper rock is far from the upper most active solution region close to the epikarst and, secondly, less water follows flow paths because these paths are longer and the hydraulic gradient is smaller. After the desaturation of the upper highly transmissive layer, only the low transmissivity rock remains hydraulically active. However, these two periods are not easily defined and most probably vary in time and length from year to year. This type of aquifer has a highly dynamic response to input and probably rarely reaches steady state.
4.5. Delays between inputs and outputs
The delays between inputs and outputs are useful in the regional study of a karst aquifer because they give an estimation of the variation of the pressure pulse transfer times and of the particle travel times through the aquifer. The delays constitute an impor- tant information for management of the spring, for vulnerability studies and for the modelling of the aquifer.
In the La Rochefoucauld karst, the spring flow rates are composed of two different types of water: recharge water from net precipitation and water lost from the Bandiat and Tardoire rivers. A cross- correlation analysis of precipitation against the flow rates was performed for the Foulpougne and Leche
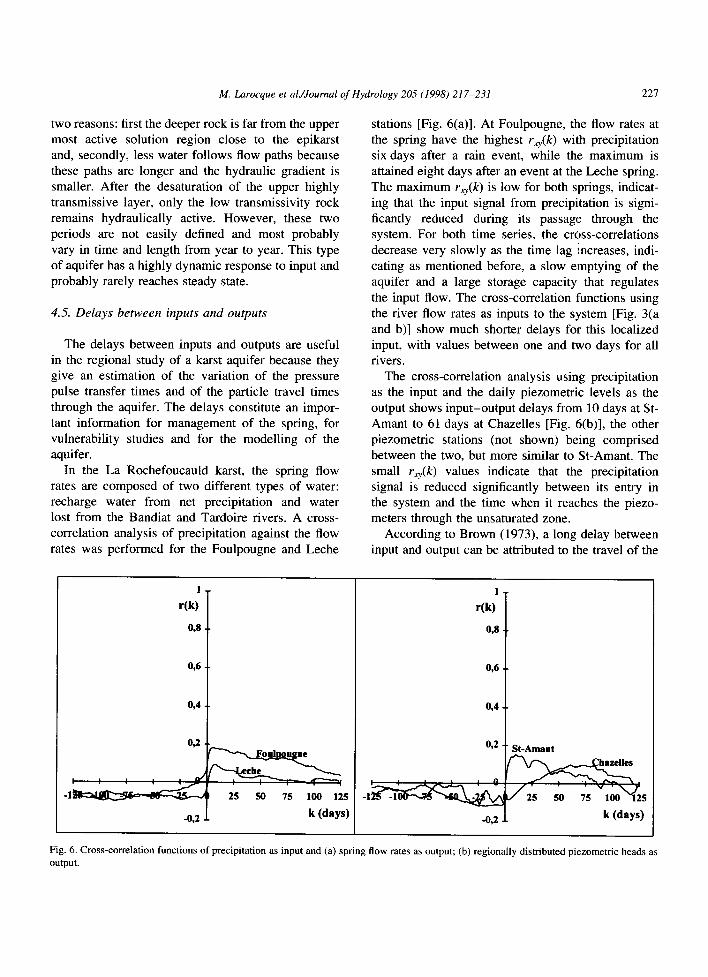
stations [Fig. 6(a)]. At Foulpougne, the flow rates at the spring have the highest r~.(k) with precipitation six days after a rain event, while the maximum is attained eight days after an event at the Leche spring. The maximum r~(k) is low for both springs, indicat- ing that the input signal from precipitation is signi- ficantly reduced during its passage through the system. For both time series, the cr0ss-correlations decrease very slowly as the time lag increases, indi- cating as mentioned before, a slow emptying of the aquifer and a large storage capacity that regulates the input flow. The cross-correlation functions using the river flow rates as inputs to the system [Fig. 3(a and b)] show much shorter delays for this localized input, with values between one and two days for all rivers.
The cross-correlation analysis using precipitation as the input and the daily piezometric levels as the output shows input-output delays from 10 days at St- Amant to 61 days at Chazelles [Fig. 6(b)], the other piezometric stations (not shown) being comprised between the two, but more similar to St-Amant. The small r~y(k) values indicate that the precipitation signal is reduced significantly between its entry in the system and the time when it reaches the piezo- meters through the unsaturated zone.
According to Brown (1973), a long delay between input and output can be attributed to the travel of the
1
r(k)
0,8
0,6
0,4
0,2
-0,2
|
25 50 75 I00 125
k (days)
1
r(k)
0,8
O y 6
0 , 4 .
0 ~ 2 ,
i i i i , ~
41,2
St-Amant
k (days)
Fig. 6. Cross-correlation functions of precipitation as input and (a) spring flow rates as output; (b) regionally distributed piezometric heads as output.
228 M. Larocque et al./Journal of Hydrology 205 (1998) 217-231
pressure pulse in an unsaturated zone, while a short delay comes from the transmission of the pressure pulse through the saturated zone which acts as a water hammer. This explanation is in accord with the actual results, where the longer delays correspond to the precipitation input which travels mostly through the unsaturated zone. The shorter delays coming from the river input are an indication that this component of the flow occurs through localized dissolution channels, which are mostly saturated. However, it is clear that this is a simplified represen- tation of the aquifer and in reality, the time required for a pressure pulse to reach the resurgence is influ- enced by both transmissivity and storativity.
The travel time of a pressure pulse is much shorter than the flow through time of the water responsible for the hydrograph rise at a spring. The particle flow paths are probably similar to those of the pressure pulse from river losses, but with much longer delays. The readings of electrical conductivity of the water at 20°C provide information on the travel time of water particles through the system [Fig. 5(a)]. During the high water period, the maximum r~y(k) value is reached after 163 h (111 m h -1) for water from the Bandiat River and 138h (135mh -1) for water from the Tardoire River. These results are confirmed by tracer tests which have shown effective speeds to be as much as 100 m h -l (Quelennec et al., 1971). These large water speeds indicate the presence of very rapid flow, probably through karstified fractures.
4.6. Specific storage and porosity
In a confined aquifer, the total porosity, n and the specific storage coefficient, Ss, of an aquifer can be evaluated through the study of the earth tides and the barometric effect on the fluctuations of hourly piezo- metric heads (Ah). Earth tides are the response of the water levels to the dilatation of a confined aquifer caused by the moon's movement around the Earth. Earth tides have been related to head fluctuations by Bredehoeft (1967) using aquifer dilatation, 0(4.5 x 10⁻⁸):
0 Ah = --. (17)
Ss
The barometric fluctuations observed in a confined
Table 2 Specific storage and porosity from hourly piezometer heads
ss (l/m) n (%)
Agris 4.5 × 10 -7 0.89 Boufix 1.5 x 10 4 0.94 Chazelles 1.1 x 10 4 1.35 St Amant 5.0 × 10 -7 0.81
aquifer are proportional to the daily variations in atmospheric pressure and the constant of proportion- ality is called the barometric efficiency, B. Jacob (1940) linked B to Ss, through the porosity, n, the elasticity module of water, Ew(2.1 × 10⁸ kg m-Is-2), the water volumetric mass, p (999 kg m -3) and the acceleration of gravity, g (9.81 m s-e):
pgn (18) S s - EwB"
Provided it is possible to evaluate Ah and B, the calculation of Ss and n is straightforward. To estimate B, Marsaud et al. (1993) used the value of the gain function at the frequency corresponding to the dally barometric variation (24 h). The Ah due to the earth tides can be measured directly on the raw hourly head data by locating the semidiurnal (12 h) head variations. High and low water hourly piezometric head time series were analysed for earth tides and barometric effects. These effects were observed on four out of eight piezometers during both periods.
Table 2 shows the results obtained from this part of the analysis, high and low water periods combined. The estimated parameters are spatially homogeneous with values from 0.81 to 1.35% for n and from 10 -6 to 10 -7 for Ss. The low n values indicate almost no flow through the aquifer matrix and are at the lower limit of the fracture porosity in carbonate rocks (Castany, 1982). The specific storage values are also very small. These low values could be explained by the very short-term effect of the earth tides and the baro- metric effects (6 and 12 h). This duration is probably too short for the smaller fissures responsible for storage to be involved and the flow is transmitted through large and probably karstified fractures. The observation of the earth tides and the barometric effects also shows that the aquifer has a confined behaviour since these effects are negligible in an unconfined aquifer. The confined behaviour in this
M. Larocque et al./Journal of Hydrology 205 (1998) 217-231 229
apparently unconfined aquifer could be due to the presence of a more karstified conductive layer, carry- ing important water volumes, confined between less conductive carbonate rocks. The confined behaviour could also be due more simply to the presence of a negligible specific yield, as is often the case in a karst aquifer.
One reason for not observing earth tides and baro- metric effects on the other piezometers could be that local turbulence alters the signal in such a way that daily and semidiurnal variations are not visible. Earth tides can also mask the barometric effect and irregular pumping cycles can mask the head variations due to the earth tides. The absence of earth tides and barometric effects can also be explained locally by the absence of large karstified fractures which induce the confined behaviour.
5. Discussion and conclusion
The classical application of spectral and correlation analyses with the study of the spring hydrographs has provided global information concerning the slow emptying and large storage capacity of this aquifer. This is an important component of flow which can be neglected when compared with more spectacular karstic manifestations. The presence and importance of this storage capacity can be very valu- able for planning ground water use. The use of varied and distributed time series has completed these results and provided valuable information for the regional understanding of the flow.
The study of river-spring flow rates have shown that the aquifer can be delimited at least from Feuillade and Montbron to the east, up to Villebette and north of the Bonnieure. The Echelle River does not participate to the flow at the springs. More fre- quent sampling would be required to determine the part of the year during which the Bonnieure River contributes to the flow at the springs. Most of the results show that the aquifer can be divided in two zones, north and south. The northern part of the aqui- fer transmits the distributed recharge from precipita- tion more rapidly and more linearly than the southern part, through the unsaturated zone and to the water table. This is an indication of the karstification spatial variability in the unsaturated zone. The groundwater
flow composed of water lost from the rivers also travels more linearly in the northern part of the aqui- fer. This component of flow is transmitted more linearly and more strongly to Foulpougne than to the Leche spring. When the flow paths cross the southern area of the aquifer, the groundwater flow becomes diffuse and the input signal is more trans- formed than when it travels directly to the Bouillant spring. The study of hourly piezometric heads and electrical conductivity time series show the presence of a temporal variability of karstification. This can be attributed to the vertical variability of the karstifi- cation which is more important near the top of the aquifer. When the water level drops, the larger drains are desaturated and the more homogeneously frac- tured rock transmits the inputs slower and less line- arly. The study of the delays has provided information on the transfer times of pressure pulses and on travel times of water particles. This information is very valuable for the management of the water resources, for the study of its vulnerability and for modelling. The electrical conductivity time series have shown that the real travel time of water particles is more than 100 m h -1 which indicates the presence of very rapid flow, probably through karstified fractures. The identification of earth tides and barometric effects on some piezometers is an indication that this appar- ently unconfined aquifer can have a confined beha- viour when subjected to very high frequency effects. The reason for this behaviour is uncertain, but it could be due to the presence of a confined more karstified conductive layer or more simply to the presence of a negligible specific yield. The small porosity values indicate that there is no significant flow in the rock matrix and that most flow occurs in the fissures and karstified fractures.
These results show that correlation and spectral analyses using various types of spatially distributed time series data are useful in the initial characteri- zation of a karst aquifer. This regional understanding of groundwater flow could not be obtained through a classical use of spectral and correlation analysis. In this regional application, however, some time series appear to be more instructive than others. Flow rates and piezometric head time series can be interpreted relatively easily and, in the example presented, con- tained valuable information. Hydrometric and piezo- metric stations are usually the first to be implemented
230 M. Larocque et al./Journal of Hydrology 205 (1998) 217-231
on a studied aquifer and therefore are often available. Electrical conductivity readings were also useful, but this information usually requires more collection effort. In the example presented, these time series provided information that was directly compatible with tracer tests. These time series could be used to replace or plan tracer test. Temperature readings provided little information in the example presented and may not be of good use in an aquifer with much mixing or important thermal exchanges between the water and the bedrock. Moreover, the longer the time series, the more information they contain. It is there- fore important to start collecting data long before analysis. Uninterrupted time series are also a necessity for correlation and spectral analyses. Readings on a short time period (one hour) are most useful as they provide more information and can be aggregated into daily values, if required. If the aquifer is confined or is suspected to have a confined behaviour, an analy- sis of the hourly piezometric times series requires atmospheric pressure time series on a short-term basis. Finally, simultaneous collection of the differ- ent time series is recommended to ensure that the analysed signals are coherent in time and are therefore more easily interpreted.
Some of the results obtained in this study are con- firmed by previous findings on the example aquifer. Other results contribute valuable new information concerning the spatial and the temporal heterogeneity of the flow in this karst aquifer. Authors will agree that time series data should be part of any regional investigation of aquifer hydrodynamics because these data contain valuable information concerning the nature of flow. This study shows that using different types of spatially distributed time series gives a new dimension to correlation and spectral analyses, lead- ing to a regional understanding of the hydrodynamic characteristics and flow conditions in a karst aquifer. It remains to be seen if the analysis of different types of spatially distributed time series can be as useful in differently karstified carbonate rock aquifers such as entirely diffuse or conduit flow karst aquifers.
Acknowledgements
This research was supported in part by the Conseil General de la Charente (France) and by the French
Ministry of Foreign Affairs. The authors would like to thank Meteo-France, the DIREN Poltou-Charente, the Conseil General de la Charente and the BRGM Poitou-Charente for providing all the necessary data.
References
Atkinson, T.C., 1977. Diffuse flow and conduit flow in limestone terrain in the Mendip Hills, Somerset (Great Britain), J. Hydrol., 35, 93-110.
Bangoy, L.M. and Drogue, C., 1994. Analysis of intermittent pumping tests in fissured fractal aquifers: theory and applica- tions, J. Hydrol., 158, 47-59.
Bonacci, O., 1993. Karst spring hydrographs as indicators of karst aquifers, J. Hydrol. Sci., 38 (1-2), 51-62.
Box, G.E.P., Jenkins, G.M. and Reinsel, G.C., 1994. Time Series Analysis: Forecasting and control, 3rd ed. Prentice Hall Inc. Englewood Cliffs, NJ, USA.
Bredehoeft, J.D., 1967. Response of well-aquifer systems to earth tides, J. Geophys. Res., 72 (12), 3075-3087.
Brown, M.C., 1973. Mass balance and spectral analysis applied to karst hydrologic networks, Water Resourc. Res., 9 (1), 749-752.
Castany, G., 1982. Principes et Mrthodes de l'Hydrogrologie. Dunod, Paris, France.
Clarke, R.T., 1996. Residual maximum likelihood (REML) methods for analysing hydrological data series, J. Hydrol., 182, 277-295.
Ford, D. and Williams, P., 1989. Karst Geomorphology and Hydrology. Chapman and Hall, London, UK, p. 601.
Jacob, C.E., 1940. On the flow of water in an elastic artesian aquifer, Trans. Am. Geophys. Union, 21,574-586.
Mangin, A., 1984. Pour une meilleure connaissance des syst~mes hydrologiques h partir des analyses corrflatoire et spectrale, J. Hydrol., 67, 25-43.
Mangin, A., 1984. Ecoulement en milieu karstique. Annales des Mines, May-June, pp. 1-8.
Marsaud, B., Mangin, A. and Bel, F., 1993. Estimation des caract 6ristiques physiques d'aquifrres profonds ~ partir de l'incidence baromrtrique et des marres terrestres, J. Hydrol., 144, 85-100.
Max, M., 1980. Mrthodes et Techniques de Traitement du Signal et Application aux Mesures Physiques, 2nd ed. Masson, Paris, France.
McConnell, C.L., 1993. Double porosity well testing in the fractured carbonate rocks of the Ozarks, Ground Water, 31 (1), 75-83.
Moore, G.K., 1992. Hydrographs analysis in fractured rock terrane, Ground Water, 30 (3), 390-395.
Morales-Juberias, T., Cruz-Sanjulian, J.J., Zafra, P., Olazar, M. and Arandes, J.M., 1996. Etudes des rrponses naturelles du systrme karstique d'Olalde (Pays Basque): approche de la reconnaissance de sa structure interne, Hydrogrologie, 1, 39-51.
M. Larocque et al./Journal of Hydrology 205 (1998) 217-231 231
Padilla, A., Pudillo-Bosch, A. and Mangin, A., 1994. Relative importance of baseflow and quickflow from hydrographs of karst springs, Ground Water, 32 (2), 267-277.
Padilia, A. and Pulido-Bosch, A., 1995. Study of hydrographs of karst aquifers by means of correlation and cross-spectral ana- lysis, J. Hydrol., 168, 73-89.
Quelennec, R.E., Sauret, J.C., Seguin, M. and Vouve, J., 1971. Les r6surgences de la Touvre. Etude pr61iminaire. Annales Scienti- fique de l'Universit6 de Besanqon, G6ologie, 3rd series. Fasc. 15. Colloque d'hydrologie en pays calcaire. Besanc,:on, Suisse, 8/10-9/10 1971, pp. 197-255.
Smart, C.C., 1988. Artificial tracer techniques for the determination of the structure of conduit aquifers, Ground Water, 26 (4), 445-453.
Soulios, G., 1991. Contribution h l'6tude des courbes de r6cession
des sources karstiques. Exemples du pays Hell6nique, J. Hydrol., 127, 29-42.
Squarcioni, P., 1993. Etude du transit de l'eau dans le reservoir karstique de la Touvre au moyen des courbes de flux chimique- d6bit. Conseil G6n6ral de la Charente. Hydro-Invest no. 93010090, Angoul~me, France.
Thrailkill, J., 1985. Flow in a limestone aquifer as determined from water tracing and water levels in wells, J. Hydrol., 78, 123-136.
Thrailkill, J., 1988. Drawdown interval analysis: a method of determining the parameters of shallow conduit flow carbonate aquifers from pumping tests, Water Resourc. Res., 24 (8), 1423-1428.
White, W.B., 1969. Conceptual models for carbonate aquifers, Ground Water, 7 (3), 15-21.