continuous distribution model for the investigation of complex molecular architectures near...
TRANSCRIPT

Continuous distribution model for the investigation of complex moleculararchitectures near interfaces with scattering techniques
Prabhanshu Shekhar,1 Hirsh Nanda,1,3 Mathias Losche,1,2,3,a) and Frank Heinrich1,3
1Department of Physics, Carnegie Mellon University, 5000 Forbes Avenue, Pittsburgh, Pennsylvania15213-3890, USA2Department of Biomedical Engineering, Carnegie Mellon University, 5000 Forbes Avenue, Pittsburgh,Pennsylvania 15213-3890, USA3The National Institute of Standards and Technology, Center for Neutron Research, Gaithersburg,Maryland 20899-6102, USA
(Received 1 September 2010; accepted 28 November 2010; published online 30 November 2011)
Biological membranes are composed of a thermally disordered lipid matrix and therefore require
non-crystallographic scattering approaches for structural characterization with x-rays or neutrons.
Here we develop a continuous distribution (CD) model to refine neutron or x-ray reflectivity data
from complex architectures of organic molecules. The new model is a flexible implementation of
the composition-space refinement of interfacial structures to constrain the resulting scattering
length density profiles. We show this model increases the precision with which molecular
components may be localized within a sample, with a minimal use of free model parameters. We
validate the new model by parameterizing all-atom molecular dynamics (MD) simulations of
bilayers and by evaluating the neutron reflectivity of a phospholipid bilayer physisorbed to a solid
support. The determination of the structural arrangement of a sparsely-tethered bilayer lipid
membrane (stBLM) comprised of a multi-component phospholipid bilayer anchored to a gold
substrate by a thiolated oligo(ethylene oxide) linker is also demonstrated. From the model we
extract the bilayer composition and density of tether points, information which was previously
inaccessible for stBLM systems. The new modeling strategy has been implemented into the ga_reflreflectivity data evaluation suite, available through the National Institute of Standards and
Technology (NIST) Center for Neutron Research (NCNR). VC 2011 American Institute of Physics.
[doi:10.1063/1.3661986]
I. INTRODUCTION
Lipid bilayers in biological membranes are thermally disor-
dered leaflets of fluid aliphatic molecules, assembled by hydro-
phobic interactions that expose a chemically diverse interface to
their aqueous environment. They form the plasma membranes
facing the intercellular space and the internal membranes that
confine cell organelles. In both cases, the bilayer acts as a tightly
controlled permeation barrier that interacts with proteins in a
multitude of ways and mediates responses of the cell to external
and internal cues. If these responses follow predefined patterns,
the cell goes about its complex business plan using well-
orchestrated, feedback-controlled reactions. However, this com-
plexity of choreographed transcription and signaling events also
holds the prospect for a wide range of pathologies, if something
goes wrong.
X-ray and neutron scattering have been essential for char-
acterization of the basic bilayer structure through small-angle
scattering from vesicles, one-dimensional (1D) diffraction from
aligned multi-bilayer stacks, and reflection from single planar
bilayers. As explored extensively by many laboratories,1–6 scat-
tering techniques are well suited to unravel the disordered
nature of fluid membranes where crystallography fails due to
the lack of long-range order. With the basic bilayer structure
firmly established, it has now become possible to ask detailed
questions as to how membrane-specific proteins interact with
bilayers and if protein-lipid interactions differ for proteins in
their active and mutated forms. Within the family of scattering
techniques, such questions are arguably best investigated with
x-ray or neutron reflectometry (XR and NR, respectively) on
single bilayers supported by solid substrates, a methodology
that allows for the investigation of the membranes without and
with protein in subsequent scans of the same physical sample.
In recent years, we developed the technology to perform
such studies with NR.7–9 Here we describe a flexible and mod-
ular modeling technique, based on earlier work in our lab and
others,10–13 to maximize the information extracted from
reflectivity measurements of substrate-supported bilayers.
While simple slab models (“box” models)11 are still widely
used in the evaluation of reflectometry data of membrane
structures, such models cannot describe partial overlap of mo-
lecular fragments along the membrane normal. However, such
a coexistence of distinct molecular components within the
same cross-sectional area of the bilayer occurs generally in
membranes. The new model developed here overcomes this
limitation, thereby providing a logical step toward more
realistic descriptions of membrane structures.
In this paper, we describe the use of NR isotopic con-
trast variation to unravel details of bilayer structures. How-
ever, the procedures we developed are equally applicable to
XR data interpretation, or to the joint refinement of XR
and NR data. We discuss the model implementationa)Electronic mail: [email protected].
0021-8979/2011/110(10)/102216/12/$30.00 VC 2011 American Institute of Physics110, 102216-1
JOURNAL OF APPLIED PHYSICS 110, 102216 (2011)

and application to solid-supported bilayers, specifically,
a sparsely-tethered bilayer lipid membrane (stBLM). A soft-
ware implementation of the model has been integrated into
the reflectometry data evaluation program ga_refl by the
NIST Center for Neutron Research (NCNR).14
A. Composition-space refinement of interfacialstructures
In the analysis of reflectivity or multilayer diffraction
data of membranes, modeling of the underlying structure in
terms of chemical composition is often advantageous.13 Mod-
eling techniques for reflectivity data evaluation were initially
developed to bypass the phase problem, i.e., phase informa-
tion lost in the measurement of scattering intensity. These
approaches were refined to parameterize molecular compo-
nents and their configurations within a sample, an approach
termed composition-space refinement.10,11 In reflectometry,
even if scattering length density (SLD) profiles can be worked
out from first principles or can be determined by direct inver-
sion,15,16 composition-space refinement has advantages in that
it allows intuitive models to be implemented that constrain the
full range of SLD profiles by retaining only those relevant for
plausible chemical structures. This is particularly important in
neutron scattering when using isotopic variation of selected
chemical species, typically by 1H=2H substitution in biologi-
cal samples. Data evaluation can be very effectively dealt
with in the composition-space refinement approach if volu-
metric information is available for the sample components
because the parameterized molecular structures can be directly
mapped to reflect the isotopic constitutions of the sample.
Finally, this approach also permits the consistent evaluation of
x-ray and neutron measurements of identically prepared
samples.10,11
In more detail, a composition-space refinement approach
for NR represents sub-molecular components of the sample
as cross-sectional area profiles A(z) along an axis of orienta-
tion z, which for membrane studies usually is the bilayer nor-
mal. Figure 1 shows the space-filling structures of two
molecules of a membrane-forming lipid, DMPC,17 arranged
in opposite leaflets of a bilayer and the out-of-plane distribu-
tions of its sub-molecular components as obtained from a
molecular dynamics (MD) simulation. Absolute component
volumes can be computed by integration of the area profile
A(z): Vc ¼Ð
bilayer AcðzÞdz.
A variety of real-space models that approximate the area
profiles of sub-molecular components, such as those shown in
Fig. 1, have been developed for neutron scattering from mem-
brane structures. These include “box” models (slab models or
strip-function models18,19), models that use Gaussian distribu-
tions of sub-molecular components,12,20,21 hybrids of strip-
function and Gaussian models,22 and disordered crystalline
models.23 Thermal and conformational disorder is generally
described as a Gaussian broadening of the out-of-plane posi-
tions of the atoms of the film-forming molecules. This can be
implemented in real space, for example, by convoluting the
intrinsic (i.e., unbroadened) profile of an “average” molecule
within the bilayer with a Gaussian function of appropriate width
r, or by multiplying the scattered intensity computed for the
intrinsic SLD distribution with a Debye-Waller term in recipro-
cal space.24 The assumption of Gaussian broadening is also the
basis for the model developed here, which implements thermal
disorder by using error functions.
An approach that has been most widely used for organic
interface structures in XR and NR data analysis is the box
model,25–27 in which the 1D SLD profile is parameterized in
terms of stratified slabs of certain average chemical composi-
tions. At the boundaries, the average SLDs jump according
to the different sub-molecular contents of the neighboring
slabs, rather than changing smoothly as the spatial distribu-
tions of sub-molecular groups change along z.28 A
composition-space refinement with box models is thereby
achieved by appropriately subdividing the overall SLD pro-
file with regard to (abrupt) changes in the chemical composi-
tion of the slabs along the surface normal. Also widely used
are models employing Gaussian functions,29 or direct inver-
sion techniques.16,30
In this paper, we implement a general modeling strategy
for NR or XR, which we will call ”continuous distribution”
(CD) modeling, that takes advantage of the self-consistency
intrinsic to the composition-space refinement approach. The
CD model addresses efficiently the requirement of complete
space-filling within the sample. Although we discuss its fea-
tures in terms of modeling phospholipid bilayers supported
by a solid substrate, it is a general approach that may also
benefit investigations of more complex structures.
II. DISTRIBUTION OF MOLECULAR COMPONENTSACROSS AN INTERFACE: MODEL IMPLEMENTATION
A. Design of an error function-based model andcomparison to Gaussian distributions
Figure 2(A) shows a hypothetical example of the pro-
jected positions of a subset of atoms in a lipid on the inter-
face normal. This subset may define a sub-molecular
component of a molecule, such as the lipid’s phosphate
group. An ensemble of such molecules, e.g., lipids, deter-
gents, peptides or proteins, or polymers is self-assembled at
the interface to form an extended, in-plane homogeneous
FIG. 1. (Color online) Distribution of sub-molecular components along the
membrane normal in a DMPC bilayer, as obtained from a MD simulation
(Ref. 52). The overlaid DMPC molecules are drawn to scale.
102216-2 Shekhar et al. J. Appl. Phys. 110, 102216 (2011)

surface architecture, such as a lipid bilayer in contact with
buffer or a self-assembled monolayer (SAM) in contact with
air or organic solvent. Under the assumption that each
atomic position within the ensemble can be approximated by
a normalized Gaussian function G(z,r), the area profile A(z)
takes on the form of Eq. (1) where Vi is the volume of an
individual atom i, and zi is its position,
AðzÞ ¼ Gðz; rÞ �ð1�1
Xi
Vidiðz� ziÞdz
¼X
i
ViGðz� zi; rÞ (1)
Equation (1) is usually impractical to use because it accounts
for all individual atoms, A(z)¼A(z,r, V1…i, z1…i). For reflec-
tometry, the experimental resolution is also generally too
low to determine positions of individual atoms. An appropri-
ate grouping of atoms into sub-molecular components is
therefore required. Figure 2(B) illustrates an approach,10 in
which the atomic positions zi of a sub-molecular component
are combined into a single average position z0 and the indi-
vidual atomic volumes Vi are lumped into the component
volume V. Thus, the area profile becomes a single Gaussian
function,
AGaussðzÞ ¼ Gðz; rÞ �ð1�1
Vidiðz� z0Þdz
¼ VGðz� z0; rÞ : (2)
Although this simplification reduces the number of parameters
drastically, it may cause complications for XR=NR data anal-
ysis. First, the information about the projected extension of
the component along the z direction, previously contained in
the values zi, is now convoluted with the width of the Gaus-
sian function, r. Second, combining area profiles of distinct
sub-molecular components will result in an uneven filling of
the available space along z, even if the integral in Eq. (2)
matches exactly the total molecular volume, because Gaussian
area profiles of neighboring components will not add to a con-
stant area A. Instead, A(z) will vary as a function of z, such
that overfilling will occur for some positions z, compensated
for by underfilling elsewhere along the bilayer normal.
A different approach [Fig. 2(C)] avoids these problems:
The positions of individual atoms are approximated by a
boxcar function, b(z0,l,A) with A¼V=l, where V is the vol-
ume of the sub-molecular component, l is the projected
extension along z, and z0 the center position. The functional
form of the area profile then becomes the sum of two error
functions,
AErfðzÞ ¼ Gðz; rÞ � bðz; z0; l;AÞ
¼ð1�1
Gðz0; rÞbðz� z0; z0; l;AÞdz0
¼ð1�1
Gðz0; rÞVl
H
�z� z0 þ
1
2l� z0
��
�H
�z� z0 �
1
2l� z0
��dz0
¼ V
2lerf
z� z0þ12lffiffiffi
2p
r
� �� erf
z� z0 � 12lffiffiffi
2p
r
� �� �: (3)
H(z) is the Heaviside function. The functional form of this area
profile conserves the parameter l as the intrinsic (i.e., the
unbroadened) value of the projected length of the molecular
component. The Gaussian model is included in this model
implementation as a special case for AGaussðzÞ ¼ liml!0
AErfðzÞ.The functional form in Eq. (3) accommodates two occurrences
of the width parameter r which may be assigned distinct values.
A(z) is then parametrized by the component volume V, the pro-
jected length l on z, the center position z0, and r1 and r2,
AðzÞ ¼ V
2lerf
z� z0 þ 12lffiffiffi
2p
r1
� �� erf
z� z0 � 12lffiffiffi
2p
r2
� �� �: (4)
Using distinct r values is one way to extend the model beyond
Eq. (3). Intrinsic volume distributions may differ from a box-
car function or variations in disorder along z may arise from
different conformational degrees of freedom within a molecu-
lar component. However, r1=r2 may result in A(z)< 0 at
large values of jzj for that particular component. We show in
the Supplemental Information that moderate constraints on ri
ensure that A(z) remains positive in a computationally relevant
interval and that the error in the integrated area profile along
z, i.e., the volume, remains sufficiently small due to the limita-
tion of the computation to this interval.
The integral of the area profile equals V, independent of
l and r,
FIG. 2. Possibilities of accounting for atomic positions along the normal direction z at an interface for reflectivity modeling. (A) Average positions of the five
atoms of a lipid phosphate group. (B) Lumping together atomic positions into one average position as a basis of describing the phosphate distribution by a
Gaussian function. (C) Approximating the associated volume V of the component atoms by a boxcar function of width l and height Ab¼V=l that represents the
cross-sectional area of the component. This approximation is the basis of the model developed in this work.
102216-3 Shekhar et al. J. Appl. Phys. 110, 102216 (2011)

ð1�1
AðzÞdz ¼ð1�1
V
2lerf
z� z0 þ1
2lffiffiffi
2p
r1
0B@
1CA� erf
z� z0 �1
2lffiffiffi
2p
r2
0B@
1CA
264
375dz
¼ V
2l
ffiffiffi2p
r1
z� z0 þ 12ffiffiffi
2p
r1
erfz� z0 þ 1
2ffiffiffi2p
r1
� �þ e
�z�z0þ1
2ffiffi2p
r1
� �2
ffiffiffipp
2664
37751
�1
0BB@
�ffiffiffi2p
r2
z� z0 � 12ffiffiffi
2p
r2
erfz� z0 � 1
2ffiffiffi2p
r2
� �þ e
�z�z0�1
2ffiffi2p
r2
� �2
ffiffiffipp
2664
37751
�1
1CCA ¼ V
2l�2z0 þ l½ � � �2z0 � l½ �ð Þ ¼ V: (5)
For the purpose of XR=NR data analysis, each molecular
component c is assigned its scattering length, i.e., the neutron
scattering length, bc, or the total electron number for x-rays,
necxre (where re¼ 2.82� 10�5 A is the Thomson electron
radius).
B. Error functions ensure volume filling intrinsically
Figure 3 shows how the sum of two error functions,
expressed by Eq. (4), forms a spatially confined distribution.
This distribution approximates a Gaussian, i.e., the func-
tional form often used to represent the thermal or conforma-
tional spread [Fig. 3(A)] for the case when the distance
between the two roots, S1 and S2, vanishes. It also shows
[Fig. 3(B)] how the sum of four error functions, in which the
second set is characterized by distinct r parameters,
create an asymmetric distribution that satisfies volume filling
as long as the values of r are identical at the common inter-
face between the two sub-molecular distributions. In fact,
any number, n, of sub-molecular components, described by
two error functions each, can be combined and will fill the
area profile A(z) homogeneously along the z axis, thus
achieving an ideal volume filling, under the following
conditions:
1. The maximum value, max(A(z))¼V=l, of each compo-
nent area profile equals the global area per molecule.
2. The roots of two error functions, with a positive and with
a negative slope, of adjacent molecular components coin-
cide at the same position z.
3. The values ri,2 and riþ 1,1 of the overlapping error func-
tions are identical for 1� i< n.
Generally, any odd function symmetric about its root zS,
A(zS� z)¼�A(zSþ z), will lead to ideal volume filling under
the above conditions. In this respect, the choice of the error
function is arbitrary. Figure 3(B) shows an exemplary repre-
sentation of two area profiles A1(z) and A2(z) that satisfy the
above conditions. Ensuring that the area per molecule V=l is
equal for both area profiles fulfills condition 1. Conditions 2
and 3 are fulfilled, as r2 of the area profile A1(z) equals r1
of A2(z) and the roots of the overlapping error functions
coincide in S2. Because conditions 2 and 3 are satisfied, these
two error functions cancel all along z. The total sum of the
two area profiles then equals the sum of the two remaining
error functions with half-maxima through points S1 and S3.
FIG. 3. (Color online) (A) The sum of two error functions represents an
area profile A(z) of a sub-molecular component within a layered interface
structure with the following parameters: l¼ 4 A, V¼ 8 A3, r1¼r2¼ 1 A.
The overlaid Gaussian function has the same volume V and a width parame-
ter rGauss � 1.63 r1. (B) Adding a second sub-molecular component with
the same l, V=l, and r1 at the common interface results in ideal volume fill-
ing, even if r1=r2 for the second component. For details, see text.
102216-4 Shekhar et al. J. Appl. Phys. 110, 102216 (2011)
Since the values of V=l of the two profiles are the same, the
two error functions add up to a new area profile of the form
of Eq. (4). The extension of this line of arguments to any
number of component area profiles is straightforward.
If the area per molecule V=l of any one of the compo-
nent profiles is smaller than the global area per molecule,
this will lead to underfilling of the available volume. This is
indeed a realistic situation that may often occur, e.g., for
hydrated lipid head groups where the solvent fills the remain-
ing volume.
The second condition stated above may not be strictly sat-
isfied in all situations. Rather, a distance, leading to a deple-
tion of film-forming species, may separate two adjacent
sub-molecular components. This situation is not necessarily
unphysical, as the solvent may fill the voids. An unphysical
situation might only arise if the two sub-molecular compo-
nents are chemically bonded to each other in which case a
depletion zone would not be consistent with a physically valid
model. In any case, a spatial separation of two sub-molecular
components increases the number of model parameters. For
joined components, the parameters l and z0 of all components
are linked by the constraint that the roots of adjacent error
functions coincide. This link is broken for separated compo-
nents, leading to a larger number of independent parameters.
In some cases it is necessary to mirror an area profile on
a given interface at a position zM because of physical con-
straints. An example is an impermeable solid substrate, such
as a gold film that supports a SAM. Volume overfilling is
avoided if both roots of the error functions associated with
the terminal component are located on one side of zM. Ideal
volume filling occurs if the root of the error function closest
to the substrate is located at zM.
C. Negative areas
For r1= r2, the area profile of a given component
described by Eq. (4) is negative for some values of z. For
computational purposes, however, we truncate the calcula-
tion of the area profile at distances mr on either side of the
half-maximum points of the distribution, where the constant
m controls the precision of the approximation. We show in
the Supplemental Information that the area profile remains
positive within the interval [z0 – l=2 – mr1, z0þ l=2þmr2]
if the difference between the largest and smallest r does not
exceed l=m. The maximum difference l=m between the two
r is independent of their actual values, and it is large enough
for the modeling of typical molecular architectures consid-
ered in this application to remain realistic. The relative error
between the integral of the truncated profile and the parame-
ter V in Eq. (5), i.e., the volume of the sub-molecular group,
is smaller for r1= r2 than for r1¼ r2. For m¼ 3, this rela-
tive error is below 0.3% for all l. It is thereby smaller than
the precision with which an SLD profile can be experimen-
tally determined in a typical XR or NR measurement.
III. VALIDATION OF THE CD MODEL WITH MDSIMULATIONS OF DMPC AND DOPC BILAYERS
To explore how well the error function approach
is capable of describing realistic spatial distributions of
sub-molecular components in planar molecular aggregates,
the output of atomistic MD simulations of single-component
phospholipid bilayers were modeled. Because of the small
system sizes and the imposed periodic boundary conditions,
the simulated bilayers are essentially planar. To facilitate a
comparison, area profiles were computed from number den-
sity profiles of the lipid components obtained from the simu-
lations. Individual atoms were assigned to lipid components
using established definitions,4 thus parsing the phospholipid
molecules as follows: chain-terminal methyls (m), hydrocar-
bon (hc) methylenes, carbonyl-glycerol (cg) backbone, phos-
phate (p), and choline (c). The methyl and polymethylene
groups of the two chains were assigned to one single compo-
nent each. An algorithm31 implemented in the SIMtoEXP
software32 was used to determine component area profiles
from atomistic number densities in the MD simulations. Lit-
erature values4 were used for head group component vol-
umes because the low hydration of the bilayer in the
simulations prohibited a determination directly from the MD
output. The obtained model parameters, i.e., projected com-
ponent extensions, volumes, and interfacial roughness val-
ues, were compared with average values in the simulation
thus providing a quantitative validation of the model. Fur-
thermore, this procedure let us explore how well the pro-
jected component lengths and interfacial roughness
parameters are separated in the CD model, and what is the
accuracy of the modeled component volumes.
Constraints to the model were applied as discussed in
the previous section. The values of the projected component
extensions l along z and the volumes V of the methyls and
methylenes were constrained to yield the cross-sectional area
per lipid, Alipid, according to A¼V=l. l was chosen to be a fit
parameter, thus deriving the component volumes V from the
fit since Alipid¼ 59.4 A2 for DMPC and Alipid¼ 57.1 A2 for
DOPC were globally determined from the simulations. In the
DOPC simulation, carried out at low hydration,33 Alipid is
significantly smaller than 72 A2, the value for DOPC at full
hydration. The z positions of all components were calculated
from their values of l under the constraint that the roots of
the overlapping error functions of adjacent molecular com-
ponents coincide. Similarly, the r values of the overlapping
error functions of neighboring components were constrained
to be equal. Therefore, there is effectively only one free pa-
rameter r per component. The methyl and the choline com-
ponents each have two identical r associated with their error
functions because of the lack of a second neighboring com-
ponent. All sub-molecular components were simultaneously
fitted using a global minimizer.34
Figures 4(A) and 5(A) show best-fits of the continuous
distribution model to the area profiles of sub-molecular com-
ponents in the DMPC and the DOPC simulations, with
unweighted v2 values of 0.06 A2 and 0.11 A2, respectively.
Figures 4(B) and 5(B) compare the model-derived extensions
of the molecular components along z (shades of gray) with
averaged atomic positions (abscissae in the plots) obtained
from 1000 frames of the simulations. The standard devia-
tions of these positions from the simulation and the rough-
ness parameters r are shown on the ordinate axes. Tables I
and II list the model parameters and compare them with
102216-5 Shekhar et al. J. Appl. Phys. 110, 102216 (2011)

related values from the simulation. Projected extensions in
the simulations were derived from mean atomic positions by
defining the location of the interfaces between two sub-
molecular components as the halfway points between the
mean atomic positions of the peripheral atoms. The lowest
and the highest possible values are displayed where ambigu-
ities arose because of the staggering of lipid sn-1 and sn-2
chains or due to spatial overlap of adjacent components.
Interfacial roughness parameters from simulation are
reported as the lowest and the highest standard deviation of
any atom within one r (interfacial roughness) of the interface
as found in the model fit.
The continuous distribution model with constraints is in
excellent agreement with the area profiles derived from the
simulation data. The average number of parameters per lipid
component is 3. This is comparable to established composition-
space models in neutron diffraction.22 The standard deviation
between the volume parameters V determined from the model
and from simulation is 3.43 A3, and that between the projected
component extensions l is 0.33 A. The standard deviation of the
interfacial roughness parameters r from the intervals given by
the simulation is 0.08 A. Methyl groups contribute significantly
to the observed standard deviations.
Figures 4(A) and 5(A) demonstrate visually that the
model parameterization describes the MD simulation output
realistically by accurately determining molecular component
positions and interfacial roughness parameters. Generally,
the r parameters derived from the model resemble closely
the maximum standard deviations from mean positions of
atoms in the vicinity of the interface (6 r), as observed in
FIG. 4. (Color online) Validation of the model by fitting to an NAMD simu-
lation (Ref. 51) of a DMPC bilayer (72 lipids, 6 waters=lipid; T¼ 315 K, ini-
tial configurations from Ref. 55) that used the CHARMM27 force field
(Refs. 52–54). For details, see Supplemental Information. (A) Best-fit of the
error-function based continuous distribution model with constraints (see
text) to component distributions obtained from an average of 1000 configu-
ration snapshots of the MD simulation. The overall space filling of the lipid
molecules is broken down into the area profiles of individual lipid compo-
nents, as indicated, for both the model (dashed black lines) and the simula-
tion (continuous lines). Residuals shown at the top of the panel quantify the
agreement between the model and the simulation data. (B) Comparison of
the interfacial positions of molecular components, defined in the text, and
their interfacial roughness with mean atomic positions and standard devia-
tions from the mean obtained in the simulation. Different background gray
levels indicate the projected extensions of sub-molecular lipid components.
Crosses (x) on the interfaces between two sub-molecular components indi-
cate the interfacial roughness r of adjacent error functions determined by
the fit. These parameters describe the thermally disordered distributions of
neighboring molecular components. Upright crosses (þ) provide the aver-
aged locations and standard deviations from the mean of non-hydrogen
atomic positions observed in the MD snapshot. For the methyl, carboxyl-
glycerol, phosphate and choline components, non-hydrogen atoms are
labeled. Dashed lines are guides for the eye.
FIG. 5. (Color online) Validation of the model by fitting to an NAMD
simulation of a DOPC bilayer (72 lipids, 5.4 waters=lipid, T¼ 296 K; initial
configuration from Ref. 33). Other details as given in Fig. 4 and the Supple-
mental Information. (A) Best-fit of the error-function based continuous dis-
tribution model with constraints to a simulation snapshot. (B) Comparison
of the interfacial positions of molecular components and their interfacial
roughness with mean atomic positions and standard deviations from the
mean obtained in the simulation.
102216-6 Shekhar et al. J. Appl. Phys. 110, 102216 (2011)
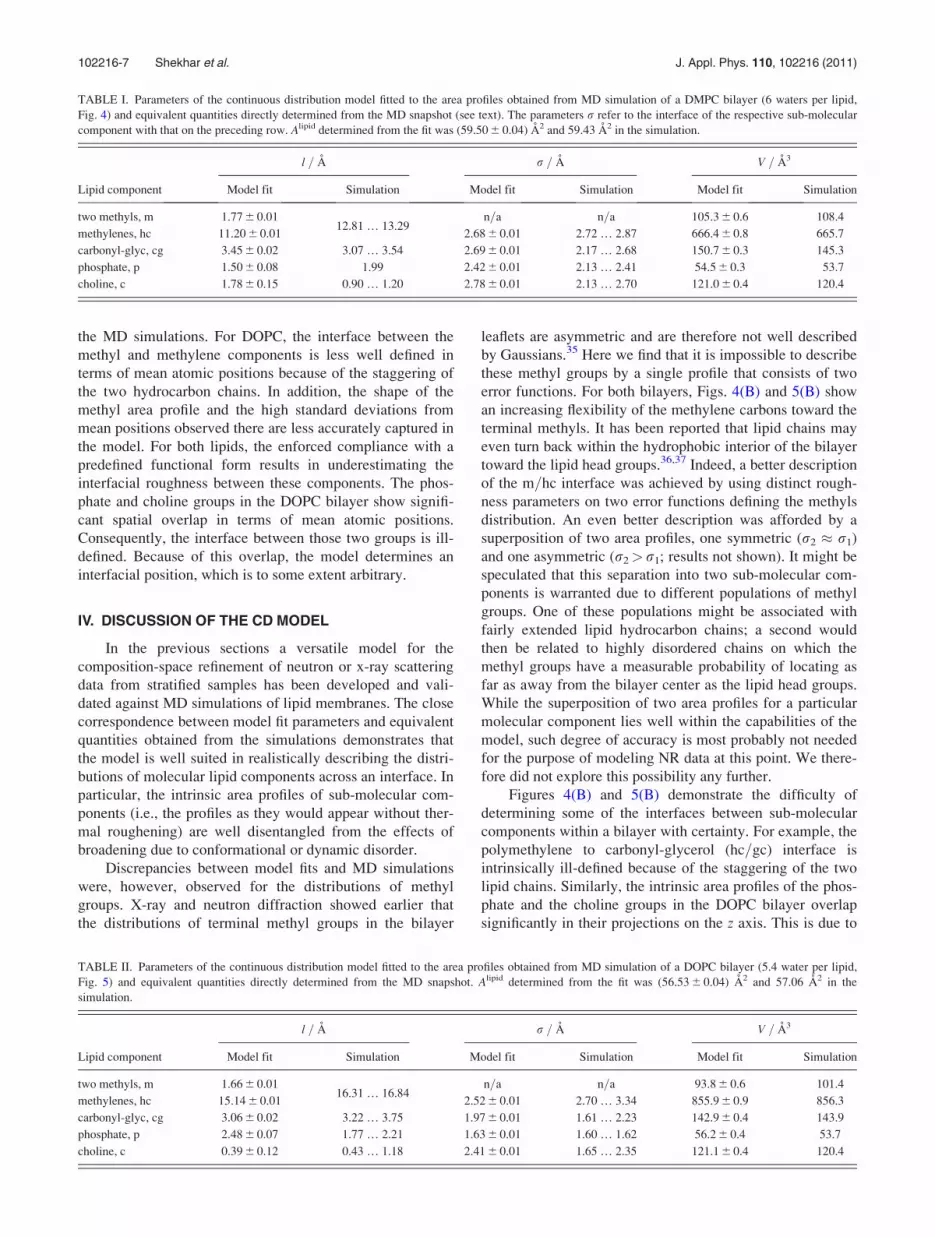
the MD simulations. For DOPC, the interface between the
methyl and methylene components is less well defined in
terms of mean atomic positions because of the staggering of
the two hydrocarbon chains. In addition, the shape of the
methyl area profile and the high standard deviations from
mean positions observed there are less accurately captured in
the model. For both lipids, the enforced compliance with a
predefined functional form results in underestimating the
interfacial roughness between these components. The phos-
phate and choline groups in the DOPC bilayer show signifi-
cant spatial overlap in terms of mean atomic positions.
Consequently, the interface between those two groups is ill-
defined. Because of this overlap, the model determines an
interfacial position, which is to some extent arbitrary.
IV. DISCUSSION OF THE CD MODEL
In the previous sections a versatile model for the
composition-space refinement of neutron or x-ray scattering
data from stratified samples has been developed and vali-
dated against MD simulations of lipid membranes. The close
correspondence between model fit parameters and equivalent
quantities obtained from the simulations demonstrates that
the model is well suited in realistically describing the distri-
butions of molecular lipid components across an interface. In
particular, the intrinsic area profiles of sub-molecular com-
ponents (i.e., the profiles as they would appear without ther-
mal roughening) are well disentangled from the effects of
broadening due to conformational or dynamic disorder.
Discrepancies between model fits and MD simulations
were, however, observed for the distributions of methyl
groups. X-ray and neutron diffraction showed earlier that
the distributions of terminal methyl groups in the bilayer
leaflets are asymmetric and are therefore not well described
by Gaussians.35 Here we find that it is impossible to describe
these methyl groups by a single profile that consists of two
error functions. For both bilayers, Figs. 4(B) and 5(B) show
an increasing flexibility of the methylene carbons toward the
terminal methyls. It has been reported that lipid chains may
even turn back within the hydrophobic interior of the bilayer
toward the lipid head groups.36,37 Indeed, a better description
of the m=hc interface was achieved by using distinct rough-
ness parameters on two error functions defining the methyls
distribution. An even better description was afforded by a
superposition of two area profiles, one symmetric (r2 � r1)
and one asymmetric (r2> r1; results not shown). It might be
speculated that this separation into two sub-molecular com-
ponents is warranted due to different populations of methyl
groups. One of these populations might be associated with
fairly extended lipid hydrocarbon chains; a second would
then be related to highly disordered chains on which the
methyl groups have a measurable probability of locating as
far as away from the bilayer center as the lipid head groups.
While the superposition of two area profiles for a particular
molecular component lies well within the capabilities of the
model, such degree of accuracy is most probably not needed
for the purpose of modeling NR data at this point. We there-
fore did not explore this possibility any further.
Figures 4(B) and 5(B) demonstrate the difficulty of
determining some of the interfaces between sub-molecular
components within a bilayer with certainty. For example, the
polymethylene to carbonyl-glycerol (hc=gc) interface is
intrinsically ill-defined because of the staggering of the two
lipid chains. Similarly, the intrinsic area profiles of the phos-
phate and the choline groups in the DOPC bilayer overlap
significantly in their projections on the z axis. This is due to
TABLE I. Parameters of the continuous distribution model fitted to the area profiles obtained from MD simulation of a DMPC bilayer (6 waters per lipid,
Fig. 4) and equivalent quantities directly determined from the MD snapshot (see text). The parameters r refer to the interface of the respective sub-molecular
component with that on the preceding row. Alipid determined from the fit was (59.50 6 0.04) A2 and 59.43 A2 in the simulation.
l = A r = A V = A3
Lipid component Model fit Simulation Model fit Simulation Model fit Simulation
two methyls, m 1.77 6 0.0112.81 … 13.29
n=a n=a 105.3 6 0.6 108.4
methylenes, hc 11.20 6 0.01 2.68 6 0.01 2.72 … 2.87 666.4 6 0.8 665.7
carbonyl-glyc, cg 3.45 6 0.02 3.07 … 3.54 2.69 6 0.01 2.17 … 2.68 150.7 6 0.3 145.3
phosphate, p 1.50 6 0.08 1.99 2.42 6 0.01 2.13 … 2.41 54.5 6 0.3 53.7
choline, c 1.78 6 0.15 0.90 … 1.20 2.78 6 0.01 2.13 … 2.70 121.0 6 0.4 120.4
TABLE II. Parameters of the continuous distribution model fitted to the area profiles obtained from MD simulation of a DOPC bilayer (5.4 water per lipid,
Fig. 5) and equivalent quantities directly determined from the MD snapshot. Alipid determined from the fit was (56.53 6 0.04) A2 and 57.06 A2 in the
simulation.
l = A r = A V = A3
Lipid component Model fit Simulation Model fit Simulation Model fit Simulation
two methyls, m 1.66 6 0.0116.31 … 16.84
n=a n=a 93.8 6 0.6 101.4
methylenes, hc 15.14 6 0.01 2.52 6 0.01 2.70 … 3.34 855.9 6 0.9 856.3
carbonyl-glyc, cg 3.06 6 0.02 3.22 … 3.75 1.97 6 0.01 1.61 … 2.23 142.9 6 0.4 143.9
phosphate, p 2.48 6 0.07 1.77 … 2.21 1.63 6 0.01 1.60 … 1.62 56.2 6 0.4 53.7
choline, c 0.39 6 0.12 0.43 … 1.18 2.41 6 0.01 1.65 … 2.35 121.1 6 0.4 120.4
102216-7 Shekhar et al. J. Appl. Phys. 110, 102216 (2011)

a significant head group tilt from the normal. The CD model
is sufficiently flexible to describe this structural feature by
introducing a parameter that quantifies this overlap. Again,
as such detail is outside the resolution of a typical NR
experiment we will not further investigate this conforma-
tional freedom of the lipid head groups here.
Superficially viewed, the close mathematical relation-
ship between error functions and boxcar functions suggests a
close relation between the conventional box model and the
model described here. However, there are significant differ-
ences: Foremost, the new model implements an intuitive
way of accounting for spatial overlap of two or more molec-
ular fragments that will frequently occur in multi-component
systems. Figure 6 (below) gives an example where the
smaller PS head group in a two-component bilayer overlaps
the location of the larger PC head group only partially. Such
situations cannot be realistically modeled within the more
limited framework of a box model.
Moreover, while the new model shares the advantage of
the box and strip-function models with their intrinsic mecha-
nism that ensures ideal volume filling, it overcomes a major
disadvantage of the smoothed strip function model by realisti-
cally taking into account thermal and conformational disorder.
This is achieved by assigning distinct interfacial roughness pa-
rameters to each interface, thus accounting for the standard
deviations in the z positions from the mean of atoms close to
the interface. In contrast to common implementations of box
models, interfacial roughness parameters can be significantly
larger than the intrinsic, unbroadened width of sub-molecular
components. This allows us to account for individual, small
sub-molecular components that might be more broadly distrib-
uted within the overall structure. Furthermore, the new model
shares the realistic parameterization of sub-molecular groups
within molecular architectures with Gauss-function based
models, but is does so without requiring additional parameters
– a significant advantage over the existing modeling techni-
ques. With approximately the same number of parameters as a
Gauss-function based model, the new approach is capable of
disentangling the width of an intrinsic (unbroadened) sub-
molecular component distribution due to thermal and confor-
mational disorder from conformal roughness. These two quan-
tities are combined in one parameter, the standard deviation r,
in the Gaussian model, and hence difficult to separate.
V. APPLICATIONS OF THE CD MODEL IN NRMEASUREMENTS (REF. 38)
Typical NR measurements reach momentum transfer val-
ues up to Qz¼ 0.3 A�1, depending on the design of the spec-
trometer and – equally important – the sample environment,
where a careful minimization of material intersecting the neu-
tron beam can help minimize incoherent scattering back-
ground. Indeed, it has been shown that minimizing both the
amount of material associated with the sample cell and the
volume of the bulk buffer adjacent to a supported lipid mem-
brane can suppress the scattering background to such low lev-
els that Qz can reach values around 0.6 A�1 in NR.39 XR
measurements typically reach even further, although without
very limited options of contrast manipulation, due to a much
higher photon density and may achieve data sets that may
approach Qz¼ 0.8 A�1 and more.13 However, even at such
high momentum transfer, the canonical spatial resolution21
given by the sampling theorem, Dz ¼ p=Qmaxz , where Qmax
z is
the maximum momentum transfer achieved in a single mea-
surement (i.e., no contrast variation),13 is rather limited. For
example, the canonical resolution is limited to> 3 A, even for
Qz¼ 1.0 A�1. It has been shown that the use of isotopically
varied isomorphous samples in neutron scattering or the
co-refinement of x-ray and neutron scattering data from identi-
cally prepared samples may increase the measurement preci-
sion significantly beyond the canonical spatial resolution, in
particular with composition-space refinement.10,11 In what fol-
lows, we demonstrate that the newly developed CD modeling
procedure leads to a significant gain in the precision of the
model parameters determined from the NR measurements of
isotopically varied samples that is due to the intrinsic use of
chemical constraints in the model parameterization.
FIG. 6. (Color online) NR at two different solvent contrasts and structural
analysis of a bilayer, deposited from floating surface monolayers with a
composition, DMPS:DMPC-d54 30:70, on a thermally oxidized Si wafer.
(A) Experimental data. Error bars represent 66% confidence intervals. Inset:
Neutron SLD determined from the fit using the molecular distribution
model. (B) Decomposition of the area profile into sub-molecular compo-
nents. The PS:PC compositions in the two bilayer leaflets is distinctly differ-
ent from that of the parent monolayer, particularly in the leaflet proximal to
the solid substrate. Note the slight displacement of the PS with respect to the
PC head groups toward the bilayer center, which illustrates the capabilities
of the new model, as such shifts of molecular fragments against each other
cannot be described within the conventional box model.
102216-8 Shekhar et al. J. Appl. Phys. 110, 102216 (2011)
A. Neutron reflection from a solid-supported lipidbilayer
A dual-component phospholipid bilayer was deposited
onto a thermally oxidized silicon wafer in two successive
Langmuir–Blodgett transfers from a 70:30 mixture of chain-
deuterated DMPC-d54 and fully hydrogenated DMPS. Its
neutron reflection under buffer (two isotopic contrasts using
buffers based on pure D2O and pure H2O, see Fig. 6(A)) was
determined on the NG1 reflectometer at the NCNR. The inset
in Fig. 6(A) shows the nSLD profiles obtained from the model
fit. Area profiles of the sub-molecular groups are shown in
Fig. 6(B). Volume that is not filled by either the substrate or
the lipid components are filled with buffer. The distinct nSL
of water molecules creates the observed difference in the
nSLD profiles [inset in Fig. 6(A)], and hence in the model
reflectivities (continuous red and black lines in Fig. 6(A)). Fit-
ted model parameters and constants used in to describe the
structure are listed in Table III.
The continuous distribution model was significantly
simplified in comparison to the possibilities discussed in the
previous sections for the evaluation of the NR data. Lipid
head groups were modeled as one component that combines
the phosphate and carbonyl-glycerol groups with the choline
or serine, respectively. The projected length of the head
groups were assumed to be 9.0 A for phosphocholine (PC)
(Ref. 4) and 6.5 A for phosphoserine (PS).40 The methyl
groups were modeled separately from the polymethylene
chains in order to account for their relatively large effective
volume and its impact on the SLD profile. However, the
methyl groups did not require any free fit parameter because
their cross-sectional area is identical to that of the two poly-
methylene chains. Volumes of sub-molecular components
were used as constants fixed to literature values.4,40
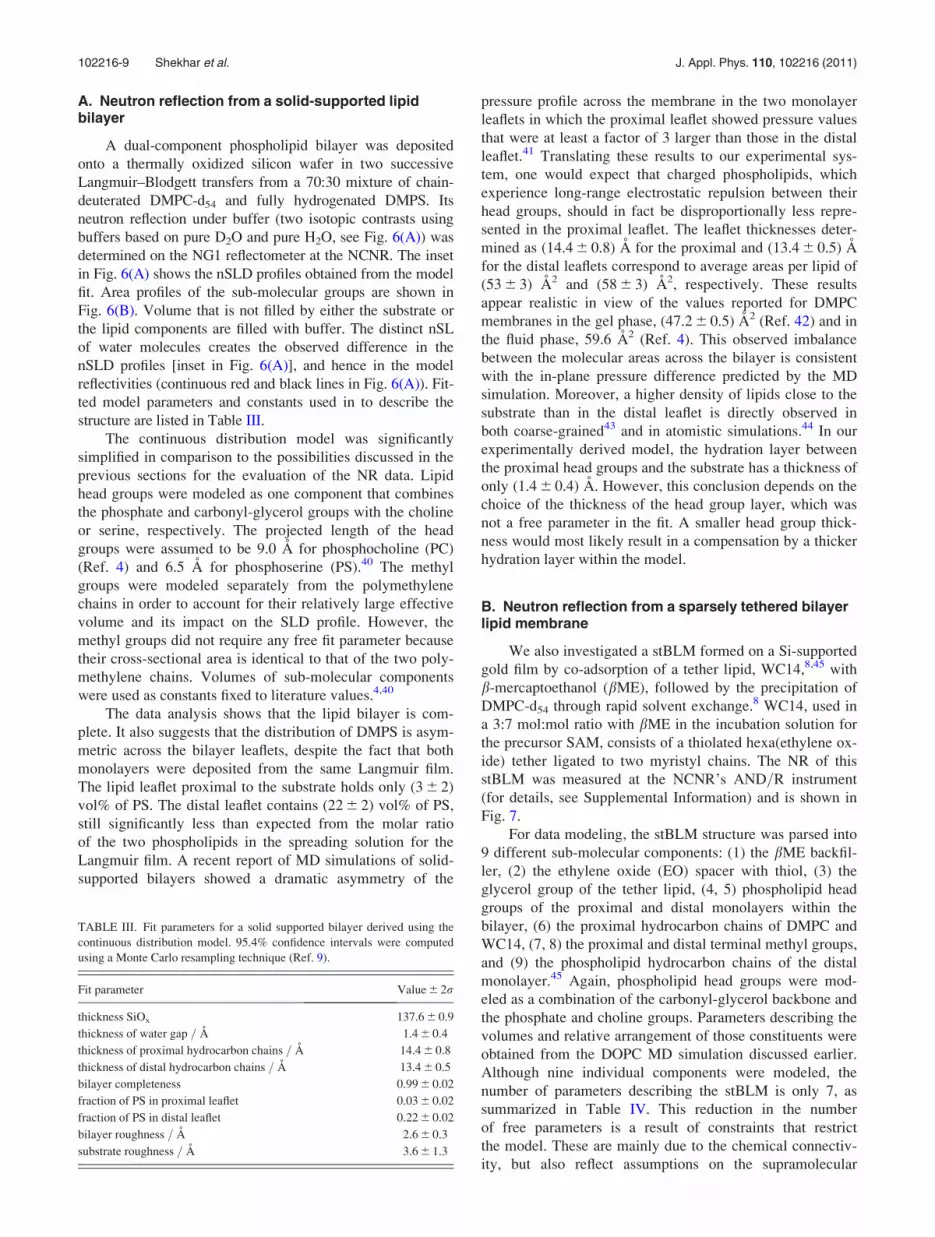
The data analysis shows that the lipid bilayer is com-
plete. It also suggests that the distribution of DMPS is asym-
metric across the bilayer leaflets, despite the fact that both
monolayers were deposited from the same Langmuir film.
The lipid leaflet proximal to the substrate holds only (3 6 2)
vol% of PS. The distal leaflet contains (22 6 2) vol% of PS,
still significantly less than expected from the molar ratio
of the two phospholipids in the spreading solution for the
Langmuir film. A recent report of MD simulations of solid-
supported bilayers showed a dramatic asymmetry of the
pressure profile across the membrane in the two monolayer
leaflets in which the proximal leaflet showed pressure values
that were at least a factor of 3 larger than those in the distal
leaflet.41 Translating these results to our experimental sys-
tem, one would expect that charged phospholipids, which
experience long-range electrostatic repulsion between their
head groups, should in fact be disproportionally less repre-
sented in the proximal leaflet. The leaflet thicknesses deter-
mined as (14.4 6 0.8) A for the proximal and (13.4 6 0.5) A
for the distal leaflets correspond to average areas per lipid of
(53 6 3) A2 and (58 6 3) A2, respectively. These results
appear realistic in view of the values reported for DMPC
membranes in the gel phase, (47.2 6 0.5) A2 (Ref. 42) and in
the fluid phase, 59.6 A2 (Ref. 4). This observed imbalance
between the molecular areas across the bilayer is consistent
with the in-plane pressure difference predicted by the MD
simulation. Moreover, a higher density of lipids close to the
substrate than in the distal leaflet is directly observed in
both coarse-grained43 and in atomistic simulations.44 In our
experimentally derived model, the hydration layer between
the proximal head groups and the substrate has a thickness of
only (1.4 6 0.4) A. However, this conclusion depends on the
choice of the thickness of the head group layer, which was
not a free parameter in the fit. A smaller head group thick-
ness would most likely result in a compensation by a thicker
hydration layer within the model.
B. Neutron reflection from a sparsely tethered bilayerlipid membrane
We also investigated a stBLM formed on a Si-supported
gold film by co-adsorption of a tether lipid, WC14,8,45 with
b-mercaptoethanol (bME), followed by the precipitation of
DMPC-d54 through rapid solvent exchange.8 WC14, used in
a 3:7 mol:mol ratio with bME in the incubation solution for
the precursor SAM, consists of a thiolated hexa(ethylene ox-
ide) tether ligated to two myristyl chains. The NR of this
stBLM was measured at the NCNR’s AND=R instrument
(for details, see Supplemental Information) and is shown in
Fig. 7.
For data modeling, the stBLM structure was parsed into
9 different sub-molecular components: (1) the bME backfil-
ler, (2) the ethylene oxide (EO) spacer with thiol, (3) the
glycerol group of the tether lipid, (4, 5) phospholipid head
groups of the proximal and distal monolayers within the
bilayer, (6) the proximal hydrocarbon chains of DMPC and
WC14, (7, 8) the proximal and distal terminal methyl groups,
and (9) the phospholipid hydrocarbon chains of the distal
monolayer.45 Again, phospholipid head groups were mod-
eled as a combination of the carbonyl-glycerol backbone and
the phosphate and choline groups. Parameters describing the
volumes and relative arrangement of those constituents were
obtained from the DOPC MD simulation discussed earlier.
Although nine individual components were modeled, the
number of parameters describing the stBLM is only 7, as
summarized in Table IV. This reduction in the number
of free parameters is a result of constraints that restrict
the model. These are mainly due to the chemical connectiv-
ity, but also reflect assumptions on the supramolecular
TABLE III. Fit parameters for a solid supported bilayer derived using the
continuous distribution model. 95.4% confidence intervals were computed
using a Monte Carlo resampling technique (Ref. 9).
Fit parameter Value 6 2r
thickness SiOx 137.6 6 0.9
thickness of water gap = A 1.4 6 0.4
thickness of proximal hydrocarbon chains = A 14.4 6 0.8
thickness of distal hydrocarbon chains = A 13.4 6 0.5
bilayer completeness 0.99 6 0.02
fraction of PS in proximal leaflet 0.03 6 0.02
fraction of PS in distal leaflet 0.22 6 0.02
bilayer roughness = A 2.6 6 0.3
substrate roughness = A 3.6 6 1.3
102216-9 Shekhar et al. J. Appl. Phys. 110, 102216 (2011)

organization of the interface structure. For example, it is
assumed that the distal monolayer of the stBLM consists
entirely of phospholipid molecules. For a more detailed
description of the model implementation for the stBLM, see
the Supplemental Information.
The sub-membrane space contains the surface-ligated
bME, (EO)6 plus thiol and the tether glycerol. Phospholipid
head groups protrude into this space. Its thickness is
d¼ (17.6 6 0.4) A, consistent with the thickness of the sub-
membrane space for the same system as determined earlier
with a box model approach, d¼ (16.7 6 1.0) A.8
The hydrocarbon thickness within the bilayer is
d¼ (28.4 6 0.5) A, as seen by the new model, which is about
4 A thinner than reported from box model fits,
d¼ (32.6 6 4.0) A.8 This discrepancy may be due to differ-
ences in modeling lipid head groups next to the substrate.
The continuous distribution model of the head groups from
the MD simulation yields a projected length of the lipid head
groups of about 9 A, used as a constant to describe the NR
data, a value that may slightly overestimate the actual head
group size. In contrast, the box model of stBLMs used earlier
assumed d¼ 7 A for the distal phospholipid head groups and
did not explicitly account for the head groups near the sub-
strate at all.
In the error-function based continuous distribution mod-
eling, the inner bilayer leaflet, composed of 63% tether
chains and 37% DMPC chains, is characterized by a high av-
erage leaflet thicknesses of (17.6 6 0.4) A, comparable to the
extended length of a myristyl group (17.9 A). The cross-
sectional area in this monolayer amounts to � 19 A2 per
chain, which would constitute an extremely small value for
phospholipids.46 However, the WC14 tether has its hydrocar-
bon chains attached by an ether linkage that lacks the car-
boxyl oxygens at the C1 carbon and is therefore structurally
related to diether lipids. A structural study of a comparable
diether lipid, 1,2-dihexadecyl-sn-glycero-3-phosphocholine
(DHPC),47,48 determined a hydrocarbon thickness of 20.3 A
for the interdigitated, non-tilted, gel phase and an area per
lipid molecule of 38.6 A2. The tilted gel phase of DHCP has
a hydrocarbon thickness of 17.3 A and an area per lipid mol-
ecule of 46.9 A2. This comparison suggests that the hydro-
carbon chains of WC14 may form a tilted gel phase at high
tether surface densities. Properties of the possibly phase-
separated DMPC minority component cannot be discerned.
The surface density of WC14 can be calculated from the
model parameters and is (1.4 6 0.1) molecules=100 A2.
There are (1.6 6 0.8) bME molecules per tether on the sur-
face. The large uncertainty of this fitting parameter shows
the insensitivity of the model to the backfiller:tether ratio.
The SAM was prepared from a 70:30 bME:WC14 solution.
The value of bME:WC14¼ 1.6 corresponds to a 62:38 ratio
of backfiller and tether and therefore appears to be a reasona-
ble estimate of the actual surface composition.
VI. CONCLUSIONS
A new continuous distribution modeling strategy based
on a flexible error-function description of molecular distri-
butions within layered interface architectures has been
FIG. 7. (Color online) NR at three different solvent contrasts and structural
analysis of a stBLM based upon WC14:bME 3:7 completed with DMPC-d54
(Ref. 8; details, see Supplemental Information). (A) Experimental data.
Error bars represent 66% confidence intervals. Inset: Neutron SLD deter-
mined from the fit using the molecular distribution model. (B) Decomposi-
tion of the area profile into sub-molecular components. Note the high
density of hydrocarbons in the proximal bilayer leaflet compared to the dis-
tal leaflet which comes about by the large content (� 63%) of myristyl
chains associated with WC14 that pack more densely than the myristoyl
chains of DMPC. The decomposition of the sub-membrane space between
the bilayer and the substrate into its components, bME, oligo(ethyleneoxide)
of the WC14 and water, is a unique capability of the new model and has not
been possible within the limitations of conventional box models. This
allows, for the first time, quantitative estimates of the area density ratio
between bME and WC14 at the interface and of WC14 and free DMPC in
the proximal bilayer leaflet within the self-organized tBLM structure.
TABLE IV. Fit parameters for the sparsely tethered lipid bilayer membrane
derived using the continuous distribution model. 95.4% confidence intervals
were computed using a Monte Carlo resampling technique (Ref. 9).
Fit parameter Value 6 2r
thickness of gold film = A 144.9 6 0.7
thickness of spacer= sub-membrane space = A 17.6 6 0.4
thickness of proximal hydrocarbon chains = A 17.5 6 0.5
thickness of distal hydrocarbon chains = A 10.9 6 0.3
bilayer completeness 1.00 6 0.02
molar fraction of DMPC in proximal leaflet 0.37 6 0.01
molar fraction of DMPC in distal leaflet 1.00 (fixed)
number of bME per WC14 1.6 6 0.8
bilayer roughness = A 4.0 6 0.1
substrate roughness = A 4.5 6 1.2
102216-10 Shekhar et al. J. Appl. Phys. 110, 102216 (2011)

presented. While rooted in earlier work, this approach over-
comes limitations of established models in the description of
membrane structures and, most significantly, is particularly
economical in the use of independent model parameters.
Chemical constraints, e.g., in the form of the connectivity
between components within a molecule can be naturally
implemented by controlling the relative positions of the con-
stituent error functions that form the overall area profiles. It
has been previously shown9,21 that such approaches may sig-
nificantly increase the precision by which structural parame-
ters can be determined from scattering experiments, in
particular if isotopic contrast variation is used in neutron
experiments. However, the described approach lends itself
equally well to the evaluation of x-ray scattering data or to
the joint refinement of x-ray and neutron experiments on
similarly prepared samples.10,11
Using this new data modeling technique, we demon-
strated the refinement of NR data sets for solid-supported
bilayers. While both compositionally simple lipid mem-
branes could be examined with the conventional box model,
the novel approach unveiled properties of interest that bear
physical meaning which would otherwise not have been
directly accessible. Previously, the compositions of the prox-
imal bilayer leaflets in terms of tether lipid and phospholi-
pids and of the thiolated compounds, tether lipid and
backfiller, on the surface of the gold films in stBLMs could
not be determined. The new approach yields precise and
physically reasonable estimates of these quantities from NR
data. We also demonstrated that areas per molecule, molecu-
lar composition of the lipid leaflets, and thickness of the
sub-membrane space can be determined with high precision.
The versatility of the model developed here will in
future be exploited in investigations of complex biological
architectures such as tethered lipid bilayer membrane sys-
tems interacting with peptides or proteins.27,49,50 The robust
framework with which we implemented the constraints
between sub-molecular groups of complex molecular archi-
tectures makes such investigations feasible. In particular, it
will also be possible to define hybrid models that combine
the layered surface architecture described here with atomic-
scale models for proteins derived from x-ray crystallography
or NMR.
The algorithms described here have been implemented
into publicly accessible modeling software, the NCNR’s
ga_refl reflectometry data evaluation suite.14
ACKNOWLEDGMENTS
We thank Dr. Norbert Kucerka, Dr. Charles F. Majkr-
zak, Dr. John F. Nagle, and Dr. David Worcester for fruitful
discussions, and Dr. Joseph Dura for the preparation of the
thermally oxidized silicon wafer. We acknowledge Dr. Paul
Kienzle for expert help regarding the data analysis software
and Dr. Peter Yaron and Dr. Duncan McGillivray for crit-
ically reading the manuscript. This work was supported by
the U.S. Department of Commerce through the MSE pro-
gram under Grant No. 70NANB8H8009 and by the NIH
(1P01 AG032131). This research was partially performed at
the NIST Center for Nanoscale Science and Technology.
1M. C. Wiener and S. H. White, Biophys. J. 61, 434 (1992).2T. J. McIntosh, Biophys. J. 29, 237 (1980).3M. Gandhavadi, D. Allende, A. Vidal, S. A. Simon, and T. J. McIntosh,
Biophys. J. 82, 1469 (2002).4J. F. Nagle and S. Tristram-Nagle, Biochim. Biophys. Acta 1469, 159
(2000).5D. Krepkiy, M. Mihailescu, J. A. Freites, E. V. Schow, D. L. Worcester,
K. Gawrisch, D. J. Tobias, S. H. White, and K. J. Swartz, Nature 462, 473
(2009).6T. T. Mills, J. Huang, G. W. Feigenson, and J. F. Nagle, Gen. Physiol. Bio-
phys. 28, 126 (2009).7J. A. Dura, D. Pierce, C. F. Majkrzak, N. Maliszewskyj, D. J. McGillivray,
M. Losche, K. V. O’Donovan, M. Mihailescu, U. A. Perez-Salas, D. L.
Worcester, and S. H. White, Rev. Sci. Instrum. 77, 074301 (2006).8D. J. McGillivray, G. Valincius, D. J. Vanderah, W. Febo-Ayala, J. T.
Woodward, F. Heinrich, J. J. Kasianowicz, and M. Losche, BioInterphases
2, 21 (2007).9F. Heinrich, T. Ng, D. J. Vanderah, P. Shekhar, M. Mihailescu, H. Nanda,
and M. Losche, Langmuir 25, 4219 (2009).10M. C. Wiener and S. H. White, Biophys. J. 59, 174 (1991).11D. Vaknin, K. Kjaer, J. Als-Nielsen, and M. Losche, Biophys. J. 59, 1325
(1991).12M. Schalke, P. Kruger, M. Weygand, and M. Losche, Biochim. Biophys.
Acta 1464, 113 (2000).13M. Schalke and M. Losche, Adv. Colloid Interface Sci. 88, 243 (2000).14P. A. Kienzle, M. Doucet, D. J. McGillivray, K. V. O’Donovan, N. F.
Berk, and C. F. Majkrzak, see http://www.ncnr.nist.gov/reflpak/garefl.html
for information about ga_refl (2000–2010).15C. F. Majkrzak and N. F. Berk, Physica B 336, 27 (2003).16J. K. Blasie, S. Zhang, and J. Strzalka, Phys. Rev. B 67, 224201
(2003).17Abbreviations: DMPC, 1,2-dimyristoyl-sn-glycero-3-phosphatidylcho-
line; DMPC-d54, 1,2-perdeuterodimyristoyl-sn-glycero-3-phosphatidyl-
choline; DMPS, 1,2-dimyristoyl-sn-glycero-3-phosphatidylserine;
DMPS-d54, 1,2-perdeuterodimyristoyl-sn-glycero-3-phosphatidyl-serine;
DOPC, 1,2-dioleoyl-sn-glycero-3-phosphatidylcholine; POPC-d31, 1-per-
deutero-palmitoyl-2-oleoyl-sn-glycero-3-phosphatidylcholine; DHPC, 1,2-
dihexadecyl-sn-glycero-3-phosphatidylcholine; WC14, 20-tetradecyloxy-
3,6,9,12,15,18,22-heptaoxahexatricontane1-thiol; bME, b-mercaptoethanol.18G. I. King and S. H. White, Biophys. J. 49, 1047 (1986).19N. P. Franks, V. Melchior, D. A. Kirschner, and D. L. D. Caspar, J. Mol.
Biol. 155, 133 (1982).20T. Mitsui, Adv. Biophys. 10, 97 (1978).21M. C. Wiener and S. H. White, Biophys. J. 59, 162 (1991).22N. Kucerka, J. F. Nagle, J. N. Sachs, S. E. Feller, J. Pencer, A. Jackson,
and J. Katsaras, Biophys. J. 95, 2356 (2008).23D. L. Worcester and N. P. Franks, J. Mol. Biol. 100, 359 (1976).24B. E. Warren, X-ray Diffraction (Dover Publications, Mineola, 1990).25H. P. Wacklin and R. K. Thomas, Langmuir 23, 7644 (2007).26M. S. Kent, H. Yim, J. K. Murton, S. Satija, J. Majewski, and I. Kuz-
menko, Biophys. J. 94, 2115 (2008).27D. J. McGillivray, G. Valincius, F. Heinrich, J. W. F. Robertson, D. J.
Vanderah, W. Febo-Ayala, I. Ignatjev, M. Losche, and J. J. Kasianowicz,
Biophys. J. 96, 1547 (2009).28A conformal roughness between adjacent slabs is usually implemented in
box models to account for substrate non-idealities, such as surface rough-
ness of a solid support. This leads to a Debye-Waller-like damping of the
reflectivity at large momentum transfers. In real-space, the step function
between the SLDs of adjacent slabs is thus replaced by an error function.
Although related, this erf-broadening of SLDs in the box model should not
be confused with the erf-functional form used in the model described here
which account for the thermal broadening of molecular distributions.29H.-H. Shen, R. K. Thomas, C.-Y. Chen, R. C. Darton, S. C. Baker, and
J. Penfold, Langmuir 25, 4211 (2009).30C. F. Majkrzak, N. Berk, S. Krueger, J. Dura, M. Tarek, D. Tobias,
V. Silin, C. Meuse, J. Woodward, and A. Plant, Biophys. J. 79, 3330
(2000).31H. I. Petrache, S. E. Feller, and J. F. Nagle, Biophys. J. 70, 2237 (1997).32N. Kucerka, J. Katsaras, and J. F. Nagle, J. Membr. Biol. 235, 43 (2010).33R. W. Benz, H. Nanda, F. Castro-Roman, S. H. White, and D. J. Tobias,
Biophys. J. 91, 3617 (2006).34See http://www.wavemetrics.com for information about Igor Pro (2008),
version 6.03.35M. C. Wiener and S. H. White, Biophys. J. 61, 428 (1992).
102216-11 Shekhar et al. J. Appl. Phys. 110, 102216 (2011)

36D. Huster, K. Arnold, and K. Gawrisch, J. Phys. Chem. B 103, 243
(1999).37D. Huster and K. Gawrisch, J. Am. Chem. Soc. 121, 1992 (1999).38Certain commercial materials, equipment, and instruments are identified in
this manuscript in order to specify the experimental procedure as com-
pletely as possible. In no case does such identification imply a recommen-
dation or endorsement by the National Institute of Standards and
Technology, nor does it imply that the materials, equipment, or instru-
ments identified are necessarily the best available for the purpose.39S. Krueger, J. F. Ankner, S. K. Satija, C. F. Majkrzak, D. Gurley, and
M. Colombini, Langmuir 11, 3218 (1995).40H. I. Petrache, S. Tristram-Nagle, K. Gawrisch, D. Harries, V. A. Parse-
gian, and J. F. Nagle, Biophys. J. 86, 1574 (2004).41C. Xing, O. H. S. Ollila, I. Vattulainen, and R. Faller, Soft Matter 5, 3258
(2009).42S. Tristram-Nagle, Y. Liu, J. Legleiter, and J. F. Nagle, Biophys. J. 83,
3324 (2002).43M. I. Hoopes, M. Deserno, M. L. Longo, and R. Faller, J. Chem. Phys.
129, 175102 (2008).44C. Xing and R. Faller, J. Chem. Phys. 131, 175104 (2009).45See the Supplemental Material at http://dx.doi.org/10.1063/1.3661986
for Fig. S4 for the structure of the WC14 compound and its parsing into
sub-molecular components in the model; for Supplemental Notes on ModelApplication.
46J. Petrov, T. Pfohl, and H. Mohwald, J. Phys. Chem. B 103, 3417 (1999).47S. D. Guler, D. D. Ghosh, J. Pan, J. C. Mathai, M. L. Zeidel, J. F. Nagle,
and S. Tristram-Nagle, Chem. Phys. Lipids 160, 33 (2009).48The parsing of the DHPC includes only 15 of the 16 carbon atoms in the
hydrocarbon chain. This makes the comparison between the results for
DHCP and WC14 in this work exact up to one carbon atom.49G. Valincius, F. Heinrich, R. Budvytyte, D. J. Vanderah, D. J. McGilliv-
ray, Y. Sokolov, J. E. Hall, and M. Losche, Biophys. J. 95, 4845 (2008).50H. Nanda, S. A. K. Datta, F. Heinrich, M. Losche, A. Rein, S. Krueger,
and J. E. Curtis, Biophys. J. 99, 2516 (2010).51H. Nanda, J. N. Sachs, H. I. Petrache, and T. B. Woolf, J. Chem. Theory
Comput. 1, 375 (2005).52L. Kale, R. Skeel, M. Bhandarkar, R. Brunner, A. Gursoy, N. Krawetz,
J. Phillips, A. Shinozaki, K. Varadarajan, and K. Schulten, J. Comput.
Phys. 151, 283 (1999).53S. E. Feller and A. D. MacKerell, J. Phys. Chem. B 104, 7510 (2000).54M. Schlenkrich, J. Brickmann, J. A. D. MacKerell, and M. Karplus, in Bio-
logical Membranes, edited by J. K. M. Merz and B. Roux (Birkhauser,
Boston, 1996), p. 31.55S. E. Feller, R. M. Venable, and R. W. Pastor, Langmuir 13, 6555 (1997).
102216-12 Shekhar et al. J. Appl. Phys. 110, 102216 (2011)