contextualized recommendations for the socio-semantic web
TRANSCRIPT
Contextualized Recommendations for theSocio-Semantic Web
Vom Fachbereich Informatik der
Technischen Universität Kaiserslautern
zur Verleihung des akademischen Grades
Doktor der Ingenieurwissenschaften (Dr.-Ing.)
genehmigte Dissertation
von
Dipl.-Inf. Rafael Schirru
aus
Lahnstein
Erstgutachter: Prof. Dr. Prof. h.c. Andreas Dengel
Zweitgutachter: Prof. Dr. Sandra Zilles
Vorsitzender: Prof. Dr. Paul Lukowicz
Dekan: Prof. Dr. Arnd Poetzsch-Heffter
Tag der mündlichen Prüfung: 2013/05/08
Zeichen der TU Kaiserslautern im Bibliotheksverkehr: D 386

ii
Selbstständigkeitserklärung
Hiermit erkläre ich, dass ich die vorliegende Arbeit mit dem Titel
Contextualized Recommendations for the Socio-Semantic Web
selbstständig verfasst und keine anderen als die angegebenen Quellen und Hilfsmit-tel benutzt habe. Die Arbeit wurde in dieser oder ähnlicher Form noch in keinemanderen Prüfungsverfahren eingereicht.
Berlin, den 10.05.2013
Rafael Schirru

AbstractIn recent years, recommender systems have been widely used for a variety of
different kinds of items such as books, movies, and music. However, current recom-mendation approaches have often been criticized to suffer from overspecializationthus not enough considering a user’s diverse topics of interest. In this thesis wepresent a novel approach to extracting contextualized user profiles which enablerecommendations taking into account a user’s full range of interests. The methodapplies algorithms from the domain of topic detection and tracking to automati-cally identify diverse user interests and to represent them with descriptive labels.That way manual annotations of interest topics by the users, e. g., from a prede-fined domain taxonomy, are no longer required. The approach has been tested intwo scenarios: First, we implemented a content-based recommender system for anEnterprise 2.0 resource sharing platform where the contextualized user interest pro-files have been used to generate recommendations with a high degree of inter-topicdiversity. In an effort to harness the collective intelligence of the users, the resourcesin the system were described by making use of user-generated metadata. The evalu-ation experiments show that our approach is likely to capture a multitude of diverseinterest topics per user. The labels extracted are specific for these topics and can beused to retrieve relevant on-topic resources. Second, a slightly adapted variation ofthe algorithm has been used to target music recommendations based on the user’scurrent mood. In this scenario music artists are described by using freely availableSemantic Web data from the Linked Open Data cloud thus not requiring expensivemetadata annotations by experts. The evaluation experiments conducted show thatmany users have a multitude of different preferred music styles. However a correla-tion between these music styles and music mood categories could not be observed.An integration of our proposed user profiles with existing user model ontologiesseems promising for enabling context-sensitive recommendations.
Recommender Systems, Socio-Semantic Web, Topic-based Resource Recommen-dations, Mood-based Music Recommendations

ZusammenfassungIn den letzten Jahren fanden Empfehlungssysteme für eine Vielzahl unterschied-
licher Objekte wie Bücher, Filme und Musik, weite Verbreitung. Aktuelle Ansätzewerden dabei häufig kritisiert an dem Problem der Überspezialisierung zu leidenund somit die diversen Interessensgebiete eines Benutzers nicht hinreichend einzu-beziehen. In dieser Arbeit stellen wir einen neuen Ansatz zur Extraktion kontex-tualisierter Benutzerprofile vor. Diese Profile ermöglichen Empfehlungen, welche dieunterschiedlichen Interessen eines Benutzers berücksichtigen. Die Methode wendetAlgorithmen aus der Domäne der Themenextraktion und -verfolgung an, um diver-se Benutzerinteressen automatisch zu erkennen und repräsentiert diese mit einembeschreibenden Label. Auf diese Weise werden keine händischen Annotation vonInteressensgebieten, z.B. aus einer vorgegebenen Domänen-Taxonomie, durch dieBenutzer mehr benötigt. Der Ansatz wurde in zwei Szenarien getestet: Zunächsthaben wir ein inhaltsbasiertes Empfehlungssystem für eine Enterprise-2.0-Resource-Sharing-Plattform implementiert, in dem die kontextualisierten Benutzerprofile ver-wendet wurden, um Empfehlungen mit einem hohen Grad an Themen-Diversität zugenerieren. Zur Beschreibung der Inhalte im System sollte die kollektive Intelligenzder Benutzer genutzt werden, indem die Ressourcen durch Benutzer-generierte Me-tadaten beschrieben wurden. Die durchgeführte Evaluation hat gezeigt, dass unserAnsatz eine Vielzahl unterschiedlicher Benutzerinteressen erkennen kann. Die ex-trahierten Labels sind spezifisch für die erkannten Themen und können verwendetwerden, um thematisch passende Ressourcen zu finden. Als Zweites wurde eine leichtveränderte Variante des Algorithmus getestet, um Musikempfehlungen zu generie-ren, die die aktuelle Stimmung des Benutzers berücksichtigen. In diesem Szenariowurden Künstler mittels frei verfügbarer semantischer Daten aus der Linked OpenData Cloud beschrieben, so dass teure Metadaten-Annotationen durch Expertennicht mehr benötigt werden. Die Evaluationsexperimente haben gezeigt, dass vie-le Benutzer unterschiedliche Musikrichtungen hören, jedoch konnte eine Korrelati-on zwischen diesen Musikrichtungen und bestimmten Stimmungen nicht beobach-tet werden. Eine Integration der von uns vorgeschlagenen Benutzerprofile mit exis-tierenden Benutzermodell-Ontologien scheint vielversprechend, um kontextsensitiveEmpfehlungen zu ermöglichen.
Empfehlungssysteme, Socio-Semantic Web, themenbasierte Empfehlungen vonRessourcen, stimmungsbasierte Musikempfehlungen

Acknowledgments
This thesis would not have been possible without the help of many different people.I want to thank Stephan Baumann for his inexhaustible support during the pastyears, for all the controversial and fruitful discussions as well as proof-reading of thethesis. Further, I’d like to thank Professor Sandra Zilles for proof-reading, helpfulsuggestions and guidance. Special thanks belong to Professor Andreas Dengel for hisfeedback on my work and for providing me with an environment that made this thesispossible. Further I want to thank my colleagues Tatjana Scheffler, Michael Sintek,and Thomas Roth-Berghofer for guiding me with my first scientific publications.I also want to thank the professors and attendees of the doctoral symposium atthe RecSys 2010 conference for their critical questions and their encouragement tocontinue my work on diversification in recommender systems. My sincere thanks goto my student workers Bernhard Streit for his work on artist similarities based onmetadata from the Semantic Web and to Christian Freye for his work on the context-based identification of music preferences. Special thanks belong to my family fortheir support during the years and to my friends Karsten Adler, Peter Kretzschmar,Bernhard Streit, Inessa Seifert, and Kinga Schumacher for believing in me.
This research has been financed to a large extend by the IBB Berlin in the project“Social Media Miner”, and co-financed by the EFRE fonds of the European Union.
ix

x
Contents
I Foundations 1
1 Introduction 3
1.1 Topic-based Resource Recommendations . . . . . . . . . . . . . . . . 4
1.2 Mood-based Music Recommendations . . . . . . . . . . . . . . . . . . 5
1.3 Research Hypotheses . . . . . . . . . . . . . . . . . . . . . . . . . . . 6
1.4 Outline . . . . . . . . . . . . . . . . . . . . . . . . . . . . . . . . . . . 7
2 State of the Art in Recommender Systems 11
2.1 Content-Based Approach . . . . . . . . . . . . . . . . . . . . . . . . . 12
2.2 Collaborative Filtering . . . . . . . . . . . . . . . . . . . . . . . . . . 13
2.2.1 User-Based Collaborative Filtering . . . . . . . . . . . . . . . 14
2.2.2 Item-Based Collaborative Filtering . . . . . . . . . . . . . . . 15
2.2.3 The Netflix Competition . . . . . . . . . . . . . . . . . . . . . 16
2.3 Discussion . . . . . . . . . . . . . . . . . . . . . . . . . . . . . . . . . 17
2.4 Model-based Approaches . . . . . . . . . . . . . . . . . . . . . . . . . 18
2.5 Further Approaches . . . . . . . . . . . . . . . . . . . . . . . . . . . . 19
2.6 Hybrid Systems . . . . . . . . . . . . . . . . . . . . . . . . . . . . . . 20
2.7 Beyond the State of the Art . . . . . . . . . . . . . . . . . . . . . . . 22
3 The Web 3.0 25
3.1 The Web 2.0 . . . . . . . . . . . . . . . . . . . . . . . . . . . . . . . . 26
3.1.1 Collaborative Tagging Systems . . . . . . . . . . . . . . . . . 29
3.1.2 The Enterprise 2.0 . . . . . . . . . . . . . . . . . . . . . . . . 34
3.2 The Semantic Web . . . . . . . . . . . . . . . . . . . . . . . . . . . . 35
3.3 The Social Semantic Web . . . . . . . . . . . . . . . . . . . . . . . . 38
xi
4 Background - The ALOE System 41
4.1 Basic Functionalities . . . . . . . . . . . . . . . . . . . . . . . . . . . 41
4.2 System Design Options . . . . . . . . . . . . . . . . . . . . . . . . . . 42
4.3 Resource Metadata . . . . . . . . . . . . . . . . . . . . . . . . . . . . 43
4.4 The C-LINK System . . . . . . . . . . . . . . . . . . . . . . . . . . . 44
4.4.1 Recommendations in C-LINK . . . . . . . . . . . . . . . . . . 46
4.4.2 Review of the C-LINK Approach . . . . . . . . . . . . . . . . 48
II Approach 51
5 Topic-based Recommendations 53
5.1 Eliciting Preferences for Items . . . . . . . . . . . . . . . . . . . . . . 54
5.2 Modeling Contextualized User Profiles . . . . . . . . . . . . . . . . . 54
5.3 Providing Recommendations . . . . . . . . . . . . . . . . . . . . . . . 56
5.3.1 Offline Analysis . . . . . . . . . . . . . . . . . . . . . . . . . . 56
5.3.2 Online Recommendation Generation . . . . . . . . . . . . . . 60
5.4 Background on Topic Extraction Algorithms . . . . . . . . . . . . . . 62
6 Mood-based Music Recommendations 65
6.1 Representations of Mood in Music . . . . . . . . . . . . . . . . . . . . 66
6.2 Approach . . . . . . . . . . . . . . . . . . . . . . . . . . . . . . . . . 68
6.2.1 Data Sources . . . . . . . . . . . . . . . . . . . . . . . . . . . 69
6.2.2 Algorithm . . . . . . . . . . . . . . . . . . . . . . . . . . . . . 71
6.3 Providing Recommendations . . . . . . . . . . . . . . . . . . . . . . . 73
6.4 Background on Semantics-based Recommender Systems . . . . . . . . 74
7 Evaluation 79
7.1 Evaluation Based on User Goals . . . . . . . . . . . . . . . . . . . . . 80
7.2 Evaluation of Our Research Hypotheses . . . . . . . . . . . . . . . . . 83
7.3 Evaluation of Topic-based Recommendations . . . . . . . . . . . . . . 84
7.3.1 Subjective Evaluation Study . . . . . . . . . . . . . . . . . . . 85
7.3.2 Objective Evaluation Study . . . . . . . . . . . . . . . . . . . 86
7.4 Evaluation of Mood-based Recommendations . . . . . . . . . . . . . . 95
7.4.1 Data Set . . . . . . . . . . . . . . . . . . . . . . . . . . . . . . 95
7.4.2 Results: Identification of Preferred Music Styles . . . . . . . . 98
xii
7.4.3 Results: Mood Support in Clusters . . . . . . . . . . . . . . . 1027.4.4 Discussion . . . . . . . . . . . . . . . . . . . . . . . . . . . . . 103
8 Related Work 107
8.1 Topic-based Resource Recommendations . . . . . . . . . . . . . . . . 1078.2 Mood-based Music Recommendations . . . . . . . . . . . . . . . . . . 111
III Conclusion 115
9 Summary 117
9.1 Discussion of Research Hypotheses . . . . . . . . . . . . . . . . . . . 1179.2 Research Contributions . . . . . . . . . . . . . . . . . . . . . . . . . . 1199.3 Limitations . . . . . . . . . . . . . . . . . . . . . . . . . . . . . . . . 120
10 Outlook 123
IV Appendix 125
A Similarity Measures 127
B Error Measures 131
B.1 Residual Sum of Squares . . . . . . . . . . . . . . . . . . . . . . . . . 131B.2 Mean Absolute Error . . . . . . . . . . . . . . . . . . . . . . . . . . . 132B.3 Root Mean Squared Error . . . . . . . . . . . . . . . . . . . . . . . . 132
C Clustering Algorithms 133
C.1 Hierarchical Clustering . . . . . . . . . . . . . . . . . . . . . . . . . . 134C.2 Flat Clustering Using K-Means . . . . . . . . . . . . . . . . . . . . . 136
C.2.1 The K-Means Algorithm . . . . . . . . . . . . . . . . . . . . . 136C.2.2 Estimating the Cluster Number . . . . . . . . . . . . . . . . . 137
C.3 Clustering via Matrix Factorization . . . . . . . . . . . . . . . . . . . 138C.3.1 LSA-based Clustering . . . . . . . . . . . . . . . . . . . . . . . 139C.3.2 NMF-based Clustering . . . . . . . . . . . . . . . . . . . . . . 140
C.4 Cluster Labeling Methods . . . . . . . . . . . . . . . . . . . . . . . . 142C.4.1 Frequency-based Cluster Labeling . . . . . . . . . . . . . . . . 142C.4.2 Chi-square Cluster Labeling . . . . . . . . . . . . . . . . . . . 143
xiii
D Music Mood Categories 145
E Evaluation 147
E.1 Kind of Evaluation . . . . . . . . . . . . . . . . . . . . . . . . . . . . 147E.2 Kind of Data Set . . . . . . . . . . . . . . . . . . . . . . . . . . . . . 148E.3 Properties of Data Sets . . . . . . . . . . . . . . . . . . . . . . . . . . 148E.4 Evaluation Measures . . . . . . . . . . . . . . . . . . . . . . . . . . . 148
E.4.1 Predictive Accuracy Metrics . . . . . . . . . . . . . . . . . . . 148E.4.2 Classification Accuracy Metrics . . . . . . . . . . . . . . . . . 150E.4.3 Rank Accuracy Metrics . . . . . . . . . . . . . . . . . . . . . . 151E.4.4 Prediction-Rating Correlation . . . . . . . . . . . . . . . . . . 151
E.5 Beyond Accuracy . . . . . . . . . . . . . . . . . . . . . . . . . . . . . 151
xiv
List of Figures
2.1 Example of a user-item rating matrix. . . . . . . . . . . . . . . . . . . 14
2.2 Data sources used for the extraction of contextualized user profilesand the recommendation algorithms proposed in this thesis. . . . . . 24
3.1 The Web 3.0 as the convergence of the Web 2.0 and the Semantic Web. 25
3.2 Linking Open Data cloud diagram. . . . . . . . . . . . . . . . . . . . 39
4.1 Detail view of an ALOE resource. . . . . . . . . . . . . . . . . . . . . 45
4.2 Welcome page of the C-LINK system. . . . . . . . . . . . . . . . . . . 47
5.1 Contextualized user interest profile. . . . . . . . . . . . . . . . . . . . 55
5.2 Topic extraction process steps. . . . . . . . . . . . . . . . . . . . . . . 57
5.3 Overview of the topic-based recommender system. . . . . . . . . . . . 60
6.1 Mood adjectives arranged in eight related groups ([Hevner, 1936]). . . 67
6.2 Eight affect concepts according to [Russell, 1980]. . . . . . . . . . . . 67
6.3 Music styles identification process steps. . . . . . . . . . . . . . . . . 71
6.4 Example of an artist-property matrix. . . . . . . . . . . . . . . . . . . 72
6.5 Screenshot of the HORST similar artists interface. . . . . . . . . . . . 75
6.6 Explanations in the dbrec music recommender system. . . . . . . . . 76
7.1 Distribution of the number of tags in the BibSonomy data set. . . . . 88
7.2 Distribution of the number of tagged bookmarks in the BibSonomydata set. . . . . . . . . . . . . . . . . . . . . . . . . . . . . . . . . . . 88
7.3 Evaluation of the topic labels. . . . . . . . . . . . . . . . . . . . . . . 91
7.4 Lorenz curve plotting the rounded, average precision at different termrelevance thresholds. . . . . . . . . . . . . . . . . . . . . . . . . . . . 92
7.5 Distribution of the number of playlist entries in the Last.fm data set. 96
xv
7.6 Cumulative distribution of the number of playlist entries in theLast.fm data set. . . . . . . . . . . . . . . . . . . . . . . . . . . . . . 97
7.7 Evaluation of music style labels (frequency based). . . . . . . . . . . . 1007.8 Evaluation of music style labels (chi square). . . . . . . . . . . . . . . 1017.9 Lorenz curve plotting the rounded, average support at different fea-
ture relevance thresholds. . . . . . . . . . . . . . . . . . . . . . . . . . 102
8.1 Overview of the FAB recommender system. . . . . . . . . . . . . . . . 108
C.1 Example of a dendrogram as output of a hierarchical clustering algo-rithm. . . . . . . . . . . . . . . . . . . . . . . . . . . . . . . . . . . . 135
C.2 Factorization of the term-document matrix by the NMF algorithm. . 141
xvi
List of Tables
4.1 ALOE resource metadata. . . . . . . . . . . . . . . . . . . . . . . . . 464.2 Composition of metadata profiles of resources, events, and users in
the C-LINK system. . . . . . . . . . . . . . . . . . . . . . . . . . . . 48
5.1 Rating and priority values that are associated with user actions. . . . 55
7.1 Results of the subjective user interests identification evaluation study. 867.2 Examples of extracted user interest topics. . . . . . . . . . . . . . . . 947.3 Available metadata for each playlist entry in the music recommenda-
tion data set. . . . . . . . . . . . . . . . . . . . . . . . . . . . . . . . 977.4 Mood supports in tenth part intervals juxtaposed to the number of
occurring clusters. . . . . . . . . . . . . . . . . . . . . . . . . . . . . . 1037.5 Examples of identified preferred music styles. . . . . . . . . . . . . . . 104
8.1 Comparison with related topic-based recommender systems. . . . . . 112
C.1 Reasonable cluster number used depending on the number of a user’spreferred items/artists. . . . . . . . . . . . . . . . . . . . . . . . . . . 138
D.1 Music mood clusters proposed by [Laurier et al., 2009]. . . . . . . . . 145
E.1 Properties of data sets. . . . . . . . . . . . . . . . . . . . . . . . . . . 149E.2 Confusion matrix showing recommended (chosen) items in contrast
to the user’s information need. . . . . . . . . . . . . . . . . . . . . . . 150
xvii

xviii

Part I
Foundations
1

Chapter 1
Introduction
Nowadays, recommender systems are omnipresent on the World Wide Web. Theysupport people to discover a variety of different kinds of items such as music, books,and movies in a vast and almost unmanageable information space. The two predom-inant recommendation technologies applied today are content-based and collabora-tive filtering. Content-based recommender systems have their roots in informationretrieval research [Belkin and Croft, 1992]. They recommend items that are similarto those items a user has liked in the past. Collaborative filtering was invented inthe early 1990ies [Goldberg et al., 1992, Resnick et al., 1994] and has been adaptedsuccessfully in many large scale online portals like Amazon1 and Last.fm.2 Col-laborative filtering systems recommend such items that an active user’s peers havepreferred in the past.
With the advent of the Web 3.0 new and exciting opportunities for rec-ommender systems have emerged. [Wahlster et al., 2006] defined the Web 3.0as the convergence of the Web 2.0 [O’Reilly, 2005b] and the Semantic Web[Berners-Lee et al., 2001]. Recommender systems can profit from both worlds. Onthe one hand we have the Web 2.0 comprising technologies such as wikis, blogs,and resource sharing platforms in which we find user-generated content and socialmetadata such as tags. Tagging is a lightweight approach to collaboratively catego-rize items being widely adapted due to its low cognitive cost [Sinha, 2005]. Despitewell-known problems like synonymous and ambiguous tags or tag assignments ondifferent levels of specificity ([Begelman et al., 2006]), tags still provide a valuable
1http://www.amazon.com/2http://www.last.fm/
3
4
source of information about items that can be used for recommendations. On theother hand the Semantic Web provides us with structured metadata that can beunderstood by machines. The Linking Open Data project3 identifies existing datasets under open licenses and publishes them on the Web, according to the LinkedData principles (see Chapter 3.2). This data can be used to obtain descriptions foritems from different domains (e. g., music, movies, and books), that way openingnew possibilities for content-based recommender systems.
Traditional content-based and collaborative recommender systems tendto recommend similar items predominantly (e. g., [Bradley and Smyth, 2001,Zhang and Hurley, 2009]) thus not taking a user’s full range of interests into ac-count. In this thesis we propose an approach extracting contextualized user inter-est profiles that can be used to enhance the diversity of recommendation lists byrecommending items from different user interest topics. So far, recommender sys-tems have mostly been evaluated by assessing each recommended item separatelyand calculating an aggregated score for the whole system. However judging rec-ommendation lists as a whole has been identified as an important issue in recentyears [McNee et al., 2006a]. It has also been addressed in previous work, e. g., by[Ziegler et al., 2005] showing that recommendation lists with a higher degree of di-versity can improve user satisfaction with the recommender system. In Section 1.1we introduce our idea of topic-based recommendations in Enterprise 2.0 resourcesharing platforms. Our goal here is the provision of recommendations accordingto a knowledge worker’s full range of interests. Next, in Section 1.2 we presentanother application domain for our algorithm. In the second use case we identifythe different music styles a user prefers, that way aiming at context-sensitive musicrecommendations based on the present mood of the active user.
1.1 Topic-based Resource Recommendations
Nowadays, social media technologies are increasingly often deployed to foster theknowledge transfer in the Enterprise. McAfee introduced the concept of the Enter-prise 2.0 as a collection of Web 2.0 technologies for generating, sharing, and refininginformation [McAfee, 2006]. Companies can buy or build these technologies in orderto uncover the practices and outputs of their knowledge workers. At the German
3http://esw.w3.org/SweoIG/TaskForces/CommunityProjects/LinkingOpenData
5
Research Center for Artificial Intelligence4 we have developed the ALOE5 system, asocial resource sharing platform for bookmarks, files, and their associated metadatathat can be deployed in such scenarios.
As the amount of content in these information systems grows, there is an in-creasing need for recommender systems that keep the users informed about re-sources matching their needs and preferences. However, traditional recommendersystems based on collaborative filtering suffer from sparsity issues, particularly inscenarios where the amount of items is much larger than the amount of users.Content-based recommender systems on the other hand suffer from the overspe-cialization problem thus not considering a user’s full range of interests (e. g.,[Adomavicius and Tuzhilin, 2005]). Let’s assume a knowledge worker is interested inJava programming, Perl scripting, and Linux operating system. She uses an Enter-prise 2.0 resource sharing platform to share resources with her colleagues accordingto these topics. We envision a recommender system that identifies these topics andprovides recommendations accordingly.
After a warm-up phase in which traditional item-based collaborative filtering rec-ommendations are provided for new users, our proposed approach applies algorithmsfrom the domain of topic detection and tracking to identify a knowledge worker’sdifferent topics of interest. The method analyzes the metadata profiles of the user’spreferred resources and derives per topic a weighted term vector as a label. Whenthe user requests recommendations these vectors are used to query an index in orderto find previously unknown resources matching the respective interest topics.
The underlying approach (namely clustering and cluster label extraction) hasfurther been applied in a use case for music recommendations based on the presentmood of the active user. The idea will be introduced subsequently.
1.2 Mood-based Music Recommendations
Music classification and recommendation based on mood has been a growing researcharea in recent years (e. g., [Rho et al., 2009, Lee and Lee, 2006]). This is also re-flected in the MIREX (Music Information Retrieval Evaluation eXchange) challenge6
where the Audio Mood Classification task has been added in 2007 ([Hu et al., 2008]).4http://www.dfki.de/5http://aloe-project.de/AloeView/6http://music-ir.org/mirex/wiki/MIREX_HOME
6
In this thesis we investigate two assumptions: First, we examine the hypothesisthat many people listen to different styles of music in terms of genres, instruments,release years, etc. While this hypothesis might seem intuitively plausible, currentmusic recommender systems do not particularly consider the different music styles auser prefers. Many music recommender systems are based on collaborative filteringtechniques that tend to recommend similar items only. Other recommender sys-tems for entertainment items try to infer a user’s taste from identified personalitytraits [Hu and Pu, 2009]. Advocates of theses systems often claim that a user mightprefer different music styles within a given genre, however preferences across vari-ous very different genres are often neglected. Second, we analyze whether a user’scurrently preferred music style depends on her present mood. There is evidence inthe literature that a user’s music preferences change depending on her mood (e. g.,[Mortensen et al., 2008]). For that reason we try to find correlations between theuser’s current mood and her preferred music style in terms of music attributes suchas genres and instruments. In our approach we use metadata from the Semantic Webto describe a user’s preferred artists. These artists are then clustered according tothe music styles they are associated with. Then we check whether the identifiedgroups overlap with mood categories we found in the literature. The primary goalfor this scenario is the provision of context-sensitive music recommendations. De-pending on the user’s mood we aim at recommending items from the music stylewhich is most appropriate in the given situation.
In contrast to traditional collaborative filtering methods that tend to recom-mend popular items and are not well suited for users with extraordinary tastes([McNee et al., 2006b]) approaches based on metadata from the Semantic Web canprovide recommendations with a high degree of novelty without the need of findingpeers with a similar taste for the active user [Baumann et al., 2010].
1.3 Research Hypotheses
For topic-based resource recommendations we will analyze the following hypotheses:
H1 Knowledge workers have different topics of interest.
H2 By applying topic detection algorithms on the users’ preferred resources we candetect these topics.
7
H3 The detected topics can be used to generate recommendation lists with a highdegree of diversity.
To the best of our knowledge these hypotheses have not been examined in theEnterprise 2.0 context so far. For mood-based music recommendations we will in-vestigate the following hypotheses:
H4 Many people listen to different styles of music.
H5 An active user’s preferred style of music depends on her mood.
1.4 Outline
The thesis is divided into four major parts: Part I describes the motivation for thiswork and provides the reader with relevant information about the environment inwhich the thesis is set.
Chapter 2 presents the state of the art in recommender systems. It gives anoverview of the different kinds of recommendation algorithms with content-based andcollaborative approaches as the predominant ones. Different hybridization methodsare discussed that combine the strengths of single recommendation methods whileat the same time alleviating their deficiencies. Finally, the chapter states two areaswhere the extraction of user profiles and recommendation algorithms proposed inthis thesis go beyond the current state of the art.
Chapter 3 describes the idea of the Web 3.0 as the convergence of the Web ofpeople (i. e., the Web 2.0) and the Web of data (i. e., the Semantic Web). A focus isput on collaborative tagging systems and the Enterprise 2.0 as well as Linked Dataas these concepts are particularly important for the use cases in which the proposedrecommendation approaches have been applied.
Chapter 4 depicts the ALOE system, an Enterprise 2.0 platform that has beenimplemented in the Knowledge Management group at DFKI as well as the C-LINKsystem which is a conference organization system that has been built on top ofALOE. In C-LINK content-based recommendations for conference events andparticipants have been implemented. The chapter discusses the C-LINK system as
8
well as lessons learned.
In Part II we present the proposed approaches together with their evaluations.
Chapter 5 introduces our approach for topic-based resource recommendations inEnterprise 2.0 platforms. It depicts in detail our idea on how to extract user profilesthat appropriately represent a user’s different topics of interest as well as the derivedcontent-based recommender system.
Chapter 6 describes our method extracting multifaceted profiles representing auser’s different preferred music styles. First, we depict Semantic Web data sourcesthat can be used to describe music artists. Then we present our approach to extract-ing contextualized music preference profiles and suggest possible fields of application.
Chapter 7 covers the evaluation of the ideas presented in this thesis. First, itpresents goals from the literature which are commonly addressed when recommendersystems are evaluated. Then it explains the reasoning behind the evaluation methodapplied. Next, the results for our topic-based resource recommendations and mood-based music recommendations are presented respectively.
Chapter 8 presents research in the fields of topic-based resource recommenda-tions as well as mood-based music recommendations.
Part III concludes the findings of our work and presents ideas for future work.
Chapter 9 summarizes the work performed in this thesis, discusses the researchhypotheses that have been set in the introduction, and depicts our research contri-butions. Finally, limitations of the approach as well as the evaluation experimentsconducted are discussed.
Chapter 10 suggests ideas for future work. In particular we discuss the use ofour multifaceted user profiles for context-sensitive recommendations.
In the appendix we present background knowledge and technical details of thetechniques used in this work.
9
Appendix A depicts similarity and distance measures that are often used forrecommender systems or clustering algorithms to determine the similarity betweenusers, items, or between whole item sets.
Appendix B describes statistical error measures that are commonly used to eval-uate the quality of clustering results or the accuracy of recommendation algorithms.
Appendix C provides an overview of clustering algorithms. First, hierarchicalclustering methods are described that allow for a visual representation of clusteringresults. Second, we present the K-Means algorithm as an example for flat clusteringtogether with a heuristic to determine a reasonable cluster number. Third, co-clustering techniques are depicted that perform clustering of the rows and columnsof a matrix at the same time. Finally, we present two methods that are frequentlyused to extract cluster labels.
Appendix D presents two schemes for music mood representations based on socialtags.
Appendix E summarizes important aspects for the evaluation of recommendersystems and of collaborative filtering in particular. It compares live user experi-ments to offline analyses and the use of synthesized vs. natural data sets. Furtherproperties of recommender system data sets are discussed and different evaluationmeasures are presented.

10
Chapter 2
State of the Art in Recommender
Systems
Providing useful recommendations is a challenging task. A recommender systemneeds to learn about the preferences of users as unobtrusively as possible and providereal-time recommendations in a vast information space of potentially millions ofitems. Following [Adomavicius and Tuzhilin, 2005] we state the recommendationproblem as follows: Let U be the set of all users and I be the set of all items in thesystem. Let ϕ be a utility function to measure the usefulness of item i to user u,ϕ : U × I → R with R being a totally ordered set. For each user u ∈ U we want toselect items i′ ∈ I that maximize the utility for the user:
∀u ∈ U, i′u = arg maxi∈I
ϕ(u, i) (2.1)
As depicted in [Montaner et al., 2003] there are three main information filteringmethods for recommender systems on the Web today: content-based, collaborativeand demographic filtering. Furthermore hybrid approaches exist that combine sev-eral techniques in order to overcome the particular weaknesses of the individualapproaches [Burke, 2002]. Subsequently content-based and collaborative filteringare briefly introduced.
For both techniques memory-based and model-based approaches exist. In largescale environments with millions of items and millions of users memory-based ap-proaches often suffer performance issues. Model-based algorithms remedy theseproblems. They use the set of available ratings to learn a model offline which canbe used to make on demand rating predictions. In order to depict the functionality
11
12
of the algorithms we mainly concentrate on the memory-based approaches.
2.1 Content-Based Approach
Content-based (CB) methods estimate the utility of an item according to its sim-ilarity to items for which the user has expressed a preference in the past. Thecontent-based methods have their roots in information retrieval and information fil-tering research hence being prevailingly implemented for resources having textualfeatures available (either directly extracted from documents or in the form of meta-data). However content-based recommender systems have also been implementedfor multimedia items for which no textual features are available. For instance,[Liu and Huang, 2000] and [Logan and Salomon, 2001] implemented content-basedretrieval of similar audio items by using automatically extracted signal features suchas mel-frequency cepstral coefficients. Subsequently we will focus on content-basedsystems for items for which textual features are available. We will use the expres-sions “items with textual features” and “metadata profiles of items” synonymouslywith the term “documents.”
For every item that can possibly be recommended content-based approaches com-pose a profile (ItemProfile (i)) consisting of its features (i. e., the attributes that char-acterize the item). For textual resources this is usually a set of keywords with an“importance” weight attached. For this weight the term frequency/inverse documentfrequency measure is widely used [Sparck Jones, 1972]:
Let N be the number of all items that can be recommended and ka a keywordwhich is contained in na of them. Further fa,b is the number of times ka is containedin ib. The term frequency is computed as follows:
TFa,b =fa,b
maxz fz,b(2.2)
with the maximum computed over the frequencies fz,b of all keywords which arecontained in item ib. Keywords that appear in many documents are not discrimi-native. The measure of the inverse document frequency (IDFa = log
N
na
) is usedto cope with this problem. The combined TF-IDF weight for a keyword is deter-mined by multiplying its term frequency in a document with its inverse document
13
frequency:
wa,b = TFa,b × IDFa (2.3)
An item profile might be composed of these weights:
ItemProfile (i) = (w1i, w2i, ..., wKi) (2.4)
with K as the total number of all keywords. Further, we need for every user aprofile
UserProfile (u) = (wu1, wu2, ..., wuK) (2.5)
that describes her interests. Usually this profile is composed of weighted termsfrom items for which the user has expressed a preference in the past.
The utility function is defined as follows:
ϕ (u, i) = score (UserProfile (u) , ItemProfile (i)) (2.6)
For ItemProfile (i) = −−−→witem and UserProfile (u) = −−−→wuser a common scoring heuris-tic is the cosine similarity measure:
ϕ (u, i) = cos (−−−→wuser,−−−→witem) =
−−−→wuser · −−−→witem
‖−−−→wuser‖2 × ‖−−−→witem‖2(2.7)
A content-/model-based approach for website recommendations is presented in[Pazzani and Billsus, 1997]. In their system Syskill & Webert users can initializetheir profiles by assigning keywords and probabilities of their occurrences for a topicin order to distinguish interesting pages on the topic from uninteresting ones. Thisprofile is later revised when users provide ratings for Web pages they have visited.Website recommendations are treated as a classification problem that is solved witha naïve Bayesian classifier.
2.2 Collaborative Filtering
The concept of collaborative filtering (CF) was first introduced by[Goldberg et al., 1992]. In the Tapestry system eager users are expected toannotate eMails (in particular newsgroup messages). More casual users will profit
14
Alice
Bob
Carol
Dave
...
Item A Item B Item C Item D ...
3 5
5 1
4 4
2
-
-
-
--
--
- -
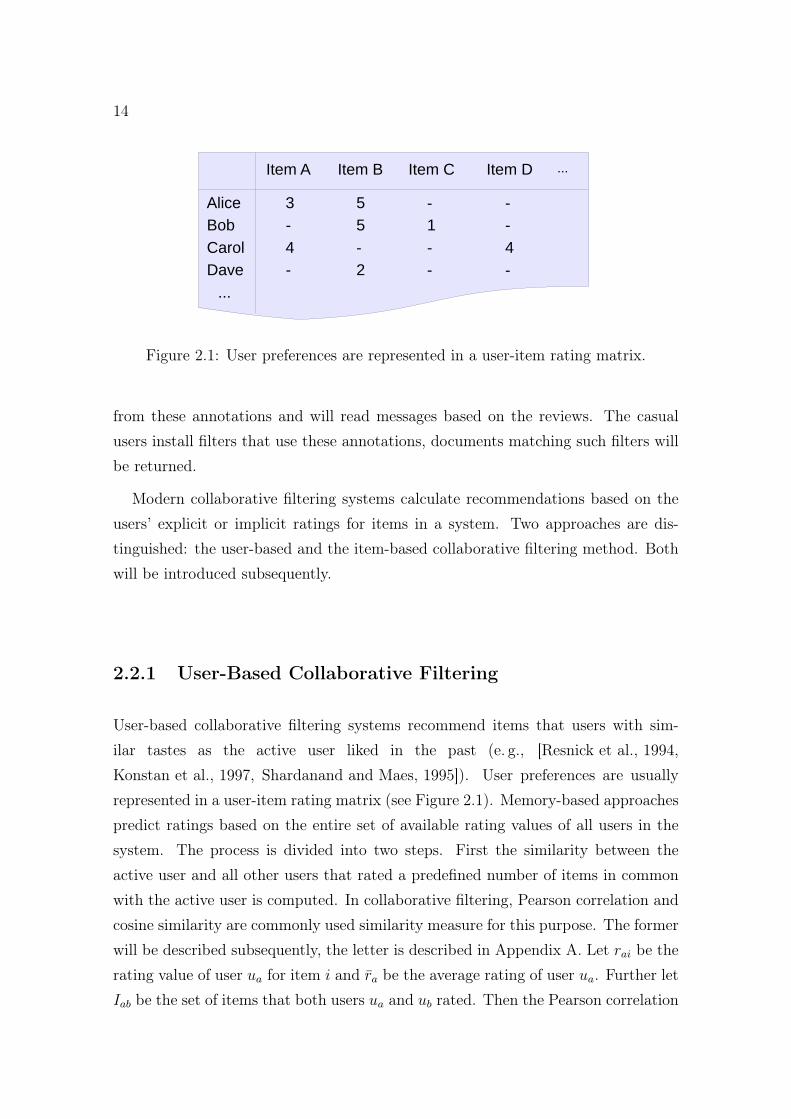
Figure 2.1: User preferences are represented in a user-item rating matrix.
from these annotations and will read messages based on the reviews. The casualusers install filters that use these annotations, documents matching such filters willbe returned.
Modern collaborative filtering systems calculate recommendations based on theusers’ explicit or implicit ratings for items in a system. Two approaches are dis-tinguished: the user-based and the item-based collaborative filtering method. Bothwill be introduced subsequently.
2.2.1 User-Based Collaborative Filtering
User-based collaborative filtering systems recommend items that users with sim-ilar tastes as the active user liked in the past (e. g., [Resnick et al., 1994,Konstan et al., 1997, Shardanand and Maes, 1995]). User preferences are usuallyrepresented in a user-item rating matrix (see Figure 2.1). Memory-based approachespredict ratings based on the entire set of available rating values of all users in thesystem. The process is divided into two steps. First the similarity between theactive user and all other users that rated a predefined number of items in commonwith the active user is computed. In collaborative filtering, Pearson correlation andcosine similarity are commonly used similarity measure for this purpose. The formerwill be described subsequently, the letter is described in Appendix A. Let rai be therating value of user ua for item i and ra be the average rating of user ua. Further letIab be the set of items that both users ua and ub rated. Then the Pearson correlation
15
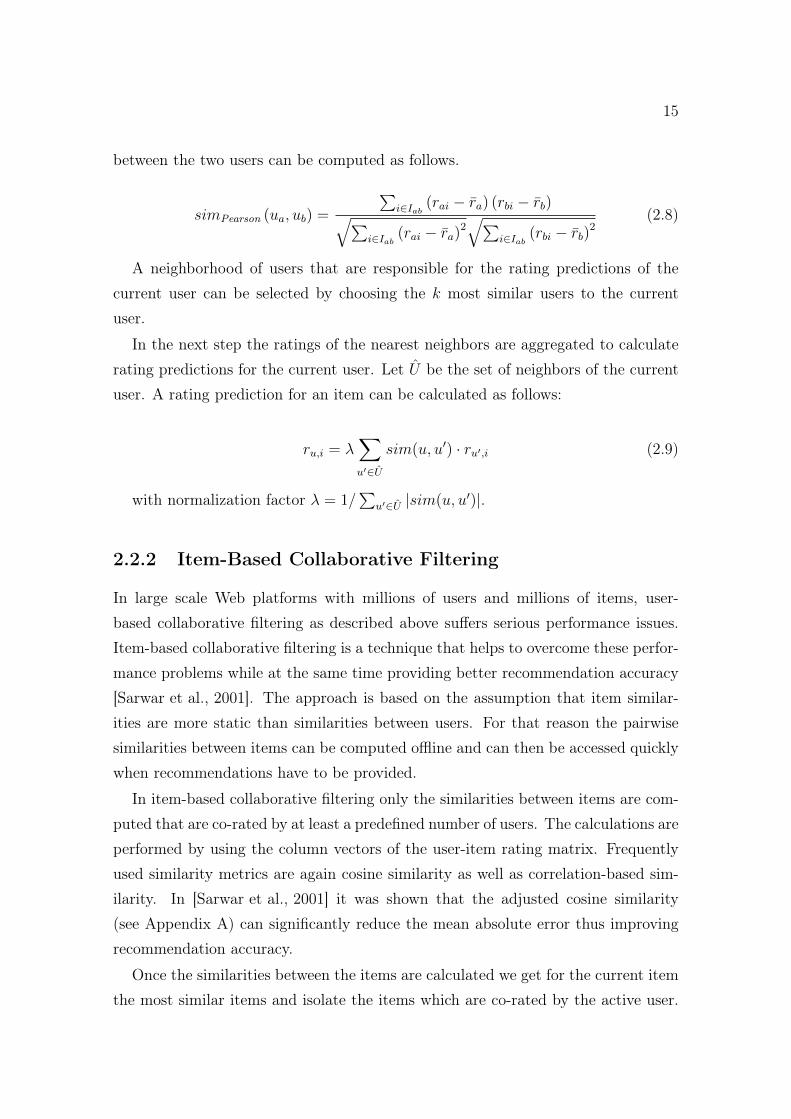
between the two users can be computed as follows.
simPearson (ua, ub) =
∑i∈Iab (rai − ra) (rbi − rb)√∑
i∈Iab (rai − ra)2√∑
i∈Iab (rbi − rb)2(2.8)
A neighborhood of users that are responsible for the rating predictions of thecurrent user can be selected by choosing the k most similar users to the currentuser.
In the next step the ratings of the nearest neighbors are aggregated to calculaterating predictions for the current user. Let U be the set of neighbors of the currentuser. A rating prediction for an item can be calculated as follows:
ru,i = λ∑u′∈U
sim(u, u′) · ru′,i (2.9)
with normalization factor λ = 1/∑
u′∈U |sim(u, u′)|.
2.2.2 Item-Based Collaborative Filtering
In large scale Web platforms with millions of users and millions of items, user-based collaborative filtering as described above suffers serious performance issues.Item-based collaborative filtering is a technique that helps to overcome these perfor-mance problems while at the same time providing better recommendation accuracy[Sarwar et al., 2001]. The approach is based on the assumption that item similar-ities are more static than similarities between users. For that reason the pairwisesimilarities between items can be computed offline and can then be accessed quicklywhen recommendations have to be provided.
In item-based collaborative filtering only the similarities between items are com-puted that are co-rated by at least a predefined number of users. The calculations areperformed by using the column vectors of the user-item rating matrix. Frequentlyused similarity metrics are again cosine similarity as well as correlation-based sim-ilarity. In [Sarwar et al., 2001] it was shown that the adjusted cosine similarity(see Appendix A) can significantly reduce the mean absolute error thus improvingrecommendation accuracy.
Once the similarities between the items are calculated we get for the current itemthe most similar items and isolate the items which are co-rated by the active user.
16
Let I be the set of co-rated items. The rating prediction for the current item canbe calculated as follows:
ru,i =
∑i′∈I sim(i, i′) · ru,i′∑
i′∈I |sim(i, i′)|(2.10)
The perhaps most popular item-based recommender system might be the one ofonline retailer Amazon [Linden et al., 2003].
2.2.3 Improving Collaborative Filtering - The Netflix Com-
petition
In October 2006 the online DVD retail service Netflix1 announced a competitionexposing a price of 1,000,000 USD for the best team implementing a collaborativefiltering algorithm that could achieve a reduction of the root mean squared error(RMSE, see Appendix B.3) by at least 10% compared to their own Cinematch algo-rithm. They released a training data set of 100,480,507 ratings by 480,189 users for17,770 movies. Each rating was also associated with a timestamp indicating whenthe rating was contributed. Further a separate data set was provided containing thetitles and release years of the movies. In the view of privacy concerns no informa-tion about the users was given [Wikipedia, 2010c]. The team “BellKor’s PragmaticChaos” was announced as the winner of the competition on September 18, 2009.Their algorithm is described in detail in [Koren, 2009].
[Amatriain, 2009] summarizes what the collaborative filtering community haslearned from the competition:
• RMSE is not a valid success measure: There is no direct correlation betweenRMSE and the end-user satisfaction with the recommender system (see alsothe discussion on this topic in Appendix E).
• Time matters: Modeling the temporal evolution of user preferences has beenfound to be of major importance. Just because someone liked the first HarryPotter book in 1997 does not necessarily mean that the person will like theseventh book of the series today. It does not even mean that he/she still likesthe first book today.
1http://www.netflix.com/
17
• Matrix factorization methods work best: Methods such as singular value de-composition and non-negative matrix factorization do not only improve therecommendation results but they also provide insights into the problem andmost importantly they can be implemented in a very efficient way. We discussthese techniques in the context of clustering in Appendix C.3.
• One method is not enough (nor 100): To improve the rating predictions of asystem it is usually easier to add another prediction method instead of trying toimprove the old one. In the winning solution of the Netflix competition manypredictors have been blended requiring the learning of millions of parametersthus bringing the algorithm close to being a black box. The scientific insightsand the knowledge learned from it was very limited and the portability of theapproach is rather questionable.
• The importance of data and noise: Good improvements with rating predictionscan be made when the data is first cleaned from noise, e. g., when asking theusers to re-rate some items.
2.3 Discussion of Content-Based and Collaborative
Approaches
Content-based and collaborative information filters both have their particularstrengths and weaknesses. We will summarize them in this section according to[Adomavicius and Tuzhilin, 2005]. A common issue of both approaches is the newuser problem. Providing high quality recommendations to a user is only possiblewhen the user has expressed preferences for a sufficiently large amount of items. InCF there is also the new item problem, i. e., items for which a minimum number ofratings is not available cannot be recommended. CB approaches select items depend-ing on their features thus not suffering this problem. However the need for features(e. g., text or manually annotated features) is also a drawback of content-based ap-proaches as such features might not always be available, e. g., features describingthe content of video data or images. Also content-based approaches cannot takeinto account the quality of items. Items with similar content but different in qualitycannot easily be distinguished. As collaborative filtering relies on the ratings ofitems the approach inherently considers the quality of items. Another problem of
18
content-based approaches is overspecialization. CB recommender systems suggestitems that are thematically similar to items for which a user has expressed a prefer-ence in the past that way missing interesting items from other topics. Collaborativefiltering is capable of recommending items from different topics thus increasing theserendipity aspect of the system. However CF cannot always be applied. In systemswhere the user-item rating matrix is sparsely populated the recommendation qualityof collaborative information filters decreases significantly.
2.4 Model-based Approaches
Recommender systems face many challenges. They have to produce high quality rec-ommendations, perform many recommendations per second for potentially millionsof users and items, and they have to achieve high coverage in spite of data sparsity.Pure memory-based approaches as described before suffer scalability issues when thenumber of users and items becomes too large. It is for this reason that approacheshave been implemented which learn a model of the available data (offline) in orderto enable efficient recommendations for systems with many users and items.
[Sarwar et al., 2000] present a model-based collaborative filtering algorithm thatapplies Latent Semantic Indexing/Singular Value Decomposition to reduce the di-mensionality of the data in recommender systems. They use the low dimensionalrepresentation of the data to compute the neighborhood of the active user, that wayimproving the efficiency of the collaborative filtering algorithm. Two experimentswere conducted: in the first experiment rating predictions were calculated, in thesecond Top-N recommendation lists were generated. The evaluation of the systemshows that the approach results in good quality predictions and has the potentialto provide better online performance than pure memory-based approaches.
Model-based, content-based recommender systems are described, e. g., by[Pazzani and Billsus, 2007]. They present the task of learning a user model forcontent-based recommendations as a form of classification learning. In such systemsuser feedback on items is used as training data for classification learners. The datais divided into categories such as “items the user likes” and “items the user doesn’tlike”. Content descriptions of items can either be structured or unstructured (freetext). The classification learners try to predict whether a user will like an item ornot. Many of these algorithms also provide an estimate of the probability that the
19
user will like an unseen item. These estimates can be used to rank a list of recom-mendation candidates. Some algorithms directly try to predict a user’s degree ofinterest by providing numeric values that estimate a user’s rating for an unseen item.As suitable machine learning algorithms for model-based, content-based recommen-dations Pazzani and Billsus present among others: decision trees (prevailingly forstructured data with few attributes), rule induction (particularly suited for semi-structured data), Rocchio’s algorithm, linear classifiers, and probabilistic methodssuch as naïve Bayes.
2.5 Further Approaches
Knowledge-based recommender systems are closely related to Case Based Reasoningresearch. Their four main characteristics are: centrality of examples, conversationalnavigation via tweaks, knowledge-based similarity metrics and task-specific retrievalstrategies. The FindMe approach as proposed, e. g., in [Burke, 2000], has two funda-mental retrieval modes: The first is similarity finding. In this mode the user selectsan item from a catalog and requests similar items. Alternatively it may also bepossible to just specify desired features of the searched items. Second is the tweakmode where features of candidate items can be adjusted (e. g., lower price) in or-der to get better recommendations. In contrast to collaborative information filters,knowledge-based recommender systems do not a have a ramp-up problem and alsodo not suffer from the new user problem as the user directly tells the system whatkind of item she is searching for. However the knowledge engineering task (i. e.,describing items with high-quality up-to-date data) is often a bottleneck in thesesystems.
Another type of recommender systems uses demographic information (such asgender, age, or education) to identify types of users that like certain objects. How-ever obtaining demographic information can be difficult. [Pazzani, 1999] trains aclassifier for each recommendable item with the homepages of users that liked therespective item and the homepages of users that didn’t like the item.
Utility-based recommender systems try to capture a user’s preferences in a util-ity function (cf. Equation 2.1). While with other recommendation approaches thisfunction is usually known in advance and the same for all users, learning such afunction for each user is the biggest issue of utility-based recommender systems.
20
[Yi and Deng, 2009] propose an approach for utility-based recommendations in E-Commerce based on Bayesian networks. User utilities are represented as proba-bilities over attributes. First a common utility function for all users is build by adomain expert. A prior Bayesian network is established based on this function. Ina second step the Bayesian network is adapted according to the implicit feedbackthat a user provides for items (e. g., the user purchases an item or saves a referenceto an item). The utility function that is learned that way, will be used to recom-mend items that are supposed to have the highest utility for a user. An importantadvantage of utility-based recommender systems is that they can incorporate itemfeatures that are not related to the item itself (such as delivery schedule or warrantyterms) but are important to the user.
2.6 Hybrid Systems
To overcome the limitations of individual recommendation approaches and to exploitthe advantages of two or more methods, often hybrid systems are built. [Burke, 2002]describes seven methods to combine different recommendation algorithms:
Weighted In a weighted hybrid recommender system the results of all availablerecommendation techniques are combined to calculate the score of an item. In itssimplest form the final score is a linear combination of the recommendation scoresof the available methods. In case that some or all of the involved methods do notproduce a rating prediction score the recommendations of each method may be con-sidered as votes for the respective items. In the hybrid system these votes will thenbe combined in order to produce the final recommendation list. There are systemsthat also adapt the influence of single recommendation techniques based on the userfeedback for the recommended items. A drawback of the weighted hybridizationmethod is its implicit assumption that the relative value of each recommendationtechnique is more or less uniform across the item space. However this assumptiondoes not always hold true as, e. g., collaborative approaches perform worse on seldomrated items.
Switching [Tran and Cohen, 2000] present a hybrid recommender system thatswitches between knowledge-based and collaborative recommendations based on a
21
predefined criterion. New users receive knowledge-based recommendations. As soonas a sufficiently large user profile of preferred items is available the system can alsoprovide recommendations based on a collaborative recommendation method. Thesystem determines automatically whether the knowledge-based or the collaborativemethod can provide the most useful recommendations. For that purpose it calcu-lates rating predictions according to the collaborative method. If the average ratingprediction exceeds a predefined threshold the recommendations of the collaborativemethod will be presented to the user, otherwise the knowledge-based recommenda-tions will be used. If the actual user ratings for the knowledge-based recommenda-tions are worse than the average rating prediction of the collaborative method thethreshold for the switching criterion will be lowered and the selection process startsover. Another switching criterion might be the confidence of the recommendationsprovided by single methods (see Appendix E.5).
Mixed In cases where many recommendations are needed simultaneously, it mightbe useful to have a mixed hybrid that presents recommendations from differentsystems. For instance, a mixed hybrid of collaborative and content-based filtersis likely to overcome the new item problem as the content-based technique doesnot suffer from this problem. It might be able to alleviate the overspecializationproblem of pure content-based approaches as the collaborative filter is likely toalso recommend interesting items from other domains than those for which theuser already has expressed a preference. However it still suffers from the new userproblem as both content-based as well as collaborative recommender systems havethis problem.
Feature Combination The feature combination approach allows to mixcontent-based and collaborative filters by treating user ratings as additional fea-tures for items. It applies content-based techniques on the augmented data set.Such a hybrid allows the consideration of collaborative data without relying exclu-sively on it. That way it reduces the sensitivity of the system for the number ofusers that rated an item. Moreover the content-based features allow the systemto have information about the inherent similarity of items that would otherwise beconcealed by pure collaborative approaches.
22
Cascade The cascade hybrid involves a staged process. First, one recommenda-tion technique is employed to produce a roughly ranked list of candidate items. Ina second step another recommendation technique is used to refine the recommen-dations from the candidate set. Two advantages of the cascade hybrid should behighlighted here: The first advantage is that cascading allows to avoid employingthe second recommendation technique on items that are already well-differentiatedby the first, higher-priority, technique or not sufficiently often rated. Second thecascade hybrid is tolerant of noise produced by the second, lower-priority techniqueas the second technique can only refine, not upset the results of the first technique.
Feature Augmentation Feature augmentation hybrids take rating predictionsor classifications of items as additional input for the next recommendation step.Burke mentions the LIBRA system [Mooney and Roy, 2000] as an example for such ahybrid. LIBRA is a content-based book recommender system that uses the metadatathat is associated with books (titles, authors, synopses, ...) to learn user profiles.The metadata incorporates collaborative content such as related authors and titlesas determined by Amazons collaborative recommender system. Mooney and Royhave evaluated the role of the collaborative features and have found that they havea significant positive effect on the quality of the generated recommendations.
Meta-level The last kind of hybrid recommender systems that Burke presents,are the meta-level hybrids. These systems take the model learned by one recom-mendation technique as the input for the second technique. As one example Burkementions the method of collaboration via content [Pazzani, 1999] that addresses thesparsity problem of traditional collaborative filtering systems. To determine thesimilarity between users, collaboration via content uses content-based user profiles.The profiles consist of weighted terms that indicate that a user will like an item.The prediction value of an item is calculated as the weighted average of all users’predictions for the item. Therefore, the correlation between profiles is used as weight.
2.7 Beyond the State of the Art
The methods for user profile extraction and item recommendations based on theseprofiles that are described in this thesis go beyond the current state of the art at least
23
in two areas: First, we tackle the problem of limited content analysis for multimediaitems. As described before capturing the topics of non-textual items automatically isstill difficult today and thus complicates the use of content-based systems in scenar-ios where such items have to be recommended. We investigate the use of metadataannotated by the user community for the extraction of contextualized user profilesin an Enterprise 2.0 platform thus being able to provide content-based recommenda-tions of items independent of their format. That way we can provide an alternativefor scenarios where collaborative filtering recommendations are problematic due tosparsity issues of the user-item rating matrix. In the second use case analyzing theusers’ music preferences, we made use of Linked Data2 to describe the artists a userprefers. Providing music recommendations based on manually annotated metadatahas been done successfully in recent years. Platforms such as Pandora3 have put ahuge amount of effort into the manual annotation of music items. Exploiting freelyavailable data from the Semantic Web could help to make recommendations basedon metadata descriptions of multimedia items cheaper and applicable for a largeramount of items.
Besides the annotation of items with community metadata, the second issue tack-led by our approach is the problem of overspecialization which is a major concernparticularly for content-based recommender systems that tend to recommend itemsfrom the user’s predominant interest topic mostly. By applying clustering algorithmson the profiles of a user’s preferred items we can identify groups (topics of interestand preferred music styles) that cover a broad range of the user’s preferences thusallowing us to improve the diversity of recommendation lists or to provide context-sensitive recommendations according to a user’s current needs and preferences.
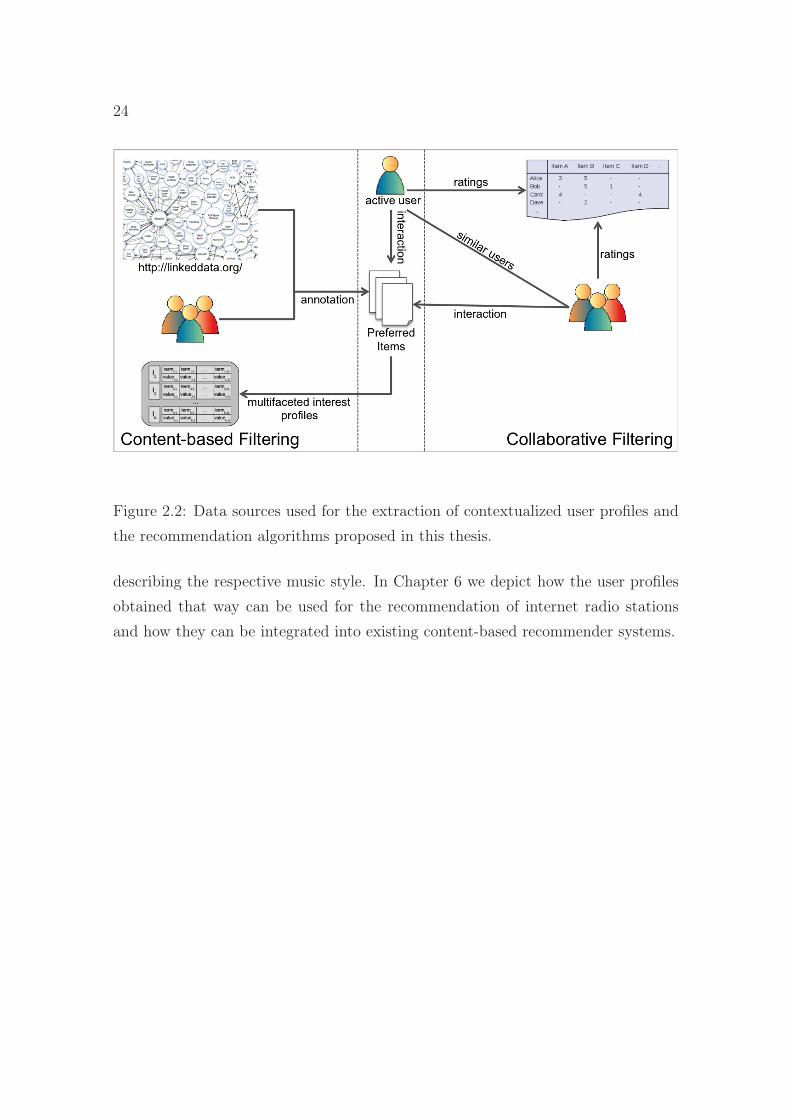
Figure 2.2 shows an overview of the data sources used for the extraction of the userprofiles and for the recommendation algorithms proposed in this thesis. In Chapter 5we present a switching hybrid recommender system providing collaborative filteringrecommendations for new users and content-based recommendations based on ourcontextualized user profiles for users that interacted with the system over a longerperiod of time. In this scenario the items are annotated by the users of the Enterprise2.0 platform. In the second scenario we describe a user’s preferred artists by makinguse of Linked Data. The artists are clustered and for each group a label is extracted
2http://linkeddata.org/3http://www.pandora.com
24
Figure 2.2: Data sources used for the extraction of contextualized user profiles andthe recommendation algorithms proposed in this thesis.
describing the respective music style. In Chapter 6 we depict how the user profilesobtained that way can be used for the recommendation of internet radio stationsand how they can be integrated into existing content-based recommender systems.
Chapter 3
The Web 3.0
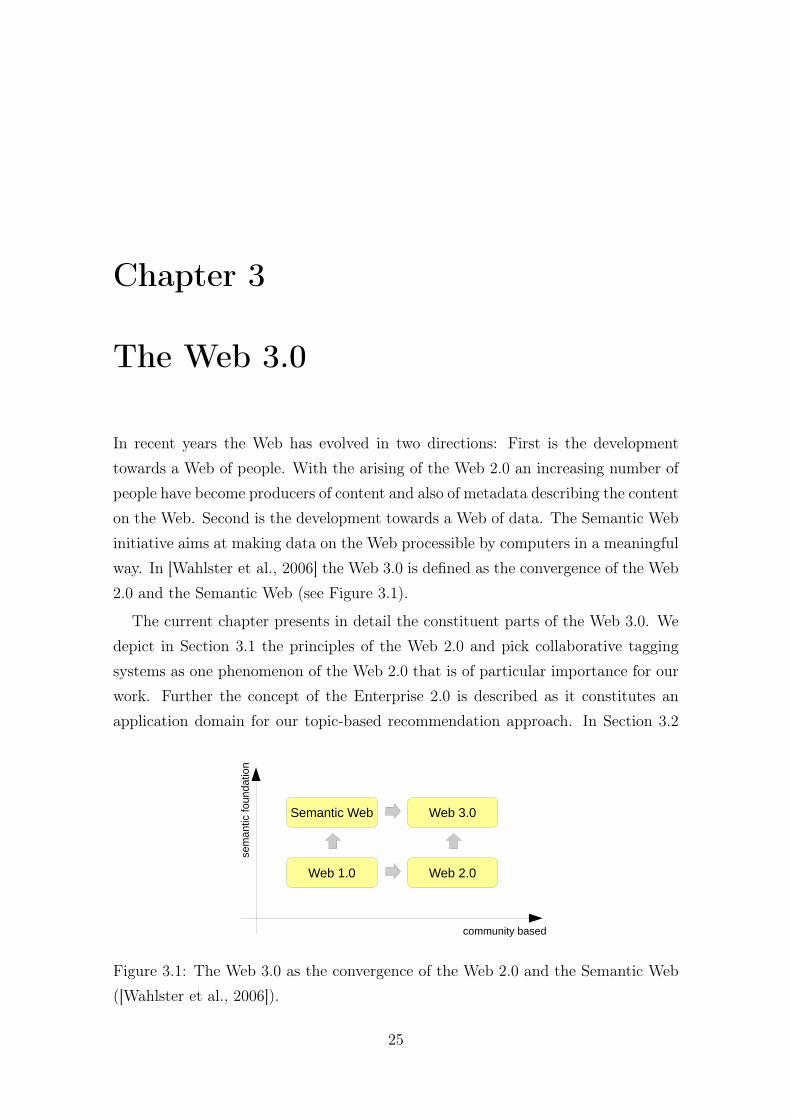
In recent years the Web has evolved in two directions: First is the developmenttowards a Web of people. With the arising of the Web 2.0 an increasing number ofpeople have become producers of content and also of metadata describing the contenton the Web. Second is the development towards a Web of data. The Semantic Webinitiative aims at making data on the Web processible by computers in a meaningfulway. In [Wahlster et al., 2006] the Web 3.0 is defined as the convergence of the Web2.0 and the Semantic Web (see Figure 3.1).
The current chapter presents in detail the constituent parts of the Web 3.0. Wedepict in Section 3.1 the principles of the Web 2.0 and pick collaborative taggingsystems as one phenomenon of the Web 2.0 that is of particular importance for ourwork. Further the concept of the Enterprise 2.0 is described as it constitutes anapplication domain for our topic-based recommendation approach. In Section 3.2
Web 1.0
Semantic Web Web 3.0
Web 2.0
se
ma
ntic f
oun
datio
n
community based
Figure 3.1: The Web 3.0 as the convergence of the Web 2.0 and the Semantic Web([Wahlster et al., 2006]).
25
26
we depict the characteristics of the Semantic Web and briefly introduce the conceptof Linked Data. Finally the convergence of the Web 2.0 and the Semantic Web inthe Social Semantic Web is described in Section 3.3.
3.1 The Web 2.0
A turning point for the Web was marked with the bursting of the dot-com bubblein the autumn of 2001. The Web was judged as overrated by many people, butbubbles and consequent shakeouts are typical features of all technological revolutions[O’Reilly, 2005b].
The concept of the Web 2.0 started with a conference brainstorming session be-tween O’Reilly and MediaLive International. As stated by Dale Dougherty, a Webpioneer and O’Reilly VP, the Web was far from having crashed. In contrast it wasmore important than ever. New applications and sites arose with a surprising regu-larity. It seemed that the companies that had survived the bursting of the dot-combubble had certain things in common. [O’Reilly, 2005a] gives the following definitionof the term Web 2.0:
“Web 2.0 is the network as platform, spanning all connected devices;Web 2.0 applications are those that make the most of the intrinsic ad-vantages of that platform: delivering software as a continually-updatedservice that gets better the more people use it, consuming and remixingdata from multiple sources, including individual users, while providingtheir own data and services in a form that allows remixing by others,creating network effects through an “architecture of participation,” andgoing beyond the page metaphor of Web 1.0 to deliver rich user experi-ences.”
According to [O’Reilly, 2005b] seven principles which are included in the abovedefinition and which characterize Web 2.0 applications will be presented subse-quently.
The Web As Platform Based on the example of Google the first principle shallbe explained. Google was started as a native Web application which was delivered asa service. The Web application itself was never packaged or sold and there were no
27
scheduled software releases. The Web application was just continuously improved.The application was never licensed, just used. For this reason the application didn’thave to be ported to different platforms so that customers could run the software ontheir own equipment. The application was run on a scalable collection of commodityPCs running open source operating systems in addition with homegrown applicationsand utilities which no one outside the company ever gets to see.
Harnessing Collective Intelligence The power of the Web to harness collectiveintelligence seems to be the central principle for those who survived the Web 1.0 eraand are leaders in the Web 2.0 era. Segaran states that collective intelligence is aboutdrawing new conclusions from independent contributors ([Segaran, 2007], page 2). Amajor difference between Amazon and competitors like Barnesandnoble.com is thatAmazon made a science of user engagement. They have much more user reviews,participation possibilities on almost every page, and they make use of user activitiesto produce better search results.
Much attention has been received by sites like Delicious1 which have pioneereda concept that is called “folksonomy”. The term stands for a style of collaborativecategorization of resources by making use of freely chosen keywords which are oftenreferred to as tags. The concept of folksonomies will be described in more detail inSection 3.1.1.
Data is the Next Intel Inside A specialized data base constitutes the backendof every current significant internet application. This makes data base managementa core competency of Web 2.0 companies. The importance of the data can againbe illustrated by making use of the example of Amazon.com. Amazon’s originaldata base came from the ISBN registry provider R. R. Bowker. In contrast to itscompetitors Amazon enhanced the data by adding publisher-supplied data (e. g.,cover images, table of contents, and sample material) and they further encouragedtheir users to annotate the data. By effectively embracing and extending their datasuppliers, Amazon became the primary source for bibliographic data on books, areference source for scholars, librarians, and consumers.
1Delicious is a social sharing platform for bookmarks. For further information see:http://delicious.com/.
28
End of the Software Release Cycle As described above, the software of theinternet era is delivered as a service and not as a product. Two points are importantfor this kind of software: First operations must be a core competency and thesoftware has to be maintained on a daily basis, otherwise it will cease to perform.For instance, Google has to crawl the Web in order to update its indices, filterout link spam and other attempts to influence its results continuously. It furtherhas to dynamically respond to hundreds of millions of user queries that must bematched with context-appropriate advertisements. Second it is important to treatusers as co-developers, i. e., monitoring of user behavior in order to observe whichnew features are used and how they are used. On this basis it can be decided whichfeatures are kept and which are dismissed.
Lightweight Programming Models Amazon provides its Web services in twoforms: The first adheres to the formalisms of the SOAP2 Web service stack, thesecond provides XML data over HTTP in a lightweight approach called REST.3
High value B2B connections (e. g., between Amazon and retail partner ToysRUs)usually make use of the SOAP stack, however Amazon reports a usage of 95% ofthe lightweight REST service.
Software Above the Level of Single Devices The Web 2.0 is no longer limitedto the PC platform. A good example of this principle is iTunes.4 With the PC actingas the local cache and control station the application reaches from the handhelddevice to a massive Web backend. Long time Microsoft developer Dave Stutz statedthat “useful software written above the level of the single device will command highmargins for a long time to come.”
2SOAP is a protocol intended for exchanging structured information in a decentralized, dis-tributed environment. For further information see: http://www.w3.org/TR/soap/.
3REST stands for Representational State Transfer and is an architectural style for distributedhypermedia systems. For further information see: http://www.ics.uci.edu/~fielding/pubs/
dissertation/fielding_dissertation.pdf.4iTunes is an application which enables its users to buy music, movies, TV shows, and
audiobooks, or download free podcasts from the iTunes Store. For further information see:http://www.apple.com/itunes/.
29
Rich User Experiences The potential of the Web to deliver full scale applica-tions hit the mainstream when Google introduced Gmail5 which is a free Webmailservice with a rich user interface and PC-equivalent interactivity. In order to realizeGmail Google made use of a collection of technologies known as Ajax6 which is akey component of the Web 2.0.
3.1.1 Collaborative Tagging Systems
With the arising of the Web 2.0 tagging systems have come up that allow their usersto share various kinds of content. Such content can either be already available on theWeb (e. g., Delicious and Diigo7 for bookmarks) or it can be uploaded by the users(e. g., Flickr8 for photos and YouTube9 for videos). When contributing resources tosuch systems, users usually enter tags (i. e., freely chosen keywords) to describe andclassify the content they provide thus improving the retrievability of resources forthemselves and also for other users.
Collaborative Tagging
In Wikipedia a tag is defined as
“a non-hierarchical keyword or term assigned to a piece of informa-tion (such as an internet bookmark, digital image, or computer file).This kind of metadata helps describe an item and allows it to befound again by browsing or searching. Tags are chosen informally andpersonally by the item’s creator or by its viewer, depending on thesystem.”[Wikipedia, 2008]
[Golder and Huberman, 2006] identify seven functions that tags perform forbookmarks:
• Identifying what (or who) it is about: The majority of tags identifies the topicsof bookmarked items.
5http://mail.google.com/6Ajax stands for Asynchronous JavaScript and XML and is a collection of several technologies.
For further information see: http://www.adaptivepath.com/publications/essays/archives/
000385.php.7http://www.diigo.com/8http://www.flickr.com/9http://www.youtube.com/
30
• Identifying what it is: Tags may describe the kind of thing a bookmarked itemis (e. g., an article, a blog, or a book).
• Identifying who owns it: Some tags describe who owns or created the book-marked content. With regard to the apparent popularity of blogs knowing thecontent ownership can be particularly important.
• Refining categories: Some tags do not establish categories themselves. Theyrather refine or qualify existing categories.
• Identifying qualities or characteristics: Users express their opinions aboutthe tagged content by assigning adjectives as tags such as scary, funny, orinspirational.
• Self reference: Some tags identify content in terms of its relation to the tagger.Such tags usually begin with “my” like, e. g., mystuff.
• Task organizing: In order to group information together that is related toperforming a task, the information may be tagged according to the task (e. g.,toread or jobsearch).
[Marlow et al., 2006] distinguish two high level categories that motivate people toannotate tags: Organizational practices rise from the use of tagging as an alternativeto structured filing. Social practices consider the communicative nature of tagging,i. e., users express themselves, their opinions, etc. through the tags they use. Thesecategories are then further refined as follows: Future retrieval of individual resourcesor collections of resources, contribution and sharing, attract attention to the ownresources, play and competition, e.g., in the ESP game,10 self presentation to writea user’s identity into the system (e.g., the “seen live” tag in Last.fm) and opinionexpression.
Folksonomies
The term Folksonomy was coined on July 24, 2004 by Thomas Vander Wal[Wal, 2007]. According to Vander Wal a
10In the ESP game two users see the same image and are asked to type in a tag for it. Whenthey agree on a tag, they move on and are awarded with points. The ESP game is available athttp://www.gwap.com/gwap/.
31
“Folksonomy is the result of personal free tagging of information andobjects (anything with a URL) for one’s own retrieval. The tagging isdone in a social environment (usually shared and open to others). Folk-sonomy is created from the act of tagging by the person consuming theinformation.”
Following [Hotho et al., 2006b] a folksonomy can formally be defined as follows:
Definition 1 (Folksonomy) A folksonomy is a tuple F := (U, T,R, Y ) where
• U , T , and R are finite sets (users, tags, and resources)
• Y is a ternary relation between them (i. e., the tag assignments),Y ⊆ U × T ×R
Equivalently the folksonomy can also be seen as a tripartite (undirected) hy-pergraph with G = (V,E), where V = U ∪T ∪R is the set of nodes and E =
{{u, t, r} |(u, t, r) ∈ Y } is the set of hyperedges.
Taxonomy of Design Options for Tagging Systems
[Marlow et al., 2006] present a taxonomy of tagging systems. They describe di-mensions of tagging systems and how the location of a system on the respectivedimension may impact the behavior of the system. It should also be noted thatsome of the dimensions interact, i. e., a decision along one of them determines (orat least can be correlated with) the system’s placement in another. This taxonomywill be depicted subsequently:
Tagging Rights Three types of tagging rights can be distinguished: With self-tagging users only tag their own resources. In the permission-based approach re-source contributors may specify who is allowed to tag their resources (e. g., friends,family, or contacts). The photo sharing platform Flickr is an example for such apermission-based system. In tagging systems that allow free-for-all tagging, everyuser is allowed to tag any resource. Analogously the rights to delete a resource maybe determined (no one, anyone, the tag creator, or the resource contributor/owner).The tagging rights influence the nature and type of the resultant tags as well as therole of the tags in the system. For instance the tags emerging in a free-for-all systemare normally broad both in the number of tags assigned and in the nature of thetags.
32
Tagging Support Three categories to configure the process of adding tags to aresource can be observed: With blind tagging a user can’t see the tags other usersassigned to the same resource during the tagging process. Viewable tagging allowsthe user to see the tags which are already associated with a resource. With suggestivetagging the system proposes possible tags which a user may take over to annotate aresource.
[Sen et al., 2006] analyzed the evolution of the vocabulary in tagging communitiesbased on community influence and personal tendency. In their experimental setupthey had four groups. To the “unshared group” no community tags were shown.The “shared group” could see the tags applied by other members of their group.To the “shared-pop group” the most frequent tags for a resource were shown andthe “shared-rec group” was presented with recommended tags that were annotatedoften for a resource or similar resources. The experiments indicate that viewing thecommunity tags has an indirect impact on the user’s tag applications by changingthe personal tendency.
It is assumed that suggestive tagging may lead to a quicker convergence of thefolksonomy, i. e., it supports the consolidation of the tag usage for a resource. How-ever it is still unclear whether this is a good thing. For instance, when a systemsuggests tags that have already been annotated for a resource, early tag assignmentsmight strongly influence the evolution of tags for a resource. Users might be de-tained to come up with their own ideas on how to tag a resource thus aggravatingthe process of harnessing collective intelligence.
In [Memmel et al., 2008] a prototypical implementation of a tag recommenderfor the ALOE system was introduced. As main sources for the generation of tagrecommendations information about the user (her tags, profile, the tags of her con-tacts, etc.), the system (e. g., existing tags in the system) and the resources (existingresource tags, content, etc.) were identified. A first evaluation showed that the pro-vided recommendations were perceived as helpful by the users of the system.
Aggregation Model A tagging system may support one of two aggregation mod-els: First there is the bag-model which allows duplicate tags for the same resourcefrom different users. Such a model is implemented in the Delicious system. Thecollective opinions of the taggers can be displayed in aggregated statistics for eachresource. The tag data gathered that way may serve to more accurately find rela-
33
tionships between users, tags, and resources. Second there is the set-model wherethe users are asked to collectively tag an individual resource. Repetition of tags bydifferent users is not allowed in this model. A set-model approach is implementedin the platforms Flickr and YouTube.
Object type There are tagging systems for a multitude of resource types. Anyobject that can be virtually represented can also be tagged. Besides the well knownexamples for photos, videos, bookmarks, and songs there are systems that allow thetagging of bibliographic material (e. g., CiteULike11 or BibSonomy12), blog posts(Technorati13), architectural content (MACE14), and so forth. It is assumed thatthe type of object has implications for the nature and type of the tags being used,however, to our best knowledge this assumption has not been empirically tested,yet.
Source of Material Resources in a tagging system can stem from differentsources. They can either be uploaded by the participants (e. g., Flickr, YouTube)or may be provided by the system (e. g., Last.fm). Some systems are also open forany resource which is available on the Web (e. g., Delicious, Digg15). The source ofmaterial may be restricted by the system architecture or through social norms (e. g.,CiteULike).
Resource Connectivity Independent of the user tags, resources can be connectedin different ways. For instance, Web pages are connected by direct links and manytagging systems allow the sharing of resources to groups. Such connections mayhave an impact on the convergence of tags for the affected resources, in particularin suggested or viewable scenarios.
Social Connectivity Just like resources also users of tagging systems may beconnected. Links are either directed (i. e., a connection between users is not nec-essarily symmetric) or undirected and some systems even allow typed links (e. g.,
11http://www.citeulike.org/12http://www.bibsonomy.org/13http://technorati.com/14http://www.mace-project.eu/15http://digg.com/
34
contacts/friends in Flickr). The connection of users may possibly lead to an adoptionof localized folksonomies that is based on the social structure in the system.
Subsequently we will present how technologies that are successful on the Web 2.0may be deployed in enterprise scenarios to support harnessing collective intelligenceand knowledge sharing between employees.
3.1.2 The Enterprise 2.0
McAffee spotted the potential of Web 2.0 technologies to foster the knowledgetransfer in companies. He introduced the concept of the Enterprise 2.0 as a col-lection of Web 2.0 technologies for generating, sharing, and refining information[McAfee, 2006]. Companies can buy or build these technologies in order to un-cover the practices and outputs of their knowledge workers. His proposed SLATESframework consists of the following six components:
• Search: McAfee cites a Forrester study [Morris et al., 2005] which revealedthat less than 50% of the intranet users reported to find the content theywere looking for. Searches on the internet however are more likely to lead tosuccessful search experiences (87%). This indicates that besides good intranetpage layouts and navigation aids, there is a demand for improved keywordsearch on many platforms.
• Links: Google showed that the exploitation of the link structure betweenWeb pages can significantly improve search results ranking. Intranets couldalso profit from this approach however it requires that many people can addlinks, not only the small group of people that develop the portal.
• Authoring: The example of Wikipedia has shown that group authorship canhave convergent, high-quality content as output. In enterprises blogs and wikisshould enable every staff member to share knowledge, insights, experiences,and the like.
• Tags: Besides improved keyword search, the study found that staff memberswould appreciate an improved categorization of content. Web 2.0 resourcesharing platforms usually collect a large amount of resources and outsourcethe process of categorization (tagging) to their users. In enterprise platformsthis could reveal patterns and processes in knowledge work by means of social
35
navigation (see which tags the colleagues used, which pages they visited, andso on).
• Extensions: Often tagging is extended by automating categorization and pat-tern matching. Recommender systems serve as a well-known example. Basedon the preferences a user expressed in the past, they recommend resourceswith similar content, resources that are preferred by the user’s peers and thelike.
• Signals: Checking the intranet for new content of a certain topic regularly isa tedious task. Feed technologies such as RSS and Atom can be used to informthe users of new content matching their topics of interest automatically.
So far we described the constituent parts of the Web of people and an applicationdomain of Web 2.0 technologies in the enterprise. This is particularly relevant for ourfirst use case targeting topic-based resource recommendations that was developedfor an Enterprise 2.0 resource sharing platform. The algorithm uses social metadatasuch as tags and titles to obtain resource descriptions which are used to extract auser’s topics of interest as well as for the retrieval of resources matching particularinterest topics. We will now go on to describe the principles of the Web of data.
3.2 The Semantic Web
The Semantic Web is an initiative of the World Wide Web Consortium (W3C). Itaims at presenting information on the Web in a way so that it can be processed bycomputers in a meaningful way. The main concepts of the Semantic Web will bedescribed according to [Berners-Lee et al., 2001] subsequently.
Expressing Meaning Nowadays, the content of the Web is designed to be readby humans, not to be processed by computer programs meaningfully. The SemanticWeb aims to bring a meaningful structure to the content of Web pages, that waycreating an environment in which software agents that roam from page to page cancarry out sophisticated tasks for users. It is an extension of the current Web, givingwell-defined meaning to information in order to improve the cooperation betweenpeople and computers.
36
Knowledge Representation To make the Semantic Web function, it is necessarythat computers have access to structured collections of information as well as setsof inference rules that can be exploited for automated reasoning. A fundamentaltechnology for developing the Semantic Web is the Resource Description Framework(RDF).16 RDF encodes meaning in sets of triples (like subject, verb, and object).The triples can be written using XML tags. With RDF, a document asserts thatcertain things, such as people, Web pages, etc., have properties (e. g., “is a sister of”,“is the author of”) with specific values (e. g., another person). Subjects, predicates,and objects are identified by Universal Resource Identifiers (URIs). The use of URIsallows everybody to define a new concept or verb by simply defining a URI for it onthe Web.
Ontologies In [Wikipedia, 2009] the term ontology is defined as follows:
“Ontology [...] is the philosophical study of the nature of being, existenceor reality in general, as well as of the basic categories of being and theirrelations.”
In Artificial Intelligence an ontology is usually understood as an explicit specifica-tion of a conceptualization in which shared knowledge is represented [Gruber, 1993].Typically it consists of a taxonomy and a set of inference rules. A taxonomy is a def-inition of classes of objects together with the relations among them, e. g., an addressmay be modeled as a type of location, city codes may be modeled to apply only tolocations, etc. Inference rules help to deduce further information from the ontology.For instance, a city code is associated with a state code and an address uses that citycode. From this it follows that the address has the associated state code. Ontologiescan be used, e. g., to improve the accuracy of Web searches. Instead of searchingfor ambiguous keywords, search programs can look for pages referring to a preciseconcept. Ontologies providing equivalence relations can help to resolve the problemof different URIs referring to a common concept.
Agents The potential of the Semantic Web will surface when programs are cre-ated that collect Web content from different sources, process the information, andexchange it with other programs. Some example applications will be pointed outsubsequently:
16http://www.w3.org/RDF/
37
• Proofs, e. g., verification that a person is the one you were looking for.
• Digital signatures which can be used to verify automatically that some infor-mation has been provided by a specific trusted source.
• Service discovery, requires a description of the service that lets agents un-derstand the function provided by the service as well as the way how to useit.
Evolution of Knowledge Besides developing tools for specific tasks, theSemantic Web can assist the evolution of human knowledge. The Semantic Webenables everybody to express new concepts by just naming them with a URI. Theseconcepts can then be progressively linked into a universal Web, that way openingup the knowledge of humans for meaningful analysis by software agents. On thisbasis new tools can be developed which support people to live, work, and learntogether.
To approach the vision of the Semantic Web the first step is to publish datathat can be naturally understood by machines ([Berners-Lee and Fischetti, 2000],p. 177). Linked Data17 is the means by which the Semantic Web can be realized[Bizer et al., 2009]. In [Wikipedia, 2010a] Linked Data is described as a method ofexposing, sharing, and connecting data via URIs on the Web. [Berners-Lee, 2009]defines four Linked Data principles as follows:
1. Use URIs in order to name things.
2. HTTP URIs should be used thus enabling the look up of these names.
3. For agents that look up a URI, useful information should be provided accordingto standards such as RDF or SPARQL.18
4. Include links to other URIs, so that agents can discover more things.
17http://linkeddata.org/18SPARQL is an RDF query language. For further information see: http://www.w3.org/TR/
rdf-sparql-query/.
38
In January 2007 the Linking Open Data project was founded with the goal tobootstrap the Web of data. Supported by the W3C Semantic Web Education andOutreach Group19 the initiative identifies existing data sets under open licenses,converts them to RDF according to the afore mentioned Linked Data principles andpublishes them on the Web. Figure 3.2 presents a diagram of the Linking OpenData cloud of published data sets as well as the interlinkage between them. Thecontent of the cloud is diverse comprising domains such as geographic locations,people, companies, books, scientific publications, movies, drugs and clinical trials,and many more [Bizer et al., 2009].
We use Linked Data for our second use case aiming at mood-based music recom-mendations. Here metadata from the Linking Open Data cloud is used to describethe artists a user listens to in terms of genres, instruments, etc. That way we iden-tify groups of artists that represent a user’s different preferred styles of music. Inthe last part of this chapter we will describe the convergence of the Web 2.0 and theSemantic Web into the Social Semantic Web.
3.3 The Social Semantic Web
[Weller, 2010] points at a trend that has been observed by several researchers inrecent years, namely the influence of the Web 2.0 on the Semantic Web (e. g.,[Ankolekar et al., 2007, Wahlster et al., 2006]). The convergence of the Social andthe Semantic Web is often referred to as the Social Semantic Web or the Web 3.0. Inher argumentation Weller cites the editorial by [Greaves and Mika, 2008] where theauthors state that both the Web 2.0 and the Semantic Web have the common con-cept of “socially shared meaning”. It is assumed that the Social Semantic Web willbe an application area for Semantic Web technologies with the Social Web on theone hand, where value is created by aggregating the contributions of many individ-ual users and the Semantic Web on the other hand integrating structured data frommany different sources. Example applications of the Social Semantic Web comprise:
Semantically Interlinked Communities Here we want to briefly present twoSemantic Web initiatives that aim at capturing social networks (e. g., people,
19http://www.w3.org/2001/sw/sweo/
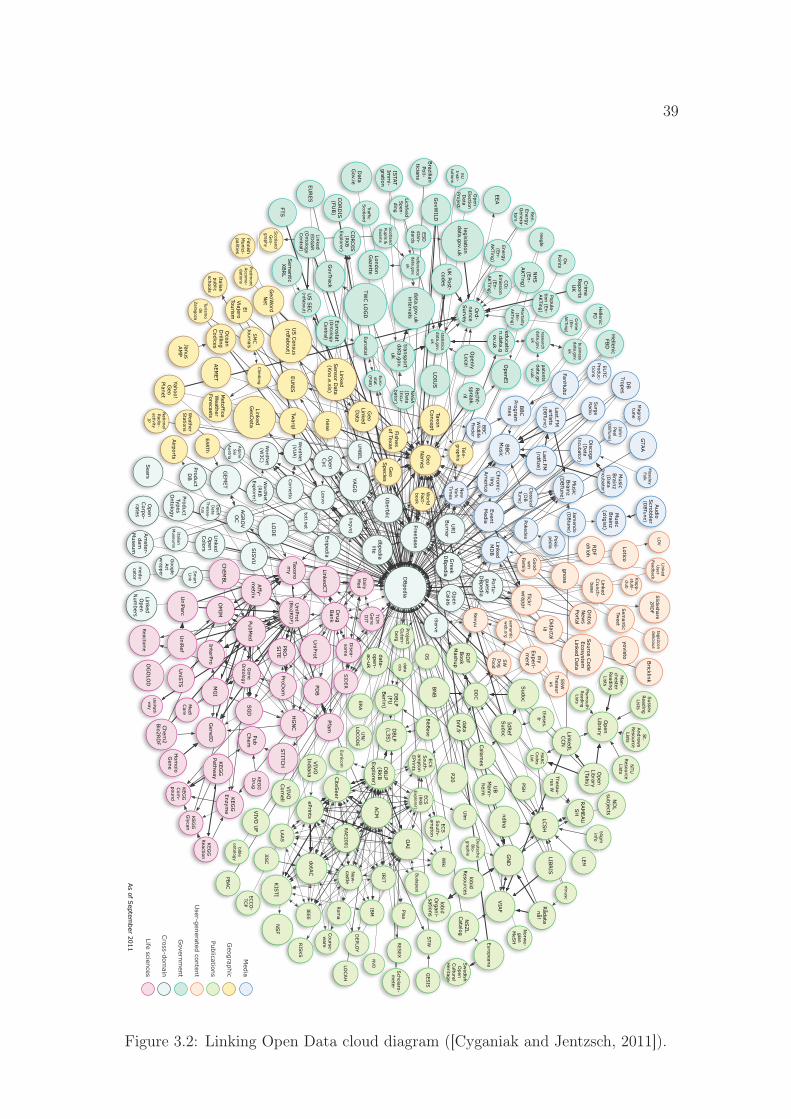
39
As of S
eptember 2011
Music
Brainz
(zitgist)
P20
Turismo
de Zaragoza
yovisto
Yahoo! G
eoPlanet
YAG
O
World
Fact-book
El Viajero
Tourism
WordN
et (W
3C)
WordN
et (V
UA)
VIV
O U
F
VIV
O
Indiana
VIV
O
Cornell
VIA
F
URI
Burner
Sussex
Reading Lists
Plymouth
Reading Lists
UniR
ef
UniProt
UM
BEL
UK Post-
codes
legislationdata.gov.uk
Uberblic
UB
Mann-
heim
TWC LO
GD
Twarql
transportdata.gov.
uk
Traffic Scotland
theses.fr
Thesau-rus W
totl.net
Tele-graphis
TCM
Gene
DIT
TaxonConcept
Open
Library (Talis)
tags2con delicious
t4gminfo
Sw
edish O
pen Cultural
Heritage
Surge
Radio
Sudoc
STW
RAM
EAU
SH
statisticsdata.gov.
uk
St.
Andrew
s Resource Lists
ECS
South-
ampton
EPrints
SSW
Thesaur
us
Sm
artLink
Slideshare2R
DF
semantic
web.org
Sem
anticTw
eet
Sem
antic XBRL
SW
Dog
Food
Source C
ode Ecosystem
Linked D
ata
US S
EC
(rdfabout)
Sears
Scotland G
eo-graphy
Scotland
Pupils &Exam
s
Scholaro-m
eter
WordN
et (R
KB
Explorer)
Wiki
UN
/LO
CO
DE
Ulm
ECS
(RKB
Explorer)
Rom
a
RIS
KS
RES
EX
RAE2001
Pisa
OS
OAI
NSF
New
-castle
LAAS
KIS
TI
JISC
IRIT
IEEE
IBM
Eurécom
ERA
ePrintsdotA
C
DEPLO
Y
DBLP
(RKB
Explorer)
Crim
e Reports U
K
Course-w
are
CO
RD
IS
(RKB
Explorer)CiteS
eer
Budapest
ACM
riese
Revyu
researchdata.gov.
ukRen.
Energy G
enera-tors
referencedata.gov.
uk
Recht-
spraak.nl
RD
Fohloh
Last.FM
(rdfize)
RD
F Book
Mashup
Rådata nå!
PSH
Product Types
Ontology
ProductD
B
PBAC
Poké-pédia
patentsdata.go
v.uk
Ox
Points
Ord-
nance Survey
Openly Local
Open
Library
Open
Cyc
Open
Corpo-rates
Open
Calais
OpenEI
Open
Election D
ata Project
Open
Data
Thesau-rus
Ontos
New
s Portal
OG
OLO
D
JanusAM
P
Ocean
Drilling
Codices
New
York
Times
NVD
ntnusc
NTU
Resource Lists
Norw
e-gian
MeS
H
ND
L subjectsndlna
my
Experi-m
ent
Italian M
useums
medu-
cator
MARC
Codes List
Man-
chester Reading Lists
Lotico
Weather
Stations
London G
azette
LOIU
S
Linked O
pen Colors
lobidResources
lobidO
rgani-sations
LEM
LinkedM
DB
LinkedLCCN
LinkedG
eoData
LinkedCT
LinkedU
serFeedback
LOV
Linked O
pen N
umbers
LOD
E
Eurostat (O
ntologyCentral)
Linked ED
GAR
(Ontology
Central)
Linked Crunch-base
lingvoj
Lichfield Spen-ding
LIBRIS
Lexvo
LCSH
DBLP
(L3S)
Linked Sensor D
ata (K
no.e.sis)
Klapp-
stuhl-club
Good-w
in Fam
ily
National Radio-
activity JP
Jamendo
(DBtune)
Italian public
schools
ISTAT
Imm
i-gration
iServe
IdRef
Sudoc
NSZL
Catalog
Hellenic PD
Hellenic FB
D
Piedmont
Accom
o-dations
GovTrack
GovW
ILD
GoogleArt
wrapper
gnoss
GES
IS
GeoW
ordN
et
Geo
Species
Geo
Nam
es
Geo
LinkedD
ata
GEM
ET
GTA
A
STITC
H
SID
ER
Project G
uten-berg
Medi
Care
Euro-stat
(FUB)
EURES
Drug
Bank
Disea-
some
DBLP
(FU
Berlin)
Daily
Med
CO
RD
IS(FU
B)
Freebase
flickr w
rappr
Fishes of Texas
Finnish M
unici-palities
ChEM
BL
FanHubz
EventM
edia
EUTC
Produc-
tions
Eurostat
Europeana
EUN
IS
EU
Insti-tutions
ESD
stan-dards
EARTh
Enipedia
Popula-tion (En-AKTing)
NH
S(En-
AKTing)
Mortality(En-
AKTing)
Energy (En-
AKTing)
Crim
e(En-
AKTing)
CO
2 Em
ission(En-
AKTing)
EEA
SIS
VU
education.data.g
ov.uk
ECS
South-
ampton
ECCO
-TC
P
GN
D
Didactal
ia
DD
CD
eutsche Bio-
graphie
datadcs
Music
Brainz
(DBTune)
Magna-tune
John Peel
(DBTune)
Classical (D
BTune) A
udioScrobbler
(DBTune)
Last.FM
artists (D
BTune)
DB
Tropes
Portu-guese
DBpedia
dbpedia lite
Greek
DBpedia
DBpedia
data-open-ac-uk
SM
CJournals
Pokedex
Airports
NASA
(Data
Incu-bator)
Music
Brainz
(Data
Incubator)
Moseley Folk
Metoffice
Weather
Forecasts
Discogs (D
ata Incubator)
Clim
bing
data.gov.uk intervals
Data
Gov.ie
databnf.fr
Cornetto
reegle
Chronic-ling
Am
erica
Chem
2Bio2R
DF C
alames
businessdata.gov.
uk
Bricklink
Brazilian Poli-
ticians
BN
B
UniS
TS
UniPathw
ay
UniParc
Taxonom
yU
niProt(B
io2RD
F)
SG
D
Reactom
e
PubMed
PubChem
PRO
-SITE
ProDom
Pfam
PDB
OM
IMM
GI
KEG
G
Reaction
KEG
G
Pathway
KEG
G
Glycan
KEG
G
Enzyme
KEG
G
DrugK
EGG
Com
-pound
InterPro
Hom
oloG
ene
HG
NC
Gene
Ontology
GeneID
Affy-
metrix
bible ontology
BibB
ase
FTS
BBC
Wildlife
Finder
BBC
Programm
esBBC
Music
Alpine Ski
Austria
LOCAH
Am
ster-dam
M
useum
AG
RO
VO
C
AEM
ET
US C
ensus (rdfabout)
Media
Geographic
Publications
Governm
ent
Cross-dom
ain
Life sciences
User-generated content
Figure 3.2: Linking Open Data cloud diagram ([Cyganiak and Jentzsch, 2011]).
40
projects, and events). Friend of a Friend (FOAF20) is the most popular such project.It was created in 2000 by Dan Brickley and Libby Miller as an experimental linkedinformation project. Its goal is described on the website as “creating a Web ofmachine-readable pages describing people, the links between them and the thingsthey create and do.” Further the SIOC21 (Semantically-Interlinked Online Com-munities) project is intended to integrate online community information. It offersan ontology thus enabling the representation of data from the Social Web in RDFformat. SIOC is often used together with the FOAF vocabulary and has become astandard way to express user-generated content from Web 2.0 platforms.
Semantic Wikis A wiki is a platform allowing the easy creation and editing ofinterlinked Web pages via a browser either by using a simplified markup languageor by making use of a WYSIWYG editor [Wikipedia, 2010e]. Application domainscomprise community websites, personal note taking, and knowledge managementsystems in enterprises. The first wiki software was developed by Ward Cunningham.Semantic wikis such as the Kaukolu semantic wiki component [van Elst et al., 2008]and the Semantic MediaWiki [Krötzsch et al., 2006] add semantic annotations towiki pages (such as categories, relations, and attributes in the Semantic MediaWiki)thus enabling
• consistency of content as information has to be stored only once and can beloaded to different pages,
• accessing knowledge in a structured way, e. g., “find all female physicists”, and
• reusing knowledge in other tools, e. g., media players.
Linking Open Data Also the Linking Open Data project as described in Section3.2 can be seen as an application domain of the Social Semantic Web representing(social) data and metadata in a structured way by making use of techniques suchas RDF (e. g., in the DBpedia22 project structured information is extracted fromWikipedia and made available on the Web).
20http://www.foaf-project.org/21http://sioc-project.org/22http://dbpedia.org/
Chapter 4
Background - The ALOE System
ALOE is an Enterprise 2.0 resource sharing platform designed for content of arbi-trary format ([Memmel and Schirru, 2007]). It enables knowledge workers to sharefiles and bookmarks according to their topics of interest hence making it an appro-priate use case for our topic-based resource recommendation algorithm. The systemhas been deployed at the Knowledge Management department of the German Re-search Center for Artificial Intelligence.
This chapter starts with an overview of the basic functionalities of the ALOEsystem in Section 4.1. In Section 4.2 the system is classified according to the designoptions taxonomy for tagging systems proposed by [Marlow et al., 2006]. Then wedepict in Section 4.3 the metadata that is annotated for resources in ALOE and howthe system harnesses collective intelligence to obtain appropriate resource descrip-tions. Finally, Section 4.4 describes the conference organization system C-LINKthat was built on top of the ALOE platform. In C-LINK we implemented the firstrecommender system for ALOE.
4.1 Basic Functionalities
The ALOE system supports sharing of bookmarks and all kinds of files (images,audio, video, office documents, etc.). It provides tagging, commenting, and rat-ing functionalities. Search facilities are offered that provide ranking options takinginto account the usage of resources (such as most viewed, highest rated, most com-mented).
In order to meet the users’ privacy needs three access levels have been imple-
41
42
mented. When contributing resources to the ALOE system, users have to chooseone of three visibility options: Resources contributed with visibility public are vis-ible for every user of the system. Resources with closed group visibility (see nextparagraph) can only be retrieved and accessed by members of the respective group.Resources that are contributed with visibility private are only accessible by thecontributor herself.
We realized a group concept that enables users to contact and exchange resourceswith other users that share similar topics of interest. Currently there are two differ-ent types of groups: open groups can be joined by any registered user of the system.Resources posted to such groups as well as the members of the groups are publiclyvisible. The membership in closed groups requires an authorization by the admin-istrator of the respective group. Resources posted to such groups as well as groupmembers are only visible for users that are themselves a member in the group.
While groups allow for a collaborative association of thematically related re-sources the concept of collections has been implemented to provide a further pos-sibility for the personal organization of resources. Users can create collections ac-cording to different topics and share resources to them. Collections also allow forsocial browsing as users may navigate through the collections of other users. Fur-ther ALOE provides facilities to manage contact lists of users and it has a messagingfunctionality to easily enable users to contact each other.
4.2 System Design Options
Subsequently we will classify the ALOE system according to the taxonomy for tag-ging systems by [Marlow et al., 2006] as introduced in Chapter 3.1.1.
Tagging Rights ALOE follows the self-tagging approach in which users may onlytag their own resources. However users can add resources that are already registeredin the system to their portfolio. That way multiple users may “own” the sameresource and add metadata to it thus enabling an extensive description of eachresource.
Tagging Support In ALOE a combination of viewable tagging and suggestivetagging has been implemented. Users annotate tags when contributing a resource
43
to the system. They may later also add tags on the detail view page of the re-source (see Figure 4.1). Here the tags that have already been annotated for theresource are visible. Further the process of adding tags is supported by providingtag recommendations ([Memmel et al., 2008]).
Aggregation Model A bag-model for tag assignments has been implemented inthe ALOE systems, i. e., one tag may be assigned by different users for the sameresource. For each resource a tag cloud is displayed that shows the aggregated tagassignments.
Object Type ALOE is open for potentially all kinds of objects. The users maycontribute bookmarks to the system or upload file resources.
Source of Material In ALOE the source of material is either the Web or thecompany’s intranet (in the case when users contribute bookmarks to the system) orit is the participants (in the case when users upload files).
Resource Connectivity Besides connecting resources by tags, they can also beconnected by sharing them to a common group or collection. The resources of agroup or collection are presented in a list that can be ranked according to differentcriteria such as contribution date, average rating, or the resource titles.
Social Connectivity Users of the ALOE system are connected by
• Contact lists: A user can add another user to her contacts. The connection isdirected and not necessarily symmetric.
• Groups: Users may also share group memberships. Every member of a groupcan easily see which other users are members of the group and contact thosemembers with messages either individually or all members of the group atonce.
4.3 Resource Metadata
In order to make resources easily retrievable they are annotated with metadata pro-vided by the community of users and with automatically generated metadata. In
44
ALOE we normalize URLs of bookmarks and represent each URL only once pervisibility in the system, i. e., once public, once for each closed group contribution,and once for every private contribution However, each user can contribute a newinstance of such a bookmark by adding it to her portfolio. During the contributionprocess she annotates a title and tags. Optionally a description, author, and licens-ing information may also be added. Further, we have system-generated metadata forevery unique resource (an identifier, its format, and visibility) and system-generatedmetadata for every contribution (the identifier of the contributor and the contribu-tion date). For file resources duplicates are currently not identified, i. e., each file istreated as a unique resource. Table 4.1 provides an overview of the ALOE resourcemetadata grouped according to the different metadata types.
The ALOE system supports resource contributions for a variety of content types.Users can either contribute bookmarks to the system or upload files such as officedocuments, images, audio, and video. Even though automatic approaches to analyzethe content of images and videos are currently investigated (e. g., [Ulges et al., 2009]for videos and [Duan et al., 2009] for images), it is still difficult to extract a tex-tual representation of these resources today. Exploiting tags from different usersto collaboratively classify a resource has been described in Section 3.1.1 before.Concerning bibliographic metadata such as the title or the creator of a resource[Downes, 2003] states that this should be first party metadata, i. e., metadata pro-vided by the resource author or a proxy (e. g., her company). However in ALOE suchmetadata is not inevitably available as the resource contributor is not necessarilythe author of the resource. For that purpose we aim at harnessing the users’ collec-tive intelligence (see Section 3.1) by aggregating their metadata to obtain a properdescription of the resources. In [Li et al., 2008] it was shown that social metadatais likely to describe the content of resources appropriately. So we decided to exploitthe users’ annotations to capture the content of the resources in the system. Figure4.1 shows the ALOE details page for a resource. Selected metadata fields such astitle (1), description (2), and tags (3) have been highlighted.
4.4 The C-LINK System
The idea to automatically extract a user’s different topics of interest has risen fromthe experiences we made in the C-LINK project in 2008. The C-LINK system is a
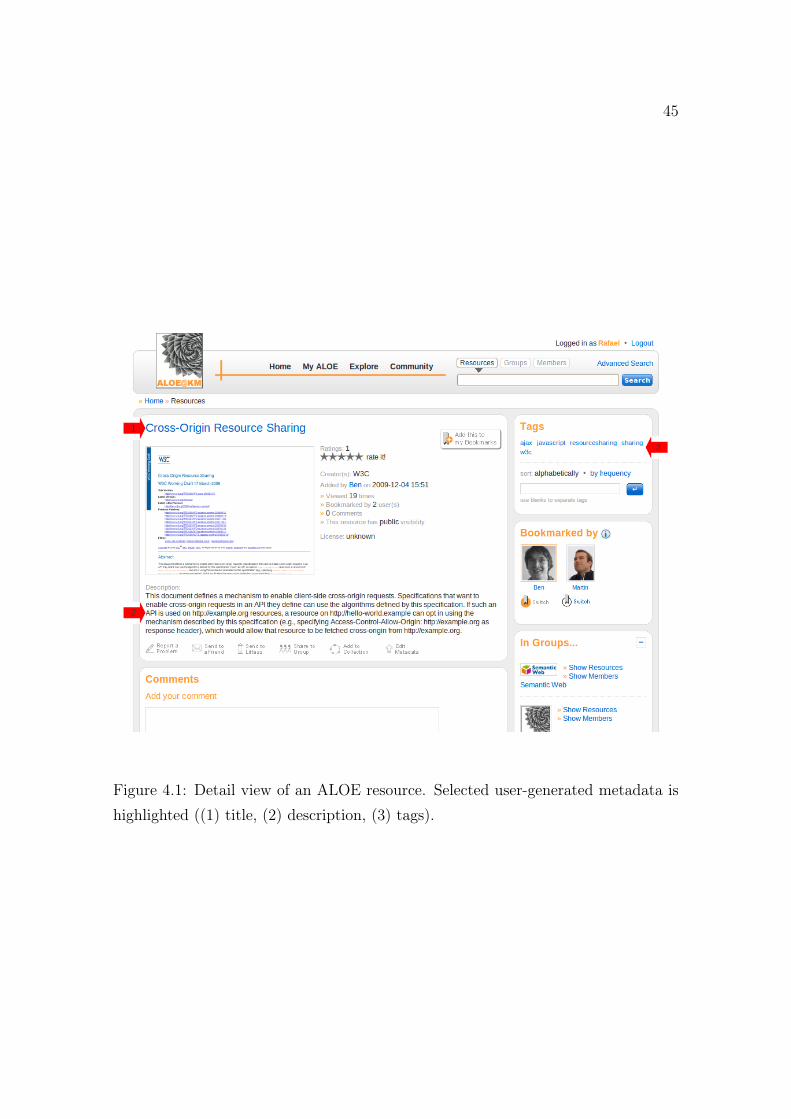
45
Figure 4.1: Detail view of an ALOE resource. Selected user-generated metadata ishighlighted ((1) title, (2) description, (3) tags).
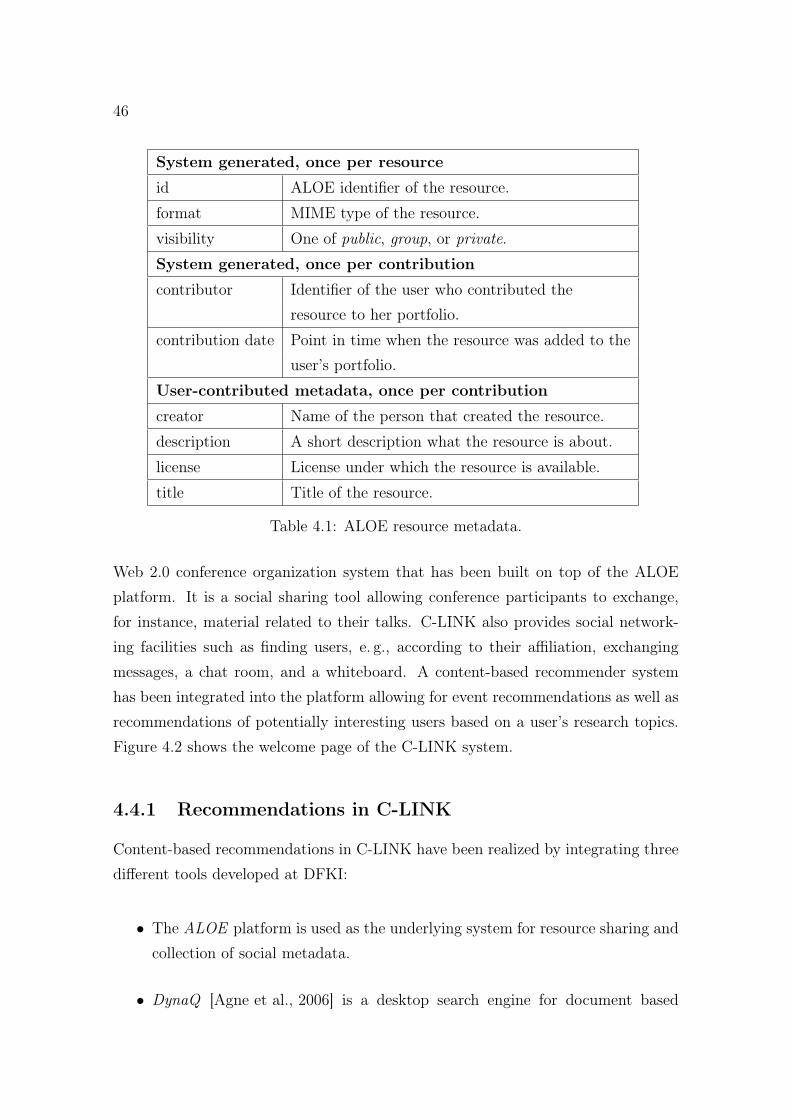
46
System generated, once per resource
id ALOE identifier of the resource.
format MIME type of the resource.
visibility One of public, group, or private.
System generated, once per contribution
contributor Identifier of the user who contributed theresource to her portfolio.
contribution date Point in time when the resource was added to theuser’s portfolio.
User-contributed metadata, once per contribution
creator Name of the person that created the resource.
description A short description what the resource is about.
license License under which the resource is available.
title Title of the resource.
Table 4.1: ALOE resource metadata.
Web 2.0 conference organization system that has been built on top of the ALOEplatform. It is a social sharing tool allowing conference participants to exchange,for instance, material related to their talks. C-LINK also provides social network-ing facilities such as finding users, e. g., according to their affiliation, exchangingmessages, a chat room, and a whiteboard. A content-based recommender systemhas been integrated into the platform allowing for event recommendations as well asrecommendations of potentially interesting users based on a user’s research topics.Figure 4.2 shows the welcome page of the C-LINK system.
4.4.1 Recommendations in C-LINK
Content-based recommendations in C-LINK have been realized by integrating threedifferent tools developed at DFKI:
• The ALOE platform is used as the underlying system for resource sharing andcollection of social metadata.
• DynaQ [Agne et al., 2006] is a desktop search engine for document based
47
Figure 4.2: Welcome page of the C-LINK system.
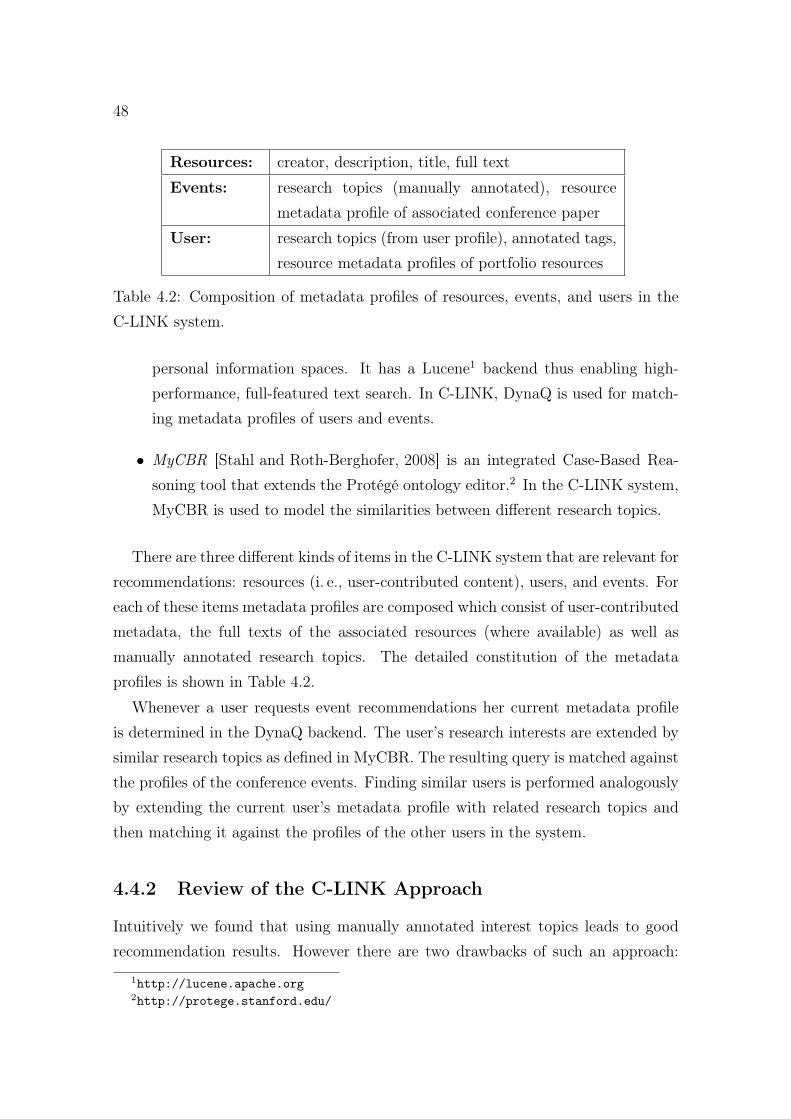
48
Resources: creator, description, title, full text
Events: research topics (manually annotated), resourcemetadata profile of associated conference paper
User: research topics (from user profile), annotated tags,resource metadata profiles of portfolio resources
Table 4.2: Composition of metadata profiles of resources, events, and users in theC-LINK system.
personal information spaces. It has a Lucene1 backend thus enabling high-performance, full-featured text search. In C-LINK, DynaQ is used for match-ing metadata profiles of users and events.
• MyCBR [Stahl and Roth-Berghofer, 2008] is an integrated Case-Based Rea-soning tool that extends the Protégé ontology editor.2 In the C-LINK system,MyCBR is used to model the similarities between different research topics.
There are three different kinds of items in the C-LINK system that are relevant forrecommendations: resources (i. e., user-contributed content), users, and events. Foreach of these items metadata profiles are composed which consist of user-contributedmetadata, the full texts of the associated resources (where available) as well asmanually annotated research topics. The detailed constitution of the metadataprofiles is shown in Table 4.2.
Whenever a user requests event recommendations her current metadata profileis determined in the DynaQ backend. The user’s research interests are extended bysimilar research topics as defined in MyCBR. The resulting query is matched againstthe profiles of the conference events. Finding similar users is performed analogouslyby extending the current user’s metadata profile with related research topics andthen matching it against the profiles of the other users in the system.
4.4.2 Review of the C-LINK Approach
Intuitively we found that using manually annotated interest topics leads to goodrecommendation results. However there are two drawbacks of such an approach:
1http://lucene.apache.org2http://protege.stanford.edu/
49
First, a domain taxonomy of topics might not be available for every resource shar-ing platform. In our ALOE system, the users share resources according to theirresearch interests, about software development, but also about topics in which theyare interested privately. Setting up a domain taxonomy for such an open world sce-nario might not always be feasible. Second, it is widely recognized that the successof resource sharing platforms is among others based on their ease of use. Requiringthe users to annotate resources with concepts from a taxonomy aggravates the con-tribution process and might hinder the usage of the system. For these reasons weaim at an approach that captures the interest topics of the users unobtrusively as aside effect of the normal usage of the system.

50

Part II
Approach
51

Chapter 5
Providing Topic-based Resource
Recommendations
The approach described in this chapter aims at providing topic-based recommenda-tions in Enterprise 2.0 resource sharing platforms taking into account a knowledgeworker’s different topics of interest. Usually in enterprise platforms the amount ofresources is much larger than the amount of users thus aggravating the sparsityproblems of traditional collaborative filtering systems (see Chapter 2.3). Collab-orative filtering is in general not well suited to provide access to the long tail ofresources. However it can provide high quality recommendations of popular items([Celma, 2008]). In [Herlocker et al., 2004] it was argued that this can increase auser’s trust in a recommender system which is particularly important for new users.According to our conviction only content-based recommender systems can provideaccess to the long tail of resources in scenarios where sparsity of the user-item ratingmatrix is an issue. Hence, we propose a switching hybrid recommender system thatgenerates traditional item-based collaborative filtering recommendations for newusers and provides content-based recommendations with a high degree of inter-topicdiversity as soon as enough information about the user’s preferences is available.
The remainder of this chapter is structured as follows: In Section 5.1 we presentways to elicit preferences for items and show how it is done in the ALOE system.Next, in Section 5.2 we introduce the concept of contextualized user interest profilesfacilitating topic-based recommendations. The overall process for recommendationgeneration is depicted in detail in Section 5.3. Finally, we present related work inthe fields of topic extraction and user interests identification in Section 5.4.
53
54
5.1 Eliciting Preferences for Items
Recommender systems need to learn about the users’ preferences in order to providethem with useful recommendations. There are two possibilities to capture thesepreferences: First, users can be asked to rate items explicitly on a predefined scale.Second, user preferences can be inferred implicitly by observing the user’s interactionwith the system ([Nichols, 1997]). As explicit ratings impose a cognitive cost, oftenusers are reluctant to vote. For that purpose many systems try to infer rating valuesimplicitly by observing the users. Certain actions on a platform are considered aspositive vote for a resource, e. g., adding a resource to ones portfolio, repeatedlyvisiting a resource, or printing a textual resource. The advantage of explicit ratings isthat they are more accurate than the implicit votes. However recommender systemsusually require a large amount of ratings from each user which is difficult to obtainwith explicit ratings only. For that purpose hybrid approaches exist that exploitboth kinds of available information.
The question which user actions on a resource can be interpreted as an expres-sion of preference has to be answered for every application individually. For ourrecommender system based on the ALOE platform, we consider resource contribu-tions, adding a resource to one’s portfolio, and looking at the detailed metadata ofa resource as implicit positive ratings. Explicit ratings are also considered by ourrecommender system and are taken over as provided by the users. All ratings areon a five point rating scale with five as the best and one as the worst rating thatcan be given. Further every action that is associated with a preference expressionhas a priority value assigned (one of low, middle, or high). In case two such actionsfrom one user are associated with a resource, the rating value of the action with thehigher priority is used. The rating and priority values of each preference relevantuser action are depicted in Table 5.1.
5.2 Modeling Contextualized User Profiles
As stated by [Schwarz, 2006], the term context is used in different disciplines (e. g.,linguistics and psychology) and understood in many different ways. Therefore whentalking about context it is necessary to talk about its application as well as thescenario in which it is used. In our system, we assume that a knowledge worker has
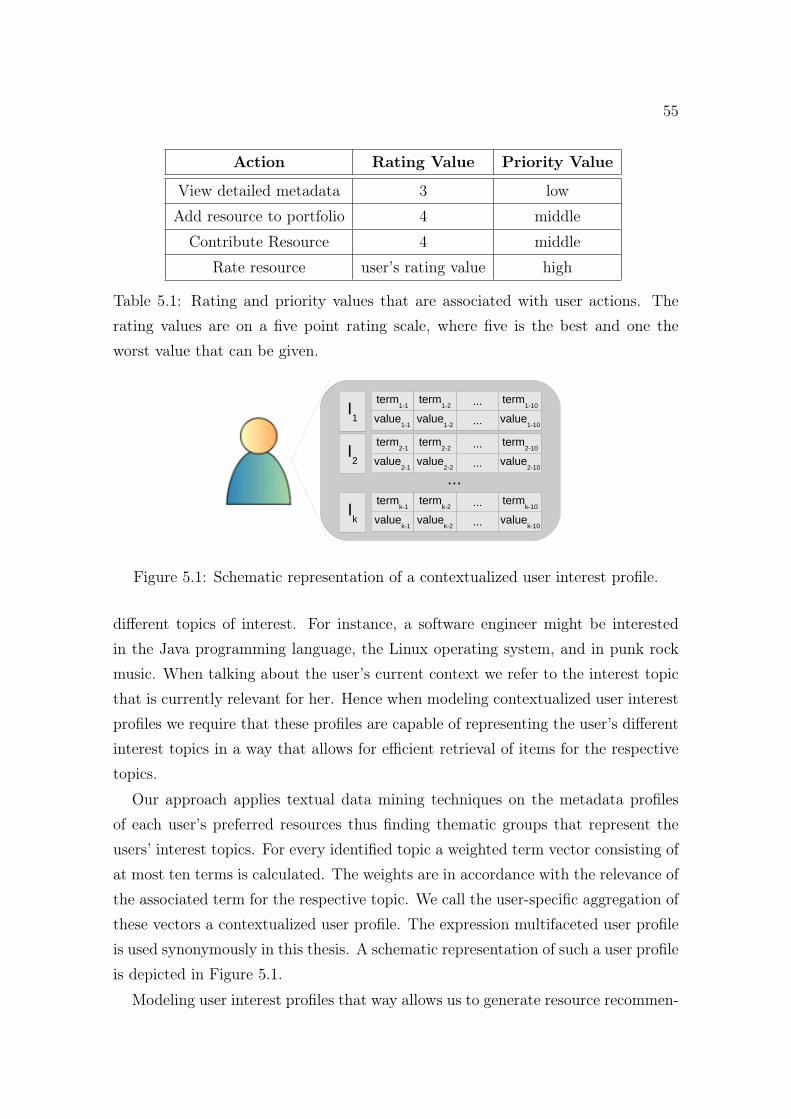
55
Action Rating Value Priority Value
View detailed metadata 3 low
Add resource to portfolio 4 middle
Contribute Resource 4 middle
Rate resource user’s rating value high
Table 5.1: Rating and priority values that are associated with user actions. Therating values are on a five point rating scale, where five is the best and one theworst value that can be given.
term1-1
value1-1
term1-10
value1-10
term1-2
value1-2
...
...I1
term2-1
value2-1
term2-10
value2-10
term2-2
value2-2
...
...I2
termk-1
valuek-1
termk-10
valuek-10
termk-2
valuek-2
...
...Ik
...
Figure 5.1: Schematic representation of a contextualized user interest profile.
different topics of interest. For instance, a software engineer might be interestedin the Java programming language, the Linux operating system, and in punk rockmusic. When talking about the user’s current context we refer to the interest topicthat is currently relevant for her. Hence when modeling contextualized user interestprofiles we require that these profiles are capable of representing the user’s differentinterest topics in a way that allows for efficient retrieval of items for the respectivetopics.
Our approach applies textual data mining techniques on the metadata profilesof each user’s preferred resources thus finding thematic groups that represent theusers’ interest topics. For every identified topic a weighted term vector consisting ofat most ten terms is calculated. The weights are in accordance with the relevance ofthe associated term for the respective topic. We call the user-specific aggregation ofthese vectors a contextualized user profile. The expression multifaceted user profileis used synonymously in this thesis. A schematic representation of such a user profileis depicted in Figure 5.1.
Modeling user interest profiles that way allows us to generate resource recommen-
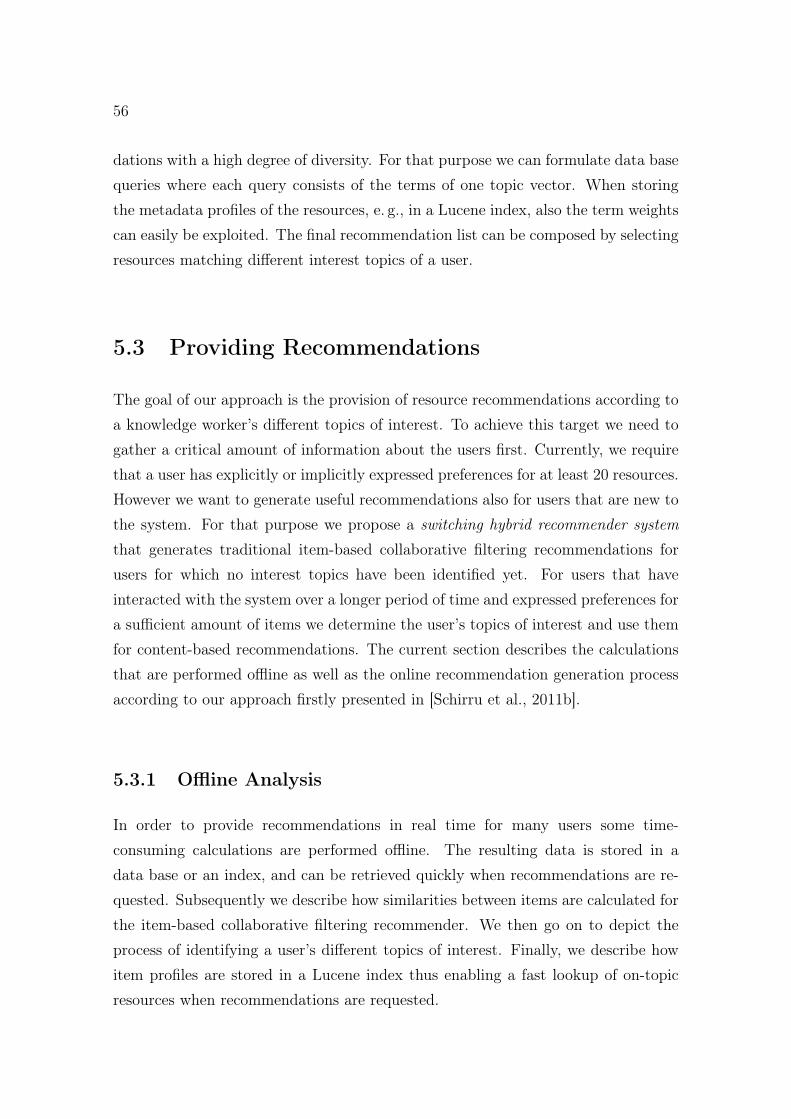
56
dations with a high degree of diversity. For that purpose we can formulate data basequeries where each query consists of the terms of one topic vector. When storingthe metadata profiles of the resources, e. g., in a Lucene index, also the term weightscan easily be exploited. The final recommendation list can be composed by selectingresources matching different interest topics of a user.
5.3 Providing Recommendations
The goal of our approach is the provision of resource recommendations according toa knowledge worker’s different topics of interest. To achieve this target we need togather a critical amount of information about the users first. Currently, we requirethat a user has explicitly or implicitly expressed preferences for at least 20 resources.However we want to generate useful recommendations also for users that are new tothe system. For that purpose we propose a switching hybrid recommender systemthat generates traditional item-based collaborative filtering recommendations forusers for which no interest topics have been identified yet. For users that haveinteracted with the system over a longer period of time and expressed preferences fora sufficient amount of items we determine the user’s topics of interest and use themfor content-based recommendations. The current section describes the calculationsthat are performed offline as well as the online recommendation generation processaccording to our approach firstly presented in [Schirru et al., 2011b].
5.3.1 Offline Analysis
In order to provide recommendations in real time for many users some time-consuming calculations are performed offline. The resulting data is stored in adata base or an index, and can be retrieved quickly when recommendations are re-quested. Subsequently we describe how similarities between items are calculated forthe item-based collaborative filtering recommender. We then go on to depict theprocess of identifying a user’s different topics of interest. Finally, we describe howitem profiles are stored in a Lucene index thus enabling a fast lookup of on-topicresources when recommendations are requested.
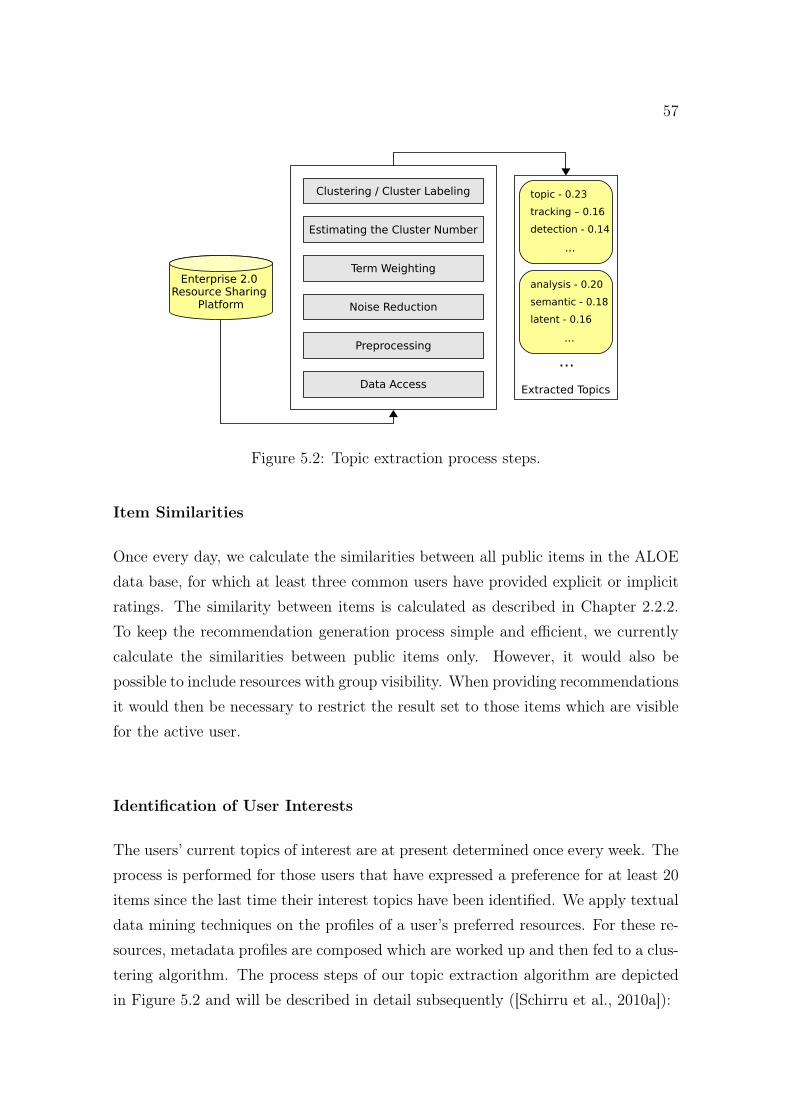
57
Data Access
Preprocessing
Noise Reduction
Term Weighting
Estimating the Cluster Number
Clustering / Cluster Labeling
Extracted Topics
topic - 0.23
tracking – 0.16
detection - 0.14
...
analysis - 0.20
semantic - 0.18
latent - 0.16
...
...
Enterprise 2.0 Resource Sharing
Platform
Figure 5.2: Topic extraction process steps.
Item Similarities
Once every day, we calculate the similarities between all public items in the ALOEdata base, for which at least three common users have provided explicit or implicitratings. The similarity between items is calculated as described in Chapter 2.2.2.To keep the recommendation generation process simple and efficient, we currentlycalculate the similarities between public items only. However, it would also bepossible to include resources with group visibility. When providing recommendationsit would then be necessary to restrict the result set to those items which are visiblefor the active user.
Identification of User Interests
The users’ current topics of interest are at present determined once every week. Theprocess is performed for those users that have expressed a preference for at least 20items since the last time their interest topics have been identified. We apply textualdata mining techniques on the profiles of a user’s preferred resources. For these re-sources, metadata profiles are composed which are worked up and then fed to a clus-tering algorithm. The process steps of our topic extraction algorithm are depictedin Figure 5.2 and will be described in detail subsequently ([Schirru et al., 2010a]):
58
Data Access We determine all resources for which a user has expressed a prefer-ence since the last time her interest topics have been extracted. For each of theseresources a metadata profile consisting of the annotated titles and tags is composed.Per resource potentially many titles are available as every user that adds the re-source to her portfolio has to provide a title (see Chapter 4.3). Experiments havebeen conducted that also included the descriptions of the resources. However weobserved that the best clustering results were achieved when only the titles and thetags of the resources were used.
Preprocessing We convert the terms contained in the metadata profiles to lowercase characters, remove punctuation characters and stop words. Further stemmingis applied to bring the terms to a normalized form. We use the Snowball stemmer1
for this purpose. The normalized profiles of the resources are represented accordingto the “bag-of-words” model, i. e., they are represented as an unordered collection ofwords. These item profiles are then mapped to a vector space where each dimensioncorresponds to a term in the corpus (i. e., the set of the active user’s preferredresources) and the dimension values are the counts of the words in the respectivemetadata profiles.
Noise Reduction Very rare and very frequent terms are not considered help-ful to characterize resources. As a consequence dimensions representing theseterms are removed. To reduce the noise that is inherent in social metadata weexperimented with dimensionality reduction based on Latent Semantic Analysis([Deerwester et al., 1990]). However, in our future work the positive impact of theapplication of this technique still has to be examined in greater depth.
Term Weighting Terms that appear frequently in the metadata profile of one re-source but rarely in the whole corpus are likely to be good discriminators and shouldtherefore obtain a higher weight. We use the TF-IDF measure ([Sparck Jones, 1972],see Chapter 2.1) which is widely applied in information retrieval systems in orderto achieve this goal.
Clustering and Cluster Labeling To be able to cluster the set of a user’spreferred resources we need to find a reasonable number of clusters in our data first.
1http://snowball.tartarus.org/
59
For this purpose we follow an approach which is based on the residual sum of squares(RSS) of a clustering result. The approach is depicted in detail in Appendix C.2.2.
For document clustering and cluster label extraction we apply non-negative ma-trix factorization (NMF, [Xu et al., 2003]). The output of the NMF algorithm is(i) a soft resource clustering and (ii) for each term and topic a weight indicatingthe relevance of the term for the respective topic. That way we can directly buildthe contextualized user profiles as described in Section 5.2 by composing a label foreach topic consisting of its most relevant terms and aggregating the labels associatedwith a user’s interest topics into her profile. The details of the NMF algorithm aredescribed in Appendix C.3.2.
For text clustering several co-clustering techniques such as latent semantic anal-ysis (LSA, cf. Appendix C.3.1), probabilistic latent semantic analysis (PLSA,[Hofmann, 1999]), non-negative matrix factorization, and latent dirichlet allocation(LDA) have been applied successfully in the past. We selected NMF for our ap-proach as it is known to lead to good co-clustering results and its output is easy tointerpret. Compared to LSA it has three advantages:
• LSA requires the axes of the semantic space to be orthogonal which makes theidentification of latent semantic directions difficult for overlapping clusters.
• With NMF a document is an additive combination of the base latent semanticswhich is more reasonable in the text domain.
• The cluster membership of a document can directly be inferred from the NMFwhereas with LSA further data clustering methods such as K-Means have tobe applied in the eigenvector space.
We expect that PLSA and LDA lead to results that are comparable to NMF inthe application domain. For our future work it would be interesting to experimentwith these co-clustering algorithms.
Item Profiles Index
In order to enable a fast lookup of items matching a user’s topics of interest we storethe metadata profiles of all public resources of the ALOE system in a Lucene index.The profiles consist of the titles, descriptions, and tags that have been annotated foreach resource. The index is updated once every day. As with the item similarities
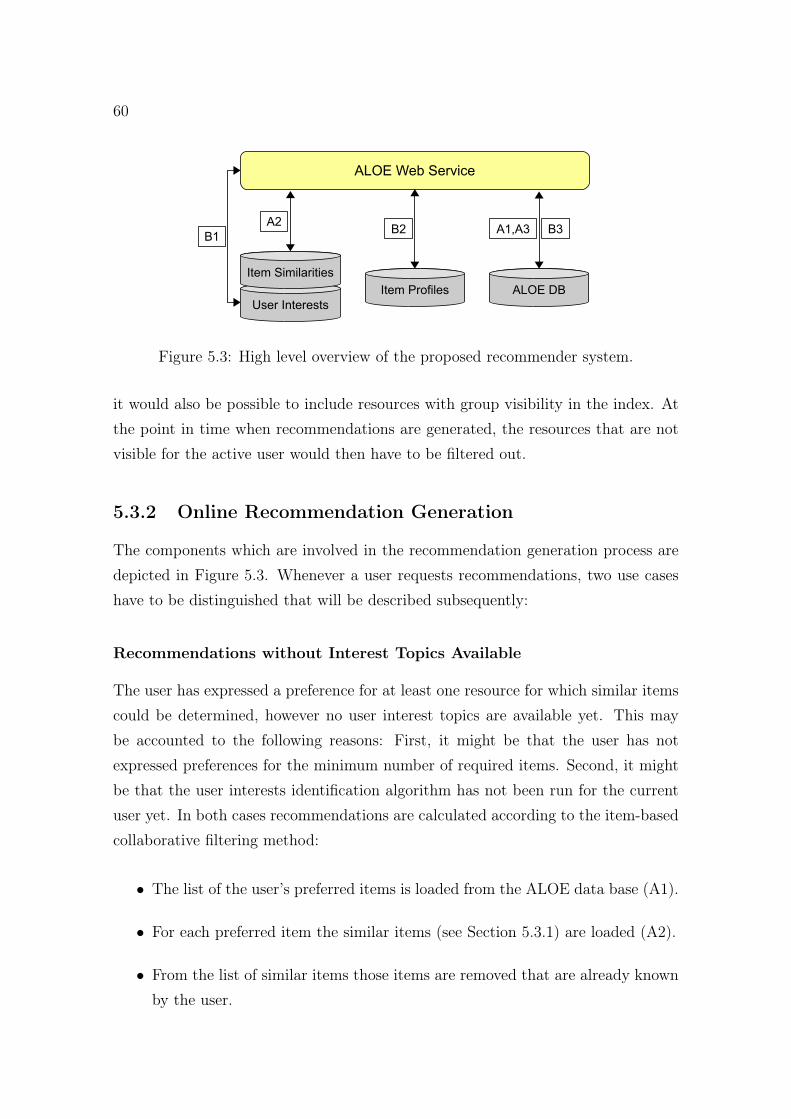
60
ALOE Web Service
User Interests
Item Similarities
Item Profiles ALOE DB
B1
A2B2 A1,A3 B3
Figure 5.3: High level overview of the proposed recommender system.
it would also be possible to include resources with group visibility in the index. Atthe point in time when recommendations are generated, the resources that are notvisible for the active user would then have to be filtered out.
5.3.2 Online Recommendation Generation
The components which are involved in the recommendation generation process aredepicted in Figure 5.3. Whenever a user requests recommendations, two use caseshave to be distinguished that will be described subsequently:
Recommendations without Interest Topics Available
The user has expressed a preference for at least one resource for which similar itemscould be determined, however no user interest topics are available yet. This maybe accounted to the following reasons: First, it might be that the user has notexpressed preferences for the minimum number of required items. Second, it mightbe that the user interests identification algorithm has not been run for the currentuser yet. In both cases recommendations are calculated according to the item-basedcollaborative filtering method:
• The list of the user’s preferred items is loaded from the ALOE data base (A1).
• For each preferred item the similar items (see Section 5.3.1) are loaded (A2).
• From the list of similar items those items are removed that are already knownby the user.
61
• For the remaining items a rating prediction is calculated using the item-basedcollaborative filtering algorithm as described in Section 2.2.2.
• Metadata of the top ten items is loaded from the ALOE data base and returnedto the user (A3).
Recommendations with Interest Topics Available
In the case that a user’s topics of interest have been identified, the recommendationsare generated as follows:
• The user’s interest topics are loaded from the data base (B1).
• From the latest interest topics we select randomly a predefined number. Cur-rently, we select at most five interest topics. However if less topics are available,all of them will be used.
• The index containing the item profiles is queried according to these interesttopics (B2). For each topic, we compose a query that contains the relevanttopic terms. A discussion on how to choose the term relevance threshold isprovided in Section 7.3.2. The term weights are used as boosting factors inour query and the terms are connected by an “OR” semantic.
• From the retrieved resources those items which are already known by the userare removed.
• A recommendation list is composed that should contain at most ten items andwe aim at delivering an equal number of items for each selected user interesttopic.
• Metadata of the recommended items is loaded from the ALOE data base andthe list is returned to the user (B3).
When relevant resources for the selected interest topics can be found in the database the proposed approach ensures a high degree of inter-topic diversity in therecommendation lists. In Chapter 7.3.2 we evaluate the specificity of our extractedcluster labels, i.e., we test how well the topic labels can separate a user’s resourcesthat belong to a topic from the rest of her resources. The specificity of the clusterlabels is assessed by making use of measures from the field of information retrieval
62
such as precision, recall, and the F-measure. Subsequently we will present relatedwork in the field of topic extraction that has been applied in different scenarioscomprising the detection of topics in accumulating document collections, searchresults, as well as social resource sharing platforms.
5.4 Background on Topic Extraction Algorithms
To detect the topics in the metadata profiles of the users’ preferred resources ourapproach uses algorithms from the domain of topic detection and tracking (TDT).TDT is concerned with finding and following new events in a stream of documents.In [Allan et al., 1998] the following TDT tasks have been identified: First is thesegmentation task, i. e., segmenting a continuous stream of text into its severalstories. Second, there is the detection task which comprises the retrospective analysisof a corpus to identify the discussed events and the identification of new events basedon online streams of stories. Third is the tracking task where incoming stories areassociated with events known in the system. In this work we focus on the detectionof topics in the profiles of the users’ preferred resources.
[Schult and Spiliopoulou, 2006] consider the problem of finding emerging and per-sistent themes in accumulating document collections which are organized in rigidcategorization schemes such as taxonomies. They propose Theme-Monitor, an al-gorithm for monitoring evolving themes from accumulating document collections.The algorithm works as follows: In the first period, it clusters all documents inthe collection. In the following periods, it clusters the new documents with the oldfeature space and compares the new clusters to the ones found in the previous pe-riod. If the clusters of two adjacent periods are similar with regard to their themesand if the quality of the clustering is not declining significantly, then the originalfeature space is kept. Otherwise a new feature space is build for the documents ofthe latest period and the next comparison. Thematic clusters are represented bya label, consisting of a set of terms that have a minimal support in the associatedcluster. Thematic clusters that survived over several periods, despite re-clusteringand changes of the feature space, will become part of the classification scheme.Theme-Monitor identifies persistent topics in accumulating document collections.In contrast our approach does not consider a user’s preferred resources as an accu-mulating set of items. Instead, each time the user’s current topics of interest are
63
determined only those items are considered for which the user has expressed a pref-erence since the last time her interest topics have been identified. Also our methoddoes not aim at keeping the feature space between different runs of the algorithm.Each time the interests identification algorithm is run we build a new feature spacefrom the metadata profiles of the items of the current period that way targetingat topic labels that best describe a user’s current topics of interest. In our futurework we also intend to find persistent interest topics of users. For that purpose wewill either compare the topic labels of different time periods or apply sophisticatedmethods such as online non-negative matrix factorization ([Cao et al., 2007]) whichautomatically track the evolution of topics while the data evolves.
[Osinski et al., 2004] present Lingo, an algorithm for search results clusteringbased on singular value decomposition (SVD). Lingo is implemented in Carrot2,an open source search results clustering engine.2 The goal of Lingo is to providean overview of the topics that are covered in a search result by providing readableand unambiguous descriptions of the thematic groups that way facilitating access tothe specific group of documents a user is looking for. The authors state that mostopen text clustering algorithms first perform document clustering and then derivedescriptions (cluster labels) from these clusters. Lingo follows a reverse “description-comes-first” approach. It first ensures that human-understandable cluster labels canbe created and then assigns documents to them. The algorithm works as follows:first the algorithm extracts frequent phrases from the input documents, hoping thatthey are the most informative sources of human-understandable topic descriptions.Next the document-term matrix which represents the search result is reduced byapplying SVD, that way trying to discover the existing latent structure of diversetopics. In the last step group descriptions are matched with the extracted topics andthe relevant documents are assigned to the groups. Similar to our approach Lingouses a matrix factorization technique to find groups of topically related documentsin a corpus. However, in the first place the algorithm aims at deriving human under-standable cluster labels. For that purpose it generates cluster descriptions consistingof frequent phrases or expressive single terms. Contrastingly the main target of ourapproach is the identification of cluster labels that optimize the retrieval of resourcesmatching the associated topic. Therefore we chose a label representation consistingof at most ten weighted terms facilitating precise weighted queries.
2http://project.carrot2.org/
64
[Li et al., 2008] propose an approach to discover social interests shared by groupsof users. For that purpose they analyze patterns of frequent co-occurring tags tocapture and characterize topics of user interests. They developed the ISID (InternetSocial Interest Discovery) system to identify common user interests and to clusterusers as well as their saved URLs by different topics of interest. The architecture ofthe system consists of three components. First, there is the topic discovery compo-nent which for a given set of bookmarks finds all topics of interest. Every topic ofinterest is a set of tags whose number of co-occurrences exceeds a given threshold.The patterns are identified by an association rule algorithm. Second, there is theclustering component. This component finds for each topic of interest, all the URLsand users that have labeled the URLs with all the tags in the topic. That way forevery topic a user cluster and a URL cluster are generated. Third, the indexing com-ponent imports the topics of interest as well as the respective user and URL clustersinto an indexing system which allows for application queries. ISID is applied in ascenario similar to ours namely in a Web 2.0 resource sharing platform. It also usessocial metadata (tags) to capture the content of items and to derive interest topics ofusers. However, like the Fab system proposed by [Balabanovic and Shoham, 1997](see Chapter 8.1) ISID extracts interest topics that are shared by many users. Weaim at topic descriptions that are stronger tailored to the individual users in orderto recommend resources that better match a user’s particular interests in a vast in-formation space in which potentially many resources are available for many interesttopics.
Chapter 6
Mood-based Music
Recommendations
As already stated before, traditional content-based and collaborative recommendersystems are known to suffer from overspecialization thus not taking into account auser’s full range of interests. In this chapter we tackle the problem of extractingmultifaceted user profiles that facilitate context-sensitive music recommendationsbased on the user’s current mood. We hypothesize that users clearly have a multi-tude of different preferred music styles that should be considered when music rec-ommendations are provided. For that purpose we propose an approach to extractcontextualized user profiles that allow for personalized recommendations of e. g., in-ternet radio stations or can be integrated into existing content-based recommendersystems. The analyses are performed on the artist level. Our method annotates theartists a user prefers by making use of metadata from Semantic Web data sources.These artists are clustered and for each group a label is extracted that describesthe music style associated with the respective group. We compose the multifacetedprofile of a user by aggregating the labels describing her preferred music styles. Themethod is a second use case for the approach presented in Chapter 5. The majordifference is that the metadata annotated for a user’s preferred artists is not pro-vided by the user herself or other users of the platform where the method is applied.Instead LOD is used to represent music items. Further, some algorithms have beenexchanged for experimental purposes.
The current chapter is structured as follows: In Section 6.1 we introduce twopsychological models that are used to represent mood in music. Further two mood
65
66
classification schemes based on social tags are presented of which the second relieson these psychological models. Next in Section 6.2 we depict the data sets usedfor our work and the method applied to extract a user’s contextualized profile ofpreferred music styles. In Section 6.3 we propose different strategies on how to usethese profiles for music recommendations. Finally, in Section 6.4 we summarize someof the sparse literature about recommendation approaches applying Semantic Webdata sets and technologies.
6.1 Representations of Mood in Music
In the literature different models for the representation of mood (both music spe-cific and general) have been proposed. Subsequently we will describe two differentapproaches: [Hevner, 1936] arranged 66 adjectives describing mood in music intoeight neighboring groups. All adjectives in one group should be closely related andcompatible with each other. Adjectives in two adjacent groups are intended to haveat least some characteristics in common. The eight groups are arranged in a circle.Two groups at the extremities of any diameter should be as oppositional as possible.Hevner’s mood groups are depicted in detail in Figure 6.1. Other approaches assumea highly systematic relation between affective states. [Russell, 1980] proposed thehypothesis that affective states are best represented as a circle in a two-dimensional,bipolar space with the first dimension representing pleasure and the second dimen-sion representing arousal. Russell’s assumption is based on evidence on how laypeople conceptualize affective states and on multivariate analysis of self-reportedstates. His affect model is depicted in Figure 6.2.
When talking about mood-based music recommendations we need to first set-tle on the mood categories that have to be used and characterize each category.[Hu et al., 2007] proposed a classification consisting of three mood categories thathave been developed to be used for the “Audio Music Mood Classification” taskin the Music Information Retrieval Evaluation eXchange (MIREX). However usingonly three mood categories was considered by many as domain oversimplification.For this reason [Hu et al., 2009a] proposed a new classification schema consisting of18 categories. They collected tags from Last.fm for an in-house collection of 21,000audio tracks. For 12,066 songs at least one tag could be found. The tags that
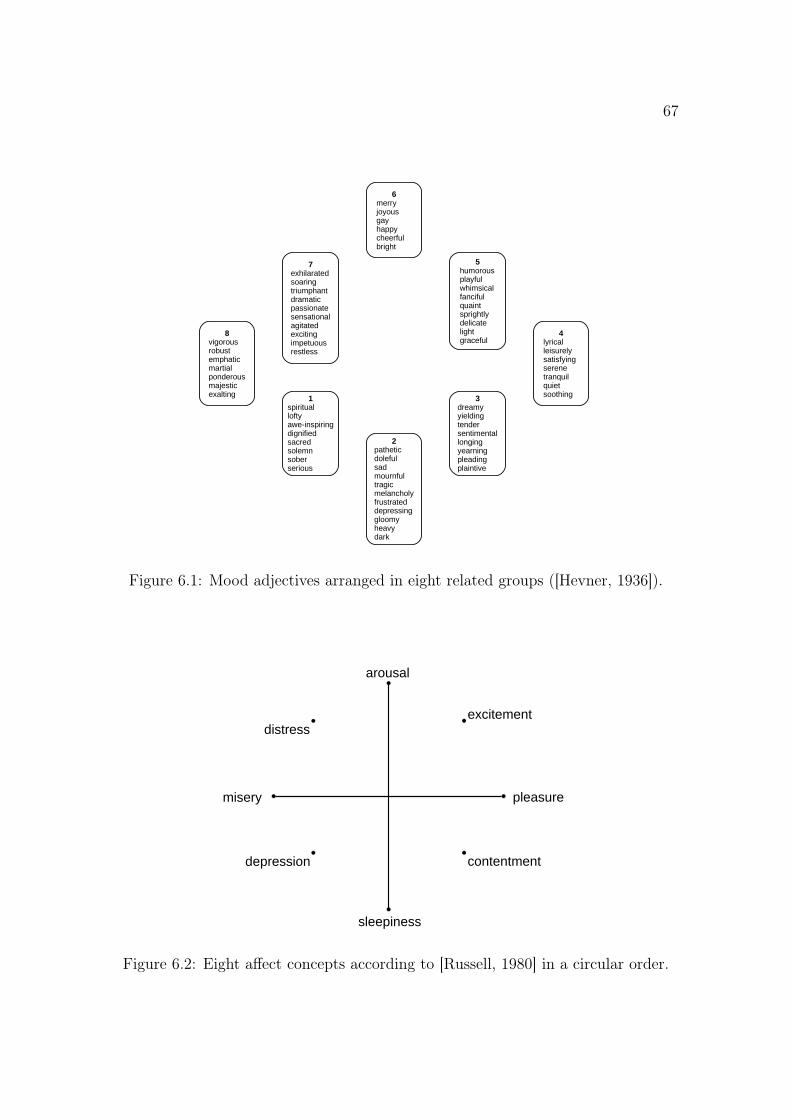
67
8
vigorousrobustemphaticmartialponderousmajesticexalting
6
merryjoyousgayhappycheerfulbright
7
exhilaratedsoaringtriumphantdramaticpassionatesensationalagitatedexcitingimpetuousrestless
5
humorousplayfulwhimsicalfancifulquaintsprightlydelicatelightgraceful
4
lyricalleisurelysatisfyingserenetranquilquietsoothing
3
dreamyyieldingtendersentimentallongingyearningpleadingplaintive
2
patheticdolefulsadmournfultragicmelancholyfrustrateddepressinggloomyheavydark
1
spirituallofty awe-inspiringdignifiedsacredsolemnsoberserious
Figure 6.1: Mood adjectives arranged in eight related groups ([Hevner, 1936]).
pleasure
excitement
arousal
contentment
sleepiness
depression
misery
distress
Figure 6.2: Eight affect concepts according to [Russell, 1980] in a circular order.
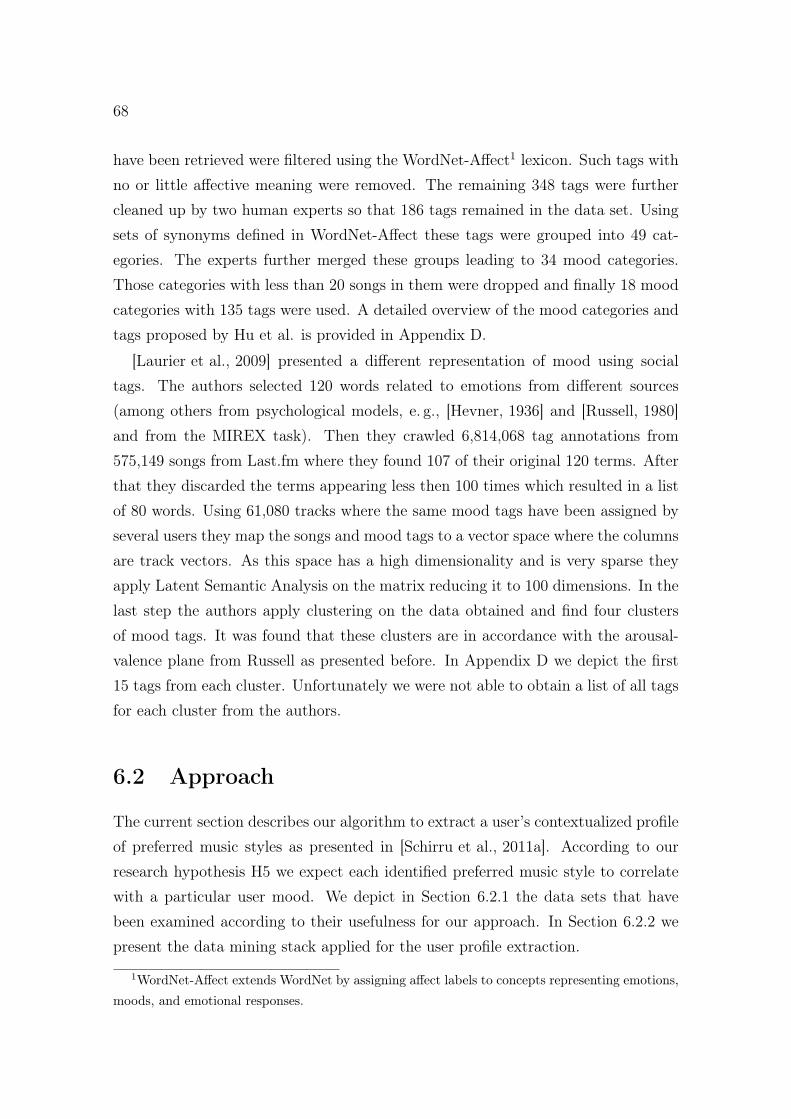
68
have been retrieved were filtered using the WordNet-Affect1 lexicon. Such tags withno or little affective meaning were removed. The remaining 348 tags were furthercleaned up by two human experts so that 186 tags remained in the data set. Usingsets of synonyms defined in WordNet-Affect these tags were grouped into 49 cat-egories. The experts further merged these groups leading to 34 mood categories.Those categories with less than 20 songs in them were dropped and finally 18 moodcategories with 135 tags were used. A detailed overview of the mood categories andtags proposed by Hu et al. is provided in Appendix D.
[Laurier et al., 2009] presented a different representation of mood using socialtags. The authors selected 120 words related to emotions from different sources(among others from psychological models, e. g., [Hevner, 1936] and [Russell, 1980]and from the MIREX task). Then they crawled 6,814,068 tag annotations from575,149 songs from Last.fm where they found 107 of their original 120 terms. Afterthat they discarded the terms appearing less then 100 times which resulted in a listof 80 words. Using 61,080 tracks where the same mood tags have been assigned byseveral users they map the songs and mood tags to a vector space where the columnsare track vectors. As this space has a high dimensionality and is very sparse theyapply Latent Semantic Analysis on the matrix reducing it to 100 dimensions. In thelast step the authors apply clustering on the data obtained and find four clustersof mood tags. It was found that these clusters are in accordance with the arousal-valence plane from Russell as presented before. In Appendix D we depict the first15 tags from each cluster. Unfortunately we were not able to obtain a list of all tagsfor each cluster from the authors.
6.2 Approach
The current section describes our algorithm to extract a user’s contextualized profileof preferred music styles as presented in [Schirru et al., 2011a]. According to ourresearch hypothesis H5 we expect each identified preferred music style to correlatewith a particular user mood. We depict in Section 6.2.1 the data sets that havebeen examined according to their usefulness for our approach. In Section 6.2.2 wepresent the data mining stack applied for the user profile extraction.
1WordNet-Affect extends WordNet by assigning affect labels to concepts representing emotions,moods, and emotional responses.
69
6.2.1 Data Sources
We checked three Semantic Web data sources for metadata that are available to de-scribe artists: Freebase, DBpedia, and MusicBrainz. Each of them will be describedbriefly subsequently.
Freebase
Freebase2 is an online collection of structured data that has been harvested frommany different sources. It also includes direct wiki-like contributions provided bythe community of users that way forming a large collaborative knowledge base. Theaim of Freebase is the creation of a global resource allowing people and machinesto access common information in a convenient way. The Freebase data is availableunder the Creative Commons Attribution 2.5 Generic license.3 It can be accessedvia a dedicated API, an RDF endpoint, as well as data base dumps. Freebaseis developed by the American software company Metaweb and has been publiclyavailable since March 2007. The available metadata to describe artists comprise:
• origin: The place (city or country) where an artist or group started theircareer.
• instrument : The instrument(s) an artist plays. For these instruments also theassociated instrument families can be requested from Freebase.
• genre: The musical genre of the artist or group.
• artist collaboration: Collection of artists and/or groups that worked together.
• record release year : Year in which an artist or group has released a record.
The full list of metadata describing items in the music domain can be retrievedat http://wiki.freebase.com/wiki/Music_commons.
DBpedia
The DBpedia4 project is a community effort that aims at extracting structured in-formation from Wikipedia and making the information available on the Web. That
2http://www.freebase.com/3http://creativecommons.org/licenses/by/2.5/4http://dbpedia.org/
70
way it covers many domains, represents community agreement, and it automaticallyevolves as Wikipedia changes. Access to the DBpedia data set is granted online viaa SPARQL query endpoint and as Linked Data. Further the data can be down-loaded as text files either in N-Triples or in N-Quads format. DBpedia is licensedunder the Creative Commons Attribution-Share Alike 3.0 license5 and the GNU FreeDocumentation License.6
Interesting metadata in DBpedia describing artists comprise the category labels.These are the labels that are shown on the bottom of most of the Wikipedia pages.For example, for Madonna we have categories “1958 births", “1980s singers", “1990ssingers", “American female singers", etc. A complete overview of the metadataavailable in DBpedia can be retrieved at http://mappings.dbpedia.org/server/ontology/classes/.
MusicBrainz
MusicBrainz7 is an open user-maintained community that collects music metadataand makes them available to the public. It was initiated by Robert Kaye as aresponse to Gracenote taking over CDDB and charging money for the access tothe previously free data. MusicBrainz collects a large amount of data comprisingmetadata about artists, release groups (e. g., albums and singles), release dates,track data, and label data. They are placed partly into the public domain8 and someparts are covered by a Creative Commons Attribution-NonCommercial-ShareAlike2.0 license.9 The data are made available as a dump for PostgreSQL data bases. Todescribe artists the data base comprises among others the following information:
• Name of the artist or group
• Common aliases and misspellings
• Type (one of person or group)
• Begin date (birth date or formation date, depending on the type)
5http://creativecommons.org/licenses/by-sa/3.0/6http://en.wikipedia.org/wiki/Wikipedia:Text_of_the_GNU_Free_Documentation_
License/7http://musicbrainz.org/8http://creativecommons.org/licenses/publicdomain/9http://creativecommons.org/licenses/by-nc-sa/2.0/
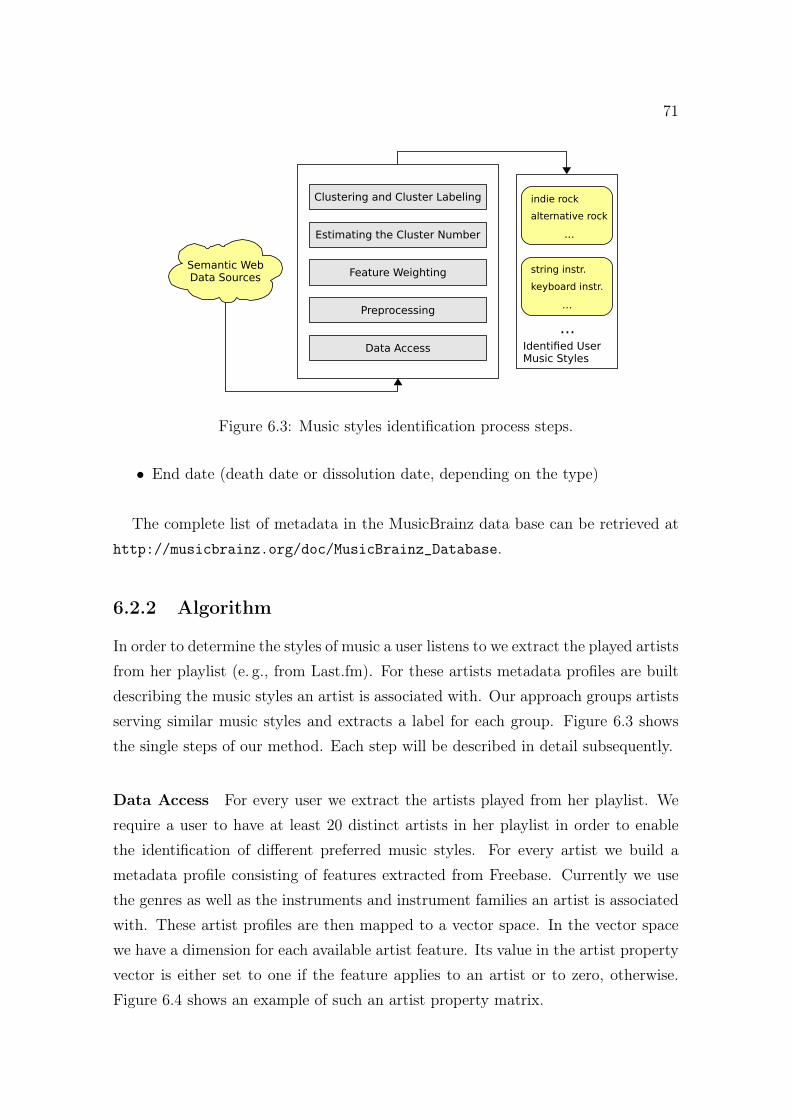
71
Data Access
Preprocessing
Feature Weighting
Estimating the Cluster Number
Clustering and Cluster Labeling
Identi�ed User Music Styles
indie rock
alternative rock
...
...
Semantic WebData Sources
string instr.
keyboard instr.
...
Figure 6.3: Music styles identification process steps.
• End date (death date or dissolution date, depending on the type)
The complete list of metadata in the MusicBrainz data base can be retrieved athttp://musicbrainz.org/doc/MusicBrainz_Database.
6.2.2 Algorithm
In order to determine the styles of music a user listens to we extract the played artistsfrom her playlist (e. g., from Last.fm). For these artists metadata profiles are builtdescribing the music styles an artist is associated with. Our approach groups artistsserving similar music styles and extracts a label for each group. Figure 6.3 showsthe single steps of our method. Each step will be described in detail subsequently.
Data Access For every user we extract the artists played from her playlist. Werequire a user to have at least 20 distinct artists in her playlist in order to enablethe identification of different preferred music styles. For every artist we build ametadata profile consisting of features extracted from Freebase. Currently we usethe genres as well as the instruments and instrument families an artist is associatedwith. These artist profiles are then mapped to a vector space. In the vector spacewe have a dimension for each available artist feature. Its value in the artist propertyvector is either set to one if the feature applies to an artist or to zero, otherwise.Figure 6.4 shows an example of such an artist property matrix.
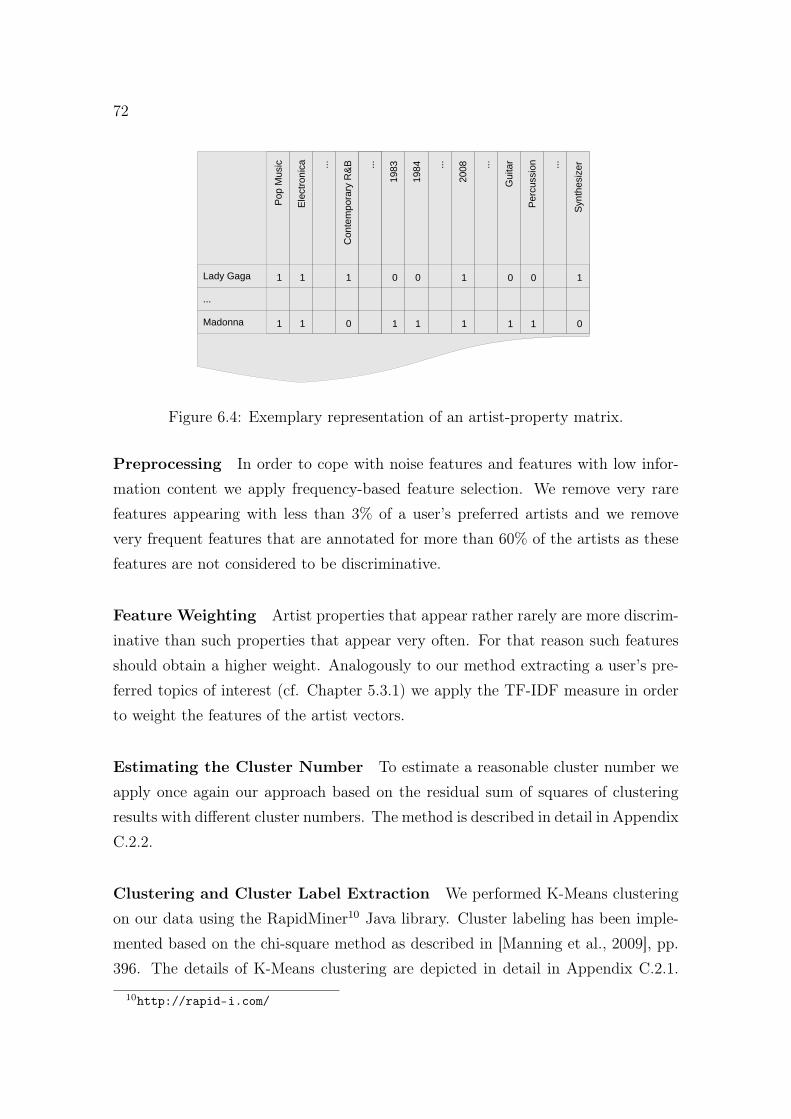
72
Lady Gaga
...
Madonna
Po
p M
usic
Ele
ctr
on
ica ...
Con
tem
por a
ry R
&B ...
198
3
198
4 ...
200
8 ...
Gu
ita
r
Pe
rcussio
n ...
Syn
thesiz
er
1
1
1
1
1
0
0 0 1
1 1 1 1 1 0
10 0
Figure 6.4: Exemplary representation of an artist-property matrix.
Preprocessing In order to cope with noise features and features with low infor-mation content we apply frequency-based feature selection. We remove very rarefeatures appearing with less than 3% of a user’s preferred artists and we removevery frequent features that are annotated for more than 60% of the artists as thesefeatures are not considered to be discriminative.
Feature Weighting Artist properties that appear rather rarely are more discrim-inative than such properties that appear very often. For that reason such featuresshould obtain a higher weight. Analogously to our method extracting a user’s pre-ferred topics of interest (cf. Chapter 5.3.1) we apply the TF-IDF measure in orderto weight the features of the artist vectors.
Estimating the Cluster Number To estimate a reasonable cluster number weapply once again our approach based on the residual sum of squares of clusteringresults with different cluster numbers. The method is described in detail in AppendixC.2.2.
Clustering and Cluster Label Extraction We performed K-Means clusteringon our data using the RapidMiner10 Java library. Cluster labeling has been imple-mented based on the chi-square method as described in [Manning et al., 2009], pp.396. The details of K-Means clustering are depicted in detail in Appendix C.2.1.
10http://rapid-i.com/
73
We explain cluster labeling using the chi-square test in Appendix C.4.2. Only suchfeatures are included in the label of a cluster whose weight is at least r% of theweight of the most relevant feature of the currently considered cluster. In Section7.4.2 we evaluate the best value for parameter r.
As a flat clustering algorithm K-Means has some drawbacks compared to hierar-chical clustering algorithms, these comprise (cf. Appendix C.2):
• The results are nondeterministic.
• For hierarchical clustering algorithms there exist good heuristics to determinea reasonable number of clusters.
• The results miss a structure that can be visualized easily like the dendrogramsthat are obtained with hierarchical clustering.
However, a major advantage of flat clustering strategies is their efficiency. Whilethe most common hierarchical algorithms have at least quadratic complexity in thenumber of items, the runtime of K-Means is linear in all relevant factors: the numberof iterations, clusters, vectors and dimensionality of the space. As our proposedalgorithm has to be applicable in an online platform with a large amount of userswe chose to use this efficient algorithm for our purposes.
6.3 Providing Recommendations
In this section we want to sketch possibilities on how the contextualized user profilesrepresenting a user’s preferred music styles can be used for music recommendations:
Integration with Previous Approach In [Baumann et al., 2010] we proposedan approach to determine similar artists based on metadata from the Semantic Web.In our online demonstration system HORST11 a user has to enter a preferred artistand the system identifies similar artists with a high degree of novelty. Figure 6.5shows HORST’s similar artists interface. The approach presented in this chapterintegrates with HORST seamlessly. The identified clusters representing a user’spreferred music styles can, e. g., be used to find other artists matching a specificmusic style but are presumably unknown to the active user. For that purpose it
11http://horst.kl.dfki.de/Horst/action/index
74
would simply be necessary to pick a representative artist from the respective clusterand to use it as a query for HORST in order to find similar artists that are not inthe active user’s listening history.
Recommendation of Radio Stations The labels representing preferred musicstyles mostly consist of genre descriptions that apply to the artists in the respectiveclusters (cf. Table 7.5). They can be used for personalized recommendations ofgenre-based internet radio stations taking into account a user’s full range of musicpreferences.
6.4 Background on Semantics-based Recommender
Systems
A recommender system exploiting the global graph of Linked Data (see Chapter 3.2)is presented by [Passant, 2010]. Passant introduces distance measures on LinkedData to determine the relatedness between resources. These measures can be usedto generate self-explanatory resource recommendations. For music recommendationsPassant uses a distance measure that takes into account direct links and indirectlinks between resources (i. e., incoming links from two different resources or out-going links to two different resources). For indirect links it is important that theresources are connected via the same link types. Further link types are weighted sothat frequent link types obtain a lower weight. For recommendations in the musicdomain the author uses the DBpedia data set. The algorithm takes a seed URI asinput and computes the distance between this URI and all other resources from thedata set. To provide relevant recommendations the result is limited to instancesof dbpedia-owl:MusicArtist and dbpedia-owl:Band. The algorithm remembersthe links that have been used to explain the recommendations in a user-friendlyway. Figure 6.6 visualizes the explanation interface of the system. It can be seenthat Mutya Buena is recommended for people preferring Amy Winehouse, as AmyWinehouse is associated musical artist, act, and band of Mutya Buena. Passantdetermines the similarity between artists by applying a link-based distance measureon the Linking Open Data graph. In contrast our approach selects metadata thatwe consider appropriate to describe the music styles of artists and performs simi-larity calculations in the vector space. We focus on rich metadata profiles to unveil
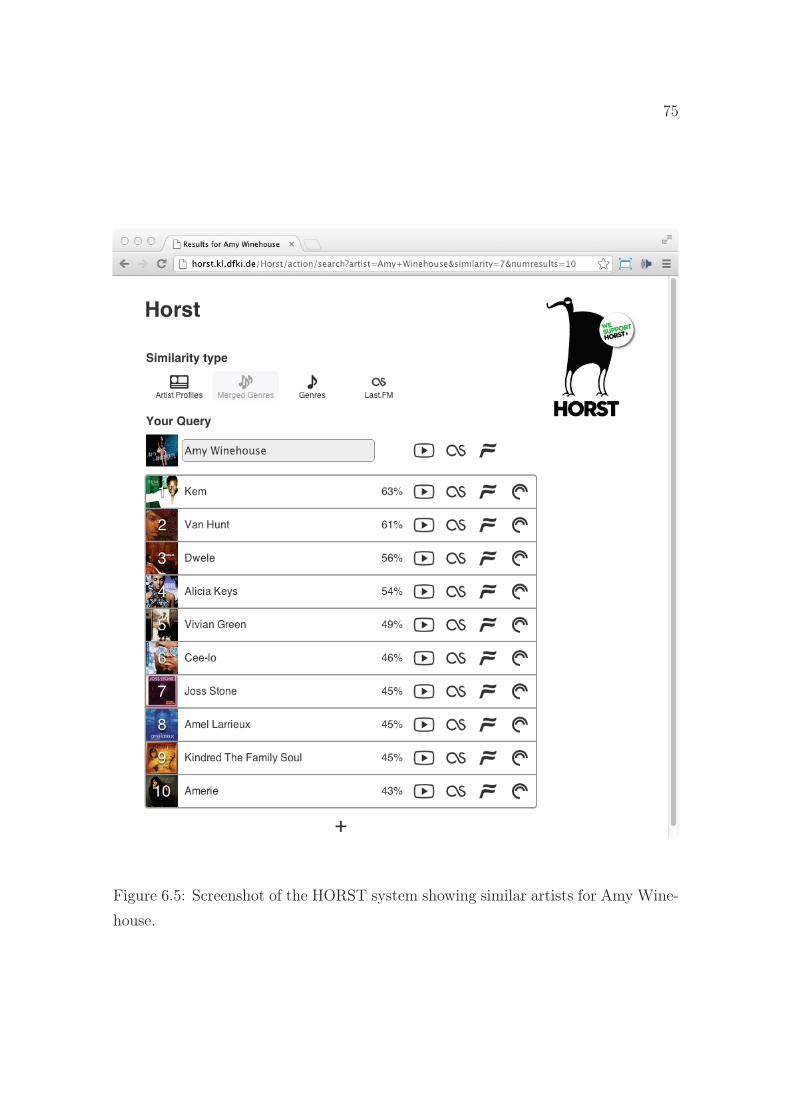
75
Figure 6.5: Screenshot of the HORST system showing similar artists for Amy Wine-house.
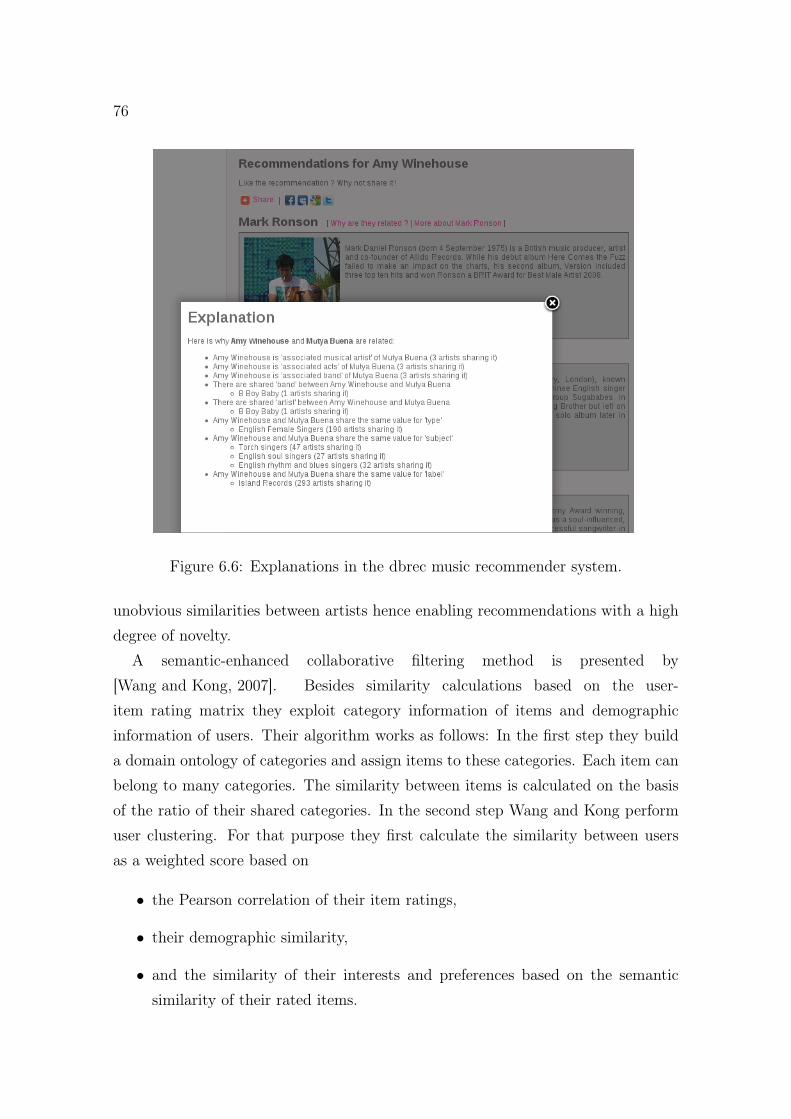
76
Figure 6.6: Explanations in the dbrec music recommender system.
unobvious similarities between artists hence enabling recommendations with a highdegree of novelty.
A semantic-enhanced collaborative filtering method is presented by[Wang and Kong, 2007]. Besides similarity calculations based on the user-item rating matrix they exploit category information of items and demographicinformation of users. Their algorithm works as follows: In the first step they builda domain ontology of categories and assign items to these categories. Each item canbelong to many categories. The similarity between items is calculated on the basisof the ratio of their shared categories. In the second step Wang and Kong performuser clustering. For that purpose they first calculate the similarity between usersas a weighted score based on
• the Pearson correlation of their item ratings,
• their demographic similarity,
• and the similarity of their interests and preferences based on the semanticsimilarity of their rated items.
77
For clustering the K-Means algorithm is used. Recommendations are then gen-erated based on the ratings of the users in the active user’s cluster. Further theitems are restricted to those matching the active user’s predominant interest cate-gory. Wang and Kong show that their approach outperforms the precision of tra-ditional collaborative filtering systems while at the same time not suffering fromperformance issues on large scale data sets. In contrast to Wang and Kong we usemetadata from the Semantic Web to enhance content-based recommendations. Weconsider content-based methods more appropriate to provide access to the long tailof seldom rated resources as they do not require an item to have a certain numberof ratings to be recommendable. Also people with extraordinary tastes can profitfrom content-based methods as they do not require to find similar users from whichrecommendations can be generated. However the quality of recommendations canbe a concern in content-based systems and should therefore be considered carefully.
In [Baumann et al., 2010] we proposed an approach to identify similar artistsbased on Semantic Web metadata. For each artist a metadata profile is built con-sisting of combined genres and record release years that are associated with therespective artist. The profiles are mapped to a vector space. To reduce the noise inthe data and to cope with features with low information content we remove very rareand very frequent features. Then the features are weighted using the TF-IDF mea-sure. To determine the similarity between artists we calculate the pairwise cosinesimilarity between their weighted feature vectors. The evaluation of the approachhas shown that this approach leads to more high quality novel artist recommenda-tions than well-known systems such as Last.fm or Echo Nest.12 However the overallrecommendation accuracy leaves room for further improvement. The multifaceteduser profiles proposed in this thesis can directly be combined with our method todetermine similar artists. E. g., we can retrieve representative artists for a preferredmusic style of a user and find other artists matching this music style that are pre-sumably unknown to the user.
12http://the.echonest.com/

78
Chapter 7
Evaluation
When developing a new recommendation algorithm a solid evaluation of the ap-proach constitutes an important element in the process. However there is constantdisagreement in the community on how recommendation algorithms should be eval-uated. In recent years recommender systems have mostly been evaluated by usinga data set of user-item preferences and predicting certain withheld values. Theresults were then analyzed by using one of the metrics discussed in Appendix E.4([Herlocker et al., 2004]). However it has often been claimed that such an offlineanalysis is not enough (e. g., [McNee et al., 2006b]) as this approach only predictswhat is already known in the data set hence not taking into account the novelty andserendipity aspects of recommendations. In a panel discussion at the RecommenderSystems 2010 conference Professor Joseph Konstan proposed the integration of newrecommendation algorithms into existing platforms and asking the users about theperceived quality of the recommendations that way directly obtaining feedback fromthe users about the performance of the recommendation algorithm. However an in-tegration into an existing platform is not always feasible.
In this thesis we proposed an algorithm extracting contextualized user profilestaking into account multifaceted user preferences. Each preference is representedby a label that should allow for a retrieval of resources that are relevant for therespective topic of interest or preferred music style. Hence we evaluate how specificthe labels are for the identified preference by making use of measures known fromthe field of information retrieval. We argue that specific labels will allow for a futureretrieval of relevant resources that a user will enjoy.
The current chapter is structured as follows: in Section 7.1 we depict evaluation
79
80
goals proposed in the recommender systems literature and discuss on which of thesegoals we focus with our experiments. Next, in Section 7.2 we report on the challengeswe faced evaluating our proposed approach and explain the reasoning behind themethod applied. In Section 7.3 we present the results of the evaluation experimentsfor our topic-based resource recommendation approach. Our analyses here weretwofold: We performed a first subjective evaluation study with a group of eight staffmembers of DFKI. It was a small sample biased towards researchers and softwareengineers. For that purpose, in the second phase we made a larger objective analysisusing the data base of the BibSonomy system. Finally, in Section 7.4 we present theresults for the mood-based music recommendations. The evaluation was carried outin an offline experiment using a data set obtained from Last.fm. We first analyzedwhether users listen to different styles of music and checked in a second step whetherthe identified preferred music styles correlate with specific mood categories.
7.1 Evaluation Based on User Goals
For a good evaluation of a recommender system it is important to consider thegoals the users have with the system (in contrast to, e. g., marketer goals). We willdescribe different such goals according to [Herlocker et al., 2004].
Annotation in Context Early recommender systems applied filtering on struc-tured discussion postings to help the user decide which posts are worth reading andwhich are not (e. g., the Tapestry system [Goldberg et al., 1992] or the GroupLenssystem [Resnick et al., 1994]). These systems require to keep the structure and con-text of the messages. They directly annotate postings with rating predictions. Theusefulness of these recommenders depends on how well the system can distinguishbetween desired and undesired items. Further, coverage is of major importance, i. e.,the system has to be able to generate rating predictions for all items the users view.
Find Good Items Shortly after Tapestry and GroupLens had been introduced,first recommender systems emerged that suggested specific items to their users (e. g.,the Ringo system [Shardanand and Maes, 1995] for music albums and artists) byproviding a ranked list of items together with prediction values that indicated howmuch a user would like the respective items. The “find good items” task is often
81
seen as the core recommendation task and applied in many commercial systems.However in these systems the rating prediction is often not shown to the user.
The tasks “annotation in context” and “find good items” are most commonly eval-uated. Subsequently user goals will be presented that are not (so often) addressedin the literature but are still considered useful to be evaluated.
Find All Good Items In general recommender systems deal with the problemof information overload. For that purpose for most of the systems it is enoughto recommend some good items to users. However there are domains where it iscrucial not to miss any relevant items. Examples comprise systems in the field oflegal data bases but also for researchers it might be important to keep track of asmany publications in their fields of interest as possible. In these scenarios the falsenegative rate needs to be sufficiently low and as in the case of “annotation in context”coverage of the approach is a major concern.
Recommender Sequence The task of recommending sequences of items can beimportant, e. g., when streaming music. Here the goal is to compose a playlist thatis pleasing as a whole. However this task can also be important in E-Learningscenarios where sequences of learning objects have to be recommended (e. g., “Firstread this introduction, second that survey, ...”).
Just Browse When talking to users of recommender systems Herlocker et al.found out that many of them used the systems without the intension to actuallypurchase anything. They just found it pleasant to browse through the items in thesystem. For those users the accuracy of the recommender might be less importantthan the graphical user interface, its ease of use, as well as the level and nature ofthe information presented.
Find Credible Recommender Another finding from discussions with users wasthat users do not automatically trust recommender systems. They play with thesystem in order to check whether the recommender matches their tastes. A systemthat is optimized for utility (and therefore, e. g., does not recommend items theuser already knows) may in these scenarios fail to appear trustworthy as it does notrecommend items the user is sure to enjoy.
82
To generate useful recommendations it is crucial that users express their prefer-ences by contributing a large amount of ratings. Evaluating if and why users provideratings is therefore another important evaluation task on which we will focus sub-sequently.
Improve Profile With this goal the assumption is that users provide ratings inorder to improve their profiles and hence improve the quality of the recommendationsthey obtain.
Express Self For some users it is important to have a forum where they canexpress their opinions. They do not provide ratings in the first place to obtain betterrecommendations. For these users anonymity has to be considered. Some of themmay want to disclose their identity to the other users of the systems while others maynot. Further the ease of making the contribution is mentioned as an important aspecthere. By encouraging this kind of self-expression the recommender platform mayobtain more data that can be used to improve the quality of the recommendations.
Help Others Some users provide ratings supposing that the community benefitsfrom them. In many cases these users also contribute ratings to express themselves(see previous goal) however this is not always necessarily the case.
Influence Others Sometimes users have the undesired explicit intension toinfluence others to view or purchase particular items. For many platforms it mightbe interesting to evaluate how good the recommender system can prevent this task.
Our system targets the tasks find good items and recommender sequence. Toachieve the first goal, we evaluate how likely the labels extracted by our approach willenable the retrieval of relevant on topic resources. The second goal aims at judgingsequences of recommended items as a whole, instead of evaluating each recommendeditem separately. For that purpose we test the specificity of our extracted topics. Ifboth goals are achieved, we can generate recommendation lists that match differentinterest topics of the users and thus improve the diversity of the recommended items.
83
We do not aim at being able to calculate rating predictions for items as needed forthe annotation in context task and we assume that in most platforms many relevantitems for a user are available so that it will be sufficient to recommend only some ofthem. As we propose a switching hybrid recommender system that generates item-based collaborative filtering recommendations for new users we are confident thatwe can establish trust with new users as this algorithm is known to provide popular,high quality recommendations. However the task find credible recommender will alsonot be evaluated in our experiments.
Evaluating why users provide ratings is an important task for every deployedrecommender system. The motivations for users to vote depend on numerous factorssuch as the recommendation algorithm, the system interface, privacy settings, etc.In this work we propose a generic recommendation strategy that can be used forplatforms where users have multifaceted preferences. The reasons that motivateusers to provide ratings have to be evaluated for every system individually for thatreason such evaluations are not in the scope of this work. Subsequently we will reporton the challenges we faced evaluating the recommendation approaches proposedin this thesis and explain the reasoning behind the method that has finally beenapplied.
7.2 Evaluation of Our Research Hypotheses
For the topic-based resource recommendations we have to evaluate the followinghypotheses:
H1 Knowledge workers have different topics of interest.
H2 By applying topic detection algorithms on the users’ preferred resources we candetect these topics.
H3 The detected topics can be used to generate recommendation lists with a highdegree of diversity.
Concerning the mood-based music recommendations the following hypotheseshave to be evaluated:
H4 Many people listen to different styles of music.
84
H5 An active user’s preferred style of music depends on her mood.
The best way to validate whether these research hypotheses apply or not wouldbe to integrate our proposed approach into an online platform and to perform anevaluation as live user experiment (cf. Appendix E). In this experiment the userswould have to be asked about their actual topics of interest and preferred musicstyles, how well the labels extracted by our approach describe these interest topicsand music styles, and of course about the perceived diversity and quality of thegenerated recommendations. To validate H5 the users could be asked whether theyassociate their identified preferred music styles with certain moods. Unfortunately,in the course of this thesis we did not have the chance to integrate our approachinto an online platform with enough users.
H1 and H2 were first checked in a small user experiment using the ALOE systemdeployed in the Knowledge Management group of DFKI. However the participantgroup was rather small and biased. So we performed a second larger offline analysison the data base of the BibSonomy system. The goal of this analysis was to checkthe specificity of the topic labels extracted by our method. The assumption is thata label is specific for a certain topic when a query with the relevant terms of its labelwill pick many or all resources within the topic cluster and few or none resourcesoutside the cluster. We expect that specific labels will enable the retrieval of relevant,previously unknown on-topic resources for a user. However with this approach wecannot evaluate the quality of the recommendations which are provided on thisbasis. H4 has been evaluated in a similar offline experiment using listening historiesfrom the Last.fm platform. Further we checked whether the users’ preferred musicstyles we identified overlap with certain moods. For that purpose we crawled moodtags associated with artists from the Last.fm platform and checked the dominanceof moods within the extracted clusters. We will report about the detailed results ofour evaluation experiments in the following sections.
7.3 Evaluation of Topic-based Recommendations
As mentioned before, the evaluation of the topic-based resource recommendationapproach has been performed in a two-staged process. In the first stage we conducteda user study in which we checked whether the users of the ALOE system couldassociate the topic labels that have been identified by our approach with their actual
85
topics of interest. We report on the results of this study in Section 7.3.1. In thesecond stage we tested on a larger data set whether the terms of the extracted clusterlabels are likely to find resources matching the associated topics. The results of thisevaluation experiment are depicted in Section 7.3.2.
7.3.1 Subjective Evaluation Study
The subjective user evaluation study has been performed with a small participantgroup consisting of eight staff members of the Knowledge Management departmentof DFKI ([Schirru et al., 2010a]). Seven of the participants were researchers (juniorto senior), one participant was a software engineer. Every participant had expressedpreferences for at least twenty resources in the system. A questionnaire was sent tothese users showing the terms which represented their identified topics of interest.For each of these topics the users had to answer three questions:
Q1: Has the topic of interest correctly been detected?
Q2: How would you describe the topic in your own words?
Q3: Would you like to get recommendations for the topic?
Table 7.1 shows for each participant of the evaluation experiment, how manytopics were identified by the system, how many of them were classified as correctlyidentified by the user and for how many of these topics the user would appreciaterecommendations.
Altogether 39 user interest topics have been identified, on average 4.9 per user.32 of the topics were classified as correct by the users, i. e., on average four topicsper user. For 27 topics the users said that they would appreciate resource recom-mendations, 3.4 on average per user. Each user on average classified 84.17% of heridentified topics as correct. User C is an outlier, only one of three identified topicshas been classified as correctly identified.
With the results of this first evaluation experiment we were confident that ourapproach could identify interest topics covering a broad range of the participants’preferences. In most cases the extracted labels where expressive enough so that theusers could assign them to their corresponding actual interest topics. Also mostlyrecommendations for the identified topics were desired by the users. However theparticipant group was small and biased so we wanted to verify our findings in a
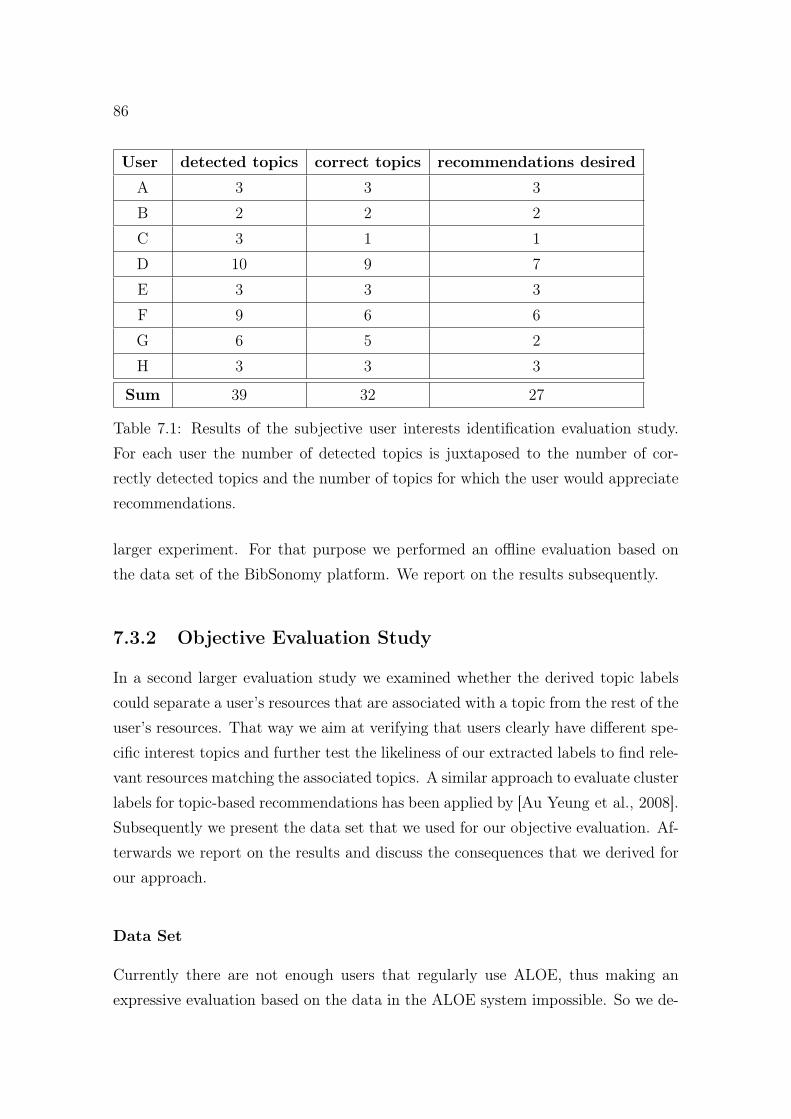
86
User detected topics correct topics recommendations desired
A 3 3 3
B 2 2 2
C 3 1 1
D 10 9 7
E 3 3 3
F 9 6 6
G 6 5 2
H 3 3 3
Sum 39 32 27
Table 7.1: Results of the subjective user interests identification evaluation study.For each user the number of detected topics is juxtaposed to the number of cor-rectly detected topics and the number of topics for which the user would appreciaterecommendations.
larger experiment. For that purpose we performed an offline evaluation based onthe data set of the BibSonomy platform. We report on the results subsequently.
7.3.2 Objective Evaluation Study
In a second larger evaluation study we examined whether the derived topic labelscould separate a user’s resources that are associated with a topic from the rest of theuser’s resources. That way we aim at verifying that users clearly have different spe-cific interest topics and further test the likeliness of our extracted labels to find rele-vant resources matching the associated topics. A similar approach to evaluate clusterlabels for topic-based recommendations has been applied by [Au Yeung et al., 2008].Subsequently we present the data set that we used for our objective evaluation. Af-terwards we report on the results and discuss the consequences that we derived forour approach.
Data Set
Currently there are not enough users that regularly use ALOE, thus making anexpressive evaluation based on the data in the ALOE system impossible. So we de-
87
cided to use the BibSonomy data set1 which is freely available for research purposes.BibSonomy is a social sharing platform for bookmarks (URLs) and publication ref-erences [Hotho et al., 2006a]. The provided data set consists of four tables:
• Table bibtex stores the bibtex entries that are associated with a shared publi-cation. It has 566,939 instances.
• Table bookmark contains the URLs and metadata of bookmark contributions.The data set comprises 275,410 instances.
• In table tas the tag assignments of bibtex entries and bookmarks are stored.There are 2,622,423 tag assignments by 6,569 users for 837,757 resources avail-able. Figure 7.1 shows the distribution of the number of tags. Figure 7.2presents the distribution of the number of tagged bookmarks.
• Further in table relation sub and super relations of tags are stored. The tablehas 11,292 instances.
From the figures we can observe a typical phenomenon of resource sharing plat-forms, i. e., the largest amount of users contributes only small or medium largeamounts of content and metadata. For instance 5302 of the 6569 users (≈ 80.71%)annotated 100 or less tags and 5833 users (≈ 88.8%) contributed 100 or less taggedresources.
In ALOE the users can share files and bookmarks. We decided to focus on theBibSonomy bookmarks for our evaluation as we consider them to best represent thedata and metadata in ALOE. As described in Chapter 5.3.1 we use titles and tags toconstruct metadata profiles of the resources from which the topics are determined.This metadata is also available for resources in the BibSonomy system. A minordifference is that in BibSonomy each resource only has one title annotated whereasin ALOE there is one title per user that has the resource in her portfolio.
When deploying a topic-based recommender system the current user interest top-ics should be extracted on a regular basis, e. g., once every week. We selected usersthat have contributed between 20 and 500 resources as we consider this amount asrepresentative to be contributed in such a time interval. From 503 users matching
1Knowledge and Data Engineering Group, University of Kassel: Benchmark Folksonomy Datafrom BibSonomy, version of July 1st, 2010
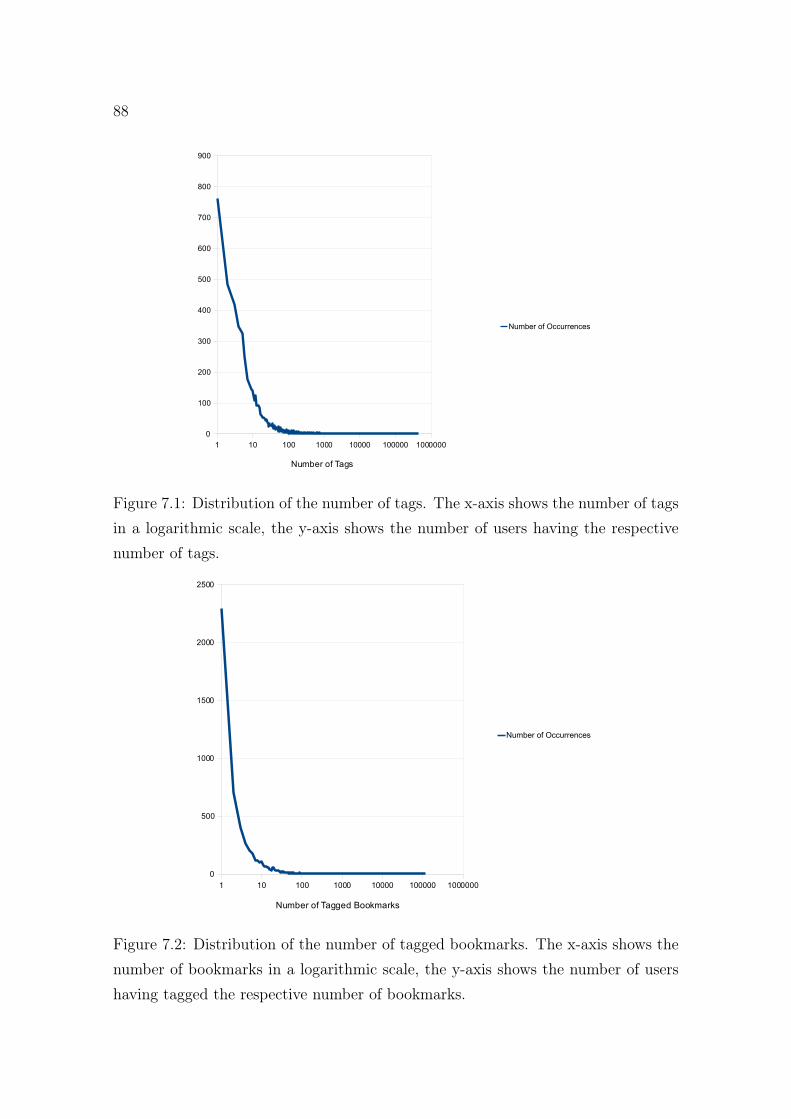
88Tabelle1
Seite 1
1 10 100 1000 10000 100000 1000000
0
100
200
300
400
500
600
700
800
900
Number of Occurrences
Number of Tags
Figure 7.1: Distribution of the number of tags. The x-axis shows the number of tagsin a logarithmic scale, the y-axis shows the number of users having the respectivenumber of tags.
Tabelle1
Seite 1
1 10 100 1000 10000 100000 1000000
0
500
1000
1500
2000
2500
Number of Occurrences
Number of Tagged Bookmarks
Figure 7.2: Distribution of the number of tagged bookmarks. The x-axis shows thenumber of bookmarks in a logarithmic scale, the y-axis shows the number of usershaving tagged the respective number of bookmarks.
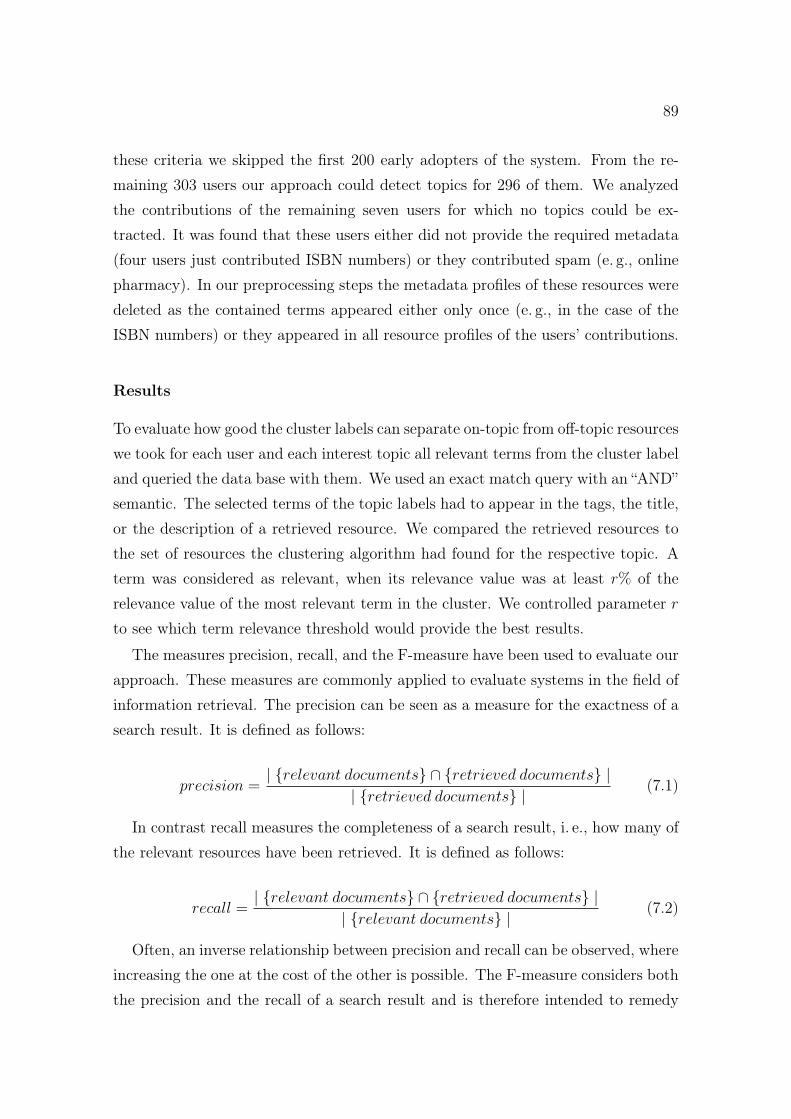
89
these criteria we skipped the first 200 early adopters of the system. From the re-maining 303 users our approach could detect topics for 296 of them. We analyzedthe contributions of the remaining seven users for which no topics could be ex-tracted. It was found that these users either did not provide the required metadata(four users just contributed ISBN numbers) or they contributed spam (e. g., onlinepharmacy). In our preprocessing steps the metadata profiles of these resources weredeleted as the contained terms appeared either only once (e. g., in the case of theISBN numbers) or they appeared in all resource profiles of the users’ contributions.
Results
To evaluate how good the cluster labels can separate on-topic from off-topic resourceswe took for each user and each interest topic all relevant terms from the cluster labeland queried the data base with them. We used an exact match query with an “AND”semantic. The selected terms of the topic labels had to appear in the tags, the title,or the description of a retrieved resource. We compared the retrieved resources tothe set of resources the clustering algorithm had found for the respective topic. Aterm was considered as relevant, when its relevance value was at least r% of therelevance value of the most relevant term in the cluster. We controlled parameter rto see which term relevance threshold would provide the best results.
The measures precision, recall, and the F-measure have been used to evaluate ourapproach. These measures are commonly applied to evaluate systems in the field ofinformation retrieval. The precision can be seen as a measure for the exactness of asearch result. It is defined as follows:
precision =| {relevant documents} ∩ {retrieved documents} |
| {retrieved documents} |(7.1)
In contrast recall measures the completeness of a search result, i. e., how many ofthe relevant resources have been retrieved. It is defined as follows:
recall =| {relevant documents} ∩ {retrieved documents} |
| {relevant documents} |(7.2)
Often, an inverse relationship between precision and recall can be observed, whereincreasing the one at the cost of the other is possible. The F-measure considers boththe precision and the recall of a search result and is therefore intended to remedy
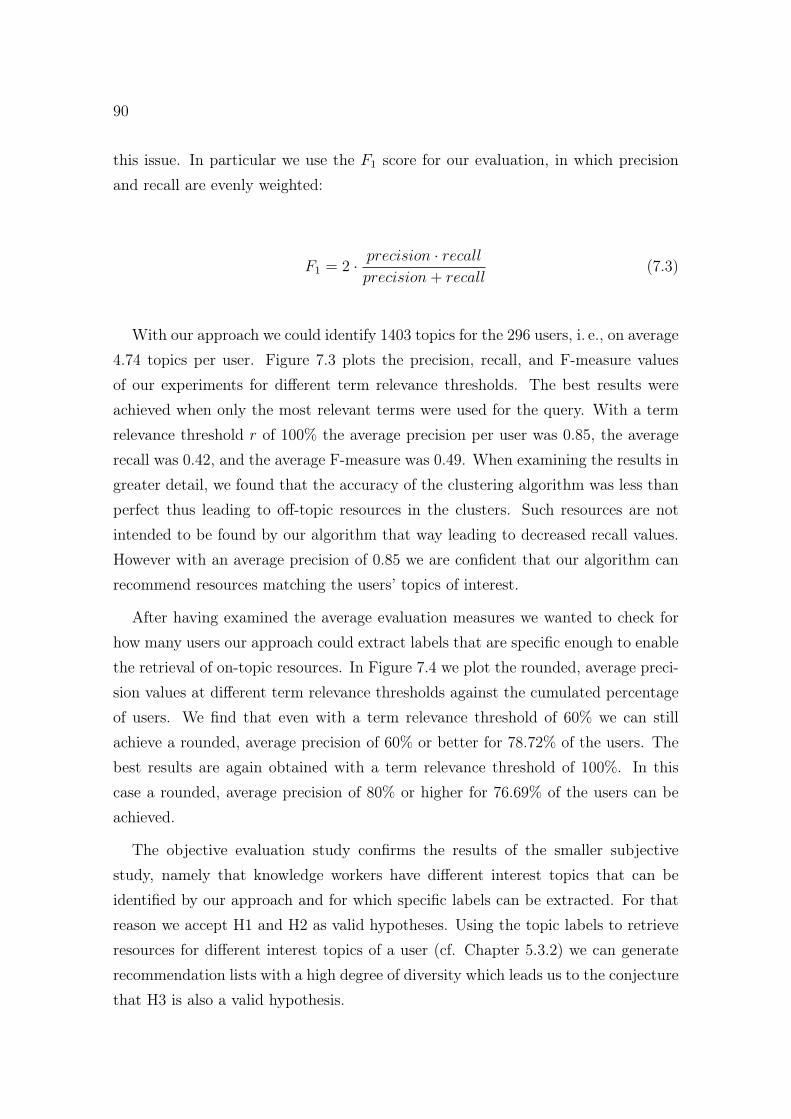
90
this issue. In particular we use the F1 score for our evaluation, in which precisionand recall are evenly weighted:
F1 = 2 · precision · recallprecision+ recall
(7.3)
With our approach we could identify 1403 topics for the 296 users, i. e., on average4.74 topics per user. Figure 7.3 plots the precision, recall, and F-measure valuesof our experiments for different term relevance thresholds. The best results wereachieved when only the most relevant terms were used for the query. With a termrelevance threshold r of 100% the average precision per user was 0.85, the averagerecall was 0.42, and the average F-measure was 0.49. When examining the results ingreater detail, we found that the accuracy of the clustering algorithm was less thanperfect thus leading to off-topic resources in the clusters. Such resources are notintended to be found by our algorithm that way leading to decreased recall values.However with an average precision of 0.85 we are confident that our algorithm canrecommend resources matching the users’ topics of interest.
After having examined the average evaluation measures we wanted to check forhow many users our approach could extract labels that are specific enough to enablethe retrieval of on-topic resources. In Figure 7.4 we plot the rounded, average preci-sion values at different term relevance thresholds against the cumulated percentageof users. We find that even with a term relevance threshold of 60% we can stillachieve a rounded, average precision of 60% or better for 78.72% of the users. Thebest results are again obtained with a term relevance threshold of 100%. In thiscase a rounded, average precision of 80% or higher for 76.69% of the users can beachieved.
The objective evaluation study confirms the results of the smaller subjectivestudy, namely that knowledge workers have different interest topics that can beidentified by our approach and for which specific labels can be extracted. For thatreason we accept H1 and H2 as valid hypotheses. Using the topic labels to retrieveresources for different interest topics of a user (cf. Chapter 5.3.2) we can generaterecommendation lists with a high degree of diversity which leads us to the conjecturethat H3 is also a valid hypothesis.
91
Sheet1
Page 1
0 0.2 0.4 0.6 0.8 1
0
0.1
0.2
0.3
0.4
0.5
0.6
0.7
0.8
0.9
Precision
Recall
F-Measure
Term Relevance Threshold
Figure 7.3: Evaluation of the topic labels by making use of precision, recall, andF-measure (y-axis). The x-axis shows the term relevance threshold that has beenused as control parameter.
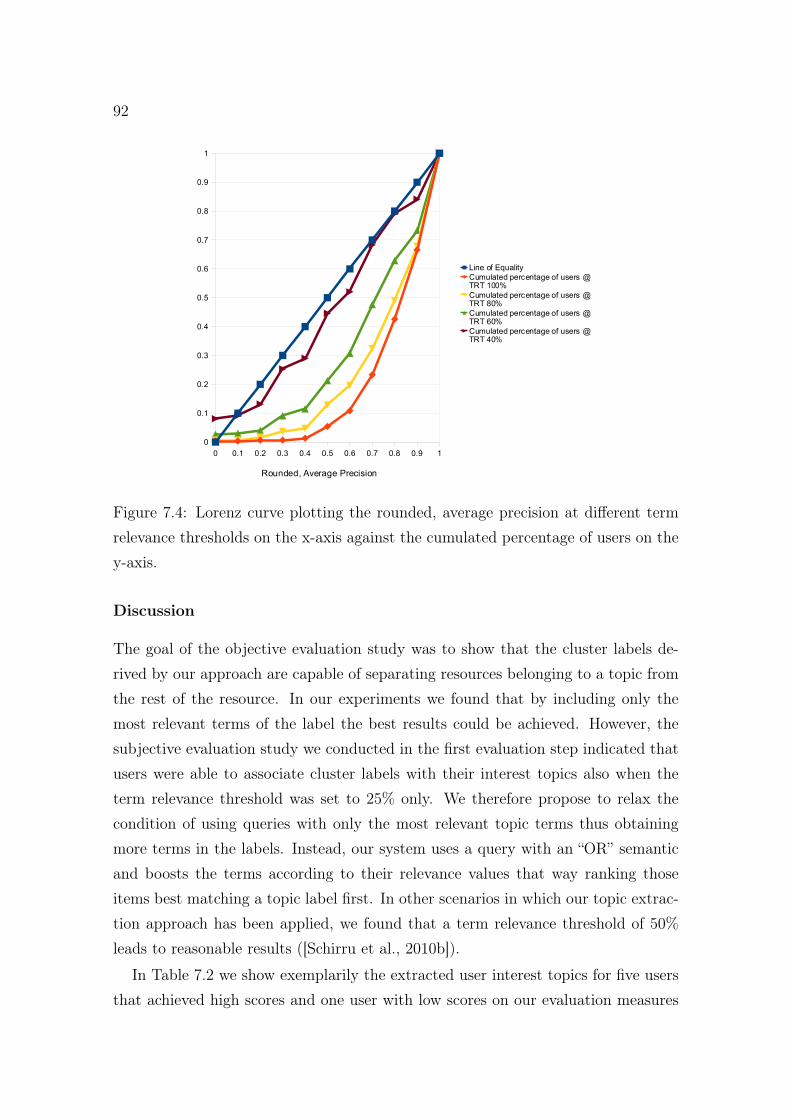
92Tabelle1
Seite 1
0 0.1 0.2 0.3 0.4 0.5 0.6 0.7 0.8 0.9 1
0
0.1
0.2
0.3
0.4
0.5
0.6
0.7
0.8
0.9
1
Line of Equality
Cumulated percentage of users @ TRT 100%
Cumulated percentage of users @ TRT 80%
Cumulated percentage of users @ TRT 60%
Cumulated percentage of users @ TRT 40%
Rounded, Average Precision
Figure 7.4: Lorenz curve plotting the rounded, average precision at different termrelevance thresholds on the x-axis against the cumulated percentage of users on they-axis.
Discussion
The goal of the objective evaluation study was to show that the cluster labels de-rived by our approach are capable of separating resources belonging to a topic fromthe rest of the resource. In our experiments we found that by including only themost relevant terms of the label the best results could be achieved. However, thesubjective evaluation study we conducted in the first evaluation step indicated thatusers were able to associate cluster labels with their interest topics also when theterm relevance threshold was set to 25% only. We therefore propose to relax thecondition of using queries with only the most relevant topic terms thus obtainingmore terms in the labels. Instead, our system uses a query with an “OR” semanticand boosts the terms according to their relevance values that way ranking thoseitems best matching a topic label first. In other scenarios in which our topic extrac-tion approach has been applied, we found that a term relevance threshold of 50%leads to reasonable results ([Schirru et al., 2010b]).
In Table 7.2 we show exemplarily the extracted user interest topics for five usersthat achieved high scores and one user with low scores on our evaluation measures
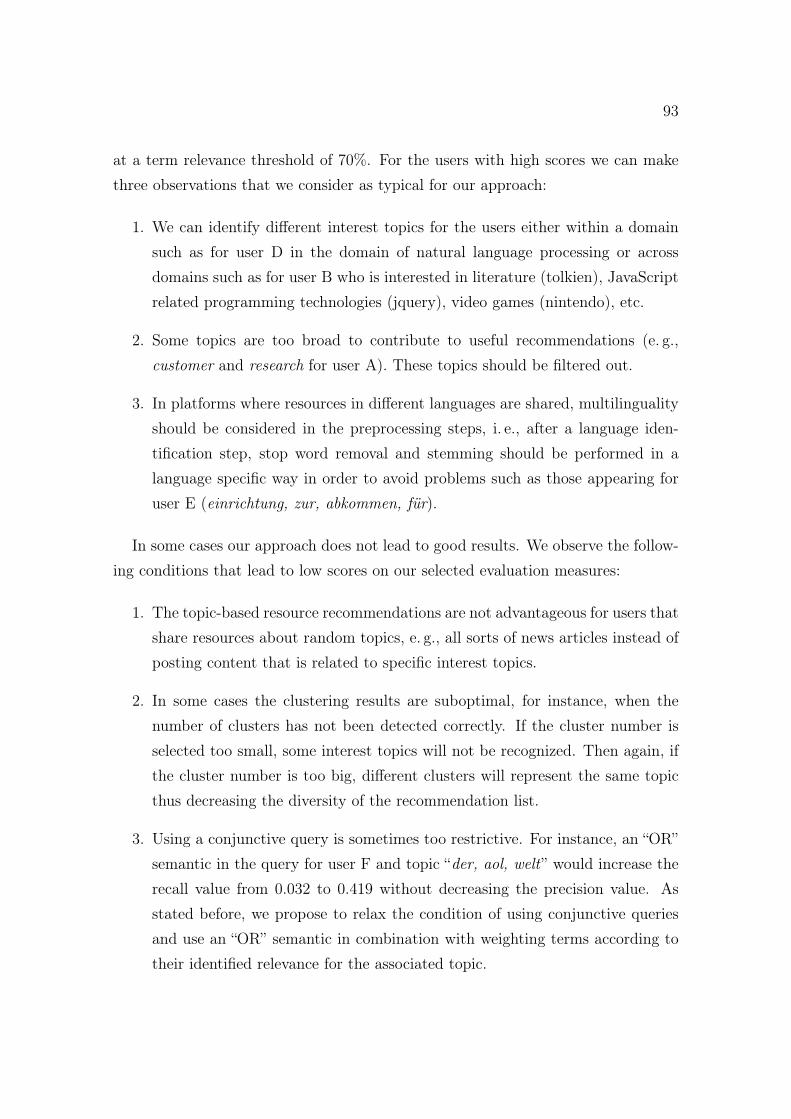
93
at a term relevance threshold of 70%. For the users with high scores we can makethree observations that we consider as typical for our approach:
1. We can identify different interest topics for the users either within a domainsuch as for user D in the domain of natural language processing or acrossdomains such as for user B who is interested in literature (tolkien), JavaScriptrelated programming technologies (jquery), video games (nintendo), etc.
2. Some topics are too broad to contribute to useful recommendations (e. g.,customer and research for user A). These topics should be filtered out.
3. In platforms where resources in different languages are shared, multilingualityshould be considered in the preprocessing steps, i. e., after a language iden-tification step, stop word removal and stemming should be performed in alanguage specific way in order to avoid problems such as those appearing foruser E (einrichtung, zur, abkommen, für).
In some cases our approach does not lead to good results. We observe the follow-ing conditions that lead to low scores on our selected evaluation measures:
1. The topic-based resource recommendations are not advantageous for users thatshare resources about random topics, e. g., all sorts of news articles instead ofposting content that is related to specific interest topics.
2. In some cases the clustering results are suboptimal, for instance, when thenumber of clusters has not been detected correctly. If the cluster number isselected too small, some interest topics will not be recognized. Then again, ifthe cluster number is too big, different clusters will represent the same topicthus decreasing the diversity of the recommendation list.
3. Using a conjunctive query is sometimes too restrictive. For instance, an “OR”semantic in the query for user F and topic “der, aol, welt” would increase therecall value from 0.032 to 0.419 without decreasing the precision value. Asstated before, we propose to relax the condition of using conjunctive queriesand use an “OR” semantic in combination with weighting terms according totheir identified relevance for the associated topic.
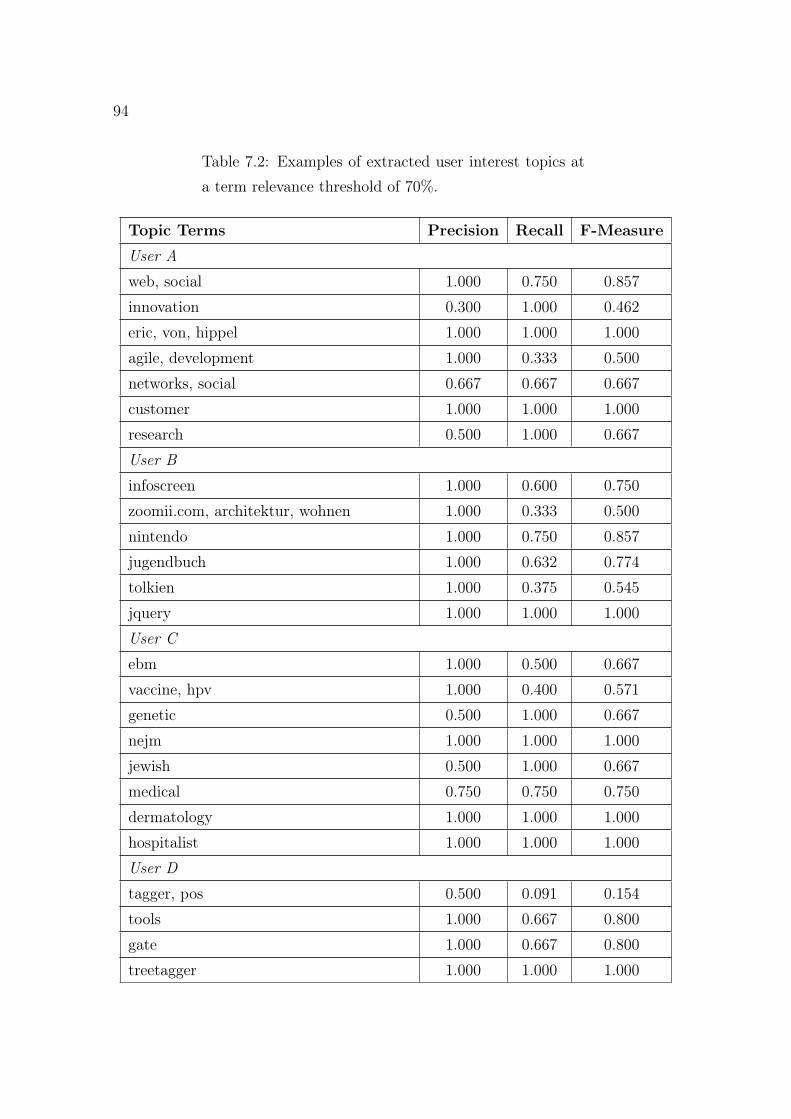
94
Table 7.2: Examples of extracted user interest topics ata term relevance threshold of 70%.
Topic Terms Precision Recall F-Measure
User A
web, social 1.000 0.750 0.857
innovation 0.300 1.000 0.462
eric, von, hippel 1.000 1.000 1.000
agile, development 1.000 0.333 0.500
networks, social 0.667 0.667 0.667
customer 1.000 1.000 1.000
research 0.500 1.000 0.667
User B
infoscreen 1.000 0.600 0.750
zoomii.com, architektur, wohnen 1.000 0.333 0.500
nintendo 1.000 0.750 0.857
jugendbuch 1.000 0.632 0.774
tolkien 1.000 0.375 0.545
jquery 1.000 1.000 1.000
User C
ebm 1.000 0.500 0.667
vaccine, hpv 1.000 0.400 0.571
genetic 0.500 1.000 0.667
nejm 1.000 1.000 1.000
jewish 0.500 1.000 0.667
medical 0.750 0.750 0.750
dermatology 1.000 1.000 1.000
hospitalist 1.000 1.000 1.000
User D
tagger, pos 0.500 0.091 0.154
tools 1.000 0.667 0.800
gate 1.000 0.667 0.800
treetagger 1.000 1.000 1.000
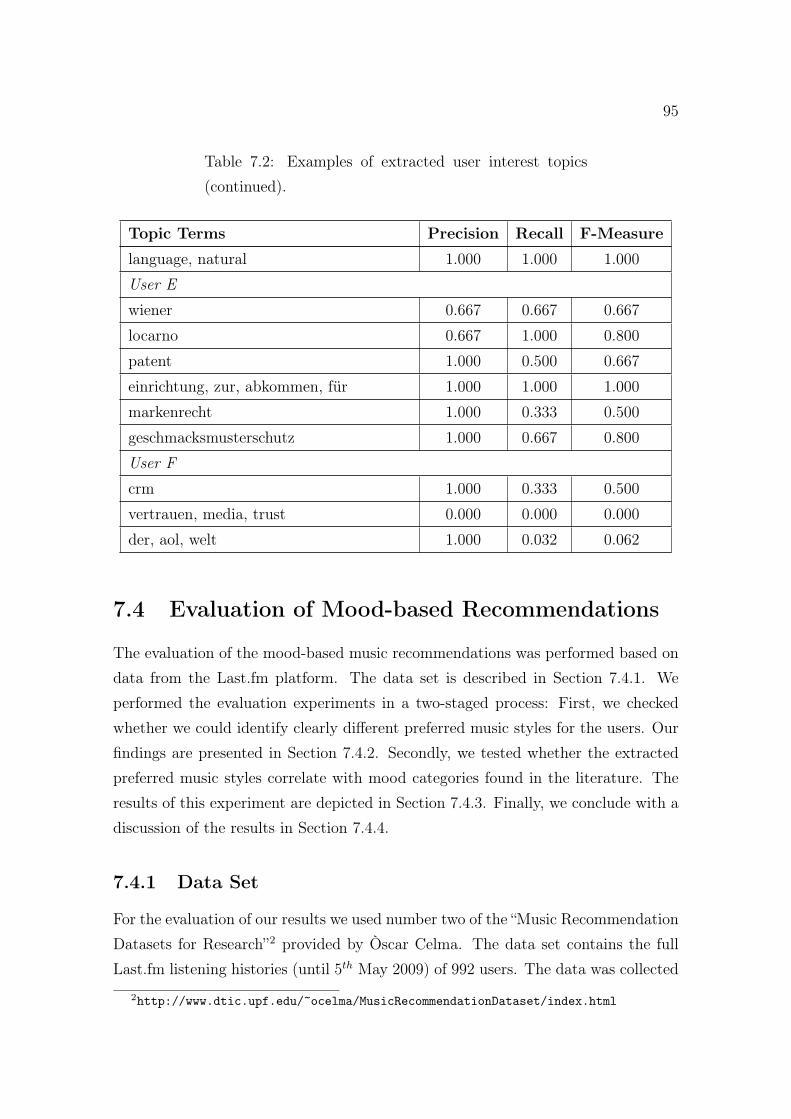
95
Table 7.2: Examples of extracted user interest topics(continued).
Topic Terms Precision Recall F-Measure
language, natural 1.000 1.000 1.000
User E
wiener 0.667 0.667 0.667
locarno 0.667 1.000 0.800
patent 1.000 0.500 0.667
einrichtung, zur, abkommen, für 1.000 1.000 1.000
markenrecht 1.000 0.333 0.500
geschmacksmusterschutz 1.000 0.667 0.800
User F
crm 1.000 0.333 0.500
vertrauen, media, trust 0.000 0.000 0.000
der, aol, welt 1.000 0.032 0.062
7.4 Evaluation of Mood-based Recommendations
The evaluation of the mood-based music recommendations was performed based ondata from the Last.fm platform. The data set is described in Section 7.4.1. Weperformed the evaluation experiments in a two-staged process: First, we checkedwhether we could identify clearly different preferred music styles for the users. Ourfindings are presented in Section 7.4.2. Secondly, we tested whether the extractedpreferred music styles correlate with mood categories found in the literature. Theresults of this experiment are depicted in Section 7.4.3. Finally, we conclude with adiscussion of the results in Section 7.4.4.
7.4.1 Data Set
For the evaluation of our results we used number two of the “Music RecommendationDatasets for Research”2 provided by Òscar Celma. The data set contains the fullLast.fm listening histories (until 5th May 2009) of 992 users. The data was collected
2http://www.dtic.upf.edu/~ocelma/MusicRecommendationDataset/index.html
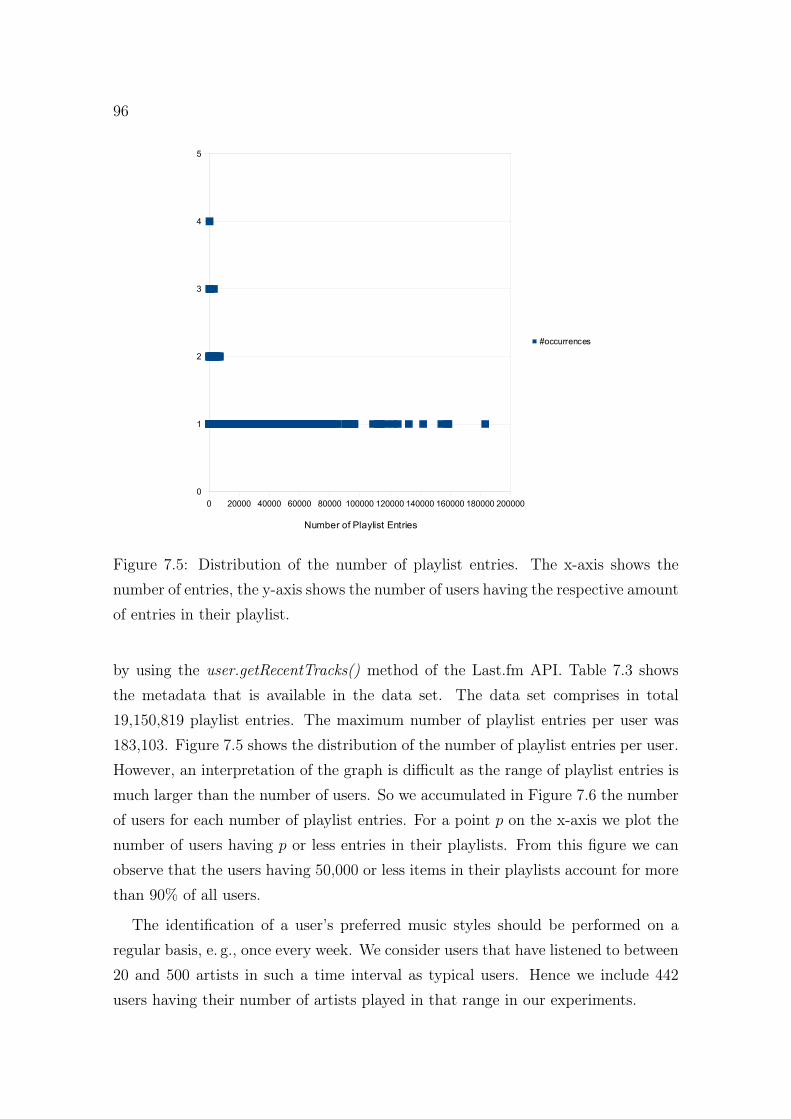
96Sheet1
Page 1
0 20000 40000 60000 80000 100000 120000 140000 160000 180000 200000
0
1
2
3
4
5
#occurrences
Number of Playlist Entries
Figure 7.5: Distribution of the number of playlist entries. The x-axis shows thenumber of entries, the y-axis shows the number of users having the respective amountof entries in their playlist.
by using the user.getRecentTracks() method of the Last.fm API. Table 7.3 showsthe metadata that is available in the data set. The data set comprises in total19,150,819 playlist entries. The maximum number of playlist entries per user was183,103. Figure 7.5 shows the distribution of the number of playlist entries per user.However, an interpretation of the graph is difficult as the range of playlist entries ismuch larger than the number of users. So we accumulated in Figure 7.6 the numberof users for each number of playlist entries. For a point p on the x-axis we plot thenumber of users having p or less entries in their playlists. From this figure we canobserve that the users having 50,000 or less items in their playlists account for morethan 90% of all users.
The identification of a user’s preferred music styles should be performed on aregular basis, e. g., once every week. We consider users that have listened to between20 and 500 artists in such a time interval as typical users. Hence we include 442users having their number of artists played in that range in our experiments.
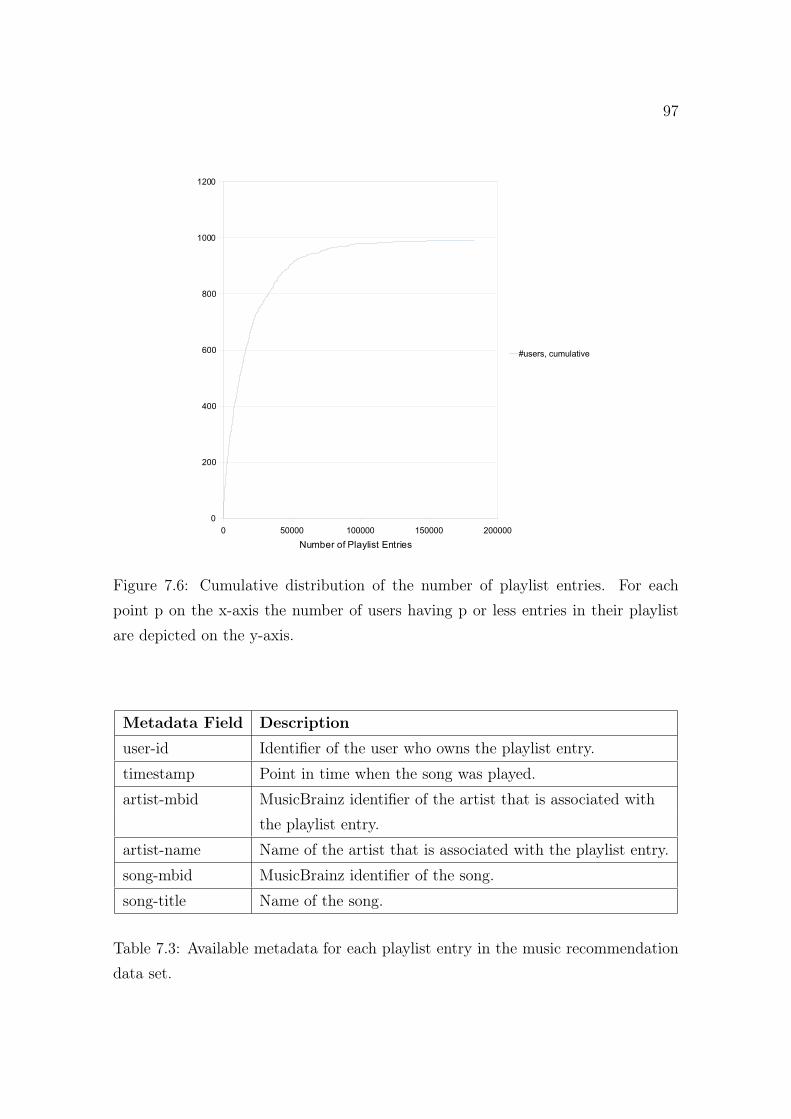
97
Sheet1
Page 1
0 50000 100000 150000 200000
0
200
400
600
800
1000
1200
#users, cumulative
Number of Playlist Entries
Figure 7.6: Cumulative distribution of the number of playlist entries. For eachpoint p on the x-axis the number of users having p or less entries in their playlistare depicted on the y-axis.
Metadata Field Description
user-id Identifier of the user who owns the playlist entry.
timestamp Point in time when the song was played.
artist-mbid MusicBrainz identifier of the artist that is associated withthe playlist entry.
artist-name Name of the artist that is associated with the playlist entry.
song-mbid MusicBrainz identifier of the song.
song-title Name of the song.
Table 7.3: Available metadata for each playlist entry in the music recommendationdata set.
98
7.4.2 Results: Identification of Preferred Music Styles
As with the evaluation of the cluster labels for the topic-based resource recommen-dations, the goal of the evaluation of the cluster labels for the mood-based musicrecommendations was to check how well the features of a label could distinguish theartists in a cluster from the rest of the artists. For that purpose we determined thesupport of a label in a cluster as well as its confidence.
According to [Witten and Frank, 2005] (page 69) the support of an associationrule measures the number of instances to which the rule correctly applies. It mayalso be specified as the percentage of instances to which the rule correctly appliesover the total number of instances instead. In the context of our cluster labels wedefine the support of a label in its associated cluster as follows:
support =#matching cluster items
#cluster items(7.4)
Please note that this definition of support corresponds to the definition of recallin information retrieval scenarios.
On the other hand confidence measures the number of instances to which a rulecorrectly applies, expressed as a proportion to the number of all instances to whichit applies. For the evaluation of our cluster labels we define confidence as follows:
confidence =#matching cluster items
#matching items(7.5)
Please note again that this definition of confidence corresponds to the definitionof precision in information retrieval scenarios.
As the support can be increased at the cost of confidence and vice versa againwe calculate their harmonic mean as our measure of choice to determine the bestsolution:
harmonic-mean = 2 · support · confidencesupport+ confidence
(7.6)
In the evaluation experiment we wanted to show that our approach could generatelabels that describe a user’s preferred music styles precisely. When a label is specificfor a music style it has a high support in its respective cluster (i. e., it matches manyitems in the cluster) and it has a high confidence (i. e., it does not match too manyitems outside the cluster).
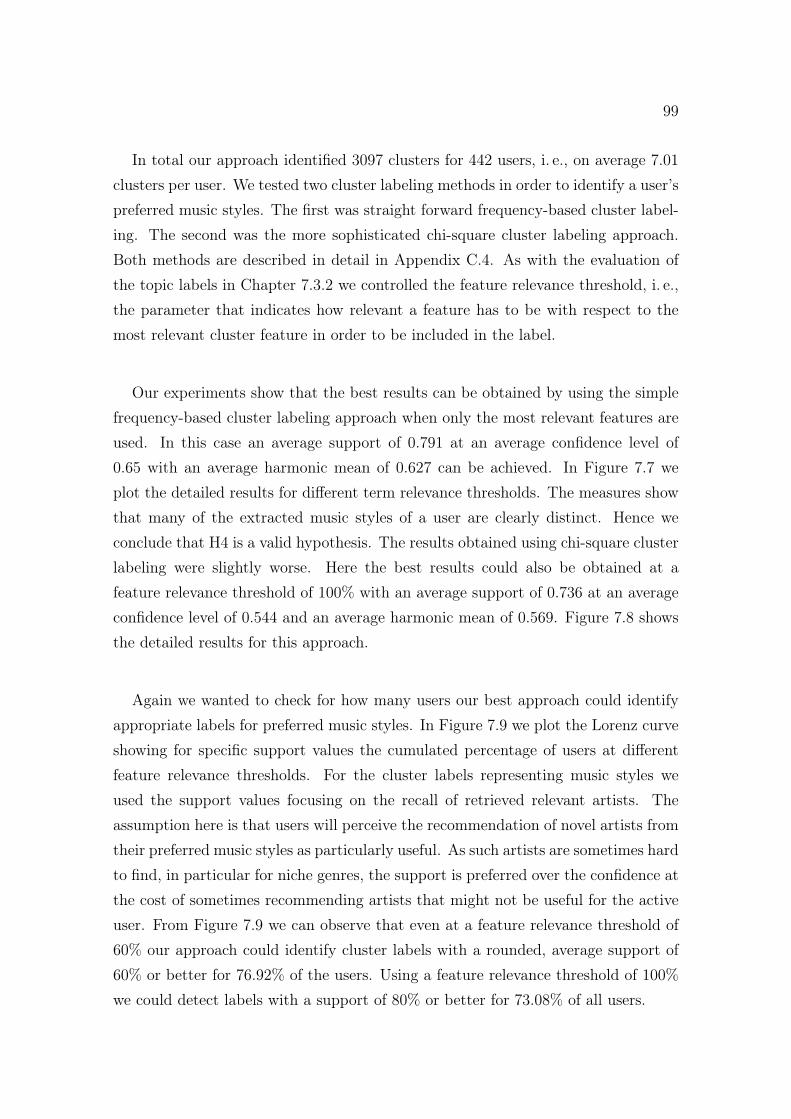
99
In total our approach identified 3097 clusters for 442 users, i. e., on average 7.01clusters per user. We tested two cluster labeling methods in order to identify a user’spreferred music styles. The first was straight forward frequency-based cluster label-ing. The second was the more sophisticated chi-square cluster labeling approach.Both methods are described in detail in Appendix C.4. As with the evaluation ofthe topic labels in Chapter 7.3.2 we controlled the feature relevance threshold, i. e.,the parameter that indicates how relevant a feature has to be with respect to themost relevant cluster feature in order to be included in the label.
Our experiments show that the best results can be obtained by using the simplefrequency-based cluster labeling approach when only the most relevant features areused. In this case an average support of 0.791 at an average confidence level of0.65 with an average harmonic mean of 0.627 can be achieved. In Figure 7.7 weplot the detailed results for different term relevance thresholds. The measures showthat many of the extracted music styles of a user are clearly distinct. Hence weconclude that H4 is a valid hypothesis. The results obtained using chi-square clusterlabeling were slightly worse. Here the best results could also be obtained at afeature relevance threshold of 100% with an average support of 0.736 at an averageconfidence level of 0.544 and an average harmonic mean of 0.569. Figure 7.8 showsthe detailed results for this approach.
Again we wanted to check for how many users our best approach could identifyappropriate labels for preferred music styles. In Figure 7.9 we plot the Lorenz curveshowing for specific support values the cumulated percentage of users at differentfeature relevance thresholds. For the cluster labels representing music styles weused the support values focusing on the recall of retrieved relevant artists. Theassumption here is that users will perceive the recommendation of novel artists fromtheir preferred music styles as particularly useful. As such artists are sometimes hardto find, in particular for niche genres, the support is preferred over the confidence atthe cost of sometimes recommending artists that might not be useful for the activeuser. From Figure 7.9 we can observe that even at a feature relevance threshold of60% our approach could identify cluster labels with a rounded, average support of60% or better for 76.92% of the users. Using a feature relevance threshold of 100%we could detect labels with a support of 80% or better for 73.08% of all users.
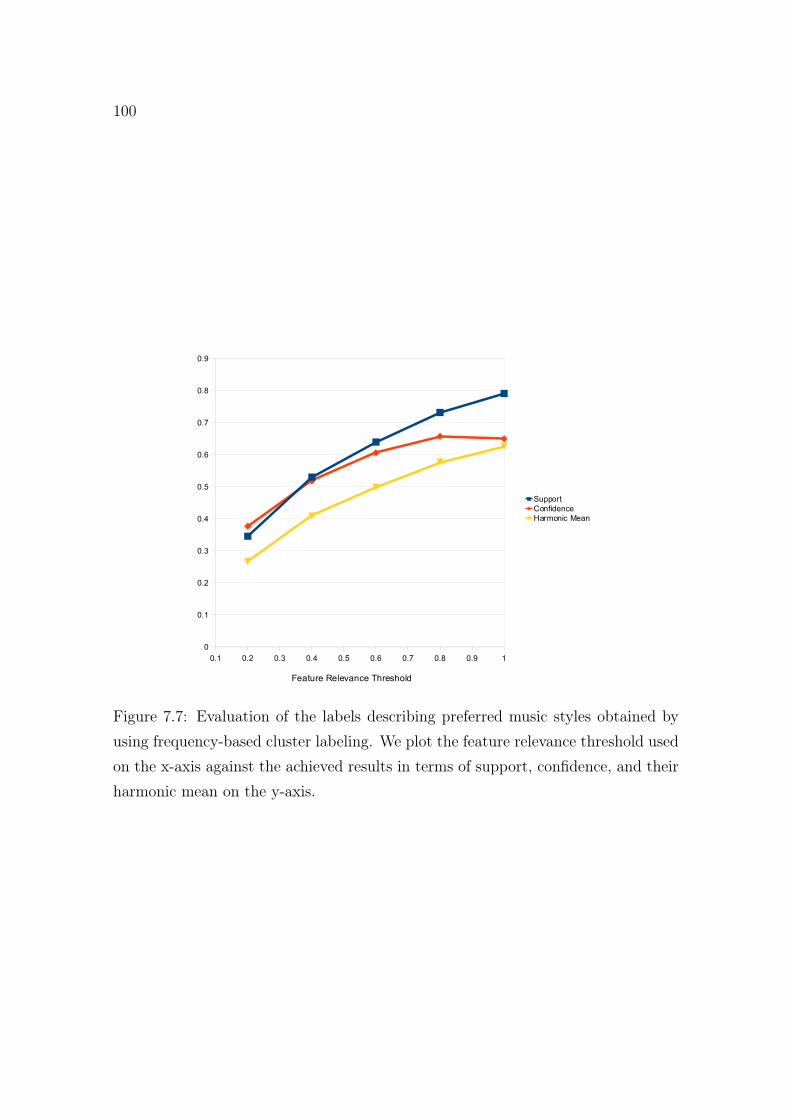
100
Tabelle1
Seite 1
0.1 0.2 0.3 0.4 0.5 0.6 0.7 0.8 0.9 1
0
0.1
0.2
0.3
0.4
0.5
0.6
0.7
0.8
0.9
Support
Confidence
Harmonic Mean
Feature Relevance Threshold
Figure 7.7: Evaluation of the labels describing preferred music styles obtained byusing frequency-based cluster labeling. We plot the feature relevance threshold usedon the x-axis against the achieved results in terms of support, confidence, and theirharmonic mean on the y-axis.
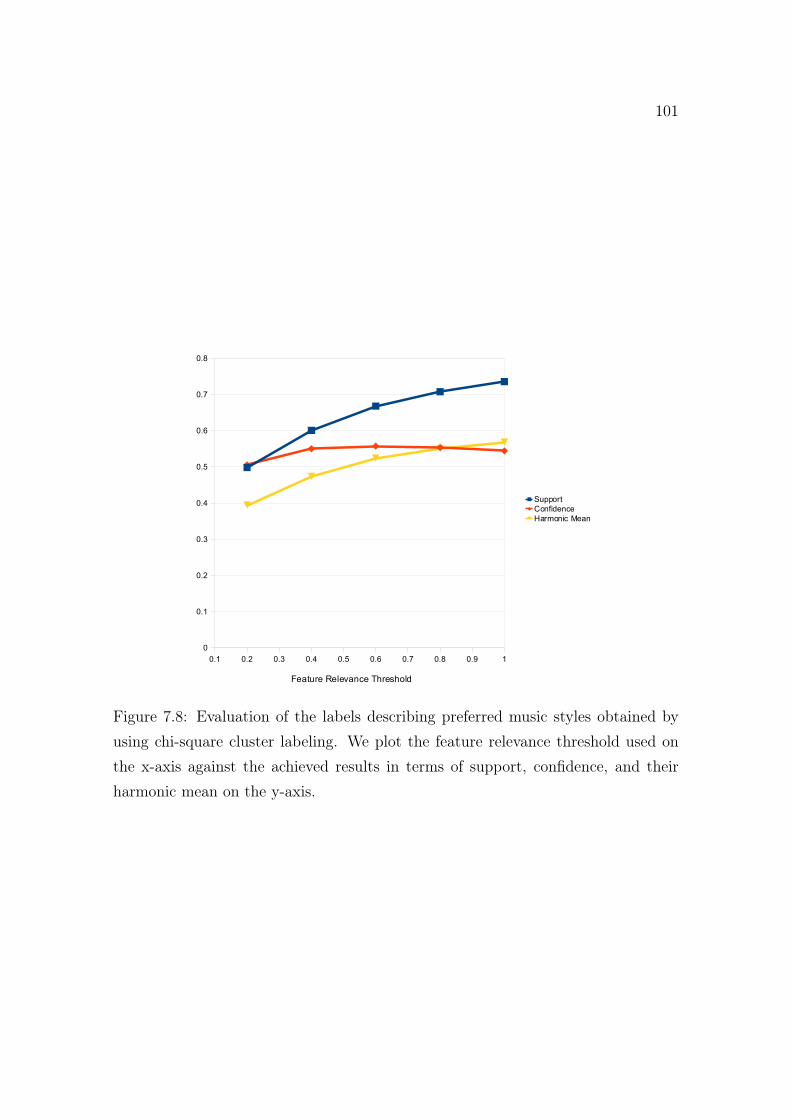
101
Tabelle1
Seite 1
0.1 0.2 0.3 0.4 0.5 0.6 0.7 0.8 0.9 1
0
0.1
0.2
0.3
0.4
0.5
0.6
0.7
0.8
Support
Confidence
Harmonic Mean
Feature Relevance Threshold
Figure 7.8: Evaluation of the labels describing preferred music styles obtained byusing chi-square cluster labeling. We plot the feature relevance threshold used onthe x-axis against the achieved results in terms of support, confidence, and theirharmonic mean on the y-axis.
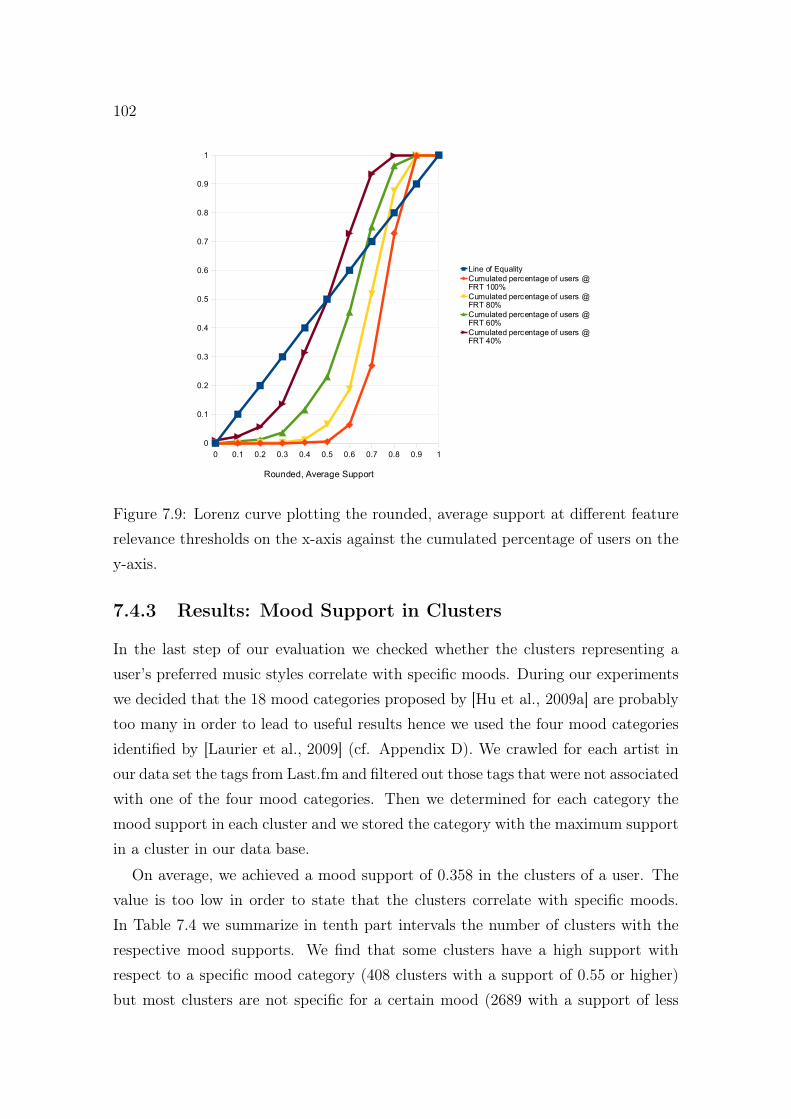
102Tabelle1
Seite 1
0 0.1 0.2 0.3 0.4 0.5 0.6 0.7 0.8 0.9 1
0
0.1
0.2
0.3
0.4
0.5
0.6
0.7
0.8
0.9
1
Line of Equality
Cumulated percentage of users @ FRT 100%
Cumulated percentage of users @ FRT 80%
Cumulated percentage of users @ FRT 60%
Cumulated percentage of users @ FRT 40%
Rounded, Average Support
Figure 7.9: Lorenz curve plotting the rounded, average support at different featurerelevance thresholds on the x-axis against the cumulated percentage of users on they-axis.
7.4.3 Results: Mood Support in Clusters
In the last step of our evaluation we checked whether the clusters representing auser’s preferred music styles correlate with specific moods. During our experimentswe decided that the 18 mood categories proposed by [Hu et al., 2009a] are probablytoo many in order to lead to useful results hence we used the four mood categoriesidentified by [Laurier et al., 2009] (cf. Appendix D). We crawled for each artist inour data set the tags from Last.fm and filtered out those tags that were not associatedwith one of the four mood categories. Then we determined for each category themood support in each cluster and we stored the category with the maximum supportin a cluster in our data base.
On average, we achieved a mood support of 0.358 in the clusters of a user. Thevalue is too low in order to state that the clusters correlate with specific moods.In Table 7.4 we summarize in tenth part intervals the number of clusters with therespective mood supports. We find that some clusters have a high support withrespect to a specific mood category (408 clusters with a support of 0.55 or higher)but most clusters are not specific for a certain mood (2689 with a support of less
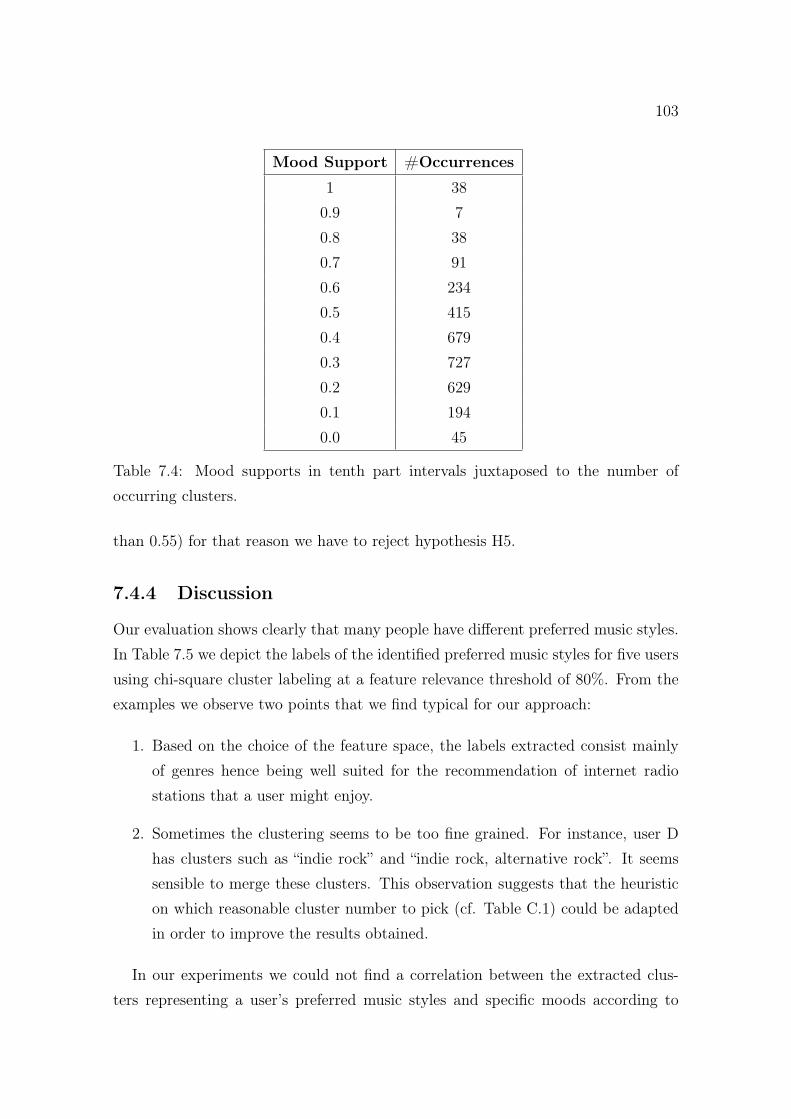
103
Mood Support #Occurrences
1 380.9 70.8 380.7 910.6 2340.5 4150.4 6790.3 7270.2 6290.1 1940.0 45
Table 7.4: Mood supports in tenth part intervals juxtaposed to the number ofoccurring clusters.
than 0.55) for that reason we have to reject hypothesis H5.
7.4.4 Discussion
Our evaluation shows clearly that many people have different preferred music styles.In Table 7.5 we depict the labels of the identified preferred music styles for five usersusing chi-square cluster labeling at a feature relevance threshold of 80%. From theexamples we observe two points that we find typical for our approach:
1. Based on the choice of the feature space, the labels extracted consist mainlyof genres hence being well suited for the recommendation of internet radiostations that a user might enjoy.
2. Sometimes the clustering seems to be too fine grained. For instance, user Dhas clusters such as “indie rock” and “indie rock, alternative rock”. It seemssensible to merge these clusters. This observation suggests that the heuristicon which reasonable cluster number to pick (cf. Table C.1) could be adaptedin order to improve the results obtained.
In our experiments we could not find a correlation between the extracted clus-ters representing a user’s preferred music styles and specific moods according to
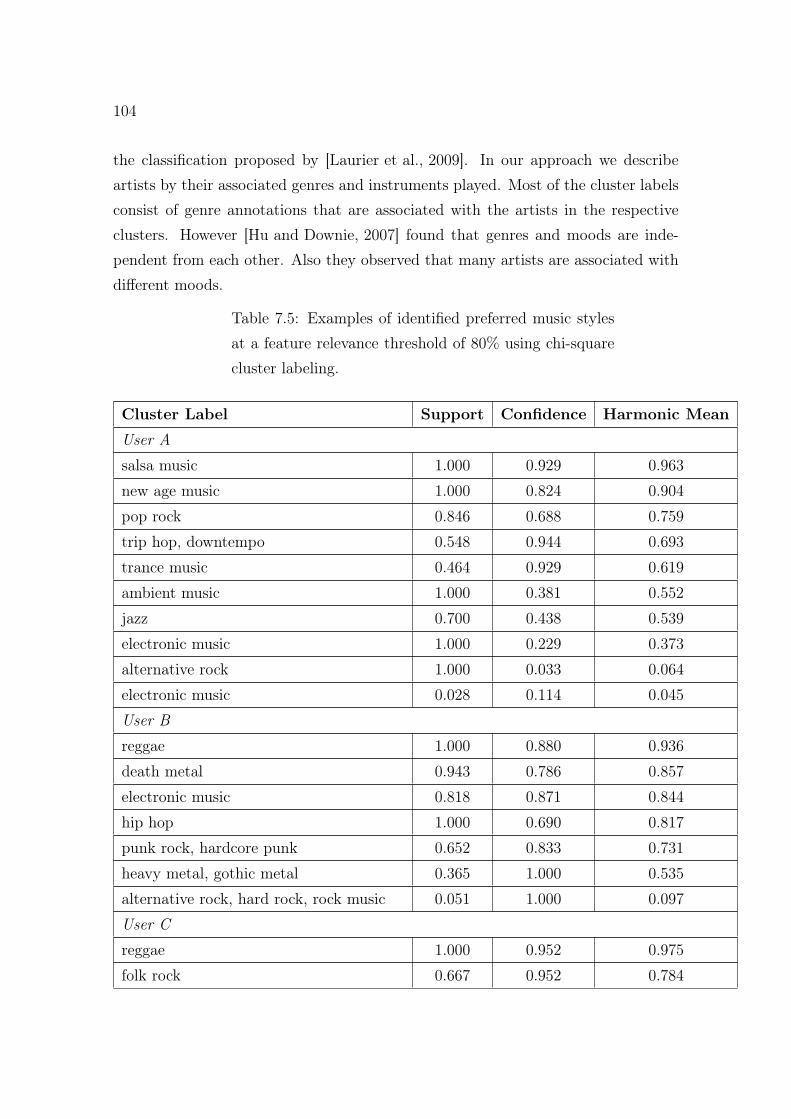
104
the classification proposed by [Laurier et al., 2009]. In our approach we describeartists by their associated genres and instruments played. Most of the cluster labelsconsist of genre annotations that are associated with the artists in the respectiveclusters. However [Hu and Downie, 2007] found that genres and moods are inde-pendent from each other. Also they observed that many artists are associated withdifferent moods.
Table 7.5: Examples of identified preferred music stylesat a feature relevance threshold of 80% using chi-squarecluster labeling.
Cluster Label Support Confidence Harmonic Mean
User A
salsa music 1.000 0.929 0.963
new age music 1.000 0.824 0.904
pop rock 0.846 0.688 0.759
trip hop, downtempo 0.548 0.944 0.693
trance music 0.464 0.929 0.619
ambient music 1.000 0.381 0.552
jazz 0.700 0.438 0.539
electronic music 1.000 0.229 0.373
alternative rock 1.000 0.033 0.064
electronic music 0.028 0.114 0.045
User B
reggae 1.000 0.880 0.936
death metal 0.943 0.786 0.857
electronic music 0.818 0.871 0.844
hip hop 1.000 0.690 0.817
punk rock, hardcore punk 0.652 0.833 0.731
heavy metal, gothic metal 0.365 1.000 0.535
alternative rock, hard rock, rock music 0.051 1.000 0.097
User C
reggae 1.000 0.952 0.975
folk rock 0.667 0.952 0.784
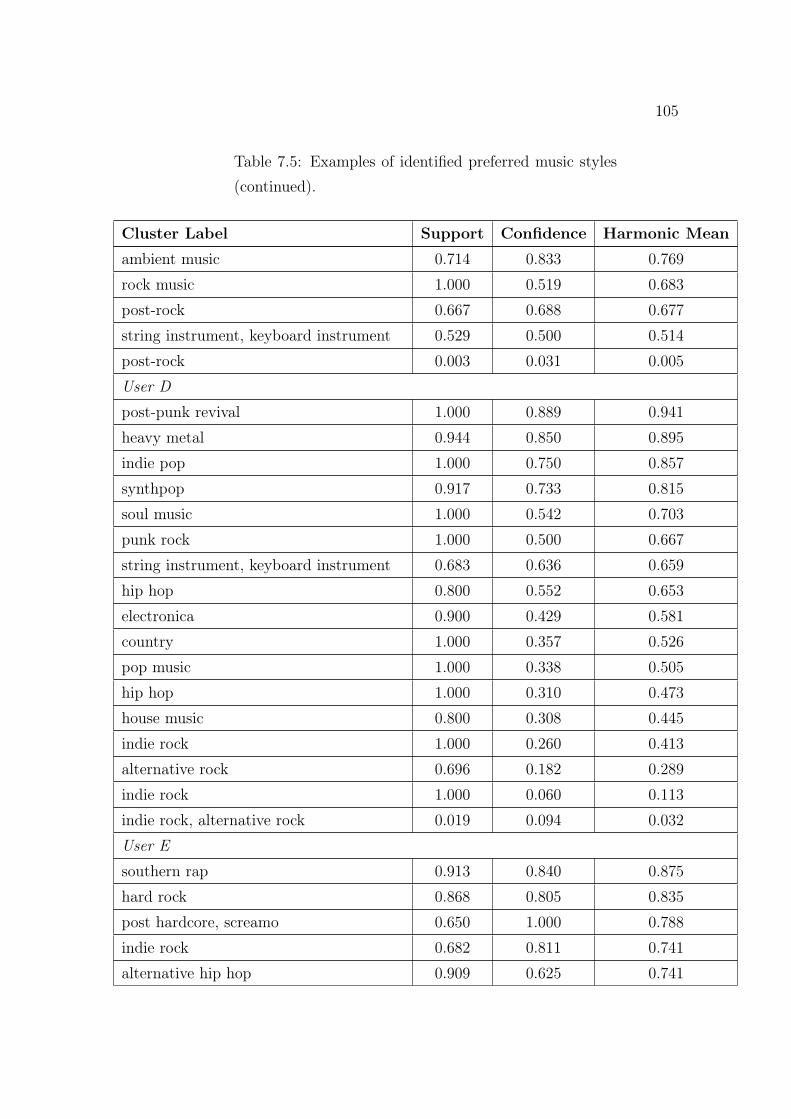
105
Table 7.5: Examples of identified preferred music styles(continued).
Cluster Label Support Confidence Harmonic Mean
ambient music 0.714 0.833 0.769
rock music 1.000 0.519 0.683
post-rock 0.667 0.688 0.677
string instrument, keyboard instrument 0.529 0.500 0.514
post-rock 0.003 0.031 0.005
User D
post-punk revival 1.000 0.889 0.941
heavy metal 0.944 0.850 0.895
indie pop 1.000 0.750 0.857
synthpop 0.917 0.733 0.815
soul music 1.000 0.542 0.703
punk rock 1.000 0.500 0.667
string instrument, keyboard instrument 0.683 0.636 0.659
hip hop 0.800 0.552 0.653
electronica 0.900 0.429 0.581
country 1.000 0.357 0.526
pop music 1.000 0.338 0.505
hip hop 1.000 0.310 0.473
house music 0.800 0.308 0.445
indie rock 1.000 0.260 0.413
alternative rock 0.696 0.182 0.289
indie rock 1.000 0.060 0.113
indie rock, alternative rock 0.019 0.094 0.032
User E
southern rap 0.913 0.840 0.875
hard rock 0.868 0.805 0.835
post hardcore, screamo 0.650 1.000 0.788
indie rock 0.682 0.811 0.741
alternative hip hop 0.909 0.625 0.741
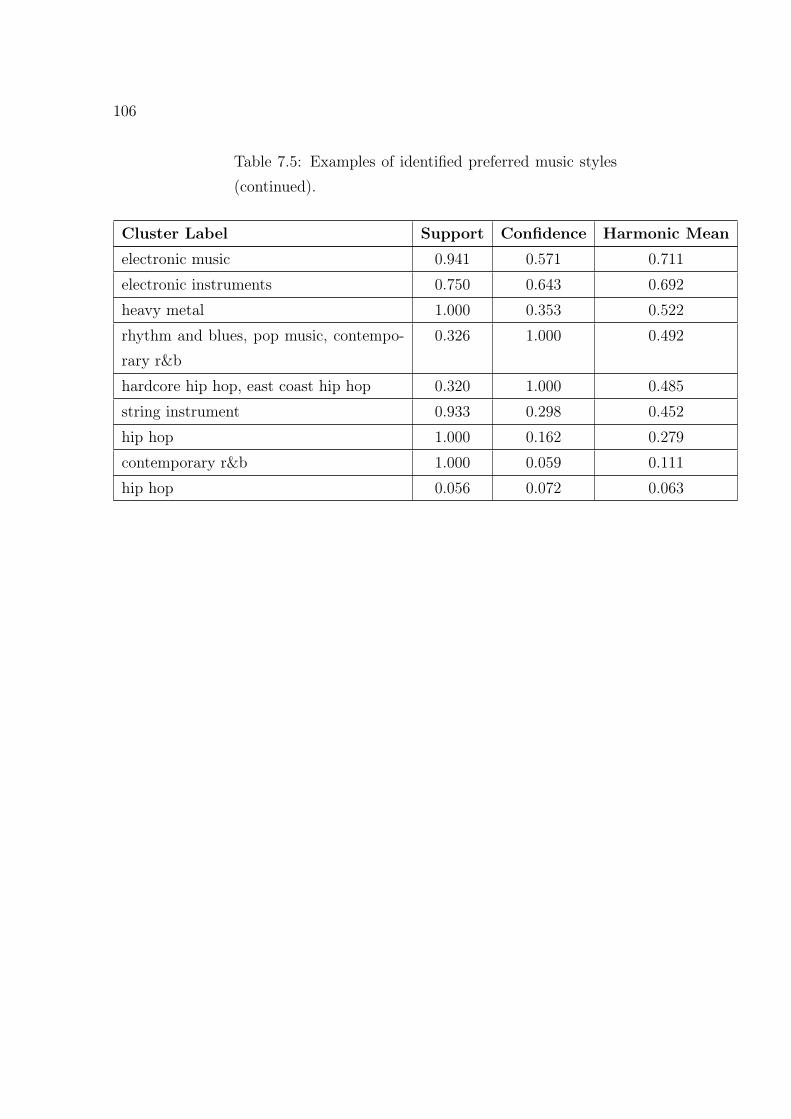
106
Table 7.5: Examples of identified preferred music styles(continued).
Cluster Label Support Confidence Harmonic Mean
electronic music 0.941 0.571 0.711
electronic instruments 0.750 0.643 0.692
heavy metal 1.000 0.353 0.522
rhythm and blues, pop music, contempo-rary r&b
0.326 1.000 0.492
hardcore hip hop, east coast hip hop 0.320 1.000 0.485
string instrument 0.933 0.298 0.452
hip hop 1.000 0.162 0.279
contemporary r&b 1.000 0.059 0.111
hip hop 0.056 0.072 0.063
Chapter 8
Related Work
In this chapter we summarize and discuss related work in the fields of topic-basedresource recommendations (Section 8.1) and mood-based music recommendations(Section 8.2) respectively.
8.1 Topic-based Resource Recommendations
An early recommender system that takes into account the user’s different topics ofinterest was the Fab system, proposed by [Balabanovic and Shoham, 1997]. Fab is adistributed content-based, collaborative recommender system. The recommendationprocess is divided into two stages: First is the collection of items from the Webaccording to different interest topics. For each topic a collection agent exists thatmaintains a content-based profile thus allowing it to gather relevant pages for therespective topic. The topics are computer generated clusters of interests that trackthe changing preferences of the user population. Second is the selection stage. Foreach user, an individual selection agent maintains a content-based user profile, thatway allowing the delivery of pages gathered from the collection agents according tothe user’s preferences. Figure 8.1 illustrates the two-staged process. In Fab the usersprovide feedback for resources by explicit ratings. The users’ ratings are stored ineach user’s individual selection agent and are forwarded to the respective collectionagents. The collection agents then adapt their profiles accordingly. Pages that havebeen rated highly by a user are recommended to other users with similar profiles. InFab each collection agent retrieves items according to a topic of interest that is sharedby many users. In contrast, our approach for topic-based resource recommendations
107
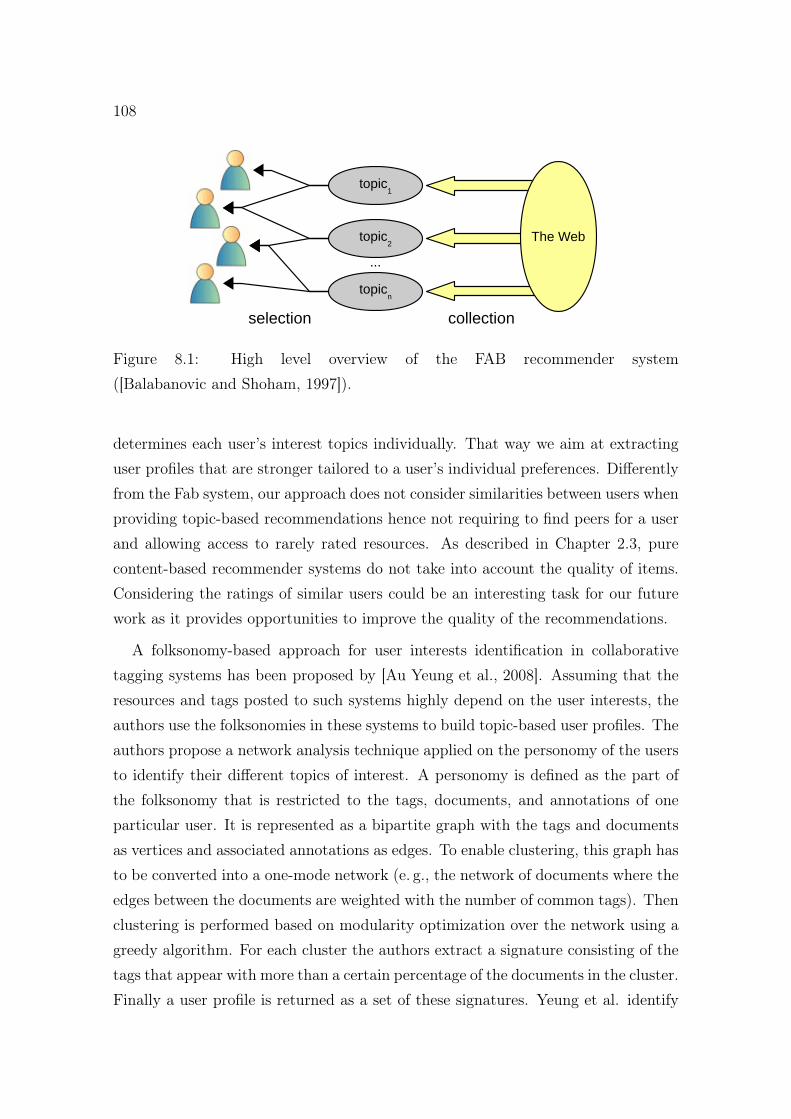
108
topic1
topic2
topicn
...
selection collection
The Web
Figure 8.1: High level overview of the FAB recommender system([Balabanovic and Shoham, 1997]).
determines each user’s interest topics individually. That way we aim at extractinguser profiles that are stronger tailored to a user’s individual preferences. Differentlyfrom the Fab system, our approach does not consider similarities between users whenproviding topic-based recommendations hence not requiring to find peers for a userand allowing access to rarely rated resources. As described in Chapter 2.3, purecontent-based recommender systems do not take into account the quality of items.Considering the ratings of similar users could be an interesting task for our futurework as it provides opportunities to improve the quality of the recommendations.
A folksonomy-based approach for user interests identification in collaborativetagging systems has been proposed by [Au Yeung et al., 2008]. Assuming that theresources and tags posted to such systems highly depend on the user interests, theauthors use the folksonomies in these systems to build topic-based user profiles. Theauthors propose a network analysis technique applied on the personomy of the usersto identify their different topics of interest. A personomy is defined as the part ofthe folksonomy that is restricted to the tags, documents, and annotations of oneparticular user. It is represented as a bipartite graph with the tags and documentsas vertices and associated annotations as edges. To enable clustering, this graph hasto be converted into a one-mode network (e. g., the network of documents where theedges between the documents are weighted with the number of common tags). Thenclustering is performed based on modularity optimization over the network using agreedy algorithm. For each cluster the authors extract a signature consisting of thetags that appear with more than a certain percentage of the documents in the cluster.Finally a user profile is returned as a set of these signatures. Yeung et al. identify
109
a set of tags per user interest topic. This is similar to our approach extracting aweighted term vector for each interest topic of a user. However, a major differencebetween the two approaches is that Yeung et al. do not exploit the user-contributedmetadata of other users for shared bookmarks. Hence, collective intelligence in notharnessed to obtain a proper resource description. From our perspective this has twodrawbacks. First, a user’s profile extracted with the proposed approach only reflectsher personal vocabulary, thus ignoring how other users would describe bookmarksof certain topics. We assume that this might complicate the process of retrievingresources matching a specific topic. Second, for users that do not tag their resourcesinterest topics cannot be extracted. However, the authors report that this appliesto only 246 users of their test set of 9,431 users.
[Guo and Joshi, 2010] propose a topic-based recommendation framework inte-grating the tag annotations of individual users, user communities, and all users ofa collaborative tagging system. They apply a modified Latent Dirichlet Alloca-tion model (LDA, [Blei et al., 2003]) to cluster users and tags simultaneously, thusobtaining the implicit linking of tags and users. The generalized description of re-sources and users is expected to alleviate the noise in the tag data as well as theproblem of data sparsity. The authors assume a fixed number of 100 topics. Theycalculate vectors that determine the degree of affiliation of each resource, user, usercommunity, and query term to each topic. Recommendations are then provided byfirst combining the vectors of the query terms, the active user, and the communityof the active user. Second, the top five topics are selected and all bookmarks with ahigh degree of affiliation for the selected topics are found in the data base. Resourceswhose feature vectors have a cosine similarity of more than 0.75 with the combinedfeature vector of the query, the active user, and the community of the active userare ordered and shown to the user. Offline analyses performed on data from the De-licious system show that the proposed recommendation method can alleviate datasparsity and provide more effective recommendations than previous methods. Theapproach proposed by Guo and Joshi represents resources and queries as vectorsin which each dimension represents the degree of affiliation to a topic in the LDAmodel. In contrast, our approach uses the model built by the NMF algorithm onlyto derive the contextualized user interest profiles. Resources are represented by themetadata annotated by the community of users. When retrieving resources for aselected topic, we exclusively rely on the match between the topic terms and the
110
metadata profiles of the resources. Further, Guo and Joshi assign each user to atopic community based on the user’s interest value for the associated topic. Ourmethod does not assume one predominant interest topic for a user. It retrievesresources for different interest topics each with equal weight.
Another user modeling approach that takes into account a user’s different topicsof interest is presented by [Middleton et al., 2001]. The authors describe the Quick-step recommender system which unobtrusively monitors the browsing behavior ofits users. The target users of the system are scientists that need to be informedabout new papers in their field of interest as well as older papers relating to theirwork. The system applies supervised machine learning coupled with an ontologicalrepresentation of topics to elicit user preferences. It uses a multi-class behavioralmodel with classes representing paper topics, that way allowing domain knowledgeto be used when the user profile is constructed. The system works as follows: Userbrowsing behavior is monitored unobtrusively via a proxy server that logs every URLbrowsed during the user’s working activity. Overnight, a machine learning algorithmclassifies browsed URLs and saves the classified papers in a paper store. The inter-est profile is derived from explicit feedback and browsed topics. Recommendationsare computed based on the user’s current topics of interest and the classified papertopics. The generated recommendation lists contain items from the user’s threemost current topics of interest. Quickstep uses a research paper topic ontology thatis based on the dmoz1 taxonomy of computer science topics. In the ALOE sys-tem deployed at the Knowledge Management department of DFKI, employees shareresources about their research interests, software engineering, and about topics inwhich they are privately interested. Designing a topic ontology for such an openworld scenario does not seem to be feasible. Hence, our approach uses algorithmsfrom the domain of topic detection and tracking in order to identify user interesttopics automatically.
[Ziegler et al., 2005] aim at improving topic diversification by balancing top-Nrecommendation lists according to the users’ full ranges of interests. In their recom-mender system each item is associated with features from a domain taxonomy like,e. g., author, genre, and audience in the domain of books. The proposed algorithmtakes a top-N recommendation list and selects a (much) smaller subset of itemswith a low degree of intra-list similarity. The final recommendation list is built by
1http://www.dmoz.org/
111
gradually adding items that keep intra-list similarity low and are recommendableaccording to traditional collaborative filtering algorithms (see Chapter 2.2). Theapproach presented by Ziegler et al. assumes that features from a domain taxonomyare annotated for each item. In Enterprise 2.0 platforms such features are not alwaysavailable as resources are contributed by the community of users and many systemsdo not want to place the burden of annotating content with concepts from a formaltaxonomy on the users. Instead they rely on lightweight approaches such as taggingin order to classify content.
[Zhang and Hurley, 2009] propose an approach to improve the diversity of rec-ommendations in collaborative information filters. To capture a user’s full range ofinterests, her preferred resources are partitioned into clusters of similar items. Rec-ommendations are then composed of items that match with the clusters instead ofmatching the whole user profile. The algorithm favors those clusters whose items areleast similar to the average user taste, that way also improving the novelty aspect ofthe recommendations. To evaluate the effectiveness of their approach, the authorsplot concentration curves of item novelty against recommendation accuracy. Theirexperiments show that the proposed approach reduces the bias of traditional collab-orative information filters towards items that are similar to the average user taste ata small cost to overall accuracy. The underlying idea proposed by Zhang and Hur-ley is similar to our approach. Both methods partition a user’s preferred items toobtain groups of similar items and then generate recommendations matching thesedifferent groups, thus improving recommendation diversity. The difference is thatZhang and Hurley apply a collaborative filtering algorithm while we implementeda content-based approach. In Enterprise 2.0 platforms where the number of usersis small compared to the number of items, collaborative filtering suffers from severesparsity issues. Hence a content-based approach matching the metadata profiles ofitems seemed to be an appropriate choice for our setting.
In Table 8.1 we summarize the main differences between the related topic-basedrecommender systems and our approach.
8.2 Mood-based Music Recommendations
[Lee and Lee, 2006] propose M3 (Music for My Mood) a music recommendation sys-tem based on the user’s intention and mood. The application layer of the system
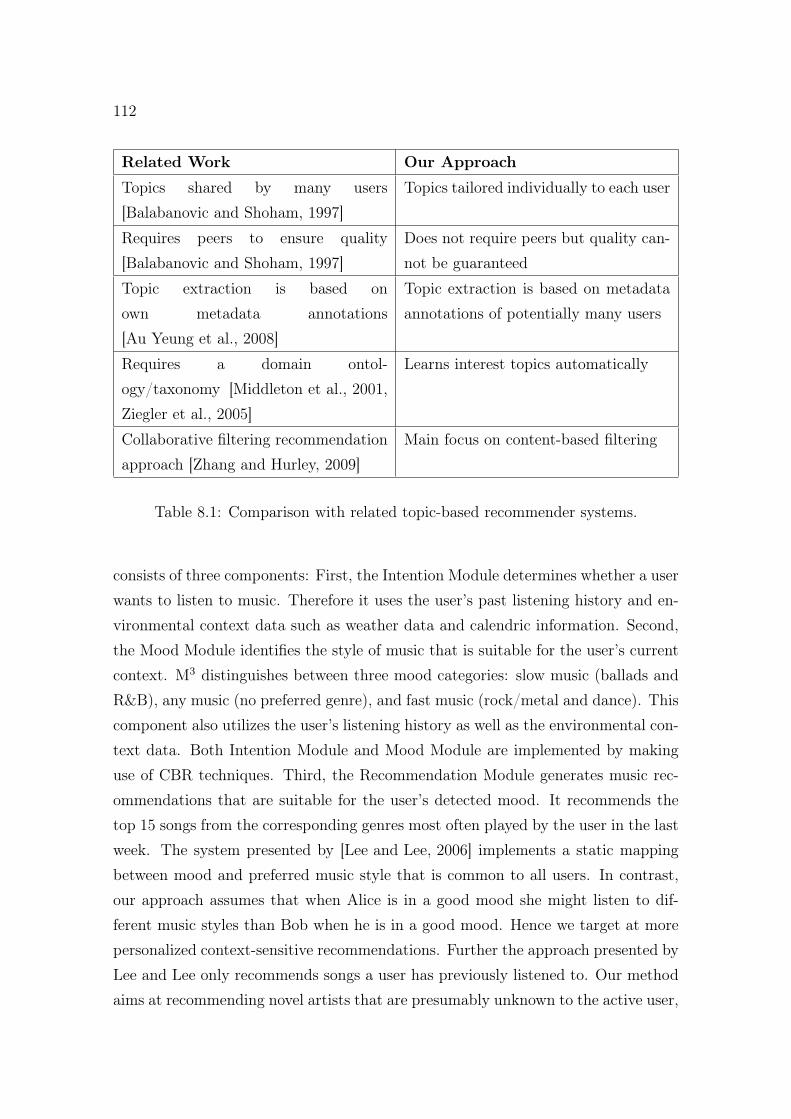
112
Related Work Our Approach
Topics shared by many users[Balabanovic and Shoham, 1997]
Topics tailored individually to each user
Requires peers to ensure quality[Balabanovic and Shoham, 1997]
Does not require peers but quality can-not be guaranteed
Topic extraction is based onown metadata annotations[Au Yeung et al., 2008]
Topic extraction is based on metadataannotations of potentially many users
Requires a domain ontol-ogy/taxonomy [Middleton et al., 2001,Ziegler et al., 2005]
Learns interest topics automatically
Collaborative filtering recommendationapproach [Zhang and Hurley, 2009]
Main focus on content-based filtering
Table 8.1: Comparison with related topic-based recommender systems.
consists of three components: First, the Intention Module determines whether a userwants to listen to music. Therefore it uses the user’s past listening history and en-vironmental context data such as weather data and calendric information. Second,the Mood Module identifies the style of music that is suitable for the user’s currentcontext. M3 distinguishes between three mood categories: slow music (ballads andR&B), any music (no preferred genre), and fast music (rock/metal and dance). Thiscomponent also utilizes the user’s listening history as well as the environmental con-text data. Both Intention Module and Mood Module are implemented by makinguse of CBR techniques. Third, the Recommendation Module generates music rec-ommendations that are suitable for the user’s detected mood. It recommends thetop 15 songs from the corresponding genres most often played by the user in the lastweek. The system presented by [Lee and Lee, 2006] implements a static mappingbetween mood and preferred music style that is common to all users. In contrast,our approach assumes that when Alice is in a good mood she might listen to dif-ferent music styles than Bob when he is in a good mood. Hence we target at morepersonalized context-sensitive recommendations. Further the approach presented byLee and Lee only recommends songs a user has previously listened to. Our methodaims at recommending novel artists that are presumably unknown to the active user,
113
that way providing access to the long tail of artists that are not so well-known.
A mood-based music recommender system based on collaborative filtering wasproposed by [Mortensen et al., 2008]. The authors conducted a mood-based recom-mendation experiment that was split into three phases. The first phase compriseda period of 19 days in which content-based recommendations were generated. Inthis phase recommendations were provided according to the users’ listening histo-ries (“more like I heard already”) and the genres the users liked. Every song playedwas rated by the users on a binary scale (like/dislike) and annotated with the user’sperceived mood (one of angry, happy, relaxed, or sad). Based on the ratings gatheredduring the first 19 days, in the second phase recommendations where generated witha collaborative filtering algorithm. In the third phase recommendations were alsoprovided based on collaborative filtering however those songs that did not match auser’s current mood were filtered out. The users stated their current mood explicitlyin the interface. Again the recommendations were only calculated based on the datacollected during the 19 days of phase one. The evaluation experiments show that col-laborative mood filtering outperforms the content-based approach and significantlyoutperforms the collaborative filtering approach that does not take into account theusers’ moods. The system proposed by [Mortensen et al., 2008] uses mood as addi-tional filter for recommendations based on collaborative filtering. Hence it suffersfrom the same drawbacks as the system proposed by [Wang and Kong, 2007] (cf.Chapter 6.4), i. e., in particular recommendations of popular items. Mood-basedrecommendations are generated based on mood annotations provided by the usersof the system. In our approach we tried to automatically find a correlation be-tween a user’s mood and her currently preferred music style. For that purpose, amood model based on social tags has been applied. However, the evaluation of ourapproach could not confirm such a correlation.
[Rho et al., 2009] propose a context-based music recommendation system thatemploys support vector regression (SVR) to map musical feature vectors to moods.An ontology-based context model is used to determine the users’ current situationand mood. The music mood classifier based on SVR consists of three parts. First,seven distinct musical features are extracted and analyzed. These features are: pitch,tempo, loudness, tonality, key, rhythm, and harmonics. Second, the training moduledetermines the arousal and valence of each song by using SVR on the analyzedmusical features. This process is performed according to the acoustic and emotion
114
rules defined by [Juslin and Sloboda, 2001]. In the third step, the mood mappermaps the arousal and valence values to one of eleven moods. These moods are:angry, bored, calm, excited, happy, nervous, peaceful, pleased, relaxed, sad, andsleepy. Further the authors developed COMUS, an ontology consisting of 826 classesand instances and 61 property definitions modeling domains such as genres, persons,mood, and situations ([Song et al., 2009]). The system considers a user’s situationalcontext and her favorite mood obtained from her profile and listening history togenerate context-based music recommendations. The approach presented by Rho etal. assumes that a user has set her musical preferences manually (e. g., genre andmood). In contrast, our method learns a user’s preferred music styles. Our intentionwas to also learn a mapping between the user’s mood and her currently preferredmusic style. However, the metadata used to describe artists (in particular the genres)do not correlate with specific moods. In our future work we will investigate whetherwe can find groups of music styles that allow for an automatic mapping of moodand preferred music style.

Part III
Conclusion
115

Chapter 9
Summary
In this thesis we have presented an approach extracting contextualized user profileswhich enable recommendations taking into account a user’s full range of interests.The method applies algorithms from the domain of topic detection and tracking toidentify diverse user interests and to represent them with descriptive labels. Theapproach was tested in two scenarios: First, we implemented a content-based rec-ommender system for our Enterprise 2.0 resource sharing platform ALOE where thecontextualized user interest profiles were used to generate recommendations with ahigh degree of inter-topic diversity. The evaluation experiments have shown thatour approach is likely to capture a multitude of interest topics per user. The labelsextracted are specific for these topics and can be used to retrieve relevant on-topicresources. Second, a slightly adapted variation of the algorithm was used to targetmusic recommendations based on the user’s current mood. The evaluation exper-iments conducted show that users clearly have a multitude of different preferredmusic styles. However, a correlation between these music styles and music moodcategories could not be observed. In Section 9.1 we discuss the research hypothesesposed at the beginning of our work. Next, in Section 9.2 we summarize the researchcontributions made in this thesis. Finally, we discuss in Section 9.3 the limitationsof our approach and the evaluation experiments performed.
9.1 Discussion of Research Hypotheses
For topic-based resource recommendations we set the following hypotheses:
H1 Knowledge workers have different topics of interest.
117
118
H2 By applying topic detection algorithms on the users’ preferred resources we candetect these topics.
H3 The detected topics can be used to provide recommendation lists with a highdegree of diversity.
First, we want to tackle H1 and H2. A preliminary evaluation study wasconducted with eight users of the ALOE system deployed at the Knowledge Man-agement department of DFKI. In this study we found first evidence that knowledgeworkers have different topics of interest which are also reflected in our Enterprise2.0 resource sharing platform. By making use of a topic extraction algorithmbased on non-negative matrix factorization we identified labels characterizing theusers’ different topics of interest (cf. Chapter 5.3.1). On average 4.9 topics wereidentified per user of which on average four were classified as correctly identifiedby the users. In a second, larger evaluation study using the data base of theBibSonomy system we could further verify the validity of H1 and H2. For 296users we could identify 1043 topics, i. e., on average 4.73 topics per user. Tocheck how likely our topic labels can retrieve on-topic resources we followed anevaluation approach proposed by [Au Yeung et al., 2008] where we determinedprecision and recall for the recommendations generated by our approach (within auser’s own resources) compared with the results obtained from the NMF algorithm.With the best configuration we could obtain a precision of 0.85 at a recall levelof 0.42. Plotting the Lorenz curve showed that with this configuration we couldachieve a rounded, average precision of 80% or better for 76.69% of the users. Ourapproach requires that users have different interest topics according to which theyshare and interact with resources in the platform. For those users that interactwith items from random topics (e. g., users contributing all sorts of news articlesfrom the field of computer science) the extraction of meaningful topic labels isdifficult and the approach can thus not be expected to be advantageous comparedto traditional content-based recommendation approaches. When examining someexamples in detail we find that, despite good precision and recall values, some topiclabels are too broad in order to generate useful recommendations. These labelsshould be filtered out. With the remaining labels we are confident that usefulrecommendations according to different interest topics of the users can be generatedthus leading us to the conjecture that also H3 is a valid hypothesis.
119
For mood-based music recommendations we set the following hypotheses:
H4 Many people listen to different styles of music.
H5 An active user’s preferred style of music depends on her mood.
We were able to confirm H4 with our approach to identify a user’s differentpreferred music styles that has been presented in Chapter 6.2. Using the Last.fmplaylists of 442 users we clustered for each user the artists she had listened to andextracted labels for the identified groups. In total 3097 clusters were identified for the442 users, i. e., on average 7.01 clusters per user. We found that the labels extractedwere specific for the respective music styles achieving an average support of 0.761 ata confidence level of 0.604 and a harmonic mean of 0.586. Plotting the associatedLorenz curve showed that with the best configuration a rounded, average support of80% or better could be achieved for 73.08% of the users. In contrast, H5 could notbe confirmed. In our best configuration we achieved an average mood support of0.358 in the clusters. We had 408 clusters with a mood support of 0.55 or better thatwere juxtaposed to 2689 clusters where the mood support was less than 0.55. Hencewe cannot observe a correlation between our identified preferred music styles andassociated moods. Currently the music styles detected by our approach are mainlydescribed by the genres that are associated with the artists in the respective clusters.Our findings are in accordance with those of [Hu and Downie, 2007] who found thatgenres and moods are independent from each other. Further they observed thatmany artists are associated with different moods.
9.2 Research Contributions
In this thesis we have shown that users of social sharing platforms (and in particularknowledge workers) have different topics of interest that should be considered whenresource recommendations are provided. We have proposed an approach that ex-ploits user-generated metadata to describe resources. The metadata profiles of eachuser’s preferred items are used to automatically identify her interest topics which arethen represented in a multifaceted user profile. Further we have suggested a switch-ing hybrid recommender system that generates item-based collaborative filtering
120
recommendations for new users and content-based recommendations for those usersfor whom enough preference expressions are available. The content-based approachtakes into account a user’s different topics of interest and provides recommendationswith a high degree of diversity.
A slightly adapted variation of our method extracting contextualized user inter-est profiles was successfully used to show that users have different preferred musicstyles. In this scenario a user’s preferred music artists were described by makinguse of semantic data from the Linked Open Data cloud. The artist profiles wereclustered and labels describing the music styles associated with the artists in theclusters were extracted. Even though a correlation between these identified mu-sic styles and specific mood groups could not be found, we are confident that themultifaceted user profiles obtained that way can be used for context-sensitive mu-sic recommendations when integrated with a general user model ontology such asGUMO ([Heckmann et al., 2005]) or a dedicated music ontology such as COMUS([Song et al., 2009]).
9.3 Limitations
Finally, we want to discuss some of the limitations of this thesis. The focus ofthe work at hand is on the extraction of the user profiles. The perceived qualityof real world recommendations based on the contextualized user profiles has notbeen evaluated so far. Traditionally, recommender systems (and in particular col-laborative filtering systems) are evaluated in offline experiments (cf. Appendix E).For this method a data base of user-item ratings is used from which a certain per-centage of ratings is removed. Based on the remaining data the user models arelearned and rating predictions are calculated for the withheld items. Then the pre-dictive accuracy is measured by comparing these predictions with the actual userratings using error measures such as mean absolute error or root mean squared error(cf. Appendix B). The problem of this method is, that recommendations of novelitems that the respective user has not rated yet, cannot be evaluated. However,besides diversity of recommendation lists, the novelty of the provided recommen-dations is a major goal of our approach. Further, novelty and diversity alwayshave to be evaluated together with the perceived quality of the recommendations([Celma and Herrera, 2008]) which can only be done in live user experiments. Find-
121
ing an online platform where our method can be integrated and evaluated is still animportant point for our future work.
The evaluation experiments conducted thus far are performed for each user inde-pendently based on her resource contributions. In some cases the extracted labelsachieve good evaluation results in our experiments but are not useful to generatetopic-based recommendations in a real world setting, for instance, when the termsin the cluster label are too broad as reported for user A in Table 7.2. Concerningthe probability of our method to retrieve relevant on-topic resources in a real wordsetting, it should be noted that we implemented a similar approach for a social me-dia mining tool where the topic extraction was applied on a set of domain-specificblog postings ([Schirru et al., 2010b]). In that system we also used a content-basedrecommendation approach based on the relevant terms of the topic labels. Theevaluation experiments showed that the precision calculated over the top 10 recom-mended blog articles was 0.87 with the best configuration showing that the methodcan recommend relevant resources for a topic.
The offline evaluation experiments conducted in this thesis only compare differentparameterizations (term or feature relevance thresholds) of the proposed approach.The use of different clustering algorithms has not been evaluated as from our pointof view there is no single best clustering algorithm for our method. Instead thechoice of the most appropriate clustering strategy should depend on the underlyingdata and has to be decided for every system individually. For the identificationof a user’s topics of interest in an Enterprise 2.0 platform we used non-negativematrix factorization. For topic modeling with text documents also algorithms suchas latent dirichlet allocation [Blei et al., 2003] are known to lead to good results.In order to cluster artists that are described by metadata features obtained fromLOD sources we experimented with the K-Means algorithm that we considered moreappropriate for this problem domain. Comparisons with other approaches proposedin the literature are difficult as measures to judge the diversity of recommendationlists (e. g., the intra-list similarity metric proposed by [Ziegler et al., 2005]) have notbeen applied widely. Also the data sets on which the evaluation experiments havebeen conducted are often not published which makes a comparison with relatedmethods difficult (e. g., [Au Yeung et al., 2008]).
Another limitation of this thesis that has often been discussed is the feature spaceused in the music recommendation use case. Currently our metadata profiles for
122
artists consist of two different feature types only: first, the genres that are associatedwith the artist, and second, his/her instruments played together with the respectiveinstrument families as found in the Freebase data set. We consider this selectionof features as a starting point when describing artists using Linked Open Data. Itshould be noted that the genres in Freebase are very fine-grained. In our data set wehad 2085 different genres describing the music style of artists precisely. For instance,for Lady Gaga we had the genres dance music, electronic music, electronic dancemusic, eurodance, contemporary R&B, electronica, and pop music. We consideran overlap in many of these specific genres as a good indication that artists areassociated with a common music style. However it would be interesting for ourfuture work to include more feature types such as record release years, associatedartists, and events where the artists performed.
Chapter 10
Outlook
In our future work we will examine how the contextualized user interest profiles canbe used for context-sensitive recommendations. [Anand et al., 2007] hypothesizethat different visits of a user on a website may be associated with different infor-mation needs. E. g., a user might seek items according to her profession in one visitand items according to her hobbies in another. The authors argue that the contextis reflected in the user’s choice of items. For our approach it would be interesting toanalyze how items visited in the user’s current session match one particular interesttopic of the user and how recommendations could be generated accordingly. Whenproviding topic-based resource recommendations, it is not only interesting to recom-mend items that match a user’s most recent topics of interest. Instead also long-terminterest topics should be detected and respective recommendations should be pro-vided. In [Schirru, 2010] we proposed a first approach in this direction. The methodcompared vectors representing a user’s interest topics from different interests iden-tification runs by calculating their cosine similarity. Such vectors whose similarityexceeded a predefined threshold were added to a persistent topic trace. For futurework it would be interesting to follow this approach and to also experiment withmore sophisticated methods, such as topic tracking using online non-negative matrixfactorization ([Cao et al., 2007]). So far we have only evaluated the specificity of thecluster labels representing a user’s different topics of interest. That way we couldassess the likeliness of our system to generate useful on-topic recommendations. Asimilar approach was previously proposed by [Au Yeung et al., 2008]. However, itwould be interesting to test the quality of the resulting recommendations in a liveuser experiment thus identifying further optimization possibilities for our approach.
123
124
Concerning music recommendations we need to integrate the contextualizeduser profiles with our approach finding similar artists that was presented in[Baumann et al., 2010]. Using artist profiles composed of structured Semantic Webmetadata we were able to generate artist recommendations with a high degree ofnovelty. An integration with our multifaceted user profiles could provide novel artistrecommendations taking into account different music styles a user prefers. In thelong term it would be interesting to integrate the contextualized user profiles withuser model ontologies, e. g., [Heckmann et al., 2005] or [Song et al., 2009], that waytargeting context-sensitive music recommendations. For this purpose it would benecessary to learn relations between a user’s current situation and her preferredmusic style.

Part IV
Appendix
125

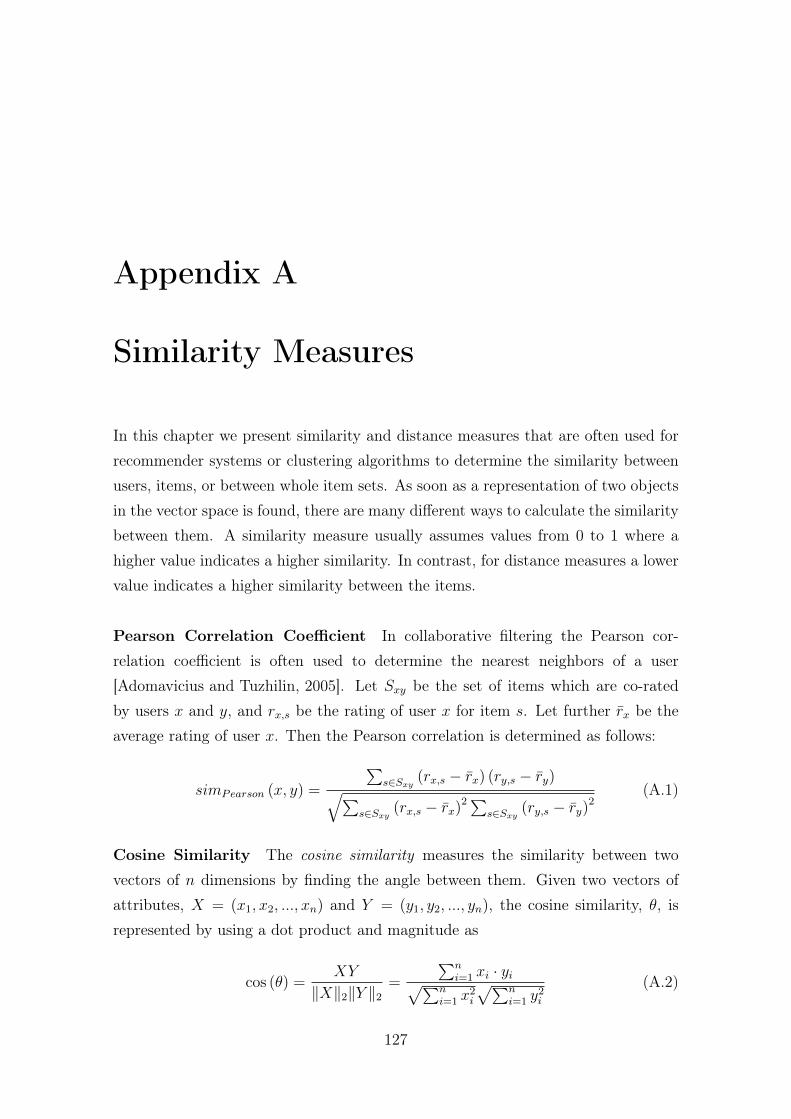
Appendix A
Similarity Measures
In this chapter we present similarity and distance measures that are often used forrecommender systems or clustering algorithms to determine the similarity betweenusers, items, or between whole item sets. As soon as a representation of two objectsin the vector space is found, there are many different ways to calculate the similaritybetween them. A similarity measure usually assumes values from 0 to 1 where ahigher value indicates a higher similarity. In contrast, for distance measures a lowervalue indicates a higher similarity between the items.
Pearson Correlation Coefficient In collaborative filtering the Pearson cor-relation coefficient is often used to determine the nearest neighbors of a user[Adomavicius and Tuzhilin, 2005]. Let Sxy be the set of items which are co-ratedby users x and y, and rx,s be the rating of user x for item s. Let further rx be theaverage rating of user x. Then the Pearson correlation is determined as follows:
simPearson (x, y) =
∑s∈Sxy
(rx,s − rx) (ry,s − ry)√∑s∈Sxy
(rx,s − rx)2∑
s∈Sxy(ry,s − ry)2
(A.1)
Cosine Similarity The cosine similarity measures the similarity between twovectors of n dimensions by finding the angle between them. Given two vectors ofattributes, X = (x1, x2, ..., xn) and Y = (y1, y2, ..., yn), the cosine similarity, θ, isrepresented by using a dot product and magnitude as
cos (θ) =XY
‖X‖2‖Y ‖2=
∑ni=1 xi · yi√∑n
i=1 x2i
√∑ni=1 y
2i
(A.2)
127
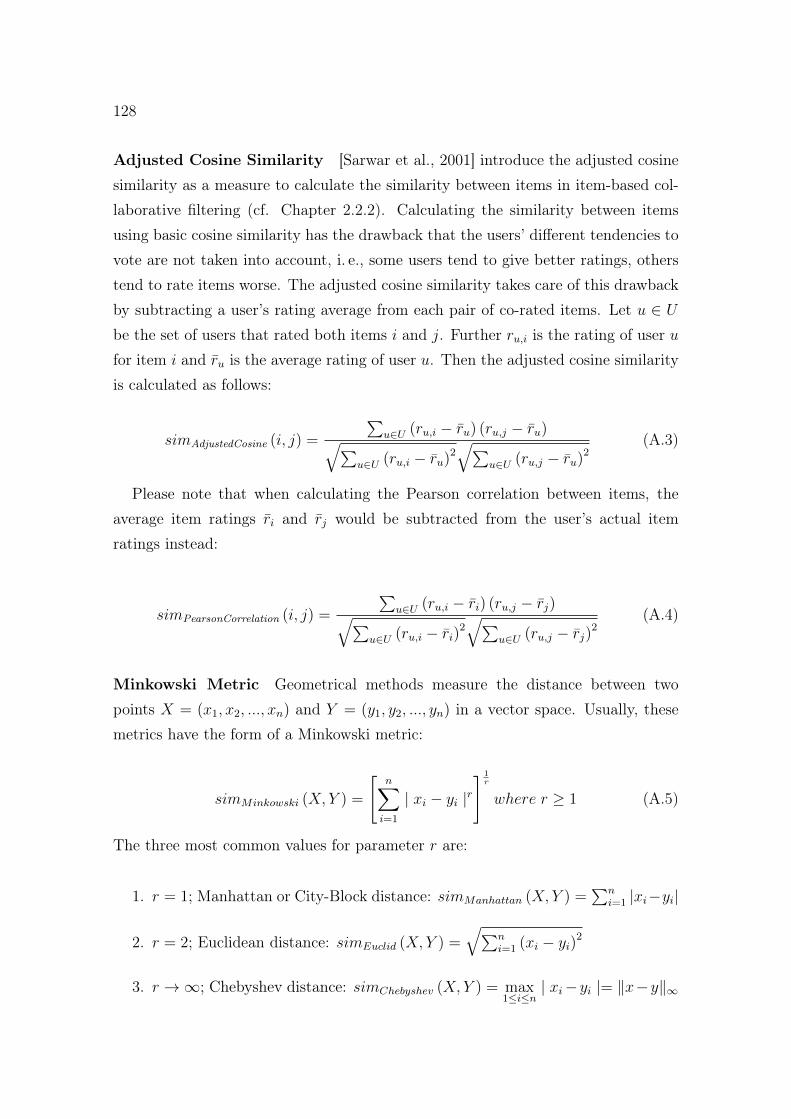
128
Adjusted Cosine Similarity [Sarwar et al., 2001] introduce the adjusted cosinesimilarity as a measure to calculate the similarity between items in item-based col-laborative filtering (cf. Chapter 2.2.2). Calculating the similarity between itemsusing basic cosine similarity has the drawback that the users’ different tendencies tovote are not taken into account, i. e., some users tend to give better ratings, otherstend to rate items worse. The adjusted cosine similarity takes care of this drawbackby subtracting a user’s rating average from each pair of co-rated items. Let u ∈ Ube the set of users that rated both items i and j. Further ru,i is the rating of user ufor item i and ru is the average rating of user u. Then the adjusted cosine similarityis calculated as follows:
simAdjustedCosine (i, j) =
∑u∈U (ru,i − ru) (ru,j − ru)√∑
u∈U (ru,i − ru)2√∑
u∈U (ru,j − ru)2(A.3)
Please note that when calculating the Pearson correlation between items, theaverage item ratings ri and rj would be subtracted from the user’s actual itemratings instead:
simPearsonCorrelation (i, j) =
∑u∈U (ru,i − ri) (ru,j − rj)√∑
u∈U (ru,i − ri)2√∑
u∈U (ru,j − rj)2(A.4)
Minkowski Metric Geometrical methods measure the distance between twopoints X = (x1, x2, ..., xn) and Y = (y1, y2, ..., yn) in a vector space. Usually, thesemetrics have the form of a Minkowski metric:
simMinkowski (X, Y ) =
[n∑
i=1
| xi − yi |r] 1
r
where r ≥ 1 (A.5)
The three most common values for parameter r are:
1. r = 1; Manhattan or City-Block distance: simManhattan (X, Y ) =∑n
i=1 |xi−yi|
2. r = 2; Euclidean distance: simEuclid (X, Y ) =√∑n
i=1 (xi − yi)2
3. r →∞; Chebyshev distance: simChebyshev (X, Y ) = max1≤i≤n
| xi−yi |= ‖x−y‖∞
129
Association Coefficients The Jaccard similarity coefficient is a statistic used forcomparing the similarity and diversity of sample sets X and Y :
Jaccard(X, Y ) =| X ∩ Y || X ∪ Y |
(A.6)
The Dice coefficient is a similarity measure related to the Jaccard index. For setsX and Y , the coefficient may be defined as:
Dice(X, Y ) =2 | X ∩ Y || X | + | Y |
(A.7)

130
Appendix B
Error Measures
In order to evaluate the quality of a clustering result or the accuracy of a recom-mender system, statistical error measures are often used. In this chapter we presentthe residual sum of squares in Section B.1 as a popular means to measure the qualityof clusterings. In Sections B.2 and B.3 the mean absolute error and the root meansquared error are presented respectively. Both measures are often used to evaluatethe predictive accuracy of recommendation algorithms.
B.1 Residual Sum of Squares
The residual sum of squares (RSS) can be used to measure the quality of a clusteringresult. It determines how well the centroids represent the members of their clusters([Manning et al., 2009], p. 360). It is calculated as the squared distance of eachvector from its associated centroid summed over all vectors. For a clustering resultwith K clusters let ~x ∈ ωk be the feature vector of item x that has been assignedto cluster k. Let ~µ (ωk) be the centroid of cluster k. Then the RSS of cluster k isdetermined as follows:
RSSk = Σ~x∈ωk| ~x− ~µ (ωk) |2 (B.1)
The residual sum of squares of the complete clustering result is then determined as
RSS = ΣKk=1RSSk (B.2)
131
132
B.2 Mean Absolute Error
In statistics, the mean absolute error (MAE) measures how close predicted values areto the actual outcomes ([Wikipedia, 2010b]). For recommender systems it measureshow close the rating predictions are to the rating values provided by the users([Herlocker et al., 2004]). Let p1, p2, ..., pn be a set of rating predictions for itemsi1, i2, ..., in and let r1, r2, ..., rn be the actual ratings for the items by the respectiveuser. MAE is then calculated as follows:
MAE =1
n
n∑i=1
|pi − ri| (B.3)
B.3 Root Mean Squared Error
Similar to MAE the root mean squared error (RMSE) or root mean square deviation(RMSD) measures the differences between predicted values and the values actuallyobserved ([Wikipedia, 2010d]). While MAE stronger punishes a larger amount oferrors RMSE penalizes larger errors more. For a set of rating predictions p1, p2, ..., pnfor items i1, i2, ..., in and actual user-item ratings r1, r2, ..., rn RMSE is calculated asfollows:
RMSE =
√∑ni=1 (pi − ri)2
n(B.4)
Appendix C
Clustering Algorithms
The goal of clustering algorithms is to group a set of items into subsets that areinternally coherent and clearly different from each other ([Manning et al., 2009], p.349). That means, items in the same cluster should be as similar as possible whileitems in different clusters should be as dissimilar as possible. Clustering is a formof unsupervised learning. Compared to supervised learning (e. g., classification) theitems do not carry any labels assigned by human experts. In information retrieval itis assumed that given an information need of a user the documents in a cluster behavesimilarly with respect to relevance. [Jardine and van Rijsbergen, 1971] formulatedthe cluster hypothesis as follows:
“It is intuitively plausible that the associations between documents conveyinformation about the relevance of documents to requests.”
In our approach we assume that each cluster represents an interest topic of auser or one of her preferred music styles. According to the cluster hypothesis, theresources in a cluster should be relevant for the respective interest topic or musicstyle.
Clustering algorithms can be distinguished into hard and soft clustering algo-rithms. Hard clustering algorithms assign each item to exactly one cluster. In con-trast with soft clustering an item can have a fractional membership in many clusters.Both hard and soft clustering strategies will be depicted in the current chapter. Ac-cording to the clustering strategy, hierarchical and flat clustering algorithms aredistinguished. We describe both approaches following [Manning et al., 2009], pp.349-401.
133
134
The remainder of the chapter is structured as follows: In Section C.1 hierarchicalclustering algorithms are presented. As the most representative algorithm for flatclustering, K-Means is depicted in Section C.2 together with a heuristic on how toestimate a reasonable number of clusters. Next, in Section C.3 clustering strategiesbased on matrix factorization are described. Finally, we present strategies for clusterlabel extraction in Section C.4.
C.1 Hierarchical Clustering
We present hierarchical clustering algorithms first in this chapter as they generate astructure of clusters that can be easily illustrated in dendrograms and thus supportthe understanding of clustering algorithms.
In hierarchical clustering bottom-up and top-down approaches are distinguished.Agglomerative (bottom-up) approaches treat each item as a single cluster in thebeginning. Then consecutively pairs of clusters are merged until all items are ag-gregated into one single cluster. Divisive (top-down) approaches need a method tosplit clusters. They start with one cluster containing all items and then recursivelysplit the clusters until each item ends up in its own cluster. In this section we willfocus on hierarchical agglomerative clustering as this approach is more frequentlyused in information retrieval.
A naïve hierarchical agglomerative clustering algorithm might work as follows:Given a corpus of N documents, compute the N ×N similarity matrix C. In N − 1
steps the algorithm merges the currently most similar clusters. After each mergeupdate the affected rows and columns in C. The clustering result is stored as a listof merges. Two famous methods to determine the similarity between clusters aresingle-link and complete-link. With single-link the similarity between two clusters isdefined as the similarity of the two most similar members in the clusters. In contrastwith complete-link the similarity between two clusters is defined as the similarity ofthe two most dissimilar members of the clusters.
An advantage of hierarchical clustering algorithms is that their results can bevisualized as dendrograms making the emergence of the clusters easy to comprehendfor the user. Cluster merges are represented by horizontal lines. The locationsof these lines along the y-coordinate show the similarity of the merged clusters.[Manning et al., 2009] call this similarity the combination similarity of two clusters.
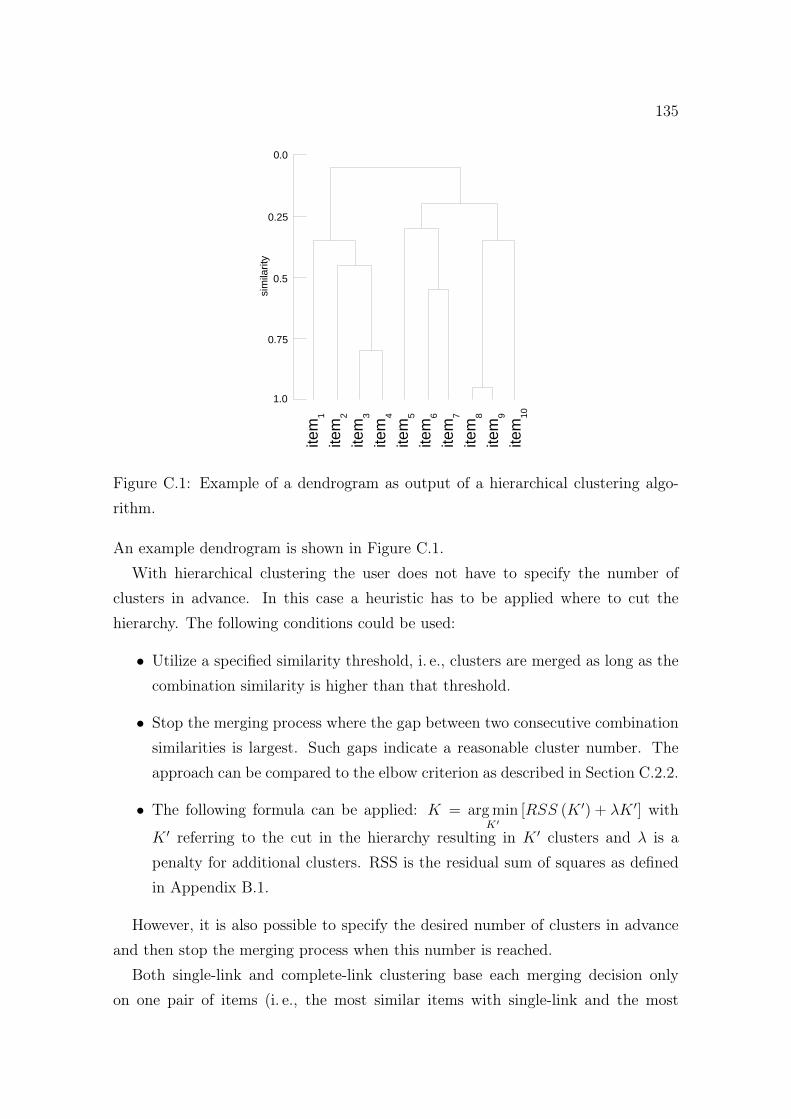
135
item
1
item
2
item
3
item
4
item
5
item
6
item
7
item
8
item
9
item
10
sim
ilarity
1.0
0.75
0.5
0.25
0.0
Figure C.1: Example of a dendrogram as output of a hierarchical clustering algo-rithm.
An example dendrogram is shown in Figure C.1.With hierarchical clustering the user does not have to specify the number of
clusters in advance. In this case a heuristic has to be applied where to cut thehierarchy. The following conditions could be used:
• Utilize a specified similarity threshold, i. e., clusters are merged as long as thecombination similarity is higher than that threshold.
• Stop the merging process where the gap between two consecutive combinationsimilarities is largest. Such gaps indicate a reasonable cluster number. Theapproach can be compared to the elbow criterion as described in Section C.2.2.
• The following formula can be applied: K = arg minK′
[RSS (K ′) + λK ′] with
K ′ referring to the cut in the hierarchy resulting in K ′ clusters and λ is apenalty for additional clusters. RSS is the residual sum of squares as definedin Appendix B.1.
However, it is also possible to specify the desired number of clusters in advanceand then stop the merging process when this number is reached.
Both single-link and complete-link clustering base each merging decision onlyon one pair of items (i. e., the most similar items with single-link and the most
136
dissimilar items with complete-link clustering) hence not considering the distributionof items in the clusters. For that reason both algorithms often produce resultsthat are undesirable. Single-link is known to suffer from the problem of chaining(i. e., producing long, straggly clusters). Complete-link on the other hand generatescompact clusters with small diameters but it pays too much attention to outliers thatway sometimes missing intuitive cluster structures. Methods have been developedthat avoid the drawbacks of single-link and complete-link clustering. For instancegroup-average agglomerative clustering determines the cluster quality based on thesimilarity of all documents in the two clusters under consideration that way avoidingthe issues of single-link and complete-link clustering mentioned before.
C.2 Flat Clustering Using K-Means
The current section first describes K-Means, the most famous flat clustering algo-rithm. As K-Means requires the number of clusters as input parameter we depict aheuristic to estimate a reasonable number of clusters subsequently.
C.2.1 The K-Means Algorithm
K-Means is often referred to as the most important flat clustering algorithm. Its goalis to minimize the residual sum of squares (RSS, cf. Appendix B.1) of items fromthe cluster centers. Given that each item ~x is represented as a length-normalizedvector in a real valued space, the center (mean or centroid ~µ) of a cluster ω is definedas follows:
~µ (ω) =1
| ω |∑~x∈ω
~x (C.1)
The algorithm works as follows:
• Select k random documents as cluster centers (i. e., the seed).
• Repeat the following steps until a stopping criterion is met:
– (Re)assign each document to the cluster with the closest centroid.
– Recompute the centroids based on the current cluster members.
[Manning et al., 2009] list the following termination criteria:
137
1. A predefined number of iterations has been reached. This criterion limitsthe runtime of the algorithm, however it might lead to poor results when thenumber of iterations is insufficient.
2. The assignment of items to clusters remains stable between iterations. Thiscondition may produce good clusterings except for cases where the algorithmis stuck in a bad local minimum. For this criterion the runtime might be unac-ceptable. An equivalent stopping condition is to check whether the centroidsdo not change between iterations.
3. Stop as soon as RSS is under a predefined threshold. This condition guaranteesa clustering result of a certain quality. However, in practice it has to becombined with a limit on the number of iterations in order to make sure thatthe algorithm terminates.
4. Stop when the decrease in RSS falls below a certain threshold. For smallthresholds this criterion indicates that the result is close to convergence butagain this condition needs to be combined with a limit on the number ofiterations in order to avoid long runtimes.
Compared to hierarchical clustering algorithms, flat clustering algorithms havesome drawbacks. The results of flat clustering miss a structure that can be easilyvisualized like the dendrograms that are obtained with hierarchical clustering. Fur-ther the results of flat clustering are nondeterministic and the algorithms require apredefined number of clusters as input parameter. Most hierarchical clustering al-gorithms used in information retrieval are by contrast deterministic and there existgood heuristics to achieve a clustering result with a reasonable number of clusterswithout requiring the user to specify the cluster number in advance. A major advan-tage of flat clustering strategies however is their efficiency. While the most commonhierarchical algorithms have at least quadratic complexity in the number of items,the runtime of K-Means is linear in all relevant factors: the number of iterations,clusters, vectors and dimensionality of the space.
C.2.2 Estimating the Cluster Number
We estimate the number of clusters in the data set as described in[Manning et al., 2009], p. 365. First we define a range in which we expect to find
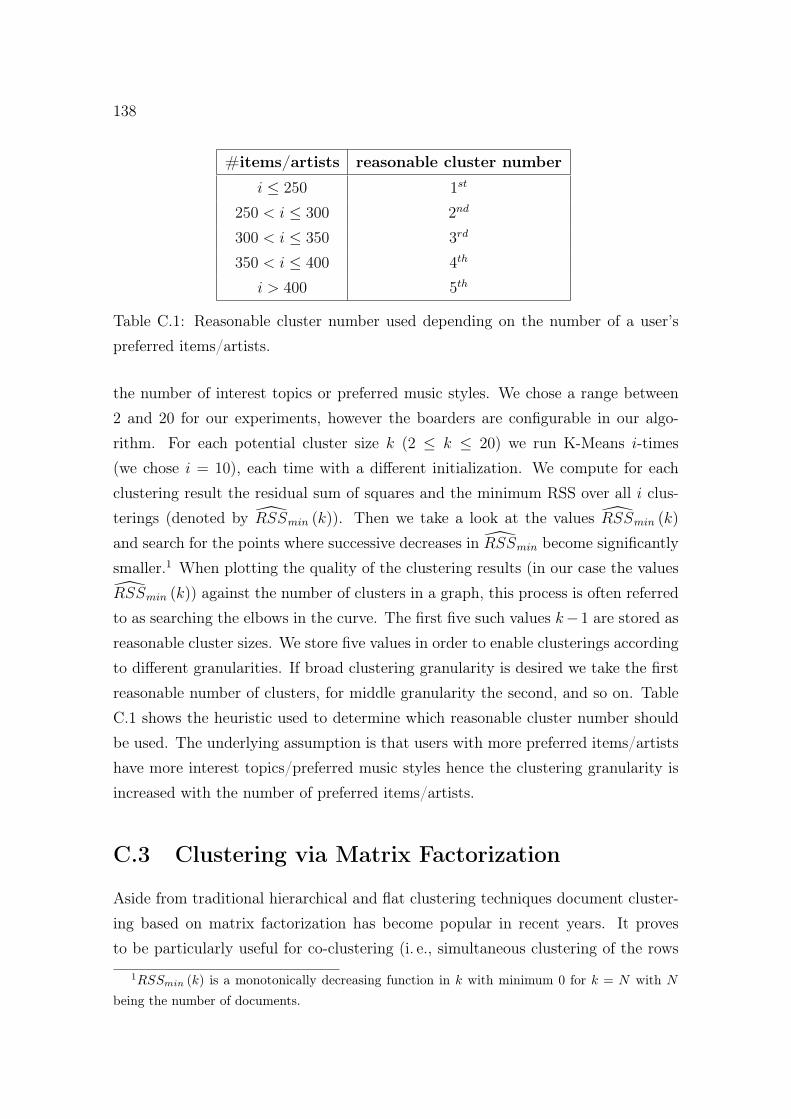
138
#items/artists reasonable cluster number
i ≤ 250 1st
250 < i ≤ 300 2nd
300 < i ≤ 350 3rd
350 < i ≤ 400 4th
i > 400 5th
Table C.1: Reasonable cluster number used depending on the number of a user’spreferred items/artists.
the number of interest topics or preferred music styles. We chose a range between2 and 20 for our experiments, however the boarders are configurable in our algo-rithm. For each potential cluster size k (2 ≤ k ≤ 20) we run K-Means i-times(we chose i = 10), each time with a different initialization. We compute for eachclustering result the residual sum of squares and the minimum RSS over all i clus-terings (denoted by RSSmin (k)). Then we take a look at the values RSSmin (k)
and search for the points where successive decreases in RSSmin become significantlysmaller.1 When plotting the quality of the clustering results (in our case the valuesRSSmin (k)) against the number of clusters in a graph, this process is often referredto as searching the elbows in the curve. The first five such values k−1 are stored asreasonable cluster sizes. We store five values in order to enable clusterings accordingto different granularities. If broad clustering granularity is desired we take the firstreasonable number of clusters, for middle granularity the second, and so on. TableC.1 shows the heuristic used to determine which reasonable cluster number shouldbe used. The underlying assumption is that users with more preferred items/artistshave more interest topics/preferred music styles hence the clustering granularity isincreased with the number of preferred items/artists.
C.3 Clustering via Matrix Factorization
Aside from traditional hierarchical and flat clustering techniques document cluster-ing based on matrix factorization has become popular in recent years. It provesto be particularly useful for co-clustering (i. e., simultaneous clustering of the rows
1RSSmin (k) is a monotonically decreasing function in k with minimum 0 for k = N with N
being the number of documents.
139
and columns of a matrix) where documents have to be clustered and descriptivelabels need to be extracted for each cluster. We depict in Section C.3.1 a cluster-ing approach in the latent semantic space derived by singular value decompositionon the term-document matrix. Document clustering based on non-negative matrixfactorization is described in Section C.3.2.
C.3.1 LSA-based Clustering
[Song and Park, 2007] propose a document model based on latent semantic analysis(LSA) for text clustering. LSA applies singular value decomposition on the term-document matrix representing the document corpus, thus obtaining k orthogonalfactors. The reduced space is intended to better capture the relations betweendocuments. In this semantic structure two documents can be related even if theydo not share any common words. The authors state that clustering performed inthe latent semantic space leads to better results than clustering performed using theoriginal vector space model.
Given a term-document matrix A representing a document corpus, the singularvalue decomposition of A is given by:
A = UΣV T (C.2)
with U being the matrix of the left singular vectors (matrix of term vectors) andV being the matrix of the right singular vectors (matrix of document vectors). Σis the diagonal matrix consisting of singular values. With LSA A is approximatedwith a rank-k matrix:
Ak = UkΣkVTk (C.3)
with Uk being comprised of the first k columns of U , V Tk comprising the first k
rows of V T and Σk = diag (σ1, σ2, ..., σk) being the first k factors.
In order to represent a document d in the latent semantic space each documentis firstly initialized as m × 1 matrix with m being the total number of terms inthe corpus. As mentioned before U represents the matrix of term vectors in alldocuments and Uk spans the basis vectors of U . Now matrices dT and Uk aremultiplied to represent the document vector hence obtaining for each document a
140
1× k matrix.
d = dTUk (C.4)
The corpus is then organized as
D′ = DUk (C.5)
with D being the n×m document-term matrix. To use the LSA-based documentrepresentation, each document d is constructed as a row vector of D′. For clusteringthe K-Means algorithm is used. To initialize the algorithm the dimensions of D′
are reduced from n to k (n < k) and the documents are constructed in the reducedlatent semantic space. Then K-Means is run as described in Section C.2.1.
In their evaluation experiments the authors show that document representationsbased on LSA clearly outperform traditional vector space model representations interms of clustering quality.
C.3.2 NMF-based Clustering
Using non-negative matrix factorization (NMF) for (soft) document clustering wasfirst introduced in [Xu et al., 2003]. The authors show that NMF-based documentclustering is able to surpass latent semantic indexing and spectral clustering basedapproaches.
NMF finds the positive factorization of a given positive matrix. It is applied to theterm-document matrix representation of a document corpus. In the latent semanticspace which is derived by applying NMF, each axis represents the base topic of adocument cluster. Every document is represented as an additive combination ofthese base topics. Associating a document with a cluster is done by choosing thebase topic (axis) that has the highest projection value with the document. We applyNMF as follows:
Let W = {f1, f2, ..., fm} be the set of terms in the document corpus after ourpreprocessing steps. The weighted term vector Xd of document d is defined as
Xd = [x1d, x2d, ..., xmd]T (C.6)
with xid being the TF-IDF weight of the term fi in document d.
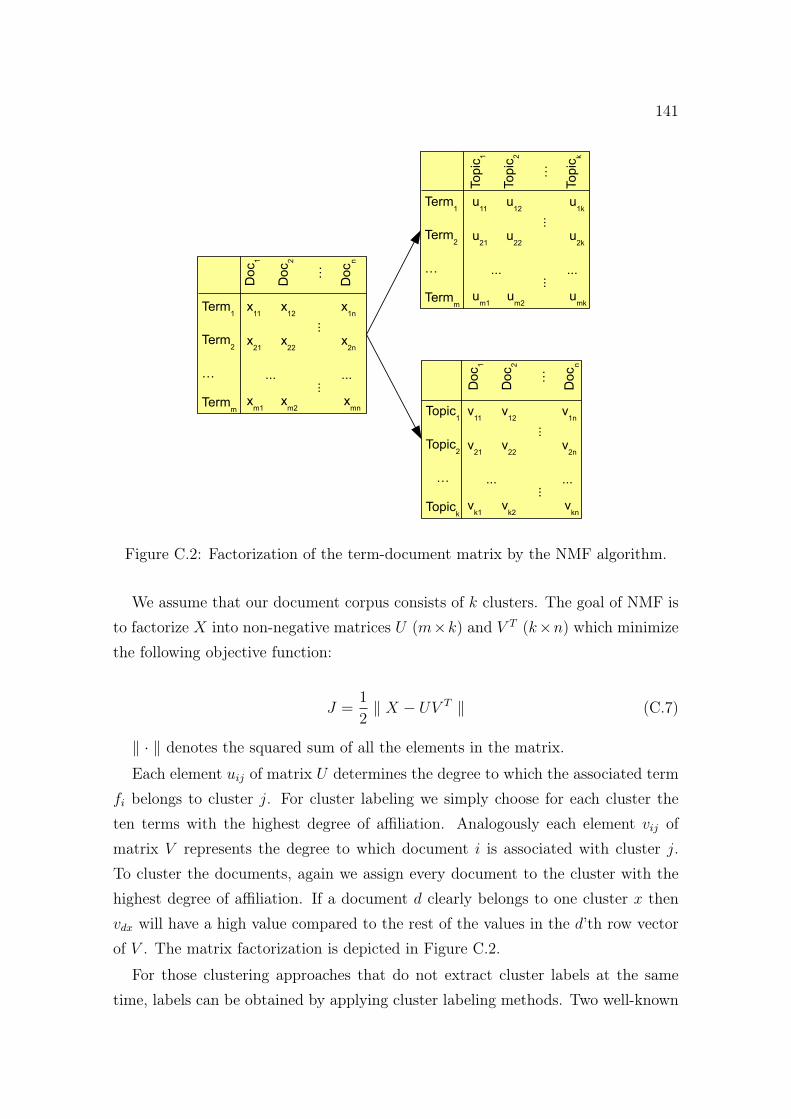
141
Doc1
Doc2
…
Docn
x11
x12
x1n
x21
x22
x2n
xm1
xm2
xmn
... ...
...
...
Topic1
Topic2
…
Topick
u11
u12
u1k
u21
u22
u2k
um1
um2
umk
... ...
...
...
Topic1
Topic2
…
Topick
Doc1
Doc2
…
Docn
v11
v12
v1n
v21
v22
v2n
vk1
vk2
vkn
... ...
...
...
Term1
Term2
…
Termm
Term1
Term2
…
Termm
Figure C.2: Factorization of the term-document matrix by the NMF algorithm.
We assume that our document corpus consists of k clusters. The goal of NMF isto factorize X into non-negative matrices U (m×k) and V T (k×n) which minimizethe following objective function:
J =1
2‖ X − UV T ‖ (C.7)
‖ · ‖ denotes the squared sum of all the elements in the matrix.
Each element uij of matrix U determines the degree to which the associated termfi belongs to cluster j. For cluster labeling we simply choose for each cluster theten terms with the highest degree of affiliation. Analogously each element vij ofmatrix V represents the degree to which document i is associated with cluster j.To cluster the documents, again we assign every document to the cluster with thehighest degree of affiliation. If a document d clearly belongs to one cluster x thenvdx will have a high value compared to the rest of the values in the d’th row vectorof V . The matrix factorization is depicted in Figure C.2.
For those clustering approaches that do not extract cluster labels at the sametime, labels can be obtained by applying cluster labeling methods. Two well-known
142
approaches will be presented in the next section.
C.4 Cluster Labeling Methods
When data has been clustered it is often desirable to have a description of the clustersobtained (e. g., when users interact with the clusters). Our proposed recommenda-tion approaches use cluster labels consisting of representative terms or features inorder to enable the retrieval of resources according to a user’s respective topics ofinterest or preferred music styles. Cluster labels can be obtained by applying clus-ter labeling methods. [Manning et al., 2009], pp. 396, distinguish two approaches:First, there are cluster-internal methods that extract a label solely based on thecluster under consideration. Frequency-based cluster labeling is one such methodthat will be described in Section C.4.1. Second, with differential cluster labeling thelabels are extracted by comparing the distribution of features in one cluster withthe distribution of the features in the other clusters. We will present the chi-squaremethod as one example of such an approach in Section C.4.2. For our topic-basedresource recommendations approach we have used the NMF algorithm for cluster-ing. As NMF is a co-clustering approach that extracts clusters and cluster labelsat the same time, no separate cluster labeling method had to be applied with thisalgorithm. In Section C.3.2 it has been described how the matrices obtained by theNMF algorithm were used for clustering and cluster labeling respectively.
C.4.1 Frequency-based Cluster Labeling
Frequency-based cluster labeling selects the features that are most common in acluster. Usually document frequency (the number of documents in the cluster thathave the feature) and collection frequency (how often does the feature appear inthe whole collection) are distinguished. For our purposes we use a slightly differentapproach:
Let I be our set of items and let c = {i1, i2, ..., ij} be the items in cluster c.Each item i = (wi1 , wi2 , ..., win) is represented by n weighted features. The weightof feature f in cluster c is then determined as follows:
FB (c, f) =∑i∈c
wif (C.8)
143
To obtain a label for cluster c the features are ranked by their weight and the topk features are selected.
C.4.2 Chi-square Cluster Labeling
In statistics the chi-square test is used to check whether two events are independent.Two events A and B are defined to be independent if P (AB) = P (A)P (B). Anequivalent definition is: P (A | B) = P (A) and P (B | A) = P (B).
Let ef ∈ {0, 1} be a variable that indicates whether a feature is present (ef = 1)or absent (ef = 0) in the profile of an item and ec ∈ {0, 1} a variable that indicateswhether an item is in the currently considered cluster (ec = 1) or not (ec = 0).Let further N be the observed frequency in our item set I and E be the expectedfrequency, e. g., E11 is the expected frequency that a feature and a cluster occurtogether given that feature and cluster are independent. The chi-square weight of afeature f for a cluster c is then calculated as follows:
χ2 (I, f, c) =∑
ef∈{0,1}
∑ec∈{0,1}
(Nef ec − Eef ec
)2Eef ec
(C.9)
To obtain a label for cluster c the features are ranked by their weight and the topk features are selected.

144
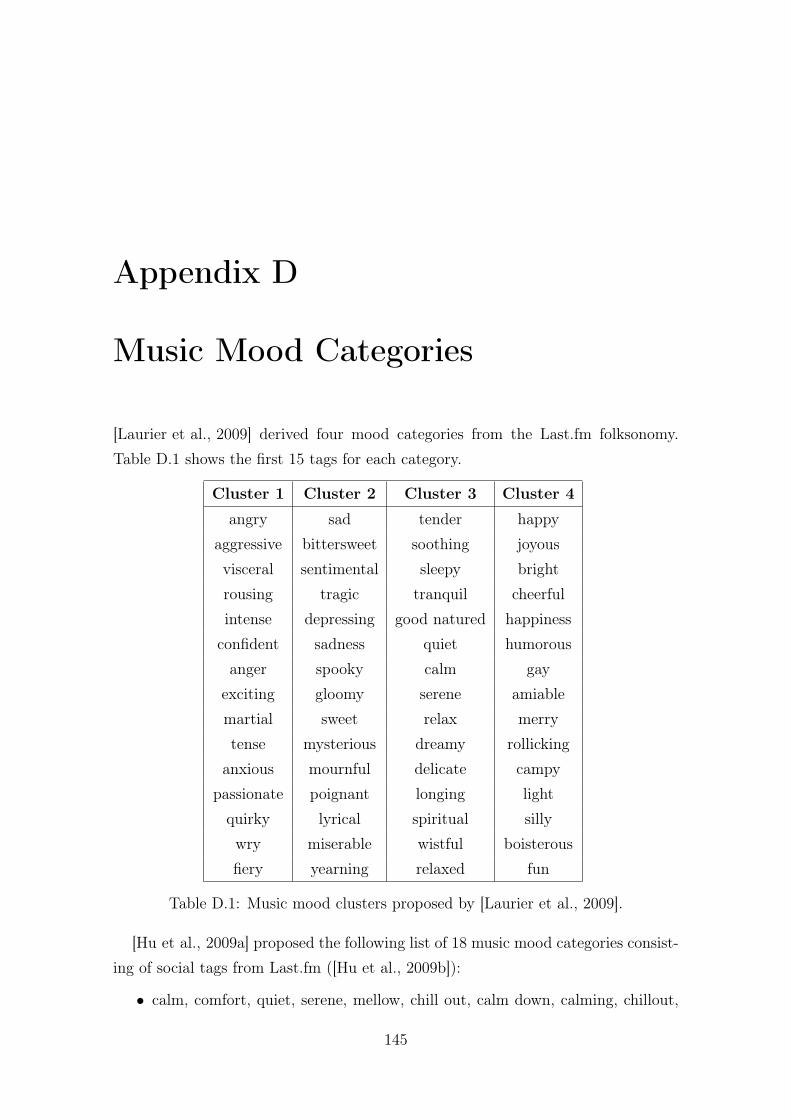
Appendix D
Music Mood Categories
[Laurier et al., 2009] derived four mood categories from the Last.fm folksonomy.Table D.1 shows the first 15 tags for each category.
Cluster 1 Cluster 2 Cluster 3 Cluster 4
angry sad tender happyaggressive bittersweet soothing joyousvisceral sentimental sleepy brightrousing tragic tranquil cheerfulintense depressing good natured happinessconfident sadness quiet humorousanger spooky calm gay
exciting gloomy serene amiablemartial sweet relax merrytense mysterious dreamy rollicking
anxious mournful delicate campypassionate poignant longing lightquirky lyrical spiritual sillywry miserable wistful boisterousfiery yearning relaxed fun
Table D.1: Music mood clusters proposed by [Laurier et al., 2009].
[Hu et al., 2009a] proposed the following list of 18 music mood categories consist-ing of social tags from Last.fm ([Hu et al., 2009b]):
• calm, comfort, quiet, serene, mellow, chill out, calm down, calming, chillout,
145
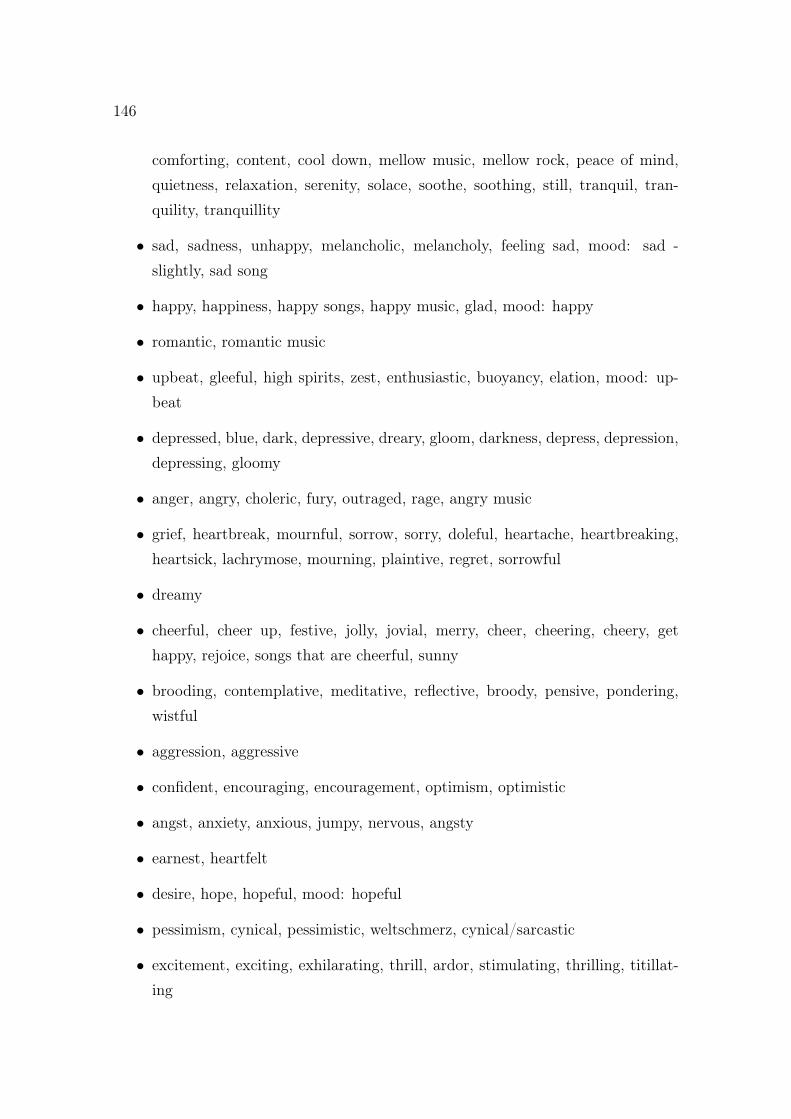
146
comforting, content, cool down, mellow music, mellow rock, peace of mind,quietness, relaxation, serenity, solace, soothe, soothing, still, tranquil, tran-quility, tranquillity
• sad, sadness, unhappy, melancholic, melancholy, feeling sad, mood: sad -slightly, sad song
• happy, happiness, happy songs, happy music, glad, mood: happy
• romantic, romantic music
• upbeat, gleeful, high spirits, zest, enthusiastic, buoyancy, elation, mood: up-beat
• depressed, blue, dark, depressive, dreary, gloom, darkness, depress, depression,depressing, gloomy
• anger, angry, choleric, fury, outraged, rage, angry music
• grief, heartbreak, mournful, sorrow, sorry, doleful, heartache, heartbreaking,heartsick, lachrymose, mourning, plaintive, regret, sorrowful
• dreamy
• cheerful, cheer up, festive, jolly, jovial, merry, cheer, cheering, cheery, gethappy, rejoice, songs that are cheerful, sunny
• brooding, contemplative, meditative, reflective, broody, pensive, pondering,wistful
• aggression, aggressive
• confident, encouraging, encouragement, optimism, optimistic
• angst, anxiety, anxious, jumpy, nervous, angsty
• earnest, heartfelt
• desire, hope, hopeful, mood: hopeful
• pessimism, cynical, pessimistic, weltschmerz, cynical/sarcastic
• excitement, exciting, exhilarating, thrill, ardor, stimulating, thrilling, titillat-ing
Appendix E
Evaluation
The current chapter of the appendix summarizes important aspects for the evalu-ation of recommender systems and in particular for the evaluation of collaborativefiltering systems as discussed by [Herlocker et al., 2004]. First, live user experimentsare compared to offline analyses in Section E.1. Next, in Section E.2 the use of syn-thesized in contrast to natural data sets is discussed. Properties of recommendersystem data sets are depicted in Section E.3. The chapter concludes with an overviewof different measures for the evaluation of recommender systems in Section E.4.
E.1 Kind of Evaluation
Recommender systems can be evaluated by conducting live user experiments, offlineanalyses, or both. The approach taken by most researchers in the past was the offlineanalysis of the predictive accuracy. Offline analyses can be performed quickly andeconomically for different algorithms and even on different data sets. However, thereare two major weaknesses of offline analyses: First, recommendations of items forwhich no ratings of the active user are available cannot be evaluated. Due to thesparsity of most rating data sets this point is a major issue. Second, with offlineanalysis it cannot be evaluated whether users preferred a system because of itspredictions or because of other criteria like, e. g., the aesthetics of the user interface.Live user experiments on the other hand allow the evaluation of measures such asuser performance, satisfaction, and participation. Dimensions of user evaluationsare depicted at the end of Section E.5.
147
148
E.2 Kind of Data Set
When selecting a data set on which to evaluate a recommender algorithm researchershave to decide whether to use a natural data set (i. e., using an existing data base)or a synthesized data set (i. e., an artificially constructed data set). Using a naturaldata set may have the drawback that the data matches the target domain and taskonly imperfectly. A synthesized data set on the other hand may better fit theseproperties but is therefore also often criticized to be unfair as it might match thetested approach to well. Using synthesized data sets to test obvious flaws in anearly stage of the recommender development is often reasonable however comparingalgorithms based on such data is risky as the data might fit one algorithm betterthan the other.
E.3 Properties of Data Sets
Subsequently we will briefly present properties of recommender system data sets asproposed by [Herlocker et al., 2004] in tabular form (see Table E.1). The propertiesare divided into domain features (reflecting the nature of the content that is rec-ommended), inherent features (reflecting the nature of the respective recommendersystem), and sample features summarizing the distribution of the attributes in thedata set. When selecting a foreign data set for the evaluation of the own recommen-dation approach it is particularly important to carefully compare these propertiesin order to find out which one is suited best.
E.4 Evaluation Measures
Subsequently we will present four different kinds of accuracy metrics that can beused for the offline evaluation of recommender systems.
E.4.1 Predictive Accuracy Metrics
Predictive accuracy metrics are widely used to evaluate the performance of recom-mender systems. They determine how close a rating prediction is to the true userrating. Usually predictive accuracy is measured by taking a data base of user-itemratings, withholding a certain percentage of the ratings, and calculating a rating
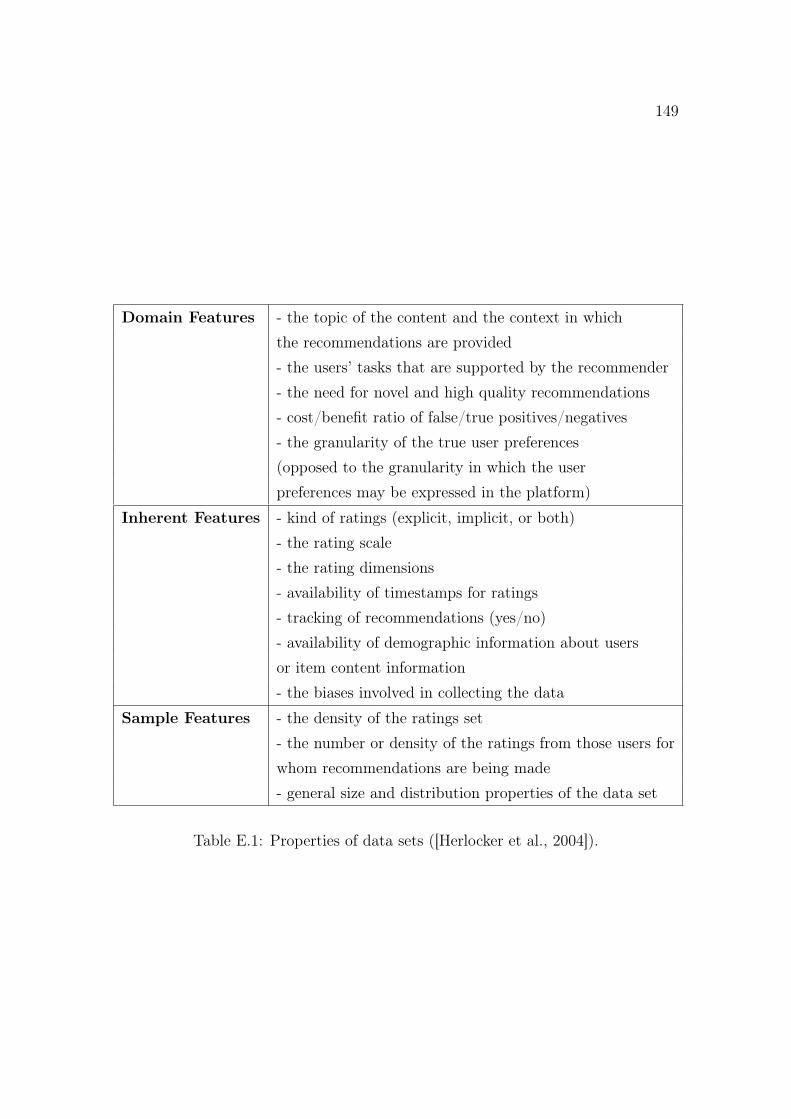
149
Domain Features - the topic of the content and the context in whichthe recommendations are provided- the users’ tasks that are supported by the recommender- the need for novel and high quality recommendations- cost/benefit ratio of false/true positives/negatives- the granularity of the true user preferences(opposed to the granularity in which the userpreferences may be expressed in the platform)
Inherent Features - kind of ratings (explicit, implicit, or both)- the rating scale- the rating dimensions- availability of timestamps for ratings- tracking of recommendations (yes/no)- availability of demographic information about usersor item content information- the biases involved in collecting the data
Sample Features - the density of the ratings set- the number or density of the ratings from those users forwhom recommendations are being made- general size and distribution properties of the data set
Table E.1: Properties of data sets ([Herlocker et al., 2004]).
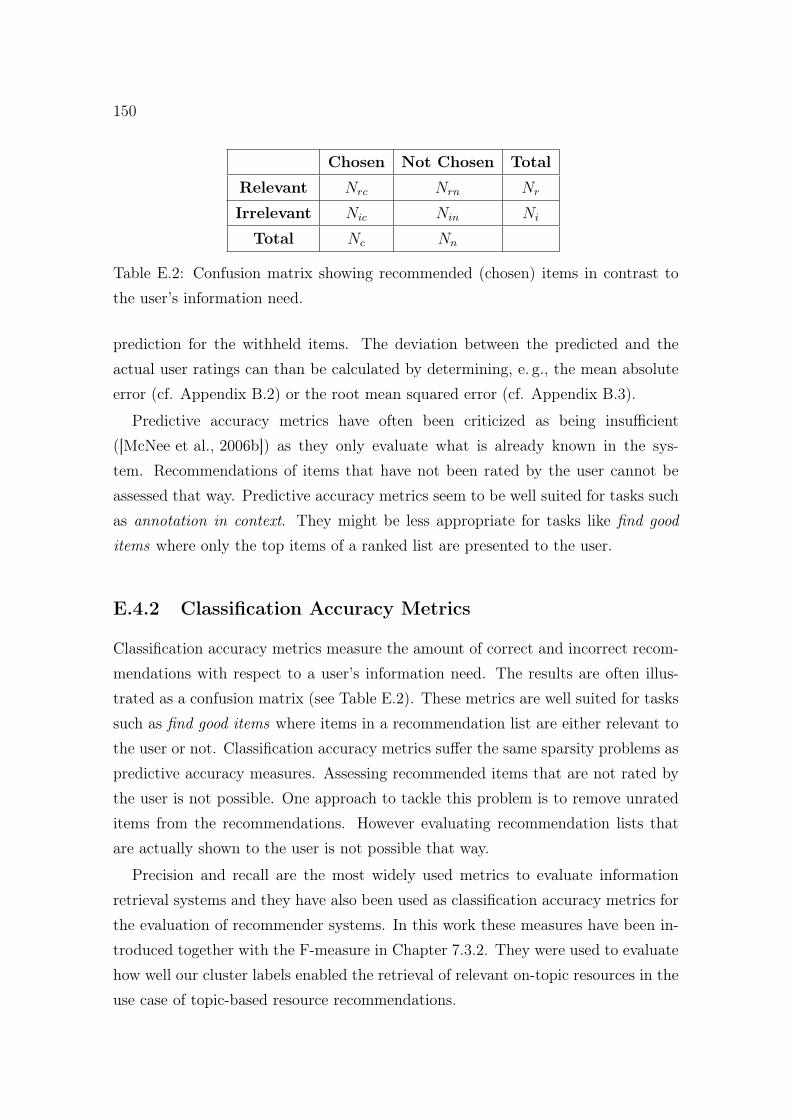
150
Chosen Not Chosen Total
Relevant Nrc Nrn Nr
Irrelevant Nic Nin Ni
Total Nc Nn
Table E.2: Confusion matrix showing recommended (chosen) items in contrast tothe user’s information need.
prediction for the withheld items. The deviation between the predicted and theactual user ratings can than be calculated by determining, e. g., the mean absoluteerror (cf. Appendix B.2) or the root mean squared error (cf. Appendix B.3).
Predictive accuracy metrics have often been criticized as being insufficient([McNee et al., 2006b]) as they only evaluate what is already known in the sys-tem. Recommendations of items that have not been rated by the user cannot beassessed that way. Predictive accuracy metrics seem to be well suited for tasks suchas annotation in context. They might be less appropriate for tasks like find gooditems where only the top items of a ranked list are presented to the user.
E.4.2 Classification Accuracy Metrics
Classification accuracy metrics measure the amount of correct and incorrect recom-mendations with respect to a user’s information need. The results are often illus-trated as a confusion matrix (see Table E.2). These metrics are well suited for taskssuch as find good items where items in a recommendation list are either relevant tothe user or not. Classification accuracy metrics suffer the same sparsity problems aspredictive accuracy measures. Assessing recommended items that are not rated bythe user is not possible. One approach to tackle this problem is to remove unrateditems from the recommendations. However evaluating recommendation lists thatare actually shown to the user is not possible that way.
Precision and recall are the most widely used metrics to evaluate informationretrieval systems and they have also been used as classification accuracy metrics forthe evaluation of recommender systems. In this work these measures have been in-troduced together with the F-measure in Chapter 7.3.2. They were used to evaluatehow well our cluster labels enabled the retrieval of relevant on-topic resources in theuse case of topic-based resource recommendations.
151
E.4.3 Rank Accuracy Metrics
Rank accuracy metrics determine how good a predicted ordering of items matchesthe user’s ordering of the items. These measures are well suited in domains wherea ranked list of items is presented to the user and the true user preferences are nonbinary. The rank accuracy metrics may be too sensitive in domains where the userjust seeks items that are “good enough”. However when good alternatives are notsufficient and the best items are required these measures can be helpful.
E.4.4 Prediction-Rating Correlation
We consider two variables as correlated when the variance in one variable can be ex-plained by the variance in the other variable. Frequently used correlation measuresare the Pearson correlation coefficient and Spearman’s ρ. Pearson correlation is de-termined as depicted in Equation A.1. Spearman’s ρ is a rank correlation measure.It is calculated in the same manner as the Pearson correlation coefficient howeverinstead of ratings the ranks of the items are used. It has to be noted that the Spear-man correlation metric doesn’t handle partial orderings well. If the user’s rankingof items given by the rating values is a partial ordering (e. g., many items rated withfour stars with no further distinction) and the system uses a complete ordering,the measure will penalize every pair of items rated equivalently by the user andranked differently by the system. Measures such as the normalized distance-basedperformance measure (NDPM, [Yao, 1995]) are supposed to remedy this problem.Despite of their simplicity, correlation based metrics have not been used very oftento evaluate recommender or information retrieval systems.
E.5 Beyond Accuracy
As already mentioned before there is an increasing awareness that judging recom-mender systems based on accuracy alone does not necessarily lead to effective andsatisfying user experiences with a system. Recommending very popular items canlead to high accuracy but may still not provide much utility to the user. E. g., arecommender system for a supermarket suggesting bread, eggs, and bananas will al-most always be highly accurate but still doesn’t aid the user. In the current sectionwe will present measures for the evaluation of recommender systems that go beyond
152
accuracy targeting at user utility ([Herlocker et al., 2004]).
Coverage is a measure of the domain of items that can be recommended by thesystem. A straightforward definition is coverage as the percentage of items for whichrating predictions can be generated (prediction coverage). Alternatively one coulddefine coverage as the percentage of catalog items that is actually recommended tousers (catalog coverage). Coverage is particularly important for the find all gooditems task as well as for the annotation in context task. Much in the same way thatprecision should always be evaluated together with recall, coverage should alwaysbe assessed together with accuracy. Tuning a system for coverage at the cost ofproviding false rating predictions/recommendations is obviously not desirable.
The Learning Rate measures the amount of ratings needed for a collaborativefiltering system to provide useful or “acceptable” recommendations and to improvethe recommendation quality. Three types of learning rates are distinguished: (i) theoverall learning rate determines the quality of the recommendations as a function ofthe total number of ratings (or users) in the system. (ii) The per-item learning rateindicates the quality of the predictions for an item as a function of the number ofavailable ratings for the item. (iii) Analogously the per-user learning rate determinesthe quality of the recommendations for a user as a function of her provided ratings.
Novelty and Serendipity Recommender systems tuned for accuracy often sufferthe problem of recommending too obvious items. This has two major drawbacks:First, it is very likely that the user already knows about these items. In this case sheeither has already consumed/purchased the item or has made a conscious decisionnot to consume/purchase it. Second, store managers already know which itemsare popular and make arrangements to present these products in an advantageousway. Hence new dimensions such as novelty and serendipity are often requested asmeasures to evaluate recommender systems. Novelty refers to recommendations ofitems that are new to the user but may potentially be similar to previously seenitems (e. g., films by the same director in the domain of movies). Serendipitousrecommendations on the other hand are both attractive and surprising to the user(i. e., not similar to previously seen items). However it should be noted that obviousrecommendations can aid new users to build up trust with a recommender systemand might therefore be helpful when a user starts to use a system.
153
Confidence is a measure of how sure the recommender system is about the accu-racy of its recommendation. It is often measured based on the amount of data thatis available to recommend an item. Confidence should clearly be distinguished fromthe strength of a recommendation which measures how much the system thinks theuser will like a recommended item (e. g., a predicted rating of four on a five pointrating scale). An item with a rating prediction of five stars will not necessarily bepreferred by a user over an item with a rating prediction of four stars when theconfidence for the five star prediction is low (i. e., the prediction is calculated basedon few data points).
User Evaluation constitutes an important instrument that allows to directlymeasure the users’ reactions to a recommender system. Subsequently we will presentfour dimensions as proposed by [Herlocker et al., 2004] for user evaluations:
Explicit vs. Implicit: In explicit evaluations users are directly asked abouttheir reactions to a recommender system (e. g., via surveys and interviews). Implicituser evaluations typically log user behavior and then perform analyses on the logdata.
Laboratory Studies vs. Field Studies: Laboratory studies are particularlysuited to test well-defined hypotheses under controlled conditions. Field studies onthe other hand allow to monitor users in their own actual contexts that way unveilingusage patterns, issues, and user needs that are unmet.
Outcome vs. Process: Measuring the outcome of a task such as find gooditems is important for the evaluation of recommender systems. However, it is crucialto also take into account the process, i. e., considering how efficiently (in terms oftime and effort spent) the task could be solved by using a particular system.
Short-term vs. Long-term: Some issues users may have with a system maynot be discovered in short-term studies. E. g., a short-term study may show thatusers still find useful items even if the overall quality of a recommender system israther low. However in the long-term users might get dissatisfied with such a systemand decide to stop using it.

154
Bibliography
[Adomavicius and Tuzhilin, 2005] Adomavicius, G. and Tuzhilin, A. (2005). Towardthe next generation of recommender systems: A survey of the state-of-the-art andpossible extensions. IEEE Transactions on Knowledge and Data Engineering,17(6):734–749.
[Agne et al., 2006] Agne, S., Reuschling, C., and Dengel, A. (2006). DynaQ - dy-namic queries for electronic document management. In Proceedings IEEE-EDM.,pages 56–59. IEEE International Workshop on the Electronic Document Manage-ment in an Enterprise Computing Environment. Hong Kong, China.
[Allan et al., 1998] Allan, J., Carbonell, J., Doddington, G., Yamron, J., and Yang,Y. (1998). Topic detection and tracking pilot study: Final report. In Proceedingsof the DARPA Broadcast News Transcription and Understanding Workshop, pages194–218.
[Amatriain, 2009] Amatriain, X. (2009). The netflix prize: Lessonslearned. http://technocalifornia.blogspot.com/2009/09/
netflix-prize-lessons-learned.html. [Online; accessed 19-November-2010].
[Anand et al., 2007] Anand, S. S., Kearney, P., and Shapcott, M. (2007). Generatingsemantically enriched user profiles for web personalization. ACM Trans. InternetTechnol., 7(4):22.
[Ankolekar et al., 2007] Ankolekar, A., Krötzsch, M., Tran, T., and Vrandecic, D.(2007). The two cultures: mashing up web 2.0 and the semantic web. In Proceed-ings of the 16th international conference on World Wide Web, WWW ’07, pages825–834, New York, NY, USA. ACM.
155
156
[Au Yeung et al., 2008] Au Yeung, C. M., Gibbins, N., and Shadbolt, N. (2008). Astudy of user profile generation from folksonomies. In Proceedings of the Work-shop on Social Web and Knowledge Management (SWKM2008), co-located withWWW2008, Beijing, China, 21-25 April, 2007, pages 1–8.
[Balabanovic and Shoham, 1997] Balabanovic, M. and Shoham, Y. (1997). Fab:Content-based, collaborative recommendation. Communications of the ACM,40(3):66–72.
[Baumann et al., 2010] Baumann, S., Schirru, R., and Streit, B. (2010). Towards astorytelling approach for novel artist recommendations. In Detyniecki, M., Knees,P., Nürnberger, A., Schedl, M., and Stober, S., editors, Adaptive Multimedia Re-trieval, volume 6817 of Lecture Notes in Computer Science, pages 1–15. Springer.
[Begelman et al., 2006] Begelman, G., Keller, P., and Smadja, F. (2006). Auto-mated tag clustering: Improving search and exploration in the tag space. InCollaborative Web Tagging Workshop at WWW2006, Edinburgh, Scotland.
[Belkin and Croft, 1992] Belkin, N. J. and Croft, W. B. (1992). Information filteringand information retrieval: two sides of the same coin? Communications of theACM, 35(12):29–38.
[Berners-Lee, 2009] Berners-Lee, T. (2009). Linked data. http://www.w3.org/
DesignIssues/LinkedData. [Online; accessed 23-September-2009].
[Berners-Lee and Fischetti, 2000] Berners-Lee, T. and Fischetti, M. (2000). Weav-ing the Web : The Original Design and Ultimate Destiny of the World Wide Web.Harper Paperbacks.
[Berners-Lee et al., 2001] Berners-Lee, T., Hendler, J., and Lassila, O. (2001). Thesemantic web. Scientific American, May Issue:34–43.
[Bizer et al., 2009] Bizer, C., Heath, T., and Berners-Lee, T. (2009). Linked data -the story so far. International Journal on Semantic Web and Information Systems,5(3):1–22.
[Blei et al., 2003] Blei, D. M., Ng, A. Y., and Jordan, M. I. (2003). Latent dirichletallocation. Journal of Machine Learning Research, 3:993–1022.
157
[Bradley and Smyth, 2001] Bradley, K. and Smyth, B. (2001). Improving recom-mendation diversity. In O’Donoghue, D., editor, Proceedings of the Twelfth Na-tional Conference in Articial Intelligence and Cognitive Science (AICS-01), pages75–84.
[Burke, 2000] Burke, R. (2000). Knowledge-based recommender systems. Encyclo-pedia of Library and Information Science, 69(32).
[Burke, 2002] Burke, R. D. (2002). Hybrid recommender systems: Survey and ex-periments. User Model. User-Adapt. Interact., 12(4):331–370.
[Cao et al., 2007] Cao, B., Shen, D., Sun, J.-T., Wang, X., Yang, Q., and Chen, Z.(2007). Detect and track latent factors with online nonnegative matrix factor-ization. In IJCAI’07: Proceedings of the 20th international joint conference onArtificial intelligence, pages 2689–2694, San Francisco, CA, USA. Morgan Kauf-mann Publishers Inc.
[Celma, 2008] Celma, Ó. (2008). Music Recommendation and Discovery in the LongTail. PhD thesis, University Pompeu Fabra, Barcelona, Spain.
[Celma and Herrera, 2008] Celma, O. and Herrera, P. (2008). A new approach toevaluating novel recommendations. In RecSys ’08: Proceedings of the 2008 ACMconference on Recommender systems, pages 179–186, New York, NY, USA. ACM.
[Cyganiak and Jentzsch, 2011] Cyganiak, R. and Jentzsch, A. (2011). The linkingopen data cloud diagram. http://richard.cyganiak.de/2007/10/lod/. [On-line; accessed 16-May-2012].
[Deerwester et al., 1990] Deerwester, S. C., Dumais, S. T., Landauer, T. K., Furnas,G. W., and Harshman, R. A. (1990). Indexing by latent semantic analysis. Journalof the American Society of Information Science, 41(6):391–407.
[Downes, 2003] Downes, S. (2003). Resource profiles. http://www.downes.ca/
files/resource_profiles.htm. [Online; accessed 24-June-2010].
[Duan et al., 2009] Duan, M., Ulges, A., Breuel, T. M., and Wu, X.-q. (2009). Stylemodeling for tagging personal photo collections. In CIVR ’09: Proceeding of theACM International Conference on Image and Video Retrieval, pages 1–8, NewYork, NY, USA. ACM.
158
[Goldberg et al., 1992] Goldberg, D., Nichols, D., Oki, B. M., and Terry, D. (1992).Using collaborative filtering to weave an information tapestry. Commun. ACM,35(12):61–70.
[Golder and Huberman, 2006] Golder, S. and Huberman, B. A. (2006). Usage pat-terns of collaborative tagging systems. Journal of Information Science, 32(2):198–208.
[Greaves and Mika, 2008] Greaves, M. and Mika, P. (2008). Editorial: Semanticweb and web 2.0. Web Semant., 6:1–3.
[Gruber, 1993] Gruber, T. R. (1993). A translation approach to portable ontologyspecifications. Knowledge Acquisition, 5(2):199–220.
[Guo and Joshi, 2010] Guo, Y. and Joshi, J. B. (2010). Topic-based personalizedrecommendation for collaborative tagging system. In HT ’10: Proceedings of the21st ACM conference on Hypertext and hypermedia, pages 61–66, New York, NY,USA. ACM.
[Heckmann et al., 2005] Heckmann, D., Schwartz, T., Brandherm, B., Schmitz, M.,and von Wilamowitz-Moellendorff, M. (2005). Gumo - the general user modelontology. In Proceedings of the 10th International Conference on User Modeling,pages 428–432, Edinburgh, UK. LNAI 3538: Springer, Berlin Heidelberg.
[Herlocker et al., 2004] Herlocker, J. L., Konstan, J. A., Terveen, L. G., and Riedl,J. T. (2004). Evaluating collaborative filtering recommender systems. ACM Trans.Inf. Syst., 22(1):5–53.
[Hevner, 1936] Hevner, K. (1936). Experimental studies of the elements of expres-sion in music. The American Journal of Psychology, 48(2):246–268.
[Hofmann, 1999] Hofmann, T. (1999). Probabilistic latent semantic analysis. InProc. of Uncertainty in Artificial Intelligence, UAI’99, Stockholm.
[Hotho et al., 2006a] Hotho, A., Jäschke, R., Schmitz, C., and Stumme, G. (2006a).Bibsonomy: A social bookmark and publication sharing system. In Proceedings ofthe Conceptual Structures Tool Interoperability Workshop at the 14th InternationalConference on Conceptual Structures, pages 87–102. Aalborg University Press.
159
[Hotho et al., 2006b] Hotho, A., Jäschke, R., Schmitz, C., and Stumme, G. (2006b).Information retrieval in folksonomies: Search and ranking. In The Semantic Web:Research and Applications, volume 4011 of Lecture Notes in Computer Science,pages 411–426, Heidelberg. Springer.
[Hu and Pu, 2009] Hu, R. and Pu, P. (2009). A comparative user study on rating vs.personality quiz based preference elicitation methods. In Proceedings of the 14thinternational conference on Intelligent user interfaces, IUI ’09, pages 367–372,New York, NY, USA. ACM.
[Hu et al., 2007] Hu, X., Bay, M., and Downie, J. S. (2007). Creating a simplifiedmusic mood classification ground-truth set. In Proceedings of the 8th InternationalConference on Music Information Retrieval, pages 309–310.
[Hu and Downie, 2007] Hu, X. and Downie, J. S. (2007). Exploring mood metadata:relationships with genre, artist and usage metadata. In Proc. of ISMIR 2007,pages 67–72.
[Hu et al., 2009a] Hu, X., Downie, J. S., and Ehmann, A. F. (2009a). Lyric textmining in music mood classification. In Proceedings of the 10th InternationalConference on Music Information Retrieval, pages 411–416.
[Hu et al., 2009b] Hu, X., Downie, J. S., and Ehmann, A. F. (2009b). Moodcategories and song distributions. http://music-ir.org/archive/figs/
18moodcat.htm. [Online; accessed 31-August-2010].
[Hu et al., 2008] Hu, X., Downie, J. S., Laurier, C., Bay, M., and Ehmann, A. F.(2008). The 2007 mirex audio mood classification task: Lessons learned. In Bello,J. P., Chew, E., and Turnbull, D., editors, ISMIR, pages 462–467.
[Jardine and van Rijsbergen, 1971] Jardine, N. and van Rijsbergen, C. J. (1971).The use of hierarchic clustering in information retrieval. Information Storage andRetrieval, 7(5):217–240.
[Juslin and Sloboda, 2001] Juslin, P. N. and Sloboda, J. A. (2001). Music and Emo-tion: Theory and Research. Oxford University Press, USA.
160
[Konstan et al., 1997] Konstan, J., Miller, B., Maltz, D., Herlocker, J., Gordon, L.,and Riedl, J. (1997). Grouplens: Applying collaborative filtering to usenet news.Communications of the ACM, 40:77–87.
[Koren, 2009] Koren, Y. (2009). The bellkor solution to the netflix prize. http://www.netflixprize.com/assets/GrandPrize2009_BPC_BellKor.pdf. [Online;accessed 19-November-2010].
[Krötzsch et al., 2006] Krötzsch, M., Vrandečić, D., and Völkel, M. (2006). Seman-tic mediawiki. In Cruz, I., Decker, S., Allemang, D., Preist, C., Schwabe, D., Mika,P., Uschold, M., and Aroyo, L., editors, The Semantic Web - ISWC 2006, vol-ume 4273 of Lecture Notes in Computer Science, pages 935–942. Springer Berlin/ Heidelberg.
[Laurier et al., 2009] Laurier, C., Sordo, M., Serrà, J., and Herrera, P. (2009). Mu-sic mood representations from social tags. In International Society for MusicInformation Retrieval (ISMIR) Conference, pages 381–386.
[Lee and Lee, 2006] Lee, J. and Lee, J. (2006). Music for my mood: A music rec-ommendation system based on context reasoning. In Havinga, P., Lijding, M.,Meratnia, N., and Wegdam, M., editors, Smart Sensing and Context, volume 4272of Lecture Notes in Computer Science, pages 190–203. Springer Berlin / Heidel-berg.
[Li et al., 2008] Li, X., Guo, L., and Zhao, Y. E. (2008). Tag-based social interestdiscovery. InWWW ’08: Proceeding of the 17th international conference on WorldWide Web, pages 675–684, New York, NY, USA. ACM.
[Linden et al., 2003] Linden, G., Smith, B., and York, J. (2003). Amazon.com rec-ommendations: item-to-item collaborative filtering. Internet Computing, IEEE,7(1):76–80.
[Liu and Huang, 2000] Liu, Z. and Huang, Q. (2000). Content-based indexing andretrieval-by-example in audio. In IEEE International Conference on Multimediaand Expo (II), pages 877–880.
[Logan and Salomon, 2001] Logan, B. and Salomon, A. (2001). A music similarityfunction based on signal analysis. In Multimedia and Expo, 2001. ICME 2001.IEEE International Conference on, pages 745 – 748.
161
[Manning et al., 2009] Manning, C. D., Raghavan, P., and Schütze, H. (2009). In-troduction to Information Retrieval. Cambridge University Press, online edition.
[Marlow et al., 2006] Marlow, C., Naaman, M., Boyd, D., and Davis, M. (2006).Ht06, tagging paper, taxonomy, flickr, academic article, to read. In HYPERTEXT’06: Proceedings of the Seventeenth Conference on Hypertext and Hypermedia,pages 31–40, New York, NY, USA. ACM.
[McAfee, 2006] McAfee, A. P. (2006). Enterprise 2.0: The dawn of emergent col-laboration. MIT Sloan Management Review, 47(3):21–28.
[McNee et al., 2006a] McNee, S. M., Riedl, J., and Konstan, J. (2006a). Accurateis not always good: How accuracy metrics have hurt recommender systems. InExtended Abstracts of the 2006 ACM Conference on Human Factors in ComputingSystems (CHI 2006), pages 1–5.
[McNee et al., 2006b] McNee, S. M., Riedl, J., and Konstan, J. A. (2006b). Beingaccurate is not enough: how accuracy metrics have hurt recommender systems. InOlson, G. M. and Jeffries, R., editors, CHI Extended Abstracts, pages 1097–1101.ACM.
[Memmel et al., 2008] Memmel, M., Kockler, M., and Schirru, R. (2008). Provid-ing multi source tag recommendations in a social resource sharing platform. InMaurer, H., Kappe, F., Haas, W., and Tochtermann, K., editors, Proceedings of I-MEDIA ’08, pages 226–233. Know-Center, Graz, Journal of Universal ComputerScience. ISSN 0948-695x.
[Memmel and Schirru, 2007] Memmel, M. and Schirru, R. (2007). ALOE - a so-cially aware learning resource and metadata hub. In Wolpers, M., Klamma, R.,and Duval, E., editors, Proceedings of the EC-TEL 2007 Poster Session. CEURworkshop proceedings. ISSN 1613-0073.
[Middleton et al., 2001] Middleton, S. E., De Roure, D. C., and Shadbolt, N. R.(2001). Capturing knowledge of user preferences: ontologies in recommender sys-tems. In K-CAP ’01: Proceedings of the 1st international conference on Knowl-edge capture, pages 100–107, New York, NY, USA. ACM.
162
[Montaner et al., 2003] Montaner, M., López, B., and de la Rosa, J. L. (2003). Ataxonomy of recommender agents on the internet. Artif. Intell. Rev., 19(4):285–330.
[Mooney and Roy, 2000] Mooney, R. J. and Roy, L. (2000). Content-based bookrecommending using learning for text categorization. In DL ’00: Proceedingsof the fifth ACM conference on Digital libraries, pages 195–204, New York, NY,USA. ACM.
[Morris et al., 2005] Morris, M., Pohlmann, T., and Young, G. O. (2005). How dousers feel about technology? Forrester Research.
[Mortensen et al., 2008] Mortensen, M., Gurrin, C., and Johansen, D. (2008). Real-world mood-based music recommendation. In Li, H., Liu, T., Ma, W.-Y., Sakai,T., Wong, K.-F., and Zhou, G., editors, Information Retrieval Technology, volume4993 of Lecture Notes in Computer Science, pages 514–519. Springer Berlin /Heidelberg.
[Nichols, 1997] Nichols, D. M. (1997). Implicit rating and filtering. In Proceedings ofthe Fifth DELOS Workshop on Filtering and Collaborative Filtering, pages 31–36.
[O’Reilly, 2005a] O’Reilly, T. (2005a). Web 2.0: Compact definition?- o’reilly radar. http://radar.oreilly.com/archives/2005/10/
web-20-compact-definition.html. [Online; accessed 02-November-2010].
[O’Reilly, 2005b] O’Reilly, T. (2005b). What is web 2.0 - design patterns and busi-ness models for the next generation of software. http://www.oreillynet.com/
pub/a/oreilly/tim/news/2005/09/30/what-is-web-20.html. [Online; ac-cessed 22-August-2008].
[Osinski et al., 2004] Osinski, S., Stefanowski, J., and Weiss, D. (2004). Lingo:Search results clustering algorithm based on singular value decomposition. InIntelligent Information Systems, pages 359–368.
[Passant, 2010] Passant, A. (2010). Measuring semantic distance on linking dataand using it for resources recommendations. In Proceedings of the AAAI SpringSymposium ”Linked Data Meets Artificial Intelligence”, pages 93–98.
163
[Pazzani, 1999] Pazzani, M. J. (1999). A framework for collaborative, content-basedand demographic filtering. Artif. Intell. Rev., 13(5-6):393–408.
[Pazzani and Billsus, 1997] Pazzani, M. J. and Billsus, D. (1997). Learning and re-vising user profiles: The identification of interesting web sites. Machine Learning,27(3):313–331.
[Pazzani and Billsus, 2007] Pazzani, M. J. and Billsus, D. (2007). Content-basedrecommendation systems. In Brusilovsky, P., Kobsa, A., and Nejdl, W., edi-tors, The Adaptive Web: Methods and Strategies of Web Personalization, volume4321 of Lecture Notes in Computer Science, chapter 10, pages 325–341. Springer,Berlin.
[Resnick et al., 1994] Resnick, P., Iacovou, N., Sushak, M., Bergstrom, P., andRiedl, J. (1994). Grouplens: An open architecture for collaborative filtering ofnetnews. In 1994 ACM Conference on Computer Supported Collaborative WorkConference, pages 175–186.
[Rho et al., 2009] Rho, S., Han, B., and Hwang, E. (2009). Svr-based music moodclassification and context-based music recommendation. In Gao, W., Rui, Y.,Hanjalic, A., Xu, C., Steinbach, E. G., El-Saddik, A., and Zhou, M. X., editors,ACM Multimedia, pages 713–716. ACM.
[Russell, 1980] Russell, J. A. (1980). A circumplex model of affect. Journal ofPersonality and Social Psychology, 39(06):1161–1178.
[Sarwar et al., 2001] Sarwar, B., Karypis, G., Konstan, J., and Reidl, J. (2001).Item-based collaborative filtering recommendation algorithms. In WWW ’01:Proceedings of the 10th international conference on World Wide Web, pages 285–295, New York, NY, USA. ACM.
[Sarwar et al., 2000] Sarwar, B., Karypis, G., Konstan, J., and Riedl, J. (2000).Application of dimensionality reduction in recommender systems-a case study. InWebKDD-2000 Workshop, pages 309–324.
[Schirru, 2010] Schirru, R. (2010). Topic-based recommendations in enterprise socialmedia sharing platforms. In RecSys ’10: Proceedings of the fourth ACM conferenceon Recommender systems, pages 369–372, New York, NY, USA. ACM.
164
[Schirru et al., 2011a] Schirru, R., Baumann, S., Freye, C., and Dengel, A. (2011a).Towards context-sensitive music recommendations using multifaceted user pro-files. In The Proceedings of the AES 42nd International Conference, pages 54–59.
[Schirru et al., 2010a] Schirru, R., Baumann, S., Memmel, M., and Dengel, A.(2010a). Extraction of contextualized user interest profiles in social sharing plat-forms. Journal of Universal Computer Science, 16(16):2196–2213.
[Schirru et al., 2011b] Schirru, R., Baumann, S., Memmel, M., and Dengel, A.(2011b). Topic-based recommendations for enterprise 2.0 resource sharing plat-forms. In König, A., Dengel, A., Hinkelmann, K., Kise, K., Howlett, R. J., andJain, L. C., editors, Knowledge-Based and Intelligent Information and Engineer-ing Systems, volume 6881 of Lecture Notes in Computer Science, pages 495–504.Springer.
[Schirru et al., 2010b] Schirru, R., Obradović, D., Baumann, S., and Wortmann, P.(2010b). Domain-specific identification of topics and trends in the blogosphere.In Proceedings of the 10th industrial conference on Advances in data mining:applications and theoretical aspects, ICDM’10, pages 490–504, Berlin, Heidelberg.Springer-Verlag.
[Schult and Spiliopoulou, 2006] Schult, R. and Spiliopoulou, M. (2006). Discoveringemerging topics in unlabelled text collections. In Manolopoulos, Y., Pokorný, J.,and Sellis, T. K., editors, ADBIS, volume 4152 of Lecture Notes in ComputerScience, pages 353–366. Springer.
[Schwarz, 2006] Schwarz, S. (2006). A context model for personal knowledge man-agement applications. In Roth-Berghofer, T., Schulz, S., and Leake, D. B., editors,Modeling and Retrieval of Context, Second International Workshop, MRC 2005,Edinburgh, UK, July 31 - August 1, 2005, Revised Selected Papers, volume 3946of Lecture Notes in Computer Science, pages 18–33. Springer.
[Segaran, 2007] Segaran, T. (2007). Programming collective intelligence. O’Reilly.
[Sen et al., 2006] Sen, S., Lam, S. K., Rashid, A. M., Cosley, D., Frankowski, D.,Osterhouse, J., Harper, F. M., and Riedl, J. (2006). tagging, communities, vo-cabulary, evolution. In Proceedings of the 2006 20th anniversary conference on
165
Computer supported cooperative work, CSCW ’06, pages 181–190, New York, NY,USA. ACM.
[Shardanand and Maes, 1995] Shardanand, U. and Maes, P. (1995). Social informa-tion filtering: algorithms for automating “word of mouth”. In CHI ’95: Proceed-ings of the SIGCHI conference on Human factors in computing systems, pages210–217, New York, NY, USA. ACM Press/Addison-Wesley Publishing Co.
[Sinha, 2005] Sinha, R. (2005). A cognitive analysis of tagging. http://
rashmisinha.com/2005/09/27/a-cognitive-analysis-of-tagging/. [Online;accessed 17-September-2010].
[Song et al., 2009] Song, S., Kim, M., Rho, S., and Hwang, E. (2009). Music on-tology for mood and situation reasoning to support music retrieval and recom-mendation. In Proceedings of the 2009 Third International Conference on DigitalSociety, pages 304–309, Washington, DC, USA. IEEE Computer Society.
[Song and Park, 2007] Song, W. and Park, S. C. (2007). A novel document cluster-ing model based on latent semantic analysis. In Semantics, Knowledge and Grid,Third International Conference on, pages 539–542.
[Sparck Jones, 1972] Sparck Jones, K. (1972). A statistical interpretation of termspecificity and its application in retrieval. Journal of Documentation, 28(1):11–21.
[Stahl and Roth-Berghofer, 2008] Stahl, A. and Roth-Berghofer, T. R. (2008).Rapid prototyping of CBR applications with the open source tool myCBR. InBergmann, R. and Althoff, K.-D., editors, Advances in Case-Based Reasoning,pages 615–629. Springer Verlag.
[Tran and Cohen, 2000] Tran, T. and Cohen, R. (2000). Hybrid recommender sys-tems for electronic commerce. In Knowledge-Based Electronic Markets, Papersfrom the AAAI Workshop, AAAI Technical Report WS-00-04, pages 78–83. MenloPark, CA: AAAI Press.
[Ulges et al., 2009] Ulges, A., Koch, M., Borth, D., and Breuel, T. (2009). Tube-Tagger – YouTube-based concept detection. In Proc. Int. Workshop on InternetMultimedia Mining, pages 190–195. IEEE Computer Society.
166
[van Elst et al., 2008] van Elst, L., Kiesel, M., Schwarz, S., Buscher, G., Lauer,A., and Dengel, A. (2008). Contextualized knowledge acquisition in a personalsemantic wiki. In Gangemi, A. and Euzenat, J., editors, EKAW, volume 5268 ofLecture Notes in Computer Science, pages 172–187. Springer.
[Wahlster et al., 2006] Wahlster, W., Schwarzkopf, E., Sauermann, L., Roth-Berghofer, T., Pfalzgraf, A., Kiesel, M., Heckmann, D., Dengler, D., Dengel,A., and Sintek, M. (2006). Web 3.0: Convergence of web 2.0 and the semanticweb. Technology Radar, pages 1–23.
[Wal, 2007] Wal, T. V. (2007). Folksonomy. http://vanderwal.net/folksonomy.html. [Online; accessed 22-August-2008].
[Wang and Kong, 2007] Wang, R.-Q. and Kong, F.-S. (2007). Semantic-enhancedpersonalized recommender system. In International Conference on MachineLearning and Cybernetics, volume 07, pages 4069–4074.
[Weller, 2010] Weller, K. (2010). Knowledge Representation in the Social SemanticWeb. de Gruyter Saur.
[Wikipedia, 2008] Wikipedia (2008). Tag (metadata) — wikipedia, the free en-cyclopedia. http://en.wikipedia.org/w/index.php?title=Tag_(metadata)
&oldid=232998858. [Online; accessed 27-August-2008].
[Wikipedia, 2009] Wikipedia (2009). Ontology — wikipedia, the free ency-clopedia. http://en.wikipedia.org/w/index.php?title=Ontology&oldid=
311909039. [Online; accessed 4-September-2009].
[Wikipedia, 2010a] Wikipedia (2010a). Linked data — wikipedia, the free ency-clopedia. http://en.wikipedia.org/wiki/Linked_Data. [Online; accessed 23-June-2010].
[Wikipedia, 2010b] Wikipedia (2010b). Mean absolute error — wikipedia,the free encyclopedia. http://en.wikipedia.org/w/index.php?title=Mean_
absolute_error&oldid=392983876. [Online; accessed 16-November-2010].
[Wikipedia, 2010c] Wikipedia (2010c). Netflix prize — wikipedia, thefree encyclopedia. http://en.wikipedia.org/w/index.php?title=Netflix_
Prize&oldid=397065212. [Online; accessed 19-November-2010].
167
[Wikipedia, 2010d] Wikipedia (2010d). Root mean square deviation — wikipedia,the free encyclopedia. http://en.wikipedia.org/w/index.php?title=Root_
mean_square_deviation&oldid=392989116. [Online; accessed 16-November-2010].
[Wikipedia, 2010e] Wikipedia (2010e). Wiki — wikipedia, the free encyclopedia.http://en.wikipedia.org/w/index.php?title=Wiki&oldid=405173855. [On-line; accessed 4-January-2011].
[Witten and Frank, 2005] Witten, I. H. and Frank, E. (2005). Data Mining: Prac-tical Machine Learning Tools and Techniques. Morgan Kaufmann.
[Xu et al., 2003] Xu, W., Liu, X., and Gong, Y. (2003). Document clustering basedon non-negative matrix factorization. In SIGIR ’03: Proceedings of the 26thannual international ACM SIGIR conference on Research and development ininformaion retrieval, pages 267–273, New York, NY, USA. ACM.
[Yao, 1995] Yao, Y. Y. (1995). Measuring retrieval effectiveness based on user pref-erence of documents. J. Am. Soc. Inf. Sci., 46:133–145.
[Yi and Deng, 2009] Yi, M. and Deng, W. (2009). A utility-based recommendationapproach for e-commerce websites based on bayesian networks. Business Intelli-gence and Financial Engineering, International Conference on, 0:571–574.
[Zhang and Hurley, 2009] Zhang, M. and Hurley, N. (2009). Novel item recom-mendation by user profile partitioning. In WI-IAT ’09: Proceedings of the 2009IEEE/WIC/ACM International Joint Conference on Web Intelligence and Intel-ligent Agent Technology, pages 508–515, Washington, DC, USA. IEEE ComputerSociety.
[Ziegler et al., 2005] Ziegler, C.-N., McNee, S. M., Konstan, J. A., and Lausen, G.(2005). Improving recommendation lists through topic diversification. In WWW’05: Proceedings of the 14th international conference on World Wide Web, pages22–32, New York, NY, USA. ACM.

168
Curriculum Vitae
Contact InformationName Rafael SchirruAddress Müllerstraße 91
13349 BerlinTelephone +49 - 160 - 44 07 50 4eMail [email protected]
Personal InformationDate of Birth removed in electronic versionPlace of Birth removed in electronic versionCitizenship removed in electronic versionFamily Status removed in electronic version
Employment History
German Research Center for Artificial Intelligence (DFKI)
04/2007 - today Researcher in the Knowledge Management department
05/11-today Project Voice2Social (multimodal access to social networks onmobile devices)
11/08-10/10 Project Social Media Miner (identification of topics and trendsin the blogosphere)
169
170
04/08-09/09 Project MACE (providing access to vast amounts of architec-tural content from diverse European repositories)
03/08-12/08 Project C-LINK (a conference organization system with an in-tegrated recommender system for events and conference atten-dees)
04/07-03/08 Project CoMet (a brokerage service for all sorts of digital learn-ing content and its associated metadata)
Education
University of Kaiserslautern
10/2001 - 03/2007 Applied Computer Science (Enterprise Information Systems)
Diploma Thesis: Conception and Implementation of an Openand Adaptable Environment for Multidimensional Learning Ob-jects
Privates Johannes Gymnasium
06/2001 Graduation diploma
Spoken Languages
German Mother tongueEnglish FluentFrench BasicItalian Basic
171
Projects
The project Voice2Social aimed at combining multimodal interaction technologieson mobile devices (e. g., smartphones and tablets) with new and diverse meansfor users to interact with social media. This project was financed by the IBBBerlin and co-financed by the EFRE fonds of the European Union from 05/2011 to04/2013.
The project Social Media Miner was concerned with the analysis of user-generatedcontent in the Web 2.0. Text mining algorithms were implemented to supportautomatic topic and trend detection in social media such as the blogosphere andmicroblogging platforms. For identified topics, reading recommendations wereprovided based on metrics from the field of Social Network Analysis. The projectwas financed by the IBB Berlin and co-financed by the EFRE fonds of the EuropeanUnion from 11/2008 to 10/2010.
MACE (Metadata for Architectural Contents in Europe) is a European initiativewhich aims at improving architectural education. For that purpose it has integratedand connected vast amounts of content from diverse repositories. DFKI was apartner in the consortium and has provided the social resource sharing platformALOE to connect users and to allow them to share and organize contents andmetadata. MACE was co-funded by the EU eContentPlus program from 09/2006until 09/2009.
C-LINK (Conference Link) is a Web-based tool for individual conference organiza-tion. C-LINK has been introduced with the KI 2008 conference in Kaiserslautern.The system serves as a showcase to present DFKI technologies. Its functionalitiescomprise among others an individual conference planner, retrieval of users withsimilar interests, and Web 2.0 style resource sharing. C-LINK was an internalDFKI project funded from 03/2008 until 12/2008.
172
CoMet stands for Collaborative Sharing of Metadata and can be considered as abrokerage service for all sorts of digital learning content and its associated metadata.Functionalities of social software were intended to connect users, that way enablinginteraction and collaboration. CoMet was sponsored by the Stiftung Rheinland-Pfalz für Innovation from 04/2007 until 03/2008.
Selected Publications
2011 Rafael Schirru, Stephan Baumann, Martin Memmel, and Andreas Den-gel. Topic-Based Recommendations for Enterprise 2.0 Resource SharingPlatforms. In Andreas König et al., editors, Knowledge-Based and In-telligent Information and Engineering Systems, volume 6881 of LectureNotes in Computer Science, pages 495-504. Springer.
Rafael Schirru, Stephan Baumann, Christian Freye, and Andreas Den-gel. Towards Context-Sensitive Music Recommendations Using Multi-faceted User Profiles. The Proceedings of the AES 42nd InternationalConference, 2011, 54-59.
2010 Stephan Baumann, Rafael Schirru, and Bernhard Streit. Towards a sto-rytelling approach for novel artist recommendations. In Detyniecki, M.,Knees, P., Nürnberger, A., Schedl, M., and Stober, S., editors, Adap-tive Multimedia Retrieval, volume 6817 of Lecture Notes in ComputerScience, pages 1-15. Springer.
Rafael Schirru, Stephan Baumann, Martin Memmel, and Andreas Den-gel. Extraction of Contextualized User Interest Profiles in Social Shar-ing Platforms. Journal of Universal Computer Science, 16(16):2196-2213.
173
Fernanda Pimenta, Darko Obradovic, Rafael Schirru, Stephan Bau-mann, and Andreas Dengel. Automatic Sentiment Monitoring of Spe-cific Topics in the Blogosphere. Workshop on Dynamic Networks andKnowledge Discovery (DyNaK 2010), 2010.
Rafael Schirru. Topic-Based Recommendations in Enterprise Social Me-dia Sharing Platforms. RecSys ’10: Proceedings of the fourth ACMconference on Recommender systems, ACM, 2010, 369-372.
Rafael Schirru, Darko Obradovic, Stephan Baumann and Peter Wort-mann. Domain-Specific Identification of Topics and Trends in the Blo-gosphere. In Petra Perner, editor, Advances in Data Mining. Applica-tions and Theoretical Aspects, 10th Industrial Conference, ICDM 2010,Berlin, Germany, July 12-14, 2010. Proceedings, Springer, 2010, 6171,490-504.
2009 Martin Wolpers, Martin Memmel, Hans-Christian Schmitz, MartinFriedrich, Marco Jahn, and Rafael Schirru. Usage metadata basedsupport for learning activity reflection. In Klaus Tochtermann andHermann Maurer, editors, Proceedings of I-KNOW ’09, Graz, Austria,pages 354-359. Journal of Universal Computer Science, 2009.
Martin Memmel, Michael Kockler, and Rafael Schirru. Providing MultiSource Tag Recommendations in a Social Resource Sharing Platform.In Journal of Universal Computer Science, vol. 15, no. 3, pages 678-691. Graz, Austria 2009.
2008 Martin Memmel, Michael Kockler, and Rafael Schirru. Providing MultiSource Tag Recommendations in a Social Resource Sharing Platform.In Hermann Maurer, Frank Kappe, Werner Haas and Klaus Tochter-mann, editors, Proceedings of I-MEDIA ’08, Graz, Austria, pages 226-233. Journal of Universal Computer Science, 2008.
174
Martin Memmel, Rafael Schirru, Elia Tomadaki, and Martin Wolpers.Towards the Combined Use of Metadata to Improve the Learning Ex-perience. In Paloma Díaz, Kinshuk, Ignacio Aedo, and Eduardo Mora,editors, Proceedings of the 8th IEEE International Conference on Ad-vanced Learning Technologies, Santander, 2008, pages 930-932.
2007 Martin Memmel and Rafael Schirru. ALOE - A Socially Aware LearningResource and Metadata Hub. In Martin Wolpers, Ralf Klamma andErik Duval, editors, Proceedings of the EC-TEL 2007 Poster Session.CEUR workshop proceedings, 2007.
Martin Memmel and Rafael Schirru. Sharing Digital Resources andMetadata for Open and Flexible Knowledge Management Systems. InKlaus Tochtermann and Hermann Maurer, editors, Proceedings of the7th International Conference on Knowledge Management (I-KNOW),Graz, Austria, pages 41-48. Journal of Universal Computer Science,2007.