considerations regarding the role of taxes in correcting the economical and social inequalities on...
TRANSCRIPT
E u r o E c o n o m i c a
Issue 4(30)/2011 ISSN: 1582-8859
GLOBALIZATION AND REGIONALIZATION
15
Considerations Regarding the Role of Taxes in Correcting the Economical and Social Inequalities on the Base of Globalization Process
Elena SUMAN (TOMA)1, Marius FRUNZĂ2
1"Alexandru I. Cuza" University of Iasi, Faculty of Economics and Business Administration, [email protected]
2"Alexandru I. Cuza" University of Iasi, Faculty of Economics and Business Administration, [email protected]
Abstract: Our paper suggests, on one hand, a theoretical debate on the justification for state intervention to correct inequalities between members of society (especially on income and wealth) and on the instruments at its disposal to achieve this and their effectiveness in objective. Secondly, our approach aims at a comparative analysis of key indicators to measure the degree of inequality, in a representative number of EU countries and beyond, in the last four decades. Thirdly, but not last, we made a trip on the evolutionary changes and their impact in fiscal plan, to identify the degree in which the taxes, in comparison with other available public tools, succeed to achieve the goal of a more just distribution of income and wealth in society. We find that including for a more just income distribution, in EU, the old member States are grouped in accordance with existing social models, while new member States have migrated in the last decades among groups, in consequence of their transition to market economy. Moreover, our results represent a basis for further and detailed research, at country level, in order to identify particular instruments and their efficiency in correcting economical and social inequalities.
Keywords: Gini coefficient, income distribution, redistribution, direct taxes, social transfers
1. Introduction
The implications of inequality growth are multiple. As the Krugman, in his "Conscience of a Liberal," the most important aims towards increasing corruption among politicians. Inequality is a real problem, because economic inequality and political polarization move in unison (Krugman, 2010). At least two scenarios may be possible, if the concentration of income and wealth in a state is restrained into one a group of individual`s hands: either the group carried out extensive work aside lobby governments in power, in to obtain laws which are in their advantage, or against other members of society, whether as a result of financial power they hold, manage to reach power, themselves elaborating laws to work for them and in expense of others (Zhang, 2008).
In terms of existing economic inequalities lead to lower level of economic development, there are existing views that believe in an uneven development is not a real human development, as much as inequalities of income and wealth are more extensive, with significant losses occurring even in a segment regarding the degree of development of a state (UNDP, 2010). Supporters of redistribution policy, carried the state through taxes and public spending are the main basis that it breaks the vicious circle of poverty, contributing to the development of human capital, a factor with direct impact on economic growth and human development, knowing that "poverty born poor."
On the other hand, the median voter hypothesis test results showed that, income redistribution is among members of society with greater income inequality that are higher, implying higher taxes and potentially stronger distorted. As a result, the existence of these distortions lead to loss of efficiency, losses are found in declining growth (Perroti, 1996).
E u r o E c o n o m i c a
Issue 4(30)/2011 ISSN: 1582-8859
GLOBALIZATION AND REGIONALIZATION
16
2. The Impact of Economic Inequality on Economic Growth and Development
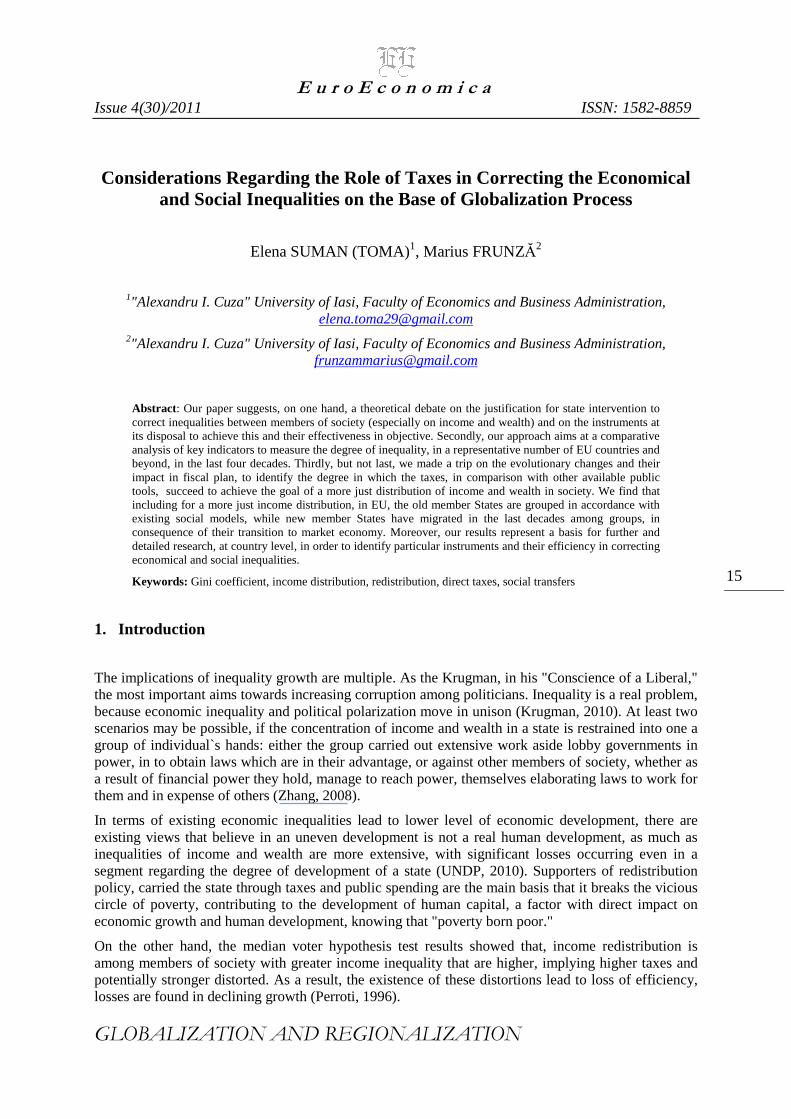
Assess the degree of development of a state is, in quantitative terms, by a composite index called the “Human Development Index” (HDI), which made up a World Bank through the annual reports. Measuring potential losses in development of a state are caused by unequal distribution of income, aside an unequal access to public health and education services, the phenomenon before in many countries around the world, especially the least developed. The negative impact of the existence of inequalities of income on the level of human development, than the other two components already mentioned, you can see in Figure 1.
Source: own calculations based on "Human development report 2010",www.undp.org
Figure 1 Gini coefficient (average) and the growth potential losses caused by inequalities of income, in period 2000-2010, respectively in 2010
Losses caused by the highest inequalities are now registered in Portugal (23.9%), USA (23.5%) and Britain (21%), average coefficient in states to come up with, as a result of primary distribution of the social product, is also above the registered average value in the OECD. In former communist countries, such as Slovakia and Romania, a lower level of this coefficient and the loss of potential causes of inequality, is explained by the fact that they have experienced a socialist regime, where income equality was a goal central. In Nordic countries, the effects of redistribution policy explain a much reduced loss potential. In the entire world, development potential losses are caused in rates of 22.6%, of the existing income inequalities between members of society.
3. The Deepening Economic Inequalities - A Reality
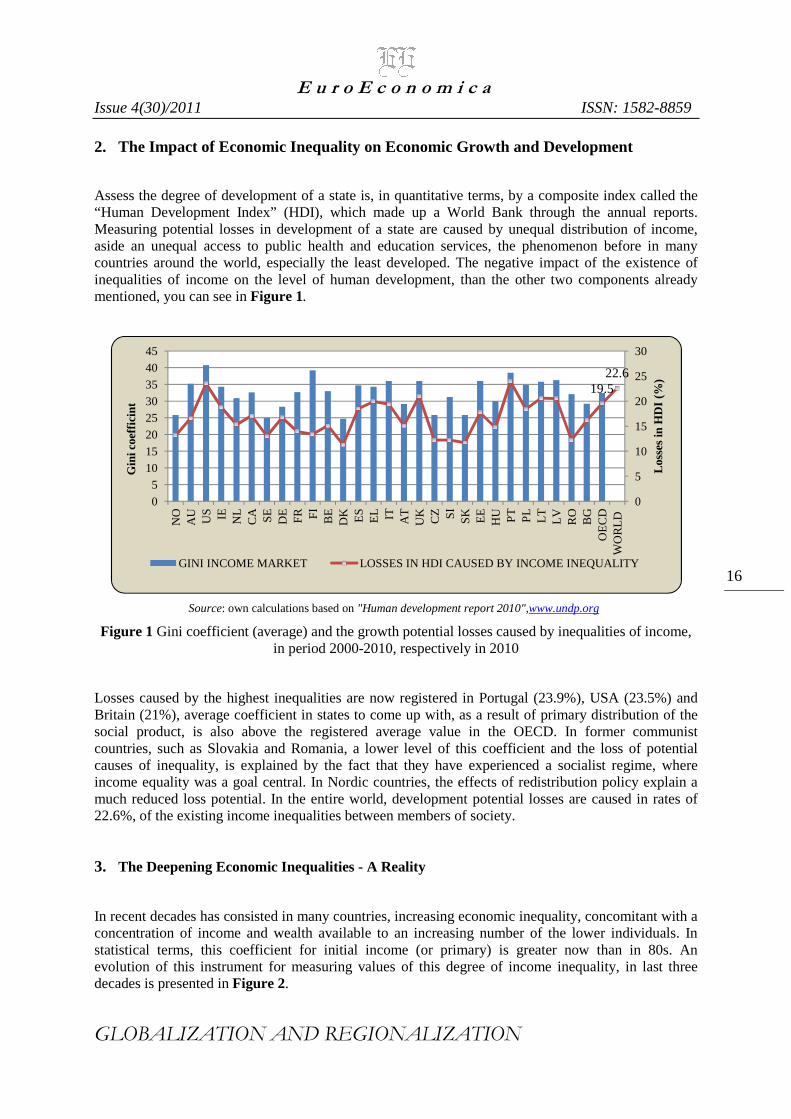
In recent decades has consisted in many countries, increasing economic inequality, concomitant with a concentration of income and wealth available to an increasing number of the lower individuals. In statistical terms, this coefficient for initial income (or primary) is greater now than in 80s. An evolution of this instrument for measuring values of this degree of income inequality, in last three decades is presented in Figure 2.
19.522.6
0
5
10
15
20
25
30
0
5
1015
20
2530
35
4045
NO
AU US IE NL
CA SE
DE
FR FI
BE
DK ES
EL IT AT
UK
CZ SI
SK
EE
HU PT
PL
LT LV RO
BG
OE
CD
WO
RLD
Los
ses
in H
DI
(%)
Gin
i coe
ffic
int
GINI INCOME MARKET LOSSES IN HDI CAUSED BY INCOME INEQUALITY
E u r o E c o n o m i c a
Issue 4(30)/2011 ISSN: 1582-8859
GLOBALIZATION AND REGIONALIZATION
17
Source: own calculations based on LIS Database, http://www.lisdatacenter.org
Figure 2 Gini index (average values) for primary income, in some OECD states
Buying available data to the mid-2000s, the Gini coefficient has registered values greater than in the 90s, in 16 countries and in 15 states, from the '80s. In overall, growth trend has manifested in 19 states, while in Ireland only manifested obvious downward trend has been spotted. Downward trend, but in a smaller scale, is registered even in Estonia, Hungary and France.
The largest increases in inequality were registered in Belgium, Finland and Italy, Belgium being the most unequal country in the distribution of primary income, followed by Hungary, Poland and this coefficient variation being present in Estonia.
4. State Intervention in Reducing Income Inequalities - Methodological Issues
Usually, in economic literature the expression "inequality reduction" is similar with "redistribution" (Immervoll&Richardson, 2011). By our point of view, redistribution make by state refer at whole activity of state; in consequence, "income redistribution" is a more appropriate expression. For simplification, when we use "redistribution" in this paper, we refer at "income redistribution".
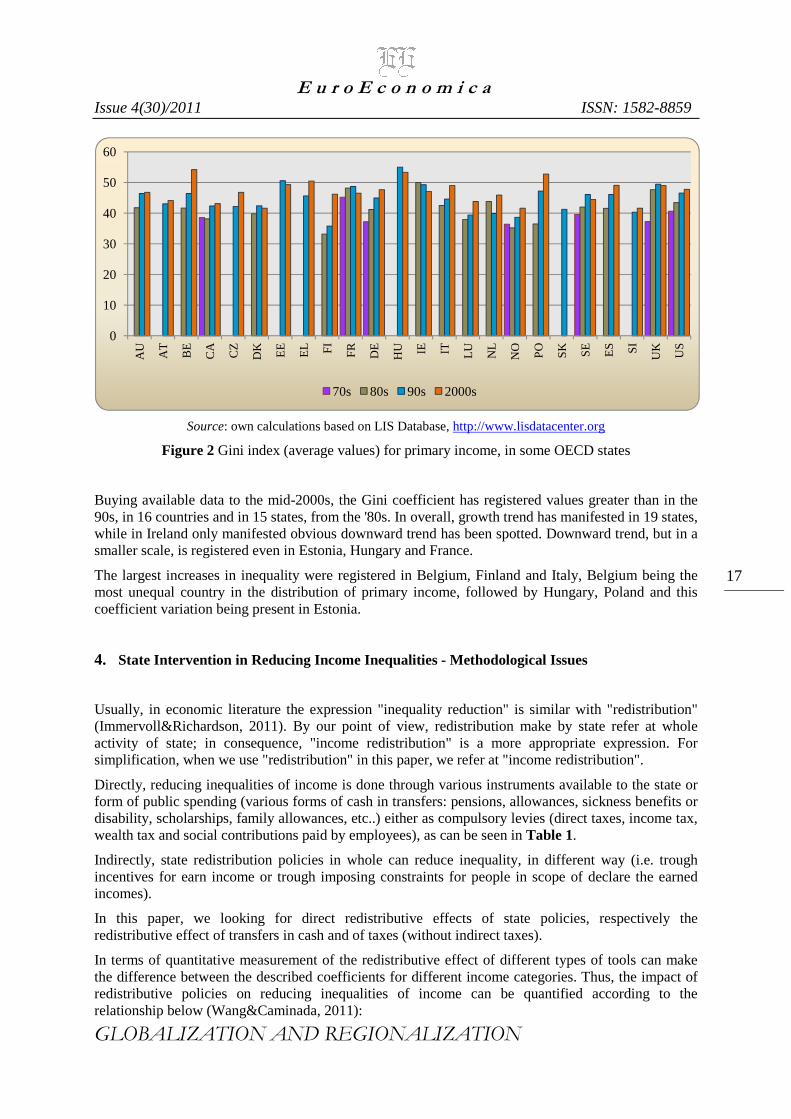
Directly, reducing inequalities of income is done through various instruments available to the state or form of public spending (various forms of cash in transfers: pensions, allowances, sickness benefits or disability, scholarships, family allowances, etc..) either as compulsory levies (direct taxes, income tax, wealth tax and social contributions paid by employees), as can be seen in Table 1.
Indirectly, state redistribution policies in whole can reduce inequality, in different way (i.e. trough incentives for earn income or trough imposing constraints for people in scope of declare the earned incomes).
In this paper, we looking for direct redistributive effects of state policies, respectively the redistributive effect of transfers in cash and of taxes (without indirect taxes).
In terms of quantitative measurement of the redistributive effect of different types of tools can make the difference between the described coefficients for different income categories. Thus, the impact of redistributive policies on reducing inequalities of income can be quantified according to the relationship below (Wang&Caminada, 2011):
0
10
20
30
40
50
60A
U AT
BE
CA
CZ
DK EE
EL FI
FR
DE
HU IE IT LU NL
NO
PO
SK
SE
ES SI
UK
US
70s 80s 90s 2000s
E u r o E c o n o m i c a
Issue 4(30)/2011 ISSN: 1582-8859
GLOBALIZATION AND REGIONALIZATION
18
Table 1 Steps in evaluating redistributive effects of social transfers and taxes
Kind of incomes Income inequality/Redistributive effect of state policy
Measurement instruments
Gross wages incomes +self-employment income + rental incomes +private pensions +other incomes =
Primary or original income
Original distribution of incomes
Gini coefficient of primary income (GPI)
+ state pensions
=
Adjusted primary income
-/- Redistributive effect of state pensions
=
Distribution of adjusted incomes
Gini coefficient of adjusted primary income (GAPI)
+ other social cash transfers
=
Gross income
-/- Redistributive effect of social transfers**
=
Distribution of gross incomes
Gini coefficient of gross income (GGI)
-/- Social contributions *
-/- Personal income tax
=
Disposable income
-/- Redistributive effect of taxes
=
Final distribution of incomes
Gini coefficient of disposable income (GDI)
* paid by employees; ** without pensions
Equation 1 Global redistributive effect
(REG) = GPI - GDI
State intervention to reduce inequalities of income is more effective, as the two factors between these differences are greater. Also, the impact of each component of the policy of redistribution can be quantified by the same mechanism. Thus, the impact of social transfers in some part, that of direct taxes and social contributions (which are generically called "taxes") may be assessed based on the relations below:
Equation 2 Redistributive effect for social transfers
(����) = GPI - GGI
Equation 3 Redistributive effect for taxes
(���) = GGI - GDI
In principle, global redistributive effect or partially materialized into a "win", meaning a flattening of income inequality, it is possible to use, in certain conditions, some public tools to accentuate existing inequalities of income, resulting in "losses".
Taking into account only of direct taxes and social contributions paid by individuals was performed but for this moment, there is no comparable data on indirect taxes (Barnard&Atta Dorkua, 2011). Impact, as it is known, is negative, emphasizing the inequality of income, because of recourse they have it. In the European Union to mitigate it’s harsh however, by introducing reduced VAT rates for those goods which constitute the largest share in consumption. Due to fiscal sovereignty, some states
E u r o E c o n o m i c a
Issue 4(30)/2011 ISSN: 1582-8859
GLOBALIZATION AND REGIONALIZATION
19
have not adopted this provision but by national law, Romania is one of them. We appreciate that, despite these attempts in effect of adoption on reduced rates, is not always to be expected as such a market with imperfect competition and the demand for goods in inelastic (as most basic goods), reduced VAT rates will be partially or fully transferred in commercial margin. Mitigate the negative impact of indirect taxes, like value added tax; the imposition of conditions is achieved in high excise duties on those goods consumed by those of wealthy.
5. State Intervention in Reducing Income Inequalities - Empirical Issues
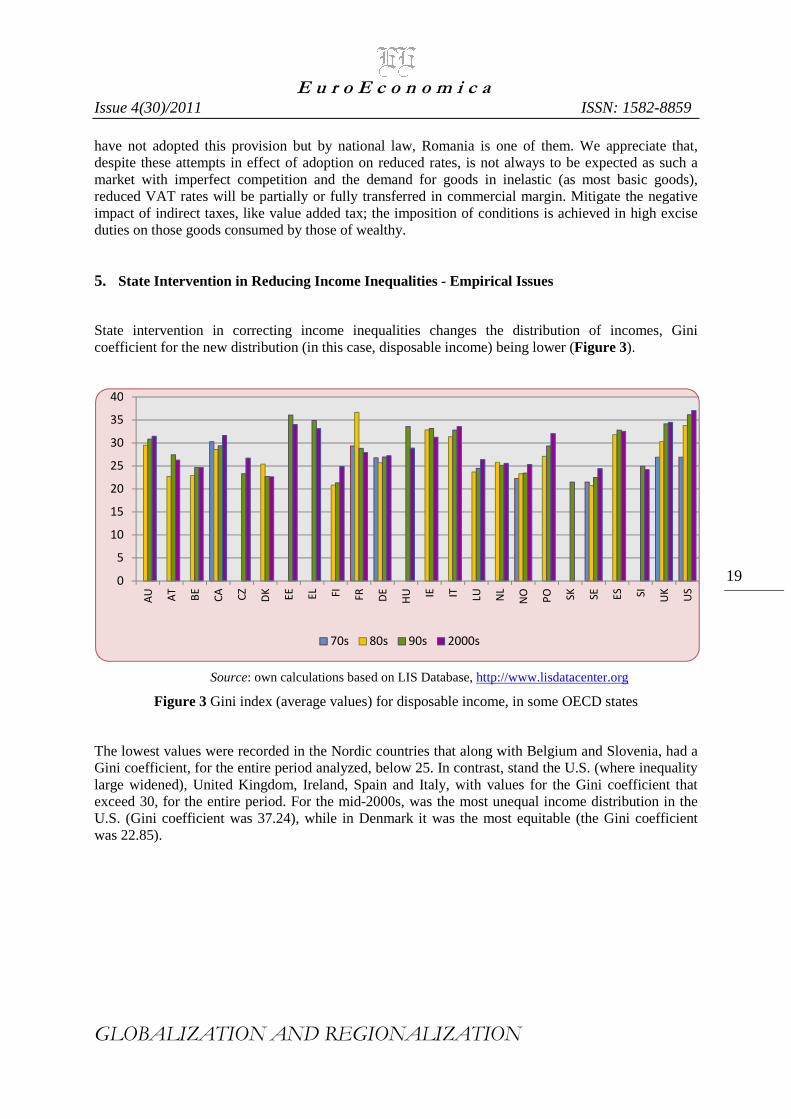
State intervention in correcting income inequalities changes the distribution of incomes, Gini coefficient for the new distribution (in this case, disposable income) being lower (Figure 3).
Source: own calculations based on LIS Database, http://www.lisdatacenter.org
Figure 3 Gini index (average values) for disposable income, in some OECD states
The lowest values were recorded in the Nordic countries that along with Belgium and Slovenia, had a Gini coefficient, for the entire period analyzed, below 25. In contrast, stand the U.S. (where inequality large widened), United Kingdom, Ireland, Spain and Italy, with values for the Gini coefficient that exceed 30, for the entire period. For the mid-2000s, was the most unequal income distribution in the U.S. (Gini coefficient was 37.24), while in Denmark it was the most equitable (the Gini coefficient was 22.85).
0
5
10
15
20
25
30
35
40
AU
AT
BE
CA
CZ
DK
EE
EL FI
FR
DE
HU IE IT LU
NL
NO
PO SK
SE
ES SI
UK
US
70s 80s 90s 2000s
E u r o E c o n o m i c a
Issue 4(30)/2011 ISSN: 1582-8859
GLOBALIZATION AND REGIONALIZATION
20
Table 2 Trend in Gini index for primary and disposable income, in some country of OECD, in the last two decades
GPI
+ _
GD
I
+ (I): AU, BE, CA, CZ, FI, DE,
IT, LU, NL, NO, PO, US
(II): SE, UK
_ (III): AT, EL, ES, SI (IV): DK, EE, FR,
HU, IE
Note: States grouping according with sing (positive or negative) for relative variation of the two categories of Gini coefficients (average of period)
For the first and fourth category of countries, redistribution policy has been relative neutral, the ascendant trend, respectively descendant trend of Gini for primary income has been followed by a similar trend of disposable income inequality.
The states of third category have changed their redistribution policy in order to obtain a more equitable distribution of disposable income, in the last decade: although the inequality of primary incomes has increased, the inequality of disposable incomes has decreased.
In Sweden and United Kingdom, although inequality of primary incomes has decreased, the inequality of disposable incomes has increased. That means a more weakly redistribution policy with a reduction of state intervention in correcting economical and social inequalities.
In quantitative terms, the degree of income redistribution can be measured by the difference between the Gini coefficients, calculated for primary income and disposable income respectively, divided by Gini index for primary income.
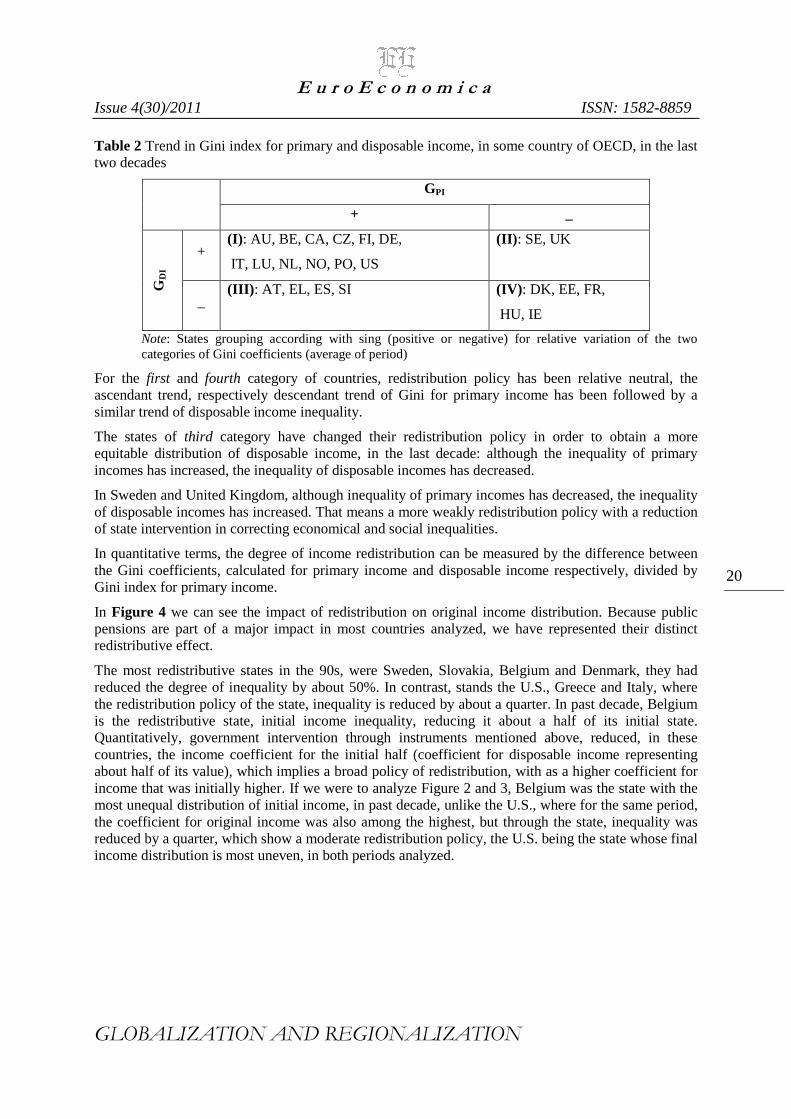
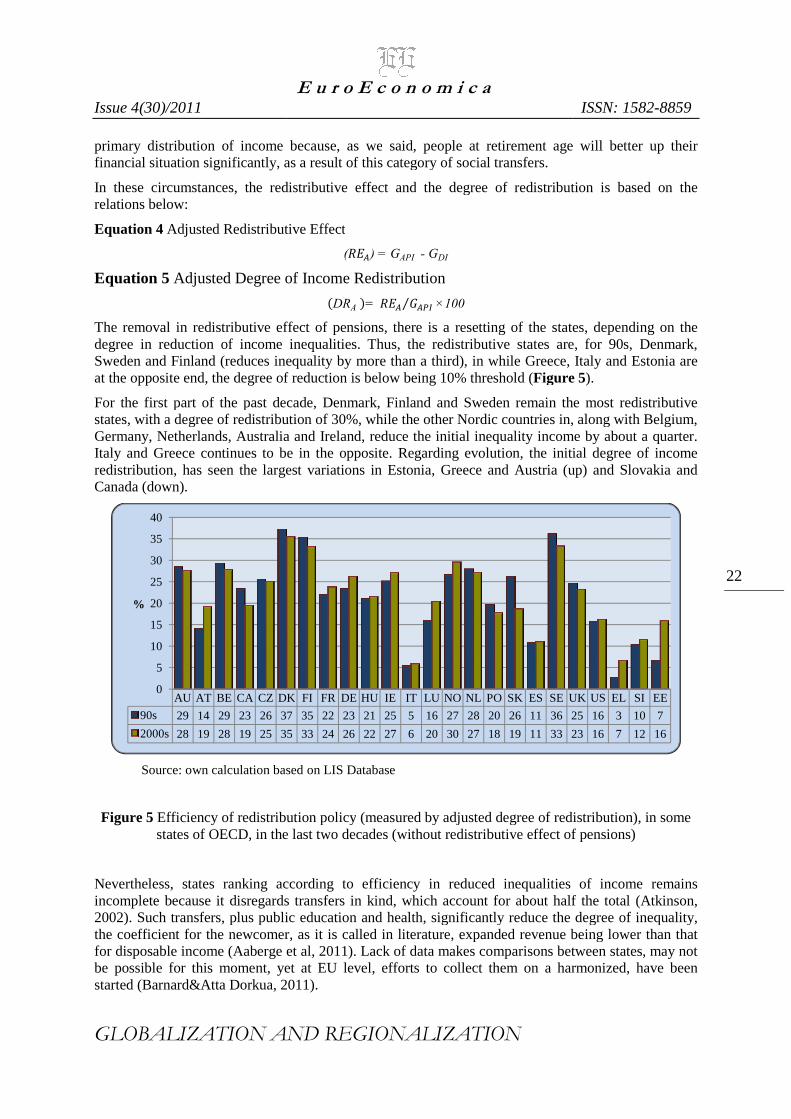
In Figure 4 we can see the impact of redistribution on original income distribution. Because public pensions are part of a major impact in most countries analyzed, we have represented their distinct redistributive effect.
The most redistributive states in the 90s, were Sweden, Slovakia, Belgium and Denmark, they had reduced the degree of inequality by about 50%. In contrast, stands the U.S., Greece and Italy, where the redistribution policy of the state, inequality is reduced by about a quarter. In past decade, Belgium is the redistributive state, initial income inequality, reducing it about a half of its initial state. Quantitatively, government intervention through instruments mentioned above, reduced, in these countries, the income coefficient for the initial half (coefficient for disposable income representing about half of its value), which implies a broad policy of redistribution, with as a higher coefficient for income that was initially higher. If we were to analyze Figure 2 and 3, Belgium was the state with the most unequal distribution of initial income, in past decade, unlike the U.S., where for the same period, the coefficient for original income was also among the highest, but through the state, inequality was reduced by a quarter, which show a moderate redistribution policy, the U.S. being the state whose final income distribution is most uneven, in both periods analyzed.
Issue 4(30)/2011
GLOBALIZATION AND REGIONALIZATION
Source: own calculations based on LIS Database,
Figure 4 Degree of income redistribution (%), in some states of OECD, in the last two decades
Nordic countries, namely Denmark, Finland, Sweden, and some countries in centralAustria, Netherlands) and southeast Europereduced income inequality through redistributive policies adopted. Conversely, with the U.S. is Canada, with much lower efficiency values in reducing inequalities of income.
In on dynamic, high degree of redistribution of in 14 Member of the 24 analyzed; beside Sweden and Slovakia, where the degree of redistribution was significantly decreased, in rest the decrease was modest. The most spectacular increases were registered in Greece, Finland and HungarNetherlands.
But also looking into the structureinequalities of income, between certain states. In 90s, pensions have taken over two thirds of the overall redistribution policy in Italy, Greece, Spain (along with a low degree of redistribution) and Austria and Luxembourg (with a high degree of redistribution). In contrast stands the U.S., Australia, UK and Canada (with a lower degree of redistribution) and Finland and Denmark of redistribution), where pensions have a reduced role for redistribution policy in whole. In first half of the past decade, significant structural changes occurred on one hand, in Greece and Estonia, where amid increasing redistribution, the role of pensions was significantly reduced. Structural changes have occurred and in former socialist states, due process of conversion to a market economy.
Removing the degree of redistribution of pensionsstudies, there are opinions that sustain that, countries where public pension system is very generousthere is only the first pillar pension or vredistributive effect is overstated as both in mpart of its income if not the only source of income. In these conditions, a person pension will be registered, following the receipt of pension
Removing pensions as comparative assessment of the degree of reduction of inequality through state policy, is based on the fact that, principle contributiveness.
From the methodological point of view, state pensions will be added to primary income, resulting in their new distribution, which can calculate a new Gini
05
10152025303540455055
AU AT
BE
CA
CZ
DK FI
RE of pensions in 90s RE of pensions in 2000s
E u r o E c o n o m i c a
GLOBALIZATION AND REGIONALIZATION
based on LIS Database, http://www.lisdatacenter.org
Degree of income redistribution (%), in some states of OECD, in the last two decades
Nordic countries, namely Denmark, Finland, Sweden, and some countries in centraland southeast Europe (Hungary, Slovakia, Czech Republic)
reduced income inequality through redistributive policies adopted. Conversely, with the U.S. is Canada, with much lower efficiency values in reducing inequalities of income.
of redistribution of in 14 Member of the 24 analyzed; beside Sweden and Slovakia, where the degree of redistribution was significantly decreased, in rest the decrease was modest. The most spectacular increases were registered in Greece, Finland and Hungar
structure, there are some similarities regarding the role in correction tools inequalities of income, between certain states. In 90s, pensions have taken over two thirds of the
cy in Italy, Greece, Spain (along with a low degree of redistribution) and Austria and Luxembourg (with a high degree of redistribution). In contrast stands the U.S., Australia, UK and Canada (with a lower degree of redistribution) and Finland and Denmark of redistribution), where pensions have a reduced role for redistribution policy in whole. In first half of the past decade, significant structural changes occurred on one hand, in Greece and Estonia, where
n, the role of pensions was significantly reduced. Structural changes have occurred and in former socialist states, due process of conversion to a market economy.
Removing the degree of redistribution of pensions from the analysis of the subject of numeroustudies, there are opinions that sustain that, redistributive effect is overstated, noting that there are countries where public pension system is very generous (Milanovic, 2006). In addition, if in that State, there is only the first pillar pension or voluntary pension pillar is modest compared to the public,
ffect is overstated as both in may, in elderly people, the pension is an overwhelming part of its income if not the only source of income. In these conditions, a person came with a t
will be registered, following the receipt of pension, from the poorest class, in the middle class.
Removing pensions as comparative assessment of the degree of reduction of inequality through state unlike direct taxes and most of cash transfers, they are based on the
From the methodological point of view, state pensions will be added to primary income, resulting in bution, which can calculate a new Gini coefficient, its value will be lower than if in
FR
DE
HU IE IT LU NO
NL
PO
SK
ES
SE
UK
RE of pensions in 90s RE without pensions in 90s RE of pensions in 2000s RE without pensions in 2000s
ISSN: 1582-8859
21
Degree of income redistribution (%), in some states of OECD, in the last two decades
Nordic countries, namely Denmark, Finland, Sweden, and some countries in central (Germany, (Hungary, Slovakia, Czech Republic) have significantly
reduced income inequality through redistributive policies adopted. Conversely, with the U.S. is
of redistribution of in 14 Member of the 24 analyzed; beside Sweden and Slovakia, where the degree of redistribution was significantly decreased, in rest the decrease was modest. The most spectacular increases were registered in Greece, Finland and Hungary and in the
, there are some similarities regarding the role in correction tools inequalities of income, between certain states. In 90s, pensions have taken over two thirds of the
cy in Italy, Greece, Spain (along with a low degree of redistribution) and Austria and Luxembourg (with a high degree of redistribution). In contrast stands the U.S., Australia, UK and Canada (with a lower degree of redistribution) and Finland and Denmark (with a high degree of redistribution), where pensions have a reduced role for redistribution policy in whole. In first half of the past decade, significant structural changes occurred on one hand, in Greece and Estonia, where
n, the role of pensions was significantly reduced. Structural changes have occurred and in former socialist states, due process of conversion to a market economy.
from the analysis of the subject of numerous , noting that there are
. In addition, if in that State, oluntary pension pillar is modest compared to the public,
ay, in elderly people, the pension is an overwhelming came with a tiny or no
from the poorest class, in the middle class.
Removing pensions as comparative assessment of the degree of reduction of inequality through state they are based on the
From the methodological point of view, state pensions will be added to primary income, resulting in efficient, its value will be lower than if in
0510152025303540455055
UK
US
EL SI
EE
RE without pensions in 90s RE without pensions in 2000s
Issue 4(30)/2011
GLOBALIZATION AND REGIONALIZATION
primary distribution of income because, as wefinancial situation significantly, as a result of this category of social transfers.
In these circumstances, the redistributive effect andrelations below:
Equation 4 Adjusted Redistributive Effect
Equation 5 Adjusted Degree of Income Redistribution
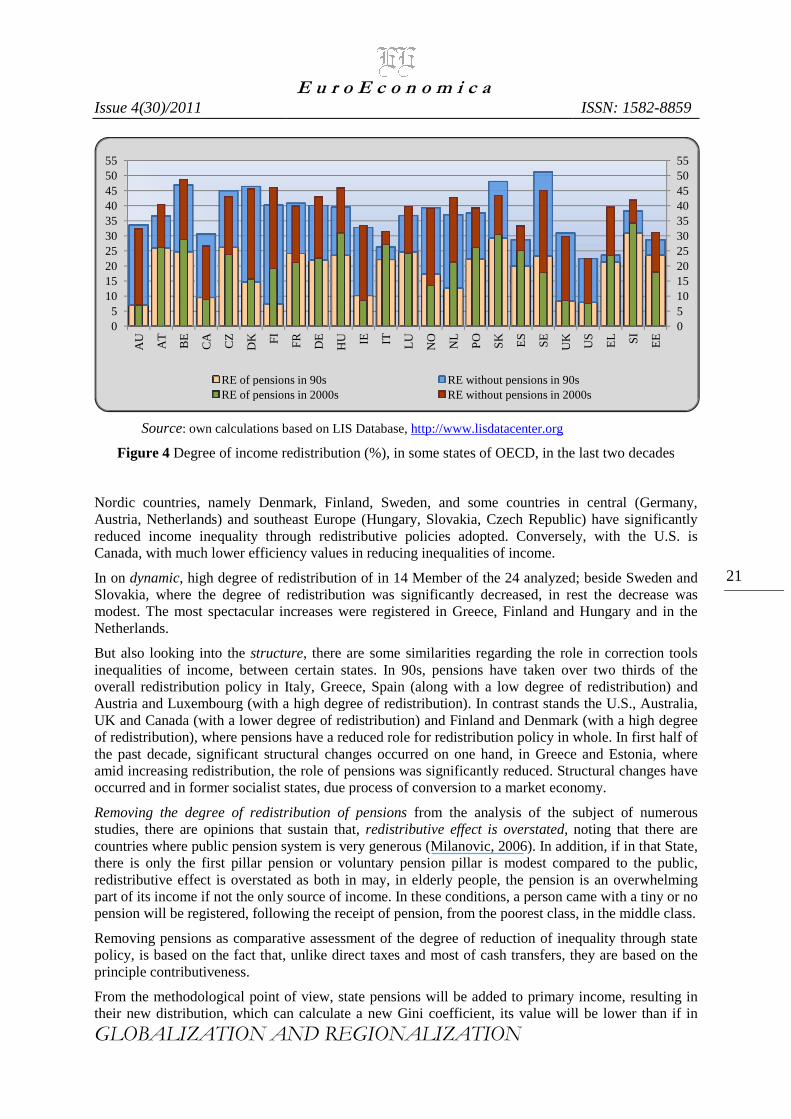
The removal in redistributive effect of pensions, there is a resetting of the states, depending on the degree in reduction of income inequalities. Thus, the redistributive states are, for 90s, Denmark, Sweden and Finland (reduces inequality by more than a third), in whilat the opposite end, the degree of reduction is below being 10% threshold
For the first part of the past decade, Denmark, Finland and Sweden remain the most redistributive states, with a degree of redistribution Germany, Netherlands, Australia and Ireland, reduce the initial inequality income by about a quarter. Italy and Greece continues to be in the opposite. Regarding evolution, the initial degreeredistribution, has seen the largest variations in Estonia, Greece and Austria (up) and Slovakia and Canada (down).
Source: own calculation based on LIS Database
Figure 5 Efficiency of redistribution policystates of OECD, in the last two decades
Nevertheless, states ranking according to efficiency in reduced inequalities of income remains incomplete because it disregards2002). Such transfers, plus public education and health, significantly reduce the degree of inequality, the coefficient for the newcomer, as it is called in literature, expfor disposable income (Aaberge et al, 2011)be possible for this moment, yet at EU level, efforts to collect them on a harmonized, have been started (Barnard&Atta Dorkua, 2011)
AU AT BE CA CZ DK
90s 29 14 29 23 26 37
2000s 28 19 28 19 25 35
0
5
10
15
20
25
30
35
40
%
E u r o E c o n o m i c a
GLOBALIZATION AND REGIONALIZATION
ibution of income because, as we said, people at retirement age will better up their as a result of this category of social transfers.
redistributive effect and the degree of redistribution
Adjusted Redistributive Effect
(���) = GAPI - GDI
Adjusted Degree of Income Redistribution
(DRA �= ��� ��⁄ ×100
redistributive effect of pensions, there is a resetting of the states, depending on the degree in reduction of income inequalities. Thus, the redistributive states are, for 90s, Denmark, Sweden and Finland (reduces inequality by more than a third), in while Greece, Italy and Estonia are at the opposite end, the degree of reduction is below being 10% threshold (Figure 5
For the first part of the past decade, Denmark, Finland and Sweden remain the most redistributive states, with a degree of redistribution of 30%, while the other Nordic countries in, along with Belgium, Germany, Netherlands, Australia and Ireland, reduce the initial inequality income by about a quarter. Italy and Greece continues to be in the opposite. Regarding evolution, the initial degreeredistribution, has seen the largest variations in Estonia, Greece and Austria (up) and Slovakia and
Source: own calculation based on LIS Database
Efficiency of redistribution policy (measured by adjusted degree of redistribution)states of OECD, in the last two decades (without redistributive effect of pensions)
ranking according to efficiency in reduced inequalities of income remains it disregards transfers in kind, which account for about half the total, plus public education and health, significantly reduce the degree of inequality,
the coefficient for the newcomer, as it is called in literature, expanded revenue being lower than that (Aaberge et al, 2011). Lack of data makes comparisons between states, may not
be possible for this moment, yet at EU level, efforts to collect them on a harmonized, have been orkua, 2011).
DK FI FR DE HU IE IT LU NO NL PO SK ES SEUK
37 35 22 23 21 25 5 16 27 28 20 26 11 3625
35 33 24 26 22 27 6 20 30 27 18 19 11 3323
ISSN: 1582-8859
22
people at retirement age will better up their
the degree of redistribution is based on the
redistributive effect of pensions, there is a resetting of the states, depending on the degree in reduction of income inequalities. Thus, the redistributive states are, for 90s, Denmark,
e Greece, Italy and Estonia are Figure 5).
For the first part of the past decade, Denmark, Finland and Sweden remain the most redistributive of 30%, while the other Nordic countries in, along with Belgium,
Germany, Netherlands, Australia and Ireland, reduce the initial inequality income by about a quarter. Italy and Greece continues to be in the opposite. Regarding evolution, the initial degree of income redistribution, has seen the largest variations in Estonia, Greece and Austria (up) and Slovakia and
(measured by adjusted degree of redistribution), in some (without redistributive effect of pensions)
ranking according to efficiency in reduced inequalities of income remains , which account for about half the total (Atkinson,
, plus public education and health, significantly reduce the degree of inequality, anded revenue being lower than that
. Lack of data makes comparisons between states, may not be possible for this moment, yet at EU level, efforts to collect them on a harmonized, have been
UK US EL SI EE
25 16 3 10 7
23 16 7 12 16
E u r o E c o n o m i c a
Issue 4(30)/2011 ISSN: 1582-8859
GLOBALIZATION AND REGIONALIZATION
23
6. The Role of Taxes in Reducing Inequalities in the Last Three Decades
To be comparable appreciation of the role of tax policy in redistribution was necessary to remove from the calculation the pensions and adding him to initial income, arguments to proceed in this manner already mentioned. Heterogeneity of states in terms of the pension system adopted, would have led to non-comparable analysis.
The main fiscal instrument to reduce income inequalities it is, at present, a progressive income tax. We appreciate that it plays a dual role in correcting income inequalities: on one hand, reduce the income gap between the richest and everyone else, because of progressive tax rates, on the other hand, an overwhelming proportion of fiscal resources from income tax, is collected from the richest taxpayers, being the premises to achieve two functions of the allocation function, the distribution in our case in cash transfers and more.
Also, a series of deductions or tax credits, granted mainly to people with a lower level of income compared to the threshold of tax laws, contribute to alleviating incomes inequality. It should not be overlooked that a number of tax incentives that can benefit only those with higher incomes (for example, stock investment) can exacerbate existing inequalities of income. Way down tax rates have a direct impact on reducing the income gap between high and those with modest incomes. The progressivity is stronger; the effect is a stronger correction of inequalities. But progressivity statutory rates and progression rates do not provide effective because of the various forms of tax progressivity may reduce or even annihilate the statutory rates.
Of wealth taxes, inheritance tax reduces wealth inequality, but no in a manner similar to progressive income tax: the redistribution is made to the State, thus reducing the wealth owned by rich people. It allows the property taxes at least once every generation, with some exceptions.
Another study, conducted in the U.S., on the data recorded in the period 1916-1996, the inheritance tax, shows that an increase in tax rates inherited wealth, lead time reduction in accumulated wealth (Slemrod&Kopczuk, 2000). However, from its inception, inheritance tax was seen as a counterweight against the increased concentration of wealth. However, property remains relatively concentrated, in most developed countries, Gini coefficient for wealth distribution has values two or three times if in income (Davies, 2008).
Even if our analysis were taken in account and social security contributions due to the setting of quotas, which are proportional in most states (except, France and the Netherlands), their redistributive role is neutral. It follows that in this point, the redistributive effect of taxes, under the generic name originally set (including both income tax and social contributions paid by employees) is, for most of the states analyzed, the redistributive effect of income tax.
E u r o E c o n o m i c a
Issue 4(30)/2011 ISSN: 1582-8859
GLOBALIZATION AND REGIONALIZATION
24
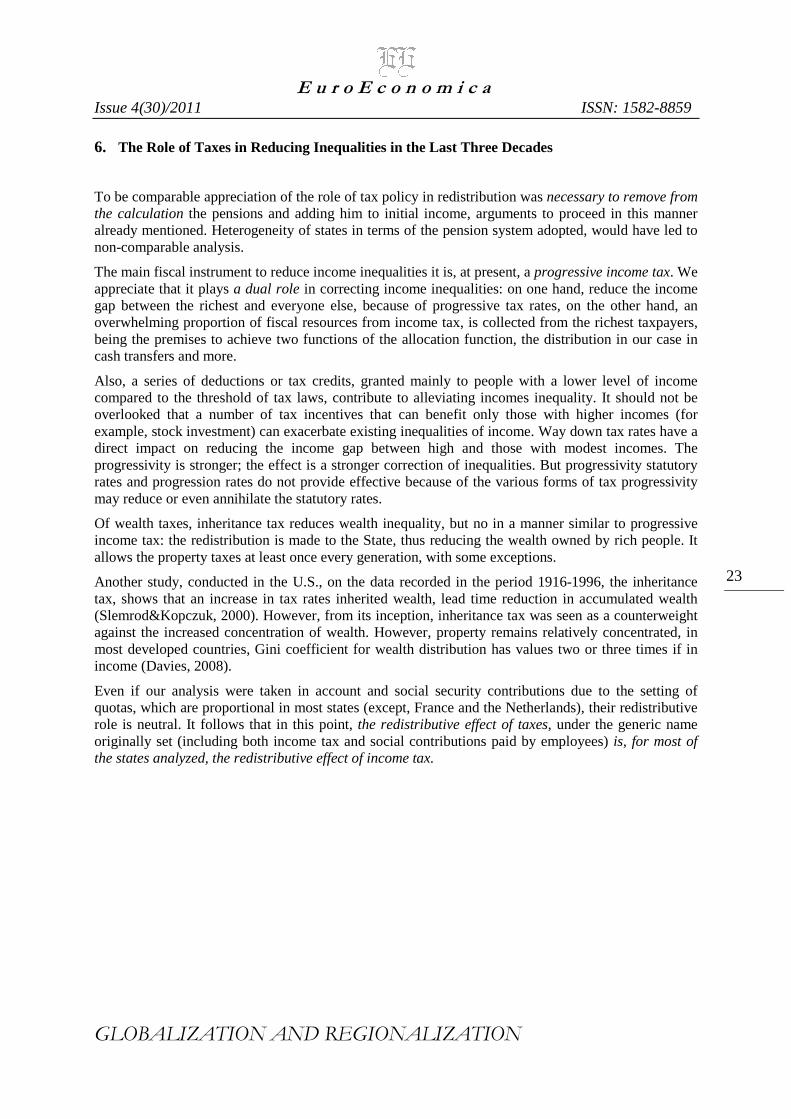
Figure 6 Distribution of states according to the efficiency of redistribution policy and the role of taxes in redistribution policy, in 90s
While taxes play an important role in whole redistribution policy, appreciation of the role of them, in reduction of income inequality, should only be performed by taking account of the degree of income redistribution in state made through and by means of redistribution policy, in whole.
In 90s, Belgium and Estonia represent the extreme cases, with a large share of taxes in income redistribution policy, but first have reduced initial inequality with a third, while in the last the efficiency of redistribution policy was weak. Poland also represent an extreme, his income tax system has accentuated the income inequality in the 90s.
Taking account both criteria, one can identify several categories of states, as can be seen in Figure 6: the first group, with a reduced share of tax policy redistribution and a very low degree of redistribution (Spain, Italy, Greece and Slovenia), a second group with a high role of taxes, but a moderate degree of redistribution (U.S., Canada, Australia, Norway, Czech Republic and Germany on the hand, France, Netherlands and Britain, on the other hand ), the third group with high importance of the tax and a high degree of redistribution (three Nordic states: Denmark, Sweden and Finland). Slovak Republic, Hungary and Ireland compose an intermediate group, with a moderate degree of redistribution, but the importance of taxes in redistribution policies has null.
In 2004, taxes contributed about half to reduce income inequalities in Belgium, USA and Estonia, the opposite being some South or Central European countries.
AU
AT
BE
CACZ
DK
FI
FR DEHU
IE
IT
LU
NONL
PO
SK
ES
SE
UKUS
EL
SI
EE
0
10
20
30
40
-20 0 20 40 60 80 100
Ad
just
ed
de
gre
e o
f re
dis
trib
uti
on
(%
)
Share of taxes (%)
E u r o E c o n o m i c a
Issue 4(30)/2011 ISSN: 1582-8859
GLOBALIZATION AND REGIONALIZATION
25
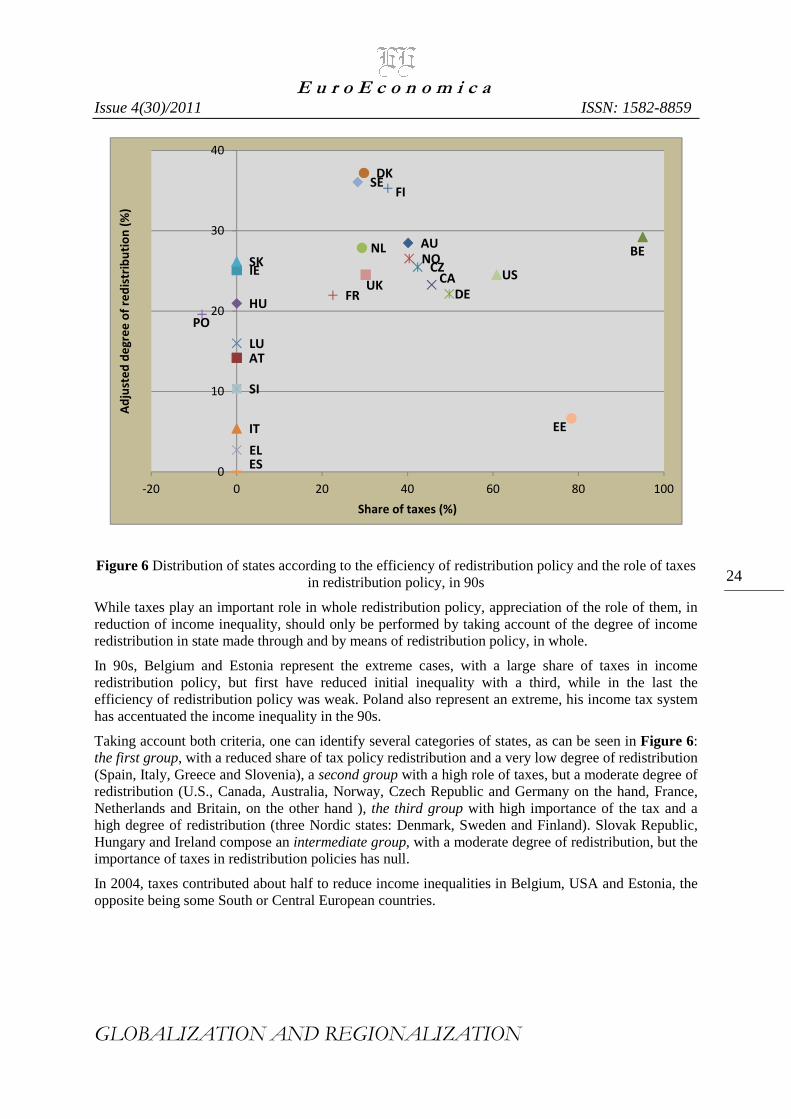
Source: own calculations based on LIS Database, http://www.lisdatacenter.org
Figure 7 Distribution of states according to the degree of redistribution and the role of taxes in redistribution policy, in 2004
Thereby, one can identify several categories of states, as can be seen in Figure 7: the first group, with a low degree of redistribution and a reduced share of tax policy redistribution (Spain, Italy, Slovenia) second group with a moderate degree of redistribution, but the high role of taxes (U.S., Canada, Luxembourg, Austria and Estonia), the third group with a high degree of income redistribution and high importance of the tax (the Nordic states, on the one hand, Ireland, Germany, Netherlands, Australia and the Czech Republic, on the other). In this case, extremes represent Belgium and Greece, in while France and Britain, on the hand, and Hungary, Slovak Republic and Poland, on the other hand, represent two intermediate groups, together with a medium degree of redistribution but with a medium, respectively low importance of taxes in redistribution policies.
For most countries for which data are available, from the 80s, the share of taxes in redistribution in all, decreased significantly, except Ireland, the Netherlands and Denmark. The biggest reductions were spotted in Belgium, Finland, Germany and Sweden, where taxes have a role pondering the majority in correcting inequalities of income. One of the major causes was the reduction in marginal tax rates of income tax for richest people, a trend manifested in most developed countries. Also, rising unemployment, especially in 90s, led to increased absolute and relative unemployment benefits, in all policies of redistribution, in most states.
Comparing Figure 6 and Figure 7, some states have migrated from a group to another. This is the case of Ireland, Luxemburg and Austria, where the importance of taxes in reducing income inequality has increased spectacularly, but the impact has rested unchanged. Norway has migrated to his neighborhood, while in US the efficiency of income redistribution policy and the role of taxes in them have decreased.
Taking into account the wealth taxes, significantly changes their appreciation of the role of tax in redistribution, as a whole. In the European Union, for 2007, it appears that they had an important role in redistribution policy, in 22 Member States of the 23 included in study, which contribute over one third to reduce overall income inequality through policy adopted by the State.
AU
AT
BE
CA
CZ
DKFI
FR
DE
HU
IE
IT
LU
NO NL
POSK
ES
SE
UK
US
EL
SI
EE
0
5
10
15
20
25
30
35
40
0 10 20 30 40 50 60 70
Deg
ree
of r
edis
trib
utio
n (%
)
Share of taxes (%)
E u r o E c o n o m i c a
Issue 4(30)/2011 ISSN: 1582-8859
GLOBALIZATION AND REGIONALIZATION
26
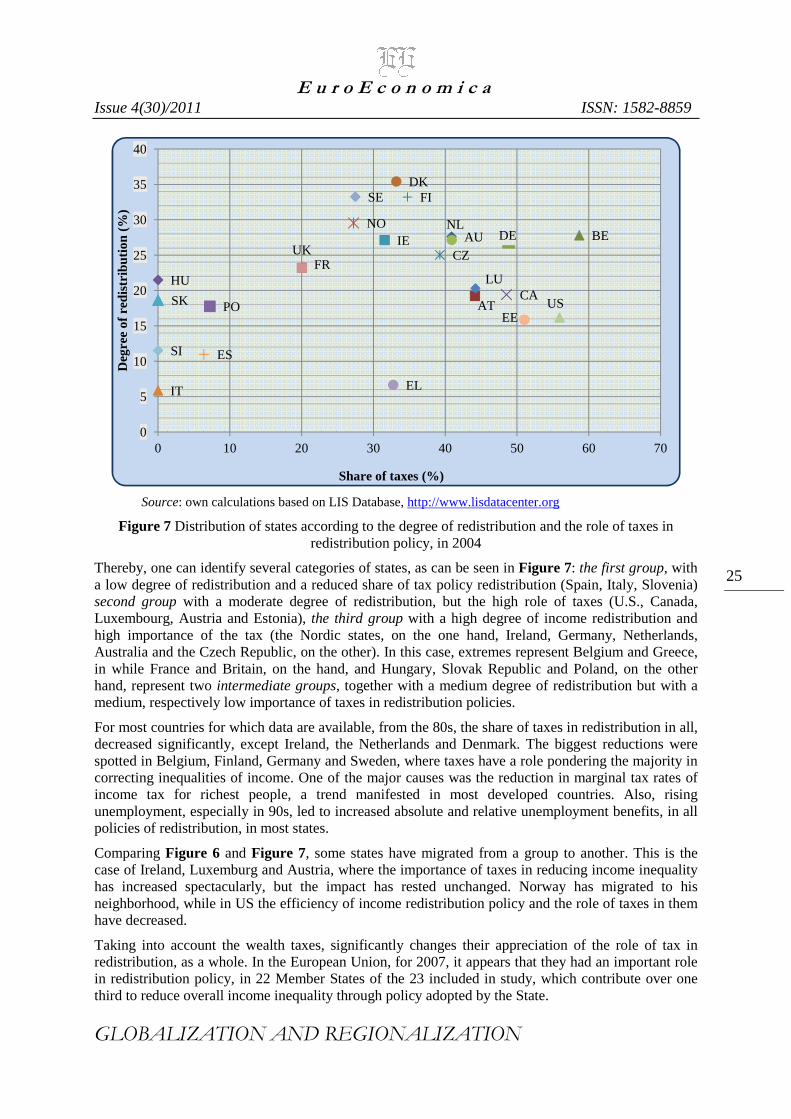
The results are different, in comparison with last decades, due to the methodology adopted, states were ordered by disposable income, taking account in concentration coefficient, both for transfers and for taxes, indicator of their degree of progressivity. The concentration coefficient for taxes is high, and for transfers are reduced, the role of redistributive tax policy in whole is more important. For example, for Latvia, the coefficient of concentration for taxes was 80.7 (average in the Member States considered as 55.7), while its value for transfers was -13.9 (mean was -39.4) (Barnard&Atta- Dorkua, 2011)
Including taxes on wealth and taking account in coefficient of concentration for both taxes and transfers, rearrange the grouping of states, but not radically, as you can see in Figure 8. Northern States continues to be a distinct group, which along with Ireland, reduce initially inequality about a third, but as the role of taxes is low compared to other Member States.
Source: own calculations based on „Income and living conditions in Europe – 2011”, European Commission, p. 346-364
Figure 8 Distribution of states according to the degree of redistribution and the role of taxes in redistribution policy, in 2007
A second group is the Baltic states and southern Europe's, with a low degree of redistribution, it represents the taxes to have more than half. Two intermediate groups can be found: the first subgroup with a high degree of redistribution, with a medium share of taxes in redistribution policy (Belgium, Netherlands, Czech Republic and Hungary), the second subgroup, with an medium degree of redistribution and a moderate share of taxes (France, Luxembourg, Austria, U.K. and Slovakia). Poland represents one extreme in this analysis. New EU Member States have changed belonging to different groups, changes due in tax legislation adopted at European Union entry in.
7. Conclusions
State intervention, to correct economic and social inequalities through taxes, has been criticized, especially by representatives of the current neoliberal; they invoked negative effect driven by high rates of income tax of the wealthy, on economic growth. The impact was considered a loss of
AT
BE
CZ
DK FI
FR
HU
IE
IT
LU
NO
NL
PO
SK
ES
SW
UK EL
EELV
PT
LT
CY
5
10
15
20
25
30
35
40
45
20 30 40 50 60 70 80
Deg
ree
of r
edis
trib
utio
n(%
)
Share of taxes (%)
E u r o E c o n o m i c a
Issue 4(30)/2011 ISSN: 1582-8859
GLOBALIZATION AND REGIONALIZATION
27
efficiency in the entire economy, driven by the negative impact of tax rates on tax bases. Recent literature, three decades after the formulation of neoliberal thesis, showed that the level of these losses is much lower than anticipated and into some extent, acceptable, so as progressive taxation of incomes, the main instrument of fiscal area in reduction of income inequality, is not harmful more than it has stated in the past decades. The results have attracted even responded harshly on political line, by admitting that neoliberal tenets were a pretext for tax cuts for the richest especially (Krugman, 2010). The reducing of the income during the last decades, following the adoption liberal positions of most developed countries, however remains a reality, especially in the higher income brackets.
The role of income taxes in correct inequalities, it has reduced the in most developed countries, reducing the progressivity and marginal rates for those with high incomes, is an important factor. However, in present, income tax continues to play an important role in redistribution policy adopted by developed countries and if one takes into account the wealth taxes, the role of direct taxes in whole becomes majority, in many developed countries, but the efficiency in reducing income inequalities is very low in some states (especially in Southern and Eastern Europe).
The deepening economic and social inequalities is a challenge for policy makers because many implications in economic, social and political spectrum, but as positive results demonstrated by some Member in reduce them, prove that there are real possibilities of control through budgetary and fiscal instruments. However, capital mobility in conditions rise amid the globalization process, the policy of redistribution will have to consider its implications; an excessive increase in tax rates is not a viable solution. On the other hand, in current conditions, in the European Union, which an increased budget deficits and great public debt is a reality, correcting inequalities of income through social transfers is placed in front of new limitations.
8. References
Aaberge, R.et al (2011). The impact of basic public services of the distribution of income in European Countries.
Atkinson, T. et al (2002). Social Indicators: The EU and social inclusion.
Bargain O. et al (2011). Tax-Benefit Systems in Europe and the US: Between Equity and Efficiency.
Barnard, A. & Atta-Dorkua V. (2011). Income and living conditions in Europe – 2011.
Davies, J. B. et al, (2008). The world distribution of household wealth.
Immervoll, H. & Richardson, L. (2011). Redistribution Policy and Inequality Reduction in OECD Countries, in OECD Social Employment and Migration Working Papers.
Krugman, P. (2010). Conscience of a liberal. Bucharest: Publica publishing house.
Milanovic, B. (2006). Do more unequal countries redistribute more? Does the median voter hypothesis hold?
Perroti, R. (1996). Growth, Income Distribution and Democracy: What the data say, Journal of Economic Growth.
Slemrod, J. & Kopczuk, W.(2000). The Impact of the Estate Tax on the Wealth Accumulation and Avoidance Behavior of Donors.
Sierminska, E. et al (2006). The Luxembourg Wealth Study.
Saez, E. (2002). Optimal income transfer programs: Intensive versus extensive labor supply responses.
UNDP (2010). Human Development Report 2010.
Wang, C. & Caminada, K. (2011). Disentangling Income Inequality and the Redistributive Effect of Social Transfers and Taxes in 36 LIS Countries.
Zhang, L. (2008). Political economy of income distribution dynamics", in Journal of Development Economics.