conscious investing options for the values driven investor
TRANSCRIPT
Conscious Investing Options for the Values Driven Investor
The following information is of a proprietary nature. Dissemination to other parties is prohibited without prior consent of Paul Comstock Partners.
Copyright © 2010 Paul Comstock Partners. All Rights Reserved.
Paul Comstock Partners ® 2
Discussion Topics
Values Driven InvestingOften investors want to consider their personal values in addition to their wealth preservation goals when making investment decisions
Socially Responsible Investing (SRI)• Negative screens allow investors to withhold capital from investments that are not aligned with
their valuesImpact Investing• Investors actively seek out investments which result in social or environmental change
Fiduciary issues for institutional investors to consider
Paul Comstock Partners ® 3
What is Socially Responsible Investing?
Socially Responsible Investing (SRI) is a broad-based approach to investing that recognizes that corporate responsibility and societal concerns are valid parts of investment decisions
Considers an investment’s impact on society Also known as: mission investing, responsible investing, double or triple bottom line investing, ethical investing, sustainable investing, or green investing
Common methods investors utilize for SRIScreeningShareholder Advocacy
Source: http://www.socialinvest.org/resources/sriguide/srifacts.cfm
Paul Comstock Partners ® 4
How Do You Implement SRI?
Define the values the foundation wishes to expressScreens of securities can either be positive or negative
Negative screens block companies engaged in certain undesirable activitiesExamples:
Industry restrictions such as gambling or tobaccoBusiness dealings in the Sudan
Positive screens attempt to identify companies with desirable attributes Examples:
high levels of community involvementgood environmental practices
Determine screens that may be controversial to your board and/or constituency Example
Abortion/Birth ControlDefense/Weapons
Test restrictions if implemented on the current portfolioNames eliminatedNames in compliance
Paul Comstock Partners ® 5
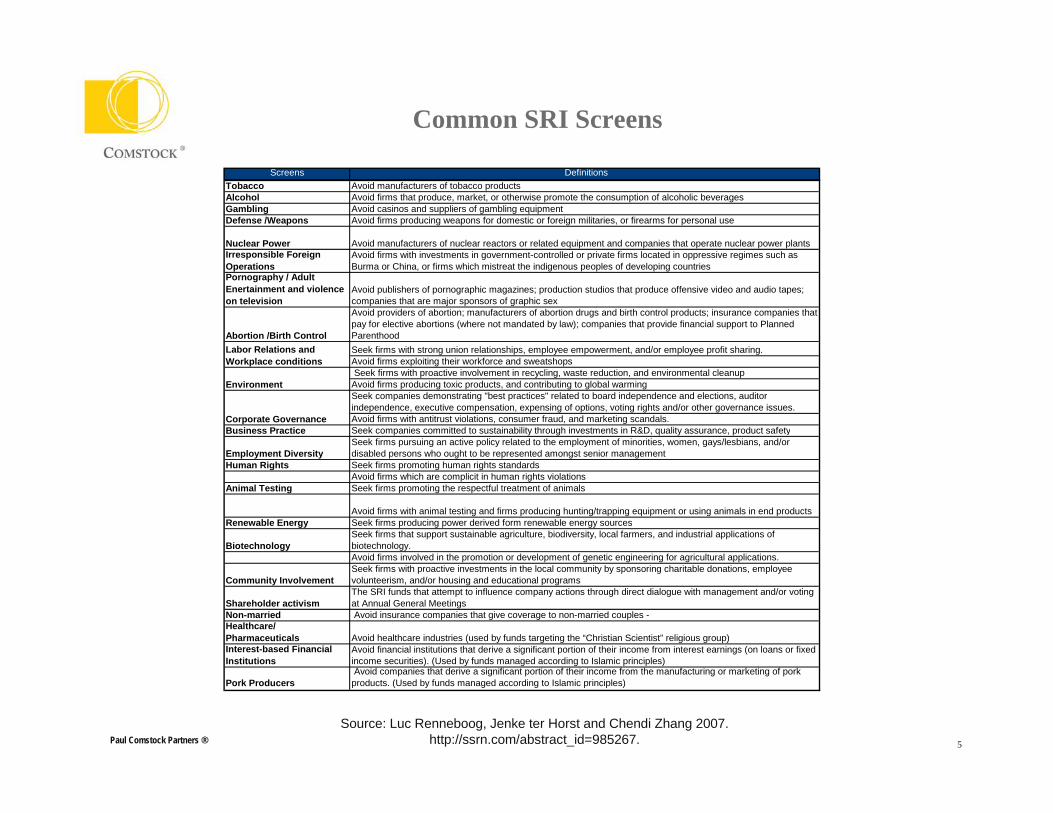
Common SRI Screens
Source: Luc Renneboog, Jenke ter Horst and Chendi Zhang 2007. http://ssrn.com/abstract_id=985267.
Screens DefinitionsTobacco Avoid manufacturers of tobacco productsAlcohol Avoid firms that produce, market, or otherwise promote the consumption of alcoholic beveragesGambling Avoid casinos and suppliers of gambling equipment Defense /Weapons Avoid firms producing weapons for domestic or foreign militaries, or firearms for personal use
Nuclear Power Avoid manufacturers of nuclear reactors or related equipment and companies that operate nuclear power plantsIrresponsible Foreign Operations
Avoid firms with investments in government-controlled or private firms located in oppressive regimes such as Burma or China, or firms which mistreat the indigenous peoples of developing countries
Pornography / Adult Enertainment and violence on television
Avoid publishers of pornographic magazines; production studios that produce offensive video and audio tapes; companies that are major sponsors of graphic sex
Abortion /Birth Control
Avoid providers of abortion; manufacturers of abortion drugs and birth control products; insurance companies that pay for elective abortions (where not mandated by law); companies that provide financial support to Planned ParenthoodSeek firms with strong union relationships, employee empowerment, and/or employee profit sharing.Avoid firms exploiting their workforce and sweatshopsSeek firms with proactive involvement in recycling, waste reduction, and environmental cleanup
Avoid firms producing toxic products, and contributing to global warmingSeek companies demonstrating "best practices" related to board independence and elections, auditor independence, executive compensation, expensing of options, voting rights and/or other governance issues.Avoid firms with antitrust violations, consumer fraud, and marketing scandals.
Business Practice Seek companies committed to sustainability through investments in R&D, quality assurance, product safety
Employment DiversitySeek firms pursuing an active policy related to the employment of minorities, women, gays/lesbians, and/or disabled persons who ought to be represented amongst senior management
Human Rights Seek firms promoting human rights standardsAvoid firms which are complicit in human rights violations
Animal Testing Seek firms promoting the respectful treatment of animals
Avoid firms with animal testing and firms producing hunting/trapping equipment or using animals in end productsRenewable Energy Seek firms producing power derived form renewable energy sources
Biotechnology Seek firms that support sustainable agriculture, biodiversity, local farmers, and industrial applications of biotechnology.Avoid firms involved in the promotion or development of genetic engineering for agricultural applications.
Community InvolvementSeek firms with proactive investments in the local community by sponsoring charitable donations, employee volunteerism, and/or housing and educational programs
Shareholder activismThe SRI funds that attempt to influence company actions through direct dialogue with management and/or voting at Annual General Meetings
Non-married Avoid insurance companies that give coverage to non-married couples -Healthcare/ Pharmaceuticals Avoid healthcare industries (used by funds targeting the “Christian Scientist” religious group)Interest-based Financial Institutions
Avoid financial institutions that derive a significant portion of their income from interest earnings (on loans or fixed income securities). (Used by funds managed according to Islamic principles)
Pork ProducersAvoid companies that derive a significant portion of their income from the manufacturing or marketing of pork
products. (Used by funds managed according to Islamic principles)
Labor Relations and Workplace conditions
Corporate Governance
Environment
Socially Responsible Rating Institutions
Paul Comstock Partners ® 7
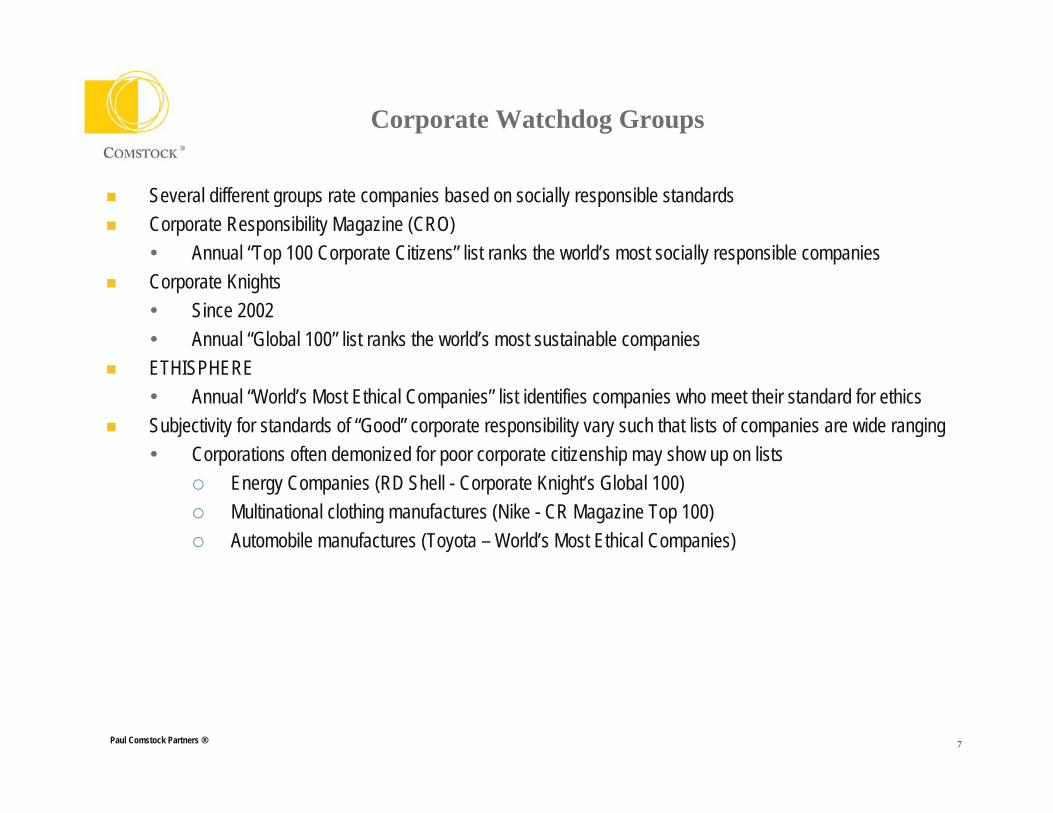
Corporate Watchdog Groups
Several different groups rate companies based on socially responsible standardsCorporate Responsibility Magazine (CRO)
Annual “Top 100 Corporate Citizens” list ranks the world’s most socially responsible companies Corporate Knights
Since 2002Annual “Global 100” list ranks the world’s most sustainable companies
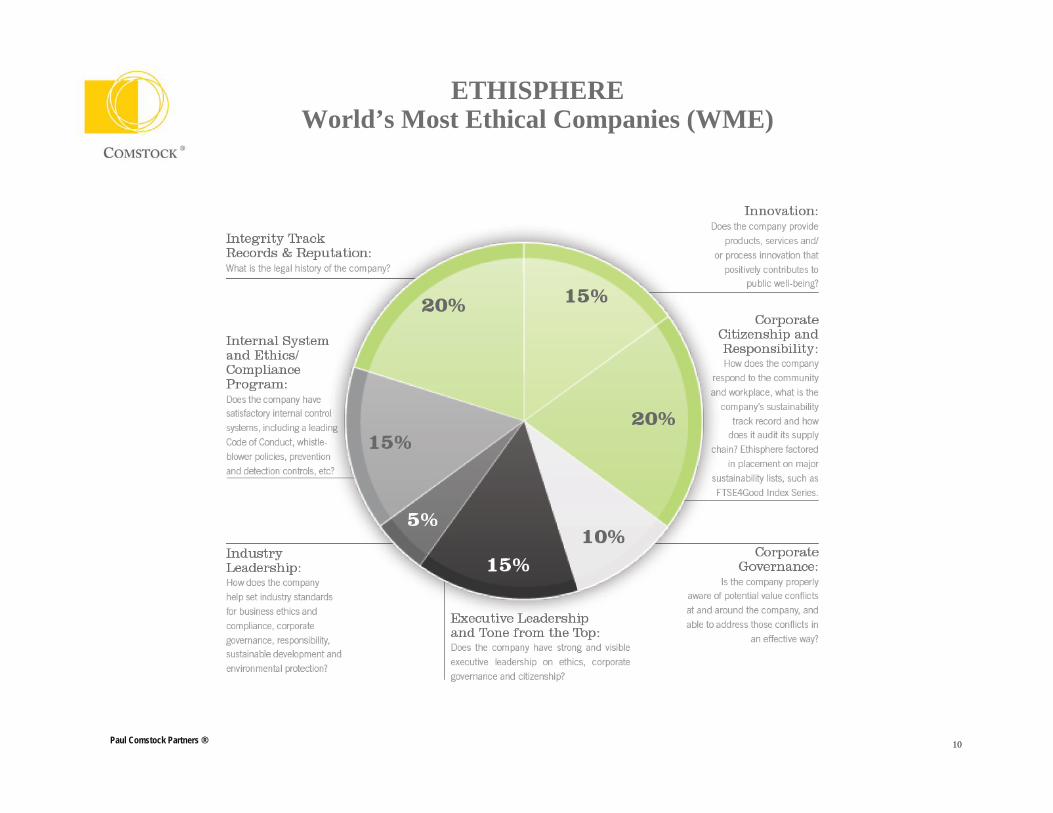
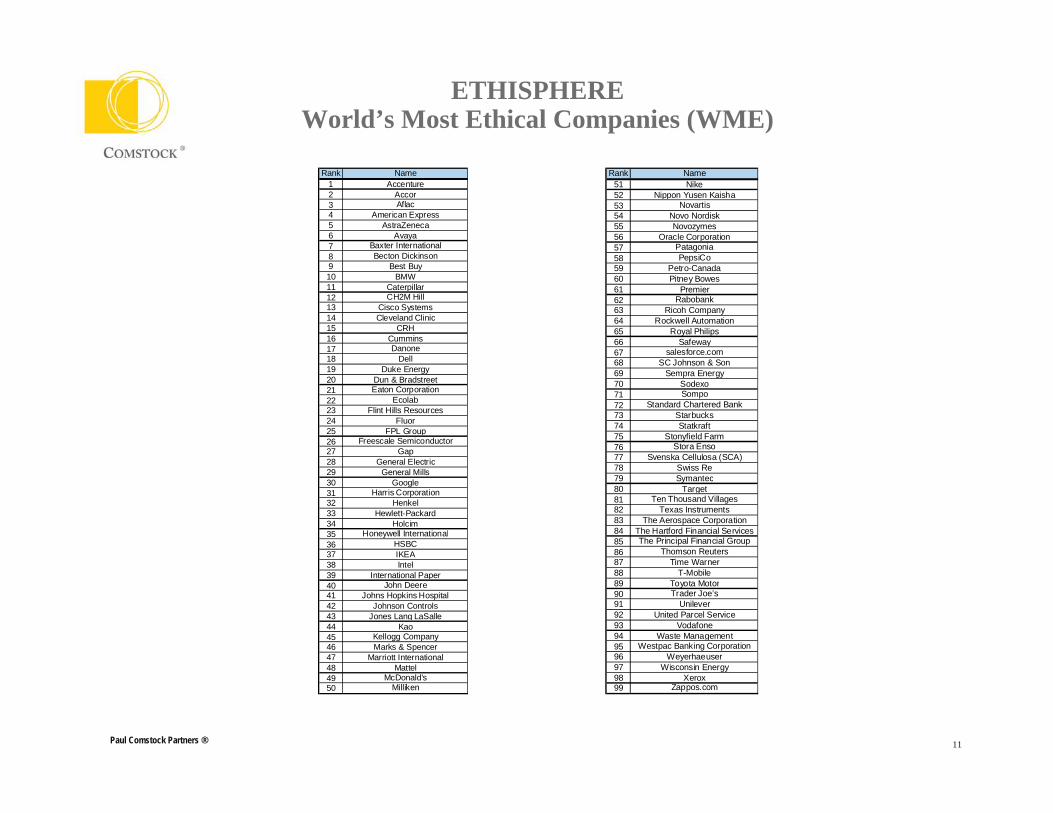
ETHISPHEREAnnual “World’s Most Ethical Companies” list identifies companies who meet their standard for ethics
Subjectivity for standards of “Good” corporate responsibility vary such that lists of companies are wide rangingCorporations often demonized for poor corporate citizenship may show up on lists
Energy Companies (RD Shell - Corporate Knight’s Global 100)Multinational clothing manufactures (Nike - CR Magazine Top 100)Automobile manufactures (Toyota – World’s Most Ethical Companies)
Paul Comstock Partners ® 8
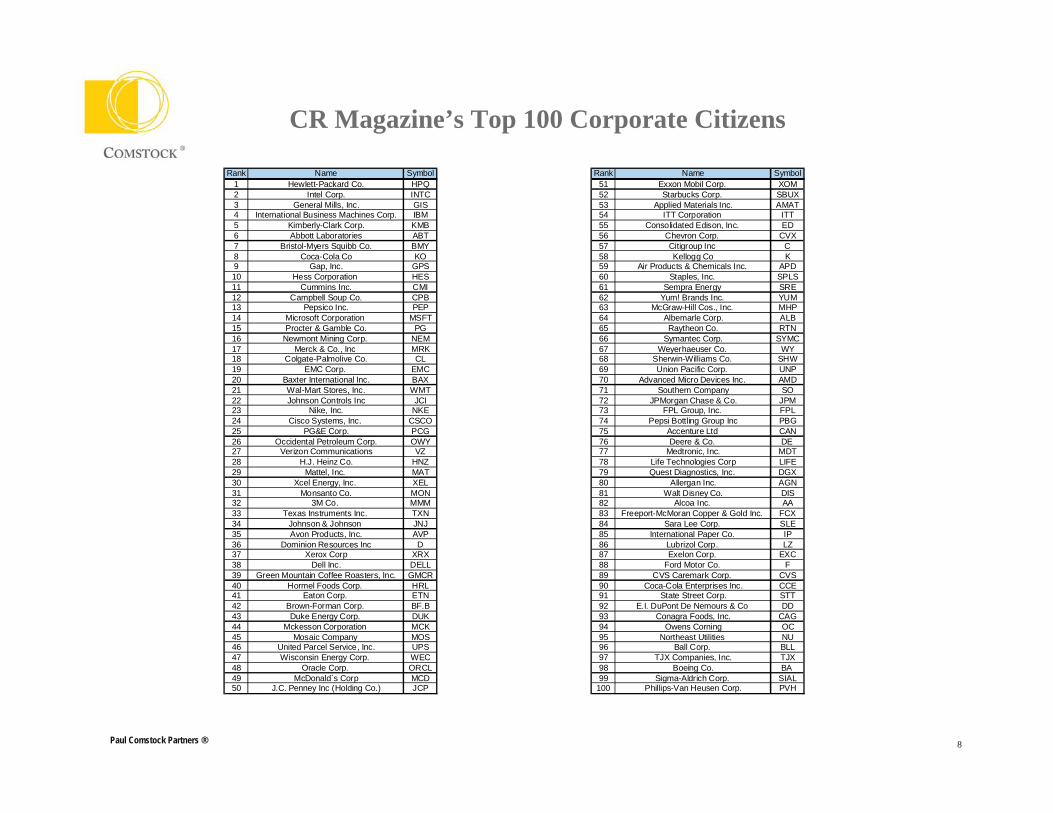
CR Magazine’s Top 100 Corporate Citizens
Rank Name Symbol1 Hewlett-Packard Co. HPQ2 Intel Corp. INTC3 General Mills, Inc. GIS4 International Business Machines Corp. IBM5 Kimberly-Clark Corp. KMB6 Abbott Laboratories ABT7 Bristol-Myers Squibb Co. BMY8 Coca-Cola Co KO9 Gap, Inc. GPS10 Hess Corporation HES11 Cummins Inc. CMI12 Campbell Soup Co. CPB13 Pepsico Inc. PEP14 Microsoft Corporation MSFT15 Procter & Gamble Co. PG16 Newmont Mining Corp. NEM17 Merck & Co., Inc MRK18 Colgate-Palmolive Co. CL19 EMC Corp. EMC20 Baxter International Inc. BAX21 Wal-Mart Stores, Inc. WMT22 Johnson Controls Inc JCI23 Nike, Inc. NKE24 Cisco Systems, Inc. CSCO25 PG&E Corp. PCG26 Occidental Petroleum Corp. OWY27 Verizon Communications VZ28 H.J. Heinz Co. HNZ29 Mattel, Inc. MAT30 Xcel Energy, Inc. XEL31 Monsanto Co. MON32 3M Co. MMM33 Texas Instruments Inc. TXN34 Johnson & Johnson JNJ35 Avon Products, Inc. AVP36 Dominion Resources Inc D37 Xerox Corp XRX38 Dell Inc. DELL39 Green Mountain Coffee Roasters, Inc. GMCR40 Hormel Foods Corp. HRL41 Eaton Corp. ETN42 Brown-Forman Corp. BF.B43 Duke Energy Corp. DUK44 Mckesson Corporation MCK45 Mosaic Company MOS46 United Parcel Service, Inc. UPS47 Wisconsin Energy Corp. WEC48 Oracle Corp. ORCL49 McDonald`s Corp MCD50 J.C. Penney Inc (Holding Co.) JCP
Rank Name Symbol51 Exxon Mobil Corp. XOM52 Starbucks Corp. SBUX53 Applied Materials Inc. AMAT54 ITT Corporation ITT55 Consolidated Edison, Inc. ED56 Chevron Corp. CVX57 Citigroup Inc C58 Kellogg Co K59 Air Products & Chemicals Inc. APD60 Staples, Inc. SPLS61 Sempra Energy SRE62 Yum! Brands Inc. YUM63 McGraw-Hill Cos., Inc. MHP64 Albemarle Corp. ALB65 Raytheon Co. RTN66 Symantec Corp. SYMC67 Weyerhaeuser Co. WY68 Sherwin-Williams Co. SHW69 Union Pacific Corp. UNP70 Advanced Micro Devices Inc. AMD71 Southern Company SO72 JPMorgan Chase & Co. JPM73 FPL Group, Inc. FPL74 Pepsi Bottling Group Inc PBG75 Accenture Ltd CAN76 Deere & Co. DE 77 Medtronic, Inc. MDT78 Life Technologies Corp LIFE79 Quest Diagnostics, Inc. DGX80 Allergan Inc. AGN81 Walt Disney Co. DIS82 Alcoa Inc. AA83 Freeport-McMoran Copper & Gold Inc. FCX84 Sara Lee Corp. SLE85 International Paper Co. IP86 Lubrizol Corp. LZ87 Exelon Corp. EXC88 Ford Motor Co. F89 CVS Caremark Corp. CVS90 Coca-Cola Enterprises Inc. CCE91 State Street Corp. STT92 E.I. DuPont De Nemours & Co DD93 Conagra Foods, Inc. CAG94 Owens Corning OC95 Northeast Utilities NU96 Ball Corp. BLL97 TJX Companies, Inc. TJX98 Boeing Co. BA 99 Sigma-Aldrich Corp. SIAL
100 Phillips-Van Heusen Corp. PVH
Paul Comstock Partners ® 9
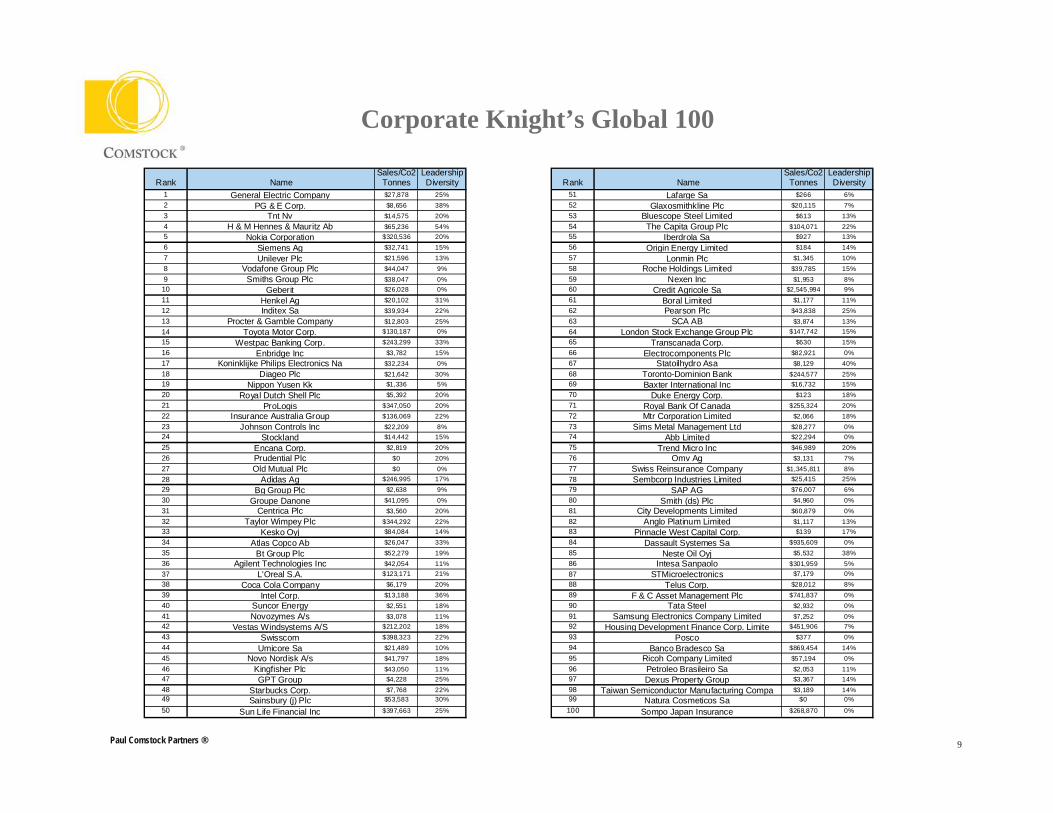
Corporate Knight’s Global 100
Rank NameSales/Co2
TonnesLeadership Diversity
1 General Electric Company $27,878 25%2 PG & E Corp. $8,656 38%3 Tnt Nv $14,575 20%4 H & M Hennes & Mauritz Ab $65,236 54%5 Nokia Corporation $320,536 20%6 Siemens Ag $32,741 15%7 Unilever Plc $21,596 13%8 Vodafone Group Plc $44,047 9%9 Smiths Group Plc $38,047 0%10 Geberit $26,028 0%11 Henkel Ag $20,102 31%12 Inditex Sa $39,934 22%13 Procter & Gamble Company $12,803 25%14 Toyota Motor Corp. $130,187 0%15 Westpac Banking Corp. $243,299 33%16 Enbridge Inc $3,782 15%17 Koninklijke Philips Electronics Na $32,234 0%18 Diageo Plc $21,642 30%19 Nippon Yusen Kk $1,336 5%20 Royal Dutch Shell Plc $5,392 20%21 ProLogis $347,050 20%22 Insurance Australia Group $136,069 22%23 Johnson Controls Inc $22,209 8%24 Stockland $14,442 15%25 Encana Corp. $2,819 20%26 Prudential Plc $0 20%27 Old Mutual Plc $0 0%28 Adidas Ag $246,995 17%29 Bg Group Plc $2,638 9%30 Groupe Danone $41,095 0%31 Centrica Plc $3,560 20%32 Taylor Wimpey Plc $344,292 22%33 Kesko Oyj $84,084 14%34 Atlas Copco Ab $26,047 33%35 Bt Group Plc $52,279 19%36 Agilent Technologies Inc $42,054 11%37 L'Oreal S.A. $123,171 21%38 Coca Cola Company $6,179 20%39 Intel Corp. $13,188 36%40 Suncor Energy $2,551 18%41 Novozymes A/s $3,078 11%42 Vestas Windsystems A/S $212,202 18%43 Swisscom $398,323 22%44 Umicore Sa $21,489 10%45 Novo Nordisk A/s $41,797 18%46 Kingfisher Plc $43,050 11%47 GPT Group $4,228 25%48 Starbucks Corp. $7,768 22%49 Sainsbury (j) Plc $53,583 30%
50 Sun Life Financial Inc $397,663 25%
Rank NameSales/Co2
TonnesLeadership Diversity
51 Lafarge Sa $266 6%52 Glaxosmithkline Plc $20,115 7%53 Bluescope Steel Limited $613 13%54 The Capita Group Plc $104,071 22%55 Iberdrola Sa $927 13%56 Origin Energy Limited $184 14%57 Lonmin Plc $1,345 10%58 Roche Holdings Limited $39,785 15%59 Nexen Inc $1,953 8%60 Credit Agricole Sa $2,545,994 9%61 Boral Limited $1,177 11%62 Pearson Plc $43,838 25%63 SCA AB $3,874 13%64 London Stock Exchange Group Plc $147,742 15%65 Transcanada Corp. $630 15%66 Electrocomponents Plc $82,921 0%67 Statoilhydro Asa $8,129 40%68 Toronto-Dominion Bank $244,577 25%69 Baxter International Inc $16,732 15%70 Duke Energy Corp. $123 18%71 Royal Bank Of Canada $255,324 20%72 Mtr Corporation Limited $2,066 18%73 Sims Metal Management Ltd $28,277 0%74 Abb Limited $22,294 0%75 Trend Micro Inc $46,989 20%76 Omv Ag $3,131 7%77 Swiss Reinsurance Company $1,345,811 8%78 Sembcorp Industries Limited $25,415 25%79 SAP AG $76,007 6%80 Smith (ds) Plc $4,960 0%81 City Developments Limited $60,879 0%82 Anglo Platinum Limited $1,117 13%83 Pinnacle West Capital Corp. $139 17%84 Dassault Systemes Sa $935,609 0%85 Neste Oil Oyj $5,532 38%86 Intesa Sanpaolo $301,959 5%87 STMicroelectronics $7,179 0%88 Telus Corp. $28,012 8%89 F & C Asset Management Plc $741,837 0%90 Tata Steel $2,932 0%91 Samsung Electronics Company Limited $7,252 0%92 Housing Development Finance Corp. Limite $451,906 7%93 Posco $377 0%94 Banco Bradesco Sa $869,454 14%95 Ricoh Company Limited $57,194 0%96 Petroleo Brasileiro Sa $2,053 11%97 Dexus Property Group $3,367 14%98 Taiwan Semiconductor Manufacturing Compa $3,189 14%99 Natura Cosmeticos Sa $0 0%
100 Sompo Japan Insurance $268,870 0%
Paul Comstock Partners ® 10
ETHISPHEREWorld’s Most Ethical Companies (WME)
Paul Comstock Partners ® 11
ETHISPHEREWorld’s Most Ethical Companies (WME)
Rank Name1 Accenture2 Accor3 Aflac4 American Express5 AstraZeneca6 Avaya7 Baxter International8 Becton Dickinson9 Best Buy10 BMW11 Caterpillar12 CH2M Hill13 Cisco Systems14 Cleveland Clinic15 CRH16 Cummins17 Danone18 Dell19 Duke Energy20 Dun & Bradstreet21 Eaton Corporation22 Ecolab23 Flint Hills Resources24 Fluor25 FPL Group26 Freescale Semiconductor27 Gap28 General Electric29 General Mills30 Google31 Harris Corporation32 Henkel33 Hewlett-Packard34 Holcim35 Honeywell International36 HSBC37 IKEA38 Intel39 International Paper40 John Deere41 Johns Hopkins Hospital42 Johnson Controls43 Jones Lang LaSalle44 Kao45 Kellogg Company46 Marks & Spencer47 Marriott International48 Mattel49 McDonald’s50 Milliken
Rank Name51 Nike52 Nippon Yusen Kaisha53 Novartis54 Novo Nordisk55 Novozymes56 Oracle Corporation57 Patagonia58 PepsiCo59 Petro-Canada60 Pitney Bowes61 Premier62 Rabobank63 Ricoh Company64 Rockwell Automation65 Royal Philips66 Safeway67 salesforce.com68 SC Johnson & Son69 Sempra Energy70 Sodexo71 Sompo72 Standard Chartered Bank73 Starbucks74 Statkraft75 Stonyfield Farm76 Stora Enso77 Svenska Cellulosa (SCA)78 Swiss Re79 Symantec80 Target81 Ten Thousand Villages82 Texas Instruments83 The Aerospace Corporation84 The Hartford Financial Services85 The Principal Financial Group86 Thomson Reuters87 Time Warner88 T-Mobile89 Toyota Motor90 Trader Joe’s91 Unilever92 United Parcel Service93 Vodafone94 Waste Management95 Westpac Banking Corporation96 Weyerhaeuser97 Wisconsin Energy98 Xerox99 Zappos.com
Sample of Socially Responsible Funds
Paul Comstock Partners ® 13
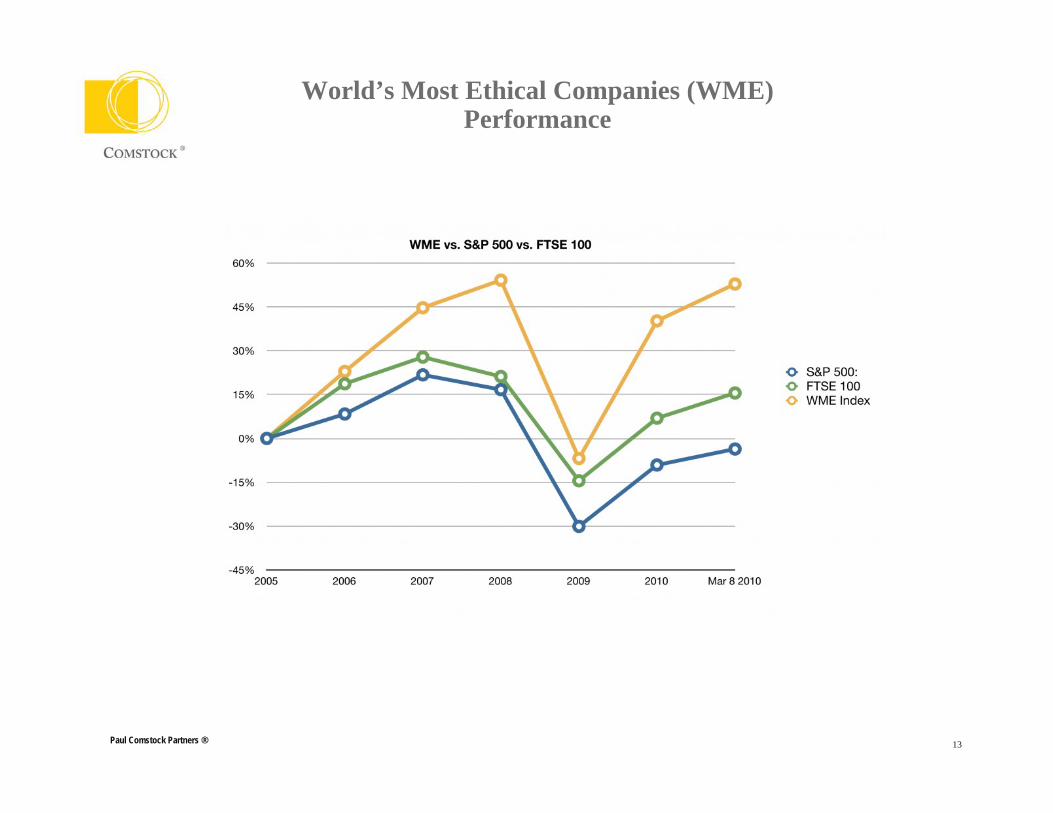
World’s Most Ethical Companies (WME) Performance
Paul Comstock Partners ® 14
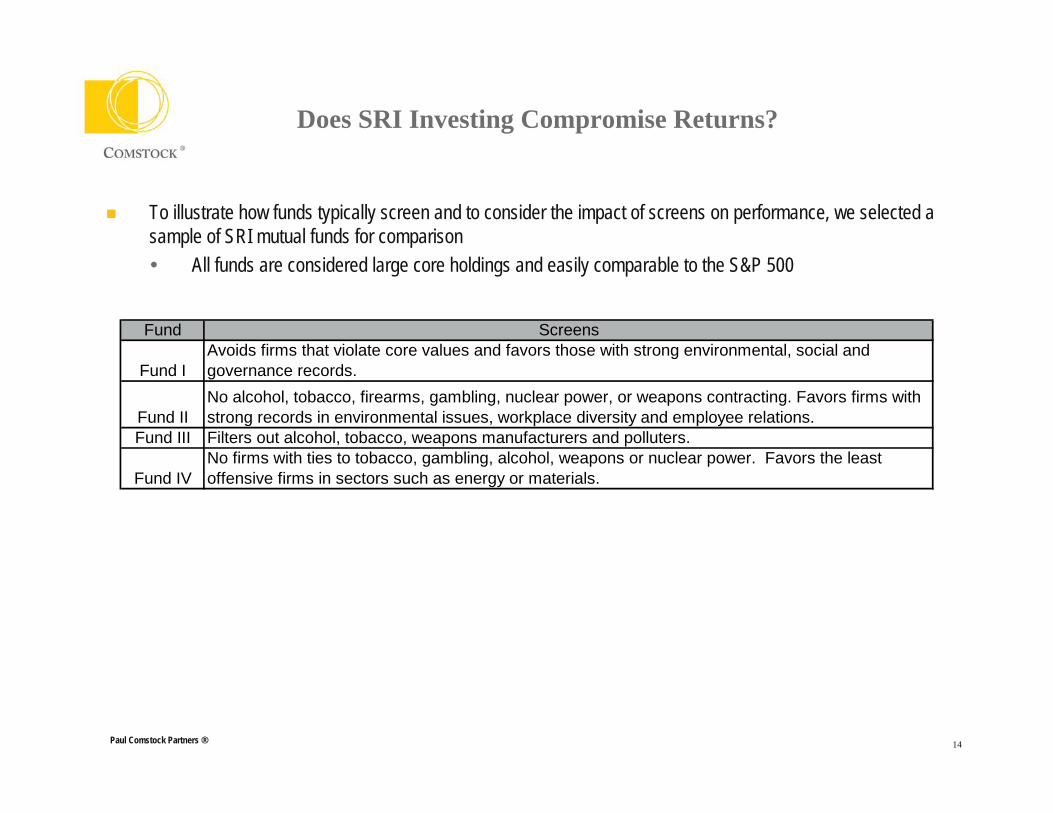
Does SRI Investing Compromise Returns?
To illustrate how funds typically screen and to consider the impact of screens on performance, we selected a sample of SRI mutual funds for comparison
All funds are considered large core holdings and easily comparable to the S&P 500
Fund Screens
Fund I Avoids firms that violate core values and favors those with strong environmental, social and governance records.
Fund IINo alcohol, tobacco, firearms, gambling, nuclear power, or weapons contracting. Favors firms with strong records in environmental issues, workplace diversity and employee relations.
Fund III Filters out alcohol, tobacco, weapons manufacturers and polluters.
Fund IVNo firms with ties to tobacco, gambling, alcohol, weapons or nuclear power. Favors the least offensive firms in sectors such as energy or materials.
Paul Comstock Partners ® 15
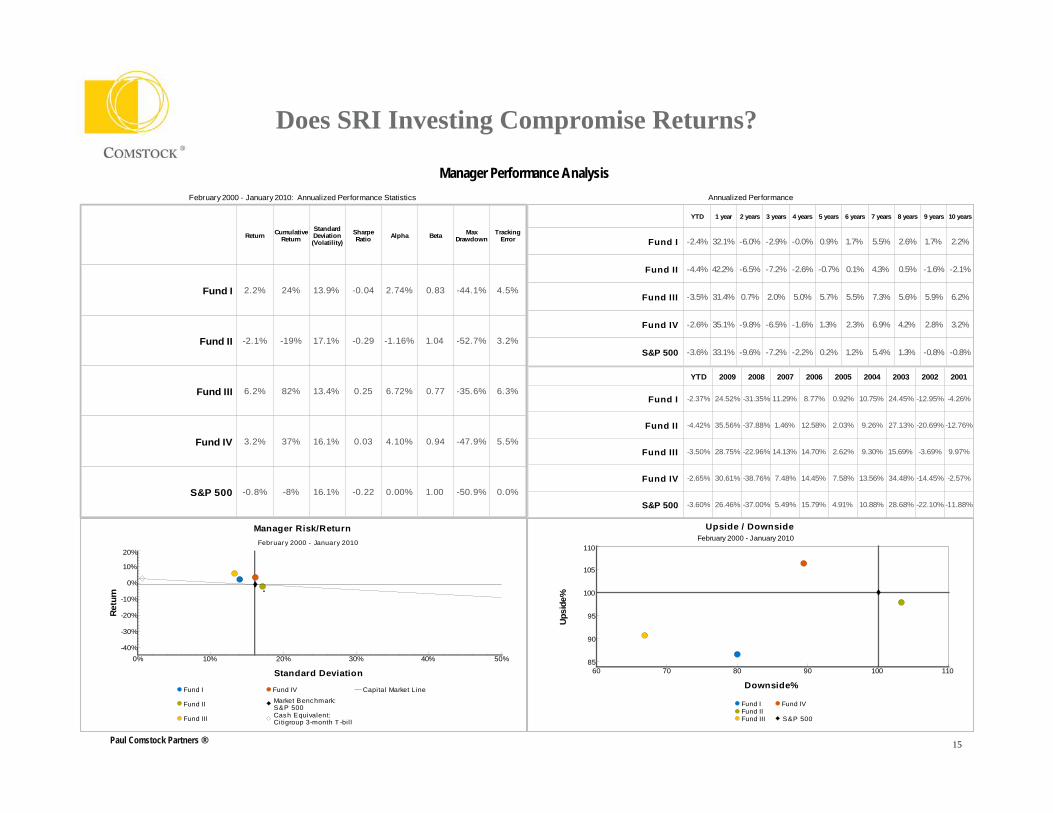
Manager Performance Analysis February 2000 - January 2010: Annualized Performance Statistics
Fund I
Return
2.2%
Fund II -2.1%
CumulativeReturn
24%
-19%
StandardDeviation(Volatility)
13.9%
17.1%
SharpeRatio
-0.04
-0.29
Alpha
2.74%
-1.16%
Beta
0.83
1.04
MaxDrawdown
-44.1%
-52.7%
Fund III 6.2% 82% 13.4% 0.25 6.72% 0.77 -35.6%
TrackingError
4.5%
3.2%
6.3%
Fund IV 3.2% 37% 16.1% 0.03 4.10% 0.94 -47.9% 5.5%
S&P 500 -0.8% -8% 16.1% -0.22 0.00% 1.00 -50.9% 0.0%
Annualized Performance
Fund I
Fund II
Fund III
YTD
-2.4%
-4.4%
-3.5%
1 year
32.1%
42.2%
31.4%
2 years
-6.0%
-6.5%
0.7%
3 years
-2.9%
-7.2%
2.0%
4 years
-0.0%
-2.6%
5.0%
Fund IV -2.6% 35.1% -9.8% -6.5% -1.6%
S&P 500 -3.6% 33.1% -9.6% -7.2% -2.2%
5 years
0.9%
-0.7%
5.7%
1.3%
0.2%
6 years
1.7%
0.1%
5.5%
2.3%
1.2%
7 years
5.5%
4.3%
7.3%
6.9%
5.4%
8 years
2.6%
0.5%
5.6%
4.2%
1.3%
9 years
1.7%
-1.6%
5.9%
2.8%
-0.8%
10 years
2.2%
-2.1%
6.2%
3.2%
-0.8%
Fund I
YTD
-2.37%
Fund II -4.42%
2009
24.52%
35.56%
2008
-31.35%
-37.88%
2007
11.29%
1.46%
2006
8.77%
12.58%
2005
0.92%
2.03%
2004
10.75%
9.26%
2003
24.45%
27.13%
2002
-12.95%
-20.69%
Fund III -3.50% 28.75% -22.96% 14.13% 14.70% 2.62% 9.30% 15.69% -3.69%
Fund IV -2.65% 30.61% -38.76% 7.48% 14.45% 7.58% 13.56% 34.48% -14.45%
S&P 500 -3.60% 26.46% -37.00% 5.49% 15.79% 4.91% 10.88% 28.68% -22.10%
2001
-4.26%
-12.76%
9.97%
-2.57%
-11.88%
Manager Risk/Return February 2000 - January 2010
Retu
rn
-40%
-30%
-20%
-10%
0%
10%
20%
Standard Deviation0% 10% 20% 30% 40% 50%
Fund I
Fund II
Fund III
Fund IV
Market Benchmark:S&P 500Cash Equivalent:Citigroup 3-month T -bil l
Capital Market Line
Upside / DownsideFebruary 2000 - January 2010
Upsi
de%
85
90
95
100
105
110
Downside%60 70 80 90 100 110
Fund IFund IIFund III
Fund IV
S&P 500
Does SRI Investing Compromise Returns?
Paul Comstock Partners ® 16
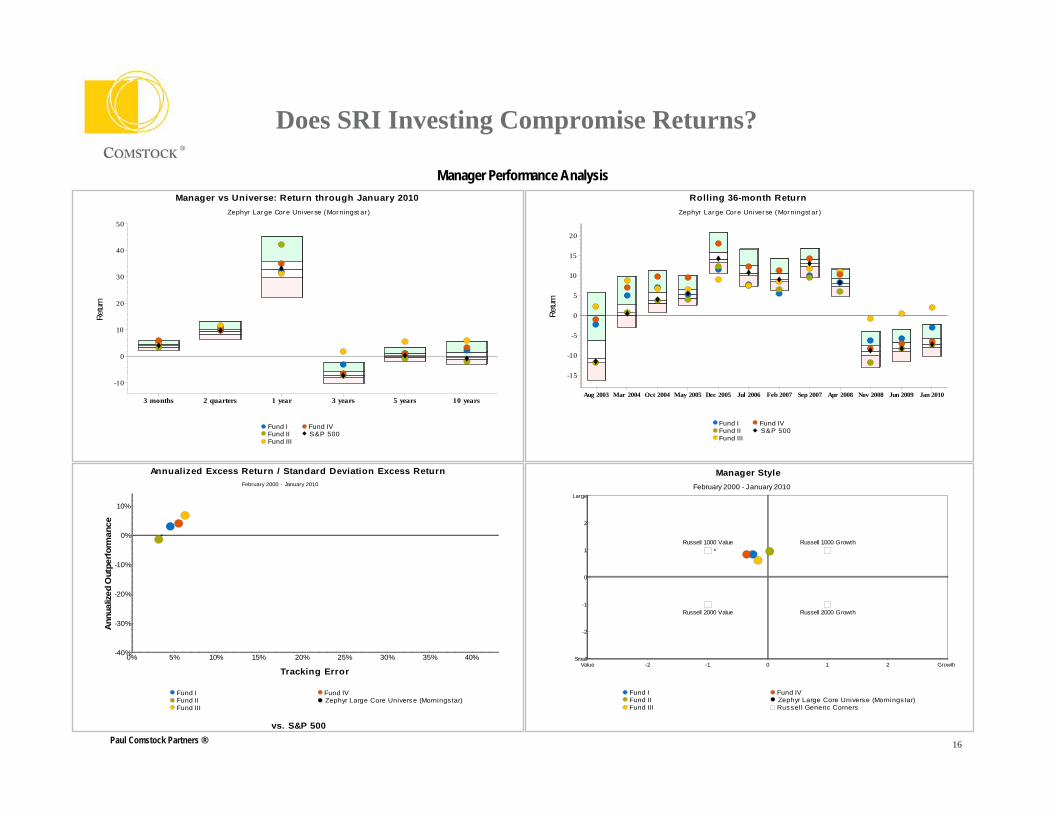
Manager Performance AnalysisManager vs Universe: Return through January 2010
Zephyr Large Core Universe (Morningstar)
Retu
rn
-10
0
10
20
30
40
50
3 months 2 quarters 1 year 3 years 5 years 10 years
Fund IFund IIFund III
Fund IVS&P 500
Rolling 36-month ReturnZephyr Large Core Universe (Morningstar)
Retu
rn
-15
-10
-5
0
5
10
15
20
Aug 2003 Mar 2004 Oct 2004 May 2005 Dec 2005 Jul 2006 Feb 2007 Sep 2007 Apr 2008 Nov 2008 Jun 2009 Jan 2010
Fund IFund IIFund III
Fund IVS&P 500
Annualized Excess Return / Standard Deviation Excess Return
vs. S&P 500
February 2000 - January 2010
Annu
alize
d O
utpe
rform
ance
-40%
-30%
-20%
-10%
0%
10%
Tracking Error0% 5% 10% 15% 20% 25% 30% 35% 40%
Fund IFund IIFund III
Fund IVZephyr Large Core Universe (Morningstar)
Manager StyleFebruary 2000 - January 2010
Russell 1000 Value Russell 1000 Growth
Russell 2000 Value Russell 2000 Growth
Small
-2
-1
0
1
2
Large
Value -2 -1 0 1 2 Growth
Fund IFund IIFund III
Fund IVZephyr Large Core Universe (Mornings tar)Russel l Generic Corners
Does SRI Investing Compromise Returns?
Impact Investing
Paul Comstock Partners ® 18
Impact Investing
Definition: Actively placing capital in businesses and funds that generate social and/or environmental good and a range of returns, from principal to above market, to investor.1
The main difference in Impact Investing and Socially Responsible Investing stems from the idea of actively seeking change through the allocation of capital
Individual investors may find it difficult to meaningfully project philanthropic idealsSome investment vehicles present an opportunity for investors to gain the advantages of scale when trying to accomplish value driven goals
The main goals of such funds is to intentionally make changeInvestments which unintentionally create social good are not included in this category
Impact Investing vehicles are not charities. While the goal is to change the society for the better, some financial return is intended on the investment
Returns may or may not be above market returns
1. Investing for Impact: Bridges Ventures and The Parthenon Group
Paul Comstock Partners ® 19
Types of Investors and Vehicles
Impact First InvestorsInvestors who are primarily seeking social good and make accept below market returns or only return of capital
Financial First InvestorsInvestors who seek market rate returns which also have social impact
Hybrid Structures (Layered Structures)Investment vehicles which combine capital from both types of investors in order to create economies of scale and do the greatest goodTranches are often created to satisfy the needs of both types of investors Philanthropic organizations may also take part in the investment to maximize the impact
Paul Comstock Partners ® 20
Impact Investing Framework
Although Impact Investing is a relatively new idea, recent innovations have create many different opportunities for investors to participate
Opportunities exist in areas from very secure cash investments and senior debt offerings to private equity and venture capital fundsConsiderations for appropriate vehicles are driven by risk tolerances and investing goals
The framework an investor chooses will drive potential returnsAs the industry has begun to mature, market returns may be reasonable considering the asset class or the tranche the investor chooses to participate
Paul Comstock Partners ® 21
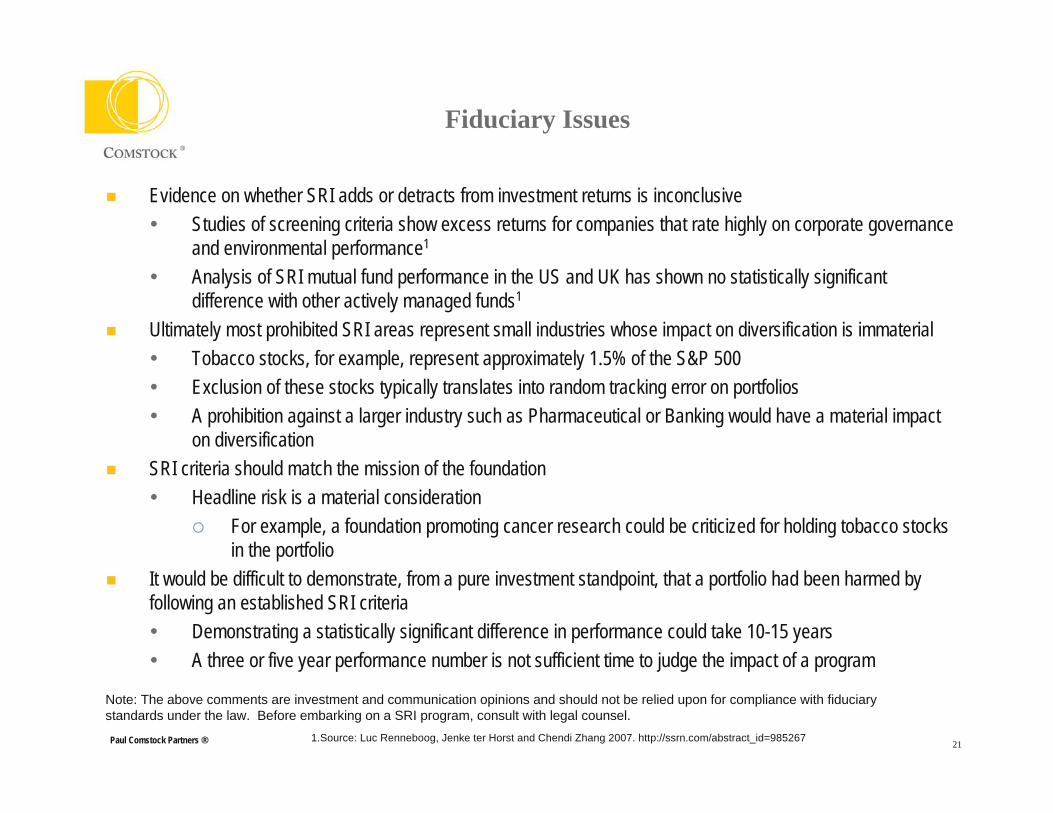
Fiduciary Issues
Evidence on whether SRI adds or detracts from investment returns is inconclusiveStudies of screening criteria show excess returns for companies that rate highly on corporate governance and environmental performance1
Analysis of SRI mutual fund performance in the US and UK has shown no statistically significant difference with other actively managed funds1
Ultimately most prohibited SRI areas represent small industries whose impact on diversification is immaterialTobacco stocks, for example, represent approximately 1.5% of the S&P 500Exclusion of these stocks typically translates into random tracking error on portfoliosA prohibition against a larger industry such as Pharmaceutical or Banking would have a material impact on diversification
SRI criteria should match the mission of the foundationHeadline risk is a material consideration
For example, a foundation promoting cancer research could be criticized for holding tobacco stocks in the portfolio
It would be difficult to demonstrate, from a pure investment standpoint, that a portfolio had been harmed by following an established SRI criteria
Demonstrating a statistically significant difference in performance could take 10-15 yearsA three or five year performance number is not sufficient time to judge the impact of a program
1.Source: Luc Renneboog, Jenke ter Horst and Chendi Zhang 2007. http://ssrn.com/abstract_id=985267
Note: The above comments are investment and communication opinions and should not be relied upon for compliance with fiduciary standards under the law. Before embarking on a SRI program, consult with legal counsel.
Paul Comstock Partners ® 22
Summary
Opportunities exist for investors looking to align their values with their investment portfoliosThere are options as to how you implement values driven investing within a portfolio
Socially Responsible Investing is a way to avoid participating with companies that produce products or provide services inconsistent with your personal valuesImpact Investing is a way to actively participate in promoting your values in emerging areas around the world while earning a return
For More Information…
Paul Comstock Partners ®Two Riverway, Suite 1000Houston, TX 77056
Main (713) 977 2694Fax (713) 877 1363
www.paulcomstockpartners.com