conceptual roadmap for implementing spc in the food industry
TRANSCRIPT
Trends in Food Science & Technology xx (2015) 1e13
Viewpoint
* Corresponding author.1 Tel.: þ44 1314513863.
http://dx.doi.org/10.1016/j.tifs.2015.03.0020924-2244/� 2015 Elsevier Ltd. All rights reserved.
Please cite this article in press as: Abdul Halim Lim, S., et al., Toward
industry, Trends in Food Science & Technology (2015), http://dx.doi.o
Towards a
conceptual roadmap
for Statistical Process
Control
implementation in
the food industry
Sarina Abdul Halim Lima,b,*,1,
Jiju Antonya,1,Jose Arturo Garza-Reyesc andNorin Arsheda,1
aSchool of Management and Languages, Heriot-Watt
University, Riccarton Campus, Edinburgh, EH14 4AS,
United Kingdom (e-mails: [email protected];
[email protected])bDept. of Food Technology, Faculty of Food Science
and Technology, University of Putra Malaysia, 43400
UPM, Serdang, Selangor Malaysia (School of
Management and Languages, Heriot-Watt University,
Riccarton Campus, Edinburgh, EH14 4AS,United Kingdom. Tel.: D44 7500200965; e-mail:
[email protected])cCentre for Supply Chain Improvement, The University
of Derby, Kedleston Road Campus, Derby, DE22 1GB,
United Kingdom (e-mail: [email protected])
Statistical process control (SPC) is one of the most highly used
quality control techniques in the industry. The lack of specific
implementation guidelines makes it the least applied quality
control technique in the food industry. This paper presents a
five-phase SPC implementation conceptual roadmap in the
food industry developed based on a critical review on current
s a conce
rg/10.10
literature of various SPC deployment methods. It considers six
critical factors for the SPC implementation in the food industry.
This paper makes unique contributions by presenting a system-
atic approach for the managers of this industry to successfully
deploy SPC in their organisations.
IntroductionIn recent years, general consumers and governments havebecome interested in food safety and certain ways of pro-ducing food from the farm to the processing level. Thishas resulted on higher awareness and stronger demandson food quality management (FQM) (Grunert, 2005).FQM refers to the approaches used for the realisation offood quality (Luning & Marcelis, 2007). Hence, amongthe food companies, the idea of implementing a systematictechnique such as Statistical Process Control (SPC) toimprove food quality is becoming more popular. This isnow particularly prevalent in the USA and European coun-tries (Higgins, 2003; Pena-Rodriguez, 2013). SPC isviewed as a building component for other quality pro-grammes implemented in the food industry, including TotalQuality Management (TQM), Six Sigma, Lean Six Sigmaand various other methodologies that are used to reducewaste through controlling process variation (Dalgic,Vardin, & Beliba€A€Yli, 2011; Dora, Kumar, VanGoubergen, Molnar, & Gellynck, 2013; Pable, Lu, &Auerbach, 2010; Paiva, 2013). In the literature of SPC inthe food industry, SPC also has been integrated with HazardAnalysis Critical Control Point (HACCP) for quality assur-ance and food safety purposes (Lim, Antony, & Albliwi,2014).
However, the academic literature indicates that thepenetration of SPC in the food industry is slowercompared to other industries (Dora, Van Goubergen,Kumar, Molnar, & Gellynck, 2014; Grigg & Walls,2007a; Lim et al., 2014). For example, Dora et al.(2013) found that SPC was the least applied techniquewhen compared to other quality control (QC) tools (i.e. vi-sual inspection and acceptance sampling) used in the foodindustry. Furthermore, previous studies on this topic re-ported that the challenges of SPC implementation facedby food companies are due to a lack of knowledge andguidance on how to implement this technique effectively(Grigg, 1998; Pena-Rodriguez, 2013). In order to exploitthe benefits of SPC application, it must be established as
ptual roadmap for Statistical Process Control implementation in the food
16/j.tifs.2015.03.002

2 S. Abdul Halim Lim et al. / Trends in Food Science & Technology xx (2015) 1e13
one of the quality techniques in the food quality systemacross the whole company.
SPC, which is one of the techniques under FQM, is un-derstood as a continuous and long-term benefits technique(Dora et al., 2013; Grigg & Walls, 2007b). FQM is acomplicated system as it involves the dynamic and complexcharacter of appreciable food products in combination withthe dynamic and often unpredictable behaviour of peopleinvolved in food production (Luning & Marcelis, 2006,2007). Hence, the implementation of SPC does not onlyrequire commitment and knowledge, but also a systematicstrategy. Current research evidence is vague in addressingthe manner that was used to introduce and implement tech-nological change and cause SPC failures. Although specificguidance has been provided by the Department of Tradeand Industry (DTI) regarding how to use control chart forthe control of weights and measures (DTI, 1979), thereare concerns that there is a lack of industry-specific guid-ance on SPC implementation. Furthermore, the introduc-tion of SPC is not the only issue that the currentliterature is lacking, but the institutionalisation and sustain-ability of SPC practices in the food sector are still in needof further research (Dora et al., 2013). In this paper, a con-ceptual framework, which intends to provide foodmanufacturing managers and engineers with a roadmapfor an effective and sustainable implementation of SPC ispresented.
Critical review of SPC implementation frameworksThis section is focused on the results of the comparative
study of existing SPC implementation frameworks. The au-thors provide a critical analysis of the existing SPC imple-mentation framework based on the criteria adopted fromthe Roger’s diffusion integration of innovation criteriaand criteria developed by Yusof and Aspinwall (2000) todevelop a TQM framework. In the diffusion of innovationtheory, Rogers (1995) identified five quality criteria (rela-tive advantages, compatibility, complexity, trialability andobservability) which facilitate to decrease the innovationadoption uncertainty. In this study, SPC is considered asthe technological innovation within the food companies(Swamidass & Winch, 2002). Meanwhile, Yusof andAspinwall (2000) proposed the criteria of a good imple-mentation framework for the TQM implementation. TQMis following the similar underlying principle philosophyas SPC, which is continous improvement (Montgomery,2012). The existing SPC implementation frameworkswere compared and contrasted using the criteria listed inTable 1.
Table 1 shows the SPC implementation frameworkcriteria and lists the conditions for each of the criteria.Such evaluation balances the analysis of the roadmapswith that of a standard set of criteria and levels. It wasconcluded that Does and Trip (1997) developed themost comprehensive roadmap as it achieved the highestlevel of most of the criteria. In terms of compatibility,
Please cite this article in press as: Abdul Halim Lim, S., et al., Towards a conce
industry, Trends in Food Science & Technology (2015), http://dx.doi.org/10.10
the roadmap did not specify the type of environment(products and industry) appropriate for the use of theframework.
DTI manual provides advice on sampling methods,calculation of standard deviation and control charts; how-ever, it lacks detailed guidelines for the application ofSPC (Grigg & Walls, 2007a). Hence, some of the foodproducers merely opt for the conventional strategy ofoverfilling (Hung & Sung, 2011). Further to the critical re-view in Table 2, authors would like to accentuate the lim-itations of the existing SPC implementation frameworkswithin the food industry context. The existingframeworks:
� failed to address the differences in employees compe-tency level issue in the training programme. In thefood industry, an employee’s competency gap has beennoted and this could result in challenges that lead to cul-tural resistance, de-motivated workforce and disruptedimplementation (Mensah & Julien, 2011)
� assumed that there is data availability and an effectivemeasurement system, which is not the case in most ofthe organisations of the food industry (Kovach & Cho,2011; van der Spiegel, Luning, Ziggers, & Jongen,2003).
� failed to address the development of SPC teams (Pena-Rodriguez, 2013).
� vaguely addressed the lack of statistical thinking culturein food companies, lack of awareness of the quality toolsand high resistance to change (Lim et al., 2014).
� failed to align SPC as a powerful technique with thebusiness strategy (Pena-Rodriguez, 2013; Woodall &Montgomery, 2014).
� failed to address the sustainability issues of SPCimplementation.
SPC implementation conceptual roadmapThe conceptual roadmap proposed was developed based
on the limitations of the existing SPC implementationframeworks previously discussed and an extensive litera-ture on SPC implementation in the food industry. The sum-mary of the literature resulted a conceptual SPCimplementation roadmap consists of five phases of imple-mentation that have been sequenced as a clear and concisestep-by-step approach as depicted in Fig. 1.
Phase A: AwarenessCreating and achieving a certain degree of awareness of
SPC within the organisation is marked as the formal start ofthe SPC deployment. The principal aim underlying thisphase is to educate and communicate people in the organi-sation the reasons as to why switching current practice toSPC as well as the challenges and benefits of its implemen-tations. Generally, it is to create a sense of urgency, creatingvalues for SPC implementation in the company and guar-antee top management commitment.
ptual roadmap for Statistical Process Control implementation in the food
16/j.tifs.2015.03.002
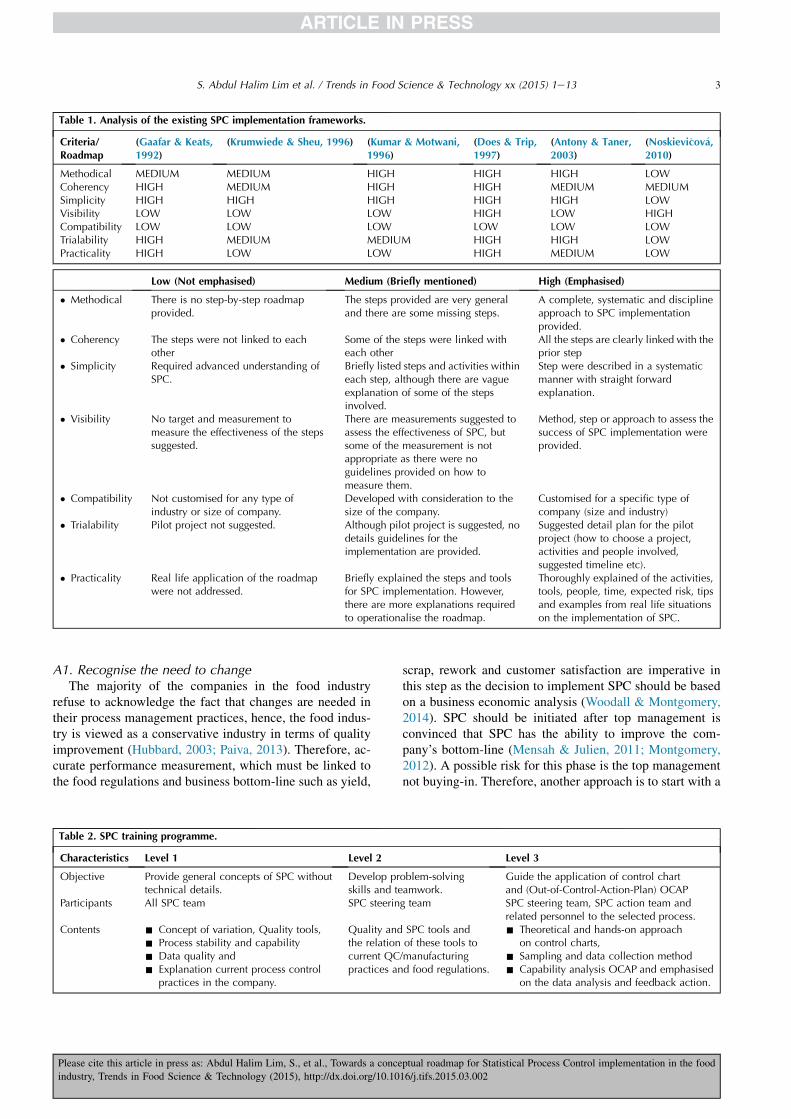
Table 1. Analysis of the existing SPC implementation frameworks.
Criteria/Roadmap
(Gaafar & Keats,1992)
(Krumwiede & Sheu, 1996) (Kumar & Motwani,1996)
(Does & Trip,1997)
(Antony & Taner,2003)
(Noskievi�cov�a,2010)
Methodical MEDIUM MEDIUM HIGH HIGH HIGH LOWCoherency HIGH MEDIUM HIGH HIGH MEDIUM MEDIUMSimplicity HIGH HIGH HIGH HIGH HIGH LOWVisibility LOW LOW LOW HIGH LOW HIGHCompatibility LOW LOW LOW LOW LOW LOWTrialability HIGH MEDIUM MEDIUM HIGH HIGH LOWPracticality HIGH LOW LOW HIGH MEDIUM LOW
Low (Not emphasised) Medium (Briefly mentioned) High (Emphasised)
� Methodical There is no step-by-step roadmapprovided.
The steps provided are very generaland there are some missing steps.
A complete, systematic and disciplineapproach to SPC implementationprovided.
� Coherency The steps were not linked to eachother
Some of the steps were linked witheach other
All the steps are clearly linked with theprior step
� Simplicity Required advanced understanding ofSPC.
Briefly listed steps and activities withineach step, although there are vagueexplanation of some of the stepsinvolved.
Step were described in a systematicmanner with straight forwardexplanation.
� Visibility No target and measurement tomeasure the effectiveness of the stepssuggested.
There are measurements suggested toassess the effectiveness of SPC, butsome of the measurement is notappropriate as there were noguidelines provided on how tomeasure them.
Method, step or approach to assess thesuccess of SPC implementation wereprovided.
� Compatibility Not customised for any type ofindustry or size of company.
Developed with consideration to thesize of the company.
Customised for a specific type ofcompany (size and industry)
� Trialability Pilot project not suggested. Although pilot project is suggested, nodetails guidelines for theimplementation are provided.
Suggested detail plan for the pilotproject (how to choose a project,activities and people involved,suggested timeline etc).
� Practicality Real life application of the roadmapwere not addressed.
Briefly explained the steps and toolsfor SPC implementation. However,there are more explanations requiredto operationalise the roadmap.
Thoroughly explained of the activities,tools, people, time, expected risk, tipsand examples from real life situationson the implementation of SPC.
3S. Abdul Halim Lim et al. / Trends in Food Science & Technology xx (2015) 1e13
A1. Recognise the need to changeThe majority of the companies in the food industry
refuse to acknowledge the fact that changes are needed intheir process management practices, hence, the food indus-try is viewed as a conservative industry in terms of qualityimprovement (Hubbard, 2003; Paiva, 2013). Therefore, ac-curate performance measurement, which must be linked tothe food regulations and business bottom-line such as yield,
Table 2. SPC training programme.
Characteristics Level 1 Level 2
Objective Provide general concepts of SPC withouttechnical details.
Develop prskills and te
Participants All SPC team SPC steerin
Contents - Concept of variation, Quality tools,- Process stability and capability- Data quality and- Explanation current process control
practices in the company.
Quality andthe relationcurrent QCpractices an
Please cite this article in press as: Abdul Halim Lim, S., et al., Towards a conce
industry, Trends in Food Science & Technology (2015), http://dx.doi.org/10.10
scrap, rework and customer satisfaction are imperative inthis step as the decision to implement SPC should be basedon a business economic analysis (Woodall & Montgomery,2014). SPC should be initiated after top management isconvinced that SPC has the ability to improve the com-pany’s bottom-line (Mensah & Julien, 2011; Montgomery,2012). A possible risk for this phase is the top managementnot buying-in. Therefore, another approach is to start with a
Level 3
oblem-solvingamwork.
Guide the application of control chartand (Out-of-Control-Action-Plan) OCAP
g team SPC steering team, SPC action team andrelated personnel to the selected process.
SPC tools andof these tools to/manufacturingd food regulations.
- Theoretical and hands-on approachon control charts,
- Sampling and data collection method- Capability analysis OCAP and emphasised
on the data analysis and feedback action.
ptual roadmap for Statistical Process Control implementation in the food
16/j.tifs.2015.03.002
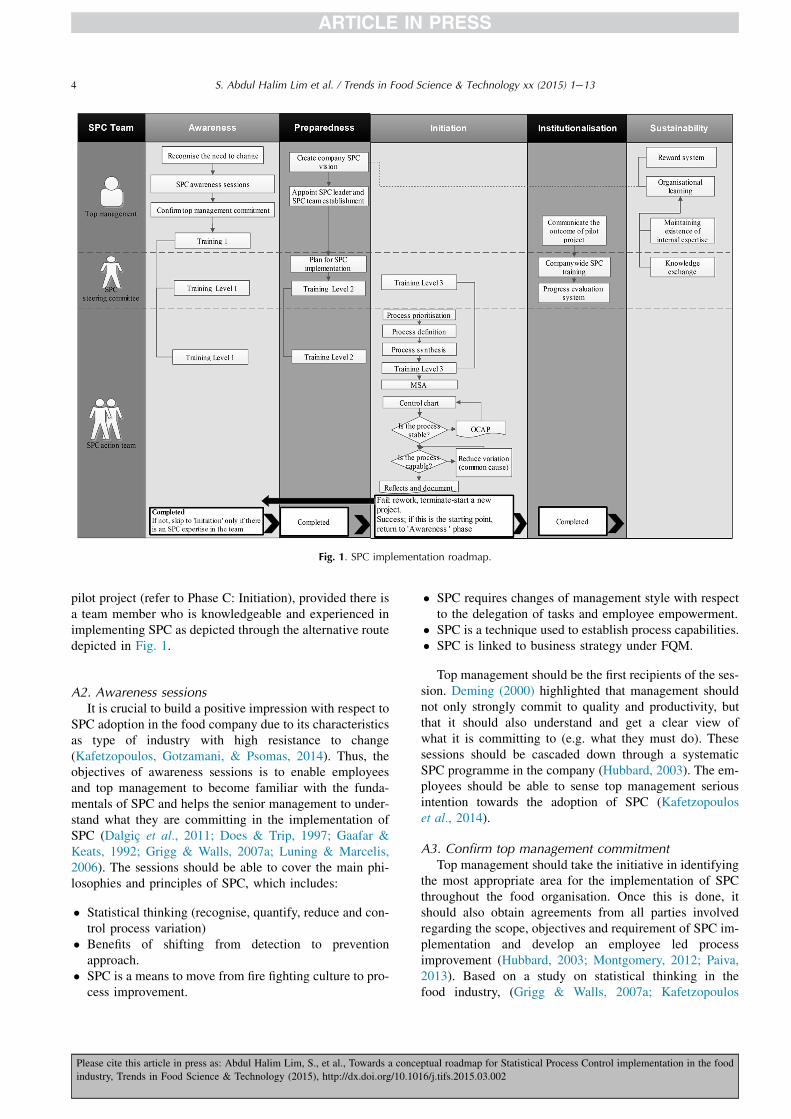
Fig. 1. SPC implementation roadmap.
4 S. Abdul Halim Lim et al. / Trends in Food Science & Technology xx (2015) 1e13
pilot project (refer to Phase C: Initiation), provided there isa team member who is knowledgeable and experienced inimplementing SPC as depicted through the alternative routedepicted in Fig. 1.
A2. Awareness sessionsIt is crucial to build a positive impression with respect to
SPC adoption in the food company due to its characteristicsas type of industry with high resistance to change(Kafetzopoulos, Gotzamani, & Psomas, 2014). Thus, theobjectives of awareness sessions is to enable employeesand top management to become familiar with the funda-mentals of SPC and helps the senior management to under-stand what they are committing in the implementation ofSPC (Dalgic et al., 2011; Does & Trip, 1997; Gaafar &Keats, 1992; Grigg & Walls, 2007a; Luning & Marcelis,2006). The sessions should be able to cover the main phi-losophies and principles of SPC, which includes:
� Statistical thinking (recognise, quantify, reduce and con-trol process variation)
� Benefits of shifting from detection to preventionapproach.
� SPC is a means to move from fire fighting culture to pro-cess improvement.
Please cite this article in press as: Abdul Halim Lim, S., et al., Towards a conce
industry, Trends in Food Science & Technology (2015), http://dx.doi.org/10.10
� SPC requires changes of management style with respectto the delegation of tasks and employee empowerment.
� SPC is a technique used to establish process capabilities.� SPC is linked to business strategy under FQM.
Top management should be the first recipients of the ses-sion. Deming (2000) highlighted that management shouldnot only strongly commit to quality and productivity, butthat it should also understand and get a clear view ofwhat it is committing to (e.g. what they must do). Thesesessions should be cascaded down through a systematicSPC programme in the company (Hubbard, 2003). The em-ployees should be able to sense top management seriousintention towards the adoption of SPC (Kafetzopouloset al., 2014).
A3. Confirm top management commitmentTop management should take the initiative in identifying
the most appropriate area for the implementation of SPCthroughout the food organisation. Once this is done, itshould also obtain agreements from all parties involvedregarding the scope, objectives and requirement of SPC im-plementation and develop an employee led processimprovement (Hubbard, 2003; Montgomery, 2012; Paiva,2013). Based on a study on statistical thinking in thefood industry, (Grigg & Walls, 2007a; Kafetzopoulos
ptual roadmap for Statistical Process Control implementation in the food
16/j.tifs.2015.03.002
5S. Abdul Halim Lim et al. / Trends in Food Science & Technology xx (2015) 1e13
et al., 2014) suggested that top management in food com-panies should promote employee involvement and crea-tivity in quality improvement activities.
SPC trainingFood companies viewed SPC as being relatively com-
plex and too advanced technique. This has subsequentlyled to the resistance of its application in this industry(Dora et al., 2013; Grigg & Walls, 2007a). The objectivesof training programmes in the SPC implementation are(Cornou, Østergaard, Ancker, Nielsen, & Kristensen,2014; Grigg & Walls, 2007b; Kafetzopoulos et al., 2014;Luning & Marcelis, 2007; Martino & Polinori, 2011;Pena-Rodriguez, 2013).
� to increase awareness of SPC and its advantages� to reduce resistance to change� to maintain in-house expertise towards the SPC
implementation.� to support the sustainability of SPC implementation and
establishing a continuous learning culture in thecompany.
Hoerl (1995) argued that current training programmesmainly focus on the technique itself, neglecting the mana-gerial aspects, which often conflict with the implementa-tion. Level of SPC training in food companies should bedivided into three levels according to the participants’ levelof knowledge, in order to increase its effectiveness andreduce the use of resources (Kheradia & Warriner, 2013).A survey of employees in a food company will alwaysreveal special skills, knowledge, interests and motivationsof employees, and it could be use to enrich the role of em-ployees in the SPC implementation (Swamidass & Winch,2002). The most ineffective approach is to congest all infor-mation in one training session as explained by Gaafar andKeats (1992), however, to provide training in each stepalong the implementation will cost the company extratime and budget (Davis & Ryan, 2005; Mensah & Julien,2011). A suggested SPC training programme for the foodindustry is depicted in Table 2 (Dalgic et al., 2011;Hubbard, 2003; Krumwiede & Sheu, 1996; Martino &Polinori, 2011; R�abago-Remy, Padilla-Gasca, & Rangel-Peraza, 2014).
Although it is not much of a critical problem as it ap-pears on the surface, language/terms used to train technicalpersonnel who are required to collect and analyse data ishighly suggested to be appropriate with the level of em-ployees understanding (Hubbard, 2003).
Phase B: PreparationIt was noted from the first finding in the literature that
successful implementation requires careful preparation(Lim et al., 2014). Under the efforts of preparing for the im-plementation, four themes emerged from the literature,which are; establishing direction of the implementation,
Please cite this article in press as: Abdul Halim Lim, S., et al., Towards a conce
industry, Trends in Food Science & Technology (2015), http://dx.doi.org/10.10
the appointment of an SPC leader, establishing the SPCteam and planning for the implementation.
B1. Create a corporate SPC visionTop management needs to create and clearly communi-
cate the vision and mission statements for the implementa-tion of SPC. SPC should also view as a part of thecompany’s FQM system to improve food quality and main-tain food safety standards (Dora et al., 2013; Luning &Marcelis, 2007).
B2. Appoint SPC leader and SPC team establishmentTop management should choose an SPC leader who has
great passion for quality improvement and a sense of ur-gency for the initiation of SPC (Antony & Taner, 2003).Some of the reported team leader’s roles are:
� Chair team meetings� Issue the instructions required to complete the project.� Assign tasks to team members.� Maintain a continuous application of SPC
In the food industry, the employee competence level hasan effect on the SPC implementation success; hence, the se-lection of top talent team members, especially the leader iscrucial (Grigg & Walls, 2007a). The SPC leader shouldhave acquired several criteria such as a logical and analyt-ical mind, perseverance, project management skills andzeal in the use of SPC tools.
Team development depends on the size of the food com-pany (Hubbard, 2003). For example, small food companiesmay have a top management team (TMT) and an SPC im-plementation team (integration of SPC steering team andaction team), while large food organisations should ableto develop the team as indicated in Table 3. Table 3 depictsdifferent types of teams, team members and their respectivetasks (it is not compulsory to include all the team memberslisted in the Table 3) (Elg, Olsson, & Dahlgaard, 2008;Luning & Marcelis, 2007, 2009; Mensah & Julien, 2011;Watson, 1998).
Team members for the SPC team may be selected basedon the categories laid out in Table 3. Type of employee’sposition is not the only factor necessary to be consideredfor the SPC team selection, but it also includes individualroles (Meredith, 1997). According to Belbin’s Roles The-ory, regardless of the size of the team, nine team roles,namely; implementer, shaper, completer, co-ordinator,team worker, resource investigator, planner, monitor evalu-ator and SPC specialist should be assigned to the teammembers for the teamwork effectiveness (Batenburg &van Walbeek, 2013; George & George, 2003).
Although it also depends on the size of the company andthe complexity of the project, the SPC action team shouldconsist of a small number of people. It is considered thata small team will be able to facilitate the achievement ofconsensus decisions more effective (Hubbard, 2003). For
ptual roadmap for Statistical Process Control implementation in the food
16/j.tifs.2015.03.002
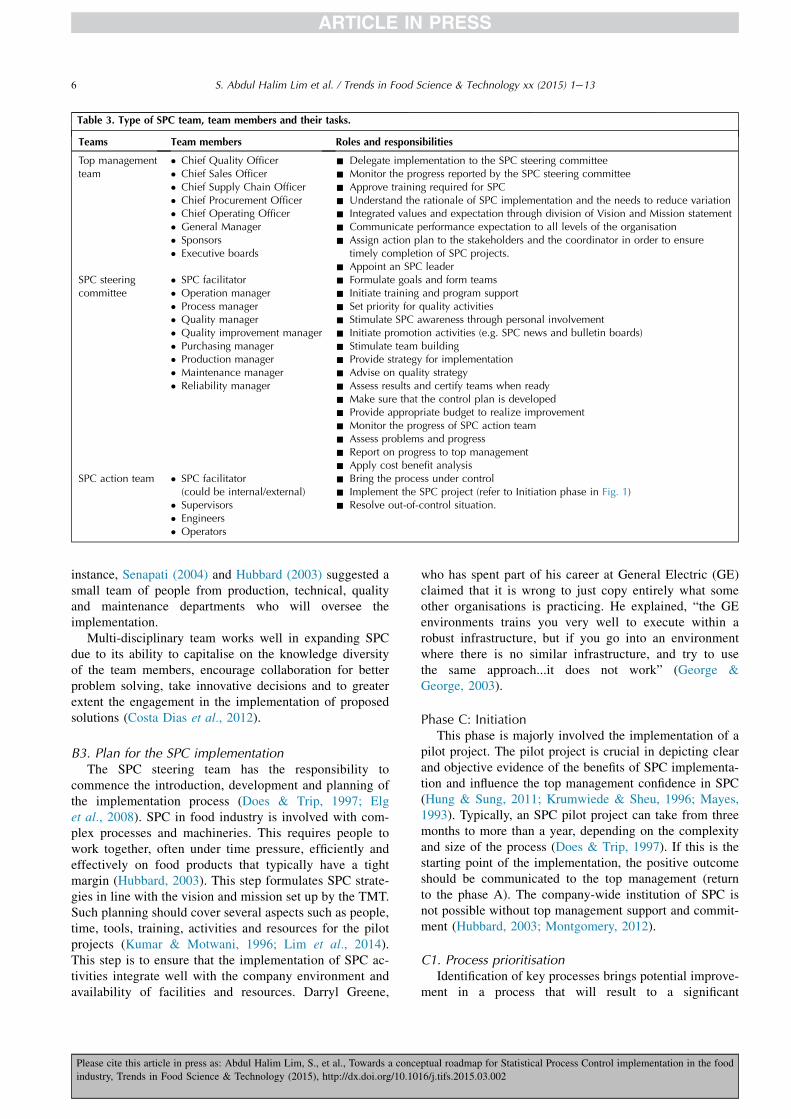
Table 3. Type of SPC team, team members and their tasks.
Teams Team members Roles and responsibilities
Top managementteam
� Chief Quality Officer� Chief Sales Officer� Chief Supply Chain Officer� Chief Procurement Officer� Chief Operating Officer� General Manager� Sponsors� Executive boards
- Delegate implementation to the SPC steering committee- Monitor the progress reported by the SPC steering committee- Approve training required for SPC- Understand the rationale of SPC implementation and the needs to reduce variation- Integrated values and expectation through division of Vision and Mission statement- Communicate performance expectation to all levels of the organisation- Assign action plan to the stakeholders and the coordinator in order to ensure
timely completion of SPC projects.- Appoint an SPC leader
SPC steeringcommittee
� SPC facilitator� Operation manager� Process manager� Quality manager� Quality improvement manager� Purchasing manager� Production manager� Maintenance manager� Reliability manager
- Formulate goals and form teams- Initiate training and program support- Set priority for quality activities- Stimulate SPC awareness through personal involvement- Initiate promotion activities (e.g. SPC news and bulletin boards)- Stimulate team building- Provide strategy for implementation- Advise on quality strategy- Assess results and certify teams when ready- Make sure that the control plan is developed- Provide appropriate budget to realize improvement- Monitor the progress of SPC action team- Assess problems and progress- Report on progress to top management- Apply cost benefit analysis
SPC action team � SPC facilitator(could be internal/external)
� Supervisors� Engineers� Operators
- Bring the process under control- Implement the SPC project (refer to Initiation phase in Fig. 1)- Resolve out-of-control situation.
6 S. Abdul Halim Lim et al. / Trends in Food Science & Technology xx (2015) 1e13
instance, Senapati (2004) and Hubbard (2003) suggested asmall team of people from production, technical, qualityand maintenance departments who will oversee theimplementation.
Multi-disciplinary team works well in expanding SPCdue to its ability to capitalise on the knowledge diversityof the team members, encourage collaboration for betterproblem solving, take innovative decisions and to greaterextent the engagement in the implementation of proposedsolutions (Costa Dias et al., 2012).
B3. Plan for the SPC implementationThe SPC steering team has the responsibility to
commence the introduction, development and planning ofthe implementation process (Does & Trip, 1997; Elget al., 2008). SPC in food industry is involved with com-plex processes and machineries. This requires people towork together, often under time pressure, efficiently andeffectively on food products that typically have a tightmargin (Hubbard, 2003). This step formulates SPC strate-gies in line with the vision and mission set up by the TMT.Such planning should cover several aspects such as people,time, tools, training, activities and resources for the pilotprojects (Kumar & Motwani, 1996; Lim et al., 2014).This step is to ensure that the implementation of SPC ac-tivities integrate well with the company environment andavailability of facilities and resources. Darryl Greene,
Please cite this article in press as: Abdul Halim Lim, S., et al., Towards a conce
industry, Trends in Food Science & Technology (2015), http://dx.doi.org/10.10
who has spent part of his career at General Electric (GE)claimed that it is wrong to just copy entirely what someother organisations is practicing. He explained, “the GEenvironments trains you very well to execute within arobust infrastructure, but if you go into an environmentwhere there is no similar infrastructure, and try to usethe same approach...it does not work” (George &George, 2003).
Phase C: InitiationThis phase is majorly involved the implementation of a
pilot project. The pilot project is crucial in depicting clearand objective evidence of the benefits of SPC implementa-tion and influence the top management confidence in SPC(Hung & Sung, 2011; Krumwiede & Sheu, 1996; Mayes,1993). Typically, an SPC pilot project can take from threemonths to more than a year, depending on the complexityand size of the process (Does & Trip, 1997). If this is thestarting point of the implementation, the positive outcomeshould be communicated to the top management (returnto the phase A). The company-wide institution of SPC isnot possible without top management support and commit-ment (Hubbard, 2003; Montgomery, 2012).
C1. Process prioritisationIdentification of key processes brings potential improve-
ment in a process that will result to a significant
ptual roadmap for Statistical Process Control implementation in the food
16/j.tifs.2015.03.002
7S. Abdul Halim Lim et al. / Trends in Food Science & Technology xx (2015) 1e13
breakthrough (Hung & Sung, 2011; Kovach & Cho, 2011;Mataragas, Drosinos, Tsola, & Zoiopoulos, 2012). Ideally,it would be good if SPC can be implemented in all key pro-cesses. Sources such as production reports, failure cost,customer complaints can help in identifying the problemareas and selecting one area on which to focus (Hung &Sung, 2011; R�abago-Remy et al., 2014). Although, prioriti-sation can be carried out by using Pareto analysis or othermethods such as those investigated by Kirkham et al.(2014), complex systems of food quality lead to processprioritisation based on multi-criteria decision analysis,such as Analytical Hierarchy Process (AHP) (Goh, Xie,& Xie, 1998; Luning & Marcelis, 2009). Therefore, processselection criteria must be developed and should be based onrealistic metrics that are easily or readily measurable. Thedefinition of the criteria should focus on the critical-to-quality, critical-to-cost, critical-to-delivery, and critical-to-responsiveness characteristics of the food company (Gohet al., 1998; Hubbard, 2003).
C2. Process descriptionIn this step, the selected process is assessed, described
and the project boundaries determined by the SPC team.In addition, relevant personnel are selected throughnumbering the process steps coherently according to itsreal situation (Cuevas, 2004; Dalgic et al., 2011; Elget al., 2008). Similar to HACCP guidelines, this step iscan be carried out by using process flowchart or processmapping (Knowles, Johnson, & Warwood, 2004; Mertenset al., 2009). In this step, some improvement opportunitiescan be detected by comparing different working methodsfrom different operators as well as information related tothe process (Does & Trip, 1997).
C3. Process synthesisThis step target of this step is to identify critical process
parameters. FQM faces difficulties with identifying and pri-oritising critical process parameters, chemical/microbi-ology hazards, and critical points (CPs) on scientific andquantitative basis (Luning & Marcelis, 2006). The usageof cause-and-effect analysis, design of experiment (DOE),multi-vari chart and Pareto analysis are valuable in thisstep (Hung & Sung, 2011; R�abago-Remy et al., 2014;Saini et al., 2011). For instance, after the team brainstormspossible critical process parameters, DOE is typicallyapplied to identify the significant parameters (Dalgicet al., 2011; Doganaksoy & Hahn, 2014; R�abago-Remyet al., 2014). Multi-vari chart is the best approach to iden-tify the different sources of process variability (shift-to-shift, lot-to-lot, machine-to-machine) (Doganaksoy &Hahn, 2014).
C4. Measurement System Analysis (MSA)The purpose of MSA studies is to measure the amount of
variability due to gauges used for measuring quality charac-teristics, to isolate the components of variability in the
Please cite this article in press as: Abdul Halim Lim, S., et al., Towards a conce
industry, Trends in Food Science & Technology (2015), http://dx.doi.org/10.10
measurement system, and to assess the capability of thegauge or instrument (Doganaksoy & Hahn, 2014;Montgomery, 2012). Luning and Marcelis (2009) and vander Spiegel et al., 2003 stated, that the main problem inFQM practices are poor of relevant monitoring systems,lack of proper equipment and use of wrong measuringequipment. Data is needed in food companies for criticalreasons including food safety, product quality, legalrequirement, customer service, cost control and actionablecost (Paiva, 2013; Whist et al., 2014).
In MSA, the application of Gauge Repeatability andReproducibility (GR&R) analysis views variability fromthe perspective of the machine and variability of peoplein using the machine itself, respectively (Doganaksoy &Hahn, 2014). Typically, food companies faced the issueof samples being altered or destroyed during testing, forthis reason, they cannot be retested. Hence, these com-panies have to consider using destructive GR&R experi-ments. Key inputs for the GR&R should be operators andmachines (Kovach & Cho, 2011). The company mayrequire re-calibrating the equipment/machines, preventivemaintenance, updating the latest model of manufacturingmachines and increasing the training of operators as correc-tive actions for incapable measurement system (Kovach &Cho, 2011; Srikaeo, Furst, & Ashton, 2005).
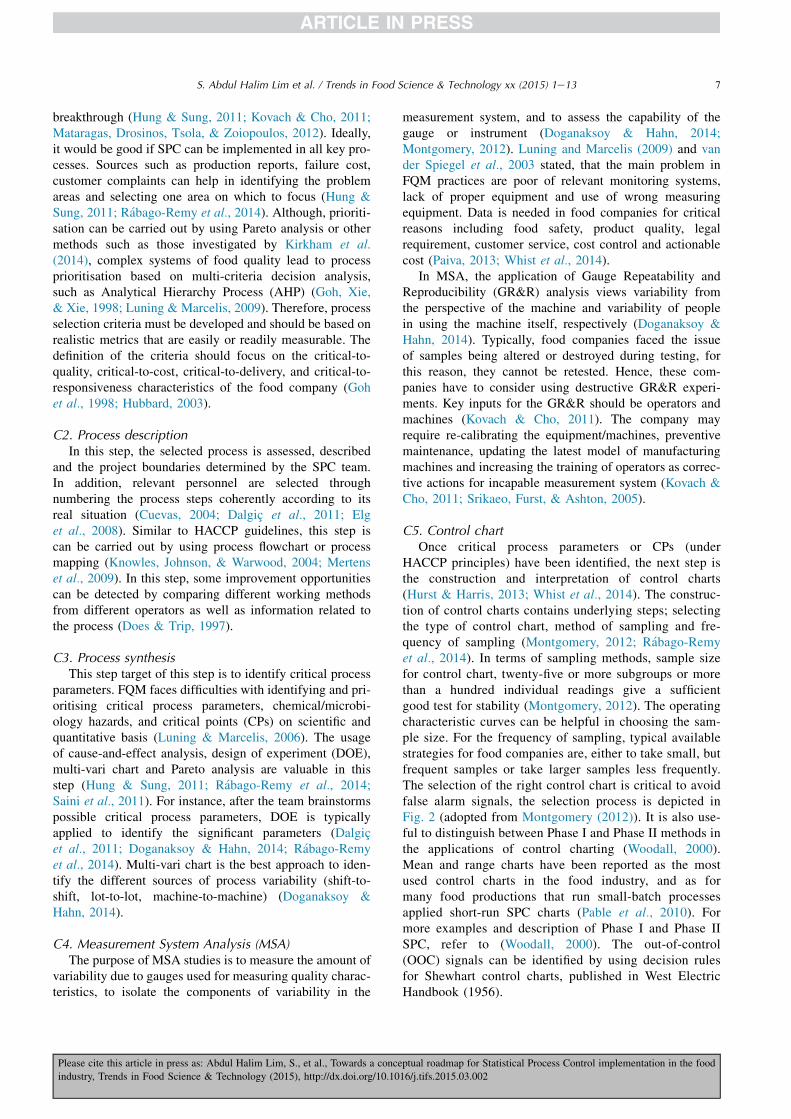
C5. Control chartOnce critical process parameters or CPs (under
HACCP principles) have been identified, the next step isthe construction and interpretation of control charts(Hurst & Harris, 2013; Whist et al., 2014). The construc-tion of control charts contains underlying steps; selectingthe type of control chart, method of sampling and fre-quency of sampling (Montgomery, 2012; R�abago-Remyet al., 2014). In terms of sampling methods, sample sizefor control chart, twenty-five or more subgroups or morethan a hundred individual readings give a sufficientgood test for stability (Montgomery, 2012). The operatingcharacteristic curves can be helpful in choosing the sam-ple size. For the frequency of sampling, typical availablestrategies for food companies are, either to take small, butfrequent samples or take larger samples less frequently.The selection of the right control chart is critical to avoidfalse alarm signals, the selection process is depicted inFig. 2 (adopted from Montgomery (2012)). It is also use-ful to distinguish between Phase I and Phase II methods inthe applications of control charting (Woodall, 2000).Mean and range charts have been reported as the mostused control charts in the food industry, and as formany food productions that run small-batch processesapplied short-run SPC charts (Pable et al., 2010). Formore examples and description of Phase I and Phase IISPC, refer to (Woodall, 2000). The out-of-control(OOC) signals can be identified by using decision rulesfor Shewhart control charts, published in West ElectricHandbook (1956).
ptual roadmap for Statistical Process Control implementation in the food
16/j.tifs.2015.03.002
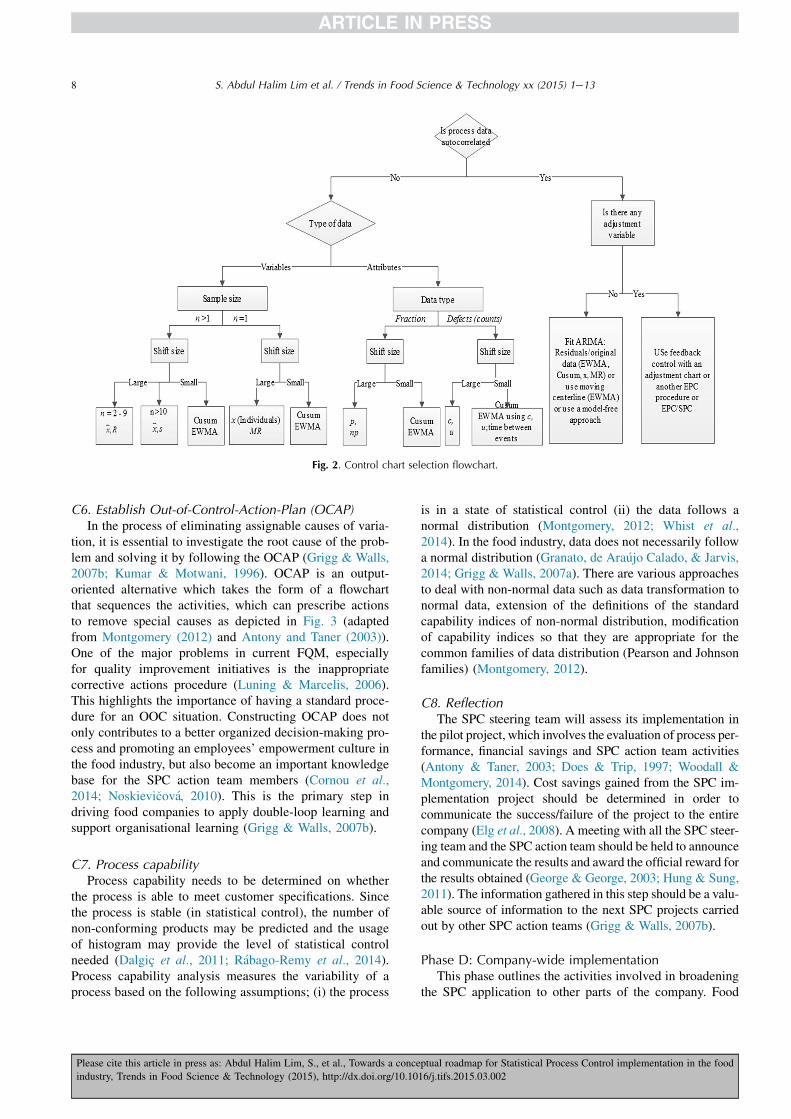
Fig. 2. Control chart selection flowchart.
8 S. Abdul Halim Lim et al. / Trends in Food Science & Technology xx (2015) 1e13
C6. Establish Out-of-Control-Action-Plan (OCAP)In the process of eliminating assignable causes of varia-
tion, it is essential to investigate the root cause of the prob-lem and solving it by following the OCAP (Grigg & Walls,2007b; Kumar & Motwani, 1996). OCAP is an output-oriented alternative which takes the form of a flowchartthat sequences the activities, which can prescribe actionsto remove special causes as depicted in Fig. 3 (adaptedfrom Montgomery (2012) and Antony and Taner (2003)).One of the major problems in current FQM, especiallyfor quality improvement initiatives is the inappropriatecorrective actions procedure (Luning & Marcelis, 2006).This highlights the importance of having a standard proce-dure for an OOC situation. Constructing OCAP does notonly contributes to a better organized decision-making pro-cess and promoting an employees’ empowerment culture inthe food industry, but also become an important knowledgebase for the SPC action team members (Cornou et al.,2014; Noskievi�cov�a, 2010). This is the primary step indriving food companies to apply double-loop learning andsupport organisational learning (Grigg & Walls, 2007b).
C7. Process capabilityProcess capability needs to be determined on whether
the process is able to meet customer specifications. Sincethe process is stable (in statistical control), the number ofnon-conforming products may be predicted and the usageof histogram may provide the level of statistical controlneeded (Dalgic et al., 2011; R�abago-Remy et al., 2014).Process capability analysis measures the variability of aprocess based on the following assumptions; (i) the process
Please cite this article in press as: Abdul Halim Lim, S., et al., Towards a conce
industry, Trends in Food Science & Technology (2015), http://dx.doi.org/10.10
is in a state of statistical control (ii) the data follows anormal distribution (Montgomery, 2012; Whist et al.,2014). In the food industry, data does not necessarily followa normal distribution (Granato, de Ara�ujo Calado, & Jarvis,2014; Grigg & Walls, 2007a). There are various approachesto deal with non-normal data such as data transformation tonormal data, extension of the definitions of the standardcapability indices of non-normal distribution, modificationof capability indices so that they are appropriate for thecommon families of data distribution (Pearson and Johnsonfamilies) (Montgomery, 2012).
C8. ReflectionThe SPC steering team will assess its implementation in
the pilot project, which involves the evaluation of process per-formance, financial savings and SPC action team activities(Antony & Taner, 2003; Does & Trip, 1997; Woodall &Montgomery, 2014). Cost savings gained from the SPC im-plementation project should be determined in order tocommunicate the success/failure of the project to the entirecompany (Elg et al., 2008). A meeting with all the SPC steer-ing team and the SPC action team should be held to announceand communicate the results and award the official reward forthe results obtained (George & George, 2003; Hung & Sung,2011). The information gathered in this step should be a valu-able source of information to the next SPC projects carriedout by other SPC action teams (Grigg & Walls, 2007b).
Phase D: Company-wide implementationThis phase outlines the activities involved in broadening
the SPC application to other parts of the company. Food
ptual roadmap for Statistical Process Control implementation in the food
16/j.tifs.2015.03.002
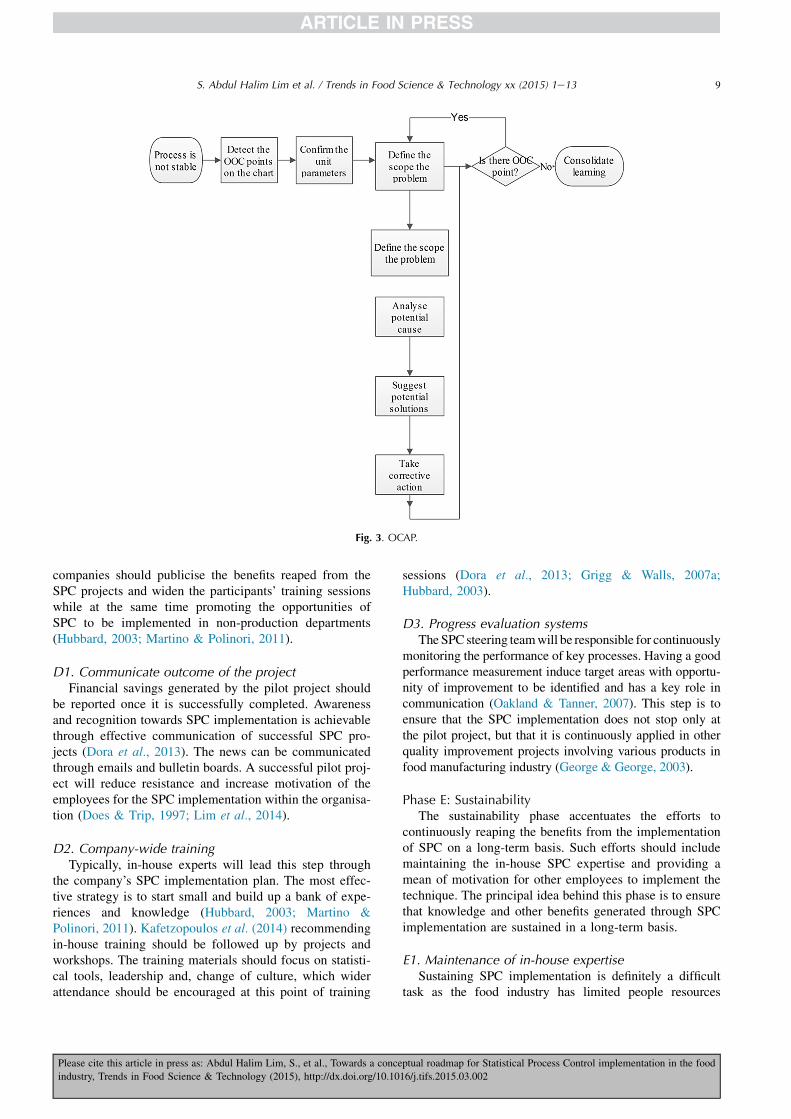
Fig. 3. OCAP.
9S. Abdul Halim Lim et al. / Trends in Food Science & Technology xx (2015) 1e13
companies should publicise the benefits reaped from theSPC projects and widen the participants’ training sessionswhile at the same time promoting the opportunities ofSPC to be implemented in non-production departments(Hubbard, 2003; Martino & Polinori, 2011).
D1. Communicate outcome of the projectFinancial savings generated by the pilot project should
be reported once it is successfully completed. Awarenessand recognition towards SPC implementation is achievablethrough effective communication of successful SPC pro-jects (Dora et al., 2013). The news can be communicatedthrough emails and bulletin boards. A successful pilot proj-ect will reduce resistance and increase motivation of theemployees for the SPC implementation within the organisa-tion (Does & Trip, 1997; Lim et al., 2014).
D2. Company-wide trainingTypically, in-house experts will lead this step through
the company’s SPC implementation plan. The most effec-tive strategy is to start small and build up a bank of expe-riences and knowledge (Hubbard, 2003; Martino &Polinori, 2011). Kafetzopoulos et al. (2014) recommendingin-house training should be followed up by projects andworkshops. The training materials should focus on statisti-cal tools, leadership and, change of culture, which widerattendance should be encouraged at this point of training
Please cite this article in press as: Abdul Halim Lim, S., et al., Towards a conce
industry, Trends in Food Science & Technology (2015), http://dx.doi.org/10.10
sessions (Dora et al., 2013; Grigg & Walls, 2007a;Hubbard, 2003).
D3. Progress evaluation systemsTheSPC steering teamwill be responsible for continuously
monitoring the performance of key processes. Having a goodperformance measurement induce target areas with opportu-nity of improvement to be identified and has a key role incommunication (Oakland & Tanner, 2007). This step is toensure that the SPC implementation does not stop only atthe pilot project, but that it is continuously applied in otherquality improvement projects involving various products infood manufacturing industry (George & George, 2003).
Phase E: SustainabilityThe sustainability phase accentuates the efforts to
continuously reaping the benefits from the implementationof SPC on a long-term basis. Such efforts should includemaintaining the in-house SPC expertise and providing amean of motivation for other employees to implement thetechnique. The principal idea behind this phase is to ensurethat knowledge and other benefits generated through SPCimplementation are sustained in a long-term basis.
E1. Maintenance of in-house expertiseSustaining SPC implementation is definitely a difficult
task as the food industry has limited people resources
ptual roadmap for Statistical Process Control implementation in the food
16/j.tifs.2015.03.002

10 S. Abdul Halim Lim et al. / Trends in Food Science & Technology xx (2015) 1e13
expertise in statistical knowledge and rapid employees’changeover (Davis & Ryan, 2005; Grigg & Walls, 2007a).In SPC implementation, it is imperative to make sure knowl-edge transfer within the organisation is actively progressingin order to increase the number of in-house expertise (Davis& Ryan, 2005). Continuous awareness training sessions andworkshops can help the company to achieve such objective(Hubbard, 2003; Kheradia & Warriner, 2013).
E2. Towards a learning organisationSenge (2014) posits that the notion of organisational
learning is through systems thinking, team learning, sharedvision, individual mastery and the use of highly sophisti-cated mental models. Learning organisation depicts charac-teristics such as: open communication without fear orcriticism, learning through teamwork, employees empower-ment for making decisions, action and result focus andwide learning opportunities (Luning & Marcelis, 2006;Senge, 2014). A regular review session should be estab-lished monthly for on-going projects, while the past perfor-mance tendency should be subsequently updated togetherwith revised strategies (Martino & Polinori, 2011). Bench-marking and learning from best-practice of internal andexternal competitors will continuously keep the companyin a momentum for continuous improvement. Grigg andWalls (2007b) highlight the opportunity for food
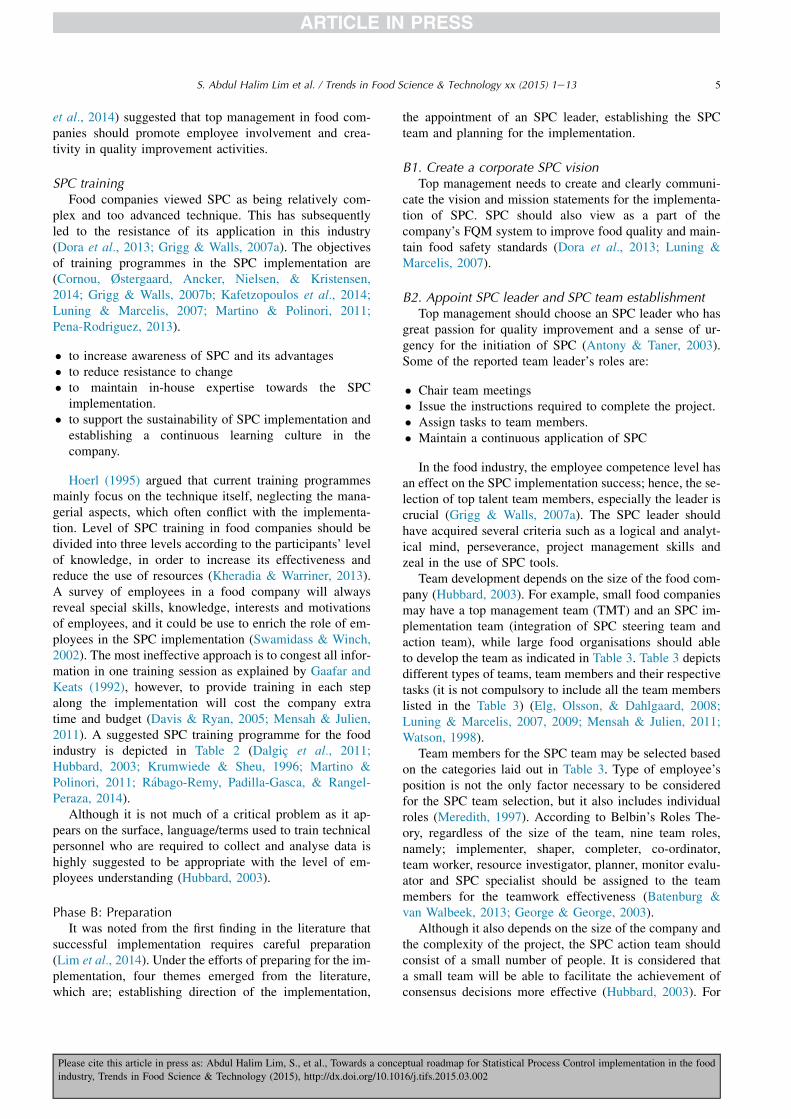
Fig. 4. Critical ingredients of SPC impl
Please cite this article in press as: Abdul Halim Lim, S., et al., Towards a conce
industry, Trends in Food Science & Technology (2015), http://dx.doi.org/10.10
organisations to become “double loop learners” towardsachieving organisational learning. SPC implementationcharacterises double loop learning by questioning the ade-quacy of data in terms of reflecting the true variation of aprocess, its governing variables and the appropriatenessof corrective actions taken in response to the chart data.Many researchers believe that the benefits of learning orga-nisation for the food companies are that learning becamemainstream activity, constant learning leads to continualchange and learning facilitates response to change (Grigg& Walls, 2007b; Martino & Polinori, 2011).
E3. Reward systemReward system should be designed to appreciate and
motivate the employees to display their commitment toquality and seek opportunities to be involved in the imple-mentation of SPC, as well as to attract and maintain peoplewith knowledge and expertise (Hung & Sung, 2011). Withan effective reward system, they will show the skills andabilities needed to achieve the company’s strategic goalto create a better process performance and subsequently su-perior organisation (Antony & Taner, 2003). One of thefailure causes in deploying and sustaining SPC is that themanagement has ignored the fact that the deployment ofSPC can lead to unintentional improvements in intrinsicreward (Scott, Wilcock, & Kanetkar, 2009).
ementation in the food industry.
ptual roadmap for Statistical Process Control implementation in the food
16/j.tifs.2015.03.002
11S. Abdul Halim Lim et al. / Trends in Food Science & Technology xx (2015) 1e13
The SPC conceptual roadmap above would be able toguide a successful SPC implementation specifically in thefood industry. In order for the SPC implementation road-map to the effectively implement it, the authors wouldrecommend the following ingredients listed in Fig. 4 tofacilitate the implementation in the food industry (Grigg& Walls, 2007a; Kafetzopoulos et al., 2014; Kheradia &Warriner, 2013; Kumar & Motwani, 1996; Lim et al.,2014; Montgomery, 2012; Noskievi�cov�a, 2010; Paiva,2013; Woodall & Montgomery, 2014).
� Teamwork skills include the appointment of an SPCleader and establishment of SPC teams for planningand carrying out OOC feedback activities, brainstormingfor decision making activities, companywide under-standing of SPC (benefits and awards).
� Management commitment includes providing adequateresources for implementation, investing in people andfinancial resources, assigning a higher priority to qualityover cost or schedule, making quality part of employees’performance and providing rewards and recognition tothe deserving employees.
� Organisational culture includes employees’ understand-ing of statistical thinking, efforts and priorities for thecontinuous improvement, employee’s empowermentand involvement in continuous improvement activitiesas well as communication and interdepartmental liaisonroles.
� Statistical knowledge includes data collection and sam-pling plans, selection and interpretation of controlcharts, statistical stability and capability.
� Engineering skills includes process prioritisation, mea-surement system analysis, identification of critical pro-cess parameters and activities taken for the OCsituations.
� Training includes continuous training and education,provide skills and team-based training, introduction ofSPC software packages.
Conclusions and future research agendaSPC is viewed as a powerful technique under FQM
through quality control and quality improvement activities.However, literature suggests that its implementation in thefood industry is still low compared to other quality controltools and technique as a tailored and effective roadmap,which addresses critical and specific issues of SPC imple-mentation in this industry does not exist. The SPC imple-mentation in the food industry has been found to differ inmany areas of its CSFs and challenges compared to otherindustries. On the basis of previous critical reviews, six crit-ical components (management commitment, training, sta-tistical knowledge, engineering skills, teamwork,organisational culture) were found relevant to facilitatethe SPC implementation in the food industry. To overcomethe limitations of the existing roadmaps towards SPC im-plementation in the food industry, this article has proposed
Please cite this article in press as: Abdul Halim Lim, S., et al., Towards a conce
industry, Trends in Food Science & Technology (2015), http://dx.doi.org/10.10
a conceptual SPC implementation roadmap developed fromthe literature of SPC implementation and food industry.
This conceptual roadmap is presented as a guideline fora successful SPC implementation in the food industry, andit reflects the general movement of food manufacturingpractices from quality control and assurance to continuouslearning and quality improvement. The proposed fivephases (awareness, preparedness, initiation, institutionalisa-tion and sustainability) SPC implementation roadmap willfacilitate the food manufacturing companies to apply SPCin a systematic manner for the successful deployment andsustainability of SPC technique. Although this roadmaphighlighted the 12-steps pilot project roadmap, the authorswould like to accentuate that sustainability of SPC is fairlychallenging to most of food companies, which necessitate afurther research on such topic.
A limitation of this study is that the implementation ofSPC was only considered within the context of foodmanufacturing and processing as it ignored the food serviceaspect. In addition, the conceptual framework for the im-plementation of SPC presented in this paper has been pro-posed in an anecdotal form resulting from an extensiveliterature research into the deployment of SPC in the foodsector and the industrial experience of these authors.Thus, the proposed framework still evokes extension theauthors stress its validation, and the exploitation of allpossible tools guided in the tooling of the implementation.
References
Antony, J., & Taner, T. (2003). A conceptual framework for theeffective implementation of statistical process control. BusinessProcess Management Journal, 9(4), 473e489.
Batenburg, R., & van Walbeek, W. (2013). Belbin role diversity andteam performance: is there a relationship? Journal of ManagementDevelopment, 32(8), 901e913.
Cornou, C., Østergaard, S., Ancker, M.-L., Nielsen, J., &Kristensen, A. R. (2014). Dynamic monitoring of reproductionrecords for dairy cattle. Computers and Electronics in Agriculture,109, 191e194.
Costa Dias, M. A., Sant’Ana, A. S., Cruz, A. G., Faria, J. D. A. F.,Fernandes de Oliveira, C. A., & Bona, E. (2012). On theimplementation of good manufacturing practices in a smallprocessing unity of mozzarella cheese in Brazil. Food Control,24(1), 199e205.
Cuevas, R. (2004). Food engineering, quality and competitiveness insmall food industry systems with emphasis on Latin America andthe Caribbean. Rome: Agricultural Services Bulletin.
Dalgic, A. C., Vardin, H., & Beliba€A€Yli, K. (2011). Improvement offood safety and quality by Statistical Process Control (SPC) in foodprocessing systems: a case study of Traditional Sucuk (Sausage). InY. Shoyama (Ed.), Processing, quality control of herbal medicinesand related areas (pp. 978). InTech, 953.
Davis, J., & Ryan, M. (2005). Training in the SME sector of the foodand drink manufacturing industries (pp. 38e42). ManagementServices, Spring.
Deming, W. (2000). Out of the crisis. Cambridge: MassachusettsInstitute of Technology Press: MIT Press (Chapter 1).
Does, R., & Trip, A. (1997). A framework for implementation ofstatistical process control. International Journal of Quality Science,2(4), 181e198.
ptual roadmap for Statistical Process Control implementation in the food
16/j.tifs.2015.03.002
12 S. Abdul Halim Lim et al. / Trends in Food Science & Technology xx (2015) 1e13
Doganaksoy, N., & Hahn, G. J. (2014). Improving a manufacturingprocess using data-based methods. Quality and ReliabilityEngineering International, 30(3), 427e435.
Dora, M., Kumar, M., Van Goubergen, D., Molnar, A., &Gellynck, X. (2013). Food quality management system: reviewingassessment strategies and a feasibility study for European foodsmall and medium-sized enterprises. Food Control, 31(2),607e616.
Dora, M., Van Goubergen, D., Kumar, M., Molnar, A., & Gellynck, X.(2014). Application of lean practices in small and medium-sizedfood enterprises. British Food Journal, 116(1), 125e141.
DTI. (1979). Code of guidance for packers and importers. London:HMSO.
Elg, M., Olsson, J., & Dahlgaard, J. J. (2008). Implementingstatistical process control: an organizational perspective.International Journal of Quality & Reliability Management,25(6), 545e560.
Gaafar, L. K., & Keats, J. B. (1992). Statistical process control: a guidefor implementation. International Journal of Quality & ReliabilityManagement, 9(4), 9e20.
George, M. L., & George, M. (2003). Lean six sigma for service. NewYork: McGraw-Hill.
Goh, T. N., Xie, M., & Xie, W. (1998). Prioritizing processes in initialimplementation of statistical process control. IEEE Transactions onEngineering Management, 45(1), 66e72.
Granato, D., de Ara�ujo Calado, V. M., & Jarvis, B. (2014).Observations on the use of statistical methods in foodscience and technology. Food Research International, 55,137e149.
Grigg, N. P. (1998). Statistical process control in UK food production:an overview. International Journal of Quality & ReliabilityManagement, 15(2), 223e238.
Grigg, N. P., & Walls, L. (2007a). Developing statistical thinkingfor performance improvement in the food industry.International Journal of Quality & Reliability Management,24(4), 347e369.
Grigg, N. P., & Walls, L. (2007b). The role of control charts inpromoting organisational learning: new perspectives from a foodindustry study. The TQM Magazine, 19(1), 37e49.
Grunert, K. G. (2005). Food quality and safety: consumer perceptionand demand. European Review of Agricultural Economics, 32(3),369e391.
Higgins, K. T. (2003). Technology update: food processing & SPC.Food Engineering Magazine, 1, 1e2.
Hoerl, R. (1995). Enhancing the bottom-line impact of statisticalmethods. Quality Management Journal, 15(2), 7e18.
Hubbard, M. R. (2003). Statistical quality control for food industry(3rd ed.). New York: Kluwer Academic/Plenum Publishers.
Hung, H.-C., & Sung, M.-H. (2011). Applying six sigma tomanufacturing processes in the food industry to reduce qualitycost. Practice, 6, 580e591.
Hurst, W., & Harris, L. (2013). Integrating Hazard Analysis CriticalControl Point (HACCP) and Statistical Process Control (SPC) forsafer nut processing. Improving the safety and quality of nuts (pp.119e147).
Kafetzopoulos, D. P., Gotzamani, K. D., & Psomas, E. L. (2014). Theimpact of employees’ attributes on the quality of food products.International Journal of Quality & Reliability Management, 31(5),500e521.
Kheradia, A., & Warriner, K. (2013). Understanding the food safetymodernization act and the role of quality practitioners in themanagement of food safety and quality systems. The TQM Journal,25(4), 347e370.
Kirkham, L., Garza-Reyes, J. A., Kumar, V., & Antony, J. (2014).Prioritisation of operations improvement projects in the Europeanmanufacturing industry. International Journal of ProductionResearch, 52(18), 5323e5345.
Please cite this article in press as: Abdul Halim Lim, S., et al., Towards a conce
industry, Trends in Food Science & Technology (2015), http://dx.doi.org/10.10
Knowles, G., Johnson, M., & Warwood, S. (2004). Medicated sweetvariability: a six sigma application at a UK food manufacturer. TheTQM Magazine, 16, 284e292.
Kovach, T., & Cho, R. (2011). Better processes make good eats thefood industry can benefit from lean Six Sigma principles. IndustrialEngineer, 43(1), 36.
Krumwiede, D., & Sheu, C. (1996). Implementing SPC in a smallorganization: a TQM approach. Integrated ManufacturingSystems, 7, 45e51.
Kumar, A., & Motwani, J. (1996). Doing it right the second time.Industrial Management & Data Systems, 96, 14e19.
Lim, S. A. H., Antony, J., & Albliwi, S. (2014). Statistical Process Control(SPC) in the food industryeA systematic review and future researchagenda. Trends in Food Science & Technology, 37(2), 137e151.
Luning, P. a, & Marcelis, W. J. (2006). A techno-managerial approachin food quality management research. Trends in Food Science &Technology, 17(7), 378e385.
Luning, P. a, & Marcelis, W. J. (2007). A conceptual model of foodquality management functions based on a techno-managerialapproach. Trends in Food Science & Technology, 18(3), 159e166.
Luning, P. A., & Marcelis, W. J. (2009). A food quality managementresearch methodology integrating technological and managerialtheories. Trends in food science & technology, 20(1), 35e44.
Martino, G., & Polinori, P. (2011). Networks and organisationallearning: evidence from broiler production. British Food Journal,113(7), 871e885.
Mataragas, M., Drosinos, E. H., Tsola, E., & Zoiopoulos, P. E. (2012).Integrating statistical process control to monitor and improvecarcasses quality in a poultry slaughterhouse implementing aHACCP system. Food Control, 28, 205e211.
Mayes, T. (1993). The application of management systems to foodsafety and quality. Trends in Food Science & Technology, 4(7),216e219.
Mensah, L. D., & Julien, D. (2011). Implementation of food safetymanagement systems in the UK. Food Control, 22(8), 1216e1225.
Meredith, B. (1997). Management teams: Why they succeed or fail.Butterworth-Heinemann.
Mertens, K., L€offel, J., Kemps, B., Kamers, B., Zoons, J., Darius, P.,et al. (2009). An intelligent control chart for monitoring ofautocorrelated egg production process data based on a synergisticcontrol strategy. Computers and Electronics in Agriculture, 69(1),100e111.
Montgomery, D. C. (2012). Introduction to statistical quality control.New York: John Wiley & Sons.
Noskievicova, D. (2010). Effective implementation of statisticalprocess control. In D. Laszlo (Ed.), Engineering the future (pp.217e240). Shanghai: InTech.
Oakland, J., & Tanner, S. (2007). A new framework for managingchange. The TQM Magazine, 19(6), 572e589.
Pable, A., Lu, S., & Auerbach, J. (2010). Integrated qualitative/quantitative techniques for food product quality planning. Journalof Food Quality, 33(1), 112e129.
Paiva, C. L. (2013). Quality management: important aspects for thefood industry. In I. Muzzalupo (Ed.), Food industry. Rijeka: InTech.
Pena-Rodriguez, M. E. (2013). Statistical process control for the FDA-regulated industry. ASQ Quality Press.
R�abago-Remy, D., Padilla-Gasca, E., & Rangel-Peraza, J. (2014).Statistical quality control and process capability analysis forvariability reduction of the tomato paste filling process. IndustrialEngineering Manage, 3(4), 1e7.
Rogers, E. (1995). Diffusion of innovations (5th ed.). New york: Simon& Schuster, Inc.
Saini, P. K., Marks, H. M., Dreyfuss, M. S., Evans, P., Cook, L. V., &Dessai, U. (2011). Indicator organisms in meat and poultryslaughter operations: their potential use in process control and therole of emerging technologies. Journal of Food Protection, 74(8),1387e1394.
ptual roadmap for Statistical Process Control implementation in the food
16/j.tifs.2015.03.002
13S. Abdul Halim Lim et al. / Trends in Food Science & Technology xx (2015) 1e13
Scott, B. S., Wilcock, A. E., & Kanetkar, V. (2009). A survey ofstructured continuous improvement programs in the Canadianfood sector. Food Control, 20(3), 209e217.
Senapati, R. N. (2004). Six Sigma: myths and realities. InternationalJournal of Quality & Reliability Management, 21(6), 683e690.
Senge, P. M. (2014). The dance of change: The challenges tosustaining momentum in a learning organization (2nd ed.). NewYork: Random House, Inc.
van der Spiegel, M., Luning, P. a, Ziggers, G. W., & Jongen, W. M. F.(2003). Towards a conceptual model to measure effectiveness offood quality systems. Trends in Food Science & Technology,14(10), 424e431.
Srikaeo, K., Furst, J. E., & Ashton, J. (2005). Characterization of wheat-based biscuit cooking process by statistical process controltechniques. Food Control, 16(4), 8.
Swamidass, P. M., & Winch, G. W. (2002). Exploratory study of theadoption of manufacturing technology innovations in the USA andthe UK. International Journal of Production Research, 40,2677e2703.
Please cite this article in press as: Abdul Halim Lim, S., et al., Towards a conce
industry, Trends in Food Science & Technology (2015), http://dx.doi.org/10.10
Watson, R. M. (1998). Implementing self-managed processimprovement teams in a continuous improvement environment.The TQM Magazine, 10(4), 246e257.
Whist, A., Liland, K., Jonsson, M., Sæbø, S., Sviland, S., Øster�as, O.,et al. (2014). Designing a risk-based surveillance program forMycobacterium avium ssp. paratuberculosis in Norwegian dairyherds using multivariate statistical process control analysis. Journalof Dairy Science, 97(11), 6835e6849.
Woodall, W. H. (2000). Controversies and contradictions instatistical process control. Journal of Quality Technology, 32(4),341e350.
Woodall, W. H., & Montgomery, D. C. (2014). Some currentdirections in the theory and application of statistical processmonitoring. Journal of Quality Technology, 46(1).
Yusof, S. M., & Aspinwall, E. (2000). A conceptual framework forTQM implementation for SMEs. The TQM magazine, 12(1),31e37.
ptual roadmap for Statistical Process Control implementation in the food
16/j.tifs.2015.03.002