concept map presentation tool (cmpt) - asee-se home
TRANSCRIPT
2009 ASEE Southeast Section Conference
Concept Map Presentation Tool (CMPT): Teaching Wireless Communications using Concept Maps
Rasha Morsi1 Wael Ibrahim2 Edward Jackson1
Abstract – Engineering education and its reach beyond the traditional classroom setting has dictated the need for new forms of content development and presentation. The need for interactive environments that teach as well as “entertain” has become the heart of recent engineering education research. Prevalent concerns for educators usually encompass student learning and mastery. The variations in student’s abilities and perceptions often impede learning if they are not taken into consideration when planning curriculum and pedagogy. This paper presents the ‘Concept Map Presentation Tool (CMPT)’ developed through an NSF funded research project (DUE-0501781). The paper also reports on an Introduction to Wireless Communications course developed using CMPT and offered as a technical elective in the department of Engineering at Norfolk State University. A detailed description of the tool and capabilities are presented. The wireless communication course concept maps are presented and discussed.
Keywords: Concept Maps, Wireless Communications, Action Script, Flash presentations.
INTRODUCTION
Concept maps have been used extensively across multiple engineering disciplines and are considered to be a useful tool for active learning as well as for learning assessment and evaluation. The graphical and process based nature of concept maps is thought to complement engineering education due to the belief that engineers are predominantly visual learners. In the past, concept maps have been used in Mechanical, Chemical, and Computer Engineering. This work investigates their use in Electrical Engineering.
The ability to present students with an aggregate view of the topic taught and maintain at the same time the interrelationship of key areas is critical to a better understanding and student engagement. The ‘Concept Map Presentation Tool (CMPT)’ presents such a means. An aggregate view of main concepts conjoined with propositions lay down the map to better understand the ‘big picture’. Faculty have the ability to embed within the ‘map nodes’ their drill down learning resources, e. g., presentations, assignments, media files, etc. The structure of the map and ‘location tracking’ enables students to explore different concepts while maintaining awareness of the inter-relationship between those concepts. With the wide variety of embedded learning resources, the tool can target different learning styles and provide a valuable aesthetically engaging resource for content development and delivery.
Background Concept maps, or mind maps, as they are sometimes referred to, have been widely used in education. Mechanical, Chemical, and Computer Engineering disciplines have used concept maps as a learning tool. Previous work addressed the use of concept maps in a sophomore multidisciplinary engineering course at MIT to evaluate students’ conceptual understanding of aerodynamics [Ibrahim,2]. Research has also shown how concept maps can be used as an evaluation tool for the Mechanical Engineering curriculum as a whole and for courses within. An emphasis is placed on effective concept maps where different knowledge domains-novice and expert- exist [Ibrahim, 2].
1 Norfolk State University, Virginia; Email: [email protected], [email protected] 2 ECPI College of Technology, Virginia; Email: [email protected]
2009 ASEE Southeast Section Conference
Several software tools exist for creating concept maps. The most prominent of all, is the one developed by the Institute for Human & Machine Cognition, IHMC [IHMC, 3]. The CmapTools program was initially used by the authors to create the concept maps to be developed in the CMPT tool. Adobe Flash 8.0 (formerly Macromedia Flash) [Adobe, 1] was chosen to implement CMPT because of its immediate availability, customizability, and widely distributable nature. A viewer for CMPT can be acquired for free from Adobe’s website. This “Flash Viewer” has been compiled for use on IBM PC compatibles and Apple Macintosh computers, as well as Personal Digital Assistants (PDAs) and Smart Phones. This has made Flash particularly desirable in that it can be distributed across virtually any medium. Flash 8.0 Flash 8.0 [Adobe, 1] is a two-dimensional graphics creation and animation tool. On the surface, flash is a layer-supporting graphics solution that builds animation through the use of frames along a timeline. Timelines delegate a scene’s sequence of events, where Flash supports unlimited (file size dependent) scenes that can be called upon within the final movie. The Stage is the canvas on which all items are placed. Its functionality is based on the use of objects, which can be created from within the program or imported from an outside source. Objects are defined as ‘drawing objects’ or ‘symbols’ were:
‘symbols’ consist of ‘graphics’, ‘movie clips’ and ‘buttons’ and are stored in the library, which is essentially a file and folder repository that is transported along with the Flash project.
‘drawing objects’ are pictures that are created on a specific frame. To create a replica, the user must repeat the same steps and redraw it.
‘Drawing objects’ can be converted into graphics, and in turn stored in the library. Once in the library, a ‘symbol’ can be placed on the ‘stage’ in any frame, and scaled to any size. All instances of a symbol in an entire project retain the properties of the original object stored in the library. This is particularly useful in that making one modification to the symbol (in the library) automatically filters through to every instance.
Following is a basic explanation of key terminology and functionality in Flash: Frames Frames are designated as either empty, populated, or keyframes. Empty frames do not contain any graphics, whereas populated ones do. Keyframes have a more advanced functionality where they are used to perform the most basic animation techniques. At specific points along the timeline, keyframes delineate changes in the state of an object. Animation in Flash Animation in Flash occurs through tweening. Tweening automatically interpolates the movement of objects (in each frame) between keyframes. For example, a simple square can be defined as a keyframe at frame 1 in the timeline. Frame 30 can be set as another keyframe with the same square object. However, in this keyframe, the square has a 180° rotation, essentially altering the state of the object. When the tweening feature is executed between the two keyframes, Flash automatically applies a progressive 6° rotation in frames 2 through 29. When the movie is played from beginning to end, the tweening has effectively created a smooth transition of the square object rotating 180° over time. Movie Clips A movie clip is a timeline-driven object with an animation that will play continuously when placed in a frame. It utilizes the same core elements for animation as previously described. Its uses vary, but an example would be a rotating globe, or color-cycling logo arbitrarily placed in a scene. Buttons A button is a four-framed movie clip, where each frame has a specific function. Instead of the usual sequential numbering that identifies columns in a regular timeline, these columns are entitled Up, Over, Down, and Hit. The Up frame shows how the button appears without any user interaction. Over identifies the look of the button while the
2009 ASEE Southeast Section Conference
mouse hovers over and Down indicates the button’s appearance while being clicked. Hit determines the area that will activate the button. Flash ActionScript At the heart of Flash is ActionScript (AS), the object-oriented programming language backbone that gives Flash developers the ability to create custom interfaces, dynamic graphics, and execute more advanced animation techniques. For CMPT, all animations were implemented using AS.
CONCEPT MAPS PRESENTATION TOOL (CMPT) Development of a concept map presentation tool using Adobe Flash 8.0 (formerly Macromedia Flash) [Adobe, 1] was the main outcome of the work undertaken. The choice of Flash as the implementation platform was due to its wide availability to users. The NSF funded project targeted both 2 year and 4 year college students in the wireless communications field. CMPT was designed and developed and a Wireless Communications concept map set was developed and used to show the desired functionality of the tool. CMPT Design CMPT utilizes a dual-mode delivery method. The first mode is a file tab structure where the learner can navigate from the main concept map to sub-concepts. The second mode is a directory structure style layout of all concepts in the concept map. The three key development components of CMPT are visual, architectural, and the user interface that provides interaction between them. In this application, the visual component requires a software package that generates two-dimensional static imaging, as well as animation. The architectural component describes the back-end, or inner workings of the application, controlling the user interaction. Finally, the user interface is an integral component because of its importance in ensuring seamless navigation throughout the tool.
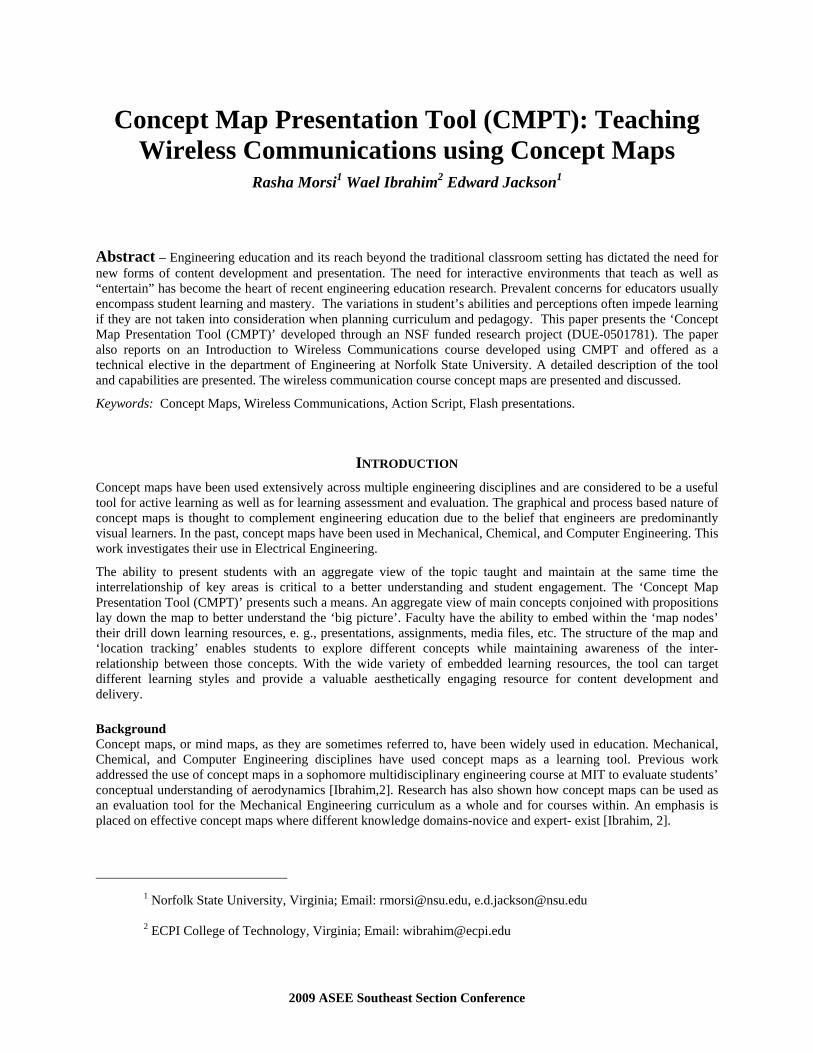
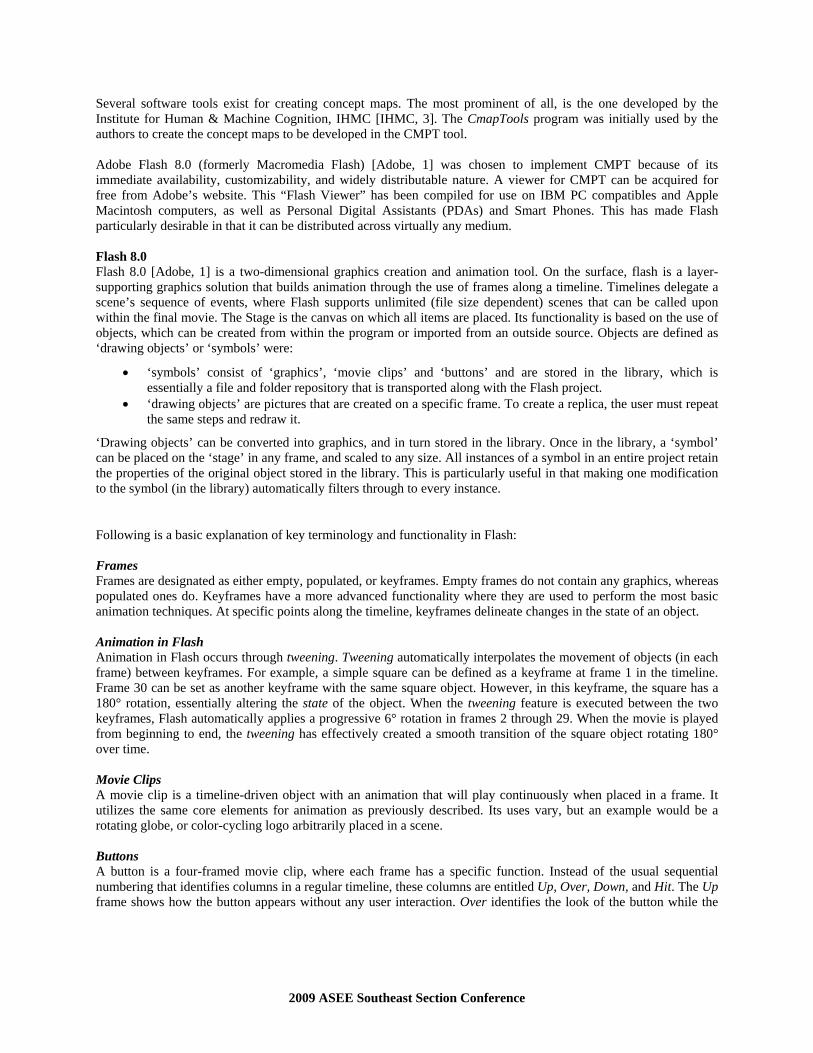
Figure 1 Layout Design Scheme for the CMPT menu In terms of the procedure, the user interface and visual components were developed concurrently [Jackson, 4]. The concept maps as well as the elements within (i.e. ovals and rectangles) were created as symbols within Flash for flexibility and repetitive use [Jackson, 4]. Figure 1 illustrates the layout design scheme used. The function of the concept map window, Figure 2, is to give each map a zoom in/zoom out capability for each of its elements. When clicked, each applicable element will bring up its respective concept map into the viewing area.
2009 ASEE Southeast Section Conference
Figure 2 Concept Map Window
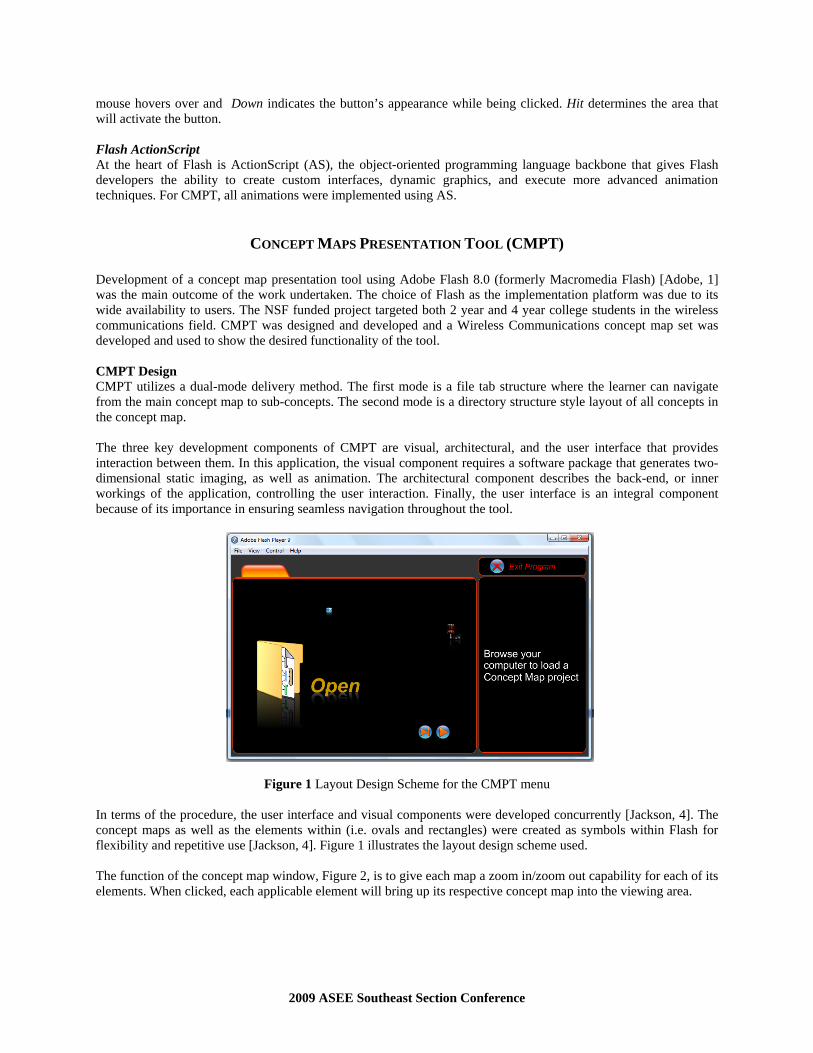
The implementation of this animation involves the following: The current x and y locations of the mouse pointer are recorded when an element oval is clicked. A three part ‘tweening’ effect is applied to the map symbol as follows:
o The map is placed on the screen at a 100% opacity setting. o The map’s center is translated from the x and y coordinates recorded with the mouse click to 0
and 0 (the center of the stage), respectively. o The x and y scaling of the map tweens from 0% to 100%, with respect to the stage width and
height. o When all of the tweening effects are performed simultaneously, the concept map appears to
zoom into view, Figure 3.
Figure 3 Zooming Functions
2009 ASEE Southeast Section Conference
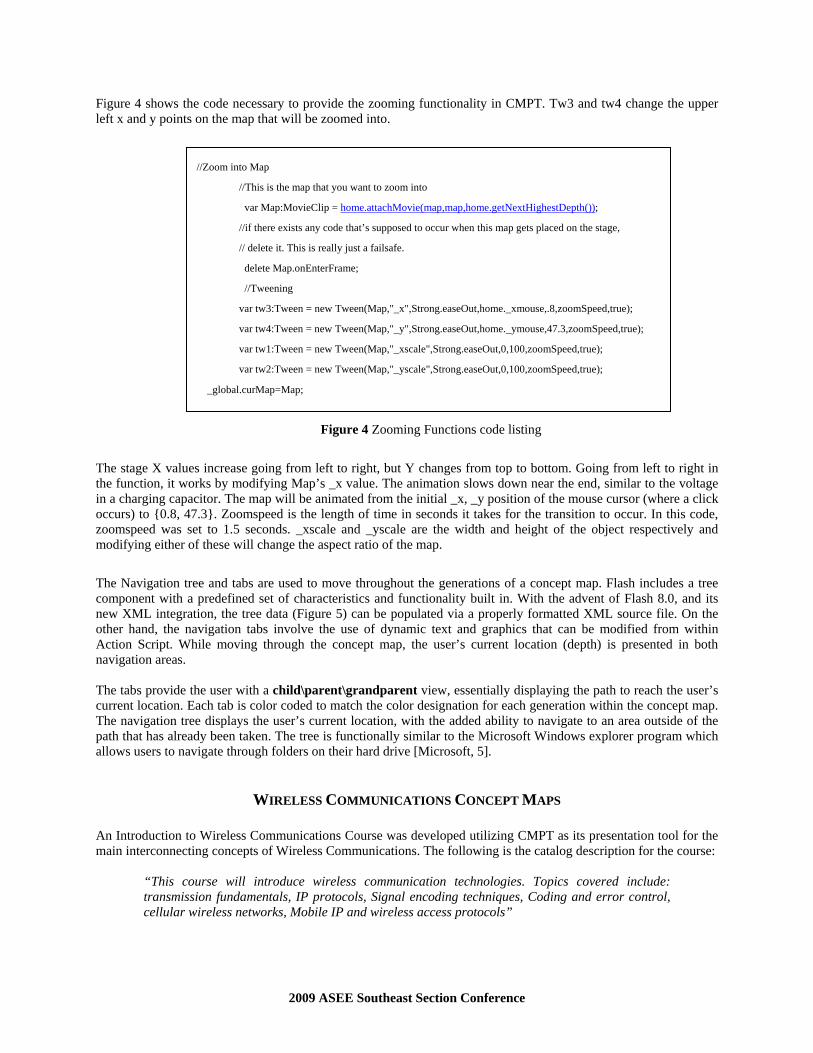
Figure 4 shows the code necessary to provide the zooming functionality in CMPT. Tw3 and tw4 change the upper left x and y points on the map that will be zoomed into.
Figure 4 Zooming Functions code listing
The stage X values increase going from left to right, but Y changes from top to bottom. Going from left to right in the function, it works by modifying Map’s _x value. The animation slows down near the end, similar to the voltage in a charging capacitor. The map will be animated from the initial _x, _y position of the mouse cursor (where a click occurs) to {0.8, 47.3}. Zoomspeed is the length of time in seconds it takes for the transition to occur. In this code, zoomspeed was set to 1.5 seconds. _xscale and _yscale are the width and height of the object respectively and modifying either of these will change the aspect ratio of the map.
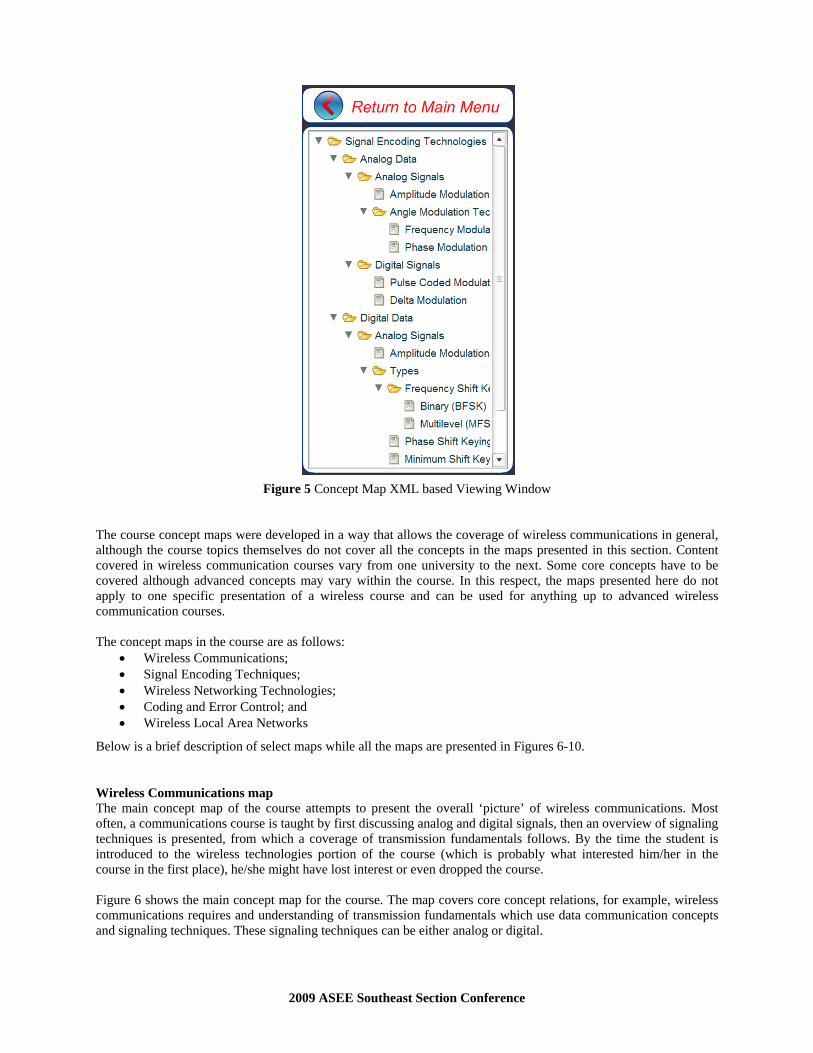
The Navigation tree and tabs are used to move throughout the generations of a concept map. Flash includes a tree component with a predefined set of characteristics and functionality built in. With the advent of Flash 8.0, and its new XML integration, the tree data (Figure 5) can be populated via a properly formatted XML source file. On the other hand, the navigation tabs involve the use of dynamic text and graphics that can be modified from within Action Script. While moving through the concept map, the user’s current location (depth) is presented in both navigation areas. The tabs provide the user with a child\parent\grandparent view, essentially displaying the path to reach the user’s current location. Each tab is color coded to match the color designation for each generation within the concept map. The navigation tree displays the user’s current location, with the added ability to navigate to an area outside of the path that has already been taken. The tree is functionally similar to the Microsoft Windows explorer program which allows users to navigate through folders on their hard drive [Microsoft, 5].
WIRELESS COMMUNICATIONS CONCEPT MAPS An Introduction to Wireless Communications Course was developed utilizing CMPT as its presentation tool for the main interconnecting concepts of Wireless Communications. The following is the catalog description for the course:
“This course will introduce wireless communication technologies. Topics covered include: transmission fundamentals, IP protocols, Signal encoding techniques, Coding and error control, cellular wireless networks, Mobile IP and wireless access protocols”
//Zoom into Map
//This is the map that you want to zoom into
var Map:MovieClip = home.attachMovie(map,map,home.getNextHighestDepth());
//if there exists any code that’s supposed to occur when this map gets placed on the stage,
// delete it. This is really just a failsafe.
delete Map.onEnterFrame;
//Tweening
var tw3:Tween = new Tween(Map,"_x",Strong.easeOut,home._xmouse,.8,zoomSpeed,true);
var tw4:Tween = new Tween(Map,"_y",Strong.easeOut,home._ymouse,47.3,zoomSpeed,true);
var tw1:Tween = new Tween(Map,"_xscale",Strong.easeOut,0,100,zoomSpeed,true);
var tw2:Tween = new Tween(Map,"_yscale",Strong.easeOut,0,100,zoomSpeed,true);
_global.curMap=Map;
2009 ASEE Southeast Section Conference
Figure 5 Concept Map XML based Viewing Window
The course concept maps were developed in a way that allows the coverage of wireless communications in general, although the course topics themselves do not cover all the concepts in the maps presented in this section. Content covered in wireless communication courses vary from one university to the next. Some core concepts have to be covered although advanced concepts may vary within the course. In this respect, the maps presented here do not apply to one specific presentation of a wireless course and can be used for anything up to advanced wireless communication courses. The concept maps in the course are as follows:
Wireless Communications; Signal Encoding Techniques; Wireless Networking Technologies; Coding and Error Control; and Wireless Local Area Networks
Below is a brief description of select maps while all the maps are presented in Figures 6-10.
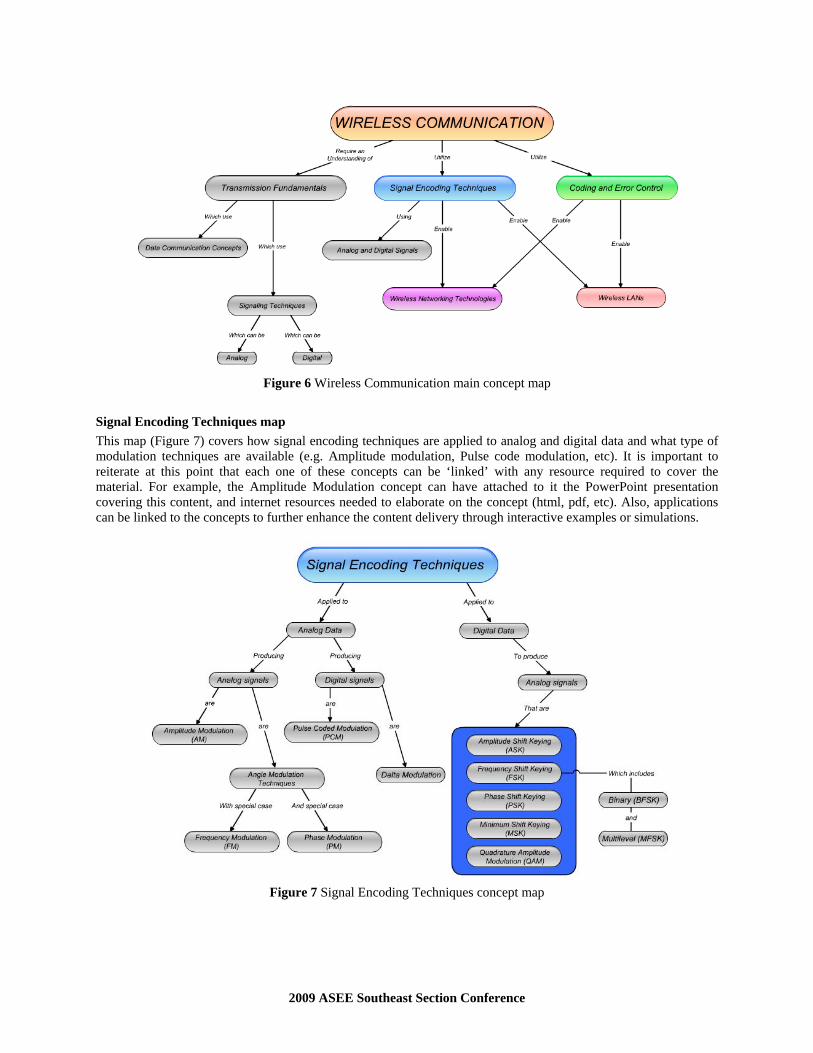
Wireless Communications map The main concept map of the course attempts to present the overall ‘picture’ of wireless communications. Most often, a communications course is taught by first discussing analog and digital signals, then an overview of signaling techniques is presented, from which a coverage of transmission fundamentals follows. By the time the student is introduced to the wireless technologies portion of the course (which is probably what interested him/her in the course in the first place), he/she might have lost interest or even dropped the course. Figure 6 shows the main concept map for the course. The map covers core concept relations, for example, wireless communications requires and understanding of transmission fundamentals which use data communication concepts and signaling techniques. These signaling techniques can be either analog or digital.
2009 ASEE Southeast Section Conference
Figure 6 Wireless Communication main concept map
Signal Encoding Techniques map
This map (Figure 7) covers how signal encoding techniques are applied to analog and digital data and what type of modulation techniques are available (e.g. Amplitude modulation, Pulse code modulation, etc). It is important to reiterate at this point that each one of these concepts can be ‘linked’ with any resource required to cover the material. For example, the Amplitude Modulation concept can have attached to it the PowerPoint presentation covering this content, and internet resources needed to elaborate on the concept (html, pdf, etc). Also, applications can be linked to the concepts to further enhance the content delivery through interactive examples or simulations.
Figure 7 Signal Encoding Techniques concept map
2009 ASEE Southeast Section Conference
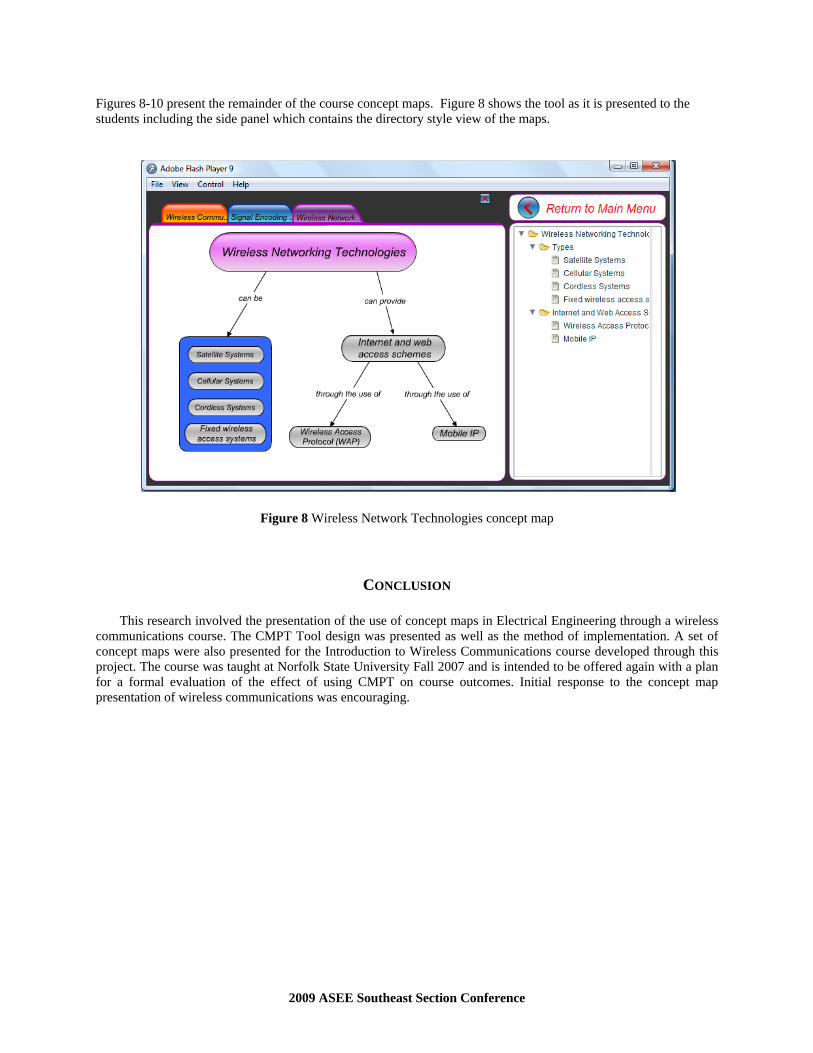
Figures 8-10 present the remainder of the course concept maps. Figure 8 shows the tool as it is presented to the students including the side panel which contains the directory style view of the maps.
Figure 8 Wireless Network Technologies concept map
CONCLUSION This research involved the presentation of the use of concept maps in Electrical Engineering through a wireless
communications course. The CMPT Tool design was presented as well as the method of implementation. A set of concept maps were also presented for the Introduction to Wireless Communications course developed through this project. The course was taught at Norfolk State University Fall 2007 and is intended to be offered again with a plan for a formal evaluation of the effect of using CMPT on course outcomes. Initial response to the concept map presentation of wireless communications was encouraging.
2009 ASEE Southeast Section Conference
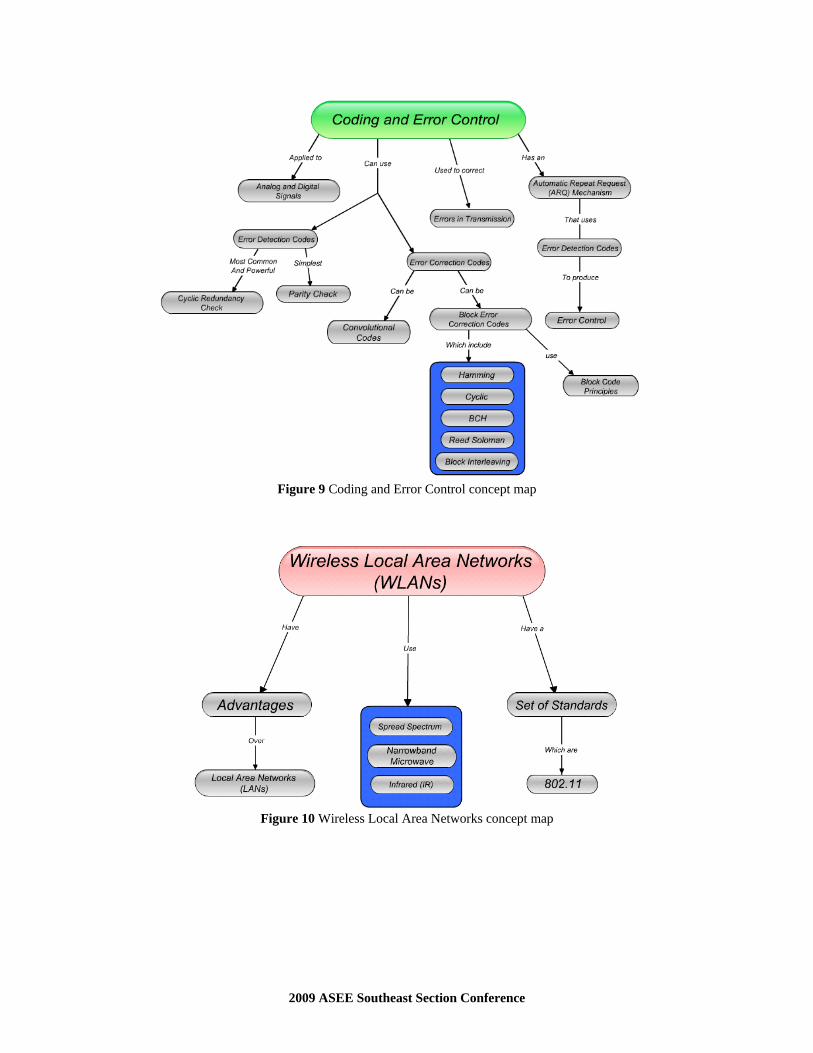
Figure 9 Coding and Error Control concept map
Figure 10 Wireless Local Area Networks concept map
2009 ASEE Southeast Section Conference
REFERENCES
[1] Adobe Flash 8.0, http://www.adobe.com/flash [2] Ibrahim, Wael and Rasha Morsi, and Theresa Tuttle, “Concept Maps: As an active learning and assessment
tool in Electrical and Computer Engineering,” ASEE Illinois-Indiana and North Central Joint Section Conference, 2006
[3] Institute for Human & Machine Cognition, IHMC. http://cmap.ihmc.us [4] Jackson, Edward and Rasha Morsi, and Wael Ibrahim, “Flash XML Concept Map Presentation Tool,” ODU-
NSU-EVMS-VTC Research Exposition Day: Research Expo 2007 - 400 Years of Discovery, Ted Constant Hall, Norfolk, VA, (Poster), April 05, 2007.
[5] Microsoft Windows Explorer, http://www.microsoft.com/windows
Rasha Morsi
Dr. Morsi graduated from King’s College, University of London, in 1991. She received an ME in Computer Engineering and a Ph.D. in Electrical and Computer Engineering from Old Dominion University, 1996 and 2002 respectively. She has extensive research experience in the areas of modeling and simulation, animation and gaming, e-learning, Formal Methods, and wireless communications. In January 2008, she was named one of Diverse: Issues in Higher Education’s Emerging Scholars – one of ten selected nationwide. Dr. Morsi has led the development of numerous interactive web-based learning applications and games for electrical and computer engineering students. Dr. Morsi joined Norfolk State University in the Fall of 2003 and is currently an Associate Professor in the department of engineering. She is director of the Creative Gaming and Simulation (CGS) Lab, a research lab with a mission of designing and developing models and frameworks for educational games and interactive e-tools.
Wael Ibrahim
Dr. Ibrahim has over thirteen years experience in education. He has an extensive experience in curriculum development for in-seat and online environments. Dr. Ibrahim has redesigned and developed the online courses for the CET department at ECPI. He is a member of the International Board of Reviewers for the International Journal of Modern Engineering, IJME. He also served as a reviewer for several national journals and conferences.
Dr. Ibrahim's research interests are geared towards three main categories; basic understanding of physical phenomena, engineering applications and engineering education enhancement. His research interests include ultrafast laser phenomenon, Biomedical Engineering, Terahertz generation and imaging, and Laser-material interaction.
Edward Jackson
Mr. Jackson received his bachelors’ degree in electronics engineering from Norfolk State University in 2007, and went on to earn a Masters Degree in electronics engineering with a computer engineering emphasis in 2008. His research interests include data and visual analytics, 3D modeling, simulation, and game development. Mr. Jackson has won or placed in a number of oral and poster competitions centered on his research.