computational fluid dynamics simulation of a rectangular slit real impactor's performance
TRANSCRIPT
Nuclear Engineering and Design 235 (2005) 1015–1028
Computational fluid dynamics simulation of a rectangularslit real impactor’s performance
Sridhar Haria, Y.A. Hassana, ∗, A.R. McFarlandb
a Department of Nuclear Engineering, Texas A&M University, College Station, TX 77843-3133, USAb Department of Mechanical Engineering, Texas A&M University, College Station, TX 77843-3123, USA
Received 17 May 2004; received in revised form 25 October 2004; accepted 16 December 2004
Abstract
The performance of a rectangular slit impactor was simulated using the three-dimensional computational fluid dynamics(CFDs) computer program CFX-4.4. The characteristic impactor efficiency curve obtained from the simulations was comparedwith the experimental results. A sensitivity study was carried out to investigate the effect of (a) the total number of particles usedfor the simulation, (b) gravity in the simulation, and (c) ultra-Stokesian drag on the efficiency curve predictions. The simulationpredictions for each of the above cases are presented along with the experimental data and the results are discussed. Resultsobtained from the simulation are seen to be in good agreement with experimental data, validating the particle transport modelimplemented in CFX-4.4, for laminar flow conditions.© 2005 Elsevier B.V. All rights reserved.
1
pf
mndn
f
iclesn thearepa-not
ate,any
orsthe
cili-tossings)
0
. Introduction
Impactors (Hinds, 1999; Fuchs, 1964) are the mostrimitive of the devices that have been extensively used
or the collection and measurement of aerosol particles.
Abbreviations:NPP, nuclear power plants; CAM, continuous aironitor; CFD, computational fluid dynamics; ATL, Aerosol Tech-ology Laboratory; TAMU, Texas A&M University; HDS, hybridifferencing scheme; CDS, central differencing scheme; AD, aerody-amic diameter; EXP, experiment; ICCG, conjugate gradient solver∗ Corresponding author. Tel.: +1 979 845 4161;
ax: +1 979 845 6443.E-mail address:[email protected] (Y.A. Hassan).
Impactors have also been used for classifying partbased on size (aerodynamic diameter); they work oprinciple of inertial impaction. They have been, andbeing used in a wide variety of disciplines from occutional health to environmental assessment. It wouldbe improper if it were mentioned that, as of this dinertial impaction is more thoroughly studied thanother aerosol separation process.
In particular, in the nuclear field, inertial impactare widely used in devices employed to monitorconcentration of radioactive aerosol in various faties ranging from nuclear fuel fabrication facilitiesnuclear waste management and spent-fuel reprocefacilities. Moreover, continuous air monitors (CAM
029-5493/$ – see front matter © 2005 Elsevier B.V. All rights reserved.doi:10.1016/j.nucengdes.2004.12.004
1016 S. Hari et al. / Nuclear Engineering and Design 235 (2005) 1015–1028
Nomenclature
Cc Cunningham slip correction factordp particle diameterFB Buoyancy forceFD drag forceFL lift forceFPG pressure gradient forceFVM virtual mass forcemp particle massnin total number of particles specified at the
inlet patchnw number of particles deposited on the wallRe fluid Reynolds numberRep particle Reynolds numberS stopping distanceStk Stokes numberT throat lengthu, v,w velocity componentsV fluid velocityV0 average velocity at the throatVp particle velocityVR relative velocity =V−VpW throat width (nozzle diameter)
Greek lettersη collection efficiency on the wallλ mean free path of the fluidµ dynamic viscosity of the fluidν kinematic viscosity of the fluidρ fluid densityρp particle density
that monitor vent exhausts from various regions of thenuclear power plant (NPP) utilize inertial impactors asthe particulate aerosol detecting device. From a moregeneral viewpoint, there are several other applicationsinvolving the transport of radioactive aerosols underlaminar flow conditions. A typical example in this re-gard is the transport of a radioactive aerosol inhaled bypersonnel through the human system, and a more novelapplication is the delivery of aerosols using nebulizersfor asthma therapy.
Inertial impactors can be classified into two types,namely, the real and the virtual impactor. The real im-
pactor removes particles by impaction on a coated solidsurface, whereas, the virtual impactor redirects the par-ticles into two different streams based on their size.Based on the geometry of the nozzle section, the realimpactor can further be classified as a slit (rectangu-lar nozzle) impactor and axy-symmetric (round nozzle)impactor.
In the past, a lot of work has been devoted to studyingthe performance of inertial impactors, theoretically andexperimentally.Marple and Liu (1974)were the firstto undertake the theoretical study of the design and de-velopment of inertial impactors. They numerically ob-tained the characteristic impactor efficiency curves forboth rectangular-and-round-jet real impactor with dif-ferent characteristic geometrical configurations. Sub-sequently,Rader and Marple (1985)refined the pre-vious study by using a finer grid and including appro-priate models for ultra-Stokesian drag and interception,for the particulate phase. The results of the above studyare treated as a standard in handbooks on aerosol mea-surement (Baron and Willeke, 2001).
More numerical studies on the performance ofround-nozzle real impactors are available in literature.Jurcik and Wang (1995)used the FIDAP code (FluentUSA Inc., 2002) to study the performance of a flat-plate orifice round nozzle impactor and compared theirresults against experimental data and the numerical re-sults ofRader and Marple (1985)for an angled nozzleconfiguration. More recently,Collazo et al. (2002)re-ported the design, calibration, and experimental valida-t torsf bers.T m-ita ionp tione in-v
y oftf per-f ctorw FX-4 zedw d int cyf ed.
ion of round-nozzle single-and-multi-stage impacor the size measurement of man-made organic fihey reported using the computational fluid dyna
cs (CFD) code FLUENT (Fluent USA Inc., 2002) inheir design stage.Huang and Tsai (2002)performednumerical study in which the influence of impactlate diameter and particle density on the collecfficiency of a round-nozzle inertial impactor wasestigated.
A study was performed to assess the capabilithe CFD code CFX-4.4 (ANSYS Canada Ltd., 2003)or modeling aerosol transport. In this study, theormance of a slit (rectangular) nozzle real impaas numerically simulated using the CFD code C.4. The sensitivity of obtained results was analyith respect to the total number of particles use
he simulation. The effect of including the buoyanorce (gravity) in the simulations was also explor
S. Hari et al. / Nuclear Engineering and Design 235 (2005) 1015–1028 1017
Moreover, the use of an ultra-Stokesian drag formula-tion to determine the drag coefficient, in place of thedefault drag coefficient formulation, was investigated.The predicted impactor curve for each of the abovecases is compared against experimental data and theobtained results are discussed. Finally, the results ob-tained from present simulation are compared againstthe results ofRader and Marple (1985).
2. Problem description
The rectangular slit real impactor whose perfor-mance is investigated in this study was designed, fab-ricated, and its performance experimentally evaluatedat the Aerosol Technology Laboratory (ATL), TexasA&M University (TAMU). More details on the designand performance evaluation of this impactor are avail-able elsewhere (Lee, 2002).
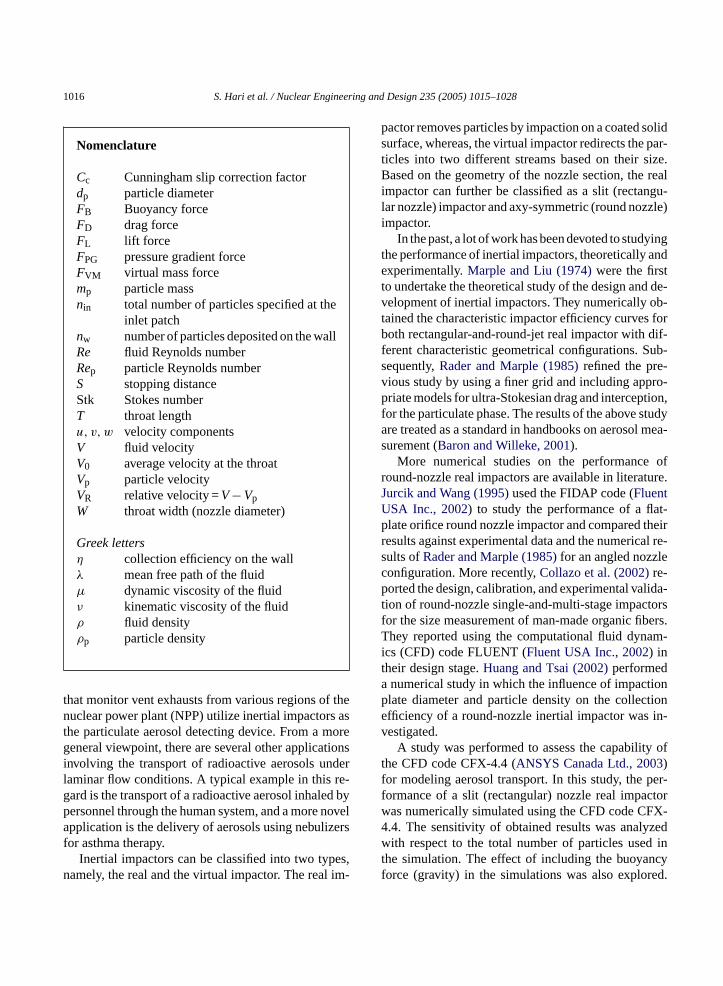
Fig. 1presents a two-dimensional view of one-halfof a section of a typical rectangular slit impactor. It isto be noted that the flow is symmetric about mid-planeand the length of the impactor is substantially greaterthan the width. The impactor geometry has a converg-ing section, a throat section, and an impaction plateat the bottom. The impaction plate is coated with theappropriate material to catch the particles and prevent
their re-suspension and bounce. Fluid (usually air) withaerosol particles (either liquid or solid phase) of differ-ent sizes entering the inlet plane is accelerated throughthe converging inlet section. The gas–particle mixturethen passes through a throat section that is in the formof a rectangular nozzle and impinges on the impactionplate below and flows out through the sides. Particlesabove a particular size that acquire enough inertia dur-ing the acceleration phase impinge on the impactionplate and stick to it, whereas those below that size areusually carried along with the fluid stream and flow outof the domain. Hence, there is a selective classificationof the particles based on the size and the characteristicthroat velocity.
3. Computational modeling and governingequations
Some of the impactor’s characteristic features thatare important from the modeling viewpoint are:
(a) the physical dimension through which two-phase(gas–particle) flow takes place is small (usually inmillimeters and less),
(b) the flow velocity through the nozzle region is veryhigh, and
e slit im
Fig. 1. Two-dimensional schematic of th pactor with appropriate boundary conditions.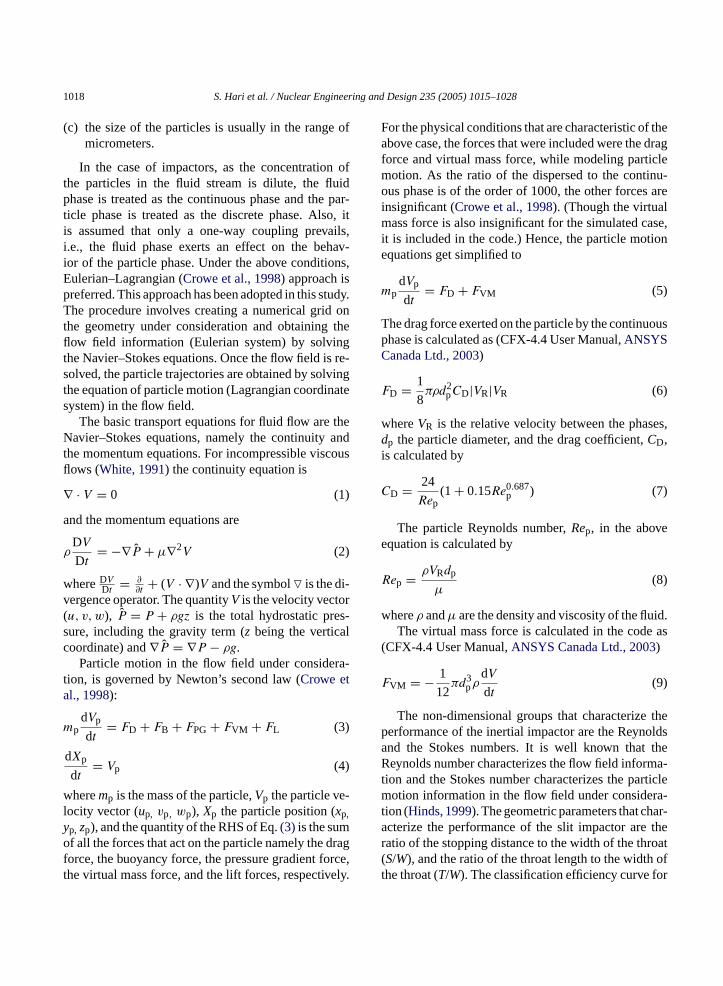
1018 S. Hari et al. / Nuclear Engineering and Design 235 (2005) 1015–1028
(c) the size of the particles is usually in the range ofmicrometers.
In the case of impactors, as the concentration ofthe particles in the fluid stream is dilute, the fluidphase is treated as the continuous phase and the par-ticle phase is treated as the discrete phase. Also, itis assumed that only a one-way coupling prevails,i.e., the fluid phase exerts an effect on the behav-ior of the particle phase. Under the above conditions,Eulerian–Lagrangian (Crowe et al., 1998) approach ispreferred. This approach has been adopted in this study.The procedure involves creating a numerical grid onthe geometry under consideration and obtaining theflow field information (Eulerian system) by solvingthe Navier–Stokes equations. Once the flow field is re-solved, the particle trajectories are obtained by solvingthe equation of particle motion (Lagrangian coordinatesystem) in the flow field.
The basic transport equations for fluid flow are theNavier–Stokes equations, namely the continuity andthe momentum equations. For incompressible viscousflows (White, 1991) the continuity equation is
∇ · V = 0 (1)
and the momentum equations are
ρDV
Dt= −∇P + µ∇2V (2)
whereDVDt = ∂
∂t+ (V · ∇)V and the symbol� is the di-
v r( s-s lc
ra-t ta
m
w -lyo ragf rce,t ely.
For the physical conditions that are characteristic of theabove case, the forces that were included were the dragforce and virtual mass force, while modeling particlemotion. As the ratio of the dispersed to the continu-ous phase is of the order of 1000, the other forces areinsignificant (Crowe et al., 1998). (Though the virtualmass force is also insignificant for the simulated case,it is included in the code.) Hence, the particle motionequations get simplified to
mpdVp
dt= FD + FVM (5)
The drag force exerted on the particle by the continuousphase is calculated as (CFX-4.4 User Manual,ANSYSCanada Ltd., 2003)
FD = 1
8πρd2
pCD|VR|VR (6)
whereVR is the relative velocity between the phases,dp the particle diameter, and the drag coefficient,CD,is calculated by
CD = 24
Rep(1 + 0.15Re0.687
p ) (7)
The particle Reynolds number,Rep, in the aboveequation is calculated by
Rep = ρVRdp
µ(8)
w id.e as
(
F
thep oldsa theR ma-t rticlem ra-t ar-a ther oat( oft or
ergence operator. The quantityV is the velocity vectou, v,w), P = P + ρgz is the total hydrostatic preure, including the gravity term (z being the verticaoordinate) and∇P = ∇P − ρg.
Particle motion in the flow field under consideion, is governed by Newton’s second law (Crowe el., 1998):
pdVp
dt= FD + FB + FPG + FVM + FL (3)
dXp
dt= Vp (4)
heremp is the mass of the particle,Vp the particle veocity vector (up, vp, wp), Xp the particle position (xp,
p, zp), and the quantity of the RHS of Eq.(3) is the sumf all the forces that act on the particle namely the d
orce, the buoyancy force, the pressure gradient fohe virtual mass force, and the lift forces, respectiv
hereρ andµ are the density and viscosity of the fluThe virtual mass force is calculated in the cod
CFX-4.4 User Manual,ANSYS Canada Ltd., 2003)
VM = − 1
12πd3
pρdV
dt(9)
The non-dimensional groups that characterizeerformance of the inertial impactor are the Reynnd the Stokes numbers. It is well known thateynolds number characterizes the flow field infor
ion and the Stokes number characterizes the paotion information in the flow field under conside
ion (Hinds, 1999). The geometric parameters that chcterize the performance of the slit impactor areatio of the stopping distance to the width of the thrS/W), and the ratio of the throat length to the widthhe throat (T/W). The classification efficiency curve f
S. Hari et al. / Nuclear Engineering and Design 235 (2005) 1015–1028 1019
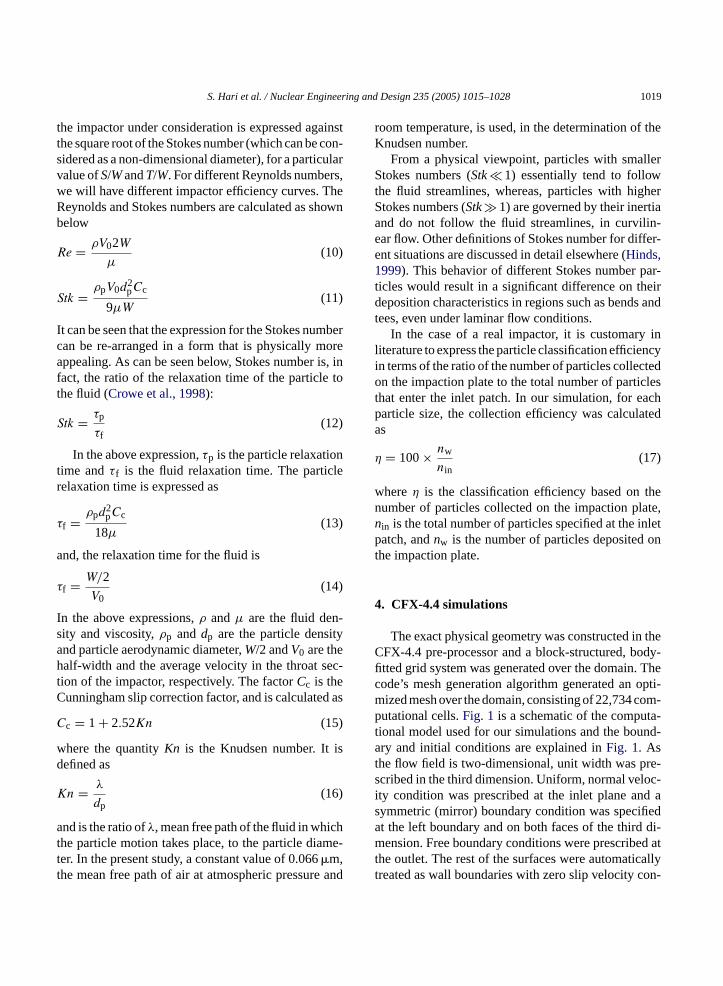
the impactor under consideration is expressed againstthe square root of the Stokes number (which can be con-sidered as a non-dimensional diameter), for a particularvalue ofS/WandT/W. For different Reynolds numbers,we will have different impactor efficiency curves. TheReynolds and Stokes numbers are calculated as shownbelow
Re = ρV02W
µ(10)
Stk = ρpV0d2pCc
9µW(11)
It can be seen that the expression for the Stokes numbercan be re-arranged in a form that is physically moreappealing. As can be seen below, Stokes number is, infact, the ratio of the relaxation time of the particle tothe fluid (Crowe et al., 1998):
Stk = τp
τf(12)
In the above expression,τp is the particle relaxationtime andτf is the fluid relaxation time. The particlerelaxation time is expressed as
τf = ρpd2pCc
18µ(13)
and, the relaxation time for the fluid is
τf = W/2(14)
I -s tyah ec-tC d as
C
w isd
K
a ht me-tt and
room temperature, is used, in the determination of theKnudsen number.
From a physical viewpoint, particles with smallerStokes numbers (Stk� 1) essentially tend to followthe fluid streamlines, whereas, particles with higherStokes numbers (Stk 1) are governed by their inertiaand do not follow the fluid streamlines, in curvilin-ear flow. Other definitions of Stokes number for differ-ent situations are discussed in detail elsewhere (Hinds,1999). This behavior of different Stokes number par-ticles would result in a significant difference on theirdeposition characteristics in regions such as bends andtees, even under laminar flow conditions.
In the case of a real impactor, it is customary inliterature to express the particle classification efficiencyin terms of the ratio of the number of particles collectedon the impaction plate to the total number of particlesthat enter the inlet patch. In our simulation, for eachparticle size, the collection efficiency was calculatedas
η = 100× nw
nin(17)
whereη is the classification efficiency based on thenumber of particles collected on the impaction plate,nin is the total number of particles specified at the inletpatch, andnw is the number of particles deposited onthe impaction plate.
4
theC ody-fi Thec opti-m om-p ta-t nd-at re-s oc-i d as fieda di-m ed att callyt on-
V0
n the above expressions,ρ andµ are the fluid denity and viscosity,ρp anddp are the particle densind particle aerodynamic diameter,W/2 andV0 are thealf-width and the average velocity in the throat s
ion of the impactor, respectively. The factorCc is theunningham slip correction factor, and is calculate
c = 1 + 2.52Kn (15)
here the quantityKn is the Knudsen number. Itefined as
n = λ
dp(16)
nd is the ratio ofλ, mean free path of the fluid in whiche particle motion takes place, to the particle diaer. In the present study, a constant value of 0.066�m,he mean free path of air at atmospheric pressure
. CFX-4.4 simulations
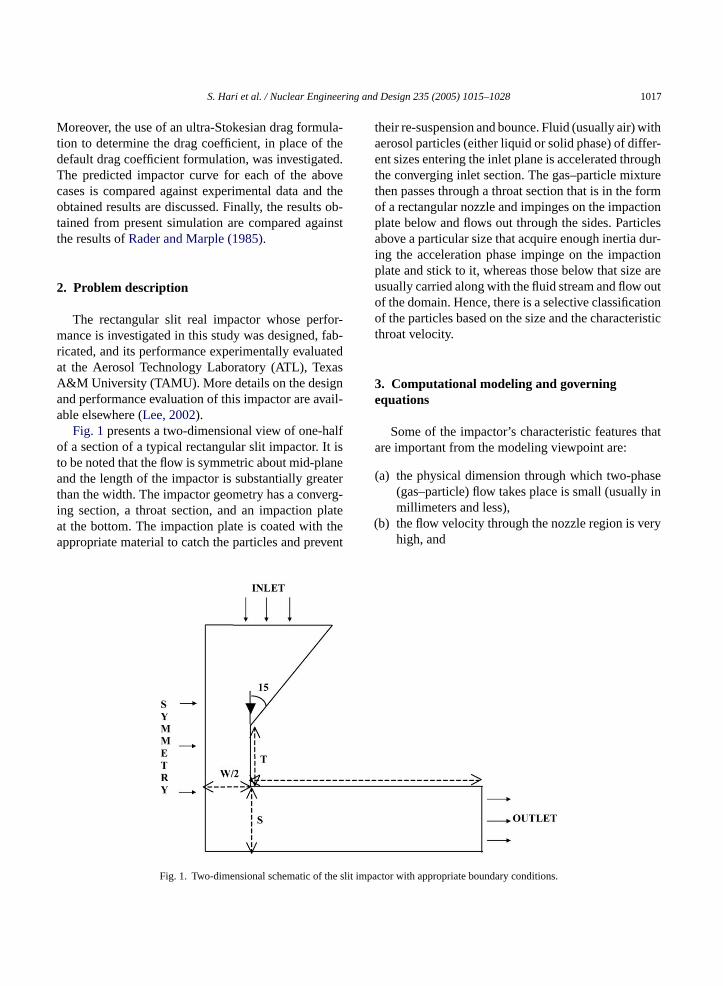
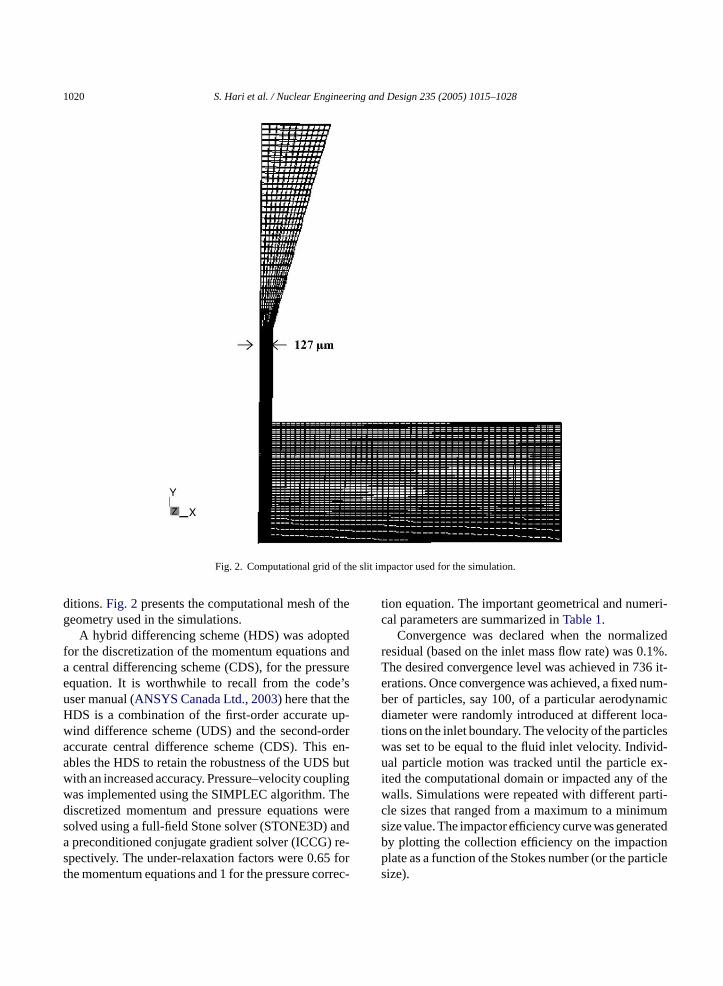
The exact physical geometry was constructed inFX-4.4 pre-processor and a block-structured, btted grid system was generated over the domain.ode’s mesh generation algorithm generated anized mesh over the domain, consisting of 22,734 cutational cells.Fig. 1 is a schematic of the compu
ional model used for our simulations and the boury and initial conditions are explained inFig. 1. As
he flow field is two-dimensional, unit width was pcribed in the third dimension. Uniform, normal velty condition was prescribed at the inlet plane anymmetric (mirror) boundary condition was specit the left boundary and on both faces of the thirdension. Free boundary conditions were prescrib
he outlet. The rest of the surfaces were automatireated as wall boundaries with zero slip velocity c
1020 S. Hari et al. / Nuclear Engineering and Design 235 (2005) 1015–1028
Fig. 2. Computational grid of the slit impactor used for the simulation.
ditions.Fig. 2presents the computational mesh of thegeometry used in the simulations.
A hybrid differencing scheme (HDS) was adoptedfor the discretization of the momentum equations anda central differencing scheme (CDS), for the pressureequation. It is worthwhile to recall from the code’suser manual (ANSYS Canada Ltd., 2003) here that theHDS is a combination of the first-order accurate up-wind difference scheme (UDS) and the second-orderaccurate central difference scheme (CDS). This en-ables the HDS to retain the robustness of the UDS butwith an increased accuracy. Pressure–velocity couplingwas implemented using the SIMPLEC algorithm. Thediscretized momentum and pressure equations weresolved using a full-field Stone solver (STONE3D) anda preconditioned conjugate gradient solver (ICCG) re-spectively. The under-relaxation factors were 0.65 forthe momentum equations and 1 for the pressure correc-
tion equation. The important geometrical and numeri-cal parameters are summarized inTable 1.
Convergence was declared when the normalizedresidual (based on the inlet mass flow rate) was 0.1%.The desired convergence level was achieved in 736 it-erations. Once convergence was achieved, a fixed num-ber of particles, say 100, of a particular aerodynamicdiameter were randomly introduced at different loca-tions on the inlet boundary. The velocity of the particleswas set to be equal to the fluid inlet velocity. Individ-ual particle motion was tracked until the particle ex-ited the computational domain or impacted any of thewalls. Simulations were repeated with different parti-cle sizes that ranged from a maximum to a minimumsize value. The impactor efficiency curve was generatedby plotting the collection efficiency on the impactionplate as a function of the Stokes number (or the particlesize).
S. Hari et al. / Nuclear Engineering and Design 235 (2005) 1015–1028 1021
Table 1Important geometrical and numerical parameters of interest
Geometrical detailsSlit width (W) = 2.54E−04 m S/W= 5Slit length = 0.127 m T/W= 3.9Nozzle area = 3.2258E−05 m2 Fluid:air at STPFlow rate = 3.75 m3/h Re= 2WV0 /ν = 1093.6Throat velocity = 32.292 m/s
Equation Differencing scheme Solutionalgorithm
Underrelaxationfactor
Numerical detailsa
u, v,w Hybrid differencingscheme
STONE3D 0.65
P Central differencingscheme
ICCG 1.00
a Total no. of computational cells = 22,734; mass source residu-als = 4800 (corresponding to 0.1% inlet mass flow rate).
5. Results and discussion
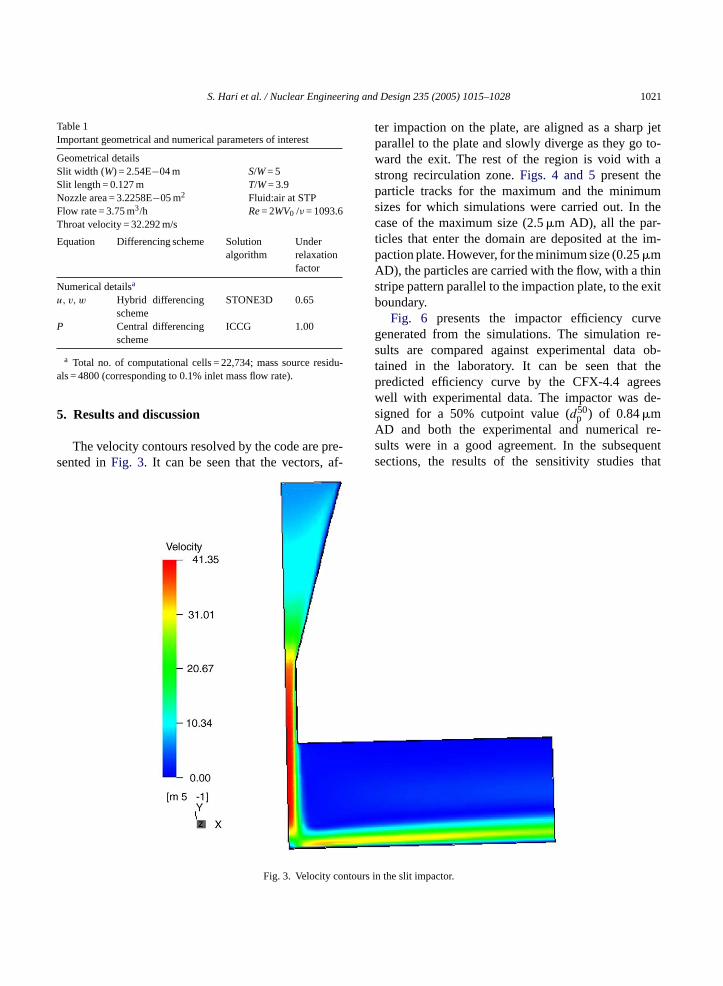
The velocity contours resolved by the code are pre-sented inFig. 3. It can be seen that the vectors, af-
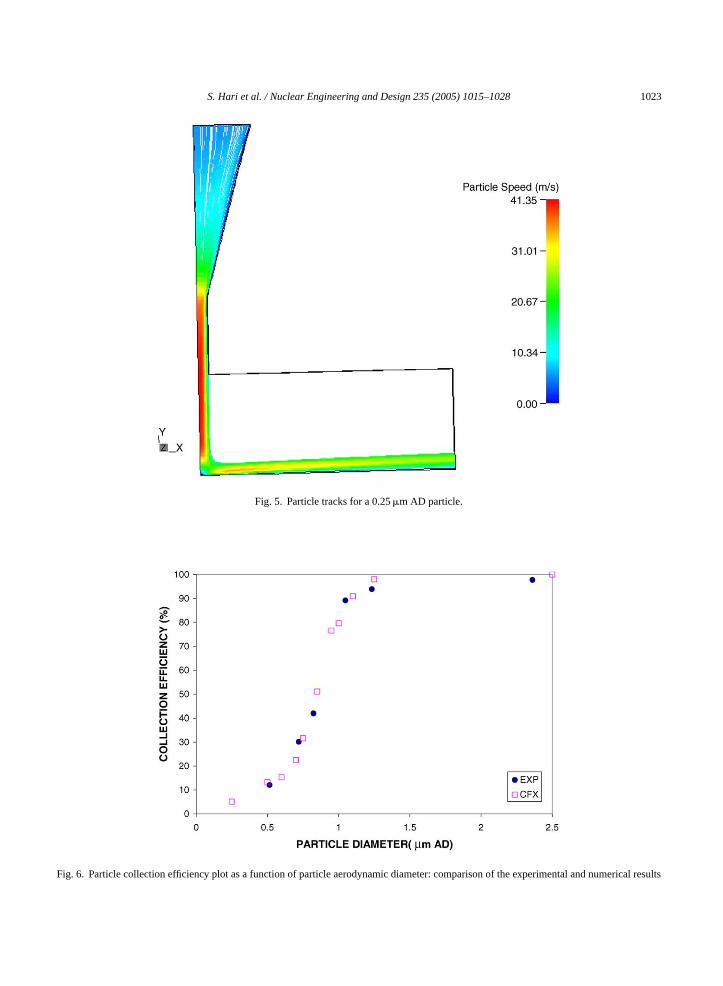
ter impaction on the plate, are aligned as a sharp jetparallel to the plate and slowly diverge as they go to-ward the exit. The rest of the region is void with astrong recirculation zone.Figs. 4 and 5present theparticle tracks for the maximum and the minimumsizes for which simulations were carried out. In thecase of the maximum size (2.5�m AD), all the par-ticles that enter the domain are deposited at the im-paction plate. However, for the minimum size (0.25�mAD), the particles are carried with the flow, with a thinstripe pattern parallel to the impaction plate, to the exitboundary.
Fig. 6 presents the impactor efficiency curvegenerated from the simulations. The simulation re-sults are compared against experimental data ob-tained in the laboratory. It can be seen that thepredicted efficiency curve by the CFX-4.4 agreeswell with experimental data. The impactor was de-signed for a 50% cutpoint value (d50
p ) of 0.84�mAD and both the experimental and numerical re-sults were in a good agreement. In the subsequentsections, the results of the sensitivity studies that
Fig. 3. Velocity contours
in the slit impactor.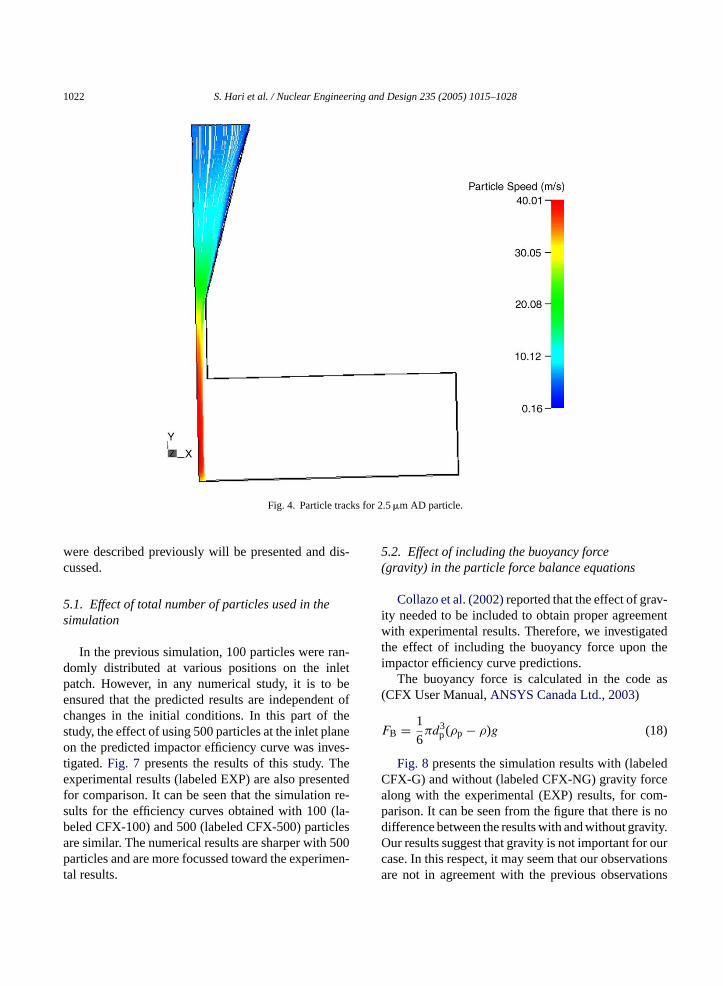
1022 S. Hari et al. / Nuclear Engineering and Design 235 (2005) 1015–1028
Fig. 4. Particle tracks for 2.5�m AD particle.
were described previously will be presented and dis-cussed.
5.1. Effect of total number of particles used in thesimulation
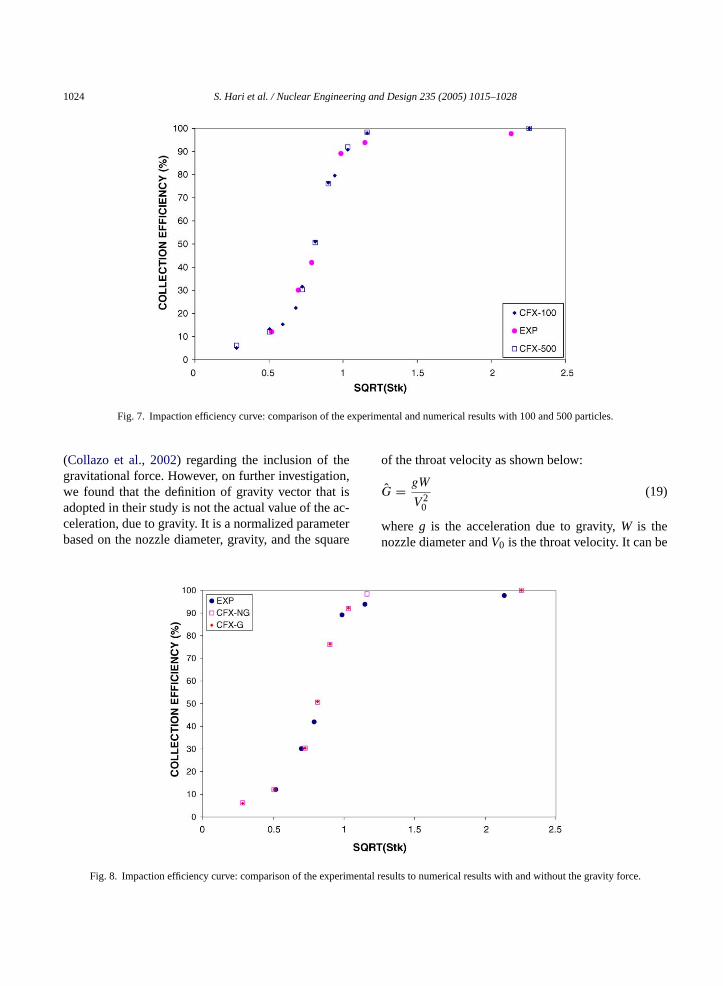
In the previous simulation, 100 particles were ran-domly distributed at various positions on the inletpatch. However, in any numerical study, it is to beensured that the predicted results are independent ofchanges in the initial conditions. In this part of thestudy, the effect of using 500 particles at the inlet planeon the predicted impactor efficiency curve was inves-tigated.Fig. 7 presents the results of this study. Theexperimental results (labeled EXP) are also presentedfor comparison. It can be seen that the simulation re-sults for the efficiency curves obtained with 100 (la-beled CFX-100) and 500 (labeled CFX-500) particlesare similar. The numerical results are sharper with 500particles and are more focussed toward the experimen-tal results.
5.2. Effect of including the buoyancy force(gravity) in the particle force balance equations
Collazo et al. (2002)reported that the effect of grav-ity needed to be included to obtain proper agreementwith experimental results. Therefore, we investigatedthe effect of including the buoyancy force upon theimpactor efficiency curve predictions.
The buoyancy force is calculated in the code as(CFX User Manual,ANSYS Canada Ltd., 2003)
FB = 1
6πd3
p(ρp − ρ)g (18)
Fig. 8 presents the simulation results with (labeledCFX-G) and without (labeled CFX-NG) gravity forcealong with the experimental (EXP) results, for com-parison. It can be seen from the figure that there is nodifference between the results with and without gravity.Our results suggest that gravity is not important for ourcase. In this respect, it may seem that our observationsare not in agreement with the previous observations
S. Hari et al. / Nuclear Engineering and Design 235 (2005) 1015–1028 1023
Fig. 5. Particle tracks for a 0.25�m AD particle.
Fig. 6. Particle collection efficiency plot as a function of particle aerodynamic diameter: comparison of the experimental and numerical results
1024 S. Hari et al. / Nuclear Engineering and Design 235 (2005) 1015–1028
Fig. 7. Impaction efficiency curve: comparison of the experimental and numerical results with 100 and 500 particles.
(Collazo et al., 2002) regarding the inclusion of thegravitational force. However, on further investigation,we found that the definition of gravity vector that isadopted in their study is not the actual value of the ac-celeration, due to gravity. It is a normalized parameterbased on the nozzle diameter, gravity, and the square
of the throat velocity as shown below:
G = gW
V 20
(19)
whereg is the acceleration due to gravity,W is thenozzle diameter andV0 is the throat velocity. It can be
Fig. 8. Impaction efficiency curve: comparison of the experimental results to numerical results with and without the gravity force.
S. Hari et al. / Nuclear Engineering and Design 235 (2005) 1015–1028 1025
seen that this non-dimensional quantity is the inverseof the Froude number. Based on our geometry and flowconditions, if we calculate the normalized gravity pa-rameter, we end up with a very small value (2.4E−06);however, the above parameter calculated for their ge-ometry and flow conditions turns out to be orders ofmagnitude higher than our case (1.5E−02) (the calcu-lation details are presented inAppendix A). This is thereason why, in our simulations, the effect of gravity isnegligible, whereas, in their case, it was important. Ingeneral, for micron-size particles, as the inertial forceincreases and the nozzle dimension decreases, the ef-fect of gravity should start diminishing.
5.3. Effect of using ultra-Stokesian drag in placeof the standard drag formulation
The work ofRader and Marple (1985)discussed theneed to include proper equations to calculate the dragcoefficient based on the concept of ultra-Stokesian fluidresistance. The drag coefficient calculation assumingultra-Stokesian conditions is different from the way thatit is presently being done in the code. It is a function ofthe particle Reynolds number and is presented below:
ForRep < 5
CD = 24
Rep(1 + 0.916Rep) (20)
and for 5 <Rep < 1000
CD = 24
Rep(1 + 0.158Re2/3p ) (21)
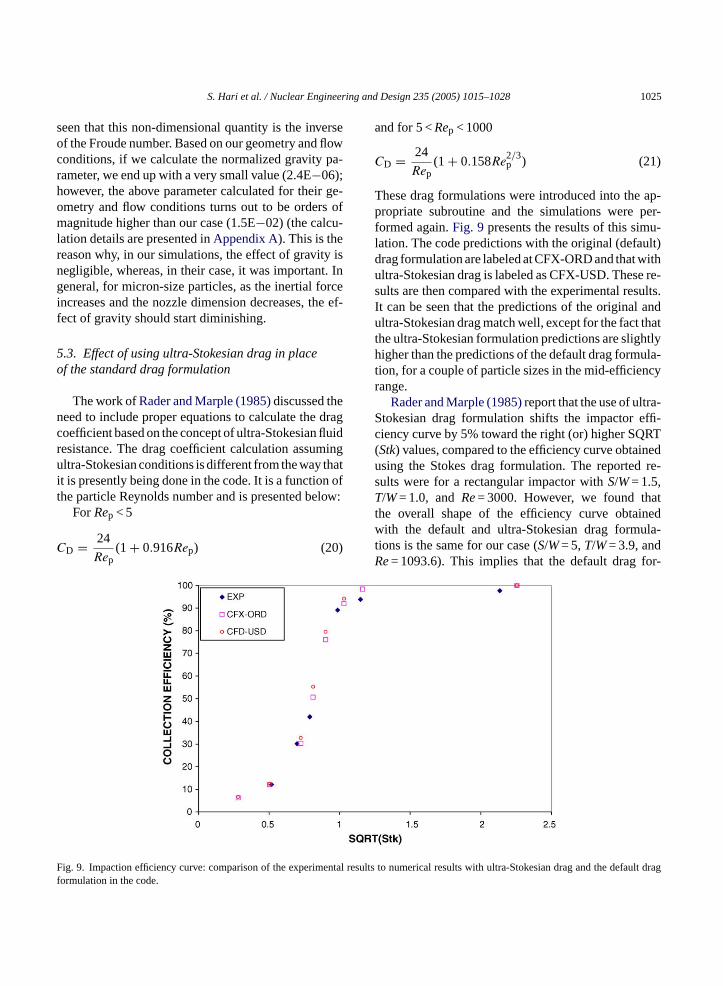
These drag formulations were introduced into the ap-propriate subroutine and the simulations were per-formed again.Fig. 9 presents the results of this simu-lation. The code predictions with the original (default)drag formulation are labeled at CFX-ORD and that withultra-Stokesian drag is labeled as CFX-USD. These re-sults are then compared with the experimental results.It can be seen that the predictions of the original andultra-Stokesian drag match well, except for the fact thatthe ultra-Stokesian formulation predictions are slightlyhigher than the predictions of the default drag formula-tion, for a couple of particle sizes in the mid-efficiencyrange.
Rader and Marple (1985)report that the use of ultra-Stokesian drag formulation shifts the impactor effi-ciency curve by 5% toward the right (or) higher SQRT(Stk) values, compared to the efficiency curve obtainedusing the Stokes drag formulation. The reported re-sults were for a rectangular impactor withS/W= 1.5,T/W= 1.0, andRe= 3000. However, we found thatthe overall shape of the efficiency curve obtainedwith the default and ultra-Stokesian drag formula-tions is the same for our case (S/W= 5,T/W= 3.9, andRe= 1093.6). This implies that the default drag for-
F ntal re efault dragf
ig. 9. Impaction efficiency curve: comparison of the experimeormulation in the code.
sults to numerical results with ultra-Stokesian drag and the d
1026 S. Hari et al. / Nuclear Engineering and Design 235 (2005) 1015–1028
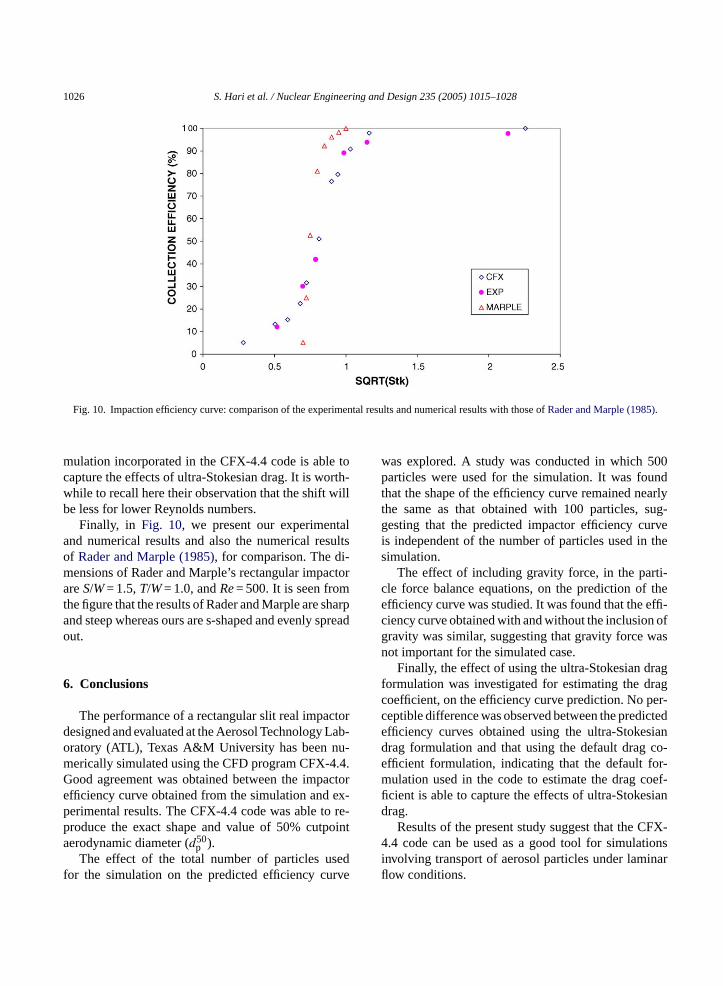
Fig. 10. Impaction efficiency curve: comparison of the experimental results and numerical results with those ofRader and Marple (1985).
mulation incorporated in the CFX-4.4 code is able tocapture the effects of ultra-Stokesian drag. It is worth-while to recall here their observation that the shift willbe less for lower Reynolds numbers.
Finally, in Fig. 10, we present our experimentaland numerical results and also the numerical resultsof Rader and Marple (1985), for comparison. The di-mensions of Rader and Marple’s rectangular impactorareS/W= 1.5,T/W= 1.0, andRe= 500. It is seen fromthe figure that the results of Rader and Marple are sharpand steep whereas ours are s-shaped and evenly spreadout.
6. Conclusions
The performance of a rectangular slit real impactordesigned and evaluated at the Aerosol Technology Lab-oratory (ATL), Texas A&M University has been nu-merically simulated using the CFD program CFX-4.4.Good agreement was obtained between the impactorefficiency curve obtained from the simulation and ex-perimental results. The CFX-4.4 code was able to re-produce the exact shape and value of 50% cutpointaerodynamic diameter (d50
p ).The effect of the total number of particles used
for the simulation on the predicted efficiency curve
was explored. A study was conducted in which 500particles were used for the simulation. It was foundthat the shape of the efficiency curve remained nearlythe same as that obtained with 100 particles, sug-gesting that the predicted impactor efficiency curveis independent of the number of particles used in thesimulation.
The effect of including gravity force, in the parti-cle force balance equations, on the prediction of theefficiency curve was studied. It was found that the effi-ciency curve obtained with and without the inclusion ofgravity was similar, suggesting that gravity force wasnot important for the simulated case.
Finally, the effect of using the ultra-Stokesian dragformulation was investigated for estimating the dragcoefficient, on the efficiency curve prediction. No per-ceptible difference was observed between the predictedefficiency curves obtained using the ultra-Stokesiandrag formulation and that using the default drag co-efficient formulation, indicating that the default for-mulation used in the code to estimate the drag coef-ficient is able to capture the effects of ultra-Stokesiandrag.
Results of the present study suggest that the CFX-4.4 code can be used as a good tool for simulationsinvolving transport of aerosol particles under laminarflow conditions.
S. Hari et al. / Nuclear Engineering and Design 235 (2005) 1015–1028 1027
Acknowledgements
Funding provided for this work by the U.S. Army,Soldier Biological Chemical Command (SBBCOM),Edgewood Chemical Biological Center (ECBC), un-der supervision of Dr. Edward Stuebing and Dr. JerryBottiger, is gratefully acknowledged. The help ofHong Xu, technical support contact at the ANSYS-CFX (formerly AEA Technologies), Pittsburg andDr. John Haglund, at the Aerosol Technology Lab-oratory, Department of Mechanical Engineering, atTAMU, during this study are greatly acknowledged andappreciated.
Appendix A
It was mentioned thatCollazo et al. (2002)had re-ported that the effect of gravity needed to be includedto obtain proper agreement with experimental results.It was also mentioned that they had defined a parame-ter known as the ‘gravity vector’ in their study that wasdefined as
G = gW
V 20
(A.1)
whereg is the acceleration due to gravity,W the nozzlediameter andV0 is the throat velocity. It was also men-tioned that this parameter is the inverse of the square oft at isia
F
w tog owg
beri Int thed thea rac-tc theR uden im-
pactor as
Fr = V 20
g(2W)(A.3)
The actual values areW= 2.54E−04 m, g= 9.8 m/s2
andu= 32.262 m/s. If the Froude number is calculatedbased on the above values, the value obtained for theFroude number isFr = 2.09E+05.
For the circular impactor ofCollazo et al. (2002),the characteristic dimension to be considered is the di-ameter of the nozzle (d). In their case, the actual valuesare d 3.81E−03 m,g= 9.8 m/s2 andu= 1.575 m/s andthe value of Froude number determined from the aboveparameters isFr = 66.42.
As can be seen from the above calculations, the in-ertial force is many orders of magnitude higher thanthe gravitational force in our case, whereas in the caseof Collazo et al. (2002)it is not so. This is the rea-son why inclusion of gravity, as defined by the ‘gravityvector’ in(A.1), in their simulations was needed, to getresults consistent with the experiment, whereas, in ourcase, there is no difference in the predictions with andwithout gravity.
References
ANSYS Canada Ltd., 2003. Waterloo, Ont., Canada.B rin-
New
C A.,ic di-l. 36,
C ithL, pp.
FF ork,
H , andpp.
H me-nd-14–
J ency
he Froude number, a non-dimensional number thmportant in free-surface flows (White, 1991), defineds follows:
r = V 2
gd(A.2)
hereV is the flow velocity,g the acceleration dueravity, andd is a characteristic dimension in the fleometry.
As can be seen from the definition, Froude nums the ratio of the inertial to the gravitational force.he case of our real impactor, the flow velocity foretermination of Froude number can be taken asverage velocity in the throat region and the chaeristic dimension, twice the throat width (2W), to beonsistent with the definition used for calculatingeynolds number. This would mean that the Froumber would have to be expressed for our real
aron, P.A., Willeke, K. (Eds.), 2001. Aerosol Measurement: Pciples, Techniques, and Applications. Wiley/Interscience,York, pp. 206–232.
ollazo, H., Crow, W.A., Gardner, L., Phillips, B.L., Marple, V.Olson, B., 2002. Inertial impactors to measure aerodynamameters of man-made organic fibres. Aerosol. Sci. Techno166–177.
rowe, C., Sommerfield, M., Tsuji, Y., 1998. Multiphase Flows wDroplets and Particles, vol. 191. CRC Press, Boca Raton, F67–101.
IDAP, FLUENT, Fluent USA Inc., 2002. Lebanon, NH, USA.uchs, N.A., 1964. Mechanics of Aerosols. Macmillan, New Y
pp. 151–159.inds, W.C., 1999. Aerosol Technology: Properties, Behavior
Measurement of Airborne Particles. Wiley, New York,121–128.
uang, C., Tsai, C., 2002. Influence of impaction plate diater and particle density on the collection efficiency of rounozzle inertial impactors. Aerosol. Sci. Technol. 36, 7720.
urcik, B., Wang, H.-C., 1995. On the shape of impactor efficicurves. J. Aerosol. Sci. 26, 1139–1147.

1028 S. Hari et al. / Nuclear Engineering and Design 235 (2005) 1015–1028
Lee, S., 2002. A slit impactor utilizing a transpirated impaction sur-face for the collection of bioaerosols. MS Thesis. Texas A&MUniversity.
Marple, V.A., Liu, B.Y.H., 1974. Characteristics of laminar jet im-pactors. Environ. Sci. Technol. 8, 648–654.
Rader, D.J., Marple, V.A., 1985. Effect of ultra-Stokesian drag andparticle interception on impaction characteristics. Aerosol. Sci.Technol. 4, 141–156.
White, F.M., 1991. Viscous Fluid Flow. McGraw-Hill, New York,pp. 105–135.