computational analyses, methods, and tools supporting
TRANSCRIPT

Computational Analyses, Methods, and Tools Supporting Cancer Biomarker
Identification and Targeted Therapy Development
A Thesis
Submitted to the Faculty
of
Drexel University
by
Pichai Raman
in partial fulfillment of the
requirements for the degree
of
Doctor of Philosophy
September 2016

ii
© Copyright 2016 Pichai Raman
All Rights Reserved.

iii
Dedications
To my parents, children, and wife. You give my life meaning.

iv
Acknowledgements
First, I would like to thank my advisor Dr. Aydin Tozeren for his support and
guidance throughout my research. His advice, patience, and support have been
invaluable and have shaped the way I think as a researcher and a scientist.
I am deeply grateful to committee member Dr. Amy Throckmorton. Her passion
for teaching and her research has been inspirational and I can only hope to
emulate it in some way. My sincerest gratitude goes to Dr. Ahmet Sacan for
being part of my committee and providing his guidance on my thesis and
project. I would like to thank my committee members from the Children's
Hospital of Philadelphia, Dr. Adam Resnick & Dr. Patrick Viatour. They have
helped me in countless ways and I consider it an honor to be involved in any
scientific endeavor they take part in.
Finally, I would like to acknowledge all my current & past colleagues & friends:
Gregg McAllister, Steve Marshall, Dr. Liam O’Connor, Dr. Stephen Cleaver, Dr.
Somnath Bandyopadhyay, Dr. Jess Mar, Dr. Deanne Taylor, Jeremy Leipzig, Dr.
Jim Zhang, Dr. Mike Xie, Dr. Patrick Warren, Dr. Eric Lim, Dr. John Maris and
last but not least Dr. Mahdi Sarmady for all his support at both CHOP and
Drexel.

v
Table of Contents
ListofTables.............................................................................................................................1
ListofFigures............................................................................................................................2
Abstract.......................................................................................................................................7
Chapter1:Introduction.....................................................................................................101.1CancerOverview......................................................................................................................101.2CancerPrognosis.....................................................................................................................121.3CancerTreatment....................................................................................................................131.4NextGenerationSequencing&TheCancerGenomeAtlas........................................161.5ProjectMotivationandSpecifications..............................................................................191.6KeyDifferentiationfromExistingworks.........................................................................211.7ThesisOrganization................................................................................................................22
Chapter2:FXYD5isamarkerforpoorprognosisandapotentialdriverformetastasisinovariancarcinomas..................................................................................232.1Summary.....................................................................................................................................232.2Background................................................................................................................................232.3MaterialsandMethods..........................................................................................................25
2.3.1 Data acquisition ........................................................................................................ 25 2.3.2 Statistical analyses .................................................................................................... 27
2.4Results&Discussion...............................................................................................................282.5Conclusion..................................................................................................................................35
Chapter3.Pancreaticcancersurvivalanalysisdefinesasignaturethatpredictsoutcomeandsuggestscandidategenetargetsfornoveltherapies...38

vi
3.1Summary.....................................................................................................................................383.2Background................................................................................................................................393.3Methods.......................................................................................................................................42
3.3.1 Pancreatic Cancer Gene List Development ......................................................... 42 3.3.2 Signature Development & ROC Analysis ........................................................... 44 3.3.3 Pathway Analysis and Druggability ..................................................................... 48 3.3.4 Target Discovery for Biologics and Immunotherapy ........................................ 49 3.3.5 Visualizations and statistical analysis .................................................................. 49
3.4Results&Discussion...............................................................................................................50
3.4.1 Discovery analysis .................................................................................................... 50 3.4.2 Survival Signature & Validation Studies ............................................................ 58 3.4.3 Drug Repositioning & Target Discovery ............................................................. 63
3.5Conclusion..................................................................................................................................66
Chapter4:AComparisonofSurvivalAnalysismethodsappliedonCancerGeneExpressionRNA-Sequencingdata...................................................................................684.1Summary.....................................................................................................................................684.2Background................................................................................................................................694.3Methods.......................................................................................................................................75
4.3.1 Data Sets ..................................................................................................................... 754.3.1.1TCGADataSets........................................................................................................................754.3.1.2SimulatedDataSets...............................................................................................................76
4.3.2 Survival Analysis Methods ..................................................................................... 774.3.2.1TheKaplan-Scanmethod.....................................................................................................774.3.2.2Dichotomizingbyquantiles................................................................................................784.3.2.3k-means.....................................................................................................................................784.3.2.4Coxregression.........................................................................................................................79
vii
4.3.2.5Distributiondichotomizationmethod............................................................................79 4.3.3 Different Metrics for Comparison of the Six Methods ..................................... 81
4.4Results&Discussion...............................................................................................................82
4.4.1 Assessment of reliability identifies k-means and Cox regression as the methods with the strongest performance. ..................................................................... 83 4.4.2 Accuracy assessment based on tumor type-specific positive controls also demonstrate that k-means and Cox regression outperform other survival analysis methods. ............................................................................................................................... 90 4.4.3 Testing for robustness using in silico data identifies Cox regression as the method that is least sensitive to different levels of noise. ........................................ 92
4.4Conclusions................................................................................................................................94
Chapter5:ThePITFITFrameworkforOncologyTargetIdentificationTranslationalResearch......................................................................................................965.1Summary.....................................................................................................................................965.2Background................................................................................................................................97
5.2.1 Target Identification ................................................................................................ 97 5.2.2 Target Prioritization ............................................................................................... 103 5.2.3 Model Selection ...................................................................................................... 112
5.3Methods....................................................................................................................................115
5.3.1 Target Identification .............................................................................................. 1155.3.1.1DataAcquisition...................................................................................................................1155.3.1.2CorrelationtoaGeneticLesion.......................................................................................1185.3.1.3VisualizationsandUserInterfaceSpecifications......................................................121
5.3.2 Target Prioritization ............................................................................................... 1255.3.2.1GeneFunction&CancerRelevanceDetermination..................................................1255.3.2.2DruggabilityandTargetabilityCandidategenes......................................................1355.3.2.3Prioritizationformulaforrankinggenes.....................................................................1405.3.2.4Visualization&UserInterfaceSpecifications.............................................................144
viii
5.3.3 Model Selection ...................................................................................................... 145
5.3.3.1ModelSelectionStrategies................................................................................................1455.3.3.2ModelSelectionImplementation....................................................................................149
5.4WorkingExampleofPITFIT..............................................................................................151
5.4.1 Working Example of the Target Identification Tool ....................................... 151 5.4.2 Working Example of the Target Prioritization Tool ........................................ 156 5.4.3 Working Example of the Model Selection Tool ............................................... 161
5.5Conclusions.............................................................................................................................164
Chapter6:Conclusion......................................................................................................1686.1Contributions.........................................................................................................................1686.2FutureWork...........................................................................................................................170
References............................................................................................................................172
Appendices...........................................................................................................................192AppendixA.....................................................................................................................................192AppendixB.....................................................................................................................................193AppendixC.....................................................................................................................................194AppendixD.....................................................................................................................................195AppendixE.....................................................................................................................................213AppendixF.....................................................................................................................................216AppendixG.....................................................................................................................................221AppendixH.....................................................................................................................................221
CurriculumVitae.................................................................................................................222

1
List of Tables
Table1.SOCTCGAstudycohortdemographicinformation................................26Table2.LiteraturereferencesofFXYD5associationwithcancer.....................29Table3.CancerGeneCensusclassifiedoncogenesthatarepartofthePancreaticCancerDEGList.........................................................................................................................56Table4.5-Genepancreaticcancersurvivalsignature............................................60Table5.PancreaticcancergenesfromDEGlistthathaveknowncompoundsandtherapiesdevelopedagainstthem....................................................................................64Table6.TableofAUCvaluesforeachcancerandmethod...................................90Table7.DatabasesandSourcesusedtoestablishcancerrelevance.............129Table8.DatabasesandSourcesusedinGeneMania............................................130Table9.ScoringMetricstoestablishdistancetotherapeuticmodalities..140Table10.TableofidealizedvectorsforTherapeuticModalities....................142Table11.GenesCorrelatedwiththeMYCOncogeneinOvarianCancer.....153Table12.ListofprioritizedTransmembranegenesassociatedwithMYCinPancreaticCancer..................................................................................................................157
2
List of Figures
Figure1.Relationshipbetweenthenumberofstemcelldivisionsandthelifetimeriskofcancerinagiventissue(Adaptedfrom[2]).Theobviouslineartrendshowscorrelationbetweenthesetwovariables.....................................................................................11Figure2.TargetedTherapymechanismsofActionbroadlycategorizedintosixbinsrepresentingdifferentaspectsofcancermolecularpathology(Adaptedfrom[5])..14Figure3.BarchartshowingthedistributionofcelllinesforcancersarisinginaparticulartissueorcelltypeinTheCancerCellLineEncyclopedia.................................20Figure4:FXYD5isamarkerforaggressiveOC,asdeterminedbytheTCGAdataset.Intersectionofgenessetswithelevatedgeneexpressionandelevatedcopynumber(A),Box-plotofshowingexpressionversusamplificationforFXYD5(B),Kaplan–MeiersurvivalcurvesshowingsurvivalbasedonFXYD5expressionandcopynumberdata,respectively(C,D)......................................................................................................32Figure5:FXYD5copy-numbervsmRNAexpressionscatter-plot....................................33Figure6.FXYD5asamarkerforaggressiveOC.Kaplan–MeiersurvivalcurvesshowingsurvivalbasedonFXYD5expressionofGSE49997andGSE18520microarraydatasets(A,B).Waterfallplotshowingtop50CCLElinesrankedbyFXYD5CopyNumber(C)......................................................................................................................35Figure7.DistributionofmaximumvalueforeachgeneintheTCGApancreaticcancerRNA-Seqdatasetwithacut-offtoindicategenesremovedfromanalysisbecauseoflowexpression...................................................................................................................43Figure8.HistogramshowingnumberofgenesthataresignificantinNiterationsorrunning‘limma’analysisontheICGCpancreaticcancerdataset......................................46Figure9.HeatmapshowingthecorrelationsofgenesrobustlyassociatedwithsurvivalintheICGCpancreaticcancerdataset.........................................................................47Figure10.DistributionofsurvivaltimesandcreationofgroupsinTCGA(Discovery)Dataset................................................................................................................................51Figure11.ClinicalsummaryinformationonthediscoverycohortgroupsfromTCGA.........................................................................................................................................................................52Figure12A)VolcanoplothighlightinggenesassociatedwithsurvivalinTCGA(Discovery)Dataset.B)VolcanoplotoftumorversusnormalpancreaticdatasetC)
3
VennDiagramofgenesfromtumorversusnormalanalysisandsurvivalanalysisD)ScatterplotofLogfoldchangefromtumorversusnormalcomparisonandLogfoldchangefromsurvivalanalysiswithsignaturegenesselected.............................................54Figure13.VennDiagramofPancreaticCancerDEGlistwithotherpublishedsignatures...................................................................................................................................................58Figure14.A)ROCcurvedemonstratingpredictivepowerofpancreaticsurvivalsignatureinPancreaticICGCDatasetB)ROCcurvedemonstratingpredictivepowerofpancreaticsurvivalsignatureinGSE57495C)ROCcurvedemonstratingpredictivepowerofpancreaticsurvivalsignatureinGSE71729D)ComparisonofnulldistributionofAUCvaluestoAUCofpancreaticsurvivalsignaturebasedonPancreaticICGCDatasetE)ComparisonofnulldistributionofAUCvaluestoAUCofpancreaticsurvivalsignaturebasedonGSE57495F)ComparisonofnulldistributionofAUCvaluestoAUCofpancreaticsurvivalsignaturebasedonGSE71729................61Figure15A)Kaplan-meierplotdemonstratingpredictivepowerofpancreaticsurvivalsignatureinPancreaticICGCDatasetB)Kaplan-meierplotdemonstratingpredictivepowerofpancreaticsurvivalsignatureinGSE57495C)Kaplan-meierplotdemonstratingpredictivepowerofpancreaticsurvivalsignatureinGSE71729.......62Figure16A)TumorversusallnormalWaterfallPlotB)ExampleTumorversuspan-normalboxplotofMSLNC)ExampleTumorversuspan-normalboxplotofCEACAM6....................................................................................................................................................66Figure17.Outlineofthemethodsusedtoidentifygeneexpressionbasedcancerbiomarkers.................................................................................................................................................73Figure18.A)Scatterplotofnegativelog10ofp-valuesforallgenesinSet1vsSet2foreachcanceracrossallmethods.B)BarChartofcorrelationforeachmethodacrossallcancers.....................................................................................................................................85Figure19.Heatmapofcorrelationofthenegativelog10ofp-valuesforeachmethodandcancer.................................................................................................................................86Figure20.FirstthreeprincipalcomponentsofPCAplottedforallcancers................87Figure21.Log-foldchangeofgenesversuspercentageofnumberofsamplesgreaterthanthreshold,coloredbycancertype.........................................................................89Figure22.ROCcurvesforeachcancercoloredbymethodtype.......................................91Figure23.ROCcurvesandAUCscatterplotforeachmethodappliedonartificialdatawithvariouslevelsofnoise......................................................................................................94
4
Figure24.LollipopviewofBRAFmutationsincBioPortalindicatingthenumberofmutationsataparticularbaseinagene.Regionsinthegenearecoloredbyproteindomaintoshowenrichmentofmutationsinparticularfunctionalmodulesofaprotein(createdusing[30])............................................................................................................100Figure25.NetworkviewofgenessurroundingandthatconnectMYCNandCD19utilizinginteraction,co-expression,pathway,anddomaininformationfromanumberofdifferentsources............................................................................................................106Figure26.Kaplan-MeierSurvivalAnalysisplotofFXYD5intheTCGAovariancancerdataset.Samplesaredividedintotwogroups,high(Red)andlow(Blue)FXYD5expressors................................................................................................................................108Figure27.ConfidenceofcellularlocationoftheALKgenebasedontheCOMPARTMENTSdatabase,anintegratedresourcefordefininggenelocation.Proteinismorelikelytobefoundinareasshadedingreen,inthiscase,theplasmamembrane...............................................................................................................................................110Figure28.Box-plotofnormaltissuemRNAexpressionofthePRM1genebasedontheGTExexpressionstudy.Tissuesofthesameoriginarerepresentedbythesamecolor...........................................................................................................................................................111Figure29.AnalyticsandstatisticsabouttheCancerCellLineEncyclopedia.FigureAisaheatmapshowingthenumberofcelllinesofaparticularlineage.FigureBshowsthecorrelationbetweentissues.FigureCisheatmapshowingcorrelationbetweencancercelllinesofaparticularlineageandprimarytumorsfromtheexpressionOncology(expO)study.FigureDshowsthecorrelationbetweenprimarytumormutationfrequenciesintheCOSMICdatabaseandmutationalfrequenciesintheCCLE...........................................................................................................................................................114Figure30.PlotofMean-VarianceTrendintheVoompackagethatisusedtotransformcountdatasothatitcanbeeanalyzedusinglinearmodelswithinthe‘limma’package.....................................................................................................................................120Figure31.PITFITTargetDiscoveryTableviewshowingthegenenameandFold-Changeandstatisticsrepresentingcorrelationtoaparticularclinicalorgenomicfeature.......................................................................................................................................................122Figure32.PITFITTargetDiscoveryVolcanoPlotviewshowingwithFold-ChangeontheX-axisandAdjustedP-ValueontheY-axis(logscaledandreversed)representingcorrelationtoaparticularclinicalorgenomicfeature.Thingsthatmeetthecut-offorcorrelation/associationarecoloredinred................................................124Figure33.PITFITTargetDiscoveryHeatmapviewshowingrawvaluesforgeneshighlycorrelatedtoaparticularclinicalorgenomicfeature.Dataisscaledonagene-wisebasisandcoloredbyrelativeabundanceofexpression...........................................125
5
Figure34.cBioPortalvisualizationofPIK3CAgenealterationsinvariousdatasets.Colororbarindicatestypeoflesionandcoloredcircleunderneaththebarindicatesthetypeofcancer.Barsaresortedbyalterationfrequencyinthedataset(createdusing[30])...............................................................................................................................................128Figure35.DiagramshowingthepathtakeninanundirectedacyclicgraphusingtheBreadth-FirstSearchalgorithm.....................................................................................................132Figure36.ExampleofPositionWeightedMatrixshowninFigureAwithColumnsindicatingrelativepositionandrowsindicatingconfidenceofeachbaseintheposition.FigureBisaSeqLogorepresentationofFigureAwithsizeofthebasecorrespondingconfidenceofthatparticularbaseinthatposition................................133Figure37.VennDiagramofthetransmembranecallsbasedonGeneOntology,theConservedDomainDatabase,andtheSurfaceomedatasource......................................138Figure38.Box-plotofnormaltissueshowingthenumberofsamplesofeachtissuetypeintheGTExexpressionstudy.Tissuesofthesameoriginarerepresentedbythesamecolor...............................................................................................................................................139Figure39.PITFITTargetprioritizationdatatableview....................................................144Figure40.Bimodaldistributionofacontinuousvariableisportrayedwithlinesindicatingthemode,median,and,andmeanoftheoveralldistrubtion......................146Figure41.ProcedurearoundGreedyAlgorithmtochoosecelllines.RowsintheTablerepresentcelllinesandcolumnsaregenes.Thesumcolumnistheobjectivefunctionwhichassignsavaluetoeachsolution.Flowchartonleftshowshowthesolutionisiterativelygrownandthesolutionfunctionthatindicateswhenthesolutioniscomplete............................................................................................................................148Figure42.TableshowingthecelllinesandassociatedvaluesthatarepartofthePITFITvalidationtool.Valuesareshowninlogscale..........................................................150Figure43.PITFITVolcanoPlotshowinggenescorrelatedtotheMYCOncogeneinPancreaticCancer.PointscoloredinredrepresentgeneshighlycorrelatedwiththeMYConcogene........................................................................................................................................155Figure44.NormaltissuegeneexpressionoftheP2RX5genebasedontheGTExnormalexpressiondataset.Barsarecoloredbasedonthetissuetype........................159Figure45.ScatterplotofP2RX5mRNAexpressioncomparedtoMYCmRNAexpressionfromanRNA-SeqexperimentintheTCGApancreaticcancerdataset.Dataislogtransformedforboth....................................................................................................160

6
Figure46.ThemRNAgeneexpressionoftheP2RX5geneinasetofPancreaticCancercelllinesfromtheCCLE.Thewaterfallplotisorderedindescendingvalueswithcelllineswiththehighestexpressionpresentedontheleft...................................162Figure47.Heatmapofcelllinesandgenes,showingwhichcelllinesaremodels(blue)forparticulargenesandwhichone’sarenot(red).Therowsarethegenesandthecolumnsarepancreaticcelllines..................................................................................163

7
Abstract
Over time, much has been done in attempt to understand the various causes and
complex molecular mechanisms of cancer, yet it still represents one of the
leading causes of mortality worldwide. Fortunately, cancer therapeutics have
evolved, from broad chemotherapies with multiple harsh side effects to
molecular missiles which target specific cancer causing genes, leaving a patient’s
normal cells largely untouched. Similarly, cancer detection strategies and
prognosis methods have also advanced, allowing doctors and patients to better
manage and control the disease. The main challenge currently is to identify those
genes that are specific markers for a particular cancer and can inform prognosis
and those that may be “targeted therapies”. This can be accomplished most
rapidly through the use of large-scale cancer genomic datasets and sophisticated
integrative analyses, methods, and tools to detect and prioritize candidate genes
and biomarkers.
As such, the goal of this work is to develop analyses, methods, and frameworks
that benefit the translational research community by identifying and prioritizing
genes for biomarker and drug development. Specifically, using integrative
approaches on The Cancer Genome Atlas (TCGA) and various datasets from
Gene Expression Omnibus (GEO), we perform analyses to identify a marker of
survival and Epithelial–mesenchymal transition (EMT) in ovarian serous
adenocarcinoma and a 5-gene signature of survival and molecular subtype in
8
pancreatic ductal adenocarcinoma. Additionally, we highlight associated
oncogenic pathways and suggest potential therapeutic strategies in these
analyses. In order to improve detection of these survival markers we also
evaluate a suite of techniques used commonly in the literature for survival
analysis and determine best practices when using RNA-Sequencing data. Finally,
we develop an application that allows researcher to access cancer ‘big data’ and
apply their experience and domain expertise alongside the application logic of
the tool to identify survival markers, therapeutic avenues, and genes that may
represent an ‘Achilles heel’ for a set of tumors.
This undertaking involves many different facets of bioinformatics, including
statistical methods of analysis, high-performance computing, graph theory, web
programming, and UI/UX interaction, as well as domain expertise in cancer
target discovery. While there is much activity in the translational cancer
informatics domain, the current study adds to the wealth of knowledge and tools
in the community and presents another foothold to gain novel insights into this
devastating disease.

9

10
Chapter 1: Introduction
1.1 Cancer Overview
There are roughly 1.6 million new cancer cases in America every year.
Furthermore, as cancer risk increases with age, and our life expectancy slowly
keeps increasing, one can only assume this number will grow larger [1]. While
there are a number of environmental variables and actions known to increase
cancer risk, such as smoking, eating red meat, and exposure to asbestos, cancer is
still largely believed to be due to random chance. A paper released recently by
Vogelstein et al, demonstrated that the risk for a particular cancer increases with
number of cell divisions for the corresponding tissue of origin [2]. The main
figure from the paper taken from the Surveillance, Epidemiology, and End
Results (SEER) database shown below demonstrates this.
11
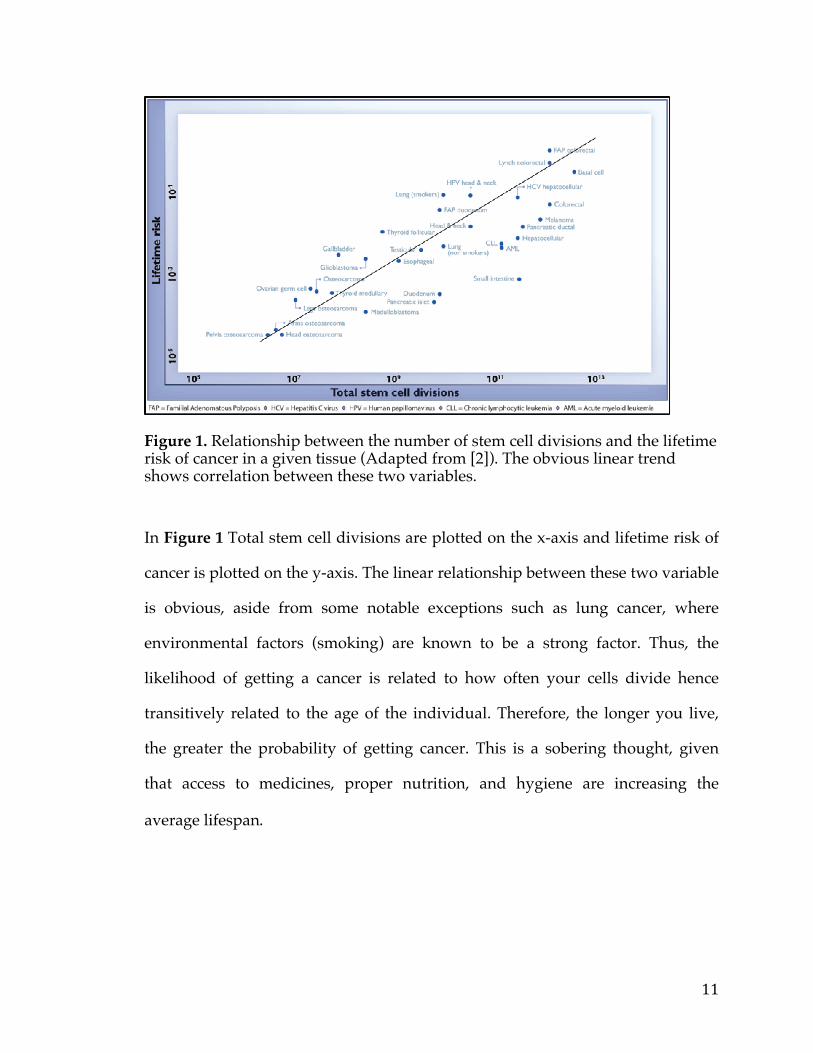
Figure 1. Relationship between the number of stem cell divisions and the lifetime risk of cancer in a given tissue (Adapted from [2]). The obvious linear trend shows correlation between these two variables.
In Figure 1 Total stem cell divisions are plotted on the x-axis and lifetime risk of
cancer is plotted on the y-axis. The linear relationship between these two variable
is obvious, aside from some notable exceptions such as lung cancer, where
environmental factors (smoking) are known to be a strong factor. Thus, the
likelihood of getting a cancer is related to how often your cells divide hence
transitively related to the age of the individual. Therefore, the longer you live,
the greater the probability of getting cancer. This is a sobering thought, given
that access to medicines, proper nutrition, and hygiene are increasing the
average lifespan.

12
1.2 Cancer Prognosis
For individuals diagnosed with cancer one important issue is prognosis and risk
assessment. This is an integral question as cancer prognosis can largely dictate
the course of treatment and therapy (or if it is used at all). Importantly, it has a
great impact on various aspects of the lives of the patient and their families,
including how they plan for the future. Prognosis has been largely dictated by a
staging system, which takes into account your age and health status before
diagnosis, type of cancer, the size and grade of the tumor, and how much the
tumor has spread [3]. This is largely limiting, and in many types of cancers has
not been a sufficient marker to determine survival. Only recently have genetic
markers such as amplification or mutational status of certain oncogenes been
employed in conjunction with the traditional staging system to more accurately
assess risk [4,5]. Extending this, large-scale cancer profiling studies that
characterize all the protein coding genes in a tumor at the DNA and RNA level
offer the prospect to further improve risk assessments. Analyzing data in search
of markers that influence survival at the single gene or multi-gene levels offers
numerous avenues to fine-tune prognosis. Specifically RNA markers or sets of
markers, often deemed a signature, lend themselves quite well as predictive
entities since they are downstream of DNA events and thus can capture
activation of genes and pathways that may be missed when assaying at the
genetic level. Propitiously, many of these same markers may also serve
functional roles and thus provide insight into the biology of the cancer.
Furthermore, they offer the opportunity for novel therapies to be developed.

13
1.3 Cancer Treatment
In the past, cancer therapeutics have primarily been focused on killing rapidly
dividing cells through either compounds or radiation that impair DNA-Synthesis
[6]. While this does have the effect of killing cancer cells and slowing cancer
growth, in some cases the cancer is refractory to treatment and furthermore,
rapidly dividing normal cells are equally damaged by treatment. Hence, many
chemotherapies have multiple undesirable side effects such as mucositis,
alopecia, and depression [7].
Fortunately, in recent years cancer therapeutics have shifted from harsh
chemotherapies to personalized targeted medicines. This change is the result of
large-scale cancer profiling studies that reveal the heterogeneous nature of this
disease. These studies also allow for the identification of novel proteins that are
drivers or accelerators of tumourigenesis and metastasis, which in turn are then
modeled to generate targeted therapies.
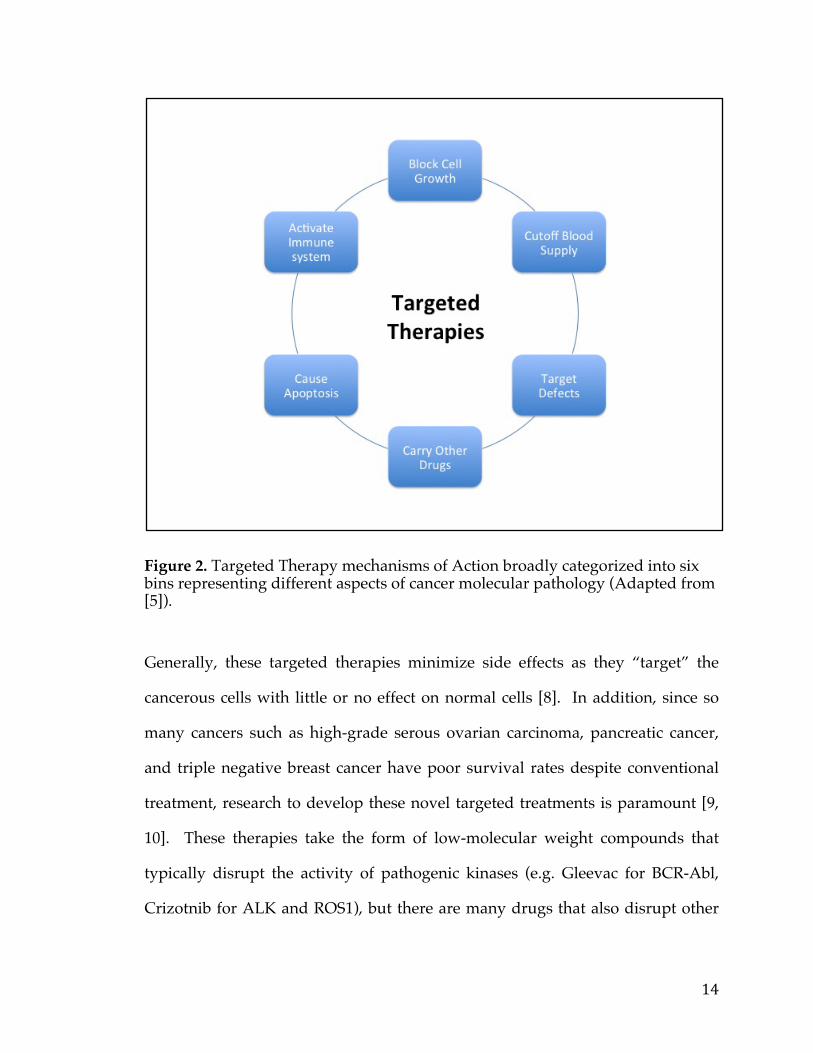
14
Figure 2. Targeted Therapy mechanisms of Action broadly categorized into six bins representing different aspects of cancer molecular pathology (Adapted from [5]).
Generally, these targeted therapies minimize side effects as they “target” the
cancerous cells with little or no effect on normal cells [8]. In addition, since so
many cancers such as high-grade serous ovarian carcinoma, pancreatic cancer,
and triple negative breast cancer have poor survival rates despite conventional
treatment, research to develop these novel targeted treatments is paramount [9,
10]. These therapies take the form of low-molecular weight compounds that
typically disrupt the activity of pathogenic kinases (e.g. Gleevac for BCR-Abl,
Crizotnib for ALK and ROS1), but there are many drugs that also disrupt other
15
enzymes (e.g. Abiraterone and CYP17A1) to disrupt pro-survival or augment
apoptotic pathways as shown in Figure 2 [11, 12, 13, 14].
The main drawback of using low-molecular weight compounds is the time and
cost required to develop the final drug. Typically, even after a gene target (or
fusion protein) is identified, it takes years to develop a drug that could go into a
Phase I trial. This amount of time is required due to a number of steps: 1)
Identification of a suitable model /assay development and high-throughput
screen across a compound deck of millions of compounds to identify hits and
compound classes of interest; 2) Hit- to-lead where “hits” are optimized and
IC50’s are determined; 3) Lead optimization in which Structure-activity
relationship (SAR) is employed and 4) Preclinical research, in which animal
models are used to check PK/PD, ADME and toxicity [15]. In addition, many of
these compounds, while efficacious against the target of interest, have some off-
target related toxicity [16]. One study found a particular targeted small molecule
inhibitor, torcetrapib , to hit as many as 6 other different proteins [17].
As compared to this, more recent “biologic” therapies have the advantage of
both cutting time/cost and providing greater specificity. These therapies
typically take the form of functional monoclonal antibodies (mAB), bi -specific
antibodies, antibody-drug Conjugates (ADC), and more recently Chimeric
antigen receptor therapy (CARs). These generally fall under the heading of
“Cancer Immunotherapy”because they employ or utilize the immune system in
order to combat the cancer [18, 19].
16
Currently, many of these therapies are already being used in the clinic to combat
a variety of cancers, with sometimes stunning results. For instance, the VEGF
inhibitor Avastin (mAB) is used in a number of cancers such as colorectal cancer,
non-small -cell lung cancer and renal cell carcinoma [20]. Similarly, the ADC
Adcentris, a CD30 inhibitor, is also employed in 2 distinct cancers [21]. Most
recently CTL019, the CART T Cell therapy that kills CD19 expressing cells has
been shown to have dramatic effects on patients (some terminal) with chronic
lymphocytic leukemia (CLL) and acute lymphoblastic leukemia (ALL) [22].
1.4 Next Generation Sequencing & The Cancer Genome Atlas
The first step toward generating novel molecular prognostic assays and targeted
therapies is defining the pathways or genes being targeted. This involves
identifying a protein or functional network that either has relevance and
promotes tumorigenesis or is expressed preferentially in the cancer (as compared
to normal tissues). As such, to initiate the development of novel treatments, it is
important to determine these pathogenic or cancer-associated entities.
Determination cannot be accomplished without high-throughput genomic and
Next Generation Sequencing (NGS) data on large cohorts of samples. NGS is a
blanket term, used to describe a host of sequencing platforms that can identify
the specific base-pairs in the DNA & RNA that make up the genome and
transcriptome, respectively [23].
17
NGS data and other high-throughput genomic profiling technologies
(quantitative Mass Spec, molecular screens, etc.) are required, as cancer, like
most diseases is caused by changes at a molecular level. Hence, we need to
profile and examine the DNA, RNA, Proteome, Methylome and other facets of a
tumor sample to determine the aberrations that could be driving it. Large
numbers of patients are needed in these sorts of studies, as cancer is highly
heterogeneous and thus a given cancer really represents a host of diseases that,
while exhibiting a similar phenotype, have different underlying molecular
mechanisms [24, 25]. Therefore, large numbers allow for the statistical power
necessary to differentiate true driver events from passenger mutations—random
mutations arising in a tumor cell that have no real functional consequence.
Fortunately, there are many large initiatives that have profiled large cohorts with
a variety of different technologies. The most famous of these is the Cancer
Genome Atlas (TCGA). The TCGA is a large multi-institution initiative started in
2006 by the National Cancer Institute (NCI) and National Human Genome
Research Initiative (NHGRI), with a goal to profile 20 different types of cancers,
with large number of samples (500+), characterized with a number of different
platforms. Currently, there are over 10,000 samples comprising about 33 different
cancers, and this resource is considered the most comprehensive repository of
human cancer molecular and clinical data to date [26].
Tumors profiled by TCGA range from solid to liquid types, from mildly to
severely aggressive in terms of survival and from benign to metastatic, thus

18
covering a large swath of phenotypes. TCGA samples will typically be profiled
in terms of expression, copy number status, mutation status, methylation, and
protein levels so one can get a comprehensive view of the molecular
characteristics of the cancer samples. Using this data, one can look for recurrent
features in a number of dimensions, thus increasing the likelihood of finding a
relevant oncogene or an Achilles heel for the tumor type that can be exploited
with the new wave of therapies. Indeed, 20 landmark papers have already been
published by the TCGA, but there is still much to glean from the data.
There is still a significant dearth of targeted therapies; cancer is far from being a
solved problem. Thus, further analysis is still needed on these large-scale studies
with a focus on integrating various data sets to remove bias and increase
statistical power. These analyses, translational in nature, must concentrate on
identifying prognostic and predictive markers or isolating proteins and
pathways that can be targeted. Additionally, research into techniques and
methods for translational informatics is also integral to ensure accuracy in
hypothesis generated. Finally, in order to further the translational research
narrative, lowering the barrier to entry, developing tools and applications that
allow for ease of access, interpretation, analysis, and visualization is also
necessary. Increasing the researcher user-base and fostering an egalitarian
approach to research will hopefully elevate the probability of significant
translationally relevant findings.
19
1.5 Project Motivation and Specifications
Given this, the main goal of this project, is to perform analyses, evaluate
methods, and develop frameworks to support translational research. The central
hypothesis is that through the integration of multiple datasets and knowledge
bases, we can elicit high-quality prognostic markers and targets. This work is
motivated by a lack of cancer biomarkers and an interest in increasing the
number of targeted therapies given the high occurrence of relapse in many
cancers [27]. The product of this work will generate, and enable researchers to
generate, high-confidence targets, biomarkers, and signatures through the
amalgamation of large-scale genomic data and other structured data resources.
Specifically, this project comprises four endeavors: two separate analyses geared
at identifying prognostic expression markers and highlighting potential
therapeutic avenues; a study performed to evaluate methods used to ascertain a
prognostic marker; and an application furnished to enable translational
researchers to discover biomarkers and identify therapeutic avenues. The first
analysis is performed on ovarian cancer and attempts to identify prognostic
markers using both copy number and gene expression data. It further utilizes the
literature and other knowledge base to pinpoint genes of interest. The second
analysis is performed on pancreatic cancer and attempts to detect a predictive
gene expression signature using a host of tumor and normal data sets. This study
additionally identifies novel avenues for targeted treatment and development.
The subsequent work evaluates a host of techniques for discovery of gene
expression survival markers. It utilizes an empirical approach to ascertain which
20
statistical methods work best, relying on both positive controls, accuracy, and in
silico data. This work was of course fueled by a desire to ensure best practices are
used while conducting discovery cancer research. Finally, utilizing code
frameworks built in the first three efforts, the final work is a pipeline and
application designed to support translational and target discovery. This tool will
identify targets using large-scale genomic data, suggest potential therapies based
on knowledge bases, and make relevant suggestions for experimental follow-up
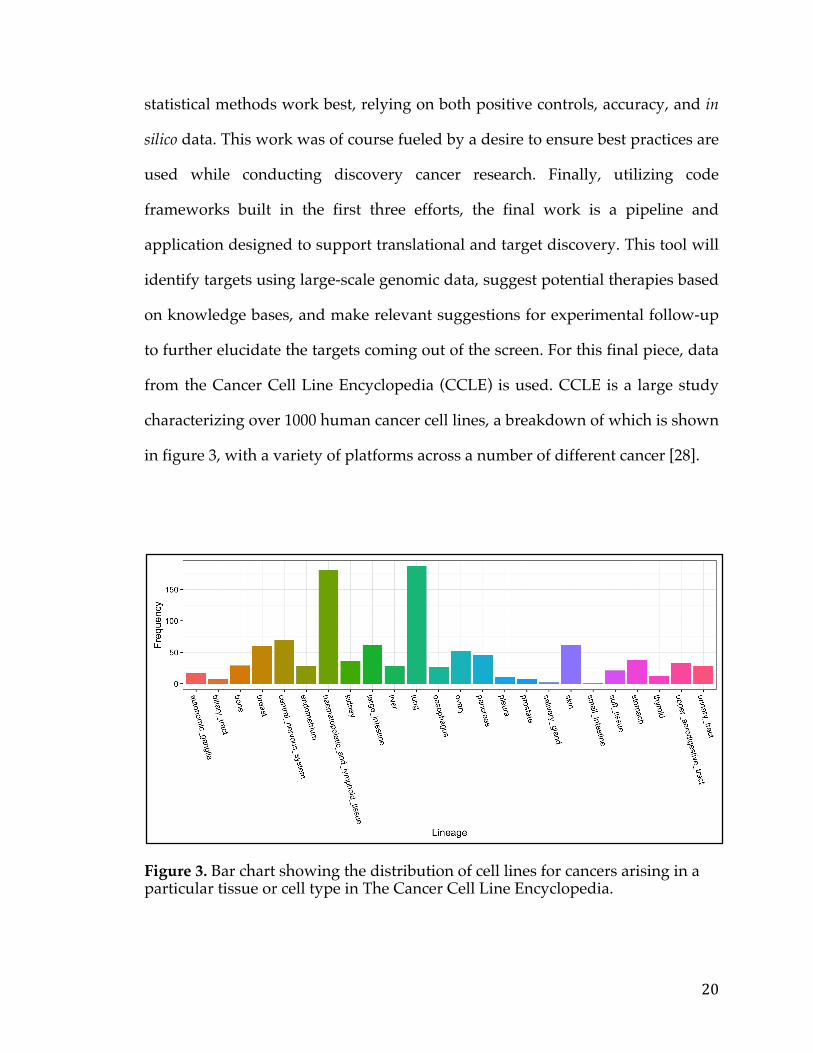
to further elucidate the targets coming out of the screen. For this final piece, data
from the Cancer Cell Line Encyclopedia (CCLE) is used. CCLE is a large study
characterizing over 1000 human cancer cell lines, a breakdown of which is shown
in figure 3, with a variety of platforms across a number of different cancer [28].
Figure 3. Bar chart showing the distribution of cell lines for cancers arising in a particular tissue or cell type in The Cancer Cell Line Encyclopedia.
21
1.6 Key Differentiation from Existing works
The field of translational cancer research is highly engaged and publications arise
daily in a myriad of cancer related journals. However, the ovarian and pancreatic
cancer studies rarely take advantage of utilizing a multi-dataset/platform
approach and incorporate knowledge bases where appropriate. While data
integration of this sort is not a new concept, my studies on ovarian and
pancreatic cancer do identify novel gene expression markers and targeted
therapies. Similarly, while survival analysis is certainly not novel, the work
evaluating techniques for cancer survival gene expression marker discovery,
specifically in the case of RNA-Sequencing data, has not been performed or
published in the literature by any other group as of yet. Finally, it should be
noted that while there are a few very good applications / web portals that allow
people to interrogate large-scale cancer studies such as the cBioPortal (Memorial
Sloan Kettering), the Tumor Portal (Broad Institute), or the Pediatric Genome
Project (St. Jude), the primary use cases are very hypothesis driven [29,30,31]. As
compared to this, the proposed research application would actually generate
hypothesis, suggest candidate drivers, and integrate information from other
resources. Overall, these targeted analyses, methods evaluation and application
represent something novel in the cancer translational informatics space and can
potentially have academic and industry utility in cancer target discovery and
resolution.
22
1.7 Thesis Organization
The presented thesis is organized as follows. Chapter 2 details the ovarian cancer
survival analysis that uses TCGA ovarian cancer copy number and (TCGA and
GEO) expression data to identify a survival marker with a potential therapeutic
role. Chapter 3 comprises the pancreatic cancer analysis, which utilizes TCGA
and multiple GEO datasets to develop a gene signature predictive of survival
and propose novel targets for therapeutic intervention. Chapter 4 concerns an
evaluation of techniques for survival analysis using gene expression markers. It
uses a host of TCGA datasets, in silico data, and positive controls to make
suggestions about best practices in gene expression survival marker discovery
efforts. Chapter 5 delves into the PIpeline To FInd Targets (PITFIT) application
that performs target discovery, prioritization, and model selection. Finally,
chapter 6 will conclude the thesis by summarizing the main opportunities these
works will help create. In addition, future work and additions/extensions to
these works to further cancer translational research will be considered.

23
Chapter 2: FXYD5 is a marker for poor prognosis and a potential driver for metastasis in ovarian carcinomas
2.1 Summary
Ovarian cancer is a leading cause of cancer mortality but aside from a few well-
studied mutations, very little is known about its underlying causes. As such, we
performed survival analysis on ovarian copy number amplifications and gene
expression datasets presented by The Cancer Genome Atlas in order to identify
potential drivers and markers of aggressive ovarian cancer. Additionally, two
independent datasets from the GEO web platform were used to validate the
identified markers.
Based on our analysis we identified FXYD5, a glycoprotein known to reduce cell
adhesion, as a potential driver of metastasis and a significant predictor of
mortality in ovarian cancer. As a marker of poor outcome, the protein has
effective antibodies against it for use in tissue arrays. FXYD5 bridges together a
wide variety of cancers including ovarian, breast cancer stage II, thyroid,
colorectal, pancreatic, and head and neck cancers for metastasis studies.
2.2 Background
24
Ovarian cancer (OC) represents one of the leading causes of cancer
mortality, exhibiting a 5-year survival rate of 44% [32]. The serous ovarian cancer
(SOC) high-grade subtype is one of the most aggressive and metastatic forms of
cancer [33]. A number of previous studies focused on identifying the major
genetic events that characterize and drive OC [34-36]. TP53 mutations, CCNE1
amplifications, BRCA1/2 (and associated Homologous Recombination Pathway)
aberrations, along with a few highly recurrent mutations or pathways have been
observed to be associated with tumourigenesis in SOC [33,37].
The need to better characterize the molecular genetics driving and
accelerating OC have paved the way for large-scale studies with big cohorts
profiled by a number of different ‘omics’ technologies. One such study, The
Cancer Genome Atlas (TCGA), profiled 572 different SOC tumours with RNA-
Seq, Gene Expression Microarray, SNP 6.0 (Copy Number), and a number of
other different platforms in addition to capturing clinical endpoints [37]. A
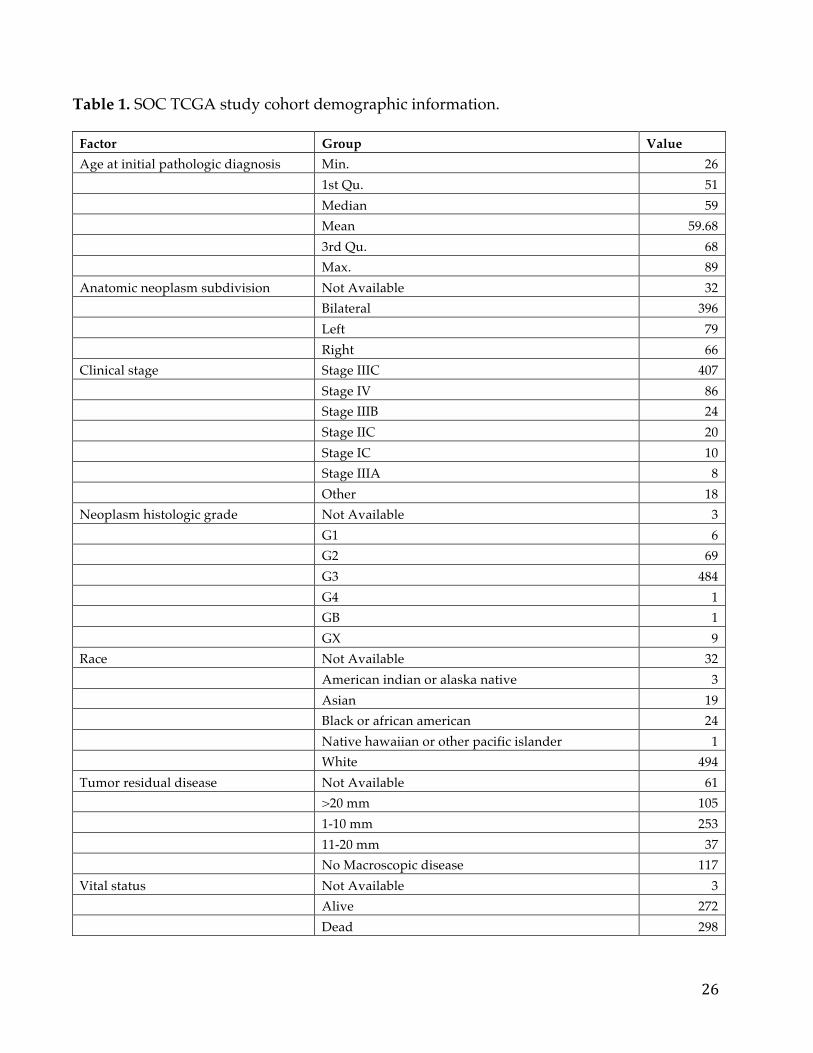
breakdown of the key characteristics of the SOC study cohort is shown in Table
1. The large sample size is especially important as cancer is recognized as being a
heterogeneous disease, and thus finding drivers or genes playing a role in
aggressiveness in a fraction of tumours is severely limited by small cohorts.
The goal of this analysis was to determine genes whose expression and
copy number changes associated with survival in SOC, even if the relative subset
of patients were a small percentage. To this end, we initially used the TCGA SOC
data to determine relevant survival-associated genes and then confirmed our
discoveries with additional similar datasets available in the public domain.
Results point to copy number amplification (CNA) and elevated gene expression
levels of FXYD5 to be markers of poor survival in SOC.
25
2.3 Materials and Methods
2.3.1 Data acquisition
TCGA SOC Affymetrix Human Genome U133 Plus 2.0 microarray gene
expression data was obtained from TCGA Data Portal by using the ‘Data Matrix’
method (https://tcga-data.nci.nih.gov/tcga/tcgaDownload.jsp). TCGA copy
number data was collected with the help of the Cancer Genomics Data Server R
(cgdsr) package (version 1.1.30) in R (version 2.15.3). Using a tool developed at
MD Anderson, it was verified that the expression and copy number data did not
suffer from significant batch effects
(http://bioinformatics.mdanderson.org/tcgambatch/). The Vienna OC dataset
(GSE49998), profiled on ABI Microarray version 2, was acquired for validation
from the Gene Expression Omnibus (GEO) using the GEOquery (version 2.13)
package in R. Also for further validation, the MGH's high-grade SOC expression
dataset (GSE18520), profiled on the Affymetrix Human Genome U133 Plus 2.0
array, was selected from NCBI's Entrez GEO DataSets database.
26
Table 1. SOC TCGA study cohort demographic information.
Factor Group Value Age at initial pathologic diagnosis Min. 26 1st Qu. 51 Median 59 Mean 59.68 3rd Qu. 68 Max. 89 Anatomic neoplasm subdivision Not Available 32 Bilateral 396 Left 79 Right 66 Clinical stage Stage IIIC 407 Stage IV 86 Stage IIIB 24 Stage IIC 20 Stage IC 10 Stage IIIA 8 Other 18 Neoplasm histologic grade Not Available 3 G1 6 G2 69 G3 484 G4 1 GB 1 GX 9 Race Not Available 32 American indian or alaska native 3 Asian 19 Black or african american 24 Native hawaiian or other pacific islander 1 White 494 Tumor residual disease Not Available 61 >20 mm 105 1-10 mm 253 11-20 mm 37 No Macroscopic disease 117 Vital status Not Available 3 Alive 272 Dead 298
27
2.3.2 Statistical analyses
Survival analysis was performed on TCGA's copy number and expression data
using the Mantel-Haenszel log-rank test and Cox proportional hazard regression
in the Survival package (version 2.37-7) of R. As copy number and expression
values are continuous variables, we incorporated a scanning approach to the
Kaplan-Meier method by moving samples between the two groups to define the
best p-value as the breakpoint or separation point. For instance, for a particular
gene the expression values were sorted. Upon sorting the bottom 5% were
assigned to group 1 and the top 95% were assigned to group 2. This step serves
to convert this continuous variable into a binary variable for subsequent survival
analysis. At this point the log-rank test was run on the two groups (group 1 and
group 2) and a p-value was calculated. In the subsequent step the smallest
sample from group 2 was transferred to group 1 and the log-rank test was run
again. This moving of samples iteratively continued until group 1 encapsulated
the bottom 95% of values and group 2 held the top 5% of values. The lowest p-
value was then chosen as the optimal breakpoint of the two groups and reported.
A Benjamini-Hochberg correction was performed on all the p-values generated
from this scanning approach to reflect the presence of multiple-hypotheses
testing. Consider for example, 100 samples of data; one would end up running 90
different log-rank tests for a given gene using this approach. The multiple-
hypothesis problem grows linearly with the sample size. In the end, both the
original and corrected p-values were returned at the optimal breakpoint (lowest
p-value) for each gene. At this point this same exercise was performed using the
28
copy number data for each gene. Although, many times, studies bin copy-
number data into “amplified”, “deleted”, “neutral” this may not accurately
reflect the clonal nature of the cancer. Some proportion of the cells in a sample
dataset may have high gains whereas others might have “neural” copy numbers.
The eventual copy number reported than actually represents an average of the
clonal populations in the sample, thus hiding a subset with highly amplified
copy number. Hence the rational for us treating the copy number as a continuous
value and using the aforementioned Kaplan-scanning approach. At the end of
this step, we had statistics on how the copy-number and expression levels of all
genes profiled, correlated with survival. Data is not available yet in the literature
to track how the copy number profiles for genes change for a patient reflecting
how clonal population percentages oscillate.
For our candidate hypothesis selection step we chose genes having an
adjusted p-value of less than 0.05 in both the expression and copy number
analysis, ensuring these genes had correlated expression and copy number data.
Visualization of results was performed using ggplot2 (version 0.9.3.1) and
VennDiagram (version 1.6.5) packages in R. The procedure was employed for
both the discovery (TCGA) and validation datasets (GEO).
2.4 Results & Discussion
The Kaplan-Meier scan on the copy number identified 128 genes, as
associated with survival, meeting the Benjamini-Hochberg corrected p-value <
0.05 cutoff criteria. A similar analysis using the expression data yielded 158
genes. The intersection of these two lists (Figure 4A) subsumed 4 genes
29
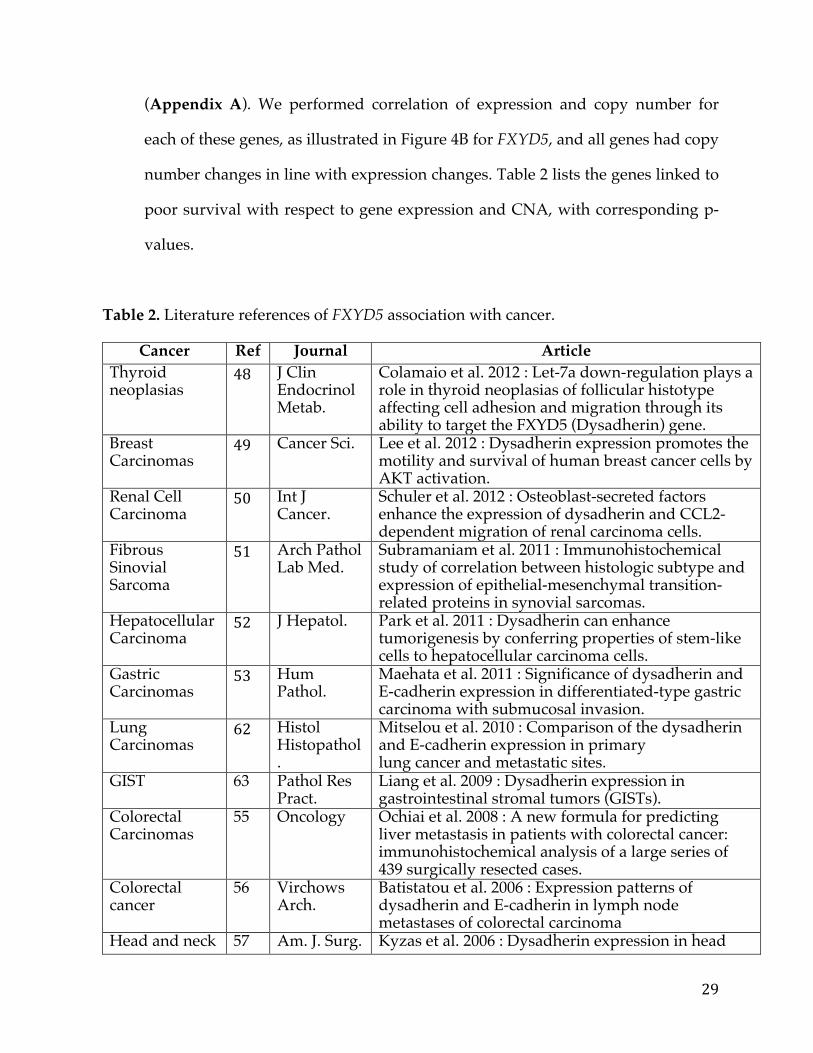
(Appendix A). We performed correlation of expression and copy number for
each of these genes, as illustrated in Figure 4B for FXYD5, and all genes had copy
number changes in line with expression changes. Table 2 lists the genes linked to
poor survival with respect to gene expression and CNA, with corresponding p-
values.
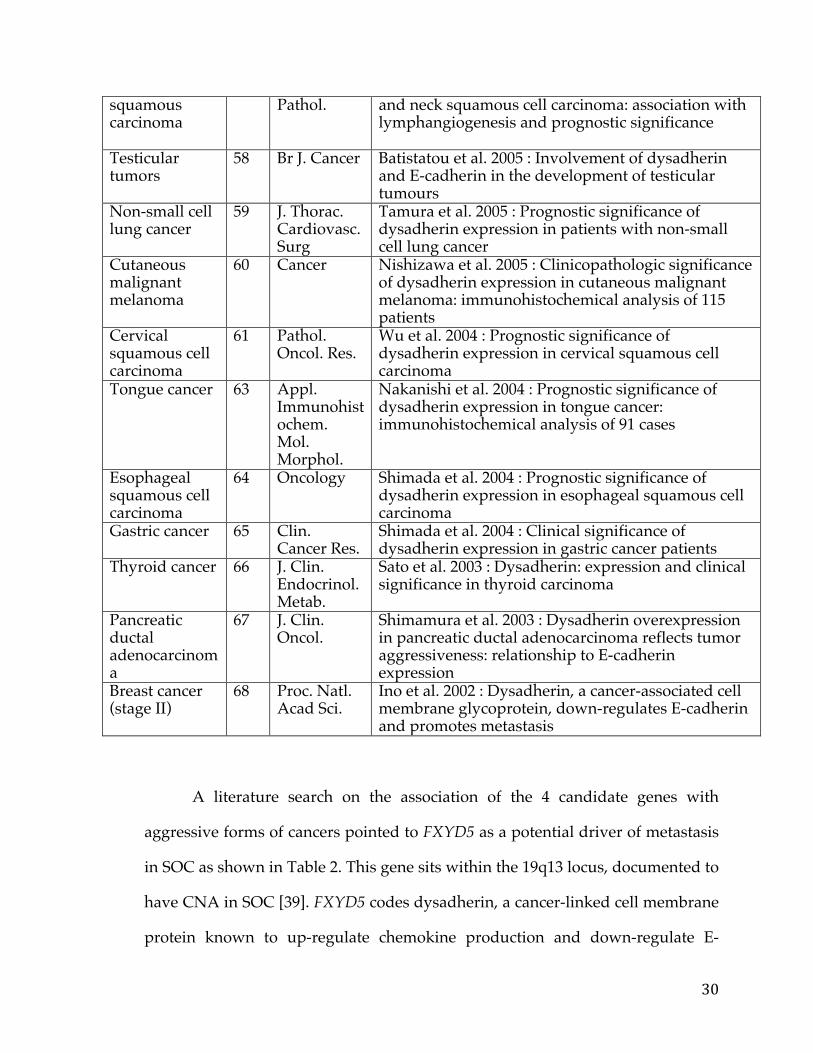
Table 2. Literature references of FXYD5 association with cancer.
Cancer Ref Journal Article Thyroid neoplasias
48 J Clin Endocrinol Metab.
Colamaio et al. 2012 : Let-7a down-regulation plays a role in thyroid neoplasias of follicular histotype affecting cell adhesion and migration through its ability to target the FXYD5 (Dysadherin) gene.
Breast Carcinomas
49 Cancer Sci. Lee et al. 2012 : Dysadherin expression promotes the motility and survival of human breast cancer cells by AKT activation.
Renal Cell Carcinoma
50 Int J Cancer.
Schuler et al. 2012 : Osteoblast-secreted factors enhance the expression of dysadherin and CCL2-dependent migration of renal carcinoma cells.
Fibrous Sinovial Sarcoma
51 Arch Pathol Lab Med.
Subramaniam et al. 2011 : Immunohistochemical study of correlation between histologic subtype and expression of epithelial-mesenchymal transition-related proteins in synovial sarcomas.
Hepatocellular Carcinoma
52 J Hepatol. Park et al. 2011 : Dysadherin can enhance tumorigenesis by conferring properties of stem-like cells to hepatocellular carcinoma cells.
Gastric Carcinomas
53 Hum Pathol.
Maehata et al. 2011 : Significance of dysadherin and E-cadherin expression in differentiated-type gastric carcinoma with submucosal invasion.
Lung Carcinomas
62 Histol Histopathol.
Mitselou et al. 2010 : Comparison of the dysadherin and E-cadherin expression in primary lung cancer and metastatic sites.
GIST 63 Pathol Res Pract.
Liang et al. 2009 : Dysadherin expression in gastrointestinal stromal tumors (GISTs).
Colorectal Carcinomas
55 Oncology Ochiai et al. 2008 : A new formula for predicting liver metastasis in patients with colorectal cancer: immunohistochemical analysis of a large series of 439 surgically resected cases.
Colorectal cancer
56 Virchows Arch.
Batistatou et al. 2006 : Expression patterns of dysadherin and E-cadherin in lymph node metastases of colorectal carcinoma
Head and neck 57 Am. J. Surg. Kyzas et al. 2006 : Dysadherin expression in head
30
squamous carcinoma
Pathol. and neck squamous cell carcinoma: association with lymphangiogenesis and prognostic significance
Testicular tumors
58 Br J. Cancer Batistatou et al. 2005 : Involvement of dysadherin and E-cadherin in the development of testicular tumours
Non-small cell lung cancer
59 J. Thorac. Cardiovasc. Surg
Tamura et al. 2005 : Prognostic significance of dysadherin expression in patients with non-small cell lung cancer
Cutaneous malignant melanoma
60 Cancer Nishizawa et al. 2005 : Clinicopathologic significance of dysadherin expression in cutaneous malignant melanoma: immunohistochemical analysis of 115 patients
Cervical squamous cell carcinoma
61 Pathol. Oncol. Res.
Wu et al. 2004 : Prognostic significance of dysadherin expression in cervical squamous cell carcinoma
Tongue cancer 63 Appl. Immunohistochem. Mol. Morphol.
Nakanishi et al. 2004 : Prognostic significance of dysadherin expression in tongue cancer: immunohistochemical analysis of 91 cases
Esophageal squamous cell carcinoma
64 Oncology Shimada et al. 2004 : Prognostic significance of dysadherin expression in esophageal squamous cell carcinoma
Gastric cancer 65 Clin. Cancer Res.
Shimada et al. 2004 : Clinical significance of dysadherin expression in gastric cancer patients
Thyroid cancer 66 J. Clin. Endocrinol. Metab.
Sato et al. 2003 : Dysadherin: expression and clinical significance in thyroid carcinoma
Pancreatic ductal adenocarcinoma
67 J. Clin. Oncol.
Shimamura et al. 2003 : Dysadherin overexpression in pancreatic ductal adenocarcinoma reflects tumor aggressiveness: relationship to E-cadherin expression
Breast cancer (stage II)
68 Proc. Natl. Acad Sci.
Ino et al. 2002 : Dysadherin, a cancer-associated cell membrane glycoprotein, down-regulates E-cadherin and promotes metastasis
A literature search on the association of the 4 candidate genes with
aggressive forms of cancers pointed to FXYD5 as a potential driver of metastasis
in SOC as shown in Table 2. This gene sits within the 19q13 locus, documented to
have CNA in SOC [39]. FXYD5 codes dysadherin, a cancer-linked cell membrane
protein known to up-regulate chemokine production and down-regulate E-
31
cadherin [38]. FXYD5 expression has similarly been shown to induce vimentin
expression in murine airway epithelial cells [47]. Both increased vimentin
expression and decreased E-cadherin are causally associated with epithelial–
mesenchymal transition, linking FXYD5 with EMT.
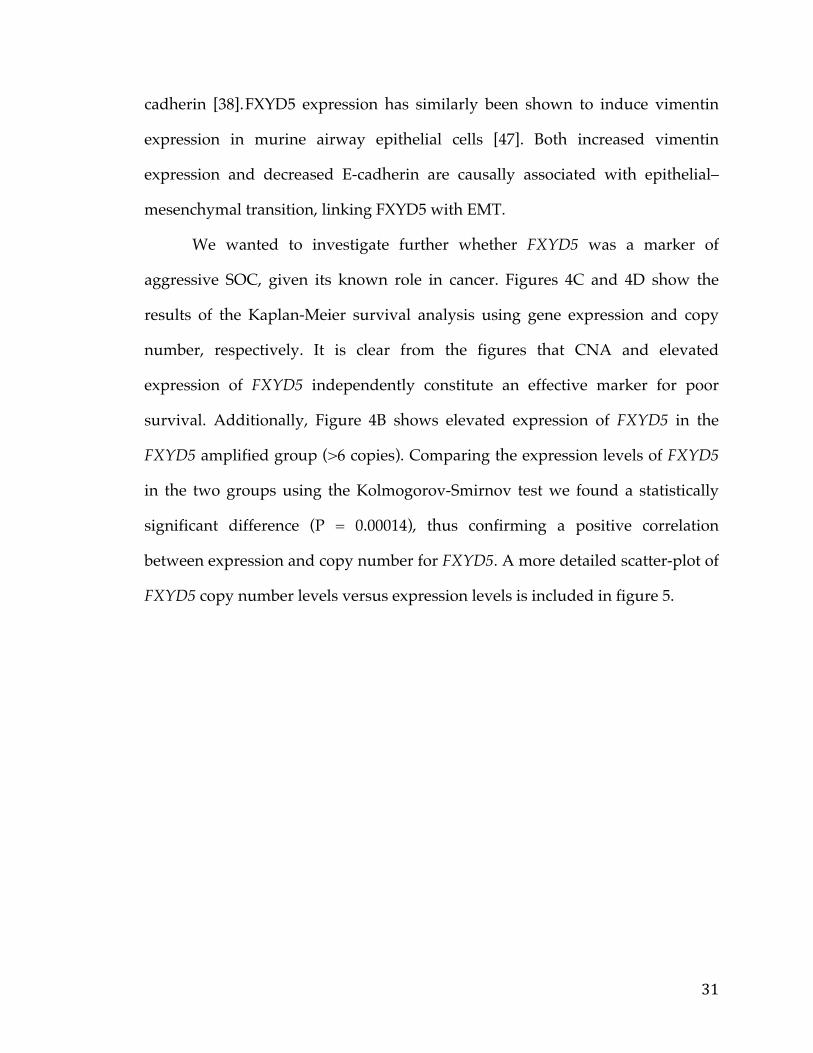
We wanted to investigate further whether FXYD5 was a marker of
aggressive SOC, given its known role in cancer. Figures 4C and 4D show the
results of the Kaplan-Meier survival analysis using gene expression and copy
number, respectively. It is clear from the figures that CNA and elevated
expression of FXYD5 independently constitute an effective marker for poor
survival. Additionally, Figure 4B shows elevated expression of FXYD5 in the
FXYD5 amplified group (>6 copies). Comparing the expression levels of FXYD5
in the two groups using the Kolmogorov-Smirnov test we found a statistically
significant difference (P = 0.00014), thus confirming a positive correlation
between expression and copy number for FXYD5. A more detailed scatter-plot of
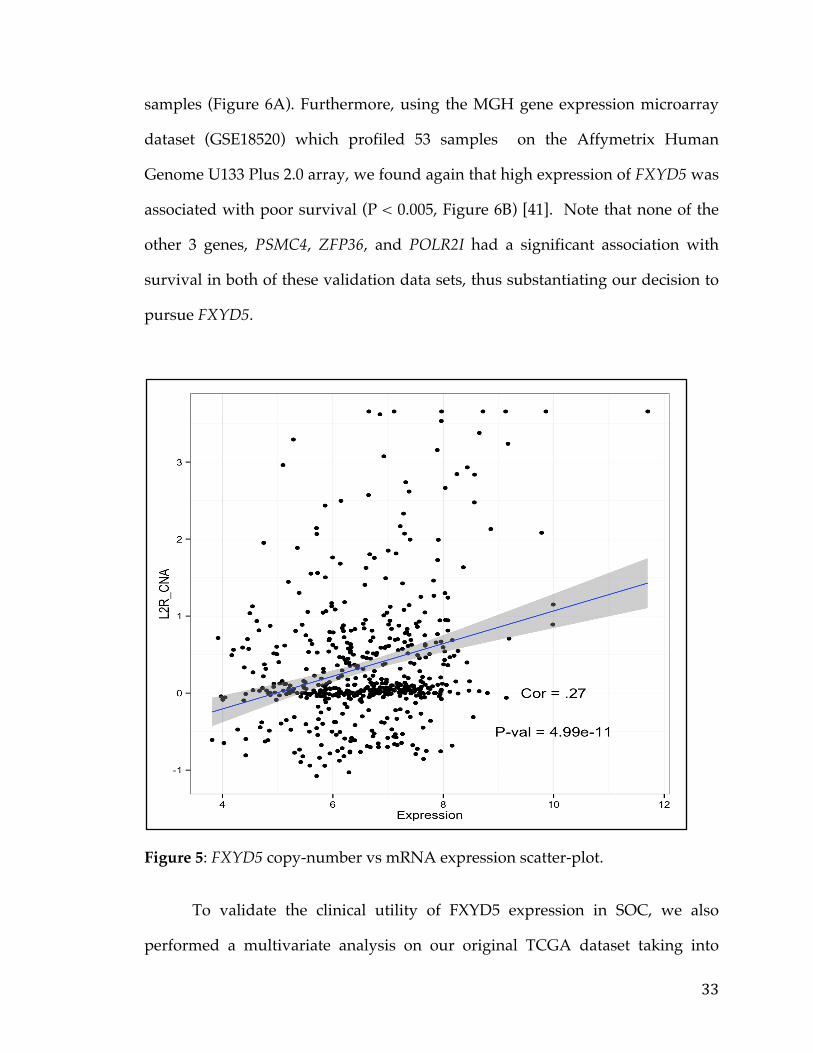
FXYD5 copy number levels versus expression levels is included in figure 5.

32
Figure 4: FXYD5 is a marker for aggressive OC, as determined by the TCGA dataset. Intersection of genes sets with elevated gene expression and elevated copy number (A), Box-plot of showing expression versus amplification for FXYD5(B), Kaplan–Meier survival curves showing survival based on FXYD5 expression and copy number data, respectively (C, D).
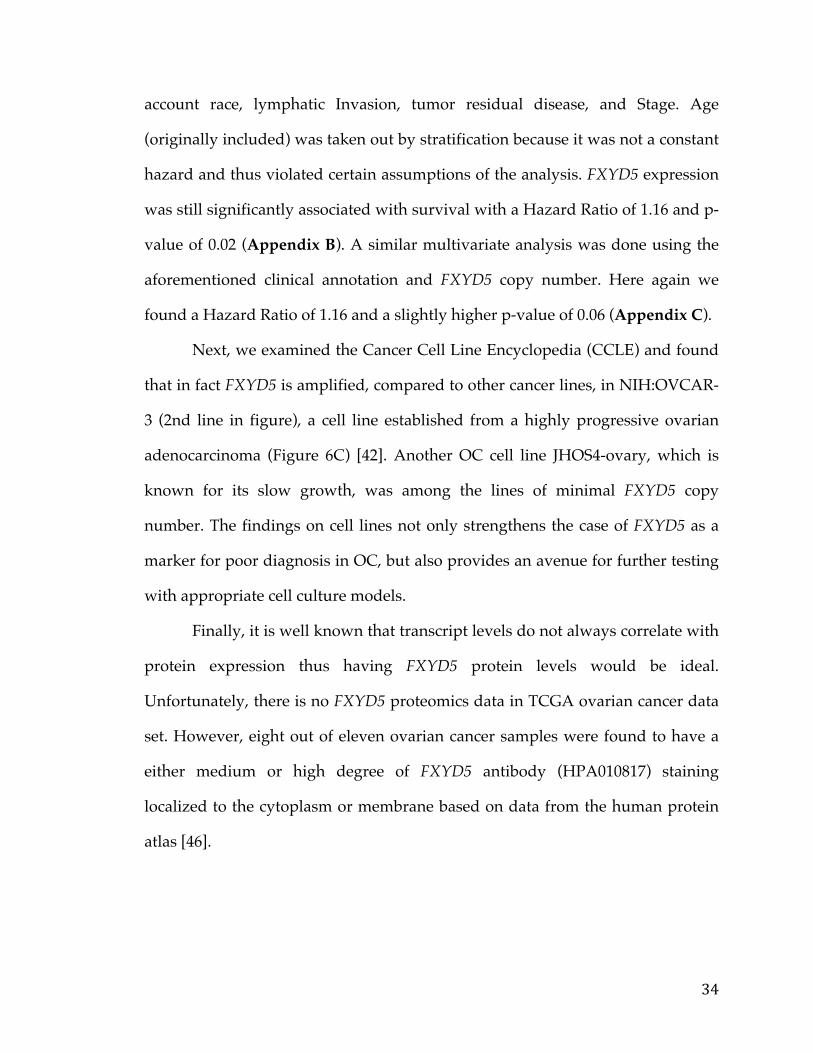
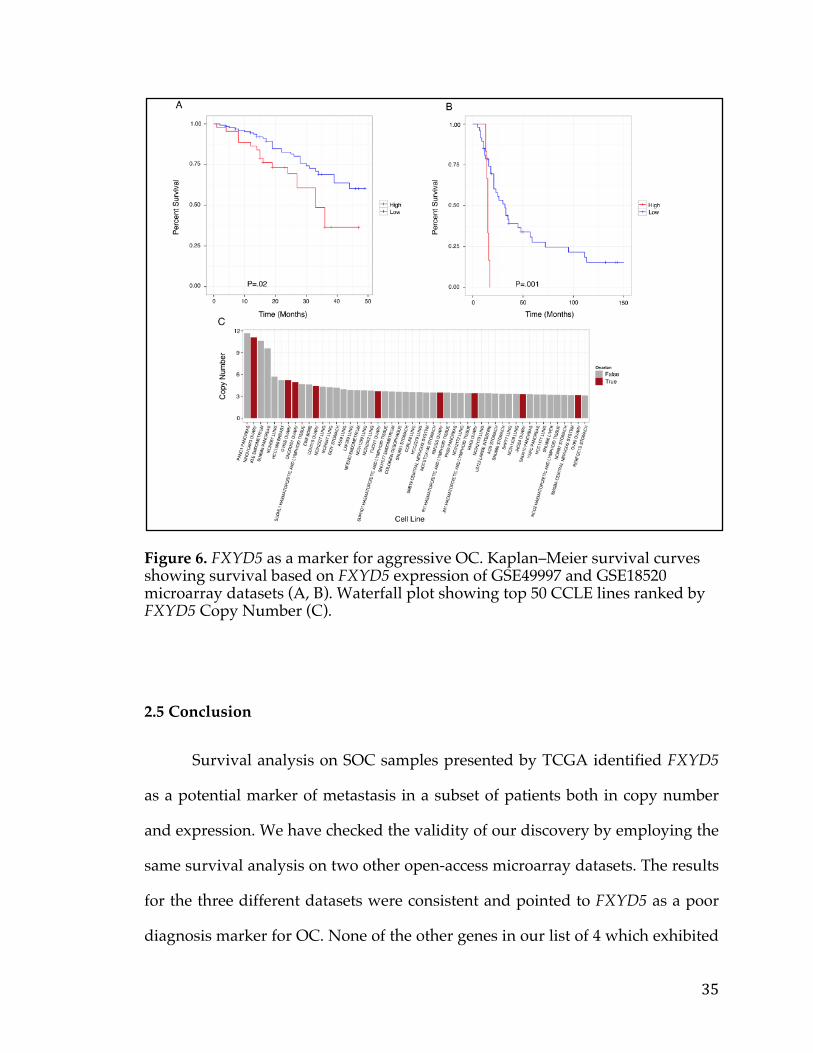
To further confirm our discovery of FXYD5 as marker for aggressive OC,
we performed survival analysis in another OC microarray study (GSE49997),
which used a different platform (ABI Microarray version 2) on 204 epithelial OC
samples [40]. In this dataset, high expression of FXYD5 was again associated
with poor outcome at the appropriate significance level (p < 0.05) in the SOC
33
samples (Figure 6A). Furthermore, using the MGH gene expression microarray
dataset (GSE18520) which profiled 53 samples on the Affymetrix Human
Genome U133 Plus 2.0 array, we found again that high expression of FXYD5 was
associated with poor survival (P < 0.005, Figure 6B) [41]. Note that none of the
other 3 genes, PSMC4, ZFP36, and POLR2I had a significant association with
survival in both of these validation data sets, thus substantiating our decision to
pursue FXYD5.
Figure 5: FXYD5 copy-number vs mRNA expression scatter-plot.
To validate the clinical utility of FXYD5 expression in SOC, we also
performed a multivariate analysis on our original TCGA dataset taking into
34
account race, lymphatic Invasion, tumor residual disease, and Stage. Age
(originally included) was taken out by stratification because it was not a constant
hazard and thus violated certain assumptions of the analysis. FXYD5 expression
was still significantly associated with survival with a Hazard Ratio of 1.16 and p-
value of 0.02 (Appendix B). A similar multivariate analysis was done using the
aforementioned clinical annotation and FXYD5 copy number. Here again we
found a Hazard Ratio of 1.16 and a slightly higher p-value of 0.06 (Appendix C).
Next, we examined the Cancer Cell Line Encyclopedia (CCLE) and found
that in fact FXYD5 is amplified, compared to other cancer lines, in NIH:OVCAR-
3 (2nd line in figure), a cell line established from a highly progressive ovarian
adenocarcinoma (Figure 6C) [42]. Another OC cell line JHOS4-ovary, which is
known for its slow growth, was among the lines of minimal FXYD5 copy
number. The findings on cell lines not only strengthens the case of FXYD5 as a
marker for poor diagnosis in OC, but also provides an avenue for further testing
with appropriate cell culture models.
Finally, it is well known that transcript levels do not always correlate with
protein expression thus having FXYD5 protein levels would be ideal.
Unfortunately, there is no FXYD5 proteomics data in TCGA ovarian cancer data
set. However, eight out of eleven ovarian cancer samples were found to have a
either medium or high degree of FXYD5 antibody (HPA010817) staining
localized to the cytoplasm or membrane based on data from the human protein
atlas [46].
35
Figure 6. FXYD5 as a marker for aggressive OC. Kaplan–Meier survival curves showing survival based on FXYD5 expression of GSE49997 and GSE18520 microarray datasets (A, B). Waterfall plot showing top 50 CCLE lines ranked by FXYD5 Copy Number (C).
2.5 Conclusion
Survival analysis on SOC samples presented by TCGA identified FXYD5
as a potential marker of metastasis in a subset of patients both in copy number
and expression. We have checked the validity of our discovery by employing the
same survival analysis on two other open-access microarray datasets. The results
for the three different datasets were consistent and pointed to FXYD5 as a poor
diagnosis marker for OC. None of the other genes in our list of 4 which exhibited
36
elevated FXYD5 in poor outcome samples were as efficient in identifying poor
prognosis as FXYD5.
Dysadherin, which is coded by FXYD5, functions in chemokine
production central to growth, survival, and migration of cancer cells from the
primary tumour. Additionally, as it down-regulates E-cadherin and up-regulated
vimentin, it may serve to push the cell from epithelial to mesenchymal state,
implicating this gene in metastasis. Moreover, recent studies identified
dysadherin as an activator of AKT1 and a driver of the oncogenic PIK3CA
pathway [43]. To the best of our knowledge, dysadherin has not been linked to
OC until this present study. As in Table 2, it has been linked, however, to a large
number of cancers as a marker for poor diagnosis. Our finding that FXYD5 is
also a marker for poor survival in OC will provide a new light on metastasis
patterns involving breast, cervical, and ovarian cancers.
Cancer driver genes have been annotated in the literature using different
definitions based on mutational patterns. A recent study by Tamborero et al.
(2013) identified genes deemed driver by four different methods and FXYD5 is
not in the list of intersections of driver genes identified in this study [44]. The
small intersection between the different methods attests, however, to challenges
for algorithmic identification of drivers of cancer. We think of FXYD5 not as an
initiator of cancer but as a potential driver for metastasis of OC based on the
finding that poor prognosis is linked to both elevated CNA and transcript
expression.
Since effective antibodies exist against dysadherin, fluorescence labeling
of tissue arrays will identify whether this protein is a differentiating factor for
poor prognosis in a clinical setting. In another set of experiments, gene silencing
37
and rescue experiments could transform FXYD5 from a marker for poor
diagnosis to metastasis driver, with causality and conclusion. If in fact, the
oncogenic potential of dysadherin is mediated via AKT1 and the PIK3CA
pathway, then the emerging drug therapies in clinical trials and on the market
targeting this pathway may be candidate treatment options for aggressive
ovarian cancer [45]. Additionally, if FXYD5 is indeed simply a marker for
metastasis and aggressive disease modern therapeutic modalities such as
Antibody-Drug Conjugate (ADC), or Chimeric Antigen Receptor (CAR) could be
employed to target cancer cells with suitable expression of this gene. Indeed, a
search in google patents reveals a patent (US 20110064752 A1) for a biologic
(EDC) targeting FXYD5 with purported use in various cancers further
strengthening the case to interrogate this target further in ovarian cancer.
38
Chapter 3. Pancreatic cancer survival analysis defines a signature that predicts outcome and suggests candidate gene targets for novel therapies
3.1 Summary
Pancreatic cancer is the fourth leading cause of cancer death in developed world.
Despite, multiple large-scale genetic sequencing studies, predictors of patient
survival and discovery of novel treatment regiments remain elusive. We
performed a focused pancreatic cancer analysis in search of genes correlated with
survival and differential between tumors and normal pancreatic tissue data.
From this analysis we were able to develop a novel signature to predict survival
and also identified a number of potential druggable therapeutic targets.
Pancreatic cancer RNA-Seq data from The Cancer Genome Atlas and microarray
data from GEO were transformed and analyzed in R using the limma package to
develop the initial pancreatic cancer list and validate the ensuing signature.
Various knowledge bases and data sources such as COSMIC and GTEx were
used to filter and prioritize the list to arrive at druggable and targetable genes.
We identified 709 pancreatic cancer genes that had a significant delta in a tumor
versus normal comparison and were related to survival, at an adjusted p-value of
0.05 and fold change of 1.5. A 5 gene signature stemming from this list was found
to have significant predictive power (AUC 0.84, 0.83, and .79) to determine the
survival of patients in three different cohorts. Additionally twenty genes from
39
the analysis were classified as oncogenes according to COSMIC, five were found
to be actionable based on the FoundationOne Panel, and a number of genes were
identified as possible avenues for therapeutic intervention.
3.2 Background
Pancreatic cancer is the fourth leading cause of cancer death in developed world
and is predicted to be the second leading cause of cancer mortality within the
next decade [69]. Currently, 5-year survival rates are estimated to be <7%, and
one-year survival rates are at approximately 20% [70,71]. Interestingly, while the
majority of patients diagnosed live less than one year there is still not a clear
understanding of why there is a marked difference in survival rate for a small
subset of patients. A number of variables have been shown that may contribute
to survival differences such as age, size of tumor, and other disease
characteristics captured by the American Joint Committee on Cancer (AJCC) but
these cannot accurately explain all differences, which raises the question as to
whether differences at the molecular level may be a stronger predictor of
survival [72].
The mutational landscape of Pancreatic cancer has been elucidated through
many large-scale studies such as the The Cancer Genome Atlas (TCGA) and the
International Cancer Genome Consortium (ICGC). It is well known for example
that ~90% of pancreatic cancers have activating mutations in the KRAS oncogene
and between 50-80% of patients have inactivating mutations and/or deletions in
the tumor suppressors TP53, CDKN2A, or SMAD4 [73]. Of course, there have
40
been a number of other mutations reported, albeit at very low frequencies. These
binary features and their combinations however still aren’t sufficient to explain
the heterogeneity in survival. A recent publication in Nature by Bailey et al, took
steps to address this by using RNA-Sequencing gene expression data to define 4
subgroups of pancreatic cancer (squamous, pancreatic progenitor, immunogenic,
and aberrantly differentiated endocrine and exocrine) and they found differential
survival between some of these groups [74]. This study however, did not take
into account the normal pancreas expression landscape nor was it directly
looking to find genes / pathways that are associated with survival. A few groups
on the other hand have developed survival signatures but clinical uptake is still
lacking and many of these were performed on relatively small cohorts
[References]. In response, our current study aims to define a set of genes with
expression profiles markedly different from normal pancreatic tissue that are
also predictive of survival in pancreatic cancer patients. This not only provides
biomarkers or a “signature” associated with survival but also may suggest
potential therapeutics or propose targets for therapy development that could be
applicable to the high-risk group of pancreatic cancer patients. This is imperative
since our current understanding of this disease has still not been translated into
actionable targeted therapeutics. While, a number of clinical trials using novel
therapeutic strategies such as Antibody Drug Conjugates (ADC) modifying
hedgehog pathway activity, immune system checkpoint inhibitors (PD-1 /
CTLA-4), and Chimeric Antigen Receptor (CAR) therapy targeting MSLN are
underway, there are often mixed results with only some proportion of patients
having a complete response [75]. This of course is a testament to the molecular
heterogeneity and clonality of cancers, as seen in both humans and animal
41
models, and furthers the case to identify and develop more targeted therapies
[76].
In order to identify the set of genes associated with pancreatic cancer survival
two separate datasets were analyzed. First, pancreatic cancer RNA-Seq and
survival data from TCGA was acquired and used to define genes associated with
survival. Second, a pancreatic microarray expression dataset (GSE28735) from
the Gene Expression Omnibus (GEO) resource containing tumor and matched
normal data was employed to establish the background and remove potential
bias caused by normal tissue contamination (in the survival signature) [77]. The
results of these analyses were further filtered using the International Cancer
genome Consoritum (ICGC) pancreatic caner data set to yield a molecular a
signature of survival [78]. This signature was then tested and validated in two
independent microarray datasets (GSE57495, GSE71729) from GEO with
associated survival information and compared to publicly available “signatures”
of survival [79,80]. Finally, available therapies and proposed targets for therapy
development are suggested based on pathway analysis and comparison to
various drug databases and the large compendium of normal RNA-Seq
expression data, developed through the Genotype Tissue Expression (GTEx)
consortium [81].
42
3.3 Methods
3.3.1 Pancreatic Cancer Gene List Development
TCGA Pancreatic RNA-Seq expression data and associated survival data was
obtained form the Broad GDAC Firehose site (https://gdac.broadinstitute.org/).
RNA-Seq data was first filtered to remove genes with general low expression
that were deemed as having a maximum expression of less than 100 counts as
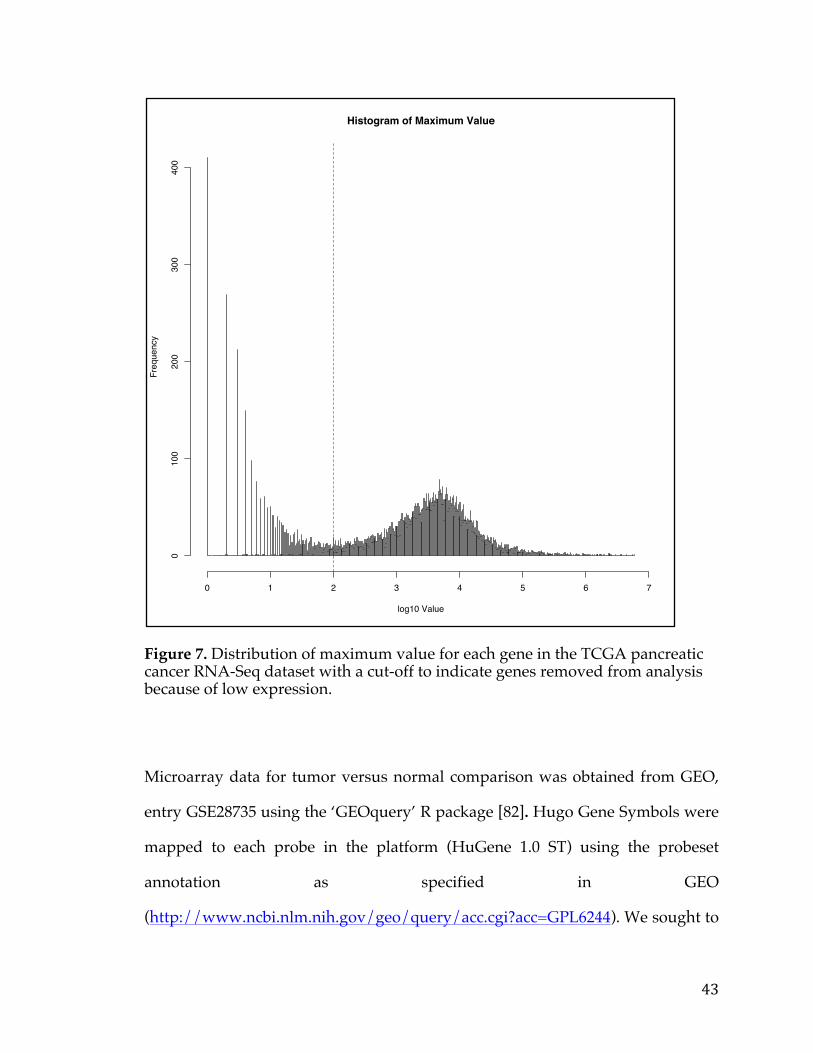
depicted in Figure 7. Furthermore, when multiple entries were found referencing
the same gene, a single representative with the maximum value was chosen.
These filtering steps dropped the number of candidate genes from 20,330 genes
to 12,959 genes. In addition, only samples with both RNA-Seq expression and
survival data were used for subsequent analysis comprising 178 patients.
Samples were split into 2 groups for comparison, those surviving less than 1 year
(Survival-) and those surviving greater than 2 years (Survival+) groups.
43
Figure 7. Distribution of maximum value for each gene in the TCGA pancreatic cancer RNA-Seq dataset with a cut-off to indicate genes removed from analysis because of low expression.
Microarray data for tumor versus normal comparison was obtained from GEO,
entry GSE28735 using the ‘GEOquery’ R package [82]. Hugo Gene Symbols were
mapped to each probe in the platform (HuGene 1.0 ST) using the probeset
annotation as specified in GEO
(http://www.ncbi.nlm.nih.gov/geo/query/acc.cgi?acc=GPL6244). We sought to
Histogram of Maximum Value
log10 Value
Freq
uenc
y
0 1 2 3 4 5 6 7
010
020
030
040
0
44
perform our analysis on the gene level to more easily integrate our results with
other data. However as multiple probesets map to the same gene symbol we had
to select a single representative gene, so our dataset did not contain duplicate
gene symbols. Thus for each set of probesets mapping to the same gene the one
with the highest maximum value was chosen as the representative gene. This
step filtered the number of entries from 28,869 probes to 20,254 genes. The
dataset itself was composed of 45 tumor/normal-matched pairs comprising 90
samples in total all, all with associated survival data.
For the analysis of the TCGA RNA-Seq data the ‘voom’ package in R was
initially used to transform the data from counts into values amenable for linear
modeling [83]. Following this, the ‘limma’ package in R was used to determine
genes that were differentially expressed between Survial- and Survival+ samples.
This package was similarly used to determine genes differentially expressed
between tumors and normals in the GSE28735 microarray dataset. No initial
conversion was needed in this case because data coming from the GEO data
repository was RMA normalized and log-transformed allowing for linear
modeling. For both comparisons an adjusted P-value cutoff of 0.05 and a fold-
change cutoff of 1.5 was used to determine differentially expressed genes (DEG).
Intersection of both DEG lists was used in subsequent analysis.
3.3.2 Signature Development & ROC Analysis
To define a more robust survival signature, pancreatic cancer microarray data
from the International Cancer Genome Consortium (ICGC), encompassing 242
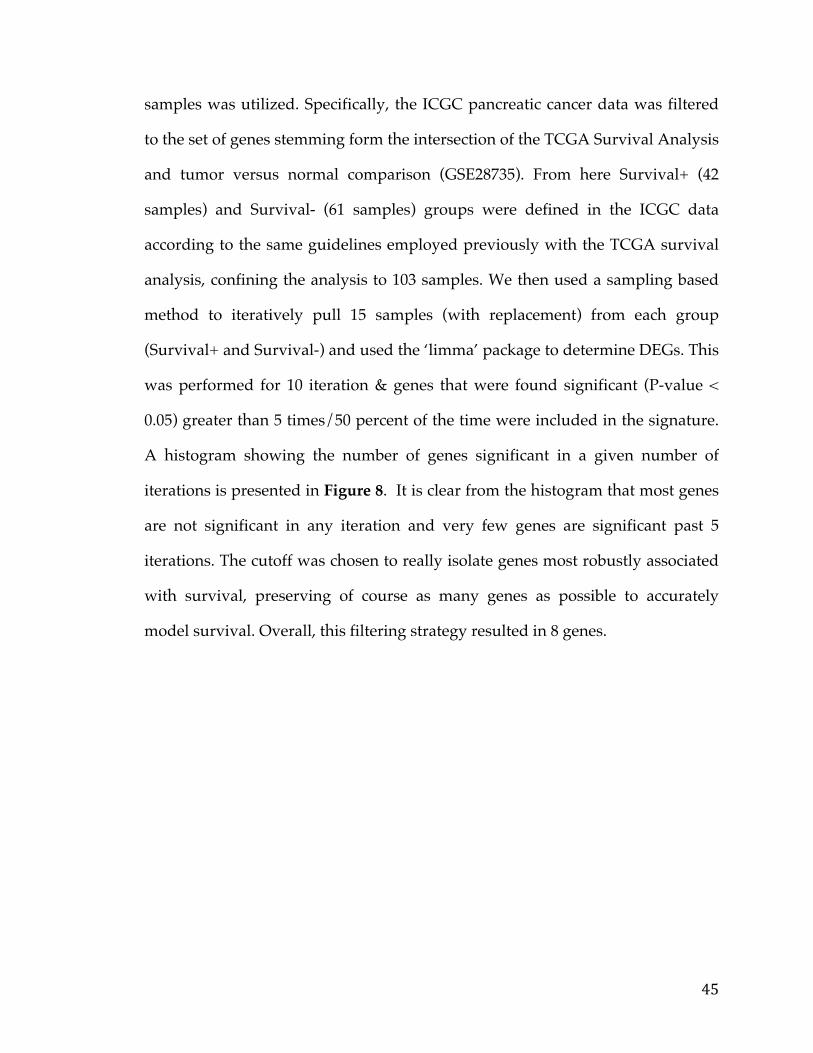
45
samples was utilized. Specifically, the ICGC pancreatic cancer data was filtered
to the set of genes stemming form the intersection of the TCGA Survival Analysis
and tumor versus normal comparison (GSE28735). From here Survival+ (42
samples) and Survival- (61 samples) groups were defined in the ICGC data
according to the same guidelines employed previously with the TCGA survival
analysis, confining the analysis to 103 samples. We then used a sampling based
method to iteratively pull 15 samples (with replacement) from each group
(Survival+ and Survival-) and used the ‘limma’ package to determine DEGs. This
was performed for 10 iteration & genes that were found significant (P-value <
0.05) greater than 5 times/50 percent of the time were included in the signature.
A histogram showing the number of genes significant in a given number of
iterations is presented in Figure 8. It is clear from the histogram that most genes
are not significant in any iteration and very few genes are significant past 5
iterations. The cutoff was chosen to really isolate genes most robustly associated
with survival, preserving of course as many genes as possible to accurately
model survival. Overall, this filtering strategy resulted in 8 genes.
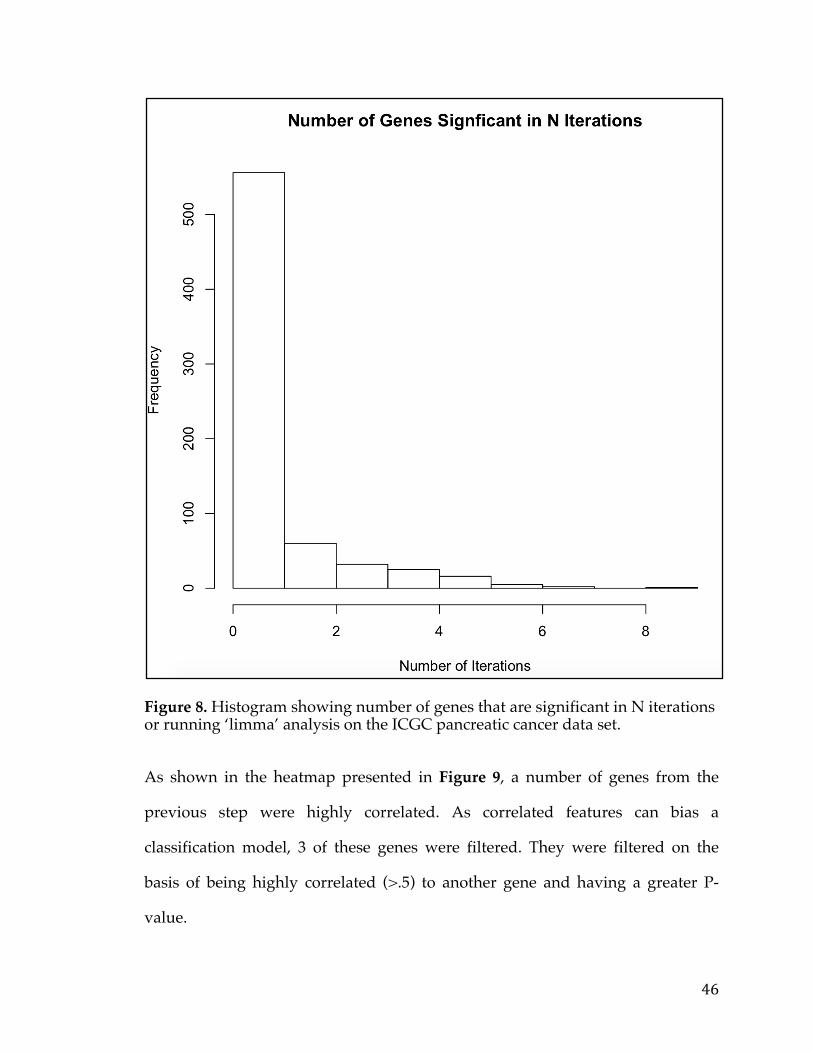
46
Figure 8. Histogram showing number of genes that are significant in N iterations or running ‘limma’ analysis on the ICGC pancreatic cancer data set.
As shown in the heatmap presented in Figure 9, a number of genes from the
previous step were highly correlated. As correlated features can bias a
classification model, 3 of these genes were filtered. They were filtered on the
basis of being highly correlated (>.5) to another gene and having a greater P-
value.
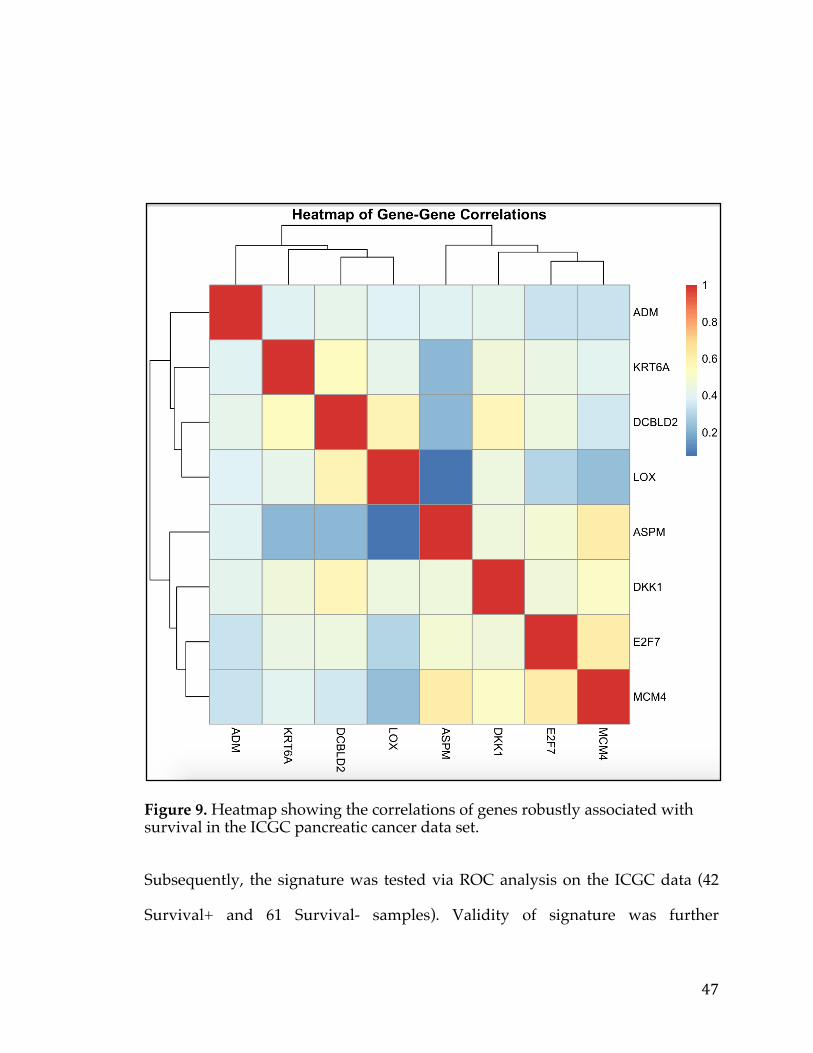
47
Figure 9. Heatmap showing the correlations of genes robustly associated with survival in the ICGC pancreatic cancer data set.
Subsequently, the signature was tested via ROC analysis on the ICGC data (42
Survival+ and 61 Survival- samples). Validity of signature was further
48
established using ROC analysis on 2 separate pancreatic microarray datasets in
the GEO data repository, GSE57495 (63 samples, 12 Survival-/17 Survival+) and
GSE71729 (357 samples, 41 Survival-/15 Survival+). Both datasets were
downloaded using the ‘GEOquery’ package in R. In order to perform ROC
analysis each dataset was split into Survival+ (Alive greater than 2 years) and
Survial- groups (survival of less than 1 year), similar to thresholds employed in
the discovery dataset and the ICGC data set. ROC analysis was also performed
on all three data sets using publicly available “gene signatures” for comparison.
Area under the curve calculation was ascertained using the ‘AUC’ package in R.
For all three datasets 5000 random signatures composed of 5 genes were also
generated and signature scores were calculated. This was then used to generate a
distribution of AUC’s, the null distribution, to compare our signature AUC with.
In addition to ROC analysis, Kaplan-Meier survival analysis was performed for
both validation studies as well as the ICGC data using the signature to delineate
groups. In addition Kaplan-Meier survival was also performed using stage for
comparison. To prevent potential batch effects samples from all three datasets
were normalized to a set of housekeeping genes (TBB, ACTB, UBC, PPIA, and
GUSB).
3.3.3 Pathway Analysis and Druggability
Pathway analysis was performed using the Hypergeometric test in the R
statistical language. Gene sets were obtained from the BROAD MsigDB
(http://software.broadinstitute.org/gsea/msigdb) [84]. The Bioconductor
packags ‘GSEABase’ was used to transform the gene sets to a format amenable to
49
processing. Gene druggability information was obtained from DGIdb
(http://dgidb.genome.wustl.edu/) [85].
3.3.4 Target Discovery for Biologics and Immunotherapy
Genes from initial discovery analysis that were up-regulated in both tumor
versus normal comparison and survival- versus survival+ comparison were used
as initial seed list of potential Targets. To determine genes on the membrane the
compartments database was downloaded
(http://compartments.jensenlab.org/Search) and only those genes annotated as
on the “Plasma Membrane” with a confidence of at least 4 were chosen [86].
Normal RNA-Seq data was downloaded from the
(http://www.gtexportal.org/home/) web portal. Tumor RNA-Seq was
transformed from raw counts to FPKM to make comparable with normal data.
3.3.5 Visualizations and statistical analysis
Volcano plots, scatter plot, boxplots, and ROC curves were generated using the
‘ggplot2’ package and venn diagrams were generated using the ‘VennDiagram’
package in R. Subsequently certain images were then amended and updated in
adobe illustrator (AI) [87, 88]. All statistical analysis and data processing were
performed in the R statistical language.
50
3.4 Results & Discussion
3.4.1 Discovery analysis
In order to define a set of genes associated with survival, TCGA RNA-Seq
pancreatic cancer data set was used alongside associated survival data. After
filtering, to remove low expressing genes, the data was split into two groups to
define the subset of patients with poor survival (Survival- / 28 samples), and
those with better survival (Survival+ / 19 samples), corresponding roughly to
the 63rd Percentile and 88th percentile, a full quartile difference (Figure 10). The
split was made at the following intervals to maximize the survival delta in
months and still ensure a reasonable number of samples in each group to
identify DEGs with potentially low effect sizes.
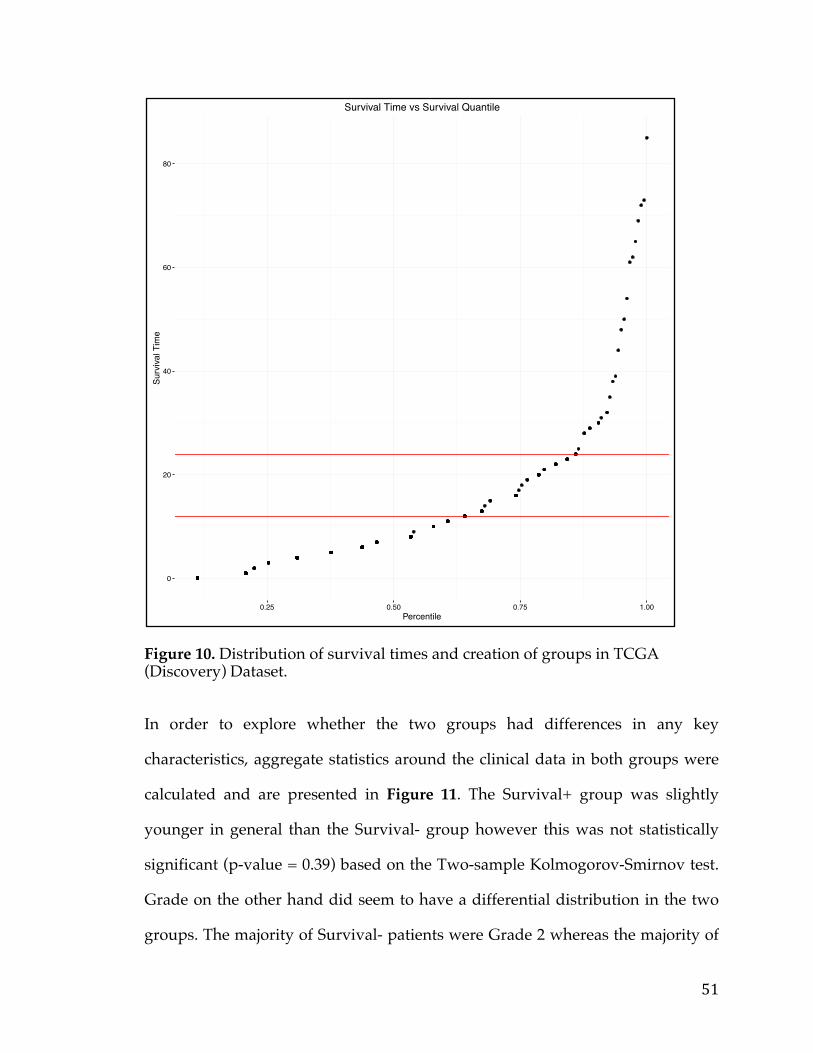
51
Figure 10. Distribution of survival times and creation of groups in TCGA (Discovery) Dataset.
In order to explore whether the two groups had differences in any key
characteristics, aggregate statistics around the clinical data in both groups were
calculated and are presented in Figure 11. The Survival+ group was slightly
younger in general than the Survival- group however this was not statistically
significant (p-value = 0.39) based on the Two-sample Kolmogorov-Smirnov test.
Grade on the other hand did seem to have a differential distribution in the two
groups. The majority of Survival- patients were Grade 2 whereas the majority of
0
20
40
60
80
0.25 0.50 0.75 1.00Percentile
Surv
ival T
ime
Survival Time vs Survival Quantile
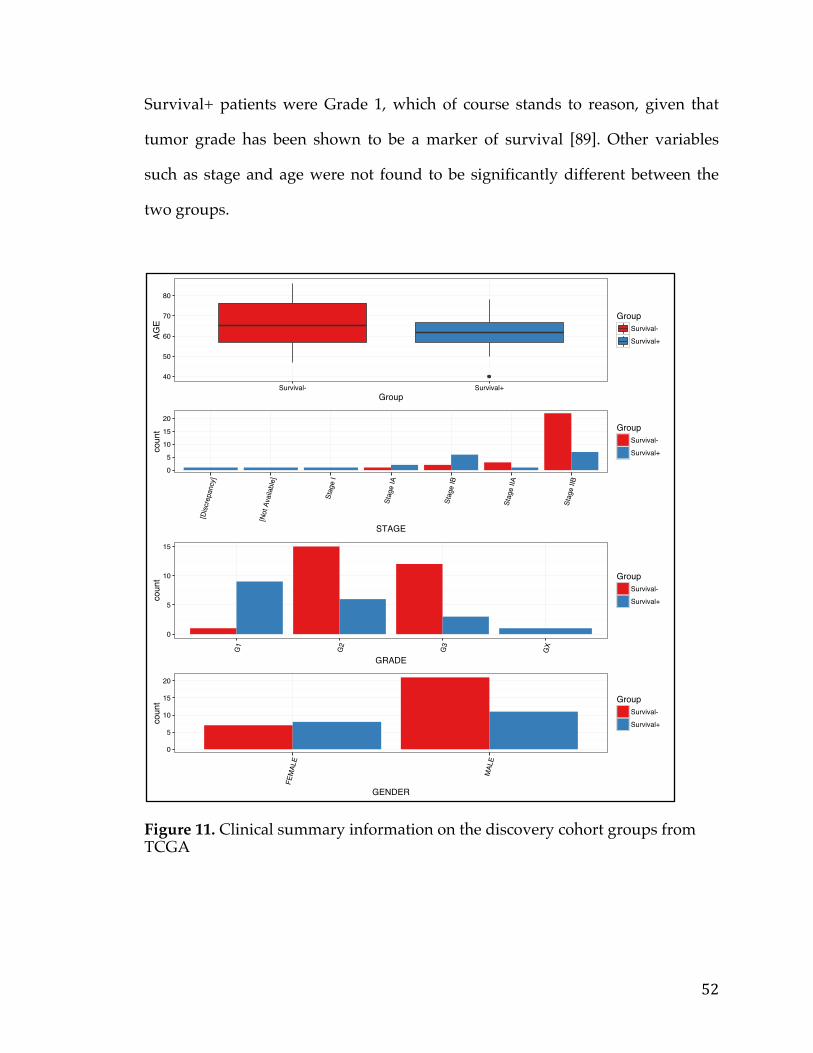
52
Survival+ patients were Grade 1, which of course stands to reason, given that
tumor grade has been shown to be a marker of survival [89]. Other variables
such as stage and age were not found to be significantly different between the
two groups.
Figure 11. Clinical summary information on the discovery cohort groups from TCGA
40
50
60
70
80
Survival- Survival+Group
AGE
GroupSurvival-
Survival+
0
5
10
15
20
[Disc
repa
ncy]
[Not
Ava
ilabl
e]
Stag
e I
Stag
e IA
Stag
e IB
Stag
e IIA
Stag
e IIB
STAGE
coun
t GroupSurvival-
Survival+
0
5
10
15
G1
G2
G3
GX
GRADE
coun
t GroupSurvival-
Survival+
0
5
10
15
20
FEM
ALE
MAL
E
GENDER
coun
t GroupSurvival-
Survival+
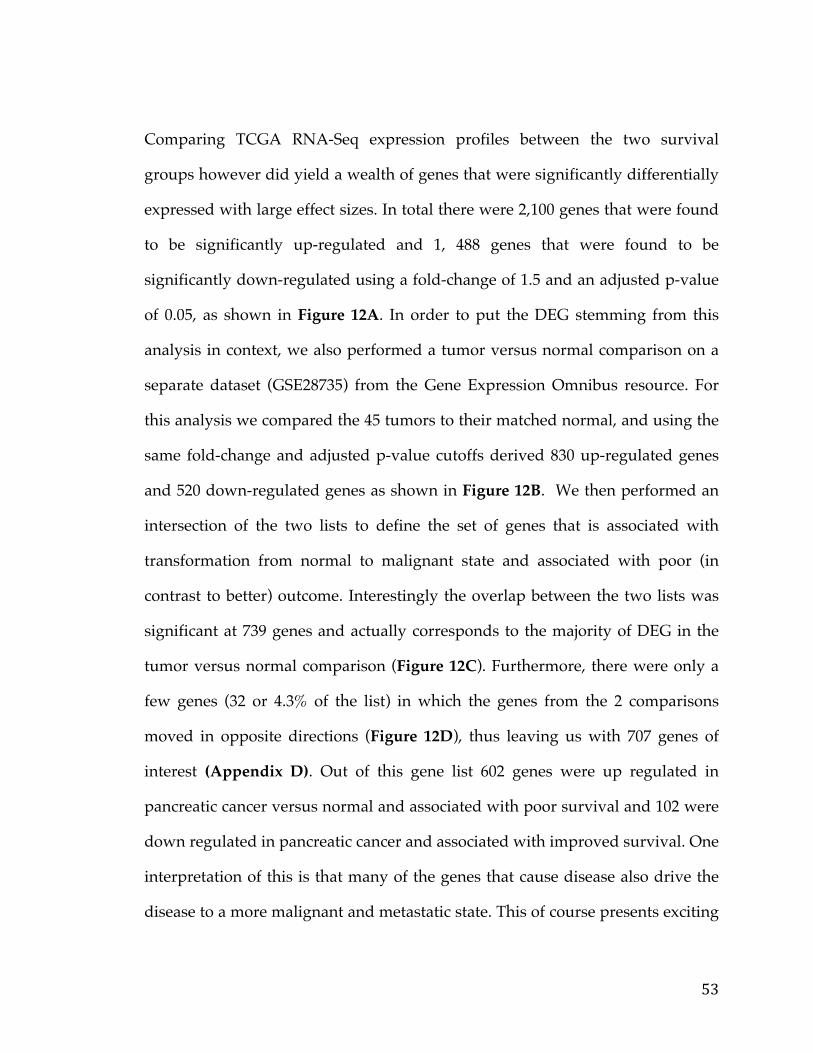
53
Comparing TCGA RNA-Seq expression profiles between the two survival
groups however did yield a wealth of genes that were significantly differentially
expressed with large effect sizes. In total there were 2,100 genes that were found
to be significantly up-regulated and 1, 488 genes that were found to be
significantly down-regulated using a fold-change of 1.5 and an adjusted p-value
of 0.05, as shown in Figure 12A. In order to put the DEG stemming from this
analysis in context, we also performed a tumor versus normal comparison on a
separate dataset (GSE28735) from the Gene Expression Omnibus resource. For
this analysis we compared the 45 tumors to their matched normal, and using the
same fold-change and adjusted p-value cutoffs derived 830 up-regulated genes
and 520 down-regulated genes as shown in Figure 12B. We then performed an
intersection of the two lists to define the set of genes that is associated with
transformation from normal to malignant state and associated with poor (in
contrast to better) outcome. Interestingly the overlap between the two lists was
significant at 739 genes and actually corresponds to the majority of DEG in the
tumor versus normal comparison (Figure 12C). Furthermore, there were only a
few genes (32 or 4.3% of the list) in which the genes from the 2 comparisons
moved in opposite directions (Figure 12D), thus leaving us with 707 genes of
interest (Appendix D). Out of this gene list 602 genes were up regulated in
pancreatic cancer versus normal and associated with poor survival and 102 were
down regulated in pancreatic cancer and associated with improved survival. One
interpretation of this is that many of the genes that cause disease also drive the
disease to a more malignant and metastatic state. This of course presents exciting
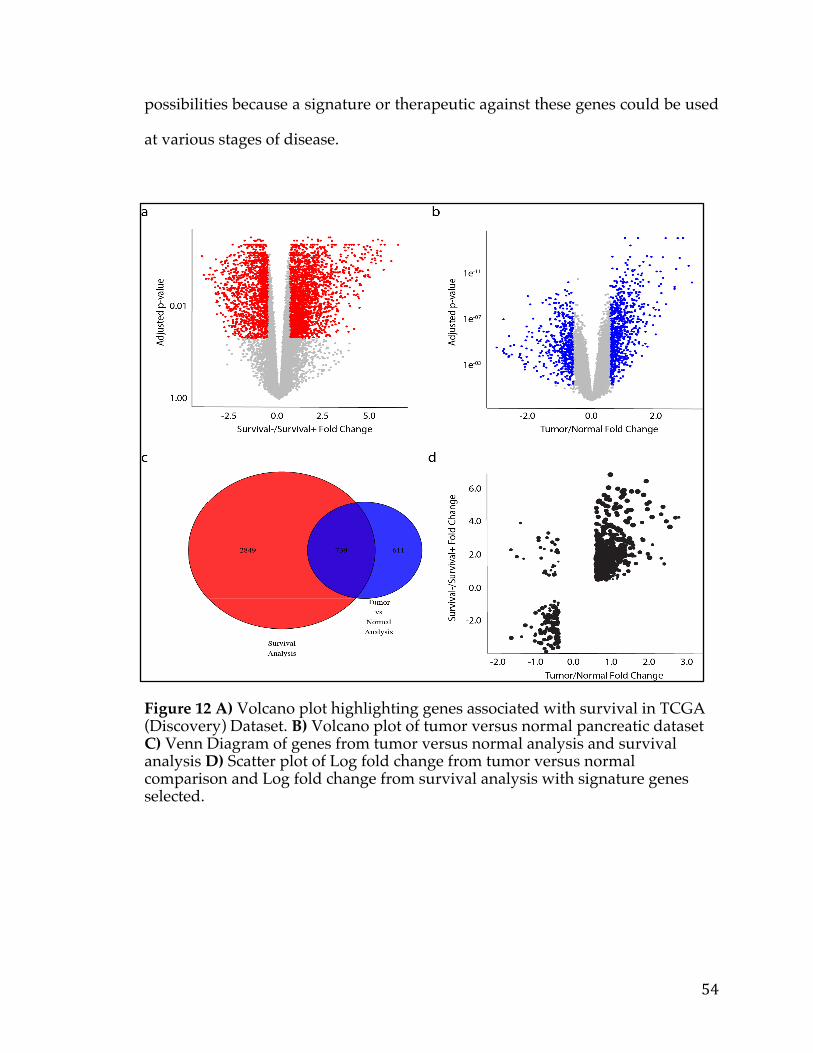
54
possibilities because a signature or therapeutic against these genes could be used
at various stages of disease.
Figure 12 A) Volcano plot highlighting genes associated with survival in TCGA (Discovery) Dataset. B) Volcano plot of tumor versus normal pancreatic dataset C) Venn Diagram of genes from tumor versus normal analysis and survival analysis D) Scatter plot of Log fold change from tumor versus normal comparison and Log fold change from survival analysis with signature genes selected.

55
In order to fully understand the relevance and confirm the validity of the
analysis we interrogated the results and compared to literature based gene lists
and public gene databases. This list identifies a number of pancreatic markers
that have been cited in literature such as MET, MAP4K4, and ITGA2 [90, 91].
Performing an intersection with the Cancer Gene Census, which catalogues
genes with causal mutations implicated in cancer, from the COSMIC database
[92] we found 20 genes as shown in Table 3. This intersection is significant and
seemingly non-random (P-value = 9.39 x 10⁻⁴) based on the hypergeometic test,
which establishes further confidence in the resulting list. While some of these are
established to have causality in driving pancreatic cancer such as PPAR-Gamma,
MUC1, and COL1A1 there are many that haven’t been investigated such as the
tyrosine kinase substrate EZR, which has been implicated in a host of other
cancers [93, 94, 95]. It is important to note that COSMIC and the Cancer Gene
Census primarily look at genetic changes, as opposed to what the current study
assess, expression changes. However, many mutations in “oncogenes” typically
have the effect of increasing the functional consequences of the gene, which can
also be stimulated through copy number amplification or hypo methylation
leading to gene overexpression. Similarly, mutations in tumor suppressors have
the effect of reducing functionality, which can also be reduced via copy number
deletion or hyper methylation leading to a lack of expression. Therefore, an
interrogation of these 20 genes, with a key focus on those that haven’t been
associated with pancreatic cancer may be a worthwhile endeavor.
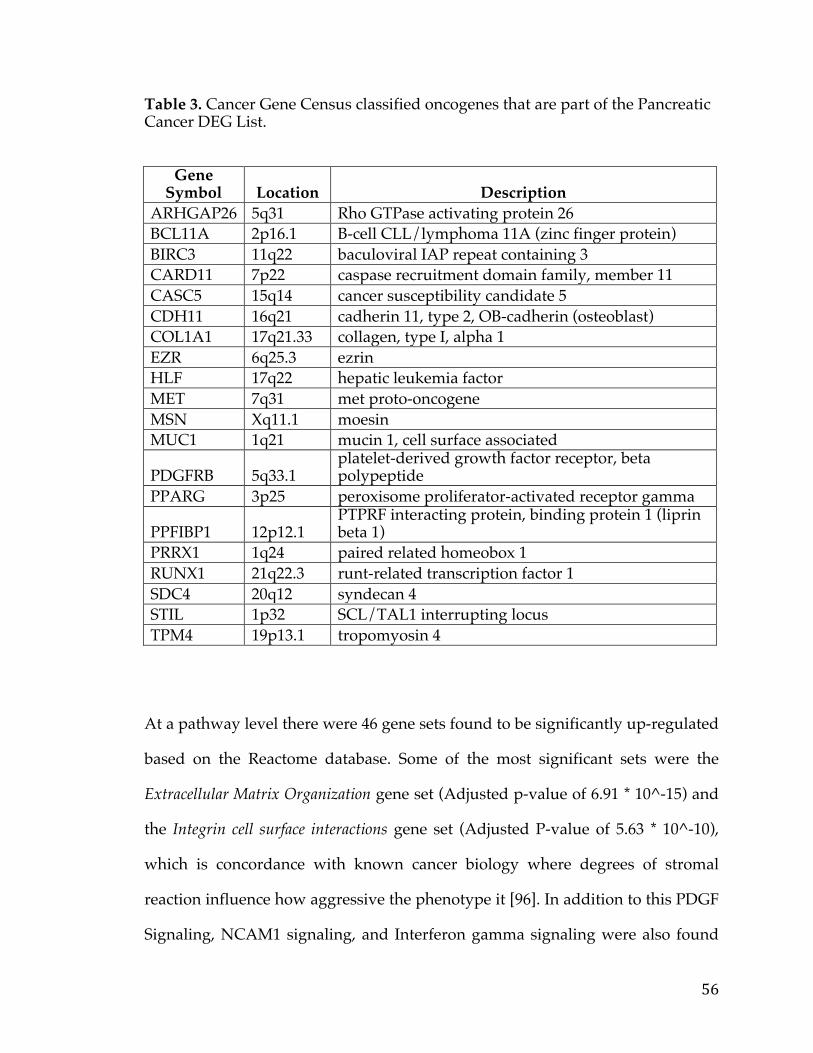
56
Table 3. Cancer Gene Census classified oncogenes that are part of the Pancreatic Cancer DEG List.
Gene Symbol Location Description
ARHGAP26 5q31 Rho GTPase activating protein 26 BCL11A 2p16.1 B-cell CLL/lymphoma 11A (zinc finger protein) BIRC3 11q22 baculoviral IAP repeat containing 3 CARD11 7p22 caspase recruitment domain family, member 11 CASC5 15q14 cancer susceptibility candidate 5 CDH11 16q21 cadherin 11, type 2, OB-cadherin (osteoblast) COL1A1 17q21.33 collagen, type I, alpha 1 EZR 6q25.3 ezrin HLF 17q22 hepatic leukemia factor MET 7q31 met proto-oncogene MSN Xq11.1 moesin MUC1 1q21 mucin 1, cell surface associated
PDGFRB 5q33.1 platelet-derived growth factor receptor, beta polypeptide
PPARG 3p25 peroxisome proliferator-activated receptor gamma
PPFIBP1 12p12.1 PTPRF interacting protein, binding protein 1 (liprin beta 1)
PRRX1 1q24 paired related homeobox 1 RUNX1 21q22.3 runt-related transcription factor 1 SDC4 20q12 syndecan 4 STIL 1p32 SCL/TAL1 interrupting locus TPM4 19p13.1 tropomyosin 4
At a pathway level there were 46 gene sets found to be significantly up-regulated
based on the Reactome database. Some of the most significant sets were the
Extracellular Matrix Organization gene set (Adjusted p-value of 6.91 * 10^-15) and
the Integrin cell surface interactions gene set (Adjusted P-value of 5.63 * 10^-10),
which is concordance with known cancer biology where degrees of stromal
reaction influence how aggressive the phenotype it [96]. In addition to this PDGF
Signaling, NCAM1 signaling, and Interferon gamma signaling were also found

57
to be highly up regulated in concordance with the literature [97, 98, 99]. A full
table of the pathway analysis results can be found in Appendix E.
The gene list was also compared to pancreatic cancer gene lists and survival
signatures from the literature. Specifically, we compared the genes from our
discovery analysis with a prognostic 15-gene signature from the Moffitt Cancer
Center, a 13-gene survival signature from the university of Virginia, a 36-gene
prognostic signature from Barts Cancer Institute, and a 48-gene pancreatic cancer
angiogenic signature developed at the Indiana University School of Medicine [79,
72, 100, 101]. Via inspection of the overlap (Figure 13) we noticed that our
analysis captured a large proportion of the genes from the Moffit signature (P-
value of 2.02x10⁻⁶ based on Hypergeometric test) and the signature from Barts (P-
value of 5.90x10⁻⁶ based on Hypergeometric test) and a few from the gene
Angiogenesis gene list from Indiana. As subsets of our gene list have been
captured previously, this replication suggests some validity to our methodology.
Additionally, a number of genes haven’t been captured in any of the previous
signatures, which may suggest opportunities for applying and/or developing
therapeutics against these targets and the pathways they comprise.
58
Figure 13. Venn Diagram of Pancreatic Cancer DEG list with other published signatures.
3.4.2 Survival Signature & Validation Studies
In order to determine the translational relevance of our analysis and resulting
gene list a survival signature was developed. The signature was culled from the
list of 707 genes, derived from the initial analysis using the ICGC Pancreatic
cancer data set. Specifically, Survival+ (42 samples) and Survival- (61 samples)
groups were defined in the ICGC data according to the same guidelines
Moffit
U.Virginia
Barts
Indiana.UDrexel.U
8
13
27
46691
0
1
06
00
0
0
8
2
0
0
0
0
0
0
0
0
0
0
0
0
0
0
0
0
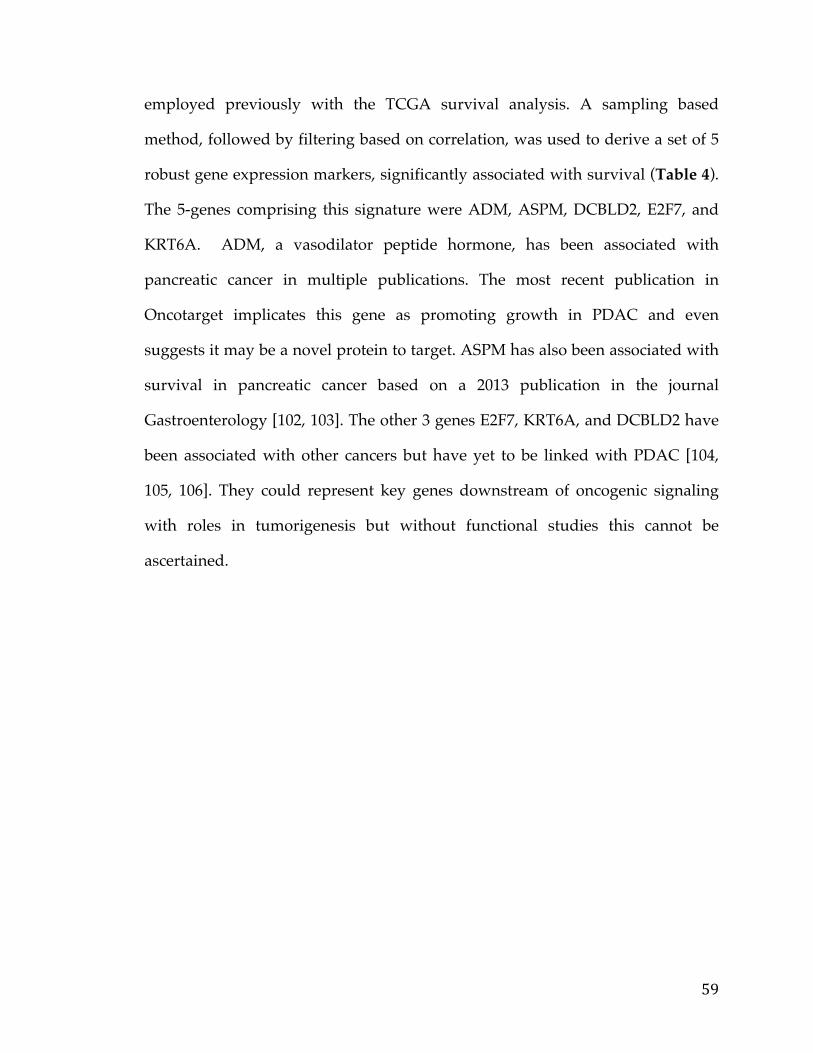
59
employed previously with the TCGA survival analysis. A sampling based
method, followed by filtering based on correlation, was used to derive a set of 5
robust gene expression markers, significantly associated with survival (Table 4).
The 5-genes comprising this signature were ADM, ASPM, DCBLD2, E2F7, and
KRT6A. ADM, a vasodilator peptide hormone, has been associated with
pancreatic cancer in multiple publications. The most recent publication in
Oncotarget implicates this gene as promoting growth in PDAC and even
suggests it may be a novel protein to target. ASPM has also been associated with
survival in pancreatic cancer based on a 2013 publication in the journal
Gastroenterology [102, 103]. The other 3 genes E2F7, KRT6A, and DCBLD2 have
been associated with other cancers but have yet to be linked with PDAC [104,
105, 106]. They could represent key genes downstream of oncogenic signaling
with roles in tumorigenesis but without functional studies this cannot be
ascertained.
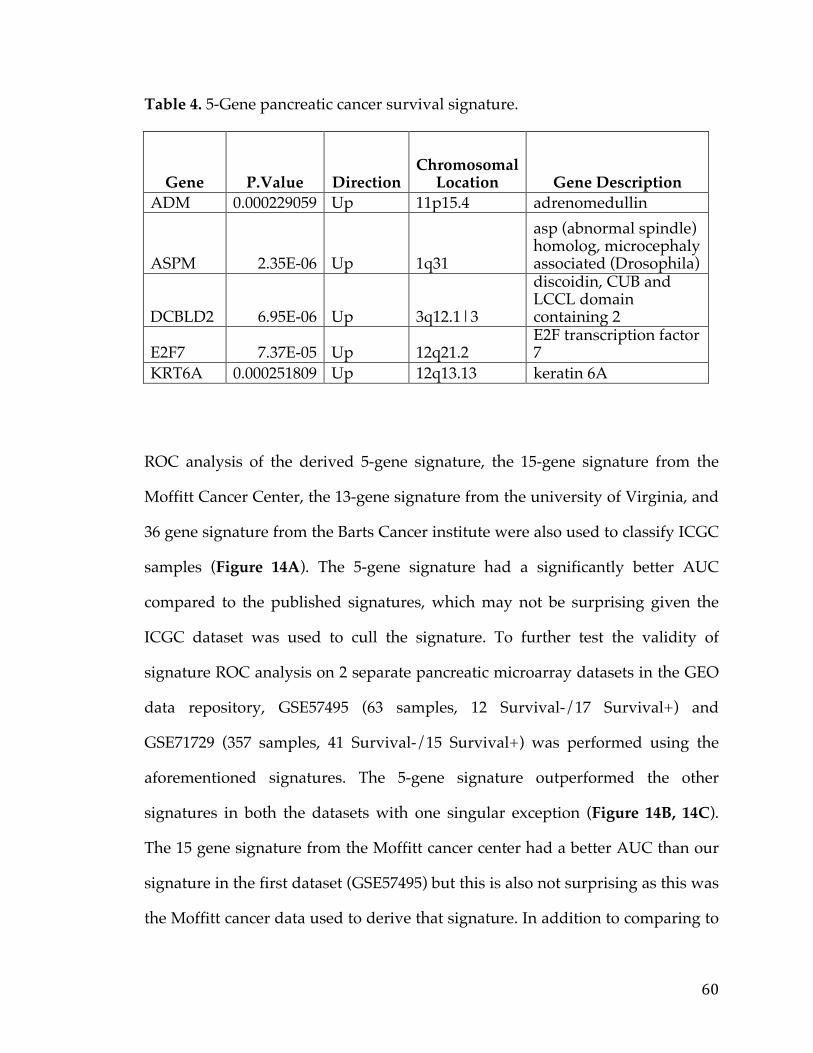
60
Table 4. 5-Gene pancreatic cancer survival signature.
Gene P.Value Direction Chromosomal
Location Gene Description ADM 0.000229059 Up 11p15.4 adrenomedullin
ASPM 2.35E-06 Up 1q31
asp (abnormal spindle) homolog, microcephaly associated (Drosophila)
DCBLD2 6.95E-06 Up 3q12.1|3
discoidin, CUB and LCCL domain containing 2
E2F7 7.37E-05 Up 12q21.2 E2F transcription factor 7
KRT6A 0.000251809 Up 12q13.13 keratin 6A
ROC analysis of the derived 5-gene signature, the 15-gene signature from the
Moffitt Cancer Center, the 13-gene signature from the university of Virginia, and
36 gene signature from the Barts Cancer institute were also used to classify ICGC
samples (Figure 14A). The 5-gene signature had a significantly better AUC
compared to the published signatures, which may not be surprising given the
ICGC dataset was used to cull the signature. To further test the validity of
signature ROC analysis on 2 separate pancreatic microarray datasets in the GEO
data repository, GSE57495 (63 samples, 12 Survival-/17 Survival+) and
GSE71729 (357 samples, 41 Survival-/15 Survival+) was performed using the
aforementioned signatures. The 5-gene signature outperformed the other
signatures in both the datasets with one singular exception (Figure 14B, 14C).
The 15 gene signature from the Moffitt cancer center had a better AUC than our
signature in the first dataset (GSE57495) but this is also not surprising as this was
the Moffitt cancer data used to derive that signature. In addition to comparing to
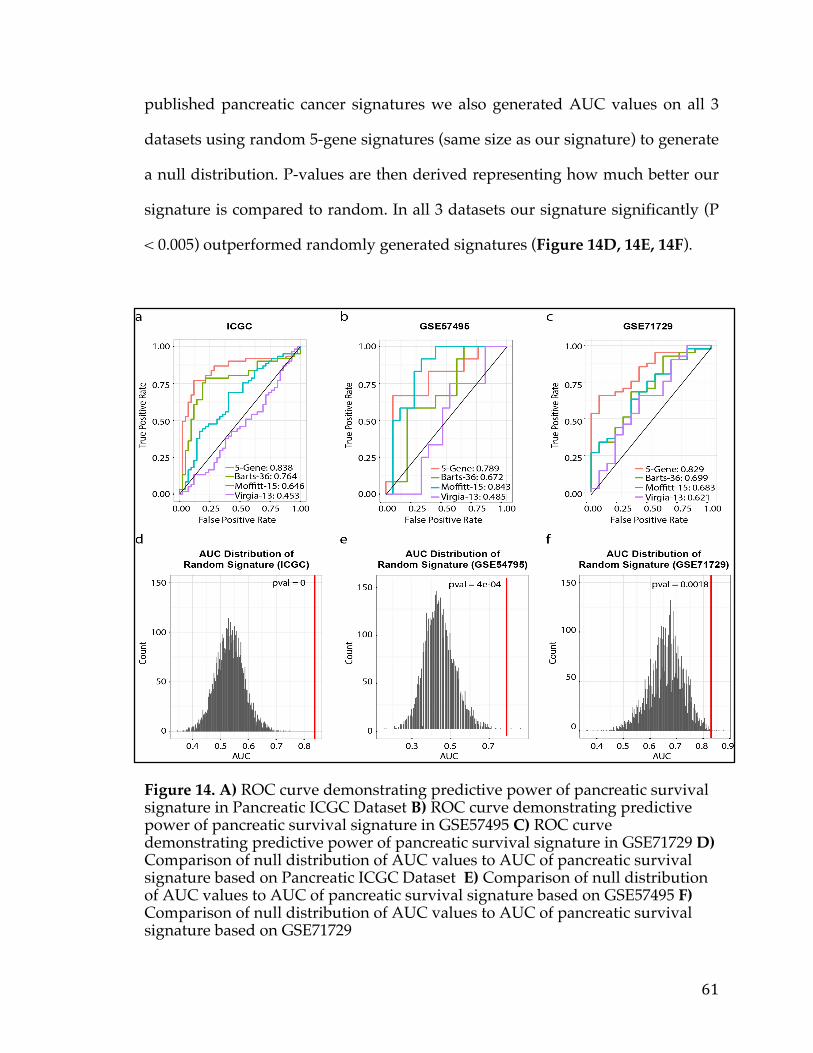
61
published pancreatic cancer signatures we also generated AUC values on all 3
datasets using random 5-gene signatures (same size as our signature) to generate
a null distribution. P-values are then derived representing how much better our
signature is compared to random. In all 3 datasets our signature significantly (P
< 0.005) outperformed randomly generated signatures (Figure 14D, 14E, 14F).
Figure 14. A) ROC curve demonstrating predictive power of pancreatic survival signature in Pancreatic ICGC Dataset B) ROC curve demonstrating predictive power of pancreatic survival signature in GSE57495 C) ROC curve demonstrating predictive power of pancreatic survival signature in GSE71729 D) Comparison of null distribution of AUC values to AUC of pancreatic survival signature based on Pancreatic ICGC Dataset E) Comparison of null distribution of AUC values to AUC of pancreatic survival signature based on GSE57495 F) Comparison of null distribution of AUC values to AUC of pancreatic survival signature based on GSE71729
62
Finally we performed a standard Kaplan-meier analysis using our signature in
all three datasets. The p-value signifying the statistical difference between the
groups was markedly less than 0.01 in all comparisons and it should be noted
that these studies represent different platforms (Figure 15A, 15B, 15C).
Additionally the median survival difference between the two groups was ~12
months or longer in concordance with our discovery analysis thresholds.
Although more testing would need to be done to validate this as a clinically
useful signature these results help to confirm the legitimacy of the initial
discovery analysis in the face of known and unknown potentially confounding
variables such as treatment, weight, or surgical procedure.
Figure 15 A) Kaplan-meier plot demonstrating predictive power of pancreatic survival signature in Pancreatic ICGC Dataset B) Kaplan-meier plot demonstrating predictive power of pancreatic survival signature in GSE57495 C) Kaplan-meier plot demonstrating predictive power of pancreatic survival signature in GSE71729
63
3.4.3 Drug Repositioning & Target Discovery
We next sought to determine whether any of the genes or pathways from our
analysis represented attractive avenues for therapy. To that end, we both looked
genes and pathways that are known to be druggable and have therapeutics
developed against them. Furthermore we sought to identify genes that could
represent novel avenues for therapy development. The latter analysis was
catered specifically toward membrane proteins that could be targeted via
Antibody Drug Conjugate (ADC), monoclonal antibodies (mAB), and Chimeric
Antigen Receptor Therapy (CART).
In order to assess druggability we used the Drug-Gene Interaction database
(DGIdb) developed at the Washington University School of Medicine. This
resource mines all the public drug and interaction space to create a seamless
resource that provides information about drugs, drug-gene interactions, and
potentially druggability. It contains a host of other resources including
PharmGKB, DrugBank, TTD, Hopkins & Groom, and Russ & Lampel, dGene,
PubChem, Ensembl, My Cancer Genome, GO, TALK, FoundationOne clinically
actionable panel, and TEND. Using this resource we were able to identify 8 genes
that are known to be clinically actionable (annotated by FoundationOne) as
shown in Table 5. While some of these are well known such as MET and the use
of c-MET inhibitors, others are still being investigated such as the use of
Proteosome inhibitors to target PDRM1 or JNK inhibitors to target CARD11 [107,
108]. Based on the pathway analysis we performed NCAM1 / CD56 inhibitors
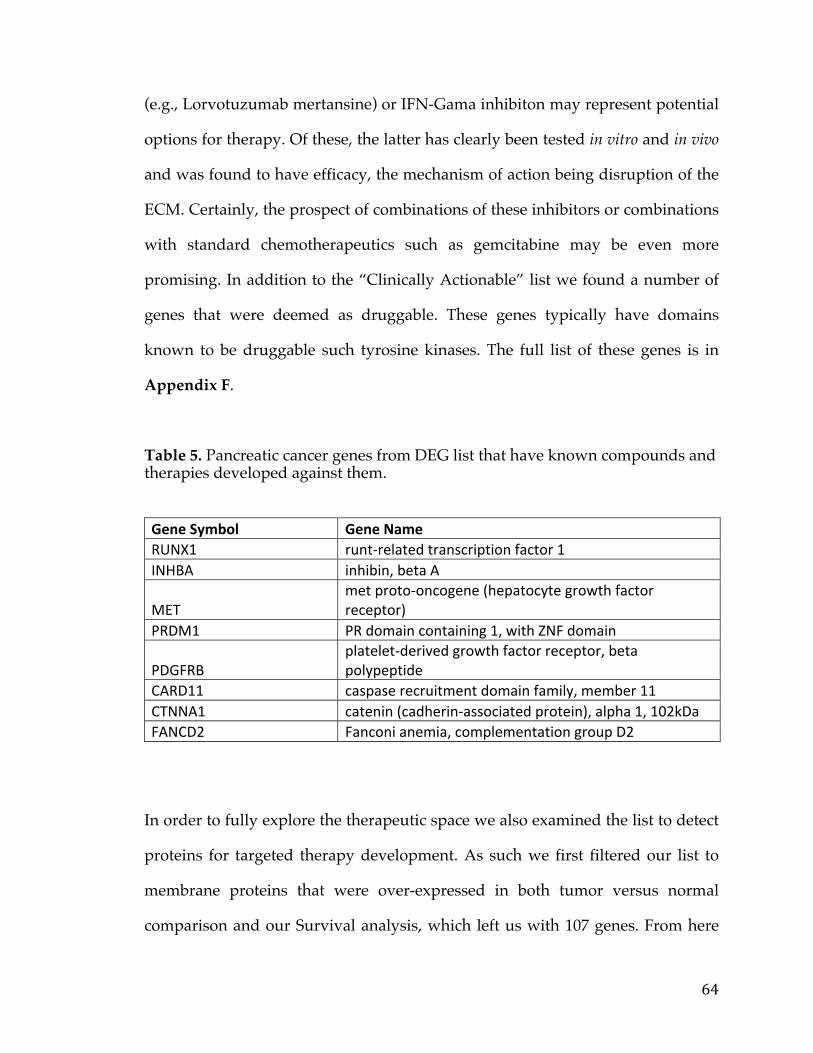
64
(e.g., Lorvotuzumab mertansine) or IFN-Gama inhibiton may represent potential
options for therapy. Of these, the latter has clearly been tested in vitro and in vivo
and was found to have efficacy, the mechanism of action being disruption of the
ECM. Certainly, the prospect of combinations of these inhibitors or combinations
with standard chemotherapeutics such as gemcitabine may be even more
promising. In addition to the “Clinically Actionable” list we found a number of
genes that were deemed as druggable. These genes typically have domains
known to be druggable such tyrosine kinases. The full list of these genes is in
Appendix F.
Table 5. Pancreatic cancer genes from DEG list that have known compounds and therapies developed against them.
GeneSymbol GeneNameRUNX1 runt-relatedtranscriptionfactor1INHBA inhibin,betaA
METmetproto-oncogene(hepatocytegrowthfactorreceptor)
PRDM1 PRdomaincontaining1,withZNFdomain
PDGFRBplatelet-derivedgrowthfactorreceptor,betapolypeptide
CARD11 caspaserecruitmentdomainfamily,member11CTNNA1 catenin(cadherin-associatedprotein),alpha1,102kDaFANCD2 Fanconianemia,complementationgroupD2
In order to fully explore the therapeutic space we also examined the list to detect
proteins for targeted therapy development. As such we first filtered our list to
membrane proteins that were over-expressed in both tumor versus normal
comparison and our Survival analysis, which left us with 107 genes. From here
65
we compared the RNA-Seq gene expression profiles of each of these genes to the
normal expression of these genes (RNA-Seq) based on the GTEx database.
Comparing the 95th percentile of the normal expression profile to the median level
in tumors we see a number of genes with much higher tumor expression as
shown in Figure 16A. Mesothelin (MSLN) one of the genes has a marked large
delta between tumor and pan-normal expression (Figure 16B). Mesothelin is
already being targeted in a Phase II clinical trial (NCT02243371) by a cancer
vaccine and a Chimeric Antigen Receptor therapy (NCT01583686). A number of
other markers with a very similar expression profile exist, such as CEACAM5 &
CEACAM6 (Figure 16C). It has been noted that CEACAM5/6 are upregulated in
pancreatic cancer and may contribute to metastatic potential [109]. Additional
there has been development of CEACAM6 therapeutics, but these studies were
never taken to clinical trials which may be based on the efficacy of the therapy,
models used, or a number of other reasons [110]. Thus it may be worth
investigating this family as well the other genes identified by the analysis as
potentials for targeted therapy development.
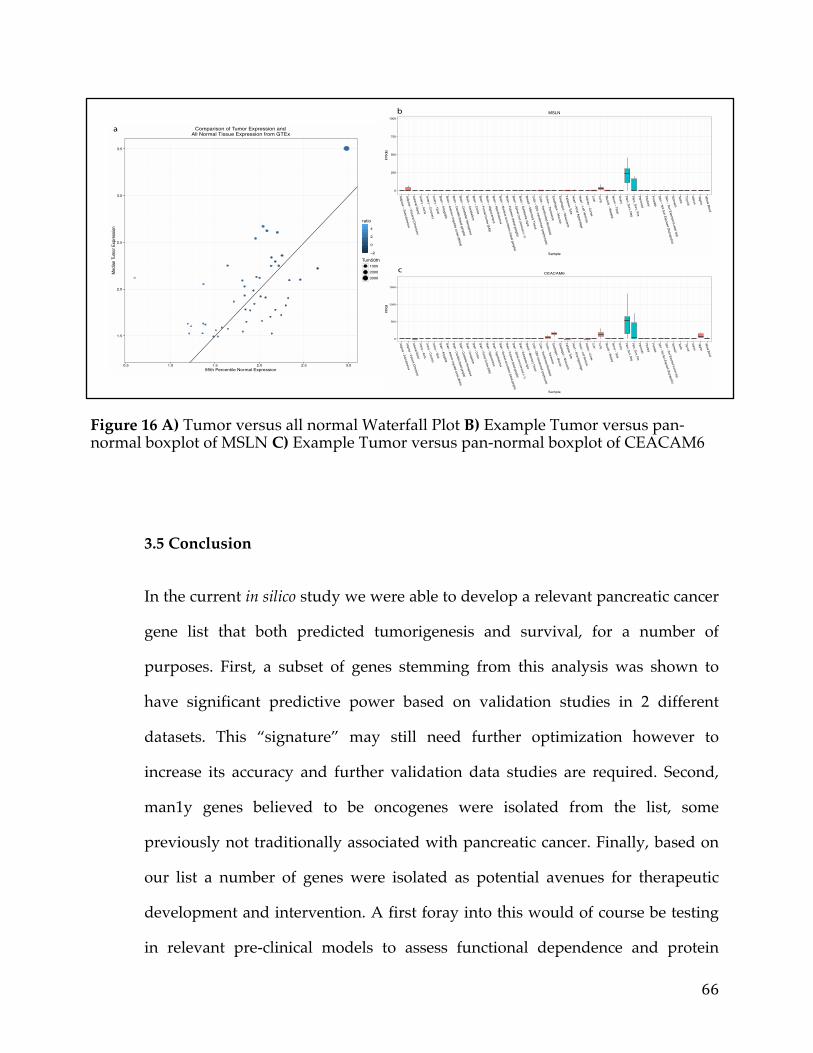
66
Figure 16 A) Tumor versus all normal Waterfall Plot B) Example Tumor versus pan-normal boxplot of MSLN C) Example Tumor versus pan-normal boxplot of CEACAM6
3.5 Conclusion
In the current in silico study we were able to develop a relevant pancreatic cancer
gene list that both predicted tumorigenesis and survival, for a number of
purposes. First, a subset of genes stemming from this analysis was shown to
have significant predictive power based on validation studies in 2 different
datasets. This “signature” may still need further optimization however to
increase its accuracy and further validation data studies are required. Second,
man1y genes believed to be oncogenes were isolated from the list, some
previously not traditionally associated with pancreatic cancer. Finally, based on
our list a number of genes were isolated as potential avenues for therapeutic
development and intervention. A first foray into this would of course be testing
in relevant pre-clinical models to assess functional dependence and protein
1.5
2.0
2.5
3.0
3.5
0.5 1.0 1.5 2.0 2.5 3.095th Percentile Normal Expression
Med
ian
Tum
or E
xpre
ssio
n
−2
0
2
4
ratio
Tum50th1000
2000
3000
Comparison of Tumor Expression andAll Normal Tissue Expression from GTEx
a
b c
0
250
500
750
1000
Adipose − SubcutaneousAdipose − Visceral (O
mentum
)Adrenal G
landArtery − AortaArtery − CoronaryArtery − TibialBrain − Am
ygdalaBrain − Anterior cingulate cortex (BA24)
Brain − Caudate (basal ganglia)Brain − Cerebellar Hem
isphereBrain − CerebellumBrain − CortexBrain − Frontal Cortex (BA9)Brain − Hippocam
pusBrain − Hypothalam
usBrain − Nucleus accum
bens (basal ganglia)
Brain − Putamen (basal ganglia)
Brain − Spinal cord (cervical c−1)Brain − Substantia nigraBreast − M
amm
ary TissueCells − EBV−transform
ed lymphocytes
Cells − Transformed fibroblasts
Colon − TransverseEsophagus − M
ucosaEsophagus − M
uscularisFallopian TubeHeart − Atrial AppendageHeart − Left VentricleKidney − CortexLiverLung
Muscle − Skeletal
Nerve − TibialO
varyPanc_Surv_NegPanc_Surv_PosPancreasPituitaryProstateSkin − Not Sun Exposed (Suprapubic)
Skin − Sun Exposed (Lower leg)Stom
achTestisThyroidUterusVaginaW
hole Blood
Sample
FPKM
MSLN
0
500
1000
1500
Adipose − SubcutaneousAdipose − Visceral (Omentum)Adrenal GlandArtery − AortaArtery − CoronaryArtery − TibialBrain − AmygdalaBrain − Anterior cingulate cortex (BA24)
Brain − Caudate (basal ganglia)Brain − Cerebellar HemisphereBrain − CerebellumBrain − CortexBrain − Frontal Cortex (BA9)Brain − HippocampusBrain − HypothalamusBrain − Nucleus accumbens (basal ganglia)
Brain − Putamen (basal ganglia)Brain − Spinal cord (cervical c−1)Brain − Substantia nigraBreast − Mammary TissueCells − EBV−transformed lymphocytes
Cells − Transformed fibroblastsColon − TransverseEsophagus − MucosaEsophagus − MuscularisFallopian TubeHeart − Atrial AppendageHeart − Left VentricleKidney − CortexLiver
Lung
Muscle − SkeletalNerve − TibialOvaryPanc_Surv_NegPanc_Surv_PosPancreasPituitaryProstateSkin − Not Sun Exposed (Suprapubic)
Skin − Sun Exposed (Lower leg)StomachTestisThyroidUterusVaginaW
hole Blood
Sample
FPKM
CEACAM6
b
c

67
expression. Overall, this study builds upon the wealth of current knowledge in
the field of pancreatic cancer and offers translationally relevant suggestions to
detect and treat this disease.
68
Chapter 4: A Comparison of Survival Analysis methods applied on Cancer Gene Expression RNA-Sequencing data.
4.1 Summary
Identifying genetic biomarkers of patient survival remains a major goal of large-
scale transcriptional profiling studies in cancer. The ability to predict the
outcome of a patient’s tumor makes biomarker discovery a compelling tool for
improving patient care. As genomic technologies improve, a host of data types
can serve as informative biomarkers, and bioinformatics strategies have evolved
around these different types of applications. In the case of categorical variables,
such as the mutation status of a gene or the existence of a fusion transcript,
biomarker identification from survival analysis is quite straightforward. On the
other hand, when dealing with continuous variables, such as RNA-Seq gene
expression, a wide array of methods are available with variable results, and
studies on best practices are lacking. We set out to investigate the performance of
six different survival analysis methods that deal specifically with continuous
data. The methods - k-means, Cox regression, 25th-75th percentile split, median-
split, distribution-based splitting, and Kaplan-scan – were applied to four cancer
cohorts from the Cancer Genome Atlas (TCGA). We assessed the reliability of
these methods by splitting each cancer data set into two groups and examining
the overlap of results. A set of positive controls, genes identified from the
literature as being associated with a particular tumor type, were used to assess
accuracy of the methods via ROC (receiver operating characteristic) analysis for

69
each of the four data sets. We also generated artificial RNA-Seq data to further
test the robustness of these methods under fixed levels of noise. Dichotomization
by either median or splitting at the 25th and 75th percentile performed poorly
based on tests based on accuracy and reliability. Overall, the Cox regression and
k-means methods had the strongest performance across all three criteria. We also
observed that one of the primary factors in the ability of any survival analysis
method to detect genes associated with survival was the number of genes in the
data set with extreme differential expression. Our results indicate that it is not
advisable to dichotomize based on quantiles when performing survival analysis
on RNA-Seq cancer gene expression to identify biomarker genes for discovery
purposes. Instead, the Cox regression method or k-means methods yield far
superior results based on overall assessment of reliability and accuracy
compared to all other methods that were tested.
4.2 Background
All large-scale cancer studies share a common feature – they consistently confirm
that cancer is a complex, heterogeneous genetic disease. Collections of genome-
wide transcriptional profiling data sets captured through technologies like
microarrays and RNA-sequencing (RNA-seq) have improved our insight into the
nature of this heterogeneity for many different tumor types. Through efforts such
as the Cancer Genome Atlas (TCGA) [111], the Expression Oncology Project
(expO) [112], and projects stemming from the International Cancer Genome
Consortium (ICGC) [130], gene expression data sets are now publicly accessible
70
for thousands of tumor samples. We have come to recognize that despite the
heterogeneity of cancer profiles, dominant features, as represented by gene
signatures and biomarkers, do exist, and can be used to predict key properties of
a tumor, such as grade and molecular subtype. In the context of addressing
clinical research problems, the most impactful goal that bioinformatics can solve
is how best to identify genes that are predictive markers of good versus poor
survival of cancer patients.
Studies focusing on genetic variation in tumors have identified specific genes
and their associated lesions that can delineate different patient sub-groups. For
example, the PTCH1 inactivating mutation in medulloblastoma [113], MYCN
amplification in neuroblastoma [114], or KRAS mutation status in non-small cell
lung cancer [115]. While these lesions are valuable for understanding cancer
biology, it is becoming increasingly clear that given the complex nature in which
tumors are regulated, there are advantages to focusing on gene expression-based
markers as well. Instead of the dichotomous or binary associations that are
reflected by genetic variants or copy number aberrations, identifying predictors
of patient survival using gene expression may result in markers that are capable
of predicting more sensitive or subtle degrees of change between these two
variables.
The task of identifying predictive biomarkers can be solved by a host of statistical
methods that are adapted from survival analysis techniques like the Kaplan-
Meier analysis or the log-rank test. The majority of these methods remain geared
towards binary inputs such as the presence or absence of a mutation, gene
71
fusion, or other genetic event. Standard workflows now exist for handling this
kind of data, and identification of these biomarkers are considered routine. On
the other hand, the equivalent framework for continuous inputs, like gene
expression is not so well-established. This is because it is not clear what the
optimal way is for estimating the link between a gene’s expression profile and
survival status in a patient cohort. For instance, a standard regression model
could be used to assess the degree to which changes are occurring between gene
expression and patient survival time. Alternatively, expression could be
dichotomized based on a threshold and standard workflows for dichotomous
data could be applied. However, identifying what this threshold should be is
also not a trivial question. Simply put, is it better to dichotomize a gene’s
expression profile, and if so, how does one identify the breakpoints to facilitate
this dichotomization?
To our knowledge, a comprehensive investigation to address this important
question has not been performed. Therefore, we compared the performance of
different statistical methods that estimate the effect of gene expression and
survival status to determine the optimal strategy for solving the issue of how to
identify predictive markers of patient survival, in the context of cancer gene
expression data sets. RNA-seq data sets from four TCGA studies - serous ovarian
cancer, prostate cancer, kidney cancer, and glioblastoma multiforme – were used
to test the reliability and accuracy of six competing survival analysis methods.
Collectively, the six methods selected each come with their own set of
advantages and limitations for finding biomarkers of survival based on gene
72
expression data (Figure 17). Cox regression is a flexible method that allows for
the inclusion of additional covariates to adjust for other explanatory variables,
further improving the accuracy of the estimate between survival and gene
expression. The k-means method has been borrowed from exploratory data
analysis methods where k-means clustering is used to split the gene expression
data into two groups in an unsupervised manner, and then a log-rank test is
applied to assess difference in survival for these two groups. The three other
methods are advantageous in that they are simple to use. The Kaplan-Scan
method identifies the optimal breakpoint by considering multiple candidates and
choosing the one that creates the most significant separation between patient
groups. While this method avoids using an arbitrary threshold for
dichotomization it suffers from an increased rate of false positives that must be
adjusted for by applying multiple hypothesis testing correction methods [122].
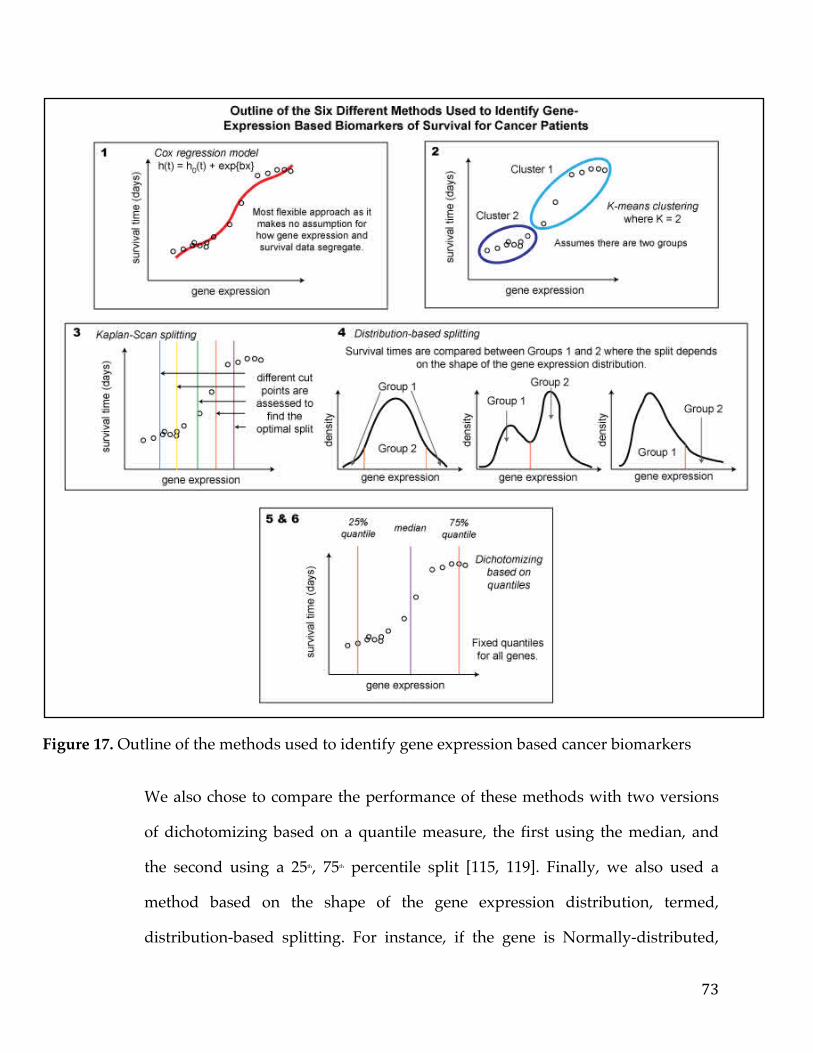
73
Figure 17. Outline of the methods used to identify gene expression based cancer biomarkers
We also chose to compare the performance of these methods with two versions
of dichotomizing based on a quantile measure, the first using the median, and
the second using a 25th, 75th percentile split [115, 119]. Finally, we also used a
method based on the shape of the gene expression distribution, termed,
distribution-based splitting. For instance, if the gene is Normally-distributed,
74
then patient sub-groups are formed based on the most extreme 5th percentiles of
the gene expression distribution. Alternatively, if the gene is asymmetric or
bimodally-distributed then the sub-groups are determined based on one side of
the distribution, or the two separate modes, respectively.
The usage of these six methods have varying degrees of popularity and ease of
application. Statistical software applications such as SPSS or SAS accommodate
Cox regression or a median cut-off for survival analysis. A handful of standalone
tools, such as Cutoff Finder [118], an online suite of optimization and
visualization routines for cutoff determination, also offer a variety of survival
analysis methods. Both the k-means and distribution approach are novel
methods for this kind of application.
In our evaluation, we examined two different characteristics of these six
methods: reliability and accuracy. To evaluate reliability, for each of the data sets,
we split the data into two groups in a stratified manner, ensuring the number
samples with and without an event was approximately the same in both. We
then assessed the correlation between the results obtained from the analysis
methods applied to each half of the data. To evaluate the accuracy of the six
methods, we examined the percentage of known cancer genes (specific to a
tumor type) identified by the method using ROC analysis. Both reliability and
accuracy were assessed for the four TCGA cancer data sets. Additionally, we also
generated in silico data sets with a known set of positive controls to assess the
robustness of the methods, where controlled levels of noise were added to the
synthetic data sets.
75
4.3 Methods
4.3.1 Data Sets
4.3.1.1 TCGA Data Sets
Data was obtained from the TCGA using the Broad GDAC FIREHOSE utility
[123] where RNA-seq gene expression patient survival data was obtained for
kidney cancer, ovarian cancer, prostate cancer, and head & neck cancers. Gene
lists representing those genes to be used as positive controls for the accuracy
analysis were obtained from the database genesigdb [124]. This resource contains
curated sets of gene signatures from the literature, and gene lists that were
relevant to survival in the tumor type included in our study and survival were
chosen. To ensure greater relevance and specificity to biomarkers of survival,
signatures in genesigdb that were associated with classifying cancer molecular
subtypes or were specific biomarkers of a molecular subtype were discarded.
The gene signatures that we enlisted for the accuracy tests were for ovarian
cancer, 115 genes from Spentzos et. al. that is referred to as the Ovarian Cancer
Prognostic Profiles (OCPP) [125]. This list was derived from computational
analysis on gene expression data. For kidney cancer, a list of 259 genes that
correlate with survival (post-surgery), from Zhao et al [126] was used. For head
and neck cancer, a list of 42 genes from Chung et. al. was derived
computationally from gene expression data, comparing high-risk and low-risk
patients [127]. Finally, for prostate cancer we used a list of 50 genes, from
76
Henshall et. al., which was obtained from a survival analysis of gene expression
microarray data on a patient cohort [128]. The signatures that were chosen to be
used in our study were most relevant to the tumor type and survival, as opposed
to a specific subtype.
4.3.1.2 Simulated Data Sets
Artificial RNA-Seq count data were generated using the ‘SimSeq’ Package in R
[129]. This package requires a set of source RNA-Seq data to model and mimic
the distribution of counts. We used the head and neck cancer data set as our
source model as it had the greatest the number of patient samples. We generated
and added noise, assumed to be normally distributed, to each gene as a
percentage of the mean of that gene across all patient samples. A total of 7 data
sets were generated, consisting of 150 patient samples and 5000 genes, with
controlled levels of simulated noise, ranging from 0 to 1.5 times the values of the
mean 250 positive controls were also generated by taking a random sample of
genes and adding a random multiplier (from 1-8) to all of those samples with
events for that gene. Specifically, for any given gene in the set of 250 positive
controls, we took the samples with an event and multiplied them all by an
integer sampled uniformly from the set {1,8}. The probability of being multiplied
by one of these integers was set as uniform for this simulation.

77
4.3.2 Survival Analysis Methods
4.3.2.1 The Kaplan-Scan method
As expression values are continuous variables, we incorporated a scanning
approach to the Kaplan–Meier method by moving samples between the two
groups to define the best P-value as the breakpoint or separation point. For
instance, for a particular gene, the expression values were sorted. Upon sorting,
the bottom 5% were assigned to group 1 and the top 95% were assigned to group
2. This step serves to convert this continuous variable into a binary variable for
subsequent survival analysis. At this point, the log-rank test was run on the two
groups (group 1 and group 2), and a P-value was calculated. In the subsequent
step, the smallest sample from group 2 was transferred to group 1 and the log-
rank test was run again. This moving of samples iteratively continued until
group 1 encapsulated the bottom 95% of values and group 2 held the top 5% of
values. The lowest P-value was then chosen as the optimal breakpoint of the two
groups and reported. A Benjamini–Hochberg correction was performed on all
the P-values generated from this scanning approach to reflect the presence of
multiple hypotheses testing. Consider, for example, 100 samples of data, one
would end up running 90 different log-rank tests for a given gene using this
approach. The multiple hypothesis problem grows linearly with the sample size.
In the end, both the original and corrected P-values were returned at the optimal
breakpoint (lowest P-value) for each gene.
78
4.3.2.2 Dichotomizing by quantiles
A standard way to turn a continuous variable into a binary or categorical
variable is simply to dichotomize the variable by finding a breakpoint. Since the
range and distribution of variables may vary quantile-based dichotomization
schemes are very popular. A natural quantile to create a cut-point in your
continuous variable is the median. This will, cleanly divide you continuous
variable into two groups without losing any samples. This is commonly seen
when trying to identify diagnostic markers for clinical tests and one of the
methods we tried. Another method we used, which is also prevalent in the
literature is to create cut-points at the 25th percentile and 75th percentile. This of
course creates three partitions but we don’t consider the middle partition in the
analysis, thus effectively disregarding a subset of samples.
4.3.2.3 k-means
k-means is a standard clustering method that partitions the data points into K
groups where K is a pre-specified number. For our particular application In each
iteration of the algorithm, every sample is assigned to the cluster whose
mean/centroid yields the least within-cluster sum of squares. This is followed by
an update on the cluster centroids as the memberships of the samples change.
The algorithm finally converges when the memberships of the genes no longer
alter. We specify K=2 to perfectly dichotomize the continuous variable into 2
separate groups. Standard survival analysis is then run on the binary,
transformed gene expression data.
79
4.3.2.4 Cox regression
A common method that does not require dichotomizing a variable a priori is Cox
regression. This model is one of the most commonly used statistical methods for
survival analysis. This model provides an estimate of treatment effect on survival
after adjustment for other explanatory variables. In addition, it allows us to
estimate the risk (or hazard) of death of an individual given their prognosis
variables. The model is written as:
h(t)=h0(t) × exp{b1x1+b2x2+⋯+bnxn}
Where h(t) is the hazard function which estimates the risk at any given time t
and is determined by a set of n covariates (x1, x2, …,xn). Regression coefficients
(b1,b2,..., bn) adjust the proportional change that the hazard related to changes in
the covariates. h0 is the baseline hazard function that corresponds to the
probability of hazard when all covariates are zero.
4.3.2.5 Distribution dichotomization method
The premise of this method is that genes may have different expression
distributions in a patient cohort, and that testing for differences in patient
survival time based on gene expression should therefore accommodate the shape
or type of the distribution. For example, if a gene is symmetrically distributed,
where it follows a Normal distribution then it would be natural to compare the
survival times of patients in both upper and lower tails of this distribution.

80
Alternatively, if the distribution is asymmetric, then a more sensible comparison
may be to compare the survival times of the patients falling in the tail versus
non-tail regions. Finally, if the gene’s distribution is not unimodal but instead
bimodal, then a more natural comparison is between the patients in each mode of
the distribution. We used a computational scheme that assesses the most likely
distribution of a gene’s expression profile by first considering bimodality
through the Bimodal Index (BI) [131]. If the BI > 1.1, the gene is designated
bimodal and survival time is tested between the patients classified in one
group/mode versus another. If the gene is not bimodal, the expression
distribution is simultaneously tested for belonging to the Normal, Lognormal,
Pareto, Gamma and Cauchy distribution and the gene is assigned to the
distribution with the most significant P-value. For genes that are either the
Normal or Cauchy, survival is tested for patients in the upper and lower tails
versus the patients in the non-tail region. For the Gamma, Pareto and Lognormal
distributions, survival is compared between the tail and non-tail regions. If all
distributions tested were not significant then the gene was listed as having an
unknown distribution and survival analysis was not performed.
For testing Normality and Lognormality, we used the Shapiro test from the R
package stats (version 3.2.2) with a threshold of 0.01 on the data and log of the
data respectively [132]. For Pareto, Gamma and Cauchy, the Kolmogorov-
Smirnov test was applied [133]. For this test, the parameters were estimated with
the Maximum Likelihood Estimates (MLE). For the MLE of Gamma, we used the
rGammaGamma R package (version 1.0.12.). For Cauchy, the two parameters
were set as the median and the interquartile range. As the parameters were
81
estimated directly from the data, we applied a parametric bootstrap to estimate
the final P-value. This idea of resampling to find the null distribution of the test
statistics when estimating the parameters is based on the Lilliefors test [134]. The
threshold for the final p-value was set to 0.01 for the significance. For testing
Bimodality, we computed the Bimodality Index from the R package
ClassDiscovery (version 3.0.0.) [131].
4.3.3 Different Metrics for Comparison of the Six Methods
Reliability of a survival analysis method was assessed by splitting each cancer
data set in a stratified manner into two half-groups, performing survival
analysis, and computing the correlation of final results between the two data
halves. For every gene, the p-value measuring the association between
expression and patient survival was calculated using each of the six different
methods. We computed the correlation between the negative log10(p-value)
between the two partitions of a cancer data set to assess reliability of each
method. For instance, a data set of 5000 genes and 150 samples (100 Alive, 50
deceased) would be divided into two sets of 100 samples (each with 75 alive and
25 deceased). Survival analysis would be performed for each of the 5000 genes on
the first set and the second set independently. The correlation of each gene
between the two sets was then examined to quantify the reliability of the method
for all genes in the cancer data set.
Accuracy of a survival analysis method was assessed using ROC analysis based
on gene sets identified from GeneSigDB as relevant positive controls. ROC
82
analysis describes the relationship between the proportion of true positives
(sensitivity) and false positives (1-specificity) resulting from each possible
decision threshold value in a two-class classification problem. The overall curve
formed from the different classification points is informative of the accuracy of
the method, specifically the area under this curve can be used as a quantitative
measure of how accurate the method is. ROC curves were visualized using the
ggplot2 R package and Area Under the Curve (AUC) values were obtained using
the AUC R package [135].
Robustness of a survival method was assessed by generating in silico data,
adding noise and then assessing accuracy by ROC analysis. The in silico datasets
were generated with controlled levels of noise and the same set of positive
controls. The AUC was used to assess the accuracy of a method at differing levels
of noise to investigate how susceptible a method was to noise in its ability to
detect the positive controls in the data.
4.4 Results & Discussion
The performance of the six survival analysis methods was evaluated according to
three criteria, reliability, accuracy and robustness. First, we assessed reliability of
the six methods. We did this by dividing each cancer data set into two sets,
running the method on both to identify markers and comparing the consistency
of these results. Second, accuracy was assessed by comparing the results of each
method to a gold standard list of known prognostic expression markers that
were specific to each tumor type. We then computed ROC curves to look at the
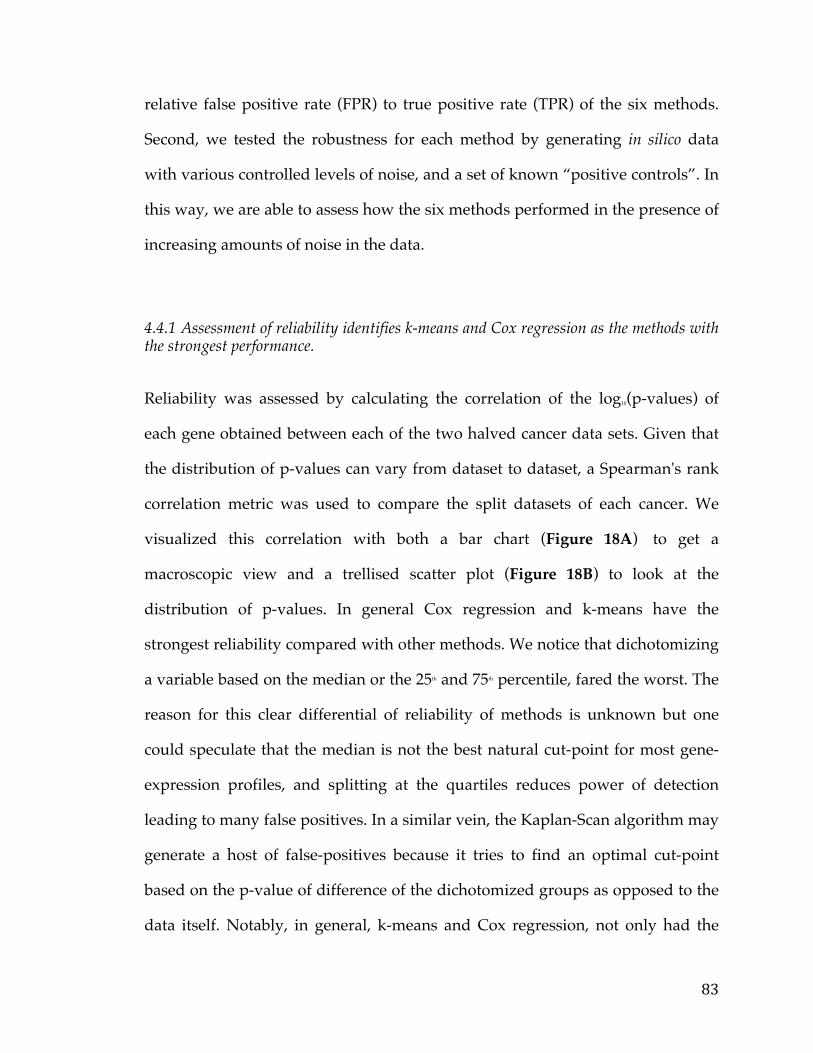
83
relative false positive rate (FPR) to true positive rate (TPR) of the six methods.
Second, we tested the robustness for each method by generating in silico data
with various controlled levels of noise, and a set of known “positive controls”. In
this way, we are able to assess how the six methods performed in the presence of
increasing amounts of noise in the data.
4.4.1 Assessment of reliability identifies k-means and Cox regression as the methods with the strongest performance.
Reliability was assessed by calculating the correlation of the log10(p-values) of
each gene obtained between each of the two halved cancer data sets. Given that
the distribution of p-values can vary from dataset to dataset, a Spearman's rank
correlation metric was used to compare the split datasets of each cancer. We
visualized this correlation with both a bar chart (Figure 18A) to get a
macroscopic view and a trellised scatter plot (Figure 18B) to look at the
distribution of p-values. In general Cox regression and k-means have the
strongest reliability compared with other methods. We notice that dichotomizing
a variable based on the median or the 25th and 75th percentile, fared the worst. The
reason for this clear differential of reliability of methods is unknown but one
could speculate that the median is not the best natural cut-point for most gene-
expression profiles, and splitting at the quartiles reduces power of detection
leading to many false positives. In a similar vein, the Kaplan-Scan algorithm may
generate a host of false-positives because it tries to find an optimal cut-point
based on the p-value of difference of the dichotomized groups as opposed to the
data itself. Notably, in general, k-means and Cox regression, not only had the

84
most reliable results but were also similar in the genes they picked out as being
significant (Figure 19). The heatmap shows the correlation of the results of
survival analysis across each of the cancer data sets (unsplit) for each method.
While the groups initially partition by cancer, the k-means and Cox regression
results are always in the same lowest branch and have a higher degree of
correlation to one another than the other methods.
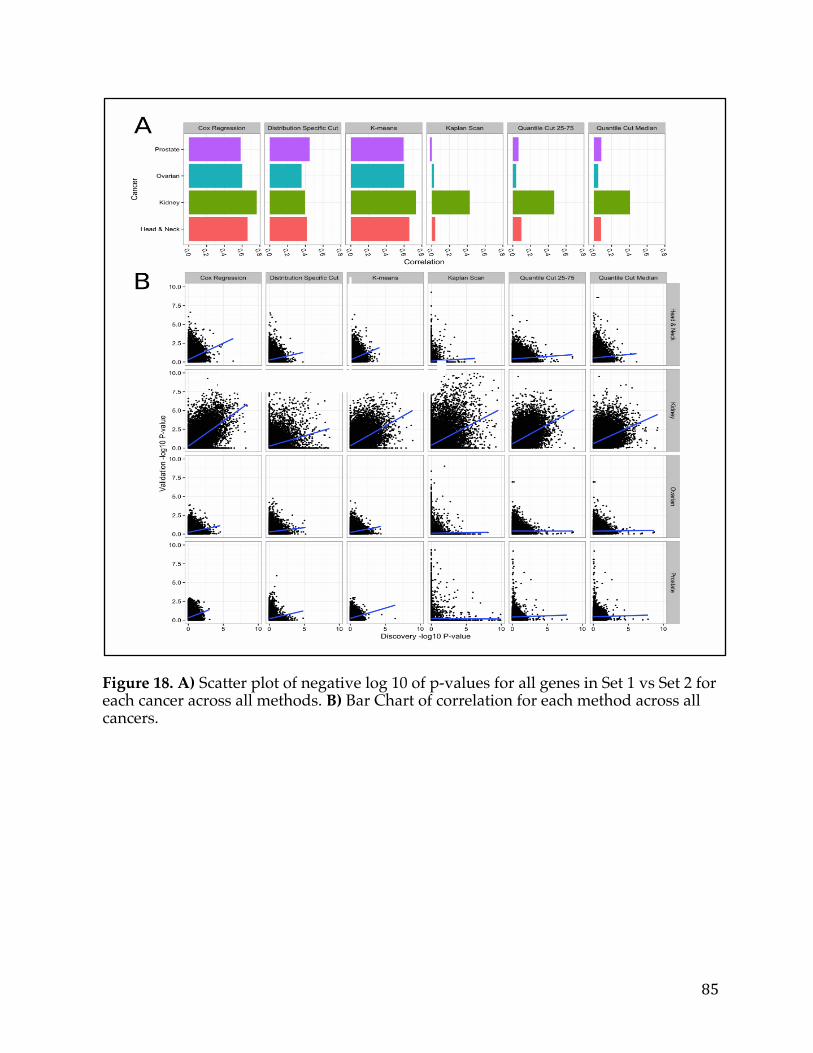
85
Figure 18. A) Scatter plot of negative log 10 of p-values for all genes in Set 1 vs Set 2 for each cancer across all methods. B) Bar Chart of correlation for each method across all cancers.
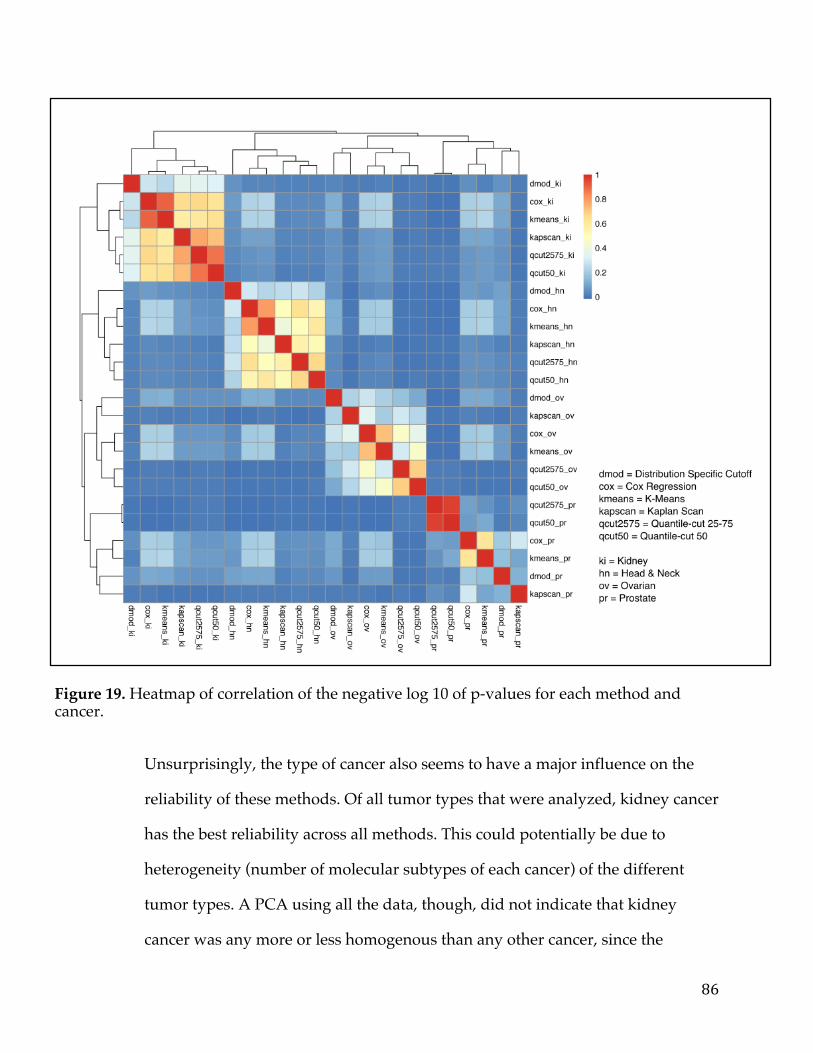
86
Figure 19. Heatmap of correlation of the negative log 10 of p-values for each method and cancer.
Unsurprisingly, the type of cancer also seems to have a major influence on the
reliability of these methods. Of all tumor types that were analyzed, kidney cancer
has the best reliability across all methods. This could potentially be due to
heterogeneity (number of molecular subtypes of each cancer) of the different
tumor types. A PCA using all the data, though, did not indicate that kidney
cancer was any more or less homogenous than any other cancer, since the
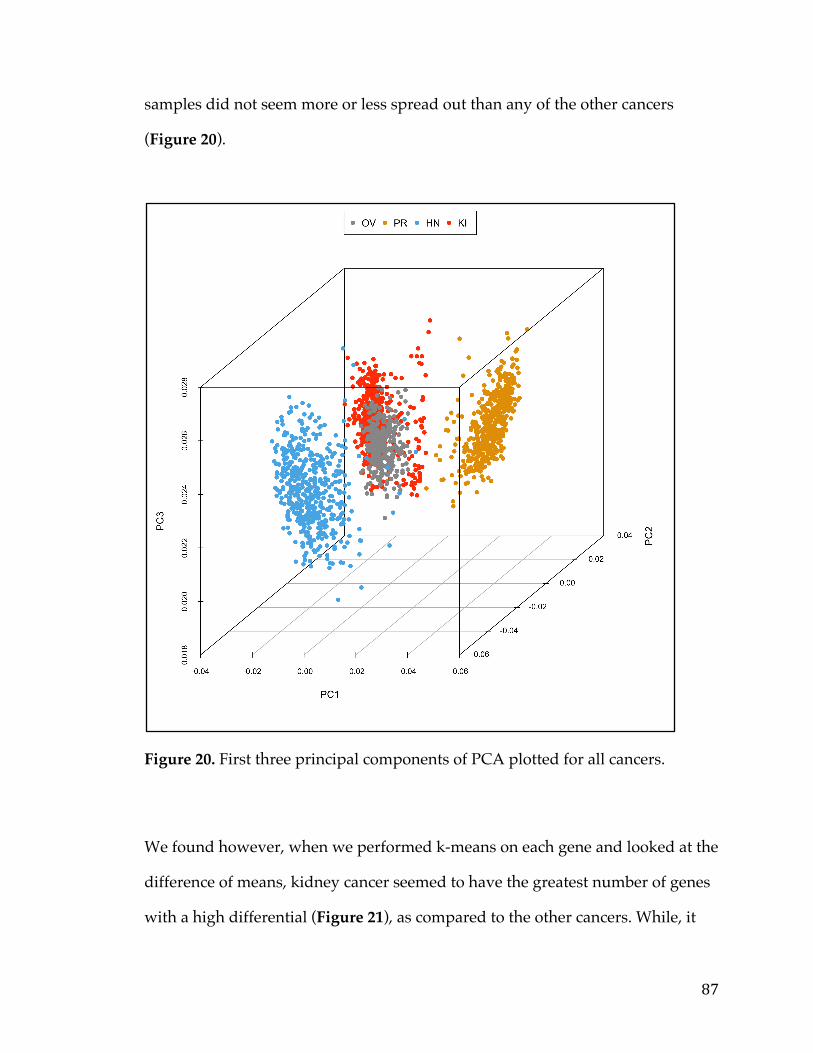
87
samples did not seem more or less spread out than any of the other cancers
(Figure 20).
Figure 20. First three principal components of PCA plotted for all cancers.
We found however, when we performed k-means on each gene and looked at the
difference of means, kidney cancer seemed to have the greatest number of genes
with a high differential (Figure 21), as compared to the other cancers. While, it

88
cannot be proven for certain that this is the cause of the discrepancy between
kidney cancer and the other tumors profiled it seems likely given that genes with
extreme differential expression between groups with and without an event
would certainly be easier to detect independent of the method applied.
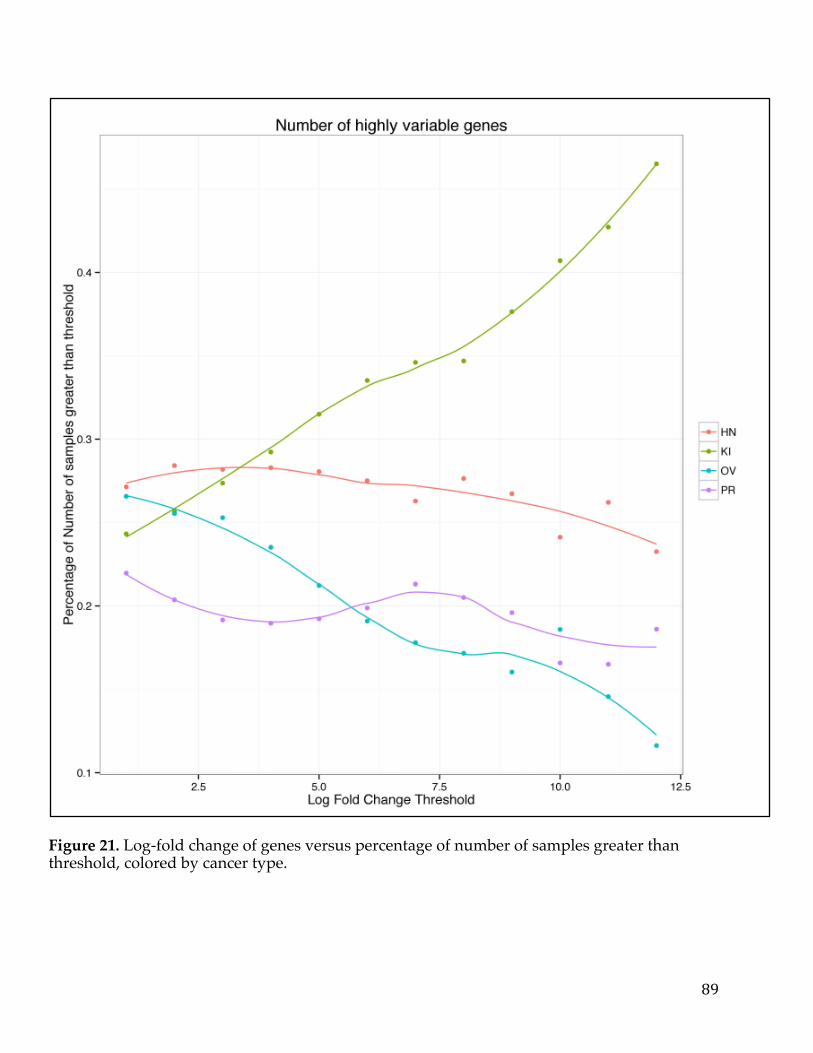
89
Figure 21. Log-fold change of genes versus percentage of number of samples greater than threshold, colored by cancer type.
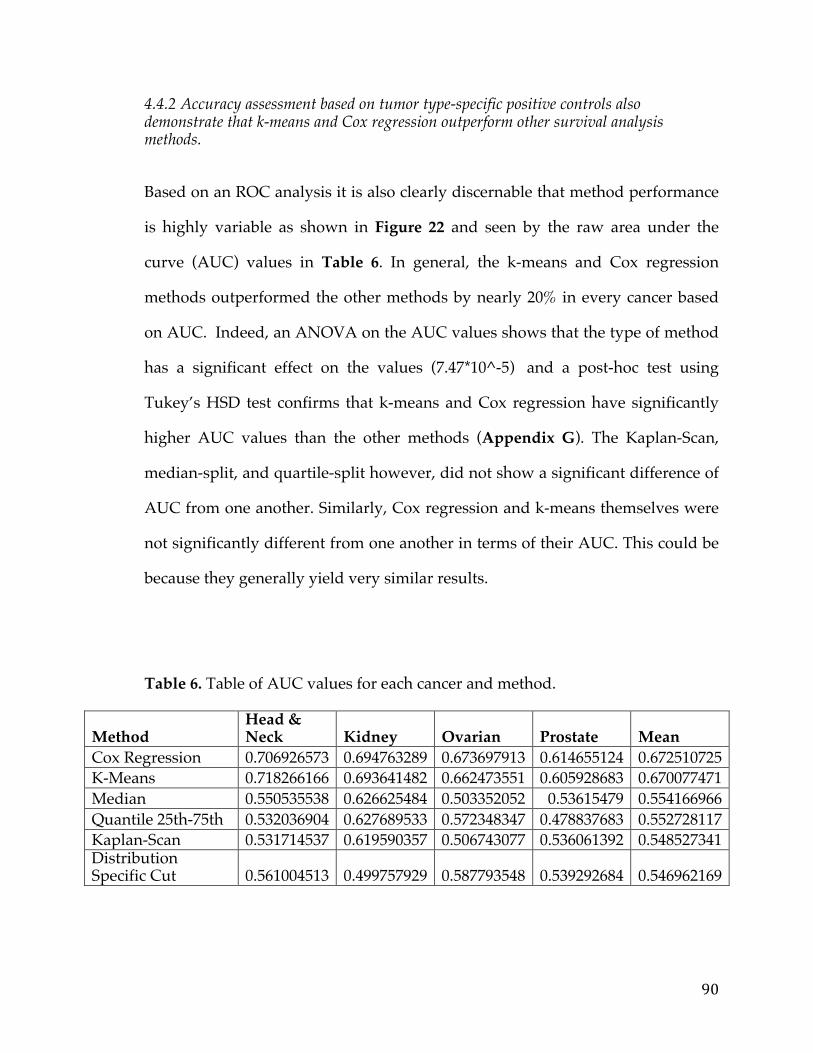
90
4.4.2 Accuracy assessment based on tumor type-specific positive controls also demonstrate that k-means and Cox regression outperform other survival analysis methods.
Based on an ROC analysis it is also clearly discernable that method performance
is highly variable as shown in Figure 22 and seen by the raw area under the
curve (AUC) values in Table 6. In general, the k-means and Cox regression
methods outperformed the other methods by nearly 20% in every cancer based
on AUC. Indeed, an ANOVA on the AUC values shows that the type of method
has a significant effect on the values (7.47*10^-5) and a post-hoc test using
Tukey’s HSD test confirms that k-means and Cox regression have significantly
higher AUC values than the other methods (Appendix G). The Kaplan-Scan,
median-split, and quartile-split however, did not show a significant difference of
AUC from one another. Similarly, Cox regression and k-means themselves were
not significantly different from one another in terms of their AUC. This could be
because they generally yield very similar results.
Table 6. Table of AUC values for each cancer and method.
Method Head & Neck Kidney Ovarian Prostate Mean
Cox Regression 0.706926573 0.694763289 0.673697913 0.614655124 0.672510725 K-Means 0.718266166 0.693641482 0.662473551 0.605928683 0.670077471 Median 0.550535538 0.626625484 0.503352052 0.53615479 0.554166966 Quantile 25th-75th 0.532036904 0.627689533 0.572348347 0.478837683 0.552728117 Kaplan-Scan 0.531714537 0.619590357 0.506743077 0.536061392 0.548527341 Distribution Specific Cut 0.561004513 0.499757929 0.587793548 0.539292684 0.546962169
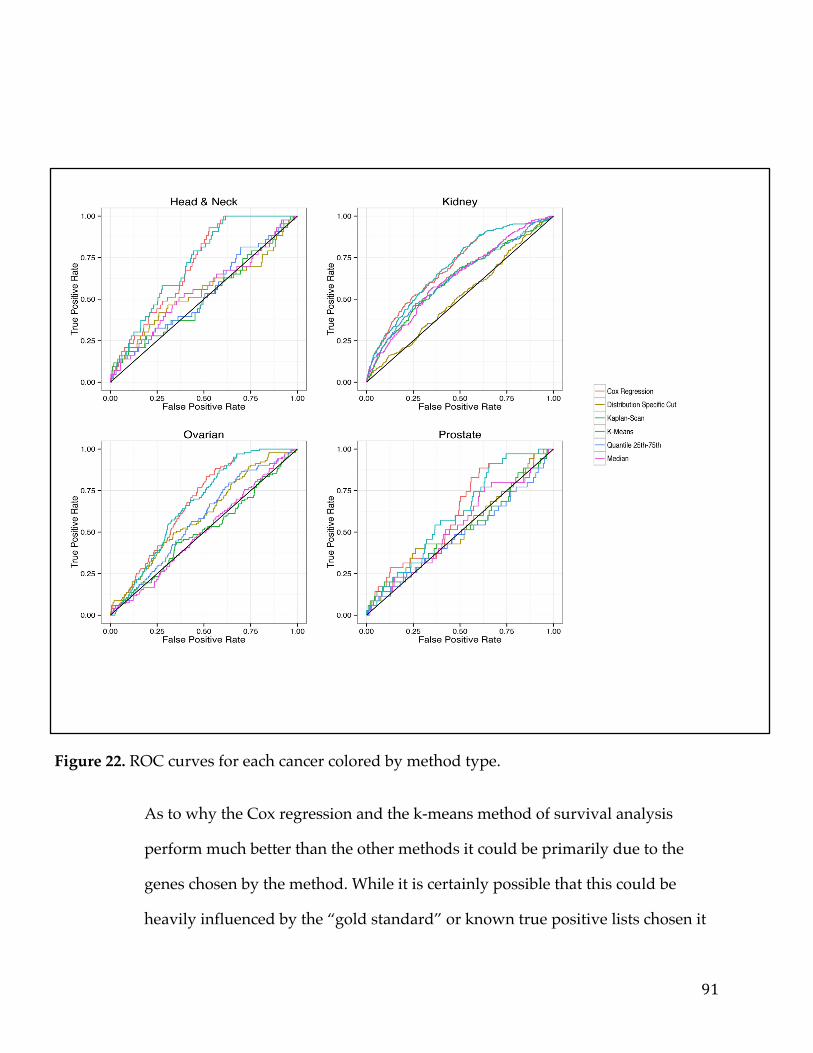
91
Figure 22. ROC curves for each cancer colored by method type.
As to why the Cox regression and the k-means method of survival analysis
perform much better than the other methods it could be primarily due to the
genes chosen by the method. While it is certainly possible that this could be
heavily influenced by the “gold standard” or known true positive lists chosen it

92
seems unlikely that each of the cancer lists favors two methods exclusively.
Additionally, this observation was apparent in the tests of reliability conducted
for all methods. Thus, it seems probable that the k-means and Cox regression
method simply perform better than the other methods because of their ability to
identify true positives and false positives more robustly in the presence of noisy
data.
4.4.3 Testing for robustness using in silico data identifies Cox regression as the method that is least sensitive to different levels of noise.
Overall, our tests identified Cox regression as the method that was the most
robust to noise using the in silico data sets. As we varied the noise incrementally
in our artificially simulated data set, both median and quartile-split methods
increasingly lose their ability to detect signal in the data (Figure 23). However,
the Cox regression method was not as affected by increases in the degree of noise
in the data. This observation is consistent with the results from the ROC analysis
using positive controls that was performed on real data. It seems likely that this
may actually reflect the ability of Cox regression method to handle continuous
data in a way that is naturally more robust to noise. Contrary to the tests based
on accuracy, k-means did not perform as well in the presence of noise but the
method of creating positive controls, generating data, and even adding noise of
course are factors that could have been the cause or influence of this result. A
thorough examination of all the parameters of our simulation study would be
helpful for identifying what circumstances and experimental designs cause each
method to fail or perform inappropriately.

93
When we consider mechanistically, how the six methods differ in their approach
to the same task, the performance of these methods appear to reflect differences
in the degree to which assumptions are made of the data. The method that makes
the least assumptions, Cox regression, has the best overall performance. To
appreciate this, consider how the Cox regression model represents the most
general method where the model estimates how gene expression changes with
respect to survival data via a single covariate. The next least restrictive method is
k-means, which assumes the existence of two patient sub-groups, however
beyond this, does not make further assumptions regarding how these groups
should be structured. The third method, Kaplan-scan, is more restrictive than the
first and second because it assumes that an inherent ordering exists amongst the
patients, and attempts to iteratively identify the boundary between the two most
optimal groups.
The distribution-based splitting method uses parametric assumptions to define a
set of rules for dichotomization based on quantiles depending on the gene
expression distribution. While this method allows for flexibility in that it will
adapt the dichotomization rule given the shape of the distribution, it also carries
with it assumptions regarding the parametrization of these distributions that
may not always hold true for each gene. Finally, the two methods based on
dichotomizing using a quantile value were the simplest approaches to
implement; however, represents they represent the most restrictive and least
flexible of the six methods because they does not take into account the shape of
the distribution, the data structure amongst patients, or the existence of
94
alternative candidates for the breakpoint location. It was therefore unsurprising
that this method had the poorest performance overall in all tests of reliability,
accuracy and robustness.
Figure 23. ROC curves and AUC scatter plot for each method applied on artificial data with various levels of noise.
4.4 Conclusions
Our study conclusively demonstrated that Cox regression and k-means were the
most optimally-performing methods for identifying markers of patient survival
from cancer RNA-seq data when based on tests of accuracy, reliability and
robustness. We recommend against methods based on dichotomizing the
expression data using quantiles, or the Kaplan-Scan method as these both
performed poorly on our tests. It should be noted that our study and
corresponding testing framework was designed around the task of performing

95
an unbiased discovery or identification of candidate biomarkers from large-scale
data sets. If a marker is identified by non-bioinformatic means then it certainly
may be reasonable to then determine an appropriate cutoff to guide treatment
decisions in a clinical setting. We have also shown that the number of highly
differential genes in a cancer influences greatly the ability to predict markers,
independent of the method employed. In the future, we hope to investigate
robust methods and more sensitive approaches to handle the problem of
identifying markers of survival in the presence of very heterogeneous cancer
data. Improving these kinds of techniques will hopefully pave the way to
develop personalized and more accurate cancer diagnostic tests.
96
Chapter 5: The PITFIT Framework for Oncology Target Identification Translational Research
5.1 Summary
Personalized medicine currently remains one of the main challenges in cancer
health care, the main obstacle being identification of those genes and pathways
specific to a particular individual’s cancer that can be targeted by specific
therapeutic modalities. Large-scale cancer genomic datasets and sophisticated
algorithms are instrumental to analyze and prioritize candidate genes and
relevant biological pathways and molecular functions. However, increasing the
accessibility of the data so that a larger user base can ask relevant domain driven
questions and generate hypotheses is equally important.
As such, the goal of this project is to develop a framework in the cloud that
allows for easy identification and prioritization of targets, accessible by data
scientists and biologists alike. The target user-base of this application would be
cancer researchers and investigators in academia and industry with some
understanding of the common genetic lesions and pathways in the cancer(s) they
are studying. The application is meant to be an easy way for researchers to
access cancer ‘big data’ and utilize their experience and domain expertise
alongside the application logic of the tool to prioritize translationally relevant
testable hypotheses.
The application has three tools that perform different functions but work in
concert to generate testable hypotheses. The first tool can be used to identify
97
cancer targets using data from The Cancer Genome Atlas (TCGA). The second
tool utilizes a number of different knowledge bases to rank and prioritize gene
targets for a particular cancer. The final tool implements data from the Cancer
Cell Line Encyclopedia (CCLE) to determine models and screens for validating a
hypothesis or set of hypotheses.
There are quite a few bioinformatics tools in the public sector that can analyze
cancer data, however an application with a strong focus on target discovery and
prioritization has still not been fully addressed. As such, this application fulfills a
need in the cancer research and cancer informatics community and can provide
unique functionality that users can utilize in concert with other open-source web
tools to effectively conduct in silico translational cancer research.
5.2 Background
5.2.1 Target Identification Target Generation and identification using in silico methods from large-scale
cancer genomic studies is typically the starting point to developing a therapeutic.
There is a known gap between the deluges of NGS data that is publicly available
and the gene targets and associated therapeutics derived from them however.
This is clearly illustrated by the fact the Office Of Cancer Genomics has a major
program dedicated to bridging this void, the Cancer Target Discovery and
Development program (CTD2); whose goal is to “bridge the gap between the
enormous volumes of data generated by genomic characterization studies and
the ability to use these data for the development of human cancer therapeutics”
98
[31]. Thus, the tools and frameworks to link genomic data and therapies is a clear
need that must be met, to allow cancer researchers to make important
translational discoveries at a quicker rate.
There are numerous obstacles, however, that stand in the way of making the leap
from genomics data to gene targets. First, much of the genomic high-throughput
experiments generate “big data” and thus parallel-computing and efficient
algorithms are necessary to process and manage the data. Depending on the
length of the sequencing reads and the number of reads an NGS runs can run
between 5-200GB and upward and thus a study can easily be in the terabytes
(bordering on petabytes) [136].
Second, machine learning and advanced statistical techniques that can draw
proper conclusions about the significance of various findings are required. This
is especially important because, unlike many other diseases, cancer genomes
(with some exceptions) are typically littered with hundreds of mutations and
other genetic lesions that are not associated with the tumor but rather or random
events. This is due to the failure of chromosome repair mechanisms that bring
about spurious non-deleterious mutations that occur randomly throughout the
genome. Many mutations discovered in cancer cells are thus neutral passengers,
also known as “passenger mutations” that merely accompany functionally
important drivers that have been subject to selective pressure. It is very
important to differentiate the “passenger” mutations from the “driver”
mutations as targeting “passengers” will have little functional effect on the cell
[137]. In addition to mutations, there are other lesions that take the form of
99
amplification of a gene (multiple DNA copies), fusion genes (a fusion of part of
one gene to a part of another that will drive the expression of the chimeric
transcript), and epigenetic events that “drive” the cancer. Given the sheer size of
the genome, 3 billion base pairs, and the number of potential events many of
which are “false-positives” in terms of cancer association it is no wonder that
statistics plays a huge role in being able to truly elucidate the underpinnings of
particular molecular cancer subtype [138]. In fact there are entire packages and
libraries that are dedicated to the statistical analysis of various NGS technologies.
Unfortunately, neither high-performance computing nor advanced statistics are
always readily available to cancer researchers. This can result in significant
delays in the gene target identification process and the corresponding
development of specific therapeutics. Hence, many web portals have sprung up
in response such as the cBioPortal of MSKCC and the Tumor Portal of the Broad
Institute. They exist with the primary purpose of bridging the gap between the
cancer researcher and the large and complex genomic data sets they have access
to.
These, portals allow a researcher to interrogate their data in a variety of ways.
The entry point could be a gene. In this scenario, the user already has a gene they
are interested in which they have presumably identified from prior research or
literature searches. They would then be able to look at this gene across various
samples in a cohort in terms of expression levels, mutation frequencies, copy
number, or other events. Overall, this entry-point leads to summary statistics
about the gene queried in the cohort. An example in Figure 24 shows the BRAF
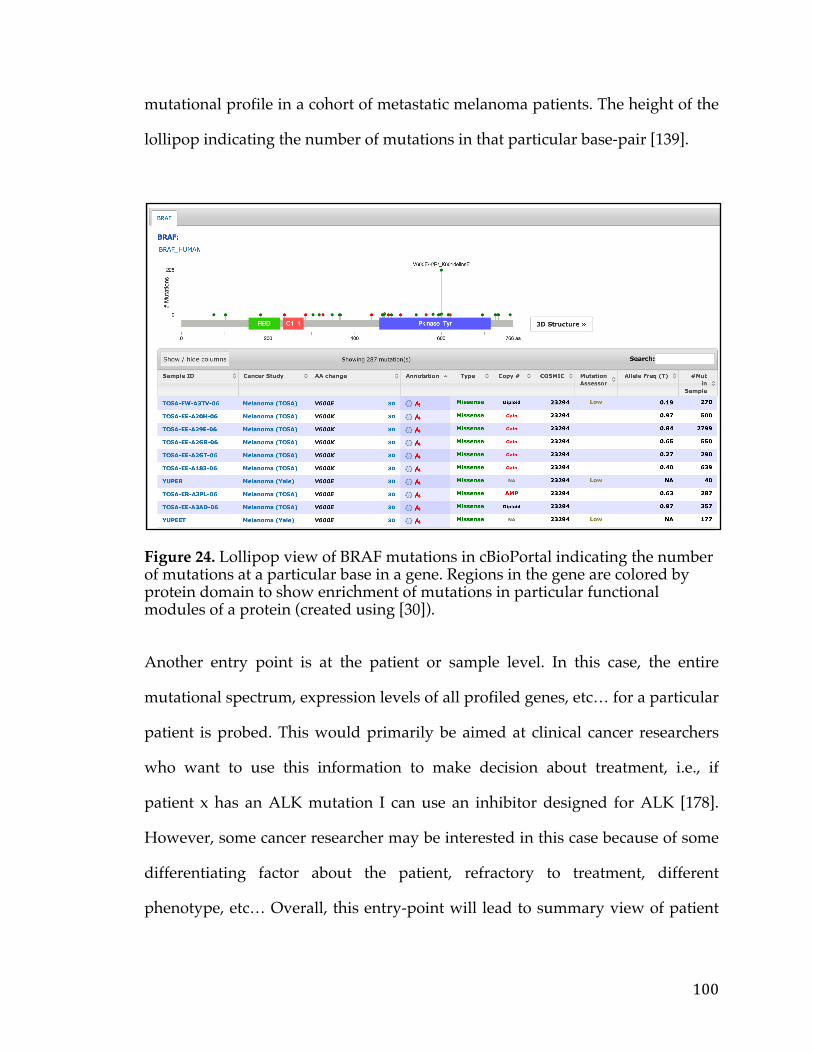
100
mutational profile in a cohort of metastatic melanoma patients. The height of the
lollipop indicating the number of mutations in that particular base-pair [139].
Figure 24. Lollipop view of BRAF mutations in cBioPortal indicating the number of mutations at a particular base in a gene. Regions in the gene are colored by protein domain to show enrichment of mutations in particular functional modules of a protein (created using [30]).
Another entry point is at the patient or sample level. In this case, the entire
mutational spectrum, expression levels of all profiled genes, etc… for a particular
patient is probed. This would primarily be aimed at clinical cancer researchers
who want to use this information to make decision about treatment, i.e., if
patient x has an ALK mutation I can use an inhibitor designed for ALK [178].
However, some cancer researcher may be interested in this case because of some
differentiating factor about the patient, refractory to treatment, different
phenotype, etc… Overall, this entry-point will lead to summary view of patient

101
profile. A typical view of this is the circos plot which can show a number of
different genetic events in one view.
The final entry-point is at the cohort level. In this scenario you usually get the
mutational frequencies and summaries of other frequently altered genes. This
gives a landscape view of the cohort and can divine the potential driver
mutations in a subset of patients. This represents de novo discovery of actionable
features and is the current practice for many cancer researcher when the causes
of a articular cancer are not fully revealed.
None of these scenarios cover the case in which a user is aware of the particular
genetic lesions that give rise to a cancer but cannot therapeutically target these
genes. It could also happen that some of these lesions are actionable but escape
mechanisms cause immediate refraction of the cancer to the therapy after a few
rounds of treatment. This is an all too common phenomenon and is testament to
the power of clonal evolution in cancer cells. An example case that is often
referenced is that of a patient who suffered from metastatic melanoma, known to
be driven by the BRAF V600E mutation [140, 141]. The drug, Plexicon 4032,
initially had dramatic results but upon continued usage the cancer became
refractory to treatment owing to secondary mutations [142]. Thus simply
knowing the “driver” or cause of the cancer does not guarantee therapy as clonal
evolution can be used to circumvent single-agent therapies.
This is where the new wave of therapeutics comes into play. This set of
therapeutics has much more specificity to targets and are generally easier to
102
develop [143]. Antibody Drug Conjugates for instance can be designed to target
any protein on the cell. The protein need not be oncogenic but could just
represent a passenger mutation or a down-stream target of the oncogene or
oncogenic pathway that has no functional relevance for the survival of the
cancer. Another class of therapeutics, Chimeric Antigen Receptor, a form of
adoptive cell transfer works in a similar fashion. In this therapeutic regime T-
Cells are reversed engineered to attack a particular protein. We could imagine a
researcher wanting to develop a novel therapeutic strategy in metastatic
melanoma. A starting point could be BRAF mutations that are known to be
involved in upwards of 50% of melanoma cancer cases [140]. The researcher
would want to find proteins, which may not be functional themselves, but
correlated to BRAF that could be targeted by using CART or ADC. There is
currently no commercial or open-source application to do this. So, in this case
they would have to go through a number of different steps to do this,
downloading data, performing the correlation, and defining the cut-off and
significant findings. This process can take quite a while due to data processing
and analysis times.
The proposed application solves this by allowing the user to have a gene as an
entry point but then define all the potential genes, correlated to the query gene.
This is crucially important in cases where the gene itself is not directly actionable
but a clinical diagnostic test to identify the genetic lesion in the gene exists. This
presents an excellent opportunity because the test can be a companion diagnostic
to the treatment, which actually targets a correlated gene.
103
Essentially, the first part of this application, known as the Prioritization and
Identification Tool For Intelligent Therapeutics (PITFIT), encompasses the ability
to find relevant genes correlated to either the mutation status of a gene, the copy
number status, or the expression levels. This is done for a particular cancer or a
molecular subset of samples. Currently there are 4 TCGA cancers included in the
study but more can be flexibly added. A brief section on the methods used to
identify correlated genes follows.
5.2.2 Target Prioritization
Whereas candidate target identification tends to be a purely data-driven step,
usually a large-scale experiment such as an RNAi Screen, NGS run, or proteomic
experiment candidate prioritization and selection is typically more biased. The
adage ‘looking under the lamp post’ is often used in this context to describe the
phenomenon of investigators and researchers selecting targets based on personal
bias [168, 169]. For instance a researcher may rank one gene higher than the other
if they have done some research on the gene previously or it appeared in a high-
profile journal.
The problem is that the amount of information and results produced by these
large-scale experiments can be overwhelming and this in turn makes it difficult
prioritize genes for follow. Compound this with the fact that in general that the
bandwidth of following up on each of the genes, can be very limited depending
on the setting. Follow-up is not confined to wet bench experimentation to
validate expression of the protein in a model cell line, rather also entails the
104
literature searches and research the investigator needs to perform on each gene.
Generally, a researcher could spend months researching genes, reading paper
upon paper and looking at various web portals in order to narrow down a list
derived from a data mining campaign or genome-wide experiment or screen.
The researcher will then spend several months validating the chosen genes in
models they have selected which can take much longer depending on availability
of reagents. The whole candidate prioritization can take anywhere from 6-8
months but in general the attributes that make a gene more attractive as a cancer
target are quantifiable and can be broken down into a few key things [172, 173].
First, it is important to determine the rationale of why a gene is differentially
regulated in the cancer and the context and biology around the gene. For
instance the gene could be the transcriptional target of a particular transcription
factor such as one of the ETS Transcription factor family, and if this transcription
factor is known to play a role in tumourigenesis, than it stands to reason that its
targets would be up-regulated in response to stimulation. Additionally,
understanding the molecular function and cellular processes associated with the
genes allows the researcher to hypothesize its role in the cell and tumourigenesis.
For instance, a gene could be a receptor tyrosine kinase with a role in cell
signaling and proliferation [173, 174, 175]. If the substrate for the signaling is
known to be involved in cancer progression than this automatically makes this
gene target more appealing. Overall, gaining a biological context around the
gene helps the researcher immensely in making prioritizations decisions as
biology guides and predicates informed therapeutic development.
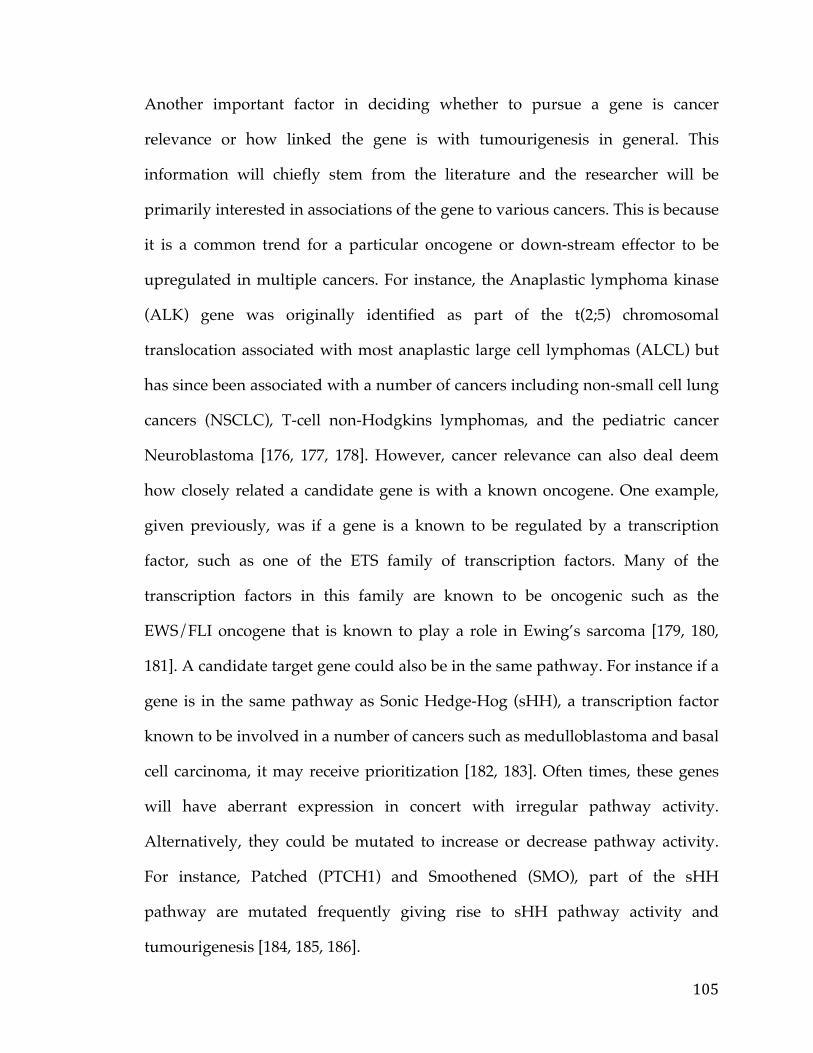
105
Another important factor in deciding whether to pursue a gene is cancer
relevance or how linked the gene is with tumourigenesis in general. This
information will chiefly stem from the literature and the researcher will be
primarily interested in associations of the gene to various cancers. This is because
it is a common trend for a particular oncogene or down-stream effector to be
upregulated in multiple cancers. For instance, the Anaplastic lymphoma kinase
(ALK) gene was originally identified as part of the t(2;5) chromosomal
translocation associated with most anaplastic large cell lymphomas (ALCL) but
has since been associated with a number of cancers including non-small cell lung
cancers (NSCLC), T-cell non-Hodgkins lymphomas, and the pediatric cancer
Neuroblastoma [176, 177, 178]. However, cancer relevance can also deal deem
how closely related a candidate gene is with a known oncogene. One example,
given previously, was if a gene is a known to be regulated by a transcription
factor, such as one of the ETS family of transcription factors. Many of the
transcription factors in this family are known to be oncogenic such as the
EWS/FLI oncogene that is known to play a role in Ewing’s sarcoma [179, 180,
181]. A candidate target gene could also be in the same pathway. For instance if a
gene is in the same pathway as Sonic Hedge-Hog (sHH), a transcription factor
known to be involved in a number of cancers such as medulloblastoma and basal
cell carcinoma, it may receive prioritization [182, 183]. Often times, these genes
will have aberrant expression in concert with irregular pathway activity.
Alternatively, they could be mutated to increase or decrease pathway activity.
For instance, Patched (PTCH1) and Smoothened (SMO), part of the sHH
pathway are mutated frequently giving rise to sHH pathway activity and
tumourigenesis [184, 185, 186].
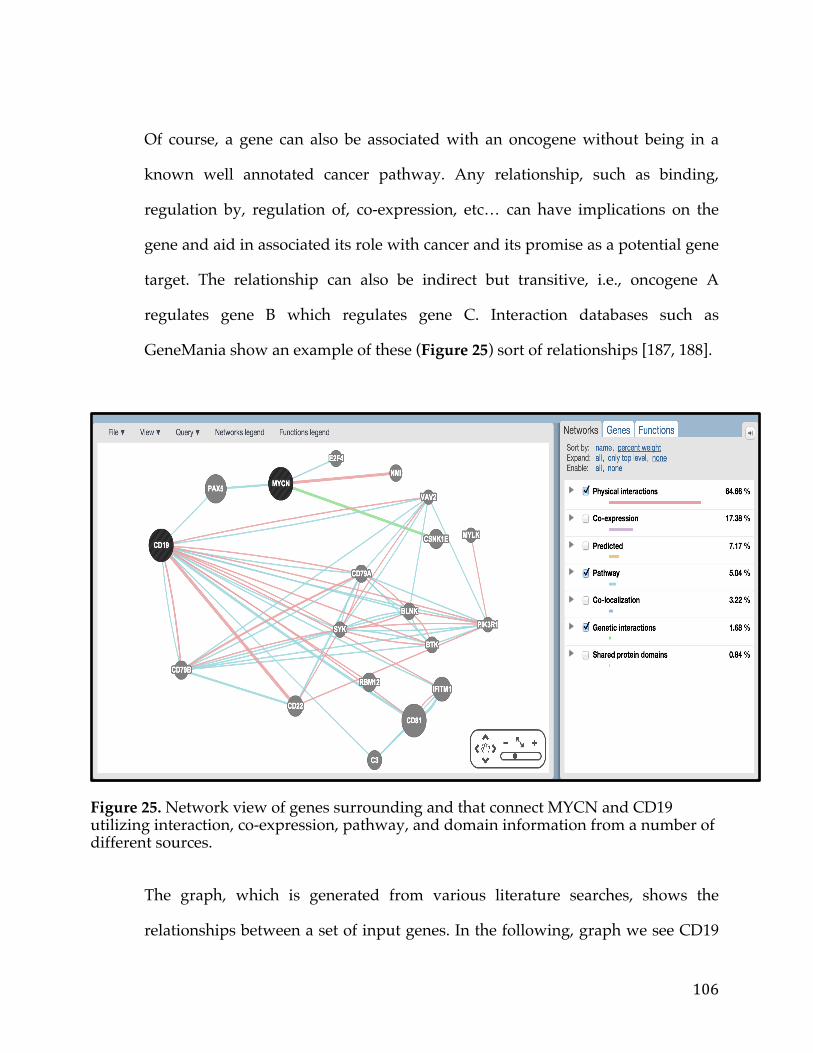
106
Of course, a gene can also be associated with an oncogene without being in a
known well annotated cancer pathway. Any relationship, such as binding,
regulation by, regulation of, co-expression, etc… can have implications on the
gene and aid in associated its role with cancer and its promise as a potential gene
target. The relationship can also be indirect but transitive, i.e., oncogene A
regulates gene B which regulates gene C. Interaction databases such as
GeneMania show an example of these (Figure 25) sort of relationships [187, 188].
Figure 25. Network view of genes surrounding and that connect MYCN and CD19 utilizing interaction, co-expression, pathway, and domain information from a number of different sources.
The graph, which is generated from various literature searches, shows the
relationships between a set of input genes. In the following, graph we see CD19

107
is 2 degrees (edges) away form the transcription factor MYCN connected via the
PAX5 Transcription factor [189]. NMI on the hand is only one degree from
MYCN. In general any sort of association of a candidate target gene with an
oncogenic factor or cancer helps with prioritizing the gene for follow up.
Additionally, one can be much more unbiased and assess cancer relevance by
looking at survival associated with a gene (Figure 26). The typical form of
survival analysis takes the form of the Kaplan-meier plot with a line for each
group (shown below) [190, 191, 192].
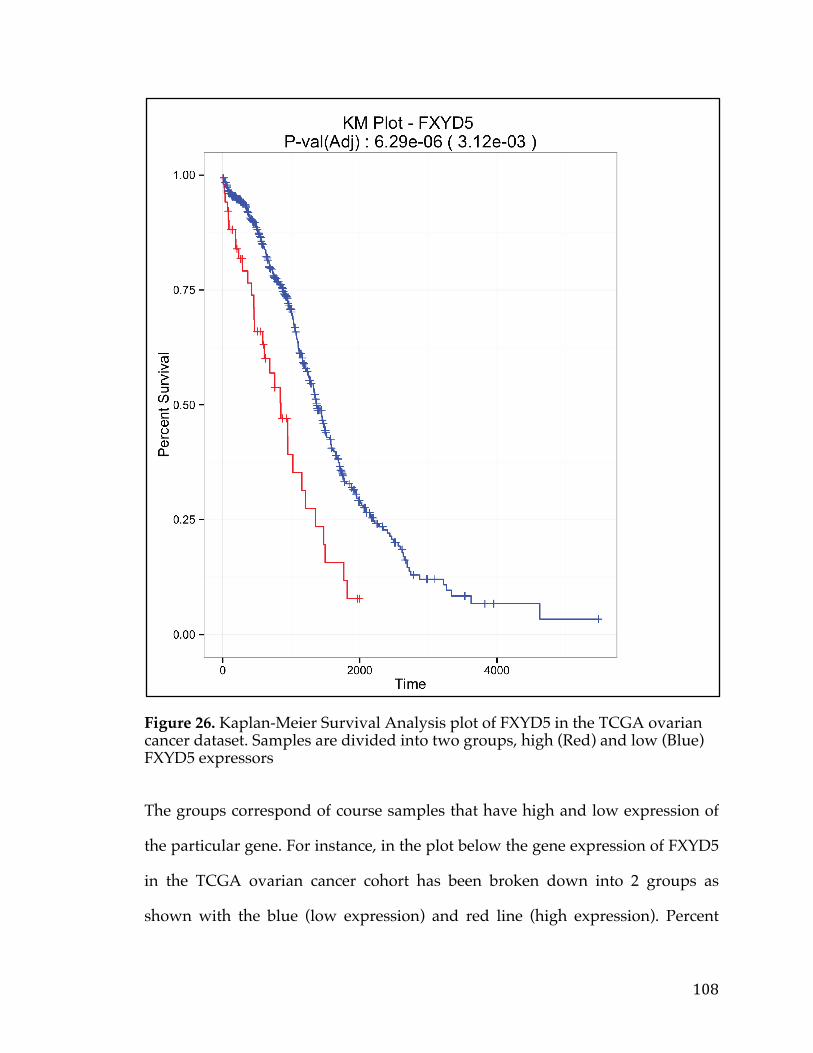
108
Figure 26. Kaplan-Meier Survival Analysis plot of FXYD5 in the TCGA ovarian cancer dataset. Samples are divided into two groups, high (Red) and low (Blue) FXYD5 expressors
The groups correspond of course samples that have high and low expression of
the particular gene. For instance, in the plot below the gene expression of FXYD5
in the TCGA ovarian cancer cohort has been broken down into 2 groups as
shown with the blue (low expression) and red line (high expression). Percent
109
survival is plotted on the y-axis and time on the y-axis. It is readily apparent that
people with high expression have worse outcome. The median survival seems to
be at least 100 days less in the “high” FXYD5 group [193]. Survival analysis may
need to be adjusted for various factors such as age, sex, stage of cancer etc… to
more robustly isolate markers. Overall examining cancer relevance in a data-
driven manner such as survival and based on literature evidence plays a big part
in the selection process [194].
One of the more important considerations in prioritizing genes is whether or not
the gene can be targeted by current therapeutic modalities. For instance, if the
gene is known to have a drug inhibitor (or agonist as the case may be) then this is
obviously one of the best-case scenarios as an entire drug development campaign
need not be launched. Alternatively, the gene may be in a class of known
druggable gene families such as GPCRs [195, 196, 197].
Alternatively, a gene could contain a druggable domain. Protein domains are
essentially stretches of the gene that are known to perform a specific function and
conserved across various species and families of proteins. In the absence of a
druggable domain, a gene expressed on the surface of the membrane can be
targeted via therapeutics such as functional monoclonal antibodies, ADC, or
CART [198]. Each of these therapeutic modalities have different strengths and
weaknesses. Monoclonal antibodies for instance require that the protein targeted
be functionally important to the cancer cell, and cannot cross the blood brain
barrier [199, 200, 201]. ADC will work on any target expressed on the plasma
membrane but can run the risk of failing if the chemistry between the toxic linker
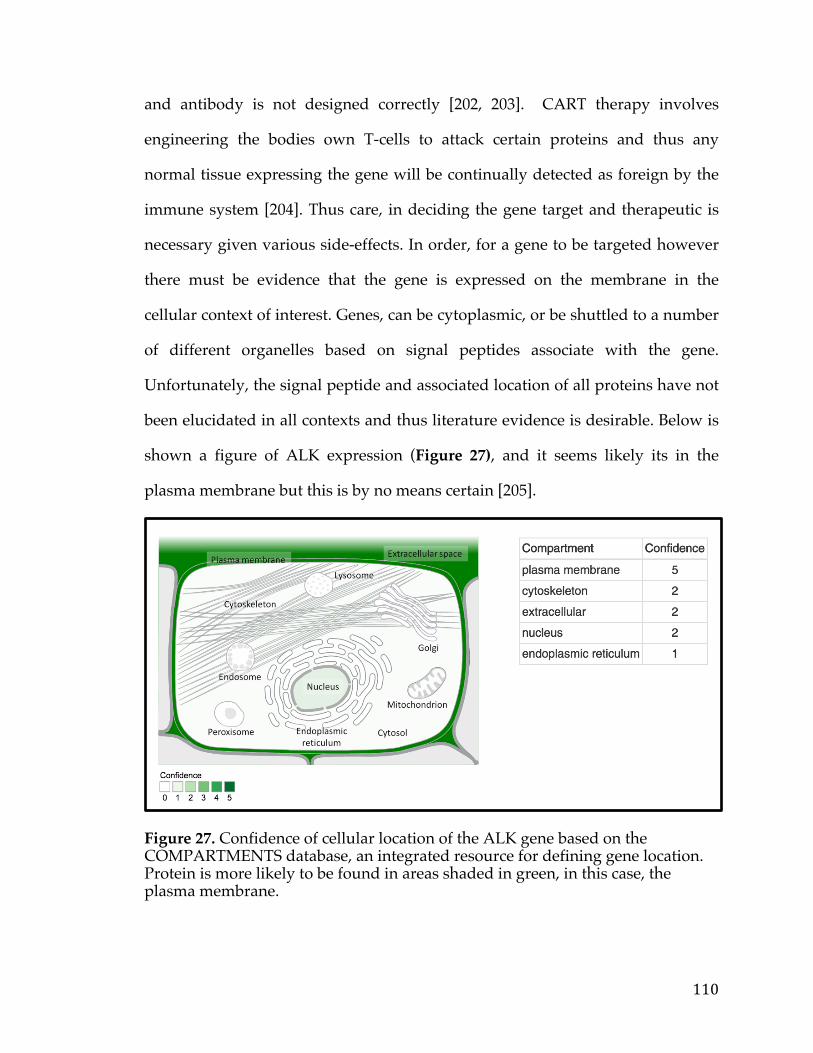
110
and antibody is not designed correctly [202, 203]. CART therapy involves
engineering the bodies own T-cells to attack certain proteins and thus any
normal tissue expressing the gene will be continually detected as foreign by the
immune system [204]. Thus care, in deciding the gene target and therapeutic is
necessary given various side-effects. In order, for a gene to be targeted however
there must be evidence that the gene is expressed on the membrane in the
cellular context of interest. Genes, can be cytoplasmic, or be shuttled to a number
of different organelles based on signal peptides associate with the gene.
Unfortunately, the signal peptide and associated location of all proteins have not
been elucidated in all contexts and thus literature evidence is desirable. Below is
shown a figure of ALK expression (Figure 27), and it seems likely its in the
plasma membrane but this is by no means certain [205].
Figure 27. Confidence of cellular location of the ALK gene based on the COMPARTMENTS database, an integrated resource for defining gene location. Protein is more likely to be found in areas shaded in green, in this case, the plasma membrane.
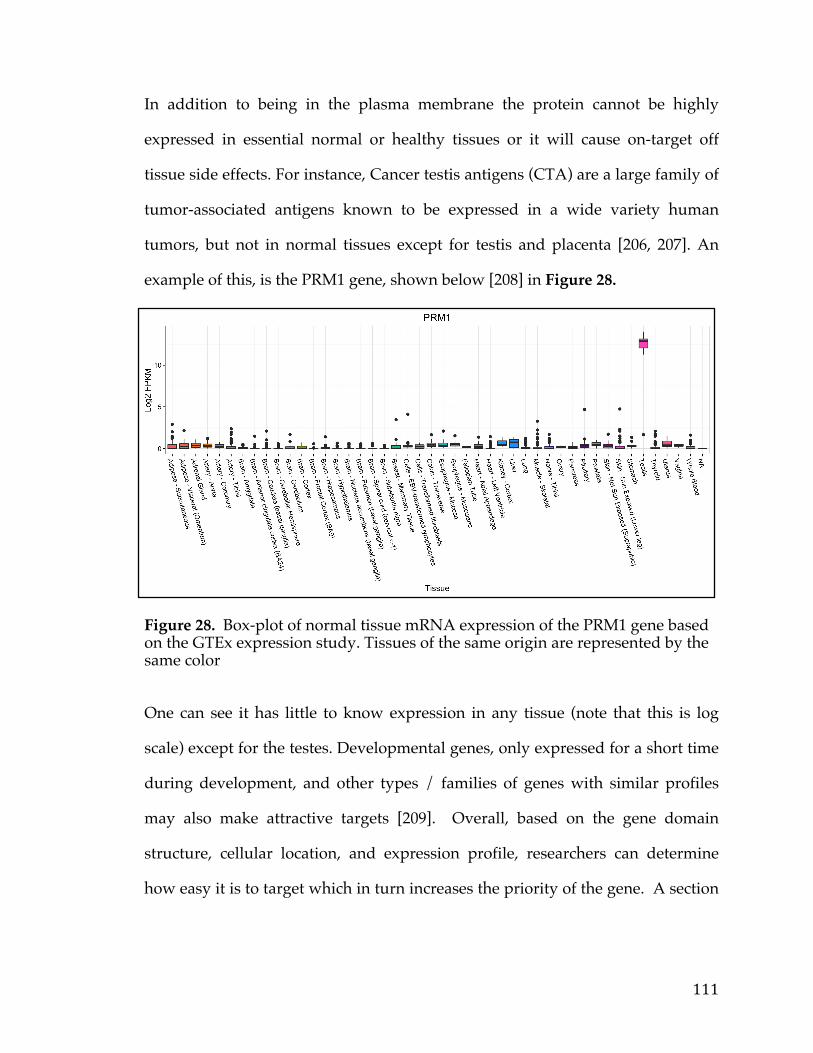
111
In addition to being in the plasma membrane the protein cannot be highly
expressed in essential normal or healthy tissues or it will cause on-target off
tissue side effects. For instance, Cancer testis antigens (CTA) are a large family of
tumor-associated antigens known to be expressed in a wide variety human
tumors, but not in normal tissues except for testis and placenta [206, 207]. An
example of this, is the PRM1 gene, shown below [208] in Figure 28.
Figure 28. Box-plot of normal tissue mRNA expression of the PRM1 gene based on the GTEx expression study. Tissues of the same origin are represented by the same color
One can see it has little to know expression in any tissue (note that this is log
scale) except for the testes. Developmental genes, only expressed for a short time
during development, and other types / families of genes with similar profiles
may also make attractive targets [209]. Overall, based on the gene domain
structure, cellular location, and expression profile, researchers can determine
how easy it is to target which in turn increases the priority of the gene. A section
112
on the various sources used in the PITFIT application to prioritize based on
molecular function, cancer relevance, and targetability follow.
5.2.3 Model Selection
After determining a set of potential candidate targets to choose from the typical
workflow is to identify model systems in which to test the hypotheses. There are
generally two sorts of hypotheses cancer translational investigators may want to
test. One is if or if not a specific target is expressed on the cell membrane which
can be accomplished via a variety of experimental techniques including but not
limited to western blots, Flow Cytometry, Immunohistochemistry (IHC), or
Immunofluorescence [242]. The other is whether or not the gene itself has
oncogenic properties and is required for survival, proliferation, or metastasis by
the tumor. Model systems to test hypothesis range from drosophila melanogaster
to higher order mammalian species. Typically however, cancer researchers will
begin by working on immortalized cancer cell lines.
While normal cells are unable to replicate past several rounds of proliferation
(termed the Hayflick limit) as with each round of proliferation the telomeres
shorten leading to DNA damage and eventually to cellular senescence, many
cancer cells can overcome this [243]. One of the first cases of this were cells
derived from cervical cancer tumor taken from Henrietta Lacks, a patient who
died of her cancer in 1951 [244, 245]. These cells continues to exist and grow and
many laboratories around the world. Generally, cancer cell lines stem from
primary tumors and metastatic tumors although some cell lines stem originate
113
from other cell lines. They will typically retain the properties of the tumor from
which they originate, meaning they contain the same basic genetic lesions
(mutations, copy number amplifications, etc..). It is known however that through
time additional mutations and epigenetic changes may occur to allow the cell
line to survive better in plastic. None-the-less these are an excellent source of
cancer models because they are nearly inexhaustible and are from human
malignancies (as opposed to using model organisms where the genetics maybe
slightly different). As such large cell line profiling campaigns have been
launched to fully characterize and profile these models. One of the biggest of
such projects is known as the Cancer Cell Line Encyclopedia.
The Cancer Cell Line Encyclopedia (CCLE) was initiative started at the Broad
Institute and Novartis to fully characterize over 947 human cancer cell lines.
These cell lines encompass 36 tumor types with every cell line being
characterized by several genomic technology platforms [246]. The mutational
status of over 1,600 genes was determined by targeted massively parallel
sequencing. Additionally copy number was measured using high-density single
nucleotide polymorphism arrays and mRNA expression levels were obtained for
each of the lines using Affymetrix U133 plus 2.0 arrays. A breakdown of the
various lineages and cancer types profiled in the experiment is shown in Figure
29. This represents one of the largest profiling experiments to date and the
publication which was in press in 2012, has been cited over 1,208 times.
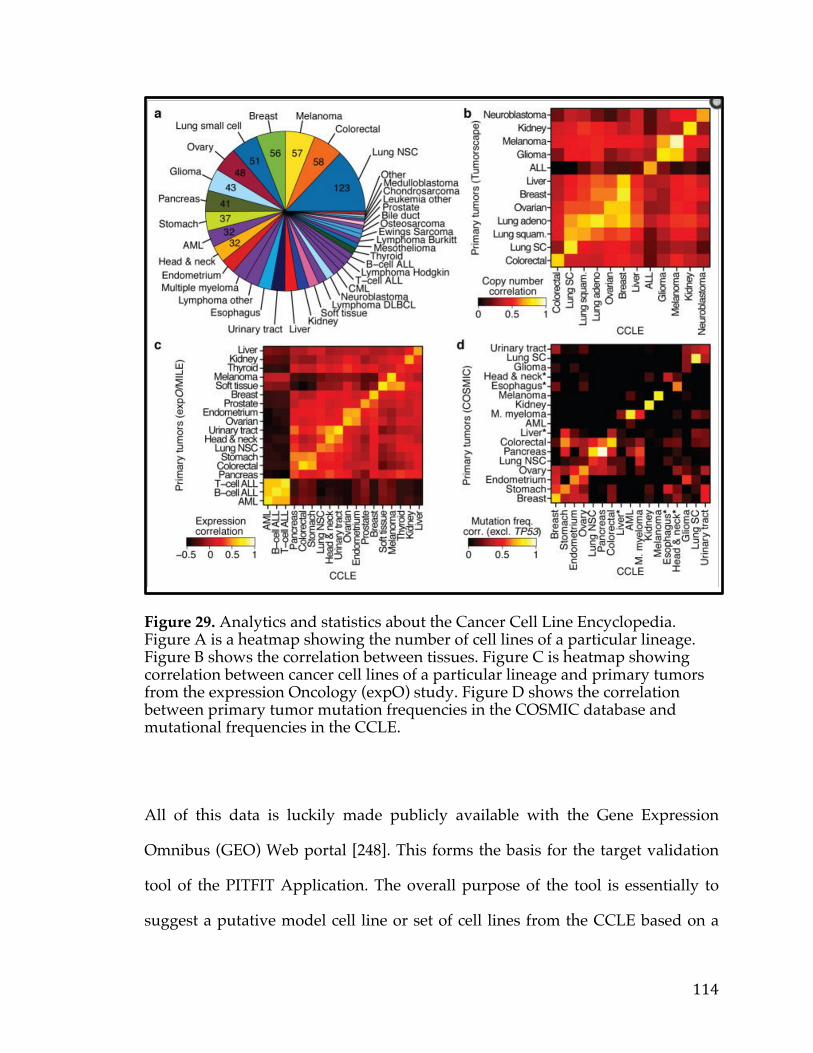
114
Figure 29. Analytics and statistics about the Cancer Cell Line Encyclopedia. Figure A is a heatmap showing the number of cell lines of a particular lineage. Figure B shows the correlation between tissues. Figure C is heatmap showing correlation between cancer cell lines of a particular lineage and primary tumors from the expression Oncology (expO) study. Figure D shows the correlation between primary tumor mutation frequencies in the COSMIC database and mutational frequencies in the CCLE.
All of this data is luckily made publicly available with the Gene Expression
Omnibus (GEO) Web portal [248]. This forms the basis for the target validation
tool of the PITFIT Application. The overall purpose of the tool is essentially to
suggest a putative model cell line or set of cell lines from the CCLE based on a
115
gene or set of genes that the user enters. Selection of cell lines will be based on
getting the most appropriate model for the particular cancer. However, when
multiple genes and features are chosen more sophisticated methods are
employed to ensure that the minimum number of lines can be used to accurately
model each lesion with an appropriate set of negative controls. As with the other
PITFIT tools this tool can be used in conjunction with or separately from the rest
of the PITFIT tools. A brief section on the actual methods employed by the tools
follows.
5.3 Methods
5.3.1 Target Identification
5.3.1.1 Data Acquisition
There are currently numerous ways to get TCGA data now, such as the TCGA
Data Portal, the Broad GDAC Firehose utility, TCGA-Assembler, and various R
packages (‘CGDSR’, ‘TCGAbiolinks’) [144, 145, 146]. Many of these work very
well in particular cases. For instance, the ‘cgdsr’ package is great at getting a slice
of data, i.e. the MYC Gene expression profile across an ovarian cancer. However,
this package will not allow the user to easily download all genes (though this
could be done with a loop, it is extremely time-consuming, and not the intended
use of the utility. The Broad GDAC Firehose utility does allow for the download
of entire data sets but parsing some of the file structures can be time-consuming.
Furthermore, not all files are formatted in a way that is amenable to gene level
analysis. For instance TCGA copy number data from Broad GDAC is served out
116
in bed files that list genomic coordinates with a given copy number [144].
Therefore, in this case, one would have to physically map all genes to these
coordinates in order to properly use the data for gene level analysis. Therefore,
even though there are many tools to retrieve the data, not all are suitable for easy
parsing and import into the PITFIT application.
Fortuitously, the cBioPortal from MSKCC has a flat file zipped data dump of
many of the TCGA cancers. This dump actually represents the “staging files” or
“loading structure” to import data directly into their MySQL database. The file
and folder structure for each cancer is standardized which makes adding more
cancer to the PITFIT application extremely easy. Each platforms experimental file
contains all the genes in the experiment and is calculated on a gene basis, as
opposed to transcript or region. Each of these files also has an associated meta-
data file which details how the data was processed, what type of data it is etc…
for the cBioPortal application. In addition, there is an annotation file that
specifies the sample level information and associated clinical data and endpoints.
This file is also structured (columns are all the same data type and name) which
makes the application logic surrounding using this data much easier. The
cBioPortal is currently an open source solution as is the TCGA Level 3 data that
is formatted and transformed by the MSKCC team. As new cancer studies,
TCGA and non-TCGA, come into the public domain these will be added to this
“staging file” repository and can be easily uploaded to both cBioPortal as well as
the PITFIT application. Therefore, by using this as our standard we are implicitly
relying on the update of the cBioPortal and continued funding and progress of
the resource. The cBioPortal is currently the pre-eminent cancer portal with
117
thousands of users a day. In addition the developers of the cBioPortal, at
MSKCC, have partnered with a number of different institutions and have
funding from their parent institution and other federal sources. Hence, by
aligning the data acquisition / loading of PITFIT with the cBioPortal we can
ensure data will be up-to-date and added on a rolling basis. This also removes
some of burden of data processing and formatting that can cause a lot of
overhead in a software suite.
The actual zip file was collected from www.getcbioportal.com. Data was
unzipped, parsed, and loaded into a RData Object which is a binary
representation of the data that can be loaded much faster than it would take to
load the corresponding text files [147]. This is extremely important, as when a
researcher loads up the PITFIT application a delay in response due to I/O issues
can severely undermine the ease of use. The code for this process of converting
the file system housing the TCGA data (from MSKCC) to an RData object is
stored in a publicly accessible github repository
(https://github.com/PichaiRaman/PITFIT/blob/master/code/aim-1/aim-1-
worker.R) and is also in Appendix H. This represents all the data needed for this
aspect of PITFIT target Identification tool as it uses an experimental data driven
approach to generate testable hypotheses.

118
5.3.1.2 Correlation to a Genetic Lesion
In order to identify genes that are correlated to a query gene it is first important
to define the type of data that is being correlated. In general, for the PITFIT
application we are examining mutation data, copy number data, and expression
data. We are typically interested in identifying genes whose expression is
correlated with a query genes mutation status, or copy number status, or
expression status. Our focus on expression is because gene expression is most
correlated, as compared with mutation or copy number status, to protein
expression. Protein expression in turn is what is required to define targeted
therapies.
Therefore, there are actually three different correlative analyses that need to be
performed; gene expression level to mutation status, gene expression level to
copy number status, and gene expression level to gene expression level. In order
to carry out these correlations we are using the ‘limma’ package in R. The
‘limma’ package is a core component of Bioconductor, an open-source R project
in statistical genomics [148, 149]. It has been long used in the analysis of gene
expression data arising from microarray data and more recently has been used
for analysis of RNA-Seq experiments. It makes use of linear models to assess
differential expression when comparing multiple groups. Generally, It operates
on a matrix of expression values, where each row represents a gene, and each
column corresponds to a sample. It fits a linear model to each gene and takes
advantage of the flexibility of such models to handle complex experimental
designs and test very elastic hypotheses. More importantly, limma benefit from
119
the use of the highly parallel nature of genomic data to borrow strength between
the gene-wise models, allowing for different levels of variability between genes
and samples. This is done via a set of methods known as the parametric
empirical bayes methods [150]. The variance for each gene becomes a
compromise between the gene-wise estimator, obtained from the data for that
gene alone, and the global variability across all genes, estimated by pooling all of
the genes. This has the effect of increasing the effective degrees of freedom with
which the gene-wise variances are estimated. This in turn makes statistical
conclusions more reliable when the number of samples is small. The linear model
and statistical principles employed in a typical limma analysis are depicted
below. (shown in figure below).
For RNA-Seq, a data type known to have a negative binomial distribution in
general (owing the number of transcripts with 0 counts), data must first be
transformed as limma and linear models in general assume a Gaussian
distribution [151]. This transformation is done via the voom function [152]. This
function estimates the mean-variance relationship non-parametrically from the
log-transformed data. This trend is then incorporated into the data as a precision
weight for each normalized observation (Figure 30).
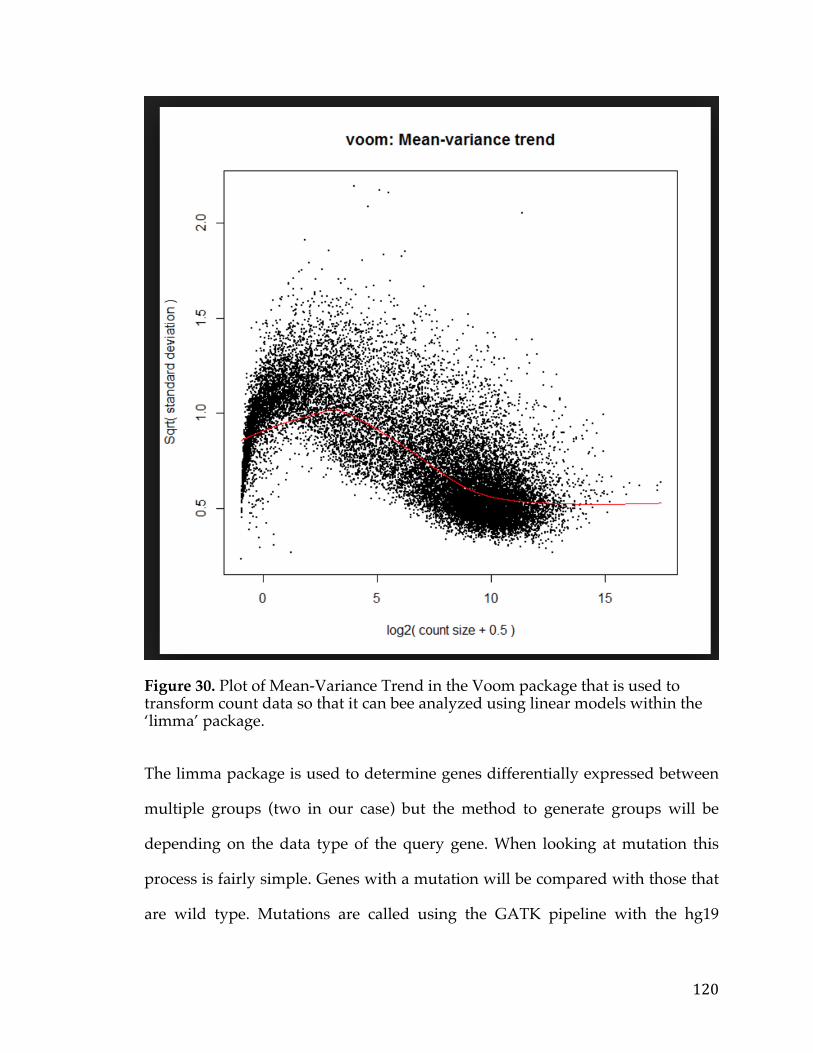
120
Figure 30. Plot of Mean-Variance Trend in the Voom package that is used to transform count data so that it can bee analyzed using linear models within the ‘limma’ package.
The limma package is used to determine genes differentially expressed between
multiple groups (two in our case) but the method to generate groups will be
depending on the data type of the query gene. When looking at mutation this
process is fairly simple. Genes with a mutation will be compared with those that
are wild type. Mutations are called using the GATK pipeline with the hg19
121
reference genome [153]. In the case of copy number, those genes with a Copy
Number value of greater than 4 are considered amplified while those with less
are considered non-amplified. In the case of expression, data is split based by
quartiles into a “high” group and “low” group, with the “high” group being the
1st quartile and the low being the 4th. Once groups are defined for the data types
the voom/limma workflow is performed [152]. In effect, the group selection
process is abstracted from the differential expression piece. Hence, as we gain
new insights into biology and new computational frameworks for differential
feature selection evolve, these components can be easily replaced. Overall, this
represents the current workflow for candidate target identification.
5.3.1.3 Visualizations and User Interface Specifications
The input to the PITFIT target identification tool is a gene name and data type for
a particular cancer. All the potential candidate targets are computed via this
pipeline. The results of the analysis are then presented in both a table and a
graphical format. The two visualizations, the heatmap and volcano plot view,
which are included in the PITFIT target identification tool assist the researcher in
looking at the landscape of identified targets. This will give the investigator a
sense of targets that are related to one another, and provide more detail into how
correlated the candidate target is to the query gene, compared to the other
candidates. This is in contrast to an ordinal ranking system that cannot capture
magnitude.
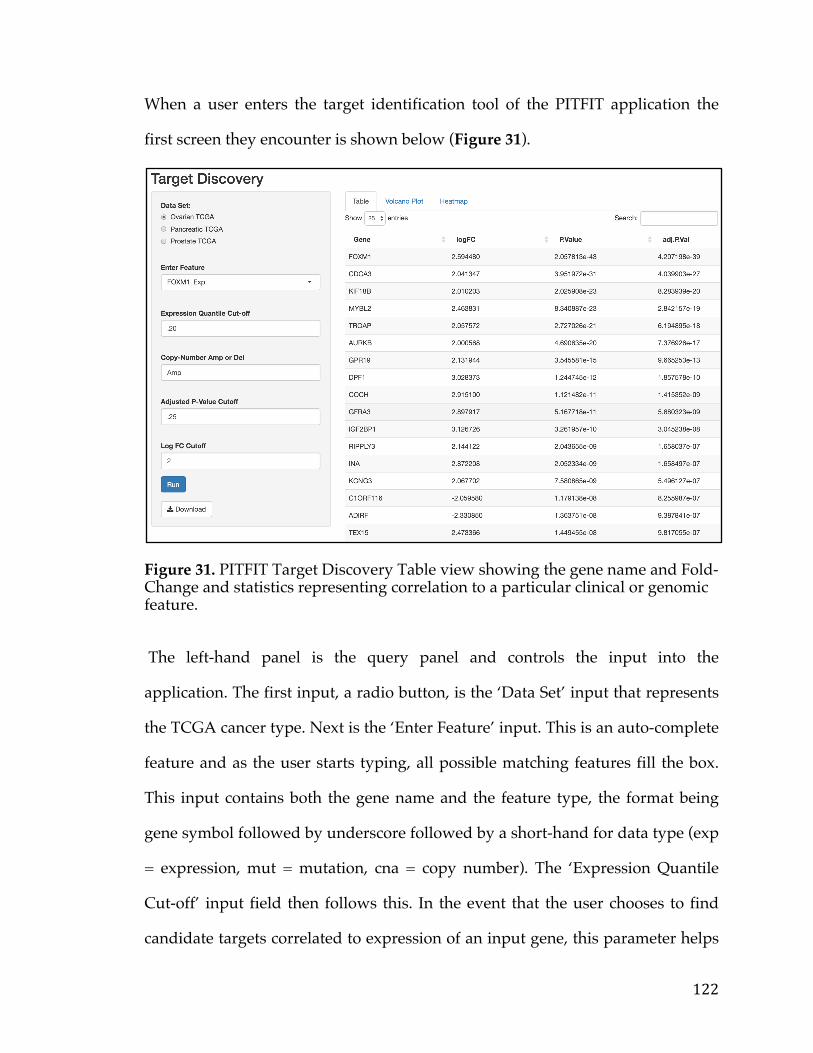
122
When a user enters the target identification tool of the PITFIT application the
first screen they encounter is shown below (Figure 31).
Figure 31. PITFIT Target Discovery Table view showing the gene name and Fold-Change and statistics representing correlation to a particular clinical or genomic feature.
The left-hand panel is the query panel and controls the input into the
application. The first input, a radio button, is the ‘Data Set’ input that represents
the TCGA cancer type. Next is the ‘Enter Feature’ input. This is an auto-complete
feature and as the user starts typing, all possible matching features fill the box.
This input contains both the gene name and the feature type, the format being
gene symbol followed by underscore followed by a short-hand for data type (exp
= expression, mut = mutation, cna = copy number). The ‘Expression Quantile
Cut-off’ input field then follows this. In the event that the user chooses to find
candidate targets correlated to expression of an input gene, this parameter helps
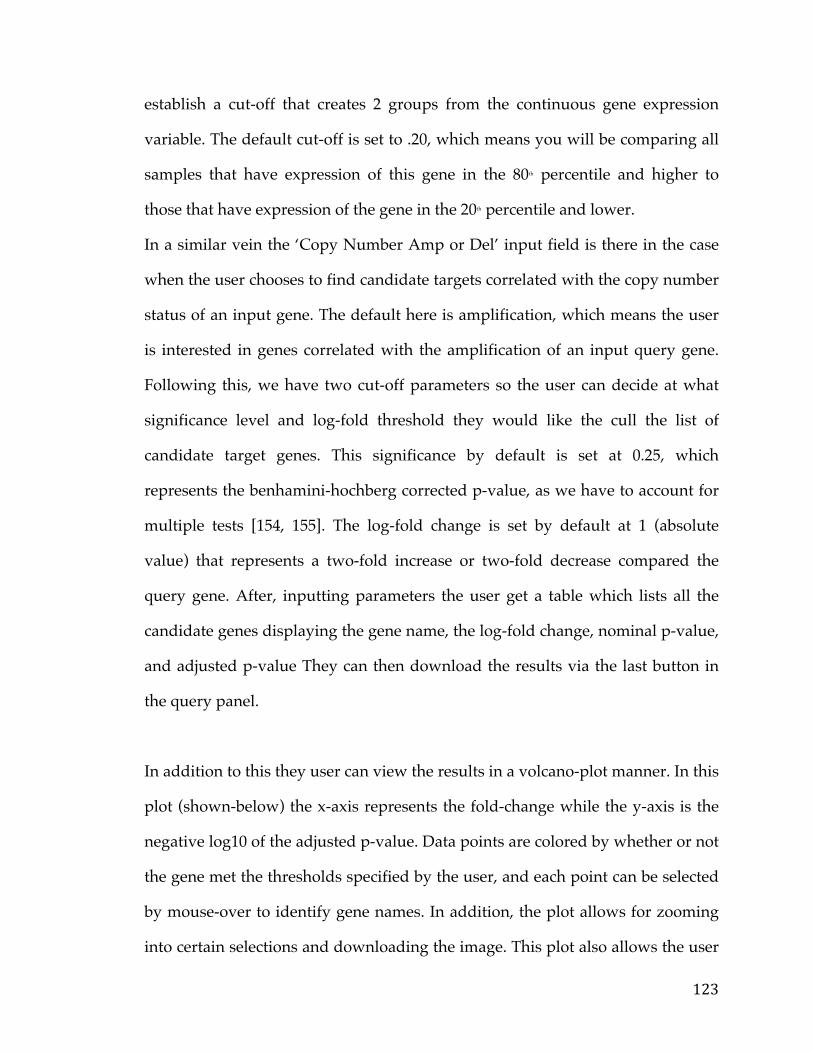
123
establish a cut-off that creates 2 groups from the continuous gene expression
variable. The default cut-off is set to .20, which means you will be comparing all
samples that have expression of this gene in the 80th percentile and higher to
those that have expression of the gene in the 20th percentile and lower.
In a similar vein the ‘Copy Number Amp or Del’ input field is there in the case
when the user chooses to find candidate targets correlated with the copy number
status of an input gene. The default here is amplification, which means the user
is interested in genes correlated with the amplification of an input query gene.
Following this, we have two cut-off parameters so the user can decide at what
significance level and log-fold threshold they would like the cull the list of
candidate target genes. This significance by default is set at 0.25, which
represents the benhamini-hochberg corrected p-value, as we have to account for
multiple tests [154, 155]. The log-fold change is set by default at 1 (absolute
value) that represents a two-fold increase or two-fold decrease compared the
query gene. After, inputting parameters the user get a table which lists all the
candidate genes displaying the gene name, the log-fold change, nominal p-value,
and adjusted p-value They can then download the results via the last button in
the query panel.
In addition to this they user can view the results in a volcano-plot manner. In this
plot (shown-below) the x-axis represents the fold-change while the y-axis is the
negative log10 of the adjusted p-value. Data points are colored by whether or not
the gene met the thresholds specified by the user, and each point can be selected
by mouse-over to identify gene names. In addition, the plot allows for zooming
into certain selections and downloading the image. This plot also allows the user
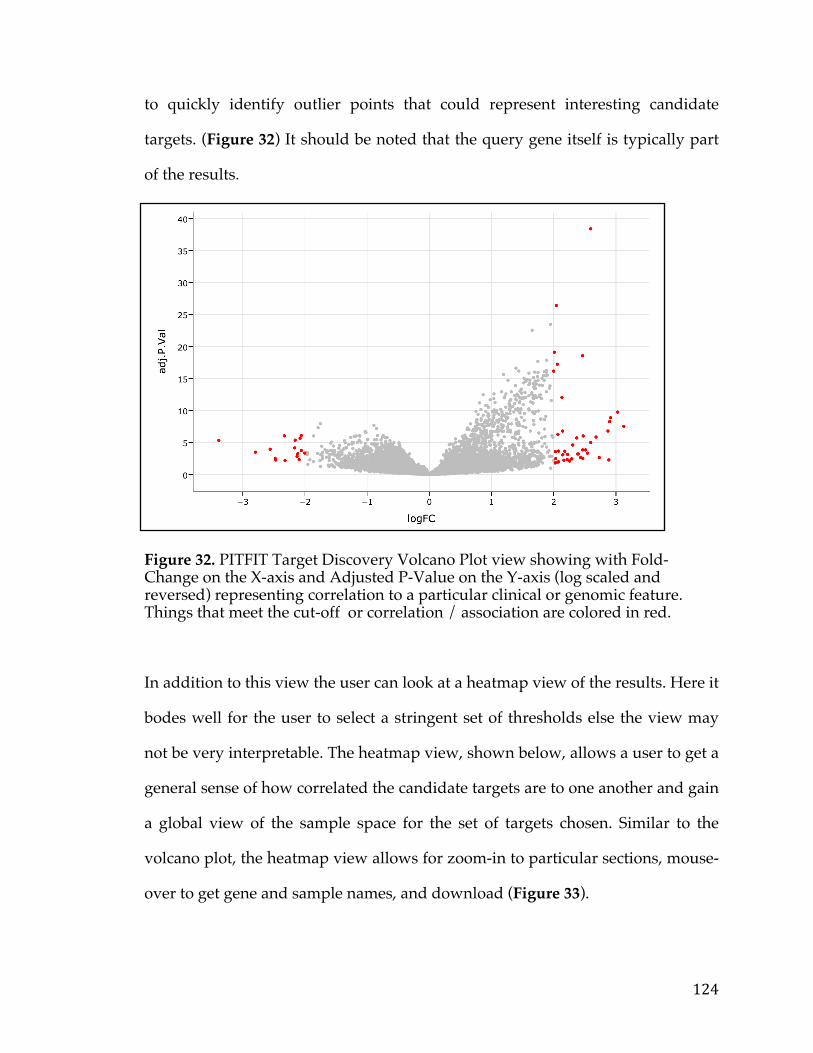
124
to quickly identify outlier points that could represent interesting candidate
targets. (Figure 32) It should be noted that the query gene itself is typically part
of the results.
Figure 32. PITFIT Target Discovery Volcano Plot view showing with Fold-Change on the X-axis and Adjusted P-Value on the Y-axis (log scaled and reversed) representing correlation to a particular clinical or genomic feature. Things that meet the cut-off or correlation / association are colored in red.
In addition to this view the user can look at a heatmap view of the results. Here it
bodes well for the user to select a stringent set of thresholds else the view may
not be very interpretable. The heatmap view, shown below, allows a user to get a
general sense of how correlated the candidate targets are to one another and gain
a global view of the sample space for the set of targets chosen. Similar to the
volcano plot, the heatmap view allows for zoom-in to particular sections, mouse-
over to get gene and sample names, and download (Figure 33).
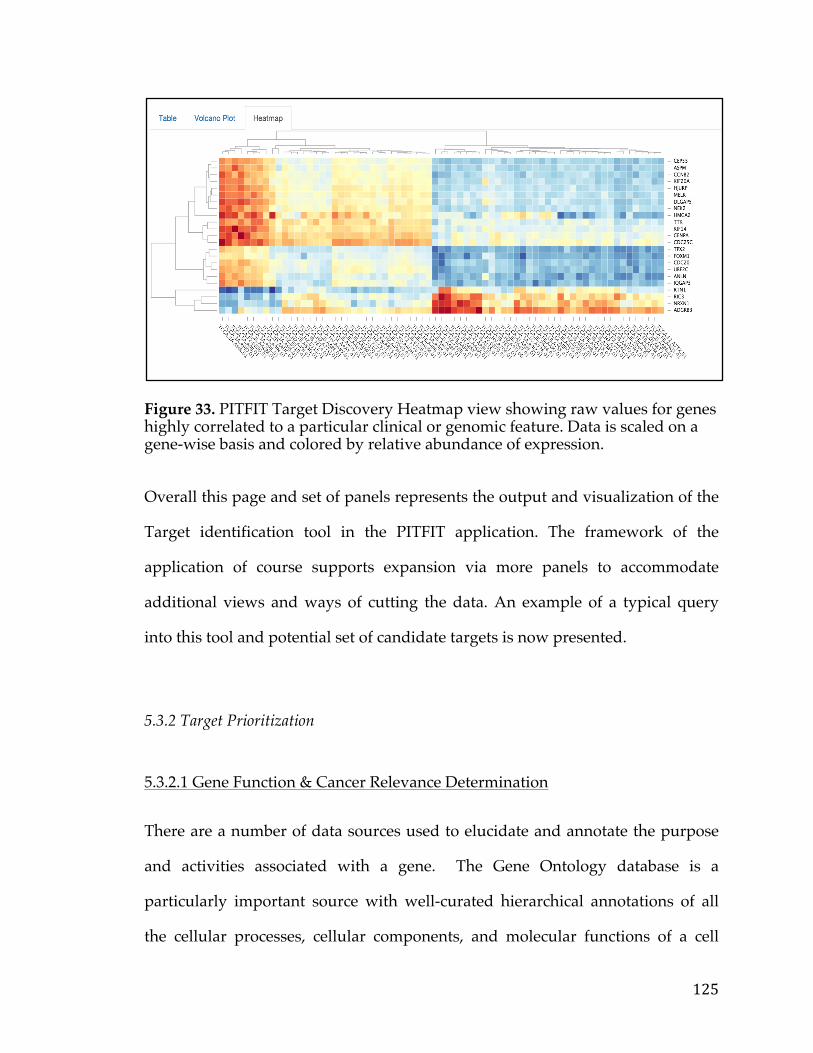
125
Figure 33. PITFIT Target Discovery Heatmap view showing raw values for genes highly correlated to a particular clinical or genomic feature. Data is scaled on a gene-wise basis and colored by relative abundance of expression.
Overall this page and set of panels represents the output and visualization of the
Target identification tool in the PITFIT application. The framework of the
application of course supports expansion via more panels to accommodate
additional views and ways of cutting the data. An example of a typical query
into this tool and potential set of candidate targets is now presented.
5.3.2 Target Prioritization
5.3.2.1 Gene Function & Cancer Relevance Determination
There are a number of data sources used to elucidate and annotate the purpose
and activities associated with a gene. The Gene Ontology database is a
particularly important source with well-curated hierarchical annotations of all
the cellular processes, cellular components, and molecular functions of a cell
126
[210, 211]. Molecular function deals with the activities at the molecular level
rather than discussing the entities that are responsible for the actions, or where
and when the activity occurs. Biological processes, on the other hand, describe
the biological goals that are accomplished by one or more molecular functions.
Finally, cellular component refers to the subcellular locations of proteins and
macromolecular complexes.
Each gene is associated or tagged with a set of these molecular functions, cell
compartments, and processes. This helps define the context and main functions
of the gene. In addition to GO, the Kyoto Encyclopedia of Genes and Genomes
(KEGG) is another highly accessed database that aims to combine genomic
information with higher order functional information by integrating the available
literature on cellular processes [212]. KEGG connects sets of genes within a
network of interacting molecules to create complexes and pathways in which
these genes function. These pathways cover a range of biological activities such
as metabolic processes, diseases networks, genetic and environmental
information processing, and signaling pathways. KEGG also provides
information about enzymatic reaction, compound binding and response, and
other biological reactions. In addition to KEGG there are number of smaller
databases that house genes of a particular family such as Kinbase which contains
all known kinases and associated annotation [213].
All of these sources provide hints of cancer relevance. For instance processes that
deal with angiogenesis, cell proliferation, evasion of the immune system could be
called cancer-related processes because these are pathways cancer cells typically
127
adopt to survive and grow. There are data sources however, that directly
implicate genes as being involved in cancer. The mSigDB for instance, is a large
resource from the Broad Institute that annotates genes from various sources such
as biocarta, GO, reactome and others [214]. This resource is broken down by
collections, which are typically gene sets of a particular type such as transcription
factors. One such collection, the “Cancer Pathways” collection, contains a
significant amount of cancer related genes. Yet another source is the COSMIC
database from the Sanger institute. It is currently the most famous and widely
used sources of cancer genes and mutations and often plays a role in clinical
decision-making [215, 216]. As literature is published implicating certain genes
and mutations that are drivers in a particular cancer these are added to the
COSMIC database via trained curation experts that are well versed in biology
and cancer. Finally, the TCGA itself contains a wealth of information related to
genes that are chronically mutated, amplified, or over-expressed in cancers. One
can quickly calculate TCGA summary statistics over genes and cancers using
tools such as the cBioPortal from Memoial Sloan Kettering. For Instance for the
PIK3CA gene a view of all alterations in various cancers and studies in the
cBioPortal that contains the TCGA is shown below (Figure 34).
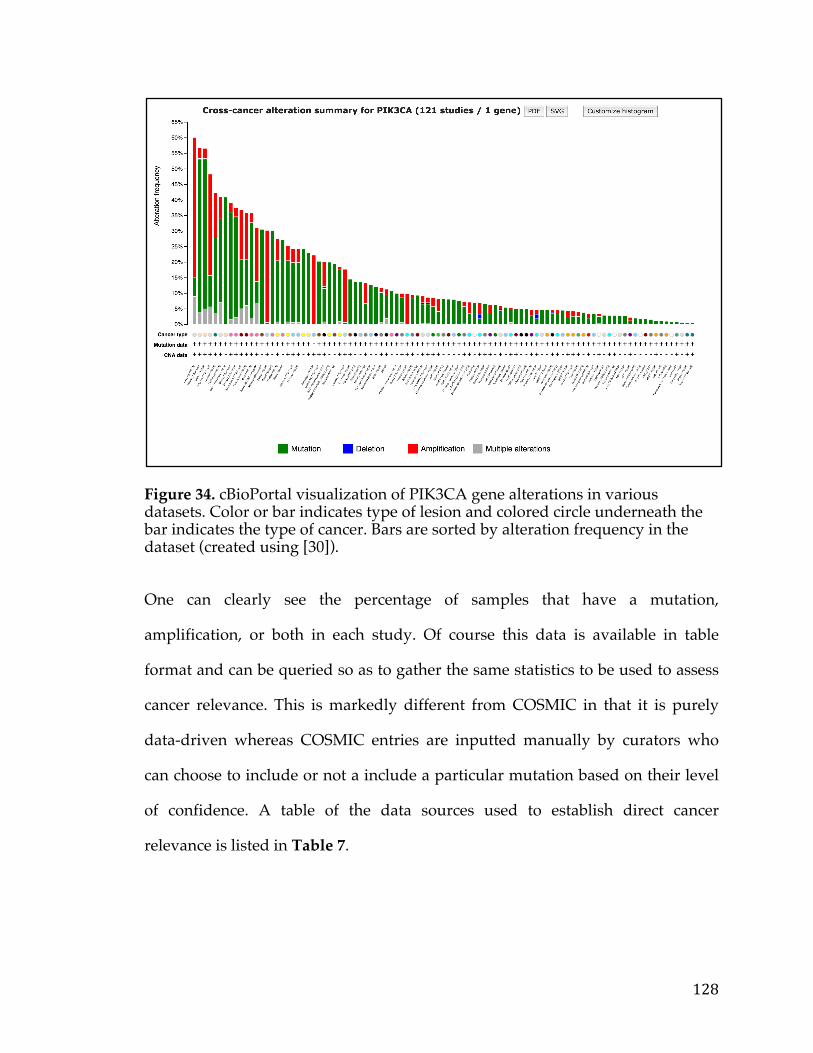
128
Figure 34. cBioPortal visualization of PIK3CA gene alterations in various datasets. Color or bar indicates type of lesion and colored circle underneath the bar indicates the type of cancer. Bars are sorted by alteration frequency in the dataset (created using [30]).
One can clearly see the percentage of samples that have a mutation,
amplification, or both in each study. Of course this data is available in table
format and can be queried so as to gather the same statistics to be used to assess
cancer relevance. This is markedly different from COSMIC in that it is purely
data-driven whereas COSMIC entries are inputted manually by curators who
can choose to include or not a include a particular mutation based on their level
of confidence. A table of the data sources used to establish direct cancer
relevance is listed in Table 7.
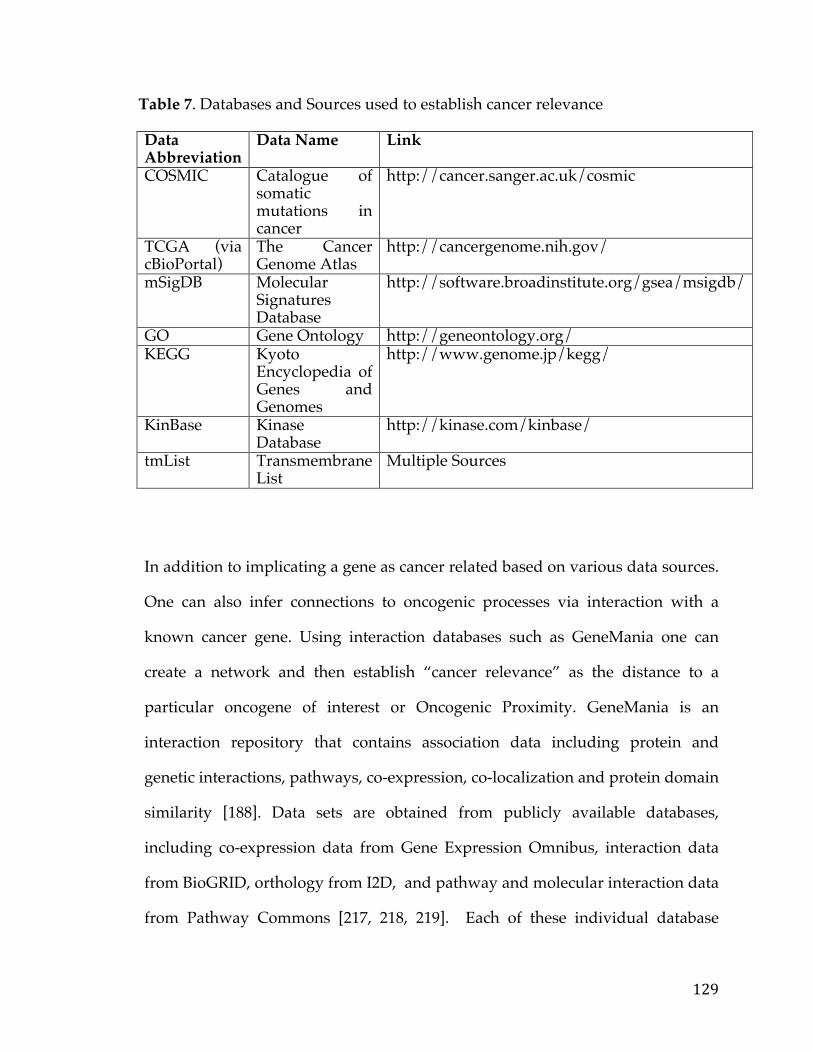
129
Table 7. Databases and Sources used to establish cancer relevance Data Abbreviation
Data Name Link
COSMIC Catalogue of somatic mutations in cancer
http://cancer.sanger.ac.uk/cosmic
TCGA (via cBioPortal)
The Cancer Genome Atlas
http://cancergenome.nih.gov/
mSigDB Molecular Signatures Database
http://software.broadinstitute.org/gsea/msigdb/
GO Gene Ontology http://geneontology.org/ KEGG Kyoto
Encyclopedia of Genes and Genomes
http://www.genome.jp/kegg/
KinBase Kinase Database
http://kinase.com/kinbase/
tmList Transmembrane List
Multiple Sources
In addition to implicating a gene as cancer related based on various data sources.
One can also infer connections to oncogenic processes via interaction with a
known cancer gene. Using interaction databases such as GeneMania one can
create a network and then establish “cancer relevance” as the distance to a
particular oncogene of interest or Oncogenic Proximity. GeneMania is an
interaction repository that contains association data including protein and
genetic interactions, pathways, co-expression, co-localization and protein domain
similarity [188]. Data sets are obtained from publicly available databases,
including co-expression data from Gene Expression Omnibus, interaction data
from BioGRID, orthology from I2D, and pathway and molecular interaction data
from Pathway Commons [217, 218, 219]. Each of these individual database
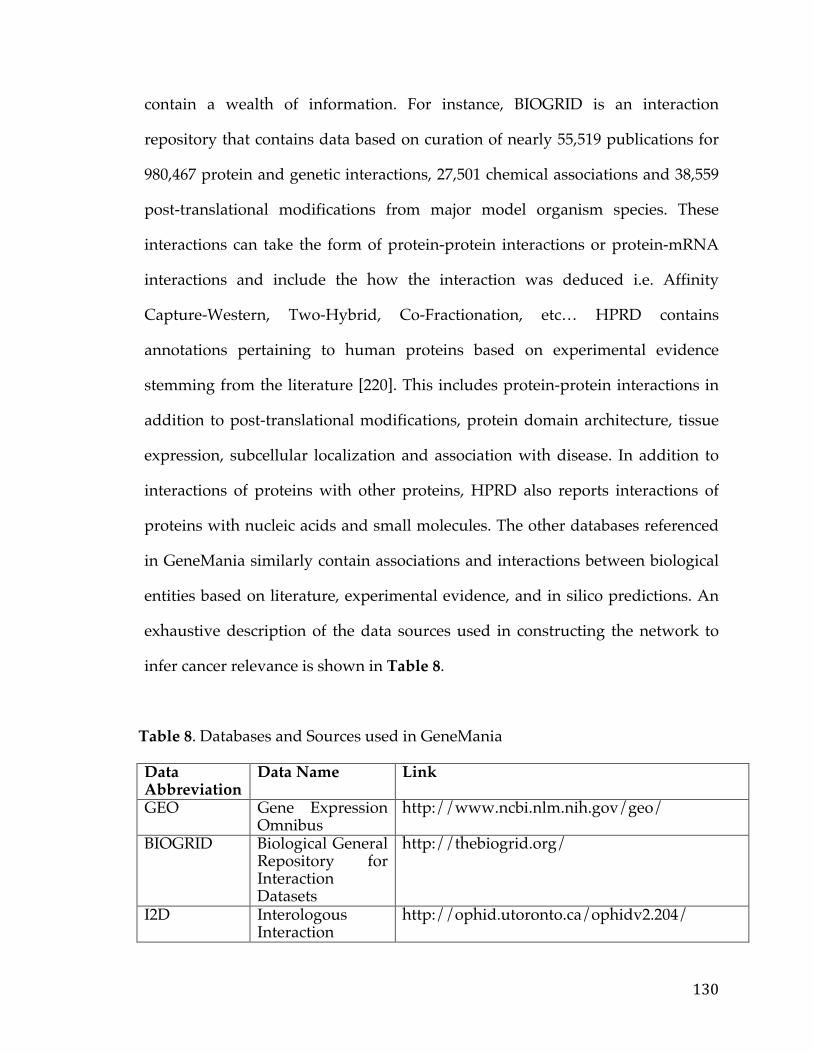
130
contain a wealth of information. For instance, BIOGRID is an interaction
repository that contains data based on curation of nearly 55,519 publications for
980,467 protein and genetic interactions, 27,501 chemical associations and 38,559
post-translational modifications from major model organism species. These
interactions can take the form of protein-protein interactions or protein-mRNA
interactions and include the how the interaction was deduced i.e. Affinity
Capture-Western, Two-Hybrid, Co-Fractionation, etc… HPRD contains
annotations pertaining to human proteins based on experimental evidence
stemming from the literature [220]. This includes protein-protein interactions in
addition to post-translational modifications, protein domain architecture, tissue
expression, subcellular localization and association with disease. In addition to
interactions of proteins with other proteins, HPRD also reports interactions of
proteins with nucleic acids and small molecules. The other databases referenced
in GeneMania similarly contain associations and interactions between biological
entities based on literature, experimental evidence, and in silico predictions. An
exhaustive description of the data sources used in constructing the network to
infer cancer relevance is shown in Table 8.
Table 8. Databases and Sources used in GeneMania Data Abbreviation
Data Name Link
GEO Gene Expression Omnibus
http://www.ncbi.nlm.nih.gov/geo/
BIOGRID Biological General Repository for Interaction Datasets
http://thebiogrid.org/
I2D Interologous Interaction
http://ophid.utoronto.ca/ophidv2.204/
131
Database Pathway Commons
Pathway Commons
http://www.pathwaycommons.org/about/
Reactome Reactome Pathway Database
http://www.reactome.org/
IntAct IntAct Molecular Interaction Database
http://www.ebi.ac.uk/intact/
HPRD Human Protein Reference Database
http://www.hprd.org/
MINT Molecular Interaction Databse
http://mint.bio.uniroma2.it/mint/Welcome.do
NCI-Pathways
National Cancer Institute Pathways
https://github.com/NCIP/pathway-interaction-database/tree/master/download
The network itself is constructed from these data sources using NEO4J graph
database and the R/NEO4J connector [221, 222]. From here nodes corresponding
to known oncogenes are labeled. This list of 571 genes comes from COSMIC, and
is thus a subset. It represents only those genes that are very well established as
oncogenic “The underlying rationale for interpreting a mutated gene as causal in
cancer development is that the number and pattern of mutations in the gene are
highly unlikely to be attributable to chance. So, in the absence of alternative
plausible explanations, the mutations are likely to have been selected because
they confer a growth advantage on the cell population from which the cancer has
developed. [223].” In this list approximately 90% of the entries have somatic
mutations in cancer, 20% bear germline mutations that predispose to cancer, and
10% show both somatic and germline mutations. For each input gene than the
shortest path is identified to this set of oncogenes. The shortest-path is the
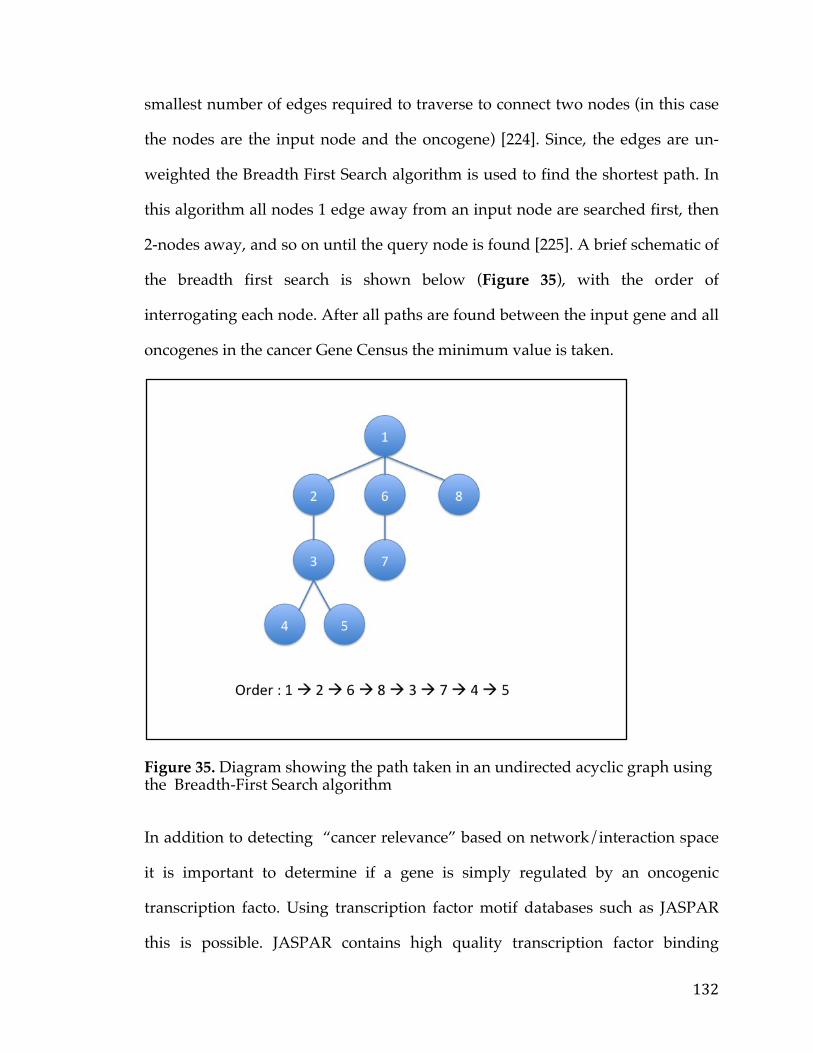
132
smallest number of edges required to traverse to connect two nodes (in this case
the nodes are the input node and the oncogene) [224]. Since, the edges are un-
weighted the Breadth First Search algorithm is used to find the shortest path. In
this algorithm all nodes 1 edge away from an input node are searched first, then
2-nodes away, and so on until the query node is found [225]. A brief schematic of
the breadth first search is shown below (Figure 35), with the order of
interrogating each node. After all paths are found between the input gene and all
oncogenes in the cancer Gene Census the minimum value is taken.
Figure 35. Diagram showing the path taken in an undirected acyclic graph using the Breadth-First Search algorithm
In addition to detecting “cancer relevance” based on network/interaction space
it is important to determine if a gene is simply regulated by an oncogenic
transcription facto. Using transcription factor motif databases such as JASPAR
this is possible. JASPAR contains high quality transcription factor binding
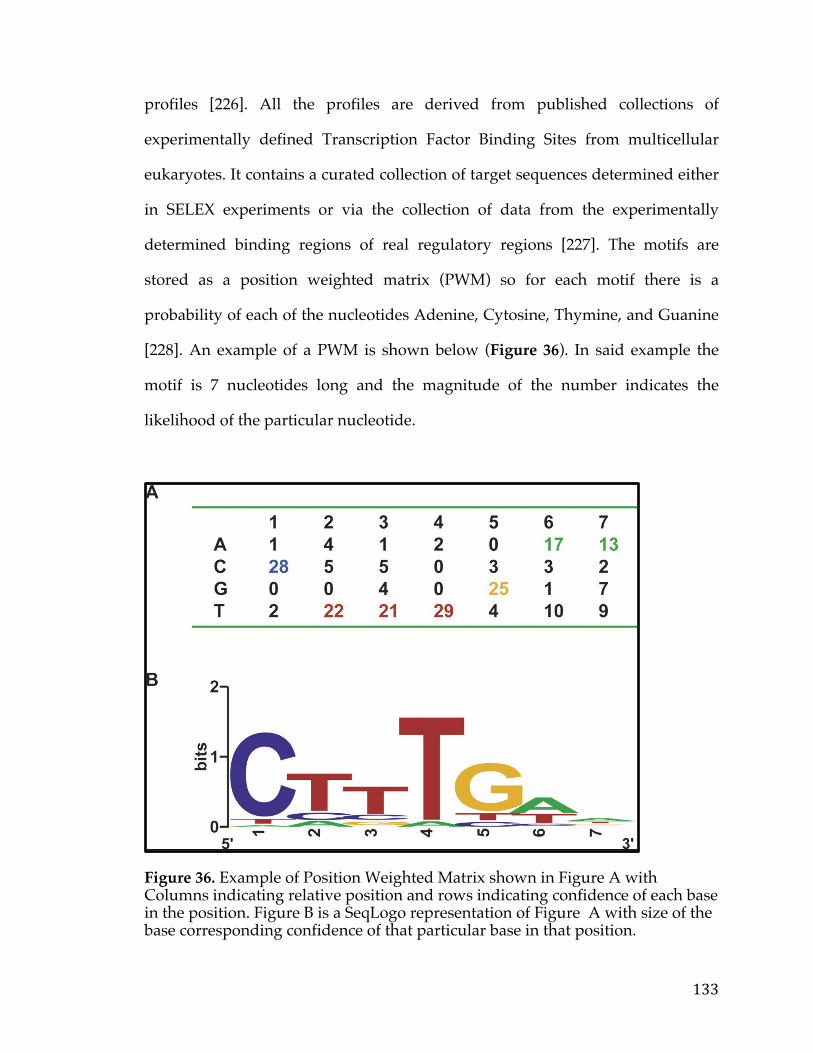
133
profiles [226]. All the profiles are derived from published collections of
experimentally defined Transcription Factor Binding Sites from multicellular
eukaryotes. It contains a curated collection of target sequences determined either
in SELEX experiments or via the collection of data from the experimentally
determined binding regions of real regulatory regions [227]. The motifs are
stored as a position weighted matrix (PWM) so for each motif there is a
probability of each of the nucleotides Adenine, Cytosine, Thymine, and Guanine
[228]. An example of a PWM is shown below (Figure 36). In said example the
motif is 7 nucleotides long and the magnitude of the number indicates the
likelihood of the particular nucleotide.
Figure 36. Example of Position Weighted Matrix shown in Figure A with Columns indicating relative position and rows indicating confidence of each base in the position. Figure B is a SeqLogo representation of Figure A with size of the base corresponding confidence of that particular base in that position.
134
Using this database of PWM’s we can scan the promoter region of a gene,
typically 2000 Base Pairs upstream of the transcriptional start site [229]. This is
performed using the ‘Biostrings’ package which uses a multinomial model with a
Dirichlet conjugate prior to calculate the estimated probability of a particular
base b at position I [230]. This can estimate if or if not the motif is in the stretch of
desired DNA at a certain confidence level, inputted by the user. Overall, using
this we are able to quickly ascertain whether or not a gene is regulated by an
oncogene.
Finally, in a completely data-driven manner we can establish cancer relevance
based on whether or not the gene influences survival. To perform this a cox-
regression was performed on each gene for a particular cancer to determine if the
gene intrinsically had an association with better or worse survival [231]. This is a
common survival method that does not require dichotomizing a variable a priori
is Cox regression. This model is one of the most commonly used statistical
methods for survival analysis. This model provides an estimate of treatment
effect on survival after adjustment for other explanatory variables. In addition, it
allows us to estimate the risk (or hazard) of death of an individual given their
prognosis variables. The model is written as:
h(t)=h0(t) × exp{b1x1+b2x2+⋯+bnxn}
Where h(t) is the hazard function which estimates the risk at any given time t
and is determined by a set of n covariates (x1, x2, …,xn). Regression coefficients
135
(b1,b2,..., bn) adjust the proportional change that the hazard related to changes
in the covariates. h0 is the baseline hazard function that corresponds to the
probability of hazard when all covariates are zero. A comparison of this with a
number of other methods including dichotomizing variables a priori based on
quantiles or in more data driven ways has shown that cox-regression is more
robust and yields much more reliable and reproducible results [232].
Overall using various data sources and algorithms we are able to both assess
Biological and Cancer relevance. This represents one section or score given to
genes and is used in conjunction with therapeutic strategy to determine a rank
prioritization for the gene.
5.3.2.2 Druggability and Targetability Candidate genes
There are a number of publicly available drug databases that can be used to
determine whether or not a gene has already been targeted by a low molecular
weight (LMW) compound, monoclonal Antibody, or other therapeutic strategy.
For instance, PharmGKM is a pharmacogenomics (the study of how genomic
variation influences drug response, looking at variation across the genome)
knowledge base that contains clinical information, drug information, and
clinically actionable gene-drug associations [233]. This is performed via both
NLP and manual curation of literature and clinical trial data. Another resource,
Drugbank, combines detailed pharmacological drug data and comprehensive
drug target information [234]. It currently contains 8148 drug and 4325 drug
targets that are linked to these drug entries. Yet, another resource, the
136
Therapeutic Targets Database, provides information about target function,
sequence, 3D structure etc…as well as the drugs which inhibit them [235]. This
contains over 140 drug therapeutic classes and 2,025 molecular targets.
Finally, Druggability can also be assessed based on interpro domain structure.
More than a decade ago Hopkins and Groom, in a landmark paper, used data
from the Investigational Drugs Database and the Pharmaprojects Database to
identify 399 non-redundant molecules that bind to compounds with high affinity
[236]. This corresponded in turn to about 130 distinct protein families. They used
this set of protein families to classify 21,688 proteins as being druggable or not
and identified roughly 3,051 proteins. This is based on the idea that drugs target
specific motifs on proteins, hence families or proteins should all be targetable
(not necessarily by the exact same drug but perhaps a similar scaffold). In order
to classify protein as belonging to one protein family or another the Interpro
database was used which provides functional analysis of proteins by classifying
them into families and predicting domains and important sites based on their
sequence. A similar study by Russ and Lampel was performed a few years later
where they too identified a set of druggable domains which they used to classify
the proteome [237]. To amass all of this data and link it all together, avoiding
redundancies, and matching meta-data would be quite a herculean effort.
Luckily, the The Drug-Gene Interaction database (DGIdb) developed at the
Washington University School of Medicine, does just this [238]. It mines all of the
drug and interaction space to create a seamless resource that provides
information about drugs, drug-gene interactions, and potentially druggability. In
addition to the resources mentioned (PharmGKB, DrugBank, TTD, Hopkins &
137
Groom, and Russ & Lampel) it conatins a host of other resources including
dGene, PubChem, Ensembl, My Cancer Genome, GO, TALK, TEND. A
description of each of the sources and the how they are imported into DGIdb is
exhaustively covered in their publication (Publication number). All of the data is
made publicly available in the form text files and a MySQL dump file. This one
data resource is used in the PITFIT Target Prioritization tool to capture
information about druggability.
Many proteins that cannot be targeted by conventional LMW drugs (or at least
haven’t been as yet) may still be targeted using monoclonal antibodies, ADC, or
CAR therapy if they meet the requirement of being present on the plasma cell
membrane. In order to determine if a protein was localized to the plasma cell
membrane a variety of sources were used to create a “Transmembrane list”
including GO, the Conserved Domains Database (CDD) , and Surfaceome [239,
240]. Genes that are called as Transmembrane by 2/3 of these sources or 2050
genes (1003+548+256+243) were deemed as Transmembrane. The Venn shown
below shows the overlap between the various sources (Figure 37)
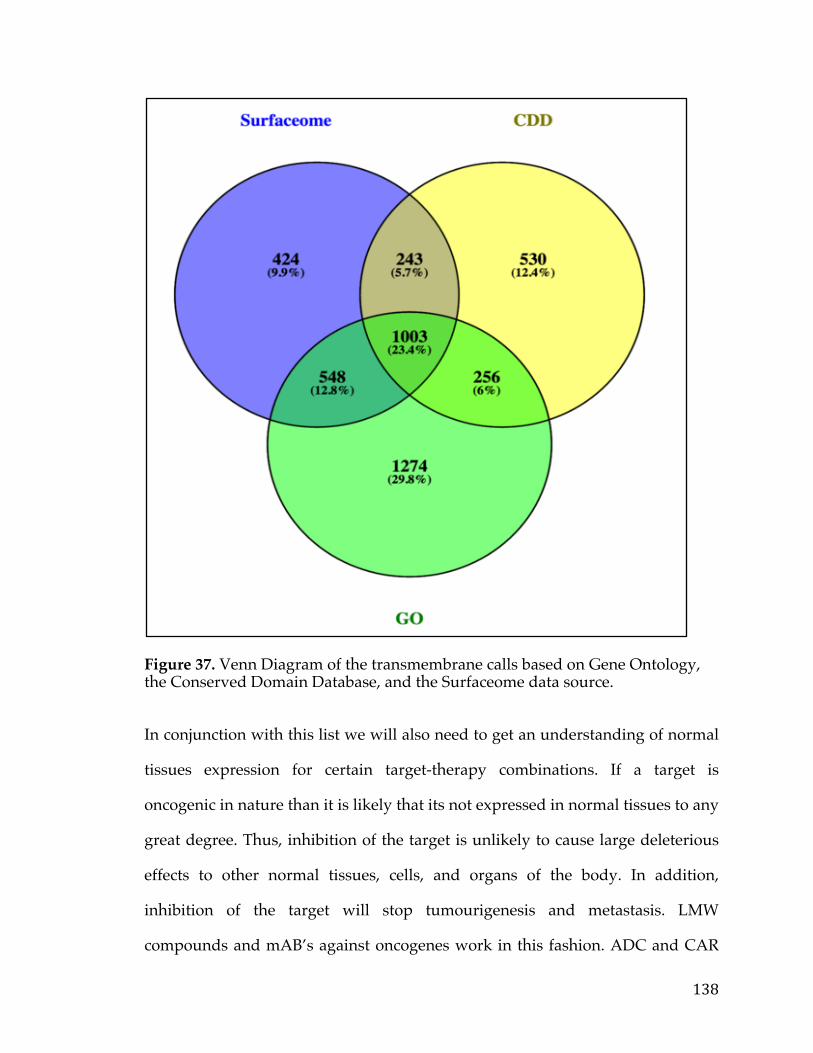
138
Figure 37. Venn Diagram of the transmembrane calls based on Gene Ontology, the Conserved Domain Database, and the Surfaceome data source.
In conjunction with this list we will also need to get an understanding of normal
tissues expression for certain target-therapy combinations. If a target is
oncogenic in nature than it is likely that its not expressed in normal tissues to any
great degree. Thus, inhibition of the target is unlikely to cause large deleterious
effects to other normal tissues, cells, and organs of the body. In addition,
inhibition of the target will stop tumourigenesis and metastasis. LMW
compounds and mAB’s against oncogenes work in this fashion. ADC and CAR
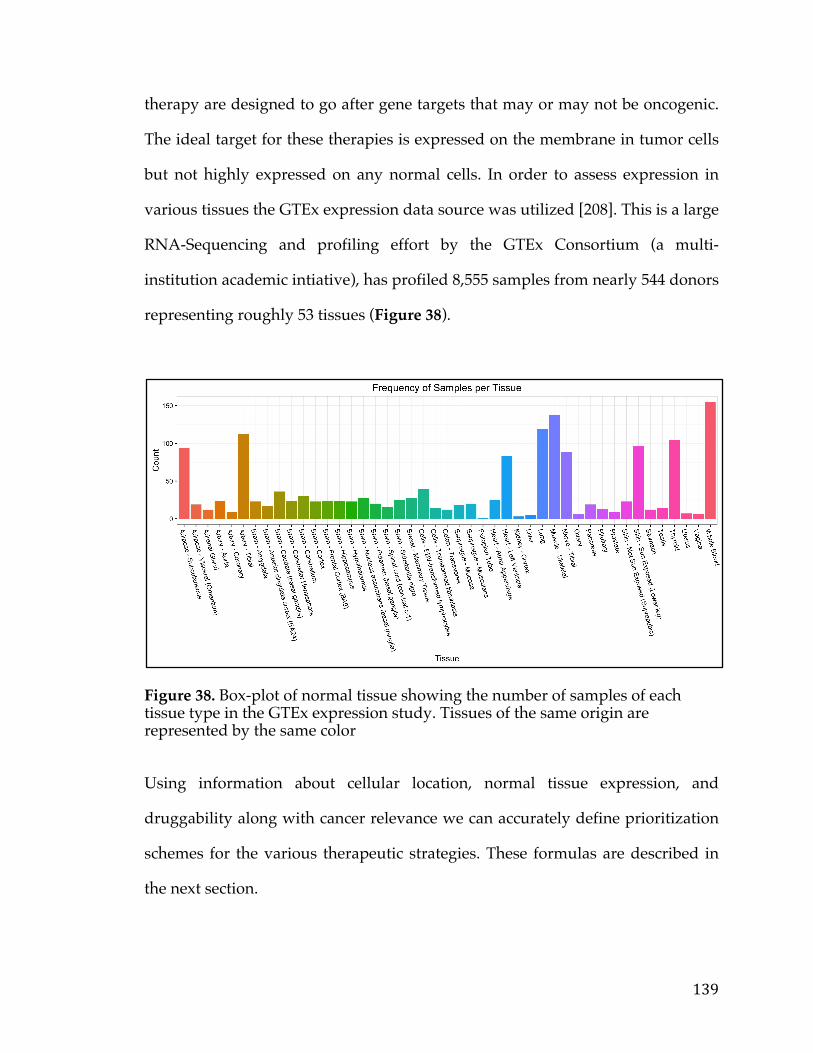
139
therapy are designed to go after gene targets that may or may not be oncogenic.
The ideal target for these therapies is expressed on the membrane in tumor cells
but not highly expressed on any normal cells. In order to assess expression in
various tissues the GTEx expression data source was utilized [208]. This is a large
RNA-Sequencing and profiling effort by the GTEx Consortium (a multi-
institution academic intiative), has profiled 8,555 samples from nearly 544 donors
representing roughly 53 tissues (Figure 38).
Figure 38. Box-plot of normal tissue showing the number of samples of each tissue type in the GTEx expression study. Tissues of the same origin are represented by the same color
Using information about cellular location, normal tissue expression, and
druggability along with cancer relevance we can accurately define prioritization
schemes for the various therapeutic strategies. These formulas are described in
the next section.
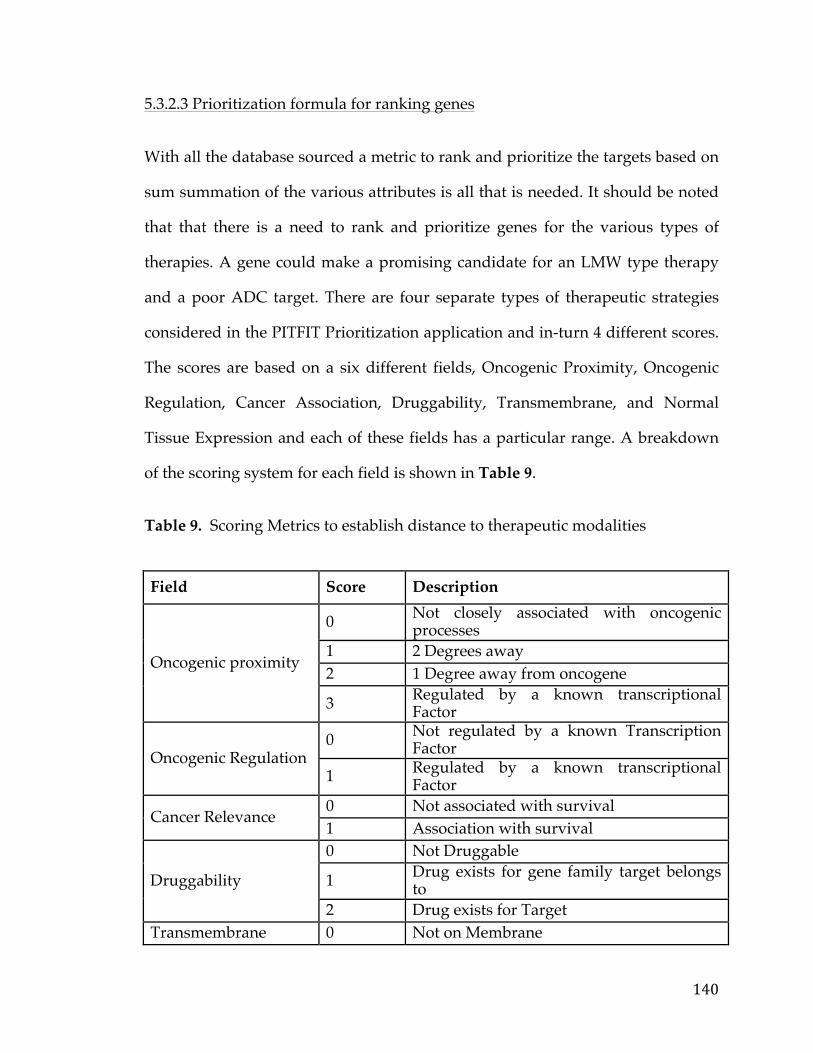
140
5.3.2.3 Prioritization formula for ranking genes
With all the database sourced a metric to rank and prioritize the targets based on
sum summation of the various attributes is all that is needed. It should be noted
that that there is a need to rank and prioritize genes for the various types of
therapies. A gene could make a promising candidate for an LMW type therapy
and a poor ADC target. There are four separate types of therapeutic strategies
considered in the PITFIT Prioritization application and in-turn 4 different scores.
The scores are based on a six different fields, Oncogenic Proximity, Oncogenic
Regulation, Cancer Association, Druggability, Transmembrane, and Normal
Tissue Expression and each of these fields has a particular range. A breakdown
of the scoring system for each field is shown in Table 9.
Table 9. Scoring Metrics to establish distance to therapeutic modalities
Field Score Description
Oncogenic proximity
0 Not closely associated with oncogenic processes
1 2 Degrees away 2 1 Degree away from oncogene
3 Regulated by a known transcriptional Factor
Oncogenic Regulation 0 Not regulated by a known Transcription
Factor
1 Regulated by a known transcriptional Factor
Cancer Relevance 0 Not associated with survival 1 Association with survival
Druggability
0 Not Druggable
1 Drug exists for gene family target belongs to
2 Drug exists for Target Transmembrane 0 Not on Membrane

141
1 Transmembrane
Normal Tissue Expression
0 Expression in normal tissues 1 Expression in non-critical tissues 2 Expression only in Brain 3 No Expression in Normal Tissues
The tally for each of these four types is calculated via the Cosine Similarity score
[241]. For this method, we create an idealized set of vectors for each therapeutic
modality and then calculate score based on how similar the target vector is to the
idealized vector.
The score basically ranges from -1 (completely opposite) to 1 (exactly the same)
with 0 indicating orthogonality. The higher the score, the better the candidate
target. The main reason each therapeutic modality is represented by a set of
vectors as opposed to a single vector is that some variable are inconsequential.
For instance, if one is using an ADC strategy for a particular strategy it is
inconsequential whether or not the gene is oncogenic. The set of idealized vectors
for each of the therapies are shown in Table 10 and a brief explanation follows.
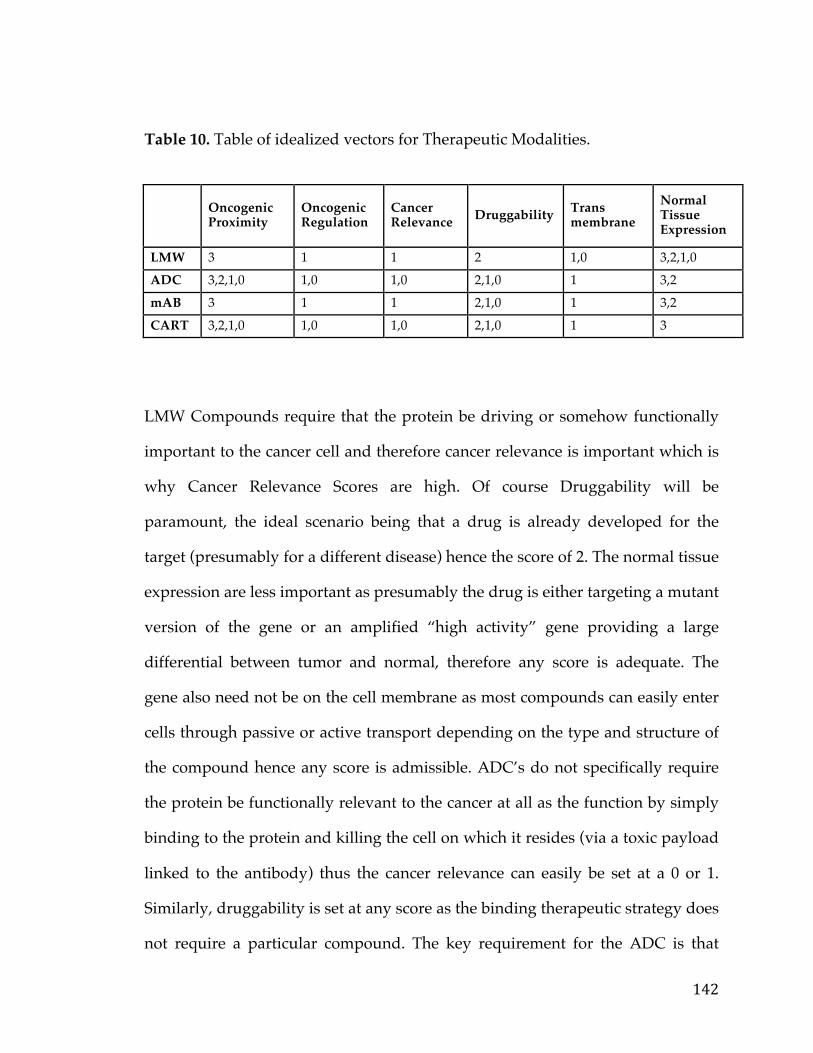
142
Table 10. Table of idealized vectors for Therapeutic Modalities.
Oncogenic Proximity
Oncogenic Regulation
Cancer Relevance Druggability Trans
membrane Normal Tissue Expression
LMW 3 1 1 2 1,0 3,2,1,0 ADC 3,2,1,0 1,0 1,0 2,1,0 1 3,2 mAB 3 1 1 2,1,0 1 3,2 CART 3,2,1,0 1,0 1,0 2,1,0 1 3
LMW Compounds require that the protein be driving or somehow functionally
important to the cancer cell and therefore cancer relevance is important which is
why Cancer Relevance Scores are high. Of course Druggability will be
paramount, the ideal scenario being that a drug is already developed for the
target (presumably for a different disease) hence the score of 2. The normal tissue
expression are less important as presumably the drug is either targeting a mutant
version of the gene or an amplified “high activity” gene providing a large
differential between tumor and normal, therefore any score is adequate. The
gene also need not be on the cell membrane as most compounds can easily enter
cells through passive or active transport depending on the type and structure of
the compound hence any score is admissible. ADC’s do not specifically require
the protein be functionally relevant to the cancer at all as the function by simply
binding to the protein and killing the cell on which it resides (via a toxic payload
linked to the antibody) thus the cancer relevance can easily be set at a 0 or 1.
Similarly, druggability is set at any score as the binding therapeutic strategy does
not require a particular compound. The key requirement for the ADC is that

143
there is very little normal tissue expression (ADC’s do not cross the blood brain
barrier hence the score of 2 or 3) and the target is located on the plasma cell
membrane. mAB’s, much like ADC require little/no normal tissue expression
but also require the gene be functionally important to the cancer (as there is no
attached toxic linker). The benefit of course of using and mAB over ADC is that
the chemistry that links the antibody to the toxic payload is tricky can be a
potential source of problem for the therapy working. CAR Therapy and other
types of Adoptive Cell transfer therapeutics similar to an ADC do not require the
target be relevant to the cancer hence the score of 0. The key requirement, similar
to those of an ADC, is that the target resides on the plasma cell membrane and
has little normal tissues expression. CAR therapy takes advantage of immune
cells to kill cancer cells and thus can cross the blood-brain barrier hence the score
of 3. After getting scores for each of these four strategies the maximum value is
taken and used as the default column to rank the genes. Of course researchers are
free to use any other column to rank depending on their background and access
to developing these therapies. It is of course noted that the assignment of scores
and the overall metric is ad hoc, but allows the users to quickly sort and rank the
genes based on real considerations translational scientists use when determining
an optimal therapeutic strategy. Typically when creating scoring metrics we can
tailor and modify the scoring system based on some set of positive controls. This
could involve changing the weight of particular fields or changing the metric
altogether. In this particular case there aren’t a great deal of positive controls
from which to develop such a method but future iterations of the application
may include this. Overall by using these data sources, and ranking strategy, the
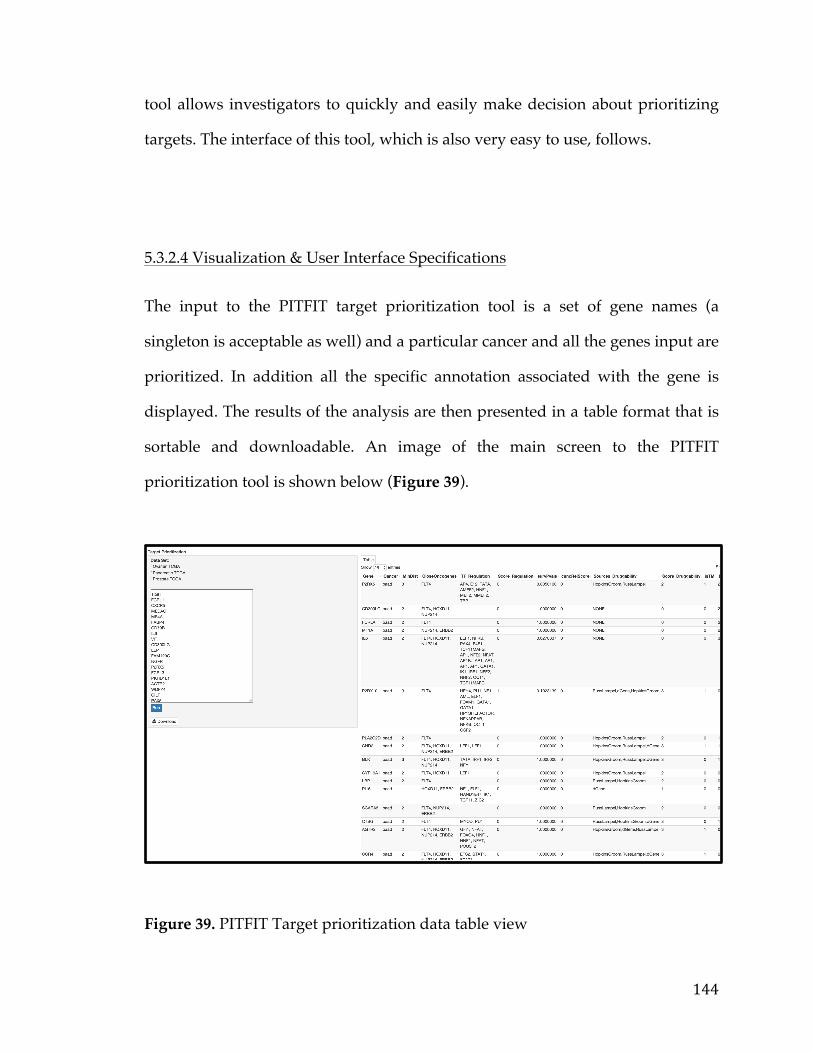
144
tool allows investigators to quickly and easily make decision about prioritizing
targets. The interface of this tool, which is also very easy to use, follows.
5.3.2.4 Visualization & User Interface Specifications
The input to the PITFIT target prioritization tool is a set of gene names (a
singleton is acceptable as well) and a particular cancer and all the genes input are
prioritized. In addition all the specific annotation associated with the gene is
displayed. The results of the analysis are then presented in a table format that is
sortable and downloadable. An image of the main screen to the PITFIT
prioritization tool is shown below (Figure 39).
Figure 39. PITFIT Target prioritization data table view
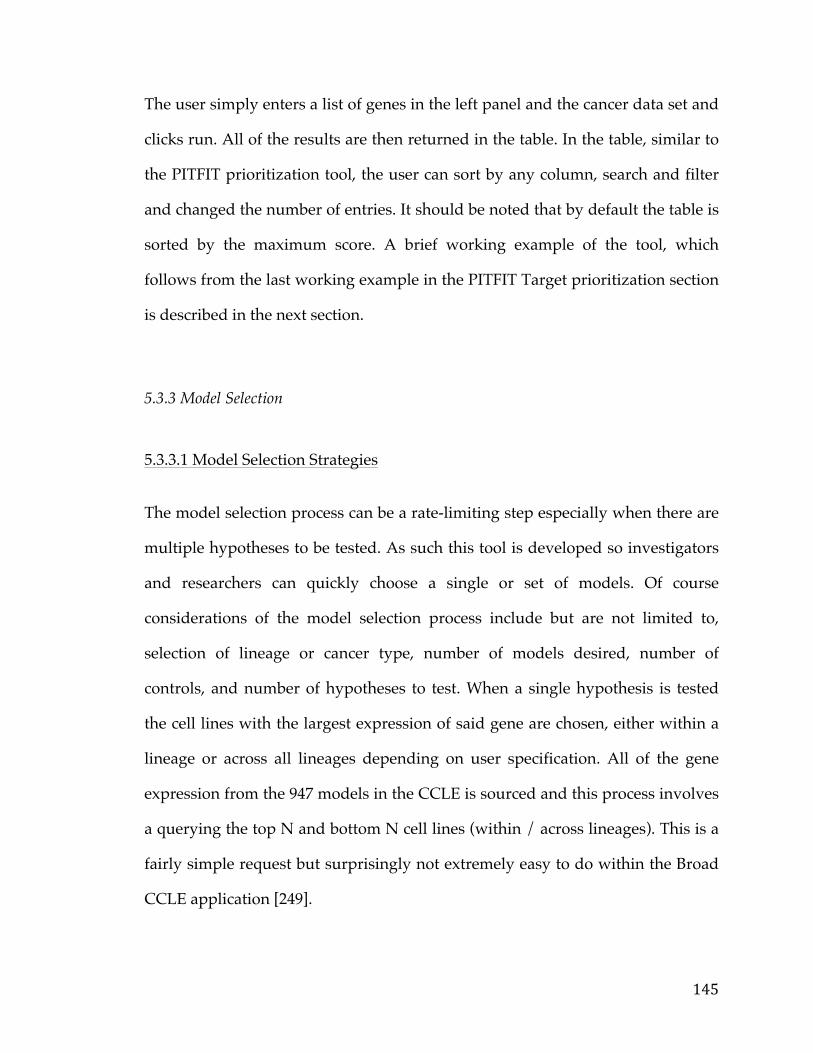
145
The user simply enters a list of genes in the left panel and the cancer data set and
clicks run. All of the results are then returned in the table. In the table, similar to
the PITFIT prioritization tool, the user can sort by any column, search and filter
and changed the number of entries. It should be noted that by default the table is
sorted by the maximum score. A brief working example of the tool, which
follows from the last working example in the PITFIT Target prioritization section
is described in the next section.
5.3.3 Model Selection
5.3.3.1 Model Selection Strategies The model selection process can be a rate-limiting step especially when there are
multiple hypotheses to be tested. As such this tool is developed so investigators
and researchers can quickly choose a single or set of models. Of course
considerations of the model selection process include but are not limited to,
selection of lineage or cancer type, number of models desired, number of
controls, and number of hypotheses to test. When a single hypothesis is tested
the cell lines with the largest expression of said gene are chosen, either within a
lineage or across all lineages depending on user specification. All of the gene
expression from the 947 models in the CCLE is sourced and this process involves
a querying the top N and bottom N cell lines (within / across lineages). This is a
fairly simple request but surprisingly not extremely easy to do within the Broad
CCLE application [249].
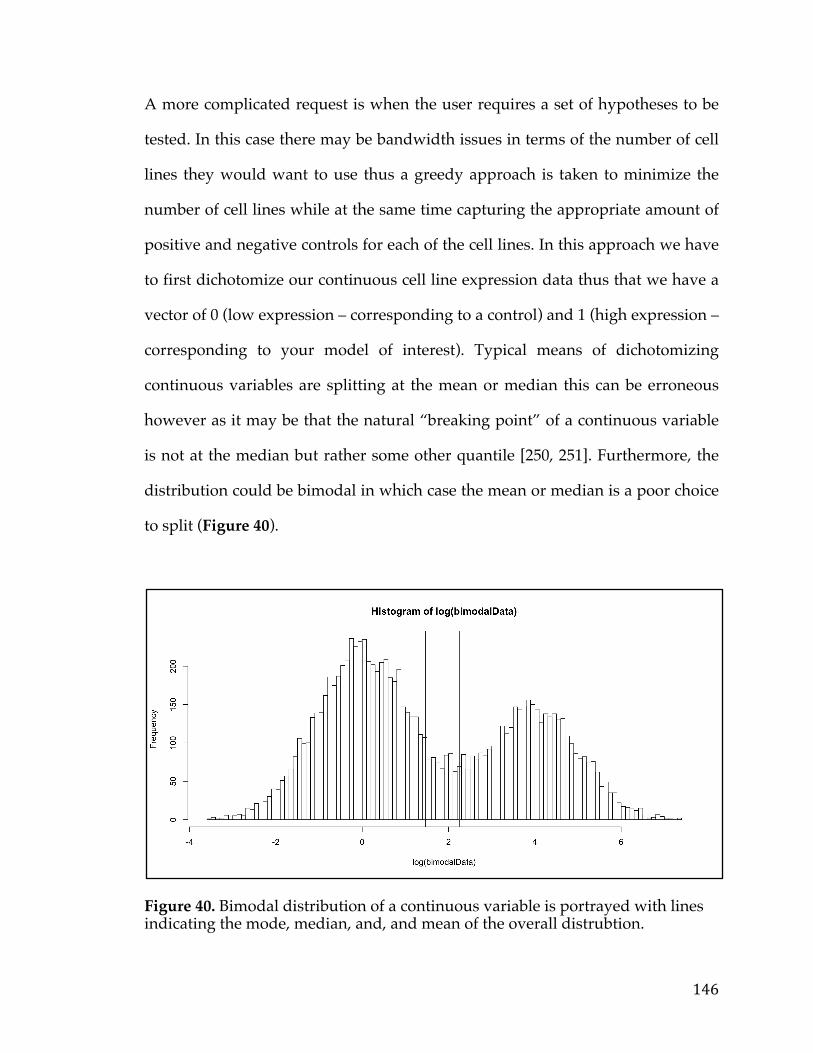
146
A more complicated request is when the user requires a set of hypotheses to be
tested. In this case there may be bandwidth issues in terms of the number of cell
lines they would want to use thus a greedy approach is taken to minimize the
number of cell lines while at the same time capturing the appropriate amount of
positive and negative controls for each of the cell lines. In this approach we have
to first dichotomize our continuous cell line expression data thus that we have a
vector of 0 (low expression – corresponding to a control) and 1 (high expression –
corresponding to your model of interest). Typical means of dichotomizing
continuous variables are splitting at the mean or median this can be erroneous
however as it may be that the natural “breaking point” of a continuous variable
is not at the median but rather some other quantile [250, 251]. Furthermore, the
distribution could be bimodal in which case the mean or median is a poor choice
to split (Figure 40).
Figure 40. Bimodal distribution of a continuous variable is portrayed with lines indicating the mode, median, and, and mean of the overall distrubtion.

147
One way to choose a more natural split is to use the k-means algorithm. k-means
is a classical clustering method that partitions the data points into K groups
where K is a pre-specified number [252, 253]. In every iteration of the algorithm,
every sample is assigned to the cluster whose mean/centroid yields the least
within-cluster sum of squares. This is followed by an update on the cluster
centroids as the memberships of the samples change. The algorithm finally
converges when the memberships of the genes no longer alter. We specify K=2 to
perfectly dichotomize the continuous variable into 2 separate groups. The group
with the lower mean is assigned to 0 and the one with the higher mean is
assigned to 1. After this is complete the greedy algorithm can be performed.
In general a Greedy Algorithm is an approach that solves complex, multi-step
problems by breaking it down into discrete steps and deciding at each step an
optimal solutions that will provide the most obvious benefit. It is called greedy
because while the optimal solution to each smaller instance will provide an
immediate output, the algorithm doesn’t consider the larger problem as a whole.
Once a decision has been made, it is not reassessed [254, 255]. Greedy algorithms
typically require a function a candidate set from which a solution will be created,
and a scoring function (sometimes broken into selection and objective function)
that chooses the best candidate at each step to be added to the solution and a
solution function which decides whether or not we have arrived at a complete
solution. For our particular case, our candidate set is a set of cell lines with each
gene in the user list marked as either a 0 or 1. So, if a user starts with 10
hypotheses each solution will be a cell line with a binary vector of 10 values. The

148
selection function will be that sum of the maximum values among your set of
vectors. In the first step, then the cell line with the maximum number of 1’s
corresponding to cell line where most hypotheses can be tested at once is chosen.
In the next step the maximum value between each cell line vector and the
solution (from the first step) is calculated and the cell line which, in addition to
the original cell line, had the maximum value, is chosen. This continues on until
the appropriate number of model cell lines represents each gene. A schematic of
this process is depicted below (Figure 41).
Figure 41. Procedure around Greedy Algorithm to choose cell lines. Rows in the Table represent cell lines and columns are genes. The sum column is the objective function which assigns a value to each solution. Flow chart on left shows how the solution is iteratively grown and the solution function that indicates when the solution is complete.
In this particular example the C (cell line) with the initial best value is C1 as it has
the maximum number of 1’s, and our solution would be [1,0,1,0,0]. The next cell
line chosen would be C3 because max(C1 OR C3) yields [1,1,1,0,1]. After this the
next soluction would be C5 as max(C1,C3 OR C5) yields[1,1,1,1,1]. It should be
149
noted that once a gene has full coverage (based on number of desired models by
the user) the score is ceilinged. So, if a user desires 5 models for each hypotheses
and the current solution is [5,5,3,4,5] then an additional cell line [1,1,0,0,0] would
not add anything to the overall score whereas [0,0,1,1,0] would. Overall this
approach will allow us to quickly determine the best set of cell lines to use for a
particular set of hypotheses tested. The next section covers how the user actually
interacts and works with the tool to generate the solutions.
5.3.3.2 Model Selection Implementation
There are basically 4 parameters that a user needs to enter in the process. One is
the gene or set of genes, the next is the number of positive controls desired and
negative controls desired, finally the lineage (blank meaning lineage or cancer
type is not important). An image of the user interface is shown below (Figure 42).
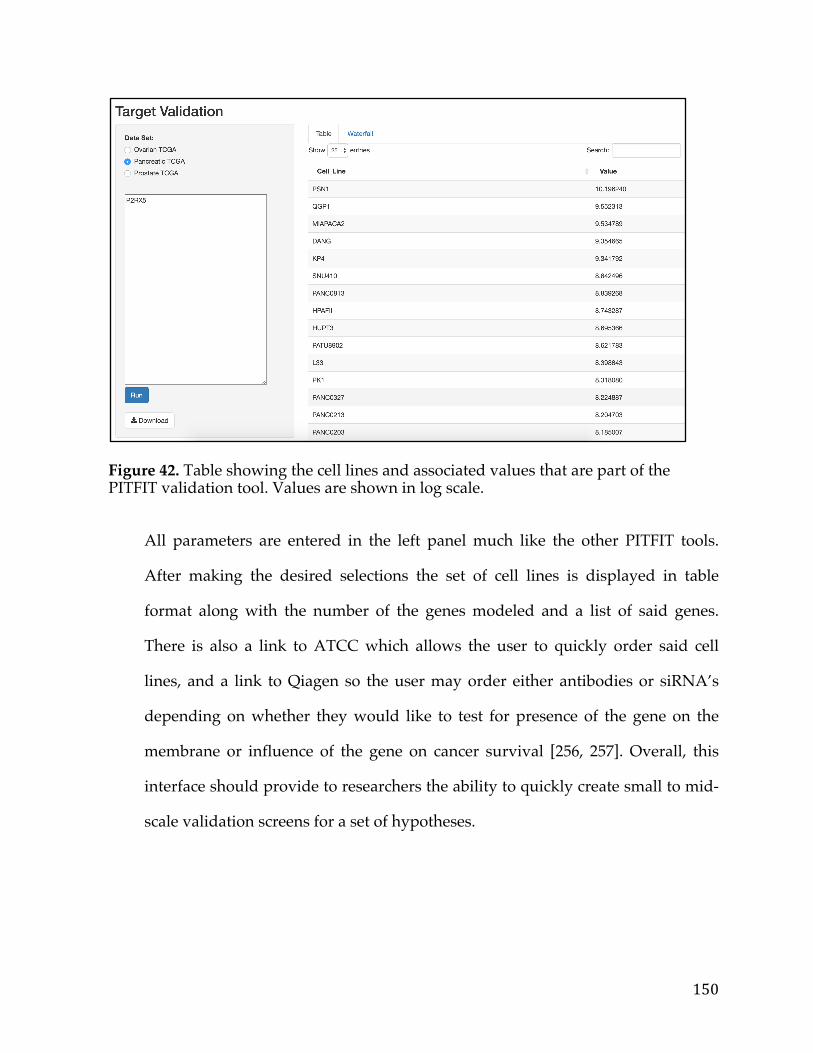
150
Figure 42. Table showing the cell lines and associated values that are part of the PITFIT validation tool. Values are shown in log scale.
All parameters are entered in the left panel much like the other PITFIT tools.
After making the desired selections the set of cell lines is displayed in table
format along with the number of the genes modeled and a list of said genes.
There is also a link to ATCC which allows the user to quickly order said cell
lines, and a link to Qiagen so the user may order either antibodies or siRNA’s
depending on whether they would like to test for presence of the gene on the
membrane or influence of the gene on cancer survival [256, 257]. Overall, this
interface should provide to researchers the ability to quickly create small to mid-
scale validation screens for a set of hypotheses.
151
5.4 Working Example of PITFIT
5.4.1 Working Example of the Target Identification Tool
Pancreatic cancer is the 4th leading cause of cancer death in the United States with
5-year survival rates at around 7% [156, 157, 158]. Furthermore, survival rates
haven’t really improved in the past 4 decades in sharp contrast to a host of other
cancers such as colon cancer or breast cancer [Include figure]. This is in part due
to the fact there are few therapeutic options for pancreatic cancer patients. While
about 15-20% of patients can get surgical-resection this brings survival rates to
only 20-25% due to the occurrence of relapse [156, 157, 158]. The current standard
of care includes gemcitabine, irinotecan, and other harsh chemotherapies.
Therefore, it is imperative to try to develop targeted therapies for this deadly
disease to improve mortality and decrease morbidity in affected patients.
In order to begin the target identification process a better understanding of the
landscape of mutations, genetic lesion, and pathways in pancreatic cancer is
necessary. The spectrum of mutations and lesions in pancreatic cancer is broad,
and the disease itself is very complex. Commonly mutated genes include KRAS,
CDKN2A, SMAD4 and the tumor-suppressor TP53 [159, 160, 161]. In addition
many core signaling pathways such as Wnt Signaling, Hedgehog signaling, and
JNK signaling are aberrantly regulated [162, 163, 164]. With so many lesions and
pathways up-regulated there are many query genes one could examine more
closely.
152
An interesting study published in the Journal of the National Cancer Institute in
2014 indicated that Pancreatic Ductal Carcinoma could be treated with a MYC
inhibitor [165]. In this particular study, the authors developed a KRAS mouse
model and came up with a few key findings. First, it was noted that mice over-
expressing mutated KRAS in the pancreas developed pancreatic cancer. Second,
these mice, when treated with an anti-MYC compound known as MYCro3 had
reduced tumor burden and improved survival times. The relationship between
MYC and KRAS is well established, MYC being a down-stream target of the
KRAS pathway [166, 167]. A study in 2010 has shown that when MYC silencing
is cytotoxic to KRAS-mutated mouse models [168]. Given, these observations one
potential oncogene to target is the MYC gene itself. Unfortunately, no FDA
targeted therapy currently exists for this gene and therefore this represents a
perfect candidate for the PITFIT target prioritization tool.
To use the tool, we first select pancreatic cancer and enter in MYC Exp (read
MYC Expression) as our feature of interest, since it is MYC expression (not Copy
Number or Mutation) that is implicated in Pancreatic Cancer. Using a very
stringent adjusted p-value cut-off of 0.001 and log-fold cut-off of 2 (which
corresponds to 4 fold change) we end up with a list of 62 genes (shown in Table
11).
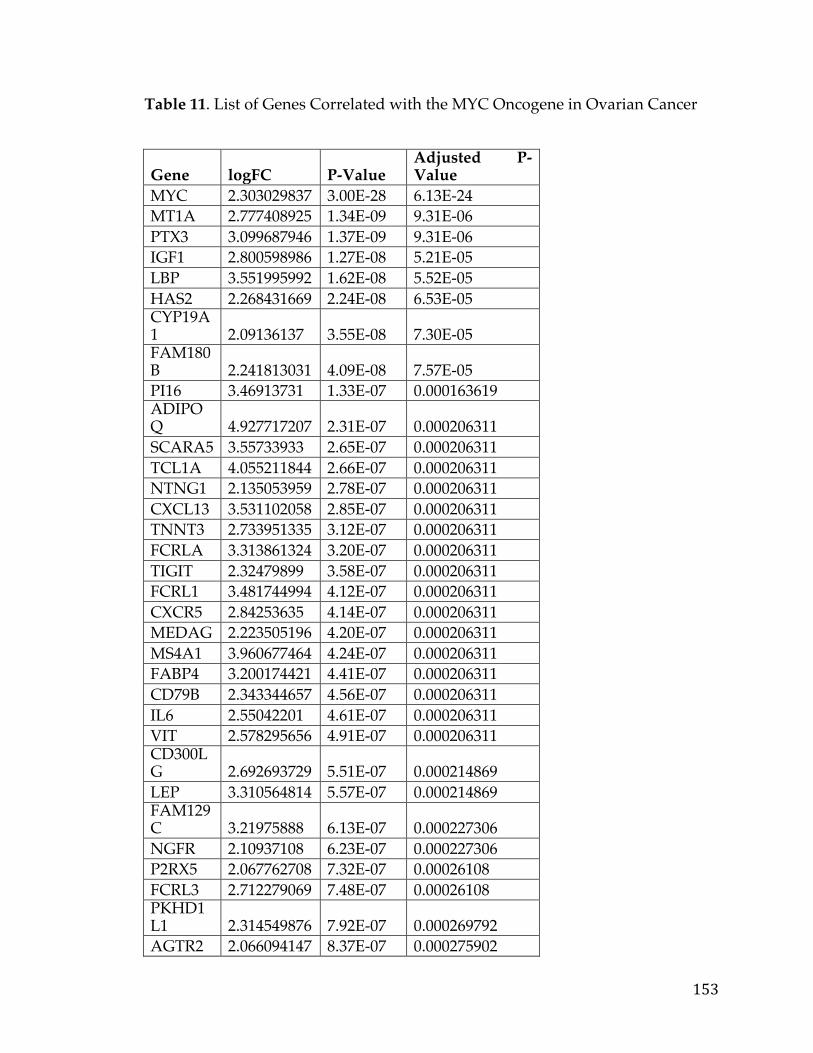
153
Table 11. List of Genes Correlated with the MYC Oncogene in Ovarian Cancer
Gene logFC P-Value Adjusted P-Value
MYC 2.303029837 3.00E-28 6.13E-24 MT1A 2.777408925 1.34E-09 9.31E-06 PTX3 3.099687946 1.37E-09 9.31E-06 IGF1 2.800598986 1.27E-08 5.21E-05 LBP 3.551995992 1.62E-08 5.52E-05 HAS2 2.268431669 2.24E-08 6.53E-05 CYP19A1 2.09136137 3.55E-08 7.30E-05 FAM180B 2.241813031 4.09E-08 7.57E-05 PI16 3.46913731 1.33E-07 0.000163619 ADIPOQ 4.927717207 2.31E-07 0.000206311 SCARA5 3.55733933 2.65E-07 0.000206311 TCL1A 4.055211844 2.66E-07 0.000206311 NTNG1 2.135053959 2.78E-07 0.000206311 CXCL13 3.531102058 2.85E-07 0.000206311 TNNT3 2.733951335 3.12E-07 0.000206311 FCRLA 3.313861324 3.20E-07 0.000206311 TIGIT 2.32479899 3.58E-07 0.000206311 FCRL1 3.481744994 4.12E-07 0.000206311 CXCR5 2.84253635 4.14E-07 0.000206311 MEDAG 2.223505196 4.20E-07 0.000206311 MS4A1 3.960677464 4.24E-07 0.000206311 FABP4 3.200174421 4.41E-07 0.000206311 CD79B 2.343344657 4.56E-07 0.000206311 IL6 2.55042201 4.61E-07 0.000206311 VIT 2.578295656 4.91E-07 0.000206311 CD300LG 2.692693729 5.51E-07 0.000214869 LEP 3.310564814 5.57E-07 0.000214869 FAM129C 3.21975888 6.13E-07 0.000227306 NGFR 2.10937108 6.23E-07 0.000227306 P2RX5 2.067762708 7.32E-07 0.00026108 FCRL3 2.712279069 7.48E-07 0.00026108 PKHD1L1 2.314549876 7.92E-07 0.000269792 AGTR2 2.066094147 8.37E-07 0.000275902
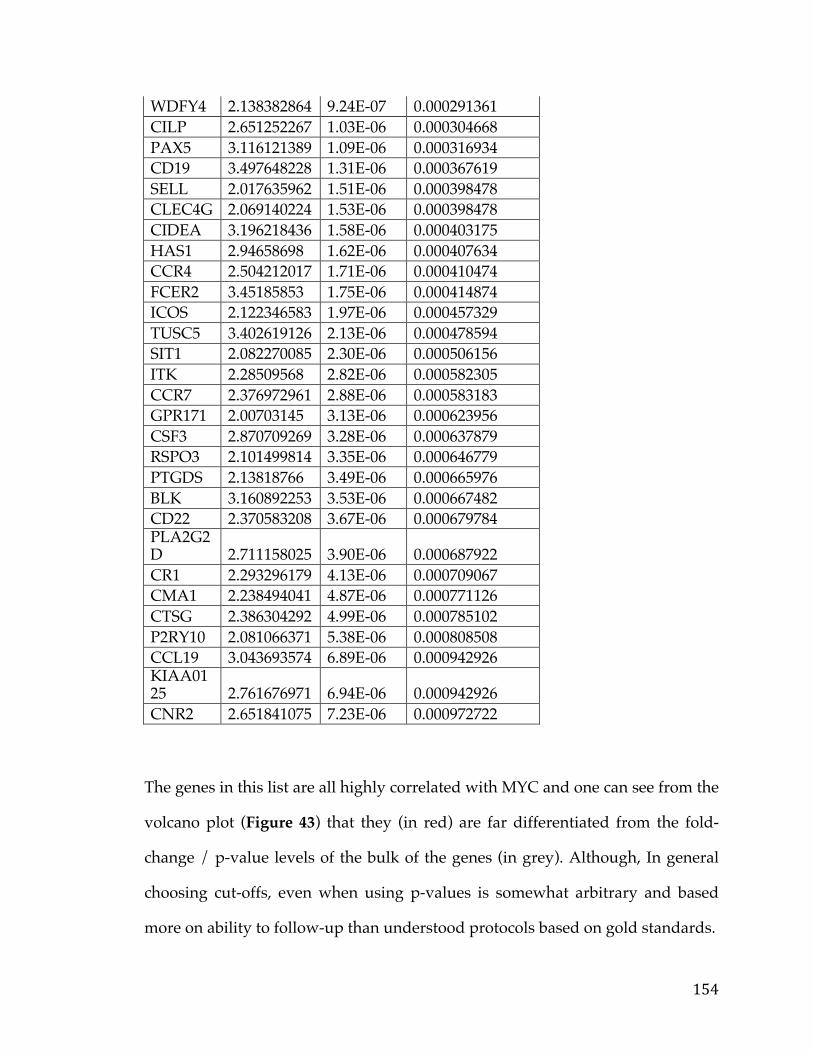
154
WDFY4 2.138382864 9.24E-07 0.000291361 CILP 2.651252267 1.03E-06 0.000304668 PAX5 3.116121389 1.09E-06 0.000316934 CD19 3.497648228 1.31E-06 0.000367619 SELL 2.017635962 1.51E-06 0.000398478 CLEC4G 2.069140224 1.53E-06 0.000398478 CIDEA 3.196218436 1.58E-06 0.000403175 HAS1 2.94658698 1.62E-06 0.000407634 CCR4 2.504212017 1.71E-06 0.000410474 FCER2 3.45185853 1.75E-06 0.000414874 ICOS 2.122346583 1.97E-06 0.000457329 TUSC5 3.402619126 2.13E-06 0.000478594 SIT1 2.082270085 2.30E-06 0.000506156 ITK 2.28509568 2.82E-06 0.000582305 CCR7 2.376972961 2.88E-06 0.000583183 GPR171 2.00703145 3.13E-06 0.000623956 CSF3 2.870709269 3.28E-06 0.000637879 RSPO3 2.101499814 3.35E-06 0.000646779 PTGDS 2.13818766 3.49E-06 0.000665976 BLK 3.160892253 3.53E-06 0.000667482 CD22 2.370583208 3.67E-06 0.000679784 PLA2G2D 2.711158025 3.90E-06 0.000687922 CR1 2.293296179 4.13E-06 0.000709067 CMA1 2.238494041 4.87E-06 0.000771126 CTSG 2.386304292 4.99E-06 0.000785102 P2RY10 2.081066371 5.38E-06 0.000808508 CCL19 3.043693574 6.89E-06 0.000942926 KIAA0125 2.761676971 6.94E-06 0.000942926 CNR2 2.651841075 7.23E-06 0.000972722
The genes in this list are all highly correlated with MYC and one can see from the
volcano plot (Figure 43) that they (in red) are far differentiated from the fold-
change / p-value levels of the bulk of the genes (in grey). Although, In general
choosing cut-offs, even when using p-values is somewhat arbitrary and based
more on ability to follow-up than understood protocols based on gold standards.
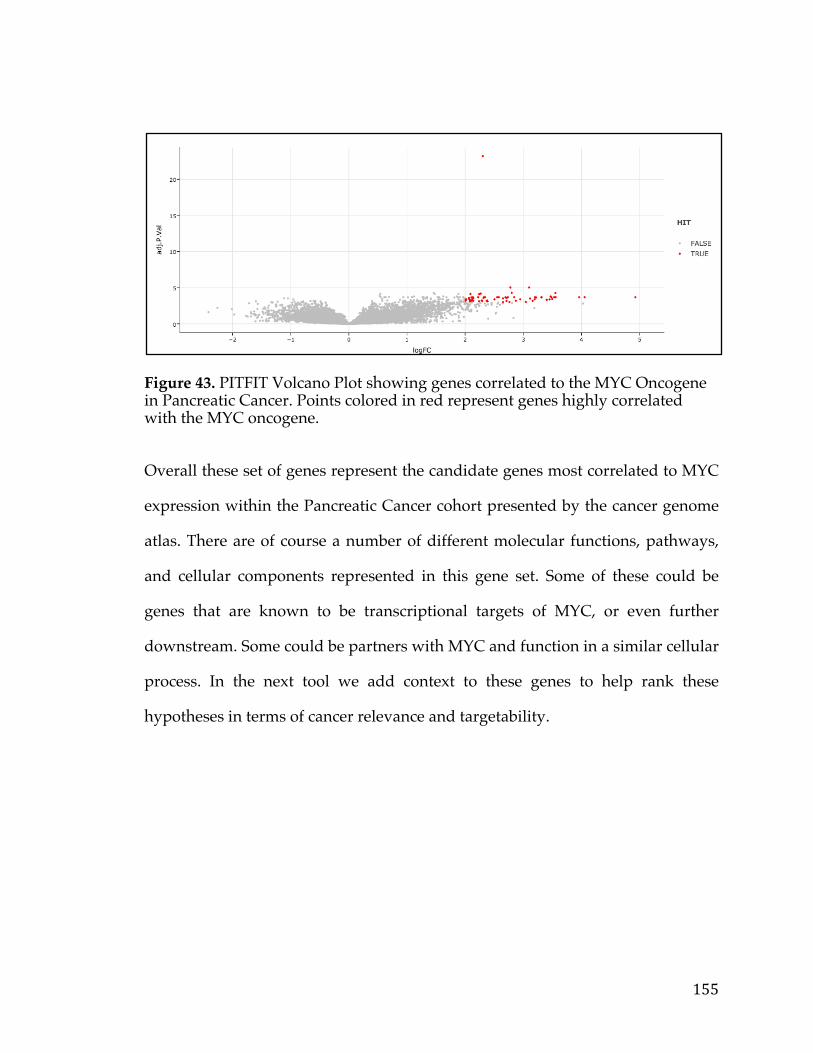
155
Figure 43. PITFIT Volcano Plot showing genes correlated to the MYC Oncogene in Pancreatic Cancer. Points colored in red represent genes highly correlated with the MYC oncogene.
Overall these set of genes represent the candidate genes most correlated to MYC
expression within the Pancreatic Cancer cohort presented by the cancer genome
atlas. There are of course a number of different molecular functions, pathways,
and cellular components represented in this gene set. Some of these could be
genes that are known to be transcriptional targets of MYC, or even further
downstream. Some could be partners with MYC and function in a similar cellular
process. In the next tool we add context to these genes to help rank these
hypotheses in terms of cancer relevance and targetability.
156
5.4.2 Working Example of the Target Prioritization Tool After employing the PITFIT identification tool to determine genes correlated
with the MYC oncogene in the TCGA Pancreatic Cancer Data Set the user is
presented with 62 genes as potential candidates for follow up. The typical
strategy employed would be to go through each gene one by one using a
combination of literature searches and various web resources in potentially very
biased manner. This process can be time consuming and create a bottleneck in
translational cancer research.
This is the perfect use case for the PITFIT target prioritization tool, which is in
fact meant to be used, sequentially with the PITFIT target identification too (It is
important to note though this represents a separate and distinct application, at
least in its current iteration). After entering in a list of genes 62 (separated by
newlines) and selecting “pancreatic cancer” as the dataset, the user is presented
with a table containing all the data required to prioritize the targets for the
various therapeutic modalities. The user may be interested only in genes that can
be targeted via ADC, mAB, or CART and thus can quickly filter to trans-
membrane genes.
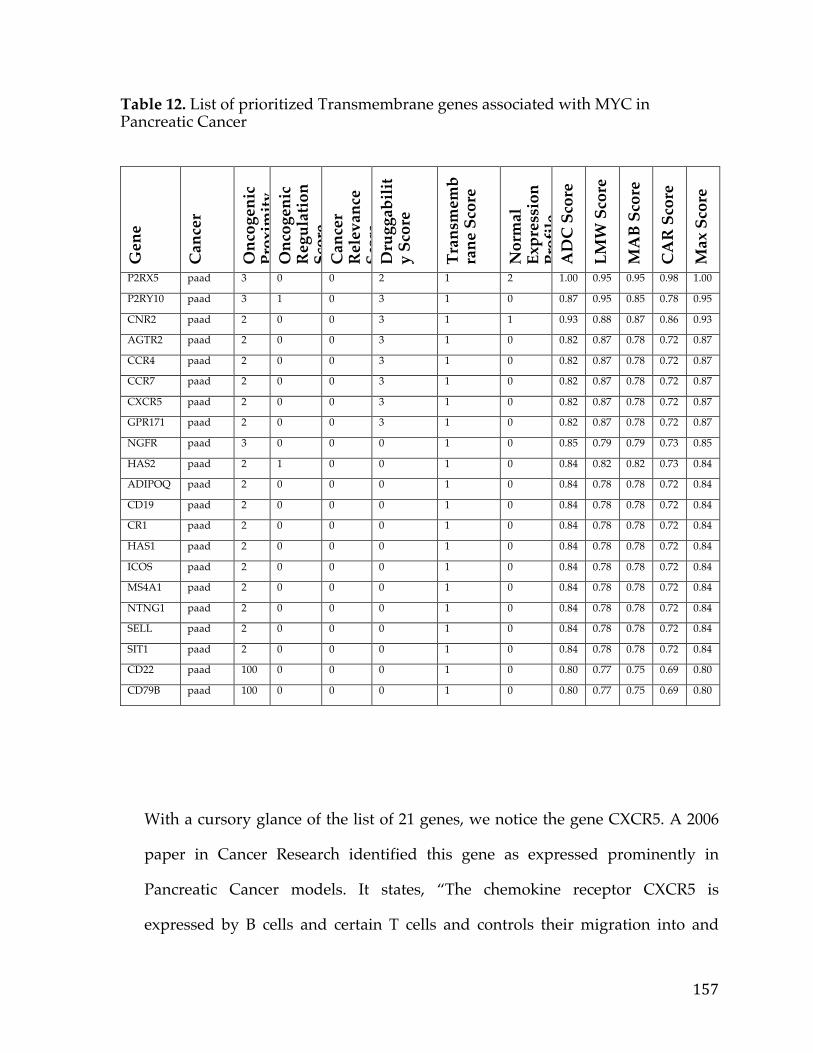
157
Table 12. List of prioritized Transmembrane genes associated with MYC in Pancreatic Cancer
G
ene
Can
cer
Onc
ogen
ic
Prox
imity
Sc
ore
Onc
ogen
ic
Reg
ulat
ion
Scor
e C
ance
r R
elev
ance
Sc
ore
Dru
ggab
ilit
y Sc
ore
Tran
smem
bra
ne S
core
Nor
mal
Ex
pres
sion
Pr
ofile
Sc
ore
AD
C S
core
LMW
Sco
re
MA
B Sc
ore
CA
R S
core
Max
Sco
re
P2RX5 paad 3 0 0 2 1 2 1.00 0.95 0.95 0.98 1.00
P2RY10 paad 3 1 0 3 1 0 0.87 0.95 0.85 0.78 0.95
CNR2 paad 2 0 0 3 1 1 0.93 0.88 0.87 0.86 0.93
AGTR2 paad 2 0 0 3 1 0 0.82 0.87 0.78 0.72 0.87
CCR4 paad 2 0 0 3 1 0 0.82 0.87 0.78 0.72 0.87
CCR7 paad 2 0 0 3 1 0 0.82 0.87 0.78 0.72 0.87
CXCR5 paad 2 0 0 3 1 0 0.82 0.87 0.78 0.72 0.87
GPR171 paad 2 0 0 3 1 0 0.82 0.87 0.78 0.72 0.87
NGFR paad 3 0 0 0 1 0 0.85 0.79 0.79 0.73 0.85
HAS2 paad 2 1 0 0 1 0 0.84 0.82 0.82 0.73 0.84
ADIPOQ paad 2 0 0 0 1 0 0.84 0.78 0.78 0.72 0.84
CD19 paad 2 0 0 0 1 0 0.84 0.78 0.78 0.72 0.84
CR1 paad 2 0 0 0 1 0 0.84 0.78 0.78 0.72 0.84
HAS1 paad 2 0 0 0 1 0 0.84 0.78 0.78 0.72 0.84
ICOS paad 2 0 0 0 1 0 0.84 0.78 0.78 0.72 0.84
MS4A1 paad 2 0 0 0 1 0 0.84 0.78 0.78 0.72 0.84
NTNG1 paad 2 0 0 0 1 0 0.84 0.78 0.78 0.72 0.84
SELL paad 2 0 0 0 1 0 0.84 0.78 0.78 0.72 0.84
SIT1 paad 2 0 0 0 1 0 0.84 0.78 0.78 0.72 0.84
CD22 paad 100 0 0 0 1 0 0.80 0.77 0.75 0.69 0.80
CD79B paad 100 0 0 0 1 0 0.80 0.77 0.75 0.69 0.80
With a cursory glance of the list of 21 genes, we notice the gene CXCR5. A 2006
paper in Cancer Research identified this gene as expressed prominently in
Pancreatic Cancer models. It states, “The chemokine receptor CXCR5 is
expressed by B cells and certain T cells and controls their migration into and
158
within lymph nodes. Its ligand BCA-1/CXCL13 is present in lymph nodes and
spleen and also in the liver. Surprisingly, we detected CXCR5 in several mouse
and human carcinoma cell lines. CXCR5 was particularly prominent in
pancreatic carcinoma cell lines and was also detected by immunohistochemistry
in 7 of 18 human pancreatic carcinoma tissues.” The authors go on to in fact
conclude, “CXCR5 may constitute an attractive target for therapy, particularly
for pancreatic carcinoma [266]. ” A different study detected CCR7, another gene
in the list, as associated with lymph node metastasis of pancreatic cancer at both
the mRNA and protein level in a number of patient samples [267]. Another study
published in 2011 has implicated, the AGTR2 gene, as integral in pancreatic
cancer ductal carcinoma. They state “Our data demonstrate a previously
unknown involvement of the angiotensin II type 2 receptor in pancreatic ductal
adenocarcinoma cell fatty acid synthesis and suggest that its blockade has
potential as a novel chemopreventive and antilipogenic mechanism for human
pancreatic ductal adenocarcinoma through the activation of AMP-activated
protein kinase, which could have detrimental effects on cancer cell survival
[269].” These examples simply demonstrate that the genes in this list are in fact
associated with pancreatic cancer in some form or way. This opens the door to
more confidently investigating genes that are not “known” to be associated with
pancreatic cancer.
For instance the top gene in the list, P2RX5 is a purinoreceptor for ATP. These
receptors are ligand gated ion channels that open in response to ATP and
cascade signals to commence in a Calcium ion dependent manner to several
cellular processes. This is actually part of a family or receptors that may have
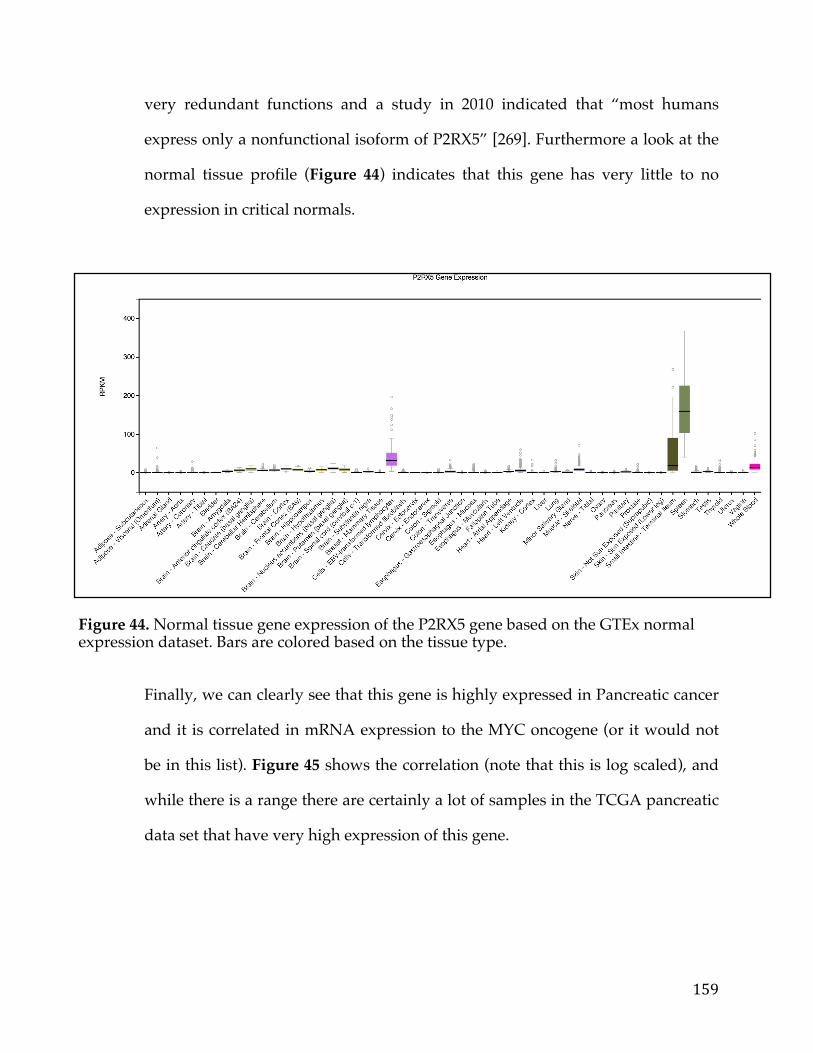
159
very redundant functions and a study in 2010 indicated that “most humans
express only a nonfunctional isoform of P2RX5” [269]. Furthermore a look at the
normal tissue profile (Figure 44) indicates that this gene has very little to no
expression in critical normals.
Figure 44. Normal tissue gene expression of the P2RX5 gene based on the GTEx normal expression dataset. Bars are colored based on the tissue type.
Finally, we can clearly see that this gene is highly expressed in Pancreatic cancer
and it is correlated in mRNA expression to the MYC oncogene (or it would not
be in this list). Figure 45 shows the correlation (note that this is log scaled), and
while there is a range there are certainly a lot of samples in the TCGA pancreatic
data set that have very high expression of this gene.
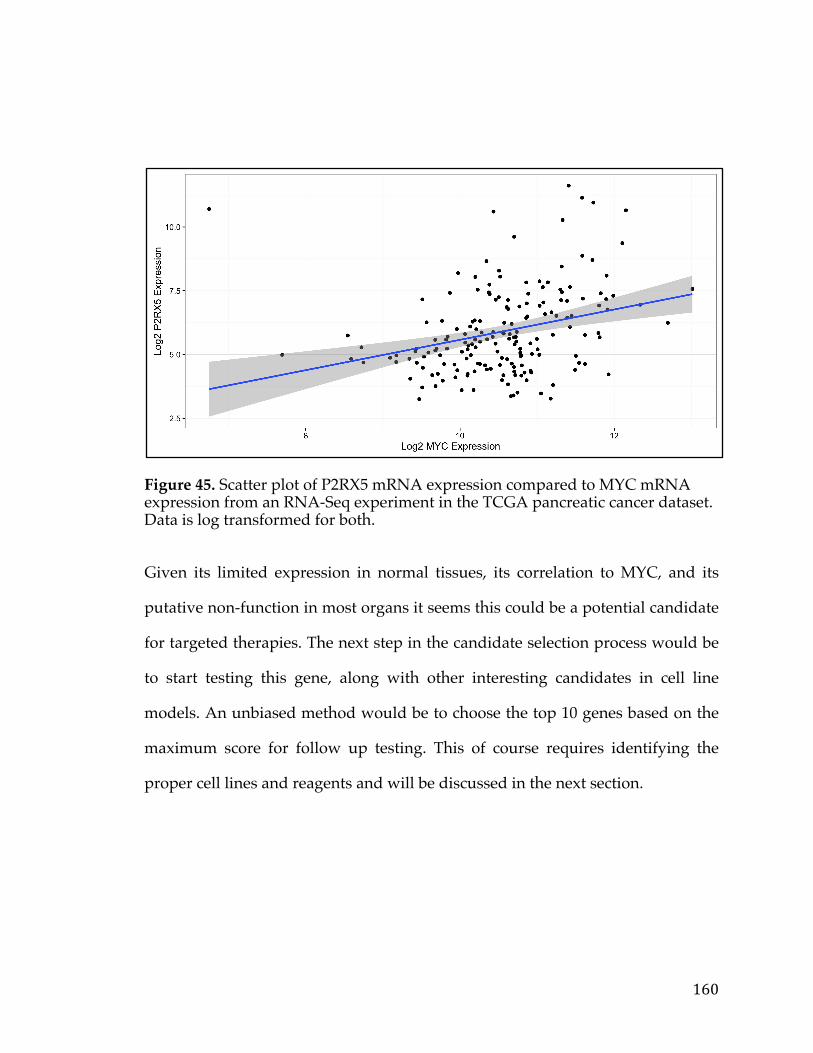
160
Figure 45. Scatter plot of P2RX5 mRNA expression compared to MYC mRNA expression from an RNA-Seq experiment in the TCGA pancreatic cancer dataset. Data is log transformed for both.
Given its limited expression in normal tissues, its correlation to MYC, and its
putative non-function in most organs it seems this could be a potential candidate
for targeted therapies. The next step in the candidate selection process would be
to start testing this gene, along with other interesting candidates in cell line
models. An unbiased method would be to choose the top 10 genes based on the
maximum score for follow up testing. This of course requires identifying the
proper cell lines and reagents and will be discussed in the next section.
161
5.4.3 Working Example of the Model Selection Tool
After identifying 62 genes as being the correlated to the MYC oncogene in
pancreatic cancer, and culling the list further to 10 genes using the PITFIT
prioritization tool the user will need to select appropriate cell line models for
each of the gene. Given that the P2RX5 gene may be the most interesting
candidate the PITFIT Validation Single Cell line tool may be used. Using this
tool, the user gets a table of cell line expression for P2RX5 or can view it as a
waterfall plot (Figure 46).
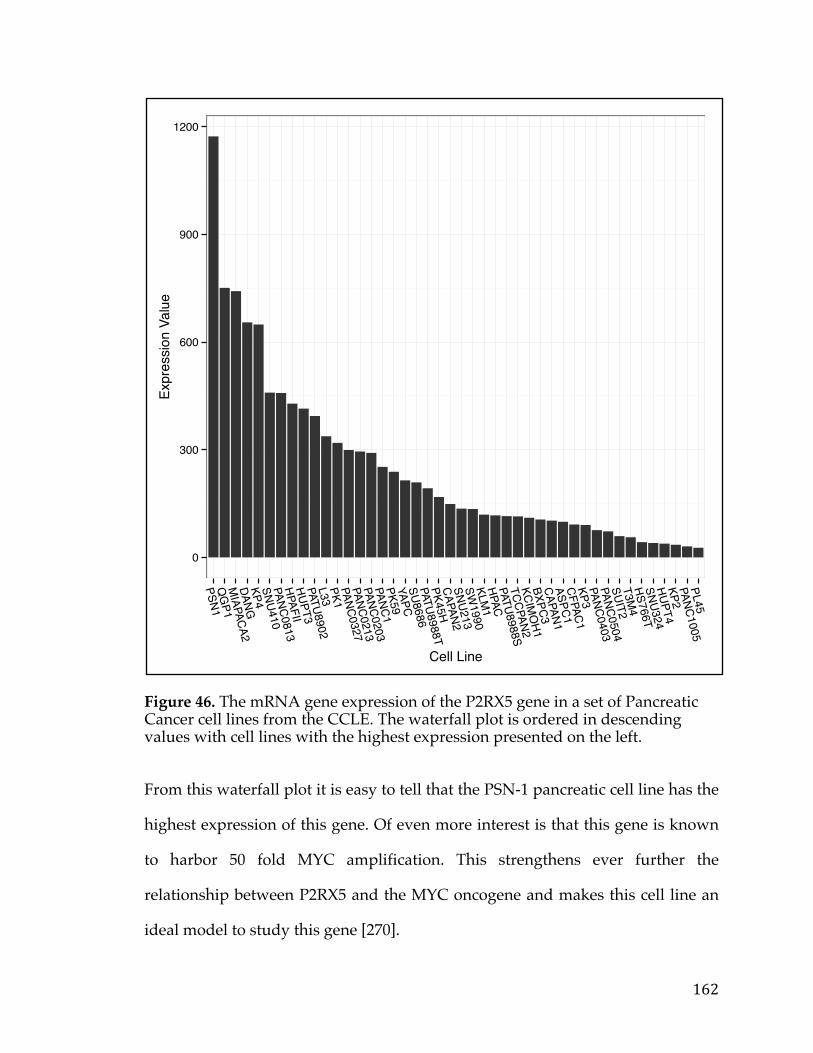
162
Figure 46. The mRNA gene expression of the P2RX5 gene in a set of Pancreatic Cancer cell lines from the CCLE. The waterfall plot is ordered in descending values with cell lines with the highest expression presented on the left.
From this waterfall plot it is easy to tell that the PSN-1 pancreatic cell line has the
highest expression of this gene. Of even more interest is that this gene is known
to harbor 50 fold MYC amplification. This strengthens ever further the
relationship between P2RX5 and the MYC oncogene and makes this cell line an
ideal model to study this gene [270].
0
300
600
900
1200
PSN1Q
GP1
MIAPACA2
DANGKP4SNU410PANC0813HPAFIIHUPT3PATU8902L33PK1PANC0327PANC0213PANC0203PANC1PK59YAPCSU8686PATU8988TPK45HCAPAN2SNU213SW
1990KLM
1HPACPATU8988STCCPAN2KCIM
OH1
BXPC3CAPAN1ASPC1CFPAC1KP3PANC0403PANC0504SUIT2T3M
4HS766TSNU324HUPT4KP2PANC1005PL45
Cell Line
Expr
essio
n Va
lue
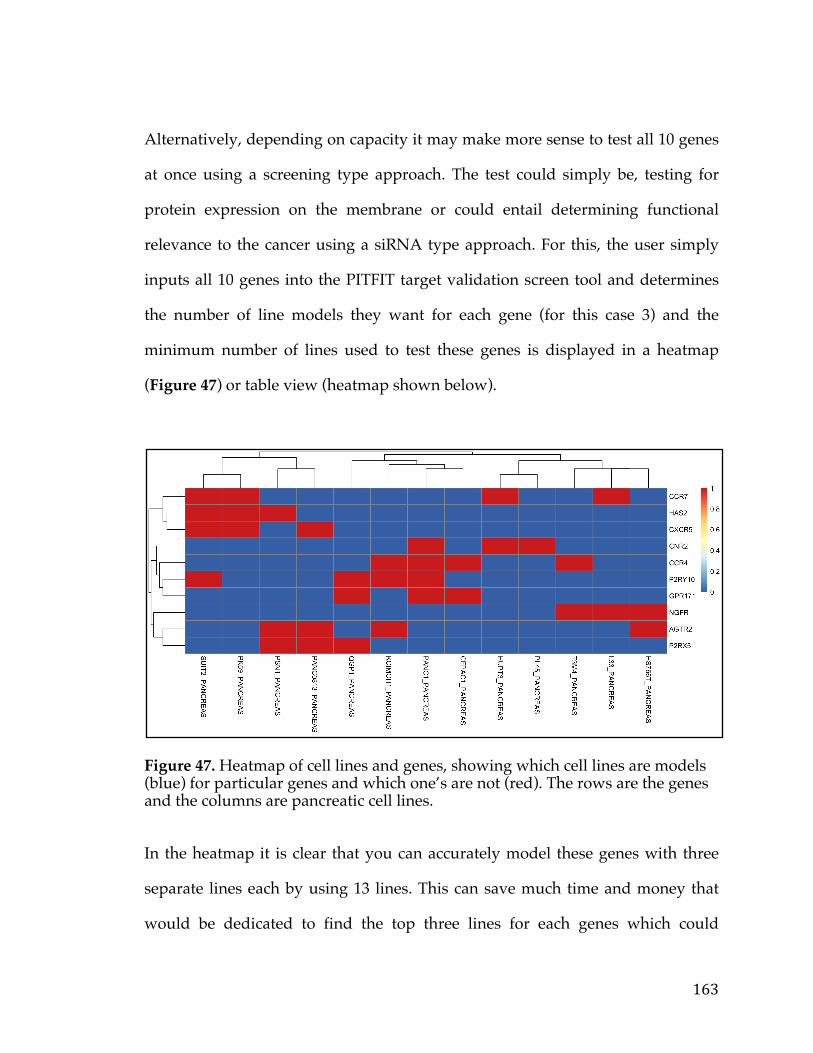
163
Alternatively, depending on capacity it may make more sense to test all 10 genes
at once using a screening type approach. The test could simply be, testing for
protein expression on the membrane or could entail determining functional
relevance to the cancer using a siRNA type approach. For this, the user simply
inputs all 10 genes into the PITFIT target validation screen tool and determines
the number of line models they want for each gene (for this case 3) and the
minimum number of lines used to test these genes is displayed in a heatmap
(Figure 47) or table view (heatmap shown below).
Figure 47. Heatmap of cell lines and genes, showing which cell lines are models (blue) for particular genes and which one’s are not (red). The rows are the genes and the columns are pancreatic cell lines.
In the heatmap it is clear that you can accurately model these genes with three
separate lines each by using 13 lines. This can save much time and money that
would be dedicated to find the top three lines for each genes which could
164
potentially end up being as much as 30 different cell lines to grow an culture.
You can also as a by product see that AGTR2 (discussed previously) is expressed
in many of the same lines as P2RX5. This ends the in silico portion of the
pancreatic cancer candidate selection process as the rest will come after multiple
rounds experimentation in cell line and animal models.
5.5 Conclusions
This project and web application helps to fill a gap currently in the cancer
translational medicine pipeline, in that it allows researchers to quickly ask
questions of cancer genomic data, prioritize their hypotheses, and develop a
validation strategy. There are a few web portals and applications that currently
allow researchers to examine genomic data but they are not tailored for oncogene
and targeted therapy discovery. Additionally, many of these applications are
fairly large with massive web frameworks and databases. In contrast the
R/Shiny framework utilized by the PITFIT application is lightweight and easy to
update with the latest data or visualizations. With the multitude of data sets
coming from sources such as the TCGA, International Cancer Genomics
Consotrium (ICGC), the TARGET program, SU2C (Stand Up 2 Cancer), and
other government and foundation based granting mechanisms it is imperative
that we can, in a quick and agile manner process, make data available, and make
decisions based on data to directly support translational efforts focused on
therapy [258, 259, 260]. In a similar vein, as software stacks and visualization
tools grow with the explosion of novel web technologies we must be able to take
165
advantage of these in order to create a sustainable up-to-date tool. Both of these
are only possible with an agile framework and flexible data model such as the
R/Shiny framework, which has also been used extensively in bioinformatics
applications [261, 262].
The key contributions of this application to the field are as follows. First, via the
PITFIT Identification tool researchers are able to identify potentially targetable
genes that are associated with oncogenic drivers. This tool can also be used by
researchers to find genes generally correlated with any gene of interest and thus
has applications beyond translational research. It provides the user with great
visualizations and statistics, with rich javascript libraries that can help to
generate hypotheses [263, 264].
Secondly, via the PITFIT prioritization tool investigators will be able to prioritize
and rank targets for a particular cancer. It should be stressed that this tool can be
used in conjunction with the PITFIT Identification tool or independently. This
modular component design allows for much greater use cases. For instance, a
user may have already arrived at large set of hypotheses to test based on a
completely independent study that is perhaps internal to their respective
institutions. They may still want to rank these so as to follow-up the hits that
have the greatest likelihood of being oncogenic or targetable. Of course, the tool
provides much information in the way of druggability and cancer association.
This tool inherently also contains a great deal of information about the gene and
thus serves as a quick way to annotate genes with functions and biological
context.
166
Finally, the PITFIT Validation tool will help researchers quickly identify models
to test their hypotheses. Using state-of-the-art algorithms accompanied by a
simple user interface and rich genomic data users will be able to identify models
or even design screens in fractions of a minutes. Overall, these three tools
together support the research and translational community as separate
components or as a pipeline for target discovery and validation.
As mentioned before the PITFIT application will be continually developed and
enhanced as new data and software packages come online. There are a few key
features that are actively in development currently to help increase the utility
and longevity of this software suite. First, users will be able to add their own
data. This involves being able to upload processed data with meta-data and
annotation in a particular format that they can use for either target identification
or prioritization. Second, the application will allow for query and filtering of data
sets to specific subsets. This will involve allowing a user to choose a set of
samples by name or via annotation regarding the samples. For instance, a user
will be able to only choose ER+ Breast Cancer samples in a particular study. This
allows for much more fine-tuned and precise hypotheses that take advantage of
the domain expertise of the user. Third, the application will provide for more
sophisticated prioritization using a reverse-causal reasoning approach. Fourth,
user and session information will be saved and an authentication system will be
provided. This will allow for users to have / store private data sets and save
certain queries or preferences for tools. Finally, a number of additional tools will
be developed and added to the software suite such as a tool to estimate a

167
targetable population of a specific therapy or one to determine association of
pathways (instead of genes) to a molecular subtype, and developing combination
therapy hypotheses to name a few. If the usage statistics are captured through
google analytics or another such program then and the utility is established with
posters and publications than efforts to identify sources of funding for this
project will ensue [265]. This will ensure that the PITFIT suite can continue to
grow with the other Cancer genomic tools to supply the research and
translational community with a solid and powerful resource.
168
Chapter 6: Conclusion
6.1 Contributions
With the multitude of data sets coming from sources such as the TCGA,
International Cancer Genomics Consotrium (ICGC), the TARGET program,
SU2C (Stand Up 2 Cancer), and other government and foundation based
granting mechanisms it is imperative that we can, in a quick and agile manner
analyze, process, make data available, and make decisions based on data to
directly support translational efforts focused on therapy [258, 259, 260]. This
body of work takes advantage of this deluge of data on many different planes.
Working at the level of individual analysis, methods evaluation, and application
development, this work embodies various aspects of the translational cancer
informatics and provides several insights and tools for the cancer translational
research community.
In the ovarian cancer survival analysis we have identified a previously unknown
marker of survival dysadherin, encoded by FXYD5, and validated its relevance
through in silico techniques and previous literature. This marker has been shown
to have predictive power both at the genomic and transcriptomic level,
increasing its utility and defining it as a primary lesion. Furthermore, the
169
oncogenic potential of dysadherin has been shown to be mediated via AKT1 and
the PIK3CA pathway, providing avenues for treatment via emerging drug
therapies in clinical trials that target this pathway. Thus, this study has offered
both a novel marker for survival in ovarian cancer and a potential therapeutic
avenue.
In the pancreatic cancer survival analysis we have developed a robust list of
pancreatic cancer associated genes and culled from that 5-gene signature which
can be used to predict tumorigenesis and survival. From our analysis we have
also isolated many genes believed to be oncogenes, some traditionally not
associated with pancreatic cancer. Finally, based on our list a number of genes
were detected as potential avenues for therapeutic development and
intervention.
In the survival analysis methods comparison publication, we have identified
optimal methods to determine gene expression markers of survival from RNA-
Sequencing data. The study additionally demonstrates how the intrinsic
molecular features of a cancer sample can have a significant effect on survival
analysis. This work has the ability to influence best practices by
bioinformaticians and data scientists in the translational cancer arena and will
hopefully increase the number of robust expression survival markers in the
literature.
Finally, the PITFIT web application helps to fill a gap currently in the cancer
translational medicine pipeline, in that it allows researchers to quickly query
170
cancer genomic data, prioritize their hypotheses, and develop a validation
strategy. There are a few web portals and applications that currently allow
researchers to examine genomic data but they are not tailored for oncogene and
targeted therapy discovery. Additionally, many of these applications are fairly
large with massive web frameworks and databases. In contrast, the R/Shiny
framework utilized by the PITFIT application is lightweight and easy to update
with the latest data or visualizations. Additionally, it provides the user with
great visualizations and statistics, using rich javascript libraries that can help to
generate, prioritize, and validate hypotheses [161, 162].
6.2 Future Work
There is still much to be understood about cancer, as well as our development of
particular strategies to combat it. While the current study has made some
contributions to the field, there are many ways to extend this work that could
have a more lasting impact. For both the ovarian cancer and pancreatic cancer
studies, wet-lab follow-up is required to more confidently assert that the findings
are relevant. A first foray into this could mean testing in relevant pre-clinical
models such as cell lines or mouse-models to assess functional dependence and
protein expression. Additionally, a more robust profiling and characterization of
the genes stemming from these analyses may help to establish their role in cancer
networks and pathways, and hence inform therapeutic development.
171
Similarly, the study evaluating methods of gene expression survival marker
discovery from RNA-Sequencing could benefit from examining more robust
methods and more sensitive approaches that may or may not be endogenous to
the cancer domain. Furthermore, we can extend this work by investigating the
problem of identifying markers of survival in the presence of very heterogeneous
cancer data. Improving these kinds of techniques will only pave the way for
more accurate cancer diagnostic tests.
Finally, the PITFIT application will also be continually developed and enhanced
as new data and software packages come online, but there are a few key features
that are actively in development. First, users will be able to add their own
processed data with meta-data and annotation in a particular format that they
can use for either target identification or prioritization. Second, the application
will allow for query and filtering of data sets to specific subset—e.g., the ability
to choose ER+ Breast Cancer samples in a particular study. Finally, the
application will provide for more sophisticated prioritization using a reverse-
causal reasoning approach and recent data mining and machine learning
advances. This will ensure that the PITFIT suite can continue to grow with the
other Cancer genomic tools to supply the research and translational community
with a solid and powerful resource.

172
References
1. Cancer.org,. "Cancer Facts & Figures 2016 | American Cancer Society". N.p., 2016. Web. 20 Feb. 2016. 2. Tomasetti, C., and B. Vogelstein. "Variation In Cancer Risk Among Tissues Can Be Explained By The Number Of Stem Cell Divisions". Science 347.6217 (2015): 78-81. 3. Edge SCompton C. The American Joint Committee on Cancer: the 7th Edition of the AJCC Cancer Staging Manual and the Future of TNM. Annals of Surgical Oncology. 2010;17(6):1471-1474. doi:10.1245/s10434-010-0985-4. 4. Gupta DLis C. Role of CA125 in predicting ovarian cancer survival - a review of the epidemiological literature. Journal of Ovarian Research. 2009;2(1):13. doi:10.1186/1757-2215-2-13. 5. Rizk N, Venkatraman E, Bains M et al. American Joint Committee on Cancer Staging System Does Not Accurately Predict Survival in Patients Receiving Multimodality Therapy for Esophageal Adenocarcinoma. Journal of Clinical Oncology. 2007;25(5):507-512. doi:10.1200/jco.2006.08.0101. 6. Iwamoto, Takuya. "Clinical Application Of Drug Delivery Systems In Cancer Chemotherapy: Review Of The Efficacy And Side Effects Of Approved Drugs". Biol. Pharm. Bull. 36.5 (2013): 715-718. 7. Mirabile, A. et al. "Pain Management In Head And Neck Cancer Patients Undergoing Chemo-Radiotherapy: Clinical Practical Recommendations". Critical Reviews in Oncology/Hematology (2015). 8. Prasad, Vinay, Tito Fojo, and Michael Brada. "Precision Oncology: Origins, Optimism, And Potential". The Lancet Oncology 17.2 (2016): e81-e86. 9. Le, Nha, Malin Sund, and Alessio Vinci. "Prognostic And Predictive Markers In Pancreatic Adenocarcinoma". Digestive and Liver Disease 48.3 (2016): 223-230. 10. Yadav, Budhi S. "Biomarkers In Triple Negative Breast Cancer: A Review". World Journal of Clinical Oncology 6.6 (2015): 252. 11. Sullivan, I., and D. Planchard. "ALK Inhibitors In Non-Small Cell Lung Cancer: The Latest Evidence And Developments". Therapeutic Advances in Medical Oncology (2015). 12 Watkins, D B, T P Hughes, and D L White. "OCT1 And Imatinib Transport In CML: Is It Clinically Relevant?". Leukemia 29.10 (2015): 1960-1969.
173
13. Gomez, Lissette, Jason R. Kovac, and Dolores J. Lamb. "CYP17A1 Inhibitors In Castration-Resistant Prostate Cancer". Steroids 95 (2015): 80-87. 14. Jackson, Sarah E., and John D. Chester. "Personalised Cancer Medicine". International Journal of Cancer 137.2 (2014): 262-266. 15. Hoelder, Swen, Paul A. Clarke, and Paul Workman. "Discovery Of Small Molecule Cancer Drugs: Successes, Challenges And Opportunities". Molecular Oncology 6.2 (2012): 155-176. 16. Hantschel, Oliver. "Unexpected Off-Targets And Paradoxical Pathway Activation By Kinase Inhibitors". ACS Chem. Biol. 10.1 (2015): 234-245. 17. Chang, Roger L. et al. "Drug Off-Target Effects Predicted Using Structural Analysis In The Context Of A Metabolic Network Model". PLoS Comput Biol 6.9 (2010): e1000938. 18. Porter, David L. et al. "Chimeric Antigen Receptor–Modified T Cells In Chronic Lymphoid Leukemia". New England Journal of Medicine 365.8 (2011): 725-733. 19. Polakis, P. "Antibody Drug Conjugates For Cancer Therapy". Pharmacological Reviews 68.1 (2015): 3-19. 20. Ferrara, Napoleone, Kenneth J. Hillan, and William Novotny. "Bevacizumab (Avastin), A Humanized Anti-VEGF Monoclonal Antibody For Cancer Therapy". Biochemical and Biophysical Research Communications 333.2 (2005): 328-335. 21. DeFrancesco, Laura. "Seattle Genetics Rare Cancer Drug Sails Through Accelerated Approval". Nat Biotechnol 29.10 (2011): 851-852. 22. Gill, S. et al. "Preclinical Targeting Of Human Acute Myeloid Leukemia And Myeloablation Using Chimeric Antigen Receptor-Modified T Cells". Blood 123.15 (2014): 2343-2354. 23.Reis-Filho, Jorge S. "Next-Generation Sequencing". Breast Cancer Research 11.Suppl 3 (2009): S12. 20 Feb. 2016. 24. Kravchenko, Julia et al. "Breast Cancer As Heterogeneous Disease: Contributing Factors And Carcinogenesis Mechanisms". Breast Cancer Res Treat 128.2 (2011): 483-493. 25. Shah, R. B. "Androgen-Independent Prostate Cancer Is A Heterogeneous Group Of Diseases: Lessons From A Rapid Autopsy Program". Cancer Research 64.24 (2004): 9209-9216. 26. Chang, Kyle et al. "The Cancer Genome Atlas Pan-Cancer Analysis Project". Nature Genetics 45.10 (2013): 1113-1120. 20 Feb. 2016.

174
27. Diamandis E. Cancer Biomarkers: Can We Turn Recent Failures into Success? JNCI Journal of the National Cancer Institute. 2010;102(19):1462-1467. doi:10.1093/jnci/djq306. 28. Barretina, Jordi et al. "The Cancer Cell Line Encyclopedia Enables Predictive Modelling Of Anticancer Drug Sensitivity". Nature 483.7391 (2012): 603-307. 29. Pecan.stjude.org,. "St. Jude Pecan Data Portal". N.p., 2016. Web. 21 Feb. 2016. 30. Tumorportal.org,. "Tumorportal". N.p., 2016. Web. 21 Feb. 2016. 31. Ocg.cancer.gov,. "Cancer Target Discovery And Development | Office Of Cancer Genomics". N.p., 2016. Web. 21 Feb. 2016. 32. Baldwin L, Ware R, Huang B et al. Ten-year relative survival for epithelial ovarian cancer. Gynecologic Oncology. 2011;120:S34-S35. doi:10.1016/j.ygyno.2010.12.085. 33. McCluggage W. Morphological subtypes of ovarian carcinoma. Pathology. 2011;43(5):420-432. doi:10.1097/pat.0b013e328348a6e7.
34. Bolton K, Ganda C, Berchuck A, Pharaoh P, Gayther S. Role of common genetic variants in ovarian cancer susceptibility and outcome: progress to date from the ovarian cancer association consortium (OCAC). Journal of Internal Medicine. 2012;271(4):366-378. doi:10.1111/j.1365-2796.2011.02509.x.
35. Van Nieuwenhuysen E, Lambrechts S, Lambrechts D, Leunen K, Amant F, Vergote I. Genetic changes in nonepithelial ovarian cancer. Expert Review of Anticancer Therapy. 2013;13(7):871-882. doi:10.1586/14737140.2013.811174.
36. Braem M, Schouten L, Peeters P, den Brandt P, Onland-Moret N. Genetic susceptibility to sporadic ovarian cancer: A systematic review. Biochimica et Biophysica Acta (BBA) - Reviews on Cancer. 2011;1816(2):132-146. doi:10.1016/j.bbcan.2011.05.002.
37. Bell D, Chin L, Carter H et al. Integrated genomic analyses of ovarian carcinoma. Nature. 2011;474(7353):609-615. doi:10.1038/nature10166.
38. Ino Y, Gotoh M, Sakamoto M, Tsukagoshi K, Hirohashi S. Dysadherin, a cancer-associated cell membrane glycoprotein, down-regulates E-cadherin and promotes metastasis. Proceedings of the National Academy of Sciences. 2001;99(1):365-370. doi:10.1073/pnas.012425299.
39. Sung C, Song I, Sohn I. A distinctive ovarian cancer molecular subgroup characterized by poor prognosis and somatic focal copy number amplifications at chromosome 19. Gynecologic Oncology. 2014;132(2):343-350. doi:10.1016/j.ygyno.2013.11.036.
40. Barrett T, Troup D, Wilhite S et al. NCBI GEO: archive for functional
175
genomics data sets--10 years on. Nucleic Acids Research. 2010;39(Database):D1005-D1010. doi:10.1093/nar/gkq1184.
41. Barrett T, Wilhite S, Ledoux P et al. NCBI GEO: archive for functional genomics data sets--update. Nucleic Acids Research. 2012;41(D1):D991-D995. doi:10.1093/nar/gks1193.
42. Barretina J, Caponigro G, Stransky N et al. The Cancer Cell Line Encyclopedia enables predictive modelling of anticancer drug sensitivity. Nature. 2012;483(7391):603-307. doi:10.1038/nature11003.
43. Lee Y, Lee S, Park J et al. Dysadherin expression promotes the motility and survival of human breast cancer cells by AKT activation. Cancer Science. 2012;103(7):1280-1289. doi:10.1111/j.1349-7006.2012.02302.x.
44. Tamborero D, Gonzalez-Perez A, Perez-Llamas C et al. Comprehensive identification of mutational cancer driver genes across 12 tumor types. Sci Rep. 2013;3. doi:10.1038/srep02650.
45. Akinleye A, Avvaru P, Furqan M, Song Y, Liu D. Phosphatidylinositol 3-kinase (PI3K) inhibitors as cancer therapeutics. Journal of Hematology & Oncology. 2013;6(1):88. doi:10.1186/1756-8722-6-88.
46. Ponten F, Jirström K, Uhlen M. The Human Protein Atlas-a tool for pathology. J Pathol. 2008;216(4):387-393. doi:10.1002/path.2440.
47. Miller T, Davis P. S163 is critical for FXYD5 modulation of wound healing in airway epithelial cells. Wound Repair and Regeneration. 2008;16(6):791-799. doi:10.1111/j.1524-475x.2008.00432.x.
48. Colamaio M, Cali G, Sarnataro D et al. Let-7a Down-Regulation Plays a Role in Thyroid Neoplasias of Follicular Histotype Affecting Cell Adhesion and Migration through Its Ability to Target the FXYD5 (Dysadherin) Gene. The Journal of Clinical Endocrinology & Metabolism. 2012;97(11):E2168-E2178. doi:10.1210/jc.2012-1929.
49. Lee Y, Lee S, Park J et al. Dysadherin expression promotes the motility and survival of human breast cancer cells by AKT activation. Cancer Science. 2012;103(7):1280-1289. doi:10.1111/j.1349-7006.2012.02302.x.
50. Schuler Y, Lee-Thedieck C, Geiger K et al. Osteoblast-secreted factors enhance the expression of dysadherin and CCL2-dependent migration of renal carcinoma cells. International Journal of Cancer. 2011;130(2):288-299. doi:10.1002/ijc.25981.
51. Subramaniam M, Navarro S, Llombart-Bosch A. Immunohistochemical Study of Correlation Between Histologic Subtype and Expression of Epithelial-Mesenchymal Transition-Related Proteins in Synovial Sarcomas. Archives of Pathology & Laboratory Medicine. 2011;135(8):1001-1009. doi:10.5858/2010-0071-oar1.
52. Park J, Kim R, Lee Y et al. Dysadherin can enhance tumorigenesis by

176
conferring properties of stem-like cells to hepatocellular carcinoma cells. Journal of Hepatology. 2011;54(1):122-131. doi:10.1016/j.jhep.2010.06.026.
53. Maehata Y, Hirahashi M, Aishima S et al. Significance of dysadherin and E-cadherin expression in differentiated-type gastric carcinoma with submucosal invasion. Human Pathology. 2011;42(4):558-567. doi:10.1016/j.humpath.2010.08.016.
54. Liang J, Zheng H, Xiao H, Li N, Cheng C, Wang H. Dysadherin expression in gastrointestinal stromal tumors (GISTs). Pathology - Research and Practice. 2009;205(7):445-450. doi:10.1016/j.prp.2008.12.020.
55. Ochiai H, Nakanishi Y, Fukasawa Y et al. A New Formula for Predicting Liver Metastasis in Patients with Colorectal Cancer: Immunohistochemical Analysis of a Large Series of 439 Surgically Resected Cases. Oncology. 2008;75(1-2):32-41. doi:10.1159/000151667.
56. Batistatou A, Charalabopoulos A, Scopa C et al. Expression patterns of dysadherin and E-cadherin in lymph node metastases of colorectal carcinoma. Virchows Archiv. 2006;448(6):763-767. doi:10.1007/s00428-006-0183-8.
57. Kyzas P, Stefanou D, Batistatou A et al. Dysadherin Expression in Head and Neck Squamous Cell Carcinoma. The American Journal of Surgical Pathology. 2006;30(2):185-193. doi:10.1097/01.pas.0000178090.54147.f8.
58. Batistatou A, Scopa C, Ravazoula P et al. Involvement of dysadherin and E-cadherin in the development of testicular tumours. Br J Cancer. 2005;93(12):1382-1387. doi:10.1038/sj.bjc.6602880.
59. Tamura M, Ohta Y, Tsunezuka Y et al. Prognostic significance of dysadherin expression in patients with non–small cell lung cancer. The Journal of Thoracic and Cardiovascular Surgery. 2005;130(3):740-745. doi:10.1016/j.jtcvs.2004.12.051.
60. Nishizawa A, Nakanishi Y, Yoshimura K et al. Clinicopathologic significance of dysadherin expression in cutaneous malignant melanoma. Cancer. 2005;103(8):1693-1700. doi:10.1002/cncr.20984.
61. Wu D, Qiao Y, Kristensen G et al. Prognostic significance of dysadherin expression in cervical squamous cell carcinoma. Pathology & Oncology Research. 2004;10(4):212-218. doi:10.1007/bf03033763.
62. Wu D, Qiao Y, Kristensen G et al. Comparison of the Dysadherin and E-cadherin expression in primary lung cancer and metstatic sites. Histol Histopathol. 2010;10(4):212-218
63. Nakanishi Y, Akimoto S, Sato Y, Kanai Y, Sakamoto M, Hirohashi S. Prognostic Significance of Dysadherin Expression in Tongue Cancer: Immunohistochemical Analysis of 91 Cases. Applied Immunohistochemistry & Molecular Morphology. 2004;12(4):323-328. doi:10.1097/00129039-200412000-00006.
64. Shimada Y, Hashimoto Y, Kan T et al. Prognostic Significance of Dysadherin
177
Expression in Esophageal Squamous Cell Carcinoma. Oncology. 2004;67(1):73-80. doi:10.1159/000080289.
65. Shimada Y. Clinical Significance of Dysadherin Expression in Gastric Cancer Patients. Clinical Cancer Research. 2004;10(8):2818-2823. doi:10.1158/1078-0432.ccr-0633-03.
66. Sato H, Ino Y, Miura A et al. Dysadherin: Expression and Clinical Significance in Thyroid Carcinoma. The Journal of Clinical Endocrinology & Metabolism. 2003;88(9):4407-4412. doi:10.1210/jc.2002-021757.
67. Shimamura T. Dysadherin Overexpression in Pancreatic Ductal Adenocarcinoma Reflects Tumor Aggressiveness: Relationship to E-Cadherin Expression. Journal of Clinical Oncology. 2003;21(4):659-667. doi:10.1200/jco.2003.06.179.
68. Ino Y, Gotoh M, Sakamoto M, Tsukagoshi K, Hirohashi S. Dysadherin, a cancer-associated cell membrane glycoprotein, down-regulates E-cadherin and promotes metastasis. Proceedings of the National Academy of Sciences. 2001;99(1):365-370. doi:10.1073/pnas.012425299
69. Rahib L, Smith B, Aizenberg R, Rosenzweig A, Fleshman J et al. (2014) Projecting Cancer Incidence and Deaths to 2030: The Unexpected Burden of Thyroid, Liver, and Pancreas Cancers in the United States. Cancer Research 74: 2913-2921. doi:10.1158/0008-5472.can-14-0155. 70. He J, Ahuja N, Makary M, Cameron J, Eckhauser F et al. (2014) 2564 resected periampullary adenocarcinomas at a single institution: trends over three decades. HPB 16: 83-90. doi:10.1111/hpb.12078. 71. Prognosis of Pancreatic Cancer-Pancreatic Cancer (2016). Pancreaticorg. Available: http://www.pancreatic.org/site/c.htJYJ8MPIwE/b.891917/k.5123/Prognosis_of_Pancreatic_Cancer.htm. Accessed 30 May 2016. 72. Newhook T, Blais E, Lindberg J, Adair S, Xin W et al. (2014) A Thirteen-Gene Expression Signature Predicts Survival of Patients with Pancreatic Cancer and Identifies New Genes of Interest. PLoS ONE 9: e105631. doi:10.1371/journal.pone.0105631. 73. Pancreatic cancer (2016). Nat Rev Dis Primers 2: 16023. doi:10.1038/nrdp.2016.23. 74. Bailey P, Chang D, Nones K, Johns A, Patch A et al. (2016) Genomic analyses identify molecular subtypes of pancreatic cancer. Nature 531: 47-52. doi:10.1038/nature16965. 75. Garrido-Laguna IHidalgo M (2015) Pancreatic cancer: from state-of-the-art treatments to promising novel therapies. Nature Reviews Clinical Oncology 12: 319-334. doi:10.1038/nrclinonc.2015.53.
178
76. Maddipati R, Stanger B. Pancreatic Cancer Metastases Harbor Evidence of Polyclonality. Cancer Discovery. 2015;5(10):1086-1097. doi:10.1158/2159-8290.cd-15-0120. 77. Zhang G, Schetter A, He P et al. DPEP1 Inhibits Tumor Cell Invasiveness, Enhances Chemosensitivity and Predicts Clinical Outcome in Pancreatic Ductal Adenocarcinoma. PLoS ONE. 2012;7(2):e31507. doi:10.1371/journal.pone.0031507. 78. Zhang J, Baran J, Cros A et al. International Cancer Genome Consortium Data Portal--a one-stop shop for cancer genomics data. Database. 2011;2011(0):bar026-bar026. doi:10.1093/database/bar026. 79. Chen D, Davis-Yadley A, Huang P et al. Prognostic Fifteen-Gene Signature for Early Stage Pancreatic Ductal Adenocarcinoma. PLOS ONE. 2015;10(8):e0133562. doi:10.1371/journal.pone.0133562. 80. Moffitt R, Marayati R, Flate E et al. Virtual microdissection identifies distinct tumor- and stroma-specific subtypes of pancreatic ductal adenocarcinoma. Nature Genetics. 2015;47(10):1168-1178. doi:10.1038/ng.3398. 81. Lonsdale J, Thomas J, Salvatore M et al. The Genotype-Tissue Expression (GTEx) project. Nature Genetics. 2013;45(6):580-585. doi:10.1038/ng.2653. 82. Davis SMeltzer P. GEOquery: a bridge between the Gene Expression Omnibus (GEO) and BioConductor. Bioinformatics. 2007;23(14):1846-1847. doi:10.1093/bioinformatics/btm254. 83. Law C, Chen Y, Shi W, Smyth G. voom: precision weights unlock linear model analysis tools for RNA-seq read counts. Genome Biol. 2014;15(2):R29. doi:10.1186/gb-2014-15-2-r29. 84. Subramanian A, Tamayo P, Mootha V et al. Gene set enrichment analysis: A knowledge-based approach for interpreting genome-wide expression profiles. Proceedings of the National Academy of Sciences. 2005;102(43):15545-15550. doi:10.1073/pnas.0506580102. 85. Griffith M, Griffith O, Coffman A et al. DGIdb: mining the druggable genome. Nature Methods. 2013;10(12):1209-1210. doi:10.1038/nmeth.2689. 86. Binder J, Pletscher-Frankild S, Tsafou K et al. COMPARTMENTS: unification and visualization of protein subcellular localization evidence. Database. 2014;2014(0):bau012-bau012. doi:10.1093/database/bau012. 87. Wickham H. ggplot2. WIREs Comp Stat. 2011;3(2):180-185. doi:10.1002/wics.147.

179
88. Chen HBoutros P. VennDiagram: a package for the generation of highly-customizable Venn and Euler diagrams in R. BMC Bioinformatics. 2011;12(1):35. doi:10.1186/1471-2105-12-35. 89. Wasif N, Ko C, Farrell J et al. Impact of Tumor Grade on Prognosis in Pancreatic Cancer: Should We Include Grade in AJCC Staging?. Annals of Surgical Oncology. 2010;17(9):2312-2320. doi:10.1245/s10434-010-1071-7. 90. Nones K, Waddell N, Song S, Patch A, Miller D et al. (2014) Genome-wide DNA methylation patterns in pancreatic ductal adenocarcinoma reveal epigenetic deregulation of SLIT-ROBO, ITGA2 and MET signaling. International Journal of Cancer 135: 1110-1118. doi:10.1002/ijc.28765. 91. Liang J, Wang H, Rashid A, Tan T, Hwang R et al. (2008) Expression of MAP4K4 Is Associated with Worse Prognosis in Patients with Stage II Pancreatic Ductal Adenocarcinoma. Clinical Cancer Research 14: 7043-7049. doi:10.1158/1078-0432.ccr-08-0381. 92. Forbes S, Beare D, Gunasekaran P et al. COSMIC: exploring the world's knowledge of somatic mutations in human cancer. Nucleic Acids Research. 2014;43(D1):D805-D811. doi:10.1093/nar/gku1075. 93. Polvani S. Peroxisome proliferator activated receptors at the crossroad of obesity, diabetes, and pancreatic cancer. World Journal of Gastroenterology. 2016;22(8):2441. doi:10.3748/wjg.v22.i8.2441. 94. Gordon-Weeks A, Jones K, Harriss E, Smith A, Silva M. Systematic Review and Meta-analysis of Current Experience in Treating IPNB. Annals of Surgery. 2016;263(4):656-663. doi:10.1097/sla.0000000000001426. 95. Garcia-Carracedo D, Yu C, Akhavan N et al. Smad4 Loss Synergizes with TGFα Overexpression in Promoting Pancreatic Metaplasia, PanIN Development, and Fibrosis. PLOS ONE. 2015;10(3):e0120851. doi:10.1371/journal.pone.0120851. 96. Xie DXie K. Pancreatic cancer stromal biology and therapy. Genes & Diseases. 2015;2(2):133-143. doi:10.1016/j.gendis.2015.01.002. 97. Cortez E, Gladh H, Braun S et al. Functional malignant cell heterogeneity in pancreatic neuroendocrine tumors revealed by targeting of PDGF-DD. Proceedings of the National Academy of Sciences. 2016;113(7):E864-E873. doi:10.1073/pnas.1509384113. 98. Tezel E, Kawase Y, Takeda S, Oshima K, Nakao A. Expression of Neural Cell Adhesion Molecule in Pancreatic Cancer. Pancreas. 2001;22(2):122-125. doi:10.1097/00006676-200103000-00003. 99. Lange F, Rateitschak K, Fitzner B, Pöhland R, Wolkenhauer O, Jaster R. Studies on mechanisms of interferon-gamma action in pancreatic cancer using a
180
data-driven and model-based approach. Molecular Cancer. 2011;10(1):13. doi:10.1186/1476-4598-10-13. 100. Haider S, Wang J, Nagano A et al. A multi-gene signature predicts outcome in patients with pancreatic ductal adenocarcinoma. Genome Medicine. 2014;6(12). doi:10.1186/s13073-014-0105-3. 101. Craven K, Gore J, Wilson J, Korc M. Angiogenic gene signature in human pancreatic cancer correlates with TGF-beta and inflammatory transcriptomes. Oncotarget. 2010;1(1):323-341. doi:10.18632/oncotarget.6345. 102. Xu M, Qi F, Zhang S et al. Adrenomedullin promotes the growth of pancreatic ductal adenocarcinoma through recruitment of myelomonocytic cells. Oncotarget. 2014. doi:10.18632/oncotarget.10393. 103. Wang W, Hsu C, Wang T et al. A Gene Expression Signature of Epithelial Tubulogenesis and a Role for ASPM in Pancreatic Tumor Progression. Gastroenterology. 2013;145(5):1110-1120. doi:10.1053/j.gastro.2013.07.040. 104. Thurlings I, Martínez-López L, Westendorp B et al. Synergistic functions of E2F7 and E2F8 are critical to suppress stress-induced skin cancer. Oncogene. 2016. doi:10.1038/onc.2016.251. 105. Holloway K, Sinha V, Bu W et al. Targeting Oncogenes into a Defined Subset of Mammary Cells Demonstrates That the Initiating Oncogenic Mutation Defines the Resulting Tumor Phenotype. Int J Biol Sci. 2016;12(4):381-388. doi:10.7150/ijbs.12947. 106. Cheng S, Feng H, Lopez G et al. EGFR phosphorylation of DCBLD2 recruits TRAF6 and stimulates AKT-promoted tumorigenesis. Neuro-Oncology. 2014;16(suppl 3):iii16-iii17. doi:10.1093/neuonc/nou206.60. 107. Lin F, Kuo H, Ying H, Yang F, Lin K. Induction of Apoptosis in Plasma Cells by B Lymphocyte Induced Maturation Protein-1 Knockdown. Cancer Research. 2007;67(24):11914-11923. doi:10.1158/0008-5472.can-07-1868. 108. Knies N, Alankus B, Weilemann A et al. Lymphomagenic CARD11/BCL10/MALT1 signaling drives malignant B-cell proliferation via cooperative NF-κB and JNK activation. Proceedings of the National Academy of Sciences. 2015;112(52):E7230-E7238. doi:10.1073/pnas.1507459112. 109. Gebauer F, Wicklein D, Horst J et al. Carcinoembryonic Antigen-Related Cell Adhesion Molecules (CEACAM) 1, 5 and 6 as Biomarkers in Pancreatic Cancer. PLoS ONE. 2014;9(11):e113023. doi:10.1371/journal.pone.0113023. 110. Hong K, Shin M, Yoon S et al. Therapeutic effect of anti CEACAM6 monoclonal antibody against lung adenoc3arcinoma by enhancing anoikis sensitivity. Biomaterials. 2015;67:32-41. doi:10.1016/j.biomaterials.2015.07.012.

181
111. Chang K, Creighton C, Davis C, Donehower L, Drummond J, Wheeler D, et al. The Cancer Genome Atlas Pan-Cancer analysis project. Nature Genetics. 2013;45(10):1113-1120. 112. The International Genomics Consortium. http://www.intgen.org/research-services/biobanking-experience/expo/. Accessed 25 Dec 2015. 113. Samkari A, White J, Packer R. SHH inhibitors for the treatment of medulloblastoma. Expert Review of Neurotherapeutics. 2015;15(7):763-770. 114. Crabbe D, Peters J, Seeger R. Rapid Detection of MYCN Gene Amplification in Neuroblastomas Using the Polymerase Chain Reaction. Diagnostic Molecular Pathology. 1992;1(1):229-234. 115. Riely G, Marks J, Pao W. KRAS Mutations in Non-Small Cell Lung Cancer. Proceedings of the American Thoracic Society. 2009;6(2):201-205. 116. Cantwell-Dorris E, O'Leary J, Sheils O. BRAFV600E: Implications for Carcinogenesis and Molecular Therapy. Molecular Cancer Therapeutics. 2011;10(3):385-394. 117. An X, Tiwari A, Sun Y, Ding P, Ashby C, Chen Z. BCR-ABL tyrosine kinase inhibitors in the treatment of Philadelphia chromosome positive chronic myeloid leukemia: A review. Leukemia Research. 2010;34(10):1255-1268. 118. Cutoff Finder. http://molpath.charite.de/cutoff. Accessed 25 Dec 2015 119. Rao M, Klein J, Moeschberger M. Survival Analysis Techniques for Censored and Truncated Data. Technometrics. 1998;40:159. 120. Osthus A, Aarstad A, Olofsson J, Aarstad H. Head and neck specific Health Related Quality of Life scores predict subsequent survival in successfully treated head and neck cancer patients: A prospective cohort study. Oral Oncology. 2011;47:974-979. 121. Cole B, Gelber R, Goldhirsch A. Cox regression models for quality adjusted survival analysis. Statist Med. 1993;12:975-987. 122. Contal CO'Quigley J. An application of changepoint methods in studying the effect of age on survival in breast cancer. Computational Statistics & Data Analysis. 1999;30:253-270. 123. Broad GDAC FIREHOSE. http://gdac.broadinstitute.org/. Accessed 25 Dec 2015 124. Culhane A, Schroder M, Sultana R et al. GeneSigDB: a manually curated database and resource for analysis of gene expression signatures. Nucleic Acids Research. 2011;40(D1):D1060-D1066.

182
125. Spentzos D. Gene Expression Signature With Independent Prognostic Significance in Epithelial Ovarian Cancer. Journal of Clinical Oncology. 2004;22(23):4700-4710. 126. Zhao H, Ljungberg B, Grankvist K, Rasmuson T, Tibshirani R, Brooks J. Gene Expression Profiling Predicts Survival in Conventional Renal Cell Carcinoma. PLoS Med. 2005;3(1):e13. 127. Chung C. Gene Expression Profiles Identify Epithelial-to-Mesenchymal Transition and Activation of Nuclear Factor- B Signaling as Characteristics of a High-risk Head and Neck Squamous Cell Carcinoma. Cancer Research. 2006;66(16):8210-8218. 128. Henshall SM, Afar DE, Hiller J et al. Survival analysis of genome-wide gene expression profiles of prostate cancers identifies new prognostic targets of disease relapse. Cancer Research. 2003;63(14):4196-20. 129. Benidt S, Nettleton D. SimSeq: a nonparametric approach to simulation of RNA-sequence datasets. Bioinformatics. 2015;31(13):2131-2140. 130. Zhang J, Baran J, Cros A, Guberman J, Haider S, Hsu J et al. International Cancer Genome Consortium Data Portal--a one-stop shop for cancer genomics data. Database. 2011;2011:bar026-bar026. 131. The Bimodality Index: A Criterion for Discovering and Ranking Bimodal Signatures from Cancer Gene Expression Profiling Data. Libertas Academica; 2009. 132. Shapiro SWilk M. An Analysis of Variance Test for Normality (Complete Samples). Biometrika. 1965;52:591. 133. Smirnov N. Table for Estimating the Goodness of Fit of Empirical Distributions. Ann Math Statist. 1948;19:279-281. 134. Lilliefors H. On the Kolmogorov-Smirnov Test for Normality with Mean and Variance Unknown. Journal of the American Statistical Association. 1967;62:399-402. 135. Wilkinson L. ggplot2: Elegant Graphics for Data Analysis by Wickham, H. Biometrics. 2011;67:678-679. 136. Voelkerding, K. V., S. A. Dames, and J. D. Durtschi. "Next-Generation Sequencing: From Basic Research To Diagnostics". Clinical Chemistry 55.4 (2009): 641-658. 137. Asatryan, Ani D., and Natalia L. Komarova. "Evolution Of Genetic Instability In Heterogeneous Tumors". Journal of Theoretical Biology (2016). 138. Genome.gov,. "Human Genome Project Completion: Frequently Asked Questions". N.p., 2016. Web. 21 Feb. 2016.
183
139. Mutvei, Anders Peter, Erik Fredlund, and Urban Lendahl. "Frequency And Distribution Of Notch Mutations In Tumor Cell Lines". BMC Cancer 15.1 (2015). 140. Abraham, Jame. "Vemurafenib In Melanoma With The BRAF V600E Mutation". Community Oncology 9.3 (2012): 85-86. 141. Eberlein, T.J. "Improved Survival With Vemurafenib In Melanoma With BRAF V600E Mutation". Yearbook of Surgery 2012 (2012): 353-356. 142. Halaban, Ruth et al. "PLX4032, A Selective BRAFV600E Kinase Inhibitor, Activates The ERK Pathway And Enhances Cell Migration And Proliferation Of BRAFWT Melanoma Cells". Pigment Cell & Melanoma Research 23.2 (2010): 190-200. 143. Aina, Olulanu H. et al. "Therapeutic Cancer Targeting Peptides". Biopolymers 66.3 (2002): 184-199. 144. Gdac.broadinstitute.org,. "Broad GDAC Firehose". N.p., 2016. Web. 21 Feb. 2016. 145. Zhu, Yitan, Peng Qiu, and Yuan Ji. "TCGA-Assembler: Open-Source Software For Retrieving And Processing TCGA Data". Nature Methods 11.6 (2014): 599-600. 146. Colaprico, Antonio et al. "Tcgabiolinks : An R/Bioconductor Package For Integrative Analysis Of TCGA Data". Nucleic Acids Res (2015): gkv1507. 147. Ats.ucla.edu,. "R FAQ: The Very Basics Of R". N.p., 2016. 21 Feb. 2016. 148. Ritchie, M. E. et al. "Limma Powers Differential Expression Analyses For RNA-Sequencing And Microarray Studies". Nucleic Acids Research 43.7 (2015): e47-e47. 149. Bioconductor.org,. "Bioconductor - Home". N.p., 2016. Web. 21 Feb. 2016. 150. Efron, Bradley, and Robert Tibshirani. "Empirical Bayes Methods And False Discovery Rates For Microarrays". Genetic Epidemiology 23.1 (2002): 70-86. 151. Guo, et al. "Rnaseqps: A Web Tool For Estimating Sample Size And Power For Rnaseq Experiment". CIN (2014): 1. 152. Law, Charity W et al. "Voom: Precision Weights Unlock Linear Model Analysis Tools For RNA-Seq Read Counts". Genome Biol 15.2 (2014): R29. 153. Bauer, Denis, and Denis Bauer. "Variant Calling Comparison CASAVA1.8 And GATK". Nature Precedings (2011).

184
154. Yekutieli, Daniel, and Yoav Benjamini. "Resampling-Based False Discovery Rate Controlling Multiple Test Procedures For Correlated Test Statistics". Journal of Statistical Planning and Inference 82.1-2 (1999): 171-196. 155. Benjamini, Yoav, and Wei Liu. "A Step-Down Multiple Hypotheses Testing Procedure That Controls The False Discovery Rate Under Independence". Journal of Statistical Planning and Inference 82.1-2 (1999): 163-170. 156. Al-Hawary, Mahmoud M., and Isaac R. Francis. "Pancreatic Ductal Adenocarcinoma Staging". Cancer Imaging 13.3 (2013): 360-364. 157. McIntyre, Caitlin A., and Jordan M. Winter. "Diagnostic Evaluation And Staging Of Pancreatic Ductal Adenocarcinoma". Seminars in Oncology 42.1 (2015): 19-27. 158. Cancer Research UK,. "Pancreatic Cancer Mortality Statistics". N.p., 2015. Web. 21 Feb. 2016. 159. Ahlgren, James D. "Genetics Of Pancreatic Cancer". Cancer Investigation 19.1 (2001): 98-99. 160. Saiki, Yuriko, and Akira Horii. "Molecular Pathology Of Pancreatic Cancer". Pathology International 64.1 (2014): 10-19. 161. Winter, Jordan M., Anirban Maitra, and Charles J. Yeo. "Genetics And Pathology Of Pancreatic Cancer". HPB 8.5 (2006): 324-336. 162. Okada, Masashi et al. "Targeting The K-Ras - JNK Axis Eliminates Cancer Stem-Like Cells And Prevents Pancreatic Tumor Formation". Oncotarget 5.13 (2014): 5100-5112. 163. Onishi, Hideya. "Hedgehog Signaling Pathway As A New Therapeutic Target In Pancreatic Cancer". World Journal of Gastroenterology 20.9 (2014): 2335. 164. Kinkel, Mary, and Victoria Prince. "Canonical Wnt Signaling Is Required To Pattern The Pancreatic Endoderm". Developmental Biology 356.1 (2011): 169. 165. Stellas, D. et al. "Therapeutic Effects Of An Anti-Myc Drug On Mouse Pancreatic Cancer". JNCI Journal of the National Cancer Institute 106.12 (2014): dju320-dju320. 166. Gyorffy, B., and R. Schafer. "Biomarkers Downstream Of RAS: A Search For Robust Transcriptional Targets". Current Cancer Drug Targets 10.8 (2010): 858-868. 167. Rajalingam, Krishnaraj et al. "Ras Oncogenes And Their Downstream Targets". Biochimica et Biophysica Acta (BBA) - Molecular Cell Research 1773.8 (2007): 1177-1195.

185
168. Soucek, L. et al. "Inhibition Of Myc Family Proteins Eradicates Kras-Driven Lung Cancer In Mice". Genes & Development 27.5 (2013): 504-513. 169. Collins, Francis S. "No Longer Just Looking Under The Lamppost* *Previously Presented At The Annual Meeting Of The American Society Of Human Genetics, In Salt Lake City, On October 28, 2005.". The American Journal of Human Genetics 79.3 (2006): 421-426. 170. Cande, Jessica et al. "Looking Under The Lamp Post: Neither Fruitless Nor Doublesex Has Evolved To Generate Divergent Male Courtship In Drosophila". Cell Reports 8.2 (2014): 363-370. 171. Zhang, Lei, Ke Hu, and Yi Tang. "Predicting Disease-Related Genes By Topological Similarity In Human Protein-Protein Interaction Network". Open Physics 8.4 (2010). 172. Chen, Yi-An, Lokesh P. Tripathi, and Kenji Mizuguchi. "Targetmine, An Integrated Data Warehouse For Candidate Gene Prioritisation And Target Discovery". PLoS ONE 6.3 (2011): e17844. 173. "Kohno, Michiaki, Susumu Tanimura, and Kei-ichi Ozaki. "Targeting The Extracellular Signal-Regulated Kinase Pathway In Cancer Therapy". Biol. Pharm. Bull. 34.12 (2011): 1781-1784. 174. Skogseth, Haakon, Kare E. Tvedt, and Jostein Halgunset. "Inhibitors Of Tyrosine Kinases (TKI) And Small Interfering Rnas (Sirna) Are Promising Targeted Cancer Treatments". J Carcinogene Mutagene 02.04 (2011). 175. Takeuchi, Kenji, and Fumiaki Ito. "Receptor Tyrosine Kinases And Targeted Cancer Therapeutics". Biol. Pharm. Bull. 34.12 (2011): 1774-1780. 176. Gu, T.-L. "NPM-ALK Fusion Kinase Of Anaplastic Large-Cell Lymphoma Regulates Survival And Proliferative Signaling Through Modulation Of Foxo3a". Blood 103.12 (2004): 4622-4629. 177. Greenland, C. "Anaplastic Large Cell Lymphoma With The T(2;5)(P23;Q35) NPM/ALK Chromosomal Translocation And Duplication Of The Short Arm Of The Non-Translocated Chromosome 2 Involving The Full Length Of The ALK Gene". Journal of Clinical Pathology 54.2 (2001): 152-154. 178. Gandhi, L., and P. A. Janne. "Crizotinib For ALK-Rearranged Non-Small Cell Lung Cancer: A New Targeted Therapy For A New Target". Clinical Cancer Research 18.14 (2012): 3737-3742. 179. Jaffe, R. "The Ews/Fli-1 Fusion Gene Switches The Differentiation Program Of Neuroblastomas To Ewing Sarcoma/Peripheral Primitive Neuroectodermal Tumors". Yearbook of Pathology and Laboratory Medicine 2006 (2006): 221-222.

186
180. May, W A et al. "The Ewing's Sarcoma EWS/FLI-1 Fusion Gene Encodes A More Potent Transcriptional Activator And Is A More Powerful Transforming Gene Than FLI-1.". Molecular and Cellular Biology 13.12 (1993): 7393-7398. 181. "Belyanskaya, L. L. "Exposure On Cell Surface And Extensive Arginine Methylation Of Ewing Sarcoma (EWS) Protein". Journal of Biological Chemistry 276.22 (2001): 18681-18687. 182. Markant, S. L. et al. "Targeting Sonic Hedgehog-Associated Medulloblastoma Through Inhibition Of Aurora And Polo-Like Kinases". Cancer Research 73.20 (2013): 6310-6322. 183. Romer, J. "Targeting Medulloblastoma: Small-Molecule Inhibitors Of The Sonic Hedgehog Pathway As Potential Cancer Therapeutics". Cancer Research 65.12 (2005): 4975-4978. 184. Mishra, Pallavi. "Sonic Hedgehog Signalling Pathway And Ameloblastoma – A Review". JCDR (2015). 185. Rimkus, Tadas et al. "Targeting The Sonic Hedgehog Signaling Pathway: Review Of Smoothened And GLI Inhibitors". Cancers 8.2 (2016): 22. 186. Lopez-Rios, Javier. "The Many Lives Of SHH In Limb Development And Evolution". Seminars in Cell & Developmental Biology 49 (2016): 116-124. 187. Mostafavi, Sara, and Quaid Morris. "Combining Many Interaction Networks To Predict Gene Function And Analyze Gene Lists". Proteomics 12.10 (2012): 1687-1696. 188. Warde-Farley, D. et al. "The Genemania Prediction Server: Biological Network Integration For Gene Prioritization And Predicting Gene Function". Nucleic Acids Research 38.Web Server (2010): W214-W220. 189. Genemania.org,. "Genemania". N.p., 2016. Web. 21 Feb. 2016. 190. Kishore, Jugal, ManishKumar Goel, and Pardeep Khanna. "Understanding Survival Analysis: Kaplan-Meier Estimate". International Journal of Ayurveda Research 1.4 (2010): 274. 191. Gillespie, Mary Jo, and Lloyd Fisher. "Confidence Bands For The Kaplan-Meier Survival Curve Estimate. Ann. Statist. 7.4 (1979): 920-924. 192. Sedgwick, P. "Kaplan-Meier Survival Analysis: Types Of Censored Observations". BMJ 347.jul26 1 (2013): f4663-f4663. 193. Raman, Pichai et al. "FXYD5 Is A Marker For Poor Prognosis And A Potential Driver For Metastasis In Ovarian Carcinomas". CIN (2015): 113.

187
194. Lahti, L. et al. "Cancer Gene Prioritization By Integrative Analysis Of Mrna Expression And DNA Copy Number Data: A Comparative Review". Briefings in Bioinformatics 14.1 (2012): 27-35. 195. Farley, Suzanne. "GPCRS: A Solid View Of Gpcrs". Nature Reviews Drug Discovery 2.11 (2003): 862-862. 196. Bouvier, Michel. "Detection, Validation, And Implications Of GPCR Heterodimers". Annu. Rev. Pharmacol. Toxicol. 52.1 (2011): 110301101444027. 197. Kotz, Joanne. "The GPCR-Cancer Connection". Science-Business eXchange 3.31 (2010). 198. Srinivasarao, Madduri, Chris V. Galliford, and Philip S. Low. "Principles In The Design Of Ligand-Targeted Cancer Therapeutics And Imaging Agents". Nature Reviews Drug Discovery 14.3 (2015): 203-219. 199. Lampson, Lois A. "Monoclonal Antibodies In Neuro-Oncology". mAbs 3.2 (2011): 153-160. 200. Aiken, Robert. "Molecular Neuro-Oncology And The Challenge Of The Blood-Brain Barrier". Seminars in Oncology 41.4 (2014): 438-445. 201. Bousquet, Guilhem, and Anne Janin. "Passage Of Humanized Monoclonal Antibodies Across The Blood- Brain Barrier: Relevance In The Treatment Of Cancer Brain Metastases?". Journal of Applied Biopharmaceutics and Pharmacokinetics 2.2 (2015): 50-58. 202. Bouchard, Hervé, Christian Viskov, and Carlos Garcia-Echeverria. "Antibody–Drug Conjugates—A New Wave Of Cancer Drugs". Bioorganic & Medicinal Chemistry Letters 24.23 (2014): 5357-5363. 203. Garcia-Echeverria, Carlos. "Developing Second Generation Antibody–Drug Conjugates: The Quest For New Technologies". J. Med. Chem. 57.19 (2014): 7888-7889. 204. Cruz, Conrad Russell. "A Closer Look At Chimeric Antigen Receptor Specificity". Cytotherapy 16.10 (2014): 1323-1324. 205. Genecards.org,. N.p., 2016. Web. 21 Feb. 2016. 206. Costa, Fabrício F., Katarina Le Blanc, and Bertha Brodin. "Concise Review: Cancer/Testis Antigens, Stem Cells, And Cancer". STEM CELLS 25.3 (2006): 707-711. 207. Ghafouri-Fard, Soudeh. "Are Cancer-Testis Antigens Cancer Stem Cell Markers?". Single Cell Biol 01.01 (2012). 208. Gtexportal.org,. "Gtex Portal". N.p., 2016. Web. 21 Feb. 2016.
188
209. Zeitlinger, Julia, and Alexander Stark. "Developmental Gene Regulation In The Era Of Genomics". Developmental Biology 339.2 (2010): 230-239. 210. "The Gene Ontology (GO) Project In 2006". Nucleic Acids Research 34.90001 (2006): D322-D326. 211. Gene Ontology Consortium,. "The Gene Ontology (GO) Database And Informatics Resource". Nucleic Acids Research 32.90001 (2004): 258D-261. 212.Kanehisa, M. "The KEGG Databases At Genomenet". Nucleic Acids Research 30.1 (2002): 42-46. 213. Kinase.com,. "Kinbase". N.p., 2016. Web. 21 Feb. 2016. 214.Liberzon, A. et al. "Molecular Signatures Database (Msigdb) 3.0". Bioinformatics 27.12 (2011): 1739-1740. 215. Cancer.sanger.ac.uk,. "COSMIC: Catalogue Of Somatic Mutations In Cancer - Home Page". N.p., 2016. Web. 21 Feb. 2016. 216. Forbes, S. A. et al. "COSMIC: Exploring The World's Knowledge Of Somatic Mutations In Human Cancer". Nucleic Acids Research 43.D1 (2014): D805-D811. 217. Stark, C. "Biogrid: A General Repository For Interaction Datasets". Nucleic Acids Research 34.90001 (2006): D535-D539. 218. Kotlyar, Max et al. "Integrated Interactions Database: Tissue-Specific View Of The Human And Model Organism Interactomes". Nucleic Acids Res 44.D1 (2015): D536-D541. 219. Cerami, E. G. et al. "Pathway Commons, A Web Resource For Biological Pathway Data". Nucleic Acids Research 39.Database (2010): D685-D690. 220. Mishra, G. R. "Human Protein Reference Database--2006 Update". Nucleic Acids Research 34.90001 (2006): D411-D414. 221. GitHub,. "Nicolewhite/Rneo4j". N.p., 2016. Web. 21 Feb. 2016. 222. Neo4j Graph Database,. "Neo4j: The World's Leading Graph Database". N.p., 2016. Web. 21 Feb. 2016. 223. Futreal, P. Andrew et al. "A Census Of Human Cancer Genes". Nature Reviews Cancer 4.3 (2004): 177-183. 224. Wikipedia,. "Shortest Path Problem". N.p., 2016. Web. 21 Feb. 2016. 225. Topcoder.com,. "Introduction To Graphs And Their Data Structures: Section 2 – Topcoder". N.p., 2016. Web. 21 Feb. 2016.

189
226. Mathelier, Anthony et al. "JASPAR 2014: An Extensively Expanded And Updated Open-Access Database Of Transcription Factor Binding Profiles". Nucleic Acids Research 42.D1 (2013): D142-D147. 227. Burke, D. "RNA Aptamers To The Adenosine Moiety Of S-Adenosyl Methionine: Structural Inferences From Variations On A Theme And The Reproducibility Of SELEX". Nucleic Acids Research 25.10 (1997): 2020-2024. 228. Xia, Xuhua. "Position Weight Matrix, Gibbs Sampler, And The Associated Significance Tests In Motif Characterization And Prediction". Scientifica 2012 (2012): 1-15. 229. Mannens, Marcel. "The Human Genome Project: Deciphering The Blueprint Of Heredity". Trends in Genetics 11.10 (1995): 418-419. 230. Bioconductor,. "Biostrings". N.p., 2016. Web. 21 Feb. 2016. 231. Sedgwick, P. "Cox Proportional Hazards Regression". BMJ 347.aug09 1 (2013): f4919-f4919. 232. GitHub,. "Pichairaman/Survanalysis_Pub". N.p., 2016. Web. 21 Feb. 2016. 233. Hewett, M. "Pharmgkb: The Pharmacogenetics Knowledge Base". Nucleic Acids Research 30.1 (2002): 163-165. 234. Wishart, D. S. et al. "Drugbank: A Knowledgebase For Drugs, Drug Actions And Drug Targets". Nucleic Acids Research 36.Database (2007): D901-D906. 235. Liu, Xin et al. "The Therapeutic Target Database: An Internet Resource For The Primary Targets Of Approved, Clinical Trial And Experimental Drugs". Expert Opinion on Therapeutic Targets 15.8 (2011): 903-912. 236. Hopkins, Andrew L., and Colin R. Groom. "The Druggable Genome". Nature Reviews Drug Discovery 1.9 (2002): 727-730. 237. Russ, Andreas P., and Stefan Lampel. "The Druggable Genome: An Update". Drug Discovery Today 10.23-24 (2005): 1607-1610. 238. Griffith, Malachi et al. "Dgidb: Mining The Druggable Genome". Nature Methods 10.12 (2013): 1209-1210. 239. Marchler-Bauer, A. "CDD: A Conserved Domain Database For Protein Classification". Nucleic Acids Research 33.Database issue (2004): D192-D196. 240. Cancerimmunity.org,. "Surfaceomedb: A Cancer-Orientated Database For Genes Encoding Cell Surface Proteins | Cancer Immunity". N.p., 2016. 21 Feb. 2016.

190
241. Perone, Christian. "Machine Learning :: Cosine Similarity For Vector Space Models (Part III) | Terra Incognita". Blog.christianperone.com. N.p., 2013. 21 Feb. 2016. 242. Biotechniques.com,. "Biotechniques - Antibody Validation". N.p., 2016. Web. 21 Feb. 2016. 243. Juckett, David A. "Cellular Aging (The Hayflick Limit) And Species Longevity: A Unification Model Based On Clonal Succession". Mechanisms of Ageing and Development 38.1 (1987): 49-71. 244. Seitz, Phillip. "The Immortal Life Of Henrietta Lacks". Curator: The Museum Journal 54.4 (2011): 473-475. 245. Franks, L., and C Rigby. "Hela Cells And RT4 Cells". Science 188.4184 (1975): 168-168. 246. Barretina, Jordi et al. "The Cancer Cell Line Encyclopedia Enables Predictive Modelling Of Anticancer Drug Sensitivity". Nature 483.7391 (2012): 603-307. 21 Feb. 2016. 247. Affymetrix.com,. "Home | Affymetrix". N.p., 2016. Web. 21 Feb. 2016. 248. Edgar, R. "Gene Expression Omnibus: NCBI Gene Expression And Hybridization Array Data Repository". Nucleic Acids Research 30.1 (2002): 207-210. 249. Broadinstitute.org,. "Broad-Novartis Cancer Cell Line Encyclopedia". N.p., 2016. Web. 21 Feb. 2016. 250. Kuss, Oliver. "The Danger Of Dichotomizing Continuous Variables: A Visualization". Teaching Statistics 35.2 (2013): 78-79. 251. "On Representing The Prognostic Value Of Continuous Gene Expression Biomarkers With The Restricted Mean Survival Curve". Oncotarget (2015). 252. Tarpey, Thaddeus. "Linear Transformations And The K -Means Clustering Algorithm". The American Statistician 61.1 (2007): 34-40. 253. ZHENG, Dan, and Qian-ping WANG. "Selection Algorithm For K-Means Initial Clustering Center". Journal of Computer Applications 32.8 (2013): 2186-2188. 254. Cormen, Thomas H. Introduction To Algorithms. Cambridge, Mass.: MIT Press, 2009. Print. 255. Dasgupta, Sanjoy, Christos H Papadimitriou, and Umesh Virkumar Vazirani. Algorithms. Boston: McGraw-Hill Higher Education, 2008. Print. 256. Atcc.org,. "ATCC Cell Lines". N.p., 2016. Web. 21 Feb. 2016.
191
257. Qiagen.com,. "Sample To Insight - QIAGEN". N.p., 2016. Web. 21 Feb. 2016. 258. Zhang, J. et al. "International Cancer Genome Consortium Data Portal--A One-Stop Shop For Cancer Genomics Data". Database 2011.0 (2011): bar026-bar026. 259. Stand Up To Cancer,. "Stand Up To Cancer". N.p., 2016. Web. 21 Feb. 2016. 260. Ocg.cancer.gov,. "Therapeutically Applicable Research To Generate Effective Treatments | Office Of Cancer Genomics". N.p., 2016. Web. 21 Feb. 2016. 261. Shiny.rstudio.com,. "Shiny". N.p., 2016. Web. 21 Feb. 2016. 262. Mallona, Izaskun, Anna Díez-Villanueva, and Miguel A Peinado. "Methylation Plotter: A Web Tool For Dynamic Visualization Of DNA Methylation Data". Source Code Biol Med 9.1 (2014): 11. 263. Corporation, Microsoft. "D3heatmap · MRAN". Mran.revolutionanalytics.com. N.p., 2016. Web. 21 Feb. 2016. 264. Plot.ly,. "Plotly | Make Charts And Dashboards Online". N.p., 2016. Web. 21 Feb. 2016. 265. Google.com,. "Google Analytics - Mobile, Premium And Free Website Analytics – Google". N.p., 2016. Web. 21 Feb. 2016.
266. Meijer, J. et al. "The CXCR5 Chemokine Receptor Is Expressed By Carcinoma Cells And Promotes Growth Of Colon Carcinoma In The Liver". Cancer Research 66.19 (2006): 9576-9582. Web. 267. Zhang, Shuncai. "Effect Of CCR7, CXCR4 And VEGF‑C On The Lymph Node Metastasis Of Human Pancreatic Ductal Adenocarcinoma". Oncology Letters (2013): n. pag. 268. McGhee, Amy et al. "Angiotensin II Type 2 Receptor Blockade Inhibits Fatty Acid Synthase Production Through Activation Of AMP-Activated Protein Kinase In Pancreatic Cancer Cells". Surgery 150.2 (2011): 284-298. 269. Kotnis, S. et al. "Genetic And Functional Analysis Of Human P2X5 Reveals A Distinct Pattern Of Exon 10 Polymorphism With Predominant Expression Of The Nonfunctional Receptor Isoform". Molecular Pharmacology 77.6 (2010): 953-960. 270. Yamada, Hisashi et al. "Establishment Of A Human Pancreatic Adenocarcinoma Cell Line (PSN-1) With Amplifications Of Both C-Myc And Activated C-Ki-Ras By A Point Mutation". Biochemical and Biophysical Research Communications 140.1 (1986): 167-173. Web.
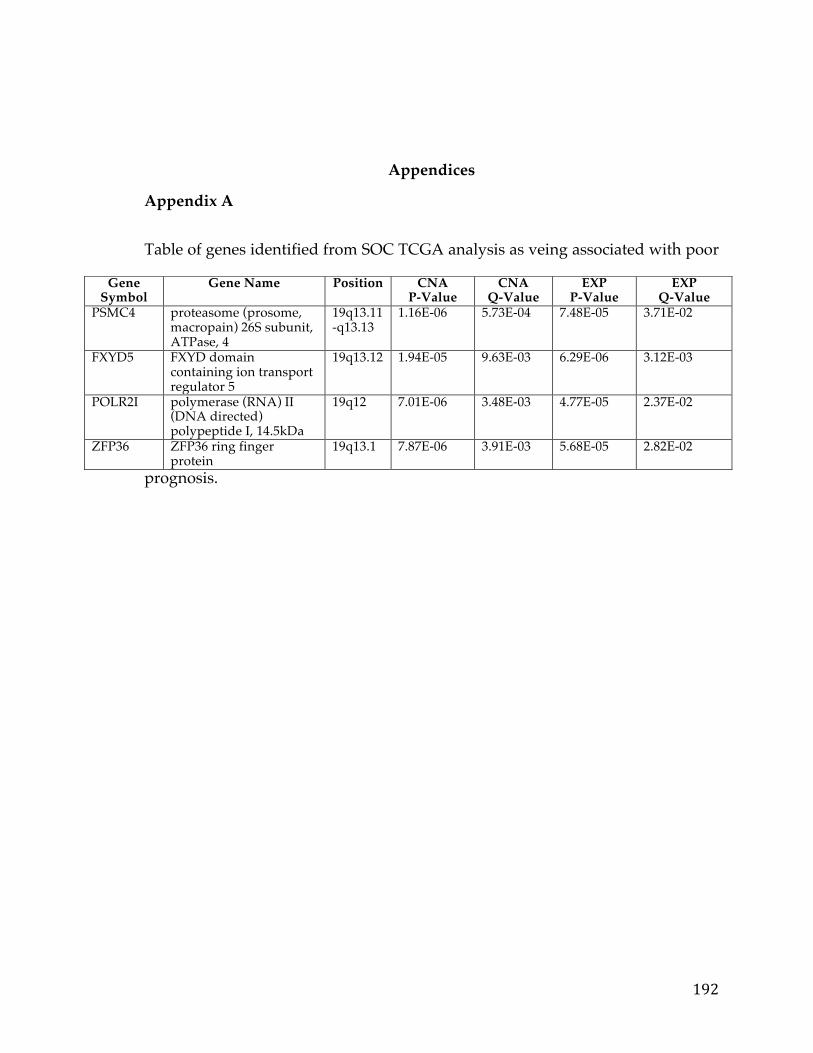
192
Appendices
Appendix A
Table of genes identified from SOC TCGA analysis as veing associated with poor
prognosis.
Gene Symbol
Gene Name Position CNA P-Value
CNA Q-Value
EXP P-Value
EXP Q-Value
PSMC4 proteasome (prosome, macropain) 26S subunit, ATPase, 4
19q13.11-q13.13
1.16E-06 5.73E-04 7.48E-05 3.71E-02
FXYD5 FXYD domain containing ion transport regulator 5
19q13.12 1.94E-05 9.63E-03 6.29E-06 3.12E-03
POLR2I polymerase (RNA) II (DNA directed) polypeptide I, 14.5kDa
19q12 7.01E-06 3.48E-03 4.77E-05 2.37E-02
ZFP36 ZFP36 ring finger protein
19q13.1 7.87E-06 3.91E-03 5.68E-05 2.82E-02
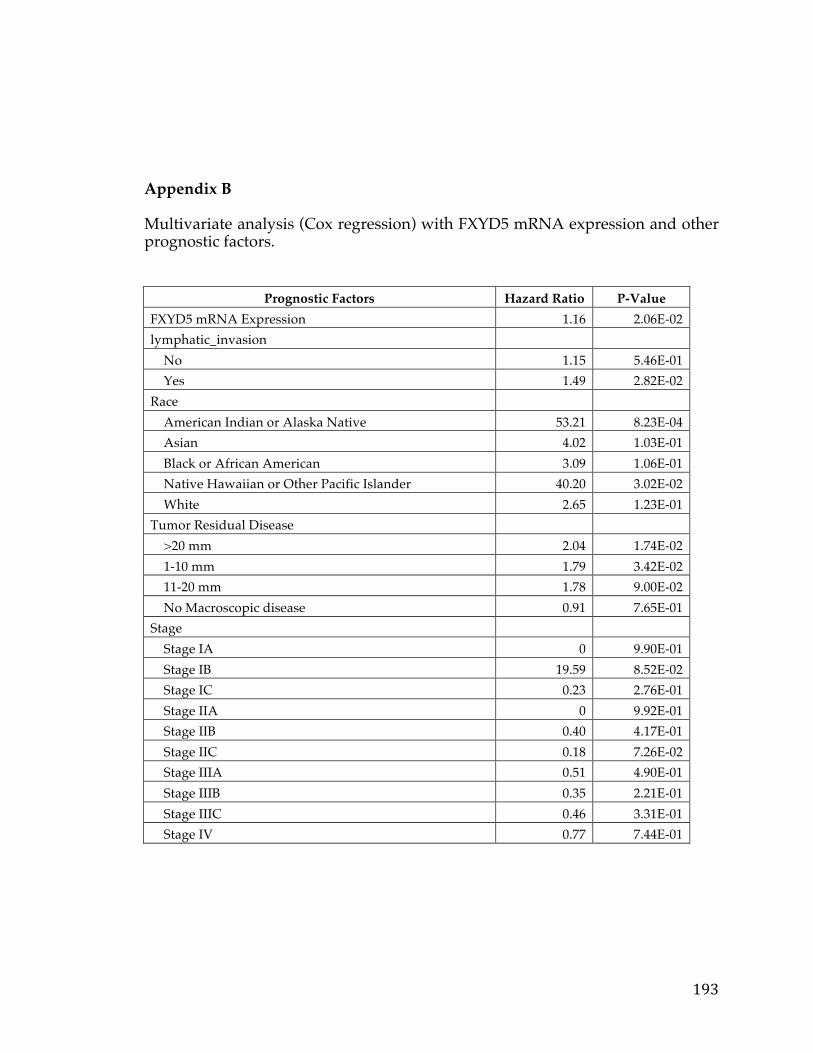
193
Appendix B Multivariate analysis (Cox regression) with FXYD5 mRNA expression and other prognostic factors.
Prognostic Factors Hazard Ratio P-Value FXYD5 mRNA Expression 1.16 2.06E-02 lymphatic_invasion No 1.15 5.46E-01 Yes 1.49 2.82E-02 Race American Indian or Alaska Native 53.21 8.23E-04 Asian 4.02 1.03E-01 Black or African American 3.09 1.06E-01 Native Hawaiian or Other Pacific Islander 40.20 3.02E-02 White 2.65 1.23E-01 Tumor Residual Disease >20 mm 2.04 1.74E-02 1-10 mm 1.79 3.42E-02 11-20 mm 1.78 9.00E-02 No Macroscopic disease 0.91 7.65E-01 Stage Stage IA 0 9.90E-01 Stage IB 19.59 8.52E-02 Stage IC 0.23 2.76E-01 Stage IIA 0 9.92E-01 Stage IIB 0.40 4.17E-01 Stage IIC 0.18 7.26E-02 Stage IIIA 0.51 4.90E-01 Stage IIIB 0.35 2.21E-01 Stage IIIC 0.46 3.31E-01 Stage IV 0.77 7.44E-01
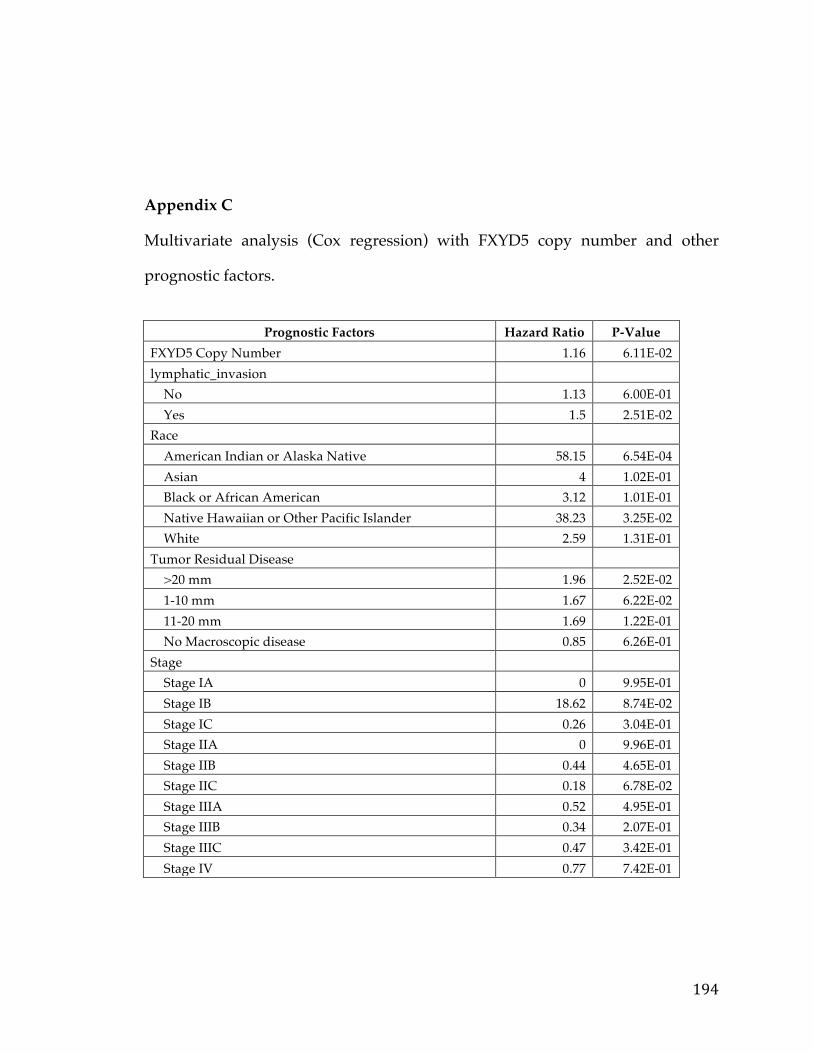
194
Appendix C Multivariate analysis (Cox regression) with FXYD5 copy number and other
prognostic factors.
Prognostic Factors Hazard Ratio P-Value
FXYD5 Copy Number 1.16 6.11E-02 lymphatic_invasion No 1.13 6.00E-01 Yes 1.5 2.51E-02 Race American Indian or Alaska Native 58.15 6.54E-04 Asian 4 1.02E-01 Black or African American 3.12 1.01E-01 Native Hawaiian or Other Pacific Islander 38.23 3.25E-02 White 2.59 1.31E-01 Tumor Residual Disease >20 mm 1.96 2.52E-02 1-10 mm 1.67 6.22E-02 11-20 mm 1.69 1.22E-01 No Macroscopic disease 0.85 6.26E-01 Stage Stage IA 0 9.95E-01 Stage IB 18.62 8.74E-02 Stage IC 0.26 3.04E-01 Stage IIA 0 9.96E-01 Stage IIB 0.44 4.65E-01 Stage IIC 0.18 6.78E-02 Stage IIIA 0.52 4.95E-01 Stage IIIB 0.34 2.07E-01 Stage IIIC 0.47 3.42E-01 Stage IV 0.77 7.42E-01
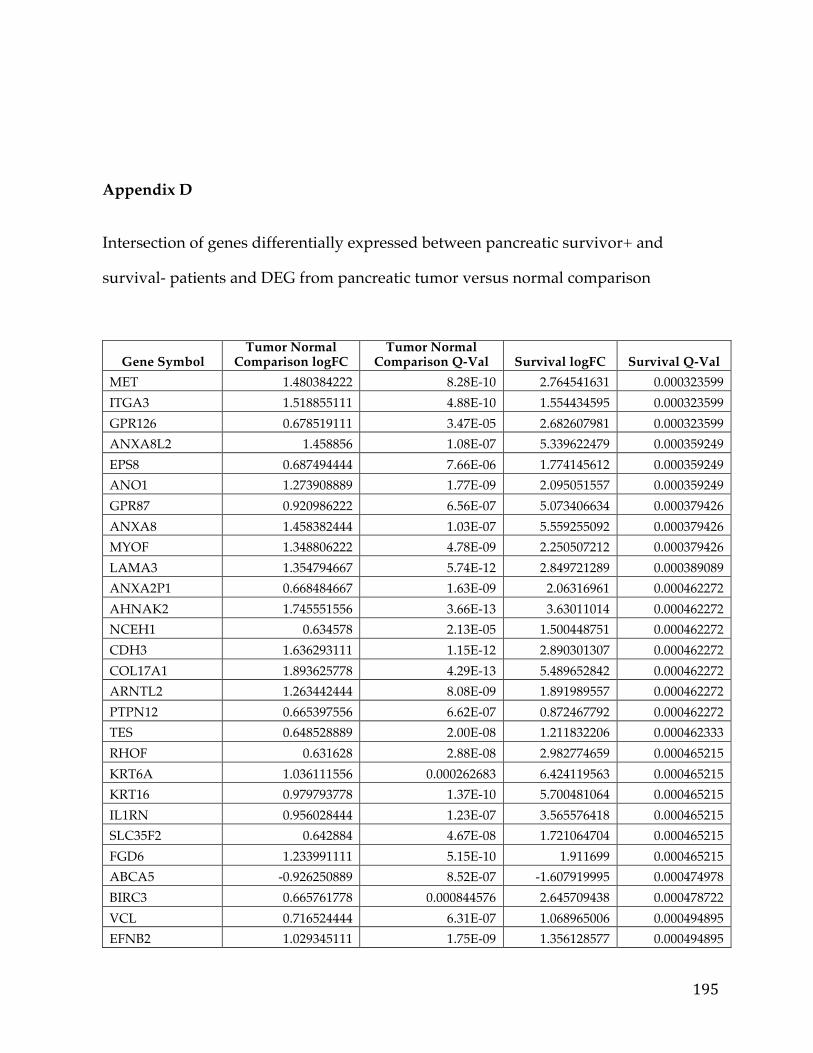
195
Appendix D
Intersection of genes differentially expressed between pancreatic survivor+ and
survival- patients and DEG from pancreatic tumor versus normal comparison
Gene Symbol Tumor Normal
Comparison logFC Tumor Normal
Comparison Q-Val Survival logFC Survival Q-Val MET 1.480384222 8.28E-10 2.764541631 0.000323599 ITGA3 1.518855111 4.88E-10 1.554434595 0.000323599 GPR126 0.678519111 3.47E-05 2.682607981 0.000323599 ANXA8L2 1.458856 1.08E-07 5.339622479 0.000359249 EPS8 0.687494444 7.66E-06 1.774145612 0.000359249 ANO1 1.273908889 1.77E-09 2.095051557 0.000359249 GPR87 0.920986222 6.56E-07 5.073406634 0.000379426 ANXA8 1.458382444 1.03E-07 5.559255092 0.000379426 MYOF 1.348806222 4.78E-09 2.250507212 0.000379426 LAMA3 1.354794667 5.74E-12 2.849721289 0.000389089 ANXA2P1 0.668484667 1.63E-09 2.06316961 0.000462272 AHNAK2 1.745551556 3.66E-13 3.63011014 0.000462272 NCEH1 0.634578 2.13E-05 1.500448751 0.000462272 CDH3 1.636293111 1.15E-12 2.890301307 0.000462272 COL17A1 1.893625778 4.29E-13 5.489652842 0.000462272 ARNTL2 1.263442444 8.08E-09 1.891989557 0.000462272 PTPN12 0.665397556 6.62E-07 0.872467792 0.000462272 TES 0.648528889 2.00E-08 1.211832206 0.000462333 RHOF 0.631628 2.88E-08 2.982774659 0.000465215 KRT6A 1.036111556 0.000262683 6.424119563 0.000465215 KRT16 0.979793778 1.37E-10 5.700481064 0.000465215 IL1RN 0.956028444 1.23E-07 3.565576418 0.000465215 SLC35F2 0.642884 4.67E-08 1.721064704 0.000465215 FGD6 1.233991111 5.15E-10 1.911699 0.000465215 ABCA5 -0.926250889 8.52E-07 -1.607919995 0.000474978 BIRC3 0.665761778 0.000844576 2.645709438 0.000478722 VCL 0.716524444 6.31E-07 1.068965006 0.000494895 EFNB2 1.029345111 1.75E-09 1.356128577 0.000494895
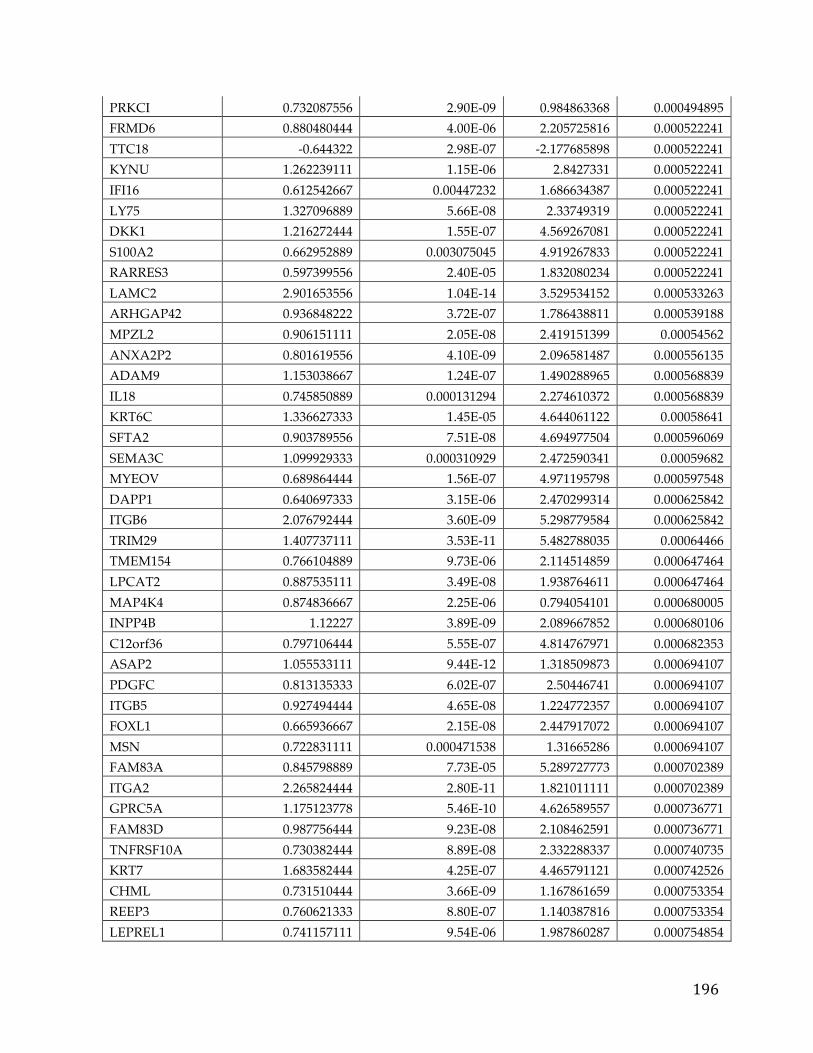
196
PRKCI 0.732087556 2.90E-09 0.984863368 0.000494895 FRMD6 0.880480444 4.00E-06 2.205725816 0.000522241 TTC18 -0.644322 2.98E-07 -2.177685898 0.000522241 KYNU 1.262239111 1.15E-06 2.8427331 0.000522241 IFI16 0.612542667 0.00447232 1.686634387 0.000522241 LY75 1.327096889 5.66E-08 2.33749319 0.000522241 DKK1 1.216272444 1.55E-07 4.569267081 0.000522241 S100A2 0.662952889 0.003075045 4.919267833 0.000522241 RARRES3 0.597399556 2.40E-05 1.832080234 0.000522241 LAMC2 2.901653556 1.04E-14 3.529534152 0.000533263 ARHGAP42 0.936848222 3.72E-07 1.786438811 0.000539188 MPZL2 0.906151111 2.05E-08 2.419151399 0.00054562 ANXA2P2 0.801619556 4.10E-09 2.096581487 0.000556135 ADAM9 1.153038667 1.24E-07 1.490288965 0.000568839 IL18 0.745850889 0.000131294 2.274610372 0.000568839 KRT6C 1.336627333 1.45E-05 4.644061122 0.00058641 SFTA2 0.903789556 7.51E-08 4.694977504 0.000596069 SEMA3C 1.099929333 0.000310929 2.472590341 0.00059682 MYEOV 0.689864444 1.56E-07 4.971195798 0.000597548 DAPP1 0.640697333 3.15E-06 2.470299314 0.000625842 ITGB6 2.076792444 3.60E-09 5.298779584 0.000625842 TRIM29 1.407737111 3.53E-11 5.482788035 0.00064466 TMEM154 0.766104889 9.73E-06 2.114514859 0.000647464 LPCAT2 0.887535111 3.49E-08 1.938764611 0.000647464 MAP4K4 0.874836667 2.25E-06 0.794054101 0.000680005 INPP4B 1.12227 3.89E-09 2.089667852 0.000680106 C12orf36 0.797106444 5.55E-07 4.814767971 0.000682353 ASAP2 1.055533111 9.44E-12 1.318509873 0.000694107 PDGFC 0.813135333 6.02E-07 2.50446741 0.000694107 ITGB5 0.927494444 4.65E-08 1.224772357 0.000694107 FOXL1 0.665936667 2.15E-08 2.447917072 0.000694107 MSN 0.722831111 0.000471538 1.31665286 0.000694107 FAM83A 0.845798889 7.73E-05 5.289727773 0.000702389 ITGA2 2.265824444 2.80E-11 1.821011111 0.000702389 GPRC5A 1.175123778 5.46E-10 4.626589557 0.000736771 FAM83D 0.987756444 9.23E-08 2.108462591 0.000736771 TNFRSF10A 0.730382444 8.89E-08 2.332288337 0.000740735 KRT7 1.683582444 4.25E-07 4.465791121 0.000742526 CHML 0.731510444 3.66E-09 1.167861659 0.000753354 REEP3 0.760621333 8.80E-07 1.140387816 0.000753354 LEPREL1 0.741157111 9.54E-06 1.987860287 0.000754854
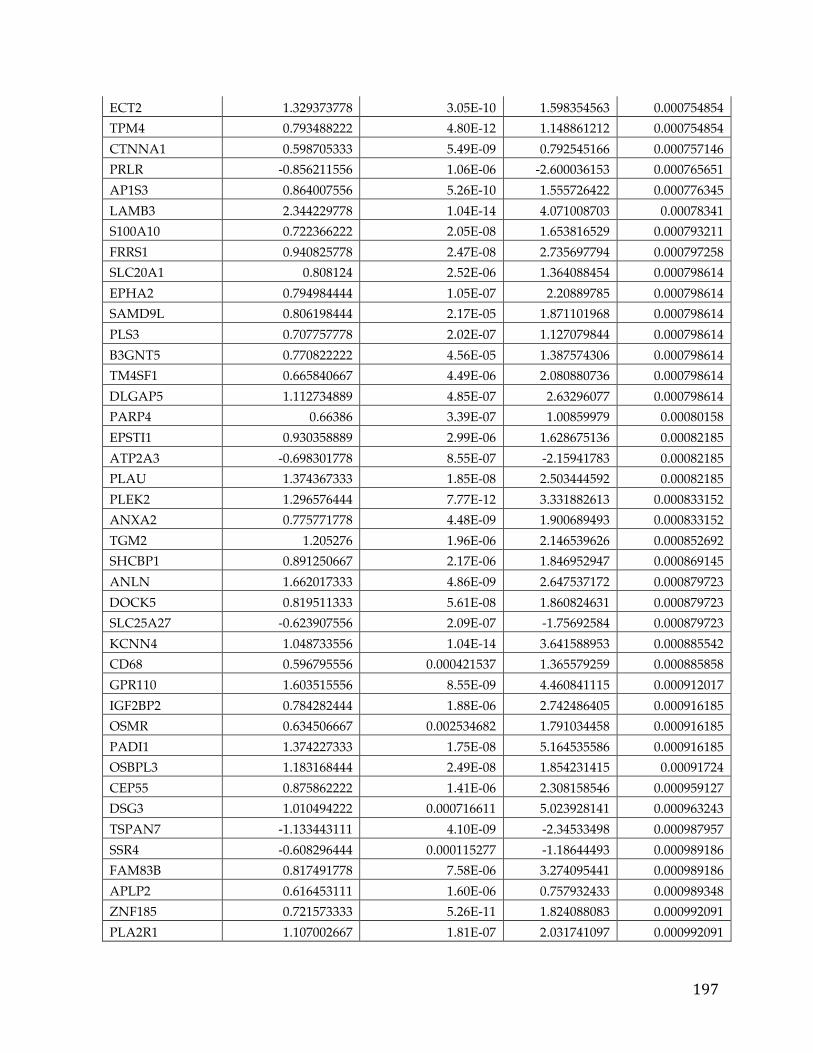
197
ECT2 1.329373778 3.05E-10 1.598354563 0.000754854 TPM4 0.793488222 4.80E-12 1.148861212 0.000754854 CTNNA1 0.598705333 5.49E-09 0.792545166 0.000757146 PRLR -0.856211556 1.06E-06 -2.600036153 0.000765651 AP1S3 0.864007556 5.26E-10 1.555726422 0.000776345 LAMB3 2.344229778 1.04E-14 4.071008703 0.00078341 S100A10 0.722366222 2.05E-08 1.653816529 0.000793211 FRRS1 0.940825778 2.47E-08 2.735697794 0.000797258 SLC20A1 0.808124 2.52E-06 1.364088454 0.000798614 EPHA2 0.794984444 1.05E-07 2.20889785 0.000798614 SAMD9L 0.806198444 2.17E-05 1.871101968 0.000798614 PLS3 0.707757778 2.02E-07 1.127079844 0.000798614 B3GNT5 0.770822222 4.56E-05 1.387574306 0.000798614 TM4SF1 0.665840667 4.49E-06 2.080880736 0.000798614 DLGAP5 1.112734889 4.85E-07 2.63296077 0.000798614 PARP4 0.66386 3.39E-07 1.00859979 0.00080158 EPSTI1 0.930358889 2.99E-06 1.628675136 0.00082185 ATP2A3 -0.698301778 8.55E-07 -2.15941783 0.00082185 PLAU 1.374367333 1.85E-08 2.503444592 0.00082185 PLEK2 1.296576444 7.77E-12 3.331882613 0.000833152 ANXA2 0.775771778 4.48E-09 1.900689493 0.000833152 TGM2 1.205276 1.96E-06 2.146539626 0.000852692 SHCBP1 0.891250667 2.17E-06 1.846952947 0.000869145 ANLN 1.662017333 4.86E-09 2.647537172 0.000879723 DOCK5 0.819511333 5.61E-08 1.860824631 0.000879723 SLC25A27 -0.623907556 2.09E-07 -1.75692584 0.000879723 KCNN4 1.048733556 1.04E-14 3.641588953 0.000885542 CD68 0.596795556 0.000421537 1.365579259 0.000885858 GPR110 1.603515556 8.55E-09 4.460841115 0.000912017 IGF2BP2 0.784282444 1.88E-06 2.742486405 0.000916185 OSMR 0.634506667 0.002534682 1.791034458 0.000916185 PADI1 1.374227333 1.75E-08 5.164535586 0.000916185 OSBPL3 1.183168444 2.49E-08 1.854231415 0.00091724 CEP55 0.875862222 1.41E-06 2.308158546 0.000959127 DSG3 1.010494222 0.000716611 5.023928141 0.000963243 TSPAN7 -1.133443111 4.10E-09 -2.34533498 0.000987957 SSR4 -0.608296444 0.000115277 -1.18644493 0.000989186 FAM83B 0.817491778 7.58E-06 3.274095441 0.000989186 APLP2 0.616453111 1.60E-06 0.757932433 0.000989348 ZNF185 0.721573333 5.26E-11 1.824088083 0.000992091 PLA2R1 1.107002667 1.81E-07 2.031741097 0.000992091
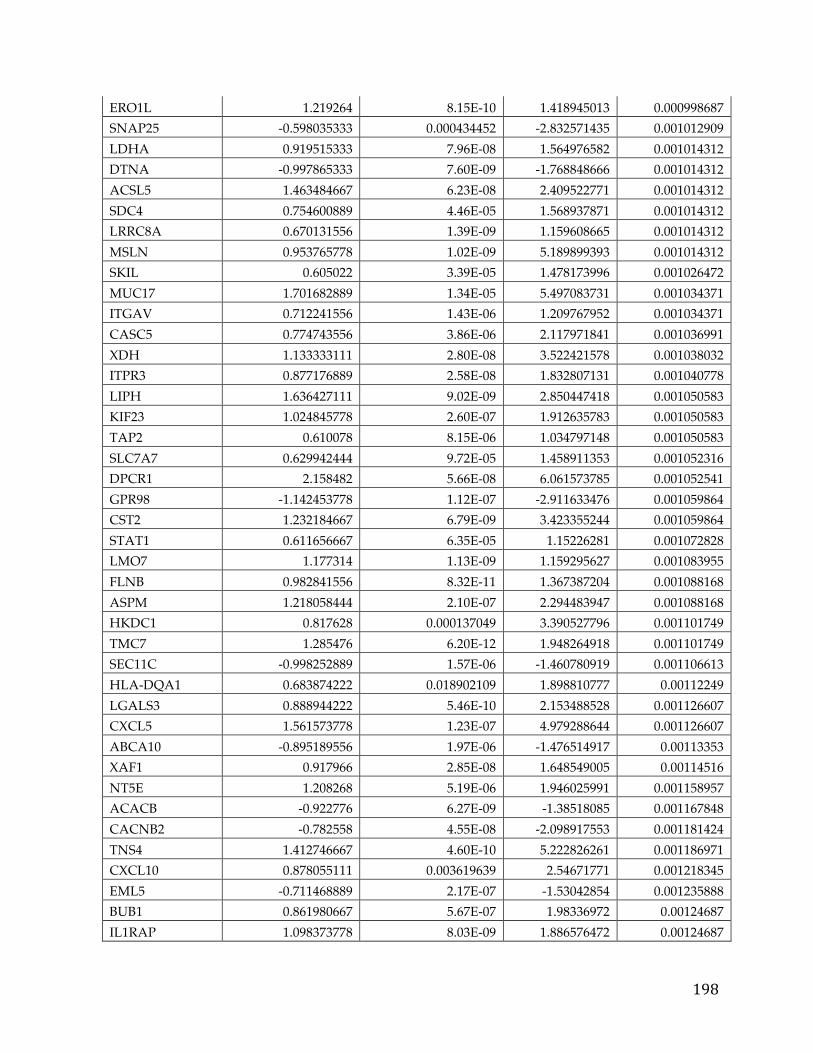
198
ERO1L 1.219264 8.15E-10 1.418945013 0.000998687 SNAP25 -0.598035333 0.000434452 -2.832571435 0.001012909 LDHA 0.919515333 7.96E-08 1.564976582 0.001014312 DTNA -0.997865333 7.60E-09 -1.768848666 0.001014312 ACSL5 1.463484667 6.23E-08 2.409522771 0.001014312 SDC4 0.754600889 4.46E-05 1.568937871 0.001014312 LRRC8A 0.670131556 1.39E-09 1.159608665 0.001014312 MSLN 0.953765778 1.02E-09 5.189899393 0.001014312 SKIL 0.605022 3.39E-05 1.478173996 0.001026472 MUC17 1.701682889 1.34E-05 5.497083731 0.001034371 ITGAV 0.712241556 1.43E-06 1.209767952 0.001034371 CASC5 0.774743556 3.86E-06 2.117971841 0.001036991 XDH 1.133333111 2.80E-08 3.522421578 0.001038032 ITPR3 0.877176889 2.58E-08 1.832807131 0.001040778 LIPH 1.636427111 9.02E-09 2.850447418 0.001050583 KIF23 1.024845778 2.60E-07 1.912635783 0.001050583 TAP2 0.610078 8.15E-06 1.034797148 0.001050583 SLC7A7 0.629942444 9.72E-05 1.458911353 0.001052316 DPCR1 2.158482 5.66E-08 6.061573785 0.001052541 GPR98 -1.142453778 1.12E-07 -2.911633476 0.001059864 CST2 1.232184667 6.79E-09 3.423355244 0.001059864 STAT1 0.611656667 6.35E-05 1.15226281 0.001072828 LMO7 1.177314 1.13E-09 1.159295627 0.001083955 FLNB 0.982841556 8.32E-11 1.367387204 0.001088168 ASPM 1.218058444 2.10E-07 2.294483947 0.001088168 HKDC1 0.817628 0.000137049 3.390527796 0.001101749 TMC7 1.285476 6.20E-12 1.948264918 0.001101749 SEC11C -0.998252889 1.57E-06 -1.460780919 0.001106613 HLA-DQA1 0.683874222 0.018902109 1.898810777 0.00112249 LGALS3 0.888944222 5.46E-10 2.153488528 0.001126607 CXCL5 1.561573778 1.23E-07 4.979288644 0.001126607 ABCA10 -0.895189556 1.97E-06 -1.476514917 0.00113353 XAF1 0.917966 2.85E-08 1.648549005 0.00114516 NT5E 1.208268 5.19E-06 1.946025991 0.001158957 ACACB -0.922776 6.27E-09 -1.38518085 0.001167848 CACNB2 -0.782558 4.55E-08 -2.098917553 0.001181424 TNS4 1.412746667 4.60E-10 5.222826261 0.001186971 CXCL10 0.878055111 0.003619639 2.54671771 0.001218345 EML5 -0.711468889 2.17E-07 -1.53042854 0.001235888 BUB1 0.861980667 5.67E-07 1.98336972 0.00124687 IL1RAP 1.098373778 8.03E-09 1.886576472 0.00124687
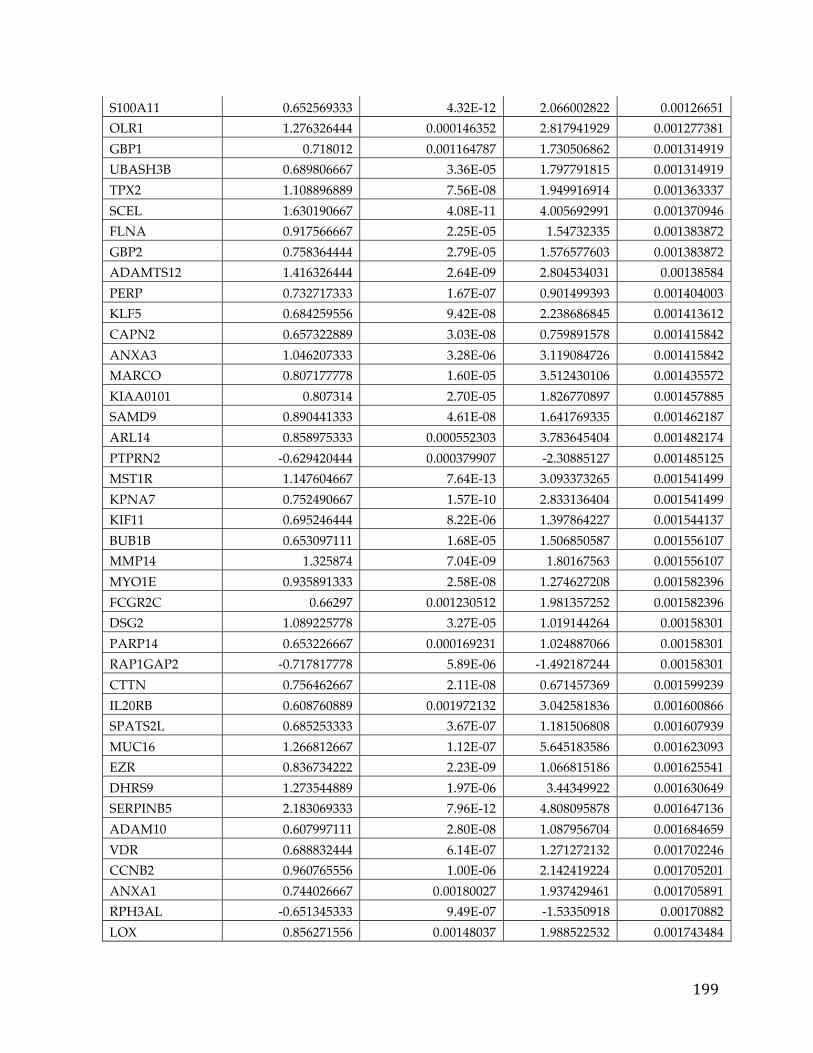
199
S100A11 0.652569333 4.32E-12 2.066002822 0.00126651 OLR1 1.276326444 0.000146352 2.817941929 0.001277381 GBP1 0.718012 0.001164787 1.730506862 0.001314919 UBASH3B 0.689806667 3.36E-05 1.797791815 0.001314919 TPX2 1.108896889 7.56E-08 1.949916914 0.001363337 SCEL 1.630190667 4.08E-11 4.005692991 0.001370946 FLNA 0.917566667 2.25E-05 1.54732335 0.001383872 GBP2 0.758364444 2.79E-05 1.576577603 0.001383872 ADAMTS12 1.416326444 2.64E-09 2.804534031 0.00138584 PERP 0.732717333 1.67E-07 0.901499393 0.001404003 KLF5 0.684259556 9.42E-08 2.238686845 0.001413612 CAPN2 0.657322889 3.03E-08 0.759891578 0.001415842 ANXA3 1.046207333 3.28E-06 3.119084726 0.001415842 MARCO 0.807177778 1.60E-05 3.512430106 0.001435572 KIAA0101 0.807314 2.70E-05 1.826770897 0.001457885 SAMD9 0.890441333 4.61E-08 1.641769335 0.001462187 ARL14 0.858975333 0.000552303 3.783645404 0.001482174 PTPRN2 -0.629420444 0.000379907 -2.30885127 0.001485125 MST1R 1.147604667 7.64E-13 3.093373265 0.001541499 KPNA7 0.752490667 1.57E-10 2.833136404 0.001541499 KIF11 0.695246444 8.22E-06 1.397864227 0.001544137 BUB1B 0.653097111 1.68E-05 1.506850587 0.001556107 MMP14 1.325874 7.04E-09 1.80167563 0.001556107 MYO1E 0.935891333 2.58E-08 1.274627208 0.001582396 FCGR2C 0.66297 0.001230512 1.981357252 0.001582396 DSG2 1.089225778 3.27E-05 1.019144264 0.00158301 PARP14 0.653226667 0.000169231 1.024887066 0.00158301 RAP1GAP2 -0.717817778 5.89E-06 -1.492187244 0.00158301 CTTN 0.756462667 2.11E-08 0.671457369 0.001599239 IL20RB 0.608760889 0.001972132 3.042581836 0.001600866 SPATS2L 0.685253333 3.67E-07 1.181506808 0.001607939 MUC16 1.266812667 1.12E-07 5.645183586 0.001623093 EZR 0.836734222 2.23E-09 1.066815186 0.001625541 DHRS9 1.273544889 1.97E-06 3.44349922 0.001630649 SERPINB5 2.183069333 7.96E-12 4.808095878 0.001647136 ADAM10 0.607997111 2.80E-08 1.087956704 0.001684659 VDR 0.688832444 6.14E-07 1.271272132 0.001702246 CCNB2 0.960765556 1.00E-06 2.142419224 0.001705201 ANXA1 0.744026667 0.00180027 1.937429461 0.001705891 RPH3AL -0.651345333 9.49E-07 -1.53350918 0.00170882 LOX 0.856271556 0.00148037 1.988522532 0.001743484
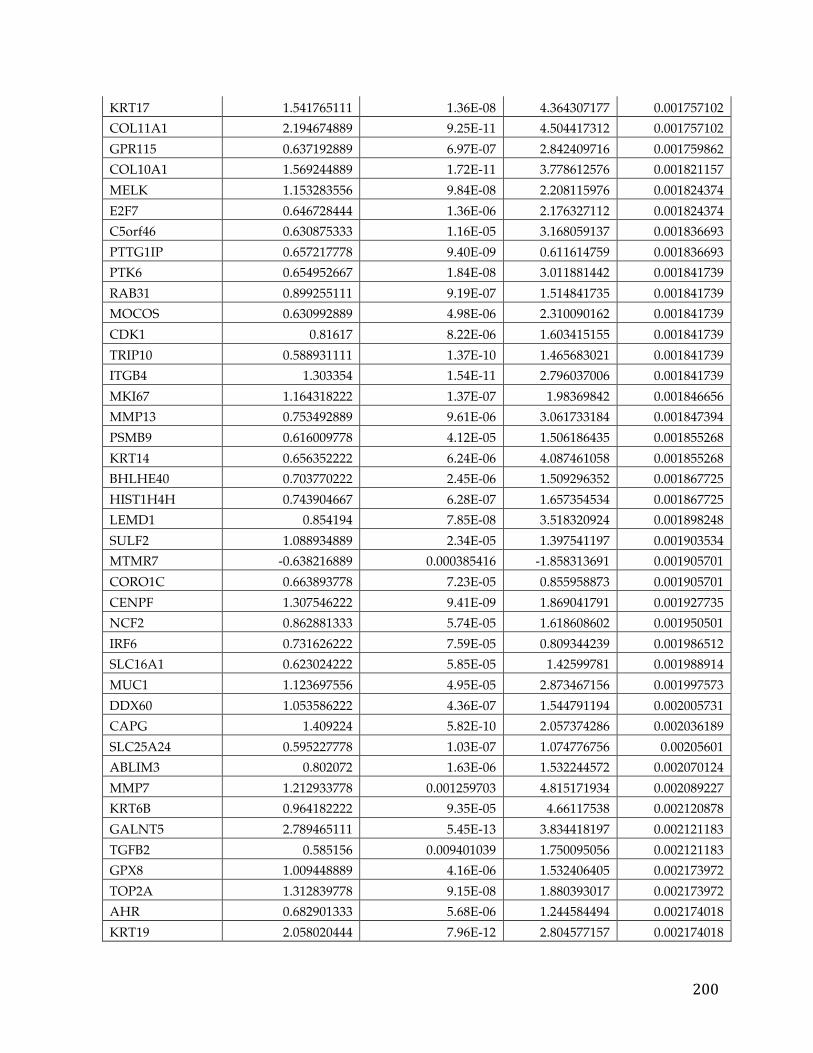
200
KRT17 1.541765111 1.36E-08 4.364307177 0.001757102 COL11A1 2.194674889 9.25E-11 4.504417312 0.001757102 GPR115 0.637192889 6.97E-07 2.842409716 0.001759862 COL10A1 1.569244889 1.72E-11 3.778612576 0.001821157 MELK 1.153283556 9.84E-08 2.208115976 0.001824374 E2F7 0.646728444 1.36E-06 2.176327112 0.001824374 C5orf46 0.630875333 1.16E-05 3.168059137 0.001836693 PTTG1IP 0.657217778 9.40E-09 0.611614759 0.001836693 PTK6 0.654952667 1.84E-08 3.011881442 0.001841739 RAB31 0.899255111 9.19E-07 1.514841735 0.001841739 MOCOS 0.630992889 4.98E-06 2.310090162 0.001841739 CDK1 0.81617 8.22E-06 1.603415155 0.001841739 TRIP10 0.588931111 1.37E-10 1.465683021 0.001841739 ITGB4 1.303354 1.54E-11 2.796037006 0.001841739 MKI67 1.164318222 1.37E-07 1.98369842 0.001846656 MMP13 0.753492889 9.61E-06 3.061733184 0.001847394 PSMB9 0.616009778 4.12E-05 1.506186435 0.001855268 KRT14 0.656352222 6.24E-06 4.087461058 0.001855268 BHLHE40 0.703770222 2.45E-06 1.509296352 0.001867725 HIST1H4H 0.743904667 6.28E-07 1.657354534 0.001867725 LEMD1 0.854194 7.85E-08 3.518320924 0.001898248 SULF2 1.088934889 2.34E-05 1.397541197 0.001903534 MTMR7 -0.638216889 0.000385416 -1.858313691 0.001905701 CORO1C 0.663893778 7.23E-05 0.855958873 0.001905701 CENPF 1.307546222 9.41E-09 1.869041791 0.001927735 NCF2 0.862881333 5.74E-05 1.618608602 0.001950501 IRF6 0.731626222 7.59E-05 0.809344239 0.001986512 SLC16A1 0.623024222 5.85E-05 1.42599781 0.001988914 MUC1 1.123697556 4.95E-05 2.873467156 0.001997573 DDX60 1.053586222 4.36E-07 1.544791194 0.002005731 CAPG 1.409224 5.82E-10 2.057374286 0.002036189 SLC25A24 0.595227778 1.03E-07 1.074776756 0.00205601 ABLIM3 0.802072 1.63E-06 1.532244572 0.002070124 MMP7 1.212933778 0.001259703 4.815171934 0.002089227 KRT6B 0.964182222 9.35E-05 4.66117538 0.002120878 GALNT5 2.789465111 5.45E-13 3.834418197 0.002121183 TGFB2 0.585156 0.009401039 1.750095056 0.002121183 GPX8 1.009448889 4.16E-06 1.532406405 0.002173972 TOP2A 1.312839778 9.15E-08 1.880393017 0.002173972 AHR 0.682901333 5.68E-06 1.244584494 0.002174018 KRT19 2.058020444 7.96E-12 2.804577157 0.002174018
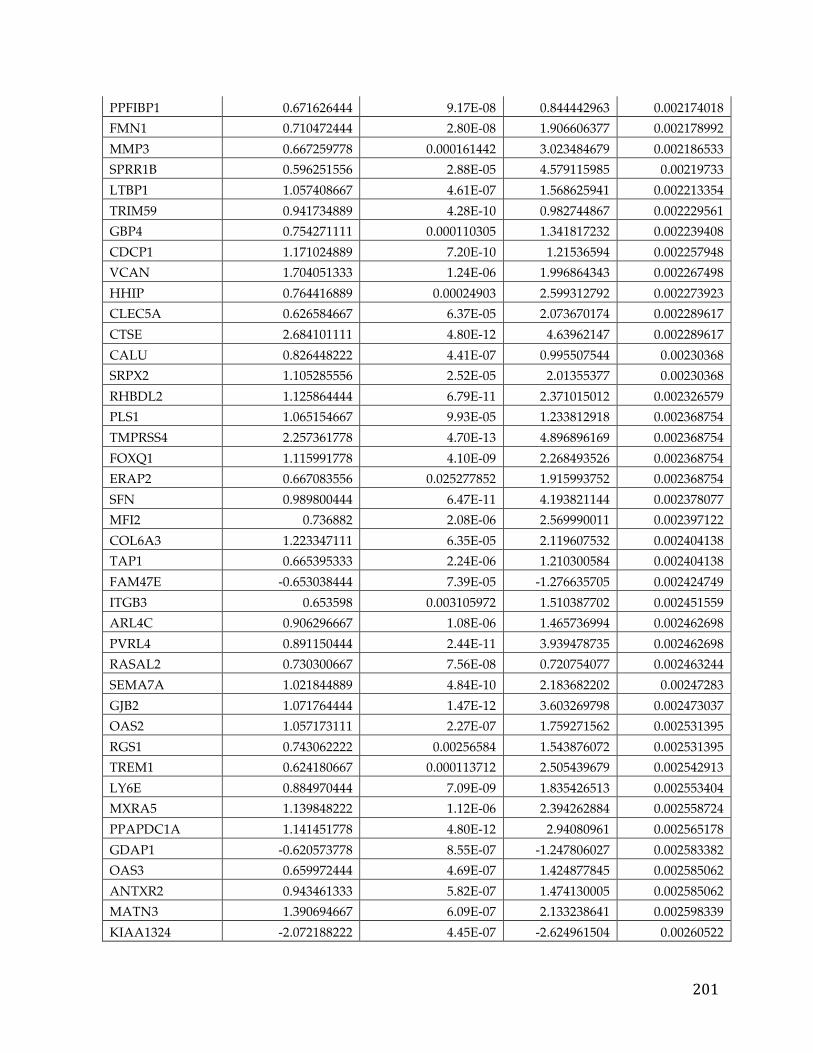
201
PPFIBP1 0.671626444 9.17E-08 0.844442963 0.002174018 FMN1 0.710472444 2.80E-08 1.906606377 0.002178992 MMP3 0.667259778 0.000161442 3.023484679 0.002186533 SPRR1B 0.596251556 2.88E-05 4.579115985 0.00219733 LTBP1 1.057408667 4.61E-07 1.568625941 0.002213354 TRIM59 0.941734889 4.28E-10 0.982744867 0.002229561 GBP4 0.754271111 0.000110305 1.341817232 0.002239408 CDCP1 1.171024889 7.20E-10 1.21536594 0.002257948 VCAN 1.704051333 1.24E-06 1.996864343 0.002267498 HHIP 0.764416889 0.00024903 2.599312792 0.002273923 CLEC5A 0.626584667 6.37E-05 2.073670174 0.002289617 CTSE 2.684101111 4.80E-12 4.63962147 0.002289617 CALU 0.826448222 4.41E-07 0.995507544 0.00230368 SRPX2 1.105285556 2.52E-05 2.01355377 0.00230368 RHBDL2 1.125864444 6.79E-11 2.371015012 0.002326579 PLS1 1.065154667 9.93E-05 1.233812918 0.002368754 TMPRSS4 2.257361778 4.70E-13 4.896896169 0.002368754 FOXQ1 1.115991778 4.10E-09 2.268493526 0.002368754 ERAP2 0.667083556 0.025277852 1.915993752 0.002368754 SFN 0.989800444 6.47E-11 4.193821144 0.002378077 MFI2 0.736882 2.08E-06 2.569990011 0.002397122 COL6A3 1.223347111 6.35E-05 2.119607532 0.002404138 TAP1 0.665395333 2.24E-06 1.210300584 0.002404138 FAM47E -0.653038444 7.39E-05 -1.276635705 0.002424749 ITGB3 0.653598 0.003105972 1.510387702 0.002451559 ARL4C 0.906296667 1.08E-06 1.465736994 0.002462698 PVRL4 0.891150444 2.44E-11 3.939478735 0.002462698 RASAL2 0.730300667 7.56E-08 0.720754077 0.002463244 SEMA7A 1.021844889 4.84E-10 2.183682202 0.00247283 GJB2 1.071764444 1.47E-12 3.603269798 0.002473037 OAS2 1.057173111 2.27E-07 1.759271562 0.002531395 RGS1 0.743062222 0.00256584 1.543876072 0.002531395 TREM1 0.624180667 0.000113712 2.505439679 0.002542913 LY6E 0.884970444 7.09E-09 1.835426513 0.002553404 MXRA5 1.139848222 1.12E-06 2.394262884 0.002558724 PPAPDC1A 1.141451778 4.80E-12 2.94080961 0.002565178 GDAP1 -0.620573778 8.55E-07 -1.247806027 0.002583382 OAS3 0.659972444 4.69E-07 1.424877845 0.002585062 ANTXR2 0.943461333 5.82E-07 1.474130005 0.002585062 MATN3 1.390694667 6.09E-07 2.133238641 0.002598339 KIAA1324 -2.072188222 4.45E-07 -2.624961504 0.00260522
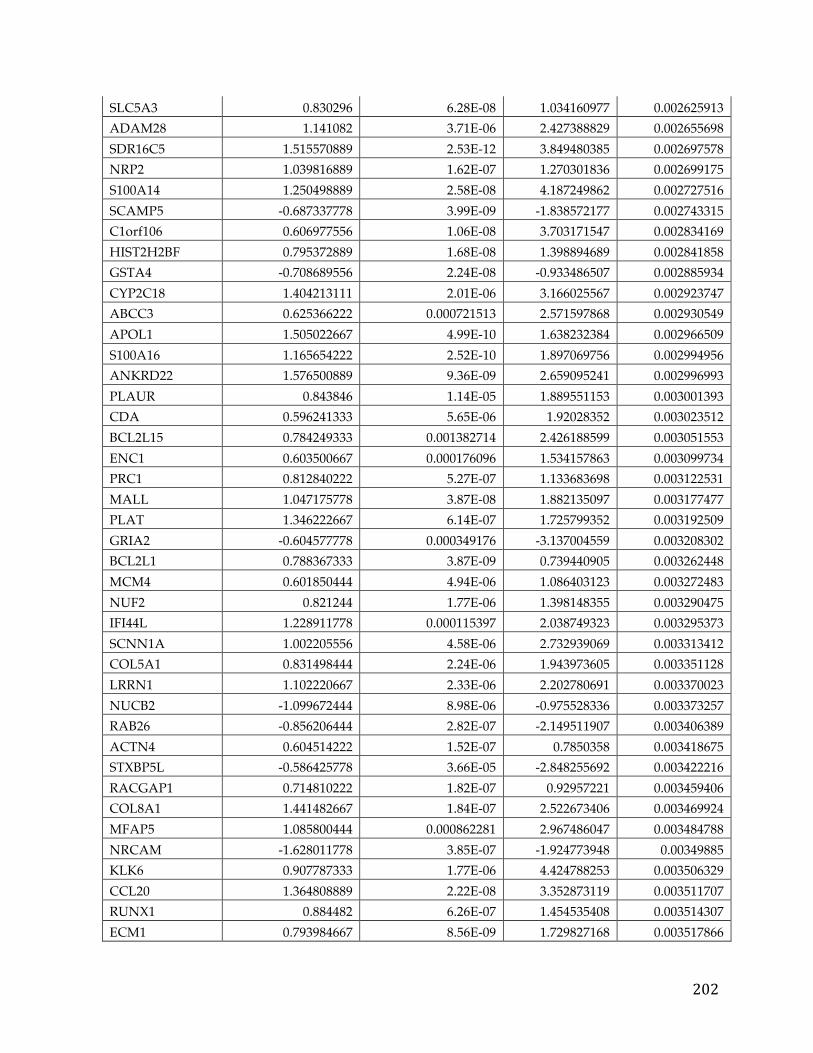
202
SLC5A3 0.830296 6.28E-08 1.034160977 0.002625913 ADAM28 1.141082 3.71E-06 2.427388829 0.002655698 SDR16C5 1.515570889 2.53E-12 3.849480385 0.002697578 NRP2 1.039816889 1.62E-07 1.270301836 0.002699175 S100A14 1.250498889 2.58E-08 4.187249862 0.002727516 SCAMP5 -0.687337778 3.99E-09 -1.838572177 0.002743315 C1orf106 0.606977556 1.06E-08 3.703171547 0.002834169 HIST2H2BF 0.795372889 1.68E-08 1.398894689 0.002841858 GSTA4 -0.708689556 2.24E-08 -0.933486507 0.002885934 CYP2C18 1.404213111 2.01E-06 3.166025567 0.002923747 ABCC3 0.625366222 0.000721513 2.571597868 0.002930549 APOL1 1.505022667 4.99E-10 1.638232384 0.002966509 S100A16 1.165654222 2.52E-10 1.897069756 0.002994956 ANKRD22 1.576500889 9.36E-09 2.659095241 0.002996993 PLAUR 0.843846 1.14E-05 1.889551153 0.003001393 CDA 0.596241333 5.65E-06 1.92028352 0.003023512 BCL2L15 0.784249333 0.001382714 2.426188599 0.003051553 ENC1 0.603500667 0.000176096 1.534157863 0.003099734 PRC1 0.812840222 5.27E-07 1.133683698 0.003122531 MALL 1.047175778 3.87E-08 1.882135097 0.003177477 PLAT 1.346222667 6.14E-07 1.725799352 0.003192509 GRIA2 -0.604577778 0.000349176 -3.137004559 0.003208302 BCL2L1 0.788367333 3.87E-09 0.739440905 0.003262448 MCM4 0.601850444 4.94E-06 1.086403123 0.003272483 NUF2 0.821244 1.77E-06 1.398148355 0.003290475 IFI44L 1.228911778 0.000115397 2.038749323 0.003295373 SCNN1A 1.002205556 4.58E-06 2.732939069 0.003313412 COL5A1 0.831498444 2.24E-06 1.943973605 0.003351128 LRRN1 1.102220667 2.33E-06 2.202780691 0.003370023 NUCB2 -1.099672444 8.98E-06 -0.975528336 0.003373257 RAB26 -0.856206444 2.82E-07 -2.149511907 0.003406389 ACTN4 0.604514222 1.52E-07 0.7850358 0.003418675 STXBP5L -0.586425778 3.66E-05 -2.848255692 0.003422216 RACGAP1 0.714810222 1.82E-07 0.92957221 0.003459406 COL8A1 1.441482667 1.84E-07 2.522673406 0.003469924 MFAP5 1.085800444 0.000862281 2.967486047 0.003484788 NRCAM -1.628011778 3.85E-07 -1.924773948 0.00349885 KLK6 0.907787333 1.77E-06 4.424788253 0.003506329 CCL20 1.364808889 2.22E-08 3.352873119 0.003511707 RUNX1 0.884482 6.26E-07 1.454535408 0.003514307 ECM1 0.793984667 8.56E-09 1.729827168 0.003517866
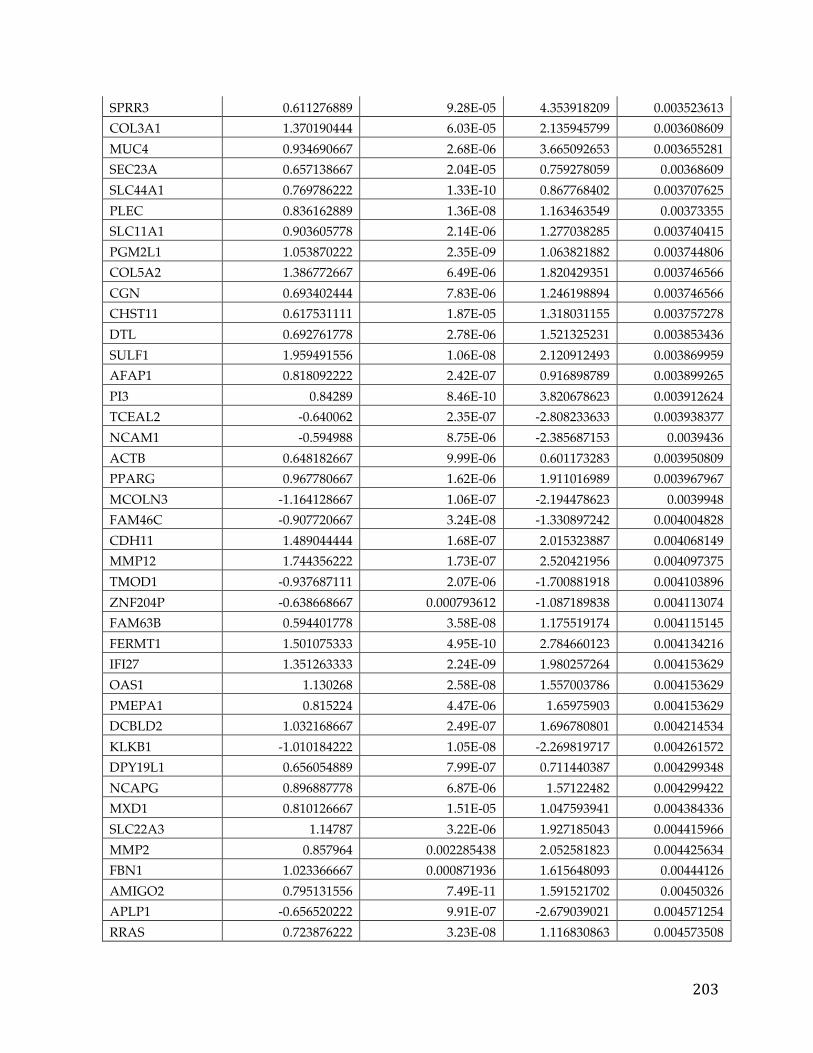
203
SPRR3 0.611276889 9.28E-05 4.353918209 0.003523613 COL3A1 1.370190444 6.03E-05 2.135945799 0.003608609 MUC4 0.934690667 2.68E-06 3.665092653 0.003655281 SEC23A 0.657138667 2.04E-05 0.759278059 0.00368609 SLC44A1 0.769786222 1.33E-10 0.867768402 0.003707625 PLEC 0.836162889 1.36E-08 1.163463549 0.00373355 SLC11A1 0.903605778 2.14E-06 1.277038285 0.003740415 PGM2L1 1.053870222 2.35E-09 1.063821882 0.003744806 COL5A2 1.386772667 6.49E-06 1.820429351 0.003746566 CGN 0.693402444 7.83E-06 1.246198894 0.003746566 CHST11 0.617531111 1.87E-05 1.318031155 0.003757278 DTL 0.692761778 2.78E-06 1.521325231 0.003853436 SULF1 1.959491556 1.06E-08 2.120912493 0.003869959 AFAP1 0.818092222 2.42E-07 0.916898789 0.003899265 PI3 0.84289 8.46E-10 3.820678623 0.003912624 TCEAL2 -0.640062 2.35E-07 -2.808233633 0.003938377 NCAM1 -0.594988 8.75E-06 -2.385687153 0.0039436 ACTB 0.648182667 9.99E-06 0.601173283 0.003950809 PPARG 0.967780667 1.62E-06 1.911016989 0.003967967 MCOLN3 -1.164128667 1.06E-07 -2.194478623 0.0039948 FAM46C -0.907720667 3.24E-08 -1.330897242 0.004004828 CDH11 1.489044444 1.68E-07 2.015323887 0.004068149 MMP12 1.744356222 1.73E-07 2.520421956 0.004097375 TMOD1 -0.937687111 2.07E-06 -1.700881918 0.004103896 ZNF204P -0.638668667 0.000793612 -1.087189838 0.004113074 FAM63B 0.594401778 3.58E-08 1.175519174 0.004115145 FERMT1 1.501075333 4.95E-10 2.784660123 0.004134216 IFI27 1.351263333 2.24E-09 1.980257264 0.004153629 OAS1 1.130268 2.58E-08 1.557003786 0.004153629 PMEPA1 0.815224 4.47E-06 1.65975903 0.004153629 DCBLD2 1.032168667 2.49E-07 1.696780801 0.004214534 KLKB1 -1.010184222 1.05E-08 -2.269819717 0.004261572 DPY19L1 0.656054889 7.99E-07 0.711440387 0.004299348 NCAPG 0.896887778 6.87E-06 1.57122482 0.004299422 MXD1 0.810126667 1.51E-05 1.047593941 0.004384336 SLC22A3 1.14787 3.22E-06 1.927185043 0.004415966 MMP2 0.857964 0.002285438 2.052581823 0.004425634 FBN1 1.023366667 0.000871936 1.615648093 0.00444126 AMIGO2 0.795131556 7.49E-11 1.591521702 0.00450326 APLP1 -0.656520222 9.91E-07 -2.679039021 0.004571254 RRAS 0.723876222 3.23E-08 1.116830863 0.004573508
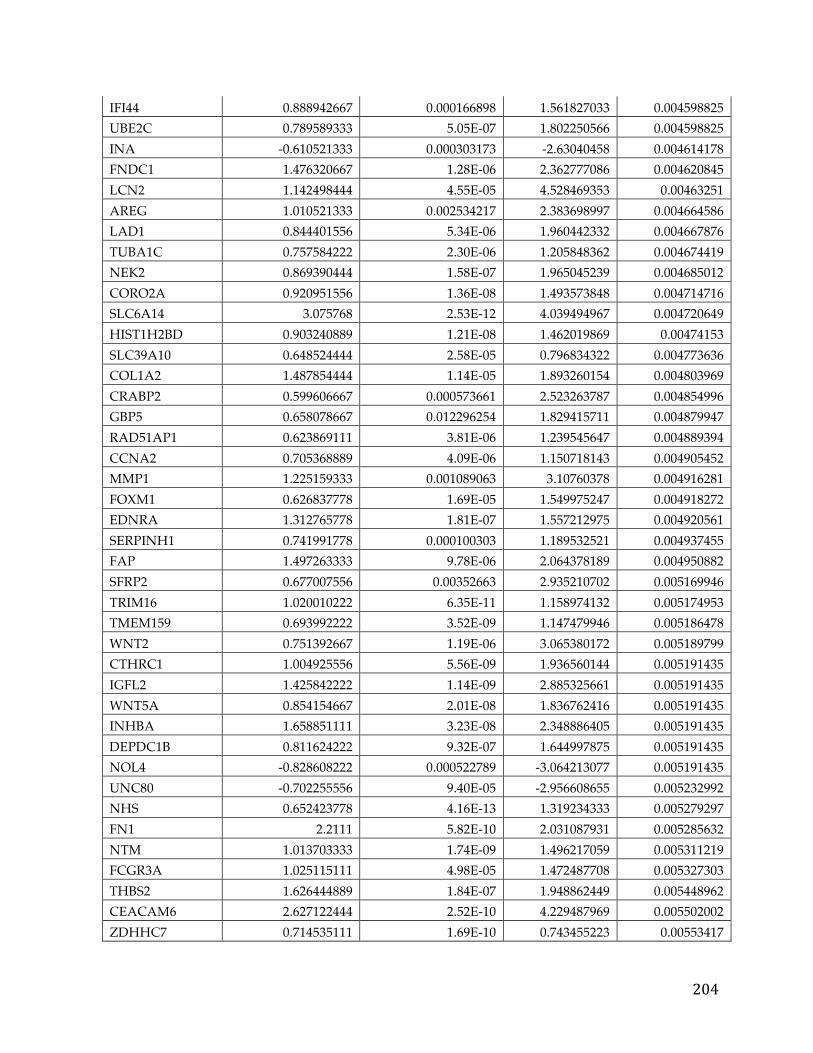
204
IFI44 0.888942667 0.000166898 1.561827033 0.004598825 UBE2C 0.789589333 5.05E-07 1.802250566 0.004598825 INA -0.610521333 0.000303173 -2.63040458 0.004614178 FNDC1 1.476320667 1.28E-06 2.362777086 0.004620845 LCN2 1.142498444 4.55E-05 4.528469353 0.00463251 AREG 1.010521333 0.002534217 2.383698997 0.004664586 LAD1 0.844401556 5.34E-06 1.960442332 0.004667876 TUBA1C 0.757584222 2.30E-06 1.205848362 0.004674419 NEK2 0.869390444 1.58E-07 1.965045239 0.004685012 CORO2A 0.920951556 1.36E-08 1.493573848 0.004714716 SLC6A14 3.075768 2.53E-12 4.039494967 0.004720649 HIST1H2BD 0.903240889 1.21E-08 1.462019869 0.00474153 SLC39A10 0.648524444 2.58E-05 0.796834322 0.004773636 COL1A2 1.487854444 1.14E-05 1.893260154 0.004803969 CRABP2 0.599606667 0.000573661 2.523263787 0.004854996 GBP5 0.658078667 0.012296254 1.829415711 0.004879947 RAD51AP1 0.623869111 3.81E-06 1.239545647 0.004889394 CCNA2 0.705368889 4.09E-06 1.150718143 0.004905452 MMP1 1.225159333 0.001089063 3.10760378 0.004916281 FOXM1 0.626837778 1.69E-05 1.549975247 0.004918272 EDNRA 1.312765778 1.81E-07 1.557212975 0.004920561 SERPINH1 0.741991778 0.000100303 1.189532521 0.004937455 FAP 1.497263333 9.78E-06 2.064378189 0.004950882 SFRP2 0.677007556 0.00352663 2.935210702 0.005169946 TRIM16 1.020010222 6.35E-11 1.158974132 0.005174953 TMEM159 0.693992222 3.52E-09 1.147479946 0.005186478 WNT2 0.751392667 1.19E-06 3.065380172 0.005189799 CTHRC1 1.004925556 5.56E-09 1.936560144 0.005191435 IGFL2 1.425842222 1.14E-09 2.885325661 0.005191435 WNT5A 0.854154667 2.01E-08 1.836762416 0.005191435 INHBA 1.658851111 3.23E-08 2.348886405 0.005191435 DEPDC1B 0.811624222 9.32E-07 1.644997875 0.005191435 NOL4 -0.828608222 0.000522789 -3.064213077 0.005191435 UNC80 -0.702255556 9.40E-05 -2.956608655 0.005232992 NHS 0.652423778 4.16E-13 1.319234333 0.005279297 FN1 2.2111 5.82E-10 2.031087931 0.005285632 NTM 1.013703333 1.74E-09 1.496217059 0.005311219 FCGR3A 1.025115111 4.98E-05 1.472487708 0.005327303 THBS2 1.626444889 1.84E-07 1.948862449 0.005448962 CEACAM6 2.627122444 2.52E-10 4.229487969 0.005502002 ZDHHC7 0.714535111 1.69E-10 0.743455223 0.00553417
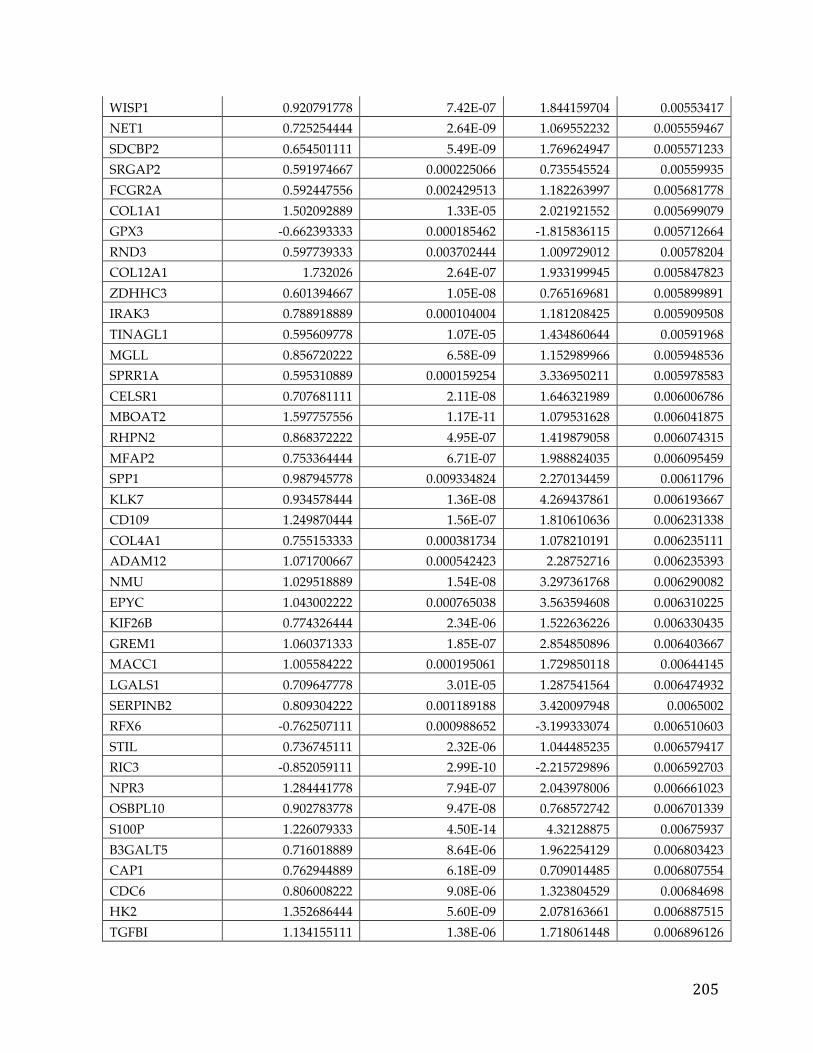
205
WISP1 0.920791778 7.42E-07 1.844159704 0.00553417 NET1 0.725254444 2.64E-09 1.069552232 0.005559467 SDCBP2 0.654501111 5.49E-09 1.769624947 0.005571233 SRGAP2 0.591974667 0.000225066 0.735545524 0.00559935 FCGR2A 0.592447556 0.002429513 1.182263997 0.005681778 COL1A1 1.502092889 1.33E-05 2.021921552 0.005699079 GPX3 -0.662393333 0.000185462 -1.815836115 0.005712664 RND3 0.597739333 0.003702444 1.009729012 0.00578204 COL12A1 1.732026 2.64E-07 1.933199945 0.005847823 ZDHHC3 0.601394667 1.05E-08 0.765169681 0.005899891 IRAK3 0.788918889 0.000104004 1.181208425 0.005909508 TINAGL1 0.595609778 1.07E-05 1.434860644 0.00591968 MGLL 0.856720222 6.58E-09 1.152989966 0.005948536 SPRR1A 0.595310889 0.000159254 3.336950211 0.005978583 CELSR1 0.707681111 2.11E-08 1.646321989 0.006006786 MBOAT2 1.597757556 1.17E-11 1.079531628 0.006041875 RHPN2 0.868372222 4.95E-07 1.419879058 0.006074315 MFAP2 0.753364444 6.71E-07 1.988824035 0.006095459 SPP1 0.987945778 0.009334824 2.270134459 0.00611796 KLK7 0.934578444 1.36E-08 4.269437861 0.006193667 CD109 1.249870444 1.56E-07 1.810610636 0.006231338 COL4A1 0.755153333 0.000381734 1.078210191 0.006235111 ADAM12 1.071700667 0.000542423 2.28752716 0.006235393 NMU 1.029518889 1.54E-08 3.297361768 0.006290082 EPYC 1.043002222 0.000765038 3.563594608 0.006310225 KIF26B 0.774326444 2.34E-06 1.522636226 0.006330435 GREM1 1.060371333 1.85E-07 2.854850896 0.006403667 MACC1 1.005584222 0.000195061 1.729850118 0.00644145 LGALS1 0.709647778 3.01E-05 1.287541564 0.006474932 SERPINB2 0.809304222 0.001189188 3.420097948 0.0065002 RFX6 -0.762507111 0.000988652 -3.199333074 0.006510603 STIL 0.736745111 2.32E-06 1.044485235 0.006579417 RIC3 -0.852059111 2.99E-10 -2.215729896 0.006592703 NPR3 1.284441778 7.94E-07 2.043978006 0.006661023 OSBPL10 0.902783778 9.47E-08 0.768572742 0.006701339 S100P 1.226079333 4.50E-14 4.32128875 0.00675937 B3GALT5 0.716018889 8.64E-06 1.962254129 0.006803423 CAP1 0.762944889 6.18E-09 0.709014485 0.006807554 CDC6 0.806008222 9.08E-06 1.323804529 0.00684698 HK2 1.352686444 5.60E-09 2.078163661 0.006887515 TGFBI 1.134155111 1.38E-06 1.718061448 0.006896126
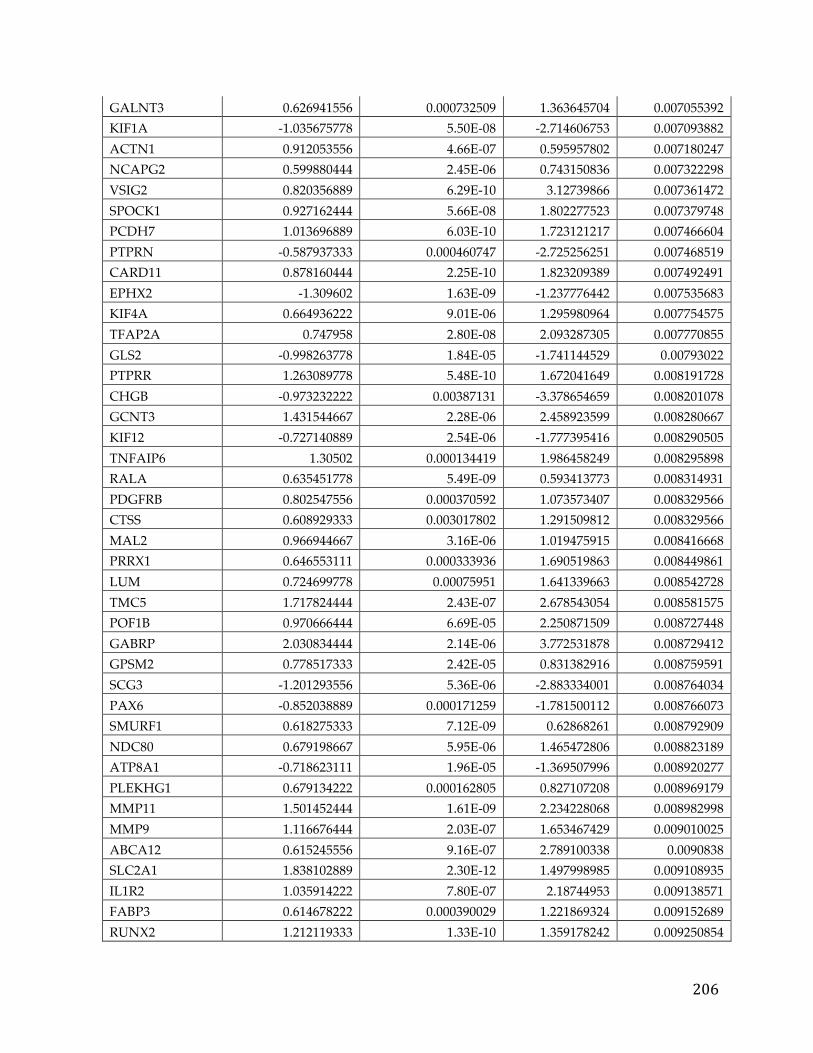
206
GALNT3 0.626941556 0.000732509 1.363645704 0.007055392 KIF1A -1.035675778 5.50E-08 -2.714606753 0.007093882 ACTN1 0.912053556 4.66E-07 0.595957802 0.007180247 NCAPG2 0.599880444 2.45E-06 0.743150836 0.007322298 VSIG2 0.820356889 6.29E-10 3.12739866 0.007361472 SPOCK1 0.927162444 5.66E-08 1.802277523 0.007379748 PCDH7 1.013696889 6.03E-10 1.723121217 0.007466604 PTPRN -0.587937333 0.000460747 -2.725256251 0.007468519 CARD11 0.878160444 2.25E-10 1.823209389 0.007492491 EPHX2 -1.309602 1.63E-09 -1.237776442 0.007535683 KIF4A 0.664936222 9.01E-06 1.295980964 0.007754575 TFAP2A 0.747958 2.80E-08 2.093287305 0.007770855 GLS2 -0.998263778 1.84E-05 -1.741144529 0.00793022 PTPRR 1.263089778 5.48E-10 1.672041649 0.008191728 CHGB -0.973232222 0.00387131 -3.378654659 0.008201078 GCNT3 1.431544667 2.28E-06 2.458923599 0.008280667 KIF12 -0.727140889 2.54E-06 -1.777395416 0.008290505 TNFAIP6 1.30502 0.000134419 1.986458249 0.008295898 RALA 0.635451778 5.49E-09 0.593413773 0.008314931 PDGFRB 0.802547556 0.000370592 1.073573407 0.008329566 CTSS 0.608929333 0.003017802 1.291509812 0.008329566 MAL2 0.966944667 3.16E-06 1.019475915 0.008416668 PRRX1 0.646553111 0.000333936 1.690519863 0.008449861 LUM 0.724699778 0.00075951 1.641339663 0.008542728 TMC5 1.717824444 2.43E-07 2.678543054 0.008581575 POF1B 0.970666444 6.69E-05 2.250871509 0.008727448 GABRP 2.030834444 2.14E-06 3.772531878 0.008729412 GPSM2 0.778517333 2.42E-05 0.831382916 0.008759591 SCG3 -1.201293556 5.36E-06 -2.883334001 0.008764034 PAX6 -0.852038889 0.000171259 -1.781500112 0.008766073 SMURF1 0.618275333 7.12E-09 0.62868261 0.008792909 NDC80 0.679198667 5.95E-06 1.465472806 0.008823189 ATP8A1 -0.718623111 1.96E-05 -1.369507996 0.008920277 PLEKHG1 0.679134222 0.000162805 0.827107208 0.008969179 MMP11 1.501452444 1.61E-09 2.234228068 0.008982998 MMP9 1.116676444 2.03E-07 1.653467429 0.009010025 ABCA12 0.615245556 9.16E-07 2.789100338 0.0090838 SLC2A1 1.838102889 2.30E-12 1.497998985 0.009108935 IL1R2 1.035914222 7.80E-07 2.18744953 0.009138571 FABP3 0.614678222 0.000390029 1.221869324 0.009152689 RUNX2 1.212119333 1.33E-10 1.359178242 0.009250854
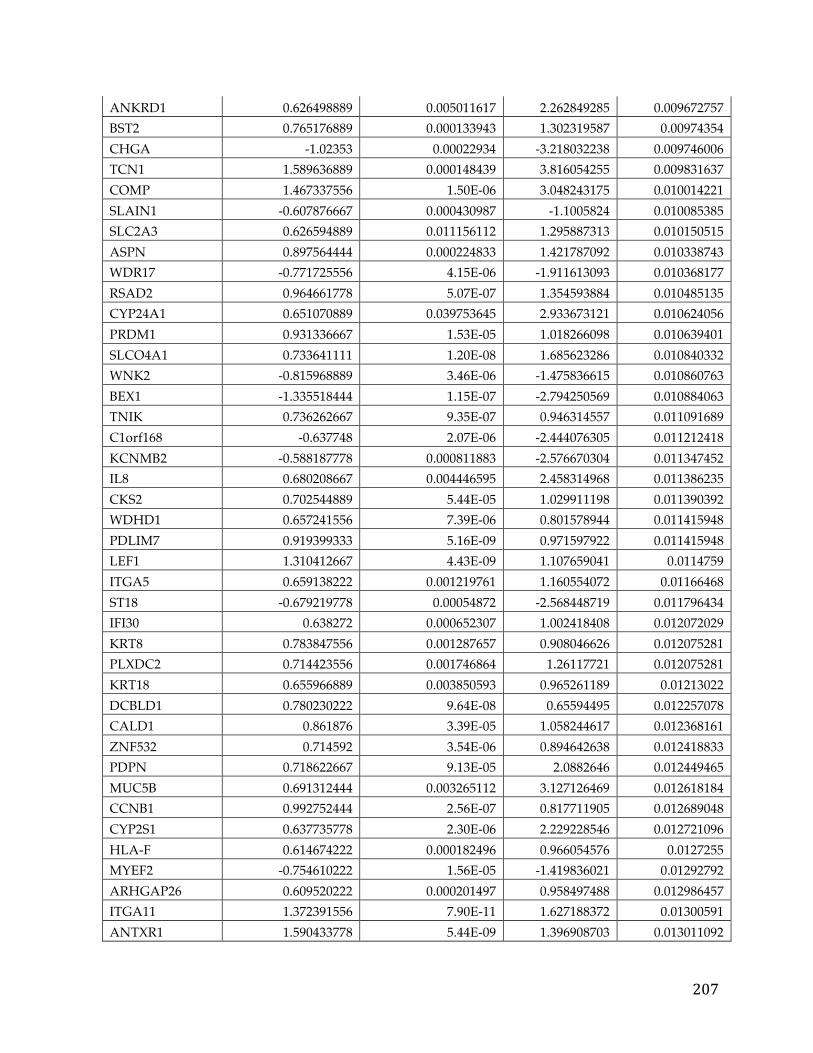
207
ANKRD1 0.626498889 0.005011617 2.262849285 0.009672757 BST2 0.765176889 0.000133943 1.302319587 0.00974354 CHGA -1.02353 0.00022934 -3.218032238 0.009746006 TCN1 1.589636889 0.000148439 3.816054255 0.009831637 COMP 1.467337556 1.50E-06 3.048243175 0.010014221 SLAIN1 -0.607876667 0.000430987 -1.1005824 0.010085385 SLC2A3 0.626594889 0.011156112 1.295887313 0.010150515 ASPN 0.897564444 0.000224833 1.421787092 0.010338743 WDR17 -0.771725556 4.15E-06 -1.911613093 0.010368177 RSAD2 0.964661778 5.07E-07 1.354593884 0.010485135 CYP24A1 0.651070889 0.039753645 2.933673121 0.010624056 PRDM1 0.931336667 1.53E-05 1.018266098 0.010639401 SLCO4A1 0.733641111 1.20E-08 1.685623286 0.010840332 WNK2 -0.815968889 3.46E-06 -1.475836615 0.010860763 BEX1 -1.335518444 1.15E-07 -2.794250569 0.010884063 TNIK 0.736262667 9.35E-07 0.946314557 0.011091689 C1orf168 -0.637748 2.07E-06 -2.444076305 0.011212418 KCNMB2 -0.588187778 0.000811883 -2.576670304 0.011347452 IL8 0.680208667 0.004446595 2.458314968 0.011386235 CKS2 0.702544889 5.44E-05 1.029911198 0.011390392 WDHD1 0.657241556 7.39E-06 0.801578944 0.011415948 PDLIM7 0.919399333 5.16E-09 0.971597922 0.011415948 LEF1 1.310412667 4.43E-09 1.107659041 0.0114759 ITGA5 0.659138222 0.001219761 1.160554072 0.01166468 ST18 -0.679219778 0.00054872 -2.568448719 0.011796434 IFI30 0.638272 0.000652307 1.002418408 0.012072029 KRT8 0.783847556 0.001287657 0.908046626 0.012075281 PLXDC2 0.714423556 0.001746864 1.26117721 0.012075281 KRT18 0.655966889 0.003850593 0.965261189 0.01213022 DCBLD1 0.780230222 9.64E-08 0.65594495 0.012257078 CALD1 0.861876 3.39E-05 1.058244617 0.012368161 ZNF532 0.714592 3.54E-06 0.894642638 0.012418833 PDPN 0.718622667 9.13E-05 2.0882646 0.012449465 MUC5B 0.691312444 0.003265112 3.127126469 0.012618184 CCNB1 0.992752444 2.56E-07 0.817711905 0.012689048 CYP2S1 0.637735778 2.30E-06 2.229228546 0.012721096 HLA-F 0.614674222 0.000182496 0.966054576 0.0127255 MYEF2 -0.754610222 1.56E-05 -1.419836021 0.01292792 ARHGAP26 0.609520222 0.000201497 0.958497488 0.012986457 ITGA11 1.372391556 7.90E-11 1.627188372 0.01300591 ANTXR1 1.590433778 5.44E-09 1.396908703 0.013011092
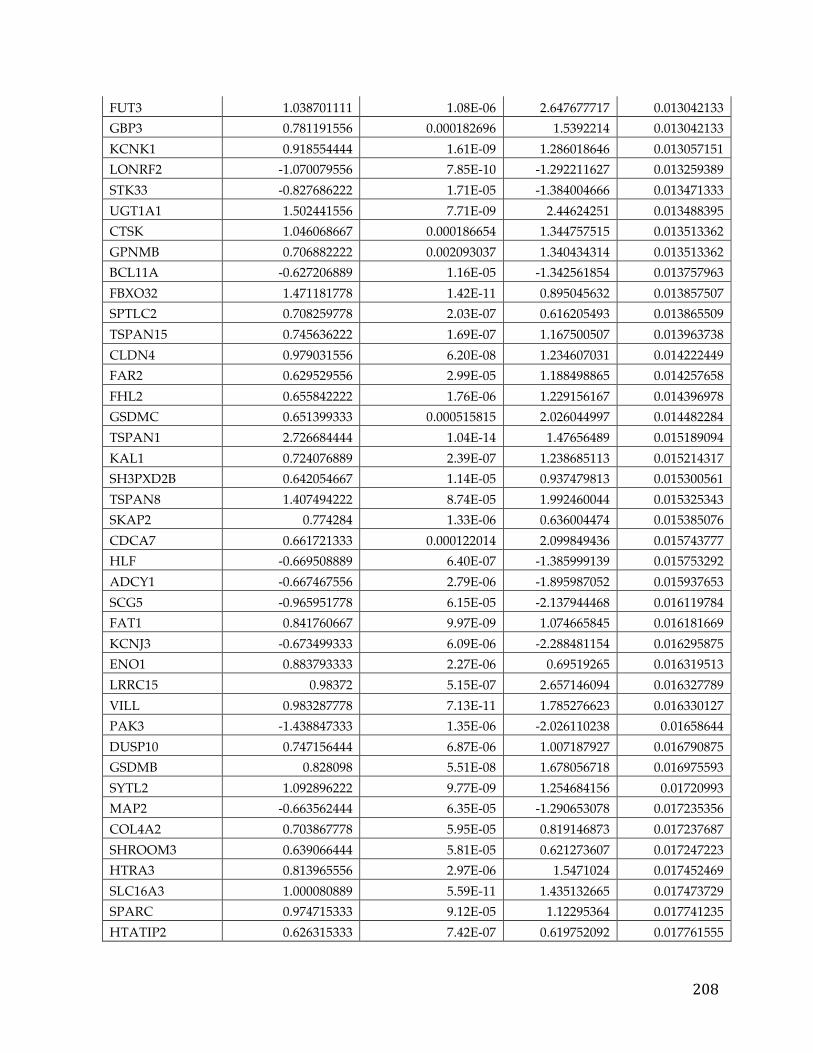
208
FUT3 1.038701111 1.08E-06 2.647677717 0.013042133 GBP3 0.781191556 0.000182696 1.5392214 0.013042133 KCNK1 0.918554444 1.61E-09 1.286018646 0.013057151 LONRF2 -1.070079556 7.85E-10 -1.292211627 0.013259389 STK33 -0.827686222 1.71E-05 -1.384004666 0.013471333 UGT1A1 1.502441556 7.71E-09 2.44624251 0.013488395 CTSK 1.046068667 0.000186654 1.344757515 0.013513362 GPNMB 0.706882222 0.002093037 1.340434314 0.013513362 BCL11A -0.627206889 1.16E-05 -1.342561854 0.013757963 FBXO32 1.471181778 1.42E-11 0.895045632 0.013857507 SPTLC2 0.708259778 2.03E-07 0.616205493 0.013865509 TSPAN15 0.745636222 1.69E-07 1.167500507 0.013963738 CLDN4 0.979031556 6.20E-08 1.234607031 0.014222449 FAR2 0.629529556 2.99E-05 1.188498865 0.014257658 FHL2 0.655842222 1.76E-06 1.229156167 0.014396978 GSDMC 0.651399333 0.000515815 2.026044997 0.014482284 TSPAN1 2.726684444 1.04E-14 1.47656489 0.015189094 KAL1 0.724076889 2.39E-07 1.238685113 0.015214317 SH3PXD2B 0.642054667 1.14E-05 0.937479813 0.015300561 TSPAN8 1.407494222 8.74E-05 1.992460044 0.015325343 SKAP2 0.774284 1.33E-06 0.636004474 0.015385076 CDCA7 0.661721333 0.000122014 2.099849436 0.015743777 HLF -0.669508889 6.40E-07 -1.385999139 0.015753292 ADCY1 -0.667467556 2.79E-06 -1.895987052 0.015937653 SCG5 -0.965951778 6.15E-05 -2.137944468 0.016119784 FAT1 0.841760667 9.97E-09 1.074665845 0.016181669 KCNJ3 -0.673499333 6.09E-06 -2.288481154 0.016295875 ENO1 0.883793333 2.27E-06 0.69519265 0.016319513 LRRC15 0.98372 5.15E-07 2.657146094 0.016327789 VILL 0.983287778 7.13E-11 1.785276623 0.016330127 PAK3 -1.438847333 1.35E-06 -2.026110238 0.01658644 DUSP10 0.747156444 6.87E-06 1.007187927 0.016790875 GSDMB 0.828098 5.51E-08 1.678056718 0.016975593 SYTL2 1.092896222 9.77E-09 1.254684156 0.01720993 MAP2 -0.663562444 6.35E-05 -1.290653078 0.017235356 COL4A2 0.703867778 5.95E-05 0.819146873 0.017237687 SHROOM3 0.639066444 5.81E-05 0.621273607 0.017247223 HTRA3 0.813965556 2.97E-06 1.5471024 0.017452469 SLC16A3 1.000080889 5.59E-11 1.435132665 0.017473729 SPARC 0.974715333 9.12E-05 1.12295364 0.017741235 HTATIP2 0.626315333 7.42E-07 0.619752092 0.017761555
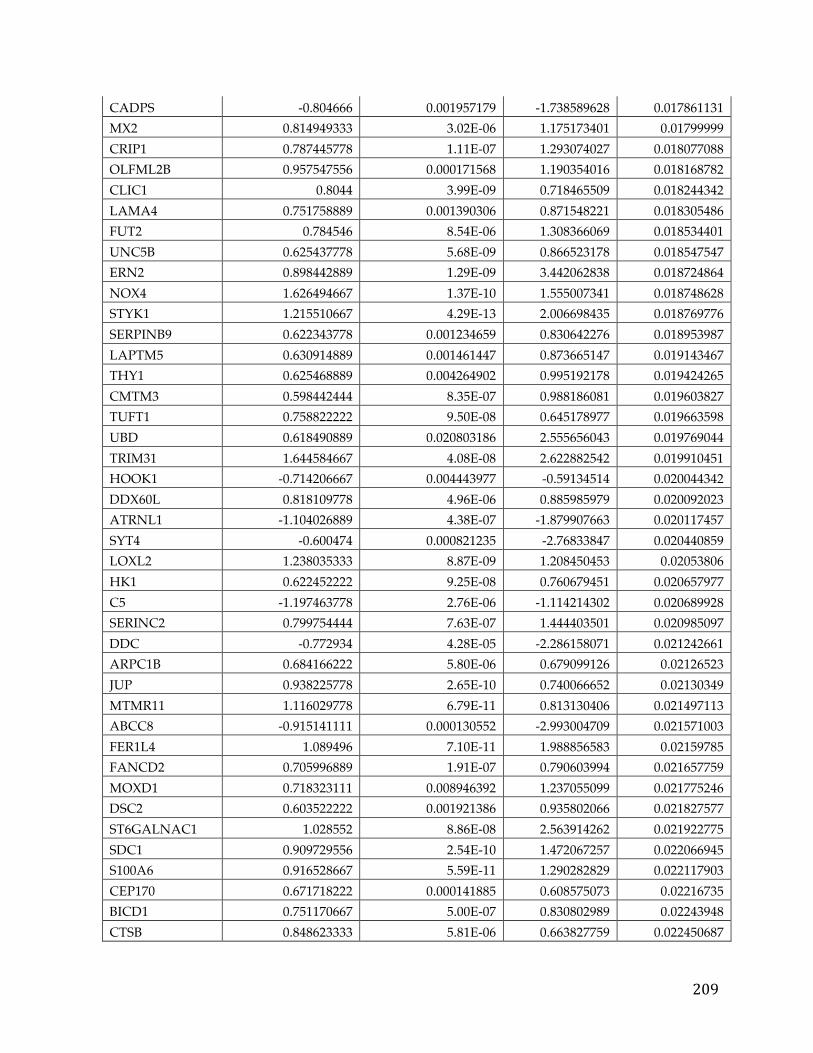
209
CADPS -0.804666 0.001957179 -1.738589628 0.017861131 MX2 0.814949333 3.02E-06 1.175173401 0.01799999 CRIP1 0.787445778 1.11E-07 1.293074027 0.018077088 OLFML2B 0.957547556 0.000171568 1.190354016 0.018168782 CLIC1 0.8044 3.99E-09 0.718465509 0.018244342 LAMA4 0.751758889 0.001390306 0.871548221 0.018305486 FUT2 0.784546 8.54E-06 1.308366069 0.018534401 UNC5B 0.625437778 5.68E-09 0.866523178 0.018547547 ERN2 0.898442889 1.29E-09 3.442062838 0.018724864 NOX4 1.626494667 1.37E-10 1.555007341 0.018748628 STYK1 1.215510667 4.29E-13 2.006698435 0.018769776 SERPINB9 0.622343778 0.001234659 0.830642276 0.018953987 LAPTM5 0.630914889 0.001461447 0.873665147 0.019143467 THY1 0.625468889 0.004264902 0.995192178 0.019424265 CMTM3 0.598442444 8.35E-07 0.988186081 0.019603827 TUFT1 0.758822222 9.50E-08 0.645178977 0.019663598 UBD 0.618490889 0.020803186 2.555656043 0.019769044 TRIM31 1.644584667 4.08E-08 2.622882542 0.019910451 HOOK1 -0.714206667 0.004443977 -0.59134514 0.020044342 DDX60L 0.818109778 4.96E-06 0.885985979 0.020092023 ATRNL1 -1.104026889 4.38E-07 -1.879907663 0.020117457 SYT4 -0.600474 0.000821235 -2.76833847 0.020440859 LOXL2 1.238035333 8.87E-09 1.208450453 0.02053806 HK1 0.622452222 9.25E-08 0.760679451 0.020657977 C5 -1.197463778 2.76E-06 -1.114214302 0.020689928 SERINC2 0.799754444 7.63E-07 1.444403501 0.020985097 DDC -0.772934 4.28E-05 -2.286158071 0.021242661 ARPC1B 0.684166222 5.80E-06 0.679099126 0.02126523 JUP 0.938225778 2.65E-10 0.740066652 0.02130349 MTMR11 1.116029778 6.79E-11 0.813130406 0.021497113 ABCC8 -0.915141111 0.000130552 -2.993004709 0.021571003 FER1L4 1.089496 7.10E-11 1.988856583 0.02159785 FANCD2 0.705996889 1.91E-07 0.790603994 0.021657759 MOXD1 0.718323111 0.008946392 1.237055099 0.021775246 DSC2 0.603522222 0.001921386 0.935802066 0.021827577 ST6GALNAC1 1.028552 8.86E-08 2.563914262 0.021922775 SDC1 0.909729556 2.54E-10 1.472067257 0.022066945 S100A6 0.916528667 5.59E-11 1.290282829 0.022117903 CEP170 0.671718222 0.000141885 0.608575073 0.02216735 BICD1 0.751170667 5.00E-07 0.830802989 0.02243948 CTSB 0.848623333 5.81E-06 0.663827759 0.022450687
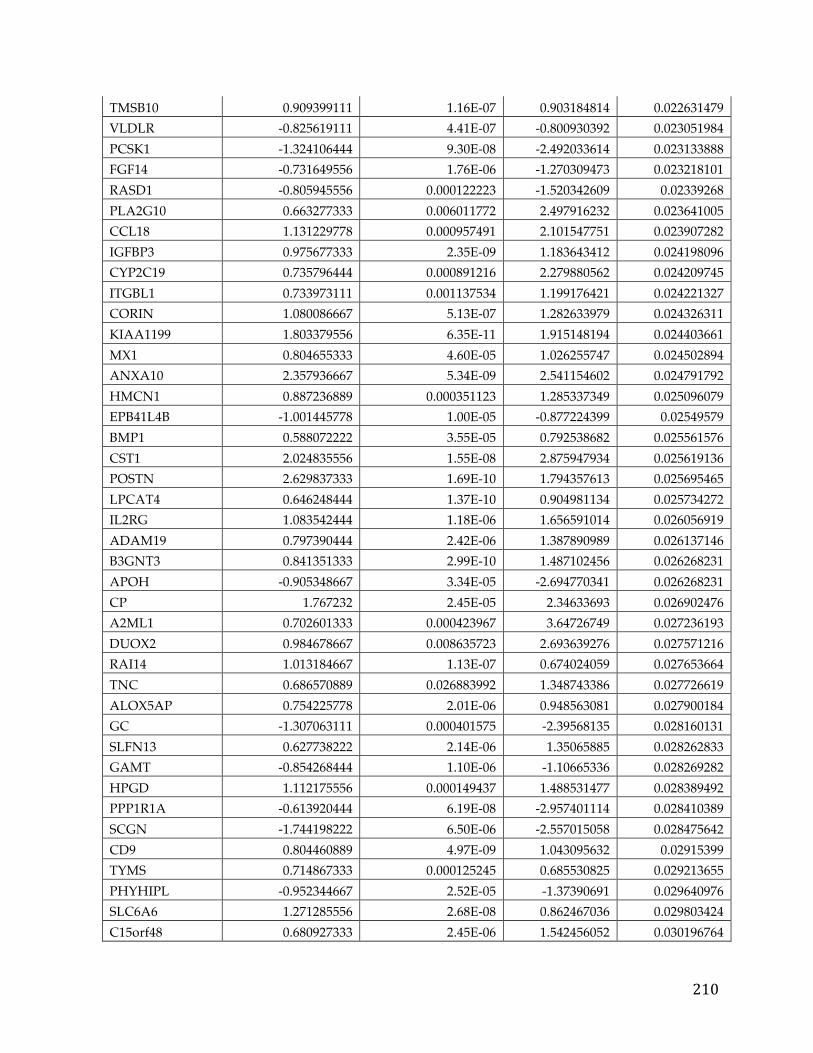
210
TMSB10 0.909399111 1.16E-07 0.903184814 0.022631479 VLDLR -0.825619111 4.41E-07 -0.800930392 0.023051984 PCSK1 -1.324106444 9.30E-08 -2.492033614 0.023133888 FGF14 -0.731649556 1.76E-06 -1.270309473 0.023218101 RASD1 -0.805945556 0.000122223 -1.520342609 0.02339268 PLA2G10 0.663277333 0.006011772 2.497916232 0.023641005 CCL18 1.131229778 0.000957491 2.101547751 0.023907282 IGFBP3 0.975677333 2.35E-09 1.183643412 0.024198096 CYP2C19 0.735796444 0.000891216 2.279880562 0.024209745 ITGBL1 0.733973111 0.001137534 1.199176421 0.024221327 CORIN 1.080086667 5.13E-07 1.282633979 0.024326311 KIAA1199 1.803379556 6.35E-11 1.915148194 0.024403661 MX1 0.804655333 4.60E-05 1.026255747 0.024502894 ANXA10 2.357936667 5.34E-09 2.541154602 0.024791792 HMCN1 0.887236889 0.000351123 1.285337349 0.025096079 EPB41L4B -1.001445778 1.00E-05 -0.877224399 0.02549579 BMP1 0.588072222 3.55E-05 0.792538682 0.025561576 CST1 2.024835556 1.55E-08 2.875947934 0.025619136 POSTN 2.629837333 1.69E-10 1.794357613 0.025695465 LPCAT4 0.646248444 1.37E-10 0.904981134 0.025734272 IL2RG 1.083542444 1.18E-06 1.656591014 0.026056919 ADAM19 0.797390444 2.42E-06 1.387890989 0.026137146 B3GNT3 0.841351333 2.99E-10 1.487102456 0.026268231 APOH -0.905348667 3.34E-05 -2.694770341 0.026268231 CP 1.767232 2.45E-05 2.34633693 0.026902476 A2ML1 0.702601333 0.000423967 3.64726749 0.027236193 DUOX2 0.984678667 0.008635723 2.693639276 0.027571216 RAI14 1.013184667 1.13E-07 0.674024059 0.027653664 TNC 0.686570889 0.026883992 1.348743386 0.027726619 ALOX5AP 0.754225778 2.01E-06 0.948563081 0.027900184 GC -1.307063111 0.000401575 -2.39568135 0.028160131 SLFN13 0.627738222 2.14E-06 1.35065885 0.028262833 GAMT -0.854268444 1.10E-06 -1.10665336 0.028269282 HPGD 1.112175556 0.000149437 1.488531477 0.028389492 PPP1R1A -0.613920444 6.19E-08 -2.957401114 0.028410389 SCGN -1.744198222 6.50E-06 -2.557015058 0.028475642 CD9 0.804460889 4.97E-09 1.043095632 0.02915399 TYMS 0.714867333 0.000125245 0.685530825 0.029213655 PHYHIPL -0.952344667 2.52E-05 -1.37390691 0.029640976 SLC6A6 1.271285556 2.68E-08 0.862467036 0.029803424 C15orf48 0.680927333 2.45E-06 1.542456052 0.030196764
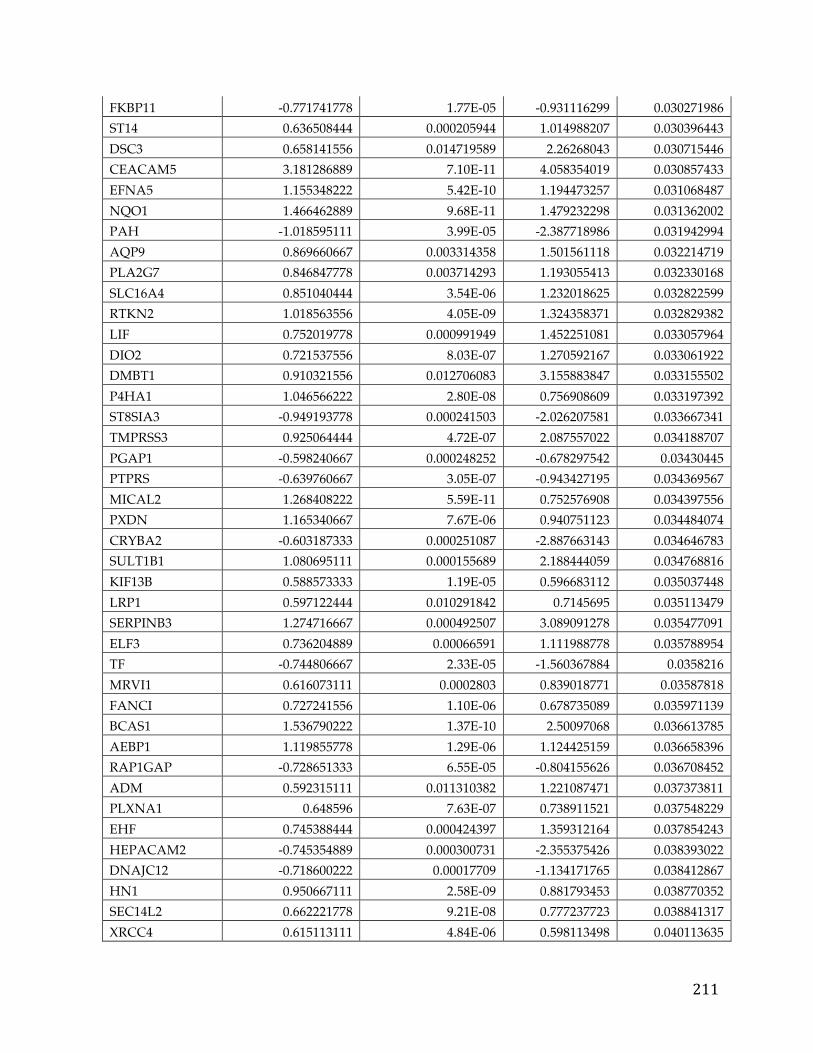
211
FKBP11 -0.771741778 1.77E-05 -0.931116299 0.030271986 ST14 0.636508444 0.000205944 1.014988207 0.030396443 DSC3 0.658141556 0.014719589 2.26268043 0.030715446 CEACAM5 3.181286889 7.10E-11 4.058354019 0.030857433 EFNA5 1.155348222 5.42E-10 1.194473257 0.031068487 NQO1 1.466462889 9.68E-11 1.479232298 0.031362002 PAH -1.018595111 3.99E-05 -2.387718986 0.031942994 AQP9 0.869660667 0.003314358 1.501561118 0.032214719 PLA2G7 0.846847778 0.003714293 1.193055413 0.032330168 SLC16A4 0.851040444 3.54E-06 1.232018625 0.032822599 RTKN2 1.018563556 4.05E-09 1.324358371 0.032829382 LIF 0.752019778 0.000991949 1.452251081 0.033057964 DIO2 0.721537556 8.03E-07 1.270592167 0.033061922 DMBT1 0.910321556 0.012706083 3.155883847 0.033155502 P4HA1 1.046566222 2.80E-08 0.756908609 0.033197392 ST8SIA3 -0.949193778 0.000241503 -2.026207581 0.033667341 TMPRSS3 0.925064444 4.72E-07 2.087557022 0.034188707 PGAP1 -0.598240667 0.000248252 -0.678297542 0.03430445 PTPRS -0.639760667 3.05E-07 -0.943427195 0.034369567 MICAL2 1.268408222 5.59E-11 0.752576908 0.034397556 PXDN 1.165340667 7.67E-06 0.940751123 0.034484074 CRYBA2 -0.603187333 0.000251087 -2.887663143 0.034646783 SULT1B1 1.080695111 0.000155689 2.188444059 0.034768816 KIF13B 0.588573333 1.19E-05 0.596683112 0.035037448 LRP1 0.597122444 0.010291842 0.7145695 0.035113479 SERPINB3 1.274716667 0.000492507 3.089091278 0.035477091 ELF3 0.736204889 0.00066591 1.111988778 0.035788954 TF -0.744806667 2.33E-05 -1.560367884 0.0358216 MRVI1 0.616073111 0.0002803 0.839018771 0.03587818 FANCI 0.727241556 1.10E-06 0.678735089 0.035971139 BCAS1 1.536790222 1.37E-10 2.50097068 0.036613785 AEBP1 1.119855778 1.29E-06 1.124425159 0.036658396 RAP1GAP -0.728651333 6.55E-05 -0.804155626 0.036708452 ADM 0.592315111 0.011310382 1.221087471 0.037373811 PLXNA1 0.648596 7.63E-07 0.738911521 0.037548229 EHF 0.745388444 0.000424397 1.359312164 0.037854243 HEPACAM2 -0.745354889 0.000300731 -2.355375426 0.038393022 DNAJC12 -0.718600222 0.00017709 -1.134171765 0.038412867 HN1 0.950667111 2.58E-09 0.881793453 0.038770352 SEC14L2 0.662221778 9.21E-08 0.777237723 0.038841317 XRCC4 0.615113111 4.84E-06 0.598113498 0.040113635
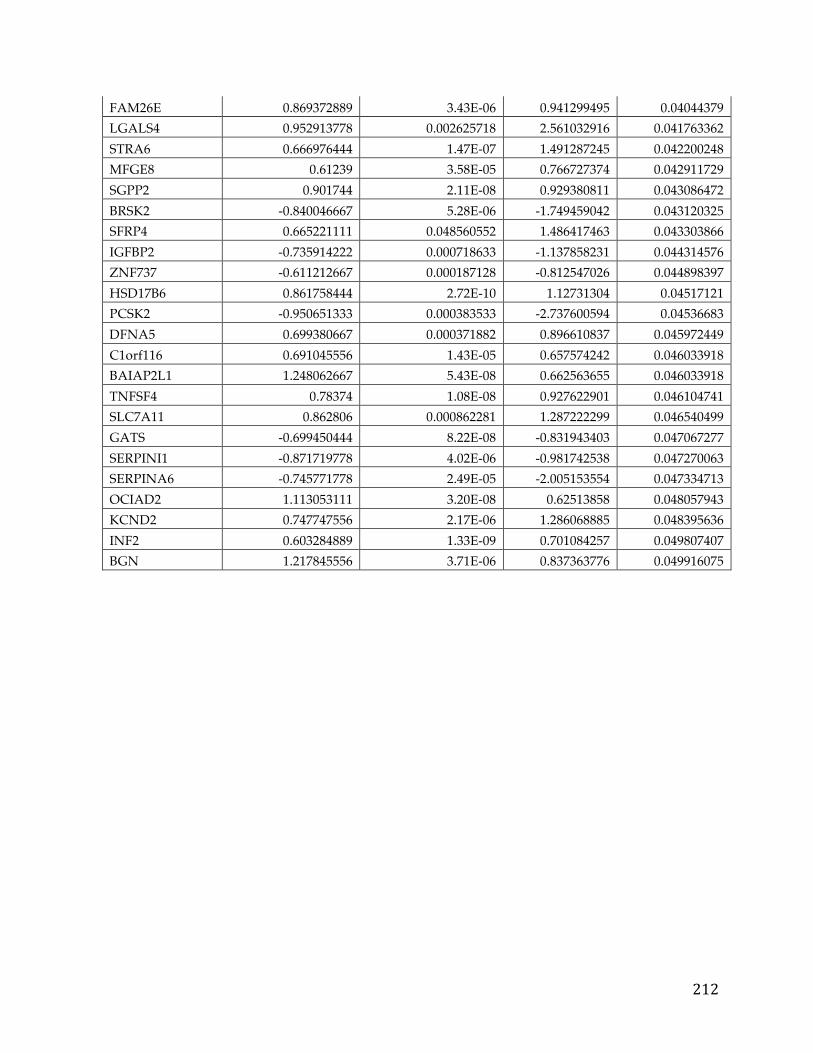
212
FAM26E 0.869372889 3.43E-06 0.941299495 0.04044379 LGALS4 0.952913778 0.002625718 2.561032916 0.041763362 STRA6 0.666976444 1.47E-07 1.491287245 0.042200248 MFGE8 0.61239 3.58E-05 0.766727374 0.042911729 SGPP2 0.901744 2.11E-08 0.929380811 0.043086472 BRSK2 -0.840046667 5.28E-06 -1.749459042 0.043120325 SFRP4 0.665221111 0.048560552 1.486417463 0.043303866 IGFBP2 -0.735914222 0.000718633 -1.137858231 0.044314576 ZNF737 -0.611212667 0.000187128 -0.812547026 0.044898397 HSD17B6 0.861758444 2.72E-10 1.12731304 0.04517121 PCSK2 -0.950651333 0.000383533 -2.737600594 0.04536683 DFNA5 0.699380667 0.000371882 0.896610837 0.045972449 C1orf116 0.691045556 1.43E-05 0.657574242 0.046033918 BAIAP2L1 1.248062667 5.43E-08 0.662563655 0.046033918 TNFSF4 0.78374 1.08E-08 0.927622901 0.046104741 SLC7A11 0.862806 0.000862281 1.287222299 0.046540499 GATS -0.699450444 8.22E-08 -0.831943403 0.047067277 SERPINI1 -0.871719778 4.02E-06 -0.981742538 0.047270063 SERPINA6 -0.745771778 2.49E-05 -2.005153554 0.047334713 OCIAD2 1.113053111 3.20E-08 0.62513858 0.048057943 KCND2 0.747747556 2.17E-06 1.286068885 0.048395636 INF2 0.603284889 1.33E-09 0.701084257 0.049807407 BGN 1.217845556 3.71E-06 0.837363776 0.049916075
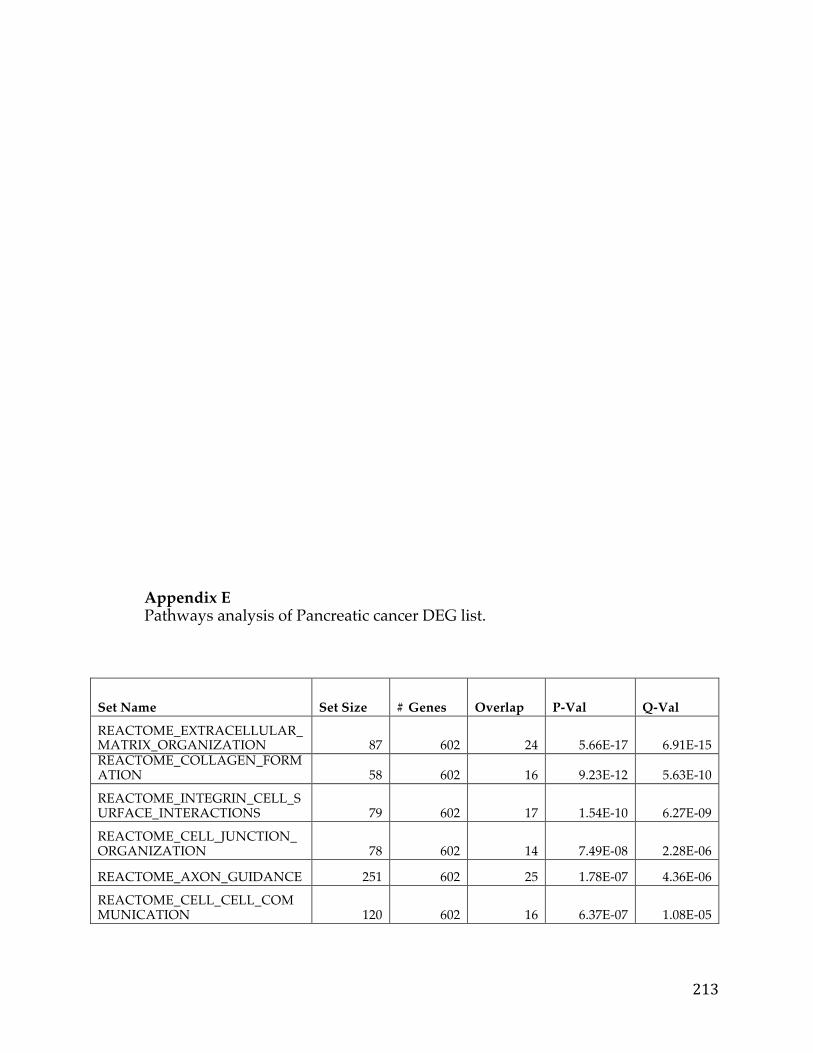
213
Appendix E Pathways analysis of Pancreatic cancer DEG list.
Set Name Set Size # Genes Overlap P-Val Q-Val
REACTOME_EXTRACELLULAR_MATRIX_ORGANIZATION 87 602 24 5.66E-17 6.91E-15 REACTOME_COLLAGEN_FORMATION 58 602 16 9.23E-12 5.63E-10
REACTOME_INTEGRIN_CELL_SURFACE_INTERACTIONS 79 602 17 1.54E-10 6.27E-09
REACTOME_CELL_JUNCTION_ORGANIZATION 78 602 14 7.49E-08 2.28E-06
REACTOME_AXON_GUIDANCE 251 602 25 1.78E-07 4.36E-06
REACTOME_CELL_CELL_COMMUNICATION 120 602 16 6.37E-07 1.08E-05
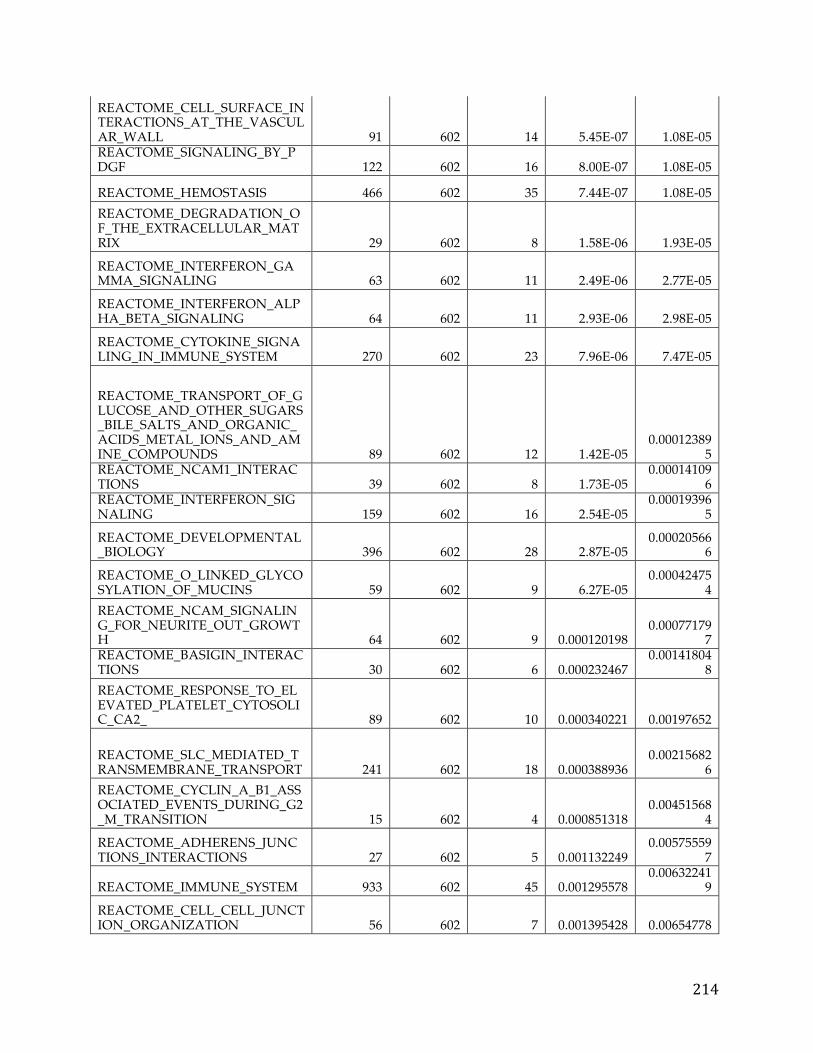
214
REACTOME_CELL_SURFACE_INTERACTIONS_AT_THE_VASCULAR_WALL 91 602 14 5.45E-07 1.08E-05 REACTOME_SIGNALING_BY_PDGF 122 602 16 8.00E-07 1.08E-05
REACTOME_HEMOSTASIS 466 602 35 7.44E-07 1.08E-05 REACTOME_DEGRADATION_OF_THE_EXTRACELLULAR_MATRIX 29 602 8 1.58E-06 1.93E-05
REACTOME_INTERFERON_GAMMA_SIGNALING 63 602 11 2.49E-06 2.77E-05
REACTOME_INTERFERON_ALPHA_BETA_SIGNALING 64 602 11 2.93E-06 2.98E-05
REACTOME_CYTOKINE_SIGNALING_IN_IMMUNE_SYSTEM 270 602 23 7.96E-06 7.47E-05
REACTOME_TRANSPORT_OF_GLUCOSE_AND_OTHER_SUGARS_BILE_SALTS_AND_ORGANIC_ACIDS_METAL_IONS_AND_AMINE_COMPOUNDS 89 602 12 1.42E-05
0.000123895
REACTOME_NCAM1_INTERACTIONS 39 602 8 1.73E-05
0.000141096
REACTOME_INTERFERON_SIGNALING 159 602 16 2.54E-05
0.000193965
REACTOME_DEVELOPMENTAL_BIOLOGY 396 602 28 2.87E-05
0.000205666
REACTOME_O_LINKED_GLYCOSYLATION_OF_MUCINS 59 602 9 6.27E-05
0.000424754
REACTOME_NCAM_SIGNALING_FOR_NEURITE_OUT_GROWTH 64 602 9 0.000120198
0.000771797
REACTOME_BASIGIN_INTERACTIONS 30 602 6 0.000232467
0.001418048
REACTOME_RESPONSE_TO_ELEVATED_PLATELET_CYTOSOLIC_CA2_ 89 602 10 0.000340221 0.00197652
REACTOME_SLC_MEDIATED_TRANSMEMBRANE_TRANSPORT 241 602 18 0.000388936
0.002156826
REACTOME_CYCLIN_A_B1_ASSOCIATED_EVENTS_DURING_G2_M_TRANSITION 15 602 4 0.000851318
0.004515684
REACTOME_ADHERENS_JUNCTIONS_INTERACTIONS 27 602 5 0.001132249
0.005755597
REACTOME_IMMUNE_SYSTEM 933 602 45 0.001295578 0.00632241
9
REACTOME_CELL_CELL_JUNCTION_ORGANIZATION 56 602 7 0.001395428 0.00654778
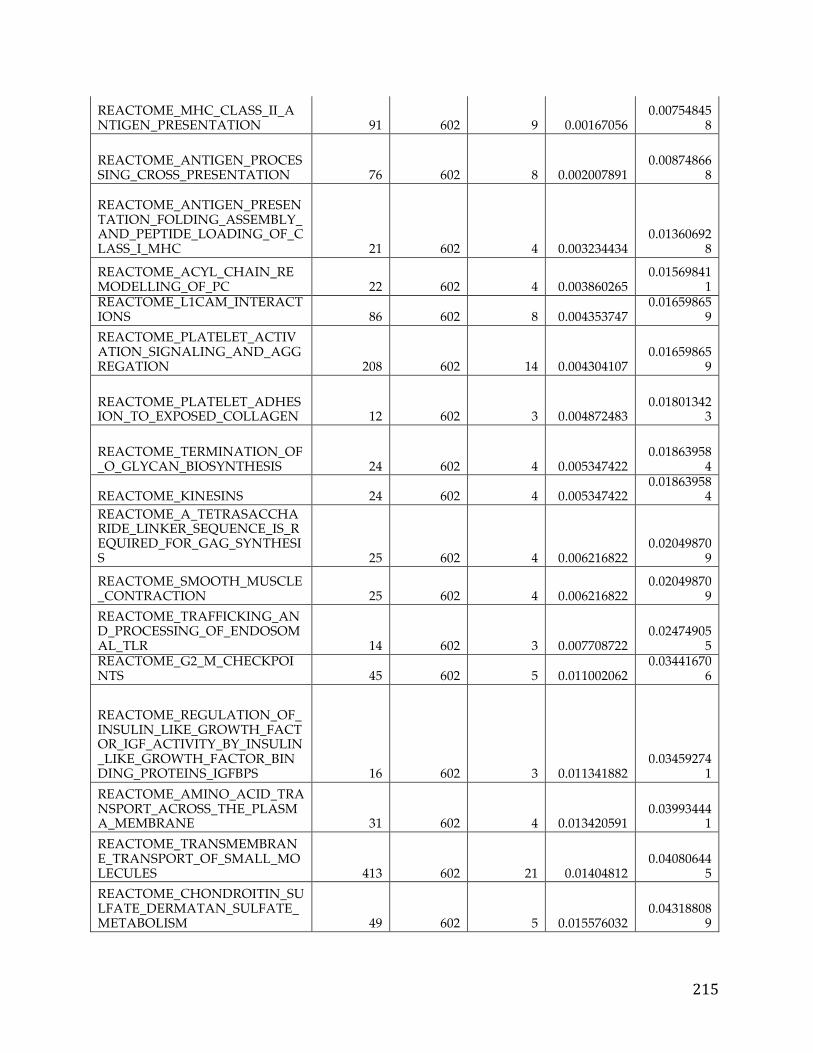
215
REACTOME_MHC_CLASS_II_ANTIGEN_PRESENTATION 91 602 9 0.00167056
0.007548458
REACTOME_ANTIGEN_PROCESSING_CROSS_PRESENTATION 76 602 8 0.002007891
0.008748668
REACTOME_ANTIGEN_PRESENTATION_FOLDING_ASSEMBLY_AND_PEPTIDE_LOADING_OF_CLASS_I_MHC 21 602 4 0.003234434
0.013606928
REACTOME_ACYL_CHAIN_REMODELLING_OF_PC 22 602 4 0.003860265
0.015698411
REACTOME_L1CAM_INTERACTIONS 86 602 8 0.004353747
0.016598659
REACTOME_PLATELET_ACTIVATION_SIGNALING_AND_AGGREGATION 208 602 14 0.004304107
0.016598659
REACTOME_PLATELET_ADHESION_TO_EXPOSED_COLLAGEN 12 602 3 0.004872483
0.018013423
REACTOME_TERMINATION_OF_O_GLYCAN_BIOSYNTHESIS 24 602 4 0.005347422
0.018639584
REACTOME_KINESINS 24 602 4 0.005347422 0.01863958
4 REACTOME_A_TETRASACCHARIDE_LINKER_SEQUENCE_IS_REQUIRED_FOR_GAG_SYNTHESIS 25 602 4 0.006216822
0.020498709
REACTOME_SMOOTH_MUSCLE_CONTRACTION 25 602 4 0.006216822
0.020498709
REACTOME_TRAFFICKING_AND_PROCESSING_OF_ENDOSOMAL_TLR 14 602 3 0.007708722
0.024749055
REACTOME_G2_M_CHECKPOINTS 45 602 5 0.011002062
0.034416706
REACTOME_REGULATION_OF_INSULIN_LIKE_GROWTH_FACTOR_IGF_ACTIVITY_BY_INSULIN_LIKE_GROWTH_FACTOR_BINDING_PROTEINS_IGFBPS 16 602 3 0.011341882
0.034592741
REACTOME_AMINO_ACID_TRANSPORT_ACROSS_THE_PLASMA_MEMBRANE 31 602 4 0.013420591
0.039934441
REACTOME_TRANSMEMBRANE_TRANSPORT_OF_SMALL_MOLECULES 413 602 21 0.01404812
0.040806445
REACTOME_CHONDROITIN_SULFATE_DERMATAN_SULFATE_METABOLISM 49 602 5 0.015576032
0.043188089
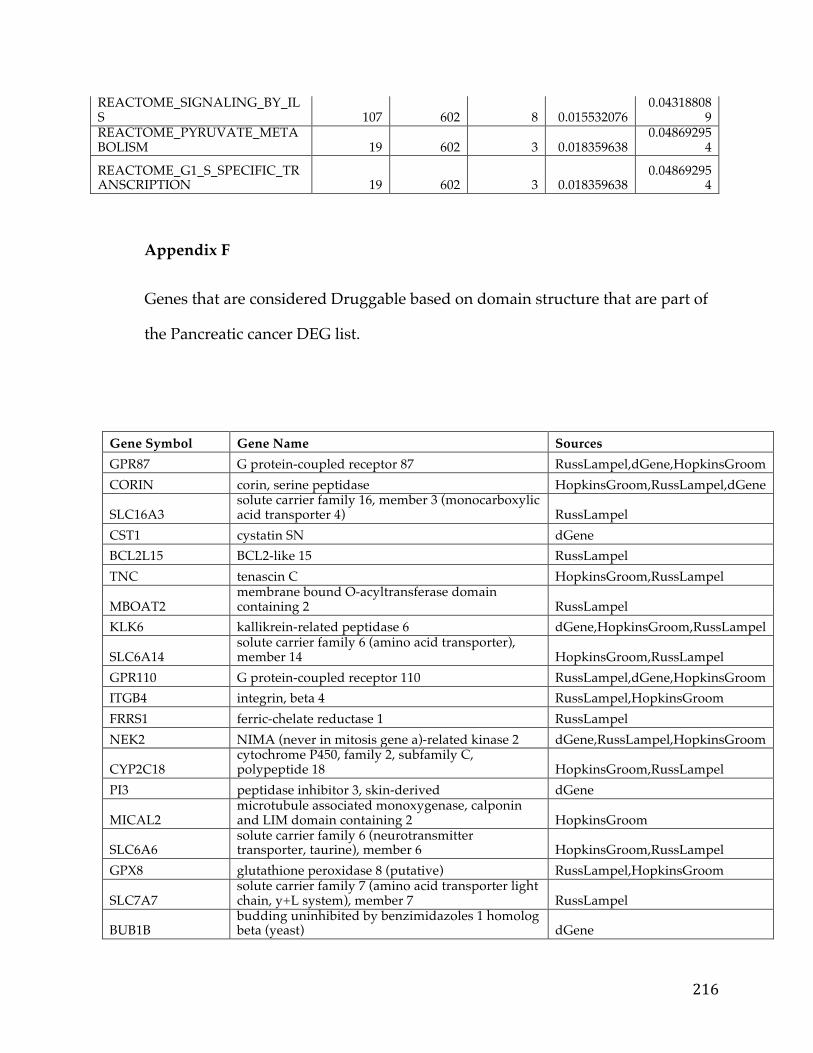
216
REACTOME_SIGNALING_BY_ILS 107 602 8 0.015532076
0.043188089
REACTOME_PYRUVATE_METABOLISM 19 602 3 0.018359638
0.048692954
REACTOME_G1_S_SPECIFIC_TRANSCRIPTION 19 602 3 0.018359638
0.048692954
Appendix F
Genes that are considered Druggable based on domain structure that are part of
the Pancreatic cancer DEG list.
Gene Symbol Gene Name Sources GPR87 G protein-coupled receptor 87 RussLampel,dGene,HopkinsGroom CORIN corin, serine peptidase HopkinsGroom,RussLampel,dGene
SLC16A3 solute carrier family 16, member 3 (monocarboxylic acid transporter 4) RussLampel
CST1 cystatin SN dGene BCL2L15 BCL2-like 15 RussLampel TNC tenascin C HopkinsGroom,RussLampel
MBOAT2 membrane bound O-acyltransferase domain containing 2 RussLampel
KLK6 kallikrein-related peptidase 6 dGene,HopkinsGroom,RussLampel
SLC6A14 solute carrier family 6 (amino acid transporter), member 14 HopkinsGroom,RussLampel
GPR110 G protein-coupled receptor 110 RussLampel,dGene,HopkinsGroom ITGB4 integrin, beta 4 RussLampel,HopkinsGroom FRRS1 ferric-chelate reductase 1 RussLampel NEK2 NIMA (never in mitosis gene a)-related kinase 2 dGene,RussLampel,HopkinsGroom
CYP2C18 cytochrome P450, family 2, subfamily C, polypeptide 18 HopkinsGroom,RussLampel
PI3 peptidase inhibitor 3, skin-derived dGene
MICAL2 microtubule associated monoxygenase, calponin and LIM domain containing 2 HopkinsGroom
SLC6A6 solute carrier family 6 (neurotransmitter transporter, taurine), member 6 HopkinsGroom,RussLampel
GPX8 glutathione peroxidase 8 (putative) RussLampel,HopkinsGroom
SLC7A7 solute carrier family 7 (amino acid transporter light chain, y+L system), member 7 RussLampel
BUB1B budding uninhibited by benzimidazoles 1 homolog beta (yeast) dGene
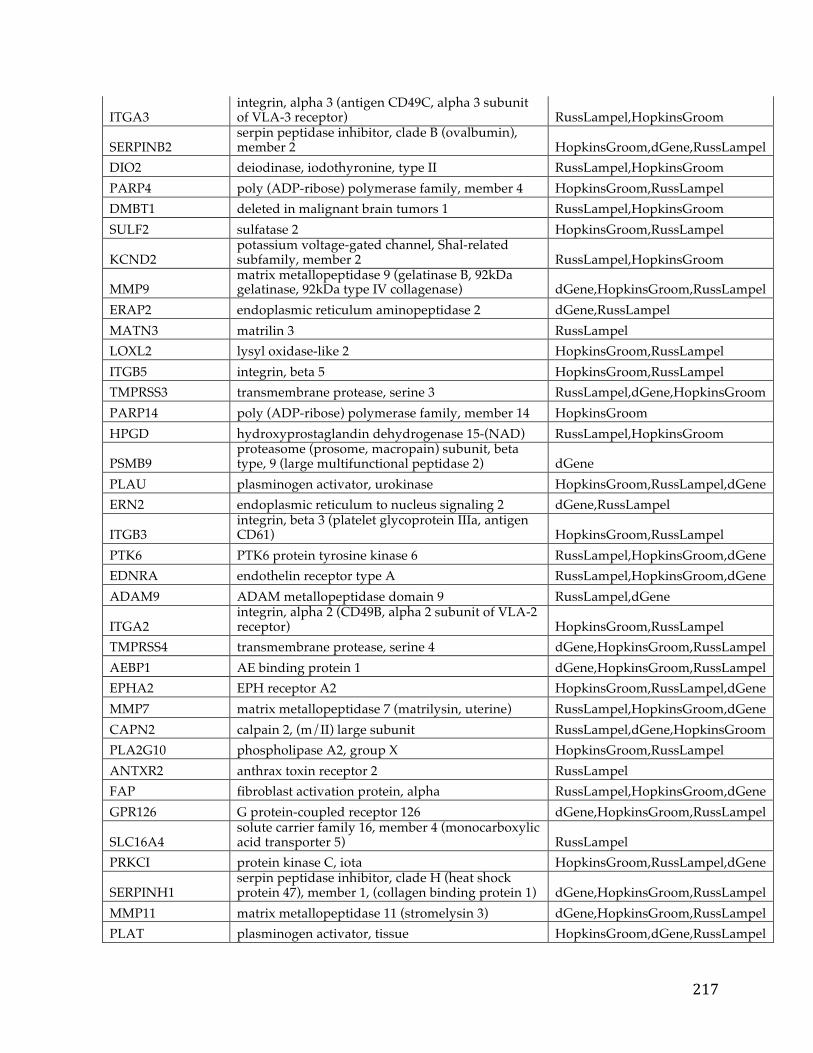
217
ITGA3 integrin, alpha 3 (antigen CD49C, alpha 3 subunit of VLA-3 receptor) RussLampel,HopkinsGroom
SERPINB2 serpin peptidase inhibitor, clade B (ovalbumin), member 2 HopkinsGroom,dGene,RussLampel
DIO2 deiodinase, iodothyronine, type II RussLampel,HopkinsGroom PARP4 poly (ADP-ribose) polymerase family, member 4 HopkinsGroom,RussLampel DMBT1 deleted in malignant brain tumors 1 RussLampel,HopkinsGroom SULF2 sulfatase 2 HopkinsGroom,RussLampel
KCND2 potassium voltage-gated channel, Shal-related subfamily, member 2 RussLampel,HopkinsGroom
MMP9 matrix metallopeptidase 9 (gelatinase B, 92kDa gelatinase, 92kDa type IV collagenase) dGene,HopkinsGroom,RussLampel
ERAP2 endoplasmic reticulum aminopeptidase 2 dGene,RussLampel MATN3 matrilin 3 RussLampel LOXL2 lysyl oxidase-like 2 HopkinsGroom,RussLampel ITGB5 integrin, beta 5 HopkinsGroom,RussLampel TMPRSS3 transmembrane protease, serine 3 RussLampel,dGene,HopkinsGroom PARP14 poly (ADP-ribose) polymerase family, member 14 HopkinsGroom HPGD hydroxyprostaglandin dehydrogenase 15-(NAD) RussLampel,HopkinsGroom
PSMB9 proteasome (prosome, macropain) subunit, beta type, 9 (large multifunctional peptidase 2) dGene
PLAU plasminogen activator, urokinase HopkinsGroom,RussLampel,dGene ERN2 endoplasmic reticulum to nucleus signaling 2 dGene,RussLampel
ITGB3 integrin, beta 3 (platelet glycoprotein IIIa, antigen CD61) HopkinsGroom,RussLampel
PTK6 PTK6 protein tyrosine kinase 6 RussLampel,HopkinsGroom,dGene EDNRA endothelin receptor type A RussLampel,HopkinsGroom,dGene ADAM9 ADAM metallopeptidase domain 9 RussLampel,dGene
ITGA2 integrin, alpha 2 (CD49B, alpha 2 subunit of VLA-2 receptor) HopkinsGroom,RussLampel
TMPRSS4 transmembrane protease, serine 4 dGene,HopkinsGroom,RussLampel AEBP1 AE binding protein 1 dGene,HopkinsGroom,RussLampel EPHA2 EPH receptor A2 HopkinsGroom,RussLampel,dGene MMP7 matrix metallopeptidase 7 (matrilysin, uterine) RussLampel,HopkinsGroom,dGene CAPN2 calpain 2, (m/II) large subunit RussLampel,dGene,HopkinsGroom PLA2G10 phospholipase A2, group X HopkinsGroom,RussLampel ANTXR2 anthrax toxin receptor 2 RussLampel FAP fibroblast activation protein, alpha RussLampel,HopkinsGroom,dGene GPR126 G protein-coupled receptor 126 dGene,HopkinsGroom,RussLampel
SLC16A4 solute carrier family 16, member 4 (monocarboxylic acid transporter 5) RussLampel
PRKCI protein kinase C, iota HopkinsGroom,RussLampel,dGene
SERPINH1 serpin peptidase inhibitor, clade H (heat shock protein 47), member 1, (collagen binding protein 1) dGene,HopkinsGroom,RussLampel
MMP11 matrix metallopeptidase 11 (stromelysin 3) dGene,HopkinsGroom,RussLampel PLAT plasminogen activator, tissue HopkinsGroom,dGene,RussLampel
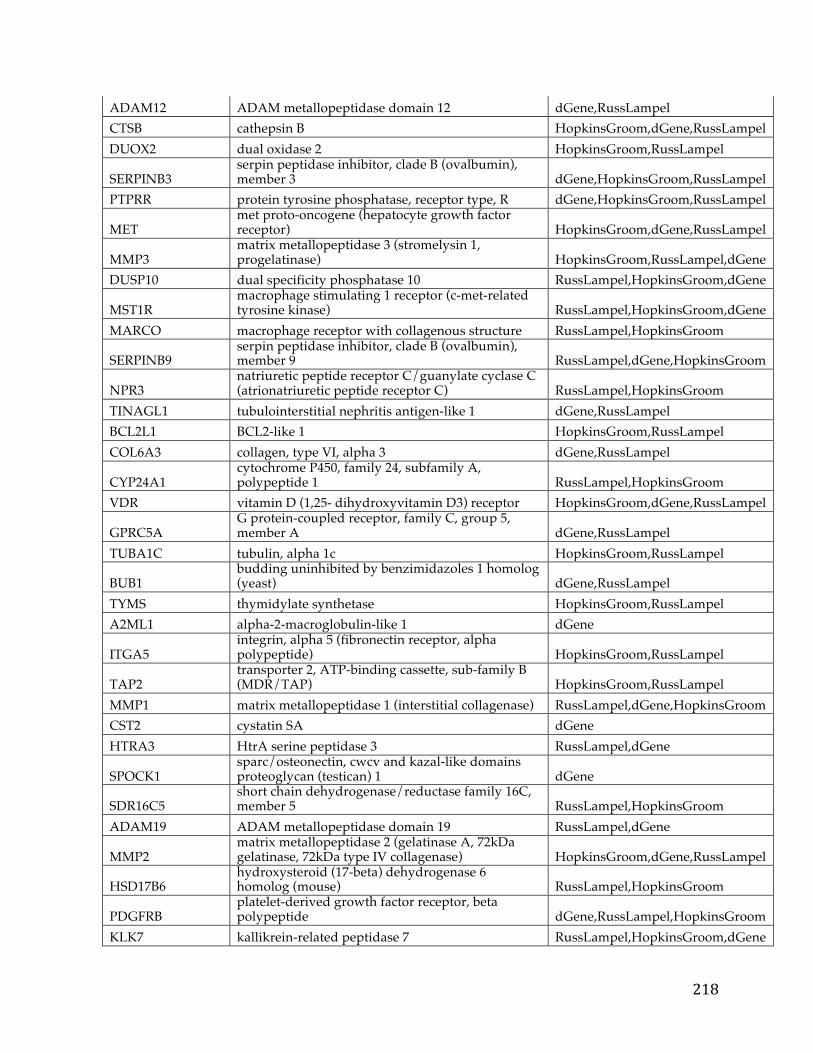
218
ADAM12 ADAM metallopeptidase domain 12 dGene,RussLampel CTSB cathepsin B HopkinsGroom,dGene,RussLampel DUOX2 dual oxidase 2 HopkinsGroom,RussLampel
SERPINB3 serpin peptidase inhibitor, clade B (ovalbumin), member 3 dGene,HopkinsGroom,RussLampel
PTPRR protein tyrosine phosphatase, receptor type, R dGene,HopkinsGroom,RussLampel
MET met proto-oncogene (hepatocyte growth factor receptor) HopkinsGroom,dGene,RussLampel
MMP3 matrix metallopeptidase 3 (stromelysin 1, progelatinase) HopkinsGroom,RussLampel,dGene
DUSP10 dual specificity phosphatase 10 RussLampel,HopkinsGroom,dGene
MST1R macrophage stimulating 1 receptor (c-met-related tyrosine kinase) RussLampel,HopkinsGroom,dGene
MARCO macrophage receptor with collagenous structure RussLampel,HopkinsGroom
SERPINB9 serpin peptidase inhibitor, clade B (ovalbumin), member 9 RussLampel,dGene,HopkinsGroom
NPR3 natriuretic peptide receptor C/guanylate cyclase C (atrionatriuretic peptide receptor C) RussLampel,HopkinsGroom
TINAGL1 tubulointerstitial nephritis antigen-like 1 dGene,RussLampel BCL2L1 BCL2-like 1 HopkinsGroom,RussLampel COL6A3 collagen, type VI, alpha 3 dGene,RussLampel
CYP24A1 cytochrome P450, family 24, subfamily A, polypeptide 1 RussLampel,HopkinsGroom
VDR vitamin D (1,25- dihydroxyvitamin D3) receptor HopkinsGroom,dGene,RussLampel
GPRC5A G protein-coupled receptor, family C, group 5, member A dGene,RussLampel
TUBA1C tubulin, alpha 1c HopkinsGroom,RussLampel
BUB1 budding uninhibited by benzimidazoles 1 homolog (yeast) dGene,RussLampel
TYMS thymidylate synthetase HopkinsGroom,RussLampel A2ML1 alpha-2-macroglobulin-like 1 dGene
ITGA5 integrin, alpha 5 (fibronectin receptor, alpha polypeptide) HopkinsGroom,RussLampel
TAP2 transporter 2, ATP-binding cassette, sub-family B (MDR/TAP) HopkinsGroom,RussLampel
MMP1 matrix metallopeptidase 1 (interstitial collagenase) RussLampel,dGene,HopkinsGroom CST2 cystatin SA dGene HTRA3 HtrA serine peptidase 3 RussLampel,dGene
SPOCK1 sparc/osteonectin, cwcv and kazal-like domains proteoglycan (testican) 1 dGene
SDR16C5 short chain dehydrogenase/reductase family 16C, member 5 RussLampel,HopkinsGroom
ADAM19 ADAM metallopeptidase domain 19 RussLampel,dGene
MMP2 matrix metallopeptidase 2 (gelatinase A, 72kDa gelatinase, 72kDa type IV collagenase) HopkinsGroom,dGene,RussLampel
HSD17B6 hydroxysteroid (17-beta) dehydrogenase 6 homolog (mouse) RussLampel,HopkinsGroom
PDGFRB platelet-derived growth factor receptor, beta polypeptide dGene,RussLampel,HopkinsGroom
KLK7 kallikrein-related peptidase 7 RussLampel,HopkinsGroom,dGene
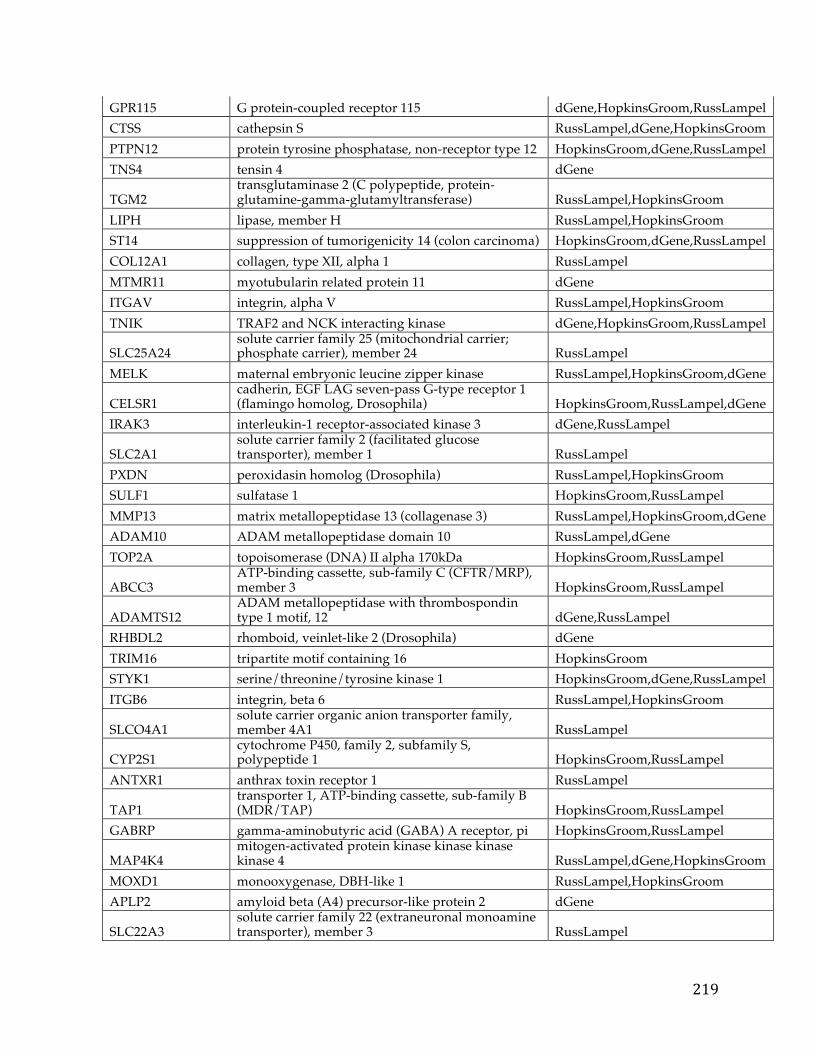
219
GPR115 G protein-coupled receptor 115 dGene,HopkinsGroom,RussLampel CTSS cathepsin S RussLampel,dGene,HopkinsGroom PTPN12 protein tyrosine phosphatase, non-receptor type 12 HopkinsGroom,dGene,RussLampel TNS4 tensin 4 dGene
TGM2 transglutaminase 2 (C polypeptide, protein-glutamine-gamma-glutamyltransferase) RussLampel,HopkinsGroom
LIPH lipase, member H RussLampel,HopkinsGroom ST14 suppression of tumorigenicity 14 (colon carcinoma) HopkinsGroom,dGene,RussLampel COL12A1 collagen, type XII, alpha 1 RussLampel MTMR11 myotubularin related protein 11 dGene ITGAV integrin, alpha V RussLampel,HopkinsGroom TNIK TRAF2 and NCK interacting kinase dGene,HopkinsGroom,RussLampel
SLC25A24 solute carrier family 25 (mitochondrial carrier; phosphate carrier), member 24 RussLampel
MELK maternal embryonic leucine zipper kinase RussLampel,HopkinsGroom,dGene
CELSR1 cadherin, EGF LAG seven-pass G-type receptor 1 (flamingo homolog, Drosophila) HopkinsGroom,RussLampel,dGene
IRAK3 interleukin-1 receptor-associated kinase 3 dGene,RussLampel
SLC2A1 solute carrier family 2 (facilitated glucose transporter), member 1 RussLampel
PXDN peroxidasin homolog (Drosophila) RussLampel,HopkinsGroom SULF1 sulfatase 1 HopkinsGroom,RussLampel MMP13 matrix metallopeptidase 13 (collagenase 3) RussLampel,HopkinsGroom,dGene ADAM10 ADAM metallopeptidase domain 10 RussLampel,dGene TOP2A topoisomerase (DNA) II alpha 170kDa HopkinsGroom,RussLampel
ABCC3 ATP-binding cassette, sub-family C (CFTR/MRP), member 3 HopkinsGroom,RussLampel
ADAMTS12 ADAM metallopeptidase with thrombospondin type 1 motif, 12 dGene,RussLampel
RHBDL2 rhomboid, veinlet-like 2 (Drosophila) dGene TRIM16 tripartite motif containing 16 HopkinsGroom STYK1 serine/threonine/tyrosine kinase 1 HopkinsGroom,dGene,RussLampel ITGB6 integrin, beta 6 RussLampel,HopkinsGroom
SLCO4A1 solute carrier organic anion transporter family, member 4A1 RussLampel
CYP2S1 cytochrome P450, family 2, subfamily S, polypeptide 1 HopkinsGroom,RussLampel
ANTXR1 anthrax toxin receptor 1 RussLampel
TAP1 transporter 1, ATP-binding cassette, sub-family B (MDR/TAP) HopkinsGroom,RussLampel
GABRP gamma-aminobutyric acid (GABA) A receptor, pi HopkinsGroom,RussLampel
MAP4K4 mitogen-activated protein kinase kinase kinase kinase 4 RussLampel,dGene,HopkinsGroom
MOXD1 monooxygenase, DBH-like 1 RussLampel,HopkinsGroom APLP2 amyloid beta (A4) precursor-like protein 2 dGene
SLC22A3 solute carrier family 22 (extraneuronal monoamine transporter), member 3 RussLampel
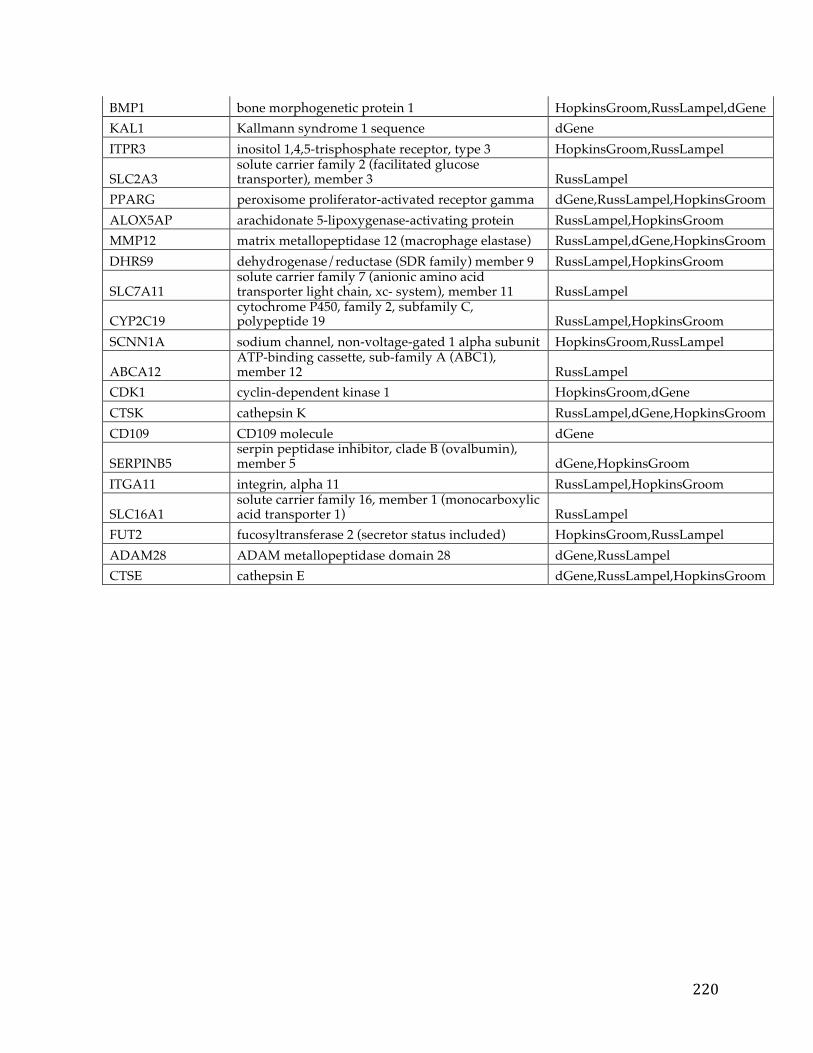
220
BMP1 bone morphogenetic protein 1 HopkinsGroom,RussLampel,dGene KAL1 Kallmann syndrome 1 sequence dGene ITPR3 inositol 1,4,5-trisphosphate receptor, type 3 HopkinsGroom,RussLampel
SLC2A3 solute carrier family 2 (facilitated glucose transporter), member 3 RussLampel
PPARG peroxisome proliferator-activated receptor gamma dGene,RussLampel,HopkinsGroom ALOX5AP arachidonate 5-lipoxygenase-activating protein RussLampel,HopkinsGroom MMP12 matrix metallopeptidase 12 (macrophage elastase) RussLampel,dGene,HopkinsGroom DHRS9 dehydrogenase/reductase (SDR family) member 9 RussLampel,HopkinsGroom
SLC7A11 solute carrier family 7 (anionic amino acid transporter light chain, xc- system), member 11 RussLampel
CYP2C19 cytochrome P450, family 2, subfamily C, polypeptide 19 RussLampel,HopkinsGroom
SCNN1A sodium channel, non-voltage-gated 1 alpha subunit HopkinsGroom,RussLampel
ABCA12 ATP-binding cassette, sub-family A (ABC1), member 12 RussLampel
CDK1 cyclin-dependent kinase 1 HopkinsGroom,dGene CTSK cathepsin K RussLampel,dGene,HopkinsGroom CD109 CD109 molecule dGene
SERPINB5 serpin peptidase inhibitor, clade B (ovalbumin), member 5 dGene,HopkinsGroom
ITGA11 integrin, alpha 11 RussLampel,HopkinsGroom
SLC16A1 solute carrier family 16, member 1 (monocarboxylic acid transporter 1) RussLampel
FUT2 fucosyltransferase 2 (secretor status included) HopkinsGroom,RussLampel ADAM28 ADAM metallopeptidase domain 28 dGene,RussLampel CTSE cathepsin E dGene,RussLampel,HopkinsGroom
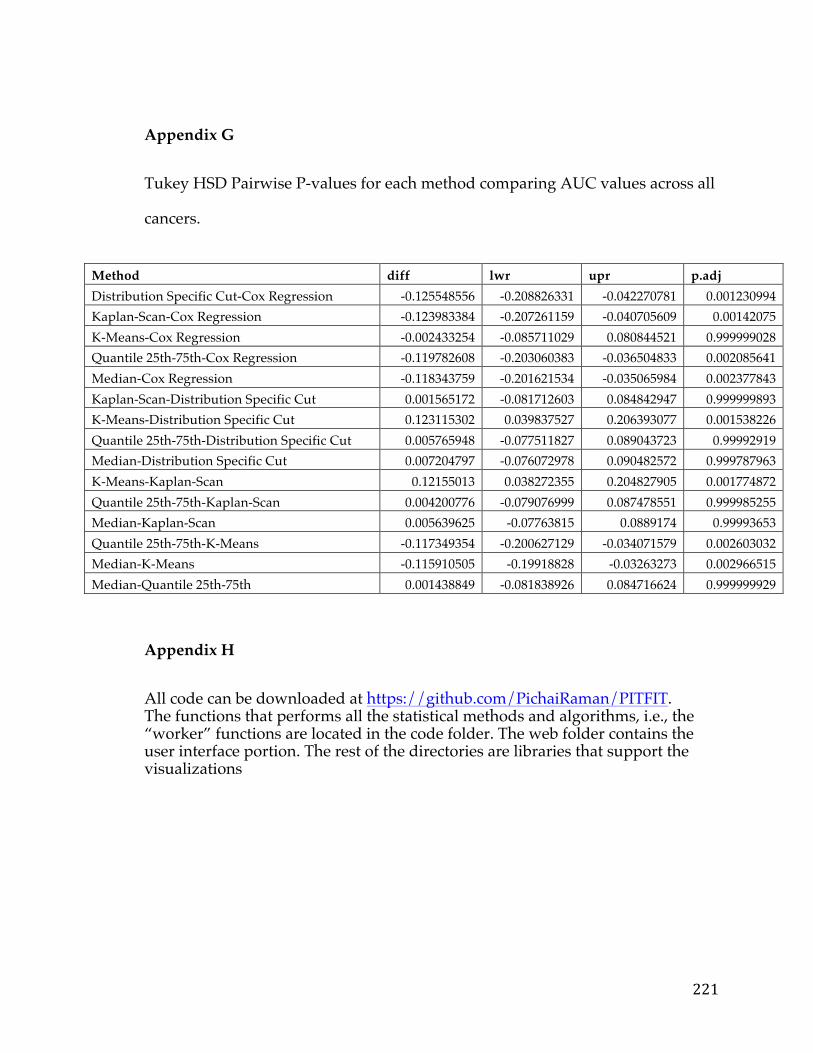
221
Appendix G
Tukey HSD Pairwise P-values for each method comparing AUC values across all
cancers.
Method diff lwr upr p.adj Distribution Specific Cut-Cox Regression -0.125548556 -0.208826331 -0.042270781 0.001230994 Kaplan-Scan-Cox Regression -0.123983384 -0.207261159 -0.040705609 0.00142075 K-Means-Cox Regression -0.002433254 -0.085711029 0.080844521 0.999999028 Quantile 25th-75th-Cox Regression -0.119782608 -0.203060383 -0.036504833 0.002085641 Median-Cox Regression -0.118343759 -0.201621534 -0.035065984 0.002377843 Kaplan-Scan-Distribution Specific Cut 0.001565172 -0.081712603 0.084842947 0.999999893 K-Means-Distribution Specific Cut 0.123115302 0.039837527 0.206393077 0.001538226 Quantile 25th-75th-Distribution Specific Cut 0.005765948 -0.077511827 0.089043723 0.99992919 Median-Distribution Specific Cut 0.007204797 -0.076072978 0.090482572 0.999787963 K-Means-Kaplan-Scan 0.12155013 0.038272355 0.204827905 0.001774872 Quantile 25th-75th-Kaplan-Scan 0.004200776 -0.079076999 0.087478551 0.999985255 Median-Kaplan-Scan 0.005639625 -0.07763815 0.0889174 0.99993653 Quantile 25th-75th-K-Means -0.117349354 -0.200627129 -0.034071579 0.002603032 Median-K-Means -0.115910505 -0.19918828 -0.03263273 0.002966515 Median-Quantile 25th-75th 0.001438849 -0.081838926 0.084716624 0.999999929
Appendix H
All code can be downloaded at https://github.com/PichaiRaman/PITFIT. The functions that performs all the statistical methods and algorithms, i.e., the “worker” functions are located in the code folder. The web folder contains the user interface portion. The rest of the directories are libraries that support the visualizations
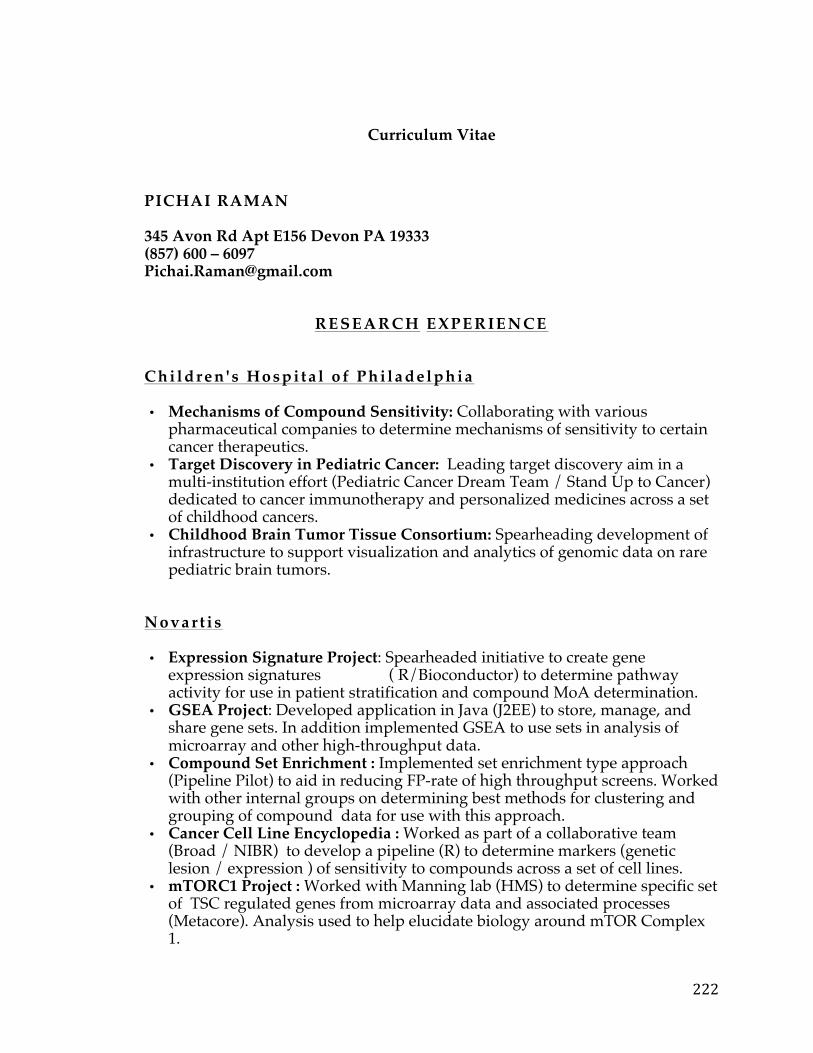
222
Curriculum Vitae
PICHAI RAMAN 345 Avon Rd Apt E156 Devon PA 19333 (857) 600 – 6097 [email protected]
R E S E A R C H EXPERIENCE C h i l d r e n ' s H o s p i t a l o f P h i l a d e l p h i a • Mechanisms of Compound Sensitivity: Collaborating with various
pharmaceutical companies to determine mechanisms of sensitivity to certain cancer therapeutics.
• Target Discovery in Pediatric Cancer: Leading target discovery aim in a multi-institution effort (Pediatric Cancer Dream Team / Stand Up to Cancer) dedicated to cancer immunotherapy and personalized medicines across a set of childhood cancers.
• Childhood Brain Tumor Tissue Consortium: Spearheading development of infrastructure to support visualization and analytics of genomic data on rare pediatric brain tumors.
Novar t i s • Expression Signature Project: Spearheaded initiative to create gene
expression signatures ( R/Bioconductor) to determine pathway activity for use in patient stratification and compound MoA determination.
• GSEA Project: Developed application in Java (J2EE) to store, manage, and share gene sets. In addition implemented GSEA to use sets in analysis of microarray and other high-throughput data.
• Compound Set Enrichment : Implemented set enrichment type approach (Pipeline Pilot) to aid in reducing FP-rate of high throughput screens. Worked with other internal groups on determining best methods for clustering and grouping of compound data for use with this approach.
• Cancer Cell Line Encyclopedia : Worked as part of a collaborative team (Broad / NIBR) to develop a pipeline (R) to determine markers (genetic lesion / expression ) of sensitivity to compounds across a set of cell lines.
• mTORC1 Project : Worked with Manning lab (HMS) to determine specific set of TSC regulated genes from microarray data and associated processes (Metacore). Analysis used to help elucidate biology around mTOR Complex 1.
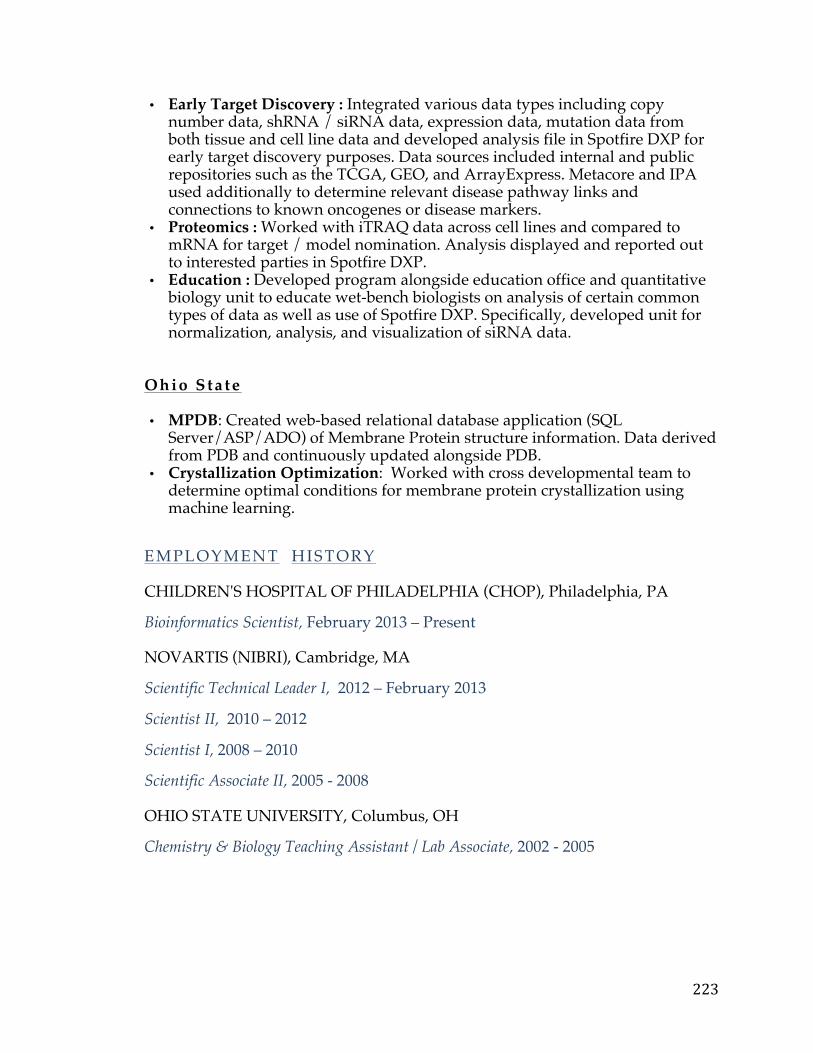
223
• Early Target Discovery : Integrated various data types including copy number data, shRNA / siRNA data, expression data, mutation data from both tissue and cell line data and developed analysis file in Spotfire DXP for early target discovery purposes. Data sources included internal and public repositories such as the TCGA, GEO, and ArrayExpress. Metacore and IPA used additionally to determine relevant disease pathway links and connections to known oncogenes or disease markers.
• Proteomics : Worked with iTRAQ data across cell lines and compared to mRNA for target / model nomination. Analysis displayed and reported out to interested parties in Spotfire DXP.
• Education : Developed program alongside education office and quantitative biology unit to educate wet-bench biologists on analysis of certain common types of data as well as use of Spotfire DXP. Specifically, developed unit for normalization, analysis, and visualization of siRNA data.
Ohio S ta te • MPDB: Created web-based relational database application (SQL
Server/ASP/ADO) of Membrane Protein structure information. Data derived from PDB and continuously updated alongside PDB.
• Crystallization Optimization: Worked with cross developmental team to determine optimal conditions for membrane protein crystallization using machine learning.
EMPLOYMENT HISTORY CHILDREN'S HOSPITAL OF PHILADELPHIA (CHOP), Philadelphia, PA
Bioinformatics Scientist, February 2013 – Present NOVARTIS (NIBRI), Cambridge, MA
Scientific Technical Leader I, 2012 – February 2013
Scientist II, 2010 – 2012
Scientist I, 2008 – 2010
Scientific Associate II, 2005 - 2008 OHIO STATE UNIVERSITY, Columbus, OH
Chemistry & Biology Teaching Assistant / Lab Associate, 2002 - 2005

224
EDUCATION OHIO STATE UNIVERSITY, Columbus, OH Master of Science in Bioinformatics, 2005 UNIVERSITY OF MICHIGAN, Ann Arbor, MI Bachelor of Science in Cell and Molecular Biology, 1999
PUBLICATIONS Raman, P., Maddipati, R., Lim, KH., Tozeren, A. “Pancreatic cancer survival analysis defines a signature that predicts outcome and suggests candidate gene targets for novel therapies”. Manuscript submitted for publication. Raman, P., Sarmady M., Wu, C., Leipzig, J., Taylor, DM., Tozeren, A., Mar, J. “A Comparison of Survival Analysis methods applied on Cancer Gene Expression RNA-Sequencing data.” Manuscript submitted for publication. Padovan-Merhar*, O., Raman*, P., Ostrovnaya, I., Kalletla, K., Rubnitz, K., Ali, SM., Miller, VA., Mossé, YP., Granger, MP., Weiss, B., Maris, JM., Modak S. “Enrichment of targetable mutations in the relapsed neuroblastoma genome“ (Submitted* co-first authors). Manuscript submitted for publication. Sotillo, E., Barrett, D., Bagashev, A., Black, K., Lanauze, C., Oldridge, D., Sussman, R., Harrington, C., Chung, E., Hofmann, T., Maude, S., Martinez, N., Raman, P., Ruella, M., Allman, D., Jacoby, E., Fry, T., Barash, Y., Lynch, K., Mackall, C., Maris, J., Grupp, S. and Thomas-Tikhonenko, A. “Convergence of acquired mutations and alternative splicing of CD19 enables resistance to CART-19 immunotherapy” Cancer Discovery, 5(12):1282-1295 (2015). PMID: 26516065 Tarangelo A., Lo N., Teng R., Kim E., Linh L., Watson D., Furth EE., Raman P., Ehmer U., Viatour P. “Recruitment of Pontin/Reptin by E2f1 amplifies E2f transcriptional response during cancer progression.” Nature Communications, 6:10028 (2015). PMID: 26639898 Schnepp, RW., Khurana P., Attiyeh EF., Raman P., Chodosh SE., Oldridge DA., Gagliardi ME., Conkrite KL., Asgharzadeh S., Seeger RC., Madison BB., Rustgi AK., Maris JM., Diskin SJ. “A LIN28B-RAN-AURKA Signaling Network Promotes Neuroblastoma Tumorigenesis.” Cancer Cell, S1535-6108(15)00343-8 (2015). PMID: 26481147

225
Raman, P., Purwin, T. and Pestell, R., Tozeren, A. “FXYD5 is a Marker for Poor Prognosis and a Potential Driver for Metastasis in Ovarian Carcinomas.” Cancer Informatics, p.113 (2015). PMID: 26494976 Krytska, K., Ryles, H., Sano, R., Raman, P., Infarinato, N., Hansel, T., Makena, M., Song, M., Reynolds, C. and Mosse, Y. “Crizotinib Synergizes with Chemotherapy in Preclinical Models of Neuroblastoma.” Clinical Cancer Research (2015). PMID: 26438783 Russell, M., Penikis, A., Oldridge, D., Alvarez-Dominguez, J., McDaniel, L., Diamond, M., Padovan, O., Raman, P., Li, Y., Wei, J., Zhang, S., Gnanchandran, J., Seeger, R., Asgharzadeh, S., Khan, J., Diskin, S., Maris, J. and Cole, K. “CASC15-S Is a Tumor Suppressor lncRNA at the 6p22 Neuroblastoma Susceptibility Locus.” Cancer Research, 75(15), pp.3155-3166 (2015). PMID: 26100672 Carson, C., Raman, P., Tullai, J., Xu, L., Henault, M., Thomas, E., Yeola, S., Lao, J., McPate, M., Verkuyl, J., Marsh, G., Sarber, J., Amaral, A., Bailey, S., Lubicka, D., Pham, H., Miranda, N., Ding, J., Tang, H., Ju, H., Tranter, P., Ji, N., Krastel, P., Jain, R., Schumacher, A., Loureiro, J., George, E., Berellini, G., Ross, N., Bushell, S., Erdemli, G. and Solomon, J. “Englerin A Agonizes the TRPC4/C5 Cation Channels to Inhibit Tumor Cell Line Proliferation.” PLOS ONE, 10(6), p.e0127498 (2015). PMID: 26098886 Otsuru, S., Hofmann, T., Raman, P., Olson, T., Guess, A., Dominici, M. and Horwitz, E. “Genomic and functional comparison of mesenchymal stromal cells prepared using two isolation methods.” Cytotherapy, 17(3), pp.262-270 (2015). PMID: 25659640 Dews, M., Tan, G., Hultine, S., Raman, P., Choi, J., Duperret, E., Lawler, J., Bass, A. and Thomas-Tikhonenko, A. “Masking Epistasis Between MYC and TGF-beta Pathways in Antiangiogenesis-Mediated Colon Cancer Suppression.“ Journal of the National Cancer Institute, 043 (2014). PMID: 24627270 Psathas JN, Doonan PJ, Raman P, Freedman BD, Minn AJ, Thomas-Tikhonenko A. “The MYC-miR-17-92 axis amplifies B-cell receptor signaling via inhibition of ITIM proteins: a novel lymphomagenic feed-forward loop.” Blood, 122 (26):4220-229 (2013). PMID: 24169826 Britschgi A, Bill A, Brinkhaus H, Rothwell C, Clay I, Duss S, Rebhan M, Raman P, Guy CT, Wetzel K, George E, Popa MO, Lilley S, Choudhury H, Gosling M, Wang L, Fitzgerald S, Borawski J, Baffoe J, Labow M, Gaither LA, Bentires-Alj M. “Calcium-activated chloride channel ANO1 promotes breast cancer progression by activating EGFR and CAMK signaling.” Proc Natl Acad Sci, 110(11):E1026-34 (2013). PMID: 23431153 Barretina J, Caponigro G, Stransky N, Venkatesan K, Margolin AA, Kim S, Wilson CJ, Lehár J, Kryukov GV, Sonkin D, Reddy A, Liu M, Murray L, Berger MF, Monahan JE, Morais P, Meltzer J, Korejwa A, Jané-Valbuena J, Mapa FA,

226
Thibault J, Bric-Furlong E, Raman P, Shipway A, Engels IH, Cheng J, Yu GK, Yu J, Aspesi P Jr, de Silva M, Jagtap K, Jones MD, Wang L, Hatton C, Palescandolo E, Gupta S, Mahan S, Sougnez C, Onofrio RC, Liefeld T, MacConaill L, Winckler W, Reich M, Li N, Mesirov JP, Gabriel SB, Getz G, Ardlie K, Chan V, Myer VE, Weber BL, Porter J, Warmuth M, Finan P, Harris JL, Meyerson M, Golub TR, Morrissey MP, Sellers WR, Schlegel R, Garraway LA. “The Cancer Cell Line Encyclopedia enables predictive modelling of anticancer drug sensitivity.” Nature, 483(7391):603-7 (2012). PMID: 22460905 Varin T, Gubler H, Parker CN, Zhang JH, Raman P, Ertl P, Schuffenhauer A. “Compound set enrichment: a novel approach to analysis of primary HTS data.” J Chem Inf Model, 50(12):2067-78 (2010). PMID: 21073183 Düvel K, Yecies JL, Menon S, Raman P (co-second author), Lipovsky AI, Souza AL, Triantafellow E, Ma Q, Gorski R, Cleaver S, Vander Heiden MG, MacKeigan JP, Finan PM, Clish CB, Murphy LO, Manning BD. “Activation of a metabolic gene regulatory network downstream of mTOR complex 1.” Mol Cell, 39(2):171-83 (2010). PMID: 20670887 Asur S, Raman P, Otey ME, Parthasarathy S. “A model-based approach for mining membrane protein crystallization trials.” Bioinformatics, 22(14):e40-8 (2006) PMID: 16873499 Raman P, Cherezov V, Caffrey M. “The Membrane Protein Data Bank.” Cell Mol Life Sci, 63(1):36-51 (2006). PMID: 16314922

227