compressive-shear adhesion characterization of polyvinyl-butyral and ethylene-vinyl acetate at...
TRANSCRIPT
RESEARCH ARTICLE
Compressive-shear adhesion characterization ofpolyvinyl-butyral and ethylene-vinyl acetate atdifferent curing times before and after exposureto damp-heat conditionsValentin Chapuis*, Ségolène Pélisset, Marylène Raeis-Barnéoud, Heng-Yu Li,Christophe Ballif and Laure-Emmanuelle Perret-Aebi
Photovoltaics and Thin Film Electronics Laboratory, Ecole Polytechnique Fédérale de Lausanne (EPFL), Rue A.-L. Breguet 2, CH-2000Neuchâtel, Switzerland
ABSTRACT
Photovoltaic (PV) module efficiency and reliability are two factors that have an important impact on the final cost of the PVelectricity production. It is widely accepted that a good adhesion between the encapsulant and the different substrates of aPV module is needed to ensure long-term reliability. Several testing procedures exist that use a metric derived from theforce at interface failure to characterize the adhesion. It has, however, not been demonstrated that those metrics relatedirectly to the interfacial adhesion (defined as the surface energy density needed to break interfacial bonds), and the obtainedresults usually relate to an apparent adhesion strength. In this work, we describe a new design for compressive-shear testingof polymer layers bonded to rigid substrates. We use it to characterize real interfacial adhesion of ethylene-vinyl acetate(EVA) and polyvinyl-butyral (PVB) to a glass substrate before and after degradation in damp-heat. Our results show that apeak-force based metric is unable to capture the evolution of adhesion through degradation, and a new metric based on theelastic strain energy of the encapsulant is proposed. Moreover, we show that PVB adhesion to glass is much more affectedby damp-heat exposure where polymer saturation takes place, in comparison with the adhesion of EVA to glass. The presentedcharacterization protocol is a powerful tool that can help in assessing the reliability of an encapsulant facing specific degradationconditions. Copyright © 2012 John Wiley & Sons, Ltd.
KEYWORDS
photovoltaic; reliability; adhesion; polymer; compressive shear
*Correspondence
Valentin Chapuis, Photovoltaics and Thin Film Electronics Laboratory, Ecole Polytechnique Fédérale de Lausanne (EPFL), Rue A.-L.Breguet 2, CH-2000 Neuchâtel, Switzerland.Email: [email protected]
Received 23 February 2012; Revised 16 May 2012; Accepted 26 June 2012
1. INTRODUCTION
Increasing module lifetime (typically over 25 years) is a keytoward photovoltaic (PV) electricity cost reduction. There-fore PV devices must be protected against environmentalstresses (e.g., ultra-violet radiation, rain, moisture, hail,thermal cycling) [1]. This protection is achieved through apackaging step in which the PV device is encapsulatedbetween glasses and/or foils by the mean of one or two poly-mer layers. It is well-known that the quality and durability ofthis protective system is dependent on the adhesion betweenthe different layers [2,3]. A degradation of the adhesionbetween the different layers of the encapsulation system
may, for example, lead to accelerated moisture ingress result-ing in reduced electrical performances of the device or to adelamination failure [4,5]. Additionally, poor adhesion mayprevent PV modules from successfully passing certain IECstandards such as the breakage test described in the IEC61730 [6]. Therefore, adhesion characterization and optimi-zation is of primary interest in the PV field. Over the years,several testing procedures to characterize adhesion in differ-ent systems have been developed in various application fieldssuch as composite testing [7,8], fracture mechanics [9],polymer science [10], aerospace [11] and more recently inthe PV field to evaluate the adhesion of a polymeric layer torigid or flexible substrates. The most common ones such as
PROGRESS IN PHOTOVOLTAICS: RESEARCH AND APPLICATIONSProg. Photovolt: Res. Appl. 2014; 22:405–414
Published online 7 September 2012 in Wiley Online Library (wileyonlinelibrary.com). DOI: 10.1002/pip.2270
Copyright © 2012 John Wiley & Sons, Ltd. 405
peel tests [12,13], lap shear tests [14–16] or compressive sheartests (CST) [17,18] are extensively described in the literature.
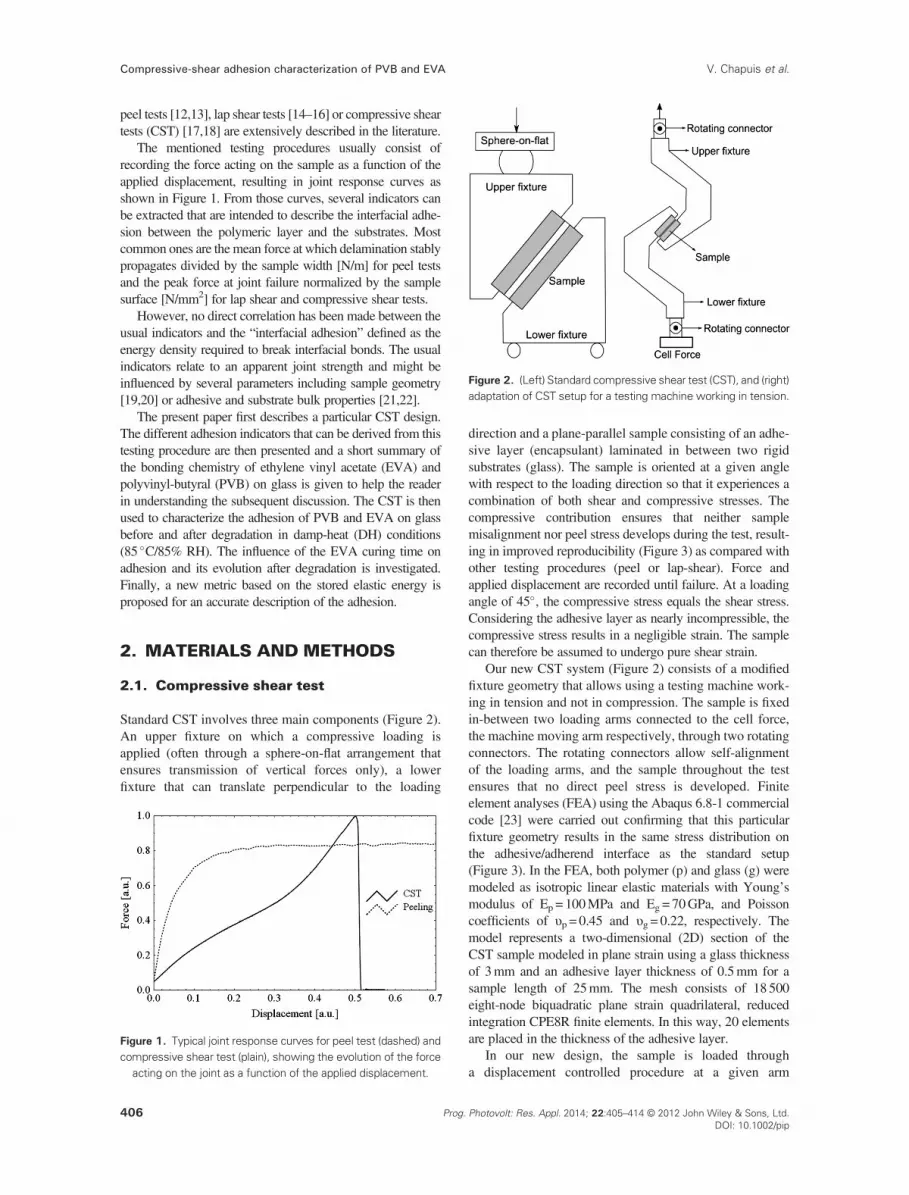
The mentioned testing procedures usually consist ofrecording the force acting on the sample as a function of theapplied displacement, resulting in joint response curves asshown in Figure 1. From those curves, several indicators canbe extracted that are intended to describe the interfacial adhe-sion between the polymeric layer and the substrates. Mostcommon ones are the mean force at which delamination stablypropagates divided by the sample width [N/m] for peel testsand the peak force at joint failure normalized by the samplesurface [N/mm2] for lap shear and compressive shear tests.
However, no direct correlation has been made between theusual indicators and the “interfacial adhesion” defined as theenergy density required to break interfacial bonds. The usualindicators relate to an apparent joint strength and might beinfluenced by several parameters including sample geometry[19,20] or adhesive and substrate bulk properties [21,22].
The present paper first describes a particular CST design.The different adhesion indicators that can be derived from thistesting procedure are then presented and a short summary ofthe bonding chemistry of ethylene vinyl acetate (EVA) andpolyvinyl-butyral (PVB) on glass is given to help the readerin understanding the subsequent discussion. The CST is thenused to characterize the adhesion of PVB and EVA on glassbefore and after degradation in damp-heat (DH) conditions(85 �C/85% RH). The influence of the EVA curing time onadhesion and its evolution after degradation is investigated.Finally, a new metric based on the stored elastic energy isproposed for an accurate description of the adhesion.
2. MATERIALS AND METHODS
2.1. Compressive shear test
Standard CST involves three main components (Figure 2).An upper fixture on which a compressive loading isapplied (often through a sphere-on-flat arrangement thatensures transmission of vertical forces only), a lowerfixture that can translate perpendicular to the loading
direction and a plane-parallel sample consisting of an adhe-sive layer (encapsulant) laminated in between two rigidsubstrates (glass). The sample is oriented at a given anglewith respect to the loading direction so that it experiences acombination of both shear and compressive stresses. Thecompressive contribution ensures that neither samplemisalignment nor peel stress develops during the test, result-ing in improved reproducibility (Figure 3) as compared withother testing procedures (peel or lap-shear). Force andapplied displacement are recorded until failure. At a loadingangle of 45�, the compressive stress equals the shear stress.Considering the adhesive layer as nearly incompressible, thecompressive stress results in a negligible strain. The samplecan therefore be assumed to undergo pure shear strain.
Our new CST system (Figure 2) consists of a modifiedfixture geometry that allows using a testing machine work-ing in tension and not in compression. The sample is fixedin-between two loading arms connected to the cell force,the machine moving arm respectively, through two rotatingconnectors. The rotating connectors allow self-alignmentof the loading arms, and the sample throughout the testensures that no direct peel stress is developed. Finiteelement analyses (FEA) using the Abaqus 6.8-1 commercialcode [23] were carried out confirming that this particularfixture geometry results in the same stress distribution onthe adhesive/adherend interface as the standard setup(Figure 3). In the FEA, both polymer (p) and glass (g) weremodeled as isotropic linear elastic materials with Young’smodulus of Ep = 100MPa and Eg = 70GPa, and Poissoncoefficients of υp = 0.45 and υg = 0.22, respectively. Themodel represents a two-dimensional (2D) section of theCST sample modeled in plane strain using a glass thicknessof 3mm and an adhesive layer thickness of 0.5mm for asample length of 25mm. The mesh consists of 18 500eight-node biquadratic plane strain quadrilateral, reducedintegration CPE8R finite elements. In this way, 20 elementsare placed in the thickness of the adhesive layer.
In our new design, the sample is loaded througha displacement controlled procedure at a given arm
Figure 1. Typical joint response curves for peel test (dashed) andcompressive shear test (plain), showing the evolution of the force
acting on the joint as a function of the applied displacement.
Figure 2. (Left) Standard compressive shear test (CST), and (right)adaptation of CST setup for a testing machine working in tension.
Compressive-shear adhesion characterization of PVB and EVA V. Chapuis et al.
406 Prog. Photovolt: Res. Appl. 2014; 22:405–414 © 2012 John Wiley & Sons, Ltd.DOI: 10.1002/pip

displacement velocity on a Schenck-Trebel RSA-100tensile testing machine (Schenck-Trebel Corp., Farmingdale,NY, USA), combined with a 10 or 100 kN cell force. A100Hz acquisition frequency was used, and the resultingdata was smoothed using a moving average function to getrid of the cell force acquisition noise. The arm displacementvelocity is calculated based on the adhesive layer thicknessin order to induce a constant shear strain rate for all samples.Equation (1) gives the relationship between imposed verticaldisplacement uy and global shear strain g, under the assumptionof small deformations (Figure 4). The arm displacement
velocity vy is then obtained as a function of the shear rate g�
using a time derivative of this relationship (2). A shear rateof 0.2 s�1 is chosen as a standard solicitation rate. The acqui-sition of force and displacement values is achieved using adata acquisitionmodule USB-6009 fromNational Instrumentscombined with a homemade LabView procedure.
uy ¼ 12
g�h0cos θð Þ (1)
vy ¼ @uy@t
¼ 12
_g�h0cos θð Þ (2)
The tests are performed on square samples (25� 25mm2)consisting of a polymeric layer laminated in-between twopieces of 2.9 mm thick glass in a vacuum laminator.The thickness of the adhesive layer is in the range of400–800mm, and the glass is washed with isopropanol andrinsed with de-ionized water before lamination. The samplesare first processed in a 100� 100mm2 format and then cutinto 25� 25mm2 pieces by means of a diamond sawingprocess. The purpose of this required preparation techniqueis to provide samples with four equivalent defect-free edgesand a homogeneous adhesive thickness, ensuring highmeasurement reproducibility. The CSTs presented in thispaper were performed at room temperature.
3. THEORY AND CALCULATIONS
3.1. Adhesion indicators
When a CST is performed, the adhesive layer deforms inshear until failure of one interface. The delamination can beseen to be either force-controlled (i.e., a critical force hasto be exceeded to induce delamination), displacement-controlled or energy-controlled. Depending on the failurecriterion that is used to describe the delamination, differentmetrics are calculated from the acquired force-displacementcurves in order to characterize adhesion.
3.1.1. Force controlled indicator.The peak force at which sudden delamination occurs isnormalized by the sample surface (lap-shear) or the samplewidth (peeling) to describe the force density needed toinduce failure. This indicator, often referred to as “adhesionstrength” for lap-shear tests or “peeling strength” for peeling
Figure 3. (Left) Von Mises stress profiles along the upper substrate/polymer interface on Figure 2, in a standard compressive shear test(CST) design (plain curve) and in our new design (dots) as obtained from FEA. (Right) Typical reproducibility of our CST for polyvinyl-butyral
and ethylene-vinyl acetate bonded to glass.
Figure 4. Sketch of the adhesive deformation used to relate thevertical displacement uy to the shear strain g for an adhesive
layer of thickness h0 loaded at an angle θ.
Compressive-shear adhesion characterization of PVB and EVAV. Chapuis et al.
407Prog. Photovolt: Res. Appl. 2014; 22:405–414 © 2012 John Wiley & Sons, Ltd.DOI: 10.1002/pip

tests, is widely used in the PV community to describeadhesion of encapsulants to rigid substrates [18,24].
A more accurate force-controlled indicator can beobtained considering only the shearing component Fshear
of the force F acting on the sample. This contributiondepends on the loading angle θ (45� in the present case)and can be calculated as in (3).
Fshear ¼ F� cos θð Þ θ¼45∘¼ F�ffiffiffi2
p
2(3)
Assuming that the shearing component results in a homo-geneous shear deformation, an “equivalent peak shear stress”(tmax) can be calculated using Equation (4), where Sdel is thedelaminated area.
tmax ¼ Fshear
Sdel(4)
The advantages of this metric as compared with thestandard peak force density are twofold. First, taking intoaccount only the shearing component allows a comparisonbetween CST performed at different angles θ. Second, thenormalization surface is the real delaminated area allowinga more accurate description especially when partial delami-nation occurs. This metric will be referred to as “peak stress”in the following sections and is expressed in [MPa].
3.1.2. Displacement controlled indicator.The maximum equivalent shear strain gmax corresponds toa homogeneous pure shear strain calculated at the peakstress level. It is calculated from the displacement at peakforce dFmax using (5). This metric takes into account thethickness of the encapsulant allowing a comparison betweenvarious samples with varying encapsulant thicknesses.
gmax ¼2�dFmax cos θð Þ
h0(5)
This metric aims to represent the maximum sheardeformation that the joint can sustain before delamination.It is expressed in radians and will be referred hereafter as“peak strain”.
3.1.3. Energy controlled indicator.Transforming a CST curve from force-displacement to ashear stress–shear strain relationship using (3), (4) and(5) provides results independent of both the encapsulantthickness and the loading angle.
Moreover, the encapsulant layer is much more compliantthan the substrates, the elastic modulus of EVA being threeorders of magnitude lower than that of glass. It can thus beassumed that the imposed displacement is only accommo-dated by the shearing deformation of the encapsulant. Conse-quently, integrating this stress–strain curve (6) leads to adeformation energy density Eel expressed in [mJ/mm3],which takes into account both the elastic and plastic defor-mation regimes of the encapsulant. If no plastic dissipationoccurs, the deformation energy density represents the energyavailable for delamination.
Eel ¼Z
t gð Þdg (6)
Using the energy-based failure criterion, the sampledelamination is seen to occur when a critical value of elasticenergy density is stored in the polymer layer. Thismetric willbe called “stored energy” in the next sections and isexpressed in [mJ/mm3].
3.2. Ethylene-vinyl acetate and polyvinyl-butyral adhesion to glass
We present here a short synthesis of the mechanisms ofadhesion for EVA and PVB. It contains elements requiredfor the reader to better understand the following discussion.
The adhesion of an EVA layer to a glass substrate [25]is performed by using adhesion promoters called silanesthat are present in the bulk of the polymer. Commerciallyavailable silanes are usually alkoxysilanes in which alkoxyreactive groups bond to the EVA chains (grafting reaction)whereas the silanol groups bond to the glass substrate.
3.2.1. Reaction of silane with glass.The typical reaction of silane (typically 3-(trimethoxysilyl)propyl ester methacrylic acid in the case of EVA) withglass occurs in three steps (Figure 5). The alkoxysilaneis first hydrolyzed to generate a silanol intermediate thatcan partially oligomerize in solution. In the second step,hydrogen bonding occurs, followed by elimination ofwater (condensation reaction) generating a stable Si-O-Sibond. The bonds established between silane and glassare thus mostly covalent in nature and form what will becalled hereafter the interface between EVA and glass.
3.2.2. Grafting reaction of the adhesion promotersto the ethylene-vinyl acetate chain.Grafting of the silane coupling agent onto the EVAchains is performed through a radical reaction induced bythermally activated peroxides. These peroxides (typicallytert-butylperoxy-2-ethylhexyl carbonate) are added to theEVA formulation to initiate the crosslinking reaction.Therefore, the curing process of EVA and the graftingreaction occurs in parallel during the lamination process.Figure 6 represents the typical situation of the radicalreaction involved during EVA processing [26].
The grafting of silane onto EVA thus forms a new layer,which will be called “interphase” in what follows. Theadhesion of EVA depends then on both the interface(silane/glass) and interphase (silane/EVA) quality.
It must be noticed that the peroxide concentration in thebulk EVA is higher than that needed to complete the curingreaction. Moreover, peroxide activation energy is around120 kJ/mol [26] corresponding to an optimal activationtemperature of 448K (175 �C). Therefore, as standardEVA lamination takes place at ~140 �C, a non-negligibleamount of peroxide remains in the encapsulant afterlamination, even for high curing times [27,28].
Compressive-shear adhesion characterization of PVB and EVA V. Chapuis et al.
408 Prog. Photovolt: Res. Appl. 2014; 22:405–414 © 2012 John Wiley & Sons, Ltd.DOI: 10.1002/pip
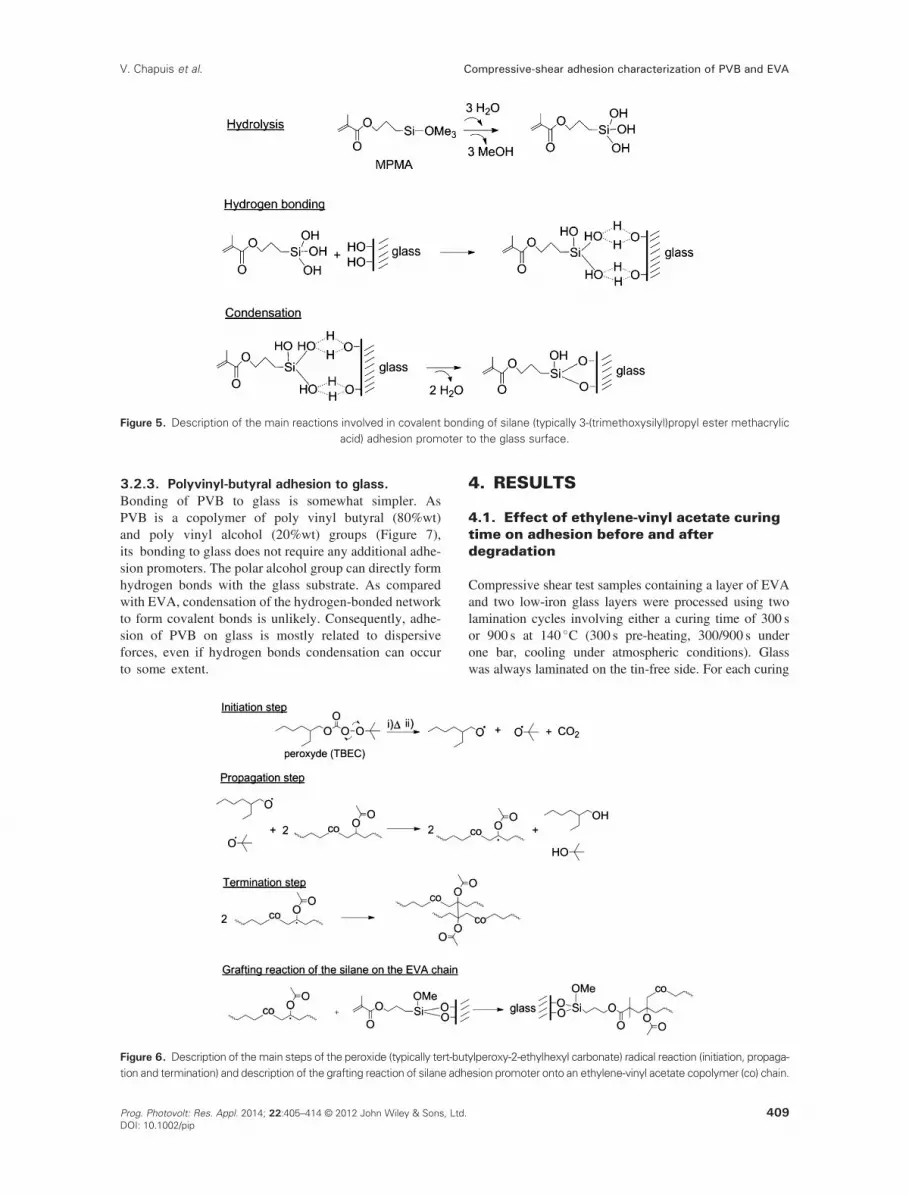
3.2.3. Polyvinyl-butyral adhesion to glass.Bonding of PVB to glass is somewhat simpler. AsPVB is a copolymer of poly vinyl butyral (80%wt)and poly vinyl alcohol (20%wt) groups (Figure 7),its bonding to glass does not require any additional adhe-sion promoters. The polar alcohol group can directly formhydrogen bonds with the glass substrate. As comparedwith EVA, condensation of the hydrogen-bonded networkto form covalent bonds is unlikely. Consequently, adhe-sion of PVB on glass is mostly related to dispersiveforces, even if hydrogen bonds condensation can occurto some extent.
4. RESULTS
4.1. Effect of ethylene-vinyl acetate curingtime on adhesion before and afterdegradation
Compressive shear test samples containing a layer of EVAand two low-iron glass layers were processed using twolamination cycles involving either a curing time of 300 sor 900 s at 140 �C (300 s pre-heating, 300/900 s underone bar, cooling under atmospheric conditions). Glasswas always laminated on the tin-free side. For each curing
Figure 6. Description of themain steps of the peroxide (typically tert-butylperoxy-2-ethylhexyl carbonate) radical reaction (initiation, propaga-tion and termination) and description of the grafting reaction of silane adhesion promoter onto an ethylene-vinyl acetate copolymer (co) chain.
Figure 5. Description of the main reactions involved in covalent bonding of silane (typically 3-(trimethoxysilyl)propyl ester methacrylicacid) adhesion promoter to the glass surface.
Compressive-shear adhesion characterization of PVB and EVAV. Chapuis et al.
409Prog. Photovolt: Res. Appl. 2014; 22:405–414 © 2012 John Wiley & Sons, Ltd.DOI: 10.1002/pip

condition, 10-25� 25mm2 samples were produced. Half ofthe samples were placed in a climate chamber under damp-heat conditions (85 �C, 85% RH). The duration of degrada-tion was set to 70 h, which corresponds to saturation of theEVA layer for 30 h. CSTs were then performed on allsamples according to the protocol described in Section 2.
Figure 8 shows a set of representative CST responsecurves for each condition, and Table I summarizes theadhesion indicators and the failure modes.
The curing time of 900 s corresponds to a standardlamination process during which the degree of crosslinkingis maximized. An EVA gel content of over 90% wasmeasured by using DSC [29]. This value corresponds to aplateau where no significant further curing takes place. Thesilanes are completely hydrolyzed, and the entire hydrogennetwork formed by the silanol groups already condensed intocovalent bonds. When exposing these samples to DH condi-tions, one observes an increase of both the peak strain(+65%) and the elastic energy (+70%), whereas the peakshear stress remains at a constant level around 7MPa. More-over, the curve shape is modified showing a softer response
(lower level of stress needed to induce the same level ofstrain) in the case of aged samples.
The curing time of 300 s corresponds to a lower gelcontent of 65%, which indicates that the crosslinking ofEVA is not completed. The bulk EVA is softer, and thefailure was cohesive. Thus no evaluation of the adhesion ofthe 300 s condition before aging can bemade even if the indi-cators could be calculated. However, after subjecting the300 s samples to DH, the failure mode changes from cohe-sive to adhesive, and the CST curve shape is modified,matching the 900 s behavior before degradation.
4.2. Evolution of adhesion through damp-heat for polyvinyl-butyral and ethylene-vinyl acetate
Compressive shear test samples containing a layer of PVBbetween two low-iron glass layers were processed follow-ing the same procedure as that for EVA samples (Section4.1). The lamination process was different, taking placeat 160 �C in the case of PVB (10min pre-heating, 11minunder 800m bars). Again, half of the samples were placedin a climate chamber under DH conditions for 70 h, under-going thus the same exposure to DH conditions as theEVA samples.
Figure 9 shows a set of representative CST responsecurves for PVB and EVA (900 s of curing). Table IIsummarizes the adhesion indicators. All samples failedadhesively, and no plasticization of the polymeric layerswas observed.
Before degradation, PVB exhibits a higher CSTresponse for all indicators as compared with EVA. However,the values of the indicators drop significantly after DH. Thepeak stress initially at 16.2MPa is decreased by a factor of2, the peak strain drops from 2.2 to 1, and the stored energyinitially at 18.7mJ/mm3 is decreased by almost 80%. Asmentioned, the situation is different for EVA. The initialresponse is lower compared with PVB, with a peak stressof 6.8MPa and a stored energy of 5.5mJ/mm3. Exposureto DH results in an increase of both stored energy (+70%)and peak strain (+68%) at a roughly constant peak shearstress level.
Figure 7. (a) Schematic representation of the interface betweenpolyvinyl-butyral (PVB) and glass, (b) a typical PVB chain with its
polar and non-polar groups.
Figure 8. Compressive shear test results, showing the shear stress t as a function of the shear strain g for ethylene-vinyl acetate samplesfor 300s of curing or 900 s of curing (black curves), before damp-heat (plain curves) and after damp-heat (dashed curves).
Compressive-shear adhesion characterization of PVB and EVA V. Chapuis et al.
410 Prog. Photovolt: Res. Appl. 2014; 22:405–414 © 2012 John Wiley & Sons, Ltd.DOI: 10.1002/pip

5. DISCUSSION
5.1. Effect of ethylene-vinyl acetate curingtimeonadhesionbefore andafter degradation
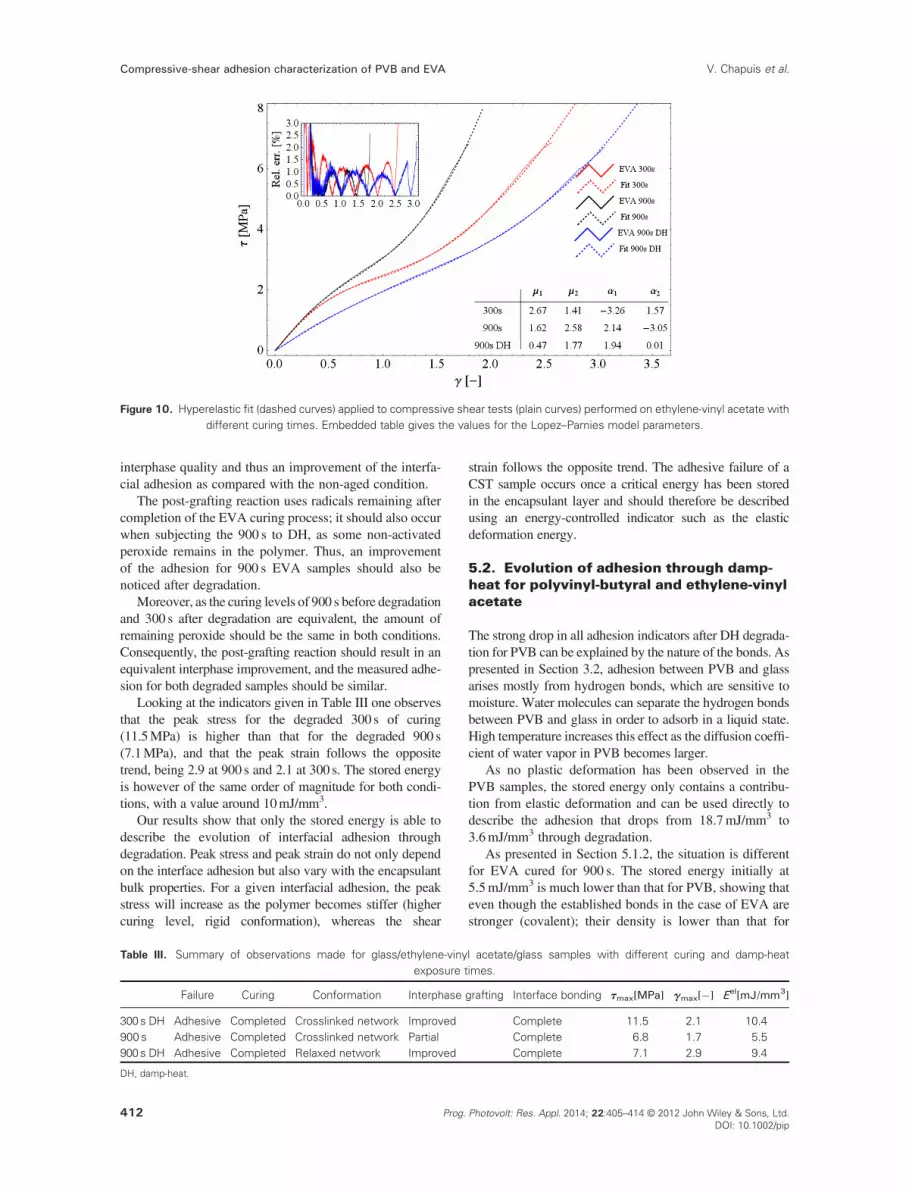
5.1.1. Bulk deformation of the ethylene-vinylacetate layer.The deformation of the studied EVA layers before failure atthe interface can be described using a hyperelastic modelaccounting for medium and large deformations. Hyperelasticmodels for rubber elasticity state that the stress–strainrelationship is driven by an entropy decrease attributable tothe reduction of available conformations when the polymerchains are stretched [30]. This entropy reduction results ina restoring force opposing the deformation. Figure 10 showsa fit of the Lopez–Pamies hyperelastic model applied in pureshear [31] to EVA CST curves before degradation. Thecorrelation is almost perfect with an error below 3% overthe entire range of deformation.
The hyperelastic deformation of a crosslinked polymercan be divided into two regimes. At low deformations,the chains can elongate in between the crosslinking points,and the hyperelastic response is dominated by networkconformation. In this regime, the curing level does notinfluence the hyperelastic behavior. At moderate and largedeformations, the crosslinking points start to limit thechains extension, and the hyperelastic response becomesstiffer as more and more crosslinking points are stressed.
This two-regime behavior is clearly seen when comparing300 s and 900 s EVA samples before degradation (Figure 10).The high gel content (900 s) leads to an overall increase ofthe hyperelastic curve slope as more crosslinking points areunder solicitation.
When the 300 s EVA samples are subjected to DHconditions, their hyperelastic behavior is modified and fitsquite well with the response of 900 s EVA samples beforedegradation (Figure 8). This provides evidence of post-curing processing of the low gel content EVA samples.The remaining peroxide after the lamination process isactivated during DH and allows the radical reaction (thuscuring process) to be completed.
The behavior of 900 s EVA samples after DH is no longersimilar to the other conditions in the low deformation regime.As a decrease in the crosslinking density because of DHexposure is very unlikely (owing to the great stability ofthe crosslinking points and the relatively low DH exposuretime), this indicates that the 900 s samples experience aconformational change during degradation. Through theeffect of temperature, the EVA network rearranges itself in away such that subsequent chain stretching is facilitated. Thismay explain the softer response and the deviation in the lowdeformation regime as comparedwith the non-aged condition.
5.1.2. Adhesion characterization.Using the hyperelastic model, we showed that the change inthe CST curve shape for the degraded 300 s samples can beexplained by a post-curing process (Section 5.1.1). Thecuring level of the degraded 300 s samples is then comparablewith that of the 900 s. The bulk behavior for both conditionsis equivalent, and the difference between the calculatedindicators is related to a change in interfacial adhesion.
Assuming the post-curing process of 300 s EVAsamples is completed before the end of 70 h DH, an excessof radicals remains that can participate in a post-graftingreaction. Therefore, one expects an improvement of the
Table I. Adhesion indicators for ethylene-vinyl acetate atdifferent curing times before and after degradation.
tmax [MPa] gmax[�] Eel[mJ/mm3] Failure
EVA 300s no DH 7.3� 0.3 2.5� 0.07 9� 0.17 CohesiveEVA 300s DH 11.5� 0.3 2.1� 0.1 10.4� 0.7 AdhesiveEVA 900s no DH 6.8� 0.6 1.7� 0.1 5.5� 0.4 AdhesiveEVA 900s DH 7.1� 0.4 2.9� 0.15 9.4� 0.6 Adhesive
EVA, ethylene-vinyl acetate; DH, damp-heat.
Figure 9. Representative compressive shear test results showing the shear stress as a function of the applied shear strain forpolyvinyl-butyral and ethylene-vinyl acetate 900 s of curing (black curves), before (plain curves) and after degradation in damp-heat
conditions (dashed curves).
Table II. Adhesion indicators for polyvinyl-butyral and ethylene-vinyl acetate before and after degradation in damp-heat conditions.
tmax[MPa] gmax[�] Eel[mJ/mm3] Failure
PVB before DH 16.2� 0.8 2.2� 0.1 18.7� 1.7 AdhesivePVB after DH 7.9� 0.3 1� 0.02 3.56� 0.3 AdhesiveEVA before DH 6.8� 0.6 1.7� 0.1 5.5� 0.4 AdhesiveEVA after DH 7.1� 0.4 2.9� 0.15 9.4� 0.6 Adhesive
PVB, polyvinyl-butyral; DH, damp-heat; EVA, ethylene-vinyl acetate.
Compressive-shear adhesion characterization of PVB and EVAV. Chapuis et al.
411Prog. Photovolt: Res. Appl. 2014; 22:405–414 © 2012 John Wiley & Sons, Ltd.DOI: 10.1002/pip
interphase quality and thus an improvement of the interfa-cial adhesion as compared with the non-aged condition.
The post-grafting reaction uses radicals remaining aftercompletion of the EVA curing process; it should also occurwhen subjecting the 900 s to DH, as some non-activatedperoxide remains in the polymer. Thus, an improvementof the adhesion for 900 s EVA samples should also benoticed after degradation.
Moreover, as the curing levels of 900 s before degradationand 300 s after degradation are equivalent, the amount ofremaining peroxide should be the same in both conditions.Consequently, the post-grafting reaction should result in anequivalent interphase improvement, and the measured adhe-sion for both degraded samples should be similar.
Looking at the indicators given in Table III one observesthat the peak stress for the degraded 300 s of curing(11.5MPa) is higher than that for the degraded 900 s(7.1MPa), and that the peak strain follows the oppositetrend, being 2.9 at 900 s and 2.1 at 300 s. The stored energyis however of the same order of magnitude for both condi-tions, with a value around 10mJ/mm3.
Our results show that only the stored energy is able todescribe the evolution of interfacial adhesion throughdegradation. Peak stress and peak strain do not only dependon the interface adhesion but also vary with the encapsulantbulk properties. For a given interfacial adhesion, the peakstress will increase as the polymer becomes stiffer (highercuring level, rigid conformation), whereas the shear
strain follows the opposite trend. The adhesive failure of aCST sample occurs once a critical energy has been storedin the encapsulant layer and should therefore be describedusing an energy-controlled indicator such as the elasticdeformation energy.
5.2. Evolution of adhesion through damp-heat for polyvinyl-butyral and ethylene-vinylacetate
The strong drop in all adhesion indicators after DH degrada-tion for PVB can be explained by the nature of the bonds. Aspresented in Section 3.2, adhesion between PVB and glassarises mostly from hydrogen bonds, which are sensitive tomoisture. Water molecules can separate the hydrogen bondsbetween PVB and glass in order to adsorb in a liquid state.High temperature increases this effect as the diffusion coeffi-cient of water vapor in PVB becomes larger.
As no plastic deformation has been observed in thePVB samples, the stored energy only contains a contribu-tion from elastic deformation and can be used directly todescribe the adhesion that drops from 18.7mJ/mm3 to3.6mJ/mm3 through degradation.
As presented in Section 5.1.2, the situation is differentfor EVA cured for 900 s. The stored energy initially at5.5mJ/mm3 is much lower than that for PVB, showing thateven though the established bonds in the case of EVA arestronger (covalent); their density is lower than that for
Figure 10. Hyperelastic fit (dashed curves) applied to compressive shear tests (plain curves) performed on ethylene-vinyl acetate withdifferent curing times. Embedded table gives the values for the Lopez–Pamies model parameters.
Table III. Summary of observations made for glass/ethylene-vinyl acetate/glass samples with different curing and damp-heatexposure times.
Failure Curing Conformation Interphase grafting Interface bonding tmax[MPa] gmax[�] Eel[mJ/mm3]
300s DH Adhesive Completed Crosslinked network Improved Complete 11.5 2.1 10.4900 s Adhesive Completed Crosslinked network Partial Complete 6.8 1.7 5.5900s DH Adhesive Completed Relaxed network Improved Complete 7.1 2.9 9.4
DH, damp-heat.
Compressive-shear adhesion characterization of PVB and EVA V. Chapuis et al.
412 Prog. Photovolt: Res. Appl. 2014; 22:405–414 © 2012 John Wiley & Sons, Ltd.DOI: 10.1002/pip
PVB. Exposure to DH conditions results in improvedadhesion, with stored energy increasing to 9.4mJ/mm3.With this value being still lower than the initial storedenergy for PVB, it indicates that even if the grafting processof silanes on EVA is complete, the density of establishedbonds is still lower than that for PVB.
6. CONCLUSION
A new CST design compatible with any universal tensiletesting machine was developed. This testing method wasused to characterize adhesion of standard encapsulants(PVB and EVA) to a glass substrate before and afterdegradation in DH conditions (85 �C/85% RH).
It is shown that during a CST, the layers of EVA exhibita hyperelastic deformation until catastrophic delaminationof the EVA/glass interface takes place. This indicates thatthe compressive shear test can be understood in terms ofclassical fracture mechanics theories, and more work is tobe done to accurately describe the delamination initiationand propagation stages.
By testing EVA processed with different curing timesbefore and after degradation, it is demonstrated that theencapsulant adhesion is neither accurately described by thepeak stress at failure nor by the peak strain. Instead, weshowed that delamination occurs once a critical energy isavailable to be released from the encapsulant to the interface.The strain energy stored in the encapsulant elastic deforma-tion is thus proposed as a more reliable metric to measureadhesion. The developed CST analysis thus provides a quickand reliable tool to evaluate the adhesion energy of PVencapsulants to rigid substrates without the need of anyadditional test to be performed, and consequently allows tocompare testing conditions where both the adhesive andthe substrate properties are different.
We show that short exposure to DH (70 h) has a posi-tive effect on the adhesion of EVA to glass for both highand low curing times, whereas it has a detrimental effecton the adhesion of PVB to glass even if its initial adhesionis much higher than that of EVA. This effect can beexplained by an improvement of the adhesion promotersgrafting on the EVA chains during DH exposure. On theother hand, PVB forms mostly hydrogen bonds that areeasily degraded by moisture leading to a large decreasein adhesion after DH.
Using the obtained results, guidelines can be drawn forthe use of PVB and EVA in degradation conditions wherethe polymer becomes saturated. This can occur on a moduleedge during damp-heat exposure when no edge sealant isused. The subsequent loss of adhesion can increase theprobability of failure in different IEC tests such as the break-age test (IEC 61730) or the hail test (IEC 61646). In this case,EVA is to be preferred to PVB because of the positiveevolution of adhesion after degradation. However, PVBremains a wise choice with its initially higher adhesion, ifmoisture saturation can be prevented (e.g., using an edgesealing agent).
ACKNOWLEDGEMENTS
This study led in the framework of the ArchinSolar project,and the authors would like to thank the Center of Compe-tence for Energy and Mobility (CCEM), the Swiss FederalOffice for Energy (SFOE), Swiss Electric Research (SER)and the Services Industriels Genevois (SIG) for funding.
The authors would also like to thank the EPFL-ATMXworkshop for samples preparation, Vincent Trachsel forhis help with the samples testing, and Christian Schlumpffor careful manuscript reading.
REFERENCES
1. Czanderna AW, Pern FJ. Encapsulation of PV modulesusing ethylene vinyl acetate copolymer as a pottant: Acritical review. Solar Energy Materials and Solar Cells1996; 43: 101–108.
2. Oreski G, Wallner GM. Delamination behaviour ofmulti-layer films for PV encapsulation.. Solar EnergyMaterials and Solar Cells 2005; 89: 139–151.
3. Jorgensen GJ, Terwilliger KM, DelCueto JA, Glick SH,Kempe MD, Pankow JW, Pern FJ, McMahon TJ. Mois-ture transport, adhesion, and corrosion protection of PVmodule packaging materials. Solar Energy Materialsand Solar Cells 2006; 90: 2739–2775.
4. Jorgensen G, Terwilliger K, Glick S, Pern J, McMahon T.Material testing for PV module encapsulation, NREL/CP-520-33578, May 2003.
5. Van Dyk EE, Chamel JB, Gxasheka AR. Investigationof delamination in an edge-defined film-fed growthphotovoltaic module. Solar Energy Materials andSolar Cells 2005; 88: 403–411.
6. Keller UW, Mortelmans H. Adhesion in laminatedsafety glass – What makes it work ?, Glass ProcessingDays, 13–16 June 1999.
7. Matthews FL, Kilty PF, Godwin EW. A review ofthe strength of joints in fibre-reinforced plastics.Composites January 1982; 29–37.
8. Herrera-Franco PJ, Drzal LT. Comparison of methodsfor the measurement of fibre/matrix adhesion in com-posites. Composites 1992; 23(1): 1–27.
9. MenningenM,Weiss H. Surface andCoatings Technology1995; 76–77: 835–840.
10. Awajas F, Gilbert M, Kelly G, Fox B, Pigram PJ.Adhesion of polymers. Progress in Polymer Science2009; 34: 948–968.
11. Sargent JP. Durability studies for aerospace applica-tions using peel and wedge tests. International Journalof Adhesion and Adhesives 2005; 25: 247–256.
12. Moore DR. An introduction to the special issue on peeltesting. International Journal of Adhesion and Adhe-sives 2008; 28: 153–157.
Compressive-shear adhesion characterization of PVB and EVAV. Chapuis et al.
413Prog. Photovolt: Res. Appl. 2014; 22:405–414 © 2012 John Wiley & Sons, Ltd.DOI: 10.1002/pip

13. ASTM Standard Test Method D6862-11 for 90 degreepeel resistance of adhesives.
14. ASTM Standard Test Method D3983-98 for measuringstrength and shear modulus of non-rigid adhesives bythe thick adherend tensile-lap specimen.
15. Mendels D-A, Page SA, Leterrier Y, Månson J-AE,Nairn JA. European conference on composite materials,Brighton, UK, 4–7 June 2000.
16. Hadavina H, Kawashita L, Kinloch AJ, Moore DR,Williams JG. A numerical analysis of the elastic-plasticpeel testEngineering Fracture Mechanics 2006; 73:2324–2335.
17. Rahul-Kumar P, Jagota A, Bennison SJ, Saigal S.Interfacial failures in a compressive shear strength testof glass/polymer laminates. Acta Materialia 1999;47(15): 4161–4169.
18. Schneider K, lauke B, Beckert W. Compression ShearTest (CST) — a convenient apparatus for the estima-tion of apparent shear strength of composite materials.Applied Composite Materials 2001; 8: 43–62.
19. Crocombe AD, Bigwood DA, Richardson G. Analysingjoints for structural adhesive failure. International Journalof Adhesion and Adhesives 1990; 10(3): 167–178.
20. Papini M, Fernlund G, Spelt JK. The effect of geome-try on the fracture of adhesive joints. InternationalJournal of Adhesion and Adhesives 1994; 14(1): 5–13.
21. Pern FJ, Glick SH. Adhesion strength study of EVAencapsulants on glass substrates, NREL/CP-520-33558,May 2003.
22. Da Silva LFM, Rodrigues TNSS, Figueiredo MAV, deMoura MFSF, Chousal JAG. Effect of adhesive type andthickness on the lap shear strength. The Journal ofAdhesion 2006; 82: 1091–1115.
23. Abaqus 6.8.1, Dassault Systèmes, 2004.24. KempeMD, JorgensenGJ, Terwilliger KM,McMahon TJ,
Kennedy CE, Borek TT. Acetic acid production andglass transition concerns with ethylene-vinyl acetateused in photovoltaic devices. Solar Energy Materials& Solar Cells 2007; 91: 315–329.
25. Koenig JL, Boerio FJ, Plueddemann EP, Miller J, WillisPB, Cuddihy EF. Chemical bonding technology: directinvestigation of interfacial bonds, JPL Publication 86–6,January 1986.
26. Li H-Y et al. submitted 2011.27. Klemchuk P, Ezrin M, Lavigne G, Halley W, Agro JS.
Investigation of the degradation and stabilization of EVA-based encapsulant in field-aged solar energy modules.Polymer Degradation and Stability 1997; 55: 347–365.
28. Vogt M. Etimex review, 28th March 2006.29. Li H-Y, Lange RFM, Luo Y, Polo R, Zahnd J. The
lamination of (multi)crystalline and thin film based photo-voltaic modules. Progress in Photovoltaics: Researchand Applications. 2011. DOI: 10.1002/pip.1175
30. Kausch H-H. Traité des Matériaux 14. PPUR:Lausanne, 2001.
31. Lopez-Pamies O. A new I1-based hyperelastic model forrubber elastic materials. Comptes Rendus Mécanique2010; 338: 3–11.
Compressive-shear adhesion characterization of PVB and EVA V. Chapuis et al.
414 Prog. Photovolt: Res. Appl. 2014; 22:405–414 © 2012 John Wiley & Sons, Ltd.DOI: 10.1002/pip