comprehensive gene and microrna expression profiling reveals the crucial role of hsa-let-7i and its...
TRANSCRIPT

Comprehensive Gene and microRNA Expression ProfilingReveals a Role for microRNAs in Human LiverDevelopmentGalit Tzur1, Ariel Israel1, Asaf Levy2, Hila Benjamin2, Eti Meiri2, Yoel Shufaro1,4, Karen Meir3, Elina
Khvalevsky1, Yael Spector2, Nathan Rojansky4, Zvi Bentwich2, Benjamin E. Reubinoff1, Eithan Galun1*
1 The Goldyne Savad Institute for Gene Therapy, Hadassah Hebrew University Hospital, Jerusalem, Israel, 2 Rosetta Genomics, Rehovot, Israel, 3 Department of Pathology,
Hadassah Hebrew University Hospital, Jerusalem, Israel, 4 Department of Obstetrics and Gynecology, Hadassah Hebrew University Hospital, Jerusalem, Israel
Abstract
Background and Aims: microRNAs (miRNAs) are small noncoding RNAs that regulate cognate mRNAs post-transcriptionally.miRNAs have been implicated in regulating gene expression in embryonic developmental processes, including proliferationand differentiation. The liver is a multifunctional organ, which undergoes rapid changes during the developmental periodand relies on tightly-regulated gene expression. Little is known regarding the complex expression patterns of both mRNAsand miRNAs during the early stages of human liver development, and the role of miRNAs in the regulation of this processhas not been studied. The aim of this work was to study the impact of miRNAs on gene expression during early human liverdevelopment.
Methods: Global gene and miRNA expression were profiled in adult and in 9–12w human embryonic livers, using high-density microarrays and quantitative RT-PCR.
Results: Embryonic liver samples exhibited a gene expression profile that differentiated upon progression in thedevelopmental process, and revealed multiple regulated genes. miRNA expression profiling revealed four major expressionpatterns that correlated with the known function of regulated miRNAs. Comparison of the expression of the most regulatedmiRNAs to that of their putative targets using a novel algorithm revealed a significant anti-correlation for several miRNAs,and identified the most active miRNAs in embryonic and in adult liver. Furthermore, our algorithm facilitated theidentification of TGFb-R1 as a novel target gene of let-7.
Conclusions: Our results uncover multiple regulated miRNAs and genes throughout human liver development, and ouralgorithm assists in identification of novel miRNA targets with potential roles in liver development.
Citation: Tzur G, Israel A, Levy A, Benjamin H, Meiri E, et al. (2009) Comprehensive Gene and microRNA Expression Profiling Reveals a Role for microRNAs inHuman Liver Development. PLoS ONE 4(10): e7511. doi:10.1371/journal.pone.0007511
Editor: Gordon Chua, University of Calgary, Canada
Received July 14, 2009; Accepted September 28, 2009; Published October 20, 2009
Copyright: � 2009 Tzur et al. This is an open-access article distributed under the terms of the Creative Commons Attribution License, which permits unrestricteduse, distribution, and reproduction in any medium, provided the original author and source are credited.
Funding: This work was supported by the Framework Program 7 (FP7) of the European Community, program Life Science Health B (LSHB-CT-2008- 223317, LIV-ES) and through grants from Lille and Alfy Nathan, Barbara Fox Miller and the Horowitz and the Wolfson Foundations. The funders had no role in study design,data collection and analysis, decision to publish, or preparation of the manuscript.
Competing Interests: The authors have declared that no competing interests exist.
* E-mail: [email protected]
Introduction
The liver transcriptome codes for diverse metabolic functions,
such as protein synthesis, biotransformation of molecules and
hormone release. While most of these functions fully develop only
after birth, they evolve during embryonic liver development
through dynamic changes of gene expression. Current evidence
suggests that certain genes are critical to normal development of
the liver, but the overall pattern of interacting genetic elements
remains obscure, especially in humans. Gene expression profiling
performed on mouse embryonic liver tissues [1,2] and on isolated
murine hepatoblasts [3] has identified a unique expression pattern
relative to the adult liver. In humans, the gene expression pattern
of the fetal liver was analyzed using the mRNA differential display
technique, and revealed multiple regulated genes, most of which
were turned on during organogenesis, whereas some were
exclusively expressed in the fetal liver [4].
MicroRNAs (miRNAs) are small noncoding RNAs that regulate
mRNA and protein expression [5]. miRNAs have been implicated
in regulating gene expression in most stages and processes of
embryonic development, such as cell differentiation, cell prolifer-
ation, and organ formation (reviewed in [6]).
The function of miRNAs during liver development is currently
poorly understood. miRNA expression has been characterized in a
relatively late stage of human liver development and revealed
changes in miRNA expression between a five-month old fetal liver
tissue and several hepatocellular carcinoma cell lines [7]. Such
profiling, however, has not yet been applied for earlier stages of
human liver development, which are characterized by extensive
cell proliferation as well as differentiation.
PLoS ONE | www.plosone.org 1 October 2009 | Volume 4 | Issue 10 | e7511

Analysis of both gene and miRNA expression is an important
step towards understanding the developmental process taking
place in the liver. Furthermore, integration of gene and miRNA
expression data will enable the estimation of the extent to which
miRNAs regulate gene expression during human liver develop-
ment, and the identification of novel target genes of differentially-
expressed miRNAs.
In the present work, we measured gene and miRNA expression
in adult liver tissue samples and embryonic liver samples
corresponding to the early stages of human liver development,
and harnessed a novel algorithm in order to analyze the impact of
miRNA expression on gene regulation. We detected increased
levels for specific miRNAs in either the embryonic or the adult
liver, and for specific miRNAs, we show a negative correlation
between the pattern of expression of the miRNA, and the pattern
of expression of their predicted target genes. This analysis has also
led us to discover a miR-target relationship for at least one of the
regulated miRNAs, let-7c, with the differentially-expressed gene
TGFBR1.
Materials and Methods
TissuesHuman liver and other tissues were collected from aborted
healthy embryos under the Hadassah Ein Kerem institutional IRB
approval, and after obtaining a written informed consent for each
embryo. After identification and separation of the liver tissue, the
liver and the rest of the embryo were immediately snap-frozen in
liquid nitrogen and then stored at 280uC until analysis. The age
of the embryos was defined according to the first day of the last
menstrual period, and confirmed by ultrasound performed at 7–9
weeks from the first day of last menstrual period. Ultrasound-
based age dating accuracy is 65d.
ImmunohistochemistryImmunohistochemistry was performed on 5 mm-thick sections
from formalin-fixed paraffin- embedded hepatic tissue. Incubation
with antibodies to cytokeratin-7 (diluted 1:2000; DAKO,
Glostrup, Denmark), cytokeratin 19 (diluted 1:75; DAKO),
alpha-fetoprotein (diluted 1:500; DAKO), and cytokeratin 18
(diluted 1:1000; Sigma, St. Louis, MO) was performed on an
automated immunostainer (Nexes, Ventana, Tucson, USA), with
diaminobenzidine/H2O2 as a chromogen.
RNA IsolationTotal RNA was isolated from cells or tissues with Trizol reagent
(Invitrogen, Carlsbad, CA) following the manufacturer’s instruc-
tions, with the exception that the RNA was precipitated over-
night at 220uC in ethanol. RNA quality and quantity were
analyzed using gel electrophoresis and Nanodrop (ND-1000
Spectrophotometer).
cDNA MicroarrayGene expression profiling was performed using the Affymetrix
Human Genome U133A Plus 2.0 Array (Santa Clara, CA), for
analysis of over 47,000 transcripts, including ,21,000 well-
characterized human genes, according to the manufacturer’s
instructions. Data was normalized using the GCRMA algorithm
[8] implemented in R and bioconductor [9]. T-tests were
performed using Excel software. Cluster analysis was performed
using Cluster 3.0 [10], and heat maps were produced with Java
Treeview software [11]. The datasets have been deposited in
NCBI’s Gene Expression Omnibus [12] and are accessible
through GEO Series accession number GSE15238 (http://www.
ncbi.nlm.nih.gov/geo/query/acc.cgi?acc = GSE15238).
microRNA MicroarrayCustom microRNA microarrays were prepared as described
previously [13]. Briefly, ,750 DNA oligonucleotide probes
representing microRNAs were spotted in triplicate on coated
microarray slides (NexterionH Slide E, Schott, Mainz, Germany).
3–5 mg of total RNA were labeled by ligation of an RNA-linker, p-
rCrU-Cy/dye (Dharmacon, Lafayette, CO; Cy3 or Cy5) to the 39
end. Slides were incubated with the labeled RNA for 12–16 hr at
42uC, and then washed twice. Arrays were scanned at a resolution
of 10 mm, and images were analyzed using SpotReader software
(Niles Scientific, Portola Valley, CA). Two groups of positive
control probes were designed: small RNA synthetic spikes were
added to the RNA before labeling to verify the labeling efficiency,
and probes for abundant small RNA (e.g., small nuclear RNAs
U43, U49, U24, Z30, U6, U48, and U44, and 5.8s and 5s
ribosomal RNA) were spotted on the array in triplicates to verify
RNA quality. Microarray spots were combined and signals were
normalized using polynomial normalization against the median of
each probe in the 7 samples.
miRNA targets predictionsIn this study, we used TargetScan 4.0 predictions (downloaded
in July 2007) of miRNA targets [14,15]. TargetScan uses both
evolutionary conservation of the seed, and specific context
determinants to predict miRNA targets.
Mapping of probe-sets to miR-seedsWe assigned each probe-set available on the microarray, a list of
miRNA seeds that regulate the transcripts detected by the probe-
set, as described in [16]. Only when the sequence corresponding to
a given miRNA binding site was directly recognized by a probe-set
or was located upstream to the sequences detected by the probe-set
in the gene, did we consider this probe-set to be affected by the
activity of this miRNA seed. We used for this purpose the UCSC
genome browser database [17], human build 17 (http://genome.
ucsc.edu). We downloaded the TargetScan predictions from the
website (http://www.targetscan.org) and mapped them to the
UCSC genome.
Calculation of enrichment of downregulated genes withincreasing number of miR target sites
For the given set of miR-seeds, we performed enrichment tests
iteratively for each i between 1 and the maximal number of target
sites, as follows. The total population size (N) was the number of
informative probe sets having at least i-1 target sites for the
considered set of miR-seeds, the number of probe-sets reporting
downregulation were counted as successes (m). We tested for
enrichment of downregulation in the sample of probe-sets
detecting at least i target sites for these miR-seeds.
Real-time Quantitative Polymerase Chain ReactionQuantification of mRNA and microRNA using real-time RT-
PCR was carried out using TaqMan-based assay. For mature
microRNA quantification, a two-step protocol including reverse
transcription with a miRNA-specific primer and TaqMan
MicroRNA Reverse Transcription Kit, followed by real-time
PCR with TaqMan assays (human) and Taqman PCR Master
Mix Kit, was applied on ten nanograms of total RNA for each
sample (all reagents were purchased from Applied Biosystems
[ABI], Foster City, CA); reaction protocols were carried out
microRNAs in Liver Development
PLoS ONE | www.plosone.org 2 October 2009 | Volume 4 | Issue 10 | e7511

according to the manufacturer’s instructions. For mRNA quan-
tification, 2.5 mg of total RNA were reverse transcribed using
random hexamer primers and Moloney murine leukemia virus
reverse transcriptase RNase H minus (both from Promega,
Madison, WI). cDNA was amplified with Fast Taqman PCR
Master Mix Kit and inventoried human Taqman assays (both
from ABI), according to the manufacturer’s instructions. The
reactions for miRNA and mRNA were automated by a 7900HT
Fast Real-Time PCR System (ABI). Each PCR reaction was
performed in triplicate and the average ct was used for the RQ
calculation after normalization to RNU43 (for miRNAs) and
human GUSB (for mRNAs) (both from ABI).
Western BlottingWestern blot assays were carried out using routine procedures.
Briefly, cells were homogenized in lysis buffer A (0.25 M sucrose,
20 mM Tris pH 7.6, 1.5 mM MgCl2, 10% glycerol, 1 mM EDTA
and ‘‘Complete mini’’ protein inhibitor cocktail [Roche Diagnos-
tics, # 11836153001]), incubated on ice for 10 min and
centrifuged at 12,000 rpm for 15 min at 4uC for supernatant
collection. Primary Abs: anti-TGFBR1 (diluted 1:250, Abcam,
Cambridge, MA, # ab31013), anti-b-Actin (ICN/MP Biomedi-
cals, USA, # 691001). Secondary Ab: Dako EnVision System
labeled Polymer-HRP anti rabbit (DAKO, # K4003). Proteins
were visualized by the EZ-ECL chemiluminescence detection kit
for HRP (Biological Industries, Bet Haemek).
Plasmids and TransfectionsFor construction of a vector containing TGFBR1–39UTR fused to
the 39 of a Luciferase reporter, we used the dual luciferase pmirGLO
vector (Promega). A 4-kb fragment of the 4.8-kb human TFGBR1
39UTR (containing both putative let-7c binding sites) was amplified
by PCR applied on genomic DNA extracted from HEK293 cells,
using primers: 59- CCAAGTTTAAACAGATCTGCTCCTGG-
GTTTTA (PmeI), and 59- CCAAGCTAGC-ACCGGTATGCTC-
TGACAAATATTAAAC (NheI, AgeI), and cloned into the PmeI/NheI
sites of pmirGLO, to generate pmirGLO-TGFBR1-long 39UTR. In
addition, ,200-bp fragments containing either the 59 (75–82) or the
39 (3889–3895) putative let-7c binding sites were amplified using
primers: 59 site - 59- CCAATCTAGAAGATCTGCTCCT-
GGGTTTTA (XbaI), and 59- CCAAGCTAGC-ACCGGTTT-
TCTGTCCTGGGAAAGAAG (NheI, AgeI) (cloned into the XbaI
site of pmirGLO); 39 site – 59– CCAAAGTCGACAACAA-
GATTTGTGAACTGAA (SalI), and 59- CCAACTGCAG ATG-
CTCTGACAAATATTAAAC (PstI) (cloned into SalI/SbfI sites of
pmirGLO), to generate pmirGLO-TGFBR1-39UTR 59 site and
pmirGLO-TGFBR1-39UTR 39 site, respectively. For generation of
mutated 59 and 39 sites, five mutations were introduced to the
putative let-7c binding sites by PCR. The sequence of the 59 site was
amplified from pmirGLO-TGFBR1-39UTR 59 site by PCR using
primers: 59- CCAATCTAGAAGATCTGCTCCTGGGTTT-
TAATTTGGGAGGTCAATTGTTCTTCACATCTGAGAGG-
GAAC (XbaI), and 59- CCAAGCTAGC-ACCGGTTTTCT-
GTCCTGGGAAAGAAG (NheI, AgeI) and recloned into the XbaI
site of this vector. The sequence of the 39 site was amplified from
pmirGLO-TGFBR1-39UTR 39 site by PCR using primers: 59–
CCAAAGTCGACAACAAGATTTGTGAACTGAA (SalI), and
59- CCAACTGCAG ATGCTCTGACAAATATTAAACATTA-
TATACACAAATGTGAAAATGTACCTTGG (PstI) and recloned
into the SalI/SbfI sites of this vector. The basic vector pmirGLO
served as an empty vector. All vectors were sequence-verified.
Transfection of plasmids and or pre-miR reagents (pre-miR
negative control #1 and pre-miR let-7c, Ambion) was performed
with Oligofectamine reagent (Invitrogen, Carlsbad, CA), accord-
ing to the manufacturer’s instructions. The cells were plated 24 hrs
prior to transfection in 6-well plates for RNA extraction or 24-well
plates for luciferase assay (using the Dual Luciferase assay as
described by the manufacturer – Promega). The cells were
transfected with 25 ng of a Luciferase-containing plasmid, and or
7.5–30 nM of pre-miR reagent, as detailed in the text and the
figure legends.
Statistical AnalysisData is expressed using the mean and the standard deviation
when at least three independent experiments were performed. The
two-tailed student’s t test was used for performing analysis of
variance in Excel software. A p value of 0.05 or less was considered
statistically-significant.
Results
Embryonic tissueFollowing the very early phase of liver development (upon
budding on , day 25 in humans), the liver undergoes a massive
proliferation phase to meet the needs during the gestational and
neonatal periods (to ultimately harbor ,1011 cells in the adult
period), while already maintaining some metabolic functions.
During this unique period, hepatocytes and non-parenchymal cells
need to both proliferate exponentially in order to meet the fetal
demands and to progress in differentiation. The current study aims
to investigate the transcriptional networking that enables these
functions (proliferation while differentiating) during early human
liver development, and to explore the possible involvement of
miRNAs in the regulation of these events. To this end, we
collected human liver tissues from aborted healthy embryos. We
collected a total of six liver tissues of embryos aged 9–12 weeks
from the last menstrual period (7–10 weeks from gestation) (Table
S1). We verified the identity of the liver tissue histologically and/or
by RT-PCR for known liver-specific markers, alpha-1 antitrypsin
and albumin.
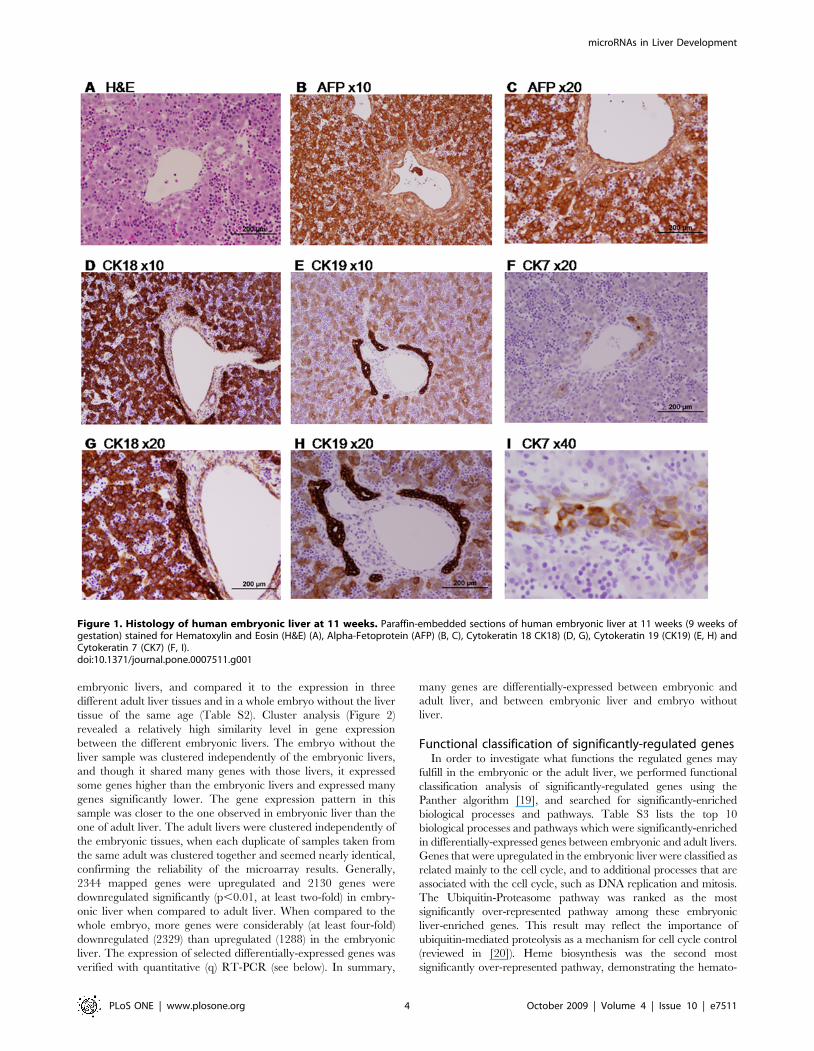
To determine the cellular content and structure of the human
fetal liver at this early phase, we first conducted a histological
analysis and investigated the expression pattern of known
hepatocytes and cholangiocytes markers. In H&E staining
(Figure 1A), hematopoietic islands are apparent between non-
organized hepatoblasts, teaching the importance of the liver as a
temporary hematopoietic site initiating approximately at 6 weeks
post-gestation [18]. In some cases, a liver triad (containing vein,
artery and bile ducts) can also be observed, with the beginning of
bile duct formation. A high level of alpha-fetoprotein (AFP)
staining (Figure 1B, C) discriminate the hepatocytes (positive) from
both hematopoietic cells and blood vessels cells (negative).
Cholangiocytes stain negatively for AFP. Cytokeratins (CK),
marker epithelial cells in the liver, are expressed at early stages in
hepatoblasts, while later on, CK18 will be expressed in
hepatocytes only, and CK7 and CK19 will be expressed in
cholangiocytes. At 11 weeks, CK18 (Figure 1D, G) is still expressed
in both cell types, CK19 (Figure 1E, H) is also still expressed in
hepatocytes but mainly in cholangiocytes, and CK7 (Figure 1F, I)
is expressed only in cholangiocytes.
Analysis of global gene expression in embryonic andadult human livers
The significant different tissue ultra-structure of the human
embryonic liver compared to the adult liver suggests that it harbors
a unique molecular driving force, which navigates its develop-
mental process. In an effort to reveal the functions essential for this
process, we characterized the global gene expression in the
microRNAs in Liver Development
PLoS ONE | www.plosone.org 3 October 2009 | Volume 4 | Issue 10 | e7511
embryonic livers, and compared it to the expression in three
different adult liver tissues and in a whole embryo without the liver
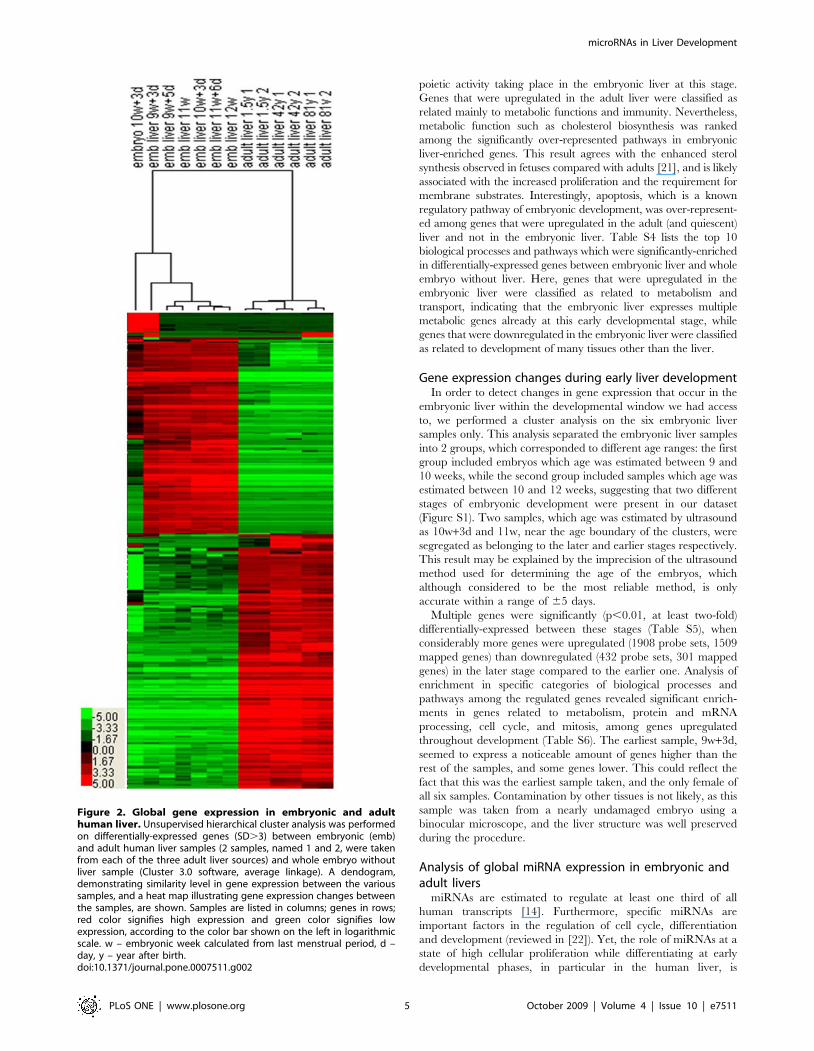
tissue of the same age (Table S2). Cluster analysis (Figure 2)
revealed a relatively high similarity level in gene expression
between the different embryonic livers. The embryo without the
liver sample was clustered independently of the embryonic livers,
and though it shared many genes with those livers, it expressed
some genes higher than the embryonic livers and expressed many
genes significantly lower. The gene expression pattern in this
sample was closer to the one observed in embryonic liver than the
one of adult liver. The adult livers were clustered independently of
the embryonic tissues, when each duplicate of samples taken from
the same adult was clustered together and seemed nearly identical,
confirming the reliability of the microarray results. Generally,
2344 mapped genes were upregulated and 2130 genes were
downregulated significantly (p,0.01, at least two-fold) in embry-
onic liver when compared to adult liver. When compared to the
whole embryo, more genes were considerably (at least four-fold)
downregulated (2329) than upregulated (1288) in the embryonic
liver. The expression of selected differentially-expressed genes was
verified with quantitative (q) RT-PCR (see below). In summary,
many genes are differentially-expressed between embryonic and
adult liver, and between embryonic liver and embryo without
liver.
Functional classification of significantly-regulated genesIn order to investigate what functions the regulated genes may
fulfill in the embryonic or the adult liver, we performed functional
classification analysis of significantly-regulated genes using the
Panther algorithm [19], and searched for significantly-enriched
biological processes and pathways. Table S3 lists the top 10
biological processes and pathways which were significantly-enriched
in differentially-expressed genes between embryonic and adult livers.
Genes that were upregulated in the embryonic liver were classified as
related mainly to the cell cycle, and to additional processes that are
associated with the cell cycle, such as DNA replication and mitosis.
The Ubiquitin-Proteasome pathway was ranked as the most
significantly over-represented pathway among these embryonic
liver-enriched genes. This result may reflect the importance of
ubiquitin-mediated proteolysis as a mechanism for cell cycle control
(reviewed in [20]). Heme biosynthesis was the second most
significantly over-represented pathway, demonstrating the hemato-
Figure 1. Histology of human embryonic liver at 11 weeks. Paraffin-embedded sections of human embryonic liver at 11 weeks (9 weeks ofgestation) stained for Hematoxylin and Eosin (H&E) (A), Alpha-Fetoprotein (AFP) (B, C), Cytokeratin 18 CK18) (D, G), Cytokeratin 19 (CK19) (E, H) andCytokeratin 7 (CK7) (F, I).doi:10.1371/journal.pone.0007511.g001
microRNAs in Liver Development
PLoS ONE | www.plosone.org 4 October 2009 | Volume 4 | Issue 10 | e7511
poietic activity taking place in the embryonic liver at this stage.
Genes that were upregulated in the adult liver were classified as
related mainly to metabolic functions and immunity. Nevertheless,
metabolic function such as cholesterol biosynthesis was ranked
among the significantly over-represented pathways in embryonic
liver-enriched genes. This result agrees with the enhanced sterol
synthesis observed in fetuses compared with adults [21], and is likely
associated with the increased proliferation and the requirement for
membrane substrates. Interestingly, apoptosis, which is a known
regulatory pathway of embryonic development, was over-represent-
ed among genes that were upregulated in the adult (and quiescent)
liver and not in the embryonic liver. Table S4 lists the top 10
biological processes and pathways which were significantly-enriched
in differentially-expressed genes between embryonic liver and whole
embryo without liver. Here, genes that were upregulated in the
embryonic liver were classified as related to metabolism and
transport, indicating that the embryonic liver expresses multiple
metabolic genes already at this early developmental stage, while
genes that were downregulated in the embryonic liver were classified
as related to development of many tissues other than the liver.
Gene expression changes during early liver developmentIn order to detect changes in gene expression that occur in the
embryonic liver within the developmental window we had access
to, we performed a cluster analysis on the six embryonic liver
samples only. This analysis separated the embryonic liver samples
into 2 groups, which corresponded to different age ranges: the first
group included embryos which age was estimated between 9 and
10 weeks, while the second group included samples which age was
estimated between 10 and 12 weeks, suggesting that two different
stages of embryonic development were present in our dataset
(Figure S1). Two samples, which age was estimated by ultrasound
as 10w+3d and 11w, near the age boundary of the clusters, were
segregated as belonging to the later and earlier stages respectively.
This result may be explained by the imprecision of the ultrasound
method used for determining the age of the embryos, which
although considered to be the most reliable method, is only
accurate within a range of 65 days.
Multiple genes were significantly (p,0.01, at least two-fold)
differentially-expressed between these stages (Table S5), when
considerably more genes were upregulated (1908 probe sets, 1509
mapped genes) than downregulated (432 probe sets, 301 mapped
genes) in the later stage compared to the earlier one. Analysis of
enrichment in specific categories of biological processes and
pathways among the regulated genes revealed significant enrich-
ments in genes related to metabolism, protein and mRNA
processing, cell cycle, and mitosis, among genes upregulated
throughout development (Table S6). The earliest sample, 9w+3d,
seemed to express a noticeable amount of genes higher than the
rest of the samples, and some genes lower. This could reflect the
fact that this was the earliest sample taken, and the only female of
all six samples. Contamination by other tissues is not likely, as this
sample was taken from a nearly undamaged embryo using a
binocular microscope, and the liver structure was well preserved
during the procedure.
Analysis of global miRNA expression in embryonic andadult livers
miRNAs are estimated to regulate at least one third of all
human transcripts [14]. Furthermore, specific miRNAs are
important factors in the regulation of cell cycle, differentiation
and development (reviewed in [22]). Yet, the role of miRNAs at a
state of high cellular proliferation while differentiating at early
developmental phases, in particular in the human liver, is
Figure 2. Global gene expression in embryonic and adulthuman liver. Unsupervised hierarchical cluster analysis was performedon differentially-expressed genes (SD.3) between embryonic (emb)and adult human liver samples (2 samples, named 1 and 2, were takenfrom each of the three adult liver sources) and whole embryo withoutliver sample (Cluster 3.0 software, average linkage). A dendogram,demonstrating similarity level in gene expression between the varioussamples, and a heat map illustrating gene expression changes betweenthe samples, are shown. Samples are listed in columns; genes in rows;red color signifies high expression and green color signifies lowexpression, according to the color bar shown on the left in logarithmicscale. w – embryonic week calculated from last menstrual period, d –day, y – year after birth.doi:10.1371/journal.pone.0007511.g002
microRNAs in Liver Development
PLoS ONE | www.plosone.org 5 October 2009 | Volume 4 | Issue 10 | e7511

unknown. In an effort to investigate which roles miRNAs may play
during early human liver development, we profiled the expression
of 507 known miRNAs and additional miRNAs validated by
Rosetta Genomics in embryonic and adult liver samples and in the
corresponding embryos without liver samples (detailed in Table
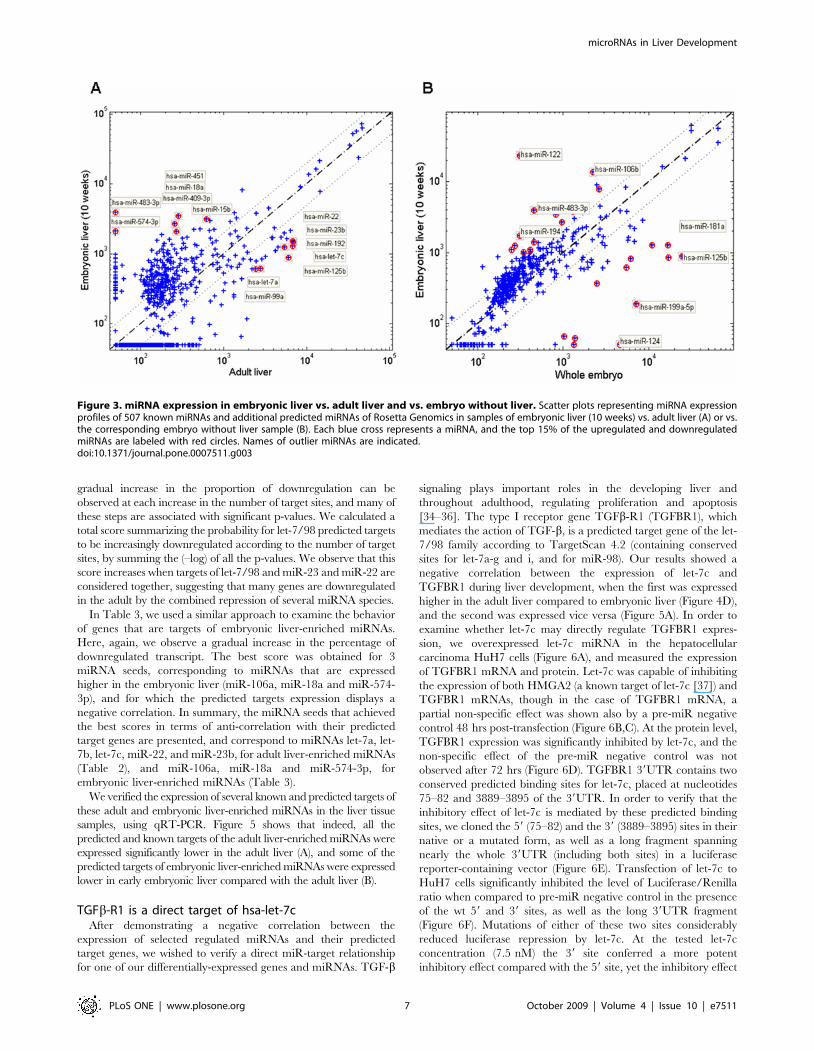
S1), using custom miRNA microarrays (Table S7). The top 15% of
the differentially-expressed miRNAs are listed in Table 1, and
representative scatter plots, comparing miRNA expression in
embryonic liver versus adult liver or versus embryo without liver
are shown in Figure 3. We identified several miRNA expression
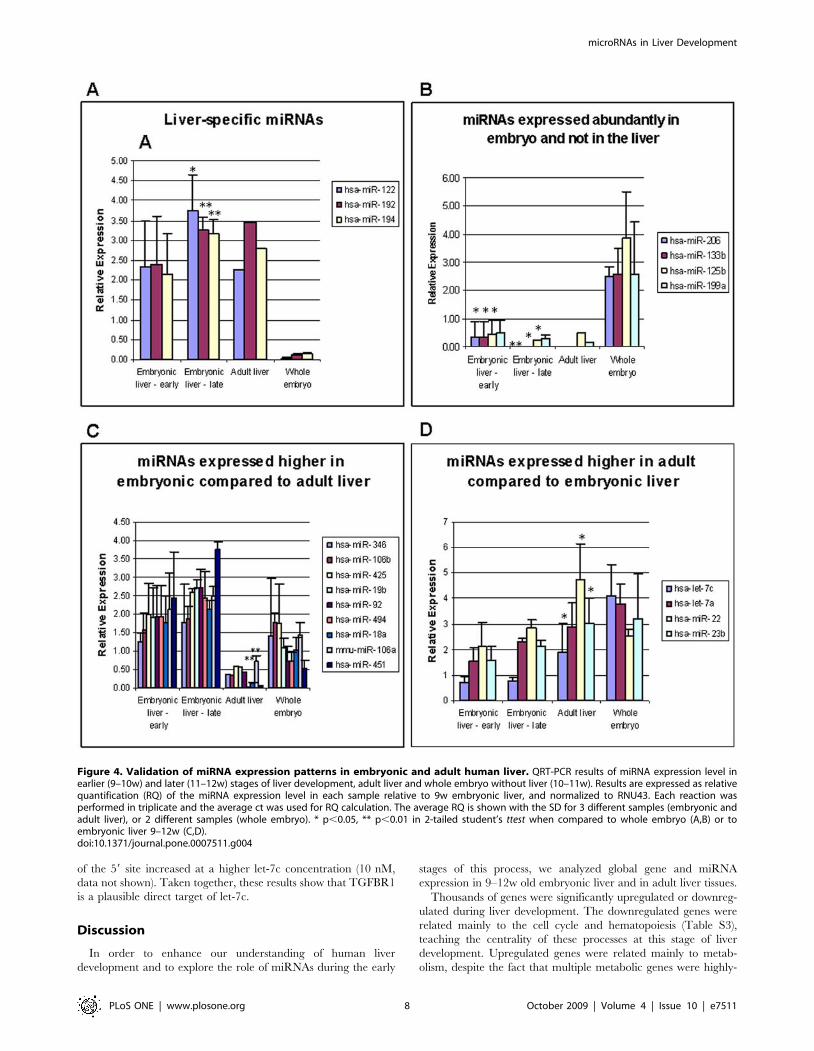
patterns, and verified the expression of selected miRNAs of each
pattern with qRT-PCR. The first pattern was of liver-specific
miRNAs, represented in Figure 4A by miR-122, miR-192 and
miR-194. These miRNAs were not expressed in the rest of the
embryo, and were highly-expressed both in the embryonic and the
adult livers. miR-122 is known to be liver–specific, and is highly-
expressed also in mouse embryonic liver [23,24]. Our results show
that this miRNA is expressed already at 9 weeks (7 weeks from
gestation) as high as in adult liver. miR-192 and miR-194, also
grouped here, are expressed relatively specifically in endoderm-
derived tissues, such as the liver, lungs and the gastrointestinal
tract [13,25,26]. Reciprocally, some miRNAs were abundantly-
expressed in the rest of the embryo, and expressed at very low
levels in embryonic and in adult livers (Figure 4B): for instance,
miR-206, which was shown to function in skeletal muscle
development [27]. A third pattern contained miRNAs that were
highly-expressed in embryonic liver compared to adult liver
(Figure 4C). The fourth pattern contained miRNAs that were
expressed higher in the adult liver compared to the embryonic
liver (Figure 4D). These results demonstrate a unique miRNA
expression in the early embryonic liver compared to other
embryonic tissues and to the adult liver, and suggest a regulatory
role for the differentially-expressed miRNAs.
Predicted targets of selected regulated miRNAs areinversely-expressed to their cognate miRNAs
It has been shown that miRNAs accelerate the degradation of
their target transcripts and repress their translation. In addition,
several studies have shown a clear correlation between miRNAs
that are highly expressed in a given tissue and the downregulation
of their target transcripts [16,25,28–30]. The increased levels that
were observed for some miRNAs in either the adult or embryonic
liver, suggest that many genes that are targets of these miRNA
could be repressed in the liver embryo, or in the adult liver. In
order to assess the impact of these miRNAs on gene expression, we
examined the behavior of predicted targets for these miRNAs
using the MiRABELLE algorithm that we have recently published
[16]. This algorithm uses the gene expression levels to compute
scores that reflect the extent of downregulation of target genes for
each miRNA seed in the samples. Using this algorithm, we
systematically surveyed the target gene behavior of all the
differentially-expressed miRNAs that we found. Among adult
liver-enriched miRNAs, we confirmed a statistically-significant
downregulation of transcripts that have predicted binding sites for
the let-7/98, miR-22 and miR-23 seeds, which correspond to the
miRNAs identified previously as expressed higher in the adult liver
than in the embryo: let-7a, let-7b, let-7c, miR-22, and miR-23b.
The downregulation of these transcripts could reflect other
regulatory mechanisms in addition to miRNAs. To provide
additional support for the hypothesis that increased levels of
miRNAs were instrumental in the downregulation of these
miRNA target genes, we verified a known property of miRNA
regulation: if the transcripts were downregulated as an effect of
miRNA-mediated degradation, then we should observe a more
efficient downregulation of transcripts carrying multiple predicted
binding sites for miRNAs [31–33]. We, therefore, examined the
extent of gene target downregulation as a function of the number
of binding sites for these seeds in target transcripts.
Table 2 summarizes the expression trends observed for probe-sets
that detect transcripts carrying predicted target sites for miRNAs,
whose predicted targets were negatively-expressed to them in the
most significant manner. To exemplify the targets’ behavior trends,
we will use the let-7/98 seed, which corresponds to the seed of
several miRNAs (let-7a, let-7b and let-7c) that are upregulated in
adult compared to embryonic livers. The first line in the table
indicates that our microarray platform includes 40,539 informative
probe-sets, with 43.67% of them displaying downregulation in the
adult liver (without specifying a minimal threshold). Looking further
for probe-sets detecting transcripts carrying at least 1 binding site for
let-7/98, we find that among the 811 probe-sets detecting such
transcripts, the percentage of downregulation increases to 56.60%
(p,5.75N10214 by a hypergeometric test). This percentage continues
to increase for probe-sets detecting transcripts carrying more
miRNA binding sites, reaching 100% for probe-sets detecting
transcripts with 4 or more binding sites. The first p-value is usually
the most significant, since it reflects enrichment on the largest sample
size, and hence has the strongest statistical power. Yet, the trend of
Table 1. The top 15% differentially-expressed miRNAs during liver development.
Expressed higher in adultcompared to embryonic liver {
Expressed higher in embryoniccompared to adult liver y
Abundantly-expressed inembryonic liver
Abundantly-expressed in embryo(deprived of embryonic liver)
let-7a miR-18a miR-106b let-7c
let-7b miR-409-3p miR-122 miR-124
let-7c miR-451 miR-192 miR-125a-5p
miR-125b miR-483-3p miR-194 miR-125b
miR-192 miR-92a miR-451 miR-140-3p
miR-22 miR-483-3p miR-199a-5p
miR-23b miR-199a-3p
miR-99a miR-205
miR-206
{Higher at least 2-fold than the expression in at least 2/3 embryonic livers.yHigher at least 2-fold in at least 2/3 embryonic livers than the expression in adult liver.doi:10.1371/journal.pone.0007511.t001
microRNAs in Liver Development
PLoS ONE | www.plosone.org 6 October 2009 | Volume 4 | Issue 10 | e7511
gradual increase in the proportion of downregulation can be
observed at each increase in the number of target sites, and many of
these steps are associated with significant p-values. We calculated a
total score summarizing the probability for let-7/98 predicted targets
to be increasingly downregulated according to the number of target
sites, by summing the (–log) of all the p-values. We observe that this
score increases when targets of let-7/98 and miR-23 and miR-22 are
considered together, suggesting that many genes are downregulated
in the adult by the combined repression of several miRNA species.
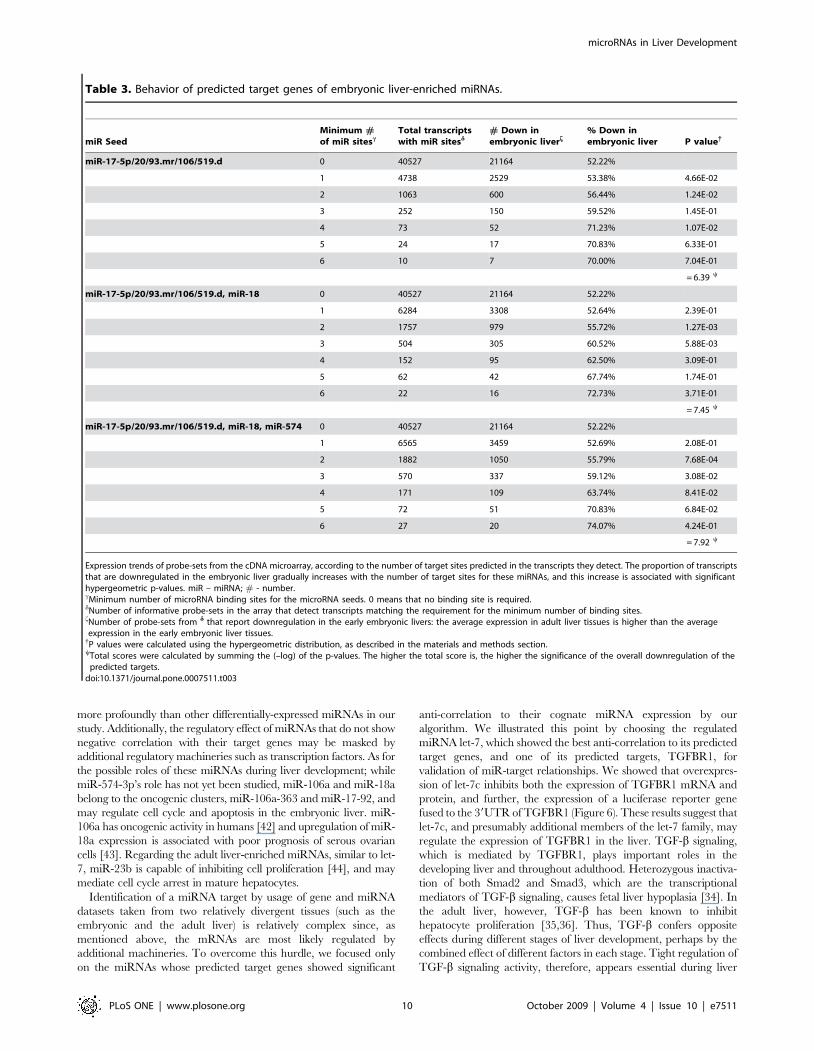
In Table 3, we used a similar approach to examine the behavior
of genes that are targets of embryonic liver-enriched miRNAs.
Here, again, we observe a gradual increase in the percentage of
downregulated transcript. The best score was obtained for 3
miRNA seeds, corresponding to miRNAs that are expressed
higher in the embryonic liver (miR-106a, miR-18a and miR-574-
3p), and for which the predicted targets expression displays a
negative correlation. In summary, the miRNA seeds that achieved
the best scores in terms of anti-correlation with their predicted
target genes are presented, and correspond to miRNAs let-7a, let-
7b, let-7c, miR-22, and miR-23b, for adult liver-enriched miRNAs
(Table 2), and miR-106a, miR-18a and miR-574-3p, for
embryonic liver-enriched miRNAs (Table 3).
We verified the expression of several known and predicted targets of
these adult and embryonic liver-enriched miRNAs in the liver tissue
samples, using qRT-PCR. Figure 5 shows that indeed, all the
predicted and known targets of the adult liver-enriched miRNAs were
expressed significantly lower in the adult liver (A), and some of the
predicted targets of embryonic liver-enriched miRNAs were expressed
lower in early embryonic liver compared with the adult liver (B).
TGFb-R1 is a direct target of hsa-let-7cAfter demonstrating a negative correlation between the
expression of selected regulated miRNAs and their predicted
target genes, we wished to verify a direct miR-target relationship
for one of our differentially-expressed genes and miRNAs. TGF-b
signaling plays important roles in the developing liver and
throughout adulthood, regulating proliferation and apoptosis
[34–36]. The type I receptor gene TGFb-R1 (TGFBR1), which
mediates the action of TGF-b, is a predicted target gene of the let-
7/98 family according to TargetScan 4.2 (containing conserved
sites for let-7a-g and i, and for miR-98). Our results showed a
negative correlation between the expression of let-7c and
TGFBR1 during liver development, when the first was expressed
higher in the adult liver compared to embryonic liver (Figure 4D),
and the second was expressed vice versa (Figure 5A). In order to
examine whether let-7c may directly regulate TGFBR1 expres-
sion, we overexpressed let-7c miRNA in the hepatocellular
carcinoma HuH7 cells (Figure 6A), and measured the expression
of TGFBR1 mRNA and protein. Let-7c was capable of inhibiting
the expression of both HMGA2 (a known target of let-7c [37]) and
TGFBR1 mRNAs, though in the case of TGFBR1 mRNA, a
partial non-specific effect was shown also by a pre-miR negative
control 48 hrs post-transfection (Figure 6B,C). At the protein level,
TGFBR1 expression was significantly inhibited by let-7c, and the
non-specific effect of the pre-miR negative control was not
observed after 72 hrs (Figure 6D). TGFBR1 39UTR contains two
conserved predicted binding sites for let-7c, placed at nucleotides
75–82 and 3889–3895 of the 39UTR. In order to verify that the
inhibitory effect of let-7c is mediated by these predicted binding
sites, we cloned the 59 (75–82) and the 39 (3889–3895) sites in their
native or a mutated form, as well as a long fragment spanning
nearly the whole 39UTR (including both sites) in a luciferase
reporter-containing vector (Figure 6E). Transfection of let-7c to
HuH7 cells significantly inhibited the level of Luciferase/Renilla
ratio when compared to pre-miR negative control in the presence
of the wt 59 and 39 sites, as well as the long 39UTR fragment
(Figure 6F). Mutations of either of these two sites considerably
reduced luciferase repression by let-7c. At the tested let-7c
concentration (7.5 nM) the 39 site conferred a more potent
inhibitory effect compared with the 59 site, yet the inhibitory effect
Figure 3. miRNA expression in embryonic liver vs. adult liver and vs. embryo without liver. Scatter plots representing miRNA expressionprofiles of 507 known miRNAs and additional predicted miRNAs of Rosetta Genomics in samples of embryonic liver (10 weeks) vs. adult liver (A) or vs.the corresponding embryo without liver sample (B). Each blue cross represents a miRNA, and the top 15% of the upregulated and downregulatedmiRNAs are labeled with red circles. Names of outlier miRNAs are indicated.doi:10.1371/journal.pone.0007511.g003
microRNAs in Liver Development
PLoS ONE | www.plosone.org 7 October 2009 | Volume 4 | Issue 10 | e7511
of the 59 site increased at a higher let-7c concentration (10 nM,
data not shown). Taken together, these results show that TGFBR1
is a plausible direct target of let-7c.
Discussion
In order to enhance our understanding of human liver
development and to explore the role of miRNAs during the early
stages of this process, we analyzed global gene and miRNA
expression in 9–12w old embryonic liver and in adult liver tissues.
Thousands of genes were significantly upregulated or downreg-
ulated during liver development. The downregulated genes were
related mainly to the cell cycle and hematopoiesis (Table S3),
teaching the centrality of these processes at this stage of liver
development. Upregulated genes were related mainly to metab-
olism, despite the fact that multiple metabolic genes were highly-
Figure 4. Validation of miRNA expression patterns in embryonic and adult human liver. QRT-PCR results of miRNA expression level inearlier (9–10w) and later (11–12w) stages of liver development, adult liver and whole embryo without liver (10–11w). Results are expressed as relativequantification (RQ) of the miRNA expression level in each sample relative to 9w embryonic liver, and normalized to RNU43. Each reaction wasperformed in triplicate and the average ct was used for RQ calculation. The average RQ is shown with the SD for 3 different samples (embryonic andadult liver), or 2 different samples (whole embryo). * p,0.05, ** p,0.01 in 2-tailed student’s ttest when compared to whole embryo (A,B) or toembryonic liver 9–12w (C,D).doi:10.1371/journal.pone.0007511.g004
microRNAs in Liver Development
PLoS ONE | www.plosone.org 8 October 2009 | Volume 4 | Issue 10 | e7511

expressed already at this early stage of liver development. This
observation may indirectly suggest that some of these genes are
regulated at the protein level during the embryonic period.
Additional experiments should clarify whether these metabolic
genes actively support metabolic activity during this period, and
which machineries control their expression.
Cluster analysis of gene expression results may assist in dividing
the embryonic development period into sequential stages, as we
manage to identify two expression patterns that separate our liver
samples into earlier and later stages (Figure S1). Such analysis
might ease the identification of the major functions that are
accomplished in each developmental stage.
Comparison of miRNA expression profiling between embryonic
liver and adult liver or embryo without liver revealed four distinct
expression patterns (Figure 4), which can facilitate understanding
of their possible roles during human development. Further, the
expression pattern of several miRNAs fit nicely with their known
function. For instance, one of the expression patterns contained
miRNAs that were highly-expressed in embryonic liver compared
to adult liver. These miRNAs may regulate processes that take
place solely at the embryonic stage (such as hematopoiesis and cell
cycle), or may inhibit genes that should be turned on only at later
stages. Thus, miR-451, which belongs to this group, was shown to
regulate maturation of erythroid cells [38]. Likewise, miR-92,
miR-19b and miR-106b, also grouped here, belong to the
paralogues and potentially oncogenic miRNA clusters, miR-17-
92 and miR-106b-25, and may regulate cell cycle-related genes in
the embryonic liver. Another pattern, which contained miRNAs
that were expressed higher in the adult liver compared to the
embryonic liver, included members of the let-7 family. Let-7
family members have been shown to target proliferation-
promoting genes, such as HMGA2 [37] and IGF2BP1 [39], and
as such, may mediate cell cycle arrest in the adult liver.
Several reports have recently shown that miRNA activity can be
inferred from the relevant gene expression level [16,40,41].
Comparison of the expression of regulated miRNAs and their
cognate-predicted targets in our arrays revealed significant anti-
correlation only for specific regulated miRNAs, which we grouped
into two: miRNAs that are enriched in the embryonic liver, including
miR-106a, miR-18a and miR-574-3p, and miRNAs that are
enriched in the adult liver, including let-7a and c, miR-23b and
miR-22. These miRNAs seem to be the most active in embryonic or
in adult liver, respectively, at least in terms of mRNA inhibition, since
their predicted target genes were negatively-expressed to them at the
most significant manner, when compared to other differentially-
expressed miRNAs. Perhaps these miRNAs affect mRNA stability
Table 2. Behavior of predicted target genes of adult liver-enriched miRNAs.
miR SeedMinimum # of miR bindingsites in transcriptsc
# of probe-sets with atleast miR sitesd
# Down in adultlivere
% Down inadult liver P value{
let-7/98 0 40539 17704 43.67%
1 811 459 56.60% 5.75E-14
2 69 46 66.67% 4.96E-02
3 13 10 76.92% 3.00E-01
4 6 6 100.00% 1.22E-01
5 3 3 100.00% 1.00E+00
= 15.98 y
let-7/98, miR-23 0 40539 17704 43.67%
1 1591 899 56.51% 7.28E-26
2 219 132 60.27% 1.27E-01
3 31 21 67.74% 2.38E-01
4 11 9 81.82% 2.02E-01
5 3 3 100.00% 5.09E-01
= 27.64 y
let-7/98, miR-23, miR-22 0 40539 17704 43.67%
1 1894 1079 56.97% 8.79E-33
2 285 180 63.16% 1.27E-02
3 42 28 66.67% 3.72E-01
4 12 9 75.00% 3.65E-01
5 4 3 75.00% 7.64E-01
= 34.94 y
Expression trends of probe-sets from the cDNA microarray, according to the number of target sites predicted in the transcripts they detect. The proportion of transcriptsthat are downregulated in the adult liver gradually increases with the number of target sites for these miRNAs, and this increase is associated with significanthypergeometric p-values. miR – miRNA; # - number.cMinimum number of microRNA binding sites for the microRNA seeds. 0 means that no binding site is required.dNumber of informative probe-sets in the array that detect transcripts matching the requirement for the minimum number of binding sites.eNumber of probe-sets from d that report downregulation in the adult: the average expression in adult liver tissues is lower than the average expression in theembryonic liver tissues.{P values were calculated using the hypergeometric distribution, as described in the materials and methods section.yTotal scores were calculated by summing the (–log) of the p-values. The higher the total score is, the higher the significance of the overall downregulation of the
predicted targets.doi:10.1371/journal.pone.0007511.t002
microRNAs in Liver Development
PLoS ONE | www.plosone.org 9 October 2009 | Volume 4 | Issue 10 | e7511
more profoundly than other differentially-expressed miRNAs in our
study. Additionally, the regulatory effect of miRNAs that do not show
negative correlation with their target genes may be masked by
additional regulatory machineries such as transcription factors. As for
the possible roles of these miRNAs during liver development; while
miR-574-3p’s role has not yet been studied, miR-106a and miR-18a
belong to the oncogenic clusters, miR-106a-363 and miR-17-92, and
may regulate cell cycle and apoptosis in the embryonic liver. miR-
106a has oncogenic activity in humans [42] and upregulation of miR-
18a expression is associated with poor prognosis of serous ovarian
cells [43]. Regarding the adult liver-enriched miRNAs, similar to let-
7, miR-23b is capable of inhibiting cell proliferation [44], and may
mediate cell cycle arrest in mature hepatocytes.
Identification of a miRNA target by usage of gene and miRNA
datasets taken from two relatively divergent tissues (such as the
embryonic and the adult liver) is relatively complex since, as
mentioned above, the mRNAs are most likely regulated by
additional machineries. To overcome this hurdle, we focused only
on the miRNAs whose predicted target genes showed significant
anti-correlation to their cognate miRNA expression by our
algorithm. We illustrated this point by choosing the regulated
miRNA let-7, which showed the best anti-correlation to its predicted
target genes, and one of its predicted targets, TGFBR1, for
validation of miR-target relationships. We showed that overexpres-
sion of let-7c inhibits both the expression of TGFBR1 mRNA and
protein, and further, the expression of a luciferase reporter gene
fused to the 39UTR of TGFBR1 (Figure 6). These results suggest that
let-7c, and presumably additional members of the let-7 family, may
regulate the expression of TGFBR1 in the liver. TGF-b signaling,
which is mediated by TGFBR1, plays important roles in the
developing liver and throughout adulthood. Heterozygous inactiva-
tion of both Smad2 and Smad3, which are the transcriptional
mediators of TGF-b signaling, causes fetal liver hypoplasia [34]. In
the adult liver, however, TGF-b has been known to inhibit
hepatocyte proliferation [35,36]. Thus, TGF-b confers opposite
effects during different stages of liver development, perhaps by the
combined effect of different factors in each stage. Tight regulation of
TGF-b signaling activity, therefore, appears essential during liver
Table 3. Behavior of predicted target genes of embryonic liver-enriched miRNAs.
miR SeedMinimum #of miR sitesc
Total transcriptswith miR sitesd
# Down inembryonic liverf
% Down inembryonic liver P value{
miR-17-5p/20/93.mr/106/519.d 0 40527 21164 52.22%
1 4738 2529 53.38% 4.66E-02
2 1063 600 56.44% 1.24E-02
3 252 150 59.52% 1.45E-01
4 73 52 71.23% 1.07E-02
5 24 17 70.83% 6.33E-01
6 10 7 70.00% 7.04E-01
= 6.39 y
miR-17-5p/20/93.mr/106/519.d, miR-18 0 40527 21164 52.22%
1 6284 3308 52.64% 2.39E-01
2 1757 979 55.72% 1.27E-03
3 504 305 60.52% 5.88E-03
4 152 95 62.50% 3.09E-01
5 62 42 67.74% 1.74E-01
6 22 16 72.73% 3.71E-01
= 7.45 y
miR-17-5p/20/93.mr/106/519.d, miR-18, miR-574 0 40527 21164 52.22%
1 6565 3459 52.69% 2.08E-01
2 1882 1050 55.79% 7.68E-04
3 570 337 59.12% 3.08E-02
4 171 109 63.74% 8.41E-02
5 72 51 70.83% 6.84E-02
6 27 20 74.07% 4.24E-01
= 7.92 y
Expression trends of probe-sets from the cDNA microarray, according to the number of target sites predicted in the transcripts they detect. The proportion of transcriptsthat are downregulated in the embryonic liver gradually increases with the number of target sites for these miRNAs, and this increase is associated with significanthypergeometric p-values. miR – miRNA; # - number.cMinimum number of microRNA binding sites for the microRNA seeds. 0 means that no binding site is required.dNumber of informative probe-sets in the array that detect transcripts matching the requirement for the minimum number of binding sites.fNumber of probe-sets from d that report downregulation in the early embryonic livers: the average expression in adult liver tissues is higher than the averageexpression in the early embryonic liver tissues.{P values were calculated using the hypergeometric distribution, as described in the materials and methods section.yTotal scores were calculated by summing the (–log) of the p-values. The higher the total score is, the higher the significance of the overall downregulation of the
predicted targets.doi:10.1371/journal.pone.0007511.t003
microRNAs in Liver Development
PLoS ONE | www.plosone.org 10 October 2009 | Volume 4 | Issue 10 | e7511

development and upon maturation. Regulation of TGFBR1 by let-7,
which is suggested by our results, may further fine tune the TGF-bsignaling activity to the necessary level at each developmental stage.
According to a likely scenario, in the embryo, where let-7 is
expressed at a relatively low level, it may allow enhanced TGF-bsignaling activity that is necessary for hepatocyte proliferation and
organization, whereas in the adult, let-7 is expressed higher and may
assist in inhibiting TGF-b signaling until it becomes necessary upon
specific states, such as liver regeneration.
In this study we identified numerous differentially-expressed
genes and miRNAs between embryonic and adult liver tissues.
While miRNAs may be responsible for at least some of these
expression changes, as demonstrated by our algorithm, additional
regulatory mechanisms, such as transcription factors, most likely
contribute to the observed changes. The contribution of other
factors, such as different compositions/ratios of cell-types in the
examined tissues, can also not be excluded. Furthermore, the
difficult acquisition of human embryonic liver tissues has limited
our liver development analysis to the period of 9–12 weeks, of
which 6 different samples were collected. Yet, widening the study
to additional stages of liver development is necessary to better
understand the impact of miRNAs during human liver develop-
ment, and reinforce the conclusions of the present study.
In summary, measurement of global gene and miRNA
expression in embryonic and adult human livers revealed multiple
regulated genes and demonstrated changes in the expression
patterns upon progression in the developmental process. Parallel
patterns were demonstrated for miRNA and gene expression,
when cell cycle and hematopoiesis were the most significant
biological process and pathway among the downregulated genes,
and accordingly, miRNAs engaged with the regulation of cell cycle
and hematopoiesis were downregulated, whereas cell cycle-
inhibiting miRNAs were upregulated upon liver maturation.
Comparison of the expression of the most regulated miRNAs and
the expression of their putative target genes using a dedicated
algorithm revealed a significant negative correlation for several
miRNAs, identified as the most active miRNAs in either the
embryonic or the adult liver, and facilitated the identification of a
novel miR-target couple, let-7 and TGFBR1. Future experiments
are necessary to uncover additional miRNA targets, and to clarify
the role of miRNAs in the regulation of liver development.
Supporting Information
Figure S1 Gene expression changes during early human liver
development Unsupervised hierarchical cluster analysis was
performed on differentially-expressed genes (SD.1) between
human embryonic (emb) liver samples (Cluster 3.0 software,
average linkage). Dendogram, demonstrating similarity level in
gene expression between the various samples, and heat map,
illustrating gene expression changes between the samples, are
shown. Samples are listed in columns; genes in rows; red color
signifies high expression and green color signifies low expression,
according to the color bar shown on the left.
Found at: doi:10.1371/journal.pone.0007511.s001 (0.38 MB TIF)
Table S1 Tissue sample characterizations and types of analysis
performed w/o - without, w - embryonic week calculated from last
menstrual period, d - day, y - year after birth. y For 1.5y-, 42y-
and 81y-old adult livers, two samples of the same patient were
taken for gene expression analysis. { The age of the embryos was
defined according to the first day of the last menstrual period, and
confirmed by ultrasound performed at 7–9 weeks from the first
day of the last menstrual period. Ultrasound-based age definition
accuracy is 65 days.
Found at: doi:10.1371/journal.pone.0007511.s002 (0.05 MB
DOC)
Figure 5. Verification of miRNA predicted-targets expression in qRT-PCR. QRT-PCR results of gene expression level in earlier (9–10w) andlater (11–12w) stages of liver development, and adult liver. Results are expressed as relative quantification of the gene expression level in each samplerelative to 9w embryonic liver, and normalized to GUSB. Each reaction was performed in triplicate and the average ct was used for RQ calculation. Theaverage RQ of 3 different samples is shown with the SD. * p,0.05, ** p,0.01 in 2-tailed student’s t-test when compared to adult liver.doi:10.1371/journal.pone.0007511.g005
microRNAs in Liver Development
PLoS ONE | www.plosone.org 11 October 2009 | Volume 4 | Issue 10 | e7511

Table S2 Affymetrix gene expression
Found at: doi:10.1371/journal.pone.0007511.s003 (4.15 MB
PDF)
Table S3 Top 10 biological processes and pathways enriched
significantly in differentially-expressed genes between embryonic
and adult liver * The reference list for the classification analysis
was all genes - NCBI: H. sapiens genes. 1 Upregulated at least
two-fold in a significant (p,0.01) manner. 2 Bonferroni-corrected
for multiple testing.
Found at: doi:10.1371/journal.pone.0007511.s004 (0.05 MB
DOC)
Figure 6. TGFBR1 is a direct target of hsa-let-7c. A. QRT-PCR results of hsa-let-7c expression level in mock transfected HuH7 cells or cells transfectedwith 30 nM of pre-miR negative control #1 (neg con) or pre-miR let-7c for 48 hrs. B–C. QRT-PCR results of mRNA level of HMGA2 (B) and TGFBR1 (C) inHuH7 cells transfected as described in A. D. Western blot analysis of TGFBR1 protein level in HuH7 cells transfected as described in A for 72 hrs.Quantification of the bands’ intensity is shown below. E. Schematic of the 39UTR of human TGFBR1 with the location and sequence of the 59 and 39 putativelet-7c binding sites. The 39UTR fragments that were cloned in pmirGLO are illustrated below. The mutations which were incorporated in the control vectorsare underlined below the wt sequences. F. Luciferase/Renilla ratio results for HuH7 cells co-transfected with 7.5 nM of pre-miR negative control (nc) or pre-miR let-7c together with pmirGLO or pmirGLO-TGFBR1 39UTR 59 site (wt or mutant) or pGL3-TGFBR1-39UTR 39 site (wt or mutant) or pmirGLO-TGFBR1 longgenomic 39UTR (containing both sites), for 72 hrs. Renilla expression from the pmirGLO vector was used for Luc/Renilla ratio quantification. The results arepresented as fold-inhibition relative to cells transfected with pmirGLO together with the corresponding pre-miR (nc or let-7c). In all histograms, the averageof at least three samples is shown with the SD. * p,0.05, ** p,0.01 in 2-tailed student’s t-test when compared to pre-miR neg con.doi:10.1371/journal.pone.0007511.g006
microRNAs in Liver Development
PLoS ONE | www.plosone.org 12 October 2009 | Volume 4 | Issue 10 | e7511

Table S4 Top 10 biological processes and pathways enriched
significantly in differentially-expressed genes between embryonic
liver and embryo without liver * The reference list for the
classification analysis was all genes - NCBI: H. sapiens genes. * w/
o - without. 1 Upregulated at least four-fold. 2 Bonferroni-
corrected for multiple testing.
Found at: doi:10.1371/journal.pone.0007511.s005 (0.06 MB
DOC)
Table S5 Differentially-expressed genes throughout develop-
ment
Found at: doi:10.1371/journal.pone.0007511.s006 (0.39 MB
XLS)
Table S6 Top 10 biological processes and pathways enriched
significantly in differentially-expressed genes between earlier (9–
10w) and later (11–12w) stages of liver development * The
reference list for the classification analysis was all genes - NCBI: H.
sapiens genes. * NS - non significant. 1 Upregulated or
downregulated at least two-fold in a significant (p,0.01) manner.
2 Bonferroni-corrected for multiple testing.
Found at: doi:10.1371/journal.pone.0007511.s007 (0.05 MB
DOC)
Table S7 microRNA expression
Found at: doi:10.1371/journal.pone.0007511.s008 (0.09 MB
XLS)
Acknowledgments
We thank Drs Eli Pikarsky and Ariel Revel for assisting with isolation of
human embryonic liver tissues and Ms Shelly Tannenbaum for editing the
manuscript.
Author Contributions
Conceived and designed the experiments: GT AI ZB BER EG. Performed
the experiments: GT EM KM EK. Analyzed the data: GT AI AL HB.
Contributed reagents/materials/analysis tools: YS YS NR. Wrote the
paper: GT EG.
References
1. Jochheim A, Cieslak A, Hillemann T, Cantz T, Scharf J, et al. (2003) Multi-stageanalysis of differential gene expression in BALB/C mouse liver development by
high-density microarrays. Differentiation 71: 62–72.2. Jochheim-Richter A, Rudrich U, Koczan D, Hillemann T, Tewes S, et al. (2006)
Gene expression analysis identifies novel genes participating in early murine liver
development and adult liver regeneration. Differentiation 74: 167–73.3. Nierhoff D, Levoci L, Schulte S, Goeser T, Rogler LE, et al. (2007) New cell
surface markers for murine fetal hepatic stem cells identified through highdensity complementary DNA microarrays. Hepatology 46: 535–47.
4. Malhotra K, Luehrsen KR, Costello LL, Raich TJ, Sim K, et al. (1999)Identification of differentially expressed mRNAs in human fetal liver across
gestation. Nucleic Acids Res 27: 839–47.
5. He L, Hannon GJ (2004) MicroRNAs: small RNAs with a big role in generegulation. Nat Rev Genet 5: 522–31.
6. Stefani G, Slack FJ (2008) Small non-coding RNAs in animal development. NatRev Mol Cell Biol 9: 219–30.
7. Fu H, Tie Y, Xu C, Zhang Z, Zhu J, et al. (2005) Identification of human fetal
liver miRNAs by a novel method. FEBS Lett 579: 3849–54.8. Wu Z, Irizarry RA, Gentleman R, Murillo F, Spencer F (2004) A Model-Based
Background Adjustment for Oligonucleotide Expression Arrays. Journal of theAmerican Statistical Association 99: 909.
9. Gentleman RC, Carey VJ, Bates DM, Bolstad B, Dettling M, et al. (2004)
Bioconductor: open software development for computational biology andbioinformatics. Genome Biol 5: R80.
10. de Hoon MJ, Imoto S, Nolan J, Miyano S (2004) Open source clusteringsoftware. Bioinformatics 20: 1453–4.
11. Saldanha AJ (2004) Java Treeview–extensible visualization of microarray data.Bioinformatics 20: 3246–8.
12. Edgar R, Domrachev M, Lash AE (2002) Gene Expression Omnibus: NCBI
gene expression and hybridization array data repository. Nucleic Acids Res 30:207–10.
13. Rosenfeld N, Aharonov R, Meiri E, Rosenwald S, Spector Y, et al. (2008)MicroRNAs accurately identify cancer tissue origin. Nat Biotechnol 26: 462–9.
14. Lewis BP, Burge CB, Bartel DP (2005) Conserved seed pairing, often flanked by
adenosines, indicates that thousands of human genes are microRNA targets. Cell120: 15–20.
15. Grimson A, Farh KK, Johnston WK, Garrett-Engele P, Lim LP, et al. (2007)MicroRNA targeting specificity in mammals: determinants beyond seed pairing.
Mol Cell 27: 91–105.16. Israel A, Sharan R, Ruppin E, Galun E (2009) Increased microRNA activity in
human cancers. PLoS One 4: e6045.
17. Karolchik D, Baertsch R, Diekhans M, Furey TS, Hinrichs A, et al. (2003) TheUCSC Genome Browser Database. Nucleic Acids Res 31: 51–4.
18. Tavian M, Hallais MF, Peault B (1999) Emergence of intraembryonichematopoietic precursors in the pre-liver human embryo. Development 126:
793–803.
19. Thomas PD, Campbell MJ, Kejariwal A, Mi H, Karlak B, et al. (2003)PANTHER: a library of protein families and subfamilies indexed by function.
Genome Res 13: 2129–41.20. Reed SI (2006) The ubiquitin-proteasome pathway in cell cycle control. Results
Probl Cell Differ 42: 147–81.21. Dietschy JM, Turley SD, Spady DK (1993) Role of liver in the maintenance of
cholesterol and low density lipoprotein homeostasis in different animal species,
including humans. J Lipid Res 34: 1637–59.22. Alvarez-Garcia I, Miska EA (2005) MicroRNA functions in animal development
and human disease. Development 132: 4653–62.
23. Lagos-Quintana M, Rauhut R, Yalcin A, Meyer J, Lendeckel W, et al. (2002)Identification of tissue-specific microRNAs from mouse. Curr Biol 12: 735–9.
24. Chang J, Nicolas E, Marks D, Sander C, Lerro A, et al. (2004) miR-122, amammalian liver-specific microRNA, is processed from hcr mRNA and may
downregulate the high affinity cationic amino acid transporter CAT-1. RNA
Biol 1: 106–13.25. Farh KK, Grimson A, Jan C, Lewis BP, Johnston WK, et al. (2005) The
widespread impact of mammalian MicroRNAs on mRNA repression andevolution. Science 310: 1817–21.
26. Landgraf P, Rusu M, Sheridan R, Sewer A, Iovino N, et al. (2007) Amammalian microRNA expression atlas based on small RNA library
sequencing. Cell 129: 1401–14.
27. Anderson C, Catoe H, Werner R (2006) MIR-206 regulates connexin43expression during skeletal muscle development. Nucleic Acids Res 34: 5863–71.
28. Lim LP, Lau NC, Garrett-Engele P, Grimson A, Schelter JM, et al. (2005)Microarray analysis shows that some microRNAs downregulate large numbers
of target mRNAs. Nature 433: 769–73.
29. Baek D, Villen J, Shin C, Camargo FD, Gygi SP, et al. (2008) The impact ofmicroRNAs on protein output. Nature 455: 64–71.
30. Selbach M, Schwanhausser B, Thierfelder N, Fang Z, Khanin R, et al. (2008)Widespread changes in protein synthesis induced by microRNAs. Nature 455: 58–63.
31. Valencia-Sanchez MA, Liu J, Hannon GJ, Parker R (2006) Control of translation and
mRNA degradation by miRNAs and siRNAs. Genes Dev 20: 515–24.32. Krek A, Grun D, Poy MN, Wolf R, Rosenberg L, et al. (2005) Combinatorial
microRNA target predictions. Nat Genet 37: 495–500.33. Nielsen CB, Shomron N, Sandberg R, Hornstein E, Kitzman J, et al. (2007)
Determinants of targeting by endogenous and exogenous microRNAs andsiRNAs. Rna 13: 1894–910.
34. Weinstein M, Monga SP, Liu Y, Brodie SG, Tang Y, et al. (2001) Smad proteins and
hepatocyte growth factor control parallel regulatory pathways that converge on beta1-integrin to promote normal liver development. Mol Cell Biol 21: 5122–31.
35. Grasl-Kraupp B, Rossmanith W, Ruttkay-Nedecky B, Mullauer L, Kammerer B,et al. (1998) Levels of transforming growth factor beta and transforming growth
factor beta receptors in rat liver during growth, regression by apoptosis and
neoplasia. Hepatology 28: 717–26.36. Isfort RJ, Cody DB, Stuard SB, Randall CJ, Miller C, et al. (1997) The
combination of epidermal growth factor and transforming growth factor-betainduces novel phenotypic changes in mouse liver stem cell lines. J Cell Sci 110
( Pt 24): 3117–29.37. Lee YS, Dutta A (2007) The tumor suppressor microRNA let-7 represses the
HMGA2 oncogene. Genes Dev 21: 1025–30.
38. Zhan M, Miller CP, Papayannopoulou T, Stamatoyannopoulos G, Song CZ(2007) MicroRNA expression dynamics during murine and human erythroid
differentiation. Exp Hematol 35: 1015–25.39. Boyerinas B, Park SM, Shomron N, Hedegaard MM, Vinther J, et al. (2008)
Identification of let-7-regulated oncofetal genes. Cancer Res 68: 2587–91.
40. Arora A, Simpson DA (2008) Individual mRNA expression profiles reveal theeffects of specific microRNAs. Genome Biol 9: R82.
41. Cheng C, Li LM (2008) Inferring microRNA activities by combining geneexpression with microRNA target prediction. PLoS ONE 3: e1989.
42. Tong AW, Nemunaitis J (2008) Modulation of miRNA activity in human cancer: anew paradigm for cancer gene therapy? Cancer Gene Ther 15: 341–55.
43. Nam EJ, Yoon H, Kim SW, Kim H, Kim YT, et al. (2008) MicroRNA
expression profiles in serous ovarian carcinoma. Clin Cancer Res 14: 2690–5.44. Tong AW, Fulgham P, Jay C, Chen P, Khalil I, et al. (2008) MicroRNA profile
analysis of human prostate cancers. Cancer Gene Ther.
microRNAs in Liver Development
PLoS ONE | www.plosone.org 13 October 2009 | Volume 4 | Issue 10 | e7511