comprehensive analysis of cardiac arrhythmias in telemetered cynomolgus monkeys over a 6month period
TRANSCRIPT

Journal of Pharmacological and Toxicological Methods 66 (2012) 84–91
Contents lists available at SciVerse ScienceDirect
Journal of Pharmacological and Toxicological Methods
j ourna l homepage: www.e lsev ie r .com/ locate / jpha rmtox
Original article
Comprehensive analysis of cardiac arrhythmias in telemetered cynomolgus monkeysover a 6 month period
Ray W. Chui, Katayoun Derakhchan, Hugo M. Vargas ⁎Amgen Inc., Department of Toxicology Sciences, 1 Amgen Center Drive, MS25-0-A, Thousand Oaks, CA 91320, United States
⁎ Corresponding author at: 1 Amgen Center Drive, M91320, United States. Tel.: +1 805 447 0547; fax: +1 8
E-mail addresses: [email protected] (R.W. Chui), kd(K. Derakhchan), [email protected] (H.M. Vargas).
1056-8719/$ – see front matter © 2012 Elsevier Inc. Alldoi:10.1016/j.vascn.2012.05.002
a b s t r a c t
a r t i c l e i n f oArticle history:
Received 27 March 2012Accepted 5 May 2012Keywords:ArrhythmiaECGCynomolgusMonkeyCircadianTelemetry
Introduction: Cardiac arrhythmia findings can be a challenge to interpret and difficult to attribute tobackground incidence or test article treatment. Thus, there is a growing need to better understand arrhyth-mia incidence in the experimental animal models used to assess the cardiovascular safety of new drugs. Cur-rently, there is little information on the frequency of spontaneous cardiac arrhythmias in the cynomolgusmonkey. Methods: This study evaluated the baseline arrhythmia rate in a group (n=19) of non-naïve(drug-free) male telemetered cynomolgus monkeys at various timepoints over a 6 month period. When sam-pled, data were collected continuously (24 hour bins over a 6 month period) and the ECG waveforms analyzedfor arrhythmia using a semi-automated approach with pattern recognition software. The arrhythmia datawere evaluated to detect atrial and ventricular patterns, as well as changes associated with circadianrhythm. Results: Evaluation of this data showed that cynomolgus monkeys can exhibit spontaneous ar-
rhythmias (day cycle; means) of the following types: supraventricular premature contraction (SPC,10.7%); escape beats (EB, 3.8%); and sinus node pause (SNP, 2.8%), with others below 2%. From the ventricularperspective, ventricular premature beats (VPB, 25.4% (day cyclemean))were themost prevalent. Circadian anal-ysis indicated that somearrhythmias had higher incidence during the night cycle: SNP (32.6%); EB (18.5%); atrio-ventricular block (AVB, 2.7%), an indication that the arrhythmia pattern is influenced by the diurnal cycle.Discussion: Overall, the data demonstrated that a variety of spontaneous arrhythmias occur at low frequencyin non-treated animals, and the incidence varies between animals, and within the same animal when repeated-ly sampled. Given the low incidence in normal animals, continuous ECG sampling over multiple days is neededto establish an accurate arrhythmia “fingerprint” for each animal in dedicated telemetry colonies, which couldassist the interpretation of arrhythmia findings that may occur in cardiovascular safety studies.© 2012 Elsevier Inc. All rights reserved.
1. Introduction
Cardiac time interval measurements from the electrocardiographic(ECG) waveform have been of the utmost importance in cardiovascularsafety pharmacology studies. This is especially important since theemergence of regulatory guidelines on the topic of drug-induced QTcinterval prolongation as a biomarker of torsades de pointes, or polymor-phic ventricular tachyarrhythmia (ICH E14, 2005; ICH S7B, 2005).During ECG monitoring in animals and humans, it is more likelythat atrial and ventricular arrhythmias will be detected when usingcontinuous monitoring methods, like invasive telemetry or Holtermonitoring, compared to snapshot evaluations (Cools et al., 2011;Macallum & Houston, 1993; Min et al., 2010; Sugiyama, 2008). Whileboth guidance documents have a primary focus on drug-induced QTcinterval prolongation, the non-clinical guidance does identify cardiac
S25-0-A, Thousand Oaks, CA05 499 [email protected]
rights reserved.
arrhythmia as an additional safety parameter of interest to assess pro-arrhythmic risk of new agents (see Section 3.1.3. of ICH S7B, 2005).
Drug-induced cardiac arrhythmias are likely to be low frequency(rare) occurrences, but have the potential to be serious adverseevents, especially if lethal (Pugsley, Authier, & Curtis, 2008). Theappearance of a ventricular (or atrial) arrhythmia can be a challenge tointerpret and attribute to either drug treatment or background incidence.Thus, there is a growing need to better understand arrhythmia incidencein the experimental animal models used to assess the cardiovascularsafety of new drugs. Although there are reports on arrhythmia incidencein restrained dogs using “snapshot” ECG evaluation, such observationsmay not represent arrhythmia incidence in unrestrained telemetered an-imals. Some investigations have evaluated cardiac arrhythmia incidencein naïve dogs using continuous 24 h data collection using telemetry(Cools & Gallacher, 2009; Cools et al., 2011; Duerr, Carr, Duke, Shmon,& Monnet, 2007; Ulloa, Houston, & Altrogge, 1995), however thereare limited reports on arrhythmia incidence in unrestrained monkeys.Macallum and Houston (1993) compared arrhythmia incidence inrestrained and unrestrained monkeys (using Holter monitoring) andfound 24 h Holter monitoring detected ventricular ectopic beats with
85R.W. Chui et al. / Journal of Pharmacological and Toxicological Methods 66 (2012) 84–91
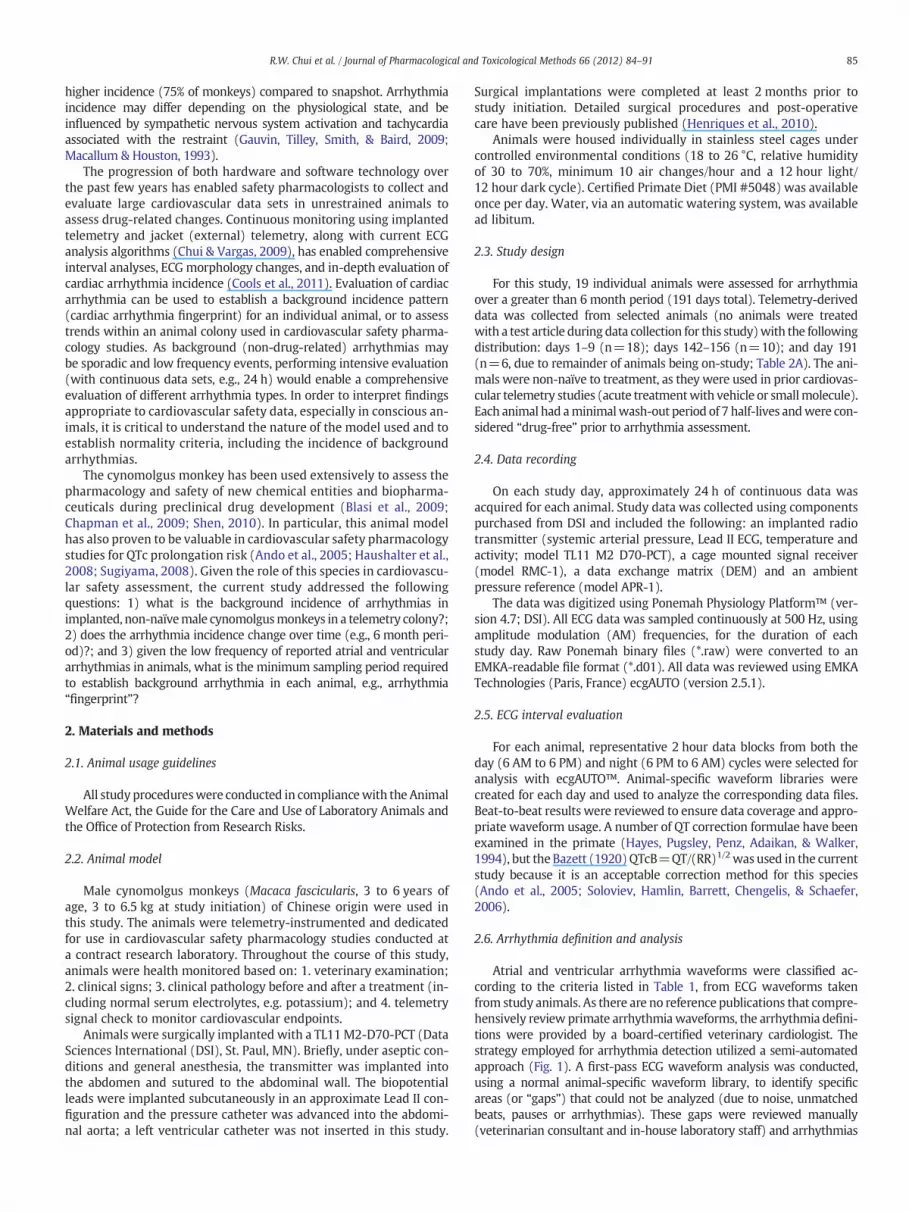
higher incidence (75% of monkeys) compared to snapshot. Arrhythmiaincidence may differ depending on the physiological state, and beinfluenced by sympathetic nervous system activation and tachycardiaassociated with the restraint (Gauvin, Tilley, Smith, & Baird, 2009;Macallum & Houston, 1993).
The progression of both hardware and software technology overthe past few years has enabled safety pharmacologists to collect andevaluate large cardiovascular data sets in unrestrained animals toassess drug-related changes. Continuous monitoring using implantedtelemetry and jacket (external) telemetry, along with current ECGanalysis algorithms (Chui & Vargas, 2009), has enabled comprehensiveinterval analyses, ECGmorphology changes, and in-depth evaluation ofcardiac arrhythmia incidence (Cools et al., 2011). Evaluation of cardiacarrhythmia can be used to establish a background incidence pattern(cardiac arrhythmia fingerprint) for an individual animal, or to assesstrends within an animal colony used in cardiovascular safety pharma-cology studies. As background (non-drug-related) arrhythmias maybe sporadic and low frequency events, performing intensive evaluation(with continuous data sets, e.g., 24 h) would enable a comprehensiveevaluation of different arrhythmia types. In order to interpret findingsappropriate to cardiovascular safety data, especially in conscious an-imals, it is critical to understand the nature of the model used and toestablish normality criteria, including the incidence of backgroundarrhythmias.
The cynomolgus monkey has been used extensively to assess thepharmacology and safety of new chemical entities and biopharma-ceuticals during preclinical drug development (Blasi et al., 2009;Chapman et al., 2009; Shen, 2010). In particular, this animal modelhas also proven to be valuable in cardiovascular safety pharmacologystudies for QTc prolongation risk (Ando et al., 2005; Haushalter et al.,2008; Sugiyama, 2008). Given the role of this species in cardiovascu-lar safety assessment, the current study addressed the followingquestions: 1) what is the background incidence of arrhythmias inimplanted, non-naïvemale cynomolgusmonkeys in a telemetry colony?;2) does the arrhythmia incidence change over time (e.g., 6 month peri-od)?; and 3) given the low frequency of reported atrial and ventriculararrhythmias in animals, what is the minimum sampling period requiredto establish background arrhythmia in each animal, e.g., arrhythmia“fingerprint”?
2. Materials and methods
2.1. Animal usage guidelines
All study procedureswere conducted in compliancewith the AnimalWelfare Act, the Guide for the Care and Use of Laboratory Animals andthe Office of Protection from Research Risks.
2.2. Animal model
Male cynomolgus monkeys (Macaca fascicularis, 3 to 6 years ofage, 3 to 6.5 kg at study initiation) of Chinese origin were used inthis study. The animals were telemetry-instrumented and dedicatedfor use in cardiovascular safety pharmacology studies conducted ata contract research laboratory. Throughout the course of this study,animals were health monitored based on: 1. veterinary examination;2. clinical signs; 3. clinical pathology before and after a treatment (in-cluding normal serum electrolytes, e.g. potassium); and 4. telemetrysignal check to monitor cardiovascular endpoints.
Animals were surgically implanted with a TL11M2-D70-PCT (DataSciences International (DSI), St. Paul, MN). Briefly, under aseptic con-ditions and general anesthesia, the transmitter was implanted intothe abdomen and sutured to the abdominal wall. The biopotentialleads were implanted subcutaneously in an approximate Lead II con-figuration and the pressure catheter was advanced into the abdomi-nal aorta; a left ventricular catheter was not inserted in this study.
Surgical implantations were completed at least 2 months prior tostudy initiation. Detailed surgical procedures and post-operativecare have been previously published (Henriques et al., 2010).
Animals were housed individually in stainless steel cages undercontrolled environmental conditions (18 to 26 °C, relative humidityof 30 to 70%, minimum 10 air changes/hour and a 12 hour light/12 hour dark cycle). Certified Primate Diet (PMI #5048) was availableonce per day. Water, via an automatic watering system, was availablead libitum.
2.3. Study design
For this study, 19 individual animals were assessed for arrhythmiaover a greater than 6 month period (191 days total). Telemetry-deriveddata was collected from selected animals (no animals were treatedwith a test article during data collection for this study)with the followingdistribution: days 1–9 (n=18); days 142–156 (n=10); and day 191(n=6, due to remainder of animals being on-study; Table 2A). The ani-mals were non-naïve to treatment, as they were used in prior cardiovas-cular telemetry studies (acute treatmentwith vehicle or smallmolecule).Each animal had aminimalwash-out period of 7 half-lives andwere con-sidered “drug-free” prior to arrhythmia assessment.
2.4. Data recording
On each study day, approximately 24 h of continuous data wasacquired for each animal. Study data was collected using componentspurchased from DSI and included the following: an implanted radiotransmitter (systemic arterial pressure, Lead II ECG, temperature andactivity; model TL11 M2 D70-PCT), a cage mounted signal receiver(model RMC-1), a data exchange matrix (DEM) and an ambientpressure reference (model APR-1).
The data was digitized using Ponemah Physiology Platform™ (ver-sion 4.7; DSI). All ECG data was sampled continuously at 500 Hz, usingamplitude modulation (AM) frequencies, for the duration of eachstudy day. Raw Ponemah binary files (*.raw) were converted to anEMKA-readable file format (*.d01). All data was reviewed using EMKATechnologies (Paris, France) ecgAUTO (version 2.5.1).
2.5. ECG interval evaluation
For each animal, representative 2 hour data blocks from both theday (6 AM to 6 PM) and night (6 PM to 6 AM) cycles were selected foranalysis with ecgAUTO™. Animal-specific waveform libraries werecreated for each day and used to analyze the corresponding data files.Beat-to-beat results were reviewed to ensure data coverage and appro-priate waveform usage. A number of QT correction formulae have beenexamined in the primate (Hayes, Pugsley, Penz, Adaikan, & Walker,1994), but the Bazett (1920)QTcB=QT/(RR)1/2was used in the currentstudy because it is an acceptable correction method for this species(Ando et al., 2005; Soloviev, Hamlin, Barrett, Chengelis, & Schaefer,2006).
2.6. Arrhythmia definition and analysis
Atrial and ventricular arrhythmia waveforms were classified ac-cording to the criteria listed in Table 1, from ECG waveforms takenfrom study animals. As there are no reference publications that compre-hensively review primate arrhythmiawaveforms, the arrhythmia defini-tions were provided by a board-certified veterinary cardiologist. Thestrategy employed for arrhythmia detection utilized a semi-automatedapproach (Fig. 1). A first-pass ECG waveform analysis was conducted,using a normal animal-specific waveform library, to identify specificareas (or “gaps”) that could not be analyzed (due to noise, unmatchedbeats, pauses or arrhythmias). These gaps were reviewed manually(veterinarian consultant and in-house laboratory staff) and arrhythmias
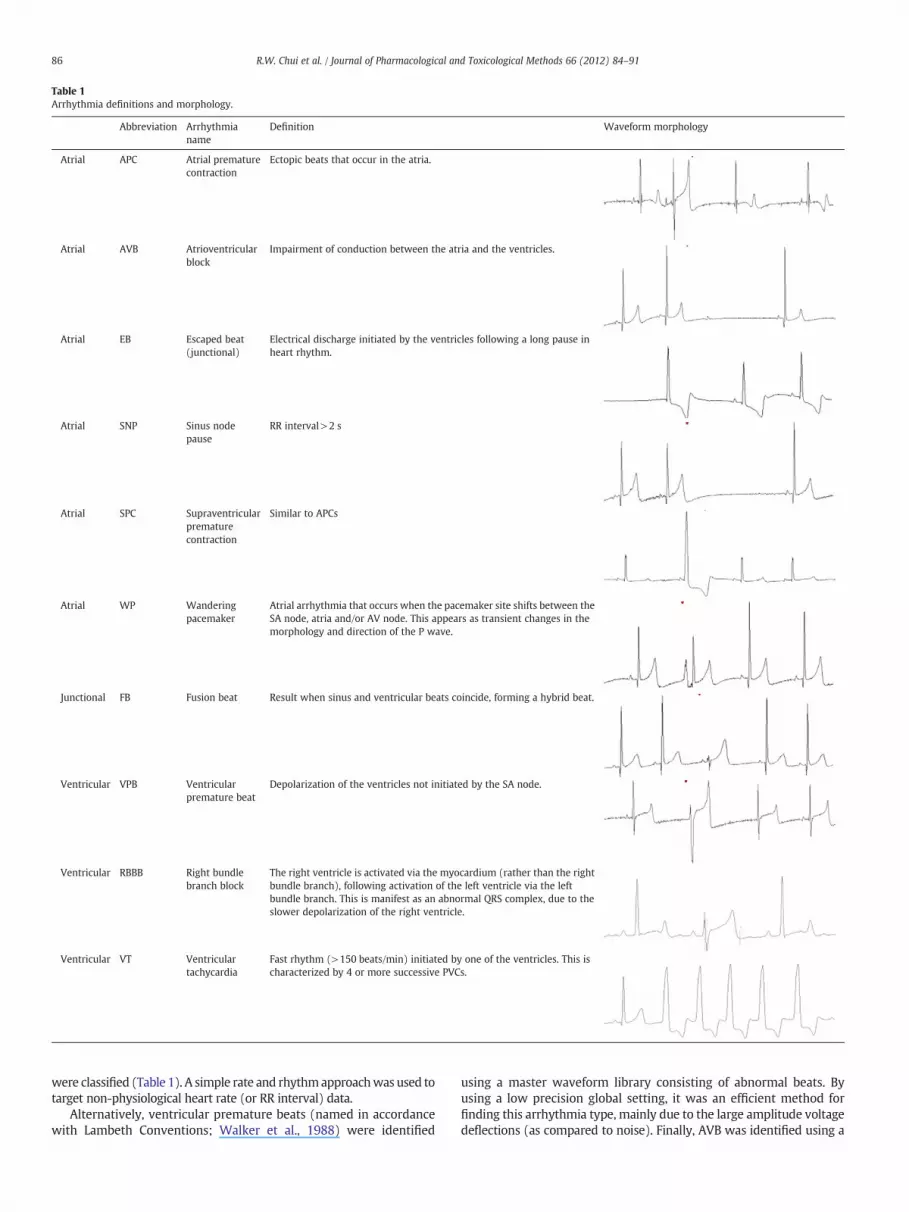
Table 1Arrhythmia definitions and morphology.
Abbreviation Arrhythmianame
Definition Waveform morphology
Atrial APC Atrial prematurecontraction
Ectopic beats that occur in the atria.
Atrial AVB Atrioventricularblock
Impairment of conduction between the atria and the ventricles.
Atrial EB Escaped beat(junctional)
Electrical discharge initiated by the ventricles following a long pause inheart rhythm.
Atrial SNP Sinus nodepause
RR interval>2 s
Atrial SPC Supraventricularprematurecontraction
Similar to APCs
Atrial WP Wanderingpacemaker
Atrial arrhythmia that occurs when the pacemaker site shifts between theSA node, atria and/or AV node. This appears as transient changes in themorphology and direction of the P wave.
Junctional FB Fusion beat Result when sinus and ventricular beats coincide, forming a hybrid beat.
Ventricular VPB Ventricularpremature beat
Depolarization of the ventricles not initiated by the SA node.
Ventricular RBBB Right bundlebranch block
The right ventricle is activated via the myocardium (rather than the rightbundle branch), following activation of the left ventricle via the leftbundle branch. This is manifest as an abnormal QRS complex, due to theslower depolarization of the right ventricle.
Ventricular VT Ventriculartachycardia
Fast rhythm (>150 beats/min) initiated by one of the ventricles. This ischaracterized by 4 or more successive PVCs.
86 R.W. Chui et al. / Journal of Pharmacological and Toxicological Methods 66 (2012) 84–91
were classified (Table 1). A simple rate and rhythmapproachwas used totarget non-physiological heart rate (or RR interval) data.
Alternatively, ventricular premature beats (named in accordancewith Lambeth Conventions; Walker et al., 1988) were identified
using a master waveform library consisting of abnormal beats. Byusing a low precision global setting, it was an efficient method forfinding this arrhythmia type, mainly due to the large amplitude voltagedeflections (as compared to noise). Finally, AVB was identified using a

Fig. 1. Overview of semi-automated arrhythmia detection using EMKA ecgAUTO patternrecognition analysis algorithm. Note: In a 24 hour period, approximately 144,000 cardiaccycles will be generated from an animal with a heart rate of 100 beats/min.
Table 2BBaseline ECG values for non-naïve NHP (Night).
Recordingday
Groupsize
HR(bpm)
PR(ms)
QRS(ms)
QT(ms)
QTcB(ms)
DiaP(mmHg)
SysP(mmHg)
MeanP(mmHg)
1 18 89.817.1
79.29.4
40.36.5
291.630.3
355.321.1
65.710.1
101.913.0
83.311.0
5 18 92.721.0
79.610.0
40.17.1
290.436.3
357.321.5
63.010.4
97.013.3
79.411.3
9 18 88.414.5
81.411.6
39.15.2
294.230.4
356.719.5
61.112.7
94.416.1
77.214.3
142 10 104.018.1
88.212.2
37.74.9
269.734.3
352.824.6
50.19.7
79.78.4
64.19.3
147 10 94.119.6
89.011.9
45.46.6
292.238.5
363.623.3
53.511.6
87.210.7
69.511.2
148 10 91.116.3
88.413.2
43.96.6
292.034.7
358.525.4
50.411.8
81.312.1
65.112.0
150 10 89.613.7
89.112.4
45.66.5
297.629.5
364.323.3
51.711.4
83.711.4
67.111.3
151 10 93.217.0
88.112.6
42.73.3
287.935.5
357.225.8
49.710.7
80.510.8
64.310.7
87R.W. Chui et al. / Journal of Pharmacological and Toxicological Methods 66 (2012) 84–91
PR-interval analysis that identified regions of high PR-interval variability(mean:>120 ms). These approaches required the user to have criteria orknowledge of arrhythmia morphology to differentiate real signals fromelectrical artifacts and to define the type of cardiac electrical abnormality.
155 10 88.520.7
89.211.4
44.46.0
298.842.5
359.525.0
45.519.4
76.229.0
60.324.0
156 10 101.122.5
88.313.0
41.45.0
276.238.9
354.723.4
39.623.1
66.536.8
52.629.8
191 6 102.122.3
87.116.6
41.17.6
278.427.6
361.418.4
52.911.8
83.98.1
67.310.2
Table 2CPooled baseline ECG values.
Pooleddata
HR(bpm)
PR(ms)
QRS(ms)
QT(ms)
QTcB(ms)
DiaP(mm Hg)
SysP(mm Hg)
MeanP(mm Hg)
Day 114.920.7
83.511.8
40.06.6
244.623.6
337.418.1
61.214.1
93.215.6
76.615.1
Night 93.118.3
85.012.1
41.66.3
289.134.1
357.922.0
54.915.0
87.219.5
70.417.0
3. Results
3.1. ECG interval and hemodynamic data
Over the course of 6 months, ECG interval and hemodynamic datafor each sampling day were tabulated to establish reference or baselinevalues for this group of cynomolgus monkeys (Table 2A). The diurnalvariations in heart rate, cardiac interval and blood pressure values areshown in Tables 2A (day) and 2B (night), and the daily average values(pooled over 24 h) for each endpoint are shown in Table 2C. The cardio-vascular endpoints monitored in this study (Tables 2A–2B) wererelatively consistent and showed little variation when evaluated eleventimes over 6 months. A comparison of cardiovascular endpoints derivedin the current study with prior findings is shown in Table 3.
Notes:For each section, the top number is the average and bottom is standard deviation.HR = heart rate; DiaP = diastolic blood pressure; SysP = systolic blood pressure;MeanP = mean blood pressure.
3.2. Arrhythmia incidence: individual animal observations
Visualization of arrhythmia type in this study was depicted using anarrhythmia “heatmap” (Fig. 2), which illustrates the type of arrhythmia(Table 1) and its incidence in each animal over time. As anticipated,cardiac arrhythmia was observed in all animals, but it occurred with
Table 2ABaseline ECG values for non-naïve NHP (Day).
Recordingday
Groupsize
HR(bpm)
PR(ms)
QRS(ms)
QT(ms)
QTcB(ms)
DiaP(mmHg)
SysP(mmHg)
MeanP(mmHg)
1 18 116.117.9
77.210.0
37.96.0
241.322.2
335.118.8
69.810.8
103.911.3
86.710.9
5 18 117.222.0
79.010.4
38.68.7
242.724.1
337.719.6
66.711.1
99.112.0
82.611.5
9 18 118.021.3
79.212.0
37.54.8
240.623.8
336.117.2
67.812.2
99.913.9
83.513.2
142 10 114.521.0
88.111.5
38.35.8
244.325.8
335.620.6
55.512.8
85.011.8
69.712.8
147 10 110.419.8
87.712.6
43.86.0
252.224.4
341.420.2
57.612.8
90.112.0
73.112.9
148 10 109.720.3
86.711.7
40.25.5
250.325.1
338.217.9
56.112.2
88.311.7
71.012.5
150 10 118.321.2
87.610.7
42.55.2
242.920.7
340.320.2
57.512.0
88.411.0
72.312.0
151 10 110.822.3
86.311.5
43.76.4
249.427.9
337.718.9
56.212.5
88.411.7
71.312.6
155 10 113.725.5
88.19.9
42.67.3
247.825.3
339.117.7
58.612.9
91.611.6
74.312.7
156 10 116.024.4
85.812.7
38.95.9
241.127.4
333.717.2
50.221.2
80.930.5
64.525.5
191 6 112.919.3
87.115.0
41.38.6
246.716.2
339.516.7
59.516.4
90.415.8
74.116.5
relatively low incidence in any given 24 hour data collection period(black and green areas in Fig. 2).
A variety of arrhythmias were observed in the monkey, includingdistinct atrial (atrial premature contraction (APC), AVB, SNP, SPCand wandering pacemaker (WP)), junctional (fusion beat (FB)) andventricular (EB, VPB, ventricular tachycardia (VT) and right bundlebranch block (RBBB)) morphologies (Table 1). The distribution ofarrhythmias was variable on each sampling day within each individualand across animals. Many of the arrhythmias observed had a low daily
Table 3Baseline cardiovascular endpoints from cynomolgus monkeys and comparison withpublished data. All data was collected from conscious animals with a telemetry implant.
Mean±SD Current studya Sasaki et al.(2005)b
Gauvin et al.(2006)c
n (males) 6–18 28 58Age (years) 3.4–6.3 3–7 1Weight (kg) 3.1–6.5 2.8–6.3 2.0–2.5HR (bpm) 115±21 136±26 160±33PR (ms) 84±12 80±8 82±13QRS (ms) 40±7 36±6 30±8QT (ms) 245±24 233±23 214±38Systolic pressure (mm Hg) 93±16 n/a 104±20Diastolic pressure (mm Hg) 61±14 n/a 73±16Mean arterial pressure (mm Hg) 77±15 82±12 89±19
a Results from pooled day cycle only (age at study onset).b Baseline results.c Grand means over entire 22 h monitoring period.

Fig. 2. Heat map showing incidence of arrhythmias in individual NHP at various timepoints over a 6 month period. Each block is broken up into 10 segments, corresponding to differenttypes of ECG arrhythmias (defined on the right side of the figure). The colors correspond to incidence, as defined by the legend.
88 R.W. Chui et al. / Journal of Pharmacological and Toxicological Methods 66 (2012) 84–91
incidence (b10 appearances in 24 h), andwere considered spontaneoussince healthy animals were studied.
On occasion, some animals did exhibit high rates of spontaneousarrhythmia. For example, NHP 8 was almost arrhythmia free duringthe initial 3 recording days. Between the 4th (day 142) and the finalrecording session (day 191), the arrhythmia profile changed; at the5th session (day 147), 634 occurrences of SPC were noted. This wasnot consistent with other recording days, as only day 151 showedanything greater than 10 (11 beats counted) occurrences. Anotheranimal that exhibited greater than 10 occurrences of arrhythmiaswas NHP 11 (12 VPB on day 5).
3.3. Distribution of arrhythmia incidence: colony-based observations
Various cardiac arrhythmias occur in low frequency manner in thenineteen animals evaluated (Fig. 2). An alternative view of the incidencedata was an evaluation of the presence and distribution of arrhythmiatypes in the entire group (e.g., telemetry colony or population), ratherthan the frequency with which each occurred in each animal. Thisarrhythmia analysis approach would enable the construction of acolony fingerprint that could be monitored over a longer period oftime, which could differ, e.g., animals enter or leave a telemetry colonyor sub-groups of animals are subjected to treatment.
Analysis of arrhythmia prevalence among 18 monkeys on days1–9 showed that some arrhythmia types (SPC, VPB), occurred inmore animals, and becamemore prevalent as ECG sampling extended
Fig. 3. Influence of sampling duration of arrhythmia detection. This data was derived fromdemonstrated the impact of data block size on the number of arrhythmias detected in thiswas collected and analyzed.
from 12 to 72 h (Fig. 3). The arrhythmia prevalence data indicatesthat low frequency arrhythmias, such as EB, SNP and WP, requiremultiple ECG recording sessions, i.e., 3, to capture these events.
3.4. Diurnal variations in animals
A variety of different atrial, ventricular and nodal arrhythmiaswere detected over the 6 month ECG data collection period. As pres-ented in Fig. 4, total arrhythmia incidence was relatively consistentover the course of evaluation, but there were day to day differences.To assesswhether spontaneous cardiac arrhythmiaswereunder circadianinfluence, the arrhythmia incidence during the day and night cycles wasexamined. The circadianfindings indicated that someventricular arrhyth-mia types tended to be higher during the day, whereas atrial arrhythmiarates tended to be higher at night (Fig. 5A/B). In Table 4, the day and nightarrhythmia rateswere averagedover the11 days of data collection topro-vide a colony summary or profile. This data clearly indicated that certainarrhythmias are more prevalent during the day (VPB) or night (EB, SNP).
4. Discussion
There is a paucity of literature detailing the background arrhythmiaincidence rate in unrestrained cynomolgus monkeys using implanttelemetry as themethod for ECGdata collection. This studydemonstratedthat spontaneous atrial, junctional and ventricular arrhythmias can occurin cynomolgus monkeys, and the type and frequency varies within any
eighteen animals sampled on days 1 (12 and 24 h), 5 (48 h) and 9 (72 h). The findinggroup of animals. The hour values represent the cumulative amount of ECG data that

Fig. 4. Pooled arrhythmia incidence inNHP colony. This graphical view illustrates the relativeincidence of ECG arrhythmias in the NHP colony over a period of more than 6months.
89R.W. Chui et al. / Journal of Pharmacological and Toxicological Methods 66 (2012) 84–91
individual animal repeatedly sampled over several ECG recording ses-sions, and across animals. Someanimals exhibited little to no arrhythmiasonmultiple sampling days (e.g., NHP 2, 6, 16 and 18), whereas others hadmore arrhythmia episodes over the 6 month observation period. Thoughthis data is restricted to one specific colony of animals, there is literatureto suggest that heterogeneity is far from the exception. Vidal, Drobatz,Holliday, Geiger, and Thomas (2010) highlight some of the differencesbetween cynomolgus monkeys (including physical characteristics,hematology parameters, among others) from different geographiclocations. They report that Mauritian cynomolgus monkeys tended tohave higher incidence (as compared to mainland Indochinese andMalaysian/Philippine animals) of myocardial degeneration, includingfindings of macroscopic and microscopic subendocardial hemorrhagewith hemosiderin, myocardial fibrosis and arterial medial degenera-tion/hemorrhage. In addition, Walker et al. (1988) proposed theLambeth Conventions, which discussed the numerous variables thatmay impact arrhythmia studies, including the potential influences ofhousing conditions, diet, and variation in coronary anatomy in somespecies. Such observations suggest that geographic, husbandry, as well
Fig. 5. Circadian influences on g
as species-specific characteristicsmay have an impact on the cardiovas-cular profile of an animal, including the incidence of cardiac arrhythmia.
Spontaneous cardiac arrhythmias are known to occur in monkeys,based on reports in manual- or chair-restrained monkeys. For exam-ple, Gauvin et al. (2009) observed in restrained cynomolgus monkeys,with snapshot ECG, that sinus rhythm abnormalities were noted in100% (n=1563) of the animals evaluated, with low incidence ofother atrial (0.12% APC) and ventricular (0.38% VPB; 0.06% VT;0.06% ventricular bigeminy; 0.7% RBBB; and 0.06% ventricular escaperhythms) arrhythmias. There are differences in incidence between thecurrent findings and Gauvin et al. (2009) due to the different ECG sam-pling methodology (10 s snapshot versus 24 h continuous recording).Arrhythmia incidence in cynomolgus monkeys was assessed in unre-strained monkeys using Holter monitoring (Macallum & Houston,1993). In that study, 47 of 62 (75%) primates demonstrated ventricularectopic beats (VPB, VT and bigeminy), but the incidence rate (b5 epi-sodes per 24 h) was low, as observed in the current study. In additionto the duration and method of ECG recording, a key factor that coulddirectly influence arrhythmia type and frequency is the basal heartrate, which could be a function of body weight and age at the timeof ECG assessment, and degree of acclimation to the ECG procedure(see Table 4).
The study by Macallum and Houston (1993) also demonstratedthat when monkeys were monitored on two occasions, the numberof ventricular ectopics was variable (i.e. that is sometimes present,sometimes absent) in the same monkey. This sporadic appearanceof arrhythmia was also observed and confirmed in the current studyovermultiple recording sessions (n=6–18) over 6 months. The currentstudy findings indicate that normal cynomolgus monkeys have a lowincidence of background arrhythmia and the low incidence rate re-quired long periods of telemetry sampling over several days to optimizedetection. In cases where there were more than ten events noted (totalof 3), the arrhythmias appeared anomalous or non-reproducible,though one animal did exhibit two of those three events. Despitethe low incidence noted in most animals, the arrhythmia data indi-cated that some animals exhibited one primary type of arrhythmia(e.g. NHP 12, 14, 15, 17, and 19) and the remainder exhibited two ormore different arrhythmias. Some arrhythmias, like APC, were identi-fied in only three cynomolgus monkeys and with low incidence inthese animals (only observed in 1 of 11 recording sessions). Thesefindings clearly indicate that each individual animal may demonstratea spontaneous and heterogeneous arrhythmia pattern (“fingerprint”)in the absence of treatment.
In regard to heterogeneity of background arrhythmia betweencynomolgus monkeys, most animals had less than 10 episodes of atrial,
roup arrhythmia incidence.
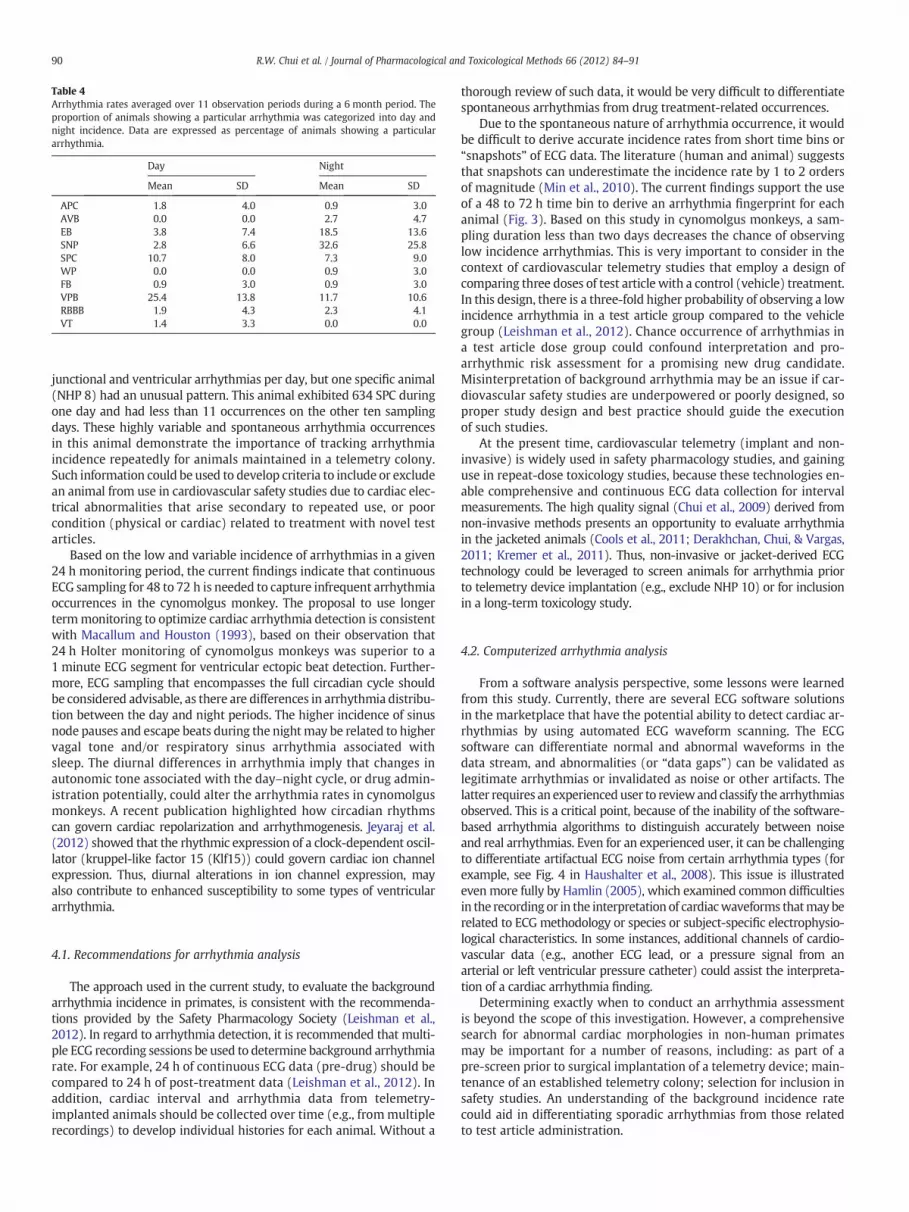
Table 4Arrhythmia rates averaged over 11 observation periods during a 6 month period. Theproportion of animals showing a particular arrhythmia was categorized into day andnight incidence. Data are expressed as percentage of animals showing a particulararrhythmia.
Day Night
Mean SD Mean SD
APC 1.8 4.0 0.9 3.0AVB 0.0 0.0 2.7 4.7EB 3.8 7.4 18.5 13.6SNP 2.8 6.6 32.6 25.8SPC 10.7 8.0 7.3 9.0WP 0.0 0.0 0.9 3.0FB 0.9 3.0 0.9 3.0VPB 25.4 13.8 11.7 10.6RBBB 1.9 4.3 2.3 4.1VT 1.4 3.3 0.0 0.0
90 R.W. Chui et al. / Journal of Pharmacological and Toxicological Methods 66 (2012) 84–91
junctional and ventricular arrhythmias per day, but one specific animal(NHP 8) had an unusual pattern. This animal exhibited 634 SPC duringone day and had less than 11 occurrences on the other ten samplingdays. These highly variable and spontaneous arrhythmia occurrencesin this animal demonstrate the importance of tracking arrhythmiaincidence repeatedly for animals maintained in a telemetry colony.Such information could be used to develop criteria to include or excludean animal from use in cardiovascular safety studies due to cardiac elec-trical abnormalities that arise secondary to repeated use, or poorcondition (physical or cardiac) related to treatment with novel testarticles.
Based on the low and variable incidence of arrhythmias in a given24 h monitoring period, the current findings indicate that continuousECG sampling for 48 to 72 h is needed to capture infrequent arrhythmiaoccurrences in the cynomolgus monkey. The proposal to use longertermmonitoring to optimize cardiac arrhythmia detection is consistentwith Macallum and Houston (1993), based on their observation that24 h Holter monitoring of cynomolgus monkeys was superior to a1 minute ECG segment for ventricular ectopic beat detection. Further-more, ECG sampling that encompasses the full circadian cycle shouldbe considered advisable, as there are differences in arrhythmia distribu-tion between the day and night periods. The higher incidence of sinusnode pauses and escape beats during the nightmay be related to highervagal tone and/or respiratory sinus arrhythmia associated withsleep. The diurnal differences in arrhythmia imply that changes inautonomic tone associated with the day–night cycle, or drug admin-istration potentially, could alter the arrhythmia rates in cynomolgusmonkeys. A recent publication highlighted how circadian rhythmscan govern cardiac repolarization and arrhythmogenesis. Jeyaraj et al.(2012) showed that the rhythmic expression of a clock-dependent oscil-lator (kruppel-like factor 15 (Klf15)) could govern cardiac ion channelexpression. Thus, diurnal alterations in ion channel expression, mayalso contribute to enhanced susceptibility to some types of ventriculararrhythmia.
4.1. Recommendations for arrhythmia analysis
The approach used in the current study, to evaluate the backgroundarrhythmia incidence in primates, is consistent with the recommenda-tions provided by the Safety Pharmacology Society (Leishman et al.,2012). In regard to arrhythmia detection, it is recommended that multi-ple ECG recording sessions be used to determine background arrhythmiarate. For example, 24 h of continuous ECG data (pre-drug) should becompared to 24 h of post-treatment data (Leishman et al., 2012). Inaddition, cardiac interval and arrhythmia data from telemetry-implanted animals should be collected over time (e.g., frommultiplerecordings) to develop individual histories for each animal. Without a
thorough review of such data, it would be very difficult to differentiatespontaneous arrhythmias from drug treatment-related occurrences.
Due to the spontaneous nature of arrhythmia occurrence, it wouldbe difficult to derive accurate incidence rates from short time bins or“snapshots” of ECG data. The literature (human and animal) suggeststhat snapshots can underestimate the incidence rate by 1 to 2 ordersof magnitude (Min et al., 2010). The current findings support the useof a 48 to 72 h time bin to derive an arrhythmia fingerprint for eachanimal (Fig. 3). Based on this study in cynomolgus monkeys, a sam-pling duration less than two days decreases the chance of observinglow incidence arrhythmias. This is very important to consider in thecontext of cardiovascular telemetry studies that employ a design ofcomparing three doses of test article with a control (vehicle) treatment.In this design, there is a three-fold higher probability of observing a lowincidence arrhythmia in a test article group compared to the vehiclegroup (Leishman et al., 2012). Chance occurrence of arrhythmias ina test article dose group could confound interpretation and pro-arrhythmic risk assessment for a promising new drug candidate.Misinterpretation of background arrhythmia may be an issue if car-diovascular safety studies are underpowered or poorly designed, soproper study design and best practice should guide the executionof such studies.
At the present time, cardiovascular telemetry (implant and non-invasive) is widely used in safety pharmacology studies, and gaininguse in repeat-dose toxicology studies, because these technologies en-able comprehensive and continuous ECG data collection for intervalmeasurements. The high quality signal (Chui et al., 2009) derived fromnon-invasive methods presents an opportunity to evaluate arrhythmiain the jacketed animals (Cools et al., 2011; Derakhchan, Chui, & Vargas,2011; Kremer et al., 2011). Thus, non-invasive or jacket-derived ECGtechnology could be leveraged to screen animals for arrhythmia priorto telemetry device implantation (e.g., exclude NHP 10) or for inclusionin a long-term toxicology study.
4.2. Computerized arrhythmia analysis
From a software analysis perspective, some lessons were learnedfrom this study. Currently, there are several ECG software solutionsin the marketplace that have the potential ability to detect cardiac ar-rhythmias by using automated ECG waveform scanning. The ECGsoftware can differentiate normal and abnormal waveforms in thedata stream, and abnormalities (or “data gaps”) can be validated aslegitimate arrhythmias or invalidated as noise or other artifacts. Thelatter requires an experienced user to reviewand classify the arrhythmiasobserved. This is a critical point, because of the inability of the software-based arrhythmia algorithms to distinguish accurately between noiseand real arrhythmias. Even for an experienced user, it can be challengingto differentiate artifactual ECG noise from certain arrhythmia types (forexample, see Fig. 4 in Haushalter et al., 2008). This issue is illustratedevenmore fully by Hamlin (2005), which examined common difficultiesin the recording or in the interpretation of cardiacwaveforms thatmayberelated to ECG methodology or species or subject-specific electrophysio-logical characteristics. In some instances, additional channels of cardio-vascular data (e.g., another ECG lead, or a pressure signal from anarterial or left ventricular pressure catheter) could assist the interpreta-tion of a cardiac arrhythmia finding.
Determining exactly when to conduct an arrhythmia assessmentis beyond the scope of this investigation. However, a comprehensivesearch for abnormal cardiac morphologies in non-human primatesmay be important for a number of reasons, including: as part of apre-screen prior to surgical implantation of a telemetry device; main-tenance of an established telemetry colony; selection for inclusion insafety studies. An understanding of the background incidence ratecould aid in differentiating sporadic arrhythmias from those relatedto test article administration.
91R.W. Chui et al. / Journal of Pharmacological and Toxicological Methods 66 (2012) 84–91
Acknowledgments
The authors thank Emily Nolan, DVM (formerly with EMKA Tech-nologies) andMatthewW. Miller, DVM, MS, Dipl. ACVIM (Cardiology)(College of Veterinary Medicine and Biomedical Sciences, MichaelE. DeBakey Institute and Texas A&M Institute for Preclinical Studies) fortheir contributions to this study. We also thank Michael Engwall, DVM,PhD for his review and constructive comments on the manuscript.
References
Ando, K., Hombo, T., Kanno, A., Ikeda, H., Imaizumi, M., Shimizu, N., et al. (2005). QTPRODACT: In vivo QT assay with a conscious monkey for assessment of the potentialfor drug-induced QT interval prolongation. Journal of Pharmacological Sciences, 99,487–500.
Bazett, H. C. (1920). An analysis of the time-relations of electrocardiograms. Heart, 7353–370.
Blasi, E., Bamberger, M., Knight, D., Engwall, M., Wolk, R., Winter, S., et al. (2009). Effects ofCP-532,623 and torcetrapib, cholesteryl ester transfer protein inhibitors, on arterialblood pressure. Journal of Cardiovascular Pharmacology, 53, 507–516.
Chapman, K., Pullen, N., Coney, L., Dempster, M., Andrews, L., Bajramovic, J., et al.(2009). Preclinical development of monoclonal antibodies: Considerations for theuse of non-human primates. MAbs, 1, 505–516.
Chui, R. W., Fosdick, A., Conner, R., Jiang, J., Bruenner, B. A., & Vargas, H. M. (2009). Assess-ment of two external telemetry systems (PhysioJacket and JET) in beagle dogs withtelemetry implants. Journal of Pharmacological and Toxicological Methods, 60, 58–68.
Chui, R. W., & Vargas, H. M. (2009). A comparison of three software platforms for auto-mated ECG analysis. Journal of Pharmacological and Toxicological Methods, 60, 28–38.
Cools, F., & Gallacher, D. J. (2009). Normal prevalence of cardiac arrhythmias in 24 hECG recordings of chronically telemetered, healthy, freely moving beagle dogs.Journal of Pharmacological and Toxicological Methods, 60, 235–236 (Abstract).
Cools, F., Janssens, S., Vanlommel, A., Teisman, A., Towart, R., & Gallacher, D. J. (2011).ECG arrhythmias in non-implanted vs. telemetry-implanted dogs: Need for screeningbefore and sufficient recovery time after implantation. Journal of Pharmacological andToxicological Methods, 64, 60–67.
Derakhchan, K., Chui, R. W., & Vargas, H. M. (2011). Evaluation of cardiac conductiondisturbances using jacketed external telemetry (JET) in conscious non-humanprimates (NHP). Journal of Pharmacological and Toxicological Methods, 64, e46.
Duerr, F. M., Carr, A. P., Duke, T., Shmon, C. L., & Monnet, E. (2007). Prevalence of perioper-ative arrhythmias in 50 young, healthy dogs. Canadian Veterinary Journal, 48, 169–177.
Gauvin, D. V., Tilley, L. P., Smith, F. W., Jr., & Baird, T. J. (2006). Electrocardiogram, hemo-dynamics, and core body temperatures of the normal freely moving cynomolgusmonkey by remote telemetry. Journal of Pharmacological and Toxicological Methods,53, 140–151.
Gauvin, D. V., Tilley, L. P., Smith, F. W. K., & Baird, T. J. (2009). Spontaneous arrhythmiasrecorded in three experimentally- and drug-naïve laboratory species (canine, pri-mate, swine) during standard pre-study screening. Journal of Pharmacological andToxicological Methods, 59, 57–61.
Hamlin, R. L. (2005). Non-drug-related electrocardiographic features in animal models insafety pharmacology. Journal of Pharmacological and Toxicological Methods, 52, 60–76.
Haushalter, T. M., Friedrichs, G. S., Reynolds, D. L., Barecki-Roach, M., Pastino, G., Hayes,R., et al. (2008). The cardiovascular and pharmacokinetic profile of dofetilide in
conscious telemetered beagle dogs and cynomolgus monkeys. British Journal ofPharmacology, 154, 1457–1464.
Hayes, E., Pugsley, M. K., Penz, W. P., Adaikan, G., &Walker, M. J. A. (1994). Relationshipbetween QaT and RR intervals in rats, guinea pigs, rabbits, and primates. Journal ofPharmacological and Toxicological Methods, 32, 201–207.
Henriques, T. A., Beck, T. W., Douglas, C. L., Jones, H. M., Kremer, J. J., Kruzich, P. J., et al.(2010). Left thoracotomy surgical approach for chronic instrumentation in dogs andmonkeys providing high-quality electrocardiogram signals. Journal of Pharmacologicaland Toxicological Methods, 62, 136–142.
ICH E14 (2005). Expert working group (efficacy) of the International Conference onHarmonisation of Technical Requirements for Registration of Pharmaceuticals for HumanUse (ICH). Clinical evaluation of QT/QTc interval prolongation and proarrhythmia po-tential for non-antiarrhythmic drugs.
ICH S7B (2005). International Conference on Harmonization of Technical Requirements forRegistration of Pharmaceuticals for Human Use (ICH). The nonclinical evaluation ofthe potential for delayed ventricular repolarization (QT interval prolongation) byhuman pharmaceuticals.
Jeyaraj, D., Haldar, S. M., Wan, X., McCauley, M. D., Ripperger, J. A., Hu, K., et al. (2012).Circadian rhythms govern cardiac repolarization and arrhythmogenesis. Nature,483, 96–99.
Kremer, J. J., Foley, C. M., Xiang, Z., Lemke, E., Sarazan, R. D., Osinski, M. A., et al. (2011).Comparison of ECG signals and arrhythmia detection using jacketed external telemetryand implanted telemetry in monkeys. Journal of Pharmacological and ToxicologicalMethods, 64, e47.
Leishman, D. J., Beck, T. W., Dybdal, N., Gallacher, D. J., Guth, B. D., Holbrook, M., Roche, B.,& Wallis, R. M. (2012). Best practice in the conduct of key nonclinical cardiovascularassessments in drug development: Current recommendations from the Safety Phar-macology Society. Journal of Pharmacological and Toxicological Methods, 65, 93–101.
Macallum, G. E., & Houston, B. J. (1993). Characterization of cardiac alterations innonsedated cynomolgus monkeys. American Journal of Veterinary Research, 54,327–332.
Min, S. S., Turner, J. R., Nada, A., DiMino, T. L., Hynie, I., Kleiman, R., et al. (2010). Evalua-tion of ventricular arrhythmias in early clinical pharmacology trials and potentialconsequences for later development. American Heart Journal, 159, 716–729.
Pugsley, M. K., Authier, S., & Curtis, M. J. (2008). Principles of safety pharmacology. BritishJournal of Pharmacology, 154, 1382–1399.
Sasaki, H., Shimizu, N., Suganami, H., & Yamamoto, K. (2005). QT PRODACT: Inter-facilityvariability in electrocardiographic and hemodynamic parameters in conscious dogsand monkeys. Journal of Pharmacological Science, 99, 513–522.
Shen, Y. T. (2010). Primate models for cardiovascular drug research and development.Current Opinion in Investigational Drugs, 11, 1025–1029.
Soloviev, M. V., Hamlin, R. L., Barrett, R. M., Chengelis, C. P., & Schaefer, G. J. (2006). Differentspecies require different correction factors for the QT interval. Cardiovascular Toxicology,6, 145–157.
Sugiyama, A. (2008). Sensitive and reliable proarrhythmia in vivo animal models forpredicting drug-induced torsades de pointes in patients with remodeled hearts.British Journal of Pharmacology, 154, 1528–1537.
Ulloa, H. M., Houston, B. J., & Altrogge, D. M. (1995). Arrhythmia prevalence during am-bulatory electrocardiographic monitoring of beagles. American Journal of VeterinaryResearch, 56, 275–281.
Vidal, J. D., Drobatz, L. S., Holliday, D. F., Geiger, L. E., & Thomas, H. C. (2010). Spontaneousfindings in the heart of Mauritian-origin cynomolgus macaques (Macaca fascicularis).Toxicologic Pathology, 38, 297–302.
Walker, M. J. A., Curtis, M. J., Hearse, D. J., Campbell, R. W. F., Janse, M. J., Yellon, D. M.,et al. (1988). The Lambeth Conventions: Guidelines for the study of arrhythmias inischaemia, infarction, and reperfusion. Cardiovascular Research, 22, 447–455.