composition, microstructure, vickers hardness and activation energies of co–cu alloys fabricated...
TRANSCRIPT
This article was downloaded by: [KU Leuven University Library]On: 05 December 2012, At: 05:49Publisher: Taylor & FrancisInforma Ltd Registered in England and Wales Registered Number: 1072954 Registeredoffice: Mortimer House, 37-41 Mortimer Street, London W1T 3JH, UK
Phase Transitions: A MultinationalJournalPublication details, including instructions for authors andsubscription information:http://www.tandfonline.com/loi/gpht20
Composition, microstructure, Vickershardness and activation energies ofCo–Cu alloys fabricated by arc meltingtechniqueA.M. Mebed a , Alaa M. Abd-Elnaiem a , Tesleem B. Asafa b & M.A.Gaffar aa Department of Physics, Faculty of Science, Assuit University,Assuit 71516, Egyptb Department of Mechanical Engineering, King Fahd University ofPetroleum and Minerals, Dhahran 31261, KSAVersion of record first published: 12 Apr 2012.
To cite this article: A.M. Mebed , Alaa M. Abd-Elnaiem , Tesleem B. Asafa & M.A. Gaffar (2012):Composition, microstructure, Vickers hardness and activation energies of Co–Cu alloys fabricated byarc melting technique, Phase Transitions: A Multinational Journal, 85:12, 1079-1090
To link to this article: http://dx.doi.org/10.1080/01411594.2012.668547
PLEASE SCROLL DOWN FOR ARTICLE
Full terms and conditions of use: http://www.tandfonline.com/page/terms-and-conditions
This article may be used for research, teaching, and private study purposes. Anysubstantial or systematic reproduction, redistribution, reselling, loan, sub-licensing,systematic supply, or distribution in any form to anyone is expressly forbidden.
The publisher does not give any warranty express or implied or make any representationthat the contents will be complete or accurate or up to date. The accuracy of anyinstructions, formulae, and drug doses should be independently verified with primarysources. The publisher shall not be liable for any loss, actions, claims, proceedings,demand, or costs or damages whatsoever or howsoever caused arising directly orindirectly in connection with or arising out of the use of this material.
Phase TransitionsVol. 85, No. 12, December 2012, 1079–1090
Composition, microstructure, Vickers hardness and activation energies
of Co–Cu alloys fabricated by arc melting technique
A.M. Mebeday*, Alaa M. Abd-Elnaiema, Tesleem B. Asafab and M.A. Gaffara
aDepartment of Physics, Faculty of Science, Assuit University, Assuit 71516, Egypt;bDepartment of Mechanical Engineering, King Fahd University of Petroleum and Minerals,
Dhahran 31261, KSA
(Received 10 January 2012; final version received 17 February 2012)
We have determined the phase transition for the Co-20 and -30 at.% Cu alloysfabricated by arc melting technique, from the binodal to the two phases �þL aswell as the peritectic transitions, using differential thermal analysis (DTA). Weequally studied the effects of aging treatment, ranging from 3 to 35 h, on the alloysamples using scanning electron microscopy (SEM) and Vickers hardness (HV).The activation energies of these alloys are equally determined using fiveestablished models. Our results show that for aging time up to 15 h, within thespinodal region at 773K, the hardness value for Co-20 and -30 at.% Cu alloysoscillates reaching a local maximum at the aging time of 8.5� 0.5 h. After 20 h ofheat treatment, the HV for Co-20 at.% Cu alloy diminishes significantly whilethat of Co-30 at.% Cu effectively stabilizes at 241MPa. The activation energiesfor the peritectic transformation based on Ozawa model are estimated to be 2465and 2680 kJmol�1 for Co-20 and -30 at.% Cu, respectively.
Keywords: spinodal; bionodal; phase transformation; differential thermalanalysis; Co–Cu alloy; Vickers hardness
1. Introduction
The Co–Cu alloy system is well known as a peritectic system, but shows a metastablemiscibility gap in the undercooled liquid state [1,2]. For sufficiently large undercoolingduring melting the binodal, which separates the undercooled melt and the metastableregion, is crossed and the melt separates into a Co-rich (L1) and a Cu-rich phase (L2).Though, a few studies have been conducted to understand the kinetics of the phaseseparation and the accompanying microstructures, however, large discrepancies in theposition of the metastable miscibility gap still exist in the literature [2–10].
In the homogeneous materials, the phase change may be initiated by nucleation-growthor spinodal decomposition [11–14]. Spinodal decomposition is similar to an age hardeningreaction which involves quenching and subsequent heat treatment. However, instead offorming precipitates by a conventional nucleation and growth mechanism, regularvariations in composition occur in the lattice with an extremely fine spacing between them.
*Corresponding author. Email: [email protected] leave for: Al-Jouf University, Skaka-2014, KSA.
ISSN 0141–1594 print/ISSN 1029–0338 online
� 2012 Taylor & Francis
http://dx.doi.org/10.1080/01411594.2012.668547
http://www.tandfonline.com
Dow
nloa
ded
by [
KU
Leu
ven
Uni
vers
ity L
ibra
ry]
at 0
5:49
05
Dec
embe
r 20
12
The two constituents have the same crystal structure but different lattice parameters. Theresulting strain hardening leads to good mechanical properties. With increasing in agingtime the rate of precipitation of the second phase increases [15,16].
Differential thermal analysis can be considered as one of the best techniques to studythe phase transitions though other methods like microscopic observations and X-raydiffraction exist [17–24]. The popular use of DTA is not without the possibility forcareful control of the heating and thermal exchanges between the actual and thereference samples. In this work, we employed DTA to determine the unstable region andthe metastable region in miscibility gap. In addition, we studied various aspects ofphase transition for the Co-20 and -30 at.% Cu systems covering the temperature range upto 750K.
2. Experimental procedures
Few specimens of Co-20 and -30 at.% Cu alloys were prepared by means of arc meltingtechnique in a purified and dried argon atmosphere following the procedure discussedelsewhere [20]. Various samples ranging from 0.25 to 4mm in thickness were obtainedfrom the specimens. To investigate their thermal stability, all the samples wereencapsulated in an evacuated quartz tube and heated in the furnace set at 773K for 3 hand then cooled to the room temperature. The samples’ Vickers hardness (HV) values weremeasured and SEM micrographs were taken as discussed below. Then, the samples wereput back into the furnace set for the same temperature and dwelled for 3 h. They were thenice-quenched for about 5min. The HV were determined and SEM micrographs weretaken. This procedure was repeated until the total dwelling/aging times were 3, 5, 8, 11, 14,17, 20, 25, 30, and 35 h.
In order to observe their microstructures at each stage, some of the samples weremechanically polished and chemically etched in a solution of 5 g FeCl3, 10mL HCl and100mL alcohol at 273K. The microstructures were then observed through JOEL-JSM-5400LV SEM manufactured in Japan. Then, energy dispersive spectrometry (EDS)measurement was performed on the samples without etching to determine the averageelemental compositions of the as-prepared samples.
The values of the HV were measured with microhardness tester manufactured byMicromet, Adolph I. Buehler Inc., USA. The hitherto polished samples’ surfaces wereplaced under a tester load of 0.2 kg and held for 30 s. The hardness was estimated from theindentation depth and the hardness value of each sample was taken from the arithmeticalmean of 16 measured indentations. Because the indentations were measured randomly,these hardness values could well reveal the hardness distribution over the sample surface ata given dwelling time. The transition behaviors of the as-prepared samples were observedwith Shimadzu DTG-60H Differential Thermal Analyzer. To do this, samples of 20mgweight were placed in a platinum holder suspended from the arm of the balance by meansof a quartz wire and were observed under non-isothermal conditions with 10–40Kmin�1
heating rates.We, thereafter, used the results of the DTA thermograms to study the dependence of
the peritectic temperature TP on the heating rate � and subsequently for the evaluation ofthe activation energy of the peritectic transformation. We applied the non-isothermalthermo-analytical models of Ozawa, Takhor, Kissinger, Starink, and Madahevan toestimate the activation energies of the alloys [22–27]. These models are based on theAvrami treatment of the transformation kinetics and define an effective crystallization rate
1080 A.M. Mebed et al.
Dow
nloa
ded
by [
KU
Leu
ven
Uni
vers
ity L
ibra
ry]
at 0
5:49
05
Dec
embe
r 20
12
coefficient with Arrhenian temperature dependence [26,27]. These models are summarizedin the following sentences.
For a temperature T, Ozawa [22] modeled the relationship between the heating rate �and the volume fraction x, of the dissolved element as in the following equation:
ln � ¼ �1
n ln½� lnð1� xÞ��
E
RTp
� �þ ln T 2
� �þ const:
� �ð1Þ
where E is the effective activation energy describing the overall transformation process andn the reaction order which depends on the mechanism of nucleation and growth. Theactivation energy can be determined from the slope of a plot of ln (�) against (1/TP).Takhor’s model [23] takes the form:
ln�
Tp � T0
� �¼
1
n
� �ln
n
n� 1
� þ ln Koð Þ �
E
RTpð2Þ
Similar to the procedure for evaluation of the activation energy in Ozawa’s model, theactivation energy based on Takhor’s model can be estimated at a room temperature T0
from the plot of lnð �Tp�T0Þ against 1
Tp. In a seemingly simpler form, Kissinger presented a
model in the form of the following equation [24]:
ln�
T2p
!¼ �
E
R
� �1
Tp
� �þ CK ð3Þ
where CK is a constant. More recently, Starink [25] showed that Equation (4) can be usedto accurately determine the activation energy of the individual process.
ln�
T1,92p
!¼ �A
E
R
� �1
Tp
� �þ Cs ð4Þ
where A¼ 1.0008 and CS is a constant that depends on the reaction kinetic model. E can beestimated from the slope of the plot of lnð �
T1:92pÞ versus ð 1Tp
Þ. The approaches proposed byChan et al. [26] and Mahadevan et al. [27] can equally be used.
ln�
Tp
� �¼ �
E
R 1Tp
� þ lnðKoÞ ð5Þ
where R, Em, and Ko are the gas constant, activation energy, and frequency factor,respectively. By plotting ln(�/TC) against (1/TC) the Em can be obtained. The frequencyfactor Ko, as a decomposition parameter, measures the probability of forming new nucleiby the nucleation-growth mechanism.
3. Results and discussion
3.1. The elemental compositions of the as-prepared samples
Figure 1(a) shows the EDS chart for Co-20 at.% Cu. The chart exhibits peakscorresponding to Co and Cu elements. The average Co and Cu compositions, using the kfactor of each element, are estimated to be 86.5% and 13.5%, respectively. For Co-30at.% Cu alloy, the average composition of Co is found to be 73.5% and 26.1% for Cu andits EDS chart is shown in Figure 1(b). These results imply that the Co compositions are
Phase Transitions 1081
Dow
nloa
ded
by [
KU
Leu
ven
Uni
vers
ity L
ibra
ry]
at 0
5:49
05
Dec
embe
r 20
12
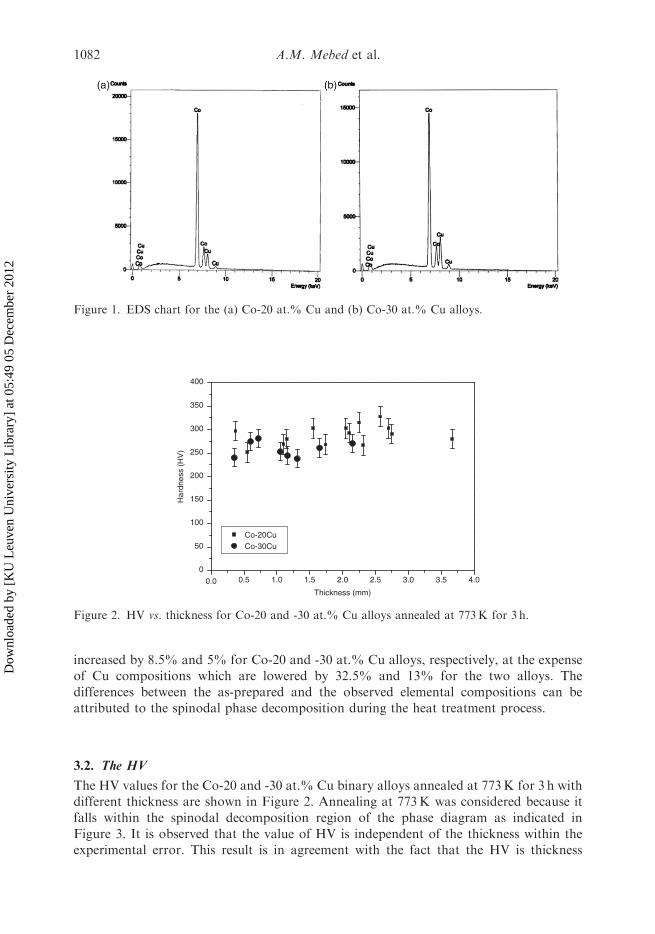
increased by 8.5% and 5% for Co-20 and -30 at.% Cu alloys, respectively, at the expenseof Cu compositions which are lowered by 32.5% and 13% for the two alloys. Thedifferences between the as-prepared and the observed elemental compositions can beattributed to the spinodal phase decomposition during the heat treatment process.
3.2. The HV
The HV values for the Co-20 and -30 at.% Cu binary alloys annealed at 773K for 3 h withdifferent thickness are shown in Figure 2. Annealing at 773K was considered because itfalls within the spinodal decomposition region of the phase diagram as indicated inFigure 3. It is observed that the value of HV is independent of the thickness within theexperimental error. This result is in agreement with the fact that the HV is thickness
Figure 1. EDS chart for the (a) Co-20 at.% Cu and (b) Co-30 at.% Cu alloys.
0.0 0.5 1.0 1.5 2.0 2.5 3.0 3.5 4.00
50
100
150
200
250
300
350
400
Har
dnes
s (H
V)
Thickness (mm)
Co-20CuCo-30Cu
Figure 2. HV vs. thickness for Co-20 and -30 at.% Cu alloys annealed at 773K for 3 h.
1082 A.M. Mebed et al.
Dow
nloa
ded
by [
KU
Leu
ven
Uni
vers
ity L
ibra
ry]
at 0
5:49
05
Dec
embe
r 20
12
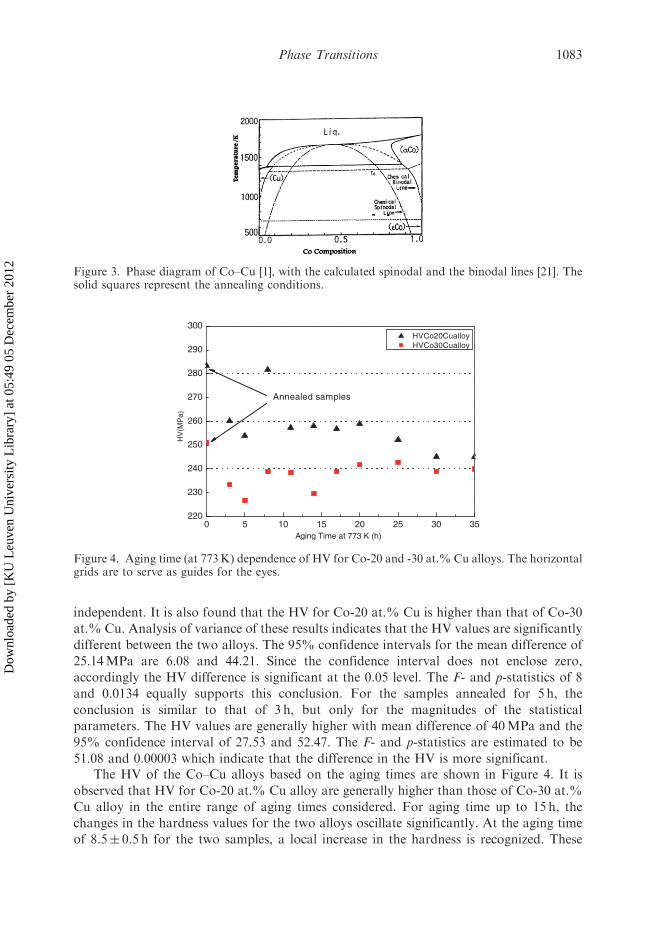
independent. It is also found that the HV for Co-20 at.% Cu is higher than that of Co-30
at.% Cu. Analysis of variance of these results indicates that the HV values are significantly
different between the two alloys. The 95% confidence intervals for the mean difference of
25.14MPa are 6.08 and 44.21. Since the confidence interval does not enclose zero,
accordingly the HV difference is significant at the 0.05 level. The F- and p-statistics of 8
and 0.0134 equally supports this conclusion. For the samples annealed for 5 h, the
conclusion is similar to that of 3 h, but only for the magnitudes of the statistical
parameters. The HV values are generally higher with mean difference of 40MPa and the
95% confidence interval of 27.53 and 52.47. The F- and p-statistics are estimated to be
51.08 and 0.00003 which indicate that the difference in the HV is more significant.The HV of the Co–Cu alloys based on the aging times are shown in Figure 4. It is
observed that HV for Co-20 at.% Cu alloy are generally higher than those of Co-30 at.%
Cu alloy in the entire range of aging times considered. For aging time up to 15 h, the
changes in the hardness values for the two alloys oscillate significantly. At the aging time
of 8.5� 0.5 h for the two samples, a local increase in the hardness is recognized. These
0 5 10 15 20 25 30 35220
230
240
250
260
270
280
290
300
HV
(MP
a)
Aging Time at 773 K (h)
HVCo20Cualloy HVCo30Cualloy
Annealed samples
Figure 4. Aging time (at 773K) dependence of HV for Co-20 and -30 at.% Cu alloys. The horizontalgrids are to serve as guides for the eyes.
Figure 3. Phase diagram of Co–Cu [1], with the calculated spinodal and the binodal lines [21]. Thesolid squares represent the annealing conditions.
Phase Transitions 1083
Dow
nloa
ded
by [
KU
Leu
ven
Uni
vers
ity L
ibra
ry]
at 0
5:49
05
Dec
embe
r 20
12

values are approximately 280 and 240MPa for Co-20 and -30 at.% Cu, respectively.Beyond 20 h of aging time, the hardness values are observed to decrease significantly forCo-20 at.% Cu while remaining relatively stable at 241 MPa for Co-30 at.% Cu alloys. Itis observed that the HV for all the samples are lower than their annealed counterparts.
The behavior of the hardness value may be explained in terms of precipitation andcoarsening mechanisms. The initial dendritic microstructures of the alloys at the beginningof the heat treatments, within and out of the miscibility gap, are partially dissolved duringaging. This activates the spinodal decomposition and precipitation process is initiated. Thealloy strength increases to a value above the HV obtained after 9 h of aging due to theexistence of the fine precipitates. For increased aging time up to 16 h, the precipitatescoarse forming more large precipitates that have opposite effect on the alloy strength. It isnoticeable that as the Cu content increases the HV decreases. Apparently, the coarseningprocess has almost completed after 20 h for the case of Co-30 at.% Cu, while precipitatesin Co-20 at.% Cu are still coarsening. The simulation results on Cu–Co alloys confirm thissuggestion [21]. Therefore, HV values after 20 h of aging time decreases significantly forCo-20 at.% Cu, while it is relatively stable for Co-30 at.% Cu.
The significant reduction in the hardness values for the Co-30 at.% Cu alloy withincreasing aging time compared to those of Co-20 at.% Cu alloy is due to the increase inthe coarsening process.
Figure 5. SEM microstructure of Co-20 at.% Cu alloy at heat treated at 773K (a) annealed (b)aging time of 3 h (c) aging time of 8 h, and (d) aging time 11 h.
1084 A.M. Mebed et al.
Dow
nloa
ded
by [
KU
Leu
ven
Uni
vers
ity L
ibra
ry]
at 0
5:49
05
Dec
embe
r 20
12
3.3. Microstructure of the annealed samples
The SEM images of the samples after annealing at 773K and for aging time of 3, 8, and
11 h are shown in Figure 5(b)–(d), respectively. For the sake of comparison, the
morphology of the as-prepared sample (Figure 5a) is also included. The as-prepared
sample was undercooled into the metastable miscibility gap and the evaluation of the
microstructure evolution during this process is significant to the understanding of the
phase transformation. During cooling, the liquid melt is transformed into a dendritic
structure with Co-rich L1-phase and a Cu-rich L2-phase through growth and coagulation.
The separation to two phases by spinodal decomposition is considered to be responsible
for the wide gap obtained in the DTA curve of Figure 6. With increasing aging time, L2
dissolves partially into L1 phase and accordingly phase decomposition is expected at the L1
and L2 boundaries and L1/L2 interface. This increase in L2 phase at the expense of L1
phase was already discussed in Section 3.1.
800 1000 1200 1400
DT
A s
igna
l (ar
b. u
nits
)
Temperature(K)
Ts-b
Tp
Tb-α+L
(3)
(2)
(1)
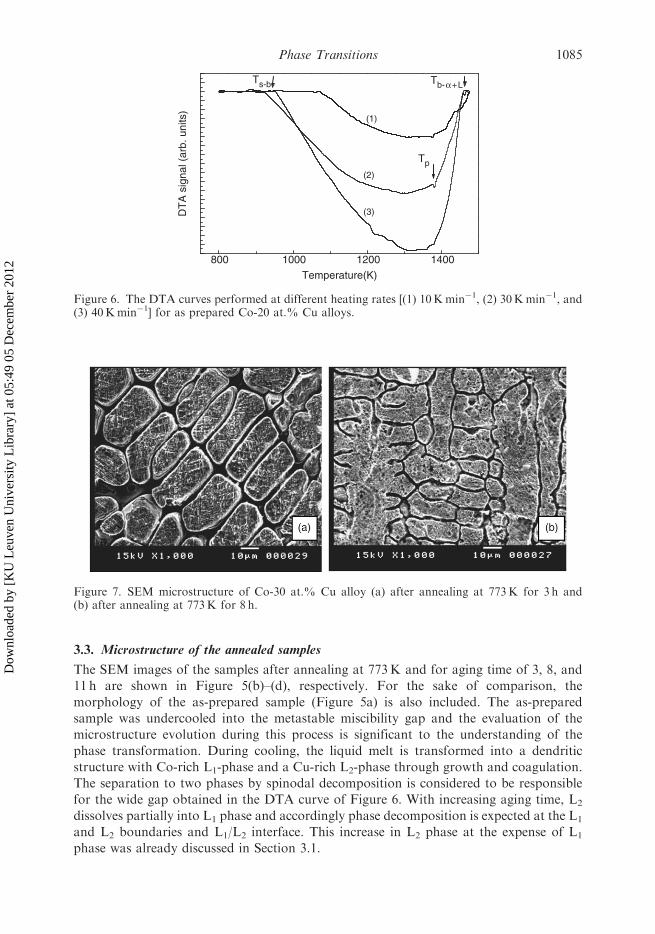
Figure 6. The DTA curves performed at different heating rates [(1) 10Kmin�1, (2) 30Kmin�1, and(3) 40Kmin�1] for as prepared Co-20 at.% Cu alloys.
Figure 7. SEM microstructure of Co-30 at.% Cu alloy (a) after annealing at 773K for 3 h and(b) after annealing at 773K for 8 h.
Phase Transitions 1085
Dow
nloa
ded
by [
KU
Leu
ven
Uni
vers
ity L
ibra
ry]
at 0
5:49
05
Dec
embe
r 20
12

Figure 7(a) and (b) are the SEM micrographs of the annealed Co-30 at.% Cu sample at773K and aging time of 8 h, respectively. Similar to the finding in Co-20 at.% Cu alloy,Co-30 at.% Cu alloy contains dendritic structure of the Co-rich L1-phase and a Cu-richL2-phase. In addition, several particles of Cu are found in the Co-rich phase and may beresponsible for the higher hardness observed at the aging time of 8 h compared to that of5 h as shown in Figure 4.
3.4. Phase transition of the annealed samples
The DTA curves of the phase transition for Co-20 at.% Cu alloy at the heating rate of 10,30 and 40Kmin�1 are shown in Figure 6. The transition temperature Ts-b corresponds tothe onset of the phase transformation from the unstable spinodal phase to the metastablebinodal two-phase regions. The values of the Ts-b at the heating rates 10, 30 and40Kmin�1 are about 1080, 950 and 980K, respectively. Apparently, this transitionprocess is stretched over an extended temperature interval of about 550K, as estimatedfrom the phase diagram for Co-20 at.% Cu alloy of Figure 3 [1]. The peritectictemperature (Tp) for Co-20 at.% Cu alloy is manifested on the DTA traces as a sharp peakin the range 1374–1383K for the different heating rates. The transition temperature fromthe binodal to the two phases �þL (Tb-�þL) is found to be about 1450K at rate 40 for Co-20 at.% Cu alloy.
As the aging time increases, the interface comes closer to the calculated spinodal line dueto the systematic change in the solubility limit with the particle size. This conclusion is logicalsince in metastable equilibrium with different aging temperature, the concentrations changecontinuously with the boundary line of the metastable miscibility gap. The DTA resultsmight indicate the continuity of the decomposition kinetics at the boundary betweenunstable and the metastable regions which is in accordance with our previous work [20].
From the phase diagram of Co-30 at.% Cu alloy shown in Figure 8, the magnetic andthe peritectic transition temperatures are observed to lie inside the spinodal region [1]. Thetemperature for the magnetic transition is about 1310K while it is 1385K for the peritectictransition. From the DTA chart of Figure 8, the peritectic temperature (Tp) is found to be
900 1000 1100 1200 1300 1400 1500
DT
A s
igna
l (ar
b. u
nits
)
Temprature(K)
Tc
Tp
Ts-b
(3)
(2)
(1)
Figure 8. DTA curves performed at different heating rates [(1) 10Kmin�1, (2) 20Kmin�1, and (3)30Kmin�1] for as prepared sample of Co-30 at.% Cu alloys.
1086 A.M. Mebed et al.
Dow
nloa
ded
by [
KU
Leu
ven
Uni
vers
ity L
ibra
ry]
at 0
5:49
05
Dec
embe
r 20
12
1378, 1382, 1384, and 1386.5K for heating rates of 10, 20, 30, and 40Kmin�1,
respectively. The characteristic onset temperature of this process is designated as Tp
on the DTA chart of Figure 8. It is worth to mention that the peritectic transition for the
Co-30 at.% Cu alloy has been observed at 1385K at low cooling rates between 50 and
70K s�1 [28].Three peaks at 1410, 1414, and 1417K for different heating rates of 10, 20, and
30Kmin�1, respectively, are identified. These corresponding temperatures are suggested to
be for the transition from the spinodal to the binodal region which agrees well with those
calculated from phase diagram [1]. The characteristic onset temperature of this process is
designated as Ts-b on the DTA chart of Figure 8. No indication of magnetic transition is
found in the DTA chart and further study is in progress to explain the reason for this
absence.
4. Kinetic parameters for the peritectic transition
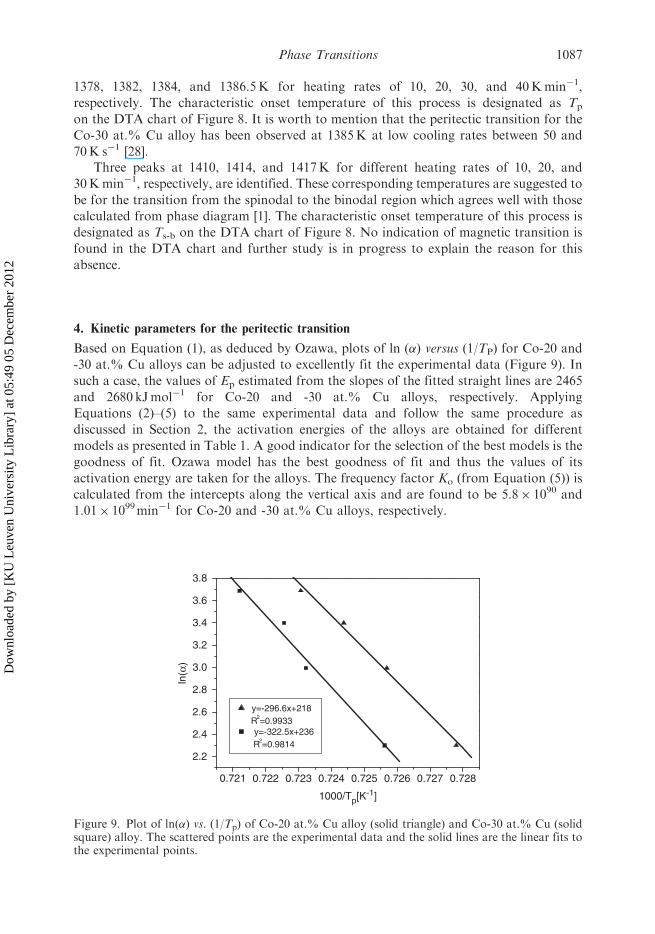
Based on Equation (1), as deduced by Ozawa, plots of ln (�) versus (1/TP) for Co-20 and
-30 at.% Cu alloys can be adjusted to excellently fit the experimental data (Figure 9). In
such a case, the values of Ep estimated from the slopes of the fitted straight lines are 2465
and 2680 kJmol�1 for Co-20 and -30 at.% Cu alloys, respectively. Applying
Equations (2)–(5) to the same experimental data and follow the same procedure as
discussed in Section 2, the activation energies of the alloys are obtained for different
models as presented in Table 1. A good indicator for the selection of the best models is the
goodness of fit. Ozawa model has the best goodness of fit and thus the values of its
activation energy are taken for the alloys. The frequency factor Ko (from Equation (5)) is
calculated from the intercepts along the vertical axis and are found to be 5.8� 1090 and
1.01� 1099min�1 for Co-20 and -30 at.% Cu alloys, respectively.
0.721 0.722 0.723 0.724 0.725 0.726 0.727 0.728
2.2
2.4
2.6
2.8
3.0
3.2
3.4
3.6
3.8
ln(α
)
1000/Tp[K-1]
y=-296.6x+218 R2=0.9933
y=-322.5x+236 R2=0.9814
Figure 9. Plot of ln(�) vs. (1/Tp) of Co-20 at.% Cu alloy (solid triangle) and Co-30 at.% Cu (solidsquare) alloy. The scattered points are the experimental data and the solid lines are the linear fits tothe experimental points.
Phase Transitions 1087
Dow
nloa
ded
by [
KU
Leu
ven
Uni
vers
ity L
ibra
ry]
at 0
5:49
05
Dec
embe
r 20
12
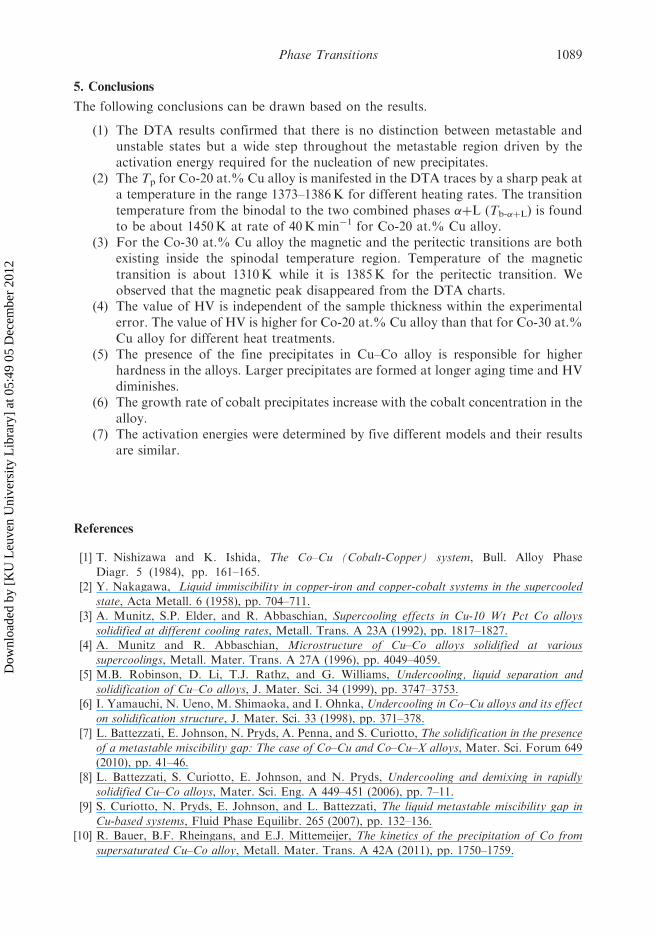
The overall nucleation rate constant (K) at any temperature T in the entire region of
the endothermic peak is usually assumed to have an Arrhenian temperature dependence as
in the following equation:
K ¼ Ko exp �E
RT
� �: ð6Þ
Substituting the activation energy Ep and the frequency factor Ko, the value of K as a
function of T can be estimated for each heating rate. The calculated value of K(T) for Co-
20 at.% Cu alloys at a constant heating rate is plotted as lnK versus 1/T as shown in
Figure 10. From Figure 10, it is noticed that the decomposition rate constant K is faster at
higher heating rates than at lower heating rates. In other words, the Co-rich phase is being
thermally formed more rapidly at higher temperatures.
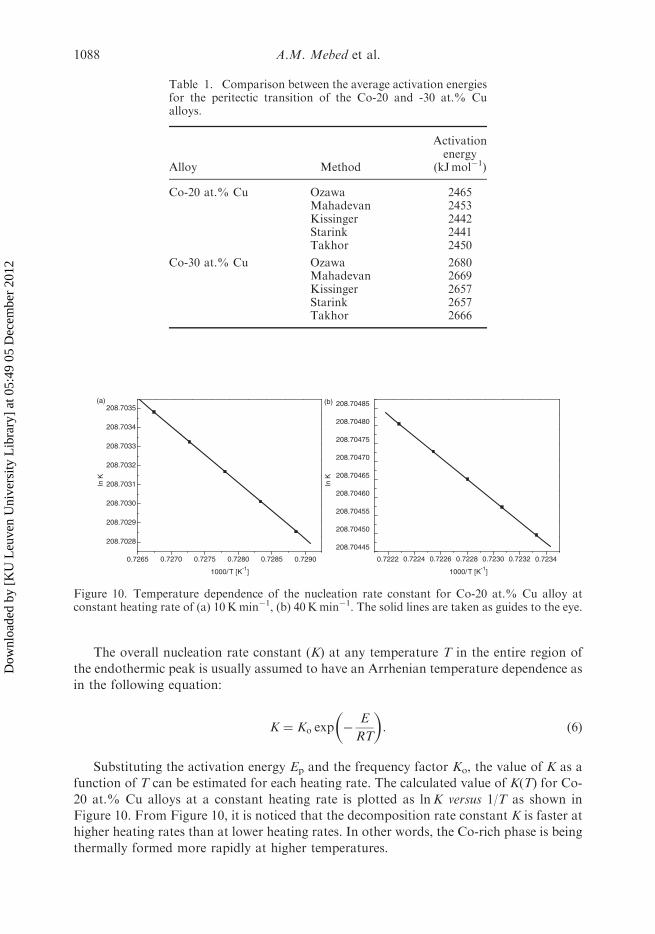
Table 1. Comparison between the average activation energiesfor the peritectic transition of the Co-20 and -30 at.% Cualloys.
Alloy Method
Activationenergy
(kJmol�1)
Co-20 at.% Cu Ozawa 2465Mahadevan 2453Kissinger 2442Starink 2441Takhor 2450
Co-30 at.% Cu Ozawa 2680Mahadevan 2669Kissinger 2657Starink 2657Takhor 2666
0.7265 0.7270 0.7275 0.7280 0.7285 0.7290
208.7028
208.7029
208.7030
208.7031
208.7032
208.7033
208.7034
208.7035
ln K
1000/T [K-1] 1000/T [K-1]
(a)
0.7222 0.7224 0.7226 0.7228 0.7230 0.7232 0.7234
208.70445
208.70450
208.70455
208.70460
208.70465
208.70470
208.70475
208.70480
208.70485
ln K
(b)
Figure 10. Temperature dependence of the nucleation rate constant for Co-20 at.% Cu alloy atconstant heating rate of (a) 10Kmin�1, (b) 40Kmin�1. The solid lines are taken as guides to the eye.
1088 A.M. Mebed et al.
Dow
nloa
ded
by [
KU
Leu
ven
Uni
vers
ity L
ibra
ry]
at 0
5:49
05
Dec
embe
r 20
12
5. Conclusions
The following conclusions can be drawn based on the results.
(1) The DTA results confirmed that there is no distinction between metastable andunstable states but a wide step throughout the metastable region driven by theactivation energy required for the nucleation of new precipitates.
(2) The Tp for Co-20 at.% Cu alloy is manifested in the DTA traces by a sharp peak ata temperature in the range 1373–1386K for different heating rates. The transitiontemperature from the binodal to the two combined phases �þL (Tb-�þL) is foundto be about 1450K at rate of 40Kmin�1 for Co-20 at.% Cu alloy.
(3) For the Co-30 at.% Cu alloy the magnetic and the peritectic transitions are bothexisting inside the spinodal temperature region. Temperature of the magnetictransition is about 1310K while it is 1385K for the peritectic transition. Weobserved that the magnetic peak disappeared from the DTA charts.
(4) The value of HV is independent of the sample thickness within the experimentalerror. The value of HV is higher for Co-20 at.% Cu alloy than that for Co-30 at.%Cu alloy for different heat treatments.
(5) The presence of the fine precipitates in Cu–Co alloy is responsible for higherhardness in the alloys. Larger precipitates are formed at longer aging time and HVdiminishes.
(6) The growth rate of cobalt precipitates increase with the cobalt concentration in thealloy.
(7) The activation energies were determined by five different models and their resultsare similar.
References
[1] T. Nishizawa and K. Ishida, The Co–Cu (Cobalt-Copper) system, Bull. Alloy Phase
Diagr. 5 (1984), pp. 161–165.[2] Y. Nakagawa, Liquid immiscibility in copper-iron and copper-cobalt systems in the supercooled
state, Acta Metall. 6 (1958), pp. 704–711.
[3] A. Munitz, S.P. Elder, and R. Abbaschian, Supercooling effects in Cu-10 Wt Pct Co alloys
solidified at different cooling rates, Metall. Trans. A 23A (1992), pp. 1817–1827.[4] A. Munitz and R. Abbaschian, Microstructure of Cu–Co alloys solidified at various
supercoolings, Metall. Mater. Trans. A 27A (1996), pp. 4049–4059.
[5] M.B. Robinson, D. Li, T.J. Rathz, and G. Williams, Undercooling, liquid separation and
solidification of Cu–Co alloys, J. Mater. Sci. 34 (1999), pp. 3747–3753.[6] I. Yamauchi, N. Ueno, M. Shimaoka, and I. Ohnka, Undercooling in Co–Cu alloys and its effect
on solidification structure, J. Mater. Sci. 33 (1998), pp. 371–378.
[7] L. Battezzati, E. Johnson, N. Pryds, A. Penna, and S. Curiotto, The solidification in the presence
of a metastable miscibility gap: The case of Co–Cu and Co–Cu–X alloys, Mater. Sci. Forum 649
(2010), pp. 41–46.[8] L. Battezzati, S. Curiotto, E. Johnson, and N. Pryds, Undercooling and demixing in rapidly
solidified Cu–Co alloys, Mater. Sci. Eng. A 449–451 (2006), pp. 7–11.
[9] S. Curiotto, N. Pryds, E. Johnson, and L. Battezzati, The liquid metastable miscibility gap in
Cu-based systems, Fluid Phase Equilibr. 265 (2007), pp. 132–136.[10] R. Bauer, B.F. Rheingans, and E.J. Mittemeijer, The kinetics of the precipitation of Co from
supersaturated Cu–Co alloy, Metall. Mater. Trans. A 42A (2011), pp. 1750–1759.
Phase Transitions 1089
Dow
nloa
ded
by [
KU
Leu
ven
Uni
vers
ity L
ibra
ry]
at 0
5:49
05
Dec
embe
r 20
12
[11] K. Binder and H.L. Frisch, Phase stability of weakly crosslinked interpenetrating polymernetworks, J. Chem. Phys. 81 (1984), pp. 2126–2136.
[12] J.D. Gunton, M. San Miguel, P.S. Sahni, C. Domb, and J.L. Lebowitz, Phase Transition andCritical Phenomena, Vol. 8, Academic Press, London, 1983.
[13] K. Binder, Theory of first-order phase transitions, Rep. Prog. Phys. 50 (1987), pp. 783–859.[14] R. Wagner and R. Kampmann, Homogeneous second phase precipitation, in Materials Science
and Technology – A Comprehensive Treatment, R.W. Cahn, P. Haasen, and E.J. Kramer, eds.,
Vol. 5, Chap. 4, VCH, Weinheim, 1991, pp. 213–303.[15] V.A. Phillips, Electron-microscope observations on precipitation in a Cu-3.1 wt Pct Co alloy,
Trans. TMS-AIME 230 (1964), pp. 967–976.
[16] J.C. Livingston, Critical particle size for precipitation hardening, Trans. Met. Soc. AIME 215(1959), pp. 566–571.
[17] C.D. Cao, G.P. Gorler, D.M. Herlach, and B. Wei, Liquid–liquid phase separation in undercooled
Co–Cu alloys, Mater. Sci. Eng. A 325 (2002), pp. 503–510.[18] C.D. Cao, B. Wei, and D.M. Herlach, Disperse structures of undercooled Co-40 wt% Cu droplets
processed in drop tube, J. Mater. Sci. Lett. 21 (2002), pp. 341–343.[19] M. Kolbe, C.D. Cao, X.Y. Lu, P.K. Galenko, B. Wei, and D.M. Herlach, Solidification
behaviour of undercooled Co–Cu alloys showing a metastable miscibility gap, Mater. Sci. Eng.A 375–377 (2004), pp. 520–523.
[20] A.M. Mebed, M.I. Abd-Elrahman, A.M. Abd-Elnaiem, and M.A. Gaffar, Thermal analysis
study for the phase determination and instable to metastable transformation of the Co-13Cu alloy,J. Phase Transit. 82 (2009), pp. 587–598.
[21] T. Koyama, T. Miyazaki, and A.M. Mebed, Computer simulation of phase decomposition in real
alloy system based on the modified Khachaturyan diffusion equation, Metall. Mater. Trans. A 26(1995), pp. 2617–2623.
[22] T. Ozawa, Estimation of activation energy by isoconversion methods, Thermochim. Acta 203(1992), pp. 159–165.
[23] R.L. Takhor, Advances in Nucleation and Crystallization of Glasses, American Ceramics Society,Columbus, 1972.
[24] H.E. Kissinger, Reaction kinetics in differential thermal analysis, Anal. Chem. 29 (1957),
pp. 1702–1706.[25] M.J. Starink, A new method for the derivation of activation energies from experiments performed
at constant heating rate, Thermochim. Acta 288 (1996), pp. 97–104.
[26] H.S.O. Chan, S.C. Ng, W.S. Sim, W.S.H. Seo, and B.T.G. Tan, Synthesis and characterization ofconducting poly(o-aminobenzyl alcohol) and its copolymers with aniline, Macromolecules 26(1993), pp. 144–150.
[27] S. Madahevan, A. Giridhar, and A.K. Singh, Calorimetric measurements on As–Sb–Seglasses, J. Non-Cryst. Solids 88 (1978), pp. 11–34.
[28] D. Li, M.B. Robinson, T.J. Rathz, and G. Williams, Direct determination of the metastable liquidmiscibility gap in undercooled Cu–Co alloys, J. Mater. Lett. 36 (1998), pp. 152–156.
1090 A.M. Mebed et al.
Dow
nloa
ded
by [
KU
Leu
ven
Uni
vers
ity L
ibra
ry]
at 0
5:49
05
Dec
embe
r 20
12