complex cepstrum based voice conversion using radial basis function
TRANSCRIPT
Research ArticleComplex Cepstrum Based Voice Conversion Using RadialBasis Function
Jagannath Nirmal1 Suprava Patnaik1 Mukesh Zaveri2 and Pramod Kachare1
1 Department of Electronics Engineering SVNIT Surat India2Department of Computer Engineering SVNIT Surat India
Correspondence should be addressed to Jagannath Nirmal jhnirmal1975gmailcom
Received 30 November 2013 Accepted 26 December 2013 Published 6 February 2014
Academic Editors K S Chuang and A Maier
Copyright copy 2014 Jagannath Nirmal et al This is an open access article distributed under the Creative Commons AttributionLicense which permits unrestricted use distribution and reproduction in any medium provided the original work is properlycited
The complex cepstrumvocoder is used tomodify the speaker specific characteristics of the source speaker speech to that of the targetspeaker speech The low time and high time liftering are used to split the calculated cepstrum into the vocal tract and the sourceexcitation parametersThe obtainedmixed phase vocal tract and source excitation parameters with finite impulse response preservethe phase properties of the resynthesized speech frame The radial basis function is explored to capture the nonlinear mappingfunction for modifying the complex cepstrum based real and imaginary components of the vocal tract and source excitation of thespeech signalThe state-of-the-artMel cepstrum envelope and the fundamental frequency (119865
0) are considered to represent the vocal
tract and the source excitation of the speech frame respectively Radial basis function is used to capture and formulate the nonlinearrelations between theMel cepstrum envelope of the source and target speakers Mean and standard deviation approach is employedto modify the fundamental frequency (119865
0) The Mel log spectral approximation filter is used to reconstruct the speech signal
from the modified Mel cepstrum envelope and fundamental frequency A comparison of the proposed complex cepstrum basedmodel has beenmade with the state-of-the-artMel Cepstrum Envelope based voice conversionmodel with objective and subjectiveevaluations The evaluation measures reveal that the proposed complex cepstrum based voice conversion system approximate theconverted speech signal with better accuracy than the model based on the Mel cepstrum envelope based voice conversion
1 Introduction
The voice conversion (VC) system extracts the features of thesource and the target speaker soundrsquos and formulates themapping function to modify the features of the sourcespeaker soundrsquos such that the resynthesized speech soundrsquos asif spoken by a target speaker [1] Application of VC includesthe personification of text to speech design of multispeakerbased speech synthesis system audio dubbing karaoke appli-cations security related system the design of speaking aidsfor the speech impaired patient broadcasting and multime-dia applications [2ndash4]TheVC involves the transformation ofspeaker specific characteristics such as vocal tract parameterssource excitation and long term prosodic parameters withthat of desired speaker parameters [5]The vocal tract param-eters are relatively more prominent for identifying thespeaker uniqueness than the source excitation [5]
Several methods have been reported in the literature tocharacterize the spectrum of the speech frame namely For-mant Frequency (FF) Formant Bandwidth (FBW) [1] LinearPredictive Coefficients (LPC) [6] Reflection Coefficients(RC) [7] Log Area Ratio (LAR) [8] Cepstrum Coefficients[9] Mel cepstrum envelope (MCEP) [10] Wavelet Transform(WT) [11] and Mel generated spectra [12] Line Spectral Fre-quency (LSF) [13 14] is a direct mathematical transformationof LPC which has a special attraction in representing thevocal tract as it smoothly traces the shape of formants andantiformants and overcomes the interpolation quantizationand stability issues of the LPC However LP related featuresdoes not assume nonstationary characteristics of the speechsignal within a frame and therefore fail to analyze the localspeech events accurately [15] Further a very accurateapproach STRAIGHT [16] has also been proposed It needsenormous computations and therefore it is inappropriate
Hindawi Publishing CorporationISRN Signal ProcessingVolume 2014 Article ID 357048 13 pageshttpdxdoiorg1011552014357048
2 ISRN Signal Processing
for real time applications Another approach using Mel Fre-quency Cepstrum Coefficients (MFCC) have been proposed[17] which properly model both spectral peaks and valleysHowever the main toil of MFCC synthesis is to loose pitchand phase related information [17]
The conventional parametric speech production modellike LPC real cepstrum [18ndash20] and Liljencrants-Fant (LF)[21] models is based on minimum phase model with infiniteimpulse response [22] In fact a completely different categoryof glottal flow estimation relies on the mixed-phase modelof speech [22 23] According to this estimation the speechsignal is composed of both maximum (ie anticausal) andminimum phase (ie causal) components The return phaseof the glottal pulse components and vocal tract impulseresponse is part of minimum phase signals whereas the openphase of the glottal flow is considered as maximum phaseof the signal [24] It has been shown in the literature thatthe mixed phase models are appropriate for representing thevoiced speech [25] The real cepstrum with minimum phasediscards the glottal flow information of speech However thecomplex cepstrum incorporates phase as glottal pulse infor-mation during speech synthesis [25] The complex cepstrumrepresentation of the speech signal allows noncasual model-ing of short time speech frame which is actually observed innatural speech [22ndash24] Complex cepstrum perform well inspeech synthesis and speech modeling [25 26]
For the development of appropriate transformationmodel various mapping functions have been proposed inthe literature such as Vector Quantization (VQ) based code-book mapping [6] and Gaussian Mixture Model (GMM)based transformation models [3 9 10] Fuzzy vector quan-tization [27] and a Speaker Transformation Algorithm usingSegmental Code-book (STASC) have been proposed toovercome limitations of VQ based model [14] In additionDynamic Frequency Warping (DFW) [28] have also beenused for transformation of the spectral envelope The GMMoversmoothing issue is resolved via maximum likelihoodestimators and hybrid methods [29] The dynamic kernelpartial least square regression technique has also implied[12] for spectral transformation In fact the relation betweenthe shapes of the vocal tracts of the different speakers arehighly nonlinear to capture this nonlinearity between thevocal tracts artificial neural network has been explored in theliterature [10 11 14 18 30]
In addition to vocal tract the source excitation containsvital speaker-specific characteristics [1 3] so it is necessary toproperly modify the excitation signal to accurately synthesizethe target speakerrsquos voice [4] Very few methods have beendiscussed in the literature for excitation signal transformationsuch as residual copying but the converted sound seems tobe a third speakerrsquos voice [31] another method is residualprediction [3]However it has the problemof over smoothen-ing In order to alleviate the over smoothening problem ofresidual prediction residual selection method unit selectionmethod [31] and combination of residual selection and unitselection have been also explored in the literature [32] TheArtificial Neural Network model has also applied to modifythe residual signal but time domain residual transformation
loses the correlation in the speech production model whichleads to distortion in speech signal [12]
In this paper the prominent complex cepstrum vocoderis employed to model the vocal tract and source excitation ofthe speech The low time and high time lifters are designedto separate the complex cepstrum into vocal tract and sourceexcitation parameters with real and imaginary componentsThe reasons behind the use of radial basis function (RBF)based the transformation model are its fast training abilitydesirable computational efficiency and interpolation prop-erty The RBF based mapping function are trained separatelyto capture the nonlinear relations for modifying the real andthe imaginary components of cepstrum based vocal tractand source excitation of the source speaker to that of thetarget speaker utterancersquos Similarly the MCEP parametersof source speakerrsquos utterances are also modified according tothe target speakerrsquos utterances using RBF The fundamentalfrequency between source and target speakerrsquos utterances ismodified using mean and standard deviation approach [10]Mel log spectral approximation (MLSA) filter [33] is usedto reconstruct the speech signal from modified MCEP andfundamental (119865
0)
Finally the performance of the proposed complex cep-strum based VC approach is compared with MCEP [34]basedVC approachThis is done using various objectivemea-sures such as a performance index (119875LSF) [3] formant devia-tion [14 30] and spectral distortion [14]The commonly usedsubjective measures such as Mean Opinion Score (MOS) andABX verify the quality and speaker identity of the convertedspeech signal
This paper is organized as follows Section 2 describes thecomplex cepstrumanalysiswith low time andhigh time lifterswhich are used to extract the cepstrum based features of thevocal tract and excitation based signals Section 3 explainsthe proposed VC system based on complex cepstrum and thestate-of-the-art MCEP based VC system Radial basis basedspectral mapping is described in Section 4The experimentalenvironment database and objective measures such asperformance index formant deviation spectrograph and theperceptual tests namely Mean Opinion Score (MOS) andABX conducted with different human listeners are presentedin Section 5 The last Section gives the overall conclusions ofthe paper
2 Complex Cepstrum Analysis
According to the source-filter model of the human speechproduction system the source signal excites the vocal tractand it generates the speech signal The human speech is two-sided real and asymmetrical in nature Hence a mixed phaseFinite Impulse Response (FIR) systemmay be realized whichpreserves the phase related information to givemore accuratesynthesized speech From the signal processing point of viewthe short time speech signal 119904(119899) can be considered as linearconvolution of the source excitation 119892(119899) with the impulsefunction of the vocal tract V(119899) It can be defined as follows
119904 (119899) = V (119899) lowast 119892 (119899) (1)
ISRN Signal Processing 3
By applying DTFT to the speech signal we obtain
119878 (120596) =
119872
sum
119899=minus119872
119904 (119899) 119890minus119895120596119899 (2)
where119872 is the order of cepstrum that is number of one sidedfrequenciesThe time domain convolution can bemodeled asspectral multiplication of the vocal tract filter response 119881(120596)and source excitation response 119866(120596) giving the short timespeech spectrum 119878(120596) as shown
119878 (120596) = 119881 (120596)119866 (120596) (3)
Cepstral analysis includes transforming themultiplied sourceexcitation and vocal tract responses in the frequency domaininto linear combination of the two components in the cepstraldomain The analysis of the speech signal needs to separatetwo components 119881(120596) and 119866(120596) In frequency domainlogarithmic representation is used to linearly combine thecomponents119881(120596) and119866(120596)The complex spectrum 119878(120596) canbe rewritten by performing logarithmic compression
119878 (120596) = log 119878 (120596) (4)
Therefore the log spectrum is further separated into two parts
log 119878 (120596) = log119881 (120596) + log119866 (120596) (5)
Thus the log spectrum can be decomposed as addition ofmagnitude and phase components
119878 (120596) = log |119878 (120596)| + 119895 arg 119878 (120596) (6)
The imaginary part of the logarithmic spectrum is theunwrapped phase sequence [23] Thus phase information isno more ignored giving rise to a complex cepstrum Hencecomprising of a mixed phase system with a finite impulseresponse (FIR) type which is stable The cepstrum is definedas
119888 (119899) =1
2120587int
120587
minus120587
119878 (120596) 119890119895120596119899119889120596 (7)
where 119888(119899) can be given as
119888 (119899) =1
2120587int
120587
minus120587
log |119878 (120596)| 119890119895120596119899119889120596
+1
2120587int
120587
minus120587
119890119895(120596+arg(119878(120596)))119899
119889120596
(8)
The log spectral components that vary rapidly with frequency120596 are denoted as a high time component log119866(120596) and thelog spectral components that slowly with frequency 120596 aredesignated as a low time component log119881(120596) [20] Here 119888(119899)is time aliased version therefore 119872 gt 119873 condition avoidsaliasing effect119873 is total number of cepstrum samples
Consider
119897119897 (119899) =
1 0 le 119899 lt 119871119888
0 119871119888ge 119899 le 119873
119888V (119899) = 119897119897 (119899) 119888 (119899)
119897ℎ(119899) =
1 119871119888le 119899 le 119873
0 elsewhere
119888119890(119899) = 119897
ℎ(119899) 119888 (119899)
(9)
where the 119888(119899) represents complex cepstrum of speech frame119897119897(119899) is low time lifter 119897
ℎ(119899) is high time lifter In the de-
convolution stage an appropriate value of lifter index 119871119888is
chosen to separate the two components namely the fastchanging excitation parameter 119888
119890(119899) and the slowly changing
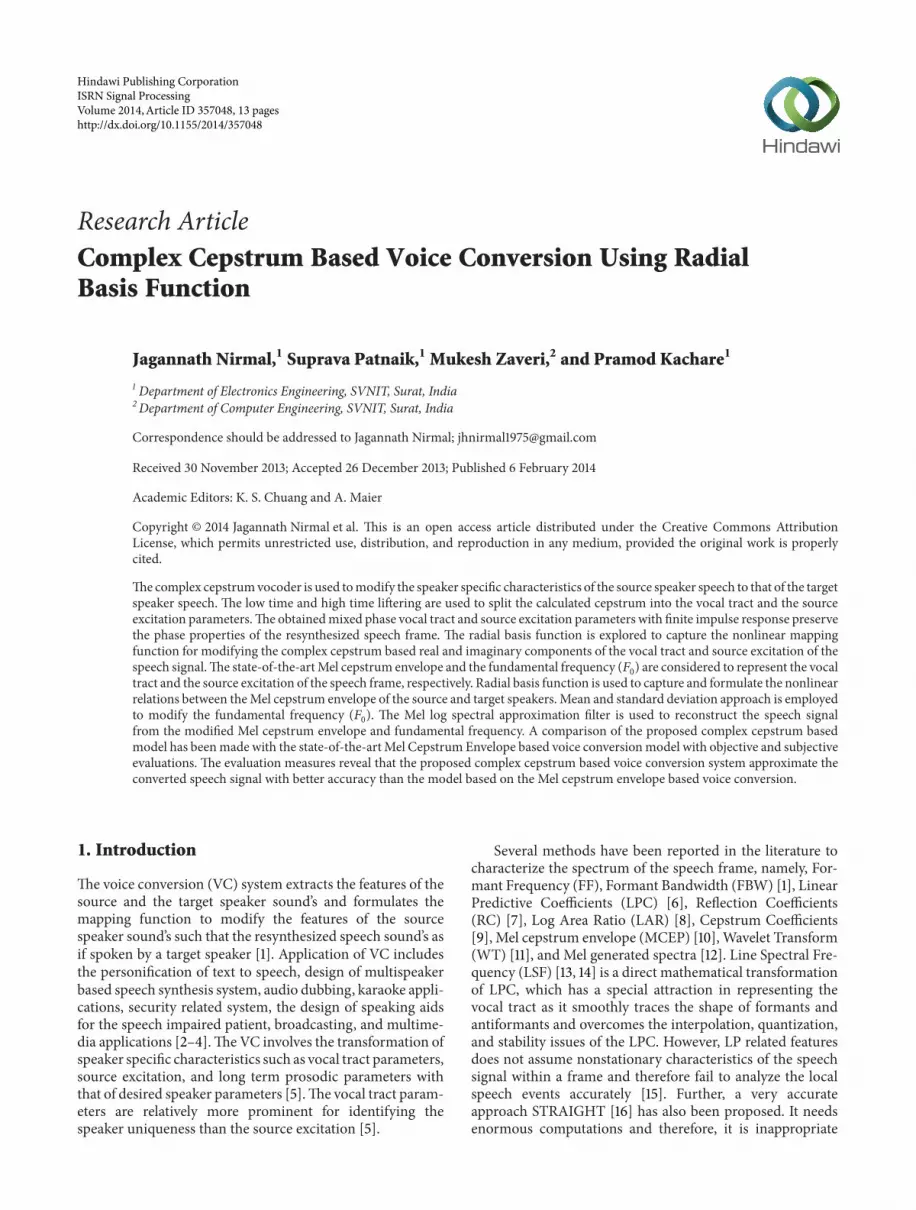
parameters that is vocal tract parameter 119888V(119899) The win-dowed signal the complex cepstrum with magnitude andphase spectra are shown in Figure 1 The coefficient 119888(0) isthe speech signal energy and the coefficients 119888(119899) for 119899 ge1 signifies the magnitude and phase at the quefrency 119899 inthe spectrum The vocal tract cepstrum 119888V(119899) has coefficientswith significant magnitudes at lower values of 119899 and sourceexcitation cepstrum 119888
119890(119899) has relatively lower magnitude
coefficients for higher values of 119899 Theoretically the complexcepstrum being a mixed phase results in a more accuratemodel of the speech signal when compared to the minimumphase synthesis filter approach which discard the glottal flowinformation content in the cepstrum [18] The cepstrumvalues lower than zero represents the maximum phase (ieanticausal) response whereas the values above zero can beconsidered as the minimum phase (ie causal) response areshown in Figure 2 Mathematically it can be modeled as
Minimum Phase = 119888min (119899)
=
0 119899 = minus119872 minus2 minus1
119888 (119899) 119899 = 0
119888 (119899) + 119888 (minus119899) 119899 = 1 2 119872
Maximum Phase = 119888max (119899) = 119888 (119899) minus 119888min (119899)
119888max (119899) =
119888 (119899) 119899 = minus119872 minus2 minus1
0 119899 = 0
minus119888 (minus119899) 119899 = 1 2 119872
(10)
The anticausal and casual cepstrum parts with the cor-responding magnitude and phase spectrum are shown inFigure 3 It has been observed that the logarithmic compres-sion involved in the cepstrum analysis helps in obtaining themixed phase response for both voiced as well as unvoicedsignals
3 Voice Conversion Framework
In this section the complex cepstrum based VC algorithmis proposed The MCEP-MLSA based VC algorithm is also
4 ISRN Signal Processing
0 20 40 60 80 100 120minus1
minus05
0
05
1
n
s(n)120596
(n)
(a) Speech frame and window
0 1000 2000 3000 4000 5000 6000 7000 8000minus20
minus10
0
10
20
30
40
Mag
nitu
de (d
B)
f (Hz)
(b) Mag spectrum
minus150 minus100 minus50 0 50 100 150minus4
minus2
0
2
4
n
Cep
strum
(c) Complex cepstrum
0 1000 2000 3000 4000 5000 6000 7000 8000minus4
minus2
0
2
4
Phas
e (ra
d)
f (Hz)
(d) Phase spectrum
Figure 1 (a) Speech frame and window (b) magnitude spectra (c) complex cepstrum and (d) phase spectra
minus250 minus200 minus150 minus100 minus50 0 50 100 150 200 250minus10
minus8minus6minus4minus2
02468
10
Quefrency (sample)
Am
plitu
de
Maximum phase (anti-causal)
Minimum phase(causal)
Figure 2 Complex cepstrum decomposition into maximum andminimum phase speech components
developed for comparing the performance with the proposedalgorithm
31 Proposed Complex Cepstrum Vocoder Based VC Theproposed algorithm is implemented in two distinct phases(i) training and (ii) transformation phase as depicted inFigure 4 In the training phase the input speech signal of thesource and target speakers are normalized and silence framesare removed The normalized speech frame is representedusing homomorphic decomposition It takes the advantagesof the logarithmic scaling and the theory of convolutionThe low time portion of the complex cepstrum can beapproximated as a vocal tract impulse response (VT) whereas high time portion of the complex cepstrum is considered
as source excitation (GE) of the speech frame The length ofthe rectangular lifter is chosen with regard to the accuracyof the vocal tract model and sampling frequency Thus thecepstrum frame is split into vocal tract impulse responseand source excitation of the speech using low time and hightime liftering respectively Even if the source and the targetspeaker utter the same sentence the length of their featurevectors may be different so dynamic time warping is used toalign these feature vectors The separate RBF based mappingfunctions are developed for modifying the cepstrum basedreal and imaginary components of the vocal tract and sourceexcitation of the source speaker according to the targetspeaker
In the transformation phase followed by training phasethe parallel utterance of the test speaker speech is prepro-cessed to derive vocal tract and source excitation feature setbased on cepstral analysis The test feature vectors are pro-jected to the trained RBF in order to obtain the transformedfeature vectors The time domain features are computed byinverse transforming complex cepstrum based parametersThe modified speech frame is reconstructed by convolvingthe transformed vocal tract and source excitationThe similarprocess is adapted for all remaining frames The overlapand add method is used to resynthesize speech from mod-ified speech frames Finally the speech quality is enhancedthrough the postfiltering applied to the modified speechFigure 4 depicts the training and testing phase details ofthe proposed approach The resynthesized speech from thecomplex cepstrum has higher perceptual quality than thespeech signal constructed from the real cepstrum
ISRN Signal Processing 5
minus150 minus100 minus50 0
Smax
(n)
Anticipative cepstrum
minus4minus2
024
n
(a)
0 50 100 150minus4minus2
024
Smin
(n)
n
Causal cepstrum
(b)
Anticipative magnitude spectrum
0
10
20
Mag
nitu
de (d
B)
0 500 1000 1500 2000 2500 3000 3500 4000f (Hz)
(c)
0 500 1000 1500 2000 2500 3000 3500 40000
10
20
Mag
nitu
de (d
B)
Causal magnitude spectrum
f (Hz)
(d)
Anticipative phase spectrum
0
5
Phas
e (ra
d)
0 500 1000 1500 2000 2500 3000 3500 4000f (Hz)
minus5
(e)
minus05
0
05Ph
ase (
rad)
Causal phase spectrum
0 500 1000 1500 2000 2500 3000 3500 4000f (Hz)
(f)
Figure 3 Anticausal and causal cepstrum with corresponding magnitude and phase spectrum
32 Baseline Mel Cepstral Envelope Vocoder Based VCFigure 5 depicts a block diagram of a VC system usingbaseline features During the analysis step the MCEPs arederived as spectral parameters and the fundamental fre-quency (119865
0) is derived as excitation parameter for every
5msec [10] As discussed in the earlier section the feature setsobtained from the source and target speakers usually differin time duration Therefore the source and target speakerrsquosutterances are aligned using DTW The feature set capturesthe joint distribution of source and target speaker using RBFto carry out VCThe excitation features (119865
0) use the cepstrum
method to calculate the pitch period for the frame size of25msec resulting into 25 MCEP features Mean and standarddeviation statistics are obtained from log(119865
0) and used as
feature set In the testing phase the parallel utterances oftest speaker are used to obtain the feature vector with theprocedure similar to that of the training set feature vector Inorder to produce transformed feature vector the test speakerfeature vector is projected through the trained RBFmodel Inthe synthesis stage the transformedMCEP and 119865
0are passed
through the MLSA [10 33 35] filter The postfiltering appliedto the transformed speech signal ensures its high quality
4 Radial Basis Function Based VC
TheRBF is used tomodel the nonlinearity between the sourceand the target speaker feature vectors [11] It is a special case
of feed forward network which nonlinearly maps input spaceto hidden space followed by a linear mapping from a hiddenspace to the output spaceThe network represents amap from1198720dimensional input space to119873
0dimensional output space
written as 119878 1198771198720rarr 119877119873
0 When a training dataset of input
output pairs [119909119896 119889119896] 119896 = 1 2 119872
0is applied to the RBF
model the mapping function 119865 is computed as
119865119896(119909) = 119908
1198950+
119898
sum
119895=1
119908119895119896Φ(10038171003817100381710038171003817119909 minus 119889119895
10038171003817100381710038171003817) (11)
where sdot is a norm usually Euclidian and computes thedistance between applied input 119909 and training data point 119889
119895
and Φ(119909 minus 119889119895) | 119895 = 1 2 119898 is the set of 119898 arbitrary
functions known as radial basis functions The commonlyconsidered form ofΦ is Gaussian function defined as
Φ (119909) = exp(1003817100381710038171003817119909 minus 120583
1003817100381710038171003817
2
21205902) (12)
RBF neural network learning process includes training andgeneralized phase The training phase constitutes the opti-mization of basis function parameters using input dataset toevaluate 119896-means algorithm in an unsupervised manner [11]In the second phase hidden-output neurons weight matrix is
6 ISRN Signal Processing
Source directory
High time
VT
GE
Real
Image
Real
Imag
e
Real
Imag
Target directoryC
ompl
ex
ceps
trum
Com
plex
ce
pstr
umC
ompl
ex
ceps
trum
Low time lifer
lifer
High time lifer
High time lifer
Low time lifer
Low time lifer
VT
GE
Real
Imag
DTW
DTWDTW
DTW
RBFRBFRBFRBF
VT
GE
Real
ImageRe
alIm
age
Test signal
Real
Imag
Real
Image
Inverse cepstrum
Postfiltering
Converted speech
Training phase
Transformation phase
GE
RBF
RBF
RBF
RBF
GE
VT
Figure 4 Functional block diagram of the complex cepstrum based VC
Conversion model
DTW
Mean and
Mean and
STDRBF
Source directory
MCEP
Windowing
Framing Target directory
MCEP
Windowing
Framing
STD
RBF
MLSA filter Postfiltering
Test signal
MCEP
Windowing
Framing Converted speech
Training mode
Testing mode Trained model
F0F0
F0
Figure 5 Block diagram of analysis and Synthesis of Mel cepstrum based VC system
optimized by the least square sense to minimize the squarederror function using the equation
119864 =1
2sum
119899
sum
119896
[119891119896((119909119899) minus (119889
119896)119899)]2
(13)
where (119889119896)119899 is desired value for 119896th output unit when input
to the network is 119909119899 The weight vector is determined as
119882 = Φ119879119863 (14)
ISRN Signal Processing 7
where Φ matrix of size (119899 times 119895)119863 matrix of size (119899 times 119896) andΦ119879 transpose of matrixΦ
(Φ119879Φ)119882 = Φ
119879119863
119882 = (Φ119879Φ)minus1
Φ119879119863
(15)
where (Φ119879Φ)minus1Φ119879 represents the pseudoinverse of matrix Φand119863 denotes the target matrix for 119889119899
119896 The weight matrix119882
can be calculated by linear inverse matrix technique and usedfor mapping between the source and target acoustic featurevectorThe exact interpolation of RBF is acquainted with twoserious problems namely (i) poor performance for noisy dataand (ii) increased computational complexityThese problemscan be addressed bymodifying two RBF parametersThe firstone is the spread factor which is calculated as
120590119895= 2 times avg 10038171003817100381710038171003817119909 minus 120583119895
10038171003817100381710038171003817 (16)
The selected spread factor confirms that the individual RBFsare neither wide nor narrow The second one is an extra biasunit which is introduced into the linear sum of activationsat the desired output layer to compensate for the differencebetween the mean over the data set of the basis functionactivations and the correspondingmean of the targetsHencewe achieve the RBF network for mapping as
119865119896(119909) =
119898
sum
119895=0
119908119895119896Φ(10038171003817100381710038171003817119909 minus 119889119895
10038171003817100381710038171003817) (17)
In this work RBF neural networks are initialized and bestnetworks are developed to obtain the mapping between thecepstral based acoustic parameters of the source and thetarget speakers The trained networks are used to predictreal and imaginary components of the vocal tract and sourceexcitation of the target speakerrsquos speech signal In the baselineapproach theMCEP based featurematrices of the source andtarget utterances with the order of 25 are formed Radial basisfunction is trained to obtain best mapping functionThe bestmapping function is obtained using RBF network and used topredict the MCEP parameters of the target speakerrsquos speechsignal
5 Experimental Results
In this paper theRBFbasedmapping functions are developedusing CMU-ARCTIC corpusThe corpus consists of differentsets of 1132 phonetically balanced parallel utterances of eachspeaker sampled at 16 kHz The corpus includes two femalethat is CLB (US Female) and SLT (US Female) and fivedifferent male such as AWB (Scottish Male) BDL (USMale)JMK (Canadian Male) RMS (US Male) and KSP (IndianMale) [36] In this work we have made use of the parallelutterances of the AWB (M1) CLB (F1) BDL (M2) and SLT(F2) with different speaker combinations like M1-F1 F2-M2M1-M2 and F1-F2 For each of the speaker pairs 50 parallelsentences of source and target speakers are used for VCsystem training and system evaluations are made using a
separate set of 25 source speaker sentences The performanceof homomorphic vocoder based VC system is compared withthe state-of-the-art MCEP based VC system using differentobjective and subjective measures
51 Objective Evaluation Theobjective measures provide themathematical analysis for determining the similarity indexand quality inspection score between desired (target) andtransformed speech signal In this work performance indexspectral distortion and formant deviation are considered asobjective measures
The performance index (119875LSF) is computed for investigat-ing the requirement of normalized error for different pairsThe spectral distortion between desired and transformedutterances 119863LSF (119889(119899) 119889(119899)) and the interspeaker spectraldistortion 119863LSF (119889(119899) 119904(119899)) are used for computing the 119875LSFmeasure In general the speaker spectral distortion betweensignals 119906 and V119863LSF (119906 V) is defined as
119863LSF (119906 V) = [
[
1
119873
119873
sum
119894=1
radic1
119875
119875
sum
119895=1
(LSF119894119895119906minus LSF119894119895V )
2]
]
(18)
where 119873 represents the number of frames 119875 refers to a LSForder and LSF119894119895
119906is the 119895th LSF component in the frame 119894The
119875LSF measure is given as
119875LSF = [1 minus119863LSF (119889 (119899) 119889 (119899))
119863LSF (119889 (119899) 119904 (119899))] (19)
The performance index 119875LSF = 1 indicates that the convertedsignal is identical to the desired one whereas 119875LSF = 1specifies that the converted signal is not at all similar to thedesired one
In the computation of the performance index four differ-ent converted samples of M1 to F1 F2 to M2 F1 to F2 andM1 to M2 combinations are considered Comparative perfor-mance between cepstrum based VC algorithm and MCEPbased VC is shown in Table 1 The results specified that theperformance of the complex cepstrum based VC performedbetter than MCEP based VC algorithm
Along with performance index the different objectivemeasures namely deviation (119863
119894) root mean square error
(RMSE) and correlation coefficients (120590119909119910
) are also cal-culated for different speaker pairs Deviation parameter isdefined as the percentage variation in the actual (119909
119896) and
predicted (119910119896) formant frequencies derived from the speech
frames It corresponds to the percentage of test frames withina specified deviation Deviation (119863
119896) is calculated as
119863119896=
1003816100381610038161003816119909119896 minus 1199101198961003816100381610038161003816
119909119896
times 100 (20)
8 ISRN Signal Processing
Table 1 The performance index of complex cepstrum based VC and MCEP based VC
Type of conversion
Performance indexSample 1 Sample 2 Sample 3 Sample 4
Cep basedVC
MCEP basedVC
Cep basedVC
MCEP basedVC
Cep basedVC
MCEP basedVC
Cep basedVC
MCEP basedVC
M1-F1 07679 06230 07483 06356 07127 06080 08350 06768F2-M2 07389 05781 07150 06988 07780 06908 07848 06845F1-F2 07921 06576 06908 05954 06740 06209 07946 06925M1-M2 07023 06490 06821 06012 06432 05801 07852 07012
Table 2 Prediction performance of MCEP based for formant frequencies
Transformation model Formant frequencies Predicted frame within deviation2 5 10 15 20 25 50 120583RMSE Υ
119883119910
M1-F1
F1 51 74 80 81 83 85 90 445 07235F2 45 63 68 78 82 87 89 373 08182F3 57 62 79 86 87 89 92 334 08703F4 69 79 84 89 88 90 100 239 08629
F2-M2
F1 36 58 67 74 82 86 90 428 07190F2 57 82 86 87 87 89 91 630 07238F3 72 77 89 91 92 94 95 523 07474F4 66 74 89 90 93 95 100 491 07957
The root mean square error is calculated as percentage ofaverage of desired formant values obtained from the speechsegments
120583RMSE =radicsum119896
1003816100381610038161003816119909119896 minus 1199101198961003816100381610038161003816
2
119909times 100
120590 = radicsum
119896
1198892
119896 119889119896= 119890119896minus 120583
119890119896= 119909119896minus 119910119896 120583 =
sum119896
1003816100381610038161003816119909119896 minus 1199101198961003816100381610038161003816
119873
(21)
The error 119890119896is the difference between the actual and predicted
formant values119873 is the number of observed formant valuesof speech frames The parameter 119889
119896is the error in the
deviation The correlation coefficient Υ119883119910
is the parameterwhich is to be determined from the covariance COV(119883 119884)between the target (119909) and the predicted (119910) formant valuesand the standard deviations 120590
119883 120590119884of the target and the
predicted formant values respectively The parameters Υ119883119910
and COV(119883 119884) are calculated using
Υ119883119910=COV (119883 119884)120590119883120590119884
COV (119883 119884) =sum119896
1003816100381610038161003816(119909119896 minus 119909) (119910119896 minus 119910)1003816100381610038161003816
119873
(22)
The objective measures namely deviation (119863119894) root mean
square error (RMSE) and correlation coefficients (Υ119883119910)
of M1-F1 and F2-M2 are obtained for MCEP based VCalgorithm and shown in Table 2 Similarly the Table 3 shows
the measures obtained for proposed VC system From thetables it can be observed that the 120583RMSE between the desiredand the predicted acoustic space parameters for proposedmodel are less than the baseline model However every timeRMSE does not give strong information about the spectraldistortion Consequently scatter plots and spectral distortionare employed additionally as objective evaluation measuresThe scatter plots for first second third and fourth formantfrequencies for MCEP based VC and complex cepstrumbased VC models are shown in Figures 6 and 7 respec-tively Figures show that complex cepstrum VC based vocaltract envelope in term of predicted formants closely orienttowards the desired speech frames formants as comparedto MCEP based predicted formants The clusters obtainedusing complex cepstrum based VC are more compact anddiagonally oriented than that using MCEP based VC Asperfect prediction means all the data points in scatter plotare diagonally oriented in right side The compact clustersobtained for proposed method implies its ability to capturethe formant structure of desired speaker
The transformed formant patterns for a specific frameof source and target speech signal are obtained using bothcomplex cepstrum and MCEP based VC models and shownin Figures 8(a) and 8(b) respectively Figure 8(a) depictsthat the patterns of particular target signal closely followsthe corresponding transformed signal whereas Figure 8(b)shows that the predicted formant pattern closely follows thetarget pattern only for lower formants
Figure 9(a) shows the normalized frequency spectrogramof desired and transformed speech signals obtained fromM1to F1 and F2 to M2 of complex cepstrum based VC modelSimilarly Figure 9(b) shows the spectrogram forM1 to F1 and
ISRN Signal Processing 9
Table 3 Prediction performance of complex cepstrum based for formant frequencies
Transformation model Formant frequencies Predicted frame within deviation2 5 10 15 20 25 50 120583RMSE Υ
119883119910
M1-F1
F1 59 80 89 91 91 93 95 445 07197F2 52 72 85 88 91 92 95 355 08149F3 63 83 90 92 93 95 99 265 08837F4 72 86 91 93 95 97 100 2049 08909
F2-M2
F1 38 60 71 78 80 86 90 856 0757F2 60 82 89 92 92 93 98 362 0790F3 72 87 92 95 95 95 100 293 0778F4 70 86 91 96 97 99 100 241 0756
0200 400 600 8000
200
400
600
800
Desired formants (Hz)
Pred
icte
d fo
rman
ts (H
z)
(a)
500 1000 1500
500
1000
1500
Desired formants (Hz)
Pred
icte
d fo
rman
ts (H
z)
(b)
Desired formants (Hz)
Pred
icte
d fo
rman
ts (H
z)
1000 1500 2000 25001000
1500
2000
2500
(c)
Desired formants (Hz)
Pred
icte
d fo
rman
ts (H
z)
2000 2500 3000 3500 40002000
2500
3000
3500
4000
(d)
Figure 6 Desired and predicted formant frequencies for F2 to M2 VC using MCEP based approach (a) first formant (b) second formant(c) third formant and (d) fourth formant
F2 toM2 for theMCEP basedVCmodel It has been observedthat the dynamics of the first three formant frequencies inboth the algorithms are closely followed in the target and thetransformed speech samples
52 Subjective Evaluation The effectiveness of the algorithmis also evaluated using listening tests These subjective tests
are used to determine the closeness between the trans-formed and target speech sampleThemapping functions aredeveloped using 50 parallel utterances of the source andtarget speakers Twenty-five different synthesized speechutterances are obtained from the mapping function for inter-and intragender speech conversion and corresponding targetutterances are presented to twelve listenersThey are asked to
10 ISRN Signal Processing
0200 400 600 8000
200
400
600
800
Desired formants (Hz)
Pred
icte
d fo
rman
ts (H
z)
(a)
500 1000 1500
500
1000
1500
Desired formants (Hz)
Pred
icte
d fo
rman
ts (H
z)
(b)
Desired formants (Hz)
Pred
icte
d fo
rman
ts (H
z)
1000 1500 2000 25001000
1500
2000
2500
(c)
Desired formants (Hz)
Pred
icte
d fo
rman
ts (H
z)
2000 3000 40002000
2500
3000
3500
4000
(d)
Figure 7Desired and predicted formant frequencies for F2 toM2VCusing the complex cepstrumbased (a) first formant (b) second formant(c) third formant and (d) fourth formant
minus60
minus50
minus40
minus30
minus20
minus10
0
Mag
nitu
de (d
B)
DesiredProposed
0 20 40 60 80 100 120 140Frequency (Hz)
(a)
0 20 40 60 80 100 120 140minus70minus60minus50minus40minus30minus20minus10
010
Frequency (Hz)
Mag
nitu
de (d
B)
DesiredMcep based
(b)
Figure 8 Target and transformed spectral envelopes of the desired speaker using (a) complex cepstrum based VC and (b) MCEP based VC
ISRN Signal Processing 11
Time
Nor
mal
ised
frequ
ency
05 1 15 2 250
05
1
times104 Time
Nor
mal
ised
frequ
ency
05 1 15 2 250
05
1
times104
Time
Nor
mal
ised
frequ
ency
05 1 15 20
05
1
times104 Time
Nor
mal
ised
frequ
ency
05 1 15 20
05
1
times104
(A) (B)
(C) (D)
(a)
Time
Nor
mal
ised
frequ
ency
05 1 15 2 250
05
1
times104
(A) (B)Time
Nor
mal
ised
frequ
ency
05 1 15 2 250
05
1
times104
Time
Nor
mal
ised
frequ
ency
05 1 15 20
05
1
times104Time
Nor
mal
ised
frequ
ency
05 1 15 20
05
1
times104
(C) (D)
(b)
Figure 9 Spectrogram of the desired and the transformed signal for M1 to F1 ((A) to (C)) and F2 to M2 ((B) to (D)) using (a) complexcepstrum based VC and (b) MCEP based VC
12 ISRN Signal Processing
Table 4 MOS and ABX evaluations of complex cepstrum andMCEP based VC models
Conversiondata
MOS ABXCepstrumbased
MCEPbased
Cepstrumbased
MCEPbased
M1-F1 464 431 455 425F2-M1 418 392 434 423M1-M2 407 388 419 406F1-F2 424 376 436 413
evaluate their relative performance in term of voice quality(MOS) and speaker identity (ABX) with correspondingsource and target speaker speech samples on a scale of 1to 5 where rating 5 specifies an excellent match betweenthe transformed and target utterances rating 1 indicates apoor match and the other ratings indicate different levels ofvariation between 1 and 5 The ratings given to each set ofutterances are used to calculate theMOS for different speakercombinations like M1 to F1 M1 to M2 F1 to F2 and F2 toM2 the results are presented in Table 4 The dissimilarity inthe length of the vocal tract and the intonation patterns ofdifferent genders is themajor reason for variation in theMOSresults for source and target utterances of different gendersTheABX (A Source B Target X Transformed speech signal)test is also performed using the same set of utterances andspeakers In the ABX test the listeners are asked to judgewhether the unknown speech sample X sounds closer tothe reference sample A or B The ABX is a measure ofidentity transformationThe higher value of ABX percentageindicates that the transformed speech lies in close proximityof the target utterance The results of the ABX test are alsoshown in Table 4
6 Conclusion
The VC algorithm comprising of complex cepstrum thatpreserves the phase related information content of the syn-thesized speech outcome is presented Amixed phase systemis designed to yield far better transformed speech signal thanthe minimum phase systems The vocal tract and excitationparameters of the speech signal are obtained with the helpof low and high time liftering Radial basis functions areexplored to capture the nonlinear mapping function formodifying the real and imaginary parts of the vocal tractand source excitations of the source speaker speech to that ofthe target speaker speech In baseline VC algorithm MCEPmethod is used to interpret the vocal tract whereas the fun-damental frequency (119865
0) represent the source excitation
The RBF based mapping function is used to capture thenonlinear relationship between the MCEP of the sourcespeaker to that of the target speaker and statistical mean andstandard deviation is used for transformation of fundamentalfrequency The proposed complex cepstrum based VC iscompared with the MCEP based VC using various objectiveand subjectivemeasuresThe evaluation results reveal that thecomplex cepstrumbasedVCperforms slightly better than the
MCEP basedVCmodel in term of speech quality and speakeridentity The reason may be the fluctuation of MLSA filterparameters with limited margins in Pade approximation Itmay be unstable momentarily when the parameters varyrapidly by contrast the complex cepstrum with finite impulseresponse is always stable
Conflict of Interests
The authors declare that there is no conflict of interestsregarding the publication of this paper
References
[1] HKuwabara andY Sagisak ldquoAcoustic characteristics of speakerindividuality control and conversionrdquo Speech Communicationvol 16 no 2 pp 165ndash173 1995
[2] K-S Lee ldquoStatistical approach for voice personality transfor-mationrdquo IEEE Transactions on Audio Speech and LanguageProcessing vol 15 no 2 pp 641ndash651 2007
[3] A Kain and M W Macon ldquoDesign and evaluation of a voiceconversion algorithm based on spectral envelope mapping andresidual predictionrdquo in Proceedings of the IEEE InterntionalConference onAcoustics Speech and Signal Processing vol 2 pp813ndash816 May 2001
[4] D Sundermann ldquoVoice conversion state-of-the-art and futureworkrdquo in Proceedings of the 31st German Annual Conference onAcoustics (DAGA rsquo01) Munich Germany 2001
[5] DGChilders B Yegnanarayana andWKe ldquoVoice conversionfactors responsible for qualityrdquo in Proceeding of the IEEE Inter-national Conference on Acoustics Speech and Signal Processing(ICASSP rsquo85) vol 1 pp 748ndash751 Tampa Fla USA 1985
[6] MAbe S Nakanura K Shikano andHKuwabara ldquoVoice con-version through vector quantizationrdquo in Proceeding of the IEEEInternational Conference on Acoustics Speech and Signal Pro-cessing pp 655ndash658 1988
[7] W Verhelst and J Mertens ldquoVoice conversion using partitionsof spectra feature spacerdquo inProceedings of the IEEE InternationalConference on Acoustics Speech and Signal Processing (ICASSPrsquo96) pp 365ndash368 May 1996
[8] N Iwahashi and Y Sagisaka ldquoSpeech spectrum conversionbased on speaker interpolation and multi-functional represen-tation with weighting by radial basis function networksrdquo SpeechCommunication vol 16 no 2 pp 139ndash151 1995
[9] Y Stylianou O Cappe and E Moulines ldquoContinuous proba-bilistic transform for voice conversionrdquo IEEE Transactions onSpeech and Audio Processing vol 6 no 2 pp 131ndash142 1998
[10] S Desai A W Black B Yegnanarayana and K PrahalladldquoSpectral mapping using artificial neural networks for voiceconversionrdquo IEEE Transactions on Audio Speech and LanguageProcessing vol 18 no 5 pp 954ndash964 2010
[11] C Orphanidou I M Moroz and S J Roberts ldquoWavelet-basedvoice morphingrdquo WSEAS Journal of Systems vol 10 no 3 pp3297ndash3302 2004
[12] E Helander T Virtanen N Jani and M Gabbouj ldquoVoice con-version using partial least squares regressionrdquo IEEE TranscationonAudio Speech Language Processing vol 18 no 5 pp 912ndash9212010
[13] LMArslan ldquoSpeaker transformation algorithmusing segmen-tal codebooks (STASC)rdquo Speech Communication vol 28 no 3pp 211ndash226 1999
ISRN Signal Processing 13
[14] K S Rao ldquoVoice conversion by mapping the speaker-specificfeatures using pitch synchronous approachrdquo Computer Speechand Language vol 24 no 3 pp 474ndash494 2010
[15] S Hayakawa and F Itakura ldquoText-dependent speaker recogni-tion using the information in the higher frequency bandrdquo inProceedings of the International Conference on Acoustics Speechand Signal Processing (ICASSP rsquo94) pp 137ndash140 Adelaide Aus-tralia 1994
[16] H Kawahara I Masuda-Katsuse and A de CheveigneldquoRestructuring speech representations using a pitch-adaptivetime-frequency smoothing and an instantaneous-frequency-based F0 extraction possible role of a repetitive structure insoundsrdquo Speech Communication vol 27 no 3 pp 187ndash207 1999
[17] R J McAulay and T F Quatieri ldquoPhasemodelling and its appli-cation to sinusoidal transform codingrdquo in Proceedings of theIEEE International Conference on Acoustics Speech and SignalProcessing (ICASSP rsquo86) vol 1 pp 1713ndash1716 Tokyo Japan 1986
[18] J Nirmal P Kachare S Patnaik and M Zaveri ldquoCepstrumliftering based voice conversion using RBF and GMMrdquo inProceedings of the IEEE International Conference on Commu-nications and Signal Processing (ICCSP rsquo13) pp 570ndash575 April2013
[19] A V Oppenheim ldquoSpeech analysis and synthesis system basedon homomorphic filteringrdquoThe Journal of the Acoustical Societyof America vol 45 no 2 pp 458ndash465 1969
[20] W Verhelst and O Steenhaut ldquoA new model for the short-time complex cepstrum of voiced speechrdquo IEEE Transactions onAcoustics Speech and Signal Processing vol 34 no 1 pp 43ndash511986
[21] H Deng R K Ward M P Beddoes and M Hodgson ldquoA newmethod for obtaining accurate estimates of vocal-tract filtersand glottal waves from vowel soundsrdquo IEEE Transactions onAudio Speech and Language Processing vol 14 no 2 pp 445ndash455 2006
[22] T Drugman B Bozkurt and T Dutoit ldquoComplex cepstrum-based decomposition of speech for glottal source estimationrdquoin Proceedings of the 10th Annual Conference of the InternationalSpeech Communication Association (INTERSPEECH rsquo09) pp116ndash119 Brighton UK September 2009
[23] T F Quatieri Jr ldquoMinimum and mixed phase speech analysis-synthesis by adaptive homomorphic deconvolutionrdquo IEEETransactions on Acoustics Speech and Signal Processing vol 27no 4 pp 328ndash335 1979
[24] T Drugman B Bozkurt and T Dutoit ldquoCausal-anticausaldecomposition of speech using complex cepstrum for glottalsource estimationrdquo Speech Communication vol 53 no 6 pp855ndash866 2011
[25] M Vondra and R Vıch ldquoSpeechmodeling using the complexcepstrumrdquo in Toward Autonomous Adaptive and Context-Aware Ultimodal InterfacesTheoretical and Practical Issues vol6456 of Lecture Notes in Computer Science pp 324ndash330 2011
[26] R Maia M Akamine and M Gales ldquoComplex cepstrum asphase information in statistical parametric speech synthesisrdquo inProceedings of the IEEE International Conference on AcousticsSpeech and Signal Processing (ICASSP rsquo12) pp 4581ndash4584 2012
[27] K Shikano S Nakamura andM Abe ldquoSpeaker adaptation andvoice conversion by codebook mappingrdquo in Proceedings of theIEEE International Symposium onCircuits and Systems pp 594ndash597 June 1991
[28] T Toda H Saruwatari and K Shikano ldquoVoice conversion algo-rithm based on Gaussian mixture model with dynamic fre-quencywarping of straight spectrumrdquo inProceedings of the IEEE
Interntional Conference on Acoustics Speech and Signal Process-ing pp 841ndash844 May 2001
[29] H Ye and S Young ldquoHigh quality voice morphingrdquo in Proceed-ings of the IEEE International Conference on Acoustics Speechand Signal Processing pp I9ndashI12 May 2004
[30] R Laskar K Banerjee F Talukdar and K Sreenivasa Rao ldquoApitch synchronous approach to design voice conversion systemusing source-filter correlationrdquo International Journal of SpeechTechnology vol 15 pp 419ndash431 2012
[31] D Sundermann A Bonafonte H Ney and H Hoge ldquoA studyon residual prediction techniques for voice conversionrdquo inProceedings of the IEEE International Conference on AcousticsSpeech and Signal Processing (ICASSP rsquo05) pp I13ndashI16 March2005
[32] K S Rao R H Laskar and S G Koolagudi ldquoVoice transfor-mation by mapping the features at syllable levelrdquo in PatternRecognition and Machine Intelligence vol 4815 of Lecture Notesin Computer Science pp 479ndash486 Springer 2007
[33] httpsp-tksourceforgenet[34] S Imai ldquoCepstral analysis and synthesis on the mel-frequency
scalerdquo in Proceedings of the IEEE International Conference onAcoustics Speech and Signal Processing (ICASSP rsquo83) pp 93ndash96Boston Mass USA 1983
[35] K Tokuda T Kobayashi T Masuko and S Imai ldquoMel-gener-alized cepstral analysismdasha unified approach to speech spectralestimationrdquo in Proceedings of the International Conference onSpoken Language Processing (ICSLP rsquo94) pp 1043ndash1046 1994
[36] J Kominek and AW Black ldquoCMUARCTIC speech databasesrdquoin Proceedings of the 5th ISCA Speech Synthesis Workshop pp223ndash224 Pittsburgh Pa USA June 2004
Submit your manuscripts athttpwwwhindawicom
VLSI Design
Hindawi Publishing Corporationhttpwwwhindawicom Volume 2014
International Journal of
RotatingMachinery
Hindawi Publishing Corporationhttpwwwhindawicom Volume 2014
Hindawi Publishing Corporation httpwwwhindawicom
Journal ofEngineeringVolume 2014
Hindawi Publishing Corporationhttpwwwhindawicom Volume 2014
Shock and Vibration
Hindawi Publishing Corporationhttpwwwhindawicom Volume 2014
Mechanical Engineering
Advances in
Hindawi Publishing Corporationhttpwwwhindawicom Volume 2014
Civil EngineeringAdvances in
Acoustics and VibrationAdvances in
Hindawi Publishing Corporationhttpwwwhindawicom Volume 2014
Hindawi Publishing Corporationhttpwwwhindawicom Volume 2014
Electrical and Computer Engineering
Journal of
Hindawi Publishing Corporationhttpwwwhindawicom Volume 2014
Distributed Sensor Networks
International Journal of
The Scientific World JournalHindawi Publishing Corporation httpwwwhindawicom Volume 2014
SensorsJournal of
Hindawi Publishing Corporationhttpwwwhindawicom Volume 2014
Modelling amp Simulation in EngineeringHindawi Publishing Corporation httpwwwhindawicom Volume 2014
Hindawi Publishing Corporationhttpwwwhindawicom Volume 2014
Active and Passive Electronic Components
Hindawi Publishing Corporationhttpwwwhindawicom Volume 2014
Chemical EngineeringInternational Journal of
Control Scienceand Engineering
Journal of
Hindawi Publishing Corporationhttpwwwhindawicom Volume 2014
Antennas andPropagation
International Journal of
Hindawi Publishing Corporationhttpwwwhindawicom Volume 2014
Hindawi Publishing Corporationhttpwwwhindawicom Volume 2014
Navigation and Observation
International Journal of
Advances inOptoElectronics
Hindawi Publishing Corporation httpwwwhindawicom
Volume 2014
RoboticsJournal of
Hindawi Publishing Corporationhttpwwwhindawicom Volume 2014

2 ISRN Signal Processing
for real time applications Another approach using Mel Fre-quency Cepstrum Coefficients (MFCC) have been proposed[17] which properly model both spectral peaks and valleysHowever the main toil of MFCC synthesis is to loose pitchand phase related information [17]
The conventional parametric speech production modellike LPC real cepstrum [18ndash20] and Liljencrants-Fant (LF)[21] models is based on minimum phase model with infiniteimpulse response [22] In fact a completely different categoryof glottal flow estimation relies on the mixed-phase modelof speech [22 23] According to this estimation the speechsignal is composed of both maximum (ie anticausal) andminimum phase (ie causal) components The return phaseof the glottal pulse components and vocal tract impulseresponse is part of minimum phase signals whereas the openphase of the glottal flow is considered as maximum phaseof the signal [24] It has been shown in the literature thatthe mixed phase models are appropriate for representing thevoiced speech [25] The real cepstrum with minimum phasediscards the glottal flow information of speech However thecomplex cepstrum incorporates phase as glottal pulse infor-mation during speech synthesis [25] The complex cepstrumrepresentation of the speech signal allows noncasual model-ing of short time speech frame which is actually observed innatural speech [22ndash24] Complex cepstrum perform well inspeech synthesis and speech modeling [25 26]
For the development of appropriate transformationmodel various mapping functions have been proposed inthe literature such as Vector Quantization (VQ) based code-book mapping [6] and Gaussian Mixture Model (GMM)based transformation models [3 9 10] Fuzzy vector quan-tization [27] and a Speaker Transformation Algorithm usingSegmental Code-book (STASC) have been proposed toovercome limitations of VQ based model [14] In additionDynamic Frequency Warping (DFW) [28] have also beenused for transformation of the spectral envelope The GMMoversmoothing issue is resolved via maximum likelihoodestimators and hybrid methods [29] The dynamic kernelpartial least square regression technique has also implied[12] for spectral transformation In fact the relation betweenthe shapes of the vocal tracts of the different speakers arehighly nonlinear to capture this nonlinearity between thevocal tracts artificial neural network has been explored in theliterature [10 11 14 18 30]
In addition to vocal tract the source excitation containsvital speaker-specific characteristics [1 3] so it is necessary toproperly modify the excitation signal to accurately synthesizethe target speakerrsquos voice [4] Very few methods have beendiscussed in the literature for excitation signal transformationsuch as residual copying but the converted sound seems tobe a third speakerrsquos voice [31] another method is residualprediction [3]However it has the problemof over smoothen-ing In order to alleviate the over smoothening problem ofresidual prediction residual selection method unit selectionmethod [31] and combination of residual selection and unitselection have been also explored in the literature [32] TheArtificial Neural Network model has also applied to modifythe residual signal but time domain residual transformation
loses the correlation in the speech production model whichleads to distortion in speech signal [12]
In this paper the prominent complex cepstrum vocoderis employed to model the vocal tract and source excitation ofthe speech The low time and high time lifters are designedto separate the complex cepstrum into vocal tract and sourceexcitation parameters with real and imaginary componentsThe reasons behind the use of radial basis function (RBF)based the transformation model are its fast training abilitydesirable computational efficiency and interpolation prop-erty The RBF based mapping function are trained separatelyto capture the nonlinear relations for modifying the real andthe imaginary components of cepstrum based vocal tractand source excitation of the source speaker to that of thetarget speaker utterancersquos Similarly the MCEP parametersof source speakerrsquos utterances are also modified according tothe target speakerrsquos utterances using RBF The fundamentalfrequency between source and target speakerrsquos utterances ismodified using mean and standard deviation approach [10]Mel log spectral approximation (MLSA) filter [33] is usedto reconstruct the speech signal from modified MCEP andfundamental (119865
0)
Finally the performance of the proposed complex cep-strum based VC approach is compared with MCEP [34]basedVC approachThis is done using various objectivemea-sures such as a performance index (119875LSF) [3] formant devia-tion [14 30] and spectral distortion [14]The commonly usedsubjective measures such as Mean Opinion Score (MOS) andABX verify the quality and speaker identity of the convertedspeech signal
This paper is organized as follows Section 2 describes thecomplex cepstrumanalysiswith low time andhigh time lifterswhich are used to extract the cepstrum based features of thevocal tract and excitation based signals Section 3 explainsthe proposed VC system based on complex cepstrum and thestate-of-the-art MCEP based VC system Radial basis basedspectral mapping is described in Section 4The experimentalenvironment database and objective measures such asperformance index formant deviation spectrograph and theperceptual tests namely Mean Opinion Score (MOS) andABX conducted with different human listeners are presentedin Section 5 The last Section gives the overall conclusions ofthe paper
2 Complex Cepstrum Analysis
According to the source-filter model of the human speechproduction system the source signal excites the vocal tractand it generates the speech signal The human speech is two-sided real and asymmetrical in nature Hence a mixed phaseFinite Impulse Response (FIR) systemmay be realized whichpreserves the phase related information to givemore accuratesynthesized speech From the signal processing point of viewthe short time speech signal 119904(119899) can be considered as linearconvolution of the source excitation 119892(119899) with the impulsefunction of the vocal tract V(119899) It can be defined as follows
119904 (119899) = V (119899) lowast 119892 (119899) (1)
ISRN Signal Processing 3
By applying DTFT to the speech signal we obtain
119878 (120596) =
119872
sum
119899=minus119872
119904 (119899) 119890minus119895120596119899 (2)
where119872 is the order of cepstrum that is number of one sidedfrequenciesThe time domain convolution can bemodeled asspectral multiplication of the vocal tract filter response 119881(120596)and source excitation response 119866(120596) giving the short timespeech spectrum 119878(120596) as shown
119878 (120596) = 119881 (120596)119866 (120596) (3)
Cepstral analysis includes transforming themultiplied sourceexcitation and vocal tract responses in the frequency domaininto linear combination of the two components in the cepstraldomain The analysis of the speech signal needs to separatetwo components 119881(120596) and 119866(120596) In frequency domainlogarithmic representation is used to linearly combine thecomponents119881(120596) and119866(120596)The complex spectrum 119878(120596) canbe rewritten by performing logarithmic compression
119878 (120596) = log 119878 (120596) (4)
Therefore the log spectrum is further separated into two parts
log 119878 (120596) = log119881 (120596) + log119866 (120596) (5)
Thus the log spectrum can be decomposed as addition ofmagnitude and phase components
119878 (120596) = log |119878 (120596)| + 119895 arg 119878 (120596) (6)
The imaginary part of the logarithmic spectrum is theunwrapped phase sequence [23] Thus phase information isno more ignored giving rise to a complex cepstrum Hencecomprising of a mixed phase system with a finite impulseresponse (FIR) type which is stable The cepstrum is definedas
119888 (119899) =1
2120587int
120587
minus120587
119878 (120596) 119890119895120596119899119889120596 (7)
where 119888(119899) can be given as
119888 (119899) =1
2120587int
120587
minus120587
log |119878 (120596)| 119890119895120596119899119889120596
+1
2120587int
120587
minus120587
119890119895(120596+arg(119878(120596)))119899
119889120596
(8)
The log spectral components that vary rapidly with frequency120596 are denoted as a high time component log119866(120596) and thelog spectral components that slowly with frequency 120596 aredesignated as a low time component log119881(120596) [20] Here 119888(119899)is time aliased version therefore 119872 gt 119873 condition avoidsaliasing effect119873 is total number of cepstrum samples
Consider
119897119897 (119899) =
1 0 le 119899 lt 119871119888
0 119871119888ge 119899 le 119873
119888V (119899) = 119897119897 (119899) 119888 (119899)
119897ℎ(119899) =
1 119871119888le 119899 le 119873
0 elsewhere
119888119890(119899) = 119897
ℎ(119899) 119888 (119899)
(9)
where the 119888(119899) represents complex cepstrum of speech frame119897119897(119899) is low time lifter 119897
ℎ(119899) is high time lifter In the de-
convolution stage an appropriate value of lifter index 119871119888is
chosen to separate the two components namely the fastchanging excitation parameter 119888
119890(119899) and the slowly changing
parameters that is vocal tract parameter 119888V(119899) The win-dowed signal the complex cepstrum with magnitude andphase spectra are shown in Figure 1 The coefficient 119888(0) isthe speech signal energy and the coefficients 119888(119899) for 119899 ge1 signifies the magnitude and phase at the quefrency 119899 inthe spectrum The vocal tract cepstrum 119888V(119899) has coefficientswith significant magnitudes at lower values of 119899 and sourceexcitation cepstrum 119888
119890(119899) has relatively lower magnitude
coefficients for higher values of 119899 Theoretically the complexcepstrum being a mixed phase results in a more accuratemodel of the speech signal when compared to the minimumphase synthesis filter approach which discard the glottal flowinformation content in the cepstrum [18] The cepstrumvalues lower than zero represents the maximum phase (ieanticausal) response whereas the values above zero can beconsidered as the minimum phase (ie causal) response areshown in Figure 2 Mathematically it can be modeled as
Minimum Phase = 119888min (119899)
=
0 119899 = minus119872 minus2 minus1
119888 (119899) 119899 = 0
119888 (119899) + 119888 (minus119899) 119899 = 1 2 119872
Maximum Phase = 119888max (119899) = 119888 (119899) minus 119888min (119899)
119888max (119899) =
119888 (119899) 119899 = minus119872 minus2 minus1
0 119899 = 0
minus119888 (minus119899) 119899 = 1 2 119872
(10)
The anticausal and casual cepstrum parts with the cor-responding magnitude and phase spectrum are shown inFigure 3 It has been observed that the logarithmic compres-sion involved in the cepstrum analysis helps in obtaining themixed phase response for both voiced as well as unvoicedsignals
3 Voice Conversion Framework
In this section the complex cepstrum based VC algorithmis proposed The MCEP-MLSA based VC algorithm is also
4 ISRN Signal Processing
0 20 40 60 80 100 120minus1
minus05
0
05
1
n
s(n)120596
(n)
(a) Speech frame and window
0 1000 2000 3000 4000 5000 6000 7000 8000minus20
minus10
0
10
20
30
40
Mag
nitu
de (d
B)
f (Hz)
(b) Mag spectrum
minus150 minus100 minus50 0 50 100 150minus4
minus2
0
2
4
n
Cep
strum
(c) Complex cepstrum
0 1000 2000 3000 4000 5000 6000 7000 8000minus4
minus2
0
2
4
Phas
e (ra
d)
f (Hz)
(d) Phase spectrum
Figure 1 (a) Speech frame and window (b) magnitude spectra (c) complex cepstrum and (d) phase spectra
minus250 minus200 minus150 minus100 minus50 0 50 100 150 200 250minus10
minus8minus6minus4minus2
02468
10
Quefrency (sample)
Am
plitu
de
Maximum phase (anti-causal)
Minimum phase(causal)
Figure 2 Complex cepstrum decomposition into maximum andminimum phase speech components
developed for comparing the performance with the proposedalgorithm
31 Proposed Complex Cepstrum Vocoder Based VC Theproposed algorithm is implemented in two distinct phases(i) training and (ii) transformation phase as depicted inFigure 4 In the training phase the input speech signal of thesource and target speakers are normalized and silence framesare removed The normalized speech frame is representedusing homomorphic decomposition It takes the advantagesof the logarithmic scaling and the theory of convolutionThe low time portion of the complex cepstrum can beapproximated as a vocal tract impulse response (VT) whereas high time portion of the complex cepstrum is considered
as source excitation (GE) of the speech frame The length ofthe rectangular lifter is chosen with regard to the accuracyof the vocal tract model and sampling frequency Thus thecepstrum frame is split into vocal tract impulse responseand source excitation of the speech using low time and hightime liftering respectively Even if the source and the targetspeaker utter the same sentence the length of their featurevectors may be different so dynamic time warping is used toalign these feature vectors The separate RBF based mappingfunctions are developed for modifying the cepstrum basedreal and imaginary components of the vocal tract and sourceexcitation of the source speaker according to the targetspeaker
In the transformation phase followed by training phasethe parallel utterance of the test speaker speech is prepro-cessed to derive vocal tract and source excitation feature setbased on cepstral analysis The test feature vectors are pro-jected to the trained RBF in order to obtain the transformedfeature vectors The time domain features are computed byinverse transforming complex cepstrum based parametersThe modified speech frame is reconstructed by convolvingthe transformed vocal tract and source excitationThe similarprocess is adapted for all remaining frames The overlapand add method is used to resynthesize speech from mod-ified speech frames Finally the speech quality is enhancedthrough the postfiltering applied to the modified speechFigure 4 depicts the training and testing phase details ofthe proposed approach The resynthesized speech from thecomplex cepstrum has higher perceptual quality than thespeech signal constructed from the real cepstrum
ISRN Signal Processing 5
minus150 minus100 minus50 0
Smax
(n)
Anticipative cepstrum
minus4minus2
024
n
(a)
0 50 100 150minus4minus2
024
Smin
(n)
n
Causal cepstrum
(b)
Anticipative magnitude spectrum
0
10
20
Mag
nitu
de (d
B)
0 500 1000 1500 2000 2500 3000 3500 4000f (Hz)
(c)
0 500 1000 1500 2000 2500 3000 3500 40000
10
20
Mag
nitu
de (d
B)
Causal magnitude spectrum
f (Hz)
(d)
Anticipative phase spectrum
0
5
Phas
e (ra
d)
0 500 1000 1500 2000 2500 3000 3500 4000f (Hz)
minus5
(e)
minus05
0
05Ph
ase (
rad)
Causal phase spectrum
0 500 1000 1500 2000 2500 3000 3500 4000f (Hz)
(f)
Figure 3 Anticausal and causal cepstrum with corresponding magnitude and phase spectrum
32 Baseline Mel Cepstral Envelope Vocoder Based VCFigure 5 depicts a block diagram of a VC system usingbaseline features During the analysis step the MCEPs arederived as spectral parameters and the fundamental fre-quency (119865
0) is derived as excitation parameter for every
5msec [10] As discussed in the earlier section the feature setsobtained from the source and target speakers usually differin time duration Therefore the source and target speakerrsquosutterances are aligned using DTW The feature set capturesthe joint distribution of source and target speaker using RBFto carry out VCThe excitation features (119865
0) use the cepstrum
method to calculate the pitch period for the frame size of25msec resulting into 25 MCEP features Mean and standarddeviation statistics are obtained from log(119865
0) and used as
feature set In the testing phase the parallel utterances oftest speaker are used to obtain the feature vector with theprocedure similar to that of the training set feature vector Inorder to produce transformed feature vector the test speakerfeature vector is projected through the trained RBFmodel Inthe synthesis stage the transformedMCEP and 119865
0are passed
through the MLSA [10 33 35] filter The postfiltering appliedto the transformed speech signal ensures its high quality
4 Radial Basis Function Based VC
TheRBF is used tomodel the nonlinearity between the sourceand the target speaker feature vectors [11] It is a special case
of feed forward network which nonlinearly maps input spaceto hidden space followed by a linear mapping from a hiddenspace to the output spaceThe network represents amap from1198720dimensional input space to119873
0dimensional output space
written as 119878 1198771198720rarr 119877119873
0 When a training dataset of input
output pairs [119909119896 119889119896] 119896 = 1 2 119872
0is applied to the RBF
model the mapping function 119865 is computed as
119865119896(119909) = 119908
1198950+
119898
sum
119895=1
119908119895119896Φ(10038171003817100381710038171003817119909 minus 119889119895
10038171003817100381710038171003817) (11)
where sdot is a norm usually Euclidian and computes thedistance between applied input 119909 and training data point 119889
119895
and Φ(119909 minus 119889119895) | 119895 = 1 2 119898 is the set of 119898 arbitrary
functions known as radial basis functions The commonlyconsidered form ofΦ is Gaussian function defined as
Φ (119909) = exp(1003817100381710038171003817119909 minus 120583
1003817100381710038171003817
2
21205902) (12)
RBF neural network learning process includes training andgeneralized phase The training phase constitutes the opti-mization of basis function parameters using input dataset toevaluate 119896-means algorithm in an unsupervised manner [11]In the second phase hidden-output neurons weight matrix is
6 ISRN Signal Processing
Source directory
High time
VT
GE
Real
Image
Real
Imag
e
Real
Imag
Target directoryC
ompl
ex
ceps
trum
Com
plex
ce
pstr
umC
ompl
ex
ceps
trum
Low time lifer
lifer
High time lifer
High time lifer
Low time lifer
Low time lifer
VT
GE
Real
Imag
DTW
DTWDTW
DTW
RBFRBFRBFRBF
VT
GE
Real
ImageRe
alIm
age
Test signal
Real
Imag
Real
Image
Inverse cepstrum
Postfiltering
Converted speech
Training phase
Transformation phase
GE
RBF
RBF
RBF
RBF
GE
VT
Figure 4 Functional block diagram of the complex cepstrum based VC
Conversion model
DTW
Mean and
Mean and
STDRBF
Source directory
MCEP
Windowing
Framing Target directory
MCEP
Windowing
Framing
STD
RBF
MLSA filter Postfiltering
Test signal
MCEP
Windowing
Framing Converted speech
Training mode
Testing mode Trained model
F0F0
F0
Figure 5 Block diagram of analysis and Synthesis of Mel cepstrum based VC system
optimized by the least square sense to minimize the squarederror function using the equation
119864 =1
2sum
119899
sum
119896
[119891119896((119909119899) minus (119889
119896)119899)]2
(13)
where (119889119896)119899 is desired value for 119896th output unit when input
to the network is 119909119899 The weight vector is determined as
119882 = Φ119879119863 (14)
ISRN Signal Processing 7
where Φ matrix of size (119899 times 119895)119863 matrix of size (119899 times 119896) andΦ119879 transpose of matrixΦ
(Φ119879Φ)119882 = Φ
119879119863
119882 = (Φ119879Φ)minus1
Φ119879119863
(15)
where (Φ119879Φ)minus1Φ119879 represents the pseudoinverse of matrix Φand119863 denotes the target matrix for 119889119899
119896 The weight matrix119882
can be calculated by linear inverse matrix technique and usedfor mapping between the source and target acoustic featurevectorThe exact interpolation of RBF is acquainted with twoserious problems namely (i) poor performance for noisy dataand (ii) increased computational complexityThese problemscan be addressed bymodifying two RBF parametersThe firstone is the spread factor which is calculated as
120590119895= 2 times avg 10038171003817100381710038171003817119909 minus 120583119895
10038171003817100381710038171003817 (16)
The selected spread factor confirms that the individual RBFsare neither wide nor narrow The second one is an extra biasunit which is introduced into the linear sum of activationsat the desired output layer to compensate for the differencebetween the mean over the data set of the basis functionactivations and the correspondingmean of the targetsHencewe achieve the RBF network for mapping as
119865119896(119909) =
119898
sum
119895=0
119908119895119896Φ(10038171003817100381710038171003817119909 minus 119889119895
10038171003817100381710038171003817) (17)
In this work RBF neural networks are initialized and bestnetworks are developed to obtain the mapping between thecepstral based acoustic parameters of the source and thetarget speakers The trained networks are used to predictreal and imaginary components of the vocal tract and sourceexcitation of the target speakerrsquos speech signal In the baselineapproach theMCEP based featurematrices of the source andtarget utterances with the order of 25 are formed Radial basisfunction is trained to obtain best mapping functionThe bestmapping function is obtained using RBF network and used topredict the MCEP parameters of the target speakerrsquos speechsignal
5 Experimental Results
In this paper theRBFbasedmapping functions are developedusing CMU-ARCTIC corpusThe corpus consists of differentsets of 1132 phonetically balanced parallel utterances of eachspeaker sampled at 16 kHz The corpus includes two femalethat is CLB (US Female) and SLT (US Female) and fivedifferent male such as AWB (Scottish Male) BDL (USMale)JMK (Canadian Male) RMS (US Male) and KSP (IndianMale) [36] In this work we have made use of the parallelutterances of the AWB (M1) CLB (F1) BDL (M2) and SLT(F2) with different speaker combinations like M1-F1 F2-M2M1-M2 and F1-F2 For each of the speaker pairs 50 parallelsentences of source and target speakers are used for VCsystem training and system evaluations are made using a
separate set of 25 source speaker sentences The performanceof homomorphic vocoder based VC system is compared withthe state-of-the-art MCEP based VC system using differentobjective and subjective measures
51 Objective Evaluation Theobjective measures provide themathematical analysis for determining the similarity indexand quality inspection score between desired (target) andtransformed speech signal In this work performance indexspectral distortion and formant deviation are considered asobjective measures
The performance index (119875LSF) is computed for investigat-ing the requirement of normalized error for different pairsThe spectral distortion between desired and transformedutterances 119863LSF (119889(119899) 119889(119899)) and the interspeaker spectraldistortion 119863LSF (119889(119899) 119904(119899)) are used for computing the 119875LSFmeasure In general the speaker spectral distortion betweensignals 119906 and V119863LSF (119906 V) is defined as
119863LSF (119906 V) = [
[
1
119873
119873
sum
119894=1
radic1
119875
119875
sum
119895=1
(LSF119894119895119906minus LSF119894119895V )
2]
]
(18)
where 119873 represents the number of frames 119875 refers to a LSForder and LSF119894119895
119906is the 119895th LSF component in the frame 119894The
119875LSF measure is given as
119875LSF = [1 minus119863LSF (119889 (119899) 119889 (119899))
119863LSF (119889 (119899) 119904 (119899))] (19)
The performance index 119875LSF = 1 indicates that the convertedsignal is identical to the desired one whereas 119875LSF = 1specifies that the converted signal is not at all similar to thedesired one
In the computation of the performance index four differ-ent converted samples of M1 to F1 F2 to M2 F1 to F2 andM1 to M2 combinations are considered Comparative perfor-mance between cepstrum based VC algorithm and MCEPbased VC is shown in Table 1 The results specified that theperformance of the complex cepstrum based VC performedbetter than MCEP based VC algorithm
Along with performance index the different objectivemeasures namely deviation (119863
119894) root mean square error
(RMSE) and correlation coefficients (120590119909119910
) are also cal-culated for different speaker pairs Deviation parameter isdefined as the percentage variation in the actual (119909
119896) and
predicted (119910119896) formant frequencies derived from the speech
frames It corresponds to the percentage of test frames withina specified deviation Deviation (119863
119896) is calculated as
119863119896=
1003816100381610038161003816119909119896 minus 1199101198961003816100381610038161003816
119909119896
times 100 (20)
8 ISRN Signal Processing
Table 1 The performance index of complex cepstrum based VC and MCEP based VC
Type of conversion
Performance indexSample 1 Sample 2 Sample 3 Sample 4
Cep basedVC
MCEP basedVC
Cep basedVC
MCEP basedVC
Cep basedVC
MCEP basedVC
Cep basedVC
MCEP basedVC
M1-F1 07679 06230 07483 06356 07127 06080 08350 06768F2-M2 07389 05781 07150 06988 07780 06908 07848 06845F1-F2 07921 06576 06908 05954 06740 06209 07946 06925M1-M2 07023 06490 06821 06012 06432 05801 07852 07012
Table 2 Prediction performance of MCEP based for formant frequencies
Transformation model Formant frequencies Predicted frame within deviation2 5 10 15 20 25 50 120583RMSE Υ
119883119910
M1-F1
F1 51 74 80 81 83 85 90 445 07235F2 45 63 68 78 82 87 89 373 08182F3 57 62 79 86 87 89 92 334 08703F4 69 79 84 89 88 90 100 239 08629
F2-M2
F1 36 58 67 74 82 86 90 428 07190F2 57 82 86 87 87 89 91 630 07238F3 72 77 89 91 92 94 95 523 07474F4 66 74 89 90 93 95 100 491 07957
The root mean square error is calculated as percentage ofaverage of desired formant values obtained from the speechsegments
120583RMSE =radicsum119896
1003816100381610038161003816119909119896 minus 1199101198961003816100381610038161003816
2
119909times 100
120590 = radicsum
119896
1198892
119896 119889119896= 119890119896minus 120583
119890119896= 119909119896minus 119910119896 120583 =
sum119896
1003816100381610038161003816119909119896 minus 1199101198961003816100381610038161003816
119873
(21)
The error 119890119896is the difference between the actual and predicted
formant values119873 is the number of observed formant valuesof speech frames The parameter 119889
119896is the error in the
deviation The correlation coefficient Υ119883119910
is the parameterwhich is to be determined from the covariance COV(119883 119884)between the target (119909) and the predicted (119910) formant valuesand the standard deviations 120590
119883 120590119884of the target and the
predicted formant values respectively The parameters Υ119883119910
and COV(119883 119884) are calculated using
Υ119883119910=COV (119883 119884)120590119883120590119884
COV (119883 119884) =sum119896
1003816100381610038161003816(119909119896 minus 119909) (119910119896 minus 119910)1003816100381610038161003816
119873
(22)
The objective measures namely deviation (119863119894) root mean
square error (RMSE) and correlation coefficients (Υ119883119910)
of M1-F1 and F2-M2 are obtained for MCEP based VCalgorithm and shown in Table 2 Similarly the Table 3 shows
the measures obtained for proposed VC system From thetables it can be observed that the 120583RMSE between the desiredand the predicted acoustic space parameters for proposedmodel are less than the baseline model However every timeRMSE does not give strong information about the spectraldistortion Consequently scatter plots and spectral distortionare employed additionally as objective evaluation measuresThe scatter plots for first second third and fourth formantfrequencies for MCEP based VC and complex cepstrumbased VC models are shown in Figures 6 and 7 respec-tively Figures show that complex cepstrum VC based vocaltract envelope in term of predicted formants closely orienttowards the desired speech frames formants as comparedto MCEP based predicted formants The clusters obtainedusing complex cepstrum based VC are more compact anddiagonally oriented than that using MCEP based VC Asperfect prediction means all the data points in scatter plotare diagonally oriented in right side The compact clustersobtained for proposed method implies its ability to capturethe formant structure of desired speaker
The transformed formant patterns for a specific frameof source and target speech signal are obtained using bothcomplex cepstrum and MCEP based VC models and shownin Figures 8(a) and 8(b) respectively Figure 8(a) depictsthat the patterns of particular target signal closely followsthe corresponding transformed signal whereas Figure 8(b)shows that the predicted formant pattern closely follows thetarget pattern only for lower formants
Figure 9(a) shows the normalized frequency spectrogramof desired and transformed speech signals obtained fromM1to F1 and F2 to M2 of complex cepstrum based VC modelSimilarly Figure 9(b) shows the spectrogram forM1 to F1 and
ISRN Signal Processing 9
Table 3 Prediction performance of complex cepstrum based for formant frequencies
Transformation model Formant frequencies Predicted frame within deviation2 5 10 15 20 25 50 120583RMSE Υ
119883119910
M1-F1
F1 59 80 89 91 91 93 95 445 07197F2 52 72 85 88 91 92 95 355 08149F3 63 83 90 92 93 95 99 265 08837F4 72 86 91 93 95 97 100 2049 08909
F2-M2
F1 38 60 71 78 80 86 90 856 0757F2 60 82 89 92 92 93 98 362 0790F3 72 87 92 95 95 95 100 293 0778F4 70 86 91 96 97 99 100 241 0756
0200 400 600 8000
200
400
600
800
Desired formants (Hz)
Pred
icte
d fo
rman
ts (H
z)
(a)
500 1000 1500
500
1000
1500
Desired formants (Hz)
Pred
icte
d fo
rman
ts (H
z)
(b)
Desired formants (Hz)
Pred
icte
d fo
rman
ts (H
z)
1000 1500 2000 25001000
1500
2000
2500
(c)
Desired formants (Hz)
Pred
icte
d fo
rman
ts (H
z)
2000 2500 3000 3500 40002000
2500
3000
3500
4000
(d)
Figure 6 Desired and predicted formant frequencies for F2 to M2 VC using MCEP based approach (a) first formant (b) second formant(c) third formant and (d) fourth formant
F2 toM2 for theMCEP basedVCmodel It has been observedthat the dynamics of the first three formant frequencies inboth the algorithms are closely followed in the target and thetransformed speech samples
52 Subjective Evaluation The effectiveness of the algorithmis also evaluated using listening tests These subjective tests
are used to determine the closeness between the trans-formed and target speech sampleThemapping functions aredeveloped using 50 parallel utterances of the source andtarget speakers Twenty-five different synthesized speechutterances are obtained from the mapping function for inter-and intragender speech conversion and corresponding targetutterances are presented to twelve listenersThey are asked to
10 ISRN Signal Processing
0200 400 600 8000
200
400
600
800
Desired formants (Hz)
Pred
icte
d fo
rman
ts (H
z)
(a)
500 1000 1500
500
1000
1500
Desired formants (Hz)
Pred
icte
d fo
rman
ts (H
z)
(b)
Desired formants (Hz)
Pred
icte
d fo
rman
ts (H
z)
1000 1500 2000 25001000
1500
2000
2500
(c)
Desired formants (Hz)
Pred
icte
d fo
rman
ts (H
z)
2000 3000 40002000
2500
3000
3500
4000
(d)
Figure 7Desired and predicted formant frequencies for F2 toM2VCusing the complex cepstrumbased (a) first formant (b) second formant(c) third formant and (d) fourth formant
minus60
minus50
minus40
minus30
minus20
minus10
0
Mag
nitu
de (d
B)
DesiredProposed
0 20 40 60 80 100 120 140Frequency (Hz)
(a)
0 20 40 60 80 100 120 140minus70minus60minus50minus40minus30minus20minus10
010
Frequency (Hz)
Mag
nitu
de (d
B)
DesiredMcep based
(b)
Figure 8 Target and transformed spectral envelopes of the desired speaker using (a) complex cepstrum based VC and (b) MCEP based VC
ISRN Signal Processing 11
Time
Nor
mal
ised
frequ
ency
05 1 15 2 250
05
1
times104 Time
Nor
mal
ised
frequ
ency
05 1 15 2 250
05
1
times104
Time
Nor
mal
ised
frequ
ency
05 1 15 20
05
1
times104 Time
Nor
mal
ised
frequ
ency
05 1 15 20
05
1
times104
(A) (B)
(C) (D)
(a)
Time
Nor
mal
ised
frequ
ency
05 1 15 2 250
05
1
times104
(A) (B)Time
Nor
mal
ised
frequ
ency
05 1 15 2 250
05
1
times104
Time
Nor
mal
ised
frequ
ency
05 1 15 20
05
1
times104Time
Nor
mal
ised
frequ
ency
05 1 15 20
05
1
times104
(C) (D)
(b)
Figure 9 Spectrogram of the desired and the transformed signal for M1 to F1 ((A) to (C)) and F2 to M2 ((B) to (D)) using (a) complexcepstrum based VC and (b) MCEP based VC
12 ISRN Signal Processing
Table 4 MOS and ABX evaluations of complex cepstrum andMCEP based VC models
Conversiondata
MOS ABXCepstrumbased
MCEPbased
Cepstrumbased
MCEPbased
M1-F1 464 431 455 425F2-M1 418 392 434 423M1-M2 407 388 419 406F1-F2 424 376 436 413
evaluate their relative performance in term of voice quality(MOS) and speaker identity (ABX) with correspondingsource and target speaker speech samples on a scale of 1to 5 where rating 5 specifies an excellent match betweenthe transformed and target utterances rating 1 indicates apoor match and the other ratings indicate different levels ofvariation between 1 and 5 The ratings given to each set ofutterances are used to calculate theMOS for different speakercombinations like M1 to F1 M1 to M2 F1 to F2 and F2 toM2 the results are presented in Table 4 The dissimilarity inthe length of the vocal tract and the intonation patterns ofdifferent genders is themajor reason for variation in theMOSresults for source and target utterances of different gendersTheABX (A Source B Target X Transformed speech signal)test is also performed using the same set of utterances andspeakers In the ABX test the listeners are asked to judgewhether the unknown speech sample X sounds closer tothe reference sample A or B The ABX is a measure ofidentity transformationThe higher value of ABX percentageindicates that the transformed speech lies in close proximityof the target utterance The results of the ABX test are alsoshown in Table 4
6 Conclusion
The VC algorithm comprising of complex cepstrum thatpreserves the phase related information content of the syn-thesized speech outcome is presented Amixed phase systemis designed to yield far better transformed speech signal thanthe minimum phase systems The vocal tract and excitationparameters of the speech signal are obtained with the helpof low and high time liftering Radial basis functions areexplored to capture the nonlinear mapping function formodifying the real and imaginary parts of the vocal tractand source excitations of the source speaker speech to that ofthe target speaker speech In baseline VC algorithm MCEPmethod is used to interpret the vocal tract whereas the fun-damental frequency (119865
0) represent the source excitation
The RBF based mapping function is used to capture thenonlinear relationship between the MCEP of the sourcespeaker to that of the target speaker and statistical mean andstandard deviation is used for transformation of fundamentalfrequency The proposed complex cepstrum based VC iscompared with the MCEP based VC using various objectiveand subjectivemeasuresThe evaluation results reveal that thecomplex cepstrumbasedVCperforms slightly better than the
MCEP basedVCmodel in term of speech quality and speakeridentity The reason may be the fluctuation of MLSA filterparameters with limited margins in Pade approximation Itmay be unstable momentarily when the parameters varyrapidly by contrast the complex cepstrum with finite impulseresponse is always stable
Conflict of Interests
The authors declare that there is no conflict of interestsregarding the publication of this paper
References
[1] HKuwabara andY Sagisak ldquoAcoustic characteristics of speakerindividuality control and conversionrdquo Speech Communicationvol 16 no 2 pp 165ndash173 1995
[2] K-S Lee ldquoStatistical approach for voice personality transfor-mationrdquo IEEE Transactions on Audio Speech and LanguageProcessing vol 15 no 2 pp 641ndash651 2007
[3] A Kain and M W Macon ldquoDesign and evaluation of a voiceconversion algorithm based on spectral envelope mapping andresidual predictionrdquo in Proceedings of the IEEE InterntionalConference onAcoustics Speech and Signal Processing vol 2 pp813ndash816 May 2001
[4] D Sundermann ldquoVoice conversion state-of-the-art and futureworkrdquo in Proceedings of the 31st German Annual Conference onAcoustics (DAGA rsquo01) Munich Germany 2001
[5] DGChilders B Yegnanarayana andWKe ldquoVoice conversionfactors responsible for qualityrdquo in Proceeding of the IEEE Inter-national Conference on Acoustics Speech and Signal Processing(ICASSP rsquo85) vol 1 pp 748ndash751 Tampa Fla USA 1985
[6] MAbe S Nakanura K Shikano andHKuwabara ldquoVoice con-version through vector quantizationrdquo in Proceeding of the IEEEInternational Conference on Acoustics Speech and Signal Pro-cessing pp 655ndash658 1988
[7] W Verhelst and J Mertens ldquoVoice conversion using partitionsof spectra feature spacerdquo inProceedings of the IEEE InternationalConference on Acoustics Speech and Signal Processing (ICASSPrsquo96) pp 365ndash368 May 1996
[8] N Iwahashi and Y Sagisaka ldquoSpeech spectrum conversionbased on speaker interpolation and multi-functional represen-tation with weighting by radial basis function networksrdquo SpeechCommunication vol 16 no 2 pp 139ndash151 1995
[9] Y Stylianou O Cappe and E Moulines ldquoContinuous proba-bilistic transform for voice conversionrdquo IEEE Transactions onSpeech and Audio Processing vol 6 no 2 pp 131ndash142 1998
[10] S Desai A W Black B Yegnanarayana and K PrahalladldquoSpectral mapping using artificial neural networks for voiceconversionrdquo IEEE Transactions on Audio Speech and LanguageProcessing vol 18 no 5 pp 954ndash964 2010
[11] C Orphanidou I M Moroz and S J Roberts ldquoWavelet-basedvoice morphingrdquo WSEAS Journal of Systems vol 10 no 3 pp3297ndash3302 2004
[12] E Helander T Virtanen N Jani and M Gabbouj ldquoVoice con-version using partial least squares regressionrdquo IEEE TranscationonAudio Speech Language Processing vol 18 no 5 pp 912ndash9212010
[13] LMArslan ldquoSpeaker transformation algorithmusing segmen-tal codebooks (STASC)rdquo Speech Communication vol 28 no 3pp 211ndash226 1999
ISRN Signal Processing 13
[14] K S Rao ldquoVoice conversion by mapping the speaker-specificfeatures using pitch synchronous approachrdquo Computer Speechand Language vol 24 no 3 pp 474ndash494 2010
[15] S Hayakawa and F Itakura ldquoText-dependent speaker recogni-tion using the information in the higher frequency bandrdquo inProceedings of the International Conference on Acoustics Speechand Signal Processing (ICASSP rsquo94) pp 137ndash140 Adelaide Aus-tralia 1994
[16] H Kawahara I Masuda-Katsuse and A de CheveigneldquoRestructuring speech representations using a pitch-adaptivetime-frequency smoothing and an instantaneous-frequency-based F0 extraction possible role of a repetitive structure insoundsrdquo Speech Communication vol 27 no 3 pp 187ndash207 1999
[17] R J McAulay and T F Quatieri ldquoPhasemodelling and its appli-cation to sinusoidal transform codingrdquo in Proceedings of theIEEE International Conference on Acoustics Speech and SignalProcessing (ICASSP rsquo86) vol 1 pp 1713ndash1716 Tokyo Japan 1986
[18] J Nirmal P Kachare S Patnaik and M Zaveri ldquoCepstrumliftering based voice conversion using RBF and GMMrdquo inProceedings of the IEEE International Conference on Commu-nications and Signal Processing (ICCSP rsquo13) pp 570ndash575 April2013
[19] A V Oppenheim ldquoSpeech analysis and synthesis system basedon homomorphic filteringrdquoThe Journal of the Acoustical Societyof America vol 45 no 2 pp 458ndash465 1969
[20] W Verhelst and O Steenhaut ldquoA new model for the short-time complex cepstrum of voiced speechrdquo IEEE Transactions onAcoustics Speech and Signal Processing vol 34 no 1 pp 43ndash511986
[21] H Deng R K Ward M P Beddoes and M Hodgson ldquoA newmethod for obtaining accurate estimates of vocal-tract filtersand glottal waves from vowel soundsrdquo IEEE Transactions onAudio Speech and Language Processing vol 14 no 2 pp 445ndash455 2006
[22] T Drugman B Bozkurt and T Dutoit ldquoComplex cepstrum-based decomposition of speech for glottal source estimationrdquoin Proceedings of the 10th Annual Conference of the InternationalSpeech Communication Association (INTERSPEECH rsquo09) pp116ndash119 Brighton UK September 2009
[23] T F Quatieri Jr ldquoMinimum and mixed phase speech analysis-synthesis by adaptive homomorphic deconvolutionrdquo IEEETransactions on Acoustics Speech and Signal Processing vol 27no 4 pp 328ndash335 1979
[24] T Drugman B Bozkurt and T Dutoit ldquoCausal-anticausaldecomposition of speech using complex cepstrum for glottalsource estimationrdquo Speech Communication vol 53 no 6 pp855ndash866 2011
[25] M Vondra and R Vıch ldquoSpeechmodeling using the complexcepstrumrdquo in Toward Autonomous Adaptive and Context-Aware Ultimodal InterfacesTheoretical and Practical Issues vol6456 of Lecture Notes in Computer Science pp 324ndash330 2011
[26] R Maia M Akamine and M Gales ldquoComplex cepstrum asphase information in statistical parametric speech synthesisrdquo inProceedings of the IEEE International Conference on AcousticsSpeech and Signal Processing (ICASSP rsquo12) pp 4581ndash4584 2012
[27] K Shikano S Nakamura andM Abe ldquoSpeaker adaptation andvoice conversion by codebook mappingrdquo in Proceedings of theIEEE International Symposium onCircuits and Systems pp 594ndash597 June 1991
[28] T Toda H Saruwatari and K Shikano ldquoVoice conversion algo-rithm based on Gaussian mixture model with dynamic fre-quencywarping of straight spectrumrdquo inProceedings of the IEEE
Interntional Conference on Acoustics Speech and Signal Process-ing pp 841ndash844 May 2001
[29] H Ye and S Young ldquoHigh quality voice morphingrdquo in Proceed-ings of the IEEE International Conference on Acoustics Speechand Signal Processing pp I9ndashI12 May 2004
[30] R Laskar K Banerjee F Talukdar and K Sreenivasa Rao ldquoApitch synchronous approach to design voice conversion systemusing source-filter correlationrdquo International Journal of SpeechTechnology vol 15 pp 419ndash431 2012
[31] D Sundermann A Bonafonte H Ney and H Hoge ldquoA studyon residual prediction techniques for voice conversionrdquo inProceedings of the IEEE International Conference on AcousticsSpeech and Signal Processing (ICASSP rsquo05) pp I13ndashI16 March2005
[32] K S Rao R H Laskar and S G Koolagudi ldquoVoice transfor-mation by mapping the features at syllable levelrdquo in PatternRecognition and Machine Intelligence vol 4815 of Lecture Notesin Computer Science pp 479ndash486 Springer 2007
[33] httpsp-tksourceforgenet[34] S Imai ldquoCepstral analysis and synthesis on the mel-frequency
scalerdquo in Proceedings of the IEEE International Conference onAcoustics Speech and Signal Processing (ICASSP rsquo83) pp 93ndash96Boston Mass USA 1983
[35] K Tokuda T Kobayashi T Masuko and S Imai ldquoMel-gener-alized cepstral analysismdasha unified approach to speech spectralestimationrdquo in Proceedings of the International Conference onSpoken Language Processing (ICSLP rsquo94) pp 1043ndash1046 1994
[36] J Kominek and AW Black ldquoCMUARCTIC speech databasesrdquoin Proceedings of the 5th ISCA Speech Synthesis Workshop pp223ndash224 Pittsburgh Pa USA June 2004
Submit your manuscripts athttpwwwhindawicom
VLSI Design
Hindawi Publishing Corporationhttpwwwhindawicom Volume 2014
International Journal of
RotatingMachinery
Hindawi Publishing Corporationhttpwwwhindawicom Volume 2014
Hindawi Publishing Corporation httpwwwhindawicom
Journal ofEngineeringVolume 2014
Hindawi Publishing Corporationhttpwwwhindawicom Volume 2014
Shock and Vibration
Hindawi Publishing Corporationhttpwwwhindawicom Volume 2014
Mechanical Engineering
Advances in
Hindawi Publishing Corporationhttpwwwhindawicom Volume 2014
Civil EngineeringAdvances in
Acoustics and VibrationAdvances in
Hindawi Publishing Corporationhttpwwwhindawicom Volume 2014
Hindawi Publishing Corporationhttpwwwhindawicom Volume 2014
Electrical and Computer Engineering
Journal of
Hindawi Publishing Corporationhttpwwwhindawicom Volume 2014
Distributed Sensor Networks
International Journal of
The Scientific World JournalHindawi Publishing Corporation httpwwwhindawicom Volume 2014
SensorsJournal of
Hindawi Publishing Corporationhttpwwwhindawicom Volume 2014
Modelling amp Simulation in EngineeringHindawi Publishing Corporation httpwwwhindawicom Volume 2014
Hindawi Publishing Corporationhttpwwwhindawicom Volume 2014
Active and Passive Electronic Components
Hindawi Publishing Corporationhttpwwwhindawicom Volume 2014
Chemical EngineeringInternational Journal of
Control Scienceand Engineering
Journal of
Hindawi Publishing Corporationhttpwwwhindawicom Volume 2014
Antennas andPropagation
International Journal of
Hindawi Publishing Corporationhttpwwwhindawicom Volume 2014
Hindawi Publishing Corporationhttpwwwhindawicom Volume 2014
Navigation and Observation
International Journal of
Advances inOptoElectronics
Hindawi Publishing Corporation httpwwwhindawicom
Volume 2014
RoboticsJournal of
Hindawi Publishing Corporationhttpwwwhindawicom Volume 2014
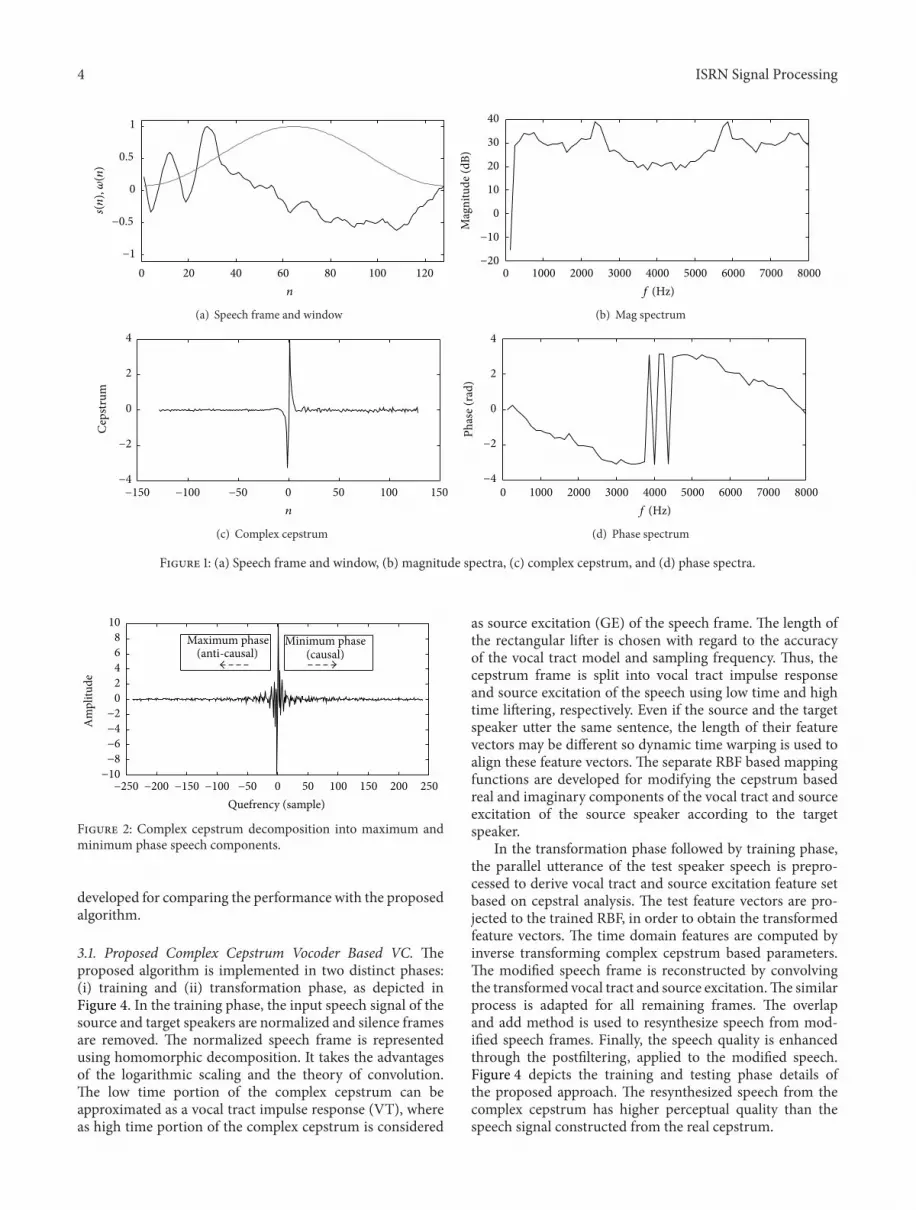
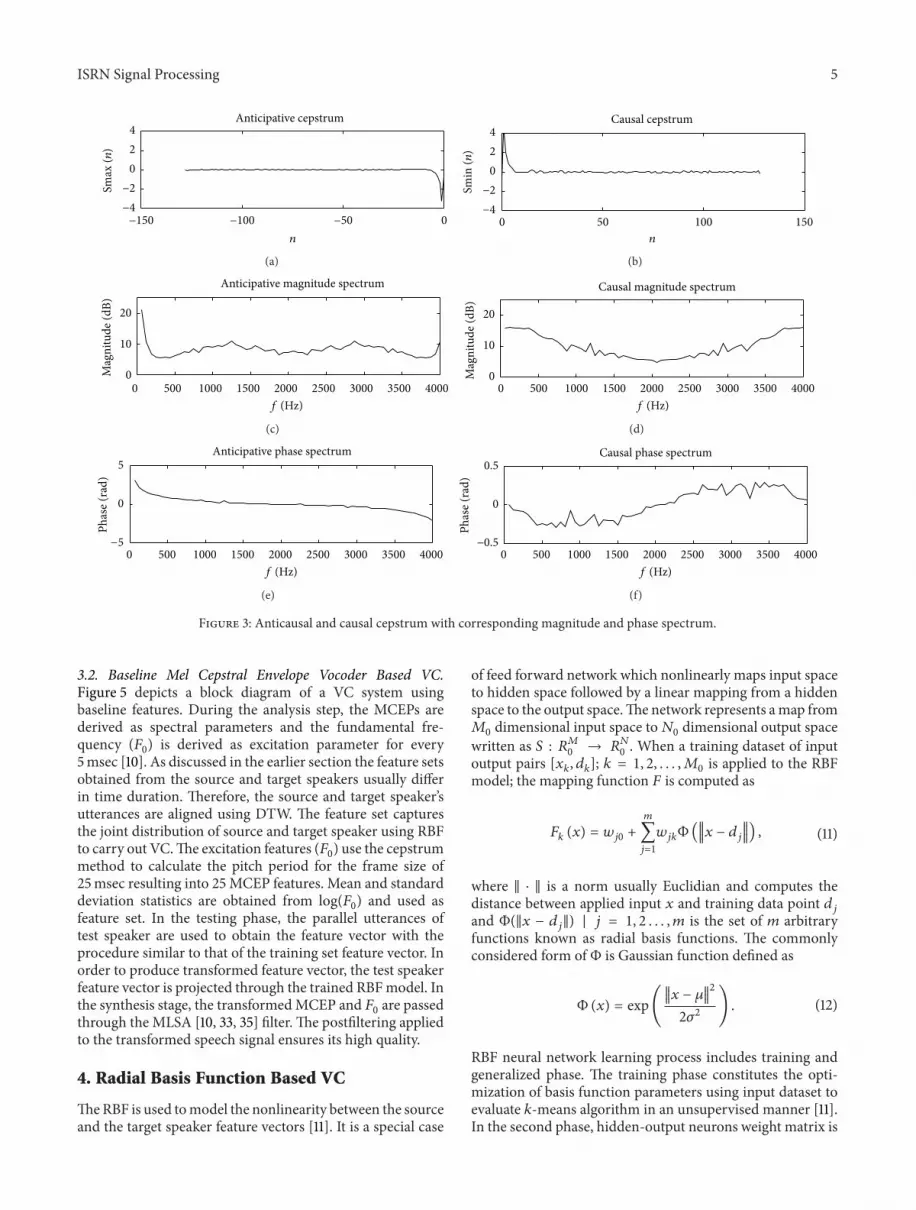
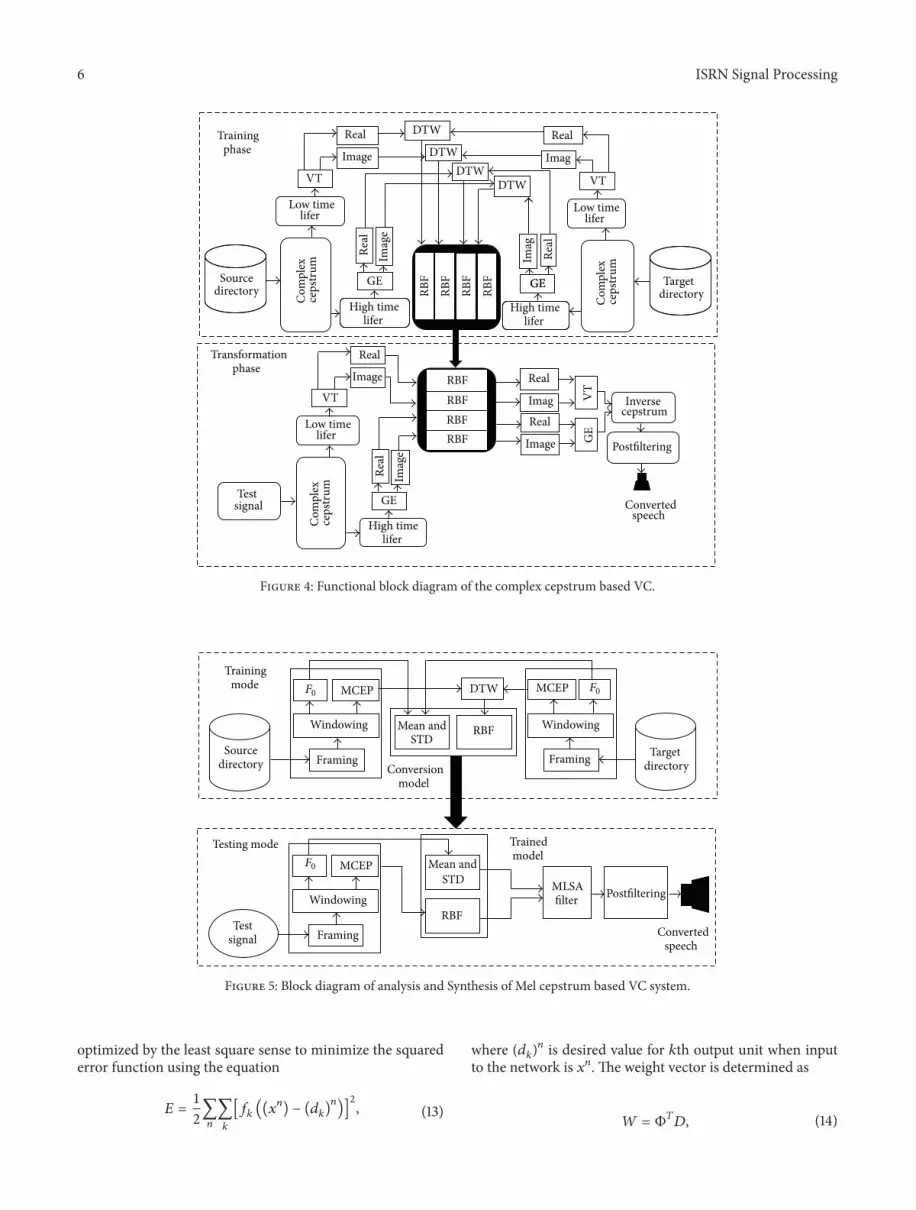
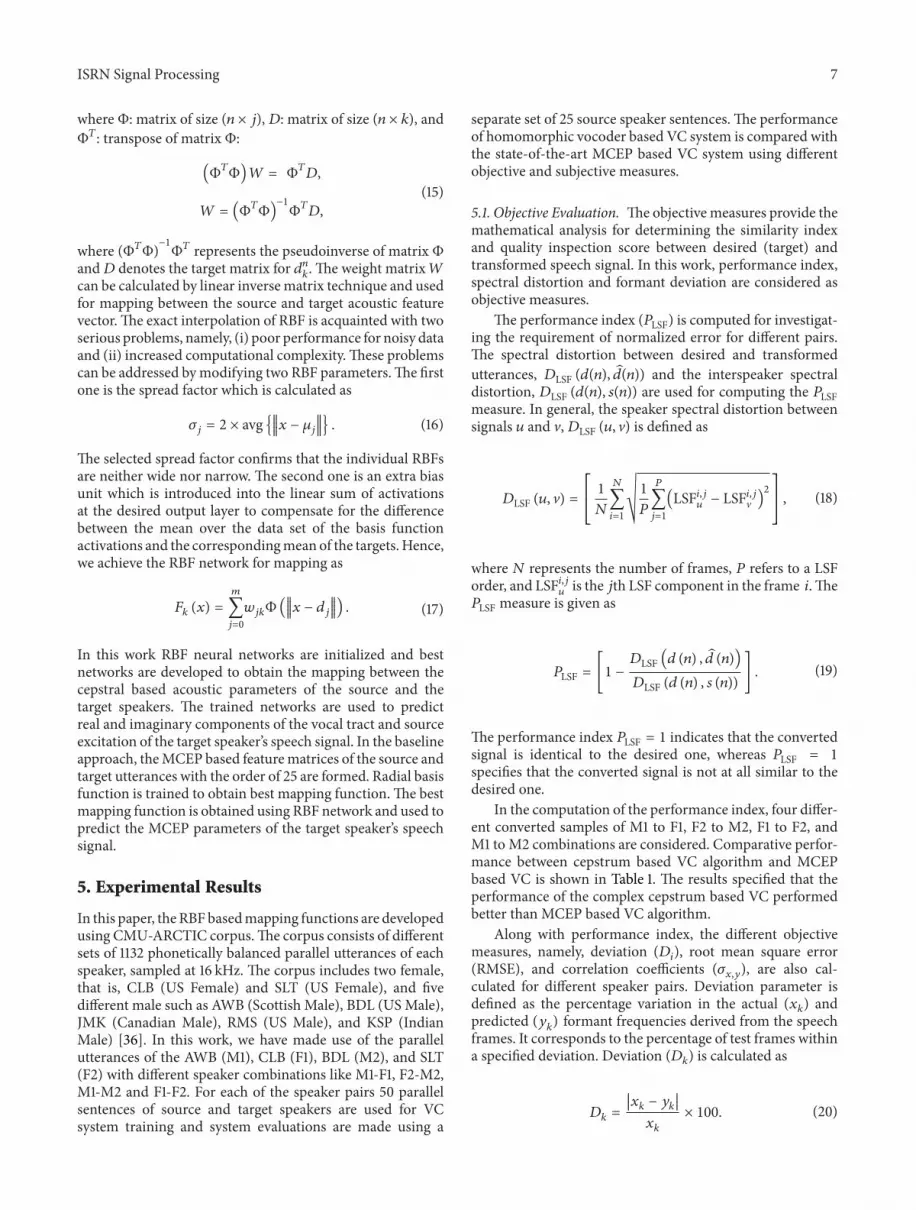
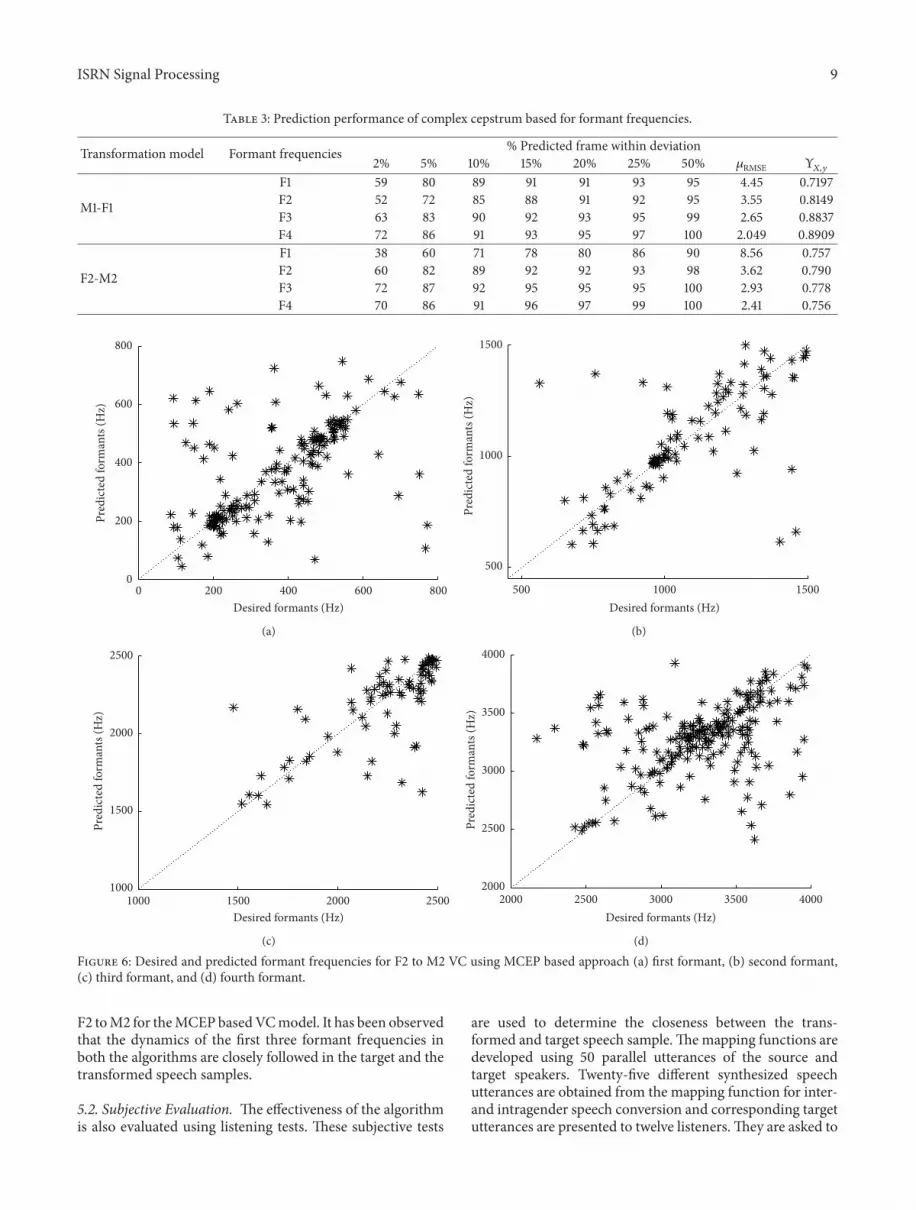
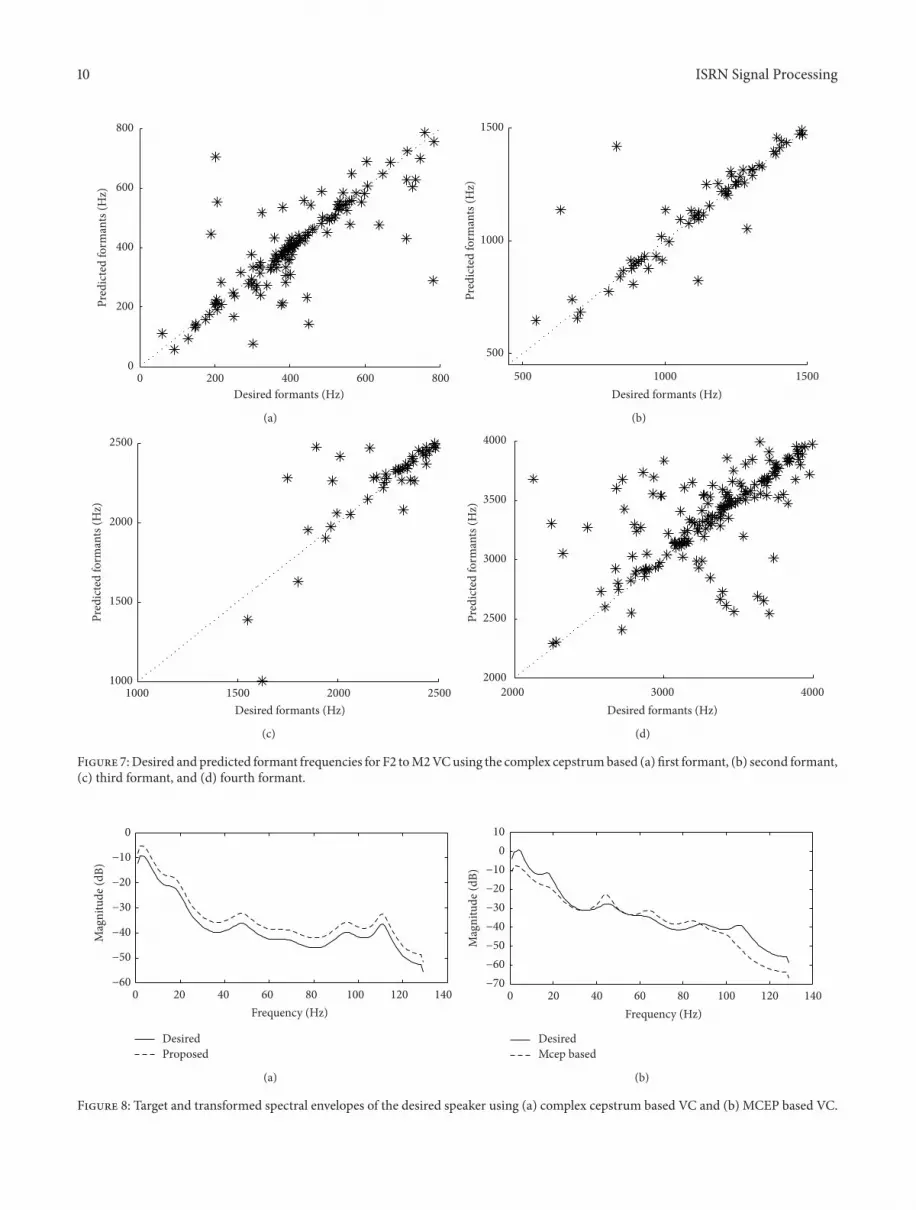
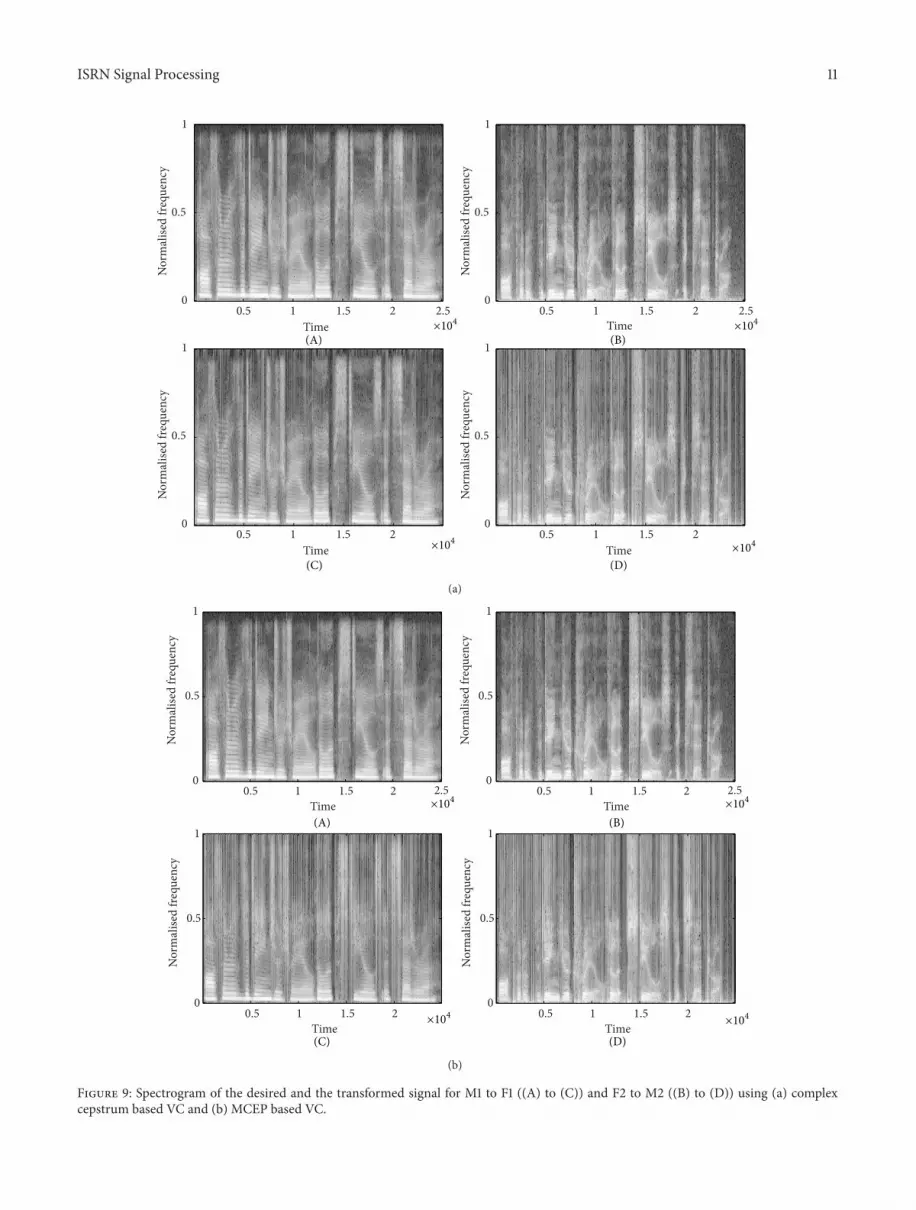