competitive electron transfers in model ionic triad systems: md simulations
TRANSCRIPT

Journal of Photochemistry and Photobiology A: Chemistry 158 (2003) 83–100
Competitive electron transfers in model ionic triad systems:MD simulations
Maria Hilczera,b, M. Tachiyaa,∗a National Institute of Advanced Industrial Science and Technology, Tsukuba Central 5, 1-1-1 Higashi, Ibaraki 305-8565, Japan
b Institute of Applied Radiation Chemistry, Technical University, Wroblewskiego 15, 93-590 Lodz, Poland
Received 25 March 2002; accepted 1 July 2002
Abstract
We present the second part of the work [J. Phys. Chem. 100 (1996) 8815] devoted to electron transfer (ET) reactions in model triadsystems. A model supramolecule is the ionic triad D+–A1−–A2 immersed in acetonitrile solvent at room temperature. The ET rateconstants for both the charge separation (the forward ET) and the charge recombination (the backward ET) are expressed in terms of thetwo-dimensional (2D) statistical distribution of the respective solvent polarization coordinates. This distribution for the triad with variousangular arrangements of the subunits has been evaluated by the MD computer simulation for the molecular model of the solvent. Thedependence of the yield of the charge-separated state D+–A1–A2− on the triad geometry and the free energy changes of the forward andthe backward ETs as well as the conditions that maximize the yield of the forward ET have been considered.© 2003 Elsevier Science B.V. All rights reserved.
Keywords:Computer simulation; Molecular dynamics; Photoinduced electron transfer; Triad system
1. Introduction
Electron transfer (ET) in supramolecular systems is a sub-ject of intensive experimental[1–28]and theoretical[29–54]research, which have an important practical implication. Ithas been proven possible to prepare synthetic molecular de-vices that can be used for capturing and storing solar energy.Their efficiency is, however, still beneath the level of themost famous natural electronic devices such as the reactioncenters (RCs) of photosynthetic organisms.
Theoretical approach to ETs in multicenter systems im-mersed in protein or polar solvents requires definition of anappropriate number of intramolecular and solvent-dependentreaction coordinates. The former coordinates are connectedwith the internal reorganization of a supramolecule duringparticular charge transfer processes, whereas the latter de-scribe the effect of fluctuation of the surrounding medium.For rigid supramolecular systems in solvents of high po-larity the set of reaction coordinates can be limited to thesolvent polarization coordinates. It has been shown that thecompetitive or sequential ETs in a rigid triad system canbe modeled using two polarization coordinates and, conse-
∗ Corresponding author.E-mail addresses:[email protected] (M. Hilczer),[email protected] (M. Tachiya).
quently, the two-dimensional (2D) free energy surfaces ofthe reactant and the product states[29–32].
Pairs of orthogonal reaction coordinates were introducedby Marchi et al.[34] and Parson et al.[35] in their computersimulations of the competitive charge separation reactionsin the bacterial photosynthetic RC. Results of the formergroup supported the direct ET (superexchange) from unit 1of the triad (special pair composed of a bacteriochlorophylldimer) to unit 3 (bacteriopheophytin). Results of the lattergroup predicted the possibility of the sequential ETs: from1 to 2 (bacteriochlorophyll) and then from 2 to 3. Warshelet al. [37] suggested that divergence of the simulation re-sults arose from incomplete treatment of dielectric effectsin the Marchi’s calculations. All these groups of workersused, however, one-dimensional (1D) free energy curves, in-stead of 2D free energy surfaces, to analyze their simulationdata. Fushiki and Tachiya[38] have constructed the correct2D free energy functions for the two primary ETs in thebacterial RC from the results of the aforementioned simula-tions. Their conclusions supported the two-step mechanismof charge separation in the RC. The authors underlined thatif the rate of fluctuation of solvent surrounding the triad isslow compared with rates of the two competitive ETs, thenthese ETs interfere with each other and this makes it impos-sible to describe them separately based on 1D free energycurves. Contrary, in the nonadiabatic limit the equilibrium
1010-6030/03/$ – see front matter © 2003 Elsevier Science B.V. All rights reserved.doi:10.1016/S1010-6030(03)00021-2

84 M. Hilczer, M. Tachiya / Journal of Photochemistry and Photobiology A: Chemistry 158 (2003) 83–100
distribution in the free energy surface of the initial state ofthe triad is maintained during ETs and both reactions occurindependently[29–32,38]. Thus, each of them can be ana-lyzed using a pair of appropriate 1D free energy curves: onecurve for the initial state and one for the final state. The ini-tial state curvesGis(q1) andGis(q2) for the two competitiveETs are, however, different even in the nonadiabatic limit.
Recently, Zusman and Beratan[39] developed thetheory of ET in three-center systems immersed in adielectric-continuum solvent. They described ET as arisingfrom 2D diffusion over two statistically independent reac-tion coordinates, which were defined similarly as in[34].Their theory describes competition between sequential andsuperexchange ET mechanisms, and includes the solventdynamics control of the overall reaction rate. The dynam-ical solvent effect in the dielectric-continuum limit wasalso considered in a theory developed by Okada et al.[40],which concerns ETs among many electronic states coupledto multidimensional diffusive nuclear modes. The theoryhas been applied to description of thenonequilibrium se-quential ETs in a supramolecular triad system composedof donor–medium–acceptor (DMA) molecules. In otherwords, they considered ET from D∗MA to D+M−A, fol-lowed by another ET from D+M−A to D+MA− withoutthermal equilibration of the state D+M−A. They found anonmonotonic dependence of the overall donor-to-acceptorET rate constantk on the solvation time scaleτs. The func-tion k(τs) appeared to increase in the region of smallτs anddecrease in the slow solvation limit. Najbar and co-workers[41] applied the theory of the nonadiabatic ET reactionsbased on the stochastic Liouville equation to model DAAtriad systems in a continuum dielectric solvent. Fushiki andTachiya[30] expressed the two-step ETs in a model lineartriad DAA surrounded by polar, structureless solvent interms of the dynamics of a Brownian particle on the 2D freeenergy surfaceFI (q1, q2) of the intermediate state D+A−A.
In the majority of papers concerning ETs in three-centersystems, a polar solvent was treated as adielectric continuumcharacterized by specific values of the static and opticaldielectric constants. Our previous paper[32] introduced amolecular modelof solvent (acetonitrile) and showed howit affects description of the competitive ET reactions in amodel rigid supramolecule with various spatial arrangementsof the subunits. One of the triad considered there was theD–A1–A2 system that produces after photoexcitation theionic states D+–A1−–A2 or D+–A1–A2−.
The present work is a logical continuation and com-pletion of those studies. It is devoted to ETs which occurin the model,ionic triads D+–A1−–A2 immersed in ace-tonitrile solvent at room temperature. One of these ETsis the backward reaction, which leads to reformation ofthe neutral system D–A1–A2, the other is the forward ETresulting in the charge-separated state D+–A1–A2−. Thereaction coordinates for these two processes are definedas q1 = e(V2 − V1) and q2 = e(V2 − V3), whereV1, V2andV3 stand for the electrostatic potential at D+, A1− and
A2, respectively. We apply the MD computer simulationmethod to calculate the statistical distributionϕ(q1, q2) and,consequently, the free energy surface of the D+–A1−–A2state. We consider the nonadiabatic limit (fast solvation) atwhich both reactions can run parallel on this energy surface.The reaction coordinates are random variables. We describestatic and dynamical stochastic properties of the reactioncoordinates and discuss the influence of the solvent, thetriad geometry, and the free energy changes on the twoprocesses on the basis of these properties. We also considerthe competition between the forward and the backward ETreactions and the conditions that maximize the yield of theformer process. Our triad is not supposed to mimic any spe-cific experimental system. Our intention is to show the roleof the solvent, for which we employ a realisticmolecularmodel [55] that has been proven to reproduce some struc-tural and dielectric properties of the bulk phase[56,57]. Wecompare some results for the ionic system with those for theneutral triad and discuss some conclusions drawn from thepresent model in relation to the available experimental data.
The remainder of the paper is organized as follows: InSection 2we describe details of the performed computersimulations. InSection 3.1we present the 2D and marginal(1D) probability distribution functions and their dependenceon the angular arrangement of the triad subunits. The dy-namical properties of the reaction coordinates are discussedbased on the time auto- and cross-correlation functions inSection 3.2. We compare here the dynamics of solvation ofthe particular subunits of the triad with that of the separatelysolvated molecules or ions. InSection 3.3we present therate constants for the forward and backward ETs and discussthe efficiency of the former process. Finally, inSection 3.4,we describe the solvent structure and the charge distributionaround the ionic triads and compare them with respectivedata for the neutral triad systems.
2. Outline of calculation
Chromophores of the D+–A1−–A2 system were modeledby two simple ions (labeled 1 and 2) and one atom (labeled3), and surrounded by 497 acetonitrile molecules. The triadwas immobile during simulation runs and a constant value ofr = 5.5 Å was assumed as the distance between the centraland each of the side subunits. We considered several differentangular arrangements of the triad, which were characterizedby the angleβ between axes connecting A1− with D+ andA2, respectively. The values ofβ assumed for particular runswere 60, 90, 120, and 180◦.
CH3CN–CH3CN interactions were described by thesix-site potential developed by Böhm et al.[55]. In thispotential the sites are located on the respective atoms ofan acetonitrile molecule and each site of one moleculeinteracts with every site on another molecule through thestandard 6–12 Lennard–Jones and the Coulomb potentials.The acetonitrile molecule is treated as a rigid object, with
M. Hilczer, M. Tachiya / Journal of Photochemistry and Photobiology A: Chemistry 158 (2003) 83–100 85
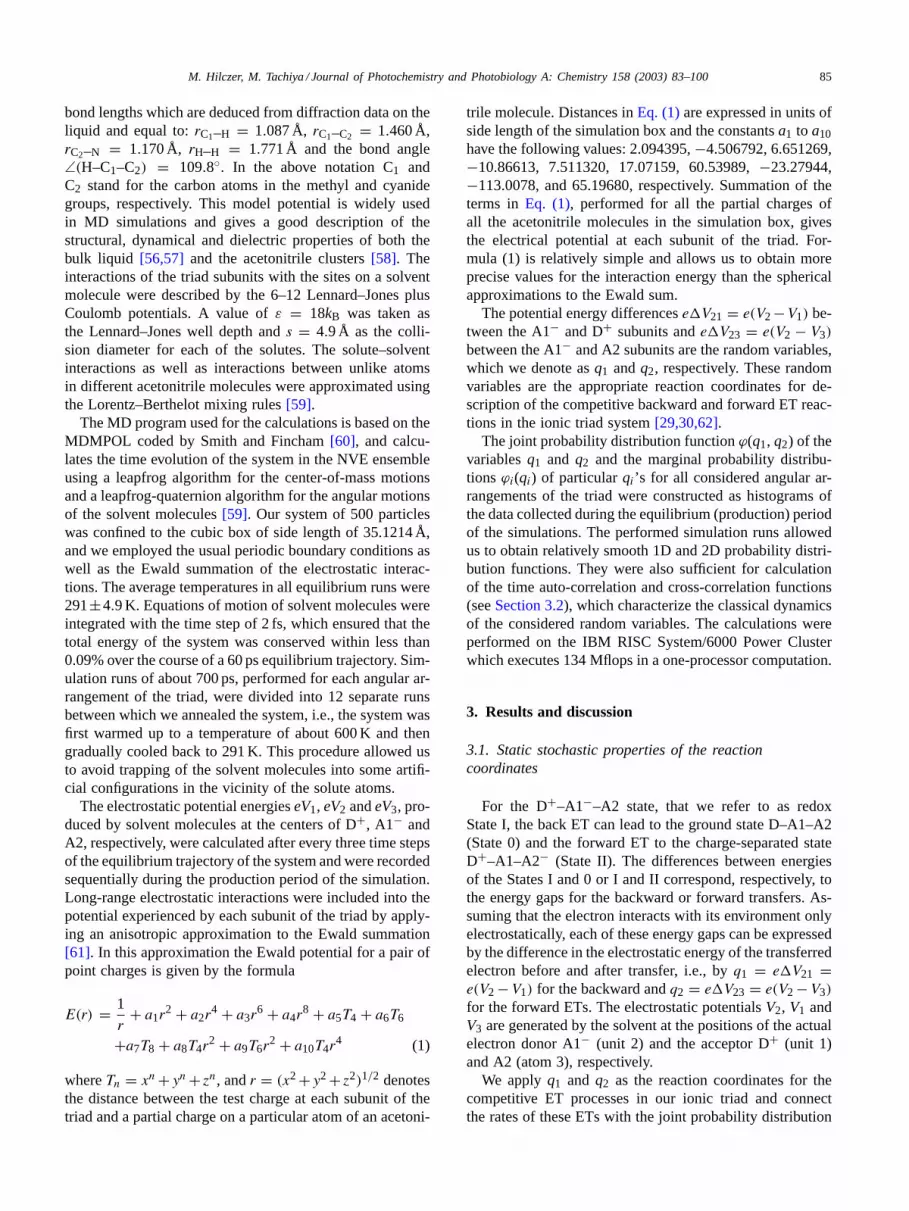
bond lengths which are deduced from diffraction data on theliquid and equal to:rC1–H = 1.087 Å, rC1–C2 = 1.460 Å,rC2–N = 1.170 Å, rH–H = 1.771 Å and the bond angle∠(H–C1–C2) = 109.8◦. In the above notation C1 andC2 stand for the carbon atoms in the methyl and cyanidegroups, respectively. This model potential is widely usedin MD simulations and gives a good description of thestructural, dynamical and dielectric properties of both thebulk liquid [56,57] and the acetonitrile clusters[58]. Theinteractions of the triad subunits with the sites on a solventmolecule were described by the 6–12 Lennard–Jones plusCoulomb potentials. A value ofε = 18kB was taken asthe Lennard–Jones well depth ands = 4.9 Å as the colli-sion diameter for each of the solutes. The solute–solventinteractions as well as interactions between unlike atomsin different acetonitrile molecules were approximated usingthe Lorentz–Berthelot mixing rules[59].
The MD program used for the calculations is based on theMDMPOL coded by Smith and Fincham[60], and calcu-lates the time evolution of the system in the NVE ensembleusing a leapfrog algorithm for the center-of-mass motionsand a leapfrog-quaternion algorithm for the angular motionsof the solvent molecules[59]. Our system of 500 particleswas confined to the cubic box of side length of 35.1214 Å,and we employed the usual periodic boundary conditions aswell as the Ewald summation of the electrostatic interac-tions. The average temperatures in all equilibrium runs were291±4.9 K. Equations of motion of solvent molecules wereintegrated with the time step of 2 fs, which ensured that thetotal energy of the system was conserved within less than0.09% over the course of a 60 ps equilibrium trajectory. Sim-ulation runs of about 700 ps, performed for each angular ar-rangement of the triad, were divided into 12 separate runsbetween which we annealed the system, i.e., the system wasfirst warmed up to a temperature of about 600 K and thengradually cooled back to 291 K. This procedure allowed usto avoid trapping of the solvent molecules into some artifi-cial configurations in the vicinity of the solute atoms.
The electrostatic potential energieseV1, eV2 andeV3, pro-duced by solvent molecules at the centers of D+, A1− andA2, respectively, were calculated after every three time stepsof the equilibrium trajectory of the system and were recordedsequentially during the production period of the simulation.Long-range electrostatic interactions were included into thepotential experienced by each subunit of the triad by apply-ing an anisotropic approximation to the Ewald summation[61]. In this approximation the Ewald potential for a pair ofpoint charges is given by the formula
E(r) = 1
r+ a1r
2 + a2r4 + a3r
6 + a4r8 + a5T4 + a6T6
+a7T8 + a8T4r2 + a9T6r
2 + a10T4r4 (1)
whereTn = xn +yn +zn, andr = (x2 +y2 +z2)1/2 denotesthe distance between the test charge at each subunit of thetriad and a partial charge on a particular atom of an acetoni-
trile molecule. Distances inEq. (1)are expressed in units ofside length of the simulation box and the constantsa1 to a10have the following values: 2.094395,−4.506792, 6.651269,−10.86613, 7.511320, 17.07159, 60.53989,−23.27944,−113.0078, and 65.19680, respectively. Summation of theterms in Eq. (1), performed for all the partial charges ofall the acetonitrile molecules in the simulation box, givesthe electrical potential at each subunit of the triad. For-mula (1) is relatively simple and allows us to obtain moreprecise values for the interaction energy than the sphericalapproximations to the Ewald sum.
The potential energy differencese�V21 = e(V2−V1) be-tween the A1− and D+ subunits ande�V23 = e(V2 − V3)
between the A1− and A2 subunits are the random variables,which we denote asq1 andq2, respectively. These randomvariables are the appropriate reaction coordinates for de-scription of the competitive backward and forward ET reac-tions in the ionic triad system[29,30,62].
The joint probability distribution functionϕ(q1, q2) of thevariablesq1 and q2 and the marginal probability distribu-tionsϕi(qi) of particularqi’s for all considered angular ar-rangements of the triad were constructed as histograms ofthe data collected during the equilibrium (production) periodof the simulations. The performed simulation runs allowedus to obtain relatively smooth 1D and 2D probability distri-bution functions. They were also sufficient for calculationof the time auto-correlation and cross-correlation functions(seeSection 3.2), which characterize the classical dynamicsof the considered random variables. The calculations wereperformed on the IBM RISC System/6000 Power Clusterwhich executes 134 Mflops in a one-processor computation.
3. Results and discussion
3.1. Static stochastic properties of the reactioncoordinates
For the D+–A1−–A2 state, that we refer to as redoxState I, the back ET can lead to the ground state D–A1–A2(State 0) and the forward ET to the charge-separated stateD+–A1–A2− (State II). The differences between energiesof the States I and 0 or I and II correspond, respectively, tothe energy gaps for the backward or forward transfers. As-suming that the electron interacts with its environment onlyelectrostatically, each of these energy gaps can be expressedby the difference in the electrostatic energy of the transferredelectron before and after transfer, i.e., byq1 = e�V21 =e(V2 −V1) for the backward andq2 = e�V23 = e(V2 −V3)
for the forward ETs. The electrostatic potentialsV2, V1 andV3 are generated by the solvent at the positions of the actualelectron donor A1− (unit 2) and the acceptor D+ (unit 1)and A2 (atom 3), respectively.
We applyq1 and q2 as the reaction coordinates for thecompetitive ET processes in our ionic triad and connectthe rates of these ETs with the joint probability distribution

86 M. Hilczer, M. Tachiya / Journal of Photochemistry and Photobiology A: Chemistry 158 (2003) 83–100
functionϕ(q1, q2) constructed for the solvated D+–A1−–A2system. Within the framework of the linear response approx-imationϕ(q1, q2) is a 2D Gaussian
ϕ(q1, q2) = 1
2πσ1σ2
√1 − ρ2
exp
{− 1
2(1 − ρ2)
[(q1 − m1
σ1
)2
− 2ρq1 − m1
σ1
q2 − m2
σ2+
(q2 − m2
σ2
)2]}
(2)
wherem1 = 〈e�V21〉I andm2 = 〈e�V23〉I are the ensembleaverages
σ21 = 〈δq2
1〉I = 〈(e�V21 − m1)2〉I ,
σ22 = 〈δq2
2〉I = 〈(e�V23 − m2)2〉I (3)
are the fluctuations or variances of the respective potentialenergy differences calculated for the redox State I, and
ρ = 〈δq1δq2〉I
σ1σ2(4)
is the correlation coefficient expressed by the covarianceσ2
12 = 〈δq1δq2〉I of the random variablesq1 andq2.Linear response theory predicts also that the probability
distribution functionϕi(qi) of each reaction coordinateqi(i = 1, 2) is a 1D Gaussian. Parametersmi, σi2, andρ ofthe 1D and 2D Gaussians depend on the angular arrange-ment of the triad subunits and we calculate them directlyfrom the results of MD simulations. The obtained values ofmi andσi2 together with their statistical errors are listed inTable 1. To estimate the errors we use a standard proceduredescribed in[59]. The error of a meanmi is expressed byσi divided by the square root of the number ofuncorrelatedsolvent structures, i.e., asσi
√fsi/nrun, wherenrun stands
for a total number of structures collected during the simula-tion andfsi is a statistical inefficiency factor estimated froma respective time auto-correlation function (cf.Fig. 5). Thisfactor was dependent on the triad geometry and its valuesfor all considered means were within an interval from 50 to
Table 1Parameters of Gaussian distributions of the reaction coordinatesq1 = e�V21 andq2 = e�V23, and the potentialseVi, which are generated by the solventon particular triad subunitsa
β = 60◦ β = 90◦ β = 120◦ β = 180◦
Backward ET,q1
m1 4.792± 0.009 4.841± 0.009 4.849± 0.008 4.881± 0.009σ2
1 0.128± 0.003 0.128± 0.003 0.129± 0.003 0.136± 0.003
Forward ET,q2
m2 2.052± 0.008 1.308± 0.007 1.021± 0.007 0.854± 0.008σ2
2 0.116± 0.003 0.111± 0.002 0.110± 0.002 0.120± 0.003
D+ subunit〈eV1〉 −2.556± 0.008 −2.615± 0.008 −2.616± 0.007 −2.630± 0.007〈δ(eV1)
2〉 0.122± 0.002 0.117± 0.002 0.119± 0.002 0.120± 0.002
A1− subunit〈eV2〉 2.236± 0.007 2.226± 0.007 2.233± 0.007 2.250± 0.007〈δ(eV2)
2〉 0.090± 0.002 0.090± 0.002 0.088± 0.002 0.094± 0.002
A2 subunit〈eV3〉 0.184± 0.007 0.918± 0.007 1.212± 0.007 1.396± 0.007〈δ(eV3)
2〉 0.105± 0.002 0.103± 0.002 0.106± 0.002 0.103± 0.002
a The mean values are in eV and variances in eV2.
80 (fsi’s obtained form1 were higher than those form2). Theerrors in variances are determined by employing Eq. (6.23)
of [59]. Figs. 1 and 2present the distributionsϕi(qi) for thereaction coordinatesqi associated with the backward andforward ETs, respectively. Dotted lines in the figures showϕi(qi) calculated as histograms from the respective MD data,whereas full lines are the Gaussian approximations to thesehistograms. The latter are calculated by the nonlinear re-gression method based on the Levenberg–Marquardt mini-mization algorithm. For all fittings performed the chi-squarevalues do not exceed 2.8 × 10⁻⁴ eV−2 and the standard er-rors obtained for Gaussian parametersm andσ are of theorder of 0.001 eV. The optimized values ofmi andσ2
i agree,within the estimated errors, with the corresponding MD val-ues given inTable 1.
The spatial arrangement of the D+–A1−–A2 system hasrather small influence onϕ1(q1). The position ofϕ2(q2) de-pends, however, considerably on the triadshape. To explainthese relations we compare the parameters of the Gaus-sian distributions for the reaction coordinatesq1 = e�V21andq2 = e�V23 with those for the electrical potentialeVi(i = 1,2,3) produced by the solvent separately on eachcomponent of the triad. The respective data are includedin Table 1. The average potential at the center of D+ andA1− does not depend considerably on the triad geometry.On the contrary, the value of〈eV3〉 depends strongly onthe triad shape and this dependence results mainly in theaforementioned shift of the distribution function of the re-action coordinateq2. The positive electrostatic potential atthe center of the uncharged moiety A2 shows an asymmetry

M. Hilczer, M. Tachiya / Journal of Photochemistry and Photobiology A: Chemistry 158 (2003) 83–100 87
Fig. 1. Distributions of the reaction coordinateq1 = e�V21 connected with the back ET for the regular triangle (β = 60◦) and linear (β = 180◦) systemD+–A1−–A2 in acetonitrile atT = 291 K. β is the angle between directions of the D+–A1− and A1−–A2 bonds. Results of the MD simulation (dashedline) are fitted by the Gaussian function (full line).
in solvation of the triad system. This asymmetry is also seenin the solvation energies of the charged species. Multiplyingthe average potential at a given subunit by a charge locatedon the subunit, we obtain the electrostatic solvent–soluteinteraction energyEel. Yu and Karplus[63] showed thatthis quantity can approximate quite reasonably the electro-static free energy of solvationFel via the relationFel ∼=0.5Eel. The energyFel calculated for the cation subunitof the triad appears to be more negative than that for the
Fig. 2. Distributions of the reaction coordinateq2 = e�V23 connected with the forward ET for different arrangements of the D+–A1−–A2 triad. Resultsof the MD simulations (dashed lines) are fitted by the Gaussian functions (full lines). Acetonitrile solution,T = 291 K.
A1−. A similar result was found for free, simple ions sol-vated in acetonitrile[64] and also for the molecular ionsN,N-dimethylaniline+ and anthracene− in the same solvent[65].
The width of the electrostatic potential difference distri-butionϕi(qi) is related to the solvent reorganization energyλi, via
σ2i (β) = 2kBTλi(β) (5)

88 M. Hilczer, M. Tachiya / Journal of Photochemistry and Photobiology A: Chemistry 158 (2003) 83–100
Fig. 3. Correlation coefficientρ between reaction coordinatesq1 andq2 as a function of the angleβ calculated for the D+–A1−–A2 triad (black circleswith error bars) and for the corresponding neutral system D–A1–A2 (open circles with error bars).
The reorganization energies associated with the backwardand forward ETs are, on the average, 2.60±0.06 and 2.28±0.05 eV, respectively, and their dependence on the spatialarrangement of the triad is rather weak.
Fig. 3 presents the coefficient of correlationρ betweenreaction coordinatesq1 andq2 as a function ofβ. The val-ues ofρ(β) for the ionic triad are shown as black circles,whereas open circles show the correlation coefficients ob-tained for the corresponding neutral system D–A1–A2[32].Errors in the MD values ofρ(β), which are presented inthe figure, were calculated for ionic and neutral triads as[1 − ρ2(β)]/
√fsi/nrun. The correlation between reaction
coordinates for the ionic triad is considerably weaker com-pared with that for the neutral triad. In the latter systemmotions of solvent molecules are constrained mostly by thehindered rotation effects. In the former system, however, wehave additionally strong electrostatic interactions betweenthe ionic components of the triad and the partial chargesdistributed on the acetonitrile molecules. Clearly, these in-teractions reduce correlation between quantities that dependon fluctuations in molecular arrangement in the vicinity ofthe triad.
3.2. Dynamical stochastic properties of the reactioncoordinates
To characterize the dynamical behavior of the solvent andits relation to that of the reaction coordinates, we employ twokinds of equilibrium time auto-correlation functions (tacfs)defined by the relations
CVi(t) = 〈δVi(0)δVi(t)〉I
σ2Vi
, i = 1,2,3 (6)
with i running over the triad subunits D+, A1−, and A2,respectively, and
Ci(t) = 〈δqi(0)δqi(t)〉I
σ2i
, i = 1,2 (7)
for the reaction coordinatesq1 andq2. δVi(t) stands for theinstantaneous fluctuation of the electrical potentialVi(t) atthe center ofith moiety of the triad from its equilibriumaverage value andδqi(t) is the fluctuation of the coordinateqi(t). The error of a time correlation functionC(t) is generallyexpressed as(2t′cor/trun)
1/2[1−C(t)], wheret′cor is a modifiedcorrelation time obtained by integration ofC2(t) and trunis the production period of the simulation[59]. Thus, theerror of C(t) is 0 at t = 0, but it tends to(2t′cor/trun)
1/2 atlong time. With t′cor estimated for our model systems andthe production periods of about 700 ps, the long-time errorsfor all considered correlation functions are lower than 0.02.
Fig. 4presents the functionsCVi(t) calculated for variousconfigurations of the D+–A1−–A2 system on the basis ofMD simulations. In the framework of the linear responseformalism these functions are equivalent to the responsefunctions, which describe the solvation energy relaxationfollowing the solute charge jump[64]. The common featureof all functions plotted inFig. 4is that nearly 60% of the totalchange in solvation energy is achieved within the first 100 fs.The next 100 fs is sufficient for more than 90% relaxation ofthe solvation energy. The average relaxation time〈τ〉, whichcan be estimated by integration of tacf, depends on the choiceof the triad subunit as well as on the spatial arrangementof the triad. It is the longest for A1− unit (0.18 ps for theregular triangle to 0.21 ps for the linear triad) and changesfrom 0.15 to 0.18 ps in the case of D+. It is worth notingthat the above values of〈τ〉 agree quite reasonably with

M. Hilczer, M. Tachiya / Journal of Photochemistry and Photobiology A: Chemistry 158 (2003) 83–100 89
Fig. 4. Time auto-correlation functions of fluctuation in the electricalpotential (Eq. (9)) produced by the acetonitrile molecules at the centers ofeach component of the triad calculated for different values of the angleβ.
the longitudinal relaxation timeτL which was estimated forliquid acetonitrile at 298 K as 0.2 ps[66]. The shortest〈τ〉of the order of 0.12–0.14 ps is obtained for the atom A2 ofthe triad.
The above-mentioned values of〈τ〉 allow us to assume thatthe average solvation energy relaxation time for the wholetriad of any shape should not exceed〈τ〉max = 0.21 ps. Inthe present paper we describe the nonadiabatic ETs in theionic triad using the equilibrium distribution in the free en-ergy surfaces of the solvated D+–A1−–A2 systems. Suchan approach is justified if the decay rate of the ionic triad,namely, the sum of rate constants for the backward (k1) andforward (k2) ETs is much smaller than 1/〈τ〉max ≈ 4.8 ps−1.The ETs considered in the present work meet this condition.The time of the order of〈τ〉max is necessary also to completethe solvation of the D+–A1−–A2 triad, which arises fromthe respective neutral system by ET between the excited Dand A1. Thus, for the rate constantsk1 andk2 considerablyslower than 4.8 ps−1 we can neglect, in the first approxima-tion, the effect of thermal equilibration of the ionic triad onthe backward and forward ETs.
The decay of a fast component of the solvation responsein the vicinity of a particular triad subunit can be estimated
by fitting the early part of each tacf by the Gaussian functionexp[−t2/(2τ2
sh)] with a characteristic short-range correlationtime τsh. The fittings performed over the time interval from0 to 54 fs giveτsh = 83–86 fs for the neutral subunit A2and about 78 fs for the D+ and A1−. The fast part of thesolvation response is governed by small amplitude inertialmotions (mostly rotations) of solvent molecules in the closevicinity of the solute[64]. These motions should be slightlyfaster around the ionic components of the triad than aroundthe neutral subunit and this is indeed reflected in the valuesof τsh. It seems that the aforementioned ordering of theaverage relaxation times〈τ〉, which is opposite for the ionicand neutral triad components to that ofτsh, results from theslow, diffusive part of the solvation response. Most importantcontribution to this response comes from the reorganizationof the first solvation shell of the triad. The shell is looserand less ordered around the A2 than around the D+ andA1− (cf. Section 3.4) and this difference is the reason whythe overall relaxation process is faster in the vicinity of theneutral moiety A2. Different behaviors ofτsh and 〈τ〉 forionic and neutral subunits of the triad are reflected in thebehaviors ofτsh and〈τ〉 for the reaction coordinatesq1 andq2 as shown below.
Fig. 5presents the equilibrium time correlation functions(7) of fluctuations in the reaction coordinates associated withthe backward and forward ETs and calculated for variousspatial arrangements of the D+–A1−–A2 system on the basisof MD simulations. The oscillations inC1(t) are more clearand the overall relaxation process described by this func-tion for all triad arrangements is slightly slower in compar-ison with C2(t). The average relaxation times〈τ〉 obtainedby integration of (7) are 0.19–0.24 ps for the backward co-ordinateq1, and 0.15–0.19 ps for the forward coordinateq2.On the other hand, from the short-time Gaussian fittings tothe tacfs for reaction coordinates we obtainτsh within theinterval from 80 to 85 fs, but at eachβ the value forq1 isslightly smaller than that forq2. It is interesting to note thatτsh for the two competitive ETs in the D+–A1−–A2 areshorter thanτsh for the reaction coordinate associated withthe ET between the excited donor D∗ and the acceptor A1in the neutral triads of various shape. The latter time wasestimated in[32] as 92–98 fs.
To complete the study on the dynamical properties of thereaction coordinates, we construct the time cross-correlationfunctions (tccfs) of the form
CcrossV2−Vi
(t) = 〈δV2(0)δVi(t)〉I
ρ2iσV2σVi
(8)
and
Ccross(t) = 〈δq2(0)δq1(t)〉I
ρσ1σ2(9)
which describe the decay of the correlation between a par-ticular pair of random quantities. InEq. (8)Vi correspondsto the electrical potential at D+ or A2, andρ21 andρ23 arethe ensemble-averaged values of the correlation coefficients
90 M. Hilczer, M. Tachiya / Journal of Photochemistry and Photobiology A: Chemistry 158 (2003) 83–100
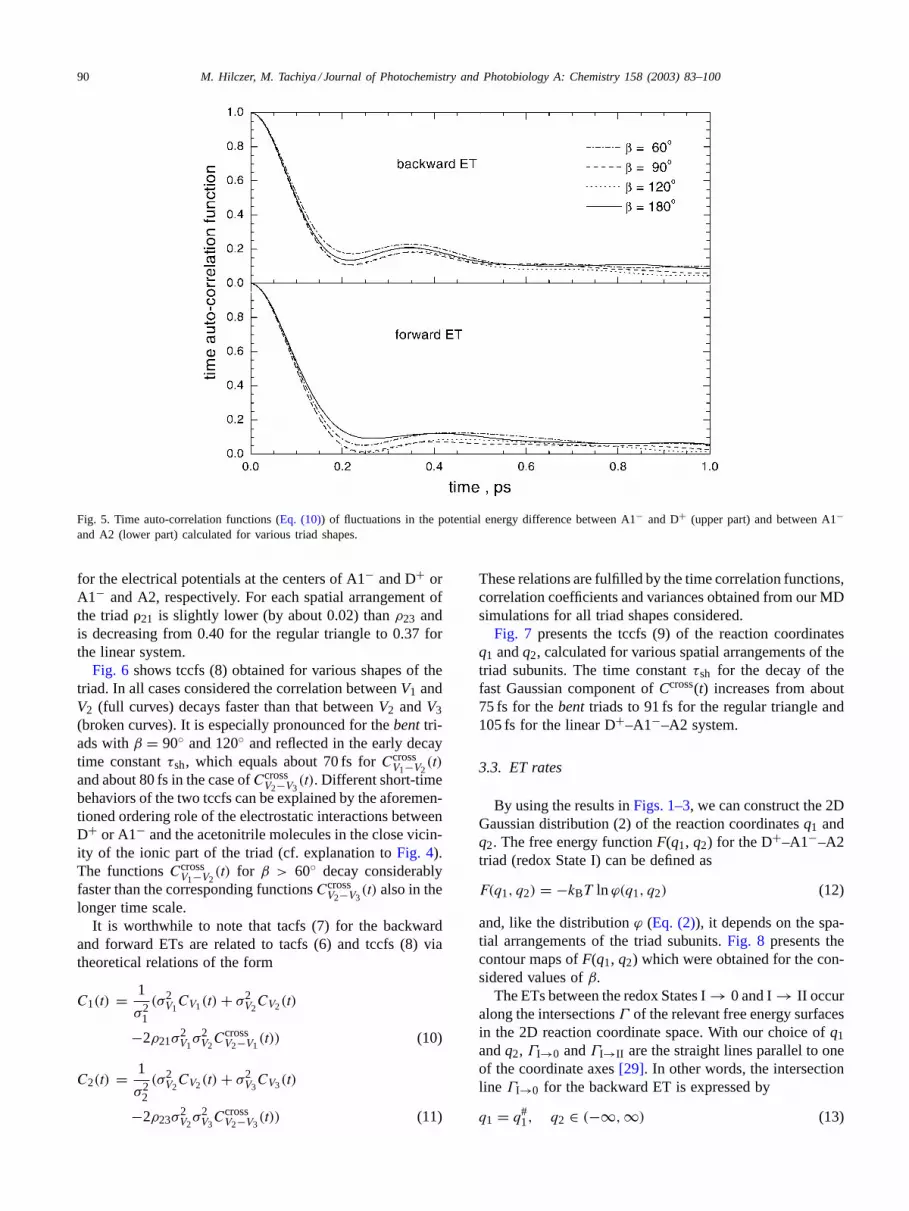
Fig. 5. Time auto-correlation functions (Eq. (10)) of fluctuations in the potential energy difference between A1− and D+ (upper part) and between A1−and A2 (lower part) calculated for various triad shapes.
for the electrical potentials at the centers of A1− and D+ orA1− and A2, respectively. For each spatial arrangement ofthe triad�21 is slightly lower (by about 0.02) thanρ23 andis decreasing from 0.40 for the regular triangle to 0.37 forthe linear system.
Fig. 6 shows tccfs (8) obtained for various shapes of thetriad. In all cases considered the correlation betweenV1 andV2 (full curves) decays faster than that betweenV2 andV3(broken curves). It is especially pronounced for thebenttri-ads withβ = 90◦ and 120◦ and reflected in the early decaytime constantτsh, which equals about 70 fs forCcross
V1−V2(t)
and about 80 fs in the case ofCcrossV2−V3
(t). Different short-timebehaviors of the two tccfs can be explained by the aforemen-tioned ordering role of the electrostatic interactions betweenD+ or A1− and the acetonitrile molecules in the close vicin-ity of the ionic part of the triad (cf. explanation toFig. 4).The functionsCcross
V1−V2(t) for β > 60◦ decay considerably
faster than the corresponding functionsCcrossV2−V3
(t) also in thelonger time scale.
It is worthwhile to note that tacfs (7) for the backwardand forward ETs are related to tacfs (6) and tccfs (8) viatheoretical relations of the form
C1(t) = 1
σ21
(σ2V1CV1(t) + σ2
V2CV2(t)
−2ρ21σ2V1σ2V2CcrossV2−V1
(t)) (10)
C2(t) = 1
σ22
(σ2V2CV2(t) + σ2
V3CV3(t)
−2ρ23σ2V2σ2V3CcrossV2−V3
(t)) (11)
These relations are fulfilled by the time correlation functions,correlation coefficients and variances obtained from our MDsimulations for all triad shapes considered.
Fig. 7 presents the tccfs (9) of the reaction coordinatesq1 andq2, calculated for various spatial arrangements of thetriad subunits. The time constantτsh for the decay of thefast Gaussian component ofCcross(t) increases from about75 fs for thebent triads to 91 fs for the regular triangle and105 fs for the linear D+–A1−–A2 system.
3.3. ET rates
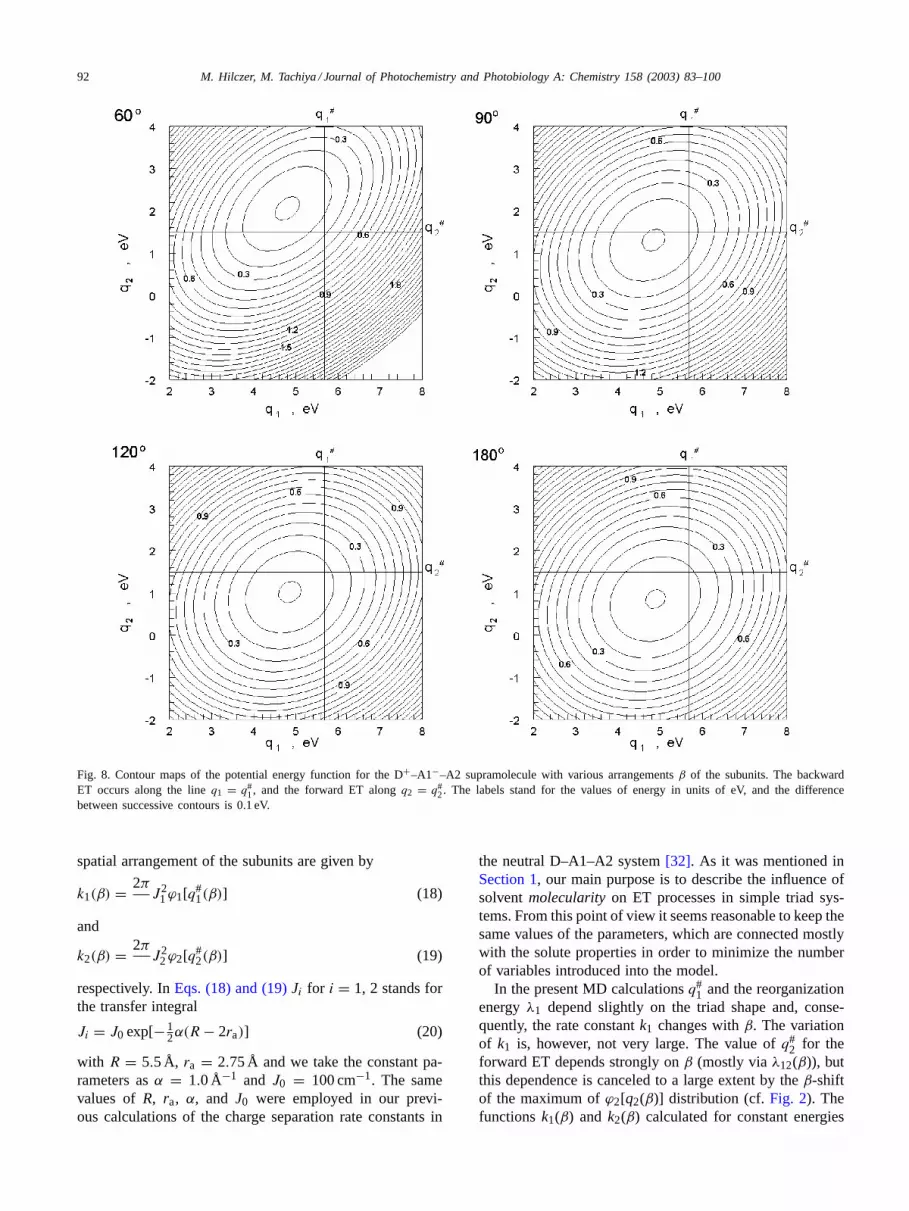
By using the results inFigs. 1–3, we can construct the 2DGaussian distribution (2) of the reaction coordinatesq1 andq2. The free energy functionF(q1, q2) for the D+–A1−–A2triad (redox State I) can be defined as
F(q1, q2) = −kBT ln ϕ(q1, q2) (12)
and, like the distributionϕ (Eq. (2)), it depends on the spa-tial arrangements of the triad subunits.Fig. 8 presents thecontour maps ofF(q1, q2) which were obtained for the con-sidered values ofβ.
The ETs between the redox States I→ 0 and I→ II occuralong the intersectionsΓ of the relevant free energy surfacesin the 2D reaction coordinate space. With our choice ofq1andq2, ΓI→0 andΓI→II are the straight lines parallel to oneof the coordinate axes[29]. In other words, the intersectionline ΓI→0 for the backward ET is expressed by
q1 = q#1, q2 ∈ (−∞,∞) (13)

M. Hilczer, M. Tachiya / Journal of Photochemistry and Photobiology A: Chemistry 158 (2003) 83–100 91
Fig. 6. Time cross-correlation functions (Eq. (11)) for the electrical po-tentials produced by the acetonitrile molecules on the D+ and A1− (fullline) and on the A1− and A2 (broken line) calculated for various valuesof the angleβ.
Fig. 7. Time cross-correlation functions (Eq. (12)) of fluctuations in the reaction coordinatesq1 and q2 calculated for various triad shapes.
whereas relations
q1 ∈ (−∞,∞), q2 = q#2 (14)
describeΓI→II associated with the forward ET. These inter-section lines are shown schematically inFig. 8. The valuesof q#
1 andq#2 depend on the triad configuration and for each
value ofβ are given by[29]
q#1(β) = λ1(β) − �G1 (15)
q#2(β) = −λ2(β) + 2λ12(β) − �G2 (16)
where�G1 and�G2 are the free energy changes,λ1 andλ2 are the reorganization energies (Eq. (5)) andλ12(β) =σ2
12(β)/2kBT .The reaction rate constantk for a given transition is pro-
portional to the probability of finding the system along therespective intersection lineΓ
k ∝∫∫
Γ
ϕ(q1, q2)dq1 dq2 (17)
Since the joint probability density functionϕ(q1, q2) is a2D Gaussian, the integral inEq. (17), with Γ defined byEqs. (13) and (14), reduces to the valueϕi(q
#i ) atqi = q#
i ofthe 1D normal distribution of the reaction coordinateqi. Inour approach the two ETs, atq1 = q#
1 andq2 = q#2, do not
interfere with each other because their rates are slower thanthe rate of the fluctuation of acetonitrile in the vicinity ofthe ionic triad. Thus, we could assume that the equilibriumfree energy surfaceF(q1, q2) is maintained and characterizeeach of the two ETs independently, using the respective 1Dfree energy curves[29–32].
The rate constants of charge recombination,kI→0 ≡ k1,and charge shift,kI→II ≡ k2, in the triad system with a given
92 M. Hilczer, M. Tachiya / Journal of Photochemistry and Photobiology A: Chemistry 158 (2003) 83–100
Fig. 8. Contour maps of the potential energy function for the D+–A1−–A2 supramolecule with various arrangementsβ of the subunits. The backwardET occurs along the lineq1 = q#
1, and the forward ET alongq2 = q#2. The labels stand for the values of energy in units of eV, and the difference
between successive contours is 0.1 eV.
spatial arrangement of the subunits are given by
k1(β) = 2πJ2
1ϕ1[q#1(β)] (18)
and
k2(β) = 2πJ2
2ϕ2[q#2(β)] (19)
respectively. InEqs. (18) and (19)Ji for i = 1, 2 stands forthe transfer integral
Ji = J0 exp[−12α(R − 2ra)] (20)
with R = 5.5 Å, ra = 2.75 Å and we take the constant pa-rameters asα = 1.0 Å−1 and J0 = 100 cm−1. The samevalues of R, ra, α, and J0 were employed in our previ-ous calculations of the charge separation rate constants in
the neutral D–A1–A2 system[32]. As it was mentioned inSection 1, our main purpose is to describe the influence ofsolventmolecularityon ET processes in simple triad sys-tems. From this point of view it seems reasonable to keep thesame values of the parameters, which are connected mostlywith the solute properties in order to minimize the numberof variables introduced into the model.
In the present MD calculationsq#1 and the reorganization
energyλ1 depend slightly on the triad shape and, conse-quently, the rate constantk1 changes withβ. The variationof k1 is, however, not very large. The value ofq#
2 for theforward ET depends strongly onβ (mostly viaλ12(β)), butthis dependence is canceled to a large extent by theβ-shiftof the maximum ofϕ2[q2(β)] distribution (cf.Fig. 2). Thefunctionsk1(β) and k2(β) calculated for constant energies

M. Hilczer, M. Tachiya / Journal of Photochemistry and Photobiology A: Chemistry 158 (2003) 83–100 93
Fig. 9. β-dependence of the ET rate constants for charge recombination,k1 (black circles with error bars), and charge shift,k2 (black squareswith error bars), in the ionic D+–A1−–A2 system as well as for the charge separation reactionsk0: D–A1–A2 → D+–A1−–A2 and k3:D–A1–A2 → D+–A1–A2− in the neutral triad obtained for the molecular model of the solvent. Calculations were performed for acetonitrile solutionsat 291 K with�G1 = �G2 = �G0 = −0.8 eV and�G3 = −1.6 eV. The curvesk0(β) and k3(β) are taken from[32].
�G1 = �G2 = −0.8 eV are presented inFig. 9. The sym-bols with error bars in the figure show the rate constantsk1andk2 for the triad configurations, for which we performedthe MD simulations. The full lines are obtained by utiliz-ing in Eqs. (15)–(19)the second-order polynomial fittingsto the MD values ofmi(β), λi(β) andλ12(β) performed forthe wholeβ-interval. The errors in rate constants are evalu-ated from the errors of the respective MD values of means,reorganization energies, and also (in the case ofk2) the co-variancesσ2
12(β) = 2kBTλ12(β). The errors ofσ212(β) were
calculated from the time cross-correlation functions[59] andtheir values for the considered triad arrangements are be-tween 4× 10⁻⁴ and 6× 10⁻⁴ eV2.
In the figure we show also the rate constantk0(β) of thecharge separation reaction D–A1–A2→ D+–A1−–A2 cal-culated for the free energy change�G0 = −0.8 eV [32].As can be seen the functionsk1(β), k2(β) and k0(β) dif-fer appreciably from each other. To complete the compar-ison we plot additionally the rate constantsk3(β) of thecharge separation reaction: D–A1–A2→ D+–A1–A2− ob-tained from MD results for�G3 = −1.6 eV [32]. With ourchoice of�Gi the MD value ofk3 for the linear systemis rather small, whereas the successive steps: D–A1–A2→D+–A1−–A2 → D+–A1–A2− occur with rates 86.8 and39.4�s−1, respectively. On the other hand, the back ET thatreforms the neutral system D–A1–A2 is about 18 times fasterthan the forward reaction.
Relation between the calculated rate constantsk1 andk2inverts if we assume more negative values of the free energychange. It is illustrated inFig. 10, which presents the energygap law for these two processes in the case of the linear
arrangement of the triad subunits. In the inverted region ofboth reactions, i.e., for�G beneath−2.4 eV, the charge shiftoccurs up to one order of magnitude faster than the chargerecombination.
To characterize the relation between the rates of the com-petitive ETs in the ionic supramolecule D+–A1−–A2 wedefine theβ-dependent quantityK2
K2(β) = k2(β)
k1(β) + k2(β)(21)
which we call the yield of the forward ET. For the purposeof the following comparison we assume equal values of thetransfer integralsJ1 = J2 in Eq. (21). The yieldK2 is pre-sented inFig. 11 as a function ofq#
2 for different arrange-ments of the triad subunits. All curves are plotted for theconstant difference|q#
1(β)− qmin1 (β)| equal to 0.8 eV, where
qmin1 (β) ≡ m1(β) denotes the value ofq1(β) at the mini-
mum of the free energy surfaceF(q1, q2) constructed for theionic system D+–A1−–A2 with a given geometry (seeFig.8). The functionK2(q#
2) has a flat maximum, which shiftsby about 1.3 eV towards lower values of energy whenβ in-creases from 60◦ to 180◦. The maximum values of the yieldK2 exceed 0.9 for all triad arrangements considered.
The shape and height of the functionK2(q#2) depend, how-
ever, on the assumed value ofq#1. Fig. 12 shows the func-
tions obtained from MD calculations for the regular trian-gle and linear D+–A1−–A2 triads and for various values of|q#
1(β) − qmin1 (β)| = δ1. As can be expected, the smallest
K2 are obtained in both cases forδ1 = 0, i.e., when the rateconstantk1 achieves its maximum value.

94 M. Hilczer, M. Tachiya / Journal of Photochemistry and Photobiology A: Chemistry 158 (2003) 83–100
Fig. 10. Energy gap law for the backward ET (k1) and the forward ET (k2). The linear triad system D+–A1−–A2 in acetonitrile solvent at 291 K.
In the design of molecular devices for storing solar en-ergy it is important to reach a relatively high value ofK2 andto accumulate a large amount of energy�Estor = �G2 −�G1 in a final charge-separated state. Hence, it can be in-teresting to analyze results of the present model from theenergy-storage point of view for the D+–A1–A2− triad asa final state.Fig. 13shows the contour map of the productK2�Estor as a function of the free energy changes�G1 and�G2 of the backward and forward ETs in the D+–A1−–A2supramolecule with geometry described by the angleβ =180◦. As can be seen, the productK2�Estor increases withthe decrease of both�G1 and�G2 and is close to 1 for
Fig. 11. Yield of the forward ET,K2, as a function ofq#2 for different arrangements (β = 60, 90, 120, and 180◦) of the D+–A1−–A2. qmin
1 is the valueof q1 at the minimum of the respective free energy surfaceF(q1, q2). FunctionsK2(q#
2) are calculated for a constant difference of 0.8 eV betweenq#1(β)
and qmin1 (β). Acetonitrile solutions, 291 K.
�G1 lower than−3 eV. Such low values of�G1 correspondto the inverted Marcus region of the charge recombinationreaction (cf.Fig. 10) with δ1 = q#
1 − qmin1 larger than 0.8 eV
(seeFig. 12). Let us take a fixed value of�G1, say−3 eV. Inthis case the rate constant of the backward ET is also fixedat k1 = 0.12 ps−1 and the yieldK2 is maximized when therate constantk2 of the forward reaction is maximized. Thelargest value ofk2 is obtained when−�G2 becomes equalto the reorganization energyλ2, i.e., equal to 2.39 eV in thecase of the linear triad system. For more negative values of�G2 the value ofK2 and that of�G2−�G1 both decrease,so the productK2�Estor also decreases. On the other hand,

M. Hilczer, M. Tachiya / Journal of Photochemistry and Photobiology A: Chemistry 158 (2003) 83–100 95
Fig. 12. Yield K2 of the forward ET as a function ofq#2 for the D+–A1−–A2 triad with the linear (β = 180◦) and the regular triangle (β = 60◦)
geometry.q#1(β) is shifted fromqmin
1 (β) by δ1 = 0, 0.5, and 1 eV, respectively.
if we increase�G2 the value ofK2 decreases, but the valueof �G2 −�G1 increases and, consequently,K2�Estor mayincrease in some case. It follows from this argument thatthe value of�Gmax
2 , which maximizesK2�Estor should beslightly larger than−λ2. In the considered case we have�Gmax
2 = −1.88 eV and the optimized values of the rateconstantk2, the yieldK2, the energy�Estor, and the productK2�Estor are 0.5 ps−1, 0.81, 1.12 and 0.91 eV, respectively.Similar relation between�Gmax
2 andλ2 is held also for triadswith other arrangements of the subunits and the optimizedvalues ofK2, �Estor, and the productK2�Estor as functions
Fig. 13. Contour map of the quantityK2�Gstor, where�Gstor = �G2 − �G1, as a function of the free energy changes�G1 and�G2 of the forwardand backward ETs for the linear D+–A1−–A2 supramolecule.
of the angleβ characterizing the geometry of the triad, areplotted inFig. 14. The smallest value ofK2�Estor, whichhas been obtained forβ = 120◦, is lower by less than 18% inrelation to its largest value predicted for the regular triangletriad. The optimized yieldK2 does not depend practically onthe triad geometry and the forward reaction for all consid-ered systems is 3–4 times faster than the backward process.
The value of−�G2 obtained from our optimization islarger than that estimated for the natural RC and for the ma-jority of artificial molecular devices of the form D–A1–A2synthesized in order to capture solar energy. However, there

96 M. Hilczer, M. Tachiya / Journal of Photochemistry and Photobiology A: Chemistry 158 (2003) 83–100
Fig. 14. Dependence of the yieldK2 of the forward ET, the energy�Gstor = �G2 − �G1 accumulated in the D+–A1–A2− state, and the product ofthese two quantitiesK2�Gstor on the geometry of the D+–A1−–A2 triad. The free energy change of the charge recombination reaction is assumed tohave a constant value�G1 = −3 eV.
are systems for which at least the free energy change�G1of the charge recombination reaction in D+–A1−–A2 is notvery different from our optimized value and the reactionitself occurs in the inverted Marcus region. For instance,Lawson et al.[25] considered the series of compounds, inwhich three chromophores: DMA (N,N-dimethylaniline),DMN (dimetoxynaphthalene), and DCV (dicyanovinyl), areconnected via bridges comprising several linearly fused nor-bornyl and bicyclo[2.2.0]hexyl units[25]. The Gibbs freeenergies−�G1 and−�G2 estimated for this triad in ace-tonitrile are of the order of 3.5 and∼1 eV, respectively. Inbenzene solution the value of�G2−�G1 is even higher andequals 3.4 eV. Thus, the efficiency of energy storage in theirsystem is better than in our optimization. Another exampleis a UV-absorbing molecular triad based on aromatic imidechromophores, for which−�G1 and−�G2 in toluene so-lution are equal to about 2.7 and 0.9 eV, respectively[26].The authors estimated also the rate constant of the forwardET for their triad as 2.3 ns−1. Imahori et al.[27] synthe-sized a porphyrin–pyromellitimide–C60 triad with energylevels of the D∗–A1–A2, D+–A1−–A2, and D+–A1–A2−states equal to 2.06, 1.92 and 1.84 eV, respectively, andnearly equal rate constants for the forward and backwardETs (16 and 17 ns−1) in dioxane solution. Similarly, forthe triad ANI–NI–PI studied by Lukas at al.[67], whereANI is a 4-(N-piperidinyl)-1,8-naphthaleneimide electrondonor, and NI and PI are 1,8:4,5-naphthalenediimide andpyromellitimide acceptors, respectively, the ANI+–PI–NI−state in toluene solution lies approximately 0.08 eV belowthat of ANI+–PI−–NI. Additionally, the rate constant of theforward ET in ANI+–PI−–NI is more than two orders ofmagnitude larger than that for the backward reaction. Thus,according to our optimization criterion, this triad would be
an example of very efficient system for storing solar energy.In the triad designed by Osuka et al.[24] and composed offixed-distance porphyrin–oxochlorin–pyromellitdimide, theD∗–A1–A2, D+–A1−–A2, and D+–A1–A2− states in DMFhave energies 1.91, 1.75 and 1.46 eV, respectively. Theyfound that the polar solvent although enables the sequen-tial ETs: D∗–A1–A2 → D+–A1−–A2 → D+–A1–A2−, itenhances rate of the energy wasteful charge recombinationprocess in D+–A1−–A2, decreasing the quantum yield ofthe final, long-lived D+–A1–A2− state.
The aforementioned examples show that the value ofK2�Estor in solvents of high polarity is lower than thatin nonpolar solvents. Especially, the energy�Estor =�G2 − �G1 considerably decreases with the increaseof polarity of the environment. To maximize the productK2�Estor the free energy change of the forward reaction�G2 should have a small negative value. As we pointed inthe previous paragraph the solvent reorganization energyλ2connected with this reaction should be smaller than−�G2and this condition can be fulfilled rather by solvents of lowpolarity.
3.4. Solvent structure around the triad system
The time correlation functions inFigs. 4–7show clearlydifferences in dynamics of the random variableseVi ande(Vi − Vj) constructed for the electrostatic potentials ondifferent subunits of the D+–A1−–A2 system with vari-ous geometry described by the angleβ. These differencescan be connected with the average arrangement of solventmolecules around the triad, which is characterized for agiven β by a set of solute–solvent radial distribution func-tions (RDFs). Using molecular configurations generated in

M. Hilczer, M. Tachiya / Journal of Photochemistry and Photobiology A: Chemistry 158 (2003) 83–100 97
Fig. 15. RDFs describing the radial distributions of the particular sites ofthe acetonitrile molecules from D+ (upper part), A1− (middle part), andA2 (lower part) subunits of the triad withβ = 120◦. C1 and C2 stand forcarbon sites of the methyl and cyanide groups, respectively.
equilibrium simulation runs, we calculated four sets of theRDFs for distances between each subunit of the triad andeach site (atom) of the acetonitrile molecules.
Fig. 15shows these RDFs obtained for the triad with an-gle β = 120◦. The functions in the figure can be directlycompared with the atom-site RDFs of[32] for the neutraltriad D–A1–A2. As expected, the presence of charge on D+and A1− results in a very strong correlation of acetonitrilemolecule positions in the vicinity of the triad. The strongestcorrelation occurs for the N sites around D+ ion. The firstpeak height of the D+–N RDF equals 6.21 as compared to1.12 for that of the D–N function in[32]. The former peakis also considerably higher than the first maximum of theD+–C2 g(r) that is shifted from the former peak by 0.85 Åtowards largerr. The integrated coordination numbers upto the first minimum of these two RDFs arenN = 7.8 andnC2 = 8.0, respectively. Since the C2 site is close to the cen-ter of mass of CH3CN, we can say that the latter minimumat r = 5.3 Å defines the first solvation layer of D+. Thus,eight acetonitrile molecules forming this layer have their ni-trogens directed toward the cation. From the positions ofthe main peaks of the N and C2 RDFs we can infer that the
average orientation of these solvent molecules is character-ized by the angle∠(D+–N–C2) ≈ 130◦. The spatial extentof the first solvation shell of D+ is shorter by 1.35 Å thanthat of the D atom in the neutral triad.
The closest to the A1− moiety of the triad are hydrogensof acetonitrile molecules. We obtained identical RDFs foreach proton of the CH3 group. The A1−–H g(r) has twodistinct maxima, one at 3.05 Å and the other at 4.55 Å. Itindicates that rotation of the methyl group is considerablylimited in the vicinity of the anion. The minimum betweenthe two hydrogen peaks is at 3.95 Å and it corresponds tothe position of the first maximum in the A1−–C1 RDF.This maximum together with the first peak of the A1−–C2RDF shows that acetonitrile molecules in the vicinity ofthe anion prefer orientations for which the average angle∠(A1−–C1–C2) = 109.7◦. The integration of the A1−–C1g(r) up to 3.95 Å givesnC1 = 3.33 and the first maximum ofthe hydrogen RDFs corresponds to 2.78 atoms. These dataand a detailed analysis of the H, C1 and C2 RDFs suggestthat one of the methyl protons can be directed towards theA1− with the average angle∠(A1−–C1–H) ≈ 30◦. The dis-tribution of positions of the other two protons is describedby the second maximum of the A1−–H functions. The firstminimum of the anion-C1 RDF is at 5.75 Å and the inte-grated coordination number up to this point isnC1 = 9.18.The first coordination shell of A1− as composed of nineacetonitrile molecules was confirmed also by integration ofC2 and H RDFs. The spatial extend of this shell is equalto 5.95 Å.
The A2-site RDFs are similar to the distribution functionspresented in[32] for the side atoms of the neutral triad.Correlation of the methyl group positions around A2 is,however, slightly stronger for the D+–A1−–A2 system. Forexample, the ratio of the peak heights of the C1 RDFs for thetwo triads is equal to 1.36. The minimum of the A2–C2 RDFis at 6.75 Å and we can expect 12 or 13 solvent moleculesin the first solvation layer of the atom A2.
The concentration of C2 sites in the first solvation shellof the cation equalscs(D+) = 0.017 Å−3 and we can as-sume that this value corresponds to the concentration of sol-vent molecules around D+. Note thatcs(D+) is substantiallyhigher as compared to the corresponding values for boththe bulk acetonitrile (0.012 Å−3) and the vicinity of the Datom in the neutral triad (0.010 Å−3). The average concen-tration of the C2 sites in the neighborhood of the ion A1− iscs(A1−) = 0.013 Å−3. However, the concentration of pro-tons in the close vicinity of the anion is much higher andequals 0.056 Å−3. These data clearly show that the relax-ation process around A1− should be affected by very strongsteric effects, which slow down the rotation of acetonitrilemolecules in this region. Thus, it is not surprising that theaverage relaxation time〈τ〉, estimated by integration of thetime correlation function (6), is longer for A1− than forD+. The shortest〈τ〉 obtained for A2 is consistent with thesmallest solvent concentrationcs(A2) = 0.011 Å−3, whichwas estimated from the first peak of the A2–C2 RDF.

98 M. Hilczer, M. Tachiya / Journal of Photochemistry and Photobiology A: Chemistry 158 (2003) 83–100
The RDFs for other spatial arrangements of the triad aresimilar to the functions presented inFig. 15. It is interestingto note, however, that all the RDFs for the linear triad startat distancesrst, which are much shorter as compared torstfor other triad shapes. The integrated coordination numbersfor these small distances are very low. The most pronouncedvariations withβ are observed among the RDFs for A2 moi-ety. For instance, the intensity of the first peak of the A2–C1RDF is considerably lower for a regular triangle than forother arrangements of the triad. The integrated coordinationnumbernC1 to the first minimum of the C1 function is 9.1for β = 60◦ and rises to 10.4 in the case of the linear sys-tem. Correlation of proton positions around A2 is also theweakest forβ = 60◦. The solvation shell of A2 in the regu-lar triangle system has a radius of 6.55 Å and it contains 11acetonitrile molecules. This shell expands to 6.80 Å and 13acetonitriles asβ reaches 180◦.
Differences in the average solvent structure around triadscan be expressed globally by the radial charge distributionsshown inFig. 16. We calculated the total chargeT(r) in-side the sphere of radiusr around each subunit of a triadby evaluating the integrated coordination numbersnk(r) atthe distancer for all sites of the acetonitrile molecules and
Fig. 16. Total charge of the sites of the acetonitrile molecules, whichare enclosed within a sphere of radiusr around the D+ (full line), A1−(dashed line), and A2 (dotted line) subunits of the triads withβ = 60◦,90◦, 120◦ and 180◦, respectively, as a function ofr.
summingnk(r) multiplied by the respective partial chargesQk. In the figure we plottedT(r) as a function of the dis-tancer from the subunit D+, A1− and A2, respectively, forthe triads of various geometry. As can be seen, the chargedistributions around the ionic subunit D+ as well as thosearound the A1− are quite similar for allβ considered. Thefirst peak ofT(r) for the neutral moiety A2 is also indepen-dent on the triad shape. However, contribution from par-tial charges on more distant acetonitrile molecules causesdifference between distribution functions around A2 forvarious triads.
4. Concluding remarks
We have considered competition between the nonadia-batic charge separation D+–A1−–A2 → D+–A1–A2− andthe charge recombination D+–A1−–A2 → D–A1–A2 in amodel triad system D+–A1−–A2 immersed in acetonitrilesolvent at room temperature. To treat these ETs, we haveemployed two reaction coordinatesq1 = e(V2 − V1) andq2 = e(V2−V3), and constructed the 2D free energy surfaceF(q1, q2) for the triads of various geometry in acetonitrilesolutions by MD computer simulations. Each of the two re-actions occurs at the intersection of the free energy surfacesof the reactant and the respective product, and this inter-section is a straight line parallel to one of the coordinateaxes,q1 or q2. Positions of these lines can be changed bychanging electronic properties of the triad moieties. In thenonadiabatic limit the ET rate constant is expressed in termsof the equilibrium distribution in the free energy surface.
The stochastic properties of the reaction coordinates aswell as the triad geometry dependence of the ET rate con-stants obtained in our calculations differ considerably frompredictions of the models, in which the solvent is treated asa dielectric continuum. Dynamical properties of the reac-tion coordinates for the ionic and neutral systems are closelycorrelated with the dynamics of the solvent surrounding thetriads. The latter sometimes deviates significantly from ourexpectations based on the results for solvation of single neu-tral or ionic molecules.
Our calculations show the role of molecularity of the po-lar solvent in description of the competitive ET reactions be-tween subunits of the triad system modeled in the simplestpossible way. We hope that the present results can be a goodbasis for introducing further refinements and constructingmore realistic theoretical models of the photoinduced ETsin supramolecular systems.
The reorganization energies estimated in our calculationsfor the ionic triads are comparable with the values ofλ forthe corresponding neutral triads. They are higher, however,thanλ predicted on the basis of the continuum model of thesolvent for majority of synthesized supramolecular systems.To verify and improve our estimation ofλ it would be nec-essary to take into consideration the internal structure of asupramolecule that is usually composed of many atoms and

M. Hilczer, M. Tachiya / Journal of Photochemistry and Photobiology A: Chemistry 158 (2003) 83–100 99
characterized by spatial distribution of partial charges[65].The triad system constructed in our approach does not ex-emplify an efficient molecular device for capturing and stor-ing solar energy. The amount of energy stored in the finalcharge-separated state is too low, and a reasonably high yieldof the forward ET is obtained only under the assumption thatboth reactions are noticeably exoergonic. Our model, how-ever, adopts a very approximate expression for the transferintegral and does not discriminate between the strengths ofcoupling of the reactant state with that of each of the prod-ucts. Optimizing the values of the pre-exponential factors inthe rate constant formulas for both reactions we can improvethe relation between the backward and forward ET rates.
References
[1] D. Gust, T.A. Moore, Top. Curr. Chem. 159 (1991) 103.[2] D. Gust, T.A. Moore, A.L. Moore, Pure Appl. Chem. 70 (1998) 2189;
D. Gust, T.A. Moore, A.L. Moore, Acc. Chem. Res. 26 (1993) 198.[3] M.R. Wasielewski, Chem. Rev. 92 (1992) 435.[4] G.P. Wiederrecht, S. Watanabe, M.R. Wasielewski, Chem. Phys. 176
(1993) 601.[5] J.R. Bolton, N. Mataga, G. McLendon (Eds.), Electron Transfer
in Inorganic, Organic, and Biological Systems, American ChemicalSociety, Washington, 1991.
[6] F.S. Sterrett (Ed.), Alternative Fuels and the Environment, Lewis,Boca Raton, 1995.
[7] J.-P. Sauvage, J.-P. Collin, J.-C. Chambron, S. Guillerez, Ch. Coudret,V. Balzani, F. Barigelletti, L. De Cola, L. Flamingi, Chem. Rev. 94(1994) 993.
[8] V. Balzani, Tetrahedron 48 (1992) 10443.[9] V. Balzani, S. Campagna, G. Denti, S. Serroni, in: E. Kochanski
(Ed.), Photoprocesses in Transition Metal Complexes, Biosystemsand Other Molecules, Experiment and Theory, Kluwer AcademicPublishers, Dordrecht, 1992, p. 233.
[10] G. Denti, S. Campagna, L. Sabatino, S. Serroni, M. Ciano, V. Balzani,in: E. Pelizzetti, M. Schiavello (Eds.), Photochemical Conversion andStorage of Solar Energy, Kluwer Academic Publishers, Dordrecht,1991, p. 27.
[11] S.-C. Hung, A.N. Macpherson, S. Lin, P.A. Liddell, G.R. Seely, A.L.Moore, T.A. Moore, D. Gust, J. Am. Chem. Soc. 117 (1995) 1657.
[12] D. Gust, T.A. Moore, A.L. Moore, A.N. Macpherson, A. Lopez,J.M. DeGraziano, I. Gouni, E. Bittersmann, G.R. Seely, F. Gao, R.A.Nieman, X.C. Ma, L.J. Demanche, S.C. Hung, D.K. Luttrull, S.J.Lee, P.K. Kerrigan, J. Am. Chem. Soc. 115 (1993) 11141.
[13] P.A. Liddell, D. Kuciauskas, J.P. Sumida, B. Nash, D. Nguyen, A.L.Moore, T.A. Moore, D. Gust, J. Am. Chem. Soc. 119 (1997) 1400.
[14] D. Gosztola, M.P. Niemczyk, M.R. Wasielewski, J. Am. Chem. Soc.120 (1998) 5118.
[15] D. Carbonera, M. Di Valentin, C. Corvaja, G. Agostini, G.Giacometti, P.A. Liddell, D. Kuciauskas, A.L. Moore, T.A. Moore,D. Gust, J. Am. Chem. Soc. 120 (1998) 4398.
[16] G.R. Fleming, R. van Grondelle, Phys. Today 47 (1994) 48.[17] G. Steinberg-Yfrach, P.A. Liddell, S.-Ch. Hung, A.L. Moore, D.
Gust, T.A. Moore, Nature 386 (1997) 239.[18] G. Steinberg-Yfrach, J.-L. Rigaud, E.N. Durantini, A.L. Moore, D.
Gust, T.A. Moore, Nature 392 (1998) 479.[19] A. Harriman, F. Odobel, J.-P. Sauvage, J. Am. Chem. Soc. 116
(1994) 5481.[20] R.J. Willemse, J.W. Verhoeven, A.M. Brouwer, J. Phys. Chem. 99
(1995) 5753.[21] S.I. van Dijk, P.G. Wiering, C.P. Groen, A.M. Brouwer, J.W.
Verhoeven, W. Schuddeboom, J.M. Warman, J. Chem. Soc., FaradayTrans. 91 (1995) 2107.
[22] A.M. Brouwer, C. Eijckelhoff, R.J. Willemse, J.W. Verhoeven, W.Schuddeboom, J.M. Warman, J. Am. Chem. Soc. 115 (1993) 2988.
[23] N. Sabbatini, M. Guardigli, J.M. Lehn, Coord. Chem. Rev. 123(1993) 201.
[24] A. Osuka, S. Marumo, K. Maruyama, N. Mataga, Y. Tanaka, S.Taniguchi, T. Okada, I. Yamazaki, Y. Nishimura, Bull. Chem. Soc.Jpn. 68 (1995) 262;A. Osuka, S. Nakajima, K. Maruyama, N. Mataga, T. Asahi, I.Yamazaki, Y. Nishimura, T. Ohno, K. Nozaki, J. Am. Chem. Soc.115 (1993) 4577.
[25] J.M. Lawson, M.N. Paddon-Row, W. Schuddeboom, J.M. Warman,A.H.A. Clayton, K.P. Ghiggino, J. Phys. Chem. 97 (1993) 13099.
[26] K. Hasharoni, H. Levanon, S.R. Greenfield, D.J. Gosztola, W.A.Svec, M.R. Wasielewski, J. Am. Chem. Soc. 117 (1995) 8055;K. Hasharoni, H. Levanon, S.R. Greenfield, D.J. Gosztola, W.A.Svec, M.R. Wasielewski, J. Am. Chem. Soc. 118 (1996) 10228.
[27] H. Imahori, K. Yamada, M. Hasegawa, S. Taniguchi, T. Okada, Y.Sakata, Angew. Chem. Int. Ed. Engl. 36 (1997) 2626.
[28] D.G. Johnson, M.P. Niemczyk, D.W. Minsek, G.P. Wiederrecht, W.A.Svec, G.L. Gaines, M.R. Wasielewski, J. Am. Chem. Soc. 115 (1993)5692;M.R. Wasielewski, G.L. Gaines, G.P. Wiederrecht, W.A. Svec, M.P.Niemczyk, J. Am. Chem. Soc. 115 (1993) 10442.
[29] J. Najbar, M. Tachiya, J. Phys. Chem. 98 (1994) 199.[30] M. Fushiki, M. Tachiya, J. Phys. Chem. 98 (1994) 10762.[31] T. Motylewski, J. Najbar, M. Tachiya, Chem. Phys. 212 (1996) 193.[32] M. Hilczer, M. Tachiya, J. Phys. Chem. 100 (1996) 8815.[33] A.V. Barzykin, M. Tachiya, Chem. Phys. Lett. 285 (1998) 150.[34] M. Marchi, J.N. Gehlen, D. Chandler, M.D. Newton, J. Am. Chem.
Soc. 115 (1993) 4178.[35] W.W. Parson, Z.T. Chu, A. Warshal, Biochim. Biophys. Acta 251
(1990) 1017.[36] A. Warshel, W.W. Parson, Annu. Rev. Phys. Chem. 42 (1991) 279.[37] A. Warshel, Z.T. Chu, W.W. Parson, J. Photochem. Photobiol. A 82
(1994) 123.[38] M. Fushiki, M. Tachiya, Chem. Phys. Lett. 255 (1996) 83.[39] L.D. Zusman, D.N. Beratan, J. Chem. Phys. 110 (1999) 10468.[40] A. Okada, T. Bandyopadhyay, M. Tachiya, J. Chem. Phys. 110 (1999)
3509;A. Okada, T. Bandyopadhyay, J. Chem. Phys. 111 (1999) 1137.
[41] J. Najbar, M. Tachiya, J. Photochem. Photobiol. A 95 (1996) 51;K. Pirowska, J. Najbar, Acta Phys. Pol. A 94 (1998) 637.
[42] S.S. Skourtis, S. Mukamel, Chem. Phys. 197 (1995) 367.[43] M.D. Newton, J. Electroanal. Chem. 438 (1997) 3.[44] L.W. Ungar, M.D. Newton, G.A. Voth, J. Phys. Chem. B 103 (1999)
7367.[45] M.D. Newton, Adv. Chem. Phys. 106 (1999) 303.[46] N. Gayathri, B. Bagchi, J. Phys. Chem. A 103 (1999) 8496.[47] M. Bixon, J. Jortner, M.E. Michel-Beyerle, Chem. Phys. 197 (1995)
389.[48] M.A. Thompson, G.K. Schenter, J. Phys. Chem. 99 (1995) 6374.[49] M. Bixon, J. Jortner, J. Phys. Chem. 90 (1986) 3795.[50] K. Schulten, M. Tesch, Chem. Phys. 158 (1991) 421.[51] S. Creighton, J.-K. Hwang, A. Warshel, W.W. Parson, J. Norris,
Biochemistry 27 (1988) 774.[52] W.W. Parson, Z.-T. Chu, A. Warshel, Biochim. Biophys. Acta 1017
(1990) 251.[53] D. Chandler, J.N. Gehlen, M. Marchi, in: Y. Gauduel, P.J. Rossky
(Eds.), Ultrafast Reaction Dynamics and Solvent Effects, SymposiumSeries, Institute of Physics, 1994, p. 50.
[54] R.A. Marcus, N. Sutin, Biochim. Biophys. Acta 811 (1985) 265.[55] H.J. Böhm, I.R. McDonald, P.A. Madden, Mol. Phys. 49 (1983) 347.[56] H.J. Böhm, R.M. Lynden-Bell, P.A. Madden, I.R. McDonald, Mol.
Phys. 51 (1984) 761.[57] T. Ohba, S. Ikawa, Mol. Phys. 73 (1991) 999.[58] A.S. Al-Mubarak, G. Del Mistro, P.G. Lethbridge, N.Y. Abdul-Sattar,
A.J. Stace, Faraday Discuss., Chem. Soc. 86 (1988) 209.

100 M. Hilczer, M. Tachiya / Journal of Photochemistry and Photobiology A: Chemistry 158 (2003) 83–100
[59] M.P. Allen, D.J. Tildesley, Computer Simulation of Liquids,Clarendon, Oxford, 1987.
[60] W. Smith, D. Fincham, CCP5 Program Library, Science and ResearchCouncil, Daresbury Laboratory, Warrington, UK, 1982.
[61] D.J. Adams, G.S. Dubey, J. Comput. Phys. 72 (1987) 156.[62] M. Tachiya, J. Phys. Chem. 97 (1993) 5911.[63] H.A. Yu, M. Karplus, J. Chem. Phys. 89 (1988) 2366.
[64] M. Maroncelli, J. Chem. Phys. 94 (1991) 2084.[65] M. Hilczer, M. Tachiya, Chem. Phys. Lett. 295 (1998) 337;
M. Hilczer, M. Tachiya, J. Mol. Liq. 86 (2000) 97.[66] J. Barthel, K. Bachhuber, R. Buchner, J.B. Gill, M. Kleebauer, Chem.
Phys. Lett. 167 (1990) 63.[67] A.S. Lukas, S.E. Miller, M.R. Wasielewski, J. Phys. Chem. B 104
(2000) 931.