comparison of co-located refractory black carbon (rbc) and
TRANSCRIPT
Atmos. Meas. Tech., 14, 1379–1403, 2021https://doi.org/10.5194/amt-14-1379-2021© Author(s) 2021. This work is distributed underthe Creative Commons Attribution 4.0 License.
Comparison of co-located refractory black carbon (rBC) andelemental carbon (EC) mass concentration measurements duringfield campaigns at several European sitesRosaria E. Pileci1, Robin L. Modini1, Michele Bertò1, Jinfeng Yuan1, Joel C. Corbin1,a, Angela Marinoni2,Bas Henzing3, Marcel M. Moerman3, Jean P. Putaud4, Gerald Spindler5, Birgit Wehner5, Thomas Müller5,Thomas Tuch5, Arianna Trentini6, Marco Zanatta7, Urs Baltensperger1, and Martin Gysel-Beer1
1Laboratory of Atmospheric Chemistry, Paul Scherrer Institute (PSI), 5232 Villigen, Switzerland2Institute of Atmospheric Science and Climate, Italian National Research Council (CNR-ISAC),via Gobetti 101, 40129 Bologna, Italy3Netherlands Organisation for Applied Scientific Research (TNO), 3584 Utrecht, the Netherlands4Joint Research Centre (JRC), European Commission, 21027 Ispra, Italy5Leibniz Institute for Tropospheric Research (TROPOS), 04318 Leipzig, Germany6Regional Agency for Prevention, Environment and Energy, Emilia–Romagna, 40122, Bologna, Italy7Alfred Wegener Institute, Helmholtz Centre for Polar and Marine Research, 27515 Bremerhaven, Germanyanow at: Metrology Research Centre, National Research Council Canada, Ottawa K1A 0R6, Canada
Correspondence: Robin L. Modini ([email protected]) and Martin Gysel-Beer ([email protected])
Received: 14 May 2020 – Discussion started: 25 June 2020Revised: 4 January 2021 – Accepted: 7 January 2021 – Published: 23 February 2021
Abstract. The mass concentration of black carbon (BC) par-ticles in the atmosphere has traditionally been quantified withtwo methods: as elemental carbon (EC) concentrations mea-sured by thermal–optical analysis and as equivalent blackcarbon (eBC) concentrations when BC mass is derived fromparticle light absorption coefficient measurements. Over thelast decade, ambient measurements of refractory black car-bon (rBC) mass concentrations based on laser-induced in-candescence (LII) have become more common, mostly dueto the development of the Single Particle Soot Photometer(SP2) instrument. In this work, EC and rBC mass concen-tration measurements from field campaigns across severalbackground European sites (Palaiseau, Bologna, Cabauw andMelpitz) have been collated and examined to identify thesimilarities and differences between BC mass concentrationsmeasured by the two techniques. All EC concentration mea-surements in PM2.5 were performed with the EUSAAR-2thermal–optical protocol. All rBC concentration measure-ments were performed with SP2 instruments calibrated withthe same calibration material as recommended in the litera-ture. The observed values of median rBC-to-EC mass con-
centration ratios on the single-campaign level were 0.53,0.65, 0.97, 1.20 and 1.29, respectively, and the geometricstandard deviation (GSD) was 1.5 when considering all datapoints from all five campaigns. This shows that substantialsystematic bias between these two quantities occurred duringsome campaigns, which also contributes to the large over-all GSD. Despite considerable variability in BC propertiesand sources across the whole dataset, it was not possible toclearly assign reasons for discrepancies to one or the othermethod, both known to have their own specific limitationsand uncertainties. However, differences in the particle sizerange covered by these two methods were identified as onelikely reason for discrepancies.
Overall, the observed correlation between rBC and ECmass reveals a linear relationship with a constant ratio, thusproviding clear evidence that both methods essentially quan-tify the same property of atmospheric aerosols, whereas sys-tematic differences in measured absolute values by up to afactor of 2 can occur. This finding for the level of agreementbetween two current state-of-the-art techniques has impor-tant implications for studies based on BC mass concentra-
Published by Copernicus Publications on behalf of the European Geosciences Union.
1380 R. E. Pileci et al.: Comparison of co-located rBC and EC mass concentration measurements
tion measurements, for example for the interpretation of un-certainties in inferred BC mass absorption coefficient values,which are required for modeling the radiative forcing of BC.Homogeneity between BC mass determination techniques isalso very important for moving towards a routine BC massmeasurement for air quality regulations.
1 Introduction
Light-absorbing aerosols exert a positive radiative forcingthrough direct absorption of solar radiation. Moreover, theirheating can change atmospheric dynamics and, thereby,cloud formation and lifetime (Samset et al., 2018). Despitethe relatively small mass abundance of black carbon (8 %–17 %; Putaud et al., 2010), it dominates the aerosol light ab-sorption in the atmosphere (Bond et al., 2013). Additional,significant contributions come from brown carbon (Kirch-stetter et al., 2004), tar balls (Adachi et al., 2019) and mineraldust (Sokolik and Toon, 1999).
Black carbon aerosols possess a unique set of properties:they are refractory (Schwarz et al., 2006), strong absorbers ofshort- and long-wave radiation (Bond and Bergstrom, 2006),insoluble in water (Fung, 1990), and composed primarilyof graphene-like sp2-bonded carbon (Medalia and Heckman,1969). The source of black carbon is the incomplete combus-tion of hydrocarbon fuels, including fossil fuels and bio-fuels(Bond et al., 2013). BC mass concentration data from atmo-spheric measurements are used in many applications such asvalidation of model simulations (Grahame et al., 2014; Hod-nebrog et al., 2014) and quantification of the mass absorptioncoefficient of BC (MACBC). The latter is defined as the ratioof the light absorption coefficient caused by BC to the BCmass concentration and is a crucial parameter in modelingthe BC radiative forcing (Matsui et al., 2018). For these rea-sons, it is important to assess the accuracy and comparabilityof different BC mass measurement techniques.
There is neither an SI (International System of Units)traceable reference method nor a suitable standard referencematerial for quantifying BC mass (Baumgardner et al., 2012;Petzold et al., 2013). This presents a challenge for the long-term, routine monitoring of BC mass concentrations in obser-vation networks such as GAW (Global Atmosphere Watch),ACTRIS (Aerosol, Clouds and Trace Gases Research In-frastructure) and IMPROVE (Interagency Monitoring of Pro-tected Visual Environments). The lack of a reference methodis due to variability in the microstructure of BC produced bydifferent combustion sources (Adachi et al., 2010), the dif-ficulty of isolating BC from other particulate matter and thelack of direct mass-based methods selective with respect toBC without interferences (Baumgardner et al., 2012).
In practice, the BC mass is defined operationally throughmethodologies that use distinct physico-chemical and/or op-tical properties of BC in order to quantify its mass concentra-
tion in aerosols. The following three different techniques aremost commonly applied: filter based thermal–optical evolvedgas analysis (Huntzicker et al., 1982; Chow et al., 2007; Cav-alli et al., 2010); laser-induced incandescence (LII) (Schramlet al., 2000; Stephens et al., 2003; Schwarz et al., 2006;Michelsen et al., 2015) and methods based on aerosol lightabsorption (Rosen et al., 1978; Hansen et al., 1984; Arnottet al., 2003; Petzold et al., 2005). The specific terms usedto refer to the mass of BC quantified by each of these threetechniques are as follows: elemental carbon (EC), refractoryblack carbon (rBC) and equivalent black carbon (eBC), re-spectively (Petzold et al., 2013). Measurements of eBC massare not further addressed here, as they rely on prior knowl-edge or assumed values of the MACBC. Such prior knowl-edge is not required for thermal–optical measurements of ECmass or for LII measurements of rBC mass.
Both thermal–optical analysis (TOA) and the LII tech-nique make use of the high refractoriness of BC to quan-tify its mass, although in different manners. In comparingthese two techniques, it is essential to define what is meantby BC. The popular Bond et al. (2013) definition of BCis, fundamentally, a summary of the properties of highlygraphitized carbon found in soot particles. There are, how-ever, other forms of light-absorbing carbonaceous particulatematter (PM), with different cross sensitivities for TOA andLII. Building on earlier studies (e.g., Bond, 2001), Corbinet al. (2019) recently proposed a refined classification oflight-absorbing carbonaceous PM into four classes: soot–BC, char BC, tar brown carbon and soluble brown carbon,and they provided an overview of the respective physico-chemical properties. This refined classification provides auseful framework in describing the responses of TOA andLII. For example tar brown carbon, an amorphous form ofcarbon, is sufficiently refractory to contribute to EC mass,whereas it is not sufficiently refractory to cause substan-tial interference in rBC (Corbin and Gysel-Beer, 2019). Anywork that compares BC measurement techniques shouldtherefore consider the types of carbonaceous material presentin the sample.
Very few intercomparisons of EC mass and rBC mass areavailable in the literature, particularly when it comes to ambi-ent aerosols, despite the fact that both methods are frequentlyapplied these days. This means that the debate on the com-parability of these two quantities is still largely unresolved.Some studies have shown that the two quantities can agree towithin a few percent (Laborde et al., 2012b; Miyakawa et al.,2016; Corbin et al., 2019), while other studies have shownthey can systematically differ by factors of up to 2 to 3 in ei-ther direction (e.g., Zhang et al., 2016; Sharma et al., 2017).
In this work, we examined and quantified the level ofagreement or disagreement between BC mass concentra-tions measured by thermal–optical analysis and the LIItechnique. For this purpose, we compared co-located mea-surements of EC and rBC mass concentrations from fieldcampaigns performed at several European sites (Bologna,
Atmos. Meas. Tech., 14, 1379–1403, 2021 https://doi.org/10.5194/amt-14-1379-2021
R. E. Pileci et al.: Comparison of co-located rBC and EC mass concentration measurements 1381
Cabauw, Palaiseau and Melpitz) in order to sample differ-ent aerosol types. Care was taken to harmonize the appliedmethods: all thermal–optical measurements were performedwith the same temperature protocol (EUSAAR-2, EuropeanSupersites for Atmospheric Aerosol Research; Cavalli et al.,2010), and all Single Particle Soot Photometer (SP2) cali-brations were performed using the same calibration material.This first multi-site intercomparison allows us to more quan-titatively assess the extent to which the EC and rBC concen-tration measurements agree or disagree with each other. Po-tential reasons for discrepancies such as different size cuts,calibration uncertainties and various interferences are dis-cussed.
2 Methods
2.1 Sampling campaigns – measurements sites andexperimental setup
The observations presented here include measurements fromfive field campaigns at four different sites, three of whichare part of the ACTRIS network (Aerosol, Clouds and TraceGases Research Infrastructure; https://www.actris.eu, last ac-cess: 16 February 2021). Basic information (site and country,station code, coordinates, altitude, year and season) of eachfield campaign is summarized in Table S1.
The Melpitz research site of TROPOS (Germany;51◦32′ N, 12◦56′ E; 87 m a.s.l.) is located in the lowlands ofSaxony, 41 km NE of Leipzig, Germany. The nearest vil-lage with about 230 inhabitants is 300 m east of the sta-tion. The site is representative of the regional backgroundin central Europe (Spindler et al., 2012, 2013) since it issituated on a flat meadow, surrounded by agricultural land(Spindler et al., 2010). The area is sometimes influencedby long-range transported air masses from source regions ineastern, southeastern and southern Europe which can con-tain, especially in winter, emissions from coal heating (vanPinxteren et al., 2019). Two separate field campaigns wereperformed in summer (from 6 May to 1 July 2015) andwinter (from 2 to 23 February 2017). During the two cam-paigns, the SP2 was placed behind a Nafion dryer (modelMD-700, Perma Pure) with a PM10 inlet about 6 m aboveground level (a.g.l.). The PM2.5 sampler for the OC–EC sam-ples was placed nearby. The meteorological conditions andaerosol characteristics encountered during the campaigns aredescribed by Altstädter et al. (2018) for the summer cam-paign and by Yuan et al. (2021) for the winter campaign.
The KNMI (Koninklijk Nederlands Meteorologisch Insti-tuut) Cabauw Experimental Site for Atmospheric Research(the Netherlands; 51◦58′ N, 4◦55′ E; 0.7 m a.s.l.) is located inthe background area of Cabauw, 20 km from Utrecht, 30 kmfrom Rotterdam and 50 km from the North Sea. The nearbyregion is agricultural in an otherwise densely populated area,and surface elevation changes are at most a few meters over
20 km. During the campaign, the SP2 was placed behind aNafion dryer (model MD-700, Perma Pure) with a PM10 in-let situated at 4.5 m a.g.l. The PM10 sampler, from whose fil-ters off-line OC–EC analyses were carried out, did not in-clude a dryer in the sampling line in line with GAW recom-mendations (GAW Report No. 227; WMO, 2016). The mea-surements at this site were performed from 13 to 28 Septem-ber 2016. The meteorological conditions and aerosol charac-teristics encountered during the campaign are described byTirpitz et al. (2021).
The Bologna measurements were performed at the mainseat of CNR-ISAC (Consiglio Nazionale delle Ricerche –Institute of Atmospheric Sciences and Climate), in Bologna(Italy; 44◦31′ N, 11◦20′ E; 39 m a.s.l.). The site is classifiedas urban background and is located in the Po Valley, a Euro-pean pollution hot spot due to its orography, meteorologicalconditions and high presence of human activities, resultingin a large number of anthropogenic emission sources (Vec-chi et al., 2009; Putaud et al., 2010; Ricciardelli et al., 2017;Bucci et al., 2018). During the campaign, a PM2.5 sampler,not equipped with a drier, was situated at the ARPAE Su-persito (inside the CNR-ISAC area). The SP2 was locatedinside a fully instrumented mobile van in the CNR parkingarea, about 50 m away from the ARPAE Supersito. The in-struments in the van were connected to two inlet lines situ-ated on the top of the vehicle at a height of 3 m and connectedto the main inlet line with an inner diameter of 5 cm; no sizecut was performed. The sampled air was dried to below 30 %relative humidity using two custom-built, silica-gel-loadeddiffusion driers. The data presented in this paper were col-lected from 7 to 31 July 2017. The meteorological conditionsand the aerosol properties of this campaign are described byPileci et al. (2021).
The SIRTA Atmospheric Research Observatory (France;48◦43′ N, 2◦12′ E; 160 m a.s.l.) is situated in Palaiseau,25 km south of Paris. The station is characterized as suburbanbackground (Haeffelin et al., 2005). This site is influencedby both fresh and aged black carbon mainly originating fromthe Paris area. It is impacted by road transport emissions allyear round and residential wood burning during the winter(Laborde et al., 2013; Petit et al., 2015; Zhang et al., 2018).The SP2 along with many other instruments was installedin an air-conditioned trailer of the SIRTA measurement plat-form. For the OC–EC measurements, high-volume samplerswith a PM2.5 cut-off were available in the same area. Themeasurements were performed from 15 January to 15 Febru-ary 2010. EC and rBC concentrations during this campaignhave previously been published in Laborde et al. (2013).
https://doi.org/10.5194/amt-14-1379-2021 Atmos. Meas. Tech., 14, 1379–1403, 2021
1382 R. E. Pileci et al.: Comparison of co-located rBC and EC mass concentration measurements
2.2 Thermal–optical analysis
2.2.1 Measurement principle, OC–EC split andinvolved artifacts
In thermal–optical evolved gas analysis (TOA), carbona-ceous particles deposited on a filter are thermally desorbedor reacted in order to determine the total carbon mass. Thistechnique further divides the total carbon (TC) into EC andorganic carbon (OC) according to the expectation that EC isrefractory in an inert atmosphere while OC is not (Chow etal., 1993; Birch and Cary, 1996; Bond, 2001; Chow et al.,2004). Therefore, TOA provides operationally defined OCand EC mass rather than fundamental quantities. This basicbinary split does not acknowledge that neither OC nor ECare well-defined materials. Instead, carbonaceous matter inaerosols populates the multidimensional space of chemicaland physical properties more or less in a continuous man-ner (Saleh et al., 2018; Corbin et al., 2020). Nevertheless, thebinary split approach aims at providing an operationally de-fined EC mass that corresponds to “true” BC mass as definedon a conceptual level by Bond et al. (2013) and Corbin etal. (2019) (see Sect. 1).
In TOA, the carbonaceous material deposited on a punchof a quartz fiber filter is thermally desorbed through pro-gressive heating: first in an inert atmosphere of pure helium(He) at multiple moderate temperatures (∼ 500–700 ◦C) (in-ert mode) and then in an oxidizing atmosphere (98 % He and2 % O2) at high temperature (∼ 850 ◦C). The applied du-ration and the temperature of each step vary between dif-ferent thermal protocols, as discussed below in Sect. 2.2.2.The evolving carbon is catalytically converted first to carbondioxide (CO2) and then to methane (CH4). CH4 is then quan-tified using a flame ionization detector (FID) and reported asOC (inert mode) and EC (oxidizing mode) mass. The instru-ment type applied in this study and most commonly used toperform TOA measurements is the OC–EC analyzer manu-factured by Sunset Laboratory Inc. (Tigard, OR, USA).
Ideally, all OC would desorb in the inert He atmosphereand EC would exclusively burn off in the oxidizing O2 atmo-sphere (Chow et al., 1993; Birch and Cary, 1996). In prac-tice, a fraction of carbonaceous matter may be more refrac-tory than the applied separation threshold while not beingBC in a strict sense. This would cause a positive bias in mea-sured EC mass. In addition, a fraction of the OC can pyrolyzein the He step to form pyrolytic carbon (PC), which is ther-mally stable and only desorbs in the O2 step, thereby caus-ing a charring artifact in the mutual quantification of OC andEC. To correct for this latter effect, a laser at 658 nm is usedin combined thermal–optical analysis to monitor the lighttransmission through the loaded filter before and during theanalysis. The measurement principle behind this so-calledthermal–optical transmission (TOT) correction approach isexplained in Sect. S1. The charring correction can also beperformed using light reflectance (thermo-optical reflectance
– TOR – method) instead of transmittance. As reported in thereview paper by Karanasiou et al. (2015), EC values of atmo-spheric samples determined using the TOT method are oftenup to 30 %–70 % lower than those determined using the TORmethod, which is attributed to various reasons (Karanasiou etal., 2015; Chiappini et al., 2014; see Sect. S1). Therefore, allEC mass values reported in this study are based on the TOTmethod.
The above-described assumptions about the optical char-ring correction are only partially fulfilled, typically leavingcharring artifacts as a main source of bias even for opticallycorrected EC mass data (Chow et al., 2004; Subramanian etal., 2006). Pyrolysis depends on many factors, including thequantity and type of organic compounds, temperature stepsin the analysis, and the residence time at each temperaturestep. This makes the TOA technique sensitive to the aerosoltype collected on the filter. Water extraction experimentshave shown that water-soluble organic carbon (WSOC) com-pounds are particularly prone to causing charring (Yu et al.,2002; Piazzalunga et al., 2011; Zhang et al., 2012; Giannoniet al., 2016). Samples with a high WSOC content come from,e.g., biomass and wood burning (Hitzenberger et al., 2006;Reisinger et al., 2008; Chen et al., 2015). A filter water-washing step prior to TOA can be used to remove WSOC,thereby reducing charring artifacts and improving compara-bility of different protocols for EC mass measurements (Yuet al., 2002; Piazzalunga et al., 2011). However, filter pre-washing is generally not applied in long-term-monitoringTOA measurements for practical reasons (the washing stepis time-consuming). In these cases, the charring phenomenoncan be reduced by adopting a thermal protocol with a suffi-ciently long residence time at each temperature step in theHe atmosphere to allow for maximum OC evolution (Subra-manian et al., 2006; Karanasiou et al., 2015).
The OC–EC split can be also biased by EC pre-combustion: EC can thermally evolve in the presence of ox-idizing species (Watson et al., 2005; Corbin et al., 2014,2015), and soluble inorganic compounds (Chow et al., 2001;Yu et al., 2002) and metal salts (Aakko-Saksa et al., 2018)can catalyze EC pre-combustion. If the amount of EC under-going pre-combustion is significant relative to the amount ofPC formed during the analysis, the optical correction (trans-mittance or reflectance) is not able to account for it, and thismay cause an underestimation of the EC concentration.
Moreover, soluble brown carbon on filters can affect thelaser correction if it was evolving during the OC steps,thereby causing a positive EC artifact. However, solublebrown carbon absorbs much less per unit mass than EC atthe red wavelength (λ= 635 nm) of the laser used in thethermal–optical instruments, since its absorbance decreasesstrongly from the blue–UV region of the electromagneticspectrum towards the red region (Karanasiou et al., 2015).This reduces the potential interference of soluble brown car-bon via the introduction of a bias in the optical charring cor-rection. Recently, Massabò et al. (2019) developed a modi-
Atmos. Meas. Tech., 14, 1379–1403, 2021 https://doi.org/10.5194/amt-14-1379-2021
R. E. Pileci et al.: Comparison of co-located rBC and EC mass concentration measurements 1383
fied Sunset Lab Inc. EC–OC analyzer to measure the browncarbon content in the sample by adding a second laser diodeat λ= 405 nm.
Tar brown carbon only evolves in the oxidizing step ofTOA due to its refractoriness (Corbin et al., 2019). There-fore, it is assigned to EC independent of its light absorptionproperties. This is in contrast to LII, where tar brown car-bon only gives a marginal contribution to observed rBC mass(Sect. 2.3.3).
Further artifacts in TOA can be caused by carbonate car-bon, as discussed in Wang et al. (2010), Karanasiou etal. (2015) and Querol et al. (2012). Thermal protocols canbe designed to minimize this artifact by having most carbon-ate carbon evolve as OC (as is the case with the EUSAAR-2protocol used in this work; Sect. 2.2.2). However, minor pos-itive, carbonate-related artifacts in EC cannot be excluded(Karanasiou et al., 2011).
2.2.2 Thermal protocols – EUSAAR-2 vs. otherexisting protocols
Many variants of thermal protocols exist for the thermal–optical analysis of EC mass (Bautista et al., 2015). The re-sults presented in this study are based on the EUSAAR-2 protocol, which was developed by Cavalli et al. (2010).The EUSAAR-2 protocol was specifically optimized foraerosol typically encountered at European background sites,and it has recently been selected as the European stan-dard thermal protocol to be applied in air quality networksfor the measurement of TC (total carbon), OC and EC inPM2.5 (particulate matter) samples (European Committee forStandardization, 2017; EN 16909:2017). Besides EUSAAR-2, the IMPROVE–A thermal protocol of the InteragencyMonitoring of Protected Visual Environments (Chow et al.,1993, 2007) and the NIOSH thermal protocols developed bythe National Institute for Occupational Safety and Health(Birch and Cary, 1996) are also commonly used for TOA.Various NIOSH-like protocols (NIOSH 5040, NIOSH 840,NIOSH 850 and NIOSH 870) exist that are all modified ver-sions of the Birch and Cary (1996) and Birch et al. (1999)protocols.
Table 1 summarizes the differences between EC measuredwith EUSAAR-2 and with other protocols reported in previ-ous literature studies, with a particular focus on the thermalprotocols that are considered in this study (e.g., see Fig. 6).The use of different thermal protocols can result in a wideelemental carbon-to-total-carbon variation by up to a factorof 5 (Cavalli et al., 2010). In general, it has been observedthat protocols with a rather low peak temperature in the in-ert mode like EUSAAR-2 and IMPROVE generally clas-sify more carbon as EC compared to the NIOSH protocol(Karanasiou et al., 2015). The EnCan-Total-900 protocol hasa much longer retention time at each temperature step com-pared to the IMPROVE and NIOSH methods and does not
Table 1. Overview of reported differences between EC calculatedwith other protocols minus the EC calculated with the EUSAAR-2protocol.
Protocols Relative differencecompared to EUSAAR-2 (TOT)
IMPROVE (TOR) ∼+25 %a
IMPROVE–A (TOR) ∼−10 %b
EnCan-Total-900 ∼±25 %c
a Han et al. (2016). b Cheng et al. (2013). c Karanasiou et al. (2015).
involve a charring correction (Huang et al., 2006; Chan etal., 2010).
2.2.3 Variability in EC measurements with theEUSAAR-2 protocol
Given the artifacts involved in TOA, different instrumentscan measure different EC concentrations for the same sam-ple, even if the same thermal protocol is used. For this reason,the Joint Research Centre (JRC) European Reference Lab-oratory for Air Pollution (ERLAP) organizes annual instru-mental inter-laboratory comparisons, which typically include15 to 30 participants, in order to harmonize measurementsfrom different Sunset instruments that employ the EUSAAR-2 protocol. The measurement performances are evaluated us-ing several PM2.5 quartz fiber filters collected at a regionalbackground site in Italy. Since the true concentrations of ECor TC in these ambient samples are unknown (due to thelack of suitable reference methods or materials), the expectedconcentrations are chosen (“assigned”) as the robust averages(i.e., with outliers removed) of the TC and EC mass concen-trations measured by all participants.
The latest intercomparison yielded an EC-to-TC ratio re-peatability (with the same instrument over time) of 3 %to 8 % and an EC-to-TC ratio reproducibility (among dif-ferent instruments) of 12 % to 17 % (across 21 partic-ipants), where the method precision becomes exponen-tially poorer towards lower TC contents (<10 µg C cm−2)and lower EC-to-TC ratios (<0.07) (EMEP/CCC – Re-port 1/2018, https://projects.nilu.no/ccc/reports/cccr1_2018_Data_Report_2016_FINAL.pdf, last access: 16 Febru-ary 2021). Table 2 presents EC bias and variability (seeSect. S2 of the Supplement for further information) for theinstruments used in each campaign (based on data fromthe ERLAP intercomparison campaign that occurred mostrecently before or after the campaign in question). ThePalaiseau campaign EC samples were analyzed by the Insti-tute des Géosciences de l’Environnement (IGE, Grenoble);the Cabauw samples were analyzed by the Joint ResearchCentre (JRC, Italy); the Melpitz (summer and winter) sam-ples were analyzed by the Leibniz-Institut für Troposphären-forschung (TROPOS); and the Bologna campaign samples
https://doi.org/10.5194/amt-14-1379-2021 Atmos. Meas. Tech., 14, 1379–1403, 2021
1384 R. E. Pileci et al.: Comparison of co-located rBC and EC mass concentration measurements
were analyzed by ARPAE. The EC bias and variability inthe instrument used for analyzing the Bologna filter samples,which did not participate in a full ERLAP intercomparison,was determined by comparison with the JRC ERLAP ref-erence instrument for nine filter samples from the Bolognacampaign. The EC bias found was smaller than 20 % for allapplied OC–EC analyzers, which is within the TOA mea-surement uncertainty. Therefore, we did not correct the ECmeasurements reported in this work for these biases.
Blank filters were analyzed for all campaigns. The blankvalue for EC mass was always below the detection limit ornegligibly small compared to EC mass on loaded filter sam-ples, such that applying a blank correction does not make adifference for the resulting EC mass concentration.
2.3 The Single Particle Soot Photometer (SP2)
2.3.1 Principle of measurement
Laser-induced incandescence occurs when a high-intensitylaser is used to heat light-absorbing and highly refractoryparticles to high-enough temperatures for them to emit con-siderable grey body and blackbody radiation. LII can beused to quantify rBC carbon mass concentration in aerosolsby detecting the emitted thermal radiation, which is ap-proximately proportional to rBC mass. There are differentinstrumental approaches for LII using both pulsed lasers(Michelsen et al., 2015) and continuous-wave lasers, as inthe commercially available Single Particle Soot Photometer(SP2, Droplet Measurement Technologies, Longmont, CO,USA). The SP2 quantifies the rBC mass in individual parti-cles (Stephens et al., 2003; Schwarz et al., 2006; Moteki andKondo, 2007). When aerosol particles enter the instrument,they are directed into the center of an intra-cavity Nd:YAGlaser beam with a wavelength of 1064 nm where they are irra-diated. BC-containing particles absorb the laser light causingthem to heat up and incandesce. Since the thermal radiationemitted by individual black carbon particles is proportionalto the volume (and mass) of BC in the particles (Moteki andKondo, 2010), this radiation intensity can be converted torBC mass using an empirical calibration curve.
2.3.2 rBC mass calibration
The relationship between incandescence signal peak ampli-tude and BC mass depends on the BC type (Moteki andKondo, 2010; Laborde et al., 2012a), which means the in-strument should be calibrated with a material that representsthe type of BC one seeks to measure. Unfortunately, manytypes of BC are found in the atmosphere, such that it is typi-cally not possible to calibrate the SP2 specifically with atmo-spheric BC. Instead, a fixed calibration using commercial BCmaterials is commonly applied. Therefore, potential variationin the chemical microstructure of atmospheric BC results inuncertainty in rBC mass measurements.
In this study, two different batches of fullerene soot (AlfaAesar, stock 40971, lots FS12S011 and W08A039) wereused. The former is recommended as calibration material(Baumgardner et al., 2012) since it was shown to be suit-able for quantifying BC in diesel engine exhaust (agreementwithin 10 % for rBC cores ≤ 40 fg; Laborde et al., 2012b).Calibrations using the latter batch agreed with those usingthe former batch within 5 %. In this work, three different SP2instruments (Paul Scherrer Institute, PSI; Institute des Géo-sciences de l’Environnement, IGE; Alfred Wegener Institute,AWI) were used to acquire the data (Table 3). This how-ever does not contribute appreciably to uncertainties, sincethe reproducibility of measured rBC mass size distributionswas shown to be ±10 % during a large SP2 intercompari-son involving six SP2 instruments from six different researchgroups (Laborde et al., 2012b). The SP2 used during the Mel-pitz campaigns was calibrated using an aerosol particle massanalyzer (APM) to select the calibration particles by mass(Table 3). For the other campaigns a differential mobilityanalyzer (DMA) was used for size selection and the corre-sponding particle mass was calculated using effective den-sity data reported in Gysel et al. (2011). The latter approachresults in an additional error of about 10 %.
2.3.3 Potential interferences and artifacts
One of the strengths of the SP2 is that the incandescence sig-nal is not perturbed by the presence of non-refractory matterinternally or externally mixed with BC (Moteki and Kondo,2007; Slowik et al., 2007). However, other types of highlyrefractory and sufficiently light-absorbing (at 1064 nm) ma-terial can incandesce in the SP2 laser. Therefore, SP2 mea-surements can potentially contain interferences from met-als, metal oxides (Moteki et al., 2017), volcanic ash anddust (rarely) (Kupiszewski et al., 2016). Fortunately, suchmaterials are usually observed only rarely in atmosphericaerosols in large-enough quantities to cause significant SP2measurement artifacts. Furthermore, if they are present, insome cases their presence can be identified and ignored whencalculating rBC mass. Specifically, potential interference canbe determined with the use of the spectral bandpass filters,which permits the determination of the color temperature ofincandescence (Moteki et al., 2017). Recently, Sedlacek etal. (2018) found that rBC-free organic particles that absorblight at 1064 nm can char and form rBC under sufficientlyhigh SP2 laser power, resulting in an rBC overestimate. Ingeneral, this artifact is only likely to be relevant in biomassburning plumes that contain organic tar balls that can ab-sorb light at 1064 nm (Sedlacek et al., 2018). Marine enginesoperated with heavy fuel oil can also produce tar particles,but Corbin and Gysel-Beer (2019) found that the contribu-tion of such particles to rBC mass was negligible. Further-more, it is possible to distinguish incandescing tar particlesfrom soot BC with SP2 measurements by examining the ra-
Atmos. Meas. Tech., 14, 1379–1403, 2021 https://doi.org/10.5194/amt-14-1379-2021
R. E. Pileci et al.: Comparison of co-located rBC and EC mass concentration measurements 1385
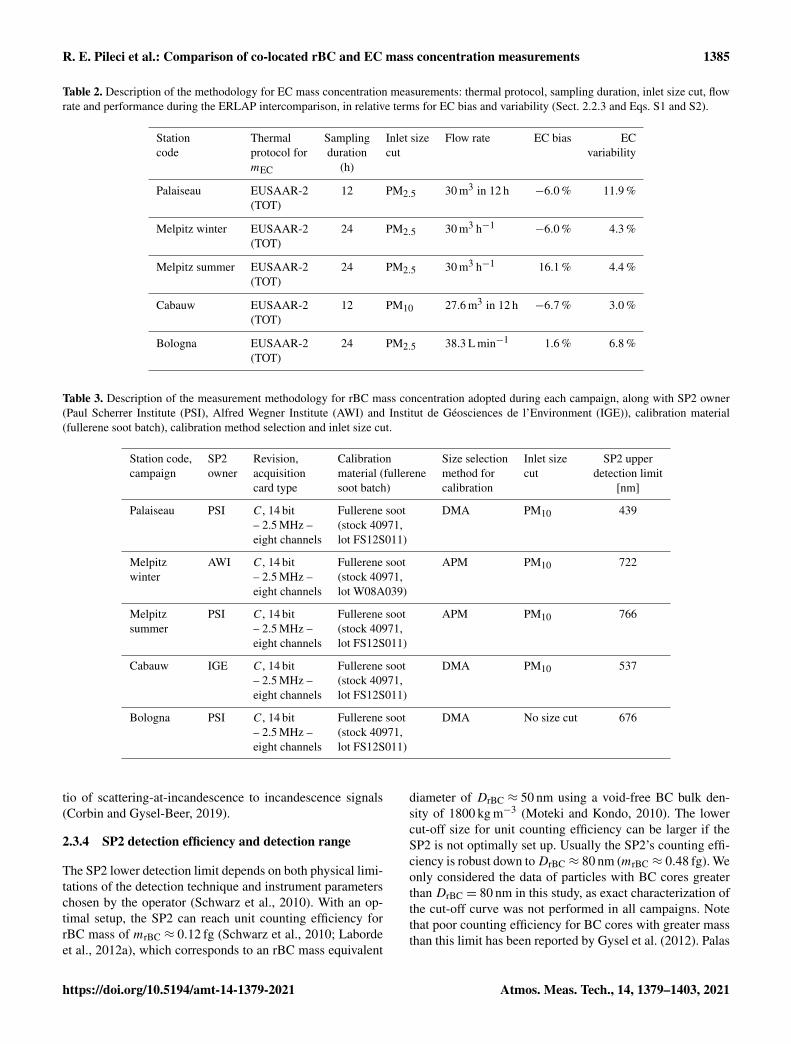
Table 2. Description of the methodology for EC mass concentration measurements: thermal protocol, sampling duration, inlet size cut, flowrate and performance during the ERLAP intercomparison, in relative terms for EC bias and variability (Sect. 2.2.3 and Eqs. S1 and S2).
Station Thermal Sampling Inlet size Flow rate EC bias ECcode protocol for duration cut variability
mEC (h)
Palaiseau EUSAAR-2 12 PM2.5 30 m3 in 12 h −6.0 % 11.9 %(TOT)
Melpitz winter EUSAAR-2 24 PM2.5 30 m3 h−1−6.0 % 4.3 %
(TOT)
Melpitz summer EUSAAR-2 24 PM2.5 30 m3 h−1 16.1 % 4.4 %(TOT)
Cabauw EUSAAR-2 12 PM10 27.6 m3 in 12 h −6.7 % 3.0 %(TOT)
Bologna EUSAAR-2 24 PM2.5 38.3 L min−1 1.6 % 6.8 %(TOT)
Table 3. Description of the measurement methodology for rBC mass concentration adopted during each campaign, along with SP2 owner(Paul Scherrer Institute (PSI), Alfred Wegner Institute (AWI) and Institut de Géosciences de l’Environment (IGE)), calibration material(fullerene soot batch), calibration method selection and inlet size cut.
Station code, SP2 Revision, Calibration Size selection Inlet size SP2 uppercampaign owner acquisition material (fullerene method for cut detection limit
card type soot batch) calibration [nm]
Palaiseau PSI C, 14 bit Fullerene soot DMA PM10 439– 2.5 MHz – (stock 40971,eight channels lot FS12S011)
Melpitz AWI C, 14 bit Fullerene soot APM PM10 722winter – 2.5 MHz – (stock 40971,
eight channels lot W08A039)
Melpitz PSI C, 14 bit Fullerene soot APM PM10 766summer – 2.5 MHz – (stock 40971,
eight channels lot FS12S011)
Cabauw IGE C, 14 bit Fullerene soot DMA PM10 537– 2.5 MHz – (stock 40971,eight channels lot FS12S011)
Bologna PSI C, 14 bit Fullerene soot DMA No size cut 676– 2.5 MHz – (stock 40971,eight channels lot FS12S011)
tio of scattering-at-incandescence to incandescence signals(Corbin and Gysel-Beer, 2019).
2.3.4 SP2 detection efficiency and detection range
The SP2 lower detection limit depends on both physical limi-tations of the detection technique and instrument parameterschosen by the operator (Schwarz et al., 2010). With an op-timal setup, the SP2 can reach unit counting efficiency forrBC mass of mrBC ≈ 0.12 fg (Schwarz et al., 2010; Labordeet al., 2012a), which corresponds to an rBC mass equivalent
diameter of DrBC ≈ 50 nm using a void-free BC bulk den-sity of 1800 kg m−3 (Moteki and Kondo, 2010). The lowercut-off size for unit counting efficiency can be larger if theSP2 is not optimally set up. Usually the SP2’s counting effi-ciency is robust down toDrBC ≈ 80 nm (mrBC ≈ 0.48 fg). Weonly considered the data of particles with BC cores greaterthan DrBC = 80 nm in this study, as exact characterization ofthe cut-off curve was not performed in all campaigns. Notethat poor counting efficiency for BC cores with greater massthan this limit has been reported by Gysel et al. (2012). Palas
https://doi.org/10.5194/amt-14-1379-2021 Atmos. Meas. Tech., 14, 1379–1403, 2021
1386 R. E. Pileci et al.: Comparison of co-located rBC and EC mass concentration measurements
soot, which is characterized by a very small primary spheresize and very low fractal dimension, results in relatively en-hanced heat loss. However, we are not aware of studies indi-cating reduced counting efficiency for atmospherically rele-vant BC particles, which have larger primary spheres and ahigher fractal dimension, compared to Palas soot.
The SP2 was operated downstream of inlets with a 50 %cut-off diameter at 10 µm in every campaign except for theBologna campaign, where no external upper size cut was ap-plied. In addition, the SP2 is unable to quantify rBC massabove a certain limit due to the saturation of the electron-ics that record the signals. This saturation limit can be var-ied via detector gains, with typical settings resulting in up-per limits of quantification ranging from DrBC ≈ 500 nm toaround DrBC ≈ 1 µm. Consequently, the total BC mass maybe underestimated if BC cores greater than the upper limitof quantification contribute substantially to total BC mass.Recently, Schwarz (2019) evaluated an algorithm for recon-structing the peak incandescence intensity from the truncatedincandescence signals of large BC cores. We did not applythis approach as it only allows increasing the upper limit ofquantification by around 15 % in terms of DrBC without in-troducing substantial uncertainty in the upper limit of quan-tification.
The SP2 has no lower number concentration detectionlimit (in the absence of leaks), while particle counting co-incidence imposes an upper concentration limit when mul-tiple BC particles cross the laser beam simultaneously. Co-incidence only caused negligibly low bias in measured rBCmass concentrations for the concentration ranges that wereencountered in this study.
2.3.5 Methods to correct SP2 data for missing massbelow lower detection limit (LDL)
Two approaches are most commonly used to extrapolate themeasured rBC mass size distribution and correct for the miss-ing rBC mass (Schwarz et al., 2006; Laborde et al., 2013). Inthis study, both methods were applied in order to assess thesensitivity to the correction approach (Sect. 3.1); based onthis assessment the first of the two methods described belowwas determined to be preferable. The two methods are basedon fitting the measured rBC mass size distribution with a uni-modal lognormal function since BC mass size distributionsare generally close to lognormally distributed (e.g., Fig. 1;Schwarz et al., 2006; and Reddington et al., 2013).
A first approach to correcting SP2 rBC measurements forpotentially missed mass is based on extrapolation of the mea-sured size distribution below and/or above the SP2 detec-tion limits. We hereafter refer to this as the “extrapolationmethod”. The corrected rBC mass, mextrap
rBC,corr, is obtained asthe sum of the measured mass, mrBC,meas, and a correctionterm, 1mextrap:
mextraprBC,corr =mrBC,meas+1m
extrap. (1)
Here, 1mextrap is obtained by fitting a lognormal functiondmfit
dlogDrBCto the measured rBC mass size distribution and
only considering potentially missed mass below the lowerdetection limit (LDL) of the SP2. No correction was ap-plied for potentially missed mass above the upper detectionlimit (UDL) for two reasons explained in Sect. 3.1.1. Usingthis approach, the correction term simplifies to the integratedmass of the lognormal fit in the size range below the LDL:
1mextrap=1mrBC<LDL
=
∫ DLDL
0
dmfit
dlogDrBC(DrBC)dlogDrBC. (2)
A second commonly applied approach, hereafter referred toas the “fit method”, is based on the assumption that the trueBC mass size distribution in the submicron size range ex-actly follows a lognormal function. Under this assumption,the corrected rBC mass,mfit
rBC,corr, is chosen as the integratedmass, mfit, of a lognormal fit to the measured rBC mass sizedistribution (which includes corrections for contributions be-low the LDL and above the UDL):
mfitrBC,corr =mfit =
∫+∞
0
dmfit
dlogDrBC(DrBC)dlogDrBC. (3)
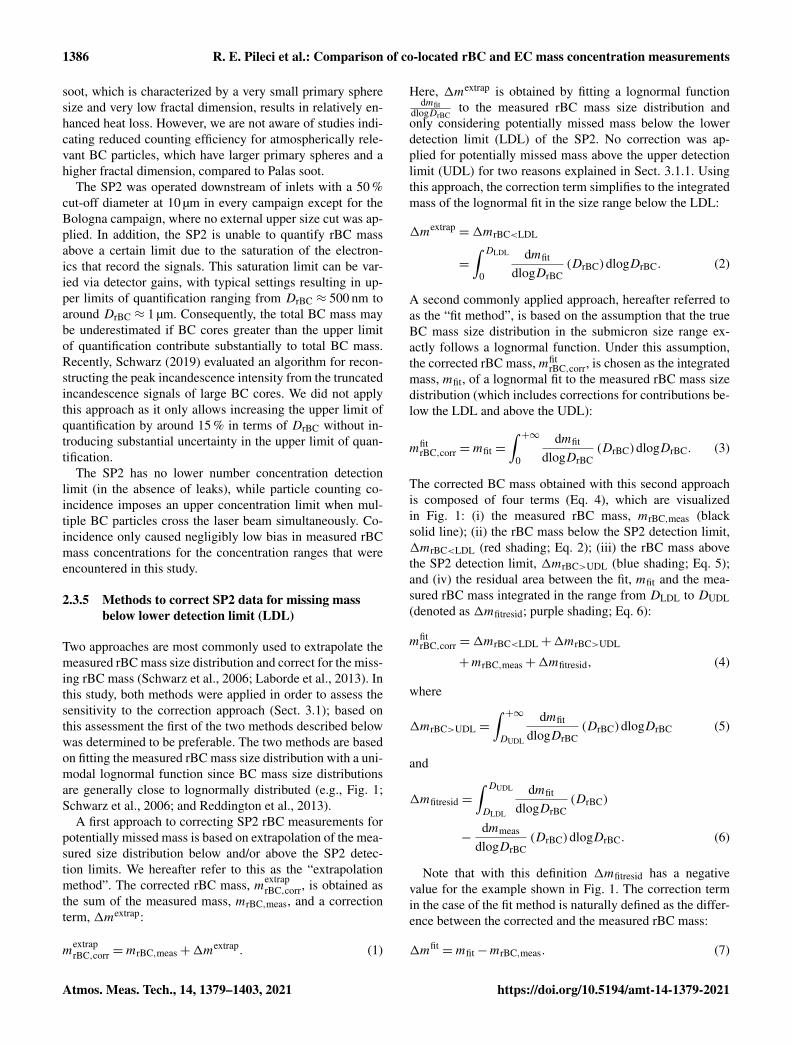
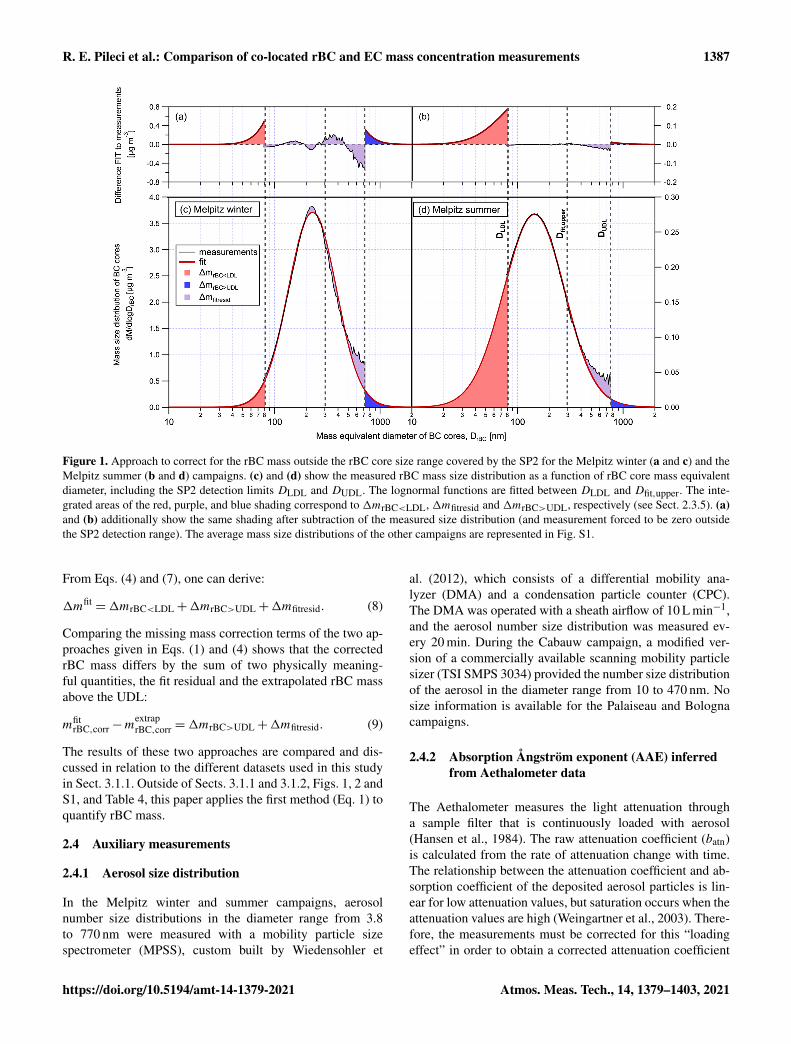
The corrected BC mass obtained with this second approachis composed of four terms (Eq. 4), which are visualizedin Fig. 1: (i) the measured rBC mass, mrBC,meas (blacksolid line); (ii) the rBC mass below the SP2 detection limit,1mrBC<LDL (red shading; Eq. 2); (iii) the rBC mass abovethe SP2 detection limit, 1mrBC>UDL (blue shading; Eq. 5);and (iv) the residual area between the fit, mfit and the mea-sured rBC mass integrated in the range from DLDL to DUDL(denoted as 1mfitresid; purple shading; Eq. 6):
mfitrBC,corr =1mrBC<LDL+1mrBC>UDL
+mrBC,meas+1mfitresid, (4)
where
1mrBC>UDL =
∫+∞
DUDL
dmfit
dlogDrBC(DrBC)dlogDrBC (5)
and
1mfitresid =
∫ DUDL
DLDL
dmfit
dlogDrBC(DrBC)
−dmmeas
dlogDrBC(DrBC)dlogDrBC. (6)
Note that with this definition 1mfitresid has a negativevalue for the example shown in Fig. 1. The correction termin the case of the fit method is naturally defined as the differ-ence between the corrected and the measured rBC mass:
1mfit=mfit−mrBC,meas. (7)
Atmos. Meas. Tech., 14, 1379–1403, 2021 https://doi.org/10.5194/amt-14-1379-2021
R. E. Pileci et al.: Comparison of co-located rBC and EC mass concentration measurements 1387
Figure 1. Approach to correct for the rBC mass outside the rBC core size range covered by the SP2 for the Melpitz winter (a and c) and theMelpitz summer (b and d) campaigns. (c) and (d) show the measured rBC mass size distribution as a function of rBC core mass equivalentdiameter, including the SP2 detection limits DLDL and DUDL. The lognormal functions are fitted between DLDL and Dfit,upper. The inte-grated areas of the red, purple, and blue shading correspond to 1mrBC<LDL, 1mfitresid and 1mrBC>UDL, respectively (see Sect. 2.3.5). (a)and (b) additionally show the same shading after subtraction of the measured size distribution (and measurement forced to be zero outsidethe SP2 detection range). The average mass size distributions of the other campaigns are represented in Fig. S1.
From Eqs. (4) and (7), one can derive:
1mfit=1mrBC<LDL+1mrBC>UDL+1mfitresid. (8)
Comparing the missing mass correction terms of the two ap-proaches given in Eqs. (1) and (4) shows that the correctedrBC mass differs by the sum of two physically meaning-ful quantities, the fit residual and the extrapolated rBC massabove the UDL:
mfitrBC,corr−m
extraprBC,corr =1mrBC>UDL+1mfitresid. (9)
The results of these two approaches are compared and dis-cussed in relation to the different datasets used in this studyin Sect. 3.1.1. Outside of Sects. 3.1.1 and 3.1.2, Figs. 1, 2 andS1, and Table 4, this paper applies the first method (Eq. 1) toquantify rBC mass.
2.4 Auxiliary measurements
2.4.1 Aerosol size distribution
In the Melpitz winter and summer campaigns, aerosolnumber size distributions in the diameter range from 3.8to 770 nm were measured with a mobility particle sizespectrometer (MPSS), custom built by Wiedensohler et
al. (2012), which consists of a differential mobility ana-lyzer (DMA) and a condensation particle counter (CPC).The DMA was operated with a sheath airflow of 10 L min−1,and the aerosol number size distribution was measured ev-ery 20 min. During the Cabauw campaign, a modified ver-sion of a commercially available scanning mobility particlesizer (TSI SMPS 3034) provided the number size distributionof the aerosol in the diameter range from 10 to 470 nm. Nosize information is available for the Palaiseau and Bolognacampaigns.
2.4.2 Absorption Ångström exponent (AAE) inferredfrom Aethalometer data
The Aethalometer measures the light attenuation througha sample filter that is continuously loaded with aerosol(Hansen et al., 1984). The raw attenuation coefficient (batn)is calculated from the rate of attenuation change with time.The relationship between the attenuation coefficient and ab-sorption coefficient of the deposited aerosol particles is lin-ear for low attenuation values, but saturation occurs when theattenuation values are high (Weingartner et al., 2003). There-fore, the measurements must be corrected for this “loadingeffect” in order to obtain a corrected attenuation coefficient
https://doi.org/10.5194/amt-14-1379-2021 Atmos. Meas. Tech., 14, 1379–1403, 2021
1388 R. E. Pileci et al.: Comparison of co-located rBC and EC mass concentration measurements
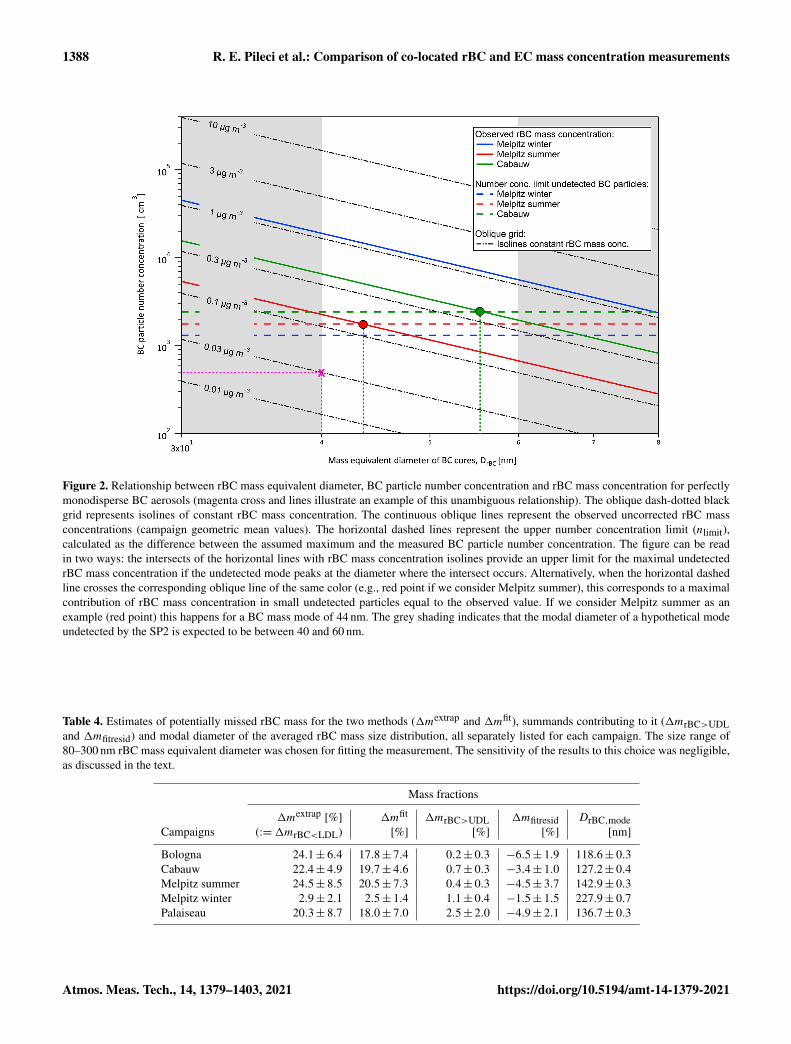
Figure 2. Relationship between rBC mass equivalent diameter, BC particle number concentration and rBC mass concentration for perfectlymonodisperse BC aerosols (magenta cross and lines illustrate an example of this unambiguous relationship). The oblique dash-dotted blackgrid represents isolines of constant rBC mass concentration. The continuous oblique lines represent the observed uncorrected rBC massconcentrations (campaign geometric mean values). The horizontal dashed lines represent the upper number concentration limit (nlimit),calculated as the difference between the assumed maximum and the measured BC particle number concentration. The figure can be readin two ways: the intersects of the horizontal lines with rBC mass concentration isolines provide an upper limit for the maximal undetectedrBC mass concentration if the undetected mode peaks at the diameter where the intersect occurs. Alternatively, when the horizontal dashedline crosses the corresponding oblique line of the same color (e.g., red point if we consider Melpitz summer), this corresponds to a maximalcontribution of rBC mass concentration in small undetected particles equal to the observed value. If we consider Melpitz summer as anexample (red point) this happens for a BC mass mode of 44 nm. The grey shading indicates that the modal diameter of a hypothetical modeundetected by the SP2 is expected to be between 40 and 60 nm.
Table 4. Estimates of potentially missed rBC mass for the two methods (1mextrap and 1mfit), summands contributing to it (1mrBC>UDLand 1mfitresid) and modal diameter of the averaged rBC mass size distribution, all separately listed for each campaign. The size range of80–300 nm rBC mass equivalent diameter was chosen for fitting the measurement. The sensitivity of the results to this choice was negligible,as discussed in the text.
Mass fractions
1mextrap [%] 1mfit 1mrBC>UDL 1mfitresid DrBC,modeCampaigns (:=1mrBC<LDL) [%] [%] [%] [nm]
Bologna 24.1± 6.4 17.8± 7.4 0.2± 0.3 −6.5± 1.9 118.6± 0.3Cabauw 22.4± 4.9 19.7± 4.6 0.7± 0.3 −3.4± 1.0 127.2± 0.4Melpitz summer 24.5± 8.5 20.5± 7.3 0.4± 0.3 −4.5± 3.7 142.9± 0.3Melpitz winter 2.9± 2.1 2.5± 1.4 1.1± 0.4 −1.5± 1.5 227.9± 0.7Palaiseau 20.3± 8.7 18.0± 7.0 2.5± 2.0 −4.9± 2.1 136.7± 0.3
Atmos. Meas. Tech., 14, 1379–1403, 2021 https://doi.org/10.5194/amt-14-1379-2021
R. E. Pileci et al.: Comparison of co-located rBC and EC mass concentration measurements 1389
(batn,corr) (Virkkula et al., 2007; Drinovec et al., 2015). Theattenuation coefficient is greater than the absorption coeffi-cient due to multi-scattering effects within the filter matrix,described with a proportionality constant C.
From a pair of batn,corr coefficients at two different wave-lengths, λ1 and λ2, it is possible to calculate the absorptionÅngström exponent, AAE(λ1, λ2), a coefficient commonlyused to describe the spectral dependence of the aerosol lightabsorption coefficient (Moosmüller et al., 2009):
AAE(λ1, λ2)=−ln(batn,1,corr(λ1))
ln(batn,1,corr(λ2))
ln(λ2)
ln(λ1). (10)
Note that since the Aethalometer C value has only a smallspectral dependence (Weingartner et al., 2003; Corbin et al.,2018), it is possible to infer the AAE directly from the cor-rected attenuation coefficient, as is done in this work.
The AAE provides an indication of the sources of BC (Zot-ter et al., 2017). The light absorption of particles from trafficemissions is dominated by BC, which has an AAE of ∼ 1.By contrast, wood burning emissions contain a mixture ofBC and co-emitted brown carbon. Light absorption by browncarbon has a much stronger spectral dependence than BC,such that the mixture has an AAE of between ∼ 1 and 3(Kirchstetter et al., 2004; Corbin et al., 2018). This makesrelative apportionment of BC to traffic and wood burningsources based on the aerosol AAE possible. However, thissimple approach only works in the absence of additional BCsources or light-absorbing aerosol components (e.g., fromcoal combustion).
In this paper the AAE values were calculated with theformula presented in Eq. (10) with λ1 = 470 nm and λ2 =
950 nm. Aethalometer AE31 (Magee Scientific) instrumentswere used during the Palaiseau and Cabauw campaigns.These measurements were corrected for the loading effectwith the algorithm developed by Weingartner et al. (2003).In the other campaigns, Aethalometer AE33 (Magee Scien-tific) instruments were used. These data did not need fur-ther correction since the algorithm developed by Drinovecet al. (2015), which takes into account the filter loading ef-fect, is incorporated into the instrument. However, the AE33firmware correction was not working properly during theBologna campaign. Therefore, these data were corrected us-ing the Weingartner et al. (2003) correction.
3 Results and discussion
3.1 Mass of rBC potentially missing below the LDL ofthe SP2
3.1.1 Comparison of two approaches to correct for thetruncated rBC mass
In the following, we compare the results from the two dif-ferent approaches for estimating the missing rBC mass con-
centration outside the size range covered by the SP2 (seeSect. 2.3.5).
Typically, the measured size distributions only approxi-mately followed a lognormal distribution. We chose to inferand present the missed rBC mass estimate based on fittingacross the range from 80 to 300 nm. In addition, the sensi-tivity to the fitted range was assessed. The estimated missedrBC mass below the SP2 LDL increased by up to 11 % ofthe measured mass when increasing the lower fit limit from80 to 100 nm, i.e., around the SP2 LDL. This provides ev-idence that the extrapolation towards the smallest BC coresis not strongly affected by the SP2 counting efficiency per-formance, which could potentially be degraded in this range.The fit approach used the total area of a lognormal fit to rBCmass size distributions to obtain the correct rBC mass. Sen-sitivity analyses performed with fitting to a manually pre-scribed upper limit between 200 and 400 nm showed that thefit results were insensitive to the choice of this upper limitfor valid fits. Therefore, a fixed fit range from 80 to 300 nm,which always provides a good match between the measuredand fitted size distribution around the mode of the distribu-tion, will be used in the remainder of this paper for missingmass corrections. The validity of the fits was determined bycomparing the fitted peak location with the mode of the mea-sured data. Data were only fitted to a manually prescribedupper limit, and the fit results were insensitive to the choiceof this upper limit for valid fits, while larger deviations oc-curred for invalid fits.
Detailed results of the missing mass correction are listed inTable 4. The extrapolation method and the fit method providecomparable results. It can be seen that 1mextrap varied in therange of 3 %–25 %, while 1mfit varied between 3 %–21 %.Considerable variability in missing mass correction betweencampaigns occurred due to differences in the rBC mass sizedistribution, especially differences in the average modal di-ameters, which are also listed in Table 4. As shown in Eq. (9),the extrapolation and the fit methods for missing mass cor-rection differ by the sum of the fit residual (1mfitresid) andthe extrapolated mass above the UDL (1mrBC>UDL). The op-posite signs and comparable magnitudes of these two terms(Table 4), shown as purple and blue shading in Figs. 1 and S1,have partially compensating effects, resulting on average inonly a 3 % difference between the two missing mass correc-tion methods.
The systematic difference between measurement and fitfor rBC mass equivalent diameters near the UDL of theSP2 (Figs. 1 and S1) could indicate either the presence ofa second lognormal mode that is centered at a larger diam-eter than the main mode or an inaccurate extrapolation ofthe incandescence signal calibration for masses greater than64 fg (DrBC = 408 nm). As both effects make extrapolationof the rBC mass size distribution above the UDL uncertain,we decided to apply the extrapolation method in this study.As explained in Sect. 2.3.5 (Eqs. 1 and 2), the extrapolationmethod only uses the fit below the LDL of the SP2 to esti-
https://doi.org/10.5194/amt-14-1379-2021 Atmos. Meas. Tech., 14, 1379–1403, 2021
1390 R. E. Pileci et al.: Comparison of co-located rBC and EC mass concentration measurements
mate missing rBC mass. This ensures a well-defined uppercut-off in terms of rBC core mass for the corrected rBC massconcentration results. In the following, all reported rBC massconcentrations are corrected with the extrapolation method(Eq. 2) with the fit range chosen from 80 to 300 nm, unlessotherwise stated.
The missing mass correction results for the Melpitz wintercampaign are significantly different from those for the Mel-pitz summer campaign and all other campaigns (Figs. 1, S1and Table 4). Specifically, the missed mass percentage forthe Melpitz winter campaign is less than 3 %, while it is be-tween 18 % and 24.5 % for the other campaigns. This is dueto the fact that the Melpitz winter rBC core mass size distri-bution peaks in the middle of the SP2 detection range, withDrBC,mode = 227.9 nm (Fig. 1 and Table 4). This is not thecase for the other campaigns, where, as shown in Table 4, theaverage rBC mass size distributions have their maximum be-tween 118.6 and 142.9 nm (Figs. 1 and S1). This could indi-cate that in Melpitz during the winter the BC source was dif-ferent from that of the other campaigns of this work. Indeed,with a back-trajectory analysis on the same dataset, Yuan etal. (2021) showed that the period between 5 and 14 Febru-ary 2017 was characterized by air masses transported fromsoutheast Europe, where coal is still used as fuel (Spindleret al., 2013). Coal combustion and biomass burning producerBC size distributions with larger modal diameter than traf-fic emissions (Bond et al., 2013; Liu et al., 2014; Schwarz,2019).
3.1.2 Limits to rBC mass missed in small BC coresimposed by the BC particle number
The presence of an additional mode of small particles be-low the lower detection limit of the SP2 would introduce anerror in the above extrapolation calculations. Indeed, a sub-stantial fraction of nascent soot particles emitted by combus-tion engines is usually below the detectable size range of theSP2. Count median diameters (CMDs) of nonvolatile particlesize distributions in aircraft turbine exhaust range from 15 to40 nm (Lobo et al., 2015; Durdina et al., 2017, 2019) whileunfiltered gasoline direct injection and diesel engines havelarger CMD values ranging from 50 to 100 nm (Burtscher etal., 2001; Momenimovahed and Olfert, 2015).
The existence of additional modes of BC cores at diam-eters below the SP2 lower detection limit has been hypoth-esized based on the observation of “upticks” in rBC masssize distributions at the LDL of the SP2 (i.e., increasing par-ticle concentration with decreasing mass equivalent diameteras the SP2 LDL is approached) (Liggio et al., 2012; Cappaet al., 2019). Cappa et al. (2019) performed multi-modal fitsto measured SP2 size distributions with upticks assuming afixed modal diameter (47 nm) and geometric standard devia-tion (1.63) of the lognormal mode lying below the SP2 LDL.These authors estimated that the campaign average mass con-centration of the hypothesized small mode of BC particles
was as large as 52 % of the total measured rBC mass con-centration. While upticks at the lower end of SP2 size dis-tributions may indicate the presence of an additional modeof small rBC particles, it should be noted that these upticksmight also represent measurement artifacts. SP2 measure-ments of rBC cores with diameters below 100 nm are sen-sitive to small variations in fitted calibration curves, and it isdifficult to perform accurate calibration measurements nearthe LDL of the SP2 (Laborde et al., 2012a). Nevertheless,we cannot exclude the presence of an undetected mode witha small modal diameter between around a 40 and 60 nm BCcore size in our studies. An even smaller mode diameteris considered unlikely because such small particles can befound only in the proximity of a source (Zhu et al., 2006). Alarger mode diameter is unrealistic in our campaigns becausewe did not see any sign of the upper tail of such a hypo-thetical mode at the bottom end of the BC size distributionmeasured by the SP2.
The mass of BC particles below the lower detection limitof the SP2 (DrBC<∼ 80 nm) can be estimated by measur-ing the total number concentration of nonvolatile particlesby thermo-denuded MPSS measurements, assuming that BCparticles dominate the number of nonvolatile (NV) parti-cles remaining after thermal treatment (Clarke et al., 2004).Miyakawa et al. (2016) employed this approach to concludethat the fraction of small rBC particles with DrBC less thanaround 80 nm did not contribute substantially to the total rBCmass concentrations measured at an industrial site south ofTokyo, Japan. In the absence of such thermally treated mea-surements, we assume 30 % of total measured particle num-ber concentration as an upper limit for total BC particle num-ber concentration (Wehner et al., 2004; Reddington et al.,2013; Cheung et al., 2016). This provides, after subtractionof the BC particle number concentration measured by theSP2, an upper limit (nlimit) for the undetected BC particlenumber concentration.
The three quantities of BC particle number concentration,rBC mass concentration and rBC mass equivalent diame-ter are unambiguously related for a hypothetical perfectlymonodisperse mode of BC particles. This relationship is il-lustrated in Fig. 2, which presents BC number concentra-tion versus rBC mass equivalent diameter along with iso-lines of constant rBC mass concentration (dash-dotted lines).For example, the magenta marker indicates that a BC par-ticle number concentration of 494 cm−3 and rBC core di-ameter of 40 nm translates to an rBC mass concentration of0.03 µg m−3. The horizontal dashed lines in Fig. 2 indicatethe estimated upper limit, nlimit, for the BC particle num-ber undetected by the SP2. Taking the Melpitz winter cam-paign as an example, the dashed blue line is clearly belowthe oblique continuous blue line in the BC core range be-tween 40 and 60 nm. Comparing the rBC mass concentra-tions corresponding to these two lines at a 40 and 60 nm di-ameter shows that the maximal undetected rBC mass concen-tration associated with small BC cores is at most 7 % to 23 %
Atmos. Meas. Tech., 14, 1379–1403, 2021 https://doi.org/10.5194/amt-14-1379-2021
R. E. Pileci et al.: Comparison of co-located rBC and EC mass concentration measurements 1391
of the measured rBC mass concentration for modes peak-ing within these size limits. For Cabauw, the number limitand mass concentration lines cross at 55.5 nm (green point).The intersect implies that an undetected mode peaking at thissize could at most contribute as much additional rBC massas measured by the SP2. The constraints resulting for unde-tected modes between 40 and 60 nm are an additional 37 %and 125 % of observed rBC mass, respectively. For the Mel-pitz summer campaign, the number limit only provides a veryweak constraint on the missed mass as the intercept occursat 43.5 nm (red point). Therefore, the undetected rBC masscould reach up to 263 % of detected rBC mass if the modaldiameter was located at 60 nm.
Based on the discussion in Sect. 3.1.1, in this study we ap-plied the extrapolation method to correct for estimated rBCmass below the SP2 LDL (1mextrap in Table 4). The resultingcorrections are smaller than the upper limit imposed by theBC particle number as discussed here. Hence, it cannot be ex-cluded that the truly missed mass was larger than accountedfor. The conservative estimate based on the BC particle num-ber considerations suggests that the missing mass could be aslarge as 23 % (applied correction 3 %), 125 % (applied cor-rection 22 %) and 263 % (applied correction 25 %) for theMelpitz winter, Cabauw and Melpitz summer campaigns, re-spectively.
3.2 Comparison of observed EC and rBC massconcentrations
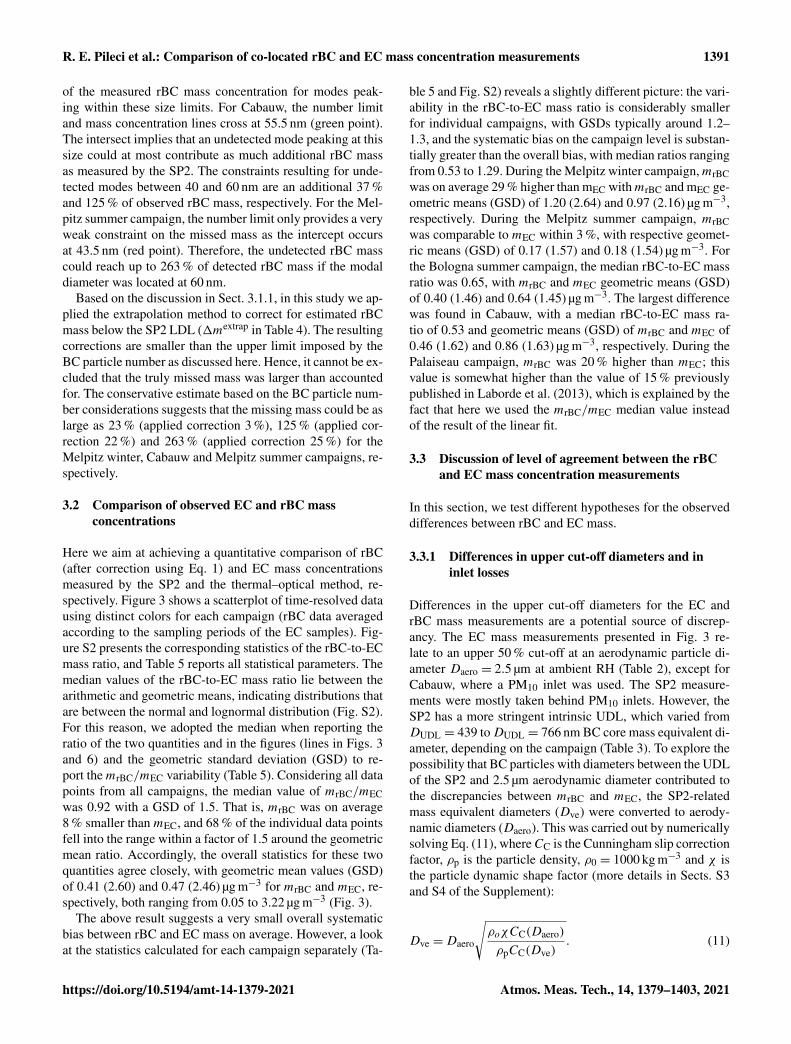
Here we aim at achieving a quantitative comparison of rBC(after correction using Eq. 1) and EC mass concentrationsmeasured by the SP2 and the thermal–optical method, re-spectively. Figure 3 shows a scatterplot of time-resolved datausing distinct colors for each campaign (rBC data averagedaccording to the sampling periods of the EC samples). Fig-ure S2 presents the corresponding statistics of the rBC-to-ECmass ratio, and Table 5 reports all statistical parameters. Themedian values of the rBC-to-EC mass ratio lie between thearithmetic and geometric means, indicating distributions thatare between the normal and lognormal distribution (Fig. S2).For this reason, we adopted the median when reporting theratio of the two quantities and in the figures (lines in Figs. 3and 6) and the geometric standard deviation (GSD) to re-port themrBC/mEC variability (Table 5). Considering all datapoints from all campaigns, the median value of mrBC/mECwas 0.92 with a GSD of 1.5. That is, mrBC was on average8 % smaller thanmEC, and 68 % of the individual data pointsfell into the range within a factor of 1.5 around the geometricmean ratio. Accordingly, the overall statistics for these twoquantities agree closely, with geometric mean values (GSD)of 0.41 (2.60) and 0.47 (2.46) µg m−3 for mrBC and mEC, re-spectively, both ranging from 0.05 to 3.22 µg m−3 (Fig. 3).
The above result suggests a very small overall systematicbias between rBC and EC mass on average. However, a lookat the statistics calculated for each campaign separately (Ta-
ble 5 and Fig. S2) reveals a slightly different picture: the vari-ability in the rBC-to-EC mass ratio is considerably smallerfor individual campaigns, with GSDs typically around 1.2–1.3, and the systematic bias on the campaign level is substan-tially greater than the overall bias, with median ratios rangingfrom 0.53 to 1.29. During the Melpitz winter campaign,mrBCwas on average 29 % higher than mEC withmrBC and mEC ge-ometric means (GSD) of 1.20 (2.64) and 0.97 (2.16) µg m−3,respectively. During the Melpitz summer campaign, mrBCwas comparable to mEC within 3 %, with respective geomet-ric means (GSD) of 0.17 (1.57) and 0.18 (1.54) µg m−3. Forthe Bologna summer campaign, the median rBC-to-EC massratio was 0.65, with mrBC and mEC geometric means (GSD)of 0.40 (1.46) and 0.64 (1.45) µg m−3. The largest differencewas found in Cabauw, with a median rBC-to-EC mass ra-tio of 0.53 and geometric means (GSD) of mrBC and mEC of0.46 (1.62) and 0.86 (1.63) µg m−3, respectively. During thePalaiseau campaign, mrBC was 20 % higher than mEC; thisvalue is somewhat higher than the value of 15 % previouslypublished in Laborde et al. (2013), which is explained by thefact that here we used the mrBC/mEC median value insteadof the result of the linear fit.
3.3 Discussion of level of agreement between the rBCand EC mass concentration measurements
In this section, we test different hypotheses for the observeddifferences between rBC and EC mass.
3.3.1 Differences in upper cut-off diameters and ininlet losses
Differences in the upper cut-off diameters for the EC andrBC mass measurements are a potential source of discrep-ancy. The EC mass measurements presented in Fig. 3 re-late to an upper 50 % cut-off at an aerodynamic particle di-ameter Daero = 2.5 µm at ambient RH (Table 2), except forCabauw, where a PM10 inlet was used. The SP2 measure-ments were mostly taken behind PM10 inlets. However, theSP2 has a more stringent intrinsic UDL, which varied fromDUDL = 439 toDUDL = 766 nm BC core mass equivalent di-ameter, depending on the campaign (Table 3). To explore thepossibility that BC particles with diameters between the UDLof the SP2 and 2.5 µm aerodynamic diameter contributed tothe discrepancies between mrBC and mEC, the SP2-relatedmass equivalent diameters (Dve) were converted to aerody-namic diameters (Daero). This was carried out by numericallysolving Eq. (11), whereCC is the Cunningham slip correctionfactor, ρp is the particle density, ρ0 = 1000 kg m−3 and χ isthe particle dynamic shape factor (more details in Sects. S3and S4 of the Supplement):
Dve =Daero
√ρoχCC(Daero)
ρpCC(Dve). (11)
https://doi.org/10.5194/amt-14-1379-2021 Atmos. Meas. Tech., 14, 1379–1403, 2021
1392 R. E. Pileci et al.: Comparison of co-located rBC and EC mass concentration measurements
Figure 3. The rBC mass concentration versus EC mass concentration for the five campaigns studied in this paper. The median rBC-to-ECmass ratios are shown as lines for each campaign. Uncertainties in EC measurements as a function of EC and TC filter surface loadings aswell as EC-to-TC mass ratio are presented in Fig. S3 and discussed in Sect. 3.3.2.
During the Melpitz winter campaign, the intrinsic UDL wasat DrBC = 722 nm. The aerodynamic diameter of externallymixed bare BC cores of this size varies from around Daero =
625 nm for fractal-like shapes to 970 nm for compact shapes(Table S3). For coated BC particles, the corresponding dryaerodynamic diameter ranges from around 1140 to 1660 nmfor coating-to-core mass ratios of 1 : 1 and 6 : 1, respec-tively. The actual BC mixing state was measured by Yuan etal. (2021), though at smaller core diameters. Using these dataas a constraint provides around 1320 nm as a best estimatefor the dry aerodynamic diameter. However, the impactorfor the filter sampling is operated at ambient RH, whichmeans that hygroscopic growth affects the cut-off diameter.Potential hygroscopic growth was assessed as described inSect. S4. Accordingly, the aerodynamic diameter of particleswith BC core sizes at the SP2 UDL increases to up to 1610and 2230 nm at 80 % and 95 % RH, respectively, for the best-estimate BC mixing state. Externally mixed bare BC parti-cles are not affected by hygroscopic growth. Based on thisanalysis, it can be expected that the intrinsic SP2 UDL trans-lates to a cut-off varying between PM1 and PM2.5 or even
slightly smaller or greater under extreme assumptions. Thisstatement also applies for the Melpitz summer campaign,where the SP2 UDL differed only marginally from that ofthe Melpitz winter campaign (Table 3).
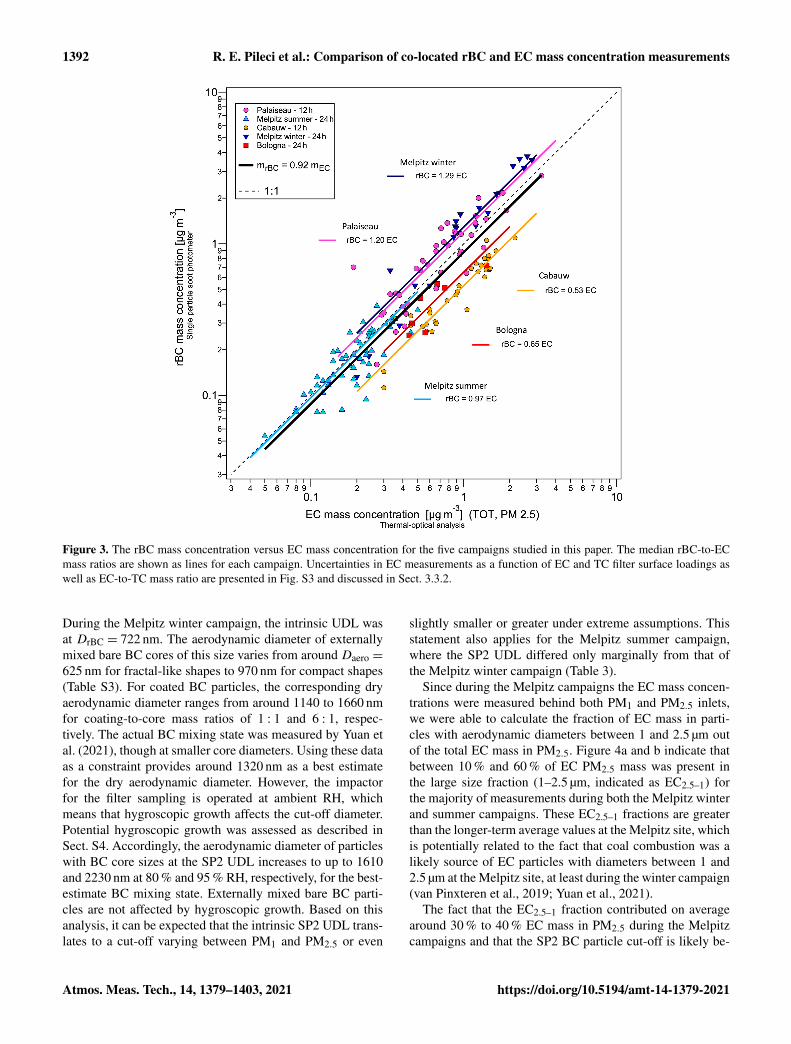
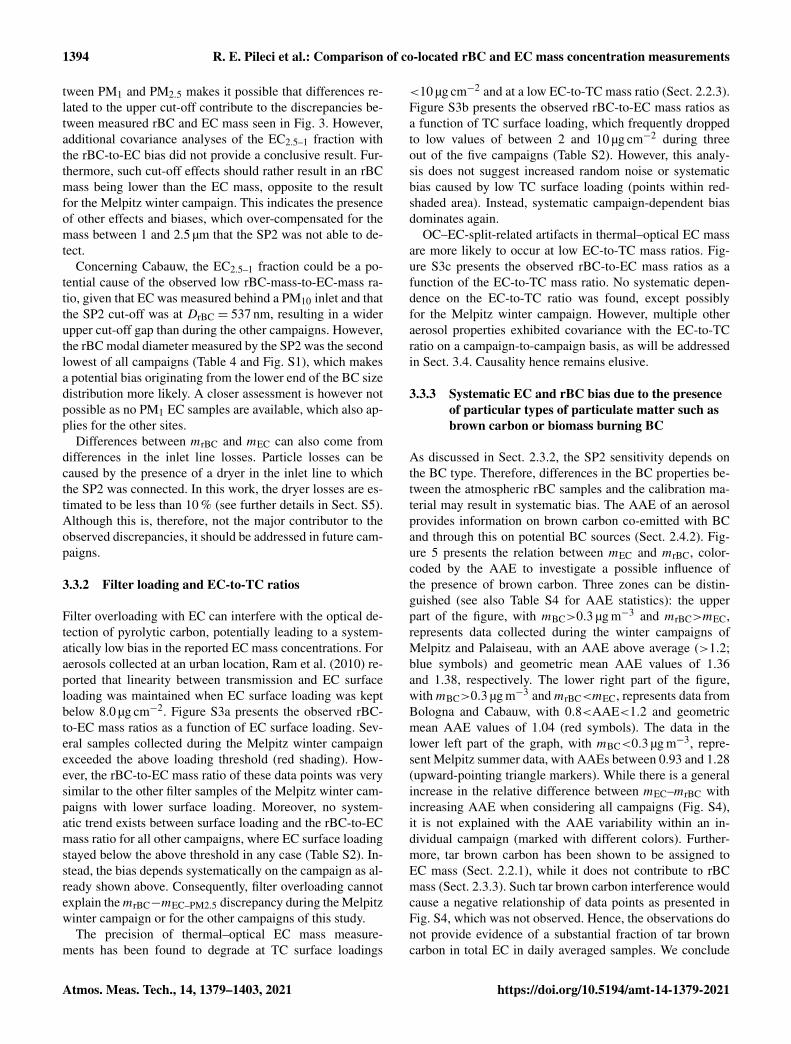
Since during the Melpitz campaigns the EC mass concen-trations were measured behind both PM1 and PM2.5 inlets,we were able to calculate the fraction of EC mass in parti-cles with aerodynamic diameters between 1 and 2.5 µm outof the total EC mass in PM2.5. Figure 4a and b indicate thatbetween 10 % and 60 % of EC PM2.5 mass was present inthe large size fraction (1–2.5 µm, indicated as EC2.5–1) forthe majority of measurements during both the Melpitz winterand summer campaigns. These EC2.5–1 fractions are greaterthan the longer-term average values at the Melpitz site, whichis potentially related to the fact that coal combustion was alikely source of EC particles with diameters between 1 and2.5 µm at the Melpitz site, at least during the winter campaign(van Pinxteren et al., 2019; Yuan et al., 2021).
The fact that the EC2.5–1 fraction contributed on averagearound 30 % to 40 % EC mass in PM2.5 during the Melpitzcampaigns and that the SP2 BC particle cut-off is likely be-
Atmos. Meas. Tech., 14, 1379–1403, 2021 https://doi.org/10.5194/amt-14-1379-2021
R. E. Pileci et al.: Comparison of co-located rBC and EC mass concentration measurements 1393
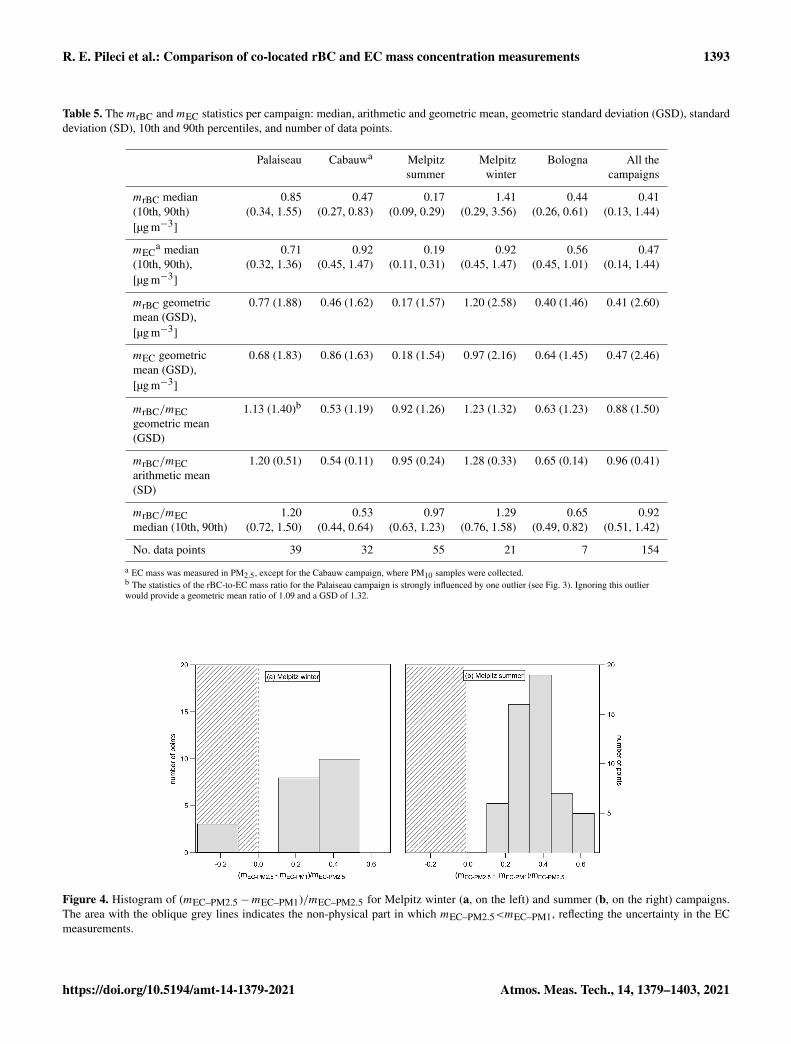
Table 5. The mrBC and mEC statistics per campaign: median, arithmetic and geometric mean, geometric standard deviation (GSD), standarddeviation (SD), 10th and 90th percentiles, and number of data points.
Palaiseau Cabauwa Melpitz Melpitz Bologna All thesummer winter campaigns
mrBC median 0.85 0.47 0.17 1.41 0.44 0.41(10th, 90th) (0.34, 1.55) (0.27, 0.83) (0.09, 0.29) (0.29, 3.56) (0.26, 0.61) (0.13, 1.44)[µg m−3]
mECa median 0.71 0.92 0.19 0.92 0.56 0.47
(10th, 90th), (0.32, 1.36) (0.45, 1.47) (0.11, 0.31) (0.45, 1.47) (0.45, 1.01) (0.14, 1.44)[µg m−3]
mrBC geometric 0.77 (1.88) 0.46 (1.62) 0.17 (1.57) 1.20 (2.58) 0.40 (1.46) 0.41 (2.60)mean (GSD),[µg m−3]
mEC geometric 0.68 (1.83) 0.86 (1.63) 0.18 (1.54) 0.97 (2.16) 0.64 (1.45) 0.47 (2.46)mean (GSD),[µg m−3]
mrBC/mEC 1.13 (1.40)b 0.53 (1.19) 0.92 (1.26) 1.23 (1.32) 0.63 (1.23) 0.88 (1.50)geometric mean(GSD)
mrBC/mEC 1.20 (0.51) 0.54 (0.11) 0.95 (0.24) 1.28 (0.33) 0.65 (0.14) 0.96 (0.41)arithmetic mean(SD)
mrBC/mEC 1.20 0.53 0.97 1.29 0.65 0.92median (10th, 90th) (0.72, 1.50) (0.44, 0.64) (0.63, 1.23) (0.76, 1.58) (0.49, 0.82) (0.51, 1.42)
No. data points 39 32 55 21 7 154
a EC mass was measured in PM2.5, except for the Cabauw campaign, where PM10 samples were collected.b The statistics of the rBC-to-EC mass ratio for the Palaiseau campaign is strongly influenced by one outlier (see Fig. 3). Ignoring this outlierwould provide a geometric mean ratio of 1.09 and a GSD of 1.32.
Figure 4. Histogram of (mEC–PM2.5−mEC–PM1)/mEC–PM2.5 for Melpitz winter (a, on the left) and summer (b, on the right) campaigns.The area with the oblique grey lines indicates the non-physical part in which mEC–PM2.5<mEC–PM1, reflecting the uncertainty in the ECmeasurements.
https://doi.org/10.5194/amt-14-1379-2021 Atmos. Meas. Tech., 14, 1379–1403, 2021
1394 R. E. Pileci et al.: Comparison of co-located rBC and EC mass concentration measurements
tween PM1 and PM2.5 makes it possible that differences re-lated to the upper cut-off contribute to the discrepancies be-tween measured rBC and EC mass seen in Fig. 3. However,additional covariance analyses of the EC2.5–1 fraction withthe rBC-to-EC bias did not provide a conclusive result. Fur-thermore, such cut-off effects should rather result in an rBCmass being lower than the EC mass, opposite to the resultfor the Melpitz winter campaign. This indicates the presenceof other effects and biases, which over-compensated for themass between 1 and 2.5 µm that the SP2 was not able to de-tect.
Concerning Cabauw, the EC2.5–1 fraction could be a po-tential cause of the observed low rBC-mass-to-EC-mass ra-tio, given that EC was measured behind a PM10 inlet and thatthe SP2 cut-off was at DrBC = 537 nm, resulting in a widerupper cut-off gap than during the other campaigns. However,the rBC modal diameter measured by the SP2 was the secondlowest of all campaigns (Table 4 and Fig. S1), which makesa potential bias originating from the lower end of the BC sizedistribution more likely. A closer assessment is however notpossible as no PM1 EC samples are available, which also ap-plies for the other sites.
Differences between mrBC and mEC can also come fromdifferences in the inlet line losses. Particle losses can becaused by the presence of a dryer in the inlet line to whichthe SP2 was connected. In this work, the dryer losses are es-timated to be less than 10 % (see further details in Sect. S5).Although this is, therefore, not the major contributor to theobserved discrepancies, it should be addressed in future cam-paigns.
3.3.2 Filter loading and EC-to-TC ratios
Filter overloading with EC can interfere with the optical de-tection of pyrolytic carbon, potentially leading to a system-atically low bias in the reported EC mass concentrations. Foraerosols collected at an urban location, Ram et al. (2010) re-ported that linearity between transmission and EC surfaceloading was maintained when EC surface loading was keptbelow 8.0 µg cm−2. Figure S3a presents the observed rBC-to-EC mass ratios as a function of EC surface loading. Sev-eral samples collected during the Melpitz winter campaignexceeded the above loading threshold (red shading). How-ever, the rBC-to-EC mass ratio of these data points was verysimilar to the other filter samples of the Melpitz winter cam-paigns with lower surface loading. Moreover, no system-atic trend exists between surface loading and the rBC-to-ECmass ratio for all other campaigns, where EC surface loadingstayed below the above threshold in any case (Table S2). In-stead, the bias depends systematically on the campaign as al-ready shown above. Consequently, filter overloading cannotexplain themrBC−mEC–PM2.5 discrepancy during the Melpitzwinter campaign or for the other campaigns of this study.
The precision of thermal–optical EC mass measure-ments has been found to degrade at TC surface loadings
<10 µg cm−2 and at a low EC-to-TC mass ratio (Sect. 2.2.3).Figure S3b presents the observed rBC-to-EC mass ratios asa function of TC surface loading, which frequently droppedto low values of between 2 and 10 µg cm−2 during threeout of the five campaigns (Table S2). However, this analy-sis does not suggest increased random noise or systematicbias caused by low TC surface loading (points within red-shaded area). Instead, systematic campaign-dependent biasdominates again.
OC–EC-split-related artifacts in thermal–optical EC massare more likely to occur at low EC-to-TC mass ratios. Fig-ure S3c presents the observed rBC-to-EC mass ratios as afunction of the EC-to-TC mass ratio. No systematic depen-dence on the EC-to-TC ratio was found, except possiblyfor the Melpitz winter campaign. However, multiple otheraerosol properties exhibited covariance with the EC-to-TCratio on a campaign-to-campaign basis, as will be addressedin Sect. 3.4. Causality hence remains elusive.
3.3.3 Systematic EC and rBC bias due to the presenceof particular types of particulate matter such asbrown carbon or biomass burning BC
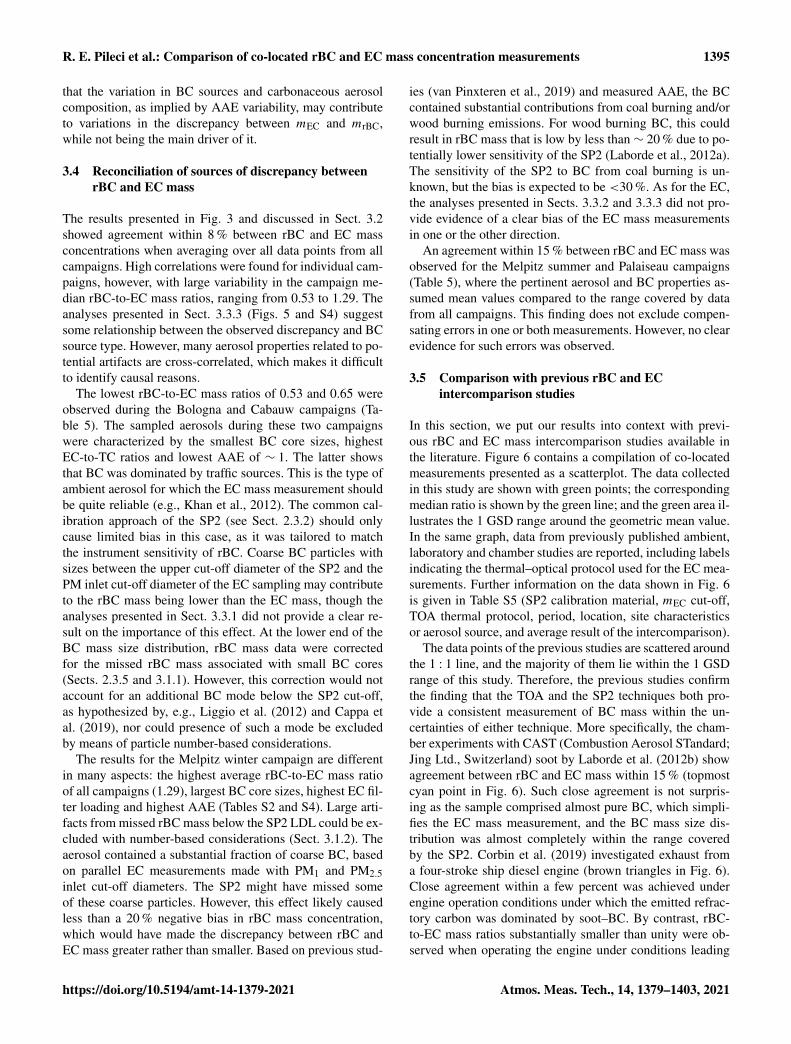
As discussed in Sect. 2.3.2, the SP2 sensitivity depends onthe BC type. Therefore, differences in the BC properties be-tween the atmospheric rBC samples and the calibration ma-terial may result in systematic bias. The AAE of an aerosolprovides information on brown carbon co-emitted with BCand through this on potential BC sources (Sect. 2.4.2). Fig-ure 5 presents the relation between mEC and mrBC, color-coded by the AAE to investigate a possible influence ofthe presence of brown carbon. Three zones can be distin-guished (see also Table S4 for AAE statistics): the upperpart of the figure, with mBC>0.3 µg m−3 and mrBC>mEC,represents data collected during the winter campaigns ofMelpitz and Palaiseau, with an AAE above average (>1.2;blue symbols) and geometric mean AAE values of 1.36and 1.38, respectively. The lower right part of the figure,withmBC>0.3 µg m−3 andmrBC<mEC, represents data fromBologna and Cabauw, with 0.8<AAE<1.2 and geometricmean AAE values of 1.04 (red symbols). The data in thelower left part of the graph, with mBC<0.3 µg m−3, repre-sent Melpitz summer data, with AAEs between 0.93 and 1.28(upward-pointing triangle markers). While there is a generalincrease in the relative difference between mEC–mrBC withincreasing AAE when considering all campaigns (Fig. S4),it is not explained with the AAE variability within an in-dividual campaign (marked with different colors). Further-more, tar brown carbon has been shown to be assigned toEC mass (Sect. 2.2.1), while it does not contribute to rBCmass (Sect. 2.3.3). Such tar brown carbon interference wouldcause a negative relationship of data points as presented inFig. S4, which was not observed. Hence, the observations donot provide evidence of a substantial fraction of tar browncarbon in total EC in daily averaged samples. We conclude
Atmos. Meas. Tech., 14, 1379–1403, 2021 https://doi.org/10.5194/amt-14-1379-2021
R. E. Pileci et al.: Comparison of co-located rBC and EC mass concentration measurements 1395
that the variation in BC sources and carbonaceous aerosolcomposition, as implied by AAE variability, may contributeto variations in the discrepancy between mEC and mrBC,while not being the main driver of it.
3.4 Reconciliation of sources of discrepancy betweenrBC and EC mass
The results presented in Fig. 3 and discussed in Sect. 3.2showed agreement within 8 % between rBC and EC massconcentrations when averaging over all data points from allcampaigns. High correlations were found for individual cam-paigns, however, with large variability in the campaign me-dian rBC-to-EC mass ratios, ranging from 0.53 to 1.29. Theanalyses presented in Sect. 3.3.3 (Figs. 5 and S4) suggestsome relationship between the observed discrepancy and BCsource type. However, many aerosol properties related to po-tential artifacts are cross-correlated, which makes it difficultto identify causal reasons.
The lowest rBC-to-EC mass ratios of 0.53 and 0.65 wereobserved during the Bologna and Cabauw campaigns (Ta-ble 5). The sampled aerosols during these two campaignswere characterized by the smallest BC core sizes, highestEC-to-TC ratios and lowest AAE of ∼ 1. The latter showsthat BC was dominated by traffic sources. This is the type ofambient aerosol for which the EC mass measurement shouldbe quite reliable (e.g., Khan et al., 2012). The common cal-ibration approach of the SP2 (see Sect. 2.3.2) should onlycause limited bias in this case, as it was tailored to matchthe instrument sensitivity of rBC. Coarse BC particles withsizes between the upper cut-off diameter of the SP2 and thePM inlet cut-off diameter of the EC sampling may contributeto the rBC mass being lower than the EC mass, though theanalyses presented in Sect. 3.3.1 did not provide a clear re-sult on the importance of this effect. At the lower end of theBC mass size distribution, rBC mass data were correctedfor the missed rBC mass associated with small BC cores(Sects. 2.3.5 and 3.1.1). However, this correction would notaccount for an additional BC mode below the SP2 cut-off,as hypothesized by, e.g., Liggio et al. (2012) and Cappa etal. (2019), nor could presence of such a mode be excludedby means of particle number-based considerations.
The results for the Melpitz winter campaign are differentin many aspects: the highest average rBC-to-EC mass ratioof all campaigns (1.29), largest BC core sizes, highest EC fil-ter loading and highest AAE (Tables S2 and S4). Large arti-facts from missed rBC mass below the SP2 LDL could be ex-cluded with number-based considerations (Sect. 3.1.2). Theaerosol contained a substantial fraction of coarse BC, basedon parallel EC measurements made with PM1 and PM2.5inlet cut-off diameters. The SP2 might have missed someof these coarse particles. However, this effect likely causedless than a 20 % negative bias in rBC mass concentration,which would have made the discrepancy between rBC andEC mass greater rather than smaller. Based on previous stud-
ies (van Pinxteren et al., 2019) and measured AAE, the BCcontained substantial contributions from coal burning and/orwood burning emissions. For wood burning BC, this couldresult in rBC mass that is low by less than ∼ 20 % due to po-tentially lower sensitivity of the SP2 (Laborde et al., 2012a).The sensitivity of the SP2 to BC from coal burning is un-known, but the bias is expected to be <30 %. As for the EC,the analyses presented in Sects. 3.3.2 and 3.3.3 did not pro-vide evidence of a clear bias of the EC mass measurementsin one or the other direction.
An agreement within 15 % between rBC and EC mass wasobserved for the Melpitz summer and Palaiseau campaigns(Table 5), where the pertinent aerosol and BC properties as-sumed mean values compared to the range covered by datafrom all campaigns. This finding does not exclude compen-sating errors in one or both measurements. However, no clearevidence for such errors was observed.
3.5 Comparison with previous rBC and ECintercomparison studies
In this section, we put our results into context with previ-ous rBC and EC mass intercomparison studies available inthe literature. Figure 6 contains a compilation of co-locatedmeasurements presented as a scatterplot. The data collectedin this study are shown with green points; the correspondingmedian ratio is shown by the green line; and the green area il-lustrates the 1 GSD range around the geometric mean value.In the same graph, data from previously published ambient,laboratory and chamber studies are reported, including labelsindicating the thermal–optical protocol used for the EC mea-surements. Further information on the data shown in Fig. 6is given in Table S5 (SP2 calibration material, mEC cut-off,TOA thermal protocol, period, location, site characteristicsor aerosol source, and average result of the intercomparison).
The data points of the previous studies are scattered aroundthe 1 : 1 line, and the majority of them lie within the 1 GSDrange of this study. Therefore, the previous studies confirmthe finding that the TOA and the SP2 techniques both pro-vide a consistent measurement of BC mass within the un-certainties of either technique. More specifically, the cham-ber experiments with CAST (Combustion Aerosol STandard;Jing Ltd., Switzerland) soot by Laborde et al. (2012b) showagreement between rBC and EC mass within 15 % (topmostcyan point in Fig. 6). Such close agreement is not surpris-ing as the sample comprised almost pure BC, which simpli-fies the EC mass measurement, and the BC mass size dis-tribution was almost completely within the range coveredby the SP2. Corbin et al. (2019) investigated exhaust froma four-stroke ship diesel engine (brown triangles in Fig. 6).Close agreement within a few percent was achieved underengine operation conditions under which the emitted refrac-tory carbon was dominated by soot–BC. By contrast, rBC-to-EC mass ratios substantially smaller than unity were ob-served when operating the engine under conditions leading
https://doi.org/10.5194/amt-14-1379-2021 Atmos. Meas. Tech., 14, 1379–1403, 2021
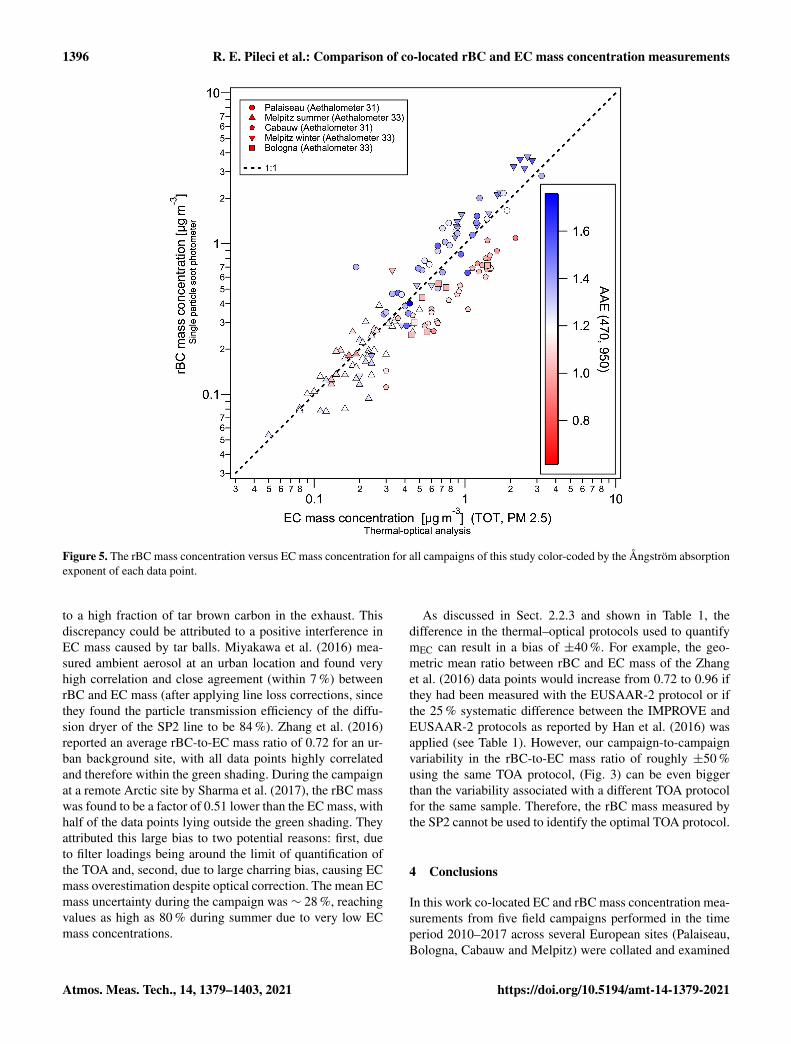
1396 R. E. Pileci et al.: Comparison of co-located rBC and EC mass concentration measurements
Figure 5. The rBC mass concentration versus EC mass concentration for all campaigns of this study color-coded by the Ångström absorptionexponent of each data point.
to a high fraction of tar brown carbon in the exhaust. Thisdiscrepancy could be attributed to a positive interference inEC mass caused by tar balls. Miyakawa et al. (2016) mea-sured ambient aerosol at an urban location and found veryhigh correlation and close agreement (within 7 %) betweenrBC and EC mass (after applying line loss corrections, sincethey found the particle transmission efficiency of the diffu-sion dryer of the SP2 line to be 84 %). Zhang et al. (2016)reported an average rBC-to-EC mass ratio of 0.72 for an ur-ban background site, with all data points highly correlatedand therefore within the green shading. During the campaignat a remote Arctic site by Sharma et al. (2017), the rBC masswas found to be a factor of 0.51 lower than the EC mass, withhalf of the data points lying outside the green shading. Theyattributed this large bias to two potential reasons: first, dueto filter loadings being around the limit of quantification ofthe TOA and, second, due to large charring bias, causing ECmass overestimation despite optical correction. The mean ECmass uncertainty during the campaign was ∼ 28 %, reachingvalues as high as 80 % during summer due to very low ECmass concentrations.
As discussed in Sect. 2.2.3 and shown in Table 1, thedifference in the thermal–optical protocols used to quantifymEC can result in a bias of ±40 %. For example, the geo-metric mean ratio between rBC and EC mass of the Zhanget al. (2016) data points would increase from 0.72 to 0.96 ifthey had been measured with the EUSAAR-2 protocol or ifthe 25 % systematic difference between the IMPROVE andEUSAAR-2 protocols as reported by Han et al. (2016) wasapplied (see Table 1). However, our campaign-to-campaignvariability in the rBC-to-EC mass ratio of roughly ±50 %using the same TOA protocol, (Fig. 3) can be even biggerthan the variability associated with a different TOA protocolfor the same sample. Therefore, the rBC mass measured bythe SP2 cannot be used to identify the optimal TOA protocol.
4 Conclusions
In this work co-located EC and rBC mass concentration mea-surements from five field campaigns performed in the timeperiod 2010–2017 across several European sites (Palaiseau,Bologna, Cabauw and Melpitz) were collated and examined
Atmos. Meas. Tech., 14, 1379–1403, 2021 https://doi.org/10.5194/amt-14-1379-2021
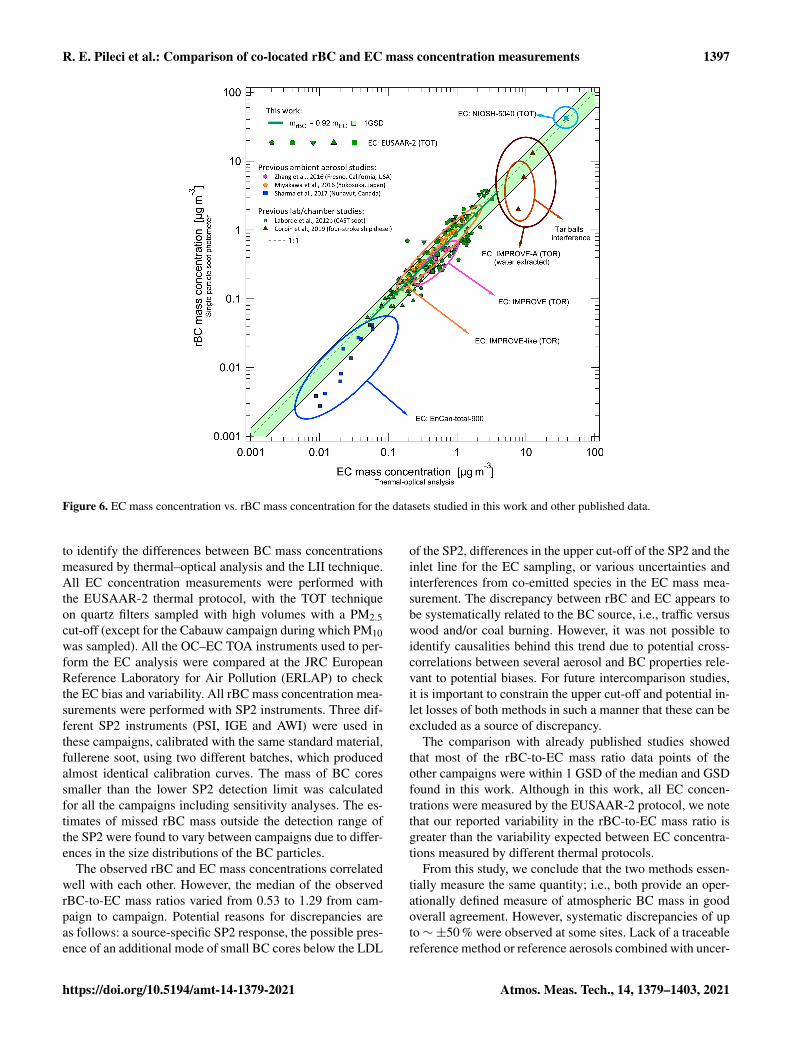
R. E. Pileci et al.: Comparison of co-located rBC and EC mass concentration measurements 1397
Figure 6. EC mass concentration vs. rBC mass concentration for the datasets studied in this work and other published data.
to identify the differences between BC mass concentrationsmeasured by thermal–optical analysis and the LII technique.All EC concentration measurements were performed withthe EUSAAR-2 thermal protocol, with the TOT techniqueon quartz filters sampled with high volumes with a PM2.5cut-off (except for the Cabauw campaign during which PM10was sampled). All the OC–EC TOA instruments used to per-form the EC analysis were compared at the JRC EuropeanReference Laboratory for Air Pollution (ERLAP) to checkthe EC bias and variability. All rBC mass concentration mea-surements were performed with SP2 instruments. Three dif-ferent SP2 instruments (PSI, IGE and AWI) were used inthese campaigns, calibrated with the same standard material,fullerene soot, using two different batches, which producedalmost identical calibration curves. The mass of BC coressmaller than the lower SP2 detection limit was calculatedfor all the campaigns including sensitivity analyses. The es-timates of missed rBC mass outside the detection range ofthe SP2 were found to vary between campaigns due to differ-ences in the size distributions of the BC particles.
The observed rBC and EC mass concentrations correlatedwell with each other. However, the median of the observedrBC-to-EC mass ratios varied from 0.53 to 1.29 from cam-paign to campaign. Potential reasons for discrepancies areas follows: a source-specific SP2 response, the possible pres-ence of an additional mode of small BC cores below the LDL
of the SP2, differences in the upper cut-off of the SP2 and theinlet line for the EC sampling, or various uncertainties andinterferences from co-emitted species in the EC mass mea-surement. The discrepancy between rBC and EC appears tobe systematically related to the BC source, i.e., traffic versuswood and/or coal burning. However, it was not possible toidentify causalities behind this trend due to potential cross-correlations between several aerosol and BC properties rele-vant to potential biases. For future intercomparison studies,it is important to constrain the upper cut-off and potential in-let losses of both methods in such a manner that these can beexcluded as a source of discrepancy.
The comparison with already published studies showedthat most of the rBC-to-EC mass ratio data points of theother campaigns were within 1 GSD of the median and GSDfound in this work. Although in this work, all EC concen-trations were measured by the EUSAAR-2 protocol, we notethat our reported variability in the rBC-to-EC mass ratio isgreater than the variability expected between EC concentra-tions measured by different thermal protocols.
From this study, we conclude that the two methods essen-tially measure the same quantity; i.e., both provide an oper-ationally defined measure of atmospheric BC mass in goodoverall agreement. However, systematic discrepancies of upto ∼±50 % were observed at some sites. Lack of a traceablereference method or reference aerosols combined with uncer-
https://doi.org/10.5194/amt-14-1379-2021 Atmos. Meas. Tech., 14, 1379–1403, 2021
1398 R. E. Pileci et al.: Comparison of co-located rBC and EC mass concentration measurements
tainties in both of the methods made it impossible to clearlyquantify the sources of discrepancies or to attribute them toone or the other method.
Data availability. The data archive for this paper is availableon Zenodo: https://doi.org/10.5281/zenodo.4445557 (Pileci et al.,2021).
Supplement. The supplement related to this article is available on-line at: https://doi.org/10.5194/amt-14-1379-2021-supplement.
Author contributions. REP, MB and RLM took the rBC measure-ments and/or analyzed the raw data during the Bologna campaign.AT was responsible for the EC measurements during the Bolognacampaign. AM coordinated the Bologna campaign. JY, MZ andRLM took the measurements and/or analyzed the raw data duringthe Melpitz winter campaign while JCC took the measurements andanalyzed the raw data during the Melpitz summer campaign. TT,TM and BW took the data and coordinated the Melpitz campaigns.GS was responsible for the EC measurements during the Melpitzcampaigns. BH, MMM and RLM were responsible for coordinationand/or measurements during the Cabauw campaign. JPP performedcalibrations of the thermal–optical OC–EC analyzers. REP synthe-sized all data sets, interpreted the results and wrote the manuscripttogether with RLM and MGB. All co-authors reviewed and com-mented on the manuscript.
Competing interests. The authors declare that they have no conflictof interest.
Disclaimer. The opinions expressed and arguments employedherein do not necessarily reflect the official views of the Swiss Gov-ernment.
Acknowledgements. The authors are grateful to Achim Grüner forthe technical support during the two Melpitz campaigns. We alsothank Claudia Zigola (ARPAE) who performed the TOA of the fil-ters during the Bologna campaign. The logistic support of CNR-ISAC technical staff (Francescopiero Calzolari) during the Bolognacampaign is appreciated. Many thanks go to the technical supportof Günther Wehrle during the Bologna campaign.
Financial support. This work received financial support fromthe ERC (grant ERC-CoG-615922-BLACARAT) and from theACTRIS-2 project (EU H2020-INFRAIA-2014-2015, grant agree-ment no. 654109, and Swiss State Secretariat for Education, Re-search and Innovation, contract number 15.0159-1). In addition,the field campaigns were supported by the Transnational Accessscheme of the ACTRIS-2 project. MZ received financial sup-port from the Deutsche Forschungsgemeinschaft (DFG, GermanResearch Foundation) – Projektnummer 268020496 – TRR 172,
within the Transregional Collaborative Research Centre “ArctiCAmplification: Climate Relevant Atmospheric and SurfaCe Pro-cesses and Feedback Mechanisms (AC)3”.
Review statement. This paper was edited by Pierre Herckes and re-viewed by two anonymous referees.
References
Aakko-Saksa, P., Koponen, P., Aurela, M., Vesala, H., Piimäkorpi,P., Murtonen, T., Sippula, O., Koponen, H., Karjalainen, P., Kuit-tinen, N., Panteliadis, P., Rönkkö, T., and Timonen, H.: Consider-ations in analysing elemental carbon from marine engine exhaustusing residual, distillate and biofuels, J. Aerosol Sci., 126, 191–204, https://doi.org/10.1016/j.jaerosci.2018.09.005, 2018.
Adachi, K., Chung, S. H., and Buseck, P. R.: Shapes of soot aerosolparticles and implications for their effects on climate, J. Geophys.Res., 115, D15206, https://doi.org/10.1029/2009JD012868,2010.
Adachi, K., Sedlacek, A. J., Kleinman, L., Springston, S. R.,Wang, J., Chand, D., Hubbe, J. M., Shilling, J. E., Onasch,T. B., Kinase, T., Sakata, K., Takahashi, Y., and Buseck,P. R.: Spherical tarball particles form through rapid chem-ical and physical changes of organic matter in biomass-burning smoke, P. Natl. Acad. Sci. USA, 116, 19336–19341,https://doi.org/10.1073/pnas.1900129116, 2019.
Altstädter, B., Platis, A., Jähn, M., Baars, H., Lückerath, J., Held,A., Lampert, A., Bange, J., Hermann, M., and Wehner, B.: Air-borne observations of newly formed boundary layer aerosol par-ticles under cloudy conditions, Atmos. Chem. Phys., 18, 8249–8264, https://doi.org/10.5194/acp-18-8249-2018, 2018.
Arnott, W. P., Moosmüller, H., Sheridan, P. J., Ogren, J. A., Raspet,R., Slaton, W. V., Hand, J. L., Kreidenweis, S. M., and Col-lett Jr., J. L.: Photoacoustic and filter-based ambient aerosollight absorption measurements: Instrument comparisons and therole of relative humidity, J. Geophys. Res.-Atmos., 108, 4034,https://doi.org/10.1029/2002JD002165, 2003.
Baumgardner, D., Popovicheva, O., Allan, J., Bernardoni, V., Cao,J., Cavalli, F., Cozic, J., Diapouli, E., Eleftheriadis, K., Gen-berg, P. J., Gonzalez, C., Gysel, M., John, A., Kirchstetter, T. W.,Kuhlbusch, T. A. J., Laborde, M., Lack, D., Müller, T., Niess-ner, R., Petzold, A., Piazzalunga, A., Putaud, J. P., Schwarz,J., Sheridan, P., Subramanian, R., Swietlicki, E., Valli, G., Vec-chi, R., and Viana, M.: Soot reference materials for instru-ment calibration and intercomparisons: a workshop summarywith recommendations, Atmos. Meas. Tech., 5, 1869–1887,https://doi.org/10.5194/amt-5-1869-2012, 2012.
Bautista, A. T., Pabroa, P. C. B., Santos, F. L., Quirit, L. L.,Asis, J. L. B., Dy, M. A. K., and Martinez, J. P. G.: Inter-comparison between NIOSH, IMPROVE_A, and EUSAAR_2protocols: Finding an optimal thermal–optical protocol forPhilippines OC/EC samples, Atmos. Pollut. Res., 6, 334–342,https://doi.org/10.5094/APR.2015.037, 2015.
Birch, M., Dahmann, D., and Fricke, H.-H.: Comparison oftwo carbon analysis methods for monitoring diesel par-ticulate levels in mines, J. Environ. Monit., 1, 541–544,https://doi.org/10.1039/A905204F, 1999.
Atmos. Meas. Tech., 14, 1379–1403, 2021 https://doi.org/10.5194/amt-14-1379-2021
R. E. Pileci et al.: Comparison of co-located rBC and EC mass concentration measurements 1399
Birch, M. E. and Cary, R. A.: Elemental carbon-basedmethod for monitoring occupational exposures to partic-ulate diesel exhaust, Aerosol Sci. Technol., 25, 221–241,https://doi.org/10.1080/02786829608965393, 1996.
Bond, T. C.: Spectral dependence of visible light ab-sorption by carbonaceous particles emitted from coalcombustion, Geophys. Res. Lett., 28, 4075–4078,https://doi.org/10.1029/2001GL013652, 2001.
Bond, T. C. and Bergström, R. W.: Light absorption by carbona-ceous particles: An investigative review, Aerosol Sci. Technol.,40, 27–67, https://doi.org/10.1080/02786820500421521, 2006.
Bond, T. C., Doherty, S. J., Fahey, D. W., Forster, P. M., Berntsen,T., DeAngelo, B. J., Flanner, M. G., Ghan, S., Kärcher, B., Koch,D., Kinne, S., Kondo, Y., Quinn, P. K., Sarofim, M. C., Schultz,M. G., Schulz, M., Venkataraman, C., Zhang, H., Zhang, S.,Bellouin, N., Guttikunda, S. K., Hopke, P. K., Jacobson, M.Z., Kaiser, J. W., Klimont, Z., Lohmann, U., Schwarz, J. P.,Shindell, D., Storelvmo, T., Warren, S. G., and Zender, C. S.:Bounding the role of black carbon in the climate system: A sci-entific assessment, J. Geophys. Res.-Atmos., 118, 5380–5552,https://doi.org/10.1002/jgrd.50171, 2013.
Bucci, S., Cristofanelli, P., Decesari, S., Marinoni, A., Sandrini,S., Größ, J., Wiedensohler, A., Di Marco, C. F., Nemitz,E., Cairo, F., Di Liberto, L., and Fierli, F.: Vertical distribu-tion of aerosol optical properties in the Po Valley during the2012 summer campaigns, Atmos. Chem. Phys., 18, 5371–5389,https://doi.org/10.5194/acp-18-5371-2018, 2018.
Burtscher, H., Baltensperger, U., Bukowiecki, N., Cohn, P., Hüglin,C., Mohr, M., Matter, U., Nyeki, S., Schmatloch, V., Streit,N., and Weingartner, E.: Separation of volatile and non-volatile aerosol fractions by thermodesorption: instrumentaldevelopment and applications, J. Aerosol Sci., 32, 427–442,https://doi.org/10.1016/S0021-8502(00)00089-6, 2001.
Cappa, C. D., Zhang, X., Russell, L. M., Collier, S., Lee, A.K. Y., Chen, C.-L., Betha, R., Chen, S., Liu, J., Price, D. J.,Sanchez, K. J., McMeeking, G. R., Williams, L. R., Onasch, T.B., Worsnop, D. R., Abbatt, J., and Zhang, Q.: Light absorp-tion by ambient black and brown carbon and its dependenceon black carbon coating state for two California, USA, cities inwinter and summer, J. Geophys. Res.-Atmos., 124, 1550–1577,https://doi.org/10.1029/2018JD029501, 2019.
Cavalli, F., Viana, M., Yttri, K. E., Genberg, J., and Putaud, J.-P.:Toward a standardised thermal-optical protocol for measuring at-mospheric organic and elemental carbon: the EUSAAR protocol,Atmos. Meas. Tech., 3, 79–89, https://doi.org/10.5194/amt-3-79-2010, 2010.
Chan, T. W., Huang, L., Leaitch, W. R., Sharma, S., Brook, J. R.,Slowik, J. G., Abbatt, J. P. D., Brickell, P. C., Liggio, J., Li, S.-M., and Moosmüller, H.: Observations of OM/OC and specificattenuation coefficients (SAC) in ambient fine PM at a rural sitein central Ontario, Canada, Atmos. Chem. Phys., 10, 2393–2411,https://doi.org/10.5194/acp-10-2393-2010, 2010.
Chen, L.-W. A., Chow, J. C., Wang, X. L., Robles, J. A., Sumlin, B.J., Lowenthal, D. H., Zimmermann, R., and Watson, J. G.: Multi-wavelength optical measurement to enhance thermal/opticalanalysis for carbonaceous aerosol, Atmos. Meas. Tech., 8, 451–461, https://doi.org/10.5194/amt-8-451-2015, 2015.
Cheng, Y., He, K.-B., Duan, F.-K., Du, Z.-Y., Zheng, M., andMa, Y.-L.: Ambient organic carbon to elemental carbon ra-
tios: Influence of the thermal-optical temperature protocoland implications, Sci. Total Environ., 468–469, 1103–1111,https://doi.org/10.1016/j.scitotenv.2013.08.084, 2013.
Cheung, H. H. Y., Tan, H., Xu, H., Li, F., Wu, C., Yu, J. Z.,and Chan, C. K.: Measurements of non-volatile aerosols witha VTDMA and their correlations with carbonaceous aerosolsin Guangzhou, China, Atmos. Chem. Phys., 16, 8431–8446,https://doi.org/10.5194/acp-16-8431-2016, 2016.
Chiappini, L., Verlhac, S., Aujay, R., Maenhaut, W., Putaud, J. P.,Sciare, J., Jaffrezo, J. L., Liousse, C., Galy-Lacaux, C., Alleman,L. Y., Panteliadis, P., Leoz, E., and Favez, O.: Clues for a stan-dardised thermal-optical protocol for the assessment of organicand elemental carbon within ambient air particulate matter, At-mos. Meas. Tech., 7, 1649–1661, https://doi.org/10.5194/amt-7-1649-2014, 2014.
Chow, J. C., Watson, J. G., Pritchett, L. C., Pierson, W. R., Fra-zier, C. A., and Purcell, R. G.: The dri thermal/optical reflectancecarbon analysis system: description, evaluation and applicationsin U.S. Air quality studies, Atmos. Environ., 27, 1185–1201,https://doi.org/10.1016/0960-1686(93)90245-T, 1993.
Chow, J. C., Watson, J. G., Crow, D., Lowenthal, D. H.,and Merrifield, T.: Comparison of IMPROVE and NIOSHcarbon measurements, Aerosol Sci. Technol., 34, 23–34,https://doi.org/10.1080/02786820119073, 2001.
Chow, J. C., Watson, J. G., Chen, L.-W. A., Arnott, W. P., Moos-müller, H., and Fung, K.: Equivalence of elemental carbonby thermal/optical reflectance and transmittance with differenttemperature protocols, Environ. Sci. Technol., 38, 4414–4422,https://doi.org/10.1021/es034936u, 2004.
Chow, J. C., Watson, J. G., Chen, L.-W. A., Chang, M. C. O.,Robinson, N. F., Trimble, D., and Kohl, S.: The IMPROVE_Atemperature protocol for thermal/optical carbon analysis: main-taining consistency with a long-term database, J. Air WasteManag. Assoc., 57, 1014–1023, https://doi.org/10.3155/1047-3289.57.9.1014, 2007.
Clarke, A. D., Shinozuka, Y., Kapustin, V. N., Howell, S., Hue-bert, B., Doherty, S., Anderson, T., Covert, D., Anderson, J.,Hua, X., Moore II, K. G., McNaughton, C., Carmichael, G.,and Weber, R.: Size distributions and mixtures of dust andblack carbon aerosol in Asian outflow: Physiochemistry and op-tical properties, J. Geophys. Res.-Atmos., 109, S1217–S1218,https://doi.org/10.1029/2003JD004378, 2004.
Corbin, J. C. and Gysel-Beer, M.: Detection of tar brown carbonwith a single particle soot photometer (SP2), Atmos. Chem.Phys., 19, 15673–15690, https://doi.org/10.5194/acp-19-15673-2019, 2019.
Corbin, J. C., Sierau, B., Gysel, M., Laborde, M., Keller, A.,Kim, J., Petzold, A., Onasch, T. B., Lohmann, U., and Men-sah, A. A.: Mass spectrometry of refractory black carbon par-ticles from six sources: carbon-cluster and oxygenated ions, At-mos. Chem. Phys., 14, 2591–2603, https://doi.org/10.5194/acp-14-2591-2014, 2014.
Corbin, J. C., Lohmann, U., Sierau, B., Keller, A., Burtscher, H.,and Mensah, A. A.: Black carbon surface oxidation and or-ganic composition of beech-wood soot aerosols, Atmos. Chem.Phys., 15, 11885–11907, https://doi.org/10.5194/acp-15-11885-2015, 2015.
Corbin, J. C., Pieber, S. M., Czech, H., Zanatta, M., Jakobi,G., Massabò, D., Orasche, J., El Haddad, I., Mensah, A.
https://doi.org/10.5194/amt-14-1379-2021 Atmos. Meas. Tech., 14, 1379–1403, 2021
1400 R. E. Pileci et al.: Comparison of co-located rBC and EC mass concentration measurements
A., Stengel, B., Drinovec, L., Mocnik, G., Zimmermann, R.,Prévôt, A. S. H., and Gysel, M.: Brown and black car-bon emitted by a marine engine operated on heavy fuel oiland distillate fuels: optical properties, size distributions, andemission factors, J. Geophys. Res-Atmos., 123, 6175–6195,https://doi.org/10.1029/2017JD027818, 2018.
Corbin, J. C., Czech, H., Massabò, D., de Mongeot, F. B., Jakobi,G., Liu, F., Lobo, P., Mennucci, C., Mensah, A. A., Orasche,J., Pieber, S. M., Prévôt, A. S. H., Stengel, B., Tay, L.-L.,Zanatta, M., Zimmermann, R., El Haddad, I., and Gysel, M.:Infrared-absorbing carbonaceous tar can dominate light absorp-tion by marine-engine exhaust, NPJ Clim. Atmos. Sci., 2, 12,https://doi.org/10.1038/s41612-019-0069-5, 2019.
Corbin, J. C., Moallemi, A., Liu, F., Gagné, S., Olfert, J.S., Smallwood, G. J., and Lobo, P.: Closure between par-ticulate matter concentrations measured ex situ by thermal–optical analysis and in situ by the CPMA–electrometer ref-erence mass system, Aerosol Sci. Technol., 54, 1293–1309,https://doi.org/10.1080/02786826.2020.1788710, 2020.
Drinovec, L., Mocnik, G., Zotter, P., Prévôt, A. S. H., Ruck-stuhl, C., Coz, E., Rupakheti, M., Sciare, J., Müller, T., Wieden-sohler, A., and Hansen, A. D. A.: The ”dual-spot” Aethalome-ter: an improved measurement of aerosol black carbon with real-time loading compensation, Atmos. Meas. Tech., 8, 1965–1979,https://doi.org/10.5194/amt-8-1965-2015, 2015.
Durdina, L., Brem, B. T., Setyan, A., Siegerist, F., Rindlis-bacher, T., and Wang, J.: Assessment of particle pollu-tion from jetliners: From smoke visibility to nanopar-ticle counting, Environ. Sci. Technol., 51, 3534–3541,https://doi.org/10.1021/acs.est.6b05801, 2017.
Durdina, L., Brem, B. T., Schönenberger, D., Siegerist, F., Anet, J.G., and Rindlisbacher, T.: Nonvolatile particulate matter emis-sions of a business jet measured at ground level and estimatedfor cruising altitudes, Environ. Sci. Technol., 53, 12865–12872,https://doi.org/10.1021/acs.est.9b02513, 2019.
European Committee for Standardization: Ambient air –Measurement of elemental carbon (EC) and organic car-bon (OC) collected on filters: EN 16909:2017, avail-able at: https://standards.cen.eu/dyn/www/f?p=204:110:0::::FSP_PROJECT,FSP_ORG_ID:39908,6245&cs=10D493A2AD690A6AB4340BE3D316277CA (last access:18 February 2021), 2017.
Fung, K.: Particulate carbon speciation by MnO2oxidation, Aerosol Sci. Technol., 12, 122–127,https://doi.org/10.1080/02786829008959332, 1990.
Giannoni, M., Calzolai, G., Chiari, M., Cincinelli, A., Lucarelli,F., Martellini, T., and Nava, S.: A comparison between thermal-optical transmittance elemental carbon measured by differentprotocols in PM2.5 samples, Sci. Total Environ., 571, 195–205,https://doi.org/10.1016/j.scitotenv.2016.07.128, 2016.
Grahame, T. J., Klemm, R., and Schlesinger, R. B.: Public healthand components of particulate matter: The changing assessmentof black carbon, J. Air Waste Manag. Assoc., 64, 620–660,https://doi.org/10.1080/10962247.2014.912692, 2014.
Gysel, M., Laborde, M., Olfert, J. S., Subramanian, R., and Gröhn,A. J.: Effective density of Aquadag and fullerene soot black car-bon reference materials used for SP2 calibration, Atmos. Meas.Tech., 4, 2851–2858, https://doi.org/10.5194/amt-4-2851-2011,2011.
Gysel, M., Laborde, M., Mensah, A. A., Corbin, J. C., Keller,A., Kim, J., Petzold, A., and Sierau, B.: Technical Note:The single particle soot photometer fails to reliably detectPALAS soot nanoparticles, Atmos. Meas. Tech., 5, 3099–3107,https://doi.org/10.5194/amt-5-3099-2012, 2012.
Haeffelin, M., Barthès, L., Bock, O., Boitel, C., Bony, S., Bouniol,D., Chepfer, H., Chiriaco, M., Cuesta, J., Delanoë, J., Drobinski,P., Dufresne, J.-L., Flamant, C., Grall, M., Hodzic, A., Hourdin,F., Lapouge, F., Lemaître, Y., Mathieu, A., Morille, Y., Naud, C.,Noël, V., O’Hirok, W., Pelon, J., Pietras, C., Protat, A., Romand,B., Scialom, G., and Vautard, R.: SIRTA, a ground-based atmo-spheric observatory for cloud and aerosol research, Ann. Geo-phys., 23, 253–275, https://doi.org/10.5194/angeo-23-253-2005,2005.
Han, Y. M., Chen, L.-W. A., Huang, R.-J., Chow, J. C., Watson,J. G., Ni, H. Y., Liu, S. X., Fung, K. K., Shen, Z. X., Wei, C.,Wang, Q. Y., Tian, J., Zhao, Z. Z., Prévôt, A. S. H., and Cao, J. J.:Carbonaceous aerosols in megacity Xi’an, China: Implicationsof thermal/optical protocols comparison, Atmos. Environ., 132,58–68, https://doi.org/10.1016/j.atmosenv.2016.02.023, 2016.
Hansen, A. D. A., Rosen, H., and Novakov, T.: The aethalometer– An instrument for the real-time measurement of optical ab-sorption by aerosol particles, Sci. Total Environ., 36, 191–196,https://doi.org/10.1016/0048-9697(84)90265-1, 1984.
Hitzenberger, R., Petzold, A., Bauer, H., Ctyroky, P., Pouresmaeil,P., Laskus, L., and Puxbaum, H.: Intercomparison of thermal andoptical measurement methods for elemental carbon and blackcarbon at an urban location, Environ. Sci. Technol., 40, 6377–6383, https://doi.org/10.1021/es051228v, 2006.
Hodnebrog, Ø., Myhre, G., and Samset, B. H.: How shorter blackcarbon lifetime alters its climate effect, Nat. Commun., 5, 5065,https://doi.org/10.1038/ncomms6065, 2014.
Huang, L., Brook, J. R., Zhang, W., Li, S. M., Graham, L., Ernst, D.,Chivulescu, A., and Lu, G.: Stable isotope measurements of car-bon fractions (OC/EC) in airborne particulate: A new dimensionfor source characterization and apportionment, Atmos. Environ.,40, 2690–2705, https://doi.org/10.1016/j.atmosenv.2005.11.062,2006.
Huntzicker, J. J., Johnson, R. L., Shah, J. J., and Cary, R. A.: Anal-ysis of organic and elemental carbon in ambient aerosols bya thermal-optical method, in: Particulate Carbon: AtmosphericLife Cycle, edited: by Wolff, G. T. and Klimisch, R. L., SpringerUS, Boston, MA, 79–88, 1982.
Karanasiou, A., Diapouli, E., Cavalli, F., Eleftheriadis, K.,Viana, M., Alastuey, A., Querol, X., and Reche, C.: Onthe quantification of atmospheric carbonate carbon by ther-mal/optical analysis protocols, Atmos. Meas. Tech., 4, 2409–2419, https://doi.org/10.5194/amt-4-2409-2011, 2011.
Karanasiou, A., Minguillón, M. C., Viana, M., Alastuey, A., Putaud,J.-P., Maenhaut, W., Panteliadis, P., Mocnik, G., Favez, O., andKuhlbusch, T. A. J.: Thermal-optical analysis for the measure-ment of elemental carbon (EC) and organic carbon (OC) in ambi-ent air a literature review, Atmos. Meas. Tech. Discuss., 8, 9649–9712, https://doi.org/10.5194/amtd-8-9649-2015, 2015.
Khan, B., Hays, M. D., Geron, C., and Jetter, J.: Differences in theOC/EC ratios that characterize ambient and source aerosols dueto thermal-optical analysis, Aerosol Sci. Technol., 46, 127–137,https://doi.org/10.1080/02786826.2011.609194, 2012.
Atmos. Meas. Tech., 14, 1379–1403, 2021 https://doi.org/10.5194/amt-14-1379-2021
R. E. Pileci et al.: Comparison of co-located rBC and EC mass concentration measurements 1401
Kirchstetter, T. W., Novakov, T., and Hobbs P. V.: Evidence that thespectral dependence of light absorption by aerosols is affectedby organic carbon, J. Geophys. Res.-Atmos., 109, D21208,https://doi.org/10.1029/2004JD004999, 2004.
Kupiszewski, P., Zanatta, M., Mertes, S., Vochezer, P., Lloyd,G., Schneider, J., Schenk, L., Schnaiter, M., Baltensperger,U., Weingartner, E. and Gysel, M.: Ice residual proper-ties in mixed-phase clouds at the high-alpine Jungfrau-joch site, J. Geophys. Res.-Atmos., 121, 12343–12362,https://doi.org/10.1002/2016JD024894, 2016.
Laborde, M., Mertes, P., Zieger, P., Dommen, J., Baltensperger, U.,and Gysel, M.: Sensitivity of the Single Particle Soot Photometerto different black carbon types, Atmos. Meas. Tech., 5, 1031–1043, https://doi.org/10.5194/amt-5-1031-2012, 2012a.
Laborde, M., Schnaiter, M., Linke, C., Saathoff, H., Naumann, K.-H., Möhler, O., Berlenz, S., Wagner, U., Taylor, J. W., Liu, D.,Flynn, M., Allan, J. D., Coe, H., Heimerl, K., Dahlkötter, F.,Weinzierl, B., Wollny, A. G., Zanatta, M., Cozic, J., Laj, P.,Hitzenberger, R., Schwarz, J. P., and Gysel, M.: Single ParticleSoot Photometer intercomparison at the AIDA chamber, Atmos.Meas. Tech., 5, 3077–3097, https://doi.org/10.5194/amt-5-3077-2012, 2012b.
Laborde, M., Crippa, M., Tritscher, T., Jurányi, Z., Decarlo, P. F.,Temime-Roussel, B., Marchand, N., Eckhardt, S., Stohl, A., Bal-tensperger, U., Prévôt, A. S. H., Weingartner, E., and Gysel,M.: Black carbon physical properties and mixing state in theEuropean megacity Paris, Atmos. Chem. Phys., 13, 5831–5856,https://doi.org/10.5194/acp-13-5831-2013, 2013.
Liggio, J., Gordon, M., Smallwood, G., Li, S.-M., Stroud, C., Stae-bler, R., Lu, G., Lee, P., Taylor, B., and Brook, J. R.: Are emis-sions of black carbon from gasoline vehicles underestimated? In-sights from near and on-road measurements, Environ. Sci. Tech-nol., 46, 4819–4828, https://doi.org/10.1021/es2033845, 2012.
Liu, D., Allan, J. D., Young, D. E., Coe, H., Beddows, D., Fleming,Z. L., Flynn, M. J., Gallagher, M. W., Harrison, R. M., Lee, J.,Prevot, A. S. H., Taylor, J. W., Yin, J., Williams, P. I., and Zot-ter, P.: Size distribution, mixing state and source apportionmentof black carbon aerosol in London during wintertime, Atmos.Chem. Phys., 14, 10061–10084, https://doi.org/10.5194/acp-14-10061-2014, 2014.
Lobo, P., Durdina, L., Smallwood, G. J., Rindlisbacher, T., Siegerist,F., Black, E. A., Yu, Z., Mensah, A. A., Hagen, D. E., Miake-Lye,R. C., Thomson, K. A., Brem, B. T., Corbin, J. C., Abegglen, M.,Sierau, B., Whitefield, P. D., and Wang, J.: Measurement of air-craft engine non-volatile PM emissions: Results of the aviation-particle regulatory instrumentation demonstration experiment(A-PRIDE) 4 campaign, Aerosol Sci. Technol., 49, 472–484,https://doi.org/10.1080/02786826.2015.1047012, 2015.
Massabò, D., Altomari, A., Vernocchi, V., and Prati, P.: Two-wavelength thermal–optical determination of light-absorbingcarbon in atmospheric aerosols, Atmos. Meas. Tech., 12, 3173–3182, https://doi.org/10.5194/amt-12-3173-2019, 2019.
Matsui, H., Hamilton, D. S., and Mahowald, N. M.: Black car-bon radiative effects highly sensitive to emitted particle sizewhen resolving mixing-state diversity, Nat. Commun., 9, 3446,https://doi.org/10.1038/s41467-018-05635-1, 2018.
Medalia, A. I. and Heckman, F. A.: Morphology of aggregates—II.Size and shape factors of carbon black aggregates from electron
microscopy, Carbon, 7, 567–582, https://doi.org/10.1016/0008-6223(69)90029-3, 1969.
Michelsen, H. A., Schulz, C., Smallwood, G. J., and Will, S.: Laser-induced incandescence: Particulate diagnostics for combustion,atmospheric, and industrial applications, Prog. Energy Combust.Sci., 51, 2–48, https://doi.org/10.1016/j.pecs.2015.07.001, 2015.
Miyakawa, T., Kanaya, Y., Komazaki, Y., Taketani, F., Pan, X., Ir-win, M., and Symonds, J.: Intercomparison between a single par-ticle soot photometer and evolved gas analysis in an industrialarea in Japan: Implications for the consistency of soot aerosolmass concentration measurements, Atmos. Environ., 127, 14–21,https://doi.org/10.1016/j.atmosenv.2015.12.018, 2016.
Momenimovahed, A. and Olfert, J. S.: Effective densityand volatility of particles emitted from gasoline directinjection vehicles and implications for particle massmeasurement, Aerosol Sci. Technol., 49, 1051–1062,https://doi.org/10.1080/02786826.2015.1094181, 2015.
Moosmüller, H., Chakrabarty, R. K., and Arnott, W. P.: Aerosol lightabsorption and its measurement: A review, J. Quant. Spectrosc.Ra., 110, 844–878, https://doi.org/10.1016/j.jqsrt.2009.02.035,2009.
Moteki, N. and Kondo, Y.: Effects of mixing stateon black carbon measurements by laser-induced in-candescence, Aerosol Sci. Technol., 41, 398–417,https://doi.org/10.1080/02786820701199728, 2007.
Moteki, N. and Kondo, Y.: Dependence of laser-induced incandes-cence on physical properties of black carbon aerosols: Measure-ments and theoretical interpretation, Aerosol Sci. Technol., 44,663–675, https://doi.org/10.1080/02786826.2010.484450, 2010.
Moteki, N., Adachi, K., Ohata, S., Yoshida, A., Harigaya,T., Koike, M., and Kondo, Y.: Anthropogenic iron oxideaerosols enhance atmospheric heating, Nat. Commun., 8, 15329,https://doi.org/10.1038/ncomms15329, 2017.
Petit, J.-E., Favez, O., Sciare, J., Crenn, V., Sarda-Estève, R., Bon-naire, N., Mocnik, G., Dupont, J.-C., Haeffelin, M., and Leoz-Garziandia, E.: Two years of near real-time chemical compo-sition of submicron aerosols in the region of Paris using anAerosol Chemical Speciation Monitor (ACSM) and a multi-wavelength Aethalometer, Atmos. Chem. Phys., 15, 2985–3005,https://doi.org/10.5194/acp-15-2985-2015, 2015.
Petzold, A., Schloesser, H., Sheridan, P. J., Arnott, W. P., Ogren,J. A., and Virkkula, A.: Evaluation of multiangle absorptionphotometry for measuring aerosol light absorption, Aerosol Sci.Technol., 39, 40–51, https://doi.org/10.1080/027868290901945,2005.
Petzold, A., Ogren, J. A., Fiebig, M., Laj, P., Li, S.-M., Bal-tensperger, U., Holzer-Popp, T., Kinne, S., Pappalardo, G., Sug-imoto, N., Wehrli, C., Wiedensohler, A., and Zhang, X.-Y.: Rec-ommendations for reporting “black carbon” measurements, At-mos. Chem. Phys., 13, 8365–8379, https://doi.org/10.5194/acp-13-8365-2013, 2013.
Piazzalunga, A., Bernardoni, V., Fermo, P., Valli, G., and Vec-chi, R.: Technical Note: On the effect of water-soluble com-pounds removal on EC quantification by TOT analysis in ur-ban aerosol samples, Atmos. Chem. Phys., 11, 10193–10203,https://doi.org/10.5194/acp-11-10193-2011, 2011.
Pileci, R. E., Modini, R. L., Berò, M., Yuan, J., Corbin, J.C., Marinoni, A., Henzing, B. J., Moerman, M. M., Putaud,J. P., Spindler, G., Wehner, B., Müller, T., Tuch, T., Tren-
https://doi.org/10.5194/amt-14-1379-2021 Atmos. Meas. Tech., 14, 1379–1403, 2021
1402 R. E. Pileci et al.: Comparison of co-located rBC and EC mass concentration measurements
tini, A., Zanatta, M., Baltensperger, U., and Gysel-Beer, M.:Data archive for the journal article: “Comparison of co-located rBC and EC mass concentration measurements duringfield campaigns at several European sites”, Data set, Zenodo,https://doi.org/10.5281/zenodo.4445557, 2021.
Putaud, J.-P., Van Dingenen, R., Alastuey, A., Bauer, H., Birmili,W., Cyrys, J., Flentje, H., Fuzzi, S., Gehrig, R., Hansson, H.C., Harrison, R. M., Herrmann, H., Hitzenberger, R., Hüglin, C.,Jones, A. M., Kasper-Giebl, A., Kiss, G., Kousa, A., Kuhlbusch,T. A. J., Löschau, G., Maenhaut, W., Molnar, A., Moreno, T.,Pekkanen, J., Perrino, C., Pitz, M., Puxbaum, H., Querol, X.,Rodriguez, S., Salma, I., Schwarz, J., Smolik, J., Schneider, J.,Spindler, G., ten Brink, H., Tursic, J., Viana, M., Wiedensohler,A., and Raes, F.: A European aerosol phenomenology – 3: Phys-ical and chemical characteristics of particulate matter from 60rural, urban, and kerbside sites across Europe, Atmos. Environ.,44, 1308–1320, https://doi.org/10.1016/j.atmosenv.2009.12.011,2010.
Querol, X., Moreno, T., Karanasiou, A., Reche, C., Alastuey, A.,Viana, M., Font, O., Gil, J., de Miguel, E., and Capdevila, M.:Variability of levels and composition of PM10 and PM2.5 in theBarcelona metro system, Atmos. Chem. Phys., 12, 5055–5076,https://doi.org/10.5194/acp-12-5055-2012, 2012.
Ram, K., Sarin, M. M., and Tripathi, S. N.: Inter-comparisonof thermal and optical methods for determination of atmo-spheric black carbon and attenuation coefficient from an ur-ban location in northern India, Atmos. Res., 97, 335–342,https://doi.org/10.1016/j.atmosres.2010.04.006, 2010.
Reddington, C. L., McMeeking, G., Mann, G. W., Coe, H., Fron-toso, M. G., Liu, D., Flynn, M., Spracklen, D. V., and Carslaw,K. S.: The mass and number size distributions of black car-bon aerosol over Europe, Atmos. Chem. Phys., 13, 4917–4939,https://doi.org/10.5194/acp-13-4917-2013, 2013.
Reisinger, P., Wonaschütz, A., Hitzenberger, R., Petzold, A., Bauer,H., Jankowski, N., Puxbaum, H., Chi, X., and Maenhaut, W.: In-tercomparison of measurement techniques for black or elementalcarbon under urban background conditions in wintertime: Influ-ence of biomass combustion, Environ. Sci. Technol., 42, 884–889, https://doi.org/10.1021/es0715041, 2008.
Ricciardelli, I., Bacco, D., Rinaldi, M., Bonafè, G., Scotto, F.,Trentini, A., Bertacci, G., Ugolini, P., Zigola, C., Rovere,F., Maccone, C., Pironi, C., and Poluzzi, V.: A three-yearinvestigation of daily PM2.5 main chemical components infour sites: The routine measurement program of the Super-sito Project (Po Valley, Italy), Atmos. Environ., 152, 418–430,https://doi.org/10.1016/j.atmosenv.2016.12.052, 2017.
Rosen, H., Hansen, A. D. A., Gundel, L., and Novakov,T.: Identification of the optically absorbing compo-nent in urban aerosols, Appl. Opt., 17, 3859–3861,https://doi.org/10.1364/AO.17.003859, 1978.
Saleh, R., Cheng, Z., and Atwi, K.: The Brown–Black Continuum of Light-Absorbing CombustionAerosols, Environ. Sci. Technol. Lett., 5, 508–513,https://doi.org/10.1021/acs.estlett.8b00305, 2018.
Samset, B. H., Stjern, C. W., Andrews, E., Kahn, R. A., Myhre, G.,Schulz, M., and Schuster, G. L.: Aerosol absorption: Progress to-wards global and regional constraints, Curr. Clim. Change Rep.,4, 65–83, https://doi.org/10.1007/s40641-018-0091-4, 2018.
Schraml, S., Heimgärtner, C., Will, S., Leipertz, A., and Hemm, A.:Application of a New Soot Sensor for Exhaust Emission ControlBased on Time Resolved Laser Induced Incandescence (TIRE-LII), SAE Transactions, 109, 2629–2638, 2000.
Schwarz, J. P.: Extrapolation of single particle soot photometerincandescent signal data, Aerosol Sci. Technol., 53, 911–920,https://doi.org/10.1080/02786826.2019.1610154, 2019.
Schwarz, J. P., Gao, R. S., Fahey, D. W., Thomson, D. S., Watts,L. A., Wilson, J. C., Reeves, J. M., Darbeheshti, M., Baum-gardner, D. G., Kok, G. L., Chung, S. H., Schulz, M., Hen-dricks, J., Lauer, A., Kärcher, B., Slowik, J. G., Rosenlof,K. H., Thompson, T. L., Langford, A. O., Loewenstein, M.and Aikin, K. C.: Single-particle measurements of midlatitudeblack carbon and light-scattering aerosols from the boundarylayer to the lower stratosphere, J. Geophys. Res.-Atmos., 111,https://doi.org/10.1029/2006JD007076, 2006.
Schwarz, J. P., Spackman, J. R., Gao, R. S., Perring, A. E.,Cross, E., Onasch, T. B., Ahern, A., Wrobel, W., Davi-dovits, P., Olfert, J., Dubey, M. K., Mazzoleni, C., and Fa-hey, D. W.: The detection efficiency of the single parti-cle soot photometer, Aerosol Sci. Technol., 44, 612–628,https://doi.org/10.1080/02786826.2010.481298, 2010.
Sedlacek, A. J., Onasch, T. B., Nichman, L., Lewis, E. R.,Davidovits, P., Freedman, A., and Williams, L.: Forma-tion of refractory black carbon by SP2-induced charringof organic aerosol, Aerosol Sci. Technol., 52, 1521–7388,https://doi.org/10.1080/02786826.2018.1531107, 2018.
Sharma, S., Leaitch, W. R., Huang, L., Veber, D., Kolonjari,F., Zhang, W., Hanna, S. J., Bertram, A. K., and Ogren, J.A.: An evaluation of three methods for measuring black car-bon in Alert, Canada, Atmos. Chem. Phys., 17, 15225–15243,https://doi.org/10.5194/acp-17-15225-2017, 2017.
Slowik, J. G., Cross, E. S., Han, J.-H., Davidovits, P., Onasch, T. B.,Jayne, J. T., Williams, L. R., Canagaratna, M. R., Worsnop, D.R., Chakrabarty, R. K., Moosmüller, H., Arnott, W. P., Schwarz,J. P., Gao, R.-S., Fahey, D. W., Kok, G. L., and Petzold, A.:An inter-comparison of instruments measuring black carboncontent of soot particles, Aerosol Sci. Technol., 41, 295–314,https://doi.org/10.1080/02786820701197078, 2007.
Sokolik, I. N. and Toon, O. B.: Incorporation of mineralogicalcomposition into models of the radiative properties of mineralaerosol from UV to IR wavelengths, J. Geophys. Res.-Atmos.,104, 9423–9444, https://doi.org/10.1029/1998JD200048, 1999.
Spindler, G., Brüggemann, E., Gnauk, T., Grüner, A., Müller,K., and Herrmann, H.: A four-year size-segregated character-ization study of particles PM10, PM2.5 and PM1 dependingon air mass origin at Melpitz, Atmos. Environ., 44, 164–173,https://doi.org/10.1016/j.atmosenv.2009.10.015, 2010.
Spindler, G., Gnauk, T., Gruener, A., Iinuma, Y., Mueller, K.,Scheinhardt, S., and Herrmann, H.: Size-segregated character-ization of PM10 at the EMEP site Melpitz (Germany) using afive-stage impactor: A six year study, J. Atmos. Chem., 69, 127–157, https://doi.org/10.1007/s10874-012-9233-6, 2012.
Spindler, G., Grüner, A., Mueller, K., Schlimper, S., and Her-rmann, H.: Long-term size-segregated particle (PM10, PM2.5,PM1) characterization study at Melpitz - Influence of air mass in-flow, weather conditions and season, J. Atmos. Chem., 70, 165–195, https://doi.org/10.1007/s10874-013-9263-8, 2013.
Atmos. Meas. Tech., 14, 1379–1403, 2021 https://doi.org/10.5194/amt-14-1379-2021
R. E. Pileci et al.: Comparison of co-located rBC and EC mass concentration measurements 1403
Stephens, M., Turner, N., and Sandberg, J.: Particle identification bylaser-induced incandescence in a solid-state laser cavity, Appl.Opt., 42, 3726, https://doi.org/10.1364/AO.42.003726, 2003.
Subramanian, R., Khlystov, A. Y., and Robinson, A. L.: Effect ofpeak inert-mode temperature on elemental carbon measured us-ing thermal-optical analysis, Aerosol Sci. Technol., 40, 763–780,https://doi.org/10.1080/02786820600714403, 2006.
Tirpitz, J.-L., Frieß, U., Hendrick, F., Alberti, C., Allaart, M., Apit-uley, A., Bais, A., Beirle, S., Berkhout, S., Bognar, K., Bösch, T.,Bruchkouski, I., Cede, A., Chan, K. L., den Hoed, M., Donner, S.,Drosoglou, T., Fayt, C., Friedrich, M. M., Frumau, A., Gast, L.,Gielen, C., Gomez-Martín, L., Hao, N., Hensen, A., Henzing, B.,Hermans, C., Jin, J., Kreher, K., Kuhn, J., Lampel, J., Li, A., Liu,C., Liu, H., Ma, J., Merlaud, A., Peters, E., Pinardi, G., Piters,A., Platt, U., Puentedura, O., Richter, A., Schmitt, S., Spinei, E.,Stein Zweers, D., Strong, K., Swart, D., Tack, F., Tiefengraber,M., van der Hoff, R., van Roozendael, M., Vlemmix, T., Vonk, J.,Wagner, T., Wang, Y., Wang, Z., Wenig, M., Wiegner, M., Wit-trock, F., Xie, P., Xing, C., Xu, J., Yela, M., Zhang, C., and Zhao,X.: Intercomparison of MAX-DOAS vertical profile retrieval al-gorithms: studies on field data from the CINDI-2 campaign, At-mos. Meas. Tech., 14, 1–35, https://doi.org/10.5194/amt-14-1-2021, 2021.
van Pinxteren, D., Mothes, F., Spindler, G., Fomba, K.W., and Herrmann, H.: Trans-boundary PM10: Quan-tifying impact and sources during winter 2016/17 ineastern Germany, Atmos. Environ., 200, 119–130,https://doi.org/10.1016/j.atmosenv.2018.11.061, 2019.
Vecchi, R., Bernardoni, V., Fermo, P., Lucarelli, F., Mazzei, F.,Nava, S., Prati, P., Piazzalunga, A., and Valli, G.: 4-hours resolu-tion data to study PM10 in a “hot spot” area in Europe, Environ.Monit. Assess., 154, 283–300, https://doi.org/10.1007/s10661-008-0396-1, 2009.
Virkkula, A., Mäkelä, T., Hillamo, R., Yli-Tuomi, T., Hirsikko,A., Hämeri, K., and Koponen, I. K.: A simple procedure forcorrecting loading effects of aethalometer data, J. Air WasteManag. Assoc., 57, 1214–1222, https://doi.org/10.3155/1047-3289.57.10.1214, 2007.
Wang, Y., Chung, A., and Paulson, S. E.: The effect of metal salts onquantification of elemental and organic carbon in diesel exhaustparticles using thermal-optical evolved gas analysis, Atmos.Chem. Phys., 10, 11447–11457, https://doi.org/10.5194/acp-10-11447-2010, 2010.
Watson, J. G., Chow, J. C., and Chen, L.-W. A.: Summaryof organic and elemental carbon/black carbon analysis meth-ods and intercomparisons, Aerosol Air Qual. Res., 5, 65–102,https://doi.org/10.4209/aaqr.2005.06.0006, 2005.
Wehner, B., Philippin, S., Wiedensohler, A., Scheer, V., and Vogt,R.: Variability of non-volatile fractions of atmospheric aerosolparticles with traffic influence, Atmos. Environ., 38, 6081–6090,https://doi.org/10.1016/j.atmosenv.2004.08.015, 2004.
Weingartner, E., Saathoff, H., Schnaiter, M., Streit, N., Bit-nar, B., and Baltensperger, U.: Absorption of light bysoot particles: determination of the absorption coefficient bymeans of aethalometers, J. Aerosol Sci., 34, 1445–1463,https://doi.org/10.1016/S0021-8502(03)00359-8, 2003.
Wiedensohler, A., Birmili, W., Nowak, A., Sonntag, A., Weinhold,K., Merkel, M., Wehner, B., Tuch, T., Pfeifer, S., Fiebig, M.,Fjäraa, A. M., Asmi, E., Sellegri, K., Depuy, R., Venzac, H., Vil-
lani, P., Laj, P., Aalto, P., Ogren, J. A., Swietlicki, E., Williams,P., Roldin, P., Quincey, P., Hüglin, C., Fierz-Schmidhauser, R.,Gysel, M., Weingartner, E., Riccobono, F., Santos, S., Grün-ing, C., Faloon, K., Beddows, D., Harrison, R., Monahan, C.,Jennings, S. G., O’Dowd, C. D., Marinoni, A., Horn, H.-G.,Keck, L., Jiang, J., Scheckman, J., McMurry, P. H., Deng, Z.,Zhao, C. S., Moerman, M., Henzing, B., de Leeuw, G., Löschau,G., and Bastian, S.: Mobility particle size spectrometers: har-monization of technical standards and data structure to facili-tate high quality long-term observations of atmospheric parti-cle number size distributions, Atmos. Meas. Tech., 5, 657–685,https://doi.org/10.5194/amt-5-657-2012, 2012.
WMO: WMO-No. 1177, GAW Report No. 227, available at: https://library.wmo.int/doc_num.php?explnum_id=3073 (last access:16 February 2021), WMO/GAW Aerosol Measurement Proce-dures, Guidelines and Recommendations, World MeteorologicalOrganization, Geneva, Switzerland, 93 pp., 2nd Edn., 2016.
Yu, J. Z., Xu, J., and Yang, H.: Charring characteristics of atmo-spheric organic particulate matter in thermal analysis, Environ.Sci. Technol., 36, 754–761, https://doi.org/10.1021/es015540q,2002.
Yuan, J., Modini, R. L., Zanatta, M., Herber, A. B., Müller, T.,Wehner, B., Poulain, L., Tuch, T., Baltensperger, U., and Gysel-Beer, M.: Variability in the mass absorption cross section of blackcarbon (BC) aerosols is driven by BC internal mixing state at acentral European background site (Melpitz, Germany) in winter,Atmos. Chem. Phys., 21, 635–655, https://doi.org/10.5194/acp-21-635-2021, 2021.
Zhang, X., Kim, H., Parworth, C. L., Young, D. E., Zhang, Q., Met-calf, A. R., and Cappa, C. D.: Optical properties of wintertimeaerosols from residential wood burning in Fresno, CA: resultsfrom DISCOVER-AQ 2013, Environ. Sci. Technol., 50, 1681–1690, https://doi.org/10.1021/acs.est.5b04134, 2016.
Zhang, Y., Favez, O., Canonaco, F., Liu, D., Mocnik, G., Amodeo,T., Sciare, J., Prévôt, A. S. H., Gros, V., and Albinet, A.: Evi-dence of major secondary organic aerosol contribution to lensingeffect black carbon absorption enhancement, NPJ Clim. Atmos.Sci., 1, 47, https://doi.org/10.1038/s41612-018-0056-2, 2018.
Zhang, Y. L., Perron, N., Ciobanu, V. G., Zotter, P., Minguil-lón, M. C., Wacker, L., Prévôt, A. S. H., Baltensperger, U.,and Szidat, S.: On the isolation of OC and EC and the opti-mal strategy of radiocarbon-based source apportionment of car-bonaceous aerosols, Atmos. Chem. Phys., 12, 10841–10856,https://doi.org/10.5194/acp-12-10841-2012, 2012.
Zhu, Y., Kuhn, T., Mayo, P., and Hinds, W. C.: Comparison of day-time and nighttime concentration profiles and size distributionsof ultrafine particles near a major highway, Environ. Sci. Tech-nol., 40, 2531–2536, https://doi.org/10.1021/es0516514, 2006.
Zotter, P., Herich, H., Gysel, M., El-Haddad, I., Zhang, Y., Mocnik,G., Hüglin, C., Baltensperger, U., Szidat, S., and Prévôt, A. S.H.: Evaluation of the absorption Ångström exponents for trafficand wood burning in the Aethalometer-based source apportion-ment using radiocarbon measurements of ambient aerosol, At-mos. Chem. Phys., 17, 4229–4249, https://doi.org/10.5194/acp-17-4229-2017, 2017.
https://doi.org/10.5194/amt-14-1379-2021 Atmos. Meas. Tech., 14, 1379–1403, 2021