comparison of circadian characteristics for cytotoxic lymphocyte subsets in non-small cell lung...
TRANSCRIPT

1 23
Clinical and Experimental Medicine ISSN 1591-8890Volume 12Number 3 Clin Exp Med (2012) 12:181-194DOI 10.1007/s10238-011-0153-6
Comparison of circadian characteristics forcytotoxic lymphocyte subsets in non-smallcell lung cancer patients versus controls
Gianluigi Mazzoccoli, Robert B. Sothern,Paola Parrella, Lucia A. Muscarella, VitoMichele Fazio, Francesco Giuliani, et al.

1 23
Your article is protected by copyright and
all rights are held exclusively by Springer-
Verlag. This e-offprint is for personal use only
and shall not be self-archived in electronic
repositories. If you wish to self-archive your
work, please use the accepted author’s
version for posting to your own website or
your institution’s repository. You may further
deposit the accepted author’s version on a
funder’s repository at a funder’s request,
provided it is not made publicly available until
12 months after publication.

ORIGINAL ARTICLE
Comparison of circadian characteristics for cytotoxic lymphocytesubsets in non-small cell lung cancer patients versus controls
Gianluigi Mazzoccoli • Robert B. Sothern • Paola Parrella • Lucia A. Muscarella •
Vito Michele Fazio • Francesco Giuliani • Victoria Polyakova • Igor M. Kvetnoy
Received: 15 March 2011 / Accepted: 11 July 2011 / Published online: 11 September 2011
� Springer-Verlag 2011
Abstract Lymphocyte subsets are major cellular com-
ponents of the adaptive immune response and in most cases
show 24-h (circadian) variations in health. In order to
determine overall levels and circadian characteristics of
cytotoxic natural killer (NK) and T and B lymphocyte
subsets, blood samples were collected every 4 h for 24 h
from eleven male controls (C) without neoplastic disease
and nine men with untreated non-small cell lung cancer
(NSCLC) and analyzed for 3 hormones (melatonin,
cortisol, and interleukin 2 [IL2]) and for 11 lymphocyte
subpopulations classified by cell surface clusters of dif-
ferentiation (CD) and antigen receptors. Circadian rhyth-
micity for each variable was evaluated by ANOVA and
24 h cosine fitting and groups compared. Rhythms in
melatonin and cortisol (peaks near 01:30 and 08:00 h)
indicated identical synchronization to the light–dark sche-
dule and probable persistent entrainment of rhythms for
both groups in metabolism or proliferation of healthy tis-
sues normally tightly coupled to the sleep–wake cycle.
Twenty-four hours means were significantly higher in
NSCLC for CD16, CD25, cortisol, and IL2 and lower for
CD8, CD8bright, and cdTCR. A significant circadian
rhythm was found in C with daytime peaks for CD8,
CD8dim, CD16, Vd2TCR, and cortisol and nighttime
peaks for CD3, CD4, CD20, and melatonin, and in
NSCLC, with daytime peaks for CD16, cdTCR, Vd2TCR
and cortisol, and nighttime peaks for CD4, CD25, and
melatonin. Thus, NSCLC was associated with significant
increases or decreases in proportions for several lympho-
cyte subsets that may reflect disease development, but peak
times were nevertheless similar between C and NSCLC for
each variable, suggesting that timed circadian administra-
tion (chronotherapy) of immunotherapy and other cancer
treatments may improve efficacy due to persistent circadian
entrainment of healthy tissues.
Keywords Lymphocyte subpopulations � NSCLC �Circadian rhythmicity � Cortisol � Melatonin � IL2
Introduction
The host immune defense influences the appearance and
the development of malignant neoplastic diseases acting
G. Mazzoccoli (&)
Department of Internal Medicine and Chronobiology Unit,
Scientific Institute and Regional General Hospital
‘‘Casa Sollievo della Sofferenza’’,
San Giovanni Rotondo, Foggia, Italy
e-mail: [email protected]
R. B. Sothern
The Rhythmometry Laboratory, College of Biological Sciences,
University of Minnesota, St. Paul, MN, USA
P. Parrella � L. A. Muscarella � V. M. Fazio
Research Laboratory of Oncology, Scientific Institute and
Regional General Hospital ‘‘Casa Sollievo della Sofferenza’’,
San Giovanni Rotondo, Foggia, Italy
F. Giuliani
Computing Unit, Scientific Institute and Regional General
Hospital ‘‘Casa Sollievo della Sofferenza’’,
San Giovanni Rotondo, Foggia, Italy
V. Polyakova � I. M. Kvetnoy
Department of Cell Biology and Pathology,
Institute of Bioregulation and Gerontology and Russian
Academy for Medical Sciences, St. Petersburg, Russia
V. Polyakova � I. M. Kvetnoy
Department of Pathology, Ott Institute of Obstetrics and
Gynecology, Russian Academy for Medical Sciences,
St. Petersburg, Russia
123
Clin Exp Med (2012) 12:181–194
DOI 10.1007/s10238-011-0153-6
Author's personal copy

upon the promotion or the control of malignant cells. In this
regard, immune-competent cells such as lymphocytes and
macrophages play a key role in the immuno-surveillance, are
an essential component of the biological host reaction, and are
the basic elements in the immunotherapy of cancer [1, 2]. The
activation and development of an adaptive immune response
is initiated by the engagement of a T-cell antigen receptor
(TCR) by an antigenic peptide major histocompatibility
complex (MHC), and the outcome of this engagement is
determined by both positive and negative signals determining
co-stimulation and co-inhibition [3–5].
Tumor-infiltrating lymphocytes (TIL), which are white
blood cells that have left the bloodstream and migrated into
a tumor, are populations of antigen-specific MHC-restric-
ted T cells, usually CD8? cytotoxic T cells, whose
response may be stimulated by a T helper 1 cytokine
milieu. This includes interferon gamma (IFN-c), interleu-
kin (IL) 2, IL12, and cdTCR? cells that are homoge-
neously composed of non-MHC-restricted cytolytic cells.
TIL are also influenced by natural killer (NK) cells (which
are large granular lymphocytes that express neither a/b or
c/d T-cell receptor nor CD3 on their surface, can lyse a
number of different tumor cells, and may be stimulated by
IFN-c, IL2, IL12, and/or IL18) and the lymphokine-acti-
vated killer cells (LAK), which are a mixed population of
peripheral blood lymphocytes that develop non-MHC-
restricted lytic activity for malignant cells after culture in
vitro with high concentrations of IL2 [6–10]. Additional
tumor-infiltrating leukocytes include monocytes recruited
from the circulation that differentiate into stable resident
tumor-associated macrophages (TAM) within the tumor
microenvironment [11]. TAM are key regulators between
inflammation and cancer and have pro-tumoral functions
that become a key link in facilitating cancer progression
and metastatic invasion [12]. TAM, which can be identified
as CD16? macrophages by their morphology, are more
stable in malignant tissues than in the circulation [13].
The many naturally occurring daily and other body
rhythms that have evolved as adjustments to environmental
changes due to the solar day and year enable organisms to
predict when environmental challenges are most likely to
occur and, as such, have a regulating influence on the
‘‘normal’’ functioning of the body’s many processes.
Human physiology is characterized by the rhythmic
recurrence of biological processes [14, 15], and circadian
(about 24 h) rhythms represent the most common biolog-
ical rhythm [16]. The 24-h rhythmic variations in physi-
ology and behavior are controlled by a highly complex
internal cellular system involving a master circadian clock
in the suprachiasmatic nuclei (SCN) of the hypothalamus,
extra-SCN cerebral clocks, and peripheral oscillators, all
comprised of a set of proteins that generate self-sustaining
transcriptional–translational feedback loops with a period
of about 24 h [17–19]. At the cellular level, the circadian
rhythms in the expression of the so-called clock genes that
include Period (Per1, Per2), Bmal1, Clock (or its paralog
Npas2), Rev-Erba, and cryptochrome (Cry1, Cry2), among
others, regulate a circadian clock that persists under a
variety of circumstances [20–23].
Immune functions show temporal changes related to
circadian variations of circulating antibodies, total lym-
phocytes, and cell-mediated immune responses, thereby
indicating a circadian organization of cellular immune
function. Peripheral blood levels of T cytotoxic lympho-
cytes, natural killer cells, and cdTCR-bearing cells are at
their lowest levels at night and rise to a maximum around
midday, thereby indicating a diurnal pattern of the cyto-
toxic arm of immune function, whereas CD4? T helper
lymphocytes have higher nocturnal levels [24–26]. The
circadian variations of lymphocyte subsets have been
related to circadian changes in the process of cell produc-
tion, release, and destruction, and to the action of hormones
(e.g., cortisol), monoamines (e.g., epinephrine and melato-
nin), and cytokines and chemokines that influence cell redis-
tribution to the bone marrow, mobilization, and migration to
lymphoid and non-lymphoid organs and peripheral tissues
[27–30]. Immune cells have specific receptors for these fac-
tors, and their circadian rhythmicity characterizes immune
system function that allows the occurrence of timed windows
of interaction among key lymphocyte subsets, immunomod-
ulating hormones, and cytokines/chemokines. Circadian
functional changes in immune cell function depend on the
circadian variation in gene expression related to transcrip-
tional and posttranslational feedback loops generated by a set
of interplaying clock proteins and time-keeping clock genes
mentioned above [31–33].
Among the strategies implementable in cancer therapy,
some deal with the enhancement of immunological response,
especially cell-mediated immune response, obtained by using
biological response modifiers and adoptive immunotherapy.
Immunological alterations and, in particular, abnormalities in
the proportions of various lymphocyte subpopulations have
been found in a number of malignant tumors [34, 35]. The
purpose of our study was to evaluate 24-h profiles of eleven
lymphocyte surface molecules and subsets in circulating
leukocytes and 3 hormones (melatonin, cortisol, and IL2) in
controls without neoplastic disease and patients with untreated
non-small cell lung cancer (NSCLC) and test for differences
between these groups in overall levels and circadian rhythm
characteristics.
Methods
Subjects gave written informed consent, and the study was
approved by the local Scientific and Ethical Committee.
182 Clin Exp Med (2012) 12:181–194
123
Author's personal copy

Peripheral blood samples were collected at intervals of 4 h
for 24 h from eleven male control subjects free from
neoplastic disease, consisting of seven patients suffering
from irritable bowel syndrome and four patients suffering
from back pain and osteoarthrosis (i.e., chronic non-
inflammatory bone disease), aged 35–53 years (mean ±
SD = 43.6 ± 5.9 years), and 9 male patients suffering
from non-small cell lung cancer (NSCLC), aged
43–63 years (mean ± SD = 51.0 ± 7.2 years). Inclusion
criteria for controls were as follows: age \80 years, body
mass index (BMI) \30 and [20, normal physical activity
level, no psychiatric disorder, no alcohol intake, no chronic
conditions, and normal blood pressure levels. Absence of
any major disease was assessed by medical history and
physical examination, basal screening with blood and urine
tests, ECG, chest X-ray, and upper and lower abdominal
ultrasound scans.
Inclusion criteria for patients suffering from lung cancer
were as follows: age \80 years, BMI \30 and [20, nor-
mal physical activity level, no psychiatric disorder, alcohol
intake or chronic conditions, normal blood pressure levels,
no treatment (surgery, chemotherapy, and radiotherapy),
performance status [80% by Karnofsky scale or \2 by
ECOG score, and tumor cell type (non-small cell lung
cancer) (NSCLC). The extent of the tumor was evaluated
by clinical examination, bronchoscopy, computed tomog-
raphy (CT) of the brain, chest, upper abdomen, and ultra-
sonography of the liver. From small biopsies and cytology,
the carcinoma was more centrally located in 3 cases
(squamous cell carcinoma) and more peripherally located
in the tissue lining in 6 cases (adenocarcinoma). All
patients were combined into a single NSCLC group, since
both diagnoses indicated that a cancerous process was
present. The pathological diagnosis was based on light
microscopy according to the WHO classification, and the
extent of cancer in each patient’s body was staged
according to the TNM (tumor–nodes–metastasis) classifi-
cation of the International Union Against Cancer staging
system after reviewing the clinical, radiologic, and patho-
logic data. The numbers of pT1, pT2, and pT3-4 cases
(representing primary tumor size) were 2, 4, and 3,
respectively, and all 9 cases showed metastasis to regional
lymph nodes. When this information was compiled to
determine a staging category used to assess prognosis
(representing the extent of cancer progression or spread at
diagnosis), the numbers of stage II (nearby lymph node
involved), III (local involvement outside lung), and IV
(distant metastasis) cases were 5, 2, and 2, respectively (see
Table 1).
The two groups were matched with regards to gender,
BMI, and season of sampling, and all NSCLC patients
were subjected to the same social routine, with identical
mealtimes and sleep–wakefulness schedules during the
week preceding the sampling day (lights on at 07:00 h and
lights off at 23:00 h). Sleep was allowed only between
23:00 (lights off) and 07:00 h (lights on). During the
daytime between 07:15 and 20:15 h, all subjects stayed in
the clinic and standardized meals were provided at appro-
priate times for breakfast (07:30 h), lunch (12:30 h), and
dinner (18:30 h). During the overnight sampling period, a
dim blue light (\100 lux) was used.
After a 36-h pre-screening span for each subject, blood
samples (6/subject) were collected intravenously every 4 h
at 10:00, 14:00, 18:00, 22:00, 02:00, and 06:00 h, centri-
fuged immediately after collection, and frozen at -20�C
for later determinations. In each blood sample, phenotypes
characteristic of eleven lymphocyte subpopulations (CD3,
CD4, CD8, CD8bright, CD8dim, CD16, CD20, CD25,
HLA-DR, cdTCR, and Vd2TCR) chosen according to the
presence of specific clusters of differentiation (CD) and
antigen receptors at the cell surface (see Table 2 for
descriptions of cells expressing each specific CD molecule)
were analyzed in peripheral blood anticoagulated with
sodium ethylenediamine tetraacetic acid (EDTA).
Analyses of lymphocyte subpopulations were performed
on unfixed cell preparations with a 5-parameter flow
cytometer (FACSCalibur, Becton–Dickinson FACS Sys-
tems, Sunnyvale, CA, USA) and a panel of monoclonal
antibodies (mAbs) to lymphocyte surface antigens (CD3
FITC/CD8 PE/CD45 PerCP/CD4 APC, CD16 PE, CD19
PE, CD25 PE Cy7, HLA-DR FITC, and PAN cdTCR:
Becton–Dickinson Biosciences, San Jose, CA, USA). We
used fluorochrome-labeled mAbs conjugated with phyco-
erythrin (PE), PE Cy7, peridinin chlorophyll protein
(PerCP), allophycocyanin (APC), and fluorescein isothio-
cyanate (FITC), and 10 ll mAbs was added to 100 ml
EDTA blood in Trucount tubes (BD Biosciences, San Jose,
Table 1 Patients with non-small cell lung cancer: age and disease
status
Patient Age
(years)
Tumor type TNMa
classification
Overallb
cancer stage
1 45 Adenocarcinoma pT2 II
2 46 Adenocarcinoma pTl II
3 57 Adenocarcinoma pT3-4 II
4 58 Squamous pT2 II
5 63 Squamous pTl II
6 49 Adenocarcinoma pT2 III
7 54 Adenocarcinoma pT2 III
8 43 Adenocarcinoma pT3-4 IV
9 44 Squamous pT3-4 IV
a TNM tumor, node, metastasis descriptors of lung cancer; pathologic
tumor (pT) stage listedb Used to assess prognosis and represents extent of cancer progres-
sion or spread
Clin Exp Med (2012) 12:181–194 183
123
Author's personal copy
CA, USA). After a 15-min incubation at room temperature,
the erythrocytes were disintegrated, and after centrifuga-
tion, the supernatants were washed with PBS. Non-lym-
phocytic cells contaminating the preparations were
excluded from analysis using scatter gates set on the 90�light scatter profile. At least 10,000 cells were acquired on
the FACScan. Absolute counts of T-cell subsets were cal-
culated based on the proportion of the respective T-cell
subpopulation and on absolute counts obtained by the
procedure. The number of fluorescent cells was expressed
as a percentage of the total lymphocytes.
Analysis of blood samples with the flow cytometer must
be performed with the same instrument setting and at the
same time, so different blood samples were stored for
variable lengths of time until examination of the entire set.
Since fresh blood samples age gradually over time, there
can be some changes between fresh blood and stored blood,
which may result in a decreased reliability in the cyto-
metric counting of leukocytes in the stored blood [36]. In
addition, erythrocyte lysing procedures cause substantial
cell loss with respect to individual values for every single
subclass and patient, and the absolute counts determined by
a ‘‘lyse no-wash’’ flow cytometry procedure may also be
influenced by the cell loss determined by the lysis process
[37]. For these reasons, we elected to evaluate rhythmic
changes in the percentages of cells rather than in the
absolute counts based on total lymphocytes.
Melatonin and cortisol, to confirm normal synchroni-
zation of the subjects to the local light–dark schedule [38],
and IL2 were also determined in serum. All samples were
analyzed in duplicate in a single assay; the intra-assay and
interassay coefficients of variation were, respectively,
below 4% and 7% for melatonin, 3% and 5% for cortisol,
and 5 and 7% for IL2. Melatonin was measured by
radioimmunoassay (Melatonin RIA kit, Buehlmann Labo-
ratories AG, Schonenbuch, Switzerland), cortisol by
Immuno-assay in ElectroChemiluminescence (Cortisol
ECL, Cobas Roche, Burgess Hill, West Sussex, England),
and IL2 by immuno-enzymatic assay (IL2 EIA, Techno-
genetics, Milan, Italy).
Statistical analysis
After normalizing data for each variable for each subject to
percent of individual mean to reduce intersubject vari-
ability in levels, overall data for each group (C, NSCLC
overall and by stages II, III, and IV) were analyzed by
variable, using both original units and normalized values,
for a 24 h time-effect across the 6 timepoints by one-way
analysis of variance (ANOVA). Analysis of each time
series for circadian rhythm characteristics was accom-
plished by the single cosinor procedure [39] by approxi-
mation of each time series of data by the least-squares
linear regression fit of a single component (24 h) cosine
using the Chronolab statistical package [40]. A P value for
the rejection of the zero-amplitude assumption was deter-
mined by an F test of the variance accounted for by the fit
of the cosine versus the variance accounted for by a
straight-line approximation of the arithmetic mean.
Rhythm detection was considered statistically significant if
P B 0.05.
Rhythm characteristics determined from the best-fitting
cosine model include the following: the ‘‘MESOR’’ (the
middle of the cosine representing an adjusted overall 24 h
average, which equals the arithmetic mean if sampling is
equidistant and there are no missing data or timepoints);
the ‘‘amplitude’’ (A, half the distance from the peak and
trough of the best-fitting curve); and the ‘‘phase’’ of the
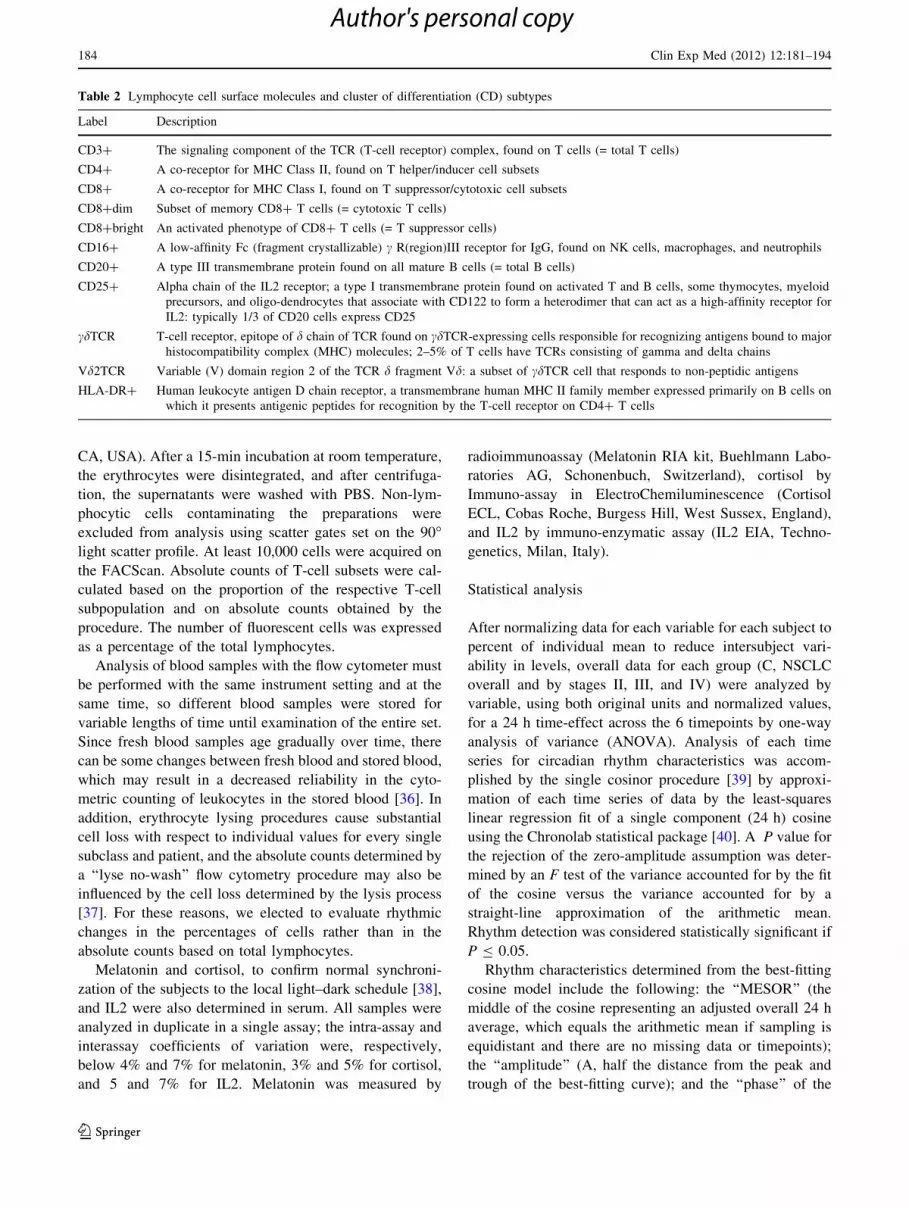
Table 2 Lymphocyte cell surface molecules and cluster of differentiation (CD) subtypes
Label Description
CD3? The signaling component of the TCR (T-cell receptor) complex, found on T cells (= total T cells)
CD4? A co-receptor for MHC Class II, found on T helper/inducer cell subsets
CD8? A co-receptor for MHC Class I, found on T suppressor/cytotoxic cell subsets
CD8?dim Subset of memory CD8? T cells (= cytotoxic T cells)
CD8?bright An activated phenotype of CD8? T cells (= T suppressor cells)
CD16? A low-affinity Fc (fragment crystallizable) c R(region)III receptor for IgG, found on NK cells, macrophages, and neutrophils
CD20? A type III transmembrane protein found on all mature B cells (= total B cells)
CD25? Alpha chain of the IL2 receptor; a type I transmembrane protein found on activated T and B cells, some thymocytes, myeloid
precursors, and oligo-dendrocytes that associate with CD122 to form a heterodimer that can act as a high-affinity receptor for
IL2: typically 1/3 of CD20 cells express CD25
cdTCR T-cell receptor, epitope of d chain of TCR found on cdTCR-expressing cells responsible for recognizing antigens bound to major
histocompatibility complex (MHC) molecules; 2–5% of T cells have TCRs consisting of gamma and delta chains
Vd2TCR Variable (V) domain region 2 of the TCR d fragment Vd: a subset of cdTCR cell that responds to non-peptidic antigens
HLA-DR? Human leukocyte antigen D chain receptor, a transmembrane human MHC II family member expressed primarily on B cells on
which it presents antigenic peptides for recognition by the T-cell receptor on CD4? T cells
184 Clin Exp Med (2012) 12:181–194
123
Author's personal copy

cosine model (Ø, referred to local midnight), with the peak
of a single component cosine called the ‘‘acrophase’’ (aØ,
acro = peak).
When two series (e.g., C vs. NSCLC) are paired in an
analysis, the cosine-fitting program automatically per-
formed a parameter t test between rhythm characteristics
(MESOR, amplitude, acrophase) for each variable and a
t test to compare individual timepoint means between the
groups (i.e., C vs. NSCLC at 02:00, 06:00 h, etc.).
A linear regression was also performed to look for
trends in each variable in the NSCLC patients when
grouped according to the two staging categories mentioned
earlier: TNM, representing primary tumor size (i.e., pT1,
pT2, and pT3-4), and overall cancer staging, representing
overall cancer progression (i.e., stages II, III, and IV).
Results
Linear regression results for trends across cancer stages are
presented in Table 3, while results of ANOVA and cosinor
analyses for time-effects for each variable and group are
presented in Table 4 for hormones and Table 5 for lym-
phocyte subpopulations. For each variable, a composite
Table 3 Linear regression on
variables in NSCLC versus
disease status
Serum samples (n = 54) were
obtained every 4 h for 24 h
from 9 male patients with non-
small cell lung cancer
(NSCLC). See L subtype
descriptions in Table 2. Two
staging systems are compared
for trends
TNM tumor, node, metastasis
descriptors of lung cancer:
pathologic tumor (pT) stage
listed
Overall cancer stage represents
extent of cancer progression or
spread used most often to assess
prognosis
Statistically significant values
are given in italics (P \ 0.05)
Variable Units TNM classification Overall cancer stage
R Slope P value R Slope P value
Lymphocyte (L) subpopulations
CD3? %L 0.58 -5.50 \0.001 0.11 -0.95 0.423
CD4? %L 0.16 -2.80 0.165 0.25 3.30 0.067
CD8? %L 0.40 -3.30 0.003 0.05 0.36 0.730
CD8?bright %L 0.36 -1.80 0.008 0.04 0.20 0.747
CD8?dim %L 0.27 -1.30 0.048 0.08 0.36 0.552
CD16? %L 0.28 -2.90 0.041 0.50 -4.70 \0.001
CD20? %L 0.03 -0.18 0.818 0.09 -0.45 0.516
CD25? %L 0.60 -1.80 \0.001 0.27 0.75 0.044
HLA-DR? %L 0.06 0.44 0.662 0.09 -0.45 0.516
cdTCR %L 0.14 -0.40 0.304 0.20 0.51 0.140
Vc2TCR %L 0.04 -0.08 0.796 0.44 0.75 0.004
Hormones
Melatonin pg/ml 0.02 -0.68 0.890 0.02 -0.51 0.908
Cortisol lg/dl 0.25 -4.10 0.070 0.53 7.80 \0.001
IL2 IU/ml 0.37 0.14 0.006 0.33 0.11 0.014
Table 4 Statistical evaluation of 24-h variations for serum hormones in controls versus non-small cell lung cancer
Variable Units Group N subj (Original units)
MESOR ± SE
Analyses for time-effect (using data normalized to % of mean)**
ANOVA 24 h cosine and parameters:
P P Amp (%) ± SE aØ ± SE (95% limits)
Melatonin pg/ml C 11 37.60 ± 2.69 \0.001 \0.001 63.9 ± 7.4 01:35 ± 00:27 h (00:40, 02:28 h)
NSCLC 9 33.19 ± 2.82 \0.001 \0.001 67.7 ± 10.2 01:36 ± 00:34 h (00:24, 02:44 h)
Cortisol lg/dl C 11 11.95 ± 0.81 \0.001 \0.001 50.1 ± 6.9 07:48 ± 00:31 h (06:44, 08:52 h)
NSCLC 9 18.20* ± 1.63 \0.001 \0.001 27.0* ± 6.9 08:22 ± 00:59 h (06:20, 10:24 h)
IL2 lU/ml C 11 0.44 ± 0.02 0.961 0.906 2.5 ± 5.7 18:18 ± 08:36 h –
NSCLC 9 0.54* ± 0.04 0.593 0.376 11.9* ± 8.4 16:14 ± 02:42 h –
At each of 6 times (02:00, 06:00, 10:00, 14:00, 18:00, and 22:00 h), blood samples were obtained from 11 male controls (C), aged 35–53 years, without
neoplastic disease, and 9 men, aged 43–63 years, with untreated non-small cell lung cancer (NSCLC). IL2 interleukin-2
Analyses for time-effect: ANOVA analysis of variance across timepoint means using all grouped values (6/subj) as % of individual mean, Cosine least-
squares fit of 24 h cosine to all grouped data as % of individual mean, MESOR middle of cosine = 24 h mean, Amp amplitude of cosine, aØ (acro-
phase) peak of cosine in hours:minutes from local midnight (95% limits listed if P B 0.05)
* After MESOR or Amp indicates significant difference from controls by parameter test. No group differences found for any acrophase comparison
** All Vd2TCR values = 0.0 for 2 NSCLC patients (for group n = 9, mean = 0.82 ± 0.18; p = 0.07 from C) and could not be used in time-effect analyses
Clin Exp Med (2012) 12:181–194 185
123
Author's personal copy

time plot (chronogram) using original values was created to
show the timepoint means ± SE for both groups and the
superimposed best-fitting 24 h cosines. Hormones (cortisol,
melatonin, and IL2) are displayed in Fig. 1, while lymphocyte
subpopulations are displayed in Figs. 2 and 3. An acrophase
chart allows visual comparison of the similarity in 24 h timing
between the two groups for each variable and the sequencing
of peaks over the 24 h among the variables (Fig. 4).
The presence or absence of a trend in the data over
staging categories depended upon which staging system
was used (Table 3). When using the TNM classification,
decreasing trends were four CD3, CD8, CD8bright,
CD8dim, CD16, and CD25, while using the overall cancer
staging system, a decreasing trend was found for CD16 and
increasing trend for CD25 and Vc2TCR (an increasing trend
in CD4 was borderline significant (P = 0.067). An increasing
trend was also found for IL2 using either staging method. For
cortisol, a large positive trend was found when using the
overall cancer staging system, supporting our use of this cat-
egorization (based upon an increase in stress related to
advanced cancer staging) when analyzing cancer subgroups
for rhythms in the other variables (a decreasing trend with
P = 0.070 was found when using the TNM system).
Serum levels of melatonin and cortisol each showed a
prominent 24-h oscillation in both groups, with highest values
at night for melatonin and near awakening for cortisol (Fig. 1,
top and middle panels). Mean melatonin values in C did
not significantly differ from NSCLC at any timepoint or
overall (mean ± SE): MESOR: NSCLC = 33.2 ± 2.8 vs.
C = 37.6 ± 2.7 pg/ml; (P = 0.261), and mean cortisol
Table 5 Statistical evaluation of 24-h variations for 11 circulating lymphocyte subpopulations in controls versus non-small cell lung cancer
Lymphocyte
(L) subpopulation
Group N subj (Original units: %L)
MESOR ± SE
Analyses for time-effect (using data normalized to % of mean)**
ANOVA 24 h cosine and parameters:
P P Amp (%) ± SE aØ ± SE (95% limits)
CD3? C 11 80.54 ± 0.80 0.046 0.050 1.3 ± 0.5 02:58 ± 01:31 h (23:28, 06:28 h)
NSCLC 9 82.55 ± 0.97 0.260 0.106 1.4 ± 0.6 20:58 ± 01:46 h –
CD4? C 11 44.30 ± 1.09 0.006 0.003 6.8 ± 1.9 01:23 ± 01:05 h (23:04, 03:40 h)
NSCLC 9 45.85 ± 1.38 \0.001 \0.001 14.3* ± 3.2 23:12 ± 00:52 h (21:24, 01:00 h)
CD8? C 11 29.33 ± 1.25 0.002 0.002 6.9 ± 1.9 12:08 ± 01:02 h (09:56, 14:20 h)
NSCLC 9 24.32* ± 0.84 0.581 0.365 4.0 ± 2.8 11:11 ± 02:40 h –
CD8?bright C 11 20.91 ± 0.98 0.300 0.242 4.5 ± 2.6 13:47 ± 02:14 h –
NSCLC 9 15.92* ± 0.51 0.703 0.402 4.1 ± 3.0 10:34 ± 02:48 h –
CD8?dim C 11 8.81 ± 0.39 0.003 \0.001 13.9 ± 3.5 11:21 ± 00:57 h (09:20, 13:20 h)
NSCLC 9 8.57 ± 0.49 0.809 0.476 5.7 ± 4.7 13:01 ± 03:07 h –
CD16? C 11 7.52 ± 0.55 0.020 0.023 12.4 ± 4.4 12:59 ± 01:22 h (10:00, 16:00 h)
NSCLC 9 16.65* ± 1.05 0.049 0.032 10.8 ± 4.0 10:29 ± 01:24 h (07:20, 13:40 h)
CD20? C 11 11.04 ± 0.61 0.255 0.053 10.6 ± 4.3 20:56 ± 01:32 h (19:24, 23:57 h)
NSCLC 9 10.12 ± 0.57 0.285 0.622 3.3 ± 3.4 01:07 ± 03:54 h –
CD25? C 11 4.69 ± 0.37 0.130 0.126 11.2 ± 5.4 00:24 ± 01:51 h –
NSCLC 9 5.70* ± 0.30 0.008 0.028 13.7 ± 5.0 22:57 ± 01:23 h (19:52, 02:04 h)
HLA-DR? C 11 14.88 ± 0.53 0.098 0.322 5.0 ± 3.3 23:06 ± 02:31 h –
NSCLC 9 14.09 ± 0.74 0.709 0.664 3.6 ± 4.0 19:48 ± 04:l2 h –
cdTCR C 11 3.50 ± 0.28 0.062 0.201 9.6 ± 5.3 12:20 ± 02:06 h –
NSCLC 9 2.34* ± 0.28 0.004 0.002 30.6* ± 8.0 14:00 ± 01:00 h (11:52, 16:08 h)
Vd2TCR C 11 1.25 ± 0.15 0.001 \0.001 35.1 ± 8.7 11:51 ± 00:57 h (09:52, 13:52 h)
NSCLC 7** 1.05 ± 0.18 0.225 0.041 24.6 ± 9.4 17:18 ± 01:27 h (13:56, 20:40 h)
At each of 6 times (02:00, 06:00, 10:00, 14:00, 18:00, and 22:00 h), blood samples were obtained from 11 male controls (C), aged 35–53 years,
without neoplastic disease, and 9 men, aged 43–63 years, with untreated non-small cell lung cancer (NSCLC). See Table 2 for lymphocyte
subpopulation descriptions
Analyses for time-effect: ANOVA analysis of variance across timepoint means using all grouped values (6/subj) as % of individual mean,
Cosine least-squares fit of 24 h cosine to all grouped data as % of individual mean, MESOR middle of cosine = 24 h mean, Amp amplitude of
cosine, aØ (acrophase) peak of cosine in hours:minutes from local midnight (95% limits listed if P B 0.05)
* After MESOR or Amp indicates significant difference from controls by parameter test. No group differences found for any aØ comparison
** All Vd2TCR values = 0.0 for 2 NSCLC patients (for group n = 9, mean = 0.82 ± 0.18; p = 0.07 from C) and could not be used in time-
effect analyses
186 Clin Exp Med (2012) 12:181–194
123
Author's personal copy
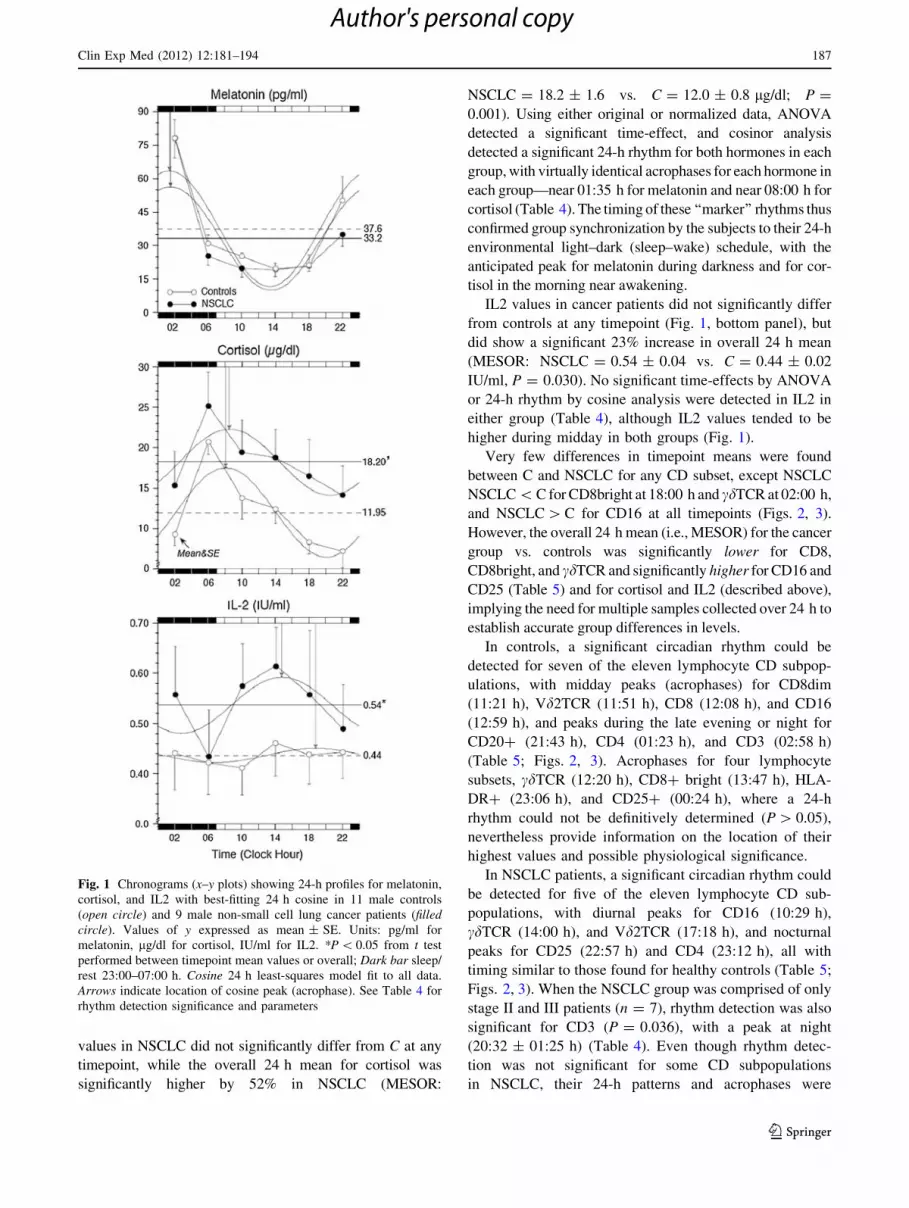
values in NSCLC did not significantly differ from C at any
timepoint, while the overall 24 h mean for cortisol was
significantly higher by 52% in NSCLC (MESOR:
NSCLC = 18.2 ± 1.6 vs. C = 12.0 ± 0.8 lg/dl; P =
0.001). Using either original or normalized data, ANOVA
detected a significant time-effect, and cosinor analysis
detected a significant 24-h rhythm for both hormones in each
group, with virtually identical acrophases for each hormone in
each group—near 01:35 h for melatonin and near 08:00 h for
cortisol (Table 4). The timing of these ‘‘marker’’ rhythms thus
confirmed group synchronization by the subjects to their 24-h
environmental light–dark (sleep–wake) schedule, with the
anticipated peak for melatonin during darkness and for cor-
tisol in the morning near awakening.
IL2 values in cancer patients did not significantly differ
from controls at any timepoint (Fig. 1, bottom panel), but
did show a significant 23% increase in overall 24 h mean
(MESOR: NSCLC = 0.54 ± 0.04 vs. C = 0.44 ± 0.02
IU/ml, P = 0.030). No significant time-effects by ANOVA
or 24-h rhythm by cosine analysis were detected in IL2 in
either group (Table 4), although IL2 values tended to be
higher during midday in both groups (Fig. 1).
Very few differences in timepoint means were found
between C and NSCLC for any CD subset, except NSCLC
NSCLC \ C for CD8bright at 18:00 h and cdTCR at 02:00 h,
and NSCLC [ C for CD16 at all timepoints (Figs. 2, 3).
However, the overall 24 h mean (i.e., MESOR) for the cancer
group vs. controls was significantly lower for CD8,
CD8bright, and cdTCR and significantly higher for CD16 and
CD25 (Table 5) and for cortisol and IL2 (described above),
implying the need for multiple samples collected over 24 h to
establish accurate group differences in levels.
In controls, a significant circadian rhythm could be
detected for seven of the eleven lymphocyte CD subpop-
ulations, with midday peaks (acrophases) for CD8dim
(11:21 h), Vd2TCR (11:51 h), CD8 (12:08 h), and CD16
(12:59 h), and peaks during the late evening or night for
CD20? (21:43 h), CD4 (01:23 h), and CD3 (02:58 h)
(Table 5; Figs. 2, 3). Acrophases for four lymphocyte
subsets, cdTCR (12:20 h), CD8? bright (13:47 h), HLA-
DR? (23:06 h), and CD25? (00:24 h), where a 24-h
rhythm could not be definitively determined (P [ 0.05),
nevertheless provide information on the location of their
highest values and possible physiological significance.
In NSCLC patients, a significant circadian rhythm could
be detected for five of the eleven lymphocyte CD sub-
populations, with diurnal peaks for CD16 (10:29 h),
cdTCR (14:00 h), and Vd2TCR (17:18 h), and nocturnal
peaks for CD25 (22:57 h) and CD4 (23:12 h), all with
timing similar to those found for healthy controls (Table 5;
Figs. 2, 3). When the NSCLC group was comprised of only
stage II and III patients (n = 7), rhythm detection was also
significant for CD3 (P = 0.036), with a peak at night
(20:32 ± 01:25 h) (Table 4). Even though rhythm detec-
tion was not significant for some CD subpopulations
in NSCLC, their 24-h patterns and acrophases were
Fig. 1 Chronograms (x–y plots) showing 24-h profiles for melatonin,
cortisol, and IL2 with best-fitting 24 h cosine in 11 male controls
(open circle) and 9 male non-small cell lung cancer patients (filledcircle). Values of y expressed as mean ± SE. Units: pg/ml for
melatonin, lg/dl for cortisol, IU/ml for IL2. *P \ 0.05 from t test
performed between timepoint mean values or overall; Dark bar sleep/
rest 23:00–07:00 h. Cosine 24 h least-squares model fit to all data.
Arrows indicate location of cosine peak (acrophase). See Table 4 for
rhythm detection significance and parameters
Clin Exp Med (2012) 12:181–194 187
123
Author's personal copy

nevertheless similar to those observed in healthy controls
(Table 5; Fig. 4).
Discussion
An effective T-cell-mediated immune surveillance is
capable of monitoring the genetic integrity of mammalian
cells, and T lymphocytes are a fundamental component of
the specific immune responses that produce tumor rejection
beginning in the earliest phases of neoplastic disease. The
function and activity of T cells (i.e., activation, prolifera-
tion, acquisition of memory, and cytolytic function vs.
induction of anergy and programmed cell death) are ulti-
mately governed by the balance between positive and
negative signaling within T cells, conferred through
Fig. 2 Chronograms (x–y plots)
showing 24-h profiles for CD3,
CD4, CD8, CD8bright,
CD8dim, and CD16 lymphocyte
subpopulations with best-fitting
24 h cosine in 11 male controls
(open circle) and 9 male
patients (filled circle) with non-
small cell lung cancer
(NSCLC). Values of
y expressed as mean ± SE
(units % cell types of total
lymphocyte population).
*P \ 0.05 from t test performed
between timepoint mean values
or overall; Dark bar sleep/rest
23:00–07:00 h. Cosine 24 h
least-squares model fit to all
data. Arrows indicate location
of cosine peak (acrophase). See
Table 5 for rhythm detection
significance and parameters
188 Clin Exp Med (2012) 12:181–194
123
Author's personal copy

interactions between various T-cell co-regulatory receptors
and ligands. This balance is maintained through direct
mechanisms, such as the inhibition of tumor growth by
antitumor cytotoxic T-cell activity, and by cytokine-med-
iated lysis of tumor cells, or by indirect mechanisms, such
as the promotion of tumor growth by regulatory T cells that
suppress antitumor T-cell responses and by humoral
immune responses that increase chronic inflammation in
the tumor microenvironment [41, 42].
For example, some research has emphasized the
importance of chronic inflammation in the microenviron-
ment of tumors as a key player in tumorigenesis, with
components of the chemokine system affecting multiple
pathways of tumor progression, including leukocytes,
Fig. 3 Chronograms (x–y plots)
showing 24-h profiles for CD20-,
CD25-, cdTCR-, Vd2TCR-, and
HLA-DR-expressing cells, with
best-fitting 24 h cosine in 11
male controls (open circle) and
9 male patients (filled circle)
with non-small cell lung cancer
(NSCLC). Values of
y expressed as mean ± SE
(units % cell types of total
lymphocyte population).
*P \ 0.05 from t test performed
between timepoint mean values
or overall; Dark bar sleep/rest
23:00–07:00 h. Cosine 24 h
least-squares model fit to all
data. Arrows indicate location
of cosine peak (acrophase). See
Table 5 for rhythm detection
significance and parameters
Clin Exp Med (2012) 12:181–194 189
123
Author's personal copy

cytokines, complement components, and various tran-
scription factors that promote tumor cell proliferation and
survival of malignant cells, invasion, and metastasis, and
subversion of adaptive immunity and response to hormones
and chemotherapeutic agents [43–45]. Cancer can also alter
immunity through direct invasion and replacement of
normal lymphoid tissue, through the production of humoral
factors that interfere with immune function, or causing
cachexia and malnutrition, which increases the severity of
the immunodeficiency. Neoplastic tissue can down-regu-
late antitumor T-cell-mediated immunity through the
tumor-associated B7-H1 molecule by interacting with the
T-cell ligand PD-1, thereby resulting in tumor-reactive
T-cell apoptosis or impairments in cytokine production and
cytotoxicity of activated antitumor T cells [46, 47].
Another mechanism may involve a severe alteration of
the physiological time structure of the human organism.
Body homeostasis is maintained by numerous rhythmic
biological functions presenting different phases, and this
phenomenon is particularly evident when the rhythms that
characterize the working of the multiple elements inter-
connected in the immune system are considered. A com-
plete loss of rhythmicity or a change of phase and/or
amplitude may alter the physiological array of rhythms
with the onset of chrono-disruption or internal desynchro-
nization [48].
In our control subjects, we found significant circadian
rhythms in the following subsets: CD20 (total B cells)-
bearing cells, with a peak in the evening, CD3 (total T
cells)- and CD4 (T helper/inducer subset)-bearing cells,
with peaks in the middle of the night, and CD8 (T sup-
pressor/cytotoxic subset)-, CD8dim (T cytotoxic lympho-
cytes)-, CD16 (natural killer)-, and Vd2TCR (a subset of
cdTCR)-expressing cells, with peaks near midday, in
Fig. 4 Acrophase (aØ) chart indicating timing of peaks for serum
levels of 3 hormones and 11 lymphocyte subpopulations in peripheral
blood sampled every 4 h for 24 h from 11 male controls (open circle)
without neoplastic disease and 9 male patients (filled circle) with non-
small cell lung cancer (NSCLC). aØ peak(s) of fitted 24 h using all
data (see Tables 3, 4); 95% confidence limits added to aØ if P B 0.05
from nonzero-amplitude test. Dark and light bars along the x-axis
indicate the duration of the sleep and wake spans, respectively
190 Clin Exp Med (2012) 12:181–194
123
Author's personal copy

antiphase to CD3- and CD4-expressing cells. A significant
rhythm for the controls as a whole was not found for
CD8bright, CD25, HLA-DR, or cdTCR, although highest
values tended to occur at the same times as highest values
in NSCLC. In the NSCLC patients, we found that the
relative percentages and the circadian rhythmicity of the
lymphocyte subsets were altered. CD8-, CD8bright (T
helper subset)-, cdTCR (cytolytic cells which have been
proposed to bridge the innate and adaptive immune
responses and to lyse tumor target cells)-, and Vd2TCR-
expressing cells were significantly diminished, whereas
CD16 and CD25 (activated T cells with expression of alpha
chain of IL2 receptor) were significantly increased, and this
increase was paralleled by increased IL2 serum levels.
Circadian rhythmicity was not detected for CD3-, CD8-,
CD8bright-, CD8dim-, CD20-, and HLA-DR-bearing
lymphocytes in the NSCLC patients, possibly due to tumor
dynamics disruption, which may or may not reflect a
benefit for the tumor.
In support of our findings of overall decreases or
increases in some CD? subsets in NSCLC, a decrease in
CD8? T suppressor cells has been observed in other types
of cancer (gastric cancer, colorectal carcinoma, urological
cancer, and breast cancer [49]), while an increase in NK
(CD16?) cells in the peripheral blood is frequently
reported in cancer patients, wherein a high proportion of
NK in TIL seems to be related to a more favorable prog-
nosis, whereas the increase in CD4? CD25? T cells seems
to be associated with a poor prognosis [50]. We noted
similar trends for these CD subtypes when categorizing our
NSCLC patients by cancer stages II–IV (Table 3). CD4?
CD25? T cells contain T regulatory cells that suppress
antigen-specific T-cell immune responses and might ham-
per effective immuno-surveillance of emerging cancer cells
and impede effective immune responses to established
tumors. CD4?CD25? T regulatory cells constitute 5–10%
of peripheral blood CD4? lymphocytes and may express
CD25 (the alpha chain of the IL2 receptor), cytotoxic T
lymphocyte-associated antigen-4 (CTLA-4), a glucocorti-
coid-induced TNFa receptor (GITR), and a member of the
forkhead transcription factors (Foxp3). Higher levels of T
regulators have also been reported in the peripheral blood
of patients with several types of tumors (malignant mela-
noma, Hodgkin lymphoma, ovarian, gastric, lung, breast,
pancreatic, and colorectal cancer) and appear also in the
tumor microenvironment [51–61].
The nervous, endocrine, and immune systems have well-
established and very close interrelationships that contribute
to the maintenance of systemic homeostasis and involve
the production and secretion of a variety of cellular
mediators known as regulatory molecules (hormones,
cytokines, chemokines, integrins, and others). Among these
factors, the main players are melatonin, cortisol, and
immune cells, such as macrophages, T lymphocytes,
eosinophilic leukocytes, and mast cells that are a rich
source of cytokines, serotonin, beta-endorphin, histamine,
and other active molecules. The hormone melatonin serves
as a chemical messenger of darkness in all species studied
to date and is an important component of the timing sys-
tems for circadian rhythms [62]. The daily external envi-
ronmental cycle of a light span followed by a dark span
synchronizes circadian rhythms by providing a signal that
is sent to the pineal gland, a neuroendocrine transducer that
is stimulated during the dark period of the external envi-
ronment and suppressed by light as perceived by the retina,
which secretes the hormone melatonin that acts as a syn-
chronizer of the internal hormonal environment to the
light–dark cycle of the external environment [63]. As a
multitasking molecule, melatonin spreads widely through-
out all body tissues and functions as a signal molecule via
receptor-independent means to modulate the physiology
and molecular biology of cells for general and local coor-
dination of intercellular relationships and to synchronize
their biological rhythms [64]. The timing of the melatonin
rhythm, with regard to phase position, indicates the status
of the internal biological clock in relation to the sleep–
wake schedule.
The human circadian system is also characterized by
cortisol secretion from the adrenals that is under the control
of the hypothalamic–pituitary–adrenal axis. Direct hypo-
thalamic neural connections link the suprachiasmatic
nuclei, the site of the circadian pacemaker, and the para-
ventricular nuclei, the site of corticotrophin-releasing hor-
mone (CRH), the principal hypothalamic factor responsible
for inducing release of ACTH from the anterior pituitary.
The episodic release of ACTH from the anterior pituitary
drives the frequency of cortisol secretory events by the
adrenal gland. Changes in the amplitude, rather than the
frequency of the secretory episodes, regulate the amount of
cortisol released in each secretory episode, and this
amplitude modulation is believed to be controlled by the
circadian pacemaker through modulation of ACTH release.
Circadian and non-circadian components underlie cortisol
diurnal patterns of variation, wherein the ultradian secre-
tory episodes and the circadian secretory amplitude result
from the kinetics of cortisol synthesis in the adrenal glands,
infusion into the peripheral circulation, and clearance from
the plasma by the liver [65–67].
When comparing NSCLC versus C, melatonin serum
levels were similar, while cortisol was significantly ele-
vated by 52% overall in NSCLC (18.2 vs. 12.0 lg/dl)
NSCLC, yet with sleep between 23:00 and 07:00 h, the
circadian rhythmicity of secretion for these two hormones
was nearly identical between the two groups as a whole,
with peaks during sleep for melatonin and just after
awakening for cortisol. However, when rhythm
Clin Exp Med (2012) 12:181–194 191
123
Author's personal copy
characteristics for cortisol were compared between NSCLC
subgroups of cancer stages II, III, and IV, it was noted that
the level for stage IV (33.97 lg/dl) was significantly ele-
vated over all other groups (C = 11.95, stage II = 15.11,
stage III = 10.15 lg/dl), and there was a loss in circadian
rhythmicity in the stage IV group. The increase in overall
cortisol levels in some of the NSCLC patients, possibly
indicating increased stress levels, and loss of rhythm may
represent a marker of altered function of the regulatory
mechanisms of neuroendocrine secretion in the presence of
advanced neoplastic disease. Increased cortisol levels may
also possibly be involved in a two-way relationship with
the changes of lymphocyte subpopulations, determining a
decrease in CD8- and cdTCR-expressing cells, that nor-
mally show the same acrophase when cortisol serum levels
reach their zenith (near awakening). Nevertheless, all
NSCLC patients showed a perfectly normal 24-h pattern in
serum melatonin (all individual peaks at 02:00 h) in rela-
tion to the controls (all peaked at 22:00 or 02:00 h).
Therefore, altered cortisol levels could indicate a periphe-
ral rhythm disturbance, while melatonin indicated the
master clock’s synchronization to the environmental sleep–
wake schedule and that all patients nevertheless maintained
circadian rhythmicity in a key body rhythm marker.
In conclusion, from around-the-clock blood sampling,
both controls and lung cancer patients were found to be
similarly synchronized to the 24-h sleep–wake schedule,
but the NSCLC patients presented anomalies in lympho-
cyte subset proportions and circadian variations that may
impair the interplay among different lymphocyte subpop-
ulations crucial for an effective immune response. These
findings are also worth considering in the context of a
therapeutic strategy that needs to take into account the
circadian patterns, in addition to complex interactions and
multiple functions that characterize the cytotoxic lympho-
cyte subpopulations. It is thus important to standardize and
report sampling time(s) of day when making comparisons
between groups and before, during and after treatments in
order to more correctly compare levels always at the same
sampling times. In addition, a chronobiologic strategy of a
correctly timed, circadian stage-dependent sampling and/or
dosing schedule versus 24-h rhythms in biochemical,
physiological, and behavioral processes will be essential in
any attempts to successfully optimize and personalize
decision making when evaluating immunomodulatory
effects determined by biological response modifiers and
adoptive immunotherapy protocols in pathological condi-
tions such as endocrine, metabolic, rheumatic, and neo-
plastic diseases, among others [68, 69]. In this regard, we
are planning to implement a protocol in which the cancer
patient stays 36 h in the ward to be studied prior to treat-
ment and during this time span undergoes 4-h blood sam-
pling and other examinations, including ultrasound
imaging, computed tomography, and biological sampling,
to define tumor histology to start primary cell cultures to
evaluate chemosensitivity and study cell kinetics. In this
way, we hope to define time-related characteristics of some
host/tumor components and, if necessary, can use the 24-h
hormone profiles [70] to adjust the scheduling of individual
anti-tumor treatment(s) with regard to ‘‘stage of rhythm’’
and not treatment time(s) as usual (i.e., ‘‘clock hour(s) of
convenience’’), in an attempt to personalize the circadian
administration of cancer treatment [69].
Acknowledgments We wish to express our gratitude and thank the
control subjects and NSCLC patients that each volunteered to par-
ticipate in this study.
Conflict of interest The authors declare that they have no conflict
of interest related to the publication of this manuscript.
References
1. de Visser KE, Eichten A, Coussens LM (2006) Paradoxical roles
of the immune system during cancer development. Nat Rev
Cancer 6(1):24–37
2. Zhang T, Herlyn D (2009) Combination of active specific
immunotherapy or adoptive antibody or lymphocyte immuno-
therapy with chemotherapy in the treatment of cancer. Cancer
Immunol Immunother 58(4):475–492
3. Blank C, Mackensen A (2007) Contribution of the PD-L1/PD-1
pathway to T-cell exhaustion: an update on implications for
chronic infections and tumor evasion. Cancer Immunol Immun-
other 56(5):739–745
4. Zang X, Allison JP (2007) The B7 family and cancer therapy:
costimulation and coinhibition. Cancer Res 13(18 Pt 1):5271–5279
5. Inman BA, Frigola X, Dong H, Kwon ED (2007) Costimulation,
coinhibition and cancer. Curr Cancer Drug Targets 7(1):15–30
Review
6. June CH, Blazar BR, Riley JL (2009) Engineering lymphocyte
subsets: tools, trials and tribulations. Nat Rev Immunol
9(10):704–716
7. Motohashi S, Nakayama T (2008) Clinical applications of natural
killer T cell-based immunotherapy for cancer. Cancer Sci
99(4):638–645
8. Zhang YL, Li J, Mo HY et al (2010) Different subsets of tumor
infiltrating lymphocytes correlate with NPC progression in dif-
ferent ways. Mol Cancer 10(9):4
9. Savas B, Kerr PE, Pross HF (2006) Lymphokine-activated killer
cell susceptibility and adhesion molecule expression of multidrug
resistant breast carcinoma. Cancer Cell Int 6:24–37
10. Kabelitz D, Wesch D, He W (2007) Perspectives of gammadelta
T cells in tumor immunology. Cancer Res 67(1):5–8
11. Mantovani A, Bottazzi B, Colotta F, Sozzani S, Ruco L (1992)
The origin and function of tumor-associated macrophages.
Immunol Today 13(7):265–270
12. Allavena P, Sica A, Solinas G, Porta C, Mantovani A (2008) The
inflammatory micro-environment in tumor progression: the role
of tumor-associated macrophages. Oncol Hematol 66(1):1–9
13. van Ravenswaay Claasen HH, Kluin PM, Fleuren GJ (1992)
Tumor infiltrating cells in human cancer. On the possible role of
CD16? macrophages in antitumor cytotoxicity. Lab Invest
67(2):166–174
192 Clin Exp Med (2012) 12:181–194
123
Author's personal copy
14. Sothern RB (2006) Clinical medicine. In: Koukkari WL, Sothern
RB (eds) Introducing biological rhythms. Springer, New York,
pp 426–525
15. Haus E (2007) Chronobiology in the endocrine system. Adv Drug
Deliv Rev 59(9–10):985–1014
16. Edery I (2000) Circadian rhythms in a nutshell. Physiol
Genomics 3(2):59–74
17. Hastings MH, Reddy AB, Maywood ES (2003) A clockwork
web: circadian timing in brain and periphery, in health and dis-
ease. Nat Rev Neurosci 4:649–661
18. Gachon F, Nagoshi E, Brown SA, Ripperger J, Schibler U (2004)
The mammalian circadian timing system: from gene expression
to physiology. Chromosoma 113:103–112
19. Ko CH, Takahashi JS (2006) Molecular components of the
mammalian circadian clock. Hum Mol Genet 15:R271–R277
Review
20. Damiola F, Le Minh N, Preitner N, Kornmann B, Fleury-Olela F,
Schibler U (2000) Restricted feeding uncouples circadian oscil-
lators in peripheral tissues from the central pacemaker in the
suprachiasmatic nucleus. Genes Dev 14:2950–2961
21. Stokkan KA, Yamazaki S, Tei H, Sakaki Y, Menaker M (2001)
Entrainment of the circadian clock in the liver by feeding. Sci-
ence 291:490–493
22. Fu L, Lee CC (2004) The circadian clock: pacemaker and tumour
suppressor. Nature Rev Cancer 3:350–361
23. Nagoshi E, Saini C, Bauer C, Laroche T, Naef F, Schibler U
(2004) Circadian gene expression in individual fibroblasts: cell-
autonomous and self-sustained oscillators pass time to daughter
cells. Cell 119:693–705
24. Mazzoccoli G, Correra M, Bianco G et al (1997) Age-related
changes of neuro-endocrine-immune interactions in healthy
humans. J Biol Reg Hom Agents 11(4):143–147
25. Suzuki S, Toyabe S, Moroda T (1997) Circadian rhythm of leu-
cocytes and lymphocytes subsets and its possible correlation with
the function of the autonomic nervous system. Clin Exp Immunol
110(3):500–508
26. Mazzoccoli G, Sothern RB, De Cata A et al (2011) A timetable of
24-hour patterns for human lymphocyte subpopulations. J Biol
Regul Homeost Agents (in press)
27. Blum KS, Pabst R (2007) Lymphocyte numbers and subsets in
the human blood. Do they mirror the situation in all organs?
Immunol Lett 108(1):45–51
28. Dimitrov S, Benedict C, Heutling D, Westermann J, Born J,
Lange T (2009) Cortisol and epinephrine control opposing cir-
cadian rhythms in T cell subsets. Blood 113(21):5134–5143
29. Dimitrov S, Lange T, Born J (2010) Selective mobilization of
cytotoxic leukocytes by epinephrine. J Immunol 184(1):503–511
30. Mazzoccoli G, De Cata A, Greco A, Carughi S, Giuliani F,
Tarquini R (2010) Circadian rhythmicity of lymphocyte sub-
populations and relationship with neuro-endocrine system. J Biol
Reg Homest Agents 24(3):341–350
31. Teboul M, Barrat-Petit M-A, Mei Li X, Claustrat B, Formento
J-L, Delaunay F (2005) Atypical patterns of circadian clock gene
expression in human peripheral blood mononuclear cells. J Mol
Med 83(9):693–699
32. Fukuya H, Emoto N, Nonaka H, Yagita K, Okamura H,
Yokoyama M (2007) Circadian expression of clock genes in human
peripheral leukocytes. Biochem Biophys Res Commun 354(4):
924–928
33. Borgs L, Beukelaers P, Vandenbosch R, Belachew S, Nguyen L,
Malgrange B (2009) Cell ‘‘circadian’’ cycle: new role for mam-
malian core clock genes. Cell Cycle 8(6):832–837
34. Estrela-Lima A, Araujo MS, Costa-Neto JM et al (2010) Immu-
nophenotypic features of tumor infiltrating lymphocytes from
mammary carcinomas in female dogs associated with prognostic
factors and survival rates. BMC Cancer 10:256
35. Mazzoccoli G, Grilli M, Carughi S et al (2003) Immune system
alterations in lung cancer patients. Int J Immunopathol Pharmacol
16(2):167–174
36. Sharma P (2009) Preanalytical variables and laboratory perfor-
mance. Ind J Clin Biochem 24:109–110
37. Gohde W, Cassens U, Lehman LG et al (2003) Individual patient-
dependent influence of erythrocyte lysing procedures on flow-
cytometric analysis of leukocyte subpopulations. Transfus Med
Hemother 30:165–170
38. Klerman EB, Gershengorn HB, Duffy JF, Kronauer RE (2002)
Comparisons of the variability of three markers of the human
circadian pacemaker. J Biol Rhythms 17(2):181–193
39. Nelson W, Tong YL, Lee YK, Halberg F (1979) Methods for
cosinor rhythmometry. Chronobiologia 6(4):305–323
40. Mojon A, Fernandez JR, Hermida R (1992) Chronolab: an
interactive software package for chronobiologic time series
analysis written for the Macintosh computer. Chronobiol Intl
9(6):403–412
41. Parmiani G (2005) Tumor-infiltrating T cells—friend or foe of
neoplastic cells? N Engl J Med 353(25):2640–2641
42. Bindea G, Mlecnik B, Fridman WH, Pages F, Galon J (2010)
Natural immunity to cancer in humans. Curr Opin Immunol
22(2):215–222
43. Mantovani A (2010) Molecular pathways linking inflammation
and cancer. Curr Mol Med 10(4):369–373 Review
44. O’Callaghan DS, O’Donnell D, O’Connell F, O’Byrne KJ (2010)
The role of inflammation in the pathogenesis of non-small cell
lung cancer. J Thorac Oncol 5(12):2024–2036 Review
45. Allavena P, Germano G, Marchesi F, Mantovani A (2011) Che-
mokines in cancer related inflammation. Exp Cell Res
317(5):664–673 Review
46. Thompson RH, Dong H, Kwon ED (2007) Implications of B7-H1
expression in clear cell carcinoma of the kidney for prognosti-
cation and therapy. Clin Cancer Res 13(2 Pt 2):709s–715s
47. Ghebeh H, Barhoush E, Tulbah A, Elkum N, Al-Tweigeri T,
Dermime S (2008) FOXP3? Tregs and B7-H1?/PD-1? T
lymphocytes co-infiltrate the tumor tissues of high-risk breast
cancer patients: implication for immunotherapy. BMC Cancer
23(8):57
48. Mazzoccoli G, Vendemiale G, De Cata A, Carughi S, Tarquini R
(2010) Altered time structure of neuro-endocrine-immune system
function in lung cancer patients. BMC Cancer 10(1):314
49. Hueman MT, Stojadinovic A, Storrer CE et al (2007) Analysis of
naıve and memory CD4 and CD8 T cell populations in breast
cancer patients receiving a HER2/neu peptide (E75) and GM-
CSF vaccine. Cancer Immunol Immunother 56(2):135–146
50. Eckschlager T, Radvanska J, Slaby K, Prusa R, Hochova I,
Radvansky J (2009) Changes of blood count, lymphocyte sub-
populations and immunoglobulin levels in nephroblastoma long
term survivors. Neoplasma 56(1):9–12
51. Ormandy LA, Hillemann T, Wedemeyer H, Manns MP, Greten
TF, Korangy F (2005) Increased populations of regulatory T cells
in peripheral blood of patients with hepatocellular carcinoma.
Cancer Res 65(6):2457–2464
52. Cesana GC, DeRaffele G, Cohen S et al (2006) Characterization
of CD4?CD25? regulatory T cells in patients treated with high-
dose interleukin-2 for metastatic melanoma or renal cell carci-
noma. J Clin Oncol 24(7):1169–1177
53. Beyer M, Kochanek M, Darabi K et al (2005) Reduced fre-
quencies and suppressive function of CD4?CD25hi regulatory T
cells in patients with chronic lymphocytic leukemia after therapy
with fludarabine. Blood 106(6):2018–2025
54. Woo EY, Chu CS, Goletz TJ et al (2001) Regulatory
CD4(?)CD25(?) T cells in tumors from patients with early-stage
non-small cell lung cancer and late-stage ovarian cancer. Cancer
Res 61(12):4766–4772
Clin Exp Med (2012) 12:181–194 193
123
Author's personal copy

55. Meloni F, Morosini M, Solari N et al (2006) Foxp3 expressing
CD4?CD25? and CD8?CD28- T regulatory cells in the
peripheral blood of patients with lung cancer and pleural meso-
thelioma. Hum Immunol 67(1–2):1–12
56. Nelson BH (2008) The impact of T-cell immunity on ovarian
cancer outcomes. Immunol Rev 222:101–116 Review
57. Ebelt K, Babaryka G, Frankenberger B et al (2009) Prostate
cancer lesions are surrounded by FOXP3?, PD-1? and B7-H1?
lymphocyte clusters. Eur J Cancer 45(9):1664–1672
58. Salama P, Phillips M, Grieu F et al (2009) Tumor-infiltrating
FOXP3? T regulatory cells show strong prognostic significance
in colorectal cancer. J Clin Oncol 27(2):186–192
59. Karagoz B, Bilgi O, Gumus M et al (2010) CD8?CD28- cells
and CD4?CD25? regulatory T cells in the peripheral blood of
advanced stage lung cancer patients. Med Oncol 27(1):29–33
60. Chaput N, Louafi S, Bardier A et al (2009) Identification of
CD8?CD25?Foxp3? suppressive T cells in colorectal cancer
tissue. Gut 58(4):520–529
61. Shen LS, Wang J, Shen DF et al (2009) CD4(?)CD25(?)
CD127(low/-) regulatory T cells express Foxp3 and suppress
effector T cell proliferation and contribute to gastric cancers
progression. Clin Immunol 131(1):109–118
62. Cassone VM, Natesan AK (1997) Time and time again: the
phylogeny of melatonin as a transducer of biological time. J Biol
Rhythms 12:489–497 Review
63. Reiter RJ (1991) Pineal melatonin: cell biology of its synthesis
and its physiological interactions. Endocr Rev 12:151–179
64. Reiter RJ, Tan DX, Fuentes-Broto L (2010) Melatonin: a multi-
tasking molecule. Prog Brain Res 181:127–151 Review
65. Van Cauter E (1990) Diurnal and ultradian rhythms in human
endocrine function: a minireview. Horm Res 34:45–53
66. Gusenoff JA, Harman S, Veldhuis JD et al (2001) Cortisol and
GH secretory dynamics, and their interrelationships, in healthy
aged women and men. Am J Physiol Endocrinol Metab
280:E616–E625
67. Haus E (2007) Chronobiology in the endocrine system. Adv Drug
Deliv Rev 59:985–1014
68. Levi F, Okyar A, Dulong S, Innominato PF, Clairambault J
(2010) Circadian timing in cancer treatments. Annu Rev Phar-
macol Toxicol 50:377–421 Review
69. Ohdo S (2010) Chronotherapeutic strategy: rhythm monitoring,
manipulation and disruption. Adv Drug Deliv Rev 62(9–10):
859–875 Review
70. Mazzoccoli G, Giuliani F, Sothern RB (2011) Whole body cir-
cadian phase evaluated from melatonin and cortisol sampled
every 4 h over 24 h in healthy men. Cancer Epidemiol (in press)
194 Clin Exp Med (2012) 12:181–194
123
Author's personal copy