comparison of air pollutant emissions among mega-cities
TRANSCRIPT

This article appeared in a journal published by Elsevier. The attachedcopy is furnished to the author for internal non-commercial researchand education use, including for instruction at the authors institution
and sharing with colleagues.
Other uses, including reproduction and distribution, or selling orlicensing copies, or posting to personal, institutional or third party
websites are prohibited.
In most cases authors are permitted to post their version of thearticle (e.g. in Word or Tex form) to their personal website orinstitutional repository. Authors requiring further information
regarding Elsevier’s archiving and manuscript policies areencouraged to visit:
http://www.elsevier.com/copyright
Author's personal copy
Comparison of air pollutant emissions among mega-cities
David D. Parrish a,*, William C. Kuster a, Min Shao b, Yoko Yokouchi c, Yutaka Kondo d,Paul D. Goldan a, Joost A. de Gouw a,e, Makoto Koike f, Tomoko Shirai g
a Chemical Sciences Division, Earth System Research Laboratory/NOAA, 325 Broadway R/CSD7, Boulder, CO 80305, USAb College of Environmental Sciences and Engineering, Peking University, Beijing, Chinac Environmental Chemistry Division, National Institute for Environmental Studies, Tsukuba, Japand Research Center for Advanced Science and Technology, The University of Tokyo, Tokyo, Japane Cooperative Institute for Research in Environmental Sciences, University of Colorado, Boulder, CO, USAf Department of Earth and Planetary Science, Graduate School of Science, The University of Tokyo, Tokyo, Japang Center for Global Environmental Research, National Institute for Environmental Studies, Tsukuba, Japan
a r t i c l e i n f o
Article history:Received 6 March 2009Received in revised form12 June 2009Accepted 15 June 2009
Keywords:Mega-cityEmissionsCarbon monoxideNitrogen oxidesNOx
HydrocarbonsVOC
a b s t r a c t
Ambient measurements of hydrocarbons, carbon monoxide and nitrogen oxides from three mega-cities(Beijing, Mexico City, Tokyo) are compared with similar measurements from US cities in the mid-1980sand the early 2000s. The common hydrocarbon pattern seen in all data sets suggests that emissionsassociated with gasoline-fueled vehicles dominate in all of these cities. This commonality suggests that itwill be efficient and, ultimately, cost effective to proceed with vehicular emission controls in mostemerging mega-cities, while proceeding with development of more locally appropriate air quality controlstrategies through emissions inventory development and ambient air monitoring. Over the three decadescovered by the US data sets, the hydrocarbon emissions decreased by a significant factor (something likean order of magnitude), which is greater than suggested by emission inventories, particularly the EDGARinternational inventory. The ambient hydrocarbon and CO concentrations reported for the three non-USmega-cities are higher than present US ambient concentrations, but lower than those observed in the1980s in the US. The one exception to the preceding statement is the high concentrations of CO observedin Beijing, which apparently have a large regional contribution.
Published by Elsevier Ltd.
1. Introduction
(Note: Much of this material appeared earlier in a slightlydifferent form as an article in the IGACtivities Newsletter, 38, 22–29in April 2008.)
The world’s mega-cities represent a wide diversity of culturesand histories, with examples of mega-cities on all five majorcontinents. This diversity might be expected to lead to verydifferent patterns of air pollutant emissions. However, as mega-cities develop economically, a convergence of cultures occurs in thesense that automobile fleets and industrial processes develop insimilar modes across all cultures. Our goal in this article is tocompare and contrast air pollutant emissions in several mega-citiesas reflected in measured ambient concentrations of those pollut-ants with the goal of inferring the degree of similarity of emissionsources among these cities.
Our focus here is on major precursors of photochemical smog:non-methane hydrocarbons (NMHC), carbon monoxide (CO), andoxides of nitrogen (NO þ NO2 ¼ NOx). These are the primarypollutants whose emissions fuel the photochemical formation ofozone, other oxidants, and a fraction of the particulate matter(nitrates and secondary organic aerosol) that accumulate in urbanatmospheres. We will not address the emissions of sulfur dioxideand primary emissions of particulate matter, which lead to a majorfraction of the visibility-reducing aerosol loading in many urbanareas. Neither will we address emissions of oxygenated volatileorganic species, nor a variety of airborne toxic species, such asmercury and persistent organic pollutants. As a consequence,possible important differences in the emissions of these speciesbetween mega-cities will remain unaddressed.
Measurements of ambient concentrations in US cities haverevealed marked similarities in the NMHC concentration patternsthroughout the country (e.g., Parrish et al., 1998; de Gouw et al.,2005; Warneke et al., 2007; Baker et al., 2008). With the exceptionof the smaller alkanes, many of the patterns are so constant thatdeviations from those patterns may indicate measurement prob-lems, rather than actual differences in the ambient concentrations
* Corresponding author. Tel.: þ1 303 497 5274; fax: þ1 303 497 5126.E-mail address: [email protected] (D.D. Parrish).
Contents lists available at ScienceDirect
Atmospheric Environment
journal homepage: www.elsevier .com/locate/atmosenv
1352-2310/$ – see front matter Published by Elsevier Ltd.doi:10.1016/j.atmosenv.2009.06.024
Atmospheric Environment 43 (2009) 6435–6441
Author's personal copy
(Parrish et al., 1998). Significant deviations from the commonpattern can be substantiated only in cities (e.g. Houston) with largeindustrial sources characteristic of that particular urban area (e.g.,Jobson et al., 2004).
One goal of this paper is to compare patterns in the ambientNMHC concentrations in three of the world’s mega-cities withthose documented in the US. Comprehensive suites of atmosphericmeasurements in mega-cities have only recently become available.The comparisons here will focus on different cities – Beijing, MexicoCity, Tokyo and US cities – and on temporal contrasts – US emis-sions at present versus in the 1980s.
It should be noted that the discussion presented here is bestcharacterized as suggestive rather than definitive. The availabledata sets are still quite limited, with the measurements conductedat only one or two sites within a large urban area and for short(about 1 month) time periods. There are differences in themeasurement techniques, the seasons and times of day of themeasurements, and in the statistical approaches to analyzingthe resulting data sets. Nevertheless, the comparisons presentedhere provide intriguing preliminary findings that providedirections for further study.
2. Data sets
The data sets considered here in detail were collected down-wind of Boston and New York City in 2004, in Tokyo in 2003 and2004, in Beijing in 2005 and in Mexico City during 2006. These dataare compared with results of measurements reported in the liter-ature for US cities in the 1980s and the 2000s.
The Tokyo NMHC data were collected during four differentIntegrated Measurement Program for Aerosol and Oxidant Chem-istry in Tokyo (IMPACT) campaigns in the summer and autumn of2003 and the winter and summer of 2004. The measurements weremade at the Komaba campus of the Research Center for AdvancedScience and Technology of the University of Tokyo located in theheart of downtown Tokyo. Shirai et al. (2007) and Kondo (2008)provide more information on the IMPACT campaign.
The Beijing measurements were made during August 2005 fromthe roof of a 6-floor academic building on the campus of PekingUniversity (PKU), located in the northwestern urban area of Beijing.More details of the measurements are available in Song et al. (2007).
The Mexico City measurements were made during the MegacityInitiative: Local and Global Research Observations (MILAGRO)campaign at the T1 site, a suburban location at the UniversidadTecnologica de Tecamac to the northeast of Mexico City duringMarch 2006. The website http://www.eol.ucar.edu/projects/milagro/media/MILAGRO-Factsheet-Final.pdf provides more infor-mation on the MILAGRO campaign, as does an article by Molinaet al. (2008). A major focus of MILAGRO was characterization ofvehicle emissions throughout the urban area. The NMHC data fromT1 site are described in detail elsewhere (de Gouw et al., 2008;Welsh-Bon et al., in preparation).
Data from the United States are presented for comparison withthese other mega-city data. A survey of NMHC concentrations in 71US cities was made by the US Environmental Protection Agency in1984–1988. Seila et al. (1989) presented a summary of the datafrom the first 39 cities surveyed, and W. A. Lonneman has providedus with the complete data set for comparison purposes. Here theseresults will be compared with a more recent, similar survey of 28US cities conducted between 1999 and 2005 (Baker et al., 2008).A detailed NMHC speciation study conducted on a ship immedi-ately downwind of the Boston and New York City urban areas(Warneke et al., 2007) will also be examined. In their work,Warneke et al. (2007) show that their NMHC speciation charac-terization is generally consistent with that of Baker et al. (2008).
All of these US data sets were collected in the summertime.Although most of the US cities investigated cannot be consideredmega-cities, the data patterns that are discussed are representativeof New York City and Los Angeles, the two US mega-cities.
3. Hydrocarbon emissions
The ambient concentrations of hydrocarbons in the atmosphereof an urban area provide detailed information regarding the emis-sion sources of these species in that area. Section 3.1 examines therelationships between the ambient concentrations of differenthydrocarbons and the emission patterns that lead to these rela-tionships. Section 3.2 explores the emission changes over the pastthree to four decades implied by the limited historical record ofhydrocarbon measurements in the US and compares recent USconcentrations with current concentrations in the other mega-cities.
3.1. Relative emission patterns of hydrocarbons
Here we examine the patterns of the ambient concentrations ofa few selected hydrocarbons (Table 1) across the data sets discussedabove. These example species were selected based on severalcriteria. First, they are among those observed at higher concen-trations, which ensures their atmospheric importance and ourability to measure their concentrations accurately and precisely.Second, they are examples from all important hydrocarbon classesfound in urban atmospheres: alkanes (n-hexane), alkenes (ethene,or more commonly, ethylene), aromatics (benzene and toluene),and the one important alkyne (ethyne, or more commonly, acety-lene). Third, they are all believed to be emitted predominately fromanthropogenic rather than biogenic sources. Finally, they representspecies emitted from all of the recognized important urbananthropogenic sources. Table 1 lists these urban sources of NMHCand indicates which of the example NMHC are released insubstantial quantities from each.
Figs. 1–3 illustrate the relationships between three pairs of theselected NMHC. In each case both members of the pair have similaratmospheric lifetimes with respect to photochemical oxidation bythe hydroxyl radical. This oxidation is the primary loss process forNMHC from the atmosphere. Similar lifetimes for a pair of hydro-carbons implies that the ratio of their measured ambient concen-trations does not depart from the molar emission ratio of thehydrocarbons, even after photochemical processing of polluted airmasses.
In general, Figs. 1–3 show approximately constant ratios of themeasured NMHC concentrations, even while the observedconcentrations vary widely. The 71 US cities data set, which wascollected more than two decades ago, generally shows largerscatter than the other four data sets. This scatter indicates eithera greater diversity of sources in the 71 cities surveyed, or perhapspoorer measurement precision because the measurement tech-nology was not nearly as mature at the time of that study.A representative average concentration ratio can be derived froma particular data set in several ways. Here two methods wereemployed: either the slope was derived from a linear, least-squarefit to the observations (with the y-intercept either set to zero oroptimized by the least-squares procedure), or the geometric meanratio was calculated from all pairs of NMHC measurements in thedata set. To obtain the ‘‘best’’ ratio estimate the former method wasused when the linear correlation coefficient between the twoNMHC was �0.8 and the latter method was used for more poorlycorrelated data. Specific details of the procedure used for eachNMHC pair are given in the figure captions. In each case the ‘‘best’’average molar ratio is taken to represent the average molar
D.D. Parrish et al. / Atmospheric Environment 43 (2009) 6435–64416436
Author's personal copy
emission ratio of those NMHC in the region in which themeasurements were made.
The uncertainties of the average molar emission ratios derivedin Figs. 1–3 have contributions from the statistical imprecision ofthe ratio determination and from systematic inaccuracies in themeasurement techniques. The statistical imprecision is in all casessmall enough to support the number of significant figures given forthe derived ratios, i.e. �10%. However, we have no means to eval-uate unknown systematic uncertainties that arise from calibrationuncertainties, instrumental differences between studies, etc. Thismust be considered in the following discussion of apparent molaremission ratio differences between cities.
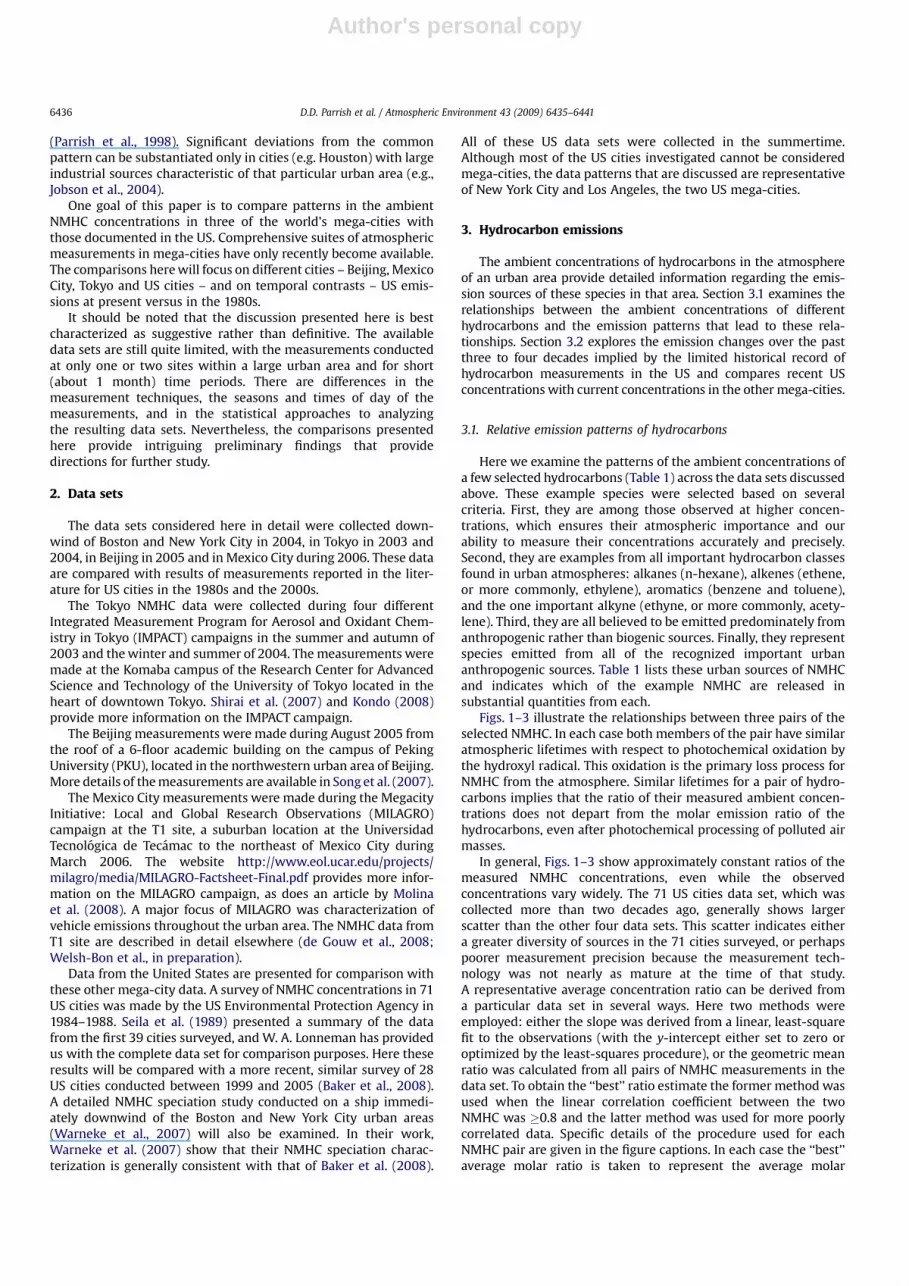
Fig. 1 presents the analysis of the molar emission ratio ofbenzene to acetylene derived from five studies. A great deal ofsimilarity between the 71 US cities study and the three non-USmega-cities is clear. The ratios of those four (of the five) data setsare all within 0.29–0.31. Benzene is a pollutant of particular regu-latory concern, since it is a demonstrated carcinogen. Fortin et al.(2005) have shown that in the US the benzene to acetylene ratio
has decreased since the early 1990s due to policies implementedfollowing the 1990 US Clean Air Act Amendments. These policiesincluded focused efforts to control a selected list of hazardous airpollutants including benzene. The emission ratios shown in Fig. 1for the two US data sets (0.30 and 0.17) are consistent with thistemporal trend. To our knowledge, this change in the benzene toacetylene emission ratio is the only well-documented, systematictemporal change in average US NMHC emission patterns. The threenon-US mega-cities exhibit emission ratios very close to the 1990sUS emission ratio, before the focus on reducing benzene in USemissions.
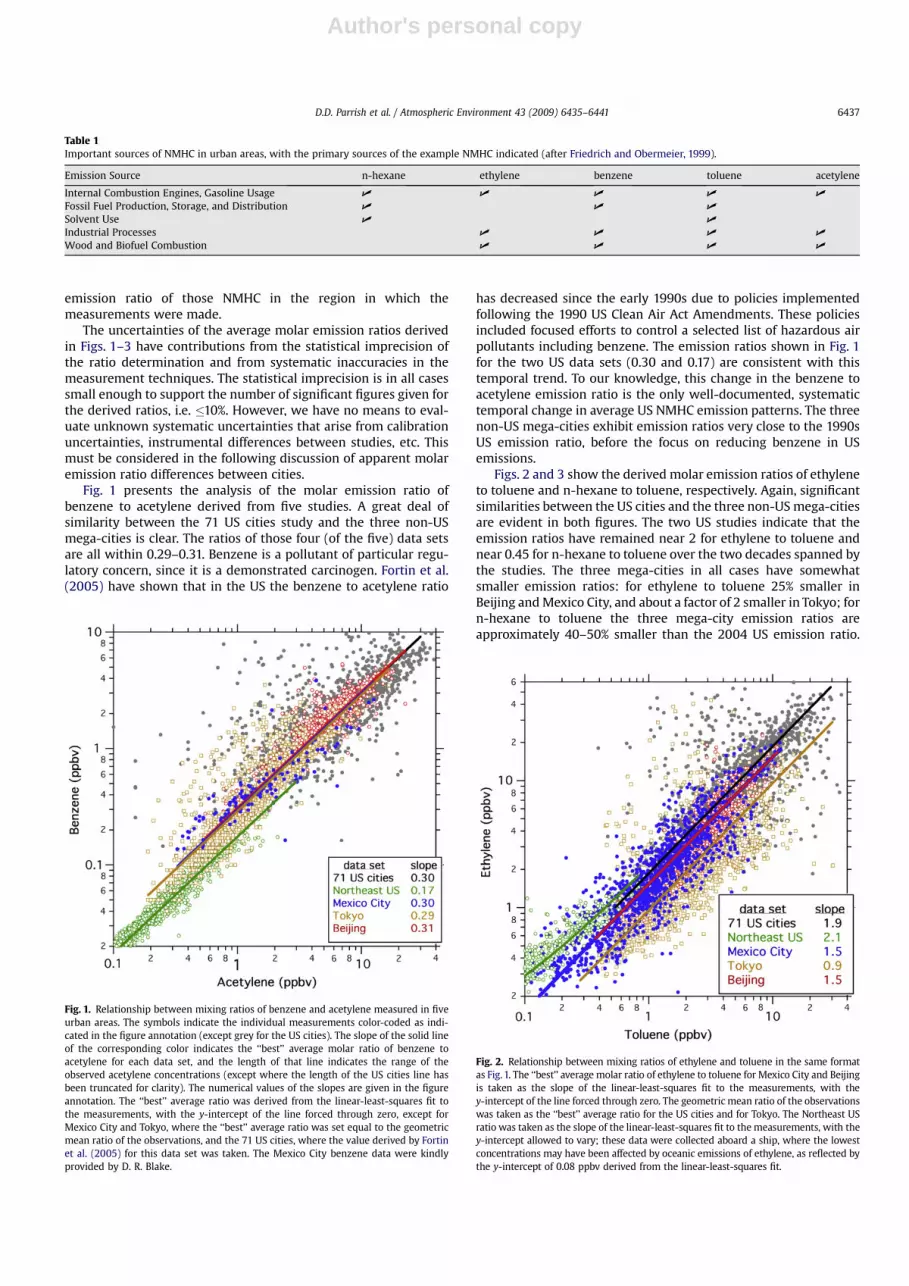
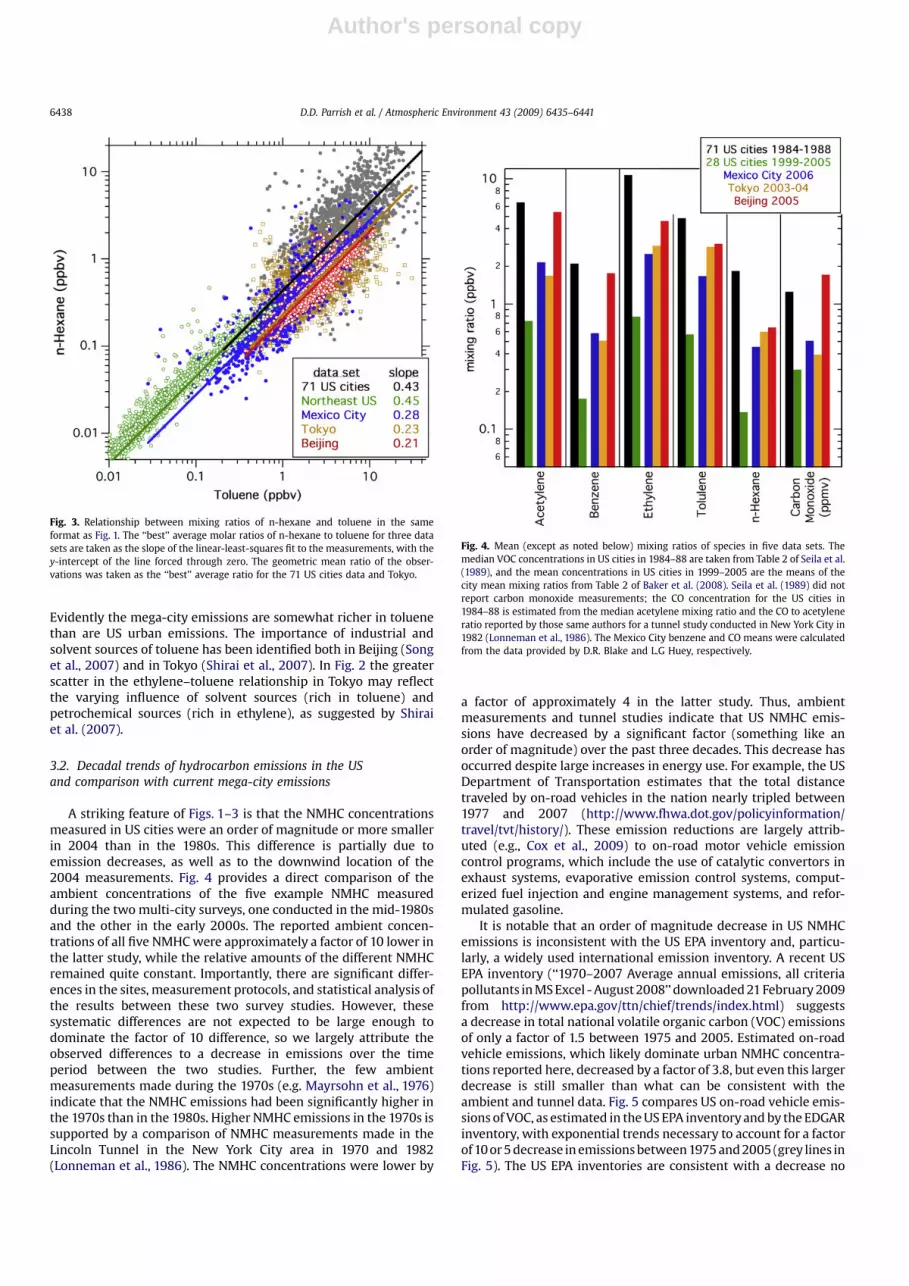
Figs. 2 and 3 show the derived molar emission ratios of ethyleneto toluene and n-hexane to toluene, respectively. Again, significantsimilarities between the US cities and the three non-US mega-citiesare evident in both figures. The two US studies indicate that theemission ratios have remained near 2 for ethylene to toluene andnear 0.45 for n-hexane to toluene over the two decades spanned bythe studies. The three mega-cities in all cases have somewhatsmaller emission ratios: for ethylene to toluene 25% smaller inBeijing and Mexico City, and about a factor of 2 smaller in Tokyo; forn-hexane to toluene the three mega-city emission ratios areapproximately 40–50% smaller than the 2004 US emission ratio.
Table 1Important sources of NMHC in urban areas, with the primary sources of the example NMHC indicated (after Friedrich and Obermeier, 1999).
Emission Source n-hexane ethylene benzene toluene acetylene
Internal Combustion Engines, Gasoline Usage U U U U U
Fossil Fuel Production, Storage, and Distribution U U U
Solvent Use U U
Industrial Processes U U U U
Wood and Biofuel Combustion U U U U
Fig. 1. Relationship between mixing ratios of benzene and acetylene measured in fiveurban areas. The symbols indicate the individual measurements color-coded as indi-cated in the figure annotation (except grey for the US cities). The slope of the solid lineof the corresponding color indicates the ‘‘best’’ average molar ratio of benzene toacetylene for each data set, and the length of that line indicates the range of theobserved acetylene concentrations (except where the length of the US cities line hasbeen truncated for clarity). The numerical values of the slopes are given in the figureannotation. The ‘‘best’’ average ratio was derived from the linear-least-squares fit tothe measurements, with the y-intercept of the line forced through zero, except forMexico City and Tokyo, where the ‘‘best’’ average ratio was set equal to the geometricmean ratio of the observations, and the 71 US cities, where the value derived by Fortinet al. (2005) for this data set was taken. The Mexico City benzene data were kindlyprovided by D. R. Blake.
Fig. 2. Relationship between mixing ratios of ethylene and toluene in the same formatas Fig. 1. The ‘‘best’’ average molar ratio of ethylene to toluene for Mexico City and Beijingis taken as the slope of the linear-least-squares fit to the measurements, with they-intercept of the line forced through zero. The geometric mean ratio of the observationswas taken as the ‘‘best’’ average ratio for the US cities and for Tokyo. The Northeast USratio was taken as the slope of the linear-least-squares fit to the measurements, with they-intercept allowed to vary; these data were collected aboard a ship, where the lowestconcentrations may have been affected by oceanic emissions of ethylene, as reflected bythe y-intercept of 0.08 ppbv derived from the linear-least-squares fit.
D.D. Parrish et al. / Atmospheric Environment 43 (2009) 6435–6441 6437
Author's personal copy
Evidently the mega-city emissions are somewhat richer in toluenethan are US urban emissions. The importance of industrial andsolvent sources of toluene has been identified both in Beijing (Songet al., 2007) and in Tokyo (Shirai et al., 2007). In Fig. 2 the greaterscatter in the ethylene–toluene relationship in Tokyo may reflectthe varying influence of solvent sources (rich in toluene) andpetrochemical sources (rich in ethylene), as suggested by Shiraiet al. (2007).
3.2. Decadal trends of hydrocarbon emissions in the USand comparison with current mega-city emissions
A striking feature of Figs. 1–3 is that the NMHC concentrationsmeasured in US cities were an order of magnitude or more smallerin 2004 than in the 1980s. This difference is partially due toemission decreases, as well as to the downwind location of the2004 measurements. Fig. 4 provides a direct comparison of theambient concentrations of the five example NMHC measuredduring the two multi-city surveys, one conducted in the mid-1980sand the other in the early 2000s. The reported ambient concen-trations of all five NMHC were approximately a factor of 10 lower inthe latter study, while the relative amounts of the different NMHCremained quite constant. Importantly, there are significant differ-ences in the sites, measurement protocols, and statistical analysis ofthe results between these two survey studies. However, thesesystematic differences are not expected to be large enough todominate the factor of 10 difference, so we largely attribute theobserved differences to a decrease in emissions over the timeperiod between the two studies. Further, the few ambientmeasurements made during the 1970s (e.g. Mayrsohn et al., 1976)indicate that the NMHC emissions had been significantly higher inthe 1970s than in the 1980s. Higher NMHC emissions in the 1970s issupported by a comparison of NMHC measurements made in theLincoln Tunnel in the New York City area in 1970 and 1982(Lonneman et al., 1986). The NMHC concentrations were lower by
a factor of approximately 4 in the latter study. Thus, ambientmeasurements and tunnel studies indicate that US NMHC emis-sions have decreased by a significant factor (something like anorder of magnitude) over the past three decades. This decrease hasoccurred despite large increases in energy use. For example, the USDepartment of Transportation estimates that the total distancetraveled by on-road vehicles in the nation nearly tripled between1977 and 2007 (http://www.fhwa.dot.gov/policyinformation/travel/tvt/history/). These emission reductions are largely attrib-uted (e.g., Cox et al., 2009) to on-road motor vehicle emissioncontrol programs, which include the use of catalytic convertors inexhaust systems, evaporative emission control systems, comput-erized fuel injection and engine management systems, and refor-mulated gasoline.
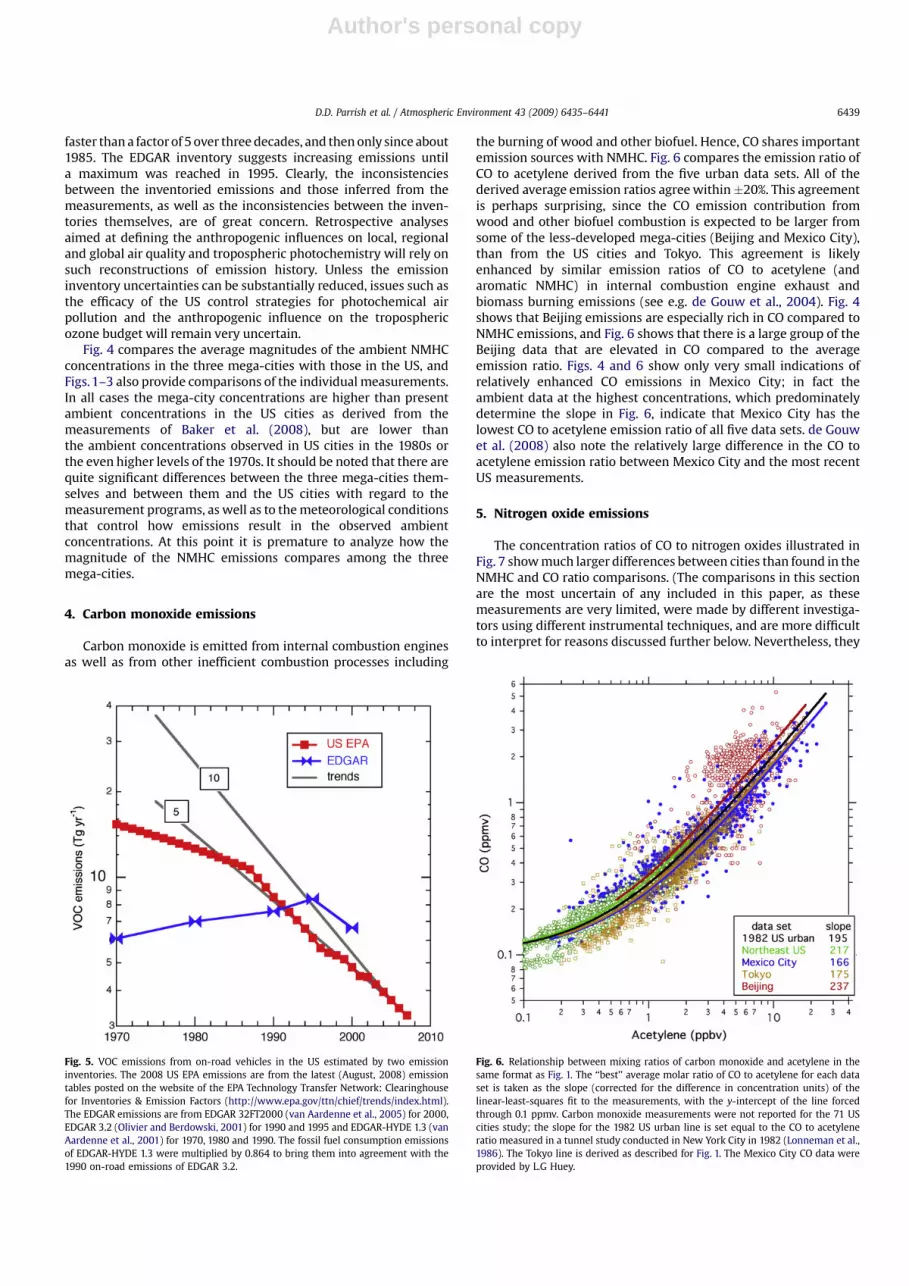
It is notable that an order of magnitude decrease in US NMHCemissions is inconsistent with the US EPA inventory and, particu-larly, a widely used international emission inventory. A recent USEPA inventory (‘‘1970–2007 Average annual emissions, all criteriapollutants in MS Excel - August 2008’’ downloaded 21 February 2009from http://www.epa.gov/ttn/chief/trends/index.html) suggestsa decrease in total national volatile organic carbon (VOC) emissionsof only a factor of 1.5 between 1975 and 2005. Estimated on-roadvehicle emissions, which likely dominate urban NMHC concentra-tions reported here, decreased by a factor of 3.8, but even this largerdecrease is still smaller than what can be consistent with theambient and tunnel data. Fig. 5 compares US on-road vehicle emis-sions of VOC, as estimated in the US EPA inventory and by the EDGARinventory, with exponential trends necessary to account for a factorof 10 or 5 decrease in emissions between 1975 and 2005 (grey lines inFig. 5). The US EPA inventories are consistent with a decrease no
Fig. 3. Relationship between mixing ratios of n-hexane and toluene in the sameformat as Fig. 1. The ‘‘best’’ average molar ratios of n-hexane to toluene for three datasets are taken as the slope of the linear-least-squares fit to the measurements, with they-intercept of the line forced through zero. The geometric mean ratio of the obser-vations was taken as the ‘‘best’’ average ratio for the 71 US cities data and Tokyo.
Fig. 4. Mean (except as noted below) mixing ratios of species in five data sets. Themedian VOC concentrations in US cities in 1984–88 are taken from Table 2 of Seila et al.(1989), and the mean concentrations in US cities in 1999–2005 are the means of thecity mean mixing ratios from Table 2 of Baker et al. (2008). Seila et al. (1989) did notreport carbon monoxide measurements; the CO concentration for the US cities in1984–88 is estimated from the median acetylene mixing ratio and the CO to acetyleneratio reported by those same authors for a tunnel study conducted in New York City in1982 (Lonneman et al., 1986). The Mexico City benzene and CO means were calculatedfrom the data provided by D.R. Blake and L.G Huey, respectively.
D.D. Parrish et al. / Atmospheric Environment 43 (2009) 6435–64416438
Author's personal copy
faster than a factor of 5 over three decades, and then only since about1985. The EDGAR inventory suggests increasing emissions untila maximum was reached in 1995. Clearly, the inconsistenciesbetween the inventoried emissions and those inferred from themeasurements, as well as the inconsistencies between the inven-tories themselves, are of great concern. Retrospective analysesaimed at defining the anthropogenic influences on local, regionaland global air quality and tropospheric photochemistry will rely onsuch reconstructions of emission history. Unless the emissioninventory uncertainties can be substantially reduced, issues such asthe efficacy of the US control strategies for photochemical airpollution and the anthropogenic influence on the troposphericozone budget will remain very uncertain.
Fig. 4 compares the average magnitudes of the ambient NMHCconcentrations in the three mega-cities with those in the US, andFigs. 1–3 also provide comparisons of the individual measurements.In all cases the mega-city concentrations are higher than presentambient concentrations in the US cities as derived from themeasurements of Baker et al. (2008), but are lower thanthe ambient concentrations observed in US cities in the 1980s orthe even higher levels of the 1970s. It should be noted that there arequite significant differences between the three mega-cities them-selves and between them and the US cities with regard to themeasurement programs, as well as to the meteorological conditionsthat control how emissions result in the observed ambientconcentrations. At this point it is premature to analyze how themagnitude of the NMHC emissions compares among the threemega-cities.
4. Carbon monoxide emissions
Carbon monoxide is emitted from internal combustion enginesas well as from other inefficient combustion processes including
the burning of wood and other biofuel. Hence, CO shares importantemission sources with NMHC. Fig. 6 compares the emission ratio ofCO to acetylene derived from the five urban data sets. All of thederived average emission ratios agree within�20%. This agreementis perhaps surprising, since the CO emission contribution fromwood and other biofuel combustion is expected to be larger fromsome of the less-developed mega-cities (Beijing and Mexico City),than from the US cities and Tokyo. This agreement is likelyenhanced by similar emission ratios of CO to acetylene (andaromatic NMHC) in internal combustion engine exhaust andbiomass burning emissions (see e.g. de Gouw et al., 2004). Fig. 4shows that Beijing emissions are especially rich in CO compared toNMHC emissions, and Fig. 6 shows that there is a large group of theBeijing data that are elevated in CO compared to the averageemission ratio. Figs. 4 and 6 show only very small indications ofrelatively enhanced CO emissions in Mexico City; in fact theambient data at the highest concentrations, which predominatelydetermine the slope in Fig. 6, indicate that Mexico City has thelowest CO to acetylene emission ratio of all five data sets. de Gouwet al. (2008) also note the relatively large difference in the CO toacetylene emission ratio between Mexico City and the most recentUS measurements.
5. Nitrogen oxide emissions
The concentration ratios of CO to nitrogen oxides illustrated inFig. 7 show much larger differences between cities than found in theNMHC and CO ratio comparisons. (The comparisons in this sectionare the most uncertain of any included in this paper, as thesemeasurements are very limited, were made by different investiga-tors using different instrumental techniques, and are more difficultto interpret for reasons discussed further below. Nevertheless, they
Fig. 5. VOC emissions from on-road vehicles in the US estimated by two emissioninventories. The 2008 US EPA emissions are from the latest (August, 2008) emissiontables posted on the website of the EPA Technology Transfer Network: Clearinghousefor Inventories & Emission Factors (http://www.epa.gov/ttn/chief/trends/index.html).The EDGAR emissions are from EDGAR 32FT2000 (van Aardenne et al., 2005) for 2000,EDGAR 3.2 (Olivier and Berdowski, 2001) for 1990 and 1995 and EDGAR-HYDE 1.3 (vanAardenne et al., 2001) for 1970, 1980 and 1990. The fossil fuel consumption emissionsof EDGAR-HYDE 1.3 were multiplied by 0.864 to bring them into agreement with the1990 on-road emissions of EDGAR 3.2.
Fig. 6. Relationship between mixing ratios of carbon monoxide and acetylene in thesame format as Fig. 1. The ‘‘best’’ average molar ratio of CO to acetylene for each dataset is taken as the slope (corrected for the difference in concentration units) of thelinear-least-squares fit to the measurements, with the y-intercept of the line forcedthrough 0.1 ppmv. Carbon monoxide measurements were not reported for the 71 UScities study; the slope for the 1982 US urban line is set equal to the CO to acetyleneratio measured in a tunnel study conducted in New York City in 1982 (Lonneman et al.,1986). The Tokyo line is derived as described for Fig. 1. The Mexico City CO data wereprovided by L.G Huey.
D.D. Parrish et al. / Atmospheric Environment 43 (2009) 6435–6441 6439

Author's personal copy
are included as preliminary indications of emission characteristics.)In the US the average urban CO to NOx concentration ratio has fallenrapidly over the last two decades (see Fig. 3 of Parrish, 2006),reaching 6.7 by 2003 (the value included in Fig. 7), and currently isbelow 5 in some cities. The CO to NOx concentration ratio in Beijingin 2005 was a factor of six larger than the 2003 US average. TheMexico City concentration ratio in 2006 was similar to the USemission ratio in the mid-1990s, and the Tokyo ratio in 2003–2004was similar to the US emission ratio in 1999.
Without careful consideration of the measurement site andmeasurement time period, it is not possible to directly equateobserved urban CO to NOx concentration ratios to emission ratios.Uncertainties arise from the different lifetimes of CO and NOx andits oxidation products. CO remains in the atmosphere for periodslong enough to be transported over regional to hemispheric scales,while NOx and even the total reactive oxidized nitrogen (NOy), isremoved on much smaller spatial scales. Thus, local urbanconcentrations of CO can be affected by upwind sources to a greaterextent than the much shorter-lived NOx or NOy. This effect appearsto influence the Beijing results much more than the other threedata sets in Fig. 7. The CO concentrations apparently have a largeregional component with concentrations often remaining elevatedfor a period of several days. This is attributed to regional pollutionevents, when emissions can build up over the entire, heavilypopulated east China region under stagnant meteorologicalconditions. Regional pollution events are not as prevalent in MexicoCity, which is relatively isolated from other major populationcenters, and in the US, where CO emissions have a much strongerlocal character as evidenced by strong morning peaks in COconcentrations due to the build-up of local pollutant emissions ina shallow, early-morning boundary layer.
The regional sources that apparently influence Beijing likelyinclude biomass burning associated with agricultural practices inthe surrounding countryside. This regional source can account forthe biomass burning suggested as a common source of CO andacetylene in the previous section. The strong contrast in Fig. 7 ofBeijing with the other cities may also reflect the larger contributionof biomass burning, compared to on-road vehicle emissions, inBeijing. Biomass burning emissions are much richer in COcompared to NOx than are vehicle emissions.
The close agreement of the Mexico City CO to NOx ratio with thatobserved in US cities in the mid-1990s can perhaps be taken as anindication that the on-road motor vehicle emission controlprograms in Mexico City in 2006 performed at about the level of theUS program in the mid-1990s. Similarly, the Tokyo program in2003–2004 was comparable to that in the US at the end of the1990s. This discussion is speculative, but the important correlatedemissions of CO and NOx are primarily due to on-road vehicleexhaust emissions. An additional variable has a strong influence onthe CO to NOx vehicle emission ratio – the proportion and drivingpatterns of heavy-duty diesel vehicles. Emissions from thesevehicles are relatively rich in NOx and poor in CO. A completeunderstanding of the relationships in Fig. 7 would require evalua-tion of both gasoline and diesel vehicle emissions in each urbanarea, and an evaluation of the contribution of each vehicle class tothe vehicle fleet.
6. Conclusions
The speciation of ambient hydrocarbon concentrations in themega-cities and other US cities examined here (Figs. 1–4) reveala large degree of similarity. This similarity spans the cities in NorthAmerica and Asia, has remained generally constant over the past 2decades in the US, and persists over wide ranges of absoluteconcentrations. A two-part hypothesis most likely explains thissimilarity. First, gasoline-fueled vehicle exhaust and the associatedevaporative gasoline emissions dominate the ambient hydrocarbonconcentrations in all of these urban areas. Second, there is no largedifference in the hydrocarbon composition of gasoline and exhaustemissions between these urban areas.
Comparison of data sets collected in US cities over the past threedecades indicates that a substantial decrease (something like anorder of magnitude) in hydrocarbon emissions has occurredeven while total distance traveled by on-road vehicles has nearlytripled. The ambient concentration data suggest that the emissiondecrease has been larger than indicated by US emission inventories,and the international EDGAR inventory does not capture anysignificant decrease. Evidently US strategies aimed towardcontrolling hydrocarbon emissions, based upon automobile cata-lytic converters, minimization of gasoline evaporation and othervehicle emission control strategies, have been very successful -indeed more successful than indicated by emission inventories.Unless the emission inventory uncertainties can be substantiallyreduced, retrospective analyses of anthropogenic influences ontropospheric composition will be uncertain to an important degree.
Emissions inventory development and extensive ambient airmonitoring programs have been important and necessary informulating air quality management programs in the US; however, itis not clear that an effort of similar magnitude need be repeated ineach mega-city. Since ambient urban NMHC concentrations areevidently strongly dependent upon vehicle exhaust and gasolineevaporation, it may well be most efficient to simply proceed withvehicular emission controls in most mega-cities before expendingthe time and expense required for emissions inventory developmentand ambient air monitoring. Indeed, vehicular emission controlmeasures can likely be expected to yield greater emissions
Fig. 7. Relationship between mixing ratios of carbon monoxide and oxides of nitrogenin the same format as Fig. 1. The ‘‘best’’ average molar ratio of CO to NOx for each dataset is taken as the slope (corrected for the difference in concentration units) of thelinear-least-squares fit to the measurements, with the y-intercept of the line forcedthrough 0.1 ppmv. In Tokyo, Mexico City and Beijing, the measured total reactiveoxidized nitrogen (NOy) measurements are plotted; NOy is a more nearly conservedmeasure of the emitted NOx than are NOx measurements themselves. The concentra-tion ratio for US cities in 2003 is taken from Fig. 3 of Parrish (2006). For Mexico City,NO data were provided by L.G. Huey and the total higher oxidized nitrogen oxides (thesum of NO2, organic nitrates and nitric acid) data were provided by R.C. Cohen.
D.D. Parrish et al. / Atmospheric Environment 43 (2009) 6435–64416440

Author's personal copy
reductions than is generally believed to be the experience in the US,since the success of US controls is underestimated in currentinventories. Additionally, of course, in any urban area with signifi-cant industrial facilities, such as Tokyo (Shirai et al., 2007) andHouston, Texas (Ryerson et al., 2003), emissions from these sourcesmust be considered in the development of control strategies.
The relationships between emissions discussed in this articleand the discussion in the preceding paragraph suggest that theIMPACT measurement program in Tokyo perhaps can providea model for characterizing emissions in developing mega-cities.This program included measurements of a limited, but carefullyselected, set of key NMHC species, plus CO, NOx and NOy, duringa few measurement periods of limited duration in differentseasons. These data sets were successfully analyzed to providedetailed information regarding the important hydrocarbon emis-sion sources in the Tokyo urban area. An approach of continuouslymeasuring a more extensive list of NMHC species at many sites inan urban area would likely provide little additional useful infor-mation, and require much greater effort. Given the usual limitationof resources, the IMPACT program provides a possible guide forformulating measurement programs in other urban areas.
Acknowledgments
The VOC data at the T1 site in Mexico City were obtained withfinancial support from NSF (grant ATM-0516610). The authorsgratefully acknowledge the assistance of W. A. Lonneman of the USEPA for providing the VOC data collected in the survey of 71 UScities conducted in the 1980s; D. R. Blake of Univ. of California,Irvine for providing the benzene data collected during the MILA-GRO campaign; L.G. Huey of Georgia Institute of Technology forproviding the NO and CO data collected during the MILAGROcampaign (supported by NSF grant ATM-0513035); R.C. Cohen andDelphine Farmer Univ. of California, Berkeley (supported by NSFgrant ATM-0511829) for providing the total higher oxidizednitrogen oxides (the sum of NO2, organic nitrates and nitric acid)measurements during the MILAGRO campaign; and Anne CaseHanks of Georgia Institute of Technology, who merged all the datafrom the MILAGRO T1 site. This analysis was supported by NOAAHealth of the Atmosphere funding.
References
van Aardenne, J.A., Dentener, F.J., Olivier, J.G.J., Klein Goldewijk, C.G.M., Lelieveld, J.,2001. A 1 � 1 degree resolution dataset of historical anthropogenic trace gasemissions for the period 1890–1990. Global Biogeochemical Cycles 15 (4),909–928.
van Aardenne, J.A., Dentener, F., Olivier, J.G.J., Peters, J.A.H.W., 2005. The EDGAR 3.2Fast Track 2000 Dataset (32FT2000) Available from: http://www.mnp.nl/edgar/Images/Description_of_EDGAR_32FT2000(v8)_tcm32-22222.pdf.
Baker, A.K., Beyersdorf, A.J., Doezema, L.A., Katzenstein, A., Meinardi, S., Simpson, I.J.,Blake, D.R., Rowland, F.S., 2008. Measurements of nonmethane hydrocarbons in28 United States cities. Atmos. Environ. 42, 170–182.
Cox, P., Delao A., , Komorniczak A., Weller R., 2009. The California Almanac ofemissions and air quality-2009 edition, California Air Resources Board.
Fortin, T.J., Howard, B.J., Parrish, D.D., Goldan, P.D., Kuster, W.C., Atlas, E.L.,Harley, R.A., 2005. Temporal changes in U.S. benzene emissions inferred fromatmospheric measurements. Environ. Sci. Technol. 39, 1403–1408. doi:10.1021/es049316n.
Friedrich, R., Obermeier, A., 1999. Anthropogenic emissions of volatile organiccompounds. In: Hewitt, C.N. (Ed.), Reactive Hydrocarbons in the Atmosphere.Academic Press, San Diego, California, USA, pp. 1–39.
de Gouw, J.A., et al., 2004. Chemical composition of air masses transported fromAsia to the U.S. West Coast during ITCT 2K2: fossil fuel combustion versusbiomass-burning signatures. J. Geophys. Res. 109, D23S20. doi:10.1029/2003JD004202.
de Gouw, J.A., et al., 2005. Budget of organic carbon in a polluted atmosphere:results from the New England air quality study in 2002. J. Geophys. Res. 110,D16305. doi:10.1029/2004JD005623.
de Gouw, J.A., et al., 2008. Emission and chemistry of organic carbon in the gas andaerosol phase at a sub-urban site near Mexico City in March 2006 during theMILAGRO study. Atmos. Chem. Phys. Discuss. 8, 21265–21312. www.atmos-chem-phys-discuss.net/8/21265/2008/.
Jobson, B.T., Berkowitz, C.M., Kuster, W.C., Goldan, P.D., Williams, E.J., Fesenfeld, F.C.,Apel, E.C., Karl, T., Lonneman, W.A., Riemer, D., 2004. Hydrocarbon sourcesignatures in Houston, Texas: influence of the petrochemical industry.J. Geophys. Res. 109, D24305. doi:10.1029/2004JD004887.
Kondo, Y., 2008. Studies on aerosol and ozone in Tokyo. IGACtivities Newsletter 38,30–38.
Lonneman, W.A., Seila, R.L., Meeks, S.A., 1986. Non-methane organic composition inthe Lincoln Tunnel. Environ. Sci. Technol. 20, 790–796.
Mayrsohn, H., Kuramoto, M., Crabtree, J.H., Sothern, R.D., Mano, S.H., 1976.Atmospheric Hydrocarbon Concentrations: June–September, 1975. State ofCalifornia Air Resources Board, El Monte, Calif.
Molina, Y., Madronich, S., Gaffney, J.S., Singh, H.B., 2008. Overview of MILAGRO/INTEX-B campaign. IGACtivities Newsletter 38, 2–15.
Olivier, J.G.J., Berdowski, J.J.M., 2001. Global emissions sources and sinks. In:Berdowski, J., Guicherit, R., Heij, B.J. (Eds.), The Climate System. A.A. BalkemaPublishers/Swets & Zeitlinger Publishers, Lisse, The Netherlands, ISBN 90 5809255 0, pp. 33–78.
Parrish, D.D., 2006. Critical evaluation of US on-road vehicle emission inventories.Atmos. Environ. 40, 2288–2300.
Parrish, D.D., et al., 1998. Internal consistency tests for evaluation of measurementsof anthropogenic hydrocarbons in the troposphere. J. Geophys. Res. 103 (D17),22339–22359.
Ryerson, T.B., et al., 2003. Effect of petrochemical industrial emissions of reactivealkenes and NOx on tropospheric ozone formation in Houston, Texas.J. Geophys. Res. 108 (D8), 4249. doi:10.1029/2002JD003070.
Seila, R.L., Lonneman, W.A., Meeks, S.A., 1989. Project Summary: Determination ofC2 to C12 Ambient Air Hydrocarbons in 39 U.S. Cities, from 1984 through 1986,EPA Rep. EPA/600/S3-89/058. Environ. Prot. Agency, Washington, D. C.
Shirai, T., Yokouchi, Y., Blake, D.R., Kita, K., Izumi, K., Koike, M., Komazaki, Y.,Miyazaki, Y., Fukuda, M., Kondo, Y., 2007. Seasonal variations of atmosphericC2–C7 nonmethane hydrocarbons in Tokyo. J. Geophys. Res. 112, D24305.doi:10.1029/2006JD008163.
Song, Y., Shao, M., Liu, Y., Lu, S., Kuster, W., Goldan, P., Xie, S., 2007. Source appor-tionment of ambient volatile organic compounds in Beijing. Environ. Sci.Technol. 41, 4348–4353.
Warneke, C., et al., 2007. Determination of urban volatile organic compoundemission ratios and comparison with an emissions database. J. Geophys. Res.112, D10S47. doi:10.1029/2006JD007930.
Welsh-Bon, D., de Gouw, J.A., Warneke, C., Kuster, W.C. Online VOC measurementsat a suburban ground site (T1) in Mexico City during the MILAGRO 2006campaign: measurement, validation, source apportionment, and estimation ofemission ratios. Atmos. Chem. Phys. Discuss., in preparation.
D.D. Parrish et al. / Atmospheric Environment 43 (2009) 6435–6441 6441