comparison and implications from strikingly different authigenic carbonates in a nyegga complex...
TRANSCRIPT
(2006) 89–102www.elsevier.com/locate/margeo
Marine Geology 231
Comparison and implications from strikingly differentauthigenic carbonates in a Nyegga complex
pockmark, G11, Norwegian Sea
Adriano Mazzini a,⁎, Henrik Svensen a, Martin Hovland b, Sverre Planke a,c
a Physics of Geological Processes (PGP), University of Oslo, PO Box 1048, Blindern, Norwayb Statoil, 4035 Stavanger, Norway
c Volcanic Basin Petroleum Research (VBPR), Oslo Research Park, 0349 Oslo, Norway
Received 14 November 2005; received in revised form 31 March 2006; accepted 30 May 2006
Abstract
Authigenic carbonates sampled in a complex pockmark (G11) from the Nyegga area, south western Vøring Basin, revealstrikingly different morphologies. A comparative study of macro and micro features of these neighbouring samples was approachedin order to attempt a reconstruction of the pockmark dynamics. The carbonate morphologies include thin (∼1 cm) platy carbonatecrusts, blocky and massive carbonate ridges up to several metres in size, and irregularly shaped carbonate deposits consisting ofinterconnected tubular and uneven intervals displaying high porosity. Our observations indicate that three distinct mechanisms offluid seepage and carbonate precipitation occurred within the pockmark. Petrography studies reveal that the samples contain threegenerations of predominantly aragonitic cements. In addition, zoned crystals with coexisting Mg-calcite and dolomite are abundantin one sample suggesting a trend of gradual increase of the sulphate concentrations in the pore fluids during carbonate precipitation.Isotope measurements on bulk carbonate cements show consistent values with δ13C as low as −52.1‰, δ18O as high as 6.4‰, and87/86Sr of 0.7092. Anaerobic oxidation of methane close to seafloor conditions can explain these isotope data. The carbonates havea common carbon source despite the differences in morphology. Methane probably originated from the dissolution of gas hydratesas supported from calculated 18O enrichment in the pore fluids and the methanogenic carbon. We propose a model where thedifferences in bulk carbonate morphology are related to local sediment properties, depth of carbonate precipitation and the flow rateof the seeping fluids.© 2006 Elsevier B.V. All rights reserved.
Keywords: hydrocarbon seepage; gas hydrates; pockmark; carbonates; Vøring Plateau
1. Introduction
The precipitation of authigenic carbonates at fluidseepage sites is a common phenomenon that can be trig-
⁎ Corresponding author.E-mail address: [email protected] (A. Mazzini).
0025-3227/$ - see front matter © 2006 Elsevier B.V. All rights reserved.doi:10.1016/j.margeo.2006.05.012
gered by the activity of a consortium of archaea andbacteria that oxidize methane close to the seafloor (e.g.Boetius et al., 2000) or that can occur due to chemicalreactions (i.e. without microbial mediation). Such carbon-ate deposits reveal different morphologies depending oncombined internal (seepage-related) and external (setting-related) factors. Internal factors include the composition
90 A. Mazzini et al. / Marine Geology 231 (2006) 89–102
and the flux of the seeping fluids, and the type of bio-logical ongoing activity. External factors are the geolog-ical setting of the seepage area, the characteristics of thesediment flushed by fluids and finally the ongoing localerosion. The various carbonate shapes observed compriseexposed and buried mineralised doughnuts and chimneysfrom centimetre to metre-scale (e.g. Kulm and Suess,1990; Aiello et al., 2001; Diaz-del-Rio et al., 2003;Mazzini et al., 2003), cemented fluid conduits and veins(Clari and Martire, 2000), concretions and micro- andmacro-slabs laterally extensive on mud volcano surfaces(Aloisi et al., 2000; Mazzini et al., 2004), cementedsedimentary layers (Hovland et al., 1985; Hovland andJudd, 1988), build-ups of chemical authigenic carbonateand calcareous skeletal debris of chemosymbiotic fauna,or so called chemoherms (Beauchamp and Savard, 1992;Aharon, 1994; Clari et al., 1994; Mazzini et al., 2005)typically found on the seafloor or at shallow depths belowthe sediment–water interface.
Recently, both industry and academic cruises (e.g.Training Through Research program, TTR) investigatedthe Norwegian Sea focussing on the north-eastern flank ofthe Storegga Slide. Results documented authigenic seepcarbonates in pockmarks showing a range of differentmorphologies (Kenyon et al., 1999; Kenyon et al., 2001;Hovland et al., 2005). Their formation could be related todestabilizing gas hydrates (Hovland et al., 2005; Mazziniet al., 2005; Hovland and Svensen, 2006). However, thedynamics of these systems are poorly understood, bothregarding pockmark formation (explosive versus effu-sive), source of methane (thermogenic versus biogenic),reason for overpressure (gas generation versus loading),and timescale for seeps (active versus extinct).
In this paper we focus on the complex pockmark,G11, where differing carbonates samples were collected(Hovland et al., 2005). The relationship between fluidflows, local sediment properties, and carbonate mor-phologies, are investigated by a detailed structural, geo-chemical and mineralogical study of the carbonates. Theorigin of the fluids and the possible evidence of gashydrates dissociation will be discussed combining dataalready published with the new results obtained.
2. Methods
Two detailed surveys in 2003–2004were completed inthe Nyegga area (Fig. 1) focussing on the G11 pockmark(∼N 64° 40′ 2ʺ, ∼E 05° 17′ 32ʺ) including geophysicalmapping, sea floor imaging, and seabed sampling using aDeepOcean ROV ‘HiRov6’-system (see Hovland et al.,2005 for details). Three different types of carbonate de-posits were sampled with the ROV's grabber arms.
Thin sections of three carbonate samples (G11-A–C)were studied using both optical and electronic micro-scopes, including UV light, secondary electron andbackscattered electron modes. Microprobe analysis (53data points) of calcite, aragonite and dolomite was donewith a CAMECA SX 100 electron microprobe. X-raydiffraction analyses were performed on bulk carbonatesamples to determine the dominant carbonate phase.
One of the samples (G11-C) was imaged using a GELightspeed Ultra CT 99_OC0 spiral computed tomog-raphy scanner, with an 8 sensor system. The thickness ofthe scanned slices was 0.625 mm, and more than 500scans were made throughout the sample.
Carbon, oxygen, and strontium isotopic analyses werecompleted on carbonate samples. Carbonate cements wereground and digested with a 0.1 ml 100% H3PO4 solutionfor two hours at 30.0 °C in a vacuumed environment. Thereleased CO2 was transferred to a FinniganMATDeltaXPisotope ratiomass spectrometer (IRMS), for determinationof δ13C and δ18O. The analyses were controlled by housestandards of calcite and aragonite. Results are reported in‰ relative to the PDB standard. The precision for δ13Cis ±0.1‰ and for δ18O ±0.2‰. Bulk crushed samples(10–20 mg) were used for Sr isotope analysis. The iso-topic composition of Sr was determined by thermal ion-ization mass spectrometry (TIMS) on a Finnigan MAT261.
3. Geological setting
The Nyegga region is located on the edge of theNorwegian continental slope (Fig. 1) on the borderbetween two large sedimentary basins: the Møre Basin tothe south and theVøringBasin to the north (Brekke, 2000;Bünz et al., 2003). This region developed as a result ofseveral rifting episodes leading to Late Paleocene/EarlyEocene continental break-up and thermal subsidence(Skogseid and Eldholm, 1989; Brekke, 2000). Severaldome-shaped structures, representing contraction struc-tures of Late Eocene and Mid Miocene age, occur on thismargin and are known to be potential traps forhydrocarbon reservoirs, such as the Ormen Lange domesouth of Nyegga (Dore and Lundin, 1996; Vågnes et al.,1998). The seafloor of the Nyegga region is generallysmooth, and consists of Plio–Pleistocene contourites andglacial–interglacial silty/clayey hemipelagic sediments ofthe Naust Formation which are acoustically parallellayered (Stuevold and Eldholm, 1996; Hjelstuen et al.,1999), covering the Miocene–Pliocene Kai Formationconsisting of hemipelagic oozes faulted by polygonalsystems (Rokoengen et al., 1995; Bünz et al., 2003). Tothe south, the giant retrogressive submarine Storegga
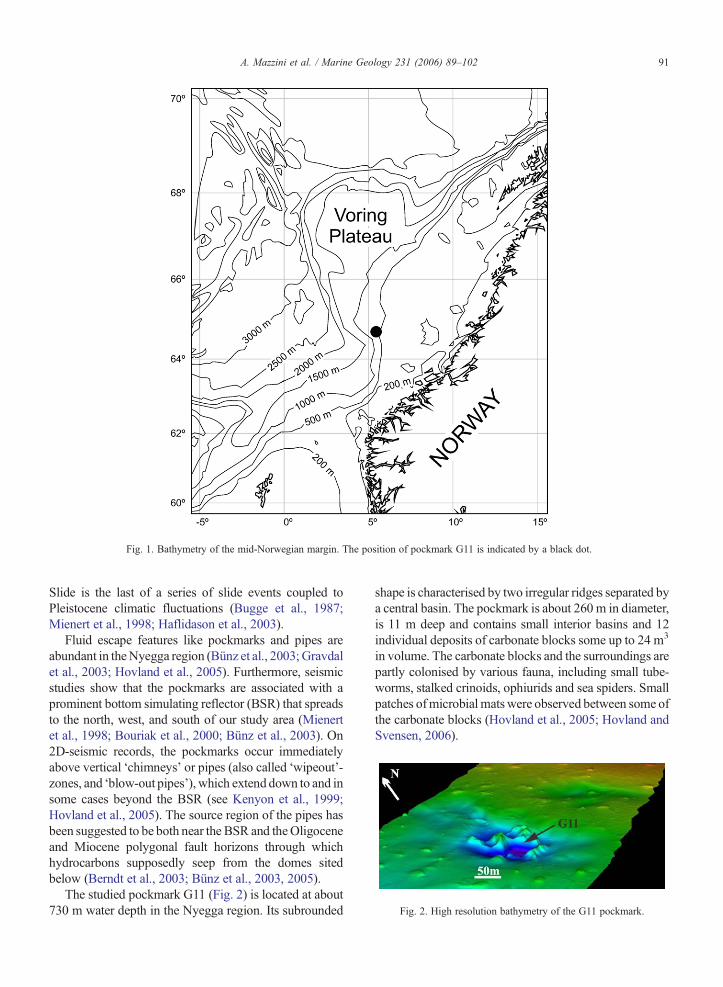
Fig. 1. Bathymetry of the mid-Norwegian margin. The position of pockmark G11 is indicated by a black dot.
Fig. 2. High resolution bathymetry of the G11 pockmark.
91A. Mazzini et al. / Marine Geology 231 (2006) 89–102
Slide is the last of a series of slide events coupled toPleistocene climatic fluctuations (Bugge et al., 1987;Mienert et al., 1998; Haflidason et al., 2003).
Fluid escape features like pockmarks and pipes areabundant in theNyegga region (Bünz et al., 2003; Gravdalet al., 2003; Hovland et al., 2005). Furthermore, seismicstudies show that the pockmarks are associated with aprominent bottom simulating reflector (BSR) that spreadsto the north, west, and south of our study area (Mienertet al., 1998; Bouriak et al., 2000; Bünz et al., 2003). On2D-seismic records, the pockmarks occur immediatelyabove vertical ‘chimneys’ or pipes (also called ‘wipeout’-zones, and ‘blow-out pipes’), which extend down to and insome cases beyond the BSR (see Kenyon et al., 1999;Hovland et al., 2005). The source region of the pipes hasbeen suggested to be both near the BSR and theOligoceneand Miocene polygonal fault horizons through whichhydrocarbons supposedly seep from the domes sitedbelow (Berndt et al., 2003; Bünz et al., 2003, 2005).
The studied pockmark G11 (Fig. 2) is located at about730 m water depth in the Nyegga region. Its subrounded
shape is characterised by two irregular ridges separated bya central basin. The pockmark is about 260 m in diameter,is 11 m deep and contains small interior basins and 12individual deposits of carbonate blocks some up to 24 m3
in volume. The carbonate blocks and the surroundings arepartly colonised by various fauna, including small tube-worms, stalked crinoids, ophiurids and sea spiders. Smallpatches ofmicrobial matswere observed between some ofthe carbonate blocks (Hovland et al., 2005; Hovland andSvensen, 2006).
92 A. Mazzini et al. / Marine Geology 231 (2006) 89–102
4. Results
4.1. Macroscopic and petrography observations oncarbonates
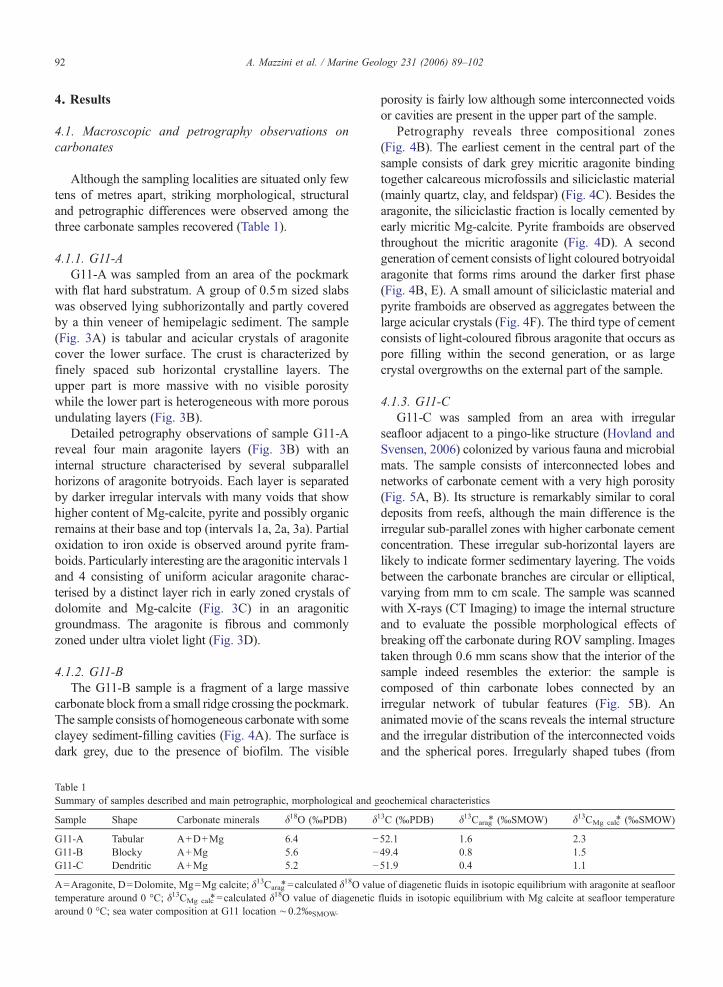
Although the sampling localities are situated only fewtens of metres apart, striking morphological, structuraland petrographic differences were observed among thethree carbonate samples recovered (Table 1).
4.1.1. G11-AG11-A was sampled from an area of the pockmark
with flat hard substratum. A group of 0.5m sized slabswas observed lying subhorizontally and partly coveredby a thin veneer of hemipelagic sediment. The sample(Fig. 3A) is tabular and acicular crystals of aragonitecover the lower surface. The crust is characterized byfinely spaced sub horizontal crystalline layers. Theupper part is more massive with no visible porositywhile the lower part is heterogeneous with more porousundulating layers (Fig. 3B).
Detailed petrography observations of sample G11-Areveal four main aragonite layers (Fig. 3B) with aninternal structure characterised by several subparallelhorizons of aragonite botryoids. Each layer is separatedby darker irregular intervals with many voids that showhigher content of Mg-calcite, pyrite and possibly organicremains at their base and top (intervals 1a, 2a, 3a). Partialoxidation to iron oxide is observed around pyrite fram-boids. Particularly interesting are the aragonitic intervals 1and 4 consisting of uniform acicular aragonite charac-terised by a distinct layer rich in early zoned crystals ofdolomite and Mg-calcite (Fig. 3C) in an aragoniticgroundmass. The aragonite is fibrous and commonlyzoned under ultra violet light (Fig. 3D).
4.1.2. G11-BThe G11-B sample is a fragment of a large massive
carbonate block from a small ridge crossing the pockmark.The sample consists of homogeneous carbonate with someclayey sediment-filling cavities (Fig. 4A). The surface isdark grey, due to the presence of biofilm. The visible
Table 1Summary of samples described and main petrographic, morphological and g
Sample Shape Carbonate minerals δ18O (‰PDB) δ
G11-A Tabular A+D+Mg 6.4 −G11-B Blocky A+Mg 5.6 −G11-C Dendritic A+Mg 5.2 −
A=Aragonite, D=Dolomite, Mg=Mg calcite; δ13Carag⁎=calculated δ18O valu
temperature around 0 °C; δ13CMg calc⁎=calculated δ18O value of diagenetic
around 0 °C; sea water composition at G11 location ∼0.2‰SMOW.
porosity is fairly low although some interconnected voidsor cavities are present in the upper part of the sample.
Petrography reveals three compositional zones(Fig. 4B). The earliest cement in the central part of thesample consists of dark grey micritic aragonite bindingtogether calcareous microfossils and siliciclastic material(mainly quartz, clay, and feldspar) (Fig. 4C). Besides thearagonite, the siliciclastic fraction is locally cemented byearly micritic Mg-calcite. Pyrite framboids are observedthroughout the micritic aragonite (Fig. 4D). A secondgeneration of cement consists of light coloured botryoidalaragonite that forms rims around the darker first phase(Fig. 4B, E). A small amount of siliciclastic material andpyrite framboids are observed as aggregates between thelarge acicular crystals (Fig. 4F). The third type of cementconsists of light-coloured fibrous aragonite that occurs aspore filling within the second generation, or as largecrystal overgrowths on the external part of the sample.
4.1.3. G11-CG11-C was sampled from an area with irregular
seafloor adjacent to a pingo-like structure (Hovland andSvensen, 2006) colonized by various fauna and microbialmats. The sample consists of interconnected lobes andnetworks of carbonate cement with a very high porosity(Fig. 5A, B). Its structure is remarkably similar to coraldeposits from reefs, although the main difference is theirregular sub-parallel zones with higher carbonate cementconcentration. These irregular sub-horizontal layers arelikely to indicate former sedimentary layering. The voidsbetween the carbonate branches are circular or elliptical,varying from mm to cm scale. The sample was scannedwith X-rays (CT Imaging) to image the internal structureand to evaluate the possible morphological effects ofbreaking off the carbonate during ROV sampling. Imagestaken through 0.6 mm scans show that the interior of thesample indeed resembles the exterior: the sample iscomposed of thin carbonate lobes connected by anirregular network of tubular features (Fig. 5B). Ananimated movie of the scans reveals the internal structureand the irregular distribution of the interconnected voidsand the spherical pores. Irregularly shaped tubes (from
eochemical characteristics13C (‰PDB) δ13Carag
⁎ (‰SMOW) δ13CMg calc⁎ (‰SMOW)
52.1 1.6 2.349.4 0.8 1.551.9 0.4 1.1
e of diagenetic fluids in isotopic equilibrium with aragonite at seafloorfluids in isotopic equilibrium with Mg calcite at seafloor temperature
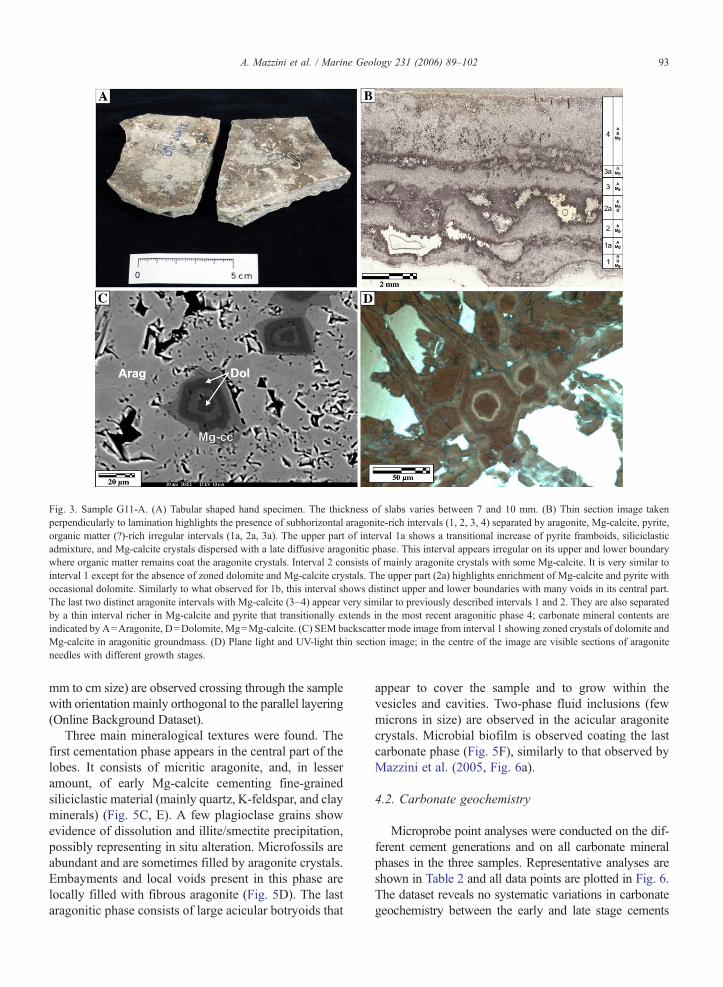
Fig. 3. Sample G11-A. (A) Tabular shaped hand specimen. The thickness of slabs varies between 7 and 10 mm. (B) Thin section image takenperpendicularly to lamination highlights the presence of subhorizontal aragonite-rich intervals (1, 2, 3, 4) separated by aragonite, Mg-calcite, pyrite,organic matter (?)-rich irregular intervals (1a, 2a, 3a). The upper part of interval 1a shows a transitional increase of pyrite framboids, siliciclasticadmixture, and Mg-calcite crystals dispersed with a late diffusive aragonitic phase. This interval appears irregular on its upper and lower boundarywhere organic matter remains coat the aragonite crystals. Interval 2 consists of mainly aragonite crystals with some Mg-calcite. It is very similar tointerval 1 except for the absence of zoned dolomite and Mg-calcite crystals. The upper part (2a) highlights enrichment of Mg-calcite and pyrite withoccasional dolomite. Similarly to what observed for 1b, this interval shows distinct upper and lower boundaries with many voids in its central part.The last two distinct aragonite intervals with Mg-calcite (3–4) appear very similar to previously described intervals 1 and 2. They are also separatedby a thin interval richer in Mg-calcite and pyrite that transitionally extends in the most recent aragonitic phase 4; carbonate mineral contents areindicated by A=Aragonite, D=Dolomite, Mg=Mg-calcite. (C) SEM backscatter mode image from interval 1 showing zoned crystals of dolomite andMg-calcite in aragonitic groundmass. (D) Plane light and UV-light thin section image; in the centre of the image are visible sections of aragoniteneedles with different growth stages.
93A. Mazzini et al. / Marine Geology 231 (2006) 89–102
mm to cm size) are observed crossing through the samplewith orientation mainly orthogonal to the parallel layering(Online Background Dataset).
Three main mineralogical textures were found. Thefirst cementation phase appears in the central part of thelobes. It consists of micritic aragonite, and, in lesseramount, of early Mg-calcite cementing fine-grainedsiliciclastic material (mainly quartz, K-feldspar, and clayminerals) (Fig. 5C, E). A few plagioclase grains showevidence of dissolution and illite/smectite precipitation,possibly representing in situ alteration. Microfossils areabundant and are sometimes filled by aragonite crystals.Embayments and local voids present in this phase arelocally filled with fibrous aragonite (Fig. 5D). The lastaragonitic phase consists of large acicular botryoids that
appear to cover the sample and to grow within thevesicles and cavities. Two-phase fluid inclusions (fewmicrons in size) are observed in the acicular aragonitecrystals. Microbial biofilm is observed coating the lastcarbonate phase (Fig. 5F), similarly to that observed byMazzini et al. (2005, Fig. 6a).
4.2. Carbonate geochemistry
Microprobe point analyses were conducted on the dif-ferent cement generations and on all carbonate mineralphases in the three samples. Representative analyses areshown in Table 2 and all data points are plotted in Fig. 6.The dataset reveals no systematic variations in carbonategeochemistry between the early and late stage cements
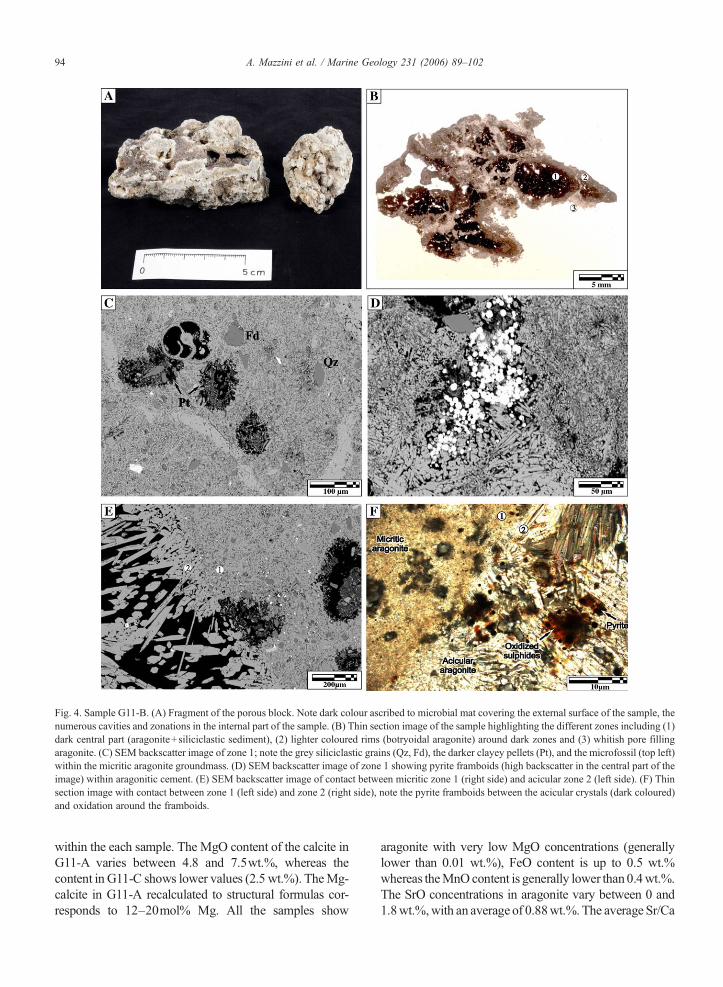
Fig. 4. Sample G11-B. (A) Fragment of the porous block. Note dark colour ascribed to microbial mat covering the external surface of the sample, thenumerous cavities and zonations in the internal part of the sample. (B) Thin section image of the sample highlighting the different zones including (1)dark central part (aragonite+siliciclastic sediment), (2) lighter coloured rims (botryoidal aragonite) around dark zones and (3) whitish pore fillingaragonite. (C) SEM backscatter image of zone 1; note the grey siliciclastic grains (Qz, Fd), the darker clayey pellets (Pt), and the microfossil (top left)within the micritic aragonite groundmass. (D) SEM backscatter image of zone 1 showing pyrite framboids (high backscatter in the central part of theimage) within aragonitic cement. (E) SEM backscatter image of contact between micritic zone 1 (right side) and acicular zone 2 (left side). (F) Thinsection image with contact between zone 1 (left side) and zone 2 (right side), note the pyrite framboids between the acicular crystals (dark coloured)and oxidation around the framboids.
94 A. Mazzini et al. / Marine Geology 231 (2006) 89–102
within the each sample. The MgO content of the calcite inG11-A varies between 4.8 and 7.5wt.%, whereas thecontent in G11-C shows lower values (2.5 wt.%). TheMg-calcite in G11-A recalculated to structural formulas cor-responds to 12–20mol% Mg. All the samples show
aragonite with very low MgO concentrations (generallylower than 0.01 wt.%), FeO content is up to 0.5 wt.%whereas theMnOcontent is generally lower than0.4wt.%.The SrO concentrations in aragonite vary between 0 and1.8wt.%,with an average of 0.88wt.%. The average Sr/Ca
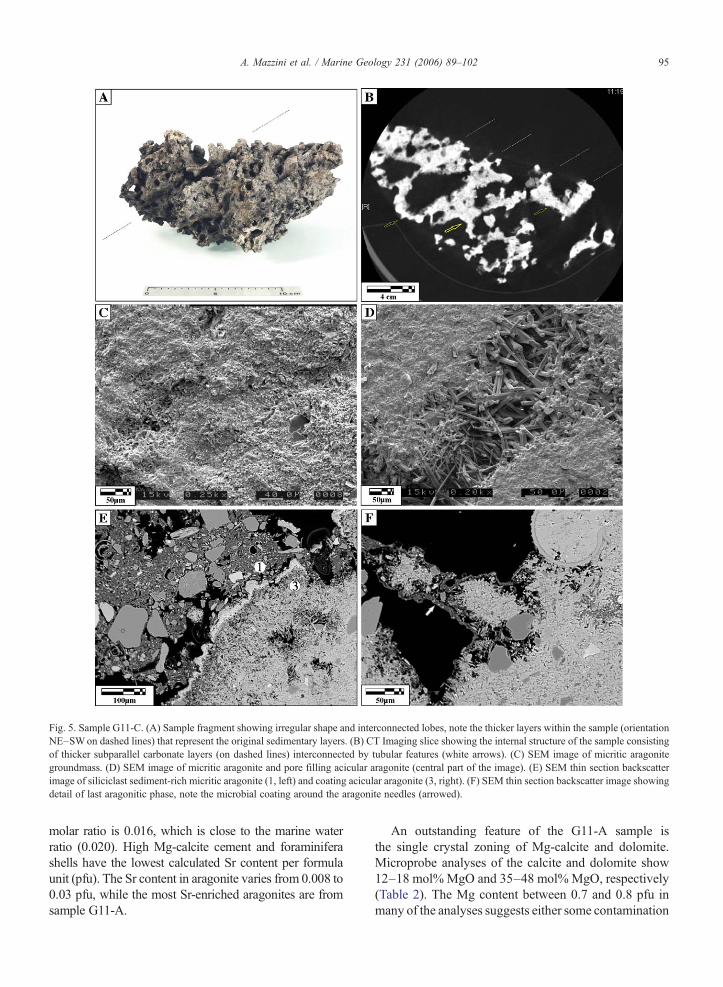
Fig. 5. Sample G11-C. (A) Sample fragment showing irregular shape and interconnected lobes, note the thicker layers within the sample (orientationNE–SWon dashed lines) that represent the original sedimentary layers. (B) CT Imaging slice showing the internal structure of the sample consistingof thicker subparallel carbonate layers (on dashed lines) interconnected by tubular features (white arrows). (C) SEM image of micritic aragonitegroundmass. (D) SEM image of micritic aragonite and pore filling acicular aragonite (central part of the image). (E) SEM thin section backscatterimage of siliciclast sediment-rich micritic aragonite (1, left) and coating acicular aragonite (3, right). (F) SEM thin section backscatter image showingdetail of last aragonitic phase, note the microbial coating around the aragonite needles (arrowed).
95A. Mazzini et al. / Marine Geology 231 (2006) 89–102
molar ratio is 0.016, which is close to the marine waterratio (0.020). High Mg-calcite cement and foraminiferashells have the lowest calculated Sr content per formulaunit (pfu). The Sr content in aragonite varies from 0.008 to0.03 pfu, while the most Sr-enriched aragonites are fromsample G11-A.
An outstanding feature of the G11-A sample isthe single crystal zoning of Mg-calcite and dolomite.Microprobe analyses of the calcite and dolomite show12–18 mol%MgO and 35–48 mol%MgO, respectively(Table 2). The Mg content between 0.7 and 0.8 pfu inmany of the analyses suggests either some contamination
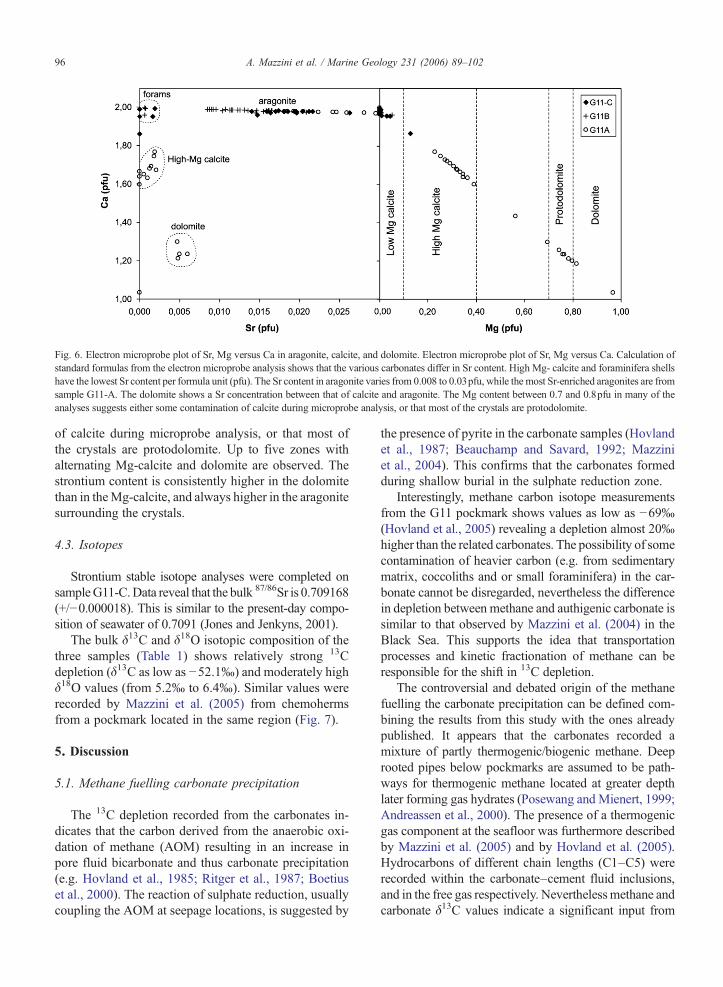
Fig. 6. Electron microprobe plot of Sr, Mg versus Ca in aragonite, calcite, and dolomite. Electron microprobe plot of Sr, Mg versus Ca. Calculation ofstandard formulas from the electron microprobe analysis shows that the various carbonates differ in Sr content. High Mg- calcite and foraminifera shellshave the lowest Sr content per formula unit (pfu). The Sr content in aragonite varies from 0.008 to 0.03pfu, while the most Sr-enriched aragonites are fromsample G11-A. The dolomite shows a Sr concentration between that of calcite and aragonite. The Mg content between 0.7 and 0.8pfu in many of theanalyses suggests either some contamination of calcite during microprobe analysis, or that most of the crystals are protodolomite.
96 A. Mazzini et al. / Marine Geology 231 (2006) 89–102
of calcite during microprobe analysis, or that most ofthe crystals are protodolomite. Up to five zones withalternating Mg-calcite and dolomite are observed. Thestrontium content is consistently higher in the dolomitethan in theMg-calcite, and always higher in the aragonitesurrounding the crystals.
4.3. Isotopes
Strontium stable isotope analyses were completed onsampleG11-C.Data reveal that the bulk 87/86Sr is 0.709168(+/−0.000018). This is similar to the present-day compo-sition of seawater of 0.7091 (Jones and Jenkyns, 2001).
The bulk δ13C and δ18O isotopic composition of thethree samples (Table 1) shows relatively strong 13Cdepletion (δ13C as low as −52.1‰) and moderately highδ18O values (from 5.2‰ to 6.4‰). Similar values wererecorded by Mazzini et al. (2005) from chemohermsfrom a pockmark located in the same region (Fig. 7).
5. Discussion
5.1. Methane fuelling carbonate precipitation
The 13C depletion recorded from the carbonates in-dicates that the carbon derived from the anaerobic oxi-dation of methane (AOM) resulting in an increase inpore fluid bicarbonate and thus carbonate precipitation(e.g. Hovland et al., 1985; Ritger et al., 1987; Boetiuset al., 2000). The reaction of sulphate reduction, usuallycoupling the AOM at seepage locations, is suggested by
the presence of pyrite in the carbonate samples (Hovlandet al., 1987; Beauchamp and Savard, 1992; Mazziniet al., 2004). This confirms that the carbonates formedduring shallow burial in the sulphate reduction zone.
Interestingly, methane carbon isotope measurementsfrom the G11 pockmark shows values as low as −69‰(Hovland et al., 2005) revealing a depletion almost 20‰higher than the related carbonates. The possibility of somecontamination of heavier carbon (e.g. from sedimentarymatrix, coccoliths and or small foraminifera) in the car-bonate cannot be disregarded, nevertheless the differencein depletion between methane and authigenic carbonate issimilar to that observed by Mazzini et al. (2004) in theBlack Sea. This supports the idea that transportationprocesses and kinetic fractionation of methane can beresponsible for the shift in 13C depletion.
The controversial and debated origin of the methanefuelling the carbonate precipitation can be defined com-bining the results from this study with the ones alreadypublished. It appears that the carbonates recorded amixture of partly thermogenic/biogenic methane. Deeprooted pipes below pockmarks are assumed to be path-ways for thermogenic methane located at greater depthlater forming gas hydrates (Posewang and Mienert, 1999;Andreassen et al., 2000). The presence of a thermogenicgas component at the seafloor was furthermore describedby Mazzini et al. (2005) and by Hovland et al. (2005).Hydrocarbons of different chain lengths (C1–C5) wererecorded within the carbonate–cement fluid inclusions,and in the free gas respectively. Neverthelessmethane andcarbonate δ13C values indicate a significant input from
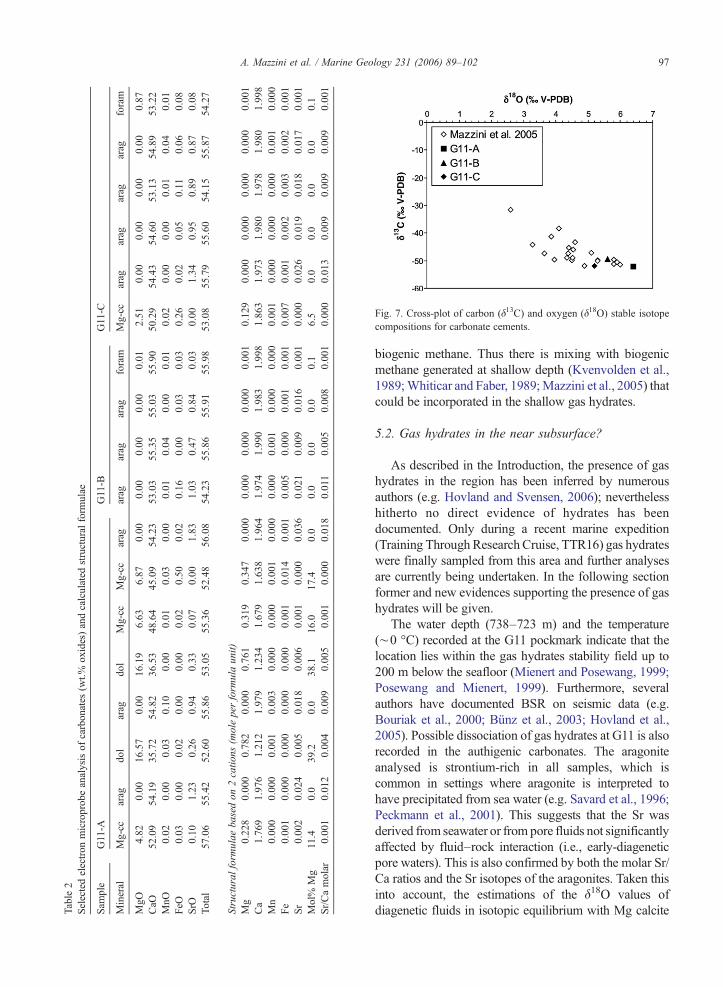
Table2
Selectedelectron
microprobeanalysisof
carbonates
(wt.%
oxides)andcalculated
structural
form
ulae
Sam
ple
G11-A
G11-B
G11-C
Mineral
Mg-cc
arag
dol
arag
dol
Mg-cc
Mg-cc
arag
arag
arag
arag
foram
Mg-cc
arag
arag
arag
arag
foram
MgO
4.82
0.00
16.57
0.00
16.19
6.63
6.87
0.00
0.00
0.00
0.00
0.01
2.51
0.00
0.00
0.00
0.00
0.87
CaO
52.09
54.19
35.72
54.82
36.53
48.64
45.09
54.23
53.03
55.35
55.03
55.90
50.29
54.43
54.60
53.13
54.89
53.22
MnO
0.02
0.00
0.03
0.10
0.00
0.01
0.03
0.00
0.01
0.04
0.00
0.01
0.02
0.00
0.00
0.01
0.04
0.01
FeO
0.03
0.00
0.02
0.00
0.00
0.02
0.50
0.02
0.16
0.00
0.03
0.03
0.26
0.02
0.05
0.11
0.06
0.08
SrO
0.10
1.23
0.26
0.94
0.33
0.07
0.00
1.83
1.03
0.47
0.84
0.03
0.00
1.34
0.95
0.89
0.87
0.08
Total
57.06
55.42
52.60
55.86
53.05
55.36
52.48
56.08
54.23
55.86
55.91
55.98
53.08
55.79
55.60
54.15
55.87
54.27
Structural
form
ulae
basedon
2catio
ns(m
oleperform
ulaun
it)Mg
0.228
0.000
0.782
0.00
00.76
10.319
0.347
0.000
0.00
00.00
00.000
0.001
0.129
0.000
0.00
00.000
0.000
0.001
Ca
1.769
1.976
1.212
1.97
91.23
41.679
1.638
1.964
1.97
41.99
01.983
1.998
1.863
1.973
1.98
01.978
1.980
1.998
Mn
0.000
0.000
0.001
0.00
30.00
00.000
0.001
0.000
0.00
00.00
10.000
0.000
0.001
0.000
0.00
00.000
0.001
0.000
Fe
0.001
0.000
0.000
0.00
00.00
00.001
0.014
0.001
0.00
50.00
00.001
0.001
0.007
0.001
0.00
20.003
0.002
0.001
Sr
0.002
0.024
0.005
0.01
80.00
60.001
0.000
0.036
0.02
10.00
90.016
0.001
0.000
0.026
0.01
90.018
0.017
0.001
Mol%
Mg
11.4
0.0
39.2
0.0
38.1
16.0
17.4
0.0
0.0
0.0
0.0
0.1
6.5
0.0
0.0
0.0
0.0
0.1
Sr/Camolar
0.001
0.012
0.004
0.00
90.00
50.001
0.000
0.018
0.011
0.00
50.008
0.001
0.000
0.013
0.00
90.009
0.009
0.001
Fig. 7. Cross-plot of carbon (δ13C) and oxygen (δ18O) stable isotopecompositions for carbonate cements.
97A. Mazzini et al. / Marine Geology 231 (2006) 89–102
biogenic methane. Thus there is mixing with biogenicmethane generated at shallow depth (Kvenvolden et al.,1989;Whiticar and Faber, 1989;Mazzini et al., 2005) thatcould be incorporated in the shallow gas hydrates.
5.2. Gas hydrates in the near subsurface?
As described in the Introduction, the presence of gashydrates in the region has been inferred by numerousauthors (e.g. Hovland and Svensen, 2006); neverthelesshitherto no direct evidence of hydrates has beendocumented. Only during a recent marine expedition(Training Through ResearchCruise, TTR16) gas hydrateswere finally sampled from this area and further analysesare currently being undertaken. In the following sectionformer and new evidences supporting the presence of gashydrates will be given.
The water depth (738–723 m) and the temperature(∼0 °C) recorded at the G11 pockmark indicate that thelocation lies within the gas hydrates stability field up to200 m below the seafloor (Mienert and Posewang, 1999;Posewang and Mienert, 1999). Furthermore, severalauthors have documented BSR on seismic data (e.g.Bouriak et al., 2000; Bünz et al., 2003; Hovland et al.,2005). Possible dissociation of gas hydrates at G11 is alsorecorded in the authigenic carbonates. The aragoniteanalysed is strontium-rich in all samples, which iscommon in settings where aragonite is interpreted tohave precipitated from sea water (e.g. Savard et al., 1996;Peckmann et al., 2001). This suggests that the Sr wasderived from seawater or from pore fluids not significantlyaffected by fluid–rock interaction (i.e., early-diageneticpore waters). This is also confirmed by both the molar Sr/Ca ratios and the Sr isotopes of the aragonites. Taken thisinto account, the estimations of the δ18O values ofdiagenetic fluids in isotopic equilibrium with Mg calcite
98 A. Mazzini et al. / Marine Geology 231 (2006) 89–102
and aragonite at seafloor temperature have been calculatedapplying respectively the Friedman and O'Neil (1977)Grossman andKu (1986) equation (Table 1). These valuesare greater than the 0.2‰SMOW, present value of Nyeggaregion bottom water (Tchernia, 1978), indicating that thecements precipitated from a fluid enriched in 18O. Fluidsreleased from the dissolution of gas hydrates could explainthese values; nevertheless it is difficult to rule out otheralternatives such as clay mineral dehydration. Support forlocal gas hydrate dissociation is also given by the specificregional oceanography, where the seasonal and decadaldepth variation of the thermocline could influence the
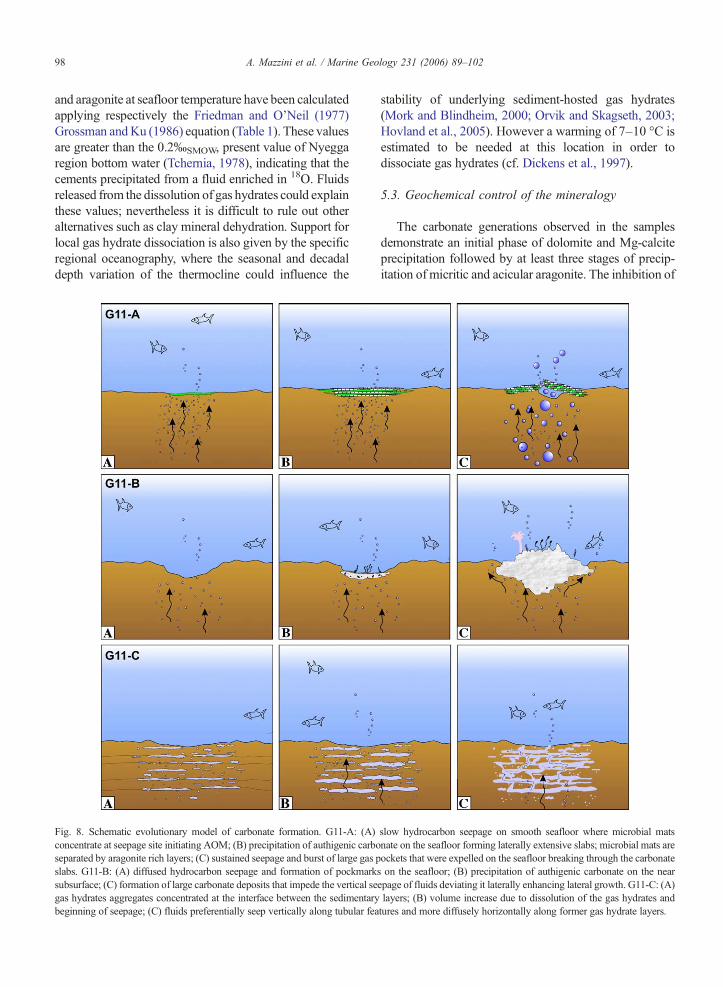
Fig. 8. Schematic evolutionary model of carbonate formation. G11-A: (A)concentrate at seepage site initiating AOM; (B) precipitation of authigenic carboseparated by aragonite rich layers; (C) sustained seepage and burst of large gas pslabs. G11-B: (A) diffused hydrocarbon seepage and formation of pockmarksubsurface; (C) formation of large carbonate deposits that impede the vertical segas hydrates aggregates concentrated at the interface between the sedimentarybeginning of seepage; (C) fluids preferentially seep vertically along tubular fea
stability of underlying sediment-hosted gas hydrates(Mork and Blindheim, 2000; Orvik and Skagseth, 2003;Hovland et al., 2005). However a warming of 7–10 °C isestimated to be needed at this location in order todissociate gas hydrates (cf. Dickens et al., 1997).
5.3. Geochemical control of the mineralogy
The carbonate generations observed in the samplesdemonstrate an initial phase of dolomite and Mg-calciteprecipitation followed by at least three stages of precip-itation of micritic and acicular aragonite. The inhibition of
slow hydrocarbon seepage on smooth seafloor where microbial matsnate on the seafloor forming laterally extensive slabs; microbial mats areockets that were expelled on the seafloor breaking through the carbonates on the seafloor; (B) precipitation of authigenic carbonate on the nearepage of fluids deviating it laterally enhancing lateral growth. G11-C: (A)layers; (B) volume increase due to dissolution of the gas hydrates andtures and more diffusely horizontally along former gas hydrate layers.
99A. Mazzini et al. / Marine Geology 231 (2006) 89–102
calcite precipitation versus aragonite in sulphate-rich dia-genetic environments has been described by severalauthors (e.g. Naehr et al., 2000; Aloisi et al., 2002). Theevolution from dolomite, micritic calcite to aragonite(Fig. 3C) observed in the Nyegga samples could indicateprecipitation at different depths below the seafloor as-suming a gradual decrease of sulphates with depth (e.g.Mazzini et al., 2005).
However, this ultimately depends on fluid composi-tion (e.g. Burton, 1993). For instance, an increase inporewater sulphate (e.g. due to a gradual decrease inseepage allowing sulphate-rich fluids to move in theclose subsurface, or due to partial erosion) could favouraragonite over Mg-calcite or dolomite.
5.4. Implications for carbonate precipitation dynamicsand mineralogical phases
Following the “freeze–thaw”model of Krause (2001),Hovland et al. (2005) suggested a generic model of slowdissociation of gas hydrates in the subsurface. With amore complex model also involving an abrupt release oftrapped gases, the authors described the general formationmodel of the pockmarks in the Nyegga area. We proposethree simplified qualitative and conceptual models todescribe the precipitation of different types of carbonatedeposits present in the G11 pockmark.
The horizontal subparallel mineralogical layeringobserved on sample G11-A suggests that carbonate pre-cipitated very close to the seafloor during slow hydrocar-bon seepage. We suggest that microbial colonies of e.g.Beggiatoa thriving at the seafloor may have generatedanoxic conditions in the immediate subsurface. In thisanoxic environment various other microbial coloniesgrew, thus forming defined layers allowing the precipi-tation of carbonates in between (Fig. 8). This hypothesis issupported by the absence of siliciclastic sediment and bythe presence of three different carbonate phases ascribedto the AOM occurring in the top few centimetres of theseafloor. The pyrite- organic- Mg-calcite-rich layers (i.e.1a, 2a, 3a, Fig. 3B) are interpreted as microbial layerswhere consortia of sulphate reducing bacteria and meth-ane oxidizing archaea were concentrated enhancingcyclic subparallel carbonate precipitation.
The elongated carbonate ridge sampled at locationG11-B suggests that hydrocarbon-rich fluidswere seeping in thepore media along preferential pathways (e.g. fractures)inducing significant precipitation of authigenic carbon-ate around the detrital grains. The last aragonitic phases(phases 2–3) are devoid of siliciclastic sediment suggest-ing that no sedimentary cappingwas present at themomentof precipitation. Similarly to G11-A sample, the dark grey
microbial coating (Beggiatoa?) on the external part couldhave caused anoxic conditions immediately below, thusallowing the precipitation of aragonite via AOM.
This type of deposits is now found outcropping as highbuild-ups and ridges (Fig. 8) likely due to erosion of thefine grained sediment thus exhuming the carbonates. Thegradual collapse of the structure is demonstrated by largeblocks nearby the ridges. These carbonate blocks rest onthe clay-rich sediment fill in the pockmark, but they areusually not covered by clay, suggesting active erosion.
The unusual structure of sample G11-C suggests a moredynamic formation mechanism. Changes in pressure andtemperature conditions presumably triggered the gashydrates dissociation in the near subsurface resulting involume increase and enhancing the seepage of fluidsthrough preferential pathways (e.g. microfractures, sedi-ment unconformities, bioturbation burrows). The layeringand the irregularly oriented tubular features observed in thehand specimen suggest that: (a) the methane-rich fluidsseepage concentrated in the tubular channels; (b) diffusiveflow occurred horizontally where the volume previouslyoccupied by gas hydrates was replaced by carbonatecement. The progressive cementation of the tubularfeatures and the subhorizontal voids can explain thedendritic irregular shape characterizing this sample (Fig. 8).The presence of porous cm sized carbonate vesicles couldalso be explained assuming that the sample represents animprint of gas hydrates. Such features have been observedalso on gas hydrate deposits, e.g. in the Cascadia margin,by several authors (e.g. Bohrmann et al., 1998; Suess et al.,2002; Teichert et al., 2005). Moreover, tomographyanalyses on these porous clathrates showed the presenceof cm sized free gas bubbles incorporated within thecrystals (Abegg et al., 2002). It is suggested that the vesiclesand the subrounded features described in carbonate sampleG11-C, represent portions of free gas originally present inthe hydrates. Like in the model suggested for sample G11-B, erosion operated by currents is expected to have exposedthe carbonate structure on the sea floor.
6. Conclusions
Unique sampling in the G11 pockmark allowed thecomparison of authigenic carbonates with contrastingmorphologies. We conclude that:
• Microbial oxidation of methane triggered the pre-cipitation of three carbonate generations within thepockmark.
• The mineralogical association of dolomite, Mg-calciteand aragonite is interpreted as due to local variation inthe porewater sulphate content that probably occurred
100 A. Mazzini et al. / Marine Geology 231 (2006) 89–102
during partial erosion, exhumation, or during a tem-porary decrease in seep activity.
• The bulk isotope composition of the samples suggestsprecipitation from the same type of pore fluid. Oxygenisotopes reveal anomalous 18O enrichment comparedwith normal seawater pore fluids, pointing towards agas hydrate origin.
• A gas hydrate origin is supported by a network-likemorphology of the volumetrically dominant carbon-ate rock type.
• High Sr concentrations in aragonite suggests a Sr andcation source from seawater or shallow pore fluids.
• The remarkable morphological differences of thesamples reflect contrasting settings and mechanismsof precipitation (i.e. seafloor precipitation during slowdiffusive flow, G11-A; microseepage of gas in the poremedia, G11-B; more sustained seepage in the subsur-face ascribed to gas hydrate dissociation; G11-C).
Acknowledgements
We are grateful to Geert De Lange, Catherine Pierreand one anonymous reviewer for their constructivesuggestions during the review of the manuscript. Wewould like to thank BjørnMorkKnutsen (Dep. of ClinicalOdontology, University of Oslo) for CT scanning theG11-C sample and Statoil for providing carbonatesamples, visual, and geophysical information and givingthe opportunity to publish the data.
Appendix A. Supplementary data
Supplementary data associated with this article canbe found, in the online version, at doi:10.1016/j.margeo.2006.05.012.
References
Abegg, F., Bohrmann, G., Freitag, J., Kipfstuhl, S., 2002. Structureand distribution of gas hydrates in marine sediments, 7th Inter-national Conference “Gas in marine sediments”, Baku, Azerbaijan,pp. 5–7.
Aharon, P., 1994. Geology and biology of modern and ancientsubmarine hydrocarbon seeps and vents: an introduction. Geo Mar.Lett. 14, 69–73.
Aiello, I.W., Garrison, R.E., Moore, J.C., Kastner, M., Stakes, D.S.,2001. Anatomy and origin of carbonate structures in a Miocenecold-seep field. Geology 29 (12), 1111–1114.
Aloisi, G., Pierre, C., Rouchy, J.M., Foucher, J.P., Woodside, J., 2000.Methane-related authigenic carbonates of eastern MediterraneanSea mud volcanoes and their possible relation to gas hydratedestabilisation. Earth Planet. Sci. Lett. 184 (1), 321–338.
Aloisi, G., Bouloubassi, I., Heijs, S.K., Pancost, R.D., Pierre, C.,Sinninghe Damste, J.S., Gottschal, J.C., Forney, L.J., Rouchy, J.-M.,
2002.CH4-consumingmicroorganisms and the formation of carbonatecrusts at cold seeps. Earth Planet. Sci. Lett. 203 (1), 195–203.
Andreassen, K., Mienert, J., Bryn, P., Singh, A., 2000. A double gas-hydrate related bottom simulating reflector at the Norwegiancontinental margin. Ann. N.Y. Acad. Sci. 912, 126–135.
Beauchamp, B., Savard, M., 1992. Cretaceous chemosyntheticcarbonate mounds in the Canadian Arctic. Palaios 7 (4), 434–450.
Berndt, C., Bunz, S., Mienert, J., 2003. Polygonal fault systems on themid-Norwegian margin: a long-term source for fluid flow. In: VanRensbergen, P., Hillis, R.R., Maltman, A.J., Morley, C.K. (Eds.),Subsurface Sediment Mobilization. Special Publication — Geo-logical Society of London. Geological Society, pp. 283–290.
Boetius, A., Ravenschlag, K., Schubert, C.J., Rickert, D., Widdel, F.,Gieseke, A., Amann, R., Jorgensen, B.B., Witte, U., Pfannkuche,O., 2000. A marine microbial consortium apparently mediatinganaerobic oxidation of methane. Nature 407, 623–625.
Bohrmann, G., Greinert, J., Suess, E., Torres, M., 1998. Authigeniccarbonates from the Cascadia subduction zone and their relation togas hydrate stability. Geology 7, 647–650.
Bouriak, S., Vanneste, M., Saoutkine, A., 2000. Inferred gas hydratesand clay diapirs near the Storegga Slide on the southern edge of theVøring Plateau, offshore Norway. Mar. Geol. 163 (1–4), 125–148.
Brekke, H., 2000. The tectonic evolution of the Norwegian Seacontinental margin, with emphasis on the Voring and More basins.In: Nottvedt, A. (Ed.), Dynamics of the Norwegian Margin.Special Publication — Geological Society of London. GeologicalSociety, pp. 327–378.
Bugge, T., Befring, S., Belderson, R.H., Eidvin, T., Jansen, E.,Kenyon, N., Holtedahl, H., Sejrup, H.P., 1987. A giant three-stagesubmarine slide off Norway. Geo Mar. Lett. 7, 191–198.
Bünz, S., Mienert, J., Berndt, C., 2003. Geological controls on theStoregga gas-hydrate system of the mid-Norwegian continentalmargin. Earth Planet. Sci. Lett. 209 (3–4), 291–307.
Bünz, S., Mienert, J., Bryn, P., Berg, K., 2005. Fluid flow impact onslope failure from 3D seismic data: a case study in the StoreggaSlide. Basin Res. 17 (1), 109–122.
Burton, E.A., 1993. Controls on marine carbonate cement mineralogy:review and reassessment. Chem. Geol. 105 (1/3), 163.
Clari, P., Fornara, L., Ricci, B., Zuppi, G.M., 1994. Methane-derivedcarbonates and chemosymbiotic communities of Piedmont (Mio-cene, northern Italy). Geo Mar. Lett. 14, 201–209.
Clari, P., Martire, L., 2000. Cold seep carbonates in the Tertiary ofnorthwest Italy: evidence of bacterial degradation of methane. In:Riding, R.E., Awramik, S.M. (Eds.), Microbial Sediments.Springer-Verlag, Berlin, Heidelberg, pp. 261–269.
Diaz-del-Rio, V., Somoza, L., Martinez-Frias, J., Mata, M.P.,Delgado, A., Hernandez-Molina, F.J., Lunar, R., Martin-Rubi,J.A., Maestro, A., Fernandez-Puga, M.C., 2003. Vast fields ofhydrocarbon-derived carbonate chimneys related to the accre-tionary wedge/olistostrome of the Gulf of Cadiz. Mar. Geol. 195(1–4), 177–200.
Dickens, G.R., Castillo,M.M.,Walker, J.C.G., 1997. A blast of gas in thelatest Paleocene: simulating first-order effects ofmassive dissociationon oceanic methane hydrate. Geology 25 (3), 259–262.
Dore, A.G., Lundin, E.R., 1996. Cenozoic compressional structures onthe NE Atlantic margin: nature, origin and potential significancefor hydrocarbon exploration. Petrol. Geosci. 2 (4), 299–311.
Friedman, I., O'Neil, J.R., 1977. Compilation of stable isotopefractionation factors of geochemical interest, In: Fleisher, M. (Ed.),Data of Geochemistry, 6th ed. USGS Prof. Paper, p. 12.
Gravdal, A., Haflidason, H., Evans, D., 2003. Seabed and subsurfacefeatures on the southern Vøring Plateau and northern Storegga
101A. Mazzini et al. / Marine Geology 231 (2006) 89–102
slide escarpment. In: Mienert, J., Weaver, P. (Eds.), EuropeanMargin Sediment Dynamics. Springer, Berlin, pp. 111–117.
Grossman, E.L., Ku, T.L., 1986. Carbon and oxygen isotopefractionation in biogenic aragonite: temperature effects. Chem.Geol. 59, 59–74.
Haflidason, H., Sejrup, H.P., Berstad, I.M., Nygård, A., Richter, T., Bryn,P., Lien, R., Berg, K., 2003. A weak layer feature on the northernStoregga Slide Escarpment. In: Mienert, J., Weaver, P. (Eds.),European Margin Sediment Dynamics. Springer, Berlin, pp. 55–62.
Hjelstuen, B.O., Eldholm, O., Skogseid, J., 1999. Cenozoic evolutionof the northern Voring margin. Bull. Geol. Soc. Am. 111 (12),1792–1807.
Hovland, M., Judd, A.G., 1988. Seabed pockmarks and seepages:impact on geology, biology and the marine environment. Graham& Trotman, p. 293.
Hovland, M., Svenson, H., 2006. Submarine pingoes: indicators ofshallow gas hydrates in a pockmark at Nyegga, Norwegian Sea.Mar. Geol. 228, 15–23.
Hovland, M., Talbot, M.R., Olaussen, S., Aasberg, L., 1985. Recentlyformed methane-derived carbonates from the North Sea floor. In:Thomas, B.M. (Ed.), Petroleum Geochemistry in Exploration ofthe Norwegian Shelf. Norwegian Petroleum Soc. Graham &Trotman, pp. 263–266.
Hovland, M., Talbot, M.R., Qvale, H., Olaussen, S., Aasberg, L., 1987.Methane-related carbonate cements in pockmarks of the North Sea.J. Sediment. Petrol. 57 (5), 881–892.
Hovland, M., Svensen, H., Forsberg, C.F., Johansen, H., Fichler, C.,Fossa, J.H., Jonsson, R., Rueslatten, H., 2005. Complex pock-marks with carbonate-ridges off mid-Norway: products ofsediment degassing. Mar. Geol. 218 (1–4), 191–206.
Kenyon, N.H., Ivanov, M.K., Akhmetzhanov, A.M. (Eds.), 1999.Geological Processes on the Northeast Atlantic Margin. TechnicalSeries — Intergovernmental Oceanographic Commission, vol. 54,p. 141.
Kenyon, N.H., Ivanov, M.K., Akhmetzhanov, A.M., Akhmanov, G.G.(Eds.), 2001. Multidisciplinary Study of Geological Processes onthe North East Atlantic Margin and Mid-Atlantic ridge. TechnicalSeries — Intergovernmental Oceanographic Commission, vol. 60,p. 142.
Krause, F.F., 2001. Genesis and geometry of the Meiklejohn Peak limemud-mound, Bare Mountain Quadrangle, Nevada, USA: Ordovi-cian limestone with submarine frost heave structures—a possibleresponse to gas clathrate hydrate evolution. Sediment. Geol. 145(3–4), 189–213.
Kulm, L.D., Suess, E., 1990. Relationship between carbonate depositsand fluid venting: Oregon accretionary prism. J. Geophys. Res. 95,8899–8915.
Kvenvolden, K.A., Golan-Bac, M., McDonald, T.J., Pflaum, R.C.,Brooks, J., 1989. Hydrocarbon gases in sediment of the VoringPlateau, Norwegian Sea. In: Eldholm, O., Thiede, J., Taylor, E.(Eds.), Proceeding of the ODP, Scientific results Leg 104,Norwegian Sea. ODP, Texas A&M University, College Station,pp. 319–326.
Mazzini, A., Duranti, D., Jonk, R., Parnell, J., Cronin, B.T., Hurst, A.,Quine, M., 2003. Palaeo-carbonate seep structures above an oilreservoir, Gryphon Field, Tertiary, North Sea. Geo Mar. Lett. 23(3–4), 323–339.
Mazzini, A., Ivanov, M.K., Parnell, J., Stadnitskaia, A., Cronin, B.T.,Poludetkina, E., Mazurenko, L., van Weering, T.C.E., 2004.Methane-related authigenic carbonates from the Black Sea:geochemical characterisation and relation to seeping fluids. Mar.Geol. 212 (1–4), 153–181.
Mazzini, A., Aloisi, G., Akhmanov, G.G., Parnell, J., Cronin, B.,Murphy, P., 2005. Integrated petrographic and geochemical recordof hydrocarbon seepage on the Vøring Plateau. Geol. Soc. 162,815–827.
Mienert, J., Posewang, J., 1999. Evidence of shallow- and deep-watergas hydrate destabilizations in North Atlantic polar continentalmargin sediments. Geo Mar. Lett. 19 (1–2), 143–149.
Mienert, J., Posewang, J., Baumann, M., 1998. Gas hydrates along thenortheastern Atlantic margin: possible hydrate-bound margininstabilities and possible release of methane. In: Henriet, J.P.,Mienert, J. (Eds.), Gas Hydrates: Relevance to World MarginStability and Climate Change. Special Publication — GeologicalSociety of London. Geological Society, pp. 275–292.
Mork, K.A., Blindheim, J., 2000. Variations in the Atlantic inflow tothe Nordic Seas, 1955–1996. Deep-sea Res., A, Oceanogr. Res.Pap. 47 (6), 1035–1057.
Naehr, T.H., Rodriguez, N.M., Bohrmann, G., Paull, C.K., Botz, R.,2000. Methane-derived authigenic carbonates associated with gashydrate decomposition and fluid venting above the Blake RidgeDiapir. In: Paull, C.K., Matsumoto, R., Wallace, P.J., Dillon, W.P.(Eds.), Proc. ODP Scientific Results. College Station, TX (OceanDrilling Program), pp. 286–300.
Orvik, K.A., Skagseth, O., 2003. Monitoring the Norwegian Atlanticslope current using a single moored current meter. Cont. Shelf Res.23 (2), 159–176.
Peckmann, J., Reimer, A., Luth, U., Luth, C., Hansen, B.T., Heinicke,C., Hoefs, J., Reitner, J., 2001. Methane-derived carbonates andauthigenic pyrite from the northwestern Black Sea. Mar. Geol. 177(1–2), 129–150.
Posewang, J., Mienert, J., 1999. The enigma of double BSRs: indicatorsfor changes in the hydrate stability field? In: Gardner, J.M., Vogt, P.R.(Eds.), High-latitude gas venting, hydrates and mass wasting.Geomarine Letters. Springer Verlag Kg, pp. 157–163.
Ritger, S., Carson, B., Suess, E., 1987. Methane-derived authigeniccarbonates formed by subduction-induced pore-water expulsionalong the Oregon/Washington margin. Geol. Soc. Am. Bull. 98,147–156.
Rokoengen, K., Rise, L., Bryn, P., Frengstad, B., Gustavsen, E.,Nygaard, E., Saettem, J., 1995. Upper Cenozoic stratigraphy on themid-Norwegian continental shelf. Nor. Geol. Tidsskr. 75 (2–3),88–104.
Savard, M.M., Beauchamp, B., Veizer, J., 1996. Significance ofaragonite cements around Cretaceous marine methane seeps.J. Sediment. Res. 66, 430–438.
Skogseid, J., Eldholm, O., 1989. Vøring Plateau continental margin;seismic interpretation, stratigraphy, and vertical movements. In:Eldholm, O., Thiede, J., Taylor, E. (Eds.), Proceeding of the ODP,Scientific results Leg 104, Norwegian Sea. ODP, Texas A&MUniversity, College Station, pp. 993–1030.
Stuevold, L.M., Eldholm, O., 1996. Cenozoic uplift of Fennoscandiainferred from a study of the mid-Norwegian margin. Glob. Planet.Change 12 (1–4), 359–386.
Suess, E., Bohrmann, G., Rickert, D., Kuhs, W., Torres, M., Tréhu, A.,Link, P., 2002. Properties and fabric of near-surface hydrates atHydrate Ridge, Cascadia margin. Fourth Int. Conf. Gas Hydrates,Yokohama, pp. 740–744.
Tchernia, P., 1978. Oceanografie regionale. Ecole Superieure desTecniques Avancees, Paris. 257 pp. (in French).
Teichert, B.M.A., Gussone, N., Eisenhauer, A., Bohrmann, G., 2005.Clathrites: archives of near-seafloor pore-fluid evolution (δ44/40Ca,δ13C, δ18O) in gas hydrate environments. Geology 33 (3),213–216.

102 A. Mazzini et al. / Marine Geology 231 (2006) 89–102
Vågnes, E., Gabrielsen, R.H., Haremo, P., 1998. Late Cretaceous–Cenozoic intraplate contractional deformation at the Norwegiancontinental shelf; timing, magnitude and regional implications.Tectonophysics 12, 29–46.
Whiticar, M.J., Faber, E., 1989. Molecular and stable isotopecomposition of Headspace and total hydrocarbon gases at ODP
Leg 104, sites 642, 643, and 644, Vøring Plateau, Norwegian Sea.In: Eldholm, O., Thiede, J., Taylor, E. (Eds.), Proceeding of theODP, Scientific results Leg 104, Norwegian Sea. ODP, TexasA&M University, College Station, pp. 327–334.