comparative study between kani's rotational contribution
TRANSCRIPT
International Journal of Civil Engineering Research.
ISSN 2278-3652 Volume 12, Number 1 (2021), pp. 1-14
© Research India Publications
http://www.ripublication.com
Comparative Study between Kani’s Rotational
Contribution Method and FEM using STAAD.Pro in
a G+3 Residential Flat
Vigneshwer S1*, Keerthi Priya Tabjula1 and Thiagu H2
1 UG Student, Dept. of Civil Engineering, SRMIST, Kattankulathur, Chengalpattu, Tamil Nadu, India.
2 Assistant Professor, Dept. of Civil Engineering, SRMIST, Kattankulathur, Chengalpattu, Tamil Nadu, India.
Abstract
Structural Engineering plays a key role in accomplishing the need for ever
increasing living space by analyzing and designing with economy and
elegance to give a safe, serviceable and durable structure. The study
investigates the effectiveness of Kani’s Rotational Contribution Method and
Finite Element Method (FEM) using STAAD.Pro in analyzing a G + 3
residential flat. Accordingly the critical portal frame was identified and
analyzed for 4 cases (floor wise combinations) using above said two methods.
The results had been compared and it was found that the mean variation for
beam moments ranges from 2.74 % to 12.7 % and for column moments it
varies from 6.92 % to 39.44 % for different floor combinations. Concisely, it
can be inferred that more than 50 % of the end moments fall within 10 %
variation category in beam moments for all cases and more than 40 % of end
moments fall within 10 % variation classification in column moments for
different floor combinations. In short both the methods are versatile on
practical considerations. In case of smaller frames (2 to 3 floors) Kani’s
method is best suited for its flexibility, self correctiveness, faster convergence
and simplicity. Alternatively for larger three dimensional frames it is
suggested to go in for Linear Static Analysis using STAAD.Pro for its speed,
adaptability, graphic interface and extendability.
Keywords: Kani’s Method, Finite Element Method (FEM), Linear Static
Analysis
2 Vigneshwer S, Keerthi Priya Tabjula and Thiagu H
1. INTRODUCTION
Buildings constitute an integral part of civilization. Ever since from ancient times,
building science has become an indispensible component of design process. It is
emphasized that any structure to be erected must satisfy the needs efficiently for
which it is intended and shall be durable throughout its desired life span. Safety
requirements must also be met so that a structure is able to serve its purpose with the
minimum costs. Thus in Engineering and Architecture, a structure is the combination
of two or more basic structural components connected together in such a way that
they serve the user functionally and carry the loads arising out of self and super-
imposed loads safely without causing any problem to utility. Migration to cities,
population explosion and ever increasing land cost pose a threat to living space.
Indirectly these factors pave way for vertical expansion and it is the responsibility of
the Civil Engineers to cope with the current situation.
Rashmi Agashe et al [1] performed theoretical design and structural analysis of a G+4
residential building using IS Code Method and verified using STADD Pro. software.
Potharaboyena Vinay et al [2] studied a portion of RCC building frame with
Substitute Frame Method. The design part of the structure was done using Limit State
Method. Chiranjeevi M et al [3] investigated a single bay portal frame using Moment
Distribution Method and Kani’s Method for uniformly distributed loading conditions.
Further the results were compared using STAAD.Pro. There is only a slight variation
in the end moments among these methods. Kushal Shah et al [4] attempted to analyze
and design a residential building of G+6 floors consisting of 5 apartments in each
floor using the software package STAAD.Pro against all possible loading conditions.
Balwinder Lallotra et al [5], considered different structural elements like fixed beam,
column with point load, cantilever beam, portal frame etc., and analyzed them using
softwares like STAAD Pro, ETABS and SAP-2000 and validated the results with
manual design as per Indian Standards. In the case of portal frame the bending
moment at one of the fixed end is more than 241.5% when compared to theoretical
value. The variation is more than 542.21 % at the other end. Ashok Kumar N et al [6]
analyzed and designed a G+3 hospital building using Substitute Frame Method and
STAAD Pro V8i. There is only minor difference between manual and software results
obtained. Syed Faheemuddin et al [7] has taken a G+2 building with 3 bays for the
study. Linear Static Analysis has been done using Kani’s Method and SAP2000
V17.3. There is only 5.2 % variation for column moments and 4.1 % variation in the
beam moments between the two methods. In column axial loads the variation is
5 .1 %. In short SAP 2000 V17.3 gives a higher variation when compared to manual
methods.
Comparative Study between Kani’s Rotational Contribution Method.... 3
2. NEED FOR THE STUDY AND APPROACH
There are three approaches to the analysis viz.,the mechanics of materials approach
(strength of materials), the elastic theory approach, and the finite element approach.
The first two make use of analytical formulations which apply mostly to simple linear
elastic models leading to solutions that can often be solved by hand. The finite
element approach is actually a numerical method for solving differential equations
generated by theories of mechanics such as elastic theory and strength of materials.
However the finite element method depends heavily on the processing power of
computers and is more applicable to structures of arbitrary size and complexity.
The present study was initiated with the aim to analyse a portal frame using both
manual and software oriented Finite Element Method (FEM). Based on space
constraint, cost issues and on the gaps identified in the earlier investigations the
following objectives are set for the present study.
1. To identify the critical portal frame in a G+3 residential flat and analyse manually
for Bending moment and Shear forces using Kani’s Rotational Contribution
Method under vertical loading conditions.
2. To conduct Linear Static Analysis by FEM using STAAD Pro.V8i and compare
the results obtained from both methods.
3. METHODOLOGY
Kani’s Rotational Contribution Method is an iteration method for analyzing
statistically indeterminate structures in which the contribution of rotation moments are
distributed till the desired degree of accuracy is achieved. Framed structures are rarely
symmetric and subjected to side sway hence Kani’s Method is best suited and much
simpler than other methods like Moment Distribution Method, Slope Deflection
Method etc. However it is only an approximate method that can save a great deal of
time when compared to Moment Distribution Method, especially when considering
structural floors with a couple of stories or more. The most significant feature of
Kani’s method is that process of iteration is self-corrective. Any error at any stage of
iterations is corrected in subsequent steps. Thus skipping a few steps either by over
sight or by intention, does not lead to error in final end moments.
Any structure’s response includes internal processes, moments, and inherent stresses
that are used in the design process. Usually in finite element based structural analysis
as contemplated in STAAD.Pro, the unknown displacement/moments are obtained
from equilibrium equations of actual system and then the external and internal forces
/stresses are calculated from structure’s global equilibrium equations. For this reason
FEM is the best option of discretization of complicated structural system where basic
4 Vigneshwer S, Keerthi Priya Tabjula and Thiagu H
equilibrium equations are readily acquired from the principle of virtual work. In this
way STAAD.Pro looks into each and every aspect of structural engineering starting
from analysis, design, validation, model evolution and visual display on the basis of
concurrent engineering. Further STAAD.Pro provides a complete insight in getting
precise results like nodal displacements, support reactions, axial forces, beam
deflections, base shear, storey shear, mode shapes etc., especially in Linear Static
Analysis which is an important subject now a days because of practical
considerations, time and safety features as the structural requirements are examined
upto collapse. However this study is confined to finding variation in beam and column
end moments only between Kani’s Rotational Contribution Method and FEM using
STAAD.Pro.
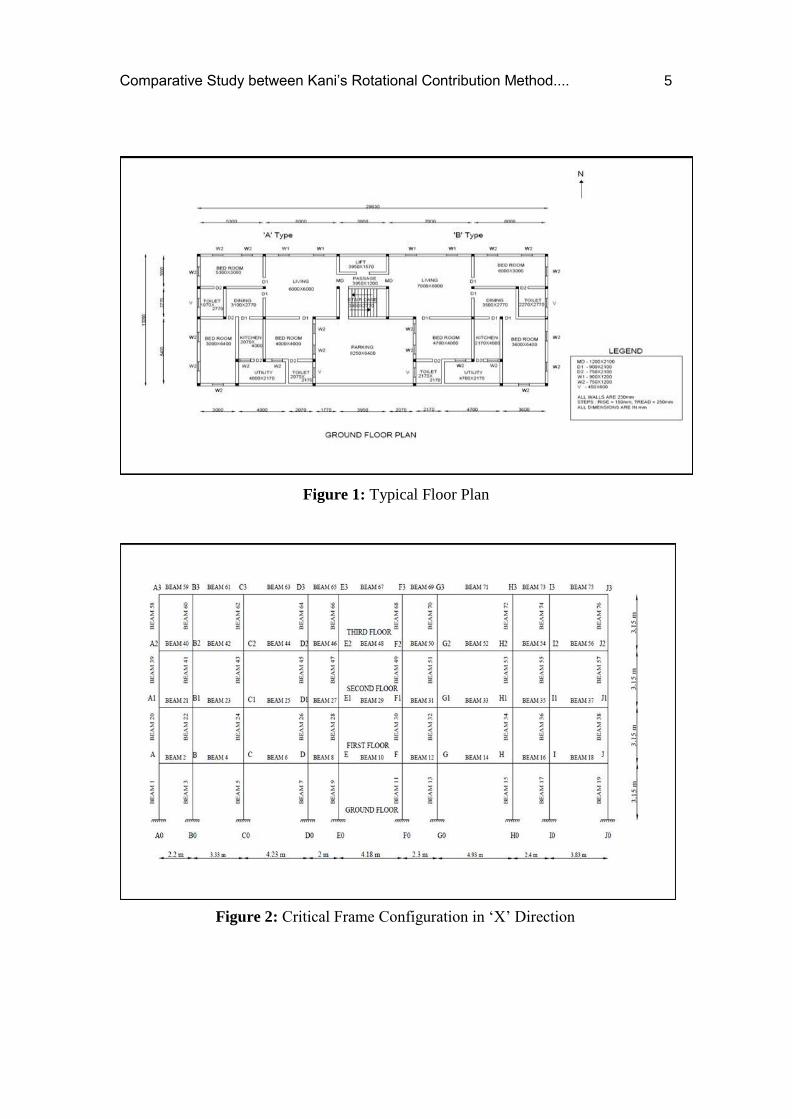
4. PLANNING AND SIZING OF STRUCTURAL ELEMENTS
A typical architectural floor plan for a G + 3 residential flat has been proposed in
Figure 1. Each floor consists of two types viz., ‘A’ and ‘B’ with common parking area
in ground floor. Both types consist of living, 3 bed rooms, kitchen, dining, toilet and
utility area. Also a balcony has been provided for first, second and third floors. A slab
thickness of 150 mm was adopted for living rooms, parking and balconies. For all
other rooms 120 mm thickness had been provided. Two cross sections for beams viz.,
230 mm × 350 mm and 230 mm × 400 mm, depending upon the spans were adopted
for all the floors. Similarly two cross sections for the columns viz., 230 mm × 230 mm
and 230 mm × 350 mm were adopted depending on the loading conditions throughout
the structure. A wall height of 3 m was provided for all the floors. For the analysis
purpose the critical frame with 9 bays has been identified in the middle of the
structure so as to support maximum loads from the floors transferred to this frame in
the “X” direction. All loading conditions on slabs, supporting beams and columns
have been calculated as per IS 875 Part 1 and 2. Further the loads on beams
supporting the slabs are uniformly distributed in accordance with Clause 24.5 of IS
456: 2000. The frame configuration and loadings on critical frame are presented in
Figures 2 and 3.
Comparative Study between Kani’s Rotational Contribution Method.... 5
Figure 1: Typical Floor Plan
Figure 2: Critical Frame Configuration in ‘X’ Direction
6 Vigneshwer S, Keerthi Priya Tabjula and Thiagu H
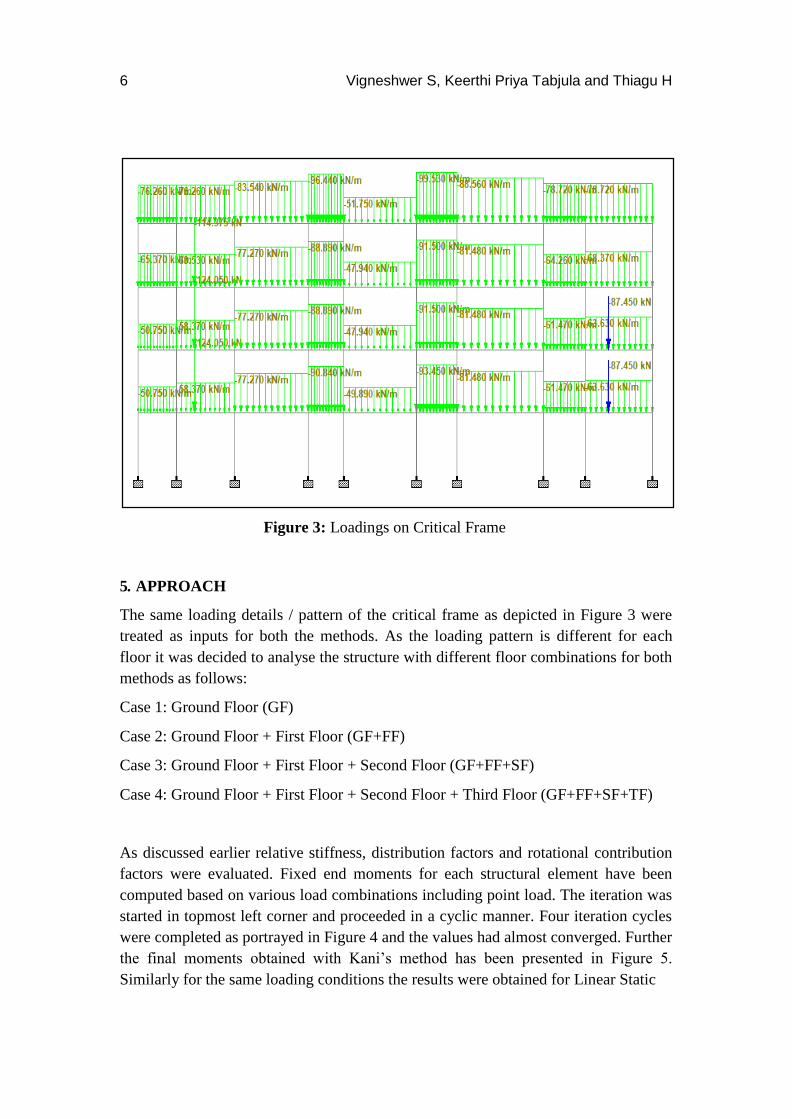
Figure 3: Loadings on Critical Frame
5. APPROACH
The same loading details / pattern of the critical frame as depicted in Figure 3 were
treated as inputs for both the methods. As the loading pattern is different for each
floor it was decided to analyse the structure with different floor combinations for both
methods as follows:
Case 1: Ground Floor (GF)
Case 2: Ground Floor + First Floor (GF+FF)
Case 3: Ground Floor + First Floor + Second Floor (GF+FF+SF)
Case 4: Ground Floor + First Floor + Second Floor + Third Floor (GF+FF+SF+TF)
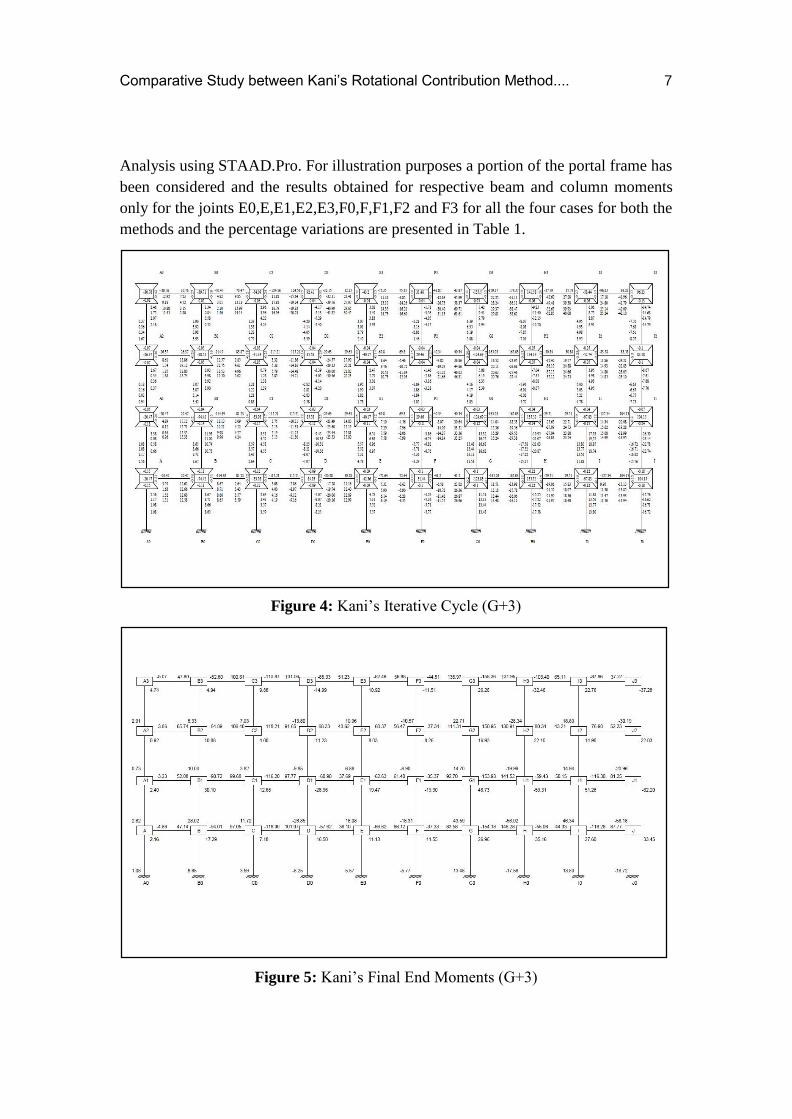
As discussed earlier relative stiffness, distribution factors and rotational contribution
factors were evaluated. Fixed end moments for each structural element have been
computed based on various load combinations including point load. The iteration was
started in topmost left corner and proceeded in a cyclic manner. Four iteration cycles
were completed as portrayed in Figure 4 and the values had almost converged. Further
the final moments obtained with Kani’s method has been presented in Figure 5.
Similarly for the same loading conditions the results were obtained for Linear Static
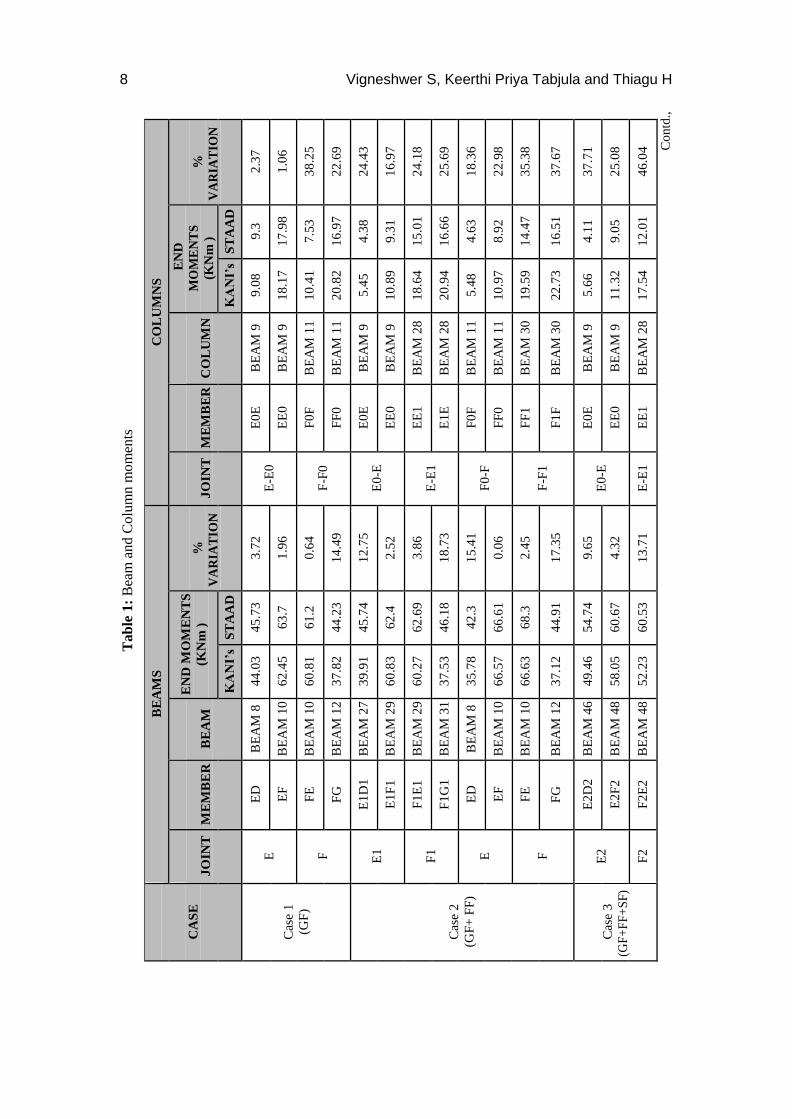
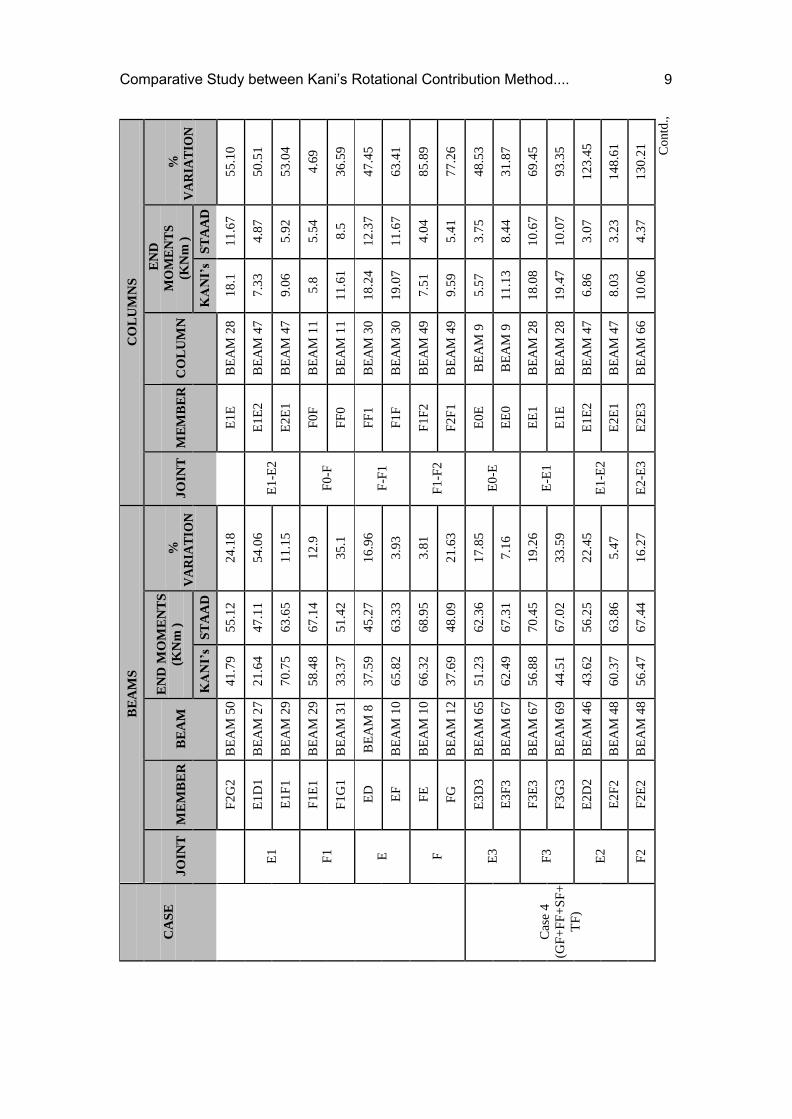
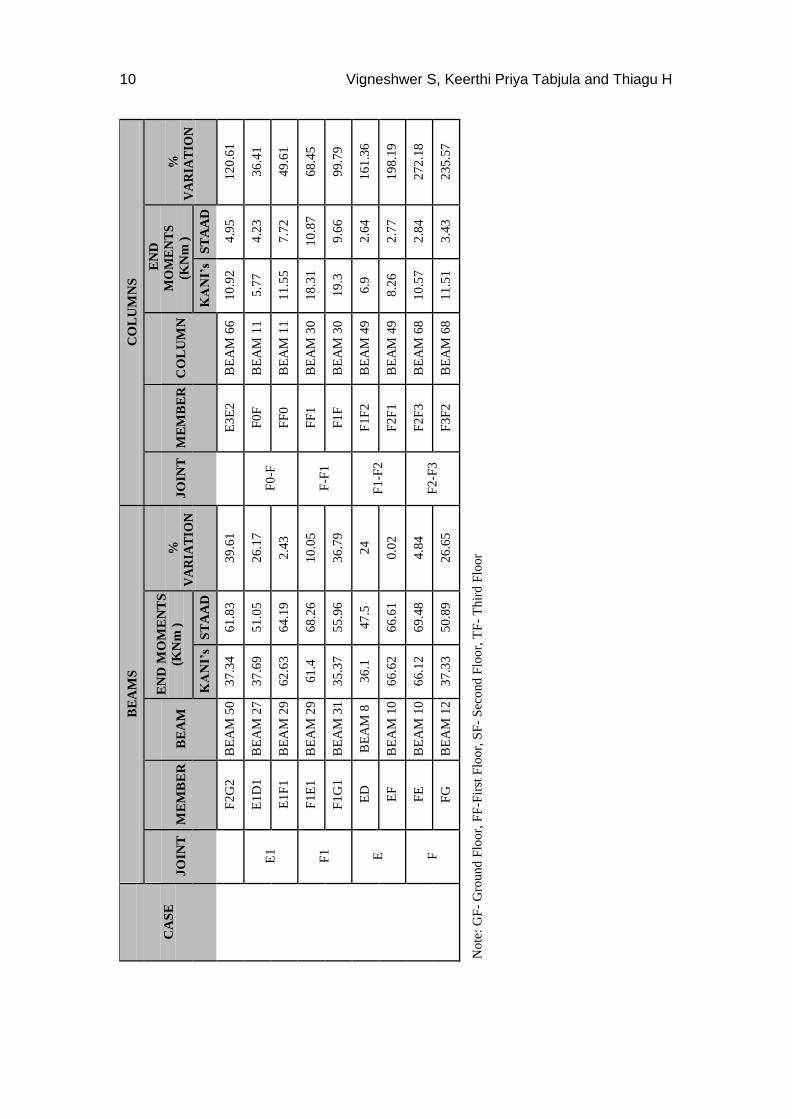
Comparative Study between Kani’s Rotational Contribution Method.... 7
Analysis using STAAD.Pro. For illustration purposes a portion of the portal frame has
been considered and the results obtained for respective beam and column moments
only for the joints E0,E,E1,E2,E3,F0,F,F1,F2 and F3 for all the four cases for both the
methods and the percentage variations are presented in Table 1.
Figure 4: Kani’s Iterative Cycle (G+3)
Figure 5: Kani’s Final End Moments (G+3)
Tab
le 1
: B
eam
and C
olu
mn m
om
ents
C
AS
E
BE
AM
S
CO
LU
MN
S
JO
INT
ME
MB
ER
BE
AM
EN
D M
OM
EN
TS
(KN
m )
%
VA
RIA
TIO
N
JO
INT
ME
MB
ER
CO
LU
MN
EN
D
MO
ME
NT
S
(KN
m )
%
VA
RIA
TIO
N
KA
NI’
s S
TA
AD
K
AN
I’s
ST
AA
D
C
ase
1
(GF
)
E
E
D
BE
AM
8
44
.03
45
.73
3.7
2
E
-E0
E
0E
B
EA
M 9
9
.08
9.3
2
.37
EF
B
EA
M 1
0
62
.45
63
.7
1.9
6
EE
0
BE
AM
9
18
.17
17
.98
1.0
6
F
F
E
BE
AM
10
6
0.8
1
61
.2
0.6
4
F
-F0
F
0F
B
EA
M 1
1
10
.41
7.5
3
38
.25
FG
B
EA
M 1
2
37
.82
44
.23
14
.49
F
F0
B
EA
M 1
1
20
.82
16
.97
22
.69
Cas
e 2
(GF
+ F
F)
E
1
E1
D1
BE
AM
27
3
9.9
1
45
.74
12
.75
E0
-E
E0
E
BE
AM
9
5.4
5
4.3
8
24
.43
E1
F1
B
EA
M 2
9
60
.83
62
.4
2.5
2
EE
0
BE
AM
9
10
.89
9.3
1
16
.97
F
1
F1
E1
B
EA
M 2
9
60
.27
62
.69
3.8
6
E
-E1
E
E1
BE
AM
28
1
8.6
4
15
.01
24
.18
F1
G1
B
EA
M 3
1
37
.53
46
.18
18
.73
E
1E
B
EA
M 2
8
20
.94
16
.66
25
.69
E
E
D
BE
AM
8
35
.78
42
.3
15
.41
F0
-F
F0
F
BE
AM
11
5
.48
4.6
3
18
.36
EF
B
EA
M 1
0
66
.57
66
.61
0.0
6
FF
0
BE
AM
11
1
0.9
7
8.9
2
22
.98
F
FE
B
EA
M 1
0
66
.63
68
.3
2.4
5
F
-F1
FF
1
BE
AM
30
1
9.5
9
14
.47
35
.38
FG
B
EA
M 1
2
37
.12
44
.91
17
.35
F
1F
B
EA
M 3
0
22
.73
16
.51
37
.67
Cas
e 3
(GF
+F
F+
SF
)
E
2
E2
D2
BE
AM
46
4
9.4
6
54
.74
9.6
5
E
0-E
E
0E
B
EA
M 9
5
.66
4.1
1
37
.71
E2
F2
B
EA
M 4
8
58
.05
60
.67
4.3
2
EE
0
BE
AM
9
11
.32
9.0
5
25
.08
F2
F
2E
2
BE
AM
48
5
2.2
3
60
.53
13
.71
E
-E1
E
E1
BE
AM
28
1
7.5
4
12
.01
46
.04 Co
ntd
.,
8 Vigneshwer S, Keerthi Priya Tabjula and Thiagu H
C
AS
E
BE
AM
S
CO
LU
MN
S
JO
INT
ME
MB
ER
BE
AM
EN
D M
OM
EN
TS
(KN
m )
%
VA
RIA
TIO
N
JO
INT
ME
MB
ER
CO
LU
MN
EN
D
MO
ME
NT
S
(KN
m )
%
VA
RIA
TIO
N
KA
NI’
s S
TA
AD
K
AN
I’s
ST
AA
D
F2
G2
B
EA
M 5
0
41
.79
55
.12
24
.18
E1
E
BE
AM
28
1
8.1
1
1.6
7
55
.10
E
1
E1
D1
BE
AM
27
2
1.6
4
47
.11
54
.06
E1
-E2
E
1E
2
BE
AM
47
7
.33
4.8
7
50
.51
E1
F1
B
EA
M 2
9
70
.75
63
.65
11
.15
E
2E
1
BE
AM
47
9
.06
5.9
2
53
.04
F
1
F1
E1
B
EA
M 2
9
58
.48
67
.14
12
.9
F
0-F
F
0F
B
EA
M 1
1
5.8
5
.54
4.6
9
F1
G1
B
EA
M 3
1
33
.37
51
.42
35
.1
FF
0
BE
AM
11
1
1.6
1
8.5
3
6.5
9
E
E
D
BE
AM
8
37
.59
45
.27
16
.96
F-F
1
FF
1
BE
AM
30
1
8.2
4
12
.37
47
.45
EF
B
EA
M 1
0
65
.82
63
.33
3.9
3
F1
F
BE
AM
30
1
9.0
7
11
.67
63
.41
F
F
E
BE
AM
10
6
6.3
2
68
.95
3.8
1
F
1-F
2
F1
F2
B
EA
M 4
9
7.5
1
4.0
4
85
.89
FG
B
EA
M 1
2
37
.69
48
.09
21
.63
F
2F
1
BE
AM
49
9
.59
5.4
1
77
.26
C
ase
4
(GF
+F
F+
SF
+
TF
)
E
3
E3
D3
BE
AM
65
5
1.2
3
62
.36
17
.85
E0
-E
E0
E
BE
AM
9
5.5
7
3.7
5
48
.53
E3
F3
B
EA
M 6
7
62
.49
67
.31
7.1
6
EE
0
BE
AM
9
11
.13
8.4
4
31
.87
F
3
F3
E3
B
EA
M 6
7
56
.88
70
.45
19
.26
E-E
1
EE
1
BE
AM
28
1
8.0
8
10
.67
69
.45
F3
G3
B
EA
M 6
9
44
.51
67
.02
33
.59
E
1E
B
EA
M 2
8
19
.47
10
.07
93
.35
E
2
E2
D2
BE
AM
46
4
3.6
2
56
.25
22
.45
E1
-E2
E
1E
2
BE
AM
47
6
.86
3.0
7
12
3.4
5
E2
F2
B
EA
M 4
8
60
.37
63
.86
5.4
7
E2
E1
BE
AM
47
8
.03
3.2
3
14
8.6
1
F2
F
2E
2
BE
AM
48
5
6.4
7
67
.44
16
.27
E
2-E
3
E2
E3
BE
AM
66
1
0.0
6
4.3
7
13
0.2
1
Co
ntd
.,
Comparative Study between Kani’s Rotational Contribution Method.... 9
C
AS
E
BE
AM
S
CO
LU
MN
S
JO
INT
ME
MB
ER
BE
AM
EN
D M
OM
EN
TS
(KN
m )
%
VA
RIA
TIO
N
JO
INT
ME
MB
ER
CO
LU
MN
EN
D
MO
ME
NT
S
(KN
m )
%
VA
RIA
TIO
N
KA
NI’
s S
TA
AD
K
AN
I’s
ST
AA
D
F2
G2
B
EA
M 5
0
37
.34
61
.83
39
.61
E3
E2
BE
AM
66
1
0.9
2
4.9
5
12
0.6
1
E
1
E1
D1
BE
AM
27
3
7.6
9
51
.05
26
.17
F0
-F
F0
F
BE
AM
11
5
.77
4.2
3
36
.41
E1
F1
B
EA
M 2
9
62
.63
64
.19
2.4
3
FF
0
BE
AM
11
1
1.5
5
7.7
2
49
.61
F
1
F1
E1
B
EA
M 2
9
61
.4
68
.26
10
.05
F-F
1
FF
1
BE
AM
30
1
8.3
1
10
.87
68
.45
F1
G1
B
EA
M 3
1
35
.37
55
.96
36
.79
F
1F
B
EA
M 3
0
19
.3
9.6
6
99
.79
E
E
D
BE
AM
8
36
.1
47
.5
24
F
1-F
2
F1
F2
B
EA
M 4
9
6.9
2
.64
16
1.3
6
EF
B
EA
M 1
0
66
.62
66
.61
0.0
2
F2
F1
B
EA
M 4
9
8.2
6
2.7
7
19
8.1
9
F
F
E
BE
AM
10
6
6.1
2
69
.48
4.8
4
F
2-F
3
F2
F3
B
EA
M 6
8
10
.57
2.8
4
27
2.1
8
FG
B
EA
M 1
2
37
.33
50
.89
26
.65
F
3F
2
BE
AM
68
1
1.5
1
3.4
3
23
5.5
7
No
te:
GF
- G
rou
nd
Flo
or,
FF
-Fir
st F
loo
r, S
F-
Sec
ond
Flo
or,
TF
- T
hir
d F
loor
10 Vigneshwer S, Keerthi Priya Tabjula and Thiagu H
Comparative Study between Kani’s Rotational Contribution Method.... 11
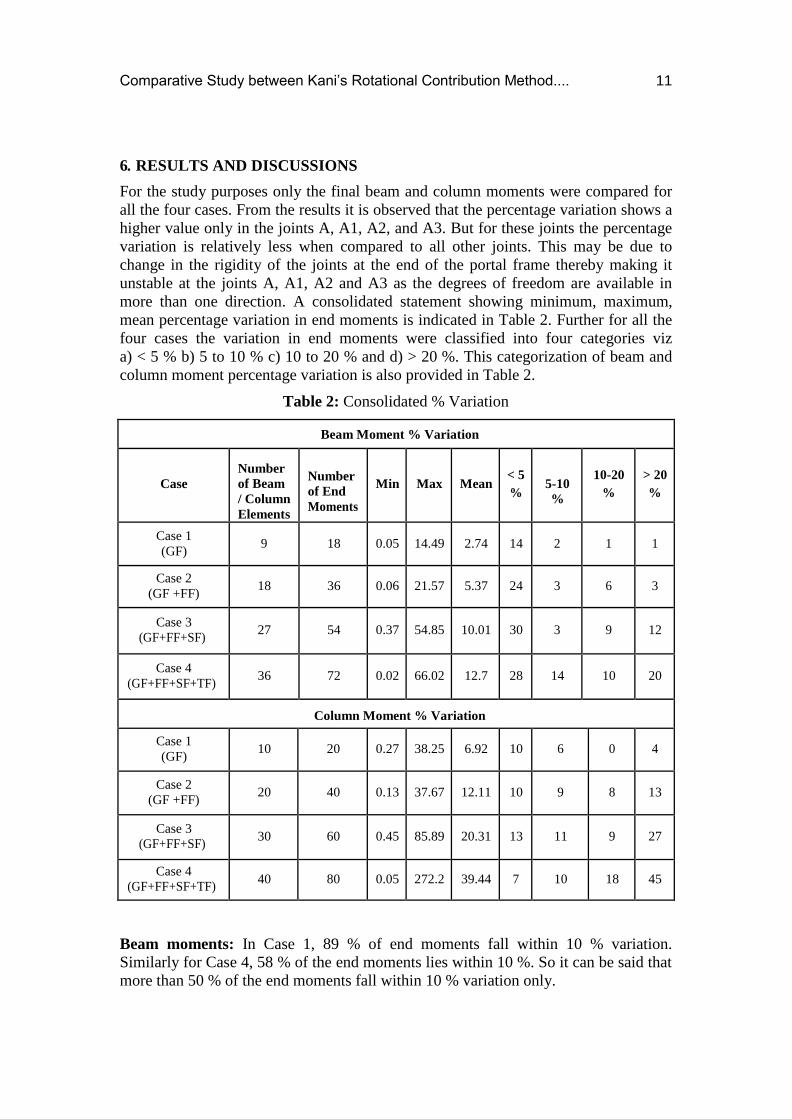
6. RESULTS AND DISCUSSIONS
For the study purposes only the final beam and column moments were compared for
all the four cases. From the results it is observed that the percentage variation shows a
higher value only in the joints A, A1, A2, and A3. But for these joints the percentage
variation is relatively less when compared to all other joints. This may be due to
change in the rigidity of the joints at the end of the portal frame thereby making it
unstable at the joints A, A1, A2 and A3 as the degrees of freedom are available in
more than one direction. A consolidated statement showing minimum, maximum,
mean percentage variation in end moments is indicated in Table 2. Further for all the
four cases the variation in end moments were classified into four categories viz
a) < 5 % b) 5 to 10 % c) 10 to 20 % and d) > 20 %. This categorization of beam and
column moment percentage variation is also provided in Table 2.
Table 2: Consolidated % Variation
Beam Moment % Variation
Case
Number
of Beam
/ Column
Elements
Number
of End
Moments
Min
Max
Mean
< 5
%
5-10
%
10-20
%
> 20
%
Case 1
(GF) 9 18 0.05 14.49 2.74 14 2 1 1
Case 2
(GF +FF) 18 36 0.06 21.57 5.37 24 3 6 3
Case 3
(GF+FF+SF)
27
54
0.37
54.85
10.01
30
3
9
12
Case 4
(GF+FF+SF+TF)
36
72
0.02
66.02
12.7
28
14
10
20
Column Moment % Variation
Case 1
(GF) 10 20 0.27 38.25 6.92 10 6 0 4
Case 2
(GF +FF) 20 40 0.13 37.67 12.11 10 9 8 13
Case 3
(GF+FF+SF) 30 60 0.45 85.89 20.31 13 11 9 27
Case 4
(GF+FF+SF+TF) 40 80 0.05 272.2 39.44 7 10 18 45
Beam moments: In Case 1, 89 % of end moments fall within 10 % variation.
Similarly for Case 4, 58 % of the end moments lies within 10 %. So it can be said that
more than 50 % of the end moments fall within 10 % variation only.
12 Vigneshwer S, Keerthi Priya Tabjula and Thiagu H
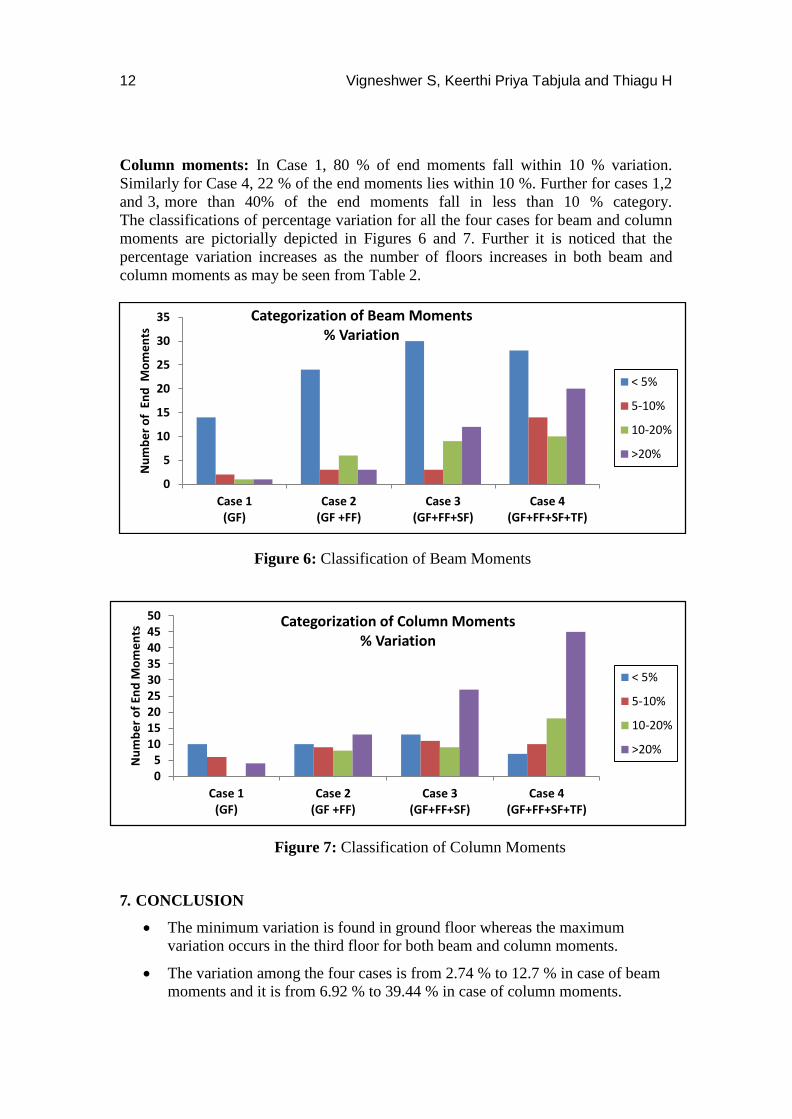
Column moments: In Case 1, 80 % of end moments fall within 10 % variation.
Similarly for Case 4, 22 % of the end moments lies within 10 %. Further for cases 1,2
and 3, more than 40% of the end moments fall in less than 10 % category.
The classifications of percentage variation for all the four cases for beam and column
moments are pictorially depicted in Figures 6 and 7. Further it is noticed that the
percentage variation increases as the number of floors increases in both beam and
column moments as may be seen from Table 2.
Figure 6: Classification of Beam Moments
Figure 7: Classification of Column Moments
7. CONCLUSION
The minimum variation is found in ground floor whereas the maximum
variation occurs in the third floor for both beam and column moments.
The variation among the four cases is from 2.74 % to 12.7 % in case of beam
moments and it is from 6.92 % to 39.44 % in case of column moments.
0
5
10
15
20
25
30
35
Case 1(GF)
Case 2(GF +FF)
Case 3(GF+FF+SF)
Case 4(GF+FF+SF+TF)
Nu
mb
er
of
En
d M
om
en
ts
Categorization of Beam Moments% Variation
< 5%
5-10%
10-20%
>20%
05
101520253035404550
Case 1(GF)
Case 2(GF +FF)
Case 3(GF+FF+SF)
Case 4(GF+FF+SF+TF)
Nu
mb
er
of
End
Mo
me
nts
Categorization of Column Moments% Variation
< 5%
5-10%
10-20%
>20%
Comparative Study between Kani’s Rotational Contribution Method.... 13
It is observed that the mean variation increases as the number of floors
increases.
The variation % is found to be more in column moments than in beam
moments.
It can be concluded that more than 50 % of the end moments fall within 10 %
variation for all the four cases for beam moments and more than 40 % of the
end moments lie within 10 % variation for the first three cases in column
moments.
In a nutshell, both the methods are adoptable for practical applications.
However for smaller frames (2 to 3 floors) Kani’s Method is suitable as it is
less time consuming, flexible, self- corrective and easy. In case of larger three
dimensional frames it is suggested to go in for Linear Static Analysis using
STAAD.Pro as the analysis is extendable to push over non linear analysis,
wind and seismic load combinations, graphic interface and design capabilities
(Limit State Method based on IS 456-2000).
REFERENCES
[1] Rashmi Agashe, Marshal Baghele, Vaishanvi Deshmukh, Sharad Khomane,
Gaurav Patle and Kushal Yadav (2020), “To Study, Analysis and Design of
Multi-Storey Building using STAAD.Pro and Comparing with Manual
Calculations”, International Research Journal of Engineering and Technology
(IRJET), Vol. No.7, Issue No 4.
[2] Potharaboyena Vinay and Kurimilla Srilaxmi (2018), “Structural Analysis and
Design of Structural Elements of a Building”, International Open Access
Journal, Vol. No. 2, Issue No 3.
[3] Chiranjeevi M, Udaykumar A and Saikumar S V (2017), “Comparative Study
on End Moments regarding Application of Analytical Methods and
STAAD.Pro software”, International Journal of Engineering, Science and
Mathematics, Vol. No. 6, Issue No 8.
[4] Kushal Shahl, Pankaj Singh (2017), “Analysis of Loads for G+6 Residential
Building using STAAD.Pro (v8i)”, International Journal of Advance Research
in Engineering, Science & Technology, Vol. No. 4, Issue No 7.
[5] Balwinder Lallotra, Dhirendra Singhal (2017), “A Compatability Study on
Design and Analysis of Reinforced Concrete Structural Design using
Software”, International Journal of Engineering and Technology (IJET), Vol.
No. 9, Issue No 2.
[6] Ashok kumar N, Navaneethan M, Naviya B, Gopalakrishnan D, Atun Roy
Choudhury (2017), “Planning, Analysis and Design of Hospital Building using
STAAD.Pro v8i”, International Journal of Scientific and Engineering
Research, Volume 8, Issue 4.
14 Vigneshwer S, Keerthi Priya Tabjula and Thiagu H
[7] Syed Faheemuddin, Mohammed Imran, Noman Fahad, Mohammed Hakeem
Pasha (2016), “Analysis of Multi-Storeyed Building”, International Journal for
Innovative Research in Science and Technology (IJIRST), Vol. No. 3, Issue
No 06.
[8] Ramamrutham S and Narayan R (2015), Theory of Structures, Edition 9,
Dhanpat Rai Publishing Company.
[9] Punmia B C (1986), Strength of Materials and Mechanics of Structures, Vol.
II Edition 7, Standard Publishers Distributors.
[10] IS 456:2000, Plain and reinforced concrete code of practice (Fourth revision).
[11] IS 875:1987 (Part 1), Code of practice for design loads (Dead load)
[12] IS 875:1987 (Part 2), Code of practice for design loads (Imposed load)
[13] SP 16:1978, Design Aids for reinforced concrete to IS 456:2000