commune agroecosystem analysis in cambodia: a guidance manual
TRANSCRIPT

GUIDANCE MANUAL
DEpArtMENt of AGrICULtUrAL ExtENsIoN MINIstry of AGrICULtUrE forEstry AND fIshErIEs, CAMboDIA
CoMMUNE AGroECosystEMs ANALysIsIN CAMboDIA
Enabling poor rural peopleto overcome poverty
GUIDANCE MANUAL

Illustrations: Mr Chongkham phonekeoConcept, design and layout: Mr robert brown
Citation: Department of Agricultural Extension (DAE), Ministry of Agriculture, forestry and fisheries (MAff), Cambodia and CGIAr Challenge program on Water and food (CpWf). 2012. Commune Agroecosystem Analysis in Cambodia: A Guidance Manual. phnom penh, Cambodia: Ministry of Agriculture, forestry and fisheries, Department of Agricultural Extension (DAE); Colombo, sri Lanka: CGIAr Challenge program on Water and food (CpWf). 118p.
DIsCLAIMEr: “this document has been produced with the financial assistance of IfAD and the European Union. the views expressed herein can in no way be taken to reflect the official opinion of IfAD and the European Union”.


forEWorDForeword
Commune Agroecosystems Analysis (CAEA) is a participatory analysis methodology used by the Department of Agricultural Extension to identify and prioritize agricultural development needs at the commune level. In 2004, CAEA was official-ly adopted as the national policy by the Ministry of Agriculture, forestry and fisheries (MAff) for producing Commune Agricultural plans and since then has been conducted in over 500 communes nationwide. funding support for CAEA has been provided by MAff and the Decentralisation and Deconcentration program (D&D), and by a range of donors including the Australian Agency for Inter-national Development (AusAID), the International fund for Agricultural Development (IfAD), the Ja-pan International Cooperation Agency (JICA), the Asian Development bank (ADb), the European Commission (EC) and a number of international non-governmental organizations (NGos).
Cambodian farmers face a number of issues as they experience the rapid transition from subsistence farming to a more market-oriented rural economy. In this context, CAEA is seen by the government
as an extremely important tool to help farmers as well as provincial and district agricultural officials in improving the quality of life, ensuring food se-curity and eradicating poverty.
prior to 2008, CAEA mainly focused on agricultur-al issues, while problems of the fisheries sector, closely interlinked with agriculture in Cambodia, were not well addressed. CAEA users recognized this weakness and agreed that the water and fisheries components of the methodology needed to be strengthened. In 2008, the Challenge pro-gram on Water and food (CpWf) of the Consulta-tive Group on International Agricultural research (CGIAr) provided support for a two-year project to upgrade CAEA with regard to the issues of water and fisheries. this Guidance Manual incorporates the changes and modifications made to CAEA un-der the CpWf project
the Ministry of Agriculture, forestry and fisheries acknowledges the kind assistance provided by the CpWf, and fully supports and endorses the use of this new Guidance Manual.
signed and sealed byH.e. So Khan rithykun,Director General,General Directorate of AgricultureMinistry of Agriculture, forestry and fisheries
III

ACKNoWLDGEMENts

ACKNoWLDGEMENtsAcKnowledgementS
this Guidance Manual for the Commune Agroecosystems Analysis (CAEA) was prepared under project Number 71 ‘Water Allocation in the tonle sap’ of the CGIAr Challenge program on Water and food (CpWf) with funding from the European Union (EU) and International fund for Agricultural Development (IfAD). A wide range of contributors from institutions in Cambodia and international partners were in-volved in the project planning, fieldwork, analysis of the results and preparation of this manual. the im-portant contributions from the following institutions and individuals are greatly appreciated.
the contributions from provincial and district staff of the relevant agencies in pursat and Kampong thom provinces are also gratefully acknowledged. In addition, special thanks go to the Commune Council members and villagers involved in the field testing of the new procedures; without their contribution the revisions in respect of the issues related to water, fisheries and livelihoods described in this CAEA Manual would not have been possible.
International water management Institutesonali senaratna sellamuttuhoanh Chu thairobyn Johnston
worldFish centresamonn MithEric baranMark Duboisrobert Arthur
School of oriental and African Studies, University of london, UKLaurence smith
Independent consultantIain Craig
challenge Program for water & Foodsophie Nguyen-Khoa
department of Agriculture extension, cambodiaMak soeunsameng KeomonineKhean sovannarasay tomhou sopor
Inland Fisheries research and development Institute, cambodiaso NamLeng sy Vannseung sokuntheaseun Nang
department of water resource management and conservation, cambodiatheng tharasuon sam onChea sophal soeum sokhemaLam sophorn Kanitha
V

AbrrEVIAtIoNs & ACroNyMs

VII
AbrrEVIAtIoNs & ACroNyMsADb Asian Development bank
AEA Agroecosystems Analysis
AusAID Australian Agency for International Development
CAAEp Cambodia Australia Agricultural Extension project
CAEA Commune Agroecosystems Analysis
CAp Commune Agricultural plan
CArDI Cambodian Agricultural research and Development Institute
CC Commune Council
CDp Commune Development plan
CGIAr Consultative Group on International Agricultural research
CIp Commune Investment plan
CpWf Challenge program on Water and food
D&D Decentralisation and Deconcentra-tion program (formerly seila)
DAE Department of Agricultural Exten-sion, Cambodia
DAo District Agriculture office
DIW District Integration Workshop
EC European Commission
fsEo farming systems and Economics office [of the DAE]
fsMIs farming systems [Extension] Man-agement Information system
fWUC farmer Water User Community
hs haemorrhagic septicaemia
IfAD International fund for Agricultural Development
IfreDI Inland fisheries research and De-velopment Institute, Cambodia
IWMI International Water Management Institute
JICA Japan International Cooperation Agency
MAff Ministry of Agriculture forestry and fisheries, Cambodia
MLMUpC Ministry of Land Management, Urban planning and Construction, Cambodia
MoWrAM Ministry of Water resources and Meteorology, Cambodia
NCDD National Committee for Decentrali-zation and Deconcentration, Cambodia
NGo Non Governmental organization
Ntfp Non timber forest product
oAE [provincial] office of Agricultural Extension
pbC planning and budgeting Committee [of the CC]
pDA provincial Department of Agricul-ture
pIf provincial Investment fund
QA Quality Assurance
rGC royal Government of Cambodia
rrA rapid rural Appraisal
sME small and Medium Enterprise
sLC social Land Concession
sMs subject Matter specialist
tIps technology Implementation procedures
tsC technical suitability Criteria
UNtAC United Nations transitional Authority in Cambodia
Worldfish World fish Center
AbbrevIAtIonS & AcronymS


tAbLE of CoNtENtstAble oF contentS
Ix
forEWorD II I
ACKNoWLEDGEMENts V
AbbrEVIAtIoNs & ACroNyMs VII
tAbLE of CoNtENts Ix
INtroDUCtIoN 1bACKGroUND to thE CoMMUNE AGroECosystEMs ANALysIs (CAEA) 2
tEChNoLoGy IMpLEMENtAtIoN proCEDUrEs (tIps) 2
CoMMUNE AGrICULtUrAL pLAN (CAp) 2
fArMING systEMs MANAGEMENt INforMAtIoN systEM (fsMIs) 3
AGroECosystEMs ANALysIs 7KEy CoNCEpts 8systEMs ...................................................................................................................................................................8
systEM hIErArChIEs .................................................................................................................................................8
AGroECosystEMs .....................................................................................................................................................8
systEM propErtIEs ..................................................................................................................................................8
EVoLUtIoN of AGroECosystEMs 8
AEA AssUMptIoNs 9
AEA pUrposE 9AEA obJECtIVEs ........................................................................................................................................................9
ExpECtED oUtpUts ...................................................................................................................................................9
CoMMUNE AGroECosystEMs ANALysIs proCEDUrEs 11phAsEs AND stEps 13tEAM CoMposItIoN ................................................................................................................................................. 14
prELIMINAry stAGEs 1 - 3 14stAGE 1. pLANNING AND prELIMINAry ANALysIs .................................................................................................... 14
KEy INforMANt sELECtIoN .................................................................................................................................. 15
stAGE 2. sECoNDAry DAtA CoLLAtIoN AND ANALysIs .............................................................................................. 15
stAGE 3. prELIMINAry ANALsyIs - systEM DEfINItIoN AND boUNDArIEs ................................................................ 16
CoMMUNE ZoNING AND sUbsystEMs ...................................................................................................................... 16
systEM hIErArChy .................................................................................................................................................. 16
rApID rUrAL ApprAIsAL 19spAtIAL ANALysIs tooLs 21MAps & oVErLAys .................................................................................................................................................... 22
thE WAtEr-boDy AttrIbUtE ANALysIs ..................................................................................................................... 24
WAtEr rEsoUrCE UsE ANALysIs .............................................................................................................................. 26
fIsh spECIEs AssEssMENt tAbLE............................................................................................................................. 28
fLoW DIAGrAMs ...................................................................................................................................................... 30
trANsECt DIAGrAM ................................................................................................................................................. 32


xI
tEMporAL ANALysIs tooLs 35hIstorICAL profILE [tIMELINE] ................................................................................................................................ 36
sEAsoNAL CALENDAr............................................................................................................................................... 40
LIVELIhooD ANALysIs tooLs 43WEALth rANKING ANALysIs ..................................................................................................................................... 44
LAND tENUrE ........................................................................................................................................................... 48
LIVELIhooD profILEs ................................................................................................................................................ 50
GENDEr tAsKs ANALysIs ........................................................................................................................................ 52
NoN-tIMbEr forEst proDUCts ................................................................................................................................ 54
ECoNoMIC ANALysIs AND DECIsIoN-MAKING tooLs 57MArKEt AND VALUE-ChAIN ANALysIs ....................................................................................................................... 58
Gross-MArGIN ANALysIs ........................................................................................................................................ 60
pAIr-WIsE rANKING tEChNIQUE ............................................................................................................................... 62
CAUsE-EffECt DIAGrAMs ......................................................................................................................................... 64
VENN DIAGrAM ........................................................................................................................................................ 68
ANALysIs of rrA tooL oUtpUts 71
systEMs ANALysIs 73sWot ANALysIs ....................................................................................................................................................... 74
ANALysIs of systEM propErtIEs ............................................................................................................................ 76
forMULAtING KEy QUEstIoNs AND DEsIGNING soLUtIoNs ....................................................................................... 78
INNoVAtIoN AssEssMENt IMpACt AssEssMENts of poVErty, GENDEr AND ENVIroNMENtAL ................................ 84
LAND AND WAtEr rEsoUrCE ................................................................................................................................... 88
MANAGEMENt strAtEGIEs ...................................................................................................................................... 88
rEport WrItING AND UsE of CAEA oUtpUts .......................................................................................................... 90
fArMING systEMs MANAGEMENt INforMAtIoN systEM (fsMIs) 92fsMIs DAtAbAsE strUCtUrE ................................................................................................................................... 92
fsMIs fUNCtIoNs .................................................................................................................................................... 92
AppENDIx 1 AGrICULtUrAL systEM propErtIEs 95
AppENDIx 2 KhMEr fIsh NAMEs AND GUILDs 97
AppENDIx 3 GLossAry of tErMs rELAtED to LIVELIhooDs ANALysIs 103
tAbLE of CoNtENtstAble oF contentS
xI


INtroDUCtIoN
the last decade has seen rapid economic progress in the Kingdom of Cambodia. per capita income has increased, remaining however low in comparison to that of most of its neighbouring countries. rural households are still mainly dependent on agriculture and its related subsectors for their livelihoods. In view of the importance of agriculture, the Department of Agricultural Extension (DAE) of the Cambodian Ministry of Agriculture, forestry and fisheries (MAff) has developed a demand-driven, district-imple-mented, provincially managed, and centrally facilitated agricultural extension system appropriate to the local needs. this National Extension system has been designed around four pillars:
IntrodUctIon
1
243
1AgroecoSyStemS AnAlySIS
A PArtIcIPAtory needS-ASSeSSment metHod-
ology, USed by tHe dAe to IdentIFy tHe moSt
ImPortAnt ProblemS And develoPment oP-
PortUnItIeS For PeoPle engAged In AgrIcUl-
tUre And relAted ActIvItIeS At tHe commUne
level.
tecHnology ImPlementAtIon ProcedUreS
ImProved AgrIcUltUrAl tecHnologIeS And
SUPPortIng mAterIAlS For SolvIng tHe mA-
jor ProblemS IdentIFIed by commUne AeAS.
A e A
c A P
t I P S
F S m I S
commUne AgrIcUltUrAl PlAn
An IntegrAted PlAnnIng ProceSS to FA-
cIlItAte tHe delIvery oF tIPS to FArmerS
tHroUgH tHe nAtIonAl decentrAlIzAtIon
And deconcentrAtIon ProgrAm (d&d) PlAn-
nIng SyStem.
FArmIng SyStemS mAnAgement InFormAtIon SyStem
A nAtIonAl dAtAbASe For tHe StorAge, mAn-
Agement And dISSemInAtIon oF AeA And tIP
dAtA to Key StAKeHolderS In cAmbodIA.

bAcKgroUnd to tHe commUne AgroecoSyStemS AnAlySIS (cAeA)
the first pillar of the National Extension system, the AEA, has
been adapted to form the Commune Agroecosystems Analysis
(CAEA). this participatory analytical tool has been used by the
DAE since 2001 to identify and prioritize agricultural develop-
ment needs at the commune level. the use of this methodology
was officially adopted as part of the national policy for agricul-
tural development by the royal Cambodian Government (rCG)
in 2004. the CAEA uses multidisciplinary investigation and par-
ticipatory analysis to understand and describe the major farm-
ing systems practiced in each commune, and to identify and
prioritize the most important problems that the farmers face.
based on this, further analyses are conducted to plan appropri-
ate agricultural interventions to address the problems and op-
portunities identified.
CAEA has now been conducted in approximately 500 communes
nationwide supported by a variety of funding sources including
MAff, D&D, the Australian Agency for International Development
(AusAID), the International fund for Agricultural Development
(IfAD), the Japan International Cooperation Agency (JICA), the
Asian Development bank (ADb), the European Commission (EC)
and a number of non-governmental organizations (NGos). It is
usually implemented through contracts with provincial Depart-
ments of Agriculture (pDAs) who are responsible for ensuring
timely outputs of the required quality standards. Quality Assur-
ance (QA) is maintained by a team of professionals in the DAE. A
manual explaining AEA contract and QA procedures is available,
on request, from the DAE in phnom penh.
Up to 2008, CAEA focused mainly on agricultural issues, while
problems of the fisheries sector closely interlinked to agriculture
in Cambodia were not adequately addressed. CAEA users rec-
ognized this weakness and were in agreement that the water
and fisheries component be strengthened. As a consequence,
between 2008 and 2010, fisheries variables were incorporated
and strengthened under the Challenge program on Water and
food (CpWf) project Number 71 of the Consultative Group on
International Agricultural research (CGIAr). this revised CAEA
adopts a more holistic approach through the incorporation of
fisheries variables and also looks at land, water, livelihoods and
institutional issues that influence commune development plan-
ning. this Guidance Manual reflects the revisions made under
the CpWf project.
tecHnology ImPlementAtIon ProcedUreS (tIPS)
technology Implementation procedures (tIps), the second pillar
of the national Extension system, describe improved agricultural
technologies developed to solve those major problems of farmers
as identified by the CAEA. tIps can best be defined as ‘the entire
package of information, procedures, methods and materials nec-
essary for an extension worker to implement the improved tech-
nology’. tIps are intended for use by extension workers, NGos
and others working in agricultural development at the field level.
the tIp concept was introduced by the DAE to facilitate the repli-
cation of improved technologies across communes, districts and
provinces throughout Cambodia according to local agroecological
and socioeconomic conditions.
tIps are commissioned by the DAE, but are prepared by experi-
enced subject Matter specialists (sMss) who are leading experts
in their fields in Cambodia. tIps thus represent the ‘current best
practice’ for each technology. Draft tIps undergo a peer review be-
fore they are endorsed by MAff and approved for field use. Com-
pleted tIps are held in the farming systems [Extension] Manage-
ment Information system (fsMIs) database where they can be
downloaded for use by [provincial] offices of Agricultural Exten-
sion (oAEs), other provincial offices or NGos. Around 30 tIps have
now been completed and are available on request from the DAE.
commUne AgrIcUltUrAl PlAn (cAP)
the third pillar of the National Extension system is the Commune
Agricultural plan (CAp). Under the D&D, Commune Councils first
prepare a three-year rolling Commune Development plan (CDp)
which is reviewed each year to produce an annual Commune In-
vestment plan (CIp), with a work plan and budget. the DAE uses
trained commune and district-level stakeholders to prepare a CAp
as part of the multi-sectoral CDp. the focus has been on support-
ing Commune Councilors, D&D district facilitators and district ag-
riculture staff to (i) conduct a CAEA, (ii) use the CAEA results to
produce a CAp, and (iii) use the relevant CAEA outputs to support
CAp submissions for funding the provincial Investment fund (pIf)
through the D&D Local planning process.
this integration of CAEA, CAp development and the D&D planning
process is described in figure 1.

fIGUrE 1: C/s DEVELopMENt pLANNING proCEss AND CAp DEVELopMENt (source: Inter-ministerial Working Group: guideline on C/s Development plan and C/s Investment program, July 2007)
FArmIng SyStemS mAnAgement InFormAtIon SyStem (FSmIS)
the fourth and last pillar of the National Extension system is the
farming systems Management Information system (fsMIs) held
in the National Agricultural Database. As CAEA coverage expand-
ed, a means of storing and managing the growing amount of data
generated became necessary. the fsMIs was therefore devel-
oped to support the management and sharing of this information
among agricultural development stakeholders at the national and
provincial levels.
the fsMIs has been installed on oAE computers, and CAEA data
are entered by oAE staff. these data are used by each province for
management and planning purposes, and are also uploaded into
the DAE National fsMIs Database in phnom penh.
the fsMIs holds five types of data:
1. Agricultural and Socioeconomic conditions: Data on (i) land
types, (ii) topography, (iii) soil types, (iv) current land use, (v)
cropping systems, (vi) crops grown, (vii) water resources, and
(viii) socioeconomic indicators (family labor, landholding, off-
farm work, rice self-sufficiency, number of livestock, and ma-
jor income sources).
2. major Problems of Farmers: Data on the major farming prob-
lems encountered in each commune, along with their priority.
3. Available tIPs: Data on improved agricultural technologies
available to solve the identified problems.
4. cAeA reports: Archived copies of all CAEA reports produced
by the provinces. Users can access the reports and retrieve
the information.
5. Secondary data: A range of additional statistical and spatial
data sets for use by agricultural extension personnel and re-
searchers.
the fsMIs has been designed to allow a wide range of users, in-
cluding MAff departments, research agencies, NGos, donor or-
3
INtroDUCtIoN

fIGUrE 2: fLoW ChArt of thE NAtIoNAL AGrICULtUrAL ExtENsIoN systEM AND thE rELAtIoNshIps bEtWEEN KEy CoMpoNENts.source: training Manual for provincial Investment fund, CAAEp, phase 2b, MAff, 2007

ganizations and the private sector, to perform a number of differ-
ent functions. It has been developed with dual language capability,
and with a range of different output reporting formats based on
user needs.
the database has been put to a number of different uses, in-
cluding:
�� targeting tIps to common problems and appropriate agroeco-
logical and socioeconomic conditions.
�� Identifying and ranking the most important problems occur-
ring for farmers in Cambodia.�� Identifying national priorities for agricultural research.
�� Locating sites with specific agroecological and socioeconomic
conditions, or where particular crops are grown.
�� Identifying market potential and private-sector opportunities.
�� Identifying potential environmental impacts and important is-
sues related to natural resource management.�� selecting target sites for donor projects and programs
Although it has been used for many different purposes, the single
most important function of the fsMIs is to support the selection
and replication of appropriate tIps to solve the problems identified
by CAEA for inclusion in the CAp. the relationships between the main
components of the National Agricultural Extension system are sum-
marized in figure 2.
INtroDUCtIoN
5


AGroECosystEMs ANALysIs
Agroecosystems Analysis (AEA) is a methodology for the analysis of agricultural livelihood systems and for planning and prioritizing research and de-velopment activities. It was developed at Chiang Mai University in the late 1970s and has since been used for research and extension planning in many different situations throughout the world.
7
It was first used in Cambodia in 1997 at the pro-vincial level and then in 1999 for district planning. CAEA was introduced in 2001, and is currently used by the Cambodian DAE to develop CAps, and forms the primary needs-assessment and planning tool for the agriculture sector of Cambodia’s Nation-al rural Development program and D&D.
AgroecoSyStemSAnAlySIS

Key concePtS
systEMsA system is defined as a set of elements (or components) and re-
lationships within a boundary. the elements of one set have strong
functional relationships with one another but limited, weak or non-
existent relationships with elements in other sets. the central con-
cept of AEA is that it is a “system” and so embodies the system
concepts of hierarchies, properties and agroecosystems.
the combined outcome of the strong functional relationships within
a system is to produce a distinct behavior of the system in that it
responds to stimuli as a whole, even if the stimulus is applied to
only one part of it.
systEM hIErArChIEsthe natural world is a nested hierarchy of systems from the eco-
system down to the gene. the processes of agricultural develop-
ment modify these systems in order to produce food or fiber, thus
creating hybrid agroecosystems, which in turn can be arranged in
a hierarchic scheme.
Ecology links the hierarchy of natural systems with all the vari-
ous disciplines of agriculture, while human ecology provides the
bridge between both these hierarchies and the hierarchy of social
systems - family, kin, minority group, etc. An important feature of
agroecosystem analysis is that each level in the hierarchy has to
be analyzed in its own right.
AGroECosystEMsthe basic unit used in this Guidance Manual is that of an agroeco-
system and may be defined as a spatially and functionally coherent
unit of agricultural activity which includes the living and non-living
components involved in that unit. Very simply, agroecosystems are
natural systems which have been modified by man for food and
fiber production in order to improve their livelihoods. however, an
agroecosystem is not restricted to the immediate site of agricul-
tural activities (e.g. the farm), but rather includes the area where
natural conditions, livelihoods, and social and economic aspects
are impacted by these activities.
As the name implies, an agroecosystem can be viewed as any area
within the subset of a conventional natural ecosystem which has
been modified by humans for agriculture to optimize certain produc-
tive features thus bringing about changes in species habitats and
biophysical conditions. however an agroecosystem is not restricted
to the site of agricultural activities but includes the region impact-
ed by these activities. Linkages with other systems are changed.
Naturally occurring flora species may be replaced by cultivated spe-
cies (crops). Inevitably the composition of natural fauna species will
change too with some opportunistic species taking advantage of
‘new’ niches available. At the same time, the system is made more
complex by the introduction of purposeful management and human
activity. Very simply, agroecosystems are natural systems which
have been modified by man for food and fiber production.
systEM propErtIEs four system properties (productivity, stability, sustainability and
equitability) are used to describe the behavior of agricultural sys-
tems (see figure 3).
ProdUctIvIty:
the level of production of the system (yield, profit, etc., per unit
of land, labor, capital).
StAbIlIty:
the degree to which productivity remains constant over space and
time (measured as the inverse of the variability in productivity).
SUStAInAbIlIty:
the ability of a system to maintain or increase its productivity over
longer periods of time when subjected to stresses or large distur-
bances (trends in productivity).
eqUItAbIlIty:
A measure of how evenly the productivity or the benefits of the
system are distributed among the local population (various meas-
ures of distribution).
evolUtIon oF AgroecoSyStemS
the four system properties of productivity, sustainability, stability
and equitability can be used to trace the historical evolution of an
agroecosystem and to evaluate its productive potential based on
the different forms of land use or the introduction of new technolo-
gies; both of which may have the immediate effect of increasing
productivity, but may also result in decreasing stability, sustain-
ability and equitability. Consequently, agricultural development in-
volves progressive changes in the valuation of the other proper-
ties of agroecosystems. for example, shifting cultivation may have
low productivity and stability, but high sustainability and equitabil-
ity, whereas irrigated paddy rice may have high productivity and
stability, but lower sustainability and equitability. the positive and

negative aspects of system properties vary from place to place
and situation to situation.
AeA ASSUmPtIonS
AEA is based on the following four assumptions:
1. It is not necessary to know everything about the agroecosys-
tem to produce a realistic and useful analysis.
2. Understanding the behavior and important properties of an
agroecosystem requires knowledge of only a few key func-
tional relationships.
3. producing significant improvements in the performance of an
agroecosystem requires changes in only a few key manage-
ment decisions.
4. only a limited number of appropriate key questions need to be
defined and answered.
AeA PUrPoSe
AEA obJECtIVEs 1. Identifying, delineating and characterizing different land-use
systems (agroecosystems) within a given land area.
2. obtaining an improved understanding of agricultural systems
and current land use in these agroecosystem zones and their
key characteristics.
3. Identifying key issues related to the performance of the entire
system and its agroecosystem zones.
4. Identifying agricultural research and extension priorities for
the systems.
5. planning programs, projects and development activities for
the systems.
ExpECtED oUtpUts 1. the delineation and the (biophysical and socioeconomic) de-
scription of agroecological zones (agroecosystems) in each
commune.
2. An improved understanding of the major agricultural livelihood
systems in each zone.
3. A prioritized list of important problems and opportunities at-
tributable to each zone (key questions).
4. A Land Management strategy or ‘development vision’ for each
agroecosystem zone.
5. A prioritized set of research, development and extension ac-
tivities to solve the problems.
fIGUrE 3: systEM propErtIEs the system properties are further explained in the illustrations presented in Appendix 1.
AGroECosystEMs ANALysIs
9

CoMMUNE AGroECosystEMs ANALysIs proCEDUrEs

CoMMUNE AGroECosystEMs ANALysIs proCEDUrEs
commUne AgroecoSyStemS AnAlySISProcedUreS
11
In Cambodia, the CAEA with the endorsement and participation of the Commune Councils (CCs) is performed by district and provincial agriculture staff, initially with training and support from the De-partment of Agricultural Extension (DAE) farming systems section. It is used to identify the major agroecosystems in the commune and to develop a common understanding of their functioning in order to define the key issues or questions affecting their performance. Key questions are then used to de-velop appropriate technological interventions for the implementation of extension programs supported by the provincial Investment fund (pIf).
It is expected that the CAEA for each commune will be revised from time to time in order to cap-ture a contemporary picture of the commune, its
agricultural development status, and any new is-sues and problems that have arisen. Any recently introduced improved agricultural technologies are also assessed in terms of their relevance for solving any outstanding problems during CAEA revisions.
As shown in figure 4, CAEA follows step-wise pro-cedures to define the system(s) being studied, set its boundaries, its position in the hierarchy of other systems and its major components and their inter-actions. As an understanding of these major system properties is developed, a limited number of central issues emerge which are then used to guide partici-patory follow-up in the field and subsequent analy-ses. As these issues are clarified and fleshed out, key questions are tabled, elaborated and used to identify priority extension and development activities.

fIGUrE 4: AGroECosystEMs ANALysIs proCEDUrEs

PHASeS And StePS
there are six key stages of CAEA which follow a logical sequence. the first three stages deal mainly with the initial data collection and
logistical arrangements. During stage 4 a rapid rural Appraisal is conducted to identify the key issues, while stage 5 is an analysis of the
systems. the final stage is that of report writing and determining the use of the results. these stages are summarized below:
StAge 3. PrelImInAry AnAlySIS
�� Identify initial boundaries of the agro-
ecosystem zones within the com-
mune.
�� Draft initial transects and a descrip-
tion of each zone.
�� Identify and fill gaps in information
and data.
�� Assign responsibilities and prepare
for rapid rural Appraisal (rrA) and
field work.
StAge 1. PlAnnIng And PrePArAtIon
�� AEA team formation and organiza-
tion.
�� brief partners (CC, planning and
budgeting Committee (pbC), etc.)
on AEA objectives, procedures and
expected outputs.
�� Explain data collection needs to par-
ticipants and assign responsibilities.
�� Arrange logistics for meeting room,
materials, supplies, transport, etc.
StAge 2. SecondAry dAtA collAtIon And orgAnIzAtIon
�� Assemble, collate and prepare all rel-
evant available data in an appropri-
ate form for use during AEA (see also
function 6 of fsMIs).
�� Data required include spatial data
(topography, elevation, slope, ge-
ology, soils, climate, current land
use, watersheds, rivers, adminis-
tration boundaries, village locations,
roads, etc.) and statistical data (de-
mographic, economic, social, agri-
cultural, climatic, hydrological, etc.).
StAge 5. SyStemS AnAlySIS
�� prepare the information on time, flow,
space and decision-making.
�� present and analyze the information
in plenary sessions.
�� Analyze system properties using
force-field analysis techniques.
�� prepare a cause-effect diagram for
each problem identified.
�� Use pair-wise ranking to rank prob-
lems identified.
�� formulate key questions and pro-
posed solutions.
�� Use the innovation assessment table
to rank proposed solutions.
StAge 4. rAPId rUrAl APPrAISAl
�� select representative participants
from all villages in all agroecosys-
tems.
�� tools used: historical profiles, agroe-
cosystem base maps, transects, sea-
sonal calendars, flow diagrams, Venn
diagrams, etc.
�� Verify and explore key issues with
farmers, fishers and other local stake-
holders.
�� Identify key problems and opportu-
nities with farmers and local stake-
holders.
StAge 6. rePort wrItIng And USe oF cAeA oUtPUtS
�� Draft report and present to the CC,
pbC members and villagers.
�� Incorporate into the report feedback
obtained during the presentation into
the report.
�� presentation of identified priorities
to district and provincial agriculture
staff for consideration in the annual
pIf allocation.
�� Use in the District Integration Work-
shop (DIW) at the time of developing
temporary contracts (refer to other
guidelines for CAEA aggregation to
higher management levels).
�� Archiving the CAEA report in the
fsMIs for use by others at the na-
tional level.
13
AGroECosystEMs ANALysIs

tAbLE 1. thE VENUE AND thE tIME for EACh phAsE of thE CAEA
stAGE of CAEA LoCAtIoN No. of DAys
1. planning and preparation stage District Agriculture office 2
2. secondary data-collection and preparation Commune Council office 3
3. preliminary analysis Commune Council office or DAo 1
4. rapid rural appraisal Commune Council office or selected villages 2
5. systems analysis Commune Council office or DAo 3
6. report writing and use of CAEA outputs provincial Agricultural Extension office 16+2*
* total person-days involving the oAE Chief and staff, the DAo Chief, and fisheries and Environment staff.
tAbLE 2. typICAL CAEA tEAM MEMbErshIp
DEpArtMENt sECtIoN/ExpErtIsE No. of pErsoNs
provincial office of Agricultural Extension Chief and two members of staff from the farming systems section 3
provincial fisheries office senior fishery subject Matter specialist 1
provincial Department of Water resources farmer Water User Group support section 1
provincial Department of Environment senior National resource Management specialist 1
provincial Department of Land Management Land Management specialist 1
District Agriculture office Agronomy, Livestock, fisheries 2
D&D District facilitator Commune Development planning specialist 1
Commune Council and planning and budgeting Committee Local knowledge and CDp/CIp 3
Villager representatives (during rrA phase) Local knowledge/community needs 30
the CAEA is normally conducted under a contract with provincial
Departments of Agriculture and costs around Us$2,000, depend-
ing on the team composition. It requires a total of 11 days of field-
work followed by write-up, presentation and feedback. the vari-
ous stages of CAEA are usually interspersed with breaks of a few
days; thus, the time to complete an AEA may be up to four weeks
or more. the venue and the approximate time each phase takes
is shown in table 1.
tEAM CoMposItIoNthe CAEA is conducted by a multidisciplinary team whose joint experience and technical knowledge cover all disci-plines relevant to agricultural planning in the commune. A typical CAEA team would normally include the members shown in table 2.
PrelImInAry StAgeS 1 - 3
stAGE 1. pLANNING AND prELIMINAry ANALysIs this first stage of the AEA involves data collection and analysis,
and an initial survey of the commune. this stage is usually com-
pleted within a week.
�� Conduct a survey of the commune and complete an initial
transect by motorcycle.
�� Conduct geo-referenced soils identification using the Manual
of the Cambodian Agricultural research Institute (CArDI) and
soil maps. If this is not possible, describe each soil type, and
assess its fertility. �� Collate, present and analyze survey findings from all of the
above.

�� Identify and map draft commune agroecosystem zone bound-
aries.�� finalize selection criteria for key informants participating in
the rrA (stage 4) based on the findings of the preliminary
survey; select sites and times for rrAs and select and notify
key informants.
KEy INforMANt sELECtIoNthe selection of the appropriate key informants for the rrA phase
of CAEA is crucial to the successful use of the tools. As far as pos-
sible, key informants should be representative of the commune
population as a whole, and should include representatives from
those groups described in table 3. In addition to farmers, ensure
that fishermen using different fishing grounds (paddy fields, flood-
ed forests, lakes, rivers, etc.) are included as participants in this
exercise. In addition, ensure both males and females participate.
Allocation of individual key informants to groups using the different
CAEA tools is also important as the representation of certain types
of people may be critical, as explained in the following examples:
�� In wealth ranking, people from each of the different wealth
classes must be involved.
�� for the historical profile, it is necessary to include elderly par-
ticipants who can give a long-term perspective of changes in
prevailing conditions and livelihood patterns.�� In gender analysis there should be equal representation of
males and females.
�� In problem tree and pair-wise ranking exercises a range of key
respondents are needed to capture the different perspectives
of those engaged in different livelihood activities, as well as those from different wealth categories, gender groups and
different age classes.
In addition, a number of other more general characteristics of key
informants are also important. first, key informants should ideally
be knowledgeable about the commune as a whole and in particu-
lar about the agroecosystem zone where they live; they should be
articulate and able to talk in front of large groups; and finally they
should be well-liked and able to get on with others.
stAGE 2. sECoNDAry DAtA CoLLAtIoN AND ANALysIsthe CAEA relies heavily on secondary data which need to be
sourced, collected and organized at the preliminary analysis stage
of AEA. the main types of data include:
1. Spatial data or maps showing topography, elevation, slope,
geology, soils, climate, land use, water-bodies, rivers, admin-
istration boundaries, village locations, roads, etc. overlaying
the various maps acquired helps identify and delineate the
agroecological zones communes.
2. commune statistical data on demographic, economic, so-
cial, agricultural and climatic conditions. Wherever possi-
ble, these data should be disaggregated by village so that
once agroecological zones have been defined, villages can
tAbLE 3. CoMMUNE rEprEsENtAtIoN AND sELECtIoN GUIDELINEs.
rEprEsENtAtIoN sELECtIoN GUIDELINEs
Geographic Ensure key informants are selected from each agroecosystem zone in approximately equal proportions.
Gender Aim for an equal number of men and women
Ethnic Ensure that all ethnic minorities found in the commune are represented and that numbers are in proportion to the total population of each ethnic group
Age Ensure that all age groups are represented in the approximate ratio of 1:3:2 corresponding to young, middle-aged and elderly persons, respectively.
resident period Ensure that the informant has lived in the commune for a few years – the longer the better
Wealth select key informants from better-off, medium, poor and very poor families in approximately equal proportions, but with a slight emphasis on poor representation.
occupation Ensure that key informants include farmers, fishers, Ntfp collectors and others engaged in locally important occupations.
social standing Ensure that there is at least some representation from official leaders (village headmen, etc.), traditional leaders (el-ders) and lay persons (regular farmers and fishers, etc.).
15
AGroECosystEMs ANALysIs

fIGUrE 5. ExAMpLE of A hIErArChy froM prEy tortUNG CoMMUNE, prEy VENG proVINCE.
be allocated to their respective zones, and the data can be
reassembled for the zone as a whole, allowing the zone’s
demographic, socioeconomic and agricultural characteris-
tics to be described.
3. commune profile. the commune profile is a valuable source
of maps and information that can help characterize the com-
mune as a whole and its agroecological zones.
4. commune development Plan (cdP) and commune Invest-
ment Plan (cIP). the CDp and CIp should be obtained and
their key chapters (economic, natural resources and gender)
should be summarized. the summaries should be reviewed
during the preliminary analysis phase of the CAEA and used to guide later analysis (analyses) to ensure that the CAp
generated by the CAEA is compatible with, and supports,
the overall CDp.
Although not always readily available, information on external
factors in the wider rural economy, and the policy and institution-
al environment that may influence household livelihood and re-
source allocation decisions should be compiled and used. Where
available, statistics on unemployment, participation in the labor
market and off-farm labor should be obtained and discussed.
this can be used to prompt an assessment of the state of the
labor market, and in turn lead to discussions on market develop-
ment for agriculture and fishery-related inputs and outputs, and
the general economic and livelihood opportunities in the area.
stAGE 3. prELIMINAry ANALysIs - systEM DEfINItIoN AND boUNDArIEsthe commune system boundary is mapped, usually on a 1:50,000
topographic map. following the field survey and initial transect, draft
agroecosystem boundaries are added along with any other features
identified during the initial survey. Commune land-use maps of the
Ministry of Land Management, Urban planning and Construction,
Cambodia (MLMUpC) are an important input to agroecosystem zon-
ing and should be obtained in advance for system definition.
CoMMUNE ZoNING AND sUbsystEMsA number of subsystems or agroecosystem zones can be identified
in all communes. these zones are essentially areas of similar land
use and agriculture, and the farming systems in each zone have
similar problems and agricultural development potential. these
zones are usually characterized by different soils, topography, hy-
drology and resource endowments. In most cases, three to six dis-
tinct zones can be identified in a commune.
systEM hIErArChythe system hierarchy comprises the systems above and below the
commune which have strong interactions with it. An example from
the svay rieng province is shown in figure 5.


rApID rUrAL ApprAIsAL
rAPId rUrAl APPrAISAl
19
stage 4 of the CAEA is that of the rapid rural Ap-praisal (rrA) involving participatory discussions with representative male and female participants from all villages in the commune. rrA teams ob-tain additional information and explore the key is-sues identified in the preliminary analysis in greater depth. farming systems, fisheries and livelihood typologies are developed for each agroecosystem, and problems and opportunities are explored in a participatory manner with key informants (usually three to four from each village, and perhaps seven to eight from each zone depending on the number of zones and the population in each zone).
the following sections of this Manual describe the range of participatory tools used during the rrA. to ensure the quality and reliability of the infor-mation obtained, and that it reflects an accurate picture of the commune situation, it is important to be aware of and work within the limitations of each of the rrA tools. Where there are obvious difficulties in getting responses to the questions posed, it is better to leave some questions unan-swered rather than forcing the issue and obtain-ing inaccurate information.
SPATIAL AnALySIS TooLS

spAtIAL ANALysIs tooLs
SPAtIAl AnAlySIS toolS
21
MAps & oVErLAys __________________________________________ 22
thE WAtEr-boDy AttrIbUtE ANALysIs ___________________________ 24
WAtEr rEsoUrCE UsE ANALysIs _______________________________ 26
fIsh spECIEs AssEssMENt tAbLE _______________________________ 28
fLoW DIAGrAMs ___________________________________________ 30
trANsECt DIAGrAM _________________________________________ 32

1obtain copies of all available
maps from D&D, provincial
offices of MLMUpC, CCs, rele-
vant government agencies and
NGos during the secondary data
collection and preliminary sur-
vey phase of the CAEA.
2overlay each map on all
the others and begin to
draft what appear to be dis-
tinct zones.
3Continually refine the maps
and the draft agroecosys-
tem zones as new information
is obtained throughout the CAEA
process.
4Use the draft maps with
villagers during the rrA
to ground-truth their accu-
racy and to capture additional
spatial information for the com-
mune.
5Cross-check with the water
sources listed in the Water
resource Use Matrix tool (see
table 5) to ensure that they are
recorded on the map and in the
Water-body Attribute Analysis
Matrix (see table 4).
6During the systems Analysis
(stage 5) all the map layers
are overlaid with one another in
order to identify important spa-
tial interactions among natural
resources, er bodies, soil types,
land use, irrigation, agriculture,
fisheries, etc.
mAPS & overlAyS
ChECKL Ist
Commune maps should be produced for the following:
Administrative boundaries. √
Village locations, roads and government services. √
rivers, streams, boeungs and other important water resources. √
Irrigation systems (functioning systems and those in disrepair). √
hydrology and flood regimes. √
soil types and geology. √
Land use and natural resources. √
Any other relevant factors. √
A selection of example maps and the agro-ecosystem zones from the map overlay anal-ysis are presented on the right in figure 6.
true-to-scale map layers should be produced for a number of different parame-
ters, including administrative boundaries, village location, services and communi-
cations, land use, soil types and water resources. All maps should be to the same
scale and ideally produced on transparency sheets so that they can be overlaid
and displayed on an overhead projector to analyze spatial relationships and to help identify the agroecosystem zones in the commune.
GIs facilities to aid map production are available through the DAE in phnom penh
and in some provincial districts. the fsMIs contains base data sets relevant to CAEA. the central fsMIs database is held at the DAE in phnom penh, and fsMIs
software has been installed on the oAE computers in 13 provinces. relevant digital
data sets and on-line mapping facilities are also available from the Atlas of Cambo-
dia at http://www.cambodiaatlas.com/. Alternatively, the Atlas of Cambodia pro-
duced by save Cambodia’s Wildlife in 2006 and available as a stand-alone CDroM
in major bookshops for Us$10 allows the production of custom maps of target prov-
inces or communes (1:80,000 terrain, roads and administrative boundaries, soil
types, 2002 land use, rice ecosystems, etc).
Where computer facilities are not available, hard copy maps can be produced using
transparencies or tracings over hard copy topographic maps or aerial photographs.
If no suitable base maps are available, sketch maps can be drawn by hand. these
should be as close to scale as possible, but should concentrate more on identifying
the main features in the commune than on absolute spatial accuracy.
Mapping should begin during the preliminary survey stage and maps should be
continually added to, and revised throughout, the CAEA process. Initial draft maps should be used with villagers during the rrA to ground-truth and revise all
spatial information associated with the commune.
KEy stEps

fIGUrE 6: GENErIC ExAMpLEs of MAps UsED for spAtIAL ANALysIs (trANGEI CoMMUNE, KAMpoNG ChhNANG) (source: http://www.cambodiaatlas.com/map)
spAtIAL ANALysIs tooLs
23
A. roADs AND WAtEr boDIEs
C. forEst CoVEr (2006)
b. ELEVAtIoN
D. sAtELLItE IMAGE (source: Google Earth)

the Water-body Attribute Analysis Matrix is used to improve understand-ing of the different water resources in the commune and to capture and analyze information on how they are used and on the aquatic resources they contain. An example of tool outputs is provided in table 4.
tHe wAter-body AttrIbUte AnAlySIS
1participant characteristics –
in addition to farmers, ensure
that fishermen using different
fishing grounds (e.g., paddy
fields, flooded forests, lakes,
rivers etc.) in the AE zone are
included as participants for this
tool. In addition, ensure both
males and females participate.
2During the rrA, use the
water resource map layer
to identify all important water
sources in the commune and
list these in the first row across
the top of the matrix.
3Use the matrix with key
respondents to record all
the key characteristics of each
water source.
4After the analysis, spend
time in summarizing the key
findings. In particular, compare
productivity levels in different
water bodies and identify the
reasons for any differences; also
assess the extent to which the
different water bodies together
are able to provide stable, year-
round benefits.
5summarize the findings from
item 3 above for use during
the systems Analysis (stage 5)
of the CAEA.
ChECKL Ist
Water body types to be analyzed by this tool should include:
rivers, perennial streams, seasonal creeks, reservoirs, lakes, aquaculture ponds, trap ponds, swamps, canals, rice paddies, etc.
√
Attributes of water bodies should include the following:
Agroecosystem zones where the water body occurs. √
seasonality (seasonal or permanent). √
Connectivity (with other water bodies). √
Key water use conflicts and short description. √
Water use regulations. √
fishing gear used. √
Key fish species. √
Key environmental concerns/risks. √
breeding/feeding/refuge site? √
Use of water body by women. √
Use of water body by men. √
An example of the tool outputs is provided in table 4.
KEy stEps

spAtIAL ANALysIs tooLs
25
WAt
Er b
oD
y
strE
AMs
(oU
)LA
KEs
(bo
EUN
G)
CANA
Ls
(pr
ALA
I)DE
Ep-p
ooLs
(A
NG
Lo
oN
G)
trAp
-poN
Ds(b
IAh
)rI
CE p
ADDI
Es
AttrIbUtE
AGro
ECos
ystE
M Z
oNE
W
hErE
WAt
Er b
oDy
oCCU
rsM
ount
ain,
upl
and,
mid
dle/
low
er te
rrace
and
floo
dpla
in
flood
plai
n a
nd m
iddl
e te
r-ra
ce zo
nes
Upla
nd, m
iddl
e te
rrace
, and
lo
wer
terra
ce zo
nes
Mou
ntai
n zo
ne
flood
plai
nM
iddl
e an
d lo
wer
ter
race
s zo
nes
sEAs
oNAL
Ity
(s
EAso
NAL
or p
ErM
ANEN
t)M
ount
ain zo
ne a
ll-yea
r-rou
nd.
othe
r zon
es se
ason
alflo
odpl
ain:
all-
year
-roun
dM
iddl
e te
rrace
wat
er in
dry
se
ason
Wet
-sea
son
wat
er o
nly
All-y
ear-r
ound
wat
erAl
l-yea
r-rou
ndW
et s
easo
n on
ly
CoNN
ECtI
VIty
(W
Ith
othE
r W
AtEr
boD
IEs)
Conn
ecte
d to
dee
p po
ols,
to
nle
sap,
can
als
and
rice
radd
ies
in th
e w
et s
easo
n
flood
plai
n bo
eung
s co
nnec
t-ed
to to
nle
sap.
Mid
dle
terra
ce b
oeun
gs c
on-
nect
ed t
o st
ream
s &
rice
padd
ies
durin
g pe
ak ra
infa
ll
Conn
ecte
d to
stre
ams,
tonl
e sa
p an
d pa
ddy
field
s du
ring
the
wet
sea
son
Conn
ecte
d to
stre
ams,
ca-
nals,
ric
e pa
ddie
s an
d th
e to
nle
sap
in th
e w
et s
easo
n
Conn
ecte
d to
tonl
e sa
p via
‘pre
k’Co
nnec
ted
to st
ream
s, an
d ca
-na
ls du
ring
the
wet
seas
on
KEy
WAt
Er U
sE C
oNfL
ICt
AND
shor
t DE
sCrI
ptIo
N
Wat
er u
se fo
r agr
icultu
re u
p-st
ream
redu
ces
dow
nstre
am
wat
er a
vaila
bilit
y
retti
ng (s
oakin
g) p
alm le
a-ve
s fo
r roo
f tha
tch
conf
licts
with
fis
hing
activ
ities
Upst
ream
use
of c
anal
wat
er
for a
gricu
lture
redu
ces
dow
n-st
ream
wat
er a
vaila
bility
None
None
WAt
Er U
sE r
EGUL
AtIo
Ns
No
rule
s fo
r irri
gatio
n w
ater
us
e. h
ave
rule
s on
fish
ing
but
not a
lway
s fo
llow
ed
No
rule
s fo
r irri
gatio
n w
ater
us
e. h
ave
rule
s on
fish
ing
but
not a
lway
s fo
llow
ed
No re
gulat
ions
for u
se o
f wa-
ter f
or a
gricu
lture
or f
isher
ies
None
None
None
(priv
atel
y ow
ned
land
)
fI shI
NG G
EAr
UsED
trap
s, p
ush-
nets
, hoo
ks,
bask
et tr
aps,
ele
ctric
ityha
nd-b
aske
ts, g
ill-ne
ts, e
lectri
c-ity
(illeg
al)Lo
ng lin
es o
f hoo
ks, g
ill ne
ts,
thro
w-n
ets,
ha
nd fi
shin
g (ti
cklin
g), e
lec-
trici
ty (i
llega
l)pu
ll lon
g ne
ts a
cros
s tra
p po
nds
KEy
fIsh
spEC
IEs
snak
ehea
d, w
alkin
g sn
ake-
head
, ca
tfish
, pe
acoc
k ee
l, cl
imbi
ng p
erch
snak
ehea
d, c
atfis
h, c
limbi
ng
perc
h, p
eaco
ck e
el, c
omm
on
eel, b
ronz
e fe
athe
rbac
k
Mai
nly
juve
nile
s of
clim
bing
pe
rch,
pea
cock
eel
, cat
fish,
cr
abs,
shr
imps
and
frog
s
snak
ehea
d, w
alkin
g sn
ake-
head
, ca
tfish
, pe
acoc
k ee
l, cl
imbi
ng p
erch
snak
ehea
d, w
alkin
g sn
ake-
head
, ca
tfish
, pe
acoc
k ee
l, cl
imbi
ng p
erch
ENVI
roNM
ENtA
L Co
NCEr
Ns A
ND r
IsKs
Use
of n
atur
al p
oiso
ns f
or
fishi
ng. U
se o
f ele
ctric
ity fo
r fis
hing
retti
ng (s
oakin
g) p
alm
leav
-e
s fo
r roo
f tha
tch
deox
ygen
-at
es w
ater
Ille
gal f
ishin
g im
-pa
cts
on fi
sh p
opul
atio
ns
Infil
tratio
n of
che
mic
al fe
rti-
lizer
s po
llutio
n by
laun
dry
de-
terg
ents
. Ele
ctric
al fi
shin
g is
redu
cing
fish
sto
cks
Use
of n
atur
al p
oiso
n (fr
om
tree
bark
) and
ele
ctric
ity fo
r fis
hing
are
redu
cing
fish
pop-
ulatio
n su
stain
abilit
y
No n
egat
ive im
pact
s
brEE
DING
/fEE
DING
/ rE
fUGE
sIt
E?fe
edin
g an
d re
fuge
site
feed
ing
and
refu
ge s
itefe
edin
g sit
e on
lyfe
edin
g, b
reed
ing
an
d re
fuge
site
feed
ing,
bre
edin
g an
d
refu
ge s
itefe
edin
g sit
e on
ly
UsE
of W
AtEr
boD
y by
WoM
EN
hom
e ga
rden
irrig
atio
n,
cook
ing
wat
er, d
rinkin
g.
fishi
ng,
retti
ng
(soa
king)
pa
lm le
aves
for r
oof t
hatc
h.fis
hing
, drin
king,
was
hing
cl
othe
s, b
athi
ng, c
ookin
gfis
hing
, drin
king,
clo
thes
-w
ashi
ng, b
athi
ng, c
ookin
gfis
hing
(30%
wom
en)
UsE
of W
AtEr
boD
y
by M
EN
fishi
ng, i
rriga
tion
(wet
sea
-so
n), c
attle
-raisi
ng
fishin
g, c
attle
-tend
ing, w
ash-
ing (w
hen
away
at n
ight).
fishi
ng.
None
fishi
ng (7
0% m
en)
tAbLE 4: ExAMpLE of WAtEr-boDy AttrIbUtE ANALysIs MAtrIx

Water is used by people for many different, often conflicting purposes. In the analysis of water resources, the CAEA takes into account all the vari-ous water uses i.e. use for irrigation, fishing, cattle, conservation, recrea-tion, transport, drinking and domestic use. A Water resource Use Matrix is used to assess this wide range of water uses and to help identify key water resource development needs. the Water resource Use Matrix tool is used to improve understanding the use of the different water sources in the commune at different times of the year and to capture and analyze in-formation on their key characteristics. Examples of outputs from this tool are presented in table 5.
wAter reSoUrce USe AnAlySIS
1participant characteristics
– in addition to farmers
ensure that fishermen who
use different fishing grounds
(e.g., paddy fields, flooded
forests, lakes, rivers) in the
agroecosystem zone are
included as participants in this
exercise. In addition, ensure
both males and females par-
ticipate.
2During the rrA, identify all
important water sources in
the commune and list these in
the first row across the top of
the matrix.
3With the key informants,
use the matrix to record
the various uses of each water
source in both the dry and the
wet seasons.
4Cross-check with the water
resource map to ensure that
all important water sources
have been assessed by the
Water resource Use Matrix
(see table 5).
5At the end of the analysis,
spend a few minutes with
participants in summarizing the
most important findings from the
tool. In particular, assess how
the different water sources are
used in the different seasons and
identify any constraints on water
availability that may occur dur-
ing certain periods.
6summarize the findings from
item 5 above for later use
during the systems Analysis
(stage 5) of the CAEA.
ChECKL Ist
Water resources that should be covered in the analysis include:
All surface water bodies (as de-tailed in table 5) √
Groundwater resources (wells, pumps, bores) √
rainwater tanks or reservoirs √
other water sources used for do-mestic supply (such as piped wa-ter, tanks, bottled water).
√
KEy stEps

spAtIAL ANALysIs tooLs
27
WEt sEAsoN (JUNE–DECEMbEr) Dry sEAsoN (DECEMbEr-JUNE)
WAtEr soUrCEst
rEAM
s
rEsE
rVoI
rs
poN
Ds
rIVE
rs
LAKE
s
othE
ra
WAtEr UsE
Cooking/drinking √ √ √√ √
Washing/bathing √ √ √√ √
Irrigation √√ √ √√
Watering livestock √√√ √√ √
home gardens √√ √√√ √
fishing √√ √
others (specify) √√ √√√ √
WAtEr soUrCE ChArACtErIstICs
Water quantity √√√
Water quality √√√
fish productivity √√
reliability √√√ √√ √√ √
Equitable access √ √ √
WAtEr soUrCE rANK
rank
strEAMs
rEsErVoIrs
poNDs
rIVErs
LAKEs
oth Era
rank water sources from most to least important to livelihoods (1 = most important)b
WAtEr soUrCE
strE
AMs
rEsE
rVoI
rs
poN
Ds
rIVE
rs
LAKE
s
othE
ra
WAtEr UsE
Cooking/drinking √ √ √√ √√√
Washing/bathing √ √ √√ √√√ √
Irrigation √√ √
Watering livestock √√ √
home gardens √√ √
fishing √√ √
others (specify) √√
WAtEr soUrCE ChArACtErIstICs
Water quantity √√√
Water quality √√ √√
fish productivity √√ √√
reliability √√
Equitable access** √ √√√ √√ √√ √ √√
WAtEr soUrCE rANK
rank
strEAMs
rEsErVoIrs
poNDs
rIVErs
LAKEs
othEra
rank water sources from most to least important to livelihoods (1 = most important)b
LEGEND water use: √√√=Importantsource √√=Significantsource √=Marginalsource 0=Unusedcharacteristics: √√√=Verygood √√=Good √=Marginal 0=Poor
a please specify any other resource used.b the answer is expected to include the river, which is the most important water resource as it is close to the village but there is a lack of water from
March to May.
tAbLE 5: WAtEr rEsoUrCE UsE MAtrIx for WEt AND Dry sEAsoNs

this tool is used to assess the threats facing important fish species and to identify potential impacts from proposed water resource infrastructural development projects on these species. An example of tool outputs is presented in table 6.
FISH SPecIeS ASSeSSment tAble
1participant characteristics –
in addition to farmers ensure
that fishermen using different
fishing grounds (e.g., paddy
fields, flooded forests, lakes, riv-
ers) in the agroecosytem zone
are included as participants in
this exercise. In addition, ensure
both males and females par-
ticipate.
2List the five most impor-
tant fish species for each
water body identified by the
Water-body Attribute Matrix
in the appropriate row in the
table.
3With the key informants,
rank the five species in
order of their importance to
the commune (i.e. 1= most
important) and identify why each
species is important. for exam-
ple, a species may be important
because of its high value, even
if its abundance is low, or con-
versely low-value fish may be
important due to the large vol-
ume caught.
4for each species, ask the
key informants to identify the
season(s) when it is fished, the
main types of gear used and the
percentage change in the aver-
age catch over the last 10 years.
record the information in the table.
5for each fish species, have
the fisheries Administration
CAEA team member record
which category of fish (guild) it
belongs to (black, white or grey).
see Appendix 2 for Khmer fish
Names and Guilds.
6At the end of the analysis,
spend a few minutes with
the key informants in summa-
rizing the key findings from the
tool. In particular, compare the
productivity of different spe-
cies (catch x value) and explore
the reasons for changes in
species populations in the
last 10 years.
7summarize the findings from
‘item 5’ above for use dur-
ing the systems Analysis phase
of CAEA.
KEy stEps

spAtIAL ANALysIs tooLs
29
WAtEr boDy: rICE fIELD
fIsh fIshING sEAsoN GEAr UsED Why IMportANt % ChANGE IN thE pAst 10 yEArs
fIsh CAtEGory (GUILD) rANK
trey ros (Channa striata)
Jun-Nov
Cast net, gillnet, trap, pumping, electro-fishing
sold for a high price, abundant
Declined 60% black 2
trey Kranh (Climbing Perch Anabas testudineus)
Jun-Nov Very abundant stable black 1
trey Changva Angkor (Garra cambodgiensis)
Jun-Nov Not so important ? black 5
trey Chlounh (Macrognathus siamensis)
Jun-Nov sold for a good price Declined 30% black 4
trey Kanhchos thmor (Pseudomystus siamensis)
Jun-Nov sold for a high price Declined 20% black 3
WAtEr boDy: strEAM
fIsh fIshING sEAsoN GEAr UsED Why IMportANt % ChANGE IN thE pAst 10 yEArs
fIsh CAtEGory (GUILD) rANK
trey Chhpin (Hypsibarbus malcolmi)
April-June
Gillnet, cast net, traps
household consumption
stable White 2
trey Khya (Hemibagrus wyckioides)
Jun -Dec sold for good price Declined 10% Grey 5
trey Kanhchrouk krohorm (Botia modesta)
Nov-March Very abundant Declined 50% White 3
trey pra po (Pangasius larnaudii)
April-Jun sold for a high price Declined 40% White 4
trey riel top (Henicorhynchus siamensis)
Nov-March Very abundant, house-hold consumption
Increased 20% White 1
tAbLE 6: ExAMpLE of AssEssMENt of fIsh spECIEs IN tWo WAtEr boDIEs

flow diagrams are used to analyze the flow of inputs, money, information, labor, etc. flows occur from one agroecosystem zone to another (e.g. mi-gration of grazing cattle from zone to zone in different seasons); and also up and down the hierarchy (e.g. between commune, district and province). As a consequence two flow diagrams (see figures 7 and 8) are normally drawn in order to improve clarity and reduce complexity. figure 9 presents an example of the final flow diagram.
Flow dIAgrAmS
1participant characteristics –
in addition to farmers ensure
that fishermen using different
fishing grounds are included
as participants in this exercise.
2Construct a diagram to
display flows among the
agroecosystem zones as shown
in template 1 of figure 7, and
another to display flows up and
down the system hierarchy as
shown in template 2 of figure 8.
3With the key informants,
record flows up and down
the hierarchy and also from zone
to zone, using the checklist to
ensure comprehensive coverage.
4At the end of the analy-
sis, spend a few minutes
with the farmers in summariz-
ing key findings from the tool. In
particular, identify constraints,
problems or missed opportuni-
ties related to flows.
5summarize the findings from
item 3 above for use during
the systems Analysis (stage 5)
of the CAEA.
ChECKL Ist
the following checklist should be used to identify locally important flows that should be analyzed with the villagers during the rrA:
flows of agricultural inputs (fertilizer, pesticides, feed, fingerlings, medi-cines, etc.) and agricultural machin-ery (tractors, combines, implements, fishing gear, etc.).
√
farm produce (crops, livestock, fish, Ntfps). √
Agricultural information (techniques, prices, inputs, etc.). √
seasonal migration (women and men) and labor flows (on-farm and off-farm).
√
Credit (formal and informal). √
Livestock movements (grazing, ref-uge, sales). √
fish migration, breeding and refuge. √
others (as locally important). √
KEy stEps

spAtIAL ANALysIs tooLs
31
fIGUrE 7: tEMpLAtE 1 fLoW DIAGrAM for rECorDING bEtWEEN AGroECosystEMs
fIGUrE 8: tEMpLAtE 2 fLoW DIAGrAM for rECorDING fLoWs Up AND DoWN thE hIErArChy.
fIGUrE 9: ExAMpLE fLoW DIAGrAM, stUNG ChINIt IrrIGAtIoN systEM, KAMpoNG thoM proVINCE
A G R OE C O LO G I C A L
Z O N E 4
A G R OE C O LO G I C A L
Z O N E 2
A G R OE C O LO G I C A L
Z O N E 2
A G R OE C O LO G I C A L
Z O N E 4
P R O V I N CE
D I S TR I CT
COMMUNE
V I L L A G E
A G R OE C O LO G I C A L
Z O N E 4
A G R OE C O LO G I C A L
Z O N E 2
A G R OE C O LO G I C A L
Z O N E 2
A G R OE C O LO G I C A L
Z O N E 4
Z O N E 1 Z O N E 4
Z O N E 3
V I L L A G E SI N Z O N E 2
MAJOR FLOW OF RESOURCES TO AND FROM
ZONE 2
E X P O R T C AT T L E
O U T S I D E
T H E P R O V I N C E
M IGRAT ION O F WOMEN
TO WORK IN
GARMENT FACTOR I ES
EXPORT P I G
S , CHI CKEN
S ,
WATERM
ELON
S AN
D R I C E
OU
TS IDE TH
E PROV IN
CE
( V IA TH
E DI S TR I C T M
ARKET
P I G L E T S A R E
I M P O R T E D F R O M
A N OT H E R P R O V I N C E
SEED, FERT I L
I ZER , P
EST I CI D
E
EXPORT FODDER IN
WET S
EASON
/ IM
PORT IN D
RY SEASON
WOOD A
ND SUB F
OREST PRODUCTS
CRED
I T
V EGETABLES
FUR
NI T
UR
E M
AN
UFA
CTU
RED
AN
D S
OLD
IN
TH
E PR
OV
INC
E
K N I V E S A N D A X E S M A N U FA C T U R E D
A N D S O L D O U T S I D E T H E P R O V I N C E
( V I A T H E D I S T R I C T M A R K E T
C O M M U N E S
D I S T R I C T S
P R O V I N C E
Z O N E S
MIG
RA
TIO
N R
AIS
E D
UC
KS
A
ND
WO
RK
IN
D
EEP
WA
TER
RIC
E FI
ELD
S
M I G R AT I O N TO F I S H I NT H E R I V E R S A N D C U T W O O DI N T H E F O R E S T

Key StePS
A transect diagram (figure 10) is used to describe and compare agroeco-system zones according to a standard set of agroecological and socioeco-nomic parameters.
trAnSect dIAgrAm
1With the key informants,
develop a transect diagram
during the rrA to describe all
the parameters included in the
template and checklist.
2Continually expand, revise,
and refine the transect dia-
gram during the CAEA process
as new information comes to
light.
3During the systems Analysis
(stage 5) of the CAEA, use
the transect diagram to iden-
tify important issues and key
questions prior to developing
appropriate tIps for their solution.
4At the end of the analysis,
spend a few minutes with
farmers in summarizing the
most important findings from
using the tool. In particular,
assess how the different water
sources are used in the differ-
ent seasons and identify any
water availability constraints
that may occur during cer-
tain periods.
5summarize the findings from
item 4 above for later use
during systems Analysis phase
of the CAEA.
ChECKL Ist
Information on all of the following parame-ters should be included in the final transect diagram (figure 11):
representative photograph and a general description of each agroeco-system zone.
√
Land cover, topography, geology/soils, hydrology, water bodies and irrigation schemes.
√
Natural ecology, wildlife. √
Wet and dry-season land use including crops, livestock and fish-eries.
√
Major income and nutrition sources. √
problems, opportunities and key issues. √
swamps √
Canals √
rice paddies √

spAtIAL ANALysIs tooLs
33
AGroECosystEM ZoNE
LoWLAND WEt-sEAsoN rICE NEAr pErMANENt LAKEs AND strEAMs
LoWLAND WEt-sEAsoN rICE AND rEsIDENtIAL ArEA
sEAsoNALLy fLooDED opEN GrAssLANDs WIth No pADDy bUNDs
soil type sandy mixed soil black soil near lakes and streamsCArDI soils Classificationprateah Lang, some Koktrap
sandy mixed soilCArDI soils Classificationprateah Lang, some Koktrap
black soilCArDI soils ClassificationKoktrap
hydrology seasonally inundated land.vInundation period - July to November
seasonally inundated land.Inundation period - August to Novem-ber
seasonally flooded land.flood period - June to December
Water sources rainfall some irrigation
rainfall river floodrainfall
Crops Wet-season ricesome small areas of dry-season riceGrassland.
Wet-season ricesome fruit trees and secondary crops (in and around villages).
small area of wet season (near edge of the flood zone)some attempts at dry-season rice.open grassland (no rice paddy bund)
Livestock Cow, buffalo, pigs (mainly breeding sows), chicken and duck
Cow, buffalo, fattening pigs, chicken and duck
Cow, buffalo (rangeland)
Land Use Lowland wet-season rice productionGrazing land (cattle/buffalo)Natural fishingWhere permanent water is available farmers can irrigate early rice in May and/or grow some dry-season rice from December to March/April
Lowland wet-season rice productionVillage land, fruit trees and mixed crops.
open grassland, grazing buffalo (most) and cattle (a few)Natural fishing
problems Illegal fishing in lakes and streamspoisoning of fish and wild birds Lack of water (shallow water in lakes and streams during the dry season)
Natural fertilizer stolen for sale to Vi-etnamCattle diseases (fMD)pigs – diarrheaChicken and duck – CholeraInsect damage to the traditional rice crop - rice bugs and stem borersrat damage in the wet-season croppoor soil fertility
Illegal fishingAcid-sulphate soilsCattle disease – fMDCholera in chicken and duckspigs – internal parasites
opportunities Mat weaving Using bamboo for construction, handi-craft (baskets) and others Dry-season rice where permanent wa-ter is available for irrigationGreen manure crops or other legumes prior to, or following, the wet-season rice crop to improve soil fertility and rice yields
Mat weaving when labor is available - after transplanting riceUsing bamboo for construction, handi-craft (baskets) and others fish raising in ponds close to housesGreen manure crops or other legumes prior to, or following, the wet-season rice crop to improve soil fertility and rice yields
fishing from lakes or riversImproved pastures in grassland are-as for the development of commercial cattle production
fIGUrE 10: ExAMpLE trANsECt DIAGrAM
fIGUrE 11: fINAL trANsECt DIAGrAM

tEMporAL ANALysIs tooLs
temPorAl AnAlySIS toolS
hIstorICAL profILE (tIMELINE) _______________________________ 36-38
sEAsoNAL CALENDAr ______________________________________ 40-41
35

HIStorIcAl ProFIle [tImelIne]
1participant characteristics –
at least one elderly person
to represent each agroecosys-
tem zone should be included as
a participant in this exercise.
2During the rrA, use the his-
torical profile template (see
example in table 7) with key
informants to record changes in
important parameters over time.
3review the time-line to iden-
tify any long-term trends,
such as changes in demogra-
phy, rice yields, soil condition,
forest cover, land use, fish pop-
ulations, etc., and with the key
informants explore the causes
of these changes.
4finally, analyze the impacts
and responses of the local
communities to these trends
and record the results in the
last two columns.
5At the end of the analysis,
spend a few minutes with
farmers in summarizing the most
important findings from using the
tool. In particular, assess how
the different water sources are
used in the different seasons
and identify any water-availabil-
ity constraints that may occur
during certain periods.
6summarize the findings from
item 4 above for use during
the systems Analysis phase
of CAEA.
ChECKL Ist
the following issues should be explored with villagers’ historical profile analysis.
Demographic changes and trends. √
political changes. √
Changes in access, communications and services. √
Land use changes and trends. √
Changes and trends in livelihood ac-tivities. √
Changes in Ntfp abundance. √
Changes in land tenure systems and landholding size. √
Changes in agricultural practices. √
trends in rice yields. √
trends in soil fertility. √
Changes in climate (rainfall, drought, flooding, etc.). √
Changes in hydrology (river, stream, lake and paddy field water-quality and quantity.
√
Changes and trends in fish stocks (production, species mix and local ex-tinctions).
√
Changes in fishing patterns (sites, access, people who fish, gear/tech-niques, laws and regulations, aquacul-ture, etc.).
√
A historical profile (table 7) is used for a timescale analysis over the longer term and to help identify key sustainability issues. Its purpose is twofold. first, is to attempt to identify longer-term trends, for example changes in forest cover, in rice yields, in livelihood systems, etc. second, it is used to assess the resilience of the agroecosystem to major events, such as floods, droughts, pest outbreaks, market-price fluctuations, etc.
KEy stEps

tAbLE 7: hIstorICAL profILE: sNA ANsAr CoMMUNE
pErIoDs prE 1979 1979-1990 1993-1998 1998-2009
poLItICAL 1970-1975 1975-1979 1979-1990 1990-1993 1993-1998 1998-2003 2003-2009
LoN NoL poL pot VIEtNAM INVAsIoN UNtAC ELECtED GoVErNMENt
ENVIroMENt NEGLIGIbLE ENVIroNMENtAL IMpACt IMpACts bEGIN LArGE IMpACts
Demographic changes � fisherfolk richer than farmers � 200 families in floating village
� rapid population increase after 1986 � population growth continues to accelerate � people from floating village begin to migrate to upland zone
political and administrative changes
� Commune office sited in sna Ansar village � sna Ansar and ou sandan all one commune
� Vietnamese occupation � Khmer rouge insurgency in mountain and flood-plain zones
� UNtAC period � first national elections in 1992 � political stability after 1997 coup
� Commune Councils elected by popular vote. � D&D � Institutionalized in rGC processes
Changes in access, communications and government services
� All selling and buying in commune market � fish market opens in the early 1960s � Airfield operating
� Commune market closed initially and then re-opens
� Access/communications improve dramatically � National road No. 5 upgraded
Land use changes � pristine forest � Land tax $1-1.75/ha.
� paddy rice, deepwater rice and home gardens � Dry-season rice begins
� forest encroachment begins � some dry season rice
� 40-50% reduction in flooded forest
� Dry season rice area reduced � Land-grabbing in the upland zone
Changes in Ntfps abundance � Wildlife plentiful � Uncontrolled hunting begins � hunting pressure intensifies � Availability of important Ntfps declines significantly
Changes in livelihood activities � Main occupations are wet- season rice and fishing � shared labor � farming by individual families � rice cultivation, decline in fishing and off-farm work increases.
Changes in land tenure systems and landholding size
� private ownership until pol pot regime � Group landholding 3-4 ha for 15 families � Land distributed to families in 1985
� Landholding sizes reduced � Land encroachment in the upland zone
Changes in agricultural practices
� Use compost only. � Good natural fertility � provincial vet service
� No chemical fertilizer use � Good soil fertility
� Use chemical fertilizer � soil fertility starts to decline � Livestock nos. increase
� fertilizer use increases year by year. � pesticide use begins � Even more livestock
Change in rice yields � rice yields 2.4-3 t/ha � > 90% of families self- sufficient in rice
� rice yields 2 t/ha � rice yields 1.5-2 t/ha � rice yields < 1 t/ha � Most families are deficient in rice
Changes in climate � rainfall plentiful and regular
hydrology: river, lake, stream water quality and quantity
� two dams on creeks � boeung holds water all year.
� Dams on creeks rehabilitated and repaired � Dams still used � siltation of streams and canal begins
� Dry-season rice damaged by floods at harvest time. � Deepwater rice damaged by earlier rapid rise in tonle sap water levels
Change in fish stocks (produc-tion, species mix, local extinc-
tions)
� Catch < 20 kg fish/day. � Many species caught.
� Catch < 15 kg fish/day � fish catch < 10 kg/day. � fish extinctions begin � 40% decrease in stocks
� More local extinctions of fish species � 70% decrease in stocks
fishing changes: sites, access, people, gear, laws, etc.
� fishing in groups (10-15 persons). � homemade fishing gear. � Gill nets introduced in the late 1960s
� fishing in groups � Cage culture introduced � Aquaculture begins � Illegal fishing begins
� small-scale fishing declines. � Large-scale fishing starts to dominate � Aquaculture increases

tEMporAL ANALysIs tooLs
38
pErIoDs prE 1979 1979-1990 1993-1998 1998-2009
poLItICAL 1970-1975 1975-1979 1979-1990 1990-1993 1993-1998 1998-2003 2003-2009
LoN NoL poL pot VIEtNAM INVAsIoN UNtAC ELECtED GoVErNMENt
ENVIroMENt NEGLIGIbLE ENVIroNMENtAL IMpACt IMpACts bEGIN LArGE IMpACts
Demographic changes � fisherfolk richer than farmers � 200 families in floating village
� rapid population increase after 1986 � population growth continues to accelerate � people from floating village begin to migrate to upland zone
political and administrative changes
� Commune office sited in sna Ansar village � sna Ansar and ou sandan all one commune
� Vietnamese occupation � Khmer rouge insurgency in mountain and flood-plain zones
� UNtAC period � first national elections in 1992 � political stability after 1997 coup
� Commune Councils elected by popular vote. � D&D � Institutionalized in rGC processes
Changes in access, communications and government services
� All selling and buying in commune market � fish market opens in the early 1960s � Airfield operating
� Commune market closed initially and then re-opens
� Access/communications improve dramatically � National road No. 5 upgraded
Land use changes � pristine forest � Land tax $1-1.75/ha.
� paddy rice, deepwater rice and home gardens � Dry-season rice begins
� forest encroachment begins � some dry season rice
� 40-50% reduction in flooded forest
� Dry season rice area reduced � Land-grabbing in the upland zone
Changes in Ntfps abundance � Wildlife plentiful � Uncontrolled hunting begins � hunting pressure intensifies � Availability of important Ntfps declines significantly
Changes in livelihood activities � Main occupations are wet- season rice and fishing � shared labor � farming by individual families � rice cultivation, decline in fishing and off-farm work increases.
Changes in land tenure systems and landholding size
� private ownership until pol pot regime � Group landholding 3-4 ha for 15 families � Land distributed to families in 1985
� Landholding sizes reduced � Land encroachment in the upland zone
Changes in agricultural practices
� Use compost only. � Good natural fertility � provincial vet service
� No chemical fertilizer use � Good soil fertility
� Use chemical fertilizer � soil fertility starts to decline � Livestock nos. increase
� fertilizer use increases year by year. � pesticide use begins � Even more livestock
Change in rice yields � rice yields 2.4-3 t/ha � > 90% of families self- sufficient in rice
� rice yields 2 t/ha � rice yields 1.5-2 t/ha � rice yields < 1 t/ha � Most families are deficient in rice
Changes in climate � rainfall plentiful and regular
hydrology: river, lake, stream water quality and quantity
� two dams on creeks � boeung holds water all year.
� Dams on creeks rehabilitated and repaired � Dams still used � siltation of streams and canal begins
� Dry-season rice damaged by floods at harvest time. � Deepwater rice damaged by earlier rapid rise in tonle sap water levels
Change in fish stocks (produc-tion, species mix, local extinc-
tions)
� Catch < 20 kg fish/day. � Many species caught.
� Catch < 15 kg fish/day � fish catch < 10 kg/day. � fish extinctions begin � 40% decrease in stocks
� More local extinctions of fish species � 70% decrease in stocks
fishing changes: sites, access, people, gear, laws, etc.
� fishing in groups (10-15 persons). � homemade fishing gear. � Gill nets introduced in the late 1960s
� fishing in groups � Cage culture introduced � Aquaculture begins � Illegal fishing begins
� small-scale fishing declines. � Large-scale fishing starts to dominate � Aquaculture increases


table 8 gives an example of a seasonal calendar showing the analysis of time-related changes for each agroecosystem in a year. such a calendar is a valuable tool for understanding the issues related to stability of the agro-ecosystem and should not be too detailed as this will obscure important time-related interactions.
SeASonAl cAlendAr
1participant characteristics –
in addition to those people
engaged in agriculture, at least
one individual engaged in fishing
or a combination of fishing and
agriculture should be included
in this exercise.
2During the rrA, construct
and complete a seasonal
calendar with the villagers fol-
lowing the example in table 8.
the seasonal calendar should
not cover more than two flip-
chart sheets of paper.
3Use the seasonal calendar
to discuss the temporal rela-
tionships within their livelihood
systems with the villagers.
4After completing the anal-
ysis, spend a few minutes
with the participants in sum-
marizing the most important
findings from the tool. In partic-
ular, use the seasonal calendar
to brainstorm how changes to
the timing of livelihood activi-
ties or farming practices can
be used to increase yields,
obtain better prices, improve
family cash flow, reduce risk
from climatic or economic
events, overcome bottlenecks
in labor, etc.
5summarize the findings from
item 4 above for later use
during the systems Analysis
(stage 5) of the CAEA.
6During the systems Analy-
sis (stage 5) of the CAEA,
use the completed seasonal
calendar to identify tIps that
can help reduce temporal con-
straints, bottlenecks or price
fluctuations.
ChECKL Ist
the seasonal calendar should cover the fol-lowing factors:
Climatic (rainfall and tempera-ture). √
hydrology (flood period, paddy in-undation, risk of drought, ground-water).
√
rice crops (early, medium, late, upland, deepwater, dry season, recession).
√
field crops and vegetables (major crops only – maximum of three). √
fruit tree crops including sugar palm and coconut (key activities only for major fruit crops – maxi-mum of three).
√
Livestock (disease incidence, feed shortages, etc., of cattle, pigs and chickens – maximum three lines).
√
fishing patterns (sites, gear used, spawning times, key migration peaks).
√
off-farm migration and work pat-terns. √
family cash flow showing domi-nant contributor to income over the year.
√
Annual price movements (rice, major crops, livestock and fish). √
KEy stEps

tEMporAL ANALysIs tooLs
41
tAbLE 8: sEAsoNAL CALENDAr for MAJor fArMING ACtIVItIEs, ChoUM KrAVIANG CoMMUNE
Note. the following symbols should be used in seasonal calendars: Crop nursery operations Crop growth, care and maintenance post harvest operations
MoNth
1 2 3 4 5 6 7 8 9 10 11 12
rainfall
temperature
paddy inundation
Early rice
Medium rice
Late rice
Upland rice
Cassava
Durian harvest
orange harvest
banana, papaya, etc.
rubber tapping
Cashew
pepper
f&M in cattle
hs in cattle
Erycipila in pigs
f&M in pigs
Newcastle in chicken
Chicken cholera
off-farm rubber work
rice price
Cassava price
rubber price
Cashew price
pig price
Chicken price
600
150
450
4,000
3,5001,600
2,500
3,000
6,0007,000
4,000
300

LIVELIhooD ANALysIstooLs

43
LIVELIhooD ANALysIstooLs
lIvelIHood AnAlySIStoolS
WEALth rANKING ANALysIs _________________________________ 44-46
LAND tENUrE ____________________________________________ 48-49
LIVELIhooD profILEs ______________________________________ 50-51
GENDEr tAsKs ANALysIs ___________________________________ 52-53
NoN-tIMbEr forEst proDUCts ______________________________ 54-55
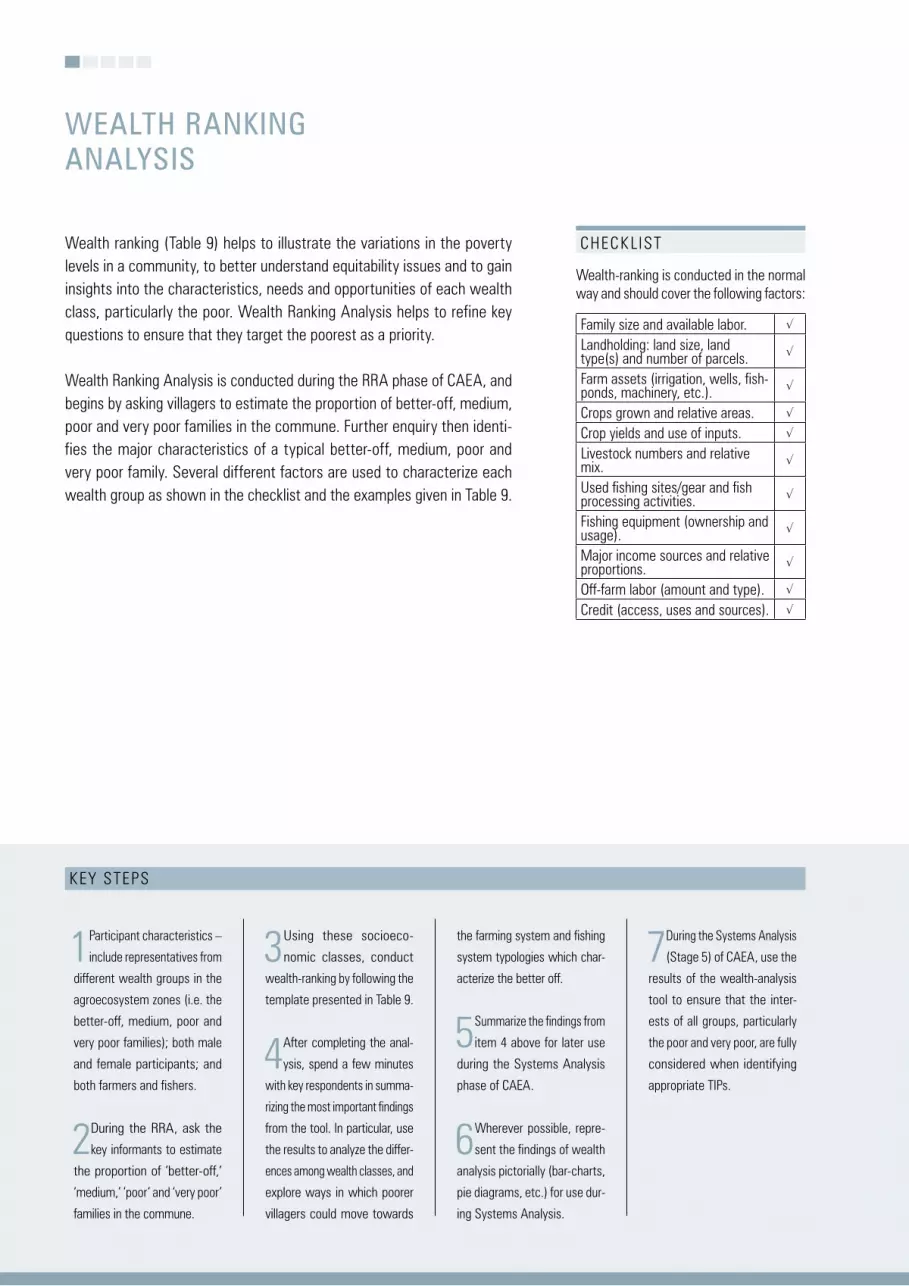
ChECKL Ist
Wealth-ranking is conducted in the normal way and should cover the following factors:
family size and available labor. √
Landholding: land size, land type(s) and number of parcels. √
farm assets (irrigation, wells, fish-ponds, machinery, etc.). √
Crops grown and relative areas. √
Crop yields and use of inputs. √
Livestock numbers and relative mix. √
Used fishing sites/gear and fish processing activities. √
fishing equipment (ownership and usage). √
Major income sources and relative proportions. √
off-farm labor (amount and type). √
Credit (access, uses and sources). √
Wealth ranking (table 9) helps to illustrate the variations in the poverty levels in a community, to better understand equitability issues and to gain insights into the characteristics, needs and opportunities of each wealth class, particularly the poor. Wealth ranking Analysis helps to refine key questions to ensure that they target the poorest as a priority.
Wealth ranking Analysis is conducted during the rrA phase of CAEA, and begins by asking villagers to estimate the proportion of better-off, medium, poor and very poor families in the commune. further enquiry then identi-fies the major characteristics of a typical better-off, medium, poor and very poor family. several different factors are used to characterize each wealth group as shown in the checklist and the examples given in table 9.
weAltH rAnKIng AnAlySIS
1participant characteristics –
include representatives from
different wealth groups in the
agroecosystem zones (i.e. the
better-off, medium, poor and
very poor families); both male
and female participants; and
both farmers and fishers.
2During the rrA, ask the
key informants to estimate
the proportion of ‘better-off,’
‘medium,’ ‘poor’ and ‘very poor’
families in the commune.
3Using these socioeco-
nomic classes, conduct
wealth-ranking by following the
template presented in table 9.
4After completing the anal-
ysis, spend a few minutes
with key respondents in summa-
rizing the most important findings
from the tool. In particular, use
the results to analyze the differ-
ences among wealth classes, and
explore ways in which poorer
villagers could move towards
the farming system and fishing
system typologies which char-
acterize the better off.
5summarize the findings from
item 4 above for later use
during the systems Analysis
phase of CAEA.
6Wherever possible, repre-
sent the findings of wealth
analysis pictorially (bar-charts,
pie diagrams, etc.) for use dur-
ing systems Analysis.
7During the systems Analysis
(stage 5) of CAEA, use the
results of the wealth-analysis
tool to ensure that the inter-
ests of all groups, particularly
the poor and very poor, are fully
considered when identifying
appropriate tIps.
KEy stEps

bEtt
Er-o
ff
MED
IUM
poor
VEry
poo
r
fArM AssEts
Crop 1a (ha)
Crop 2 (ha)
Crop 3 (ha)
Aquacultureb
Number of cattle
Number of pigs
No. adult chicken
INCoME
1st income source
2nd income source
3rd income source
off-farm labor
Number of cattle
Number of pigs
Use of credit
bEtt
Er-o
ff
MED
IUM
poor
VEry
poo
rNEED A tItLE hErE
proportion (%)
family size
Available labor
total land area (ha)
No. of parcels
fishing
others (specify)
housing land (ha)
paddy land (ha)
orchard (ha)
other land (ha)
NEED A tItLE hErE
Ntfps used
fishing sites
fishing gear used
fish processing
aCrops for main income (if the crop is less than 20% for the entire commune, it should not be considered in the discussion). Crop types could include recession rice, banana and coconut.bfor example, pond size for fish raising must be indicated in square meters or fish cage size must be indicated in cubic meters.Example results and suggested formats for presenting these attributes are presented in figures 12-15.
tAbLE 9: WEALth-rANKING tEMpLAtE
WEALth CLAss WEALth CLAss

LIVELIhooD ANALysIs tooLs
46
fIGUrE 12: WEALth CLAss DIstrIbUtIoN
fIGUrE 13: WEALth CLAss AND LANDhoLDING
fIGUrE 14: WEALth CLAss AND LIVEstoCK


In many cases, the total landholding varies with wealth class while the type of land held also varies. for historical reasons, it is often the better-off who own the most productive land (better soils, irrigation, good drainage, easy access, etc.). It is important to understand such landholding patterns so that the needs of the poor can be fully addressed in the resulting develop-ment plans. A data collection format for this is presented in table 10.
presentation of the data for analysis and reporting purposes should be visual wherever possible, and in a format best suited to drawing pertinent and correct conclusions. figure 15 shows a suggested presentation for-mat.
lAnd tenUre
ChECKL Ist
by analyzing land type and tenure issues the CAEA is able to identify agroecosys-tem zones appropriate for designation as state private Land for social Land Conces-sions (sLC). the characteristics of an agro-ecosystem zone appropriate for a sLC are:
Low population density. √
poor quality or degraded forest-land. √
Low biodiversity values. √
Adequate agricultural potential. √
Adequate water resources. √
A high incidence of landlessness or particu-larly small farm sizes in an agroecosystem zone next to a zone with the above char-acteristics demonstrates an opportunity for an sLC program in the commune. through these considerations, the CAEA can act as a mechanism for identifying suitable state private Land for a sLC program for inclu-sion in the CDp.
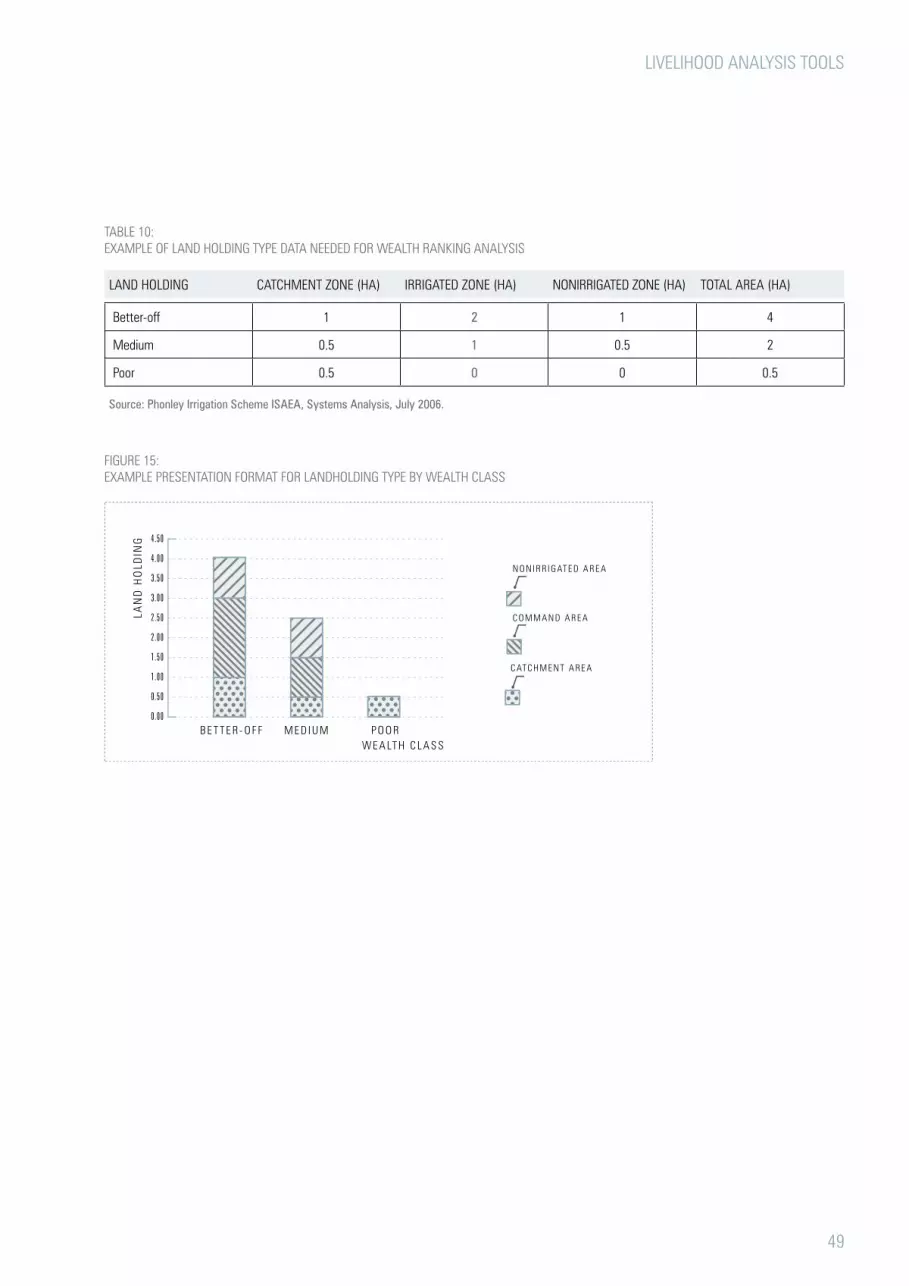
LIVELIhooD ANALysIs tooLs
49
tAbLE 10: ExAMpLE of LAND hoLDING typE DAtA NEEDED for WEALth rANKING ANALysIs
LAND hoLDING CAtChMENt ZoNE (hA) IrrIGAtED ZoNE (hA) NoNIrrIGAtED ZoNE (hA) totAL ArEA (hA)
better-off 1 2 1 4
Medium 0.5 1 0.5 2
poor 0.5 0 0 0.5
Source: Phonley Irrigation Scheme ISAeA, Systems Analysis, july 2006.
fIGUrE 15: ExAMpLE prEsENtAtIoN forMAt for LANDhoLDING typE by WEALth CLAss

1participant characteristics–
include representatives from
different wealth groups in the
agroecosystem zones (i.e. bet-
ter-off, medium, poor and very
poor families); both male and
female participants; and both
farmers and fishers.
2Use the main livelihood
activities (income sources)
identified for each agroeco-
system as the activities to be
analyzed by the Livelihoods
profile tool.
3If there is a significant overlap
of the main livelihood activ-
ities in different agroecosystem
zones, then it may be sufficient
to use these generically across all
agroecosystem zones. the zones
where the livelihood activity or
income source is found can be
noted in the first row of the profile.
4Check if the activities from
the above correspond to the
most important income sources
identified by wealth-ranking. If
not, modify the activities to be
analyzed by the tool.
5During the rrA phase of
the CAEA use the template
shown in table 11 to compile
the livelihood profiles of the live-
lihood activities for each zone.
6In completing the rows for
livelihood assets, vulnera-
bility factors, organizations and
institutions should be prepared
to look beyond the borders of
the commune to identify impor-
tant influences. for example, is
there a good market for the out-
put in the area and how do prices
vary? or is the labor needed
being attracted away from the
commune at the critical time?
7During the systems Analysis
(stage 5) use the completed
livelihoods profiles to identify
key problems and solutions to
help develop appropriate tIps.
In particular, try to focus on the
livelihood activities that are most
important for the poor and very
poor wealth categories. A tIp
that improves knowledge, an
organization or market access
may be just as valuable as one
that improves production.
Livelihood profiles are used to integrate an assessment of livelihood assets and other key factors that affect livelihood opportunities into the CAEA process. the tool should be used for each individual agroecosystem zone unless the major livelihood activities are similar across all zones.
Usually, up to three major income sources (i.e. livelihood activities) are identified for each agroecosystem. these will often be noted during the identification of agroecosystem zones in the commune during the prelimi-nary Analysis (stage 3) of the CAEA. they may also be identified based on the findings of the transect walk or wealth-ranking.
lIvelIHood ProFIleS
fUrthEr NotEs
A glossary of terms used in the livelihoods analysis above is presented in Appendix 3.
the major income-generating activities with-in an agroecosystem zone provide the focus for this assessment. some activities such as fishing may be found in more than one zone and the assessment for that activity need not be repeated for that commune. but fishing in one zone might be very small scale, occurring in rice fields and carried out by poor people while fishing in another zone might be in deeper water requiring boats and different fishing gear. In this case, the livelihood profile should be completed for each of the two different fishing activities.
In the first part of the table identify who is primarily involved in the activity. Is it men or women or both? And which wealth catego-ries are involved? Are there any comments to be recorded about their involvement?
KEy stEps

LIVELIhooD ANALysIs tooLs
51
AGroECosystEM ZoNE: sEAsoNALLy fLooDED LoWLAND MIDDLE tErrACE
lIvelIHood ActIvIty: deeP-wAter rIce
prIMAry INVoLVEMENt CoMMENts
Men √
Women √
WEALth CAtEGory CoMMENts
better-off √ Lack labor during peak periods
Medium √
poor √ Lack access to seasonal finance/credit
Very poor
KEy LIVELIhooD AssEts EMpLoyED DEsCrIptIoN DEfICIENCIEs/NEEDs:
Human capital - skills, knowledge, ability, health, etc.
Labor, knowledge of sea-sonal flooding regime
shortage of labor at har-vest - poor health during monsoon season
natural capital - Natu-ral resource base (forest, water bodies, fish, etc.)
Land owned, land rented,Annual flooding of the lake
seasonal flooding has be-come increasingly more variable in timing and du-ration
Physical capital - basic infrastructure and inputs needed to support liveli-hoods
farm tools, rented com-bine for harvest; roads impassable at harvest
threshers not available during peak harvest peri-od, particularly for the poor - reliant on traders to buy crop due to poor roads
Financial capital - Liquid assets, cash and regular cash inflows (pensions, remittances, etc.)
Credit advanced by trad-ers and thresher owners
high effective rates of in-terest and require imme-diate repayment at har-vest
Social capital - family, friends, social networks, political affiliations, etc.
reciprocal labor exchange with neighbors and within kinship networks
Exchange of labor essen-tial to meet peak labor needs
vulnerability factors - Ex-ternal forces over which people have limited or no control
Inadequate flooding; storm damage to crop; low mar-ket prices
strengthen human capi-tal through improved in-formation provision - pro-ducer groups to share information
Key organizations - for-mal and informal
Agricultural Extension Department
Lack relevant recommen-dations/ technologies
laws, rules and customs
restrictions on forest clearance for farmland.
tAbLE 11: hypothEtICAL ExAMpLE of A LIVELIhooD profILE fUrthEr NotEs cont .
In the second part of the table consider each of the livelihood assets: human, nat-ural, physical, financial and social capital. Which of these assets needed for this ac-tivity are the most important? What may be missing or lacking, either for everyone in the commune or for one or more of the wealth categories?
What are the most important vulnerability factors? these are the factors that can in-fluence the success of an activity and how much income it generates but that are be-yond the control of people in the commune. for example, some crops may be more vul-nerable to extreme weather or to variation in market prices than others. some forms of fishing may be more vulnerable to over-fishing than others.
What are the key organizations that help an income-generating activity to succeed? It could be a formal organization such as ag-ricultural extension which provides the nec-essary technical advice, for example, how to control animal diseases. or it could be an informal village organization which ar-ranges labor-sharing or helps people bor-row money to buy inputs.
What laws, rules or customs (institutions) are necessary to make sure the income-generating activity is successful and can continue in the long term? Are there any rules or customs which are having a bad ef-fect because they are stopping the activity from developing in the way that it could?
for each row in the table consider whether the issue is the same for all people or wheth-er there are worse problems for women compared to men, or for poor people com-pared to wealthy people. Make a note of the problems identified.

the Gender tasks tool provides disaggregated information on the propor-tion of men and women engaged in each livelihood sub-task. this provides a better understanding of the different roles played by men and women in the various livelihood activities undertaken in the commune.
this will help ensure that the needs of both men and women can be ade-quately addressed in the commune during the formulation of key questions and the designing of solutions and innovation assessments. It will also help in better understanding both the positive and negative impacts a poten-tial tIp could have on gender. A suggested data collection format for this is shown in table 12.
gender tASKS AnAlySIS
1participant characteristics – it
is important that both men and
women take part in this exercise. At
least one woman to represent each of
the different livelihood activities in the
agroecosystem zones, such as farm-
ing and fishing should be included.
2During the rrA, use the Gen-
der task Analysis Checklist (see
table 11) to identify the most impor-
tant livelihood activities.
3List these activities in the left
hand column of the Gender task
Analysis table, as shown in the tem-
plate in table 12
4Discuss with the participants the
role of women and men in each
livelihood activity and record these
on the form on the basis of a percent-
age effort for each activity.
5During the systems Analy-
sis (stage 5) of CAEA, use the
results of the Gender task Analysis
to help assess the gender impacts
of proposed tIps when conducting
Innovation Assessment and when
preparing gender-impact statements.
ChECKL Ist
the following checklist should be used to identify locally important livelihood activi-ties for analysis by the Gender task Analy-sis tool (table 12).
WEt-sEAsoN rICE ACtIVItIEs
Nursery land preparation
sowing nursery
pulling seedlings
transport seedlings
Land preparation
planting/transplanting
fertilizing
Water control
Weeding
harvesting
transportation
threshing
storage
fIshING ACtIVItIEs
fishing (income and consumption)
Marketing
processing
preparation for home consumption
Making fishing gear
othEr KEy LIVELIhooD ACtIVItIEs
home-garden
Upland cash crops
pig raising
Cattle raising
poultry raising
Ntfp collection
firewood collection
Charcoal
sericulture
Water collection
Maintenance of the irrigation system
ECoNoMIC ACtIVItIEs
selling agricultural products
obtaining/paying back loans
trading
household expenses
KEy stEps

LIVELIhooD ANALysIs tooLs
53
MEN WoMEN ADDItIoNAL obsErVAtIoNs
WEt-sEAsoN rICE ACtIVItIEs
Nursery land preparation 100%
sowing nursery 50% 50% Women soak seeds, men assist in sowing seed
pulling seedlings 100%
transport seedlings 100% Women sometimes assist if field is near the village
Land preparation 100%
planting/transplanting 30% 70% Amount of transplanted rice will increase after irrigation
fertilizing 90% 10% fertilizer use is likely to increase
Water control 100% Water control will be easier with irrigation
Weeding 100% Weed burden is likely to decrease with irrigation
harvesting 20% 80% higher yields with irrigation will increase the workload
transportation 100% higher yields with irrigation will increase the workload
threshing 90% 10% fee for mechanical threshing is 4% of the rice threshed
storage 20% 80%
othEr KEy LIVELIhooD ACtIVItIEs
home-garden 100% only a few households grow vegetables in home-gardens
Upland cash crops 50% 50% Mainly the poor and medium wealth classes
pig raising 10% 90% If larger scale (>5 pigs) usually managed by men.
Cattle raising 100%
poultry raising 100%
Ntfp collection 40% 60% some items are gender-specific
firewood collection 40% 60% this activity is dramatically decreasing because of availability
sericulture 100% there are currently 38 families growing mulberry trees
Charcoal 80% 20% seven charcoal production sites around phonley
fIshING
fishing for income 90% 10% only in women-headed households are women directly involved in fishing for income, otherwise women are mostly involved in the preparation of fish as food, and in fish pro-cessing and sale.
fish for own consumption 90% 10% Mostly men do this kind of activity. fewer women engage in main fishing activities
fish sales 10% 90%
fish processing 10% 90% sometimes, men also do fish processing, especially when they have to stay at the fish-ing sites longer without women accompanying them
Cooking fish 100%
fIsh-rAIsING
preparing place 90% 10% In general, men take the lead role. Women just take part in some light work
find fingerlings 90% 10% In some cases, (small-scale low input) women could take the lead role. for small- scale high input or sME, mostly men take the lead role
feeding and caretaking 50% 50% Not such heavy work
Marketing and selling 10% 90% this is still considered a “woman’s” job
trading 10% 90%
Water collection 20% 80%
Maintenance of the irrigation system 100%
tAbLE 12: tAsK ANALysIs by GENDEr - ExAMpLE DAtA CoLLECtIoN forMAt

1participant characteristics
– both men and women
engaged in Ntfp collection
should be included in this exer-
cise.
2During the rrA, use key
informants to identify all
the Ntfps important in liveli-
hood activities.
3List these Ntfps in the
left hand column of the
template presented in table
13, and with key informants
complete the remainder of
the table.
4After completing the anal-
ysis, spend a few minutes
with farmers in summarizing
the key findings. In particular,
identify important Ntfps that
are rapidly declining and with
farmers explore possible ways
to maintain their availability.
5summarize the findings from
item 4 above for later use
during the systems Analysis
phase of CAEA.
6During the systems Analy-
sis (stage 5) of CAEA, use
the results of the Ntfp Anal-
ysis to ensure that important
Ntfps are included in the rele-
vant Land and Water resource
Management strategies.
non-tImber ForeSt ProdUctS
the collection of Non-timber forest products (Ntfps) is often an important livelihood activity, particularly for poor families. It is important to gain an understanding of Ntfps during the CAEA since agricultural and other livelihood development ac-tivities may impact on their availability. It is also useful to explore possibilities for sustainable harvesting and domestication. An example template for obtaining Ntfp information, with examples, is presented in table 13.
KEy stEps

LIVELIhooD ANALysIs tooLs
55
NtfpAGro ECosystEM UsE fAMILIEs CoLLECtIoN
DECLINE IN thE LAst 10 yEArs (%) hArVEst pErIoD
bamboo shoot All zones sale 64 female 30 July-oct.
firewood All zones sale 100 female 0 All year
treang palm leaf Zone III sale 4 Male 20 All year
bamboo Zone III sale 32 Male 30 All year
Canmar leaf All zones family use - both 60 All year
Grass for thatching All zones sale - Male 10 All year
rattan Zone III family use 40 both 70 All year
psat leaves (various) All zones family use - female 0 6 months
tAbLE 13: Ntfp tEMpLAtE - ExAMpLE froM ChoUM KrAVIANG CoMMUNE

ECoNoMIC ANALysIs ANDDECIsIoN-MAKING tooLs

57
ECoNoMIC ANALysIs ANDDECIsIoN-MAKING tooLs
economIc AnAlySIS AnddecISIon-mAKIng toolS
MArKEt AND VALUE-ChAIN ANALysIs __________________________ 58-59
Gross-MArGIN ANALysIs___________________________________ 60-61
pAIr-WIsE rANKING tEChNIQUE ______________________________ 62-63
CAUsE-EffECt DIAGrAMs ___________________________________ 64-66
VENN DIAGrAM ___________________________________________ 68-69

KEy stEps
mArKet And vAlUe-cHAIn AnAlySIS
1participant characteristics
– in addition to farmers,
ensure that fishermen using
different fishing grounds (e.g.
paddy fields, flooded forests,
lakes, rivers) in the agroeco-
system zone are included as
participants in this exercise.
2Value-chain mapping should
be done for the same impor-
tant enterprises for which gross
margins were done, and should
include at least one crop, one
livestock type and one fish
enterprise. figure 16 shows a
chicken-value chain – lowland
lower terrace zone, snar Ansa
Commune, pursat province.
3During the rrA, with key
informants, draw flowcharts
that trace the movement of
the product among the differ-
ent actors along the marketing
chain.
4start the value-chain map
with the local producers and
work backwards along the input
supply chain and forwards along
the marketing chain.
5With the informants, obtain
an estimate of the number of
actors at each stage of the value
chain, and obtain estimates of
the value of the product at each
stage in the chain.
6After completing the analy-
sis, spend a few minutes with
farmers in summarizing the most
important findings obtained from
the tool. In particular, try to identify
the most important constraints,
bottlenecks and opportunities for
each link in the chain.
7summarize the findings from
item 6 above for use during
systems Analysis (stage 5).
8During the systems Analysis
(stage 5) of CAEA, use the
results of the value-chain anal-
ysis to formulate key questions
and potential solutions (tIps) to
solve marketing problems for
the products covered.
Value-chain mapping allows a better understanding of market-related problems and opportunities for important livelihood products (crops, live-stock, fish, Ntfps, etc.). Value-chain maps show the flow of a product through the marketing chain and help identify where and how value is add-ed to the product by the activities of different actors in the chain. Analysis of completed value-chain maps allows price and market constraints to be identified along with opportunities for enhancing value-added by additional or alternative operations by value-chain actors. the outputs of value-chain maps are used to plan market-related interventions (Marketing tIps).
Value chains are different for different products. for example, the value chain for rice, fish or processed pra hok for family consumption is nor-mally short and simple with only one type of actor, namely the farming family. however, the value chain for tonle sap high-value fish species that are dried, graded, bulked and exported is typically long and complex, with many different actors (fishermen, processors, middlemen, wholesalers, exporters, etc.).
ChECKL Ist
Value-chain maps should contain all of the following:
All actors in the value/market chain. √
the number of actors at each step in the chain. √
the value of the product at each step in the chain. √

ECoNoMIC ANALysIs AND DECIsIoN-MAKING tooLs
59
R 12
,000
/KG
R 12
,000
/KG
R 12
,000
/KG
R 14
,000
/KG
R 18
-25,
000/
KG
R 13
,000
/KG
R 25
,000
/KG
CH
ICK
EN
PRO
DU
CER
S
44
1
110
42%
11% 5%
25%
-30%
42%
CH
ICK
EN
MO
RTA
LITY
K.
CH
NA
NG
M
IDD
LEM
ENM
IDD
LEM
EN O
F K
RA
KOR
DIS
TRIC
T
CH
ICK
EN T
RA
DER
S
OF
KR
AKO
R
MID
DLE
MEN
OF
PHN
OM
PEN
H
WH
OLE
SA
LER
S O
F PH
NO
M P
ENH
MID
DLE
MEN
OF
THE
VIL
LAG
E
510
CO
NS
UM
ERS
FAM
ILY
CO
NS
UM
PTIO
N
CH
ICK
EN C
OO
P(N
TFPS
)
OTH
ER F
EED
(FR
EE-R
AN
GE)
CH
ICK
EN F
EED
(RIC
E)
fIGUr
E 16
: ChI
CKEN
-VAL
UE C
hAIN
: Lo
WLA
ND L
oWEr
tEr
rACE
ZoN
E, s
NAr
ANsA
CoM
MUN
E, p
UrsA
t pr
oVIN
CE.

groSS-mArgIn AnAlySIS
ChECKL Ist
Value-chain maps should contain all of the following:
All actors in the value/market chain. √
the number of actors at each step in the chain. √
the value of the product at each step in the chain. √
Gross margins for major enterprises are developed using information de-rived from the farmers during the rrA, and are used to promote a bet-ter understanding of local production systems, and to help identify where improvements can be made. Gross margins for traditional practices can also be compared with those for improved practices to show farmers how they can adjust their farming systems to obtain better returns. An example gross-margin analysis is presented in table 15.
1Gross margins should be con-
ducted for the three most
important enterprises in respect
of income and should include at
least one crop, one livestock
and one fisheries enterprise
(see table 15).
2With regard to fish and Ntfps,
gross-margin analysis is con-
ducted only for aquaculture or
domesticated Ntfp enterprises,
not for wild capture systems.
3Gross margins for major
enterprises should be
developed with farmers using
information derived from them
during the rrA.
4After completing the anal-
ysis, spend a few minutes
with farmers in summarizing
the most important findings
obtained from the tool. In partic-
ular, use the results to identify
ways to reduce costs and
increase the prices received.
5summarize the findings from
item 4 above for use during
systems Analysis (stage 5).
KEy stEps

ECoNoMIC ANALysIs AND DECIsIoN-MAKING tooLs
61
ACtIVIty QUANtIty (UNIts/hA) UNIt prICE (rIEL) totAL prICE (r/hA)
seed rice 50 kg 620 31,000
rice nursery operations
Land preparation - - 15,000
Animal manure 0.25 tons 60,000 15,000
pull seedlings 10 man-days 6,000 60,000
paddy rice operations
Land prep. 1 ha 75,000 75,000
transplanting 1 ha 75,000 75,000
Animal manure - - -
basal fertilizer 50 kg 1,070 53,500
topdressing - - -
post-harvest operations
harvest 1 ha 100,000 100,000
transport 1 ha 50,000 50,000
threshing 1 ha 40,500 40,500
total expenses 510,300
yield (kg) 1,710 450 769,500
total returns 769,500
Net returns 256,500
Cost CALCULAtIoNs rEtUrNs CALCULAtIoNs
Cropsseed Nursery operationsLand preparationAnimal manure/fertilizer (basal and topdressing) harvest post-harvest (cleaning, threshing, drying, processing)transport and marketing costsLabor (family and hired)other downstream costs (specify)
yieldpost-harvest lossesprice receivedby-products (paddy, fish, crabs, etc.)other returns (specify)
Livestockpurchase/breeding costsfeedVaccination/medicines/drenchesLabor (family and hired)transport and marketing costsLabor (family and hired)other downstream costs (specify)
price receivedby-products (eggs, milk, etc.)other returns (specify)
fish Cost of fingerlingsCost of fish feedLabor coststravel and transport costsCost of equipment (pumps, cages, etc.)pumping costsprocessing costsMarketing costsLabor (family and hired)
yieldpost-harvest lossesprice receivedsale of fish by-productsValue of fish consumedother returns (specify)
tAbLE 14: rAIN-fED, WEt-sEAsoN, trANspLANtED-rICE Gross-MArGIN ANALysIs, pUNLEy CoMMUNE, bANtEAy MEANChEy proVINCE
tAbLE 15: ChECKLIst: Gross MArGIN ANALysIs

ChECKL Ist
Value-chain maps should contain all of the following:
All actors in the value/market chain. √
the number of actors at each step in the chain. √
the value of the product at each step in the chain. √
pair-wise ranking (see table 16) provides a means of objectively ranking issues, problems and solutions. It is used with farmers during the rrA to help them prioritize the problems they face. objectivity is improved if the ranking is conducted by a group of different types of people (men/women, better-off/poor, young/old, etc.), as then it incorporates a variety of dif-ferent perspectives and points of view. Consequently, pair-wise ranking should be conducted in a plenary group involving all farmer key informants.
PAIr-wISe rAnKIng tecHnIqUe
1List all the problems raised
by all groups during the rrA,
and by means of a vote, produce
a short list of about 10 problems
identified as the most important
by key respondents.
2List the priority problems
in a matrix as shown in the
example in table 16.
3Ask the participants to com-
pare each problem with every
other problem in turn, and decide
which is the most important.
4place the number represent-
ing the problem voted the
most important in each com-
parison in the appropriate cell
in the matrix.
5When all comparisons have
been completed, the scores
(response frequency) are totaled
as shown in the scoring chart
in table 16, and the problems
are listed according to their
importance as shown in the final
ranking column of the scoring
chart (see table 17).
KEy stEps

ECoNoMIC ANALysIs AND DECIsIoN-MAKING tooLs
63
tAbLE 16: pAIr-WIsE rANKING MAtrIx
tAbLE 17: pAIr-WIsE rANKING sCorING ChArt
KEy QUEstIoNs or probLEMs 1. L
ACK
of W
AtEr
IN
Dry
sEAs
oN
2. p
oor
roAD
s
AND
DIff
ICUL
t AC
CEss
3. L
oW M
ArKE
t pr
ICEs
(D
Istr
ICt
MAr
KEt)
4. D
ECLI
NIN
G N
tfp
AV
AILA
bILI
ty
5. D
ECLI
NIN
G so
IL
f Ert
ILIt
y
6. o
Utbr
EAKs
of
ANIM
AL D
IsEA
sEs
7. L
ACK
of A
NIM
AL
MAN
UrE
1. LACK of WAtEr IN Dry sEAsoN
2. poor CoMMUNICAtIoNs AND DIffICULt ACCEss 1
3. LoW DIstrICt MArKEt prICEs 1 2
4. DECLINING NUMbErs of Ntfps 1 2 4
5. DECLINING soIL fErtILIty 1 2 3 4
6. ANIMAL DIsEAsE oUtbrEAKs 1 2 6 6 6
7. LACK of ANIMAL MANUrE 1 2 7 7 7 6
KEy QUEstIoN or probLEM rEspoNsE frEQUENCy rANKING
1. Lack of water in dry season 6 1
2. poor communications and difficult access 5 2
3. Low district market prices 1 6
4. Declining numbers of Ntfps 2 5
5. Declining soil fertility 0 7
6. outbreaks of animal diseases 4 3
7. Lack of animal manure 3 4

cAUSe-eFFect dIAgrAmS
Cause-effect diagrams are used to break down broad problem areas (key issues) into their causal factors which are then used to identify appropriate solutions. Although extremely valuable in helping to better understand problems, the cause-ef-fect tool is rather time-consuming and not easy to use. for this reason, two options are presented. first, if the CAEA team has sufficient confidence and experience, cause-effect diagrams should be produced with farmers during the rrA, but only for the four highest priority problems identified by pair-wise ranking. If skills and experience are limited, pair-wise ranking should be conducted during the systems Analysis (stage 5) of CAEA, using CC representatives as key respondents. In this case, the cause-effect tool should be used for the four highest priority tIps identified by innovation assessment.
Cause-effect diagrams begin with a broad statement of the overall problem which is then broken down into component problems and eventually root causes. the effects of the problem are then investigated to gain a more holistic understanding and to help generate key questions. the steps are illustrated below with an example from horne. and stur 2003 – Develop-ing agricultural solutions with smallholder farmers – how to get started with participatory approaches. ACIAr Monograph No. 99. 120 pages. (CIAt, Vientiane, Lao pDr).
1With the key respond-
ents, identify the four most
important problems facing the
commune as a whole. If appro-
priate, it may be useful to select
one priority from each of the fol-
lowing categories:
� Agricultural problems
� Environmental problems
� fisheries problems
� Livelihood problems
2for each priority problem
and following the exam-
ples presented in the figures,
construct diagrams to discuss
the following questions:
� What is the main problem?
(see figure 17)
� What are the causes of the
problem? (see figure 18)
� What are the effects of the
problem? (see figure 19)
� how do farmers cope
with the problem? (see
figure 20)
� how do we solve the prob-
lem? (see figure 21)
KEy stEps

fIGUrE 17: CAUsE-EffECt DIAGrAM 1wHAt IS tHe mAIn Problem?
fIGUrE 18: CAUsE-EffECt DIAGrAM 2wHAt Are tHe cAUSeS oF tHe Problem?
fIGUrE 19: CAUsE-EffECt DIAGrAM 3wHAt Are tHe eFFectS oF tHe Problem?
C AT T L E A R E T H I NA N D W E A K
C AT T L E A R E T H I NA N D W E A K
C A U S E S
E F F E C T S
C AT T L E A R E T H I NA N D W E A K
L A C K O F F E E D I NT H E D R Y S E A S O N
D R O U G H T
D I S E A S E S A N D PA R A S I T E S
AREA OF GRAZING LANDGETTING SMALLER
E X PA N D I N G A R E AO F C R O P L A N D
NO LONGER ALLOWED TO GRAZE IN FOREST
TO O M A N Y C AT T L E I N T H E V I L L A G E
C A U S E S
E F F E C T SC AT T L E A R E T H I N
A N D W E A K
L A C K O F F E E D I NT H E D R Y S E A S O N
D R O U G H T
D I S E A S E S A N D PA R A S I T E S
AREA OF GRAZING LANDGETTING SMALLER
E X PA N D I N G A R E AO F C R O P L A N D
TO O M A N Y C AT T L E I N T H E V I L L A G E
C A U S E S
E F F E C T S
C AT T L E A R E T H I NA N D W E A K
L A C K O F F E E D I NT H E D R Y S E A S O N
D R O U G H T
P LO U G H I N GTA K E S LO N G E R
NEED TO HIRE LABOUR FOR EXTRA PLOUGHING
M O R E D I S E A S EP R O B L E M S
F E W E R C A LV E S
D I S E A S E S A N D PA R A S I T E S
AREA OF GRAZING LANDGETTING SMALLER
E X PA N D I N G A R E AO F C R O P L A N D
T H I N C A LV E S
L E S S I N C O M E
TO O M A N Y C AT T L E I N T H E V I L L A G E
C A U S E S
E F F E C T S
NO LONGER ALLOWED TO GRAZE IN FOREST

ECoNoMIC ANALysIs AND DECIsIoN-MAKING tooLs
66
fIGUrE 20: CAUsE-EffECt DIAGrAM 4How do FArmerS coPe wItH tHe Problem?
fIGUrE 21: CAUsE-EffECt DIAGrAM 5How do we Solve tHe Problem?
C AT T L E A R E T H I NA N D W E A K
L A C K O F F E E D I NT H E D R Y S E A S O N
D R O U G H T
P LO U G H I N GTA K E S LO N G E R
NEED TO HIRE LABOUR FOR EXTRA PLOUGHING
M O R E D I S E A S EP R O B L E M S
F E W E R C A LV E S
D I S E A S E S A N D PA R A S I T E S
AREA OF GRAZING LANDGETTING SMALLER
E X PA N D I N G A R E AO F C R O P L A N D
T H I N C A LV E S
L E S S I N C O M E
TO O M A N Y C AT T L E I N T H E V I L L A G E
C A U S E S
E F F E C T S
NO LONGER ALLOWED TO GRAZE IN FOREST
S O L DS O M E C AT T L E
P R O V I D E E X T R AC U T F E E DTRY NEW WAYS
OF FEEDING ANIMALSU S E D T R A D I T I O N A L
R E M E D I E SN E E D H E L P W I T HA N I M A L D I S E A S E S
C AT T L E A R E T H I NA N D W E A K
L A C K O F F E E D I NT H E D R Y S E A S O N
D R O U G H T
P LO U G H I N GTA K E S LO N G E R
NEED TO HIRE LABOUR FOR EXTRA PLOUGHING
M O R E D I S E A S EP R O B L E M S
F E W E R C A LV E S
D I S E A S E S A N D PA R A S I T E S
AREA OF GRAZING LANDGETTING SMALLER
E X PA N D I N G A R E AO F C R O P L A N D
T H I N C A LV E S
L E S S I N C O M E
TO O M A N Y C AT T L E I N T H E V I L L A G E
C A U S E S
E F F E C T S
NO LONGER ALLOWED TO GRAZE IN FOREST
S O L DS O M E C AT T L E
P R O V I D E E X T R AC U T F E E D
U S E D T R A D I T I O N A LM E D I C I N E S

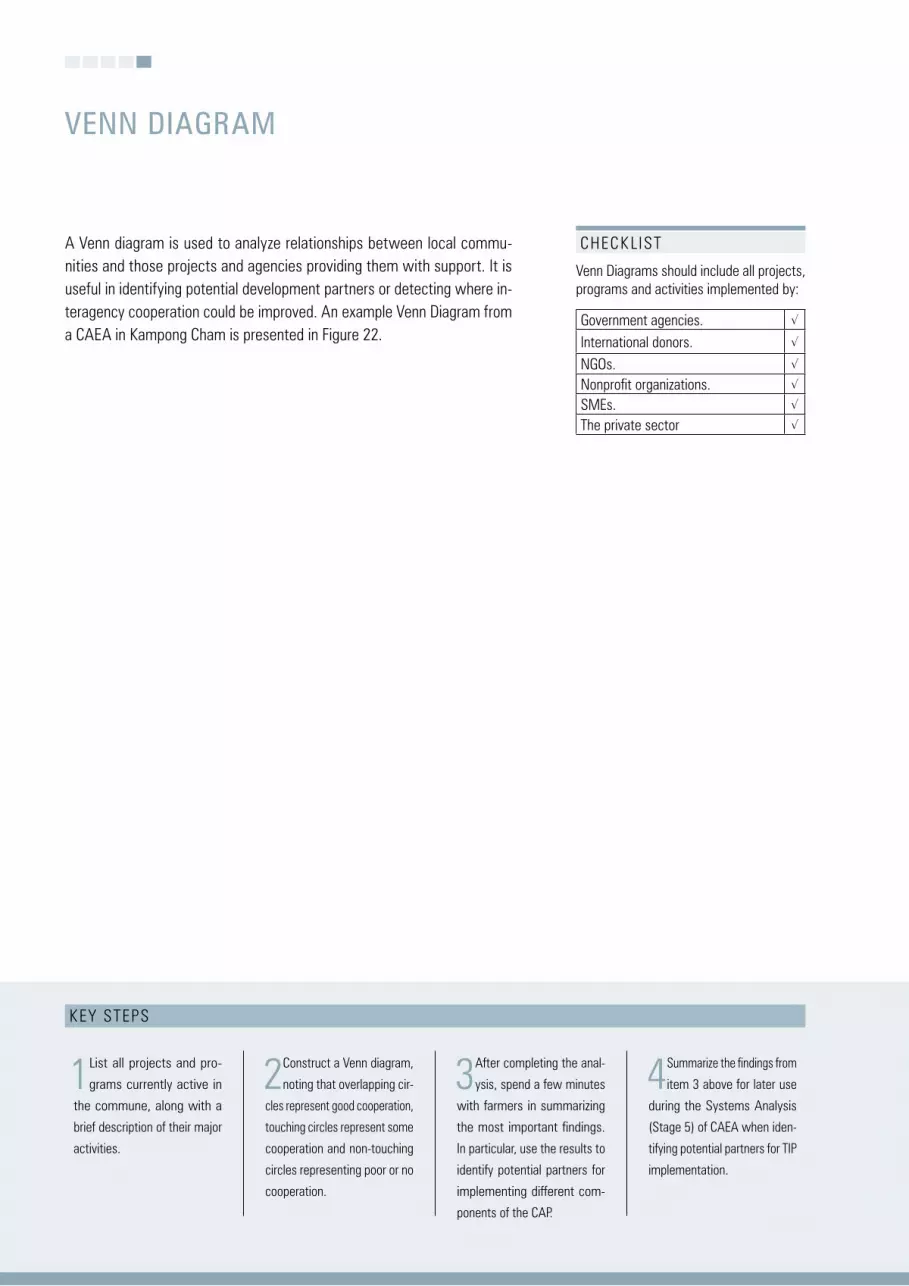
venn dIAgrAm
ChECKL Ist
Venn Diagrams should include all projects, programs and activities implemented by:
Government agencies. √
International donors. √
NGos. √
Nonprofit organizations. √
sMEs. √
the private sector √
A Venn diagram is used to analyze relationships between local commu-nities and those projects and agencies providing them with support. It is useful in identifying potential development partners or detecting where in-teragency cooperation could be improved. An example Venn Diagram from a CAEA in Kampong Cham is presented in figure 22.
1List all projects and pro-
grams currently active in
the commune, along with a
brief description of their major
activities.
2Construct a Venn diagram,
noting that overlapping cir-
cles represent good cooperation,
touching circles represent some
cooperation and non-touching
circles representing poor or no
cooperation.
3After completing the anal-
ysis, spend a few minutes
with farmers in summarizing
the most important findings.
In particular, use the results to
identify potential partners for
implementing different com-
ponents of the CAp.
4summarize the findings from
item 3 above for later use
during the systems Analysis
(stage 5) of CAEA when iden-
tifying potential partners for tIp
implementation.
KEy stEps
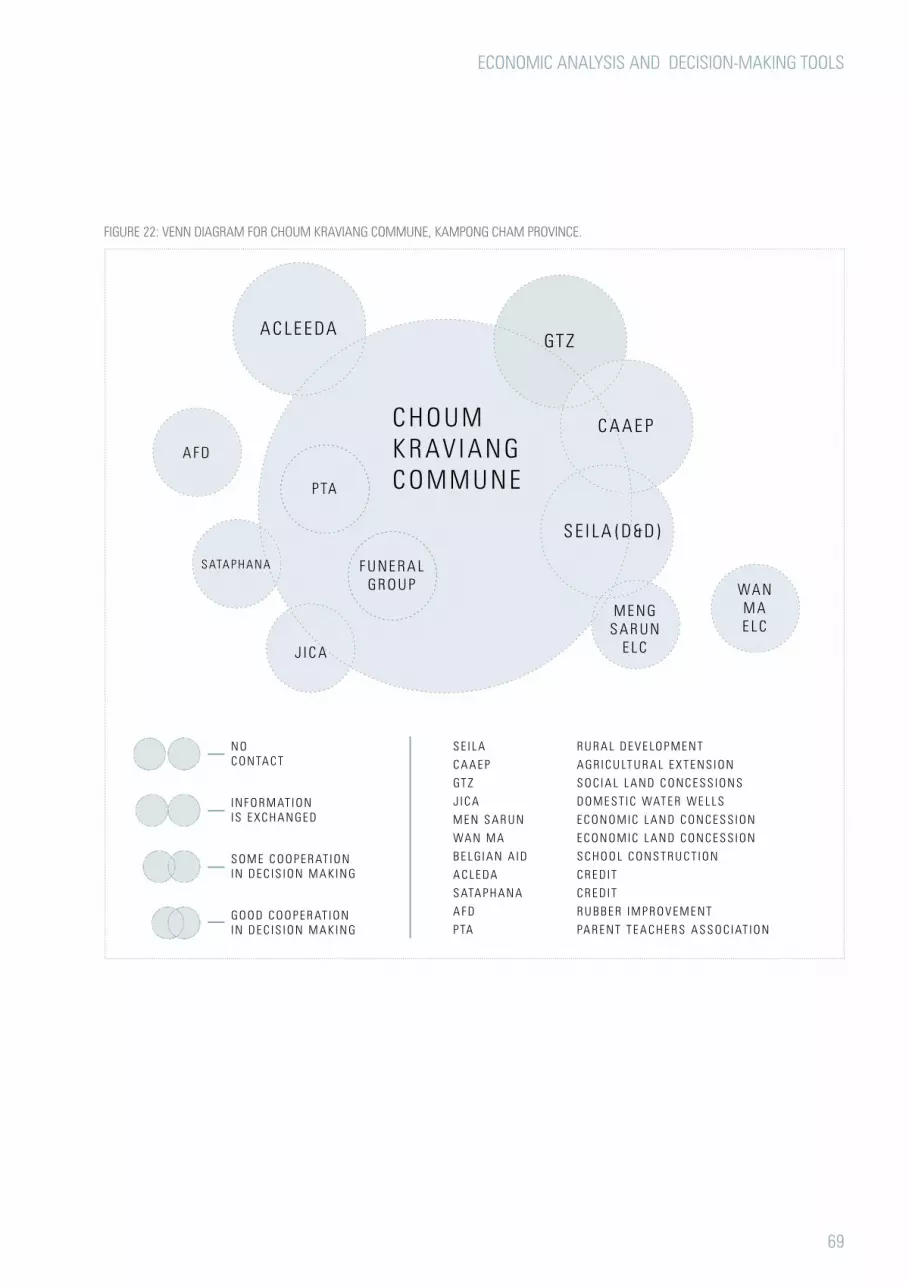
ECoNoMIC ANALysIs AND DECIsIoN-MAKING tooLs
69
fIGUrE 22: VENN DIAGrAM for ChoUM KrAVIANG CoMMUNE, KAMpoNG ChAM proVINCE.
C H O U M K R AV I A N G C O M M U N E
GT ZA C L E E DA
P TA
F U N E R A LG R O U P
S E I L A ( D & D )
C A A E P
WA NM AE L C
M E N GS A R U N
E L C
A F D
S ATA P H A N A
J I C A
S E I L A R U R A L D E V E LO P M E N T
C A A E P A G R I C U LT U R A L E X T E N S I O N
GT Z S O C I A L L A N D C O N C E S S I O N S
J I C A D O M E S T I C WAT E R W E L L S
M E N S A R U N E C O N O M I C L A N D C O N C E S S I O N
WA N M A E C O N O M I C L A N D C O N C E S S I O N
B E L G I A N A I D S C H O O L C O N S T R U C T I O N
A C L E DA C R E D I T
S ATA P H A N A C R E D I T
A F D R U B B E R I M P R O V E M E N T
P TA PA R E N T T E A C H E R S A S S O C I AT I O N
N O C O N TA C T
I N F O R M AT I O N I S E XC H A N G E D
S O M E C O O P E R AT I O N I N D E C I S I O N M A K I N G
G O O D C O O P E R AT I O N I N D E C I S I O N M A K I N G

rrA tooLsystEM propErty ADDrEssED fUrthEr ANALysIs rECoMMENDED
Maps stability (spatial) Compare productivity levels in different areas and identify the reasons for these.
Water body analysis All to some extent Compare productivity levels in different water bodies and identify the reasons for these; al-so assess to what extent the different water bodies together are able to provide stable, year-round benefits.
Assessment of fish species
productivity and sustainability Compare the productivity of different species (catch x value) and explore the reasons for changes in species populations in the last 10 years.
flow diagrams All to some extent Analyze how each type of flow affects each system property. for example, extractive flows such as nutrient flows or land clearing (sustainability); intermittent flows such as migration (stability); labor flows (productivity), etc.
transect analysis All to some extent Compare the productivity, stability, sustainability and equitability of major enterprises in the different agroecosystems and analyze the reasons for any differences.
time line sustainability review the time line to identify any long-term trends and their causes, such as the reasons for decline of rice yield, soil erosion, overgrazing, overfishing, etc.Ask farmers if they can identify any other long-term trends that are occurring.Analyze the cause and the impacts of these long-term trends.
seasonal calendar stability Look at the timing of key livelihood activities to see if shifts are possible to avoid drought, flooding, disease, etc. or to obtain better quality, prices, etc.
Wealth analysis Equitability Analysis will show the key differences among the wealth classes. Analyze the differences and explore ways in which poorer farmers could move towards the farming system typolo-gies which characterizes the better-off.
Livelihood profiles All to some extent productivity, sustainability and equitability can be affected if one or more livelihood assets are deficient or lacking for a wealth group. stability can be affected if the livelihood activity is vulnerable to an external factor beyond the control of households.having the right organizations and institutions in place can contribute to all four systems properties.
Analysis of gender task
Equitability Identify any problems specific to women and explore possible solutions. Assess the gender impacts of proposed interventions (tIps). Use the results when conducting Innovation Assessment and when preparing gender-im-pact statements.
Ntfp analysis sustainability Identify important Ntfps that are rapidly declining and with farmers explore possible ways to maintain their availability.Explore the potential for the domestication of key Ntfps.
Cause and effect All to some extent Analyze how each root cause of the problem affects the various system properties and ex-plore potential solutions with farmers.
Venn diagrams Decisions Use the results to guide proposed solutions, e.g., synergies with other projects, possibilities for cooperation with other agencies in implementing the CAp.Explore how other stakeholders might be able to provide assistance to key problems identi-fied in the above analyses.
Gross margins productivity (profit) Compare traditional and improved practices with farmers with respect to gross margins, and identify what changes could be made to increase productivity.
Analysis of market chain
productivity (profit) review the results to identify key bottlenecks in the market chain or points in the value chain where value-added opportunities might exist.
tAbLE 18: ANALysIs of systEM propErtIEs UsING rrA tooLs

ANALysIs of rrA tooL oUtpUts
there is sometimes confusion among CAEA practitioners as to the difference between stability and sustainability. In the context of AEA, there are events such as floods or droughts that have a destabi-lizing effect (short-term), while sustainability relates to stresses and strains (long-term) such as rising soil salinity, soil erosion or climate change.
Although no rrA technique directly addresses a system property, different tools are helpful in identify-ing and analyzing the various properties (see table 18). for example, time lines help identify longer-term trends that occur (sustainability); seasonal calendars are used to identify sporadic events within a year (stability); wealth analysis identifies the characteristics of different wealth classes (equitability); and comparative analysis of gross margins for different enterprises promotes an improved understanding of productivity. table18 provides guidelines for the analysis of the outputs of the main rrA tools, and a few minutes should be allocated after using each tool to conduct these analyses.
AnAlySIS oF rrA tool oUtPUtS
71


following the rrA, the information gained from the tools is organized and prepared for further analysis. the systems Analysis phase integrates and analyzes information obtained from the secondary data, the preliminary survey and the rrA in order to identify the most important agricultural problems and opportunities and to develop a future ‘vision’ for the commune.
to facilitate the process it is useful to maintain and continually update two flip charts throughout this phase. the first, entitled “Key Issues” is used to record important issues as they are identified; these are then used to help define and formulate key questions. the second flip chart, entitled “future Vision” is used to record the ideas and aspirations of villagers and CC representatives in terms of their vision for the commune in 10-20 years’ time; the results are used to develop commune land and water man-agement strategies as the final step in systems analysis.
systems analysis proceeds, in plenary session, through a number of steps using the following tools:
� sWot analysis ......................................................................................................................74-75 � system properties analysis ....................................................................................................76-77 � Key question formulation .......................................................................................................78-80 � Innovation assessment ..........................................................................................................82-83 � poverty, gender and environmental impact assessments ......................................................84-86 � Land and water resource management strategies ................................................................88-89
systEMsANALysIs
SyStemSAnAlySIS
73
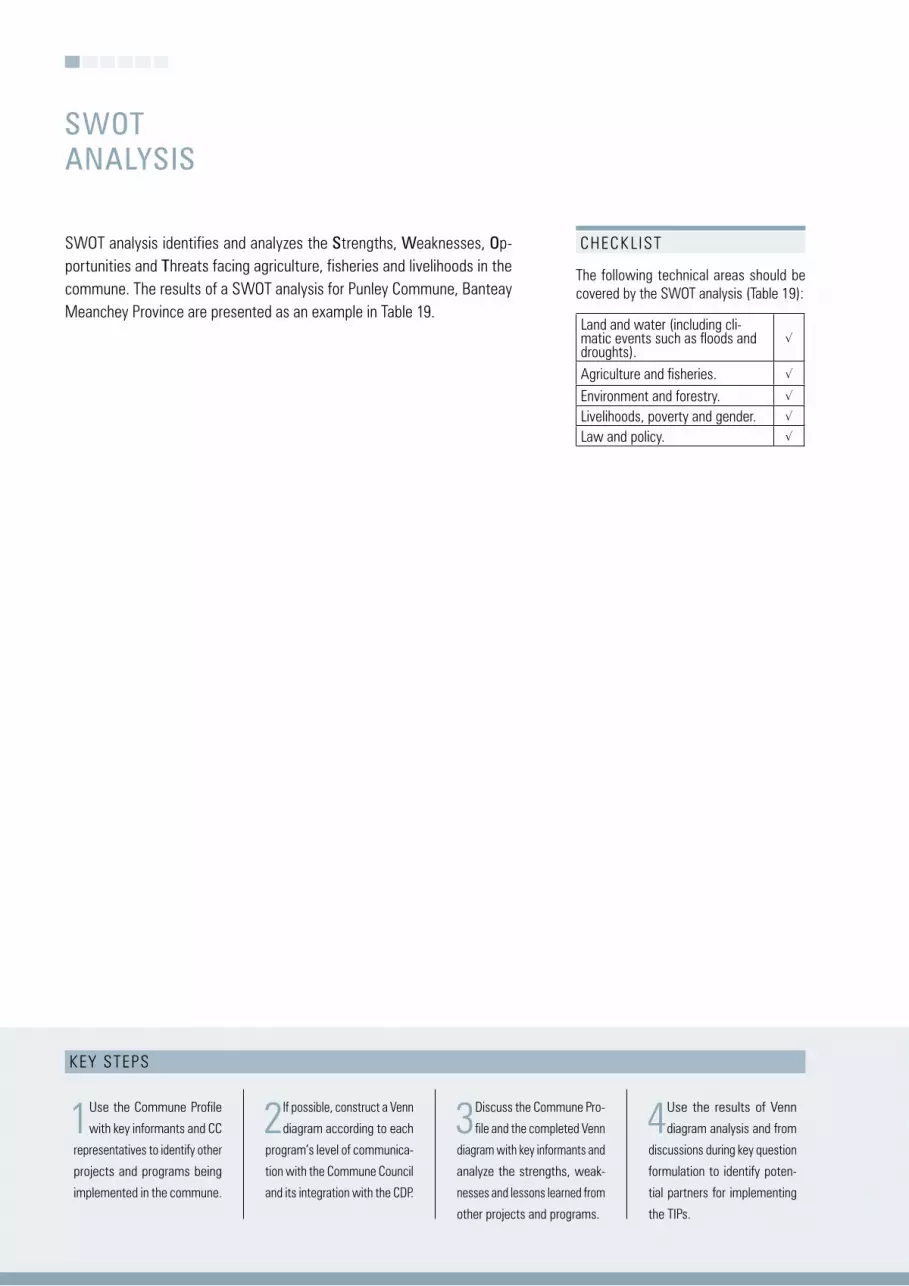
KEy stEps
Swot AnAlySIS
1Use the Commune profile
with key informants and CC
representatives to identify other
projects and programs being
implemented in the commune.
2If possible, construct a Venn
diagram according to each
program’s level of communica-
tion with the Commune Council
and its integration with the CDp.
3Discuss the Commune pro-
file and the completed Venn
diagram with key informants and
analyze the strengths, weak-
nesses and lessons learned from
other projects and programs.
4Use the results of Venn
diagram analysis and from
discussions during key question
formulation to identify poten-
tial partners for implementing
the tIps.
sWot analysis identifies and analyzes the Strengths, weaknesses, op-portunities and threats facing agriculture, fisheries and livelihoods in the commune. the results of a sWot analysis for punley Commune, banteay Meanchey province are presented as an example in table 19.
ChECKL Ist
the following technical areas should be covered by the sWot analysis (table 19):
Land and water (including cli-matic events such as floods and droughts).
√
Agriculture and fisheries. √
Environment and forestry. √
Livelihoods, poverty and gender. √
Law and policy. √

systEMs ANALysIs
75
tAbLE 19: ExAMpLE of A sWot ANALysIs for pUNLEy CoMMUNE, bANtEAy MEANChEy proVINCE
KEy QUEstIoN or probLEM rEspoNsE frEQUENCy
strengths Large land area and size of landholdings
Variety of land types
Adequate remaining natural resources
Good water resources (reservoir, creeks, ponds)
Good returns from rice, and cattle
Good employment opportunities in thailand
Weaknesses Inappropriate land use in some zones
Inequitable landownership
Deforestation and resource degradation
Waterlogging in chamkar crops
Inappropriate cultural practices related to rice
Unsuitability of saline groundwater for agricultural use
Labor shortages in peak periods
opportunities soil fertility improvement
Crop diversification
Improved chamkar production with irrigation
recession rice in reservoir drawdown area
Increased cropping intensity by improved water use efficiency
Eco-tourism associated with the reservoir
Growing markets for cash crops
threats soil erosion and reservoir sedimentation
further degradation of forests
Land conflict as a result of irrigation development (land loss, etc.)
Loss of wildlife habitat
Increased inappropriate use of agrochemicals
Livestock diseases
burning rice straw after harvest

KEy stEps
AnAlySIS oF SyStem ProPertIeS
1Construct a system proper-
ties analysis matrix using the
sWot results.
2Identify the main system
property(ies) impacted pos-
itively or negatively by each of
the sWot elements and record
the results in the matrix.
3Add up the total ‘hits’ for
each system property, and
if any have particularly low
scores relative to the others
go back to the sWot analysis
and attempt to identify addi-
tional sWot issues related to
that system property.
4the results in the combined
sWot/system properties
matrix should be reviewed when
finalizing key questions to ensure
that no important issues have
been omitted.
following the sWot analysis, the four system properties of productivity, stability, sustainability and equitability are as-sessed using the sWot results. the analysis is conducted by constructing a matrix as shown in the example in table 20, and identifying the system property(ies) impacted positively or negatively by each of the sWot elements.
It should be emphasized that the purpose of the analysis of system properties is to stimulate discussion and promote under-standing of issues related to each of the system properties. the scores generated in the final column are merely for cross-checking the results and should not be recorded in the CAEA report.
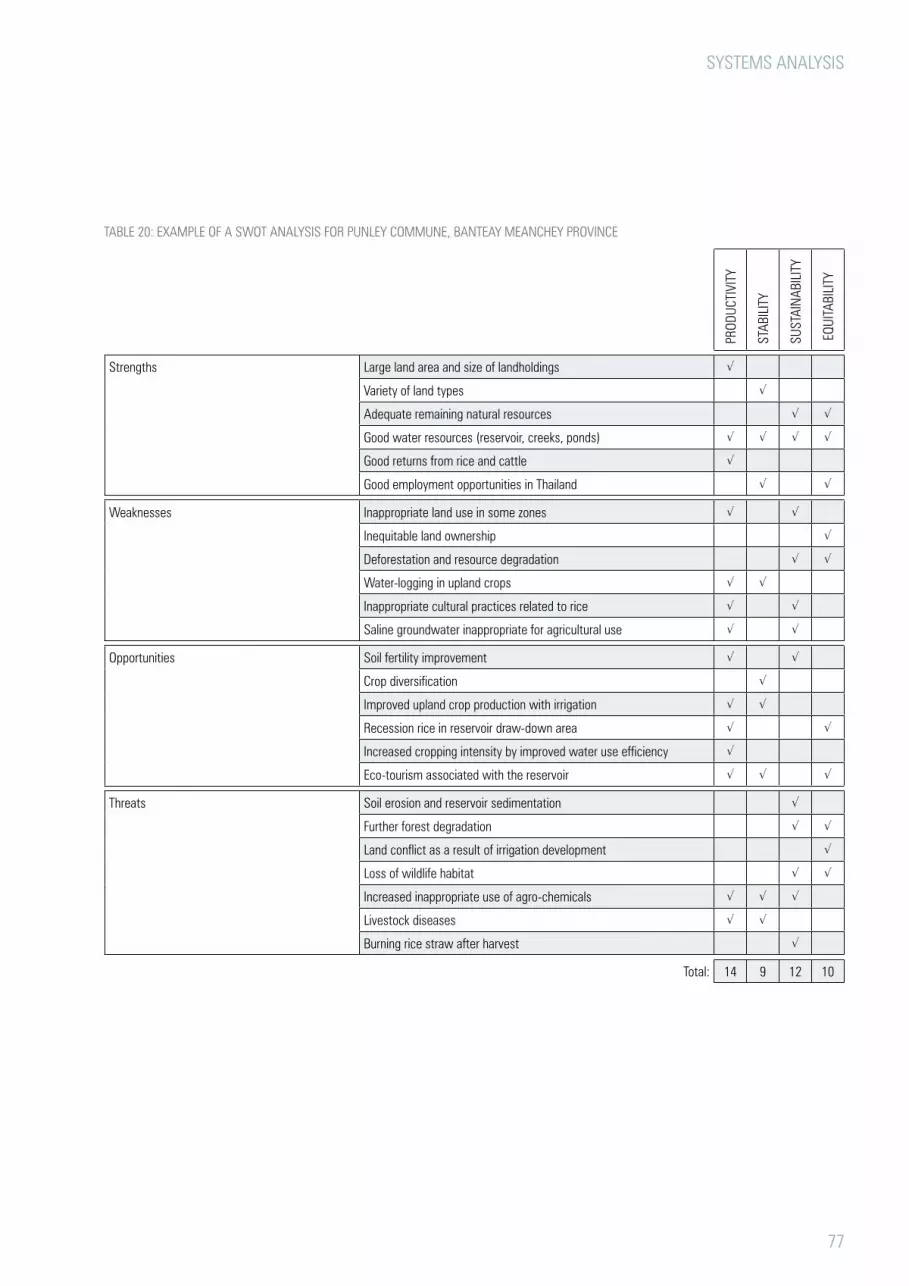
systEMs ANALysIs
77
tAbLE 20: ExAMpLE of A sWot ANALysIs for pUNLEy CoMMUNE, bANtEAy MEANChEy proVINCE
proD
UCtI
VIty
stAb
ILIt
y
sUst
AIN
AbIL
Ity
EQU
ItAbI
LIty
strengths Large land area and size of landholdings √
Variety of land types √
Adequate remaining natural resources √ √
Good water resources (reservoir, creeks, ponds) √ √ √ √
Good returns from rice and cattle √
Good employment opportunities in thailand √ √
Weaknesses Inappropriate land use in some zones √ √
Inequitable land ownership √
Deforestation and resource degradation √ √
Water-logging in upland crops √ √
Inappropriate cultural practices related to rice √ √
saline groundwater inappropriate for agricultural use √ √
opportunities soil fertility improvement √ √
Crop diversification √
Improved upland crop production with irrigation √ √
recession rice in reservoir draw-down area √ √
Increased cropping intensity by improved water use efficiency √
Eco-tourism associated with the reservoir √ √ √
threats soil erosion and reservoir sedimentation √
further forest degradation √ √
Land conflict as a result of irrigation development √
Loss of wildlife habitat √ √
Increased inappropriate use of agro-chemicals √ √ √
Livestock diseases √ √
burning rice straw after harvest √
total: 14 9 12 10

KEy stEps
FormUlAtIng Key qUeStIonS And deSIgnIng SolUtIonS
1the technical components of
the proposed program that
addresses the key question.
2. the extension methods
and delivery mechanisms
proposed to transfer the pro-
posed technology to farmers.
3technical reports and exten-
sion materials that will be
useful in developing and dis-
seminating the proposed
technology.
4potential partners for devel-
oping and extending the
proposed technology.
5target farmer groups and
the agroecological zone(s)
where the proposed technol-
ogy will be used.
Key questions address important issues identified by the CAEA. they emerge throughout the process from preliminary analysis onwards, and it is helpful to keep a list of key issues as they arise and record these on flip charts. Initially, the issues are likely to be rather general and poorly for-mulated, but as the analysis proceeds they become clearer and more fo-cused. As these issues are clarified and fleshed-out, key questions and hy-potheses are tabled, elaborated and used to identify important agricultural development and extension activities.
the use of ‘Key Question Attributes’ can provide valuable insights into the nature of the issue and help better formulate the question and the steps necessary to address it. the process essentially poses the questions of what? when? who? where? and most importantly, how? and why? and ensures that all aspects of the problem are explored. table 21 provides guidelines for formulating key questions and identifying tIps for their so-lution.
once key questions have been formulated, guidelines for addressing them are established and plans for implementing extension and development programs made. Key questions are formulated and tIps designed to ad-dress them by identifying a series of elements for each question as shown in the checklist. Examples of completed Key Questions and relevant tIps are presented in table 2.
ChECKL Ist
the technical components of the proposed program that addresses the key question.
√
the extension methods and de-livery mechanisms proposed to transfer the proposed technology to farmers.
√
technical reports and extension materials that will be useful in de-veloping and disseminating the proposed technology.
√
potential partners for developing and extending the proposed tech-nology.
√
target farmer groups and the agroecological zone(s) where the proposed technology will be used.
√
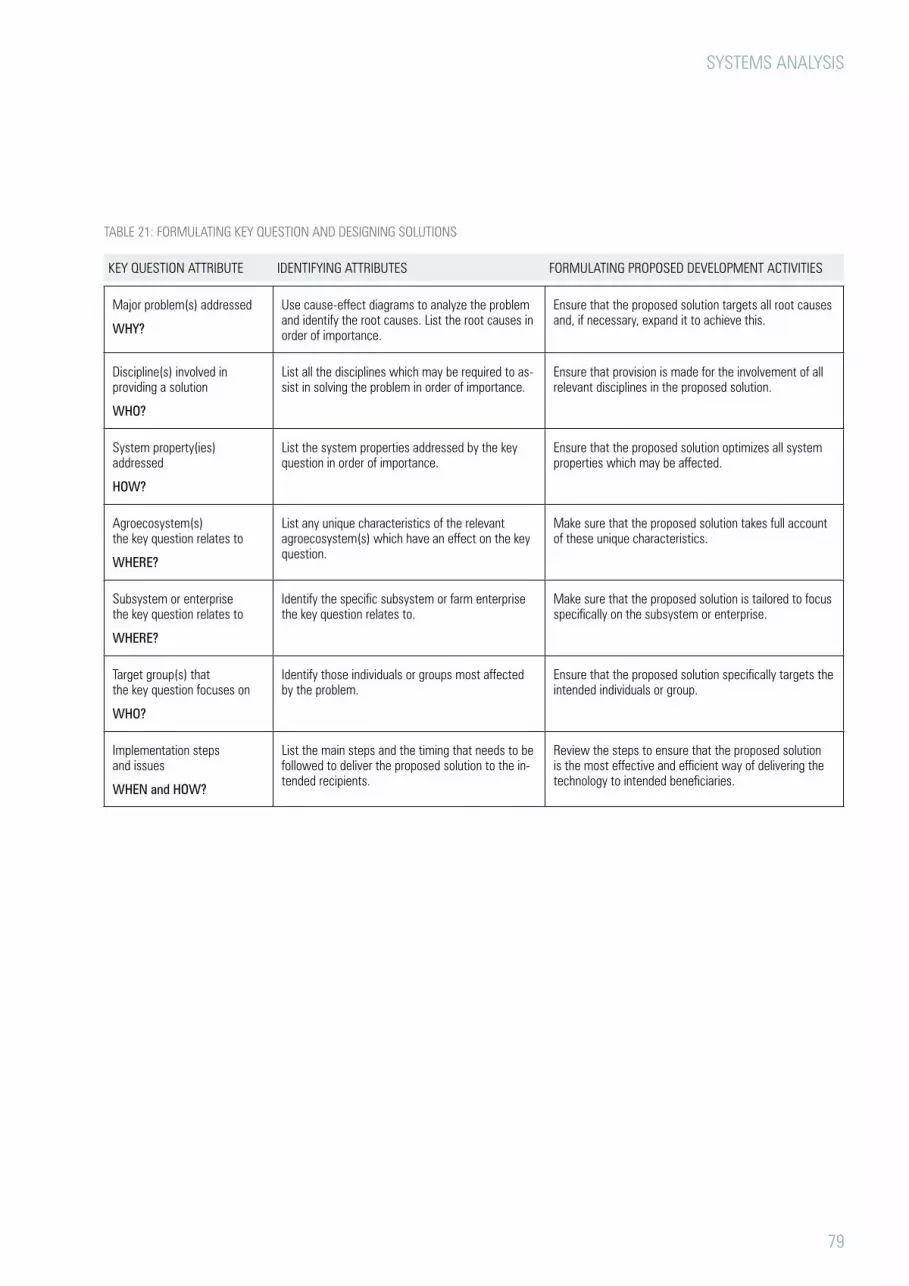
systEMs ANALysIs
79
tAbLE 21: forMULAtING KEy QUEstIoN AND DEsIGNING soLUtIoNs
KEy QUEstIoN AttrIbUtE IDENtIfyING AttrIbUtEs forMULAtING proposED DEVELopMENt ACtIVItIEs
Major problem(s) addressed
wHy?
Use cause-effect diagrams to analyze the problem and identify the root causes. List the root causes in order of importance.
Ensure that the proposed solution targets all root causes and, if necessary, expand it to achieve this.
Discipline(s) involved in providing a solution
wHo?
List all the disciplines which may be required to as-sist in solving the problem in order of importance.
Ensure that provision is made for the involvement of all relevant disciplines in the proposed solution.
system property(ies) addressed
How?
List the system properties addressed by the key question in order of importance.
Ensure that the proposed solution optimizes all system properties which may be affected.
Agroecosystem(s) the key question relates to
wHere?
List any unique characteristics of the relevant agroecosystem(s) which have an effect on the key question.
Make sure that the proposed solution takes full account of these unique characteristics.
subsystem or enterprise the key question relates to
wHere?
Identify the specific subsystem or farm enterprise the key question relates to.
Make sure that the proposed solution is tailored to focus specifically on the subsystem or enterprise.
target group(s) that the key question focuses on
wHo?
Identify those individuals or groups most affected by the problem.
Ensure that the proposed solution specifically targets the intended individuals or group.
Implementation steps and issues
wHen and How?
List the main steps and the timing that needs to be followed to deliver the proposed solution to the in-tended recipients.
review the steps to ensure that the proposed solution is the most effective and efficient way of delivering the technology to intended beneficiaries.

KEy QUEstIoN tEChNICAL CoMpoNENts ExtENsIoN MEthoDs UsEfUL rEfErENCEs pArtNEr AGENCIEs tArGEt ZoNE(s) proposED INtErVENtIoN
LoW rICE yIELDs LoW rICE yIELDs
there is already a general lack of villager understanding of appropriate cultural practices related to rice. Irrigation provision will necessitate even more changes in rice production techniques – how can we in-troduce cultural behavior changes in rice transplantation and sowing in both irrigated and non-irrigat-ed zones?
Improved varietiesQuality seedLand preparationManagement of soil fertility. Integrated pest managementWeed managementWater managementpost-harvest
technical trainingfarmer field schools on-farm demos field daysExtension materials
rice Variety tIpsoils tIpLand leveling tIpAQIp post-harvest tIpCArDI rice agronomy manual
DAo (implement)CArDI (variety)AQIp (seed)pDA (backstop)fWUC (water)DAE (tIps)
Irrigated zoneNon-irrigated zone
rice yield improvement programme
DECLINING rICE yIELDs DECLINING rICE yIELDs
there has been a steady decline in rice yields in the irrigated zone over the last 30 to 35 years – what are the reasons for this decline and how can it be reversed?
soil identification and mappingsoil analysissoil-fertility studiesIron chemistry
on farm trialsfarmer field schools plot studies
CArDI soils manual soils tIp
CArDI (tA)pDA (implement)oAE (assist)
Irrigated zone rice yield improvement programme
rECEssIoN CroppING rECEssIoN CroppING
there is an opportunity for recession cropping in the reservoir drawdown zone – how can we identi-fy and introduce appropriate recession cropping systems to farmers with land in the drawdown zone without causing sedimentation and pollution problems?
Crop selectionWater management Appropriate varietiesQuality seedsoil-fertility management Integrated pest mgt. Cultural practices
Awareness raising of potential negative impacts farmer study tourfarmer field school on-farm demonstration
CArDI rice agronomy manual soils tIp Vegetable tIp
DAo (implement)AQIp (seed)pDA (support)pDWrAM (advise)fWUC (water)DAE (tIps)Ecosorn (veg. tA)
Draw-down zone recession cropping development
soIL sALINIty soIL sALINIty
there is a soil problem that appears to be related to salinity which occurs particularly in high spots in the field – how can we identify the cause of this problem more clearly and develop appropriate solu-tions?
Land levelingWater controlsoil-fertility managementVarietal adaptationsoil identificationsoil analysis
Applied researchon farm trialsfarmer field school
CArDI soils manualsoils tIp
DAo (implement)pDA (backstop)CArDI (tA)
Irrigated zoneNon-irrigated zone Catchment zone
soil salinity amelioration
CAsh Crops CAsh Crops
there is a high production potential and good market opportunities for upland cash crops on the lighter prateah Lang soils around punley village – how can we best achieve this potential?
provision of irrigation to chamkar areaCrop selectionQuality seedUpland crop agronomyMarketing
farmer trainingfarmer field school for upland cropsUpland crop production & marketing group
Vegetable tIp DAo (implement)pDA (support)DAE (tIp)Kbal Koh (tA)
Non-irrigated zone Cash crop development
tAbLE 22: KEy QUEstIoNs AND GUIDELINEs for IMpLEMENtING proGrAMs to ADDrEss thEM
FormUlAtIng Key qUeStIonS And deSIgnIng SolUtIonS
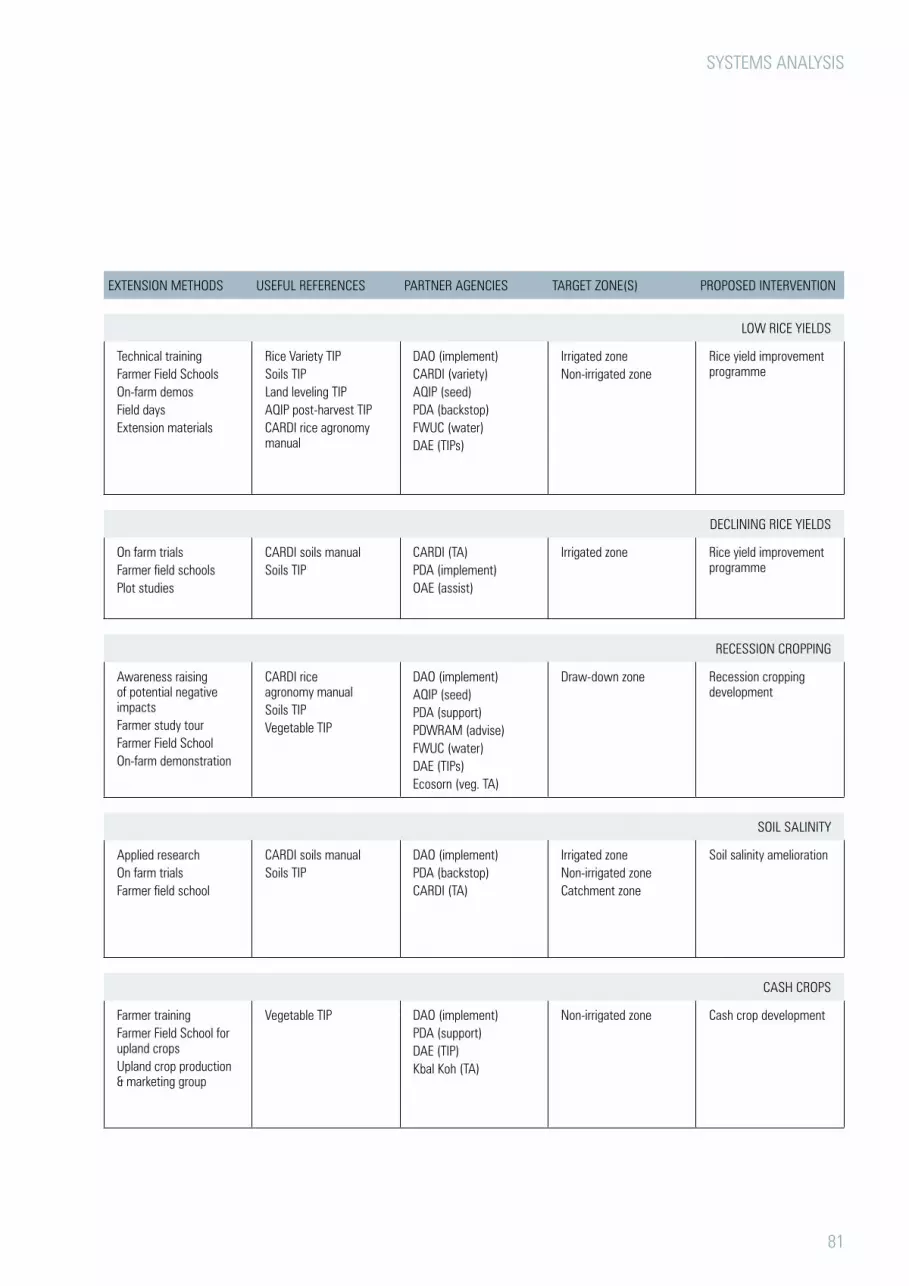
systEMs ANALysIs
81
KEy QUEstIoN tEChNICAL CoMpoNENts ExtENsIoN MEthoDs UsEfUL rEfErENCEs pArtNEr AGENCIEs tArGEt ZoNE(s) proposED INtErVENtIoN
LoW rICE yIELDs LoW rICE yIELDs
there is already a general lack of villager understanding of appropriate cultural practices related to rice. Irrigation provision will necessitate even more changes in rice production techniques – how can we in-troduce cultural behavior changes in rice transplantation and sowing in both irrigated and non-irrigat-ed zones?
Improved varietiesQuality seedLand preparationManagement of soil fertility. Integrated pest managementWeed managementWater managementpost-harvest
technical trainingfarmer field schools on-farm demos field daysExtension materials
rice Variety tIpsoils tIpLand leveling tIpAQIp post-harvest tIpCArDI rice agronomy manual
DAo (implement)CArDI (variety)AQIp (seed)pDA (backstop)fWUC (water)DAE (tIps)
Irrigated zoneNon-irrigated zone
rice yield improvement programme
DECLINING rICE yIELDs DECLINING rICE yIELDs
there has been a steady decline in rice yields in the irrigated zone over the last 30 to 35 years – what are the reasons for this decline and how can it be reversed?
soil identification and mappingsoil analysissoil-fertility studiesIron chemistry
on farm trialsfarmer field schools plot studies
CArDI soils manual soils tIp
CArDI (tA)pDA (implement)oAE (assist)
Irrigated zone rice yield improvement programme
rECEssIoN CroppING rECEssIoN CroppING
there is an opportunity for recession cropping in the reservoir drawdown zone – how can we identi-fy and introduce appropriate recession cropping systems to farmers with land in the drawdown zone without causing sedimentation and pollution problems?
Crop selectionWater management Appropriate varietiesQuality seedsoil-fertility management Integrated pest mgt. Cultural practices
Awareness raising of potential negative impacts farmer study tourfarmer field school on-farm demonstration
CArDI rice agronomy manual soils tIp Vegetable tIp
DAo (implement)AQIp (seed)pDA (support)pDWrAM (advise)fWUC (water)DAE (tIps)Ecosorn (veg. tA)
Draw-down zone recession cropping development
soIL sALINIty soIL sALINIty
there is a soil problem that appears to be related to salinity which occurs particularly in high spots in the field – how can we identify the cause of this problem more clearly and develop appropriate solu-tions?
Land levelingWater controlsoil-fertility managementVarietal adaptationsoil identificationsoil analysis
Applied researchon farm trialsfarmer field school
CArDI soils manualsoils tIp
DAo (implement)pDA (backstop)CArDI (tA)
Irrigated zoneNon-irrigated zone Catchment zone
soil salinity amelioration
CAsh Crops CAsh Crops
there is a high production potential and good market opportunities for upland cash crops on the lighter prateah Lang soils around punley village – how can we best achieve this potential?
provision of irrigation to chamkar areaCrop selectionQuality seedUpland crop agronomyMarketing
farmer trainingfarmer field school for upland cropsUpland crop production & marketing group
Vegetable tIp DAo (implement)pDA (support)DAE (tIp)Kbal Koh (tA)
Non-irrigated zone Cash crop development

KEy stEps
InnovAtIon ASSeSSment
1Construct a matrix that lists
all proposed tIps in the left-
hand column of the Innovation
Assessment and the assess-
ment criteria to be used across
the top row.
2score each tIp (from 1 =
lowest to 3 = highest) for
each of the assessment crite-
ria and record this in the matrix.
3once all of the proposed tIps
have been scored, scores are
summed and a ranking is obtained.
4the rankings obtained from
innovation assessment are
merely indicative, and deci-
sions on which activities to be
implemented should be made
in collaboration with a range of
commune stakeholders.
Implementation of the full set of proposed programs or tIps resulting from the key questions is normally beyond the financial resources available to the CCs. It is therefore necessary to have some means of setting priori-ties. Innovation assessment (see table 23) is used to help set priorities in a rational and objective manner by assessing and scoring all proposed tIps on a number of factors in order to provide a balanced assessment of the benefits that the commune can expect. Example results of innovation as-sessment are presented in table 24.
ChECKL Ist
the checklist presented in table 23 should be used to explain the assessment criteria to the CC members and obtain their agree-ment that these are valid for use in setting priorities.

systEMs ANALysIs
83
tAbLE 23: INNoVAtIoN AssEssMENt
tAbLE 24: ExAMpLE rEsULts of INNoVAtIoN AssEssMENt
productivity the expected impact of the proposed tIp on the productivity of the system
stability the expected impact of the proposed tIp on the stability of the system
sustainability the expected impact of the proposed tIp on the sustainability of the system
Equitability the expected impact of the proposed tIp on the equitability of the system
Cost the cost of the program to implement the proposed tIp
time the time taken before the benefits of the proposed tIp are realized
feasibilitya the ease of implementing the proposed tIp
resilience to climate change the extent that the proposed tIp will still provide benefits in the face of climate change
terrestrial environmental impact the expected positive impact of the proposed tIp on the terrestrial environment
Aquatic environ-mental impact the expected positive impact of the proposed tIp on the aquatic environment
Gender impact the expected positive impact of the proposed tIp on women
poverty impact the expected positive impact of the proposed tIp on the poor
Compatibility with the CDp the extent to which the tIp is in line with, supports or adds value to other elements of the CDp
Compatibility with rGC policyb the extent to which the tIp is in line with government policy.
athe following factors should be considered when assessing feasibility: (i) technical feasibility, (ii) administrative feasibility, (iii) social acceptabili-ty, (iv) availability of service providers, and (v) previous experience and available skills. bb Current government policy priorities that should be considered are: (i) food security, (ii) agricultural productivity, (iii) agricultural diversification, (iv) improved market access, (v) farmer organization development, (vi) irrigation development, (vii) land and water resource management, (viii) community fisheries development, (ix) aquaculture, (x) community forestry development, (xi) biodiversity conservation, and (xii) law enforcement (forestry and fisheries).
KEy QUEstIoNs proD
UCtI
VIty
stAb
ILIty
sUst
AINA
bILIt
y
EQUI
tAbI
LIty
Cost
tIM
E
fEA s
IbILI
ty
tErr
Estr
IAL
ENVI
roNM
ENt
IMpA
Ct
A QUA
tIC
ENVI
roNM
ENt
IMpA
Ct
GEND
Er IM
p ACt
poVE
rty
IMpA
Ct
CoM
pAtI
bILIt
y W
Ith
CDp
rGC
poLIC
y Co
MpA
tIbI
LIty
sCorE rANKING
1. rice yield improvement program 3 2 2 2 3 3 2 1 2 2 2 3 1 31 3=
2. recession cropping development 2 3 2 3 3 2 2 1 1 2 2 2 2 28 6=
3. soil salinity amelioration 2 1 3 2 2 1 1 3 3 2 2 2 1 26 10
4. Upland cash crop development 3 2 2 2 3 2 2 2 2 2 2 2 3 32 2
5. rat control 2 3 3 2 1 2 2 2 2 2 2 2 2 28 6=
6. home garden development 2 3 2 3 3 2 2 2 2 3 3 2 2 33 1
7. sericulture development 2 2 2 2 2 2 2 2 2 3 2 2 2 29 5
8. Improved water control in catchment 2 3 2 3 1 1 1 2 2 2 3 2 2 27 9
9. Improved pig fattening systems 2 2 2 3 2 3 2 2 2 3 2 2 2 31 3=
10. Livestock disease control program 2 3 2 2 2 2 2 2 2 2 1 2 2 28 6=

KEy stEps
ImPAct ASSeSSmentS oF Poverty, gender And envIronmentAl
1Discuss the proposed tIp,
its objectives and expected
outcomes.
2As a group, identify the inter-
actions the tIp will have
on each of the four cross-cut-
ting issues.
3Identify the likely positive
and negative impacts of
the tIp on these issues.
4Use the results of these anal-
yses to modify the proposed
interventions to maximize their
positive impacts and minimize
their negative impacts on all the
cross-cutting factors.
Impact assessments are used to assess the impact of proposed tIps on poverty, gender, and the terrestrial and the aquatic environments. the re-sults are used to modify the tIp so as to reduce negative impacts and in-crease positive ones. Impact assessment proceeds by completing the ap-propriate templates. similar methods are used for all four cross cutting issues (poverty, gender, and the terrestrial and aquatic environment). A terrestrial environmental impact assessment template, an aquatic environ-mental impact assessment template, a poverty impact assessment tem-plate and a gender impact assessment template are given in tables 25, 26, 27 and 28 respectively.
ChECKL Ist
A number of different aquatic indicators should be used to assess the impact of proposed tIps on the aquatic environment. these include:
Efficiency of water use. √
Impact on domestic uses and public access to water resources. √
Impact on livestock, transport and amenity values of water. √
Impact on water quality. √
Impact on hydrology and groundwater. √
Impact on connectivity of water bodies. √
Impact on wetland habitats and aquatic species (including am-phibians, reptiles, waterfowl, etc.)
√

tAbLE 25: tErrEstrIAL ENVIroNMENtAL IMpACt AssEssMENt tEMpLAtE
Description of proposed tIp
…………………………………………………………………….…………………………………………………………………….
objectives and expected outcomes of the tIp
…………………………………………………………………….…………………………………………………………………….
What will be the major interactions of the tIp with the terrestrial environment?
…………………………………………………………………….…………………………………………………………………….
What are the potential positive and negative consequences on the environment of the widespread adoption of the proposed tIp, and how can the positive ones be enhanced and the negative ones reduced?
positive impacts on the terrestrial environment how can these be enhanced?1. 1.2. 2.3. 3.
Negative impacts on terrestrial environment how can these be reduced?1. 1.2. 2.3. 3.
overall impact on the terrestrial environment will be: very positive (++), positive (+), neutral (0), negative (-), very negative (--)
Description of proposed tIp
…………………………………………………………………….…………………………………………………………………….
objectives and expected outcomes of the tIp
…………………………………………………………………….…………………………………………………………………….
What will be the major interactions of the tIp with the aquatic environment?
…………………………………………………………………….…………………………………………………………………….
What are the potential positive and negative consequences on the aquatic environment of the widespread adoption of the proposed tIp, and how can the positive ones be enhanced and the negative ones reduced?
positive impacts on the aquatic environment how can these be enhanced?1. 1.2. 2.3. 3.
Negative impacts on the aquatic environment how can these be reduced?1. 1.2. 2.3. 3.
overall impact on the terrestrial environment will be: very positive (++), positive (+), neutral (0), negative (-), very negative (--)
tAbLE 26: AQUAtIC ENVIroNMENtAL IMpACt AssEssMENt tEMpLAtE

systEMs ANALysIs
86
Description of proposed tIp
…………………………………………………………………….…………………………………………………………………….
objectives and expected outcomes of the tIp
…………………………………………………………………….…………………………………………………………………….
What will be the major interactions of the tIp with poverty?
…………………………………………………………………….…………………………………………………………………….
What are the potential positive and negative consequences on poverty of the widespread adoption of the proposed tIp, and how can the positive ones be enhanced and the negative ones reduced?
positive impacts on poverty how can these be enhanced?1. 1.2. 2.3. 3.
Negative impacts on poverty how can these be reduced?1. 1.2. 2.3. 3.
overall impact on the terrestrial environment will be: very positive (++), positive (+), neutral (0), negative (-), very negative (--)
Description of proposed tIp
…………………………………………………………………….…………………………………………………………………….
objectives and expected outcomes of the tIp
…………………………………………………………………….…………………………………………………………………….
What will be the major interactions of the tIp with gender?
…………………………………………………………………….…………………………………………………………………….
What are the potential positive and negative consequences on gender of the widespread adoption of the proposed tIp, and how can the positive ones be enhanced and the negative ones reduced?
positive impacts on gender how can these be enhanced?1. 1.2. 2.3. 3.
Negative impacts on gender how can these be reduced?1. 1.2. 2.3. 3.
overall impact on the terrestrial environment will be: very positive (++), positive (+), neutral (0), negative (-), very negative (--)
tAbLE 28: GENDEr IMpACt AssEssMENt tEMpLAtE
tAbLE 27: poVErty IMpACt AssEssMENt tEMpLAtE


KEy stEps
lAnd And wAter reSoUrce mAnAgement StrAtegIeS
1As a final step in the sys-
tems Analysis phase of the
CAEA, and in close collabora-
tion with the CC, review and
come to an agreement on the
understanding generated, the
key issues identified and the
development plans prioritized.
2With CC representatives
involved in the CAEA, brain-
storm the commune problems
and potential in order to develop
a future ‘vision’ for each agroe-
cosystem zone.
3Compare and contrast the out-
puts of items 1 and 2 above,
and discuss with the CC repre-
sentatives how to move from
the issues and potential to the
‘vision’ (and identify where the
gaps are).
4Use the results from item
1 to item 3 to produce land
and water management strat-
egies for each agroecosystem
zone in the commune.
5Identify and list the techni-
cal interventions that will
be required to implement the
strategies.
6Enter the findings in a table
following the example pre-
sented in table 29 - an example
land and water resource
management strategy table –
adapted from CAEA report of
Kor Koh Commune, Kompong
thom province.
based on the combined outputs of the CAEA, land and water resource management strategies are formulated for each agroecosystem zone in the commune. these management strategies describe the ‘development vision’ for each agroecosystem zone and are used to guide agriculture and infrastructure development over the longer term, and help ensure that commune development plans are socially responsible and environmentally sound.
the land and water resource management strategies are formulated fol-lowing the example presented in table 29. the suggested format for the strategy includes a summary of the current land use which can be extract-ed directly from the relevant parts of the transect Diagram. this is fol-lowed by a description of the vision for both land and water including the technical-support requirements to reach the vision.
Land and water resource management strategies should be revisited each year to assess progress towards the vision and to decide which elements of technical support should be included in the current year’s CIp.
ChECKL Ist
for each agroecosystem zone in the com-mune provide the following information:
Current land and water resource use √
Land resource management strategy √
technical support requirements to achieve the strategy √
Water and fisheries resource management strategy √
technical support requirements to achieve the strategy √

systEMs ANALysIs
89
tAbL
E 29
: ExA
MpL
E LA
ND A
ND W
AtEr
rEs
oUrC
E M
ANAG
EMEN
t st
rAtE
Gy tA
bLE
– AD
AptE
D fr
oM C
AEA
rEpo
rt o
f Ko
r Ko
h Co
MM
UNE,
KoM
poNG
tho
M p
roVI
NCE
AGro
ECos
ystE
M Z
oNE
UpLA
ND
M
IxED
Cro
p Zo
NE
LoW
LAN
D
WEt
-sEA
soN
rIC
E Zo
NE
fLoA
tIN
G
rICE
ZoN
EIN
tEGr
AtED
fAr
MIN
G AN
D
bIoD
IVEr
sIty
ZoN
EfL
ooDE
D
forE
st Z
oNE
Curre
nt la
nd a
nd w
ater
re-
sour
ce u
se
small
hills
, rol
ling
uplan
d w
ith
seas
onal
cre
eks.
Use
d fo
r ca
shew
, com
mun
ity fo
rest
ry
upla
nd c
rops
, w
et-s
easo
n gr
azin
g, s
ands
tone
qua
rries
, to
urism
and
hou
sing
area
.
flat t
rans
ition
are
a w
ith s
mal
l st
ream
s an
d la
kes
betw
een
upla
nd a
nd fl
oodp
lain
. Use
d fo
r ra
in-fe
d ric
e, v
eget
able
s,
wat
er m
elon
, dry
seas
on g
raz-
ing a
nd a
quac
ultur
e
flat s
easo
nally
floo
ded
ferti
le
area
with
man
y sm
all l
akes
. Us
ed fo
r flo
atin
g ric
e, re
ces-
sion
rice,
cuc
umbe
r.Dr
y-se
ason
gra
zing,
com
mu-
nity
fishe
ries.
flat s
easo
nally
floo
ded
gras
s-la
nd a
rea
with
man
y la
rger
la
kes
and
a hi
gh w
ater
tabl
e.
Used
for f
loat
ing
rice,
fish
ing,
gr
azing
, fire
woo
d.
Impo
rtant
hab
itat f
or b
enga
l flo
rican
and
fish
bre
eding
.
Very
flat
sea
sona
lly fl
oode
d ve
ry fe
rtile
flood
ed fo
rest
are
a.
Used
for f
loat
ing ri
ce,
rece
ssio
n ric
e, fi
rew
ood
and
lotu
s. Im
port
ant
habi
tat
for
wat
erfo
wl a
nd fi
sh b
reed
ing.
Land
reso
urce
man
agem
ent
stra
tegy
Mod
ern
cash
ew p
rodu
ctio
n an
d pr
oces
sing
inte
grat
ed
with
mixe
d cr
oppi
ng a
nd c
om-
mun
ity fo
rest
ry w
ith m
arke
t lin
ks to
sus
tain
able
tour
ism
an
d fa
rm p
rodu
ce s
ales
alo
ng
Natio
nal r
oad
6.
A zo
ne o
f hig
h an
d st
able
rice
yie
lds
supp
orte
d by
new
var
i-et
ies,
sus
tain
able
soi
l fer
tility
m
anag
emen
t stra
tegi
es a
nd
wel
l-mai
ntai
ned
irrig
atio
n in
-fra
stru
ctur
e.
Envir
onm
enta
lly s
ound
dee
p-w
ater
and
rece
ssio
n ric
e sy
s-te
ms,
cou
pled
with
veg
eta-
bles
, Ntf
ps a
nd g
razin
g un
der
an e
quita
ble
and
secu
re la
nd
tenu
re s
yste
m.
sust
aina
ble
livel
ihoo
ds a
nd
natu
ral r
esou
rce
man
agem
ent
base
d on
inte
grat
ed fa
rmin
g,
fishi
ng a
nd c
onse
rvat
ion
of
the
glob
ally
thre
aten
ed b
en-
gal f
loric
an.
Wel
l-pro
tect
ed fl
oode
d fo
rest
ar
ea w
ith s
usta
inab
le u
se fo
r N
tfps
, fire
woo
d an
d gr
azin
g on
a w
ell-c
ontro
lled
com
mu-
nity-
man
aged
bas
is.
tech
nica
l sup
port
req
uire
-m
ents
to a
chie
ve th
e st
rate
gy1.
Impr
oved
cas
hew
var
ietie
s.2.
Cas
hew
pro
cess
ing.
3. to
urism
dev
elop
men
t.4.
Mar
ket g
roup
sup
port.
1. Im
prov
ed ri
ce v
arie
ties
and
prod
uctio
n te
chno
logy
.2.
Impr
ovem
ent o
f rice
qua
lity
and
mar
ketin
g su
ppor
t.3.
soi
l fer
tility
man
agem
ent.
1. Im
prov
ed d
ry-s
easo
n an
d flo
atin
g ric
e pr
oduc
tion
tech
-no
logy
.2.
Est
ablis
hmen
t and
sup
port
for r
ice p
rodu
ction
and
mar
ket-
ing g
roup
s.3.
Lan
d re
form
and
land
titli
ng
via
soci
al L
and
Conc
essi
on
sche
me.
1. fl
oatin
g ric
e im
prov
emen
t. 2.
Gra
sslan
d m
anag
emen
t for
ca
ttle
and
wild
life.
3. C
onse
rvat
ion
prog
ram
for
the
beng
al flo
rican
.4.
Eco-
tour
ism d
evel
opm
ent.
1. fl
oode
d fo
rest
pro
tect
ion.
2. bi
odive
rsity
con
serv
atio
n (h
abita
t, w
ater
fow
l and
re
ptile
s).
3. s
usta
inabl
e Nt
fp h
arve
st-
ing.
Wat
er a
nd fi
sh re
sour
ces m
an-
agem
ent s
trate
gyW
ater
shed
con
serv
atio
n th
roug
h re
fore
stat
ion
and
soil
and
wat
er c
onse
rvat
ion
prac
-tic
es.
Limite
d sm
all-s
cale
dive
rsio
n irr
igat
ion
with
gro
undw
ater
de
velo
pmen
t for
aqu
acul
ture
an
d do
mes
tic u
se
Envir
onm
enta
lly s
ound
irrig
a-tio
n sy
stem
s fo
r int
ensiv
e dr
y se
ason
rice
with
ade
quat
e fis
h re
fuge
s an
d dr
y se
ason
hab
i-ta
t.
Wel
l-pro
tect
ed a
nd s
usta
ina-
bly
man
aged
fish
refu
ges
and
bree
ding
site
s.
Wel
l-pro
tect
ed fl
oode
d fo
r-es
t and
fish
con
serv
atio
n zo
ne
sust
aina
bly
man
aged
by
loca
l co
mm
uniti
es.
tech
nica
l sup
port
req
uire
-m
ents
to a
chie
ve th
e st
rate
gy1.
Com
mun
ity fo
rest
ry.2.
soi
l con
serv
atio
n an
d fe
rtil-
ity m
anag
emen
t.3.
Zero
-tilla
ge te
chniq
ues
1. Irr
igat
ion
reha
bilit
atio
n.2.
fWUC
est
ablis
hmen
t and
st
reng
then
ing.
3. G
roun
dwat
er d
evel
opm
ent.
4. A
quac
ultur
e su
ppor
t.
1. Irr
igat
ion
deve
lopm
ent f
or
float
ing a
nd re
cess
ion
rice.
2.
fWUC
est
ablis
hmen
t and
su
ppor
t.3.
Com
mun
ity fi
sher
ies
pro-
gram
.4.
res
ervo
ir fis
h co
nser
vatio
n pr
ogra
m
1. C
omm
unity
fish
ery
pro-
gram
.2.
Con
serv
atio
n of
fish
erie
s br
eedi
ng s
ites.
1. pr
otec
tion
prog
ram
for f
ish-
erie
s br
eedi
ng s
ites.
2. fo
rm a
com
mun
ity fi
sher
y as
socia
tion.
3. r
eptil
e co
nser
vatio
n pr
o-gr
am.

rePort wrItIng And USe oF cAeA oUtPUtS
following the systems analysis, stage 6, the final stage, takes place, i.e. the writing up of the results of the CAEA in a report accord-
ing to a standard format with the table of Contents as shown below.
A first draft of the CAEA report should be presented to the CC for review, comments and feedback, and any modifications made ac-
cordingly. Copies of the final report should be provided to the CC who should also be helped to integrate the CAEA outputs into their
CIp for submission for pIf funding through the D&D local planning process. two copies of the final CAEA report should also be provided
to the DAE for Quality Assurance and archiving.
the commune map showing the agroecosystem zones along with the transect diagram describing each zone should be provided to the
GIs Unit of the provincial D&D office for digitizing as a complementary map layer to the commune land use map.

systEMs ANALysIs
91
ExECUtIVE sUMMAry
INtroDUCtIoN
systEM DEfINItIoN
sUMMAry of CoMMUNE INVEstMENt pLAN
systEM boUNDAry AND CoNtExt
systEM hIErArChy
rEsULts of thE rApID rUrAL ApprAIsAL
spAtIAL ANALysIsMaps and overlaysMatrix of Water-body Attribute AnalysisMatrix of Water resource Useflow Diagrams transect Diagram
tEMporAL ANALysIs historical profile seasonal Calendar
LIVELIhooD ANALysIsWealth ranking Analysis Livelihood profiles Gender tasks AnalysisNon-timber forest products (Ntfps)
ECoNoMIC ANALysIs AND DECIsIoN MAKING Cause-Effect Analysis pair-wise ranking techniqueVenn DiagramsGross Margin Analysis Value-Chain Mapping
systEMs ANALysIs sWot Analysissystem properties Analysisformulating Key QuestionsInnovation AssessmentImpact Assessments (poverty, Gender and Environment)Land and Water resource Management strategies
AppENDICEs
CoMMUNE INVEstMENt pLAN
sECoNDAry DAtA sUMMArIEs
91

FArmIng SyStemS mAnAgement InFormAtIon SyStem (FSmIS)
After finalizing the report, key AEA data for each commune are entered into a provincial database by oAE staff. provincial data sets are
then transferred by CD roM and uploaded to the national fsMIs database held by the DAE in phnom penh.
FSmIS dAtAbASe StrUctUrethese provincial and national fsMIs databases (see figure 23) comprise five major components, each containing different types of
information.
1. Agricultural and socioeconomic Conditions. this database contains commune data on: (i) land types, (ii) topography, (iii) soil types, (iv)
current land use, (v) cropping systems, (vi) crops grown, (vii) water resources, and (viii) socioeconomic parameters.
2. Major farmer problems. this database contains commune information on the major problems encountered, their priority and the
root causes.
3. Available technology Implementation procedures (tIps). this database contains information on the improved agricultural technolo-
gies or tIps available to solve the identified problems.
4. AEA report Archives. this archive contains copies of all commune AEA reports produced to date. Users can access these reports
and retrieve information.
5. secondary Data. this part of the database contains a range of statistical and spatial information for use as input to the CAEA or for
other purposes as required by the pDA or oAE.
the fsMIs also has GIs capability and is able to geographically locate and link the information in all of the above databases.
FSmIS FUnctIonSthe fsMIs allows a range of users, including rGC departments, research agencies, NGos, donors and the private sector to perform a
number of different functions. It has dual language capability to allow its use by both English and Khmer speakers. Various reporting
formats have also been developed that allow users to query the database and generate a variety of output reports according to their
specific needs.
1. Matching tIps with priority problems identified by CAEA for specific agroecosystem zones
this is the primary function of the fsMIs, and is intended to provide the DAo and oAE with information on available technologies for ad-
dressing the priority problems identified by the CAEA and which are appropriate for use under the prevailing agroecological and socioeco-
nomic conditions. by comparing local problems (key questions) and agroecological conditions with technologies in the tIp database, the
fsMIs can identify relevant technical interventions suitable for use under local conditions.
When appropriate technologies have been identified, the entire package of technical information, procedures, methods and materials
necessary to implement an extension program for that technology is assembled from the appropriate archive and made available to
the relevant oAE/DAo.
2. Identifying research priorities and targeting new research technologies.
the fsMIs contains information on farmer-prioritized problems occurring across Cambodia. these can be grouped and ranked to pro-
vide a national picture of farmer needs, thereby providing valuable information on research priorities. some comparisons of priority
problems with available technologies fail to produce adequate matches. by ‘flagging’ these failed matches, the fsMIs can identify commonly occurring problems for which no suitable technologies are yet available, and thus help determine areas where further basic
or applied research is required.

systEMs ANALysIs
93
similarly, matching technologies in the tIp database with problems and agroecological conditions identified by the CAEA can help iden-
tify technologies for solving farmer problems across Cambodia.
3. Locating specific agroecological and socioeconomic conditions
searches of the agroecosystems database for a specific set of agroecological and socioeconomic conditions can be run by the fsMIs
to identify locations where these conditions exist. this assists the DAE in following government policy initiatives such as targeting
programs in poverty areas or focusing activities on environmentally fragile agroecosystems. the fsMIs can also be used in this way
to assist other agencies to better target their development activities and to assist research institutions in locating appropriate sites
for research, such as multi-line advanced yield trials (Ayt) or on-farm adaptive trials (ofAt), etc., in areas with the desired conditions.
similar searches can be run for the private sector to locate areas with the required conditions for a wide range of agribusiness ven-
tures. In this way, the system can help producers of agricultural inputs locate appropriate markets, direct merchants to the required
crop-production areas, and help entrepreneurs locate a variety of agribusiness opportunities in the most suitable areas of the country.
4. Identifying and locating common problems occurring across the country
by comparing, classifying and grouping key questions identified by CAEAs, the fsMIs is able to assist in setting provincial and nation-
al-level priorities. It is also capable of identifying areas with common problems, and locating the incidence of any specific problem(s),
thereby helping to target extension and development activities to sites where the need is greatest. by this means, the fsMIs does not
only help the DAE to target programs but can also assist NGos and other agencies working in a specific field to target their activities
to areas of the greatest need.
5. Monitoring and directing the implementation of AEA
records of CAEAs provide the DAE and pDAs with a powerful management tool for tracking and directing CAEA implementation.
6. producing Commune Information packages as Inputs for AEA
In addition to AEA output information, the fsMIs contains a wide range of spatial and attribute data, such as maps of administrative
boundaries, topography, land cover and land use, and seila data, World food program statistics, etc. the oAEs are be able to use the
fsMIs to retrieve and assemble this information into specially tailored ‘information packages’ to be used as inputs to commune AEAs.
this reduces the time and effort required by the oAE and DAo in preparing for CAEAs, and helps ensure that the complete package of
secondary data is available at the start of each CAEA.
FSMIS DATABASE
1. Commune agr icultural and socioeconomic condit ions
2. Pr ior i ty farmer problems in each commune (key quest ions)
3. Technologies avai lable to solve the problems (TIPs)
4. AEA report archives
5. Secondary data (maps, stat ist ics, etc.)
fIGUrE 23: thE fsMIs DAtAbAsEs
93


systEMs ANALysIs
95
APPendIx 1 AgrIcUltUrAl SyStem ProPertIeS
PRODUCTIVITY
STABILITY
SUSTAINABILITY
EQUITABILITY
the four properties used to describe the behavior of agricultural systems as defined on page 7 are further illustrated below:
our thanks go to Eric baran who prepared these slides for the CpWf pN71 project.
proDUCtIVIty:
sUstAINAbILIty:
stAbILIty:
EQUItAbILIty:


systEMs ANALysIs
97
KhMEr NAME IN roMAN KhMEr NAME IN KhMEr fAMILy LAtIN NAME GUILD
trey Ampil tum RtIGMBilTMu Cyprinidae puntius orphoides Grey
trey Andaeng ngang RtIGENþggaMg Clariidae Clarias nieuhofii black
trey Andaeng reung RtIGENþgrwg Clariidae Clarias batrachus black
trey Andaeng toun RtIGENþgTn; Clariidae Clarias meladerma black
trey Andarthpi RtIGNþatBI Cyprinidae barbichthys nitidus White
trey Andat chhkae RtIGNþatEqá Cynoglossidae Cynoglossus microlepis White
trey Andat chhkae RtIGNþatEqá Cynoglossidae Cynoglossus feldmanni White
trey Andat chhkae RtIGNþatEqá soleidae brachirus orientalis White
trey Andat chhkae RtIGNþatEqá soleidae brachirus harmandi White
trey Andat chhkae RtIGNþatEqá soleidae Achiroides melanorhynchus White
trey Andat chhkae RtIGNþatEqá soleidae Achiroides leucorhynchos White
trey Andat chhkae veng RtIGNþatEqáEvg soleidae brachirus panoides White
trey Andat pee RtIGNþatBIr Cyprinidae Epalzeorhynchos munense White
trey Angkot prak RtIsgát;R)ak; Cyprinidae puntius brevis Grey
trey Angkot prak RtIsgát;R)ak; Cyprinidae puntius aurotaeniatus Grey
trey Antong RtIGnÞg; synbranchidae Monopterus albus black
trey Antong GnÞg; Anguillidae Anguilla marmorata White
trey Antong sor GnÞg; s ophichthidae opsarius koratensis White
trey Antong srae GnÞg; ERs ophichthidae pisodonophis boro White
trey Arch kok RtIGacm_kuk Cyprinidae Labiobarbus siamensis White
trey bandol ampeuo RtIbNþÚlGMeBA Clupeidae Corica laciniata black
trey bandol ampeuo RtIbNþÚlGMeBA Clupeidae Clupeoides borneensis black
trey bandol ampeuo RtIbNþÚlGMeBA Clupeidae Clupeichthys goniognathus White
trey bandol ampeuo RtIbNþÚlGMeBA Clupeidae Clupeichthys aesarnensis black
trey bandol sok or snok RtIbNþÚlsuk rW sñúk Gyrinocheilidae Gyrinocheilus aymonieri White
trey bangkouy/Dorng Darv RtIbgÁÜy rW dgdav Cyprinidae Luciosoma bleekeri White
trey bei kam nat or Khla RtIbIkMNat; rW RtIxøa Cyprinidae puntius partipentazona Grey
trey bong Lao RtIbugLav pangasiidae pangasius krempfi White
trey Changva RtIcgVa Cyprinidae rasbota pauciperforata black
trey Changva RtIcgVaqñÚt Cyprinidae rasbora paucisqualis black
trey Changva RtIcgVa Cyprinidae rasbora myersi black
APPendIx 2 KHmer FISH nAmeS And gUIldS

KhMEr NAME IN roMAN KhMEr NAME IN KhMEr fAMILy LAtIN NAME GUILD
trey Changva RtIcgVa Cyprinidae rasbora hobelmani Grey
trey Changva kros RtIcgVaRkus Cyprinidae Crossocheilus atrilimes Grey
trey Changva angkor RtIcgVaGgÁr Cyprinidae Garra cambodgiensis black
trey Changva chnot RtIcgVaqñÚt Cyprinidae trigonostigma espei black
trey Changva chnot RtIcgVaqñÚt Cyprinidae rasbora urophthalmoides black
trey Changva chnot RtIcgVaqñÚt Cyprinidae rasbora paviei black
trey Changva chnot RtIcgVaqñÚt Cyprinidae rasbora daniconius black
trey Changva chunchuk RtIcgVaCBa¢k; Cyprinidae Crossocheilus reticulatus White
trey Changva moul RtIcgVamUl Cyprinidae rasbora tornieri black
trey Changva phleang RtIcgVaePøog Cyprinidae Esomus metallicus black
trey Changva phleang RtIcgVaePøog Cyprinidae Esomus longimanus black
trey Changva ronoung RtIcgVarenag Cyprinidae Lobocheilos melanotaenia Grey
trey Changva ronoung RtIcgVarenag Cyprinidae Garra fasciacauda black
trey Changwa Moul RtIcgVamUl Cyprinidae rasbora aurotaenia White
trey Changwa sraloung RtIcgVaRslUg Cyprinidae rasbora rubrodorsalis black
trey Changwa sraloung RtIcgVaRslUg Cyprinidae rasbora borapetensis black
trey Changwas pot RtIcgVaeBat Cyprinidae rasbota spilocerca black
trey Changwas pot RtIcgVaeBat Cyprinidae rasbora caudimaculata black
trey Cheik tum RtIeckTMu bagridae bagrichthys obscurus black
trey Cheik tum RtIeckTMu bagridae bagrichthys macropterus black
trey Cheik tum RtIeckTMu bagridae bagrichthys macracanthus black
trey Chhdau RtIeqþa Channidae Channa micropeltes black
trey Chhkaok RtIeqáak Cyprinidae Cyclocheilichthys enoplos White
trey Chhkaok phloeung RtIeqáakePIøg Cyprinidae Cyclocheilichthys furcatus White
trey Chhkaok pukmotbai RtIeqáakBukmat;bI Cyprinidae Cyclocheilichthys heteronema White
trey Chhkaok tytuy RtIeqáakTITuy Cyprinidae Albulichthys albuloides White
trey Chhkok Kda / Kampoul bai RtI eqáak rWRtIkMBUl)ay Cyprinidae Cosmochilus harmandi White
trey Chhlang RtIqøaMg bagridae hemibagrus spilopterus Grey
trey Chhlang RtIqøaMg bagridae hemibagrus nemurus Grey
trey Chhlang khmao RtIqøaMgexµA bagridae hemibagrus wyckii Grey
trey Chhlarm RtIqøam Carcharhinidae rhizoprionodon acutus White
trey Chhma RtIqµa Engraulidae setipinna melanochir White
trey Chhmar krapeu RtIqµaRkeBI Engraulidae Lycothrissa crocodilus White
trey Chhpin RtIq<in Cyprinidae hypsibarbus pierrei White
trey Chhpin RtIq<in Cyprinidae hypsibarbus malcolmi White
trey Chhpin RtIq<in Cyprinidae hypsibarbus lagleri White
trey Chhpin krohorm q<inRkhm Cyprinidae hypsibarbus wetmorei Grey
trey Chhpin prak RtIq<inR)ak; Cyprinidae barbonymus gonionotus Grey
trey Chlounh RtIqøÚj Mastacembelidae Macrognathus siamensis black

systEMs ANALysIs
99
KhMEr NAME IN roMAN KhMEr NAME IN KhMEr fAMILy LAtIN NAME GUILD
trey Chongwa RtIcgVa Cyprinidae opsarius pulchellus Grey
trey Chra keng RtIRcEkg Cyprinidae puntioplites wanderssi White
trey Chra keng RtIRcEkg Cyprinidae puntioplites proctozystron White
trey Chra keng RtIRcEkg Cyprinidae puntioplites falcifer White
trey Chunlungh moan RtICnøÜjman; Engraulidae Coilia macrognathos Grey
trey Chunlungh moan RtICnøÜjman; Engraulidae Coilia lindmani Grey
trey Chunteas phluk RtICnÞasPøúk Cyprinidae parachela williamminae Grey
trey Chunteas phluk RtICnÞasPøúk Cyprinidae parachela siamensis Grey
trey Chunteas phluk RtICnÞasPøúk Cyprinidae parachela oxygastroides Grey
trey Chunteas phluk RtICnÞasPøúk Cyprinidae parachela maculicauda Grey
trey Domrei RtIdMrI Eleotridae oxyeleotris marmorata black
trey Dong khteng RtIdgExÞg Cyprinidae Macrochirichthys macrochirus Grey
trey Ka-ao RtIkaeGar Cyprinidae tor tambroides White
trey Ka-ao RtIkaeGar Cyprinidae tor sinensis White
trey Kabo or Chai kropeu RtIkabU rW écRkeBI syngnathidae Doryichthys boaja White
trey Ka-ek RtIEk¥k Cyprinidae Labeo chrysophekadion White
trey Ka-ey RtI k¥I Notopteridae Chitala blanci Grey
trey Kahe krohorm RtIkaEhRkhm Cyprinidae barbonymus altus White
trey Kahe lueung RtIkaEhelOg Cyprinidae barbonymus schwanenfeldii Grey
trey Kam pream loeung RtIkMRBam elOg polynemidae polynemus borneensis White
trey Kam pream sor RtIkMRBam s polynemidae polynemus dubius White
trey Kambot chramos RtIkMbutRcmuH Cyprinidae Amblyrhynchichthys truncatus White
trey Kamphleanh phluk RtIkMPøajPøúk osphronemidae trichogaster microlepis black
trey Kamphleanh srae RtIkMPøajERs osphronemidae trichogaster trichopterus black
trey Kamphleav RtIkMePøóv siluridae Kryptopterus schilbeides Grey
trey Kamphleav RtIkMePøóv siluridae Kryptopterus hexapterus Grey
trey Kamphleav khlanh RtIkMePøóvxøaj; siluridae Kryptopterus cryptopterus Grey
trey Kamphleav stung RtIkMePøóvsÞwg siluridae Kryptopterus cheveyi Grey
trey Kampot RtIkMBt tetraodontidae tetraodon leiurus Grey
trey Kampot RtIkMBt tetraodontidae tetraodon cochinchinensis Grey
trey Kampot RtIkMBt tetraodontidae tetraodon biocellatus Grey
trey Kampot RtIkMMMBt tetraodontidae Carinotetraodon lorteti Grey
trey Kampot RtIkMMMBt tetraodontidae Auriglobus nefastus Grey
trey Kanhchak slar RtIkBa©ak;søa toxotidae toxotes microlepis White
trey Kanhchak slar RtIkBa©ak;søa toxotidae toxotes chatareus White
trey Kanhchanhchras thom RtIkBa©aj;Rcas;FM Ambassidae parambassis apogonoides Grey
trey Kanhchanhchras torch RtIkBa©aj;Rcas;tUc Ambassidae parambassis siamensis Grey
trey Kanhchos RtIkBa©úH bagridae Mystus micracanthus Grey
trey Kanhchos bai RtIkBa©úH)ay bagridae Mystus albolineatus Grey

KhMEr NAME IN roMAN KhMEr NAME IN KhMEr fAMILy LAtIN NAME GUILD
trey Kanhchos chnot RtIkBa©úHqñÚt bagridae Mystus mysticetus Grey
trey Kanhchos chnot RtIkBa©úHqñÚt bagridae Mystus multiradiatus Grey
trey Kanhchos Kdoang RtIkBa©úHekþag bagridae Mystus bocourti Grey
trey Kanhchos thmor RtIkBa©úH fµ bagridae pseudomystus siamensis black
trey Kanhchoun chey RtIkBa¢nC½y Channidae Channa lucius black
trey Kanhchrouk RtIk®Ba©Úk Cobitidae botia morleti White
trey Kanhchrouk RtIk®Ba©Úk Cobitidae botia beauforti White
trey Kanhchrouk chnot RtIk®Ba©ÚkqñÚt Cobitidae botia helodes White
trey Kanhchrouk krohorm RtIk®Ba©ÚkRkhm Cobitidae botia modesta White
trey Kanhchrouk leung RtIk®Ba©ÚkelOg Cobitidae botia lecontei White
trey Kantho RtIkn§r osphronemidae trichogaster pectoralis black
trey Kantrob RtIk®nþb; Nandidae pristolepis fasciata black
trey Kantrorng preng RtIk®nþgeRbg Ambassidae parambassis wolffii Grey
trey Kantuy krohorm RtIknÞúyRkhm Cyprinidae Discherodontus schroederi White
trey Ka-ork RtIk¥úk Ariidae Netuma thalassinus Grey
trey Ka-ork RtIk¥úk Ariidae Cryptarius truncatus Grey
trey Ka-ork RtIk¥úk Ariidae Cephalocassis borneensis Grey
trey Ka-ork RtIk¥úk Ariidae Arius stormii Grey
trey Ka-ork RtIk¥úk Ariidae Arius sona Grey
trey Ka-ork RtIk¥úk Ariidae Arius maculatus Grey
trey Ka-ork RtIk¥úk Ariidae Arius intermedius Grey
trey Kasan RtIkSan Channidae Channa gachua White
trey Kbork RtIk,k Clupeidae tenualosa thibaudeaui White
trey Keat srang RtIeKotRsg Cyprinidae balantiocheilos melanopterus White
trey Kes RtIEks siluridae Micronema bleekeri White
trey Kes Chumrov RtIEksCMerA siluridae Kryptopterus apogon White
trey Kes prak RtIeksR)ak; siluridae Kryptopterus bicirrhis Grey
trey Kes thom RtIEksþFM siluridae Micronema micronema Grey
trey Khchoeung RtIx¢wg Mastacembelidae Mastacembelus favus black
trey Khchoeung RtIx¢wg Mastacembelidae Mastacembelus armatus black
trey Khchoeung RtIx¢wg Mastacembelidae Macrognathus taeniagaster black
trey Khchoeung RtIx¢wg Mastacembelidae Macrognathus maculatus black
trey Khchoeung pkhar RtIx¢wgpáa Mastacembelidae Mastacembelus erythrotaenia black
trey Khchoeung pleung RtIx¢wgePßIg Mastacembelidae Macrognathus circumcinctus black
trey Khla RtIxøa Coiidae Datnioides polota White
trey Khla RtIxøa Datnioididae Datnioides undecimradiatus White
trey Khla RtIxøa Datnioididae Datnioides pulcher black
trey Khla RtIxøa Datnioididae Datnioides microlepis Grey
trey Khlang hay RtIkøaMghay siluridae belodontichthys dinema Grey
trey Khman RtIxµan; Cyprinidae hampala macrolepidota Grey

systEMs ANALysIs
101
KhMEr NAME IN roMAN KhMEr NAME IN KhMEr fAMILy LAtIN NAME GUILD
trey Khman RtIxµan; Cyprinidae hampala dispar Grey
trey Khnorng veng RtIxñgEvg Cyprinidae Labiobarbus lineatus White
trey Khnorng veng RtIxñgEvg Cyprinidae Labiobarbus leptocheila White
trey Khya RtIxüa bagridae hemibagrus wyckioides Grey
trey Kranh RtIRkaj; Anabantidae Anabas testudineus black
trey Kray RtIRkay Notopteridae Chitala ornata Grey
trey Kray RtIRkay Notopteridae Chitala chitala Grey
trey Kray krobei RtIRkayRkbI Notopteridae Chitala lopis Grey
trey Krim kdar RtIRkwmkþar osphronemidae trichopsis vittata black
trey Krim peuk RtIRkwmePOk osphronemidae betta splendens black
trey Krim tun-sary RtIRkwmTnSay osphronemidae trichopsis schalleri black
trey Krim tun-sary RtIRkwmTnSay osphronemidae trichopsis pumila black
trey Krobei RtIRkbI sisoridae Glyptothorax lampris White
trey Krobei RtI RkbI sisoridae bagarius yarrelli White
trey Krobei RtI RkbI sisoridae bagarius suchus White
trey Krobei RtI RkbI sisoridae bagarius bagarius White
trey Kromorm RtIRkm:m siluridae ompok bimaculatus Grey
trey Kromorm RtIRkm:m siluridae hemisilurus mekongensis White
trey Kros RtIRkus Cyprinidae osteochilus microcephalus White
trey Kros RtIRkus Cyprinidae osteochilus lini Grey
trey Kros RtIRkus Cyprinidae osteochilus hasseltii Grey
trey Kros RtIRkus Cyprinidae osteochilus waandersi White
trey Kros phnom RtIRkusPñM Cyprinidae poropuntius malcolmi Grey
trey Krum RtIRKMu Cyprinidae osteochilus melanopleurus White
trey Ksan RtIkSan Gobiidae Glossogobius aureus White
trey Kuch chrea RtIKuceRCo¼ke®Ba¢ó Cyprinidae puntioplites bulu White
trey Kul chek RtIKl;eck Cyprinidae Epalzeorhynchos frenatum Grey
trey Kulreang RtIKl;raMg Cyprinidae Catlocarpio siamensis White
trey Linh RtIlij Cyprinidae thynnichthys thynnoides White
trey Lolouk sor RtIllks Cyprinidae osteochilus schlegelii White
trey paloung RtI )a:lUg Clupeidae tenualosa toli White
trey pase ee RtI)a:sIuGIiu Cyprinidae Mekongina erythrospila White
trey pava mouk muoy tI)a:va:muxmYy Cyprinidae Labeo erythropterus White
trey pava mouk muoy or Ka-ek pouk
RtI)a:va:muxmYy rW Ek¥kBUk Cyprinidae Labeo dyocheilus White
trey phkar char RtIpáacar Cyprinidae Cirrhinus jullieni White
trey phkar ko RtIpáaK Cyprinidae Cirrhinus molitorella White
trey phtoung RtIepÞag belonidae xenentodon cancila Grey
trey phtoung RtIepÞag hemiramphidae hyporhamphus limbatus Grey

KhMEr NAME IN roMAN KhMEr NAME IN KhMEr fAMILy LAtIN NAME GUILD
trey phtoung RtIepÞag hemiramphidae Dermogenys siamensis Grey
trey pra chveat RtIeQVot pangasiidae pteropangasius pleurotaenia White
trey pra chveat RtIeQVot pangasiidae pangasius polyuranodon White
trey pra chveat RtIeQVót pangasiidae pangasius macronema White
trey pra kae RtIEk pangasiidae pangasius conchophilus White
trey pra kandorl RtIR)akNþúr pangasiidae helicophagus waandersii White
trey pra khchao RtIR)aex©A pangasiidae pangasius bocourti White
trey pra po RtIeBa pangasiidae pteropangasius micronemus White
trey pra po RtIeBa pangasiidae pangasius larnaudii White
trey pra po pruy RtIeBaRBúy pangasiidae pangasius sanitwongsei White
trey pra thom RtIR)aFM pangasiidae pangasianodon hypophthalmus White
trey proloung / Chroloeung RtIRBlUg¼RcLwg Cyprinidae Leptobarbus hoevenii Grey
trey proma RtIRbm:a sciaenidae boesemania microlepis White
trey pruol / Krolang RtI RBYl¼RkLg; Cyprinidae Cirrhinus microlepis White
trey reach RtIraC pangasiidae pangasianodon gigas White
trey riel RtIerol Cyprinidae Cirrhinus caudimaculatus White
trey riel angkam RtIerolGgáam Cyprinidae henicorhynchus lobatus White
trey riel angkam RtIerolGgáam Cyprinidae henicorhynchus cryptopogon White
trey riel top RtIeroltub Cyprinidae henicorhynchus siamensis White
trey romeas RtIrmas osphronemidae osphronemus exodon Grey
trey ros / phtuk RtIr:s;rWpÞk; Channidae Channa striata black
trey ruschek RtIb£seck Cobitidae Acantopsis dialuzona Grey
trey sanday RtIsNþay siluridae Wallago attu Grey
trey sawka keo RtIskaEkv Cyprinidae raiamas guttatus White
trey slat RtIsøat Notopteridae Notopterus notopterus Grey
trey sleuk russey RtIsøwkb£sSI Cyprinidae paralaubuca typus White
trey sleuk russey RtIsøwkb£sSI Cyprinidae paralaubuca riveroi White
trey sleuk russey RtIsøwkb£sSI Cyprinidae paralaubuca harmandi White
trey spong RtIs<g; Centropomidae Lates calcarifer White
trey sraka kdam RtIRskakþam Cyprinidae Cyclocheilichthys repasson Grey
trey sraka kdam RtIRskakþam Cyprinidae Cyclocheilichthys lagleri White
trey sraka kdam RtIRskakþam Cyprinidae Cyclocheilichthys armatus White
trey sraka kdam RtIRskakþam Cyprinidae Cyclocheilichthys apogon White
trey stuok RtIsÞk; siluridae Wallago leerii White
trey ta aon RtItaeGan siluridae ompok hypophthalmus Grey
trey tanel RtItaenl bagridae hemibagrus filamentus Grey
trey tra sork RtIRtsk; Cyprinidae probarbus jullieni White
trey tra sork sor RtIRtsk;s Cyprinidae probarbus labeamajor White

systEMs ANALysIs
103
APPendIx 3 gloSSAry oF termS relAted
to lIvelIHoodS AnAlySIS
hUMAN CApItAL: people’s health and ability to work, and the knowledge and skills they have acquired.
this includes, for example:
�� formal education.
�� skills in handicrafts and construction.
�� Local knowledge about farming, fishing and use of other natural resources such as forests.
�� Good health and ability to do hard work in the fields.
NAtUrAL CApItAL: Assets such as land, water, forests, fish and livestock.
the key issues for natural capital is whether people have secure access to the natural resources needed for the livelihood activity, and
whether these natural resources are in danger of being degraded by overexploitation or by some other cause such as pollution.
physICAL CApItAL: tools and equipment, and infrastructure such as roads, landing places, market facilities, wells or other wa-
ter supply facilities, and health facilities.
fINANCIAL CApItAL: Cash from the sale of production, employment or other income-generating activities; savings and access
to credit in the form of loans; and assets that can be easily sold such as gold or other jewellery.
soCIAL CApItAL: Connections between people and ways of doing things that help people work together, or help a village or com-
mune work with other organizations including government agencies, including, for example, the following:
�� Kinship groups, social groups, village organizations, and clubs or societies.
�� Community-based NGos that help with social organization and contacting government agencies and obtaining government services.
�� Ways in which the community may manage natural resources such as forests and fisheries.
VULNErAbILIty fACtors: things that affect livelihoods in the commune which people in the commune cannot easily influence
or control, as for example the following :
�� factors that may cause people to lose tenure or access to natural resources such as land or fishing grounds.
�� bad weather events that affect certain crops, livestock, fishing or other activities.
�� pest and disease threats for crops or livestock.
�� Whether human health problems may affect ability to work.
�� Variation in market prices for staple commodities or cash crops or production inputs.
�� high seasonal demand for labour in other activities.
�� Conflict or civil unrest.
INstItUtIoNs: Laws, rules and customs that determine how things are done and who has access to natural resources (natural
capital), to infrastructure (physical capital), to savings groups or loans (financial capital), to knowledge or education (human capital),
and community initiatives and actions (social capital).