common functional polymorphisms of disc1 and cortical maturation in typically developing children...
TRANSCRIPT

Common functional polymorphisms of DISC1 and corticalmaturation in typically developing children and adolescents
A Raznahan1,2, Y Lee1, R Long1, D Greenstein1, L Clasen1, A Addington1, JL Rapoport1,and JN Giedd1
1Child Psychiatry Branch, National Institute of Mental Health, Bethesda, MA, USA2Kings College London, Department of Child and Adolescent Psychiatry, Institute of Psychiatry,London, UK
AbstractDisrupted-in-schizophrenia-1 (DISC1), contains two common non-synonymous single-nucleotidepolymorphisms (SNPs)—Leu607Phe and Ser704Cys—that modulate (i) facets of DISC1molecular functioning important for cortical development, (ii) fronto-temporal cortical anatomy inadults and (iii) risk for diverse psychiatric phenotypes that often emerge during childhood andadolescence, and are associated with altered fronto-temporal cortical development. It remainsunknown, however, if Leu607Phe and Ser704Cys influence cortical maturation before adulthood,and whether each SNP shows unique or overlapping effects. Therefore, we related genotype atLeu607Phe and Ser704Cys to cortical thickness (CT) in 255 typically developing individuals aged9–22 years on whom 598 magnetic resonance imaging brain scans had been acquiredlongitudinally. Rate of cortical thinning varied with DISC1 genotype. Specifically, the rate ofcortical thinning was attenuated in Phe-carrier compared with Leu-homozygous groups (inbilateral superior frontal and left angular gyri) and accelerated in Ser-homozygous compared withCys-carrier groups (in left anterior cingulate and temporal cortices). Both SNPs additivelypredicted fixed differences in right lateral temporal CT, which were maximal between Phe-carrier/Ser-homozygous (thinnest) vs Leu-homozygous/Cys-carrier (thickest) groups. Leu607Phe andSer704Cys genotype interacted to predict the rate of cortical thinning in right orbitofrontal, middletemporal and superior parietal cortices, wherein a significantly reduced rate of CT loss wasobserved in Phe-carrier/Cys-carrier participants only. Our findings argue for further examinationof Leu607Phe and Ser704Cys interactions at a molecular level, and suggest that these SNPs mightoperate (in concert with other genetic and environmental factors) to shape risk for diversephenotypes by impacting on the early maturation of fronto-temporal cortices.
KeywordsDISC1; cortical thickness; schizophrenia; autism; genetic; neuroimaging
© 2010 Macmillan Publishers Limited All rights reservedCorrespondence: Dr A Raznahan, Child Psychiatry Branch, National Institutes of Health, National Institute of Mental Health, 10Center Drive, Building 10, Room 3N202, Bethesda, MD 20892, USA. [email protected] of interestThe authors declare no conflict of interest.Supplementary Information accompanies the paper on the Molecular Psychiatry website (http://www.nature.com/mp)
NIH Public AccessAuthor ManuscriptMol Psychiatry. Author manuscript; available in PMC 2011 September 1.
Published in final edited form as:Mol Psychiatry. 2011 September ; 16(9): 917–926. doi:10.1038/mp.2010.72.
NIH
-PA Author Manuscript
NIH
-PA Author Manuscript
NIH
-PA Author Manuscript
IntroductionDisrupted-in-schizophrenia-1 (DISC1) has become the focus of intense investigation inpsychiatric genetics since it was first described as spanning the chromosome 1 breakpoint ofa balanced t(1:11) translocation1 that had been found to segregate with schizophrenia (SCZ),bipolar affective disorder and major depressive disorder (MDD) in a large Scottish family.2This initial observation of apparent diagnostic nonspecificity has since been supplementedby cytogenetic, linkage and association studies implicating the DISC1 locus, and variantswithin it to diverse psychiatric phenotypes including SCZ (reviewed in Chubb et al.3),schizoaffective disorder,4 affective disorders (both bipolar affective disorder and MDD),5autism spectrum disorders,6,7 cognitive and symptom profile among people with SCZ,8–11
and both personality traits12 and cognitive ageing13,14 in non-clinical samples.
A potential explanation for how DISC1 variants might confer susceptibility to such a widerange of conditions comes from cell and animal studies that firmly establish DISC1 ashaving a key role in development of the cerebral cortex through its influence on coreprocesses such as progenitor cell division, radial migration of neurons into the cortical plate,neurite outgrowth and arborization, and postnatal neurogenesis.3,15 Just as DISC1 seems tobe intimately involved in cortical development, post mortem16–18 and in vivo structuralmagnetic resonance imaging (sMRI)19,20 studies indicate that aberrant cortical developmentbefore adulthood is likely to be a key component of the developmental neurobiology ofmany conditions that have been linked to DISC1. Furthermore, these conditions often haveprodromal or frank symptom onset during childhood and adolescence—when the cortex isknown to undergo dramatic structural remodeling in typical development.21–23 Theseobservations raise the as yet untested hypothesis that variations in DISC1 functioning mayimpart risk for psychopathology by modulating cortical maturation during these crucialdevelopmental phases.
Available studies regarding the role of DISC1 in development draw heavily on inferencesfrom the mouse.24–26 One strategy for better understanding how genetic variation in DISC1relates to cortical development in humans would be to focus on polymorphisms withinDISC1 that (i) are sufficiently common to allow meaningful statistical comparisons of brainsMRI images between groups of individuals bearing different genotypes, (ii) have shownsome (although not necessarily unequivocal27) association with mental disorder inassociation studies, (iii) are known to alter protein expression, posttranslational modificationor function and (iv) for which there is preferably some previous evidence linking genotypeto differences in cortical structure or function in humans. Only two genetic variants withinDISC1 are currently known to meet all these criteria—the single-nucleotide polymorphisms(SNPs) Leu607Phe (rs6675281) and Ser704Cys (rs821616). Table 1 details the manner inwhich each SNP fulfills the above criteria.
Available DISC1 ‘imaging-genetic’44 studies have made important first steps in relatinggenotype at Leu607Phe and Ser704Cys to cortical anatomy in humans. However, thesestudies have related DISC1 genotype to cross-sectional sMRI measures in adults, usingsample sizes that have precluded Leu607Phe and Ser704Cys being related to corticalanatomy concurrently, within the same sample. Therefore, it remains unknown ifLeu607Phe and Ser704Cys influence cortical maturation during childhood and adolescence,and the extent to which these two SNPs—which fall within distinct regions that encodedifferent DISC1 partner–protein interaction domains—will show overlapping vs uniquerelationships with cortical anatomy.
In this study, we related genotype at both Leu607Phe and Ser704Cys to sMRI-derivedmeasures of cortical thickness (CT) change over time, in a large longitudinal sample of
Raznahan et al. Page 2
Mol Psychiatry. Author manuscript; available in PMC 2011 September 1.
NIH
-PA Author Manuscript
NIH
-PA Author Manuscript
NIH
-PA Author Manuscript
typically developing children and adolescents. We wished to test the hypotheses that fronto-temporal cortical maturation varies as a function of genotype at Leu607Phe and Ser704Cys,and that these SNPs show both overlapping and unique regional associations with CT. Tofacilitate comparison with previous imaging-genetic investigations of these variants and tooptimize sample size in each genotype group, participants were grouped as Phe-carriers vsLeu-homozygotes (PheCar/LeuLeu), and Cys-carriers vs Ser-homozygotes (CysCar/SerSer).We chose CT as the morphometric index of interest because it is a highly heritable aspect ofcortical anatomy,45 and its developmental trajectories (i) follow a well characterizedpattern,22 (ii) are known to be altered in many of the disorders with which DISC1 has beenassociated,19,46,47 (iii) show sensitivity to genotype at other functional geneticpolymorphisms48 and (iv) can be characterized in an accurate and reliable manner at severalthousand points (vertices) across the cortical sheet using high-throughput automatedapproaches, which allows for spatially non-biased examination of cortical maturation inlarge samples.49 There are also several methodological and theoretical advantages to usingCT rather than voxel-based measures of ‘gray matter density’ as a spatially non-biased indexof cortical anatomy.50
Materials and methodsParticipants
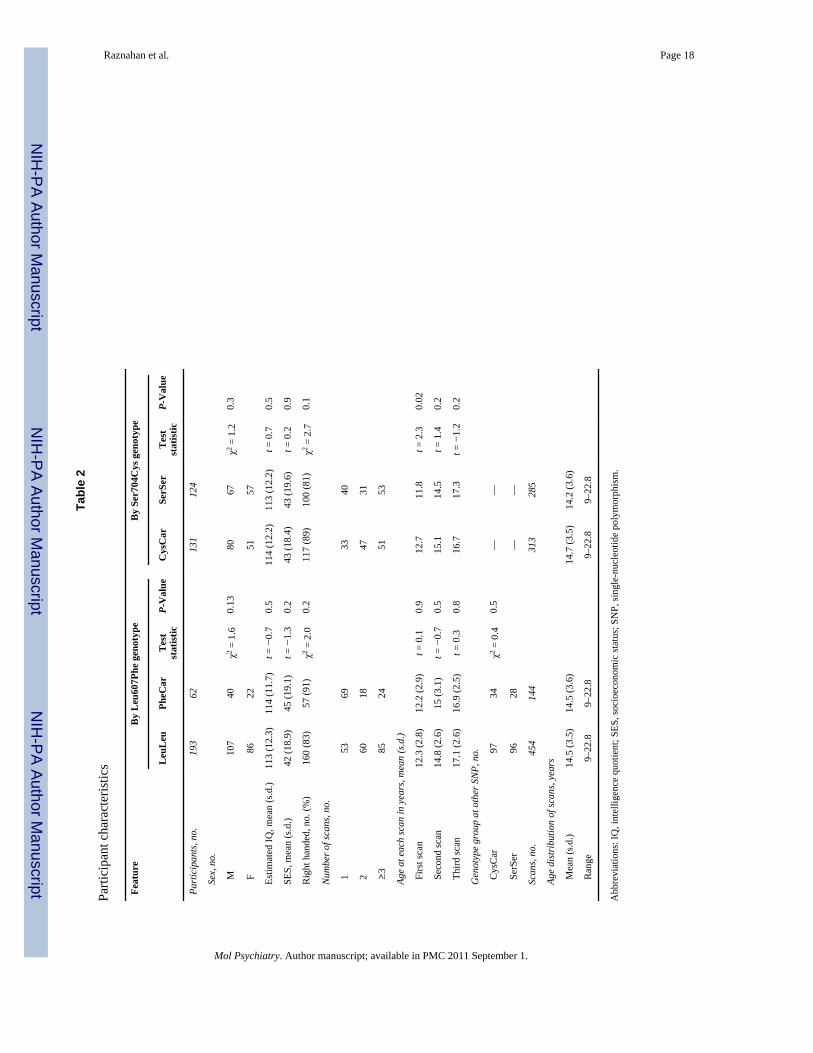
Please see Table 2 for full details of participant demographics and genotype composition.We included 255 healthy Caucasian children and adolescents (108 females) from 179families, on whom a total of 598 sMRI scans had been acquired between the ages of 9 and22 years. Participants were recruited through local advertisement. The absence ofneurological or psychiatric illness was established through completion of a screeningquestionnaire (childhood behavior checklist), and a structured diagnostic interviewadministered by a child psychiatrist.51 Participants were of mixed handedness (handednessestablished using physical and neurological examination of soft signs).
All participants had a full-scale intelligence quotient (IQ) of > 80 (IQ was estimated usingage-appropriate Wechsler intelligence scales52). Socioeconomic status was quantified usingHollings-head scales.53 The institutional review board of the National Institutes of Healthapproved the research protocol used in this study and written informed consent and assent toparticipate in the study were obtained from parents and children respectively.
GenotypingFor each participant, DNA was extracted from previously prepared lymphoblastoid cell linesusing standard methods (Qiagen, Alameda, CA, USA). It has been established thatconversion of cells into lymphoblastoid lines does not cause errors into SNP genotyping.54
Genotyping was performed by Prevention Genetics (Marshfield, WI, USA), using sub-microliter allele-specific polymerase chain reactions.55 DNA sequencing of positive controlswas conducted to ensure correct assignment of genotypes. Allele frequencies were Leu 0.88,Ser 0.70—in keeping with reference Centre d’Etude Polymorphism Humain (CEPH) datafor populations of European descent. Genotype frequencies were LeuLeu 0.76, LeuPhe 0.23,PhePhe 0.01/SerSer 0.49, SerCys 0.43 and CysCys 0.01. Genotype frequencies did notdeviate from Hardy–Weinberg equilibrium for either SNP regardless of whether relatedindividuals were included or not (Leu607Phe P = 0.5, Ser704Cys P = 0.6). Genotype at oneSNP was independent of genotype at the other (P = 0.5).
NeuroimagingOf all 225 participants with at least one brain sMRI scan, 60% had two or more, and 15%had three or more scans. Scans were acquired at approximately 2-year intervals. All sMRI
Raznahan et al. Page 3
Mol Psychiatry. Author manuscript; available in PMC 2011 September 1.
NIH
-PA Author Manuscript
NIH
-PA Author Manuscript
NIH
-PA Author Manuscript

scans were T-1 weighted images with contiguous 1.5 mm axial slices and 2.0 mm coronalslices, obtained on the same 1.5-T General Electric (Milwaukee, WI, USA) Signa scannerusing a three-dimensional spoiled gradient recalled echo sequence with the followingparameters: echo time, 5 ms; repetition time, 24 ms; flip angle 45°; acquisition matrix, 256 ×192; number of excitations, 1; and field of view, 24 cm. Head placement was standardizedas described previously. Native MRI scans were submitted to the CIVET pipeline (version1.1.8) (http://wiki.bic.mni.mcgill.ca/index.php/CIVET) to generate separate cortical modelsfor each hemisphere as described previously.56 Briefly, this automated set of algorithmsbegins with linear transformation, correction of non-uniformity artifacts, and segmentationof each image into white matter, gray matter and CSF.57 Next, each image is fitted with twodeformable mesh models to extract the white/gray and pial surfaces. These surfacerepresentations are then used to calculate CT at approximately 40 000 vertices perhemisphere (MacDonald et al., 2000).58 A 30 mm bandwidth blurring kernel was applied,the size of which was selected to maximize statistical power while minimizing falsepositives—as determined by population simulation.59 The validity of these vertex-basedestimated of CT is well established.22
Statistical analysisDemographic characteristics between genotype groups were compared using analysis ofvariance and two-sample t-tests for continuous variables, and χ2 test for categoricalvariables. General linear models with age at scan as a dependent variable were used toconfirm that interactions of demographic characteristics (for example, IQ and handedness incombination) were not unevenly distributed across the age range studied.
In neuroimaging analyses, we modeled—at each vertex—the fixed effects of age,Leu607Phe genotype, Cys704Ser genotype and interactions between these terms, whilecontrolling for gender differences in CT. Mixed model regression was used as it permits theinclusion of multiple measurements per person at different ages, and irregular intervalsbetween measurements, thereby increasing statistical power.60 We included a nested randomeffects term that modeled within family and within person dependence of observations. Allmodels were run with and without handedness, IQ and socioeconomic status as main effects,and in interaction with genotype terms. These terms were not included in the final modelbecause (i) their inclusion did not add significantly to the predictive power of the model (asdetermined using a likelihood ratio test), (ii) their addition did not alter the distribution ofsignificant findings for DISC1 genotype terms and (iii) handedness, IQ and socioeconomicstatus were evenly distributed between genotype groups and across age. Therefore, in thefinal model, at each vertex, CT for ith family’s jth individual’s kth time-point was modeledas:
Raznahan et al. Page 4
Mol Psychiatry. Author manuscript; available in PMC 2011 September 1.
NIH
-PA Author Manuscript
NIH
-PA Author Manuscript
NIH
-PA Author Manuscript

Leu607Phe and Ser704Cys were binary categorical variables with levels LeuLeu, PheCarand CysCar, SeSer, respectively. Age was centered to allow for interpretation of genotypegroup differences at the average age (14.5 years) rather than age 0. A decision was made toinclude a linear (rather than non-linear) trajectory because (i) preliminary analyses withinthis data set established that higher order age terms were not better able to predict variancein CT than linear age, and (ii) our previous work has shown that over the age range includedin this study—the predominant effect of age is linear.22 Results are reported after theapplication of a q = 0.05 false discovery rate61 threshold across P-values for all fixed-effectterms excluding the intercept. For any vertex in which an interaction term between two ormore main effects terms was significant, significant constituent main effects are notpresented.
Results for each fixed-effect term of interest were visualized by projection of the t-statisticsfor that term at all vertices onto a standard brain template. T-statistic maps (Figures 1 and 2)were also presented as ‘Binarized-maps’ (Figure 3 and Supplementary Figure 1) withsignificant clusters for any one term (that is, LeuPhe × age or SerCys × age) correspondingto one color, thus allowing multiple terms to be shown alongside each other on the samebrain template.
ResultsDemographic characteristics
LeuLeu and CysCar groups did not differ significantly from PheCar and SerSer groups bygender, handedness or IQ, respectively. Neither were these demographic characteristicssignificantly different across the four ‘haplotype’ groups (results not shown). Age at scanwas not significantly predicted by any interactions between genotype, gender, handednessand IQ. Full-scale IQ did not differ significantly between genotype groups. Fulldemographic details are provided in Table 2.
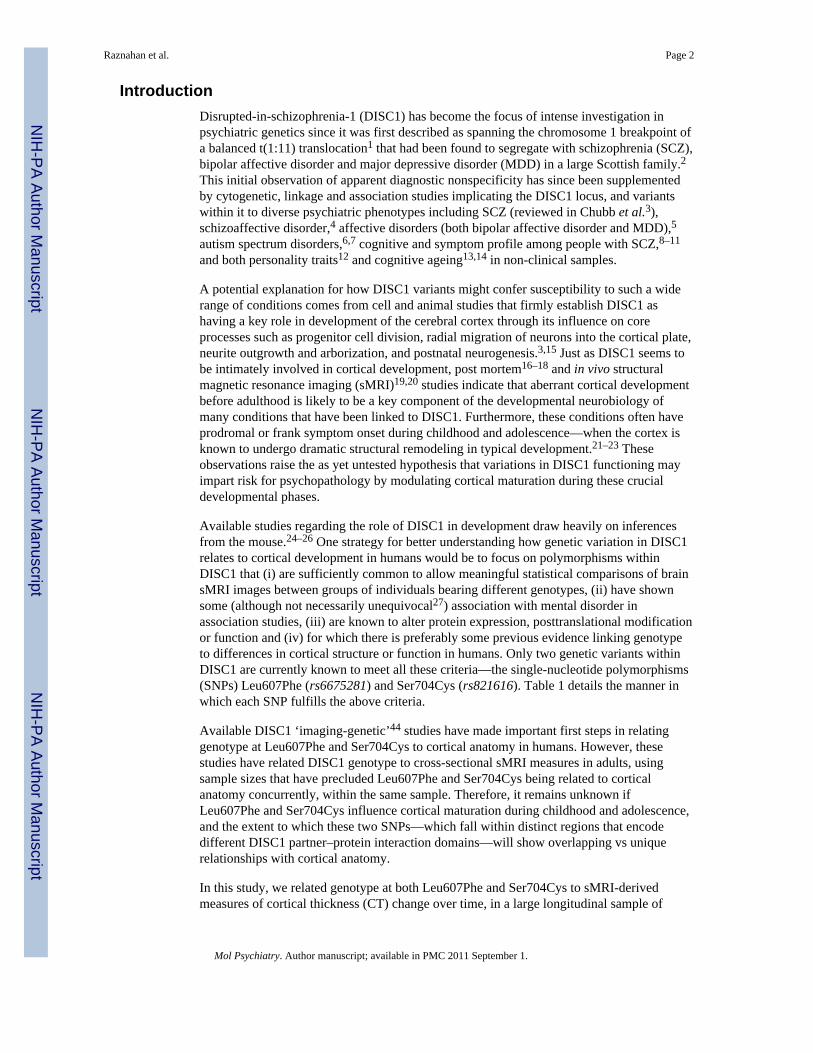
DISC1 effects on CT that did not vary significantly with ageLeu607Phe genotype was uniquely associated with CT in left middle temporal, left primarysensory, superior parietal and right inferior parietal cortices, in which PheCar were alwaysthinner than LeuLeu (see upper panel of Figure 1). Ser704Cys genotype was uniquelyassociated with CT in bilateral supplementary motor cortices, in which SerSer were alwaysthinner than CysCar (see Figure 1 lower panel). Leu607Phe and Ser704Cys genotype wereboth significantly associated with CT (PheCar thinner than LeuLeu, SerSer thinner thanCysCar) in a large confluent right lateral temporal region encompassing inferior, middle andsuperior temporal gyri. Across haplotypes groups (see Figure 3), CT was greatest in theLeuLeu/CysCar group, and smallest in the PheCar/SerSer group.
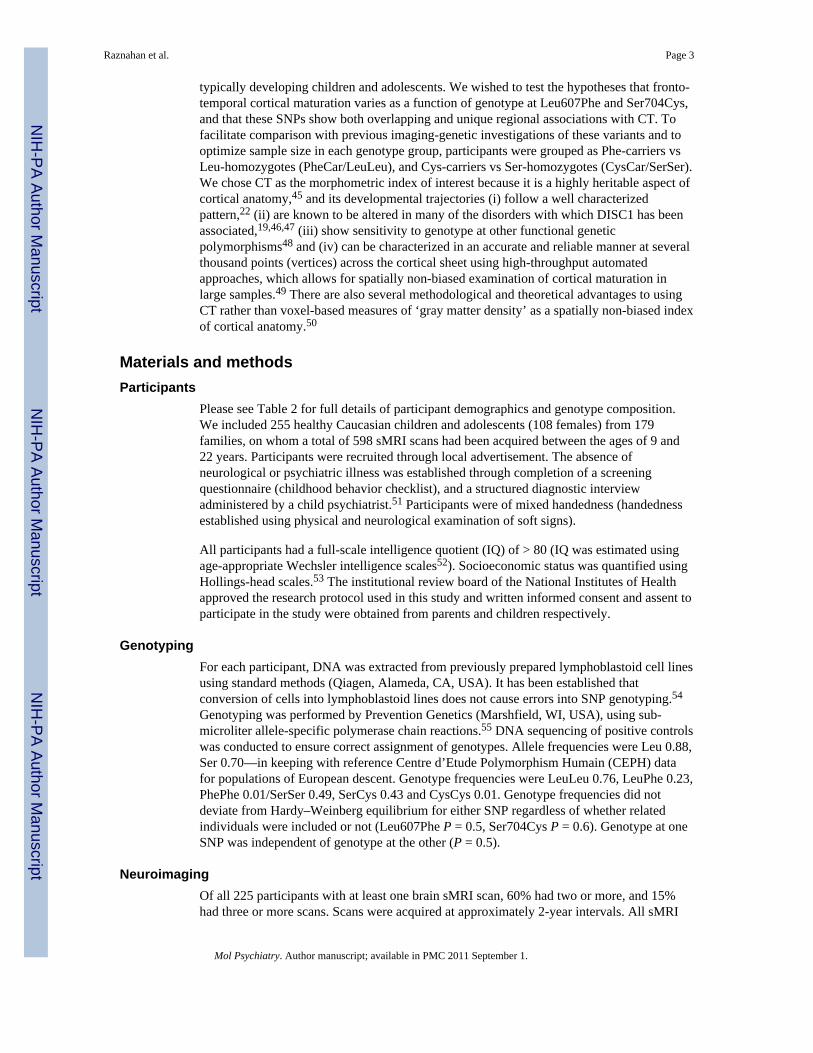
DISC1 effects on the rate of CT changeLeu607Phe influenced the rate of CT change with age in bilateral superior and medialfrontal cortices (although more so on the left), and left angular and middle temporal cortex.In all these regions CT thinning with age was attenuated in PheCar relative to LeuLeu. In theleft superior frontal cortex for example, this translated into LeuLeu undergoing a 7%reduction in CT between ages 9 and 23 years, whereas no CT change was observed inPheCar (see upper panels of Figure 2). At age 9 years, CT in this region was significantlyless in PheCar compared with LeuLeu (t = −4.3, P = 0.0005), but by age 23 there was asignificant group difference in the opposite direction (t = 2.0, P = 0.05). The spatial extent ofSer704Cys influences on the rate of CT change was less pronounced than that forLeu607Phe, and was restricted to the left anterior cingulate, and regions within the leftmiddle and superior temporal cortices. In all these areas, rate of CT thinning with age was
Raznahan et al. Page 5
Mol Psychiatry. Author manuscript; available in PMC 2011 September 1.
NIH
-PA Author Manuscript
NIH
-PA Author Manuscript
NIH
-PA Author Manuscript
increased in SerSer compared with CysCar. In the anterior cingulate, for example, CTreductions in SerSer between 8 and 22 were twice that observed in CysCar (see lower panelsof Figure 2). At age 9 years, CT in this region was significantly less in CysCar comparedwith SerSer (t = −2.3, P = 0.03), but by age 23 the direction of this group difference hadinverted, and there was no longer a statistically significant difference between the twogroups in CT (t = −1.7, P = 0.1). Maps of regions in which Leu607Phe and Ser704Cysinfluenced the rate of CT change did not overlap.
Interaction between Leu607Phe and Ser704CysSignificant interaction between Leu607Phe and Ser704Cys in predicting age-invariantdifferences in CT was restricted to a small region within the left primary sulcus and adjacentsensory cortex. In this region, PheCar was only associated with significant thinning relativeto LeuLeu in the presence of SerSer (see Supplementary Figure 1—right-hand panel).
Significant interactions between Leu607Phe and Cys704Ser in predicting the rate of CTchange with age were restricted to small regions within left orbitofrontal, right lateralparietal and right middle temporal cortices. In all these regions, CT changed little with ageamong those with the PheCar/CysCar genotype combination, while CT reduced robustlywith age in all three other genotype combinations (see Supplementary Figure 1—left-handpanel).
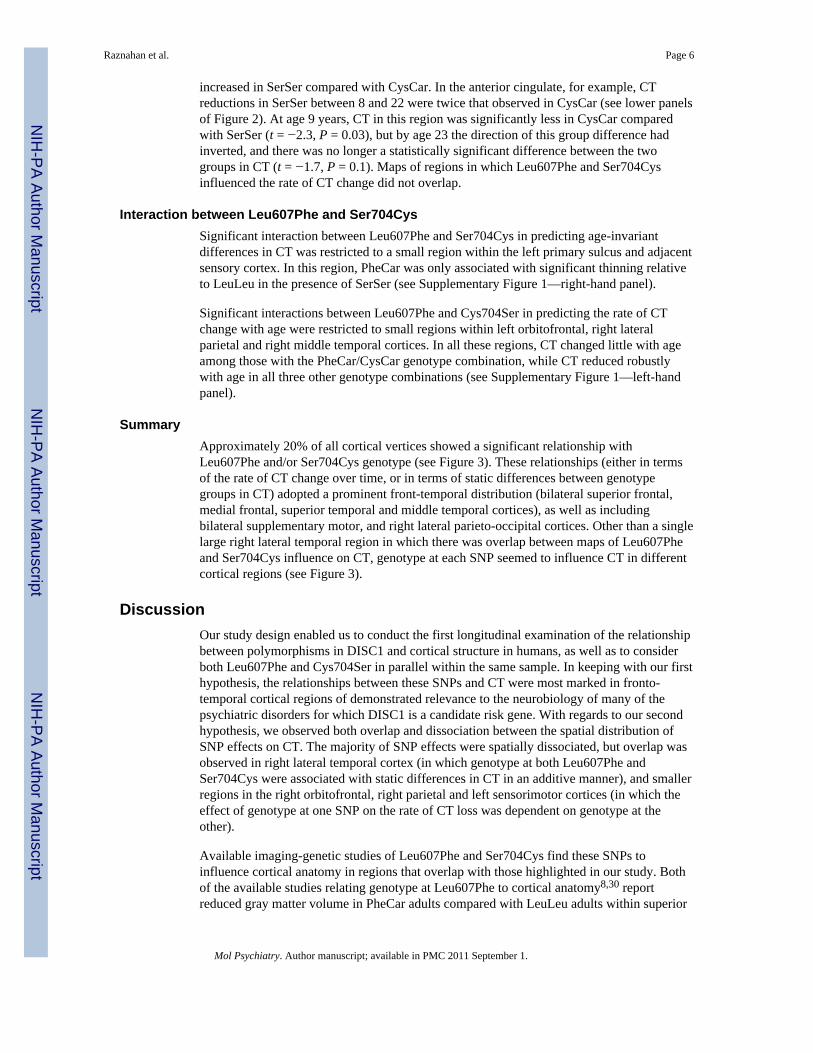
SummaryApproximately 20% of all cortical vertices showed a significant relationship withLeu607Phe and/or Ser704Cys genotype (see Figure 3). These relationships (either in termsof the rate of CT change over time, or in terms of static differences between genotypegroups in CT) adopted a prominent front-temporal distribution (bilateral superior frontal,medial frontal, superior temporal and middle temporal cortices), as well as includingbilateral supplementary motor, and right lateral parieto-occipital cortices. Other than a singlelarge right lateral temporal region in which there was overlap between maps of Leu607Pheand Ser704Cys influence on CT, genotype at each SNP seemed to influence CT in differentcortical regions (see Figure 3).
DiscussionOur study design enabled us to conduct the first longitudinal examination of the relationshipbetween polymorphisms in DISC1 and cortical structure in humans, as well as to considerboth Leu607Phe and Cys704Ser in parallel within the same sample. In keeping with our firsthypothesis, the relationships between these SNPs and CT were most marked in fronto-temporal cortical regions of demonstrated relevance to the neurobiology of many of thepsychiatric disorders for which DISC1 is a candidate risk gene. With regards to our secondhypothesis, we observed both overlap and dissociation between the spatial distribution ofSNP effects on CT. The majority of SNP effects were spatially dissociated, but overlap wasobserved in right lateral temporal cortex (in which genotype at both Leu607Phe andSer704Cys were associated with static differences in CT in an additive manner), and smallerregions in the right orbitofrontal, right parietal and left sensorimotor cortices (in which theeffect of genotype at one SNP on the rate of CT loss was dependent on genotype at theother).
Available imaging-genetic studies of Leu607Phe and Ser704Cys find these SNPs toinfluence cortical anatomy in regions that overlap with those highlighted in our study. Bothof the available studies relating genotype at Leu607Phe to cortical anatomy8,30 reportreduced gray matter volume in PheCar adults compared with LeuLeu adults within superior
Raznahan et al. Page 6
Mol Psychiatry. Author manuscript; available in PMC 2011 September 1.
NIH
-PA Author Manuscript
NIH
-PA Author Manuscript
NIH
-PA Author Manuscript
frontal regions that overlap with those in which we report PheCar as showing attenuatedrates of CT loss with age relative to LeuLeu during childhood and adolescence. ForSer704Cys, Hashimoto et al.37 report gray matter volume reductions in CysCar adultscompared with SerSer, within cingulate cortices that include the anterior cingulate region inwhich we find CysCar to have attenuated rates of CT loss with age compared with SerSer.However, closer comparison between our findings and existing DISC1 imaging-geneticsstudies is complicated by several methodological differences. First, previous studiesexamined the main effect of each SNP on cortical anatomy without controlling for genotypeat the other, and as such the SNP main effects reported are not equivalent. Second, samplesize differences between our study and previous work has implications for the risk of samplebias and type II error. Third, we explicitly examined longitudinal trajectories of CT in youth,whereas previous studies have been cross-sectional studies of cortical volume in adults. Twofalse assumptions would be made in attempting to infer cross-sectional genotype groupdifferences in cortical volume during adulthood by extrapolating genotype group differencesin longitudinal CT change during youth; that cortical volume and CT are neurobiologicallyequivalent,19 and that the linear trajectories we describe between 9 and 22 years of age canbe extended into adulthood.22 Finally, in some previous DISC1 genetic-imaging studies, theeffect of genotype has been examined while combining patients and controls in the sameanalyses,8,30 whereas we focused on typically developing children and adolescents (althoughit is possible that some of the participants in our study may go on to manifest psychiatricsymptoms when older). The relationship between genotype and cortical anatomy in clinicalgroups may be confounded by genotype-dependent differences in neuropsychological8 orsymptom30 profile, and treatment responsiveness. These features could alter corticalmaturation in their own right, and the confounding effects of such secondary changes maywell become more pronounced over time. For these reasons, examining gene–brainrelationships in younger samples of healthy, asymptomatic controls may provide a moreconfound-free means of identifying the neurostructural correlates of genetically determinedvariations in DISC1 functioning. Our findings on adopting this strategy have a number ofimplications for our understanding of DISC1 neurobiology and its role in shaping braindevelopment and risk for psychopathology.
First, multiple sMRI studies have reported differences in CT between typically developingcontrols and individuals suffering from conditions linked to DISC1 within those regions inwhich we show cortical anatomy to be influenced by Leu607Phe and Ser704Cys genotype(SCZ—bilateral superior frontal, superior temporal and angular gyrus,19,48 bipolar affectivedisorder—lateral temporal cortices62). Our findings also overlap with regions of altered CTin individuals at increased risk for, but not manifesting symptoms of disorders linked toDISC1 (SCZ—left prefrontal and bilateral temporal cortices,63 MDD—right superior frontaland supplementary motor cortex64), suggesting that altered structural cortical maturation insuch regions is not purely a consequence of illness, but indexes heritable risk for disorder.Therefore, the associations we report between genotype at Leu607Phe and Ser704Cys andCT suggest a neurodevelopmental mechanism through which these variants might act toalter risk for psychiatric disorder. It remains unclear if Leu607Phe and Ser704Cys influencecortical maturation by affecting on (i) the way DISC1 functions in the cortex duringadolescence or (ii) ‘foundational’ roles had by DISC1 during earlier cortigogenesis, whichthen have the delayed consequence of derailing adolescent cortical development. Althoughnot mutually exclusive, these hypotheses can be contrasted in animal models.65 Futureneuroimaging studies using methods for image analysis that permit assessment of earlier-established morphometric properties of the cortex such as sulcal patterning may also help tofurther parse the developmental timing of DISC1 influences on cortical development.
Second, our findings in a sample of typically developing individuals indicate that genotypedifferences at Leu607Phe and Ser704Cys, and the associated variation in fronto-temporal
Raznahan et al. Page 7
Mol Psychiatry. Author manuscript; available in PMC 2011 September 1.
NIH
-PA Author Manuscript
NIH
-PA Author Manuscript
NIH
-PA Author Manuscript

cortical maturation clearly are not, in isolation, sufficient for psychiatric illness (orprodromal developmental problems) to become apparent. This is consistent with the fact thatthese are relatively common SNPs, and (based on available genetic association study data)not highly penetrant for psychiatric phenotypes, implying that other genetic andenvironmental factors must interact with genotype at Leu607Phe and Ser704Cys, andpresumably the intermediate phenotypes they impart, to influence behavioral phenotype. Insupport of this model, (i) both SNPs impact on interactions between DISC1 and specificmolecular systems (for example, pericentriolar material-1 and extracellular signal-regulatedkinase), which are themselves known to regulate cortical development and harbor geneticvariants conferring risk for SCZ and MDD,33,66 (ii) genotype at Ser704Cys conditionsgenetic associations between SCZ and polymorphisms within NDEL1 (nuclear distributiongene E homolog-like 1, formerly known as NUDEL or endooligopeptidase A (EOPA))which interacts with DISC1 through a domain containing residue 704, and has its own well-established role in cortical maturation67 and (iii) the recent finding that Leu607Phe andSer704Cys can alter DISC1 posttranslational splicing greatly increases the scope forinteraction between these SNPs and other genetic and environmental factors.35 Our findingshighlight the processes underlying fronto-temporal cortical maturation during adolescence asa potentially ‘common pathway’ on which such interactions might converge, and withinwhich the search for DISC1 interactors may prove fruitful.
Third, DISC1 influences on CT are observed in 20% of the cortical surface, and althoughthere are some cortical regions in which both SNPs influence CT in an additive (right lateraltemporal), or interacting (left primary sulcus, right middle temporal, orbitofrontal andparietal) manner, there is otherwise remarkably little overlap between the regions in whicheach SNP is associated with CT. Spatial or temporal differences in cortical DISC1expression could potentially distinguish those regions in which either SNP is associated withCT from those in which neither SNP is associated with CT, and further studiescharacterizing these expression patterns are required. As neither Leu607Phe nor Ser704Cysseem to influence DISC1 expression,68 then the presence or absence of overlap betweenLeu607Phe and Ser704Cys effects within a given cortical region may reflect convergence ordivergence (respectively) in that region of the molecular pathways influenced by each SNP.The potential for divergence is apparent in the fact that Leu607Phe and Ser704Cys causefunctionally relevant changes in DISC1 amino acid sequence within C-terminal sub-domainsthat are distinct in the molecular interactions they mediate,3 meaning that regionaldifferences in the expression of these interactors could lead to regions differences in theconsequence of genotype at each Leu607Phe and Ser704Cys. Conversely, convergence isallowed for by the fact that the DISC1 ‘interactome’ is extensive, and includes manypartner–proteins that not only interact richly with each other, but also have a role in commoncellular processes.69 Further studies characterizing the spatio-temporal distribution ofDISC1 partner–protein expression in the cortex, and examining the molecular consequencesof allelic variation at Leu607Phe and Ser704Cys in tandem would help test thesehypotheses.
Our study suffers from certain limitations. First, we have modeled age using a linear termonly despite having previously shown CT change to follow more complex cubic or quadratictrajectory. However, a linear model for CT change is appropriate over almost all the cortexbetween the upper and lower age range of our study.22 Given the dramatic inter-individualvariation in cortical anatomy, very large longitudinal samples are required to have thestatistical power required to describe group differences in CT change using non-linear terms.Second, as in previous imaging-genetic studies of Leu607Phe and Ser704Cys, allelefrequencies at each SNP meant that we did not have sufficient subjects to compare dominantvs recessive models. Third, the degree of overlap and dissociation between SNP effects ispartly dependent on the statistical threshold applied. Fourth, we were not able to test for
Raznahan et al. Page 8
Mol Psychiatry. Author manuscript; available in PMC 2011 September 1.
NIH
-PA Author Manuscript
NIH
-PA Author Manuscript
NIH
-PA Author Manuscript
interaction between the common functional DISC1 SNPs we studied and polymorphismwithin key DISC1 interactors such as pericentriolar material-1 and NDEL1. Finally, thecellular events underlying CT change with age as measured by sMRI remain poorlyunderstood, although data exist suggesting that dendritic pruning70 or encroachment ofwhite matter into the cortical mantle71 may contribute to CT reduction with age. Furtherstudies will be required to examine how the relationship between DISC1 genotype and brainmaturation is modulated by other genetic and environmental factors, and to extend theneuroanatomical phenotype beyond the cerebral cortex.
In spite of these limitations, our study represents the first longitudinal assessment of therelationship between DISC1 genotype and cortical development in humans, and suggeststhat the molecular consequences of allele variation at Leu607Phe and Ser704Cys maymodulate risk for conditions such as SCZ, bipolar affective disorder and MDD, by affectingon the maturation of front-temporal cortical systems.
Supplementary MaterialRefer to Web version on PubMed Central for supplementary material.
AcknowledgmentsThis study was funded through the National Institutes of Health, National Institute of Health Intramural Research,and a UK Medical Research Council Clinical Research Training Fellowship (author AR—G0701370). We thankthe participants who took part in this study. We are also grateful to the reviewers of this paper for their helpfulcomments. Dr Raznahan would like to thank Ms Shirley V Rojas for her tireless support on both sides of thelaboratory door.
References1. Millar JK, Wilson-Annan JC, Anderson S, Christie S, Taylor MS, Semple CA, et al. Disruption of
two novel genes by a translocation co-segregating with schizophrenia. Hum Mol Genet. 2000;9:1415–1423. [PubMed: 10814723]
2. St Clair D, Blackwood D, Muir W, Carothers A, Walker M, Spowart G, et al. Association within afamily of a balanced autosomal translocation with major mental illness. Lancet. 1990; 336:13–16.[PubMed: 1973210]
3. Chubb JE, Bradshaw NJ, Soares DC, Porteous DJ, Millar JK. The DISC locus in psychiatric illness.Mol Psychiatry. 2008; 13:36–64. [PubMed: 17912248]
4. Hodgkinson CA, Goldman D, Jaeger J, Persaud S, Kane JM, Lipsky RH, et al. Disrupted inschizophrenia 1 (DISC1): association with schizophrenia, schizoaffective disorder, and bipolardisorder. Am J Hum Genet. 2004; 75:862–872. [PubMed: 15386212]
5. Hennah W, Thomson P, McQuillin A, Bass N, Loukola A, Anjorin A, et al. DISC1 association,heterogeneity and interplay in schizophrenia and bipolar disorder. Mol Psychiatry. 2009; 14:865–873. [PubMed: 18317464]
6. Kilpinen H, Ylisaukko-Oja T, Hennah W, Palo OM, Varilo T, Vanhala R, et al. Association ofDISC1 with autism and Asperger syndrome. Mol Psychiatry. 2008; 13:187–196. [PubMed:17579608]
7. Williams JM, Beck TF, Pearson DM, Proud MB, Cheung SW, Scott DA. A 1q42 deletion involvingDISC1, DISC2, and TSNAX in an autism spectrum disorder. Am J Med Genet A. 2009; 149A:1758–1762. [PubMed: 19606485]
8. Cannon TD, Hennah W, van Erp TG, Thompson PM, Lonnqvist J, Huttunen M, et al. Association ofDISC1/TRAX haplotypes with schizophrenia, reduced prefrontal gray matter, and impaired short-and long-term memory. Arch Gen Psychiatry. 2005; 62:1205–1213. [PubMed: 16275808]
9. Hennah W, Tuulio-Henriksson A, Paunio T, Ekelund J, Varilo T, Partonen T, et al. A haplotypewithin the DISC1 gene is associated with visual memory functions in families with a high density ofschizophrenia. Mol Psychiatry. 2005; 10:1097–1103. [PubMed: 16103888]
Raznahan et al. Page 9
Mol Psychiatry. Author manuscript; available in PMC 2011 September 1.
NIH
-PA Author Manuscript
NIH
-PA Author Manuscript
NIH
-PA Author Manuscript
10. Callicott JH, Straub RE, Pezawas L, Egan MF, Mattay VS, Hariri AR, et al. Variation in DISC1affects hippocampal structure and function and increases risk for schizophrenia. Proc Natl AcadSci USA. 2005; 102:8627–8632. [PubMed: 15939883]
11. DeRosse P, Hodgkinson CA, Lencz T, Burdick KE, Kane JM, Goldman D, et al. Disrupted inschizophrenia 1 genotype and positive symptoms in schizophrenia. Biol Psychiatry. 2007;61:1208–1210. [PubMed: 17054920]
12. Tomppo L, Hennah W, Miettunen J, Jarvelin MR, Veijola J, Ripatti S, et al. Association of variantsin DISC1 with psychosis-related traits in a large population cohort. Arch Gen Psychiatry. 2009;66:134–141. [PubMed: 19188535]
13. Thomson PA, Harris SE, Starr JM, Whalley LJ, Porteous DJ, Deary IJ. Association betweengenotype at an exonic SNP in DISC1 and normal cognitive aging. Neurosci Lett. 2005; 389:41–45.[PubMed: 16054297]
14. Harris SE, Hennah W, Thomson PA, Luciano M, Starr JM, Porteous DJ, et al. Variation in DISC1is associated with anxiety, depression and emotional stability in elderly women. Mol Psychiatry.2010; 15:232–234. [PubMed: 20168324]
15. Jaaro-Peled H, Hayashi-Takagi A, Seshadri S, Kamiya A, Brandon NJ, Sawa A.Neurodevelopmental mechanisms of schizophrenia: understanding disturbed postnatal brainmaturation through neuregulin-1-ErbB4 and DISC1. Trends Neurosci. 2009; 32:485–495.[PubMed: 19712980]
16. Harrison PJ, Weinberger DR. Schizophrenia genes, gene expression, and neuropathology: on thematter of their convergence. Mol Psychiatry. 2005; 10:68. [References].
17. Bauman ML, Kemper TL. Neuroanatomic observations of the brain in autism: A review and futuredirections. Int J Dev Neurosci. 2005; 23:183–187. [PubMed: 15749244]
18. Haldane M, Frangou S. New insights help define the pathophysiology of bipolar affective disorder:neuroimaging and neuropathology findings. Prog Neuropsychopharmacol Biol Psychiatry. 2004;28:943–960. [PubMed: 15380855]
19. Raznahan A, Toro R, Daly E, Robertson D, Murphy C, Deeley Q, et al. Cortical anatomy in autismspectrum disorder: an in vivo MRI study on the effect of age. Cereb Cortex. 2009 2009/10/13 ed,[e-pub ahead of print].
20. Giedd JN, Lenroot RK, Shaw P, Lalonde F, Celano M, White S, et al. Trajectories of anatomicbrain development as a phenotype. Novartis Found Symp. 2008; 289:101–112. discussion112-108, 193-105. [PubMed: 18497098]
21. Gogtay N, Giedd JN, Lusk L, Hayashi KM, Greenstein D, Vaituzis AC, et al. Dynamic mapping ofhuman cortical development during childhood through early adulthood. Proc Natl Acad Sci USA.2004; 101:8174–8179. [PubMed: 15148381]
22. Shaw P, Kabani NJ, Lerch JP, Eckstrand K, Lenroot R, Gogtay N, et al. Neurodevelopmentaltrajectories of the human cerebral cortex. J Neurosci. 2008; 28:3586–3594. [PubMed: 18385317]
23. Huttenlocher PR. Morphometric study of human cerebral cortex development. Neuropsychologia.1990; 28:517–527. [PubMed: 2203993]
24. Duan X, Chang JH, Ge S, Faulkner RL, Kim JY, Kitabatake Y, et al. Disrupted-in-schizophrenia 1regulates integration of newly generated neurons in the adult brain. Cell. 2007; 130:1146–1158.[PubMed: 17825401]
25. Mao Y, Ge X, Frank CL, Madison JM, Koehler AN, Doud MK, et al. Disrupted in schizophrenia 1regulates neuronal progenitor proliferation via modulation of GSK3beta/beta-catenin signaling.Cell. 2009; 136:1017–1031. [PubMed: 19303846]
26. Shen S, Lang B, Nakamoto C, Zhang F, Pu J, Kuan SL, et al. Schizophrenia-related neural andbehavioral phenotypes in transgenic mice expressing truncated Disc1. J Neurosci. 2008;28:10893–10904. [PubMed: 18945897]
27. Kendler KS. Reflections on the relationship between psychiatric genetics and psychiatric nosology.Am J Psychiatry. 2006; 163:1138–1146. [PubMed: 16816216]
28. Rastogi A, Zai C, Likhodi O, Kennedy JL, Wong AH. Genetic association and post-mortem brainmRNA analysis of DISC1 and related genes in schizophrenia. Schizophr Res. 2009; 114:39–49.[PubMed: 19632097]
Raznahan et al. Page 10
Mol Psychiatry. Author manuscript; available in PMC 2011 September 1.
NIH
-PA Author Manuscript
NIH
-PA Author Manuscript
NIH
-PA Author Manuscript
29. Hennah W, Varilo T, Kestila M, Paunio T, Arajarvi R, Haukka J, et al. Haplotype transmissionanalysis provides evidence of association for DISC1 to schizophrenia and suggests sex-dependenteffects. Hum Mol Genet. 2003; 12:3151–3159. [PubMed: 14532331]
30. Szeszko PR, Hodgkinson CA, Robinson DG, Derosse P, Bilder RM, Lencz T, et al. DISC1 isassociated with prefrontal cortical gray matter and positive symptoms in schizophrenia. BiolPsychol. 2008; 79:103–110. [PubMed: 18078707]
31. Schosser A, Gaysina D, Cohen-Woods S, Chow PC, Martucci L, Craddock N, et al. Association ofDISC1 and TSNAX genes and affective disorders in the depression case-control (DeCC) andbipolar affective case-control (BACCS) studies. Mol Psychiatry. 2009 2009/03/04 ed, [e-pubahead of print].
32. Kamiya A, Tan PL, Kubo K, Engelhard C, Ishizuka K, Kubo A, et al. Recruitment of PCM1 to thecentrosome by the cooperative action of DISC1 and BBS4: a candidate for psychiatric illnesses.Arch Gen Psychiatry. 2008; 65:996–1006. [PubMed: 18762586]
33. Eastwood S, Hodgkinson CA, Harrison PJ. DISC-1 Leu607Phe alleles differentially affectcentrosomal PCM1 localization and neurotransmitter release. Mol Psychiatry. 2009; 14:556–557.[PubMed: 19455170]
34. Nakata K, Lipska BK, Hyde TM, Ye T, Newburn EN, Morita Y, et al. DISC1 splice variants areupregulated in schizophrenia and associated with risk polymorphisms. Proc Natl Acad Sci USA.2009; 106:15873–15878. [PubMed: 19805229]
35. Kim HJ, Park HJ, Jung KH, Ban JY, Ra J, Kim JW, et al. Association study of polymorphismsbetween DISC1 and schizophrenia in a Korean population. Neurosci Lett. 2008; 430:60–63.[PubMed: 17997036]
36. Hashimoto R, Numakawa T, Ohnishi T, Kumamaru E, Yagasaki Y, Ishimoto T, et al. Impact of theDISC1 Ser704Cys polymorphism on risk for major depression, brain morphology and ERKsignaling. Hum Mol Genet. 2006; 15:3024–3033. [PubMed: 16959794]
37. Palo OM, Antila M, Silander K, Hennah W, Kilpinen H, Soronen P, et al. Association of distinctallelic haplotypes of DISC1 with psychotic and bipolar spectrum disorders and with underlyingcognitive impairments. Hum Mol Genet. 2007; 16:2517–2528. [PubMed: 17673452]
38. Leliveld SR, Hendriks P, Michel M, Sajnani G, Bader V, Trossbach S, et al. Oligomer assembly ofthe C-terminal DISC1 domain (640–854) is controlled by self-association motifs and disease-associated polymorphism S704C. Biochemistry (Mosc). 2009; 48:7746–7755.
39. Leliveld SR, Bader V, Hendriks P, Prikulis I, Sajnani G, Requena JR, et al. Insolubility ofdisrupted-in-schizophrenia 1 disrupts oligomer-dependent interactions with nuclear distributionelement 1 and is associated with sporadic mental disease. J Neurosci. 2008; 28:3839–3845.[PubMed: 18400883]
40. Ozeki Y, Tomoda T, Kleiderlein J, Kamiya A, Bord L, Fujii K, et al. Disrupted-in-Schizophrenia-1(DISC-1): mutant truncation prevents binding to NudE-like (NUDEL) and inhibits neuriteoutgrowth. Proc Natl Acad Sci USA. 2003; 100:289–294. [PubMed: 12506198]
41. Takahashi T, Suzuki M, Tsunoda M, Maeno N, Kawasaki Y, Zhou SY, et al. The Disrupted-in-schizophrenia-1 Ser704Cys polymorphism and brain morphology in schizophrenia. PsychiatryRes. 2009; 172:128–135. [PubMed: 19304459]
42. Di Giorgio A, Blasi G, Sambataro F, Rampino A, Papazacharias A, Gambi F, et al. Association ofthe SerCys DISC1 polymorphism with human hippocampal formation gray matter and functionduring memory encoding. Eur J Neurosci. 2008; 28:2129–2136. [PubMed: 19046394]
43. Prata DP, Mechelli A, Fu CH, Picchioni M, Kane F, Kalidindi S, et al. The DISC1 Ser704Cyspolymorphism is associated with prefrontal function in healthy individuals. Mol Psychiatry. 2008;13:909.
44. Hariri AR, Weinberger DR. Imaging genomics. Br Med Bull. 2003; 65:259–270. [PubMed:12697630]
45. Lenroot RK, Schmitt JE, Ordaz SJ, Wallace GL, Neale MC, Lerch JP, et al. Differences in geneticand environmental influences on the human cerebral cortex associated with development duringchildhood and adolescence. Hum Brain Mapp. 2009; 30:163–174. [PubMed: 18041741]
Raznahan et al. Page 11
Mol Psychiatry. Author manuscript; available in PMC 2011 September 1.
NIH
-PA Author Manuscript
NIH
-PA Author Manuscript
NIH
-PA Author Manuscript
46. Greenstein D, Lerch J, Shaw P, Clasen L, Giedd J, Gochman P, et al. Childhood onsetschizophrenia: cortical brain abnormalities as young adults. J Child Psychol Psychiatry. 2006;47:1003–1012. [PubMed: 17073979]
47. Goldman AL, Pezawas L, Mattay VS, Fischl B, Verchinski BA, Chen Q, et al. Widespreadreductions of cortical thickness in schizophrenia and spectrum disorders and evidence ofheritability. Arch Gen Psychiatry. 2009; 66:467–477. [PubMed: 19414706]
48. Shaw P, Gornick M, Lerch J, Addington A, Seal J, Greenstein D, et al. Polymorphisms of thedopamine d4 receptor, clinical outcome, and cortical structure in attention-deficit/hyperactivitydisorder. Arch Gen Psychiatry. 2007; 64:921–931. [PubMed: 17679637]
49. Kabani N, Le GG, MacDonald D, Evans AC. Measurement of cortical thickness using anautomated 3-D algorithm: a validation study. Neuroimage. 2001; 13:375–380. [PubMed:11162277]
50. Raznahan A, Cutter W, Lalonde F, Robertson D, Daly E, Conway GS, et al. Cortical anatomy inhuman X monosomy. Neuroimage. 2010; 49:2915–2923. [PubMed: 19948228]
51. Giedd JN, Blumenthal J, Jeffries NO, Castellanos FX, Liu H, Zijdenbos A, et al. Braindevelopment during childhood and adolescence: a longitudinal MRI study. Nat Neurosci. 1999;2:861–863. [PubMed: 10491603]
52. Shaw P, Greenstein D, Lerch J, Clasen L, Lenroot R, Gogtay N, et al. Intellectual ability andcortical development in children and adolescents. Nature. 2006; 440:676–679. [PubMed:16572172]
53. Hollingshead, AB. Four-Factor Index for Social Status. New Haven: Yale UP; 1975.54. Herbeck JT, Gottlieb GS, Wong K, Detels R, Phair JP, Rinaldo CR, et al. Fidelity of SNP array
genotyping using Epstein Barr virus-transformed B-lymphocyte cell lines: implications forgenome-wide association studies. PLoS One. 2009; 4:e6915. [PubMed: 19730697]
55. Hawkins JR, Khripin Y, Valdes AM, Weaver TA. Miniaturized sealed-tube allele-specific PCR.Hum Mutat. 2002; 19:543–553. [PubMed: 11968087]
56. Giedd JN, Clasen LS, Wallace GL, Lenroot RK, Lerch JP, Wells EM, et al. XXY (Klinefeltersyndrome): a pediatric quantitative brain magnetic resonance imaging case-control study.Pediatrics. 2007; 119:e232–e240. [PubMed: 17200249]
57. Zijdenbos AP, Forghani R, Evans AC. Automatic ‘pipeline’ analysis of 3-D MRI data for clinicaltrials: application to multiple sclerosis. IEEE Trans Med Imaging. 2002; 21:1280–1291. [PubMed:12585710]
58. MacDonald D, Kabani N, Avis D, Evans A. Automated 3-D extraction of inner and outer surfacesof cerebral cortex from MRI. Neuroimage. 2000; 12:340–356. [PubMed: 10944416]
59. Lerch JP, Evans AC. Cortical thickness analysis examined through power analysis and apopulation simulation. Neuroimage. 2005; 24:163–173. [PubMed: 15588607]
60. Pinheiro, J.; DM, B. Mixed-Effects Models in S and S-PLUS. New York: Springer; 2000.61. Genovese CR, Lazar NA, Nichols T. Thresholding of statistical maps in functional neuroimaging
using the false discovery rate. Neuroimage. 2002; 15:870–878. [PubMed: 11906227]62. Gogtay N, Ordonez A, Herman DH, Hayashi KM, Greenstein D, Vaituzis C, et al. Dynamic
mapping of cortical development before and after the onset of pediatric bipolar illness. J ChildPsychol Psychiatry. 2007; 48:852–862. [PubMed: 17714370]
63. Gogtay N, Greenstein D, Lenane M, Clasen L, Sharp W, Gochman P, et al. Cortical braindevelopment in nonpsychotic siblings of patients with childhood-onset schizophrenia. Arch GenPsychiatry. 2007; 64:772–780. [PubMed: 17606811]
64. Peterson BS, Warner V, Bansal R, Zhu H, Hao X, Liu J, et al. Cortical thinning in persons atincreased familial risk for major depression. Proc Natl Acad Sci USA. 2009; 106:6273–6278.[PubMed: 19329490]
65. Brandon NJ, Millar JK, Korth C, Sive H, Singh KK, Sawa A. Understanding the role of DISC1 inpsychiatric disease and during normal development. J Neurosci. 2009; 29:12768–12775. [PubMed:19828788]
66. Manji HK, Quiroz JA, Sporn J, Payne JL, Denicoff K, Gray NA, et al. Enhancing neuronalplasticity and cellular resilience to develop novel, improved therapeutics for difficult-to-treatdepression. Biol Psychiatry. 2003; 53:707–742. [PubMed: 12706957]
Raznahan et al. Page 12
Mol Psychiatry. Author manuscript; available in PMC 2011 September 1.
NIH
-PA Author Manuscript
NIH
-PA Author Manuscript
NIH
-PA Author Manuscript

67. Burdick KE, Kamiya A, Hodgkinson CA, Lencz T, DeRosse P, Ishizuka K, et al. Elucidating therelationship between DISC1, NDEL1 and NDE1 and the risk for schizophrenia: evidence ofepistasis and competitive binding. Hum Mol Genet. 2008; 17:2462–2473. [PubMed: 18469341]
68. Hennah W, Porteous D. The DISC1 pathway modulates expression of neurodevelopmental,synaptogenic and sensory perception genes. PLoS One. 2009; 4:e4906. [PubMed: 19300510]
69. Camargo LM, Collura V, Rain JC, Mizuguchi K, Hermjakob H, Kerrien S, et al. Disrupted inschizophrenia 1 interactome: evidence for the close connectivity of risk genes and a potentialsynaptic basis for schizophrenia. Mol Psychiatry. 2007; 12:74–86. [PubMed: 17043677]
70. Huttenlocher PR, Dabholkar A. Regional differences in synaptogenesis in human cerebral cortex. JComp Neurol. 1997; 387:167–178. [PubMed: 9336221]
71. Sowell ER, Thompson PM, Leonard CM, Welcome SE, Kan E, Toga AW. Longitudinal mappingof cortical thickness and brain growth in normal children. J Neurosci. 2004; 24:8223–8231.[PubMed: 15385605]
Raznahan et al. Page 13
Mol Psychiatry. Author manuscript; available in PMC 2011 September 1.
NIH
-PA Author Manuscript
NIH
-PA Author Manuscript
NIH
-PA Author Manuscript
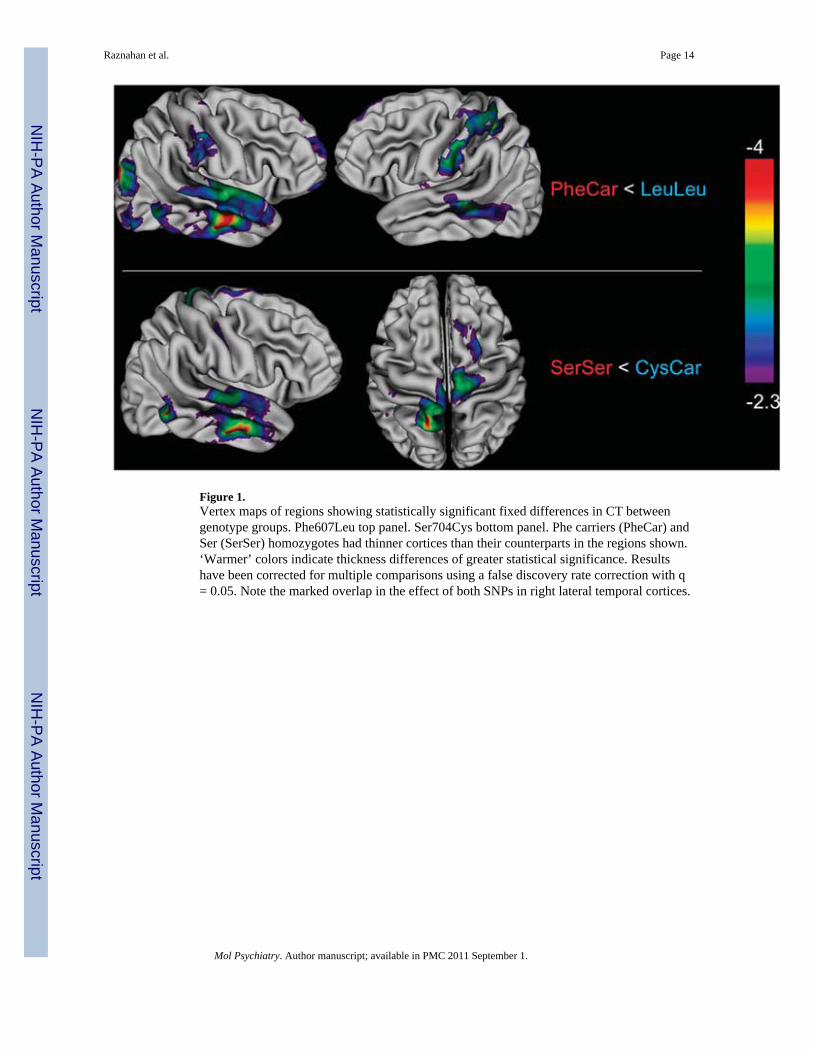
Figure 1.Vertex maps of regions showing statistically significant fixed differences in CT betweengenotype groups. Phe607Leu top panel. Ser704Cys bottom panel. Phe carriers (PheCar) andSer (SerSer) homozygotes had thinner cortices than their counterparts in the regions shown.‘Warmer’ colors indicate thickness differences of greater statistical significance. Resultshave been corrected for multiple comparisons using a false discovery rate correction with q= 0.05. Note the marked overlap in the effect of both SNPs in right lateral temporal cortices.
Raznahan et al. Page 14
Mol Psychiatry. Author manuscript; available in PMC 2011 September 1.
NIH
-PA Author Manuscript
NIH
-PA Author Manuscript
NIH
-PA Author Manuscript
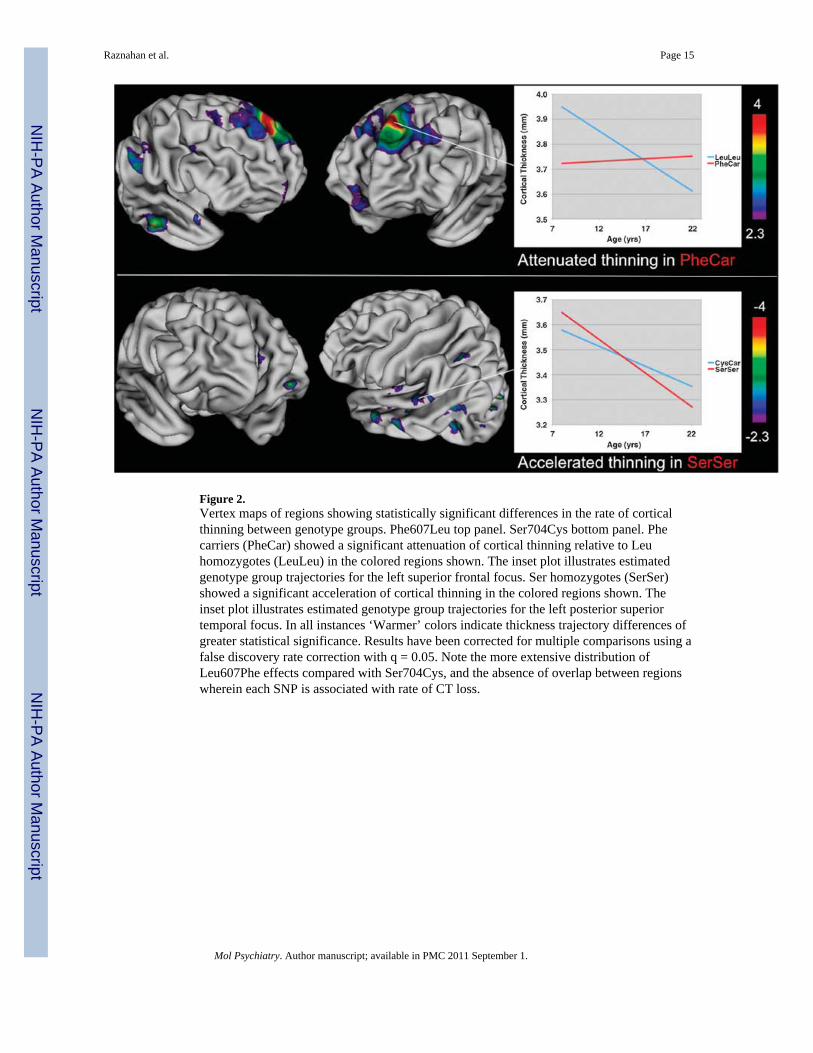
Figure 2.Vertex maps of regions showing statistically significant differences in the rate of corticalthinning between genotype groups. Phe607Leu top panel. Ser704Cys bottom panel. Phecarriers (PheCar) showed a significant attenuation of cortical thinning relative to Leuhomozygotes (LeuLeu) in the colored regions shown. The inset plot illustrates estimatedgenotype group trajectories for the left superior frontal focus. Ser homozygotes (SerSer)showed a significant acceleration of cortical thinning in the colored regions shown. Theinset plot illustrates estimated genotype group trajectories for the left posterior superiortemporal focus. In all instances ‘Warmer’ colors indicate thickness trajectory differences ofgreater statistical significance. Results have been corrected for multiple comparisons using afalse discovery rate correction with q = 0.05. Note the more extensive distribution ofLeu607Phe effects compared with Ser704Cys, and the absence of overlap between regionswherein each SNP is associated with rate of CT loss.
Raznahan et al. Page 15
Mol Psychiatry. Author manuscript; available in PMC 2011 September 1.
NIH
-PA Author Manuscript
NIH
-PA Author Manuscript
NIH
-PA Author Manuscript
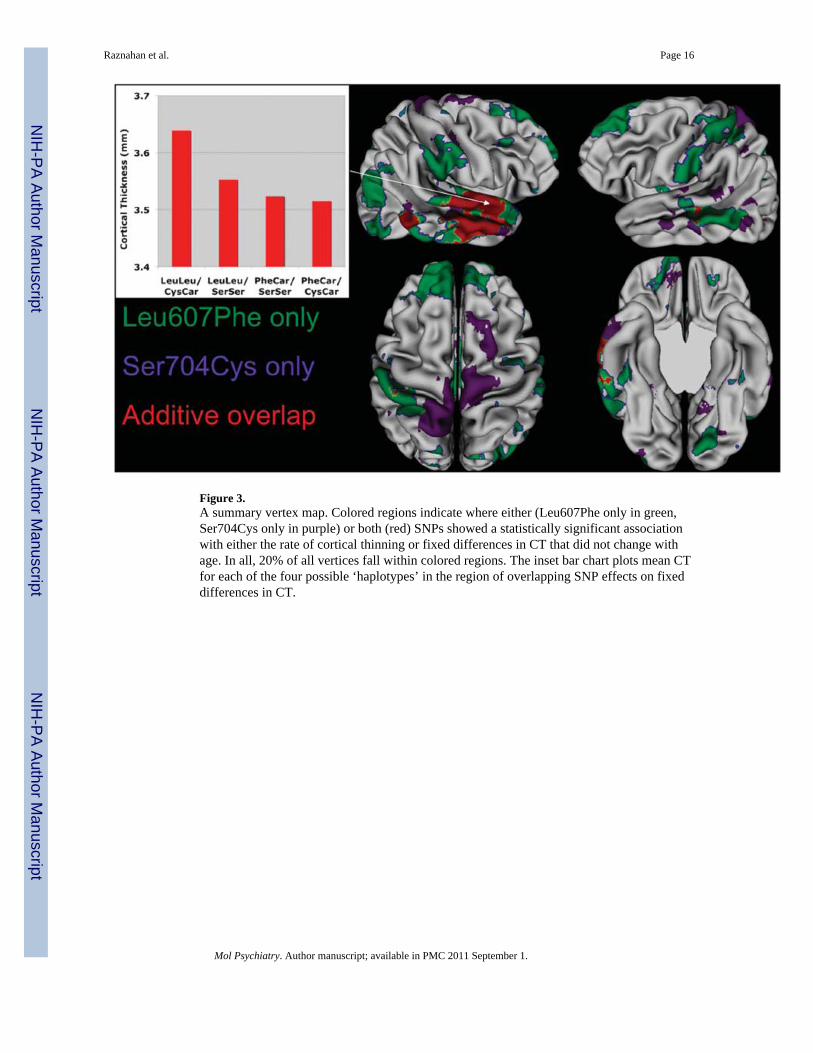
Figure 3.A summary vertex map. Colored regions indicate where either (Leu607Phe only in green,Ser704Cys only in purple) or both (red) SNPs showed a statistically significant associationwith either the rate of cortical thinning or fixed differences in CT that did not change withage. In all, 20% of all vertices fall within colored regions. The inset bar chart plots mean CTfor each of the four possible ‘haplotypes’ in the region of overlapping SNP effects on fixeddifferences in CT.
Raznahan et al. Page 16
Mol Psychiatry. Author manuscript; available in PMC 2011 September 1.
NIH
-PA Author Manuscript
NIH
-PA Author Manuscript
NIH
-PA Author Manuscript

NIH
-PA Author Manuscript
NIH
-PA Author Manuscript
NIH
-PA Author Manuscript
Raznahan et al. Page 17
Table 1
Summary of studies supporting the use of Leu607Phe and Ser704Cys in DISC1 imaging-geneticinvestigations
Characteristic Leu607Phe (rs6675281) Ser704Cys (rs821616)
Common Minor allele frequency: 0.14 Minor allele frequency: 0.31
Possible association withdisorder/symptom profilea
Schizophrenia8,28,29,30 Schizophrenia/schizoid traits10–12,35
Schizoaffective disorder4 Major depressive disorder36
Major depressive disorder31 Bipolar affective disorder37
Bipolar affective disorder31 Autism spectrum disorder6
Allele most commonlylinked to increased risk fordisorder
Phe Ser
Alters DISC molecularbehavior
i. Reduced DISC1-PCM co-localization, andneurotransmitter release in Phe vs Leu.32,33
Disruption of DISC1-PCM co-localizationin animal models causes delayed migrationof neurones into the developing cortex.32
ii. Increased brain and lymphocyte expressionof short splice variants in Phe vs Leu. Theseshorter variants are enriched in the brains ofsome individuals with schizophrenia, andresult in the omission of exons mediatingimportant DISC1-partner-proteininteractions.34
i. Higher rates of DISC1 oligomerization inSer vs Cys.38 DISC1 oligomerization isimportant for normal DISC1–NDEL1interactions involved in nueriteoutgrowth.39,40
ii. Reduced activation in Eph receptor B2(ERK) and Akt pathways in Cys vs Ser.These pathways have been implicated incytoskeletal remodeling, neuriteoutgrowth and cell survival.36
Positive previous imaging-genetic studies
Reduced cortical volume within frontal and temporallobes in Phe-carriers vs Leu-homozygotes.8,30
Associated with structural and functional variationwithin frontal cortices and hippocampus.10,36,41–43
Abbreviations: DISC1, disrupted-in-schizophrenia-1; ERK, extracellular signal-regulated kinase; NDEL1, nuclear distribution gene E homolog-like1; PCM, pericentriolar material 1;SNP, single-nucleotide polymorphism.
aNegative associations studies exist for both SNPs.5,28
Mol Psychiatry. Author manuscript; available in PMC 2011 September 1.
NIH
-PA Author Manuscript
NIH
-PA Author Manuscript
NIH
-PA Author Manuscript
Raznahan et al. Page 18
Tabl
e 2
Parti
cipa
nt c
hara
cter
istic
s
Feat
ure
By
Leu
607P
he g
enot
ype
By
Ser7
04C
ys g
enot
ype
Leu
Leu
PheC
arT
est
stat
istic
P-V
alue
Cys
Car
SerS
erT
est
stat
istic
P-V
alue
Part
icip
ants
, no.
193
6213
112
4
S
ex, n
o.
M10
740
χ2 =
1.6
0.13
8067
χ2 =
1.2
0.3
F86
2251
57
E
stim
ated
IQ, m
ean
(s.d
.)11
3 (1
2.3)
114
(11.
7)t =
−0.
70.
511
4 (1
2.2)
113
(12.
2)t =
0.7
0.5
S
ES, m
ean
(s.d
.)42
(18.
9)45
(19.
1)t =
−1.
30.
243
(18.
4)43
(19.
6)t =
0.2
0.9
R
ight
han
ded,
no.
(%)
160
(83)
57 (9
1)χ2
= 2
.00.
211
7 (8
9)10
0 (8
1)χ2
= 2
.70.
1
N
umbe
r of s
cans
, no.
153
6933
40
260
1847
31
≥
385
2451
53
A
ge a
t eac
h sc
an in
yea
rs, m
ean
(s.d
.)
Firs
t sca
n12
.3 (2
.8)
12.2
(2.9
)t =
0.1
0.9
12.7
11.8
t = 2
.30.
02
Seco
nd sc
an14
.8 (2
.6)
15 (3
.1)
t = −
0.7
0.5
15.1
14.5
t = 1
.40.
2
Third
scan
17.1
(2.6
)16
.9 (2
.5)
t = 0
.30.
816
.717
.3t =
−1.
20.
2
G
enot
ype
grou
p at
oth
er S
NP,
no.
Cys
Car
9734
χ2 =
0.4
0.5
——
SerS
er96
28—
—
S
cans
, no.
454
144
313
285
A
ge d
istr
ibut
ion
of sc
ans,
year
s
Mea
n (s
.d.)
14.5
(3.5
)14
.5 (3
.6)
14.7
(3.5
)14
.2 (3
.6)
Ran
ge9–
22.8
9–22
.89–
22.8
9–22
.8
Abb
revi
atio
ns: I
Q, i
ntel
ligen
ce q
uotie
nt; S
ES, s
ocio
econ
omic
stat
us; S
NP,
sing
le-n
ucle
otid
e po
lym
orph
ism
.
Mol Psychiatry. Author manuscript; available in PMC 2011 September 1.