commercial gas turbine engine platform strategy and design
TRANSCRIPT
Commercial Gas Turbine Engine Platform Strategy and Design
by
Habs M. Moy
M.S. Aerospace Engineering, University of Cincinnati, 1991B.En. Mechanical Engineering, Cooper Union, 1989
Submitted to the System Design & Management ProgramIn Partial Fulfillment of the Requirements for the Degree of
Master of Science In Engineering & Management
at the ASSACHUSETTS INSTITtEOF TECHNOLOGY
Massachusetts Institute of Technology
February 2000 LIBRARIES@ 2000 Habs M. Moy, All Rights Reserved
The author hereby grants to MIT permission to reproduce and to distributepublicly and electronic copies of this thesis document in whole or in part.
Signature of Author
Certified
Habs M. MoySystem Design & /nagement Program
January 14, 2000
' Kevin N. OttoRobert N. Noyce Associate Professor of Mechanical Engineering
Product Portfolio Definition Thrust Leader, Center for Innovation in Product DevelopmentThesis Supervisor
Thomas A. KochanLFM/SDM Co-Director
George M. Bunker Professor of Management
Accepted byrau P. Lagace
LFM/SDM Co-DirectorProfessor of Aeronautics & Astronautics and Engineering Systems
Accepted bv_________-_______
I_
1. ff - 1by
2
Commercial Gas Turbine Engine Platform Strategy and Design
by
Habs M. Moy
Submitted to the System Design & Management Programon January 14, 2000 in Partial Fulfillment of the
Requirements for the Degree of Master of Science inEngineering & Management
Abstract
Product development challenges companies to produce designs that meetcustomer requirements yet, that are within their technological and financialmeans to do so. The proliferation of customized or unique designs may tax theresources of a firm if product variety cannot be achieved in a cost-effectivemanner. A product platform strategy allows a set of core elements orsubsystems to be shared across all or part of a company's product portfolio,while design flexibility allows differentiated functions to satisfy specific customerneeds. A framework for identifying potential platform elements from among keysystem design variables is provided. This framework supports the hypothesisthat system design variables with low normalized coupling and low normalizedvariation across a set of conceptual product designs should be considered aspotential platform elements. A system level approach for identifying the couplingand variation of these elements is facilitated through the formulation and use of amodified quality function deployment (QFD) mapping procedure. Normalizedcoupling is quantified as the relative importance of relationships betweenstakeholder needs, system requirements and system design variables, divided bya ranking of the difficulty in their achievement. Normalized variation of systemdesign variables from a sample of parameter data is calculated as the standarddeviation divided by the mean. The proposed framework and hypothesis isvalidated with a case study of the Pratt & Whitney PW4000 family of commercialgas turbine engines where predicted platform elements were consistent withactual design choices.
Thesis Advisor: Kevin N. OttoTitle: Associate Professor of Mechanical Engineering
3
Acknowledgments
I cannot begin to acknowledge all the people who have made this work possible.It certainly includes all the people and events that have shaped the last two yearsin the System Design & Management Program, but I would be remiss if I did notalso acknowledge those who have been a constant anchor in my personal life.
Thanks go to UTC/Pratt & Whitney for sponsoring me to this program and to thefollowing individuals who supported the work that went into this research:Franklin Gattis, Karl Hasel, Jeffrey Hathaway, Billie Jones, Craig Lewis, KentLyons, Walter Malkauskas, Ben Mancuso, James Panaia, Joe Presing, ThomasRogers, Robert Saia, Austin Smith, Paul Smith, Reid Smith, Yasar Tanrikut,William Taylor, George Titterton and Barry Wood. Special thanks go to GeorgeAronstamm who spent many a late afternoon passing on the gas turbine engineknowledge he has accumulated with over 30+ years of service at Pratt &Whitney. Thanks also go to Michael Chemerynski and Frank Gass for supportingme through two years of two shift workdays.
Thanks go to MIT and the Center for Innovation in Product Development forfostering research that is pertinent for today's industry. Special thanks go to myadvisor, Kevin Otto, for his guidance and vibrant attitude towards this effort, andto Javier Gonzalez-Zugasti for all the philosophical discussions on platforms thatgave me the perspective with which to look at gas turbine engines. Best wishesto Javier for a successful doctoral defense!
Perhaps the richest part of this entire learning experience was working with andlearning from my fellow colleagues in the SDM program. Learning from all of youfirst hand about the inner workings of the various industry leading companies yourepresent, is far more valuable than reading about it in a case study or businessjournal. Thanks to all of you for making this experience come alive. Best wishesfor your continued success.
I want to thank my family for their continuous support. Thanks to Yvette, Evelynand Yvonne for taking care of things on the home front while I was occupied. Iwant to thank my significant other, Ying, for her support, patience andheartwarming smile through two years of distance relationship held concurrentlywith two years of SDM distance learning. We are finally at the end of this part ofthe journey. The next part is about to begin.
My most heartfelt acknowledgments go to my parents for their investments in mesince the day I was born. Those investments of care, guidance and support havepaid back handsomely with 3 university degrees ... all tuition free. How aboutthat for a measure of return on investment? Thanks Mom and Dad. This thirdone was a charm.
4
Table of Contents
1 Introduction............................................................................................. 8
2 Related W ork........................................................................................... 12
2.1 Product Portfolio Architecture................................................................... 12
2.2 Examples of Product Platform s ................................................................... 14
2.3 Product Architecture Concepts .................................................................. 15
3 System Architecture of a Commercial Gas Turbine Engine........17
3.1 Airplane System and Engine Subsystem ...................................................... 17
3.2 Modularity and Integrality ............................................................................ 18
3.3 Mechanical & Aerothermodynamic Coupling ........................................... 20
4 Q uality Function Deploym ent (QFD)..................................................... 23
4.1 What is QFD? ............................................................................................... 23
4.2 Applying QFD to Identify Platform Elements ................... ..25
4.3 Elem ents of the Platform QFD ........................................................................ 284.3.1 Stakeholders and their Needs ............................................................................ 28
4.3.1.1 Airplane Mission .............................................................................................. 294.3.1.2 Reliability ........................................................................................................... 304.3.1.3 Cash Operating Cost....................................................................................... 304.3.1.4 Environmental ................................................................................................ 314.3.1.5 Recurring Cost (Manufacturing)....................................................................... 314.3.1.6 Non-Recurring Cost Spent to Launch (Technology)....................................... 314.3.1.7 Non-Recurring Cost Spent from Launch to Certification (E&D)...................... 314.3.1.8 Entry into Service (EIS) Date .......................................................................... 32
4.3.2 System Requirements ......................................................................................... 334.3.2.1 Airplane Integration ......................................................................................... 344.3.2.2 Performance................................................................................................... 344.3.2.3 Reliability........................................................................................................ 354.3.2.4 Environmental ................................................................................................ 364.3.2.5 Cost ......................................................................................................... .. 374.3.2.6 Design ............................................................................................................. 374.3.2.7 In-Service Operations....................................................................................... 37
4.3.3 System Variables at the Module Level ................................................................ 384.3.4 Module Flowpath Aerothermodynamic Variables................................................. 40
4.4 QFD Platform Mapping ............................................................................. ..424.4.1 Mapping Stakeholder Needs to System Requirements ....................................... 42
4.4.1.1 Relative Importance of System Requirements................................................. 444.4.1.2 Conflicts Between and Among System Requirements .................................... 444.4.1.3 Stakeholder Needs for Different Market Segments ......................................... 474.4.1.4 System Requirement Difficulty and Core Competencies................................ 484.4.1.5 Deriving the Normalized Coupling Measure ................................................... 48
4.4.2 Mapping System Requirements to System Variables .......................................... 504.4.3 Mapping System Variables to Module Flowpath Aerothermodynamic Variables.....51
4.4.3.1 Relative Importance of Module Flowpath Aerothermodynamic Variables ........... 534.4.3.2 Relative Module Ranking ................................................................................. 544.4.3.3 Module Development Difficulty Ranking ........................................................ 54
5
4.4.4 Normalized Variation ........................................................................................... 554.4.5 Defining Boundaries for High and Low Normalized Coupling and Variation.....55
5 Pratt & W hitney Case Studies .............................................................. 57
5.1 Sample of 8 Engines.................................................................................... 58
5.2 PW4000 Engine Fam ily............................................................................... 625.2.1 Background........................................................................................................... 625.2.2 PW 4000-94" Platform Strategy........................................................................... 635.2.3 PW 4000-1 00" and PW 4000-112" Growth Strategy............................................ 655.2.4 Validating the Hypothesis with the PW 4000......................................................... 66
6 Sum m ary and Conclusions ................................................................... 74
7 Recom m endations ................................................................................. 76
7.1 Conceptual Design Tool............................................................................... 76
7.2 Extensions of QFD Mapping ....................................................................... 787.2.1 Mapping to Support Structure Part Characteristics............................................ 797.2.2 Mapping to Key Process Operations................................................................... 80
7.3 Other Applications...................................................................................... 807.3.1 Value Engineering ................................................................................................ 807.3.2 Military, Small Commercial and Industrial Engines .............................................. 81
7.4 Multi-Project Management as a Portfolio Planning Strategy .................... 817.4.1 Push versus Pull Market....................................................................................... 827.4.2 Product Lifetime & Certification Costs................................................................ 837.4.3 Production Volume .............................................................................................. 837.4.4 Level of Technology Capability............................................................................. 84
7.5 Strategic Analysis........................................................................................ 847.5.1 Core Competencies & the Organization.............................................................. 847.5.2 Porter's Five Forces Model.................................................................................. 85
7.5.2.1 Customers ........................................................................................................ 867.5.2.2 Suppliers .......................................................................................................... 877.5.2.3 Competitors...................................................................................................... 877.5.2.4 Substitutes........................................................................................................ 887.5.2.5 Barriers to Entry .............................................................................................. 89
References .................................................................................................... 92
G lossary ............................................................................................................ 95
6
List of Figures
FigureFigureFigureFigureFigureFigureFigureFigureFigure
1.1:3.1:3.2:4.1:4.2:4.3:4.4:4.5:4.6:
Figure 4.7:
Figure 5.1:
Figure 5.2:
Figure 5.3:
Figure 5.4:
Figure 5.5:
Figure 5.6:
Figure 7.1:
Hypothesis for Assessing Platform Elements ............................... 8Airplane Passenger and Range Capabilities ............................... 17PW 4000-94" .............................................................................. . .19Quality Function Deployment (QFD) Mapping Framework ......... 24Modified QFD Framework for Platform Analysis..........................26Exam ple of QFD Mapping ........................................................... 27Phase I - Mapping Stakeholder Needs to System Requirements ....43Conflicts Between and Among System Requirements.................45Phase I - Sample Mapping of System Requirements to SystemV ariables ................................................................................... . . 50Phase Ill - Sample Mapping of System Variables to ModuleFlowpath Aerothermodynamic Variables....................................52Normalized Coupling and Normalized Variation for the 8 EngineSample (Module Flowpath Aerothermodynamic Variables)........59Module Flowpath Aerothermodynamic Variable Classifications for the8 Engine Sam ple ......................................................................... 60Normalized Coupling and Normalized Variation for the PW4000(Module Flowpath Aerothermodynamic Variables)......................67Module Flowpath Aerothermodynamic Variable Classifications for thePW 4000 ..................................................................................... . 68Normalized Coupling and Normalized Variation for the PW4000 witha 4.5% Normalized Variation Threshold (Module FlowpathAerothermodynamic Variables) ................................................... 70Module Flowpath Aerothermodynamic Variable Classifications for thePW4000 with 4.5% Normalized Variation Threshold ................... 71Extension of Modified QFD Mapping for Platform Elements........79
7
List of Tables
Types of Modular Architectures .................................................... 16Stakeholders and their Needs....................................................... 29FAR Part 33 Aircraft Engine Certification Tests ............................ 32Propulsion System Requirements................................................. 33System Variables.......................................................................... 39Module Flowpath Aerothermodynamic Variables.......................... 41PW 4000 Family of Engines........................................................... 62Porter's Five Forces..................................................................... 86Travel Alternatives Between Hartford, CT and Washington, DC.......88Collaborations in Commercial Gas Turbine Engine Development .... 90
Table 2.1:Table 4.1:Table 4.2:Table 4.3:Table 4.4:Table 4.5:Table 5.1:Table 7.1:Table 7.2:Table 7.3:
8
1 Introduction
Product development challenges companies to produce designs that meet
customer needs, yet that are within their technological and financial means to do
so. The proliferation of customized or unique designs may tax the resources of a
company if product variety cannot be achieved in a cost-effective manner. One
strategy to minimize the costs associated with unique designs is to share
elements or subsystems across all or part of a company's product portfolio, while
design flexibility allows differentiated functions to satisfy specific customer needs.
The grouping of these shared elements comprise a platform. The key is to
determine which elements or subsystems comprise the platform.
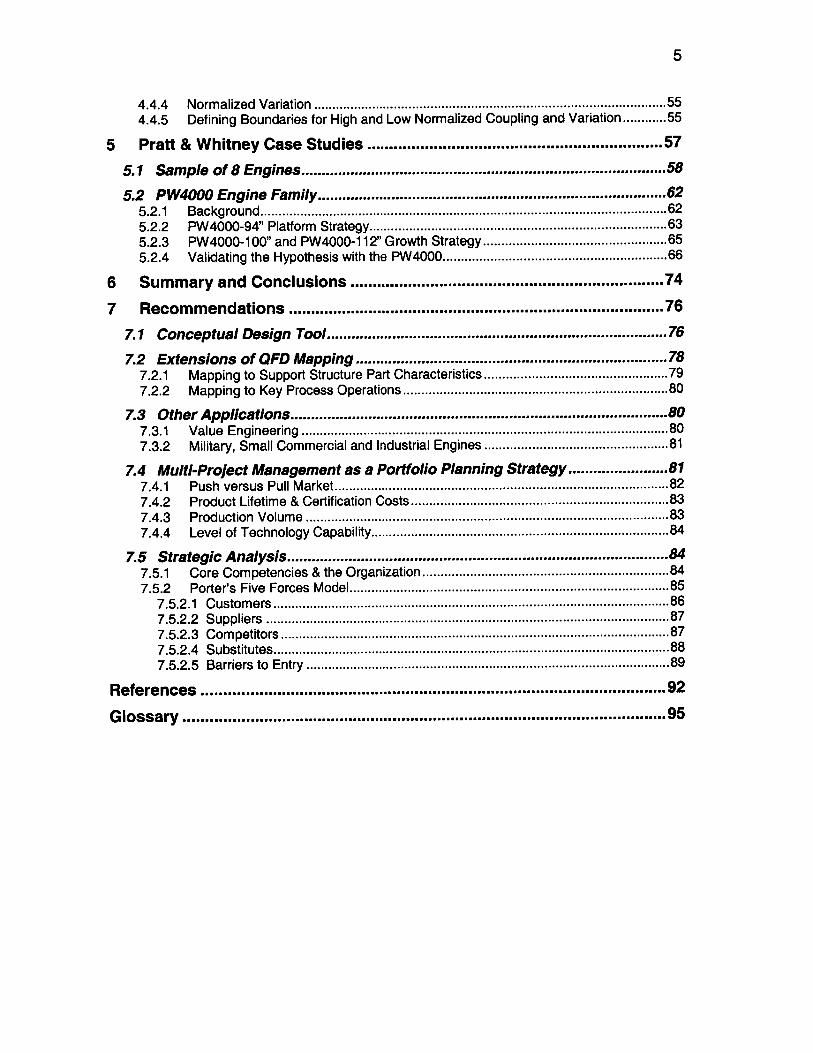
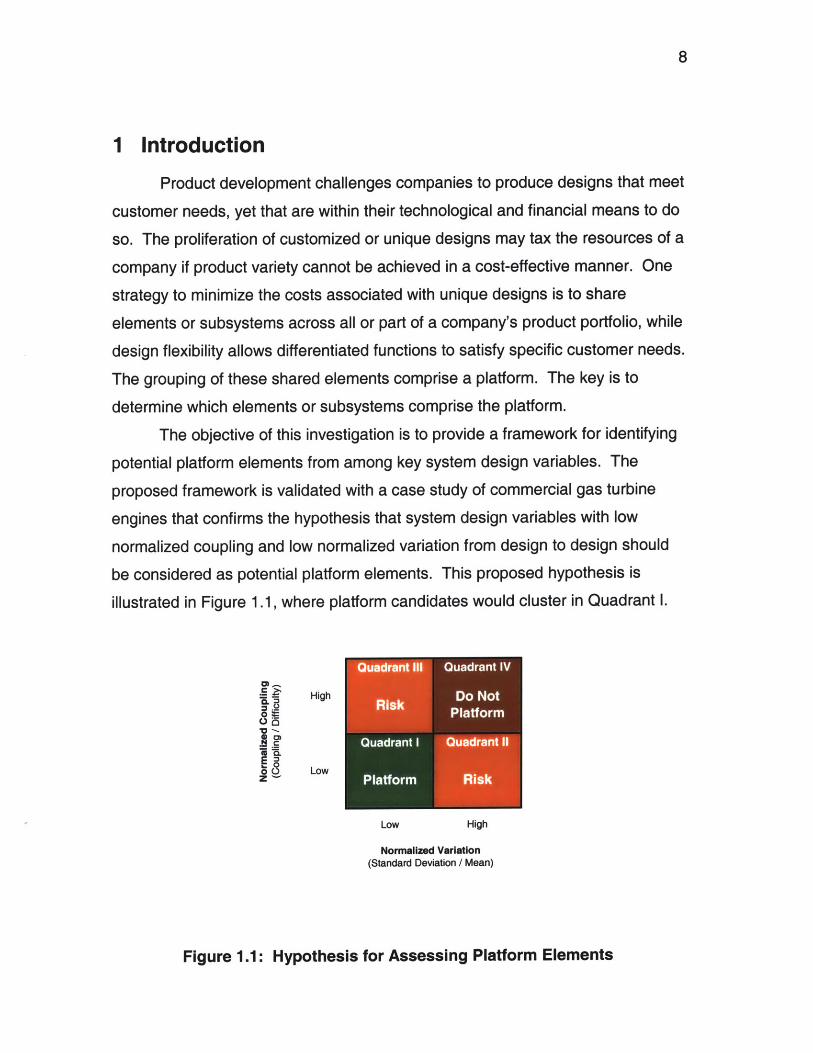
The objective of this investigation is to provide a framework for identifying
potential platform elements from among key system design variables. The
proposed framework is validated with a case study of commercial gas turbine
engines that confirms the hypothesis that system design variables with low
normalized coupling and low normalized variation from design to design should
be considered as potential platform elements. This proposed hypothesis is
illustrated in Figure 1.1, where platform candidates would cluster in Quadrant .
Quadrant III Quadrant IV
s High Do Not.4isk Platform
S Quadrant I Quadrant 11
08 Lowdr. Platform Risk
Low High
Normalized Variation(Standard Deviation / Mean)
Figure 1.1: Hypothesis for Assessing Platform Elements
9
A system level framework for identifying the normalized coupling and
normalized variation of these elements was facilitated through the formulation
and use of a modified quality function deployment (QFD) mapping procedure.
Normalized coupling was assessed by quantifying the relative importance of
relationships between stakeholder needs, system requirements and system
design variables, and dividing these rankings by a ranking of the difficulty in their
achievement. Normalized variation of system design variables from a sample of
parameter data was calculated as the standard deviation divided by the mean.
Normalized coupling implies that a product attribute or function, which has
low coupling and low difficulty, is as likely to be considered a platform element as
one that has high coupling and high difficulty. The motivation for platforming an
element that has high coupling and high difficulty is to leverage the higher
development cost and effort associated with this more difficult element across
multiple applications, rather than developing costly, unique solutions over and
over for each new product [Robertson and Ulrich, 1998]. Sharing platform
elements across multiple products may lead to lower manufacturing costs from
economies of scale, lower development costs, and faster time to market to name
a few benefits.
In contrast, system design variables that have high normalized coupling
and high normalized variation may be poor candidates as platform elements.
These variables are predicted to cluster in Quadrant IV of Figure 1.1. Because of
their high level of coupling with upstream stakeholder needs and system
requirements, keeping them at a fixed level as platform elements may adversely
affect many other system variables. The cost of keeping Quadrant IV variables
constant in a platform scenario is the high overall system impact due to the high
coupling. This system cost may outweigh the elemental cost savings benefit.
Since these variables are not difficult to achieve anyway, it may be beneficial and
cost effective to allow them to vary as appropriate, so that overall needs and
system requirements can be met.
10
For cases where there is low normalized variation, but high normalized
coupling as in Quadrant Ill, there is risk in considering these elements for a
platform. There is a possibility that fixing them in a platform scenario is risky
should some future growth potential or unanticipated condition force them to be
changed, moving these elements from Quadrant Ill to Quadrant IV. Since these
elements are highly coupled, changing them could have a large impact on the
overall system.
For cases where there is high normalized variation, but low normalized
coupling, there is less risk than the opposite case described in the preceding
paragraph because of the low coupling. These variables would cluster in
Quadrant 11. Fixing these parameters at a given level for a platform may have a
small overall system effect due to the low coupling. Again, there is always risk
that a change in requirements may increase the coupling, moving these variables
into Quadrant IV.
The proposed framework and hypothesis was validated with a case study
of the Pratt & Whitney PW4000 family of commercial gas turbine engines where
platform elements predicted by the model were consistent with actual design
choices. The results identified a set of system design variables with low
normalized coupling and low normalized variation that could serve as elements of
a commercial gas turbine engine platform and be shared across multiple
products.
Chapter 2 begins with an overview of product portfolio architecture and
methods of defining them. A platform is a type of product portfolio architecture
and some examples are given to provide the reader with a perspective of existing
platform strategies. The chapter ends with a brief discussion of product
architecture concepts as a lead into Chapter 3, which discusses the system
architecture of the gas turbine engine and how certain aspects of the engine's
architecture may or may not lend themselves to platform considerations.
Chapter 4 introduces QFD and summarizes the methodology used to adapt the
traditional QFD framework to perform platform analyses.
11
To validate the hypothesis set forth above, two case studies involving
recent Pratt & Whitney engine designs are discussed in Chapter 5. Following
some concluding statements in Chapter 6, Chapter 7 discusses
recommendations for extending the framework presented in this investigation as
well as interrelationships and implications between the strategic management of
a company and the company's product strategy. Finally, a glossary is included at
the end of the document for those who desire further explanation of terms used
in this work.
Scattered throughout the text are descriptive examples and what if
scenarios, which are provided to clarify some of the concepts and issues
surrounding commercial gas turbine engine platform strategy and design. They
are by no means exhaustive explanations, but are primarily included to provide
the reader with an appreciation of the issue(s) and to highlight key points.
Analogies to other products are also provided, not only to help explain issues
specific to gas turbine engines, but also to provide some basis for comparison as
to how these analogies apply or could be applied to gas turbine engines.
12
2 Related Work
To establish a basis for the platform framework presented in this
investigation, it is important to review related work concerning product platforms
from both a design perspective as well as a product strategy perspective. The
literature contains a number of studies that have been conducted to classify
product portfolio architectures such as platforms and recommend ways to define
these architectures. Product platforms such as the Sony Walkman and Ford
automobiles are examples of how platform strategies have been successfully
implemented and which can provide additional perspectives on what is
achievable. The discussion begins with an overview of product portfolio
architecture.
2.1 Product Portfolio Architecture
Product portfolio architecture entails defining the way in which members of
a portfolio of products share or do not share features. Yu [1998] defines three
categories of portfolio architecture: fixed, platform and adjustable. A fixed
portfolio architecture is where a single option for a feature is offered across an
entire set of products. An example of a fixed architecture is a videocassette
case. A platform portfolio architecture is where multiple options for a feature are
offered across an entire set of products. An example of a platform architecture is
Chrysler's LH platform where the Intrepid, Eagle, Concorde and LHS all share a
common body frame construction, but have different styling features for different
market segments. An adjustable, mass customization portfolio architecture is
where multiple options are offered through a single design, which can be
customized by the user. An example of an adjustable portfolio architecture is a
hair dryer with multiple heat settings.
Recent research has focused on customer needs as a basis for product
portfolio definition and planning. Moore [1999] proposes conjoint analysis as a
way to quantify customer preferences for different combinations of product
13
attributes. Yu [1998] defines a methodology for product portfolio definition of
instant film cameras based on customer needs and accounting for the possibility
that these needs may change over time. Roberson [1998] proposes a product
attribute clustering technique to define appropriate combinations of automobile
platform elements. These investigations all seem to have focused on consumer
products where variety is needed to fulfill customer needs.
Another product portfolio architecture strategy is based on some measure
of product performance. Product performance can be defined as how well a
product implements its intended functions [Ulrich, 1995]. Some general
examples of product performance characteristics are speed, efficiency, life,
accuracy and noise. Krishnan [1998] proposes a model based approach for
planning and developing a product family where customers choose products
based on some measure of performance.
In another product performance based example, Gonzalez-Zugasti [1998]
proposes a methodology for optimizing the product portfolio architecture of a
family of future spacecraft fielded by the Jet Propulsion Lab. The methodology
begins with a point design calculation for each of the different spacecraft
missions. The proposed hardware and system performance characteristics of all
the point designs are then reviewed and areas of similarity or commonality are
identified. These particular components or actual design values are held
constant as each of the point designs is then re-evaluated in terms of being able
to meet their specific mission requirements. If mission requirements cannot be
met, then a negotiation process may take place to arrive at a mutually optimal
solution in light of different mission constraints. If mission requirements are met,
then those elements can be considered part of a platform.
The framework proposed in this investigation is based on an approach
similar to that of the JPL case where the variation of key system design variables
from a sample of engines is calculated. A modified QFD mapping procedure is
implemented to quantify the degree of coupling between stakeholder needs,
system requirements and system design variables as well as the difficulty in their
14
achievement. Platform elements are then identified as those variables with low
normalized coupling and low normalized variation.
2.2 Examples of Product Platforms
The idea of platforms as a strategy for defining product portfolio
architecture is not new. Examples of product platforms include the Sony
Walkman [Sanderson and Uzumeri, 1995], and Ford's 4.6L SOHC V-8 engine
[Hagen, 1990] and vehicle platforms [Nelson et al., 1998]. The benefits of
product platforms include reduced engineering and development costs, quicker
time to market, economies of scale due to increased volume of standard parts,
and common design concepts. The case of the Sony Walkman and Ford V-8
engine illustrate two different product platform strategies, where the former is
based on topological design changes, while the latter focuses on fundamental,
internal design changes.
In the early 1980's, Sony developed 3 basic platforms on which all
subsequent Walkman models were built. These platforms focused on two key
areas including miniaturization, which affected battery size, and high sound
quality systems. With these 3 platforms, Sony offered as many as 20 new
models each year and almost 250 US models in the 1980's. Approximately 85%
of these 250 models were the result of topological design changes, or cosmetic
changes to the outside case and minor re-arrangement of existing features.
Sony's success with the Walkman was the result of providing product variety to
several market niches. In fact, they offered more models than the competition
during this period. This platform strategy focused on providing product variety
through topological design changes, while only incrementally improving the
performance of the basic platforms [Sanderson and Uzumeri, 1995].
The case of Ford's V-8 engine platform is more analogous to that of the
gas turbine engine, where the primary means of providing product variety is not
necessarily with topological design changes as in the case of the Sony Walkman,
but with design changes to the internal workings of the machinery to enhance
performance. Ford's engine platform strategy was to design a family of engines
15
that were to be used in a variety of large and luxury vehicles based on common
combustion chambers, valvetrains and basic structure to allow ease of
interchangeability. The use of the same component in multiple products can be
defined as component standardization [Ulrich, 1995]. Similar components within
engine families were also shared such as cylinder blocks, aluminum cylinder
heads, camshafts, water and oil pumps, and fasteners. Maintaining key
characteristics of a particular engine platform, such as bolt patterns, bore spacing
and journal sizes were also part of the platform strategy. As a result, it was
estimated that the family of engines would share 75% of all parts [Hagen, 1990].
Maintaining key characteristics is also the basic strategy for Ford's Global
Architecture Process (GAP) for entire vehicle platforms [Nelson et al., 1998].
Hardpoints are defined for each platform and consist of master location holes
and surfaces, weldlines, and wheelbase and overhang variation ranges. Even
with these hardpoints, there is still flexibility to build variety into products of a
given platform family. The rationale for maintaining hardpoints is to support high
volume vehicle production with flexible manufacturing lines. This vehicle platform
strategy is more analogous to the Sony Walkman case than it is to the V-8
engine case, because product variety is provided by topological design changes
like body panels, cabin size as well as other attributes distinguishable by the
consumer.
The Sony Walkman and Ford V-8 engine/vehicle cases illustrate different
product platform strategies. Chapter 5 discusses the Pratt & Whitney case study
of the PW4000 engine family and similarities to the Sony and Ford cases. The
next section discusses some basic concepts of product architecture that may or
may not lend themselves to a platform strategy.
2.3 Product Architecture Concepts
Given the examples of product platform strategies and how they may be
defined, it is important to understand some fundamental concepts of product
architecture that may or may not lend themselves to a platform strategy. Product
architecture can be categorized as either modular or integral [Ulrich, 1995]. An
16
architecture that is modular has functional elements that have a one-to-one
mapping to the physical components of the product and where interfaces
between components are decoupled. Two components are considered
decoupled if a change made to one component does not require a change to the
other component in order for the entire product to work correctly. In contrast, an
architecture that is integral has functional elements that have more than a one-to-
one mapping to physical components and/or have coupled interfaces between
components.
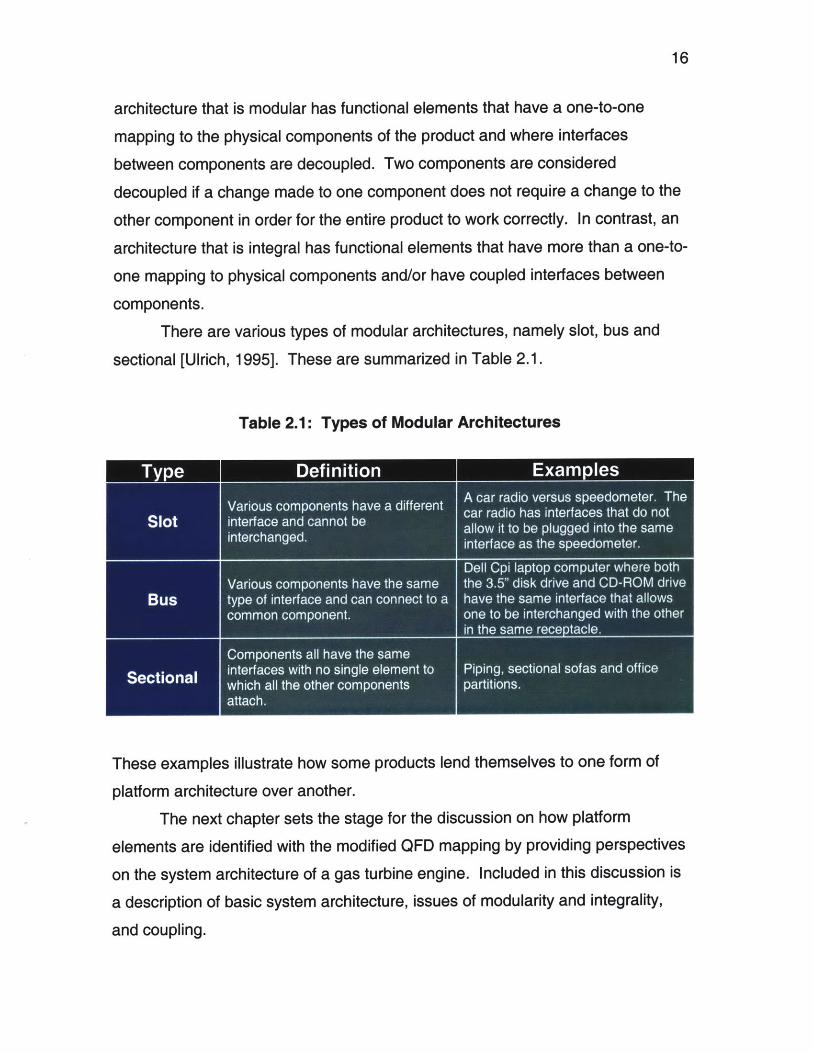
There are various types of modular architectures, namely slot, bus and
sectional [Ulrich, 1995]. These are summarized in Table 2.1.
Table 2.1: Types of Modular Architectures
TypeDefinition E xamples
A car radio versus speedometer. The
Slotinterface and cannot be car radio has interfaces that do not
interchanged. allow it to be plugged into the sameinterface as the speedometer.
Dell Cpi laptop computer where bothVarious components have the same the 3.5" disk drive and CD-ROM drive
Bustype of interface and can connect to a have the same interface that allowscommon component. one to be interchangied with the other
in the same rece tacle.
Components all have the same
S cin l interfaces with no sing e element to PpnscinlsfsadofcSectional which all the other components prtin.
attach.
These examples illustrate how some products lend themselves to one form of
platform architecture over another.
The next chapter sets the stage for the discussion on how platform
elements are identified with the modified QFD mapping by providing perspectives
on the system architecture of a gas turbine engine. Included in this discussion is
a description of basic system architecture, issues of modularity and integrality,
and coupling.
17
3 System Architecture of a Commercial Gas Turbine
Engine
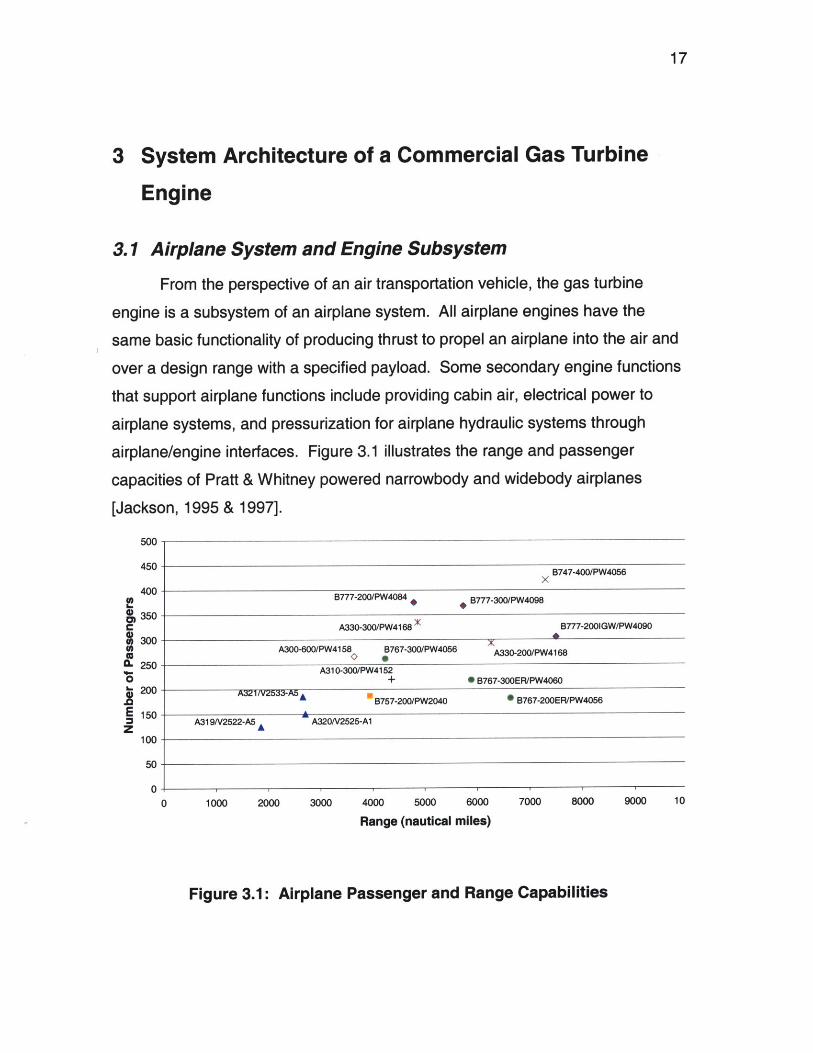
3.1 Airplane System and Engine Subsystem
From the perspective of an air transportation vehicle, the gas turbine
engine is a subsystem of an airplane system. All airplane engines have the
same basic functionality of producing thrust to propel an airplane into the air and
over a design range with a specified payload. Some secondary engine functions
that support airplane functions include providing cabin air, electrical power to
airplane systems, and pressurization for airplane hydraulic systems through
airplane/engine interfaces. Figure 3.1 illustrates the range and passenger
capacities of Pratt & Whitney powered narrowbody and widebody airplanes
[Jackson, 1995 & 1997].
IA
E-
Z
500
450
400
350
300
250
200
150
100
50
00
B747-400/PW4056xB777-2OO/PW4084. B777-300/PW4098
A330-300/PW4168 B777-2001GW/PW4090
A300-600/PW4158 B767-300/PW4056 A330-200/PW468
A31 O-300/PW41 52+ 9 B767-300ER/PW4060
A321/V2633-A5A B757-200/PW2040 @ B767-200ER/PW4056
AA31 9N2522-A5 A A320N2525-Al
1000 2000 3000 4000 5000 6000
Range (nautical miles)
7000 8000 9000 10
Figure 3.1: Airplane Passenger and Range Capabilities
18
Engines can provide different thrust levels for different airplane
applications. Thrust variation is achieved as a result of the aerothermodynamic
and mechanical design of the engine's turbomachinery that includes the rotating
blades and stationary vanes, as well as the associated support structure.
Support structure includes major parts such as disks, cases, seals, bearings and
shafts.
Airlines can choose between and among engines offered by different
manufacturers, since the engine is an option on the airplane. For example, an
airline that purchases a Boeing B777 has the option of choosing either Pratt &
Whitney PW4000, General Electric GE90 or Rolls Royce Trent 800 series
engines. Here, all three engine manufacturers supply engines with roughly the
same rated takeoff thrust, but that may be differentiated by their degree of fuel
efficiency, weight, and reliability as examples. What allows three different engine
types to interface and be used on the same airplane is the engine buildup unit
(EBU).
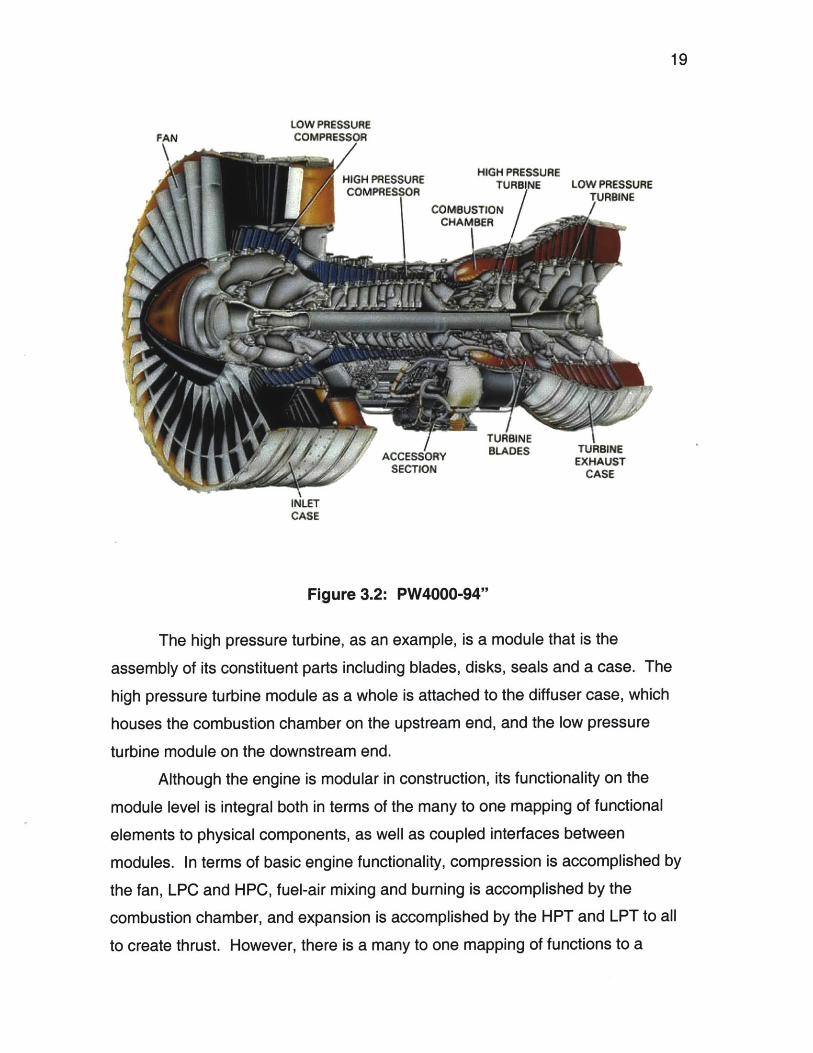
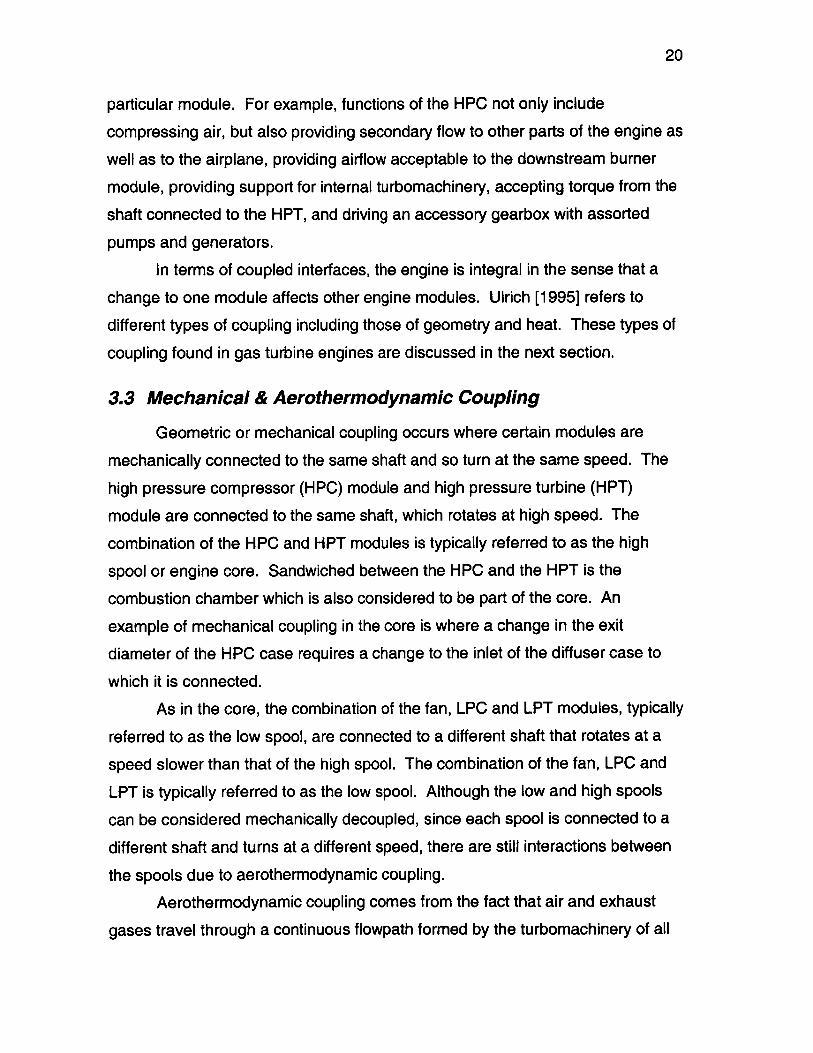
3.2 Modularity and Integrality
A commercial gas turbine engine has attributes of both modular and
integral architectures. The modular construction of the engine is such that the
major components, typically referred to as modules, can be bolted to each other
to form the entire engine. Major engine modules include
. Fan
. Low Pressure Compressor (LPC)
. High Pressure Compressor (HPC)
. Combustion Chamber (also referred to as the burner)
. High Pressure Turbine (HPT)
. Low Pressure Turbine (LPT)
Figure 3.2 is a cutaway illustration of the PW4000-94" showing the major
modules and their relative position to one another [http://www.pratt-
whitney.com/engines/galery/g.pw4000.94cut.htm].
LOW PRESSURECOMPRESSORFAN
ILETCASE
Figure 3.2: PW4000-94"
The high pressure turbine, as an example, is a module that is the
assembly of its constituent parts including blades, disks, seals and a case. The
high pressure turbine module as a whole is attached to the diffuser case, which
houses the combustion chamber on the upstream end, and the low pressure
turbine module on the downstream end.
Although the engine is modular in construction, its functionality on the
module level is integral both in terms of the many to one mapping of functional
elements to physical components, as well as coupled interfaces between
modules. In terms of basic engine functionality, compression is accomplished by
the fan, LPC and HPC, fuel-air mixing and burning is accomplished by the
combustion chamber, and expansion is accomplished by the HPT and LPT to all
to create thrust. However, there is a many to one mapping of functions to a
19
20
particular module. For example, functions of the HPC not only include
compressing air, but also providing secondary flow to other parts of the engine as
well as to the airplane, providing airflow acceptable to the downstream burner
module, providing support for internal turbomachinery, accepting torque from the
shaft connected to the HPT, and driving an accessory gearbox with assorted
pumps and generators.
In terms of coupled interfaces, the engine is integral in the sense that a
change to one module affects other engine modules. Ulrich [1995] refers to
different types of coupling including those of geometry and heat. These types of
coupling found in gas turbine engines are discussed in the next section.
3.3 Mechanical & Aerothermodynamic Coupling
Geometric or mechanical coupling occurs where certain modules are
mechanically connected to the same shaft and so turn at the same speed. The
high pressure compressor (HPC) module and high pressure turbine (HPT)
module are connected to the same shaft, which rotates at high speed. The
combination of the HPC and HPT modules is typically referred to as the high
spool or engine core. Sandwiched between the HPC and the HPT is the
combustion chamber which is also considered to be part of the core. An
example of mechanical coupling in the core is where a change in the exit
diameter of the HPC case requires a change to the inlet of the diffuser case to
which it is connected.
As in the core, the combination of the fan, LPC and LPT modules, typically
referred to as the low spool, are connected to a different shaft that rotates at a
speed slower than that of the high spool. The combination of the fan, LPC and
LPT is typically referred to as the low spool. Although the low and high spools
can be considered mechanically decoupled, since each spool is connected to a
different shaft and turns at a different speed, there are still interactions between
the spools due to aerothermodynamic coupling.
Aerothermodynamic coupling comes from the fact that air and exhaust
gases travel through a continuous flowpath formed by the turbomachinery of all
21
the engine modules, from the inlet to the exit of the engine. The exit conditions
of mass, momentum and energy in the form of pressure, temperature and flow
from one module serve as the entrance conditions for the following module. In
addition, a change in a flowpath condition for a module on one spool may affect
another module on the same or the other spool because of this continuous flow
from one module to the next.
Coupling effects are not necessarily bad. Quantification of module to
module parameter coupling can be used during the engine development process
to optimize overall system performance. The coupling between modules is
typically quantified by what are referred to as influence coefficients or trade
factors. For example, if an engine test reveals that fuel efficiency goals are not
being met, influence coefficients generated from powerplant performance
simulations can be used to compare actual parameter shifts with predicted
parameter shifts in order to determine which module(s) are key contributors to
this deficiency. This information can then be used to determine what module
improvements are needed in order for the engine to meet overall system
requirements.
In contrast, coupling can also be detrimental when a change to one aspect
of the engine adversely affects one or more aspects of another part of the
engine. For example, although the low pressure compressor (LPC) and high
pressure compressor (HPC) are not mechanically coupled because they are
connected to different shafts, they are still aerothermodynamically coupled
because they share a common interface. LPC exit conditions of pressure,
temperature and flow serve as the entrance conditions to the HPC. Good engine
design will minimize the coupling between these modules such that a surge
condition in one does not exacerbate a surge condition in the other. An engine
surge is where the compression system has lost its ability to compress air and
there is a momentary reversal of flow towards the front of the engine instead of
rearward. This is an example of the desire to minimize the coupling between
modules.
22
Coupling between and among engine modules both mechanically and
aerothermodynamically complicates the issue of a platform. Swapping a module
from one engine type to another in a building block philosophy first requires that
the mechanical interface is compatible, e.g. bolt locations, diameters and shaft
size. Even if the mechanical interface is compatible, the aerothermodynamic
coupling between and among modules may prevent this swapping strategy from
allowing the entire engine to meet system requirements.
Because the traditional approach of defining platform elements as those
which have little or no coupling at the interface or have a one-to-one mapping of
form to function, are not entirely appropriate for a commercial gas turbine engine
which is functionally integral, as well as mechanically and aerothermodynamically
coupled, an alternative approach is needed. The next chapter introduces quality
function deployment (QFD) as a framework for assessing a form of system level
coupling that not only captures the physical coupling described above, but also
the relationships between key system design variables and the stakeholder
needs and system requirements that drive them. Quantifying the degree of
coupling between needs, requirements and system design variables as well as
their difficulty in achievement, will help to identify the system level effect of
keeping key design variables constant or within a certain range of variability in a
platform scenario. Identifying these key design variables is then the first step in
identifying potential platform elements in an integral and coupled architecture
such as the gas turbine engine.
23
4 Quality Function Deployment (QFD)
4.1 What is QFD?
This investigation utilized QFD to systematically identify key elements of a
gas turbine engine product platform. QFD was reported on by Hauser and
Clausing [1998], but was originally based on the quality tables developed by
Professor Mizuno at the Tokyo Institute of Technology for Mitsubishi Kobe
Shipyards in 1972. QFD is a means to ensure that high level needs and
requirements flow down or are deployed to the design and manufacture of
various product components. QFD has been used as a system engineering tool
for requirements management, tracking and traceability. It has been used in the
design of complex systems such as spacecraft and military airplanes [Boppe,
1998]. Xerox used QFD in the design of their successful Lakes digital document
platform to "deploy the voice of the customer to the factory floor' [Paula, 1997;
Elter, 1998].
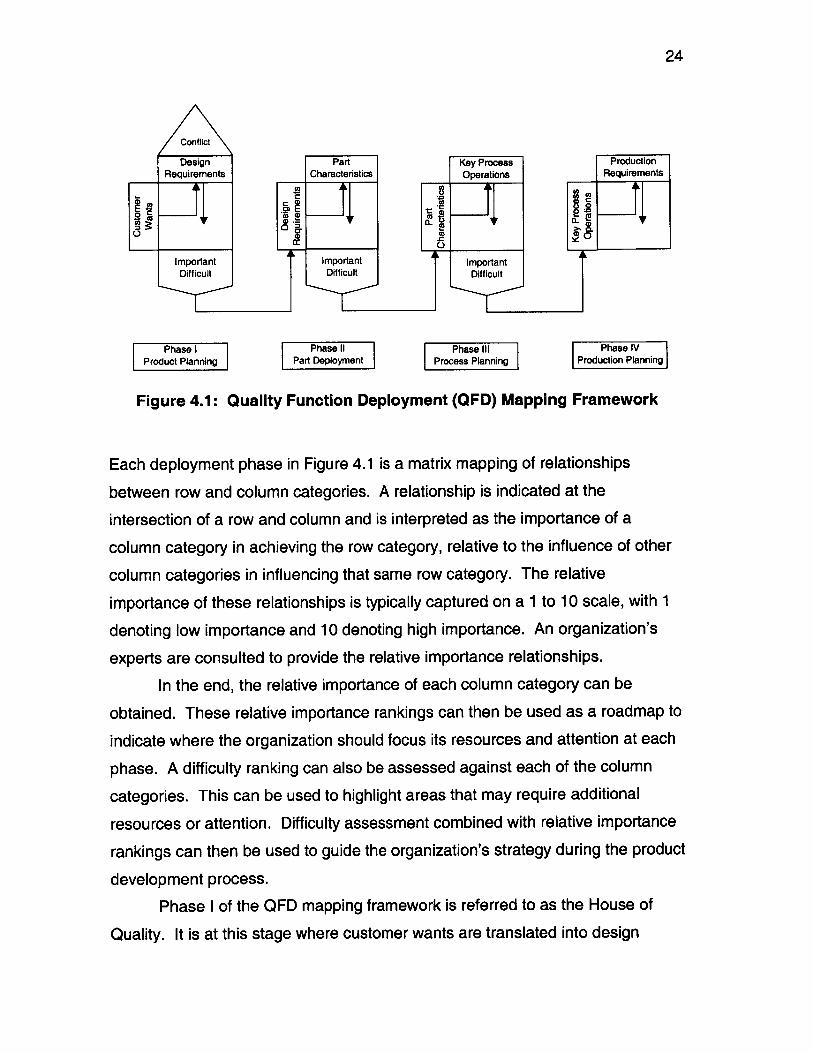
Figure 4.1 [Quality Function Deployment Implementation Manual, 1989]
shows the QFD framework beginning with customer wants or needs and
progressing to a series of 4 mappings first to design requirements, then to part
characteristics, key process operations, and finally to production requirements.
24
Conflict
Design Part Key Process ProductionRequirements Characteristics Operations Requirements
E g 0
Important Important ImportantDifficult Difficult Difficult
Phase I Phase 11 Phase III Phase IVProduct Planning Part Deployment Process Planning Production Planning
Figure 4.1: Quality Function Deployment (QFD) Mapping Framework
Each deployment phase in Figure 4.1 is a matrix mapping of relationships
between row and column categories. A relationship is indicated at the
intersection of a row and column and is interpreted as the importance of a
column category in achieving the row category, relative to the influence of other
column categories in influencing that same row category. The relative
importance of these relationships is typically captured on a 1 to 10 scale, with 1
denoting low importance and 10 denoting high importance. An organization's
experts are consulted to provide the relative importance relationships.
In the end, the relative importance of each column category can be
obtained. These relative importance rankings can then be used as a roadmap to
indicate where the organization should focus its resources and attention at each
phase. A difficulty ranking can also be assessed against each of the column
categories. This can be used to highlight areas that may require additional
resources or attention. Difficulty assessment combined with relative importance
rankings can then be used to guide the organization's strategy during the product
development process.
Phase I of the QFD mapping framework is referred to as the House of
Quality. It is at this stage where customer wants are translated into design
25
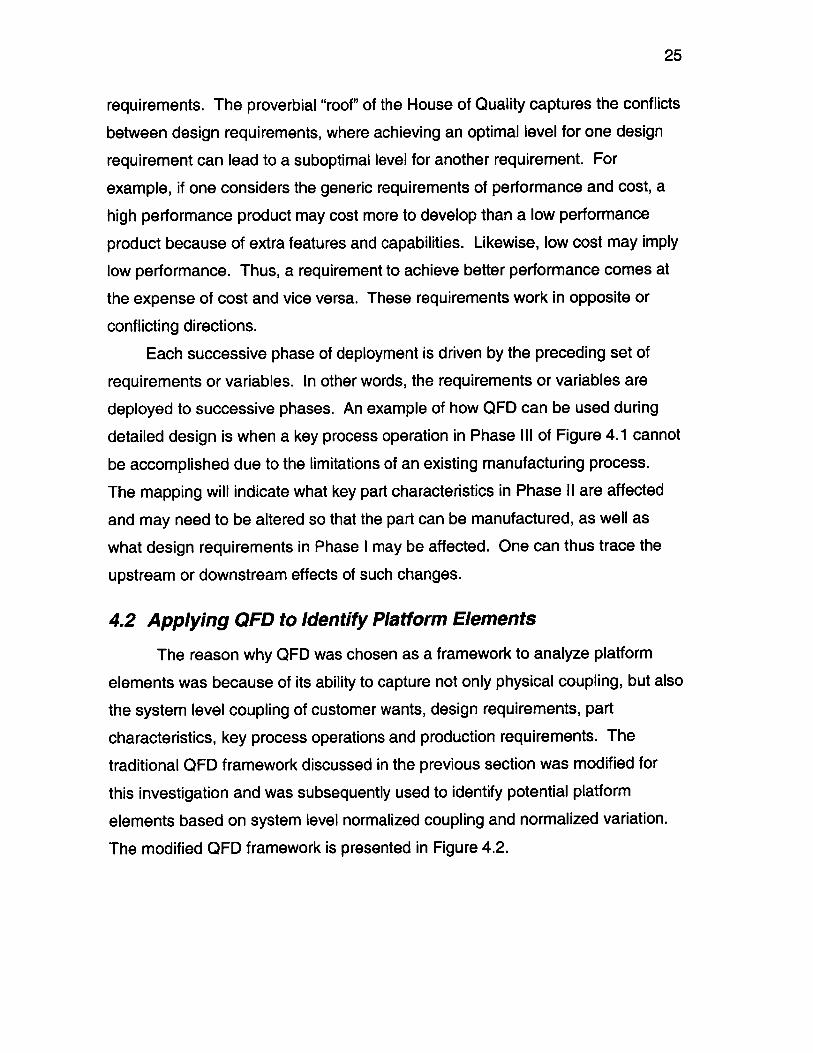
requirements. The proverbial "roof" of the House of Quality captures the conflicts
between design requirements, where achieving an optimal level for one design
requirement can lead to a suboptimal level for another requirement. For
example, if one considers the generic requirements of performance and cost, a
high performance product may cost more to develop than a low performance
product because of extra features and capabilities. Likewise, low cost may imply
low performance. Thus, a requirement to achieve better performance comes at
the expense of cost and vice versa. These requirements work in opposite or
conflicting directions.
Each successive phase of deployment is driven by the preceding set of
requirements or variables. In other words, the requirements or variables are
deployed to successive phases. An example of how QFD can be used during
detailed design is when a key process operation in Phase Ill of Figure 4.1 cannot
be accomplished due to the limitations of an existing manufacturing process.
The mapping will indicate what key part characteristics in Phase II are affected
and may need to be altered so that the part can be manufactured, as well as
what design requirements in Phase I may be affected. One can thus trace the
upstream or downstream effects of such changes.
4.2 Applying QFD to Identify Platform Elements
The reason why QFD was chosen as a framework to analyze platform
elements was because of its ability to capture not only physical coupling, but also
the system level coupling of customer wants, design requirements, part
characteristics, key process operations and production requirements. The
traditional QFD framework discussed in the previous section was modified for
this investigation and was subsequently used to identify potential platform
elements based on system level normalized coupling and normalized variation.
The modified QFD framework is presented in Figure 4.2.
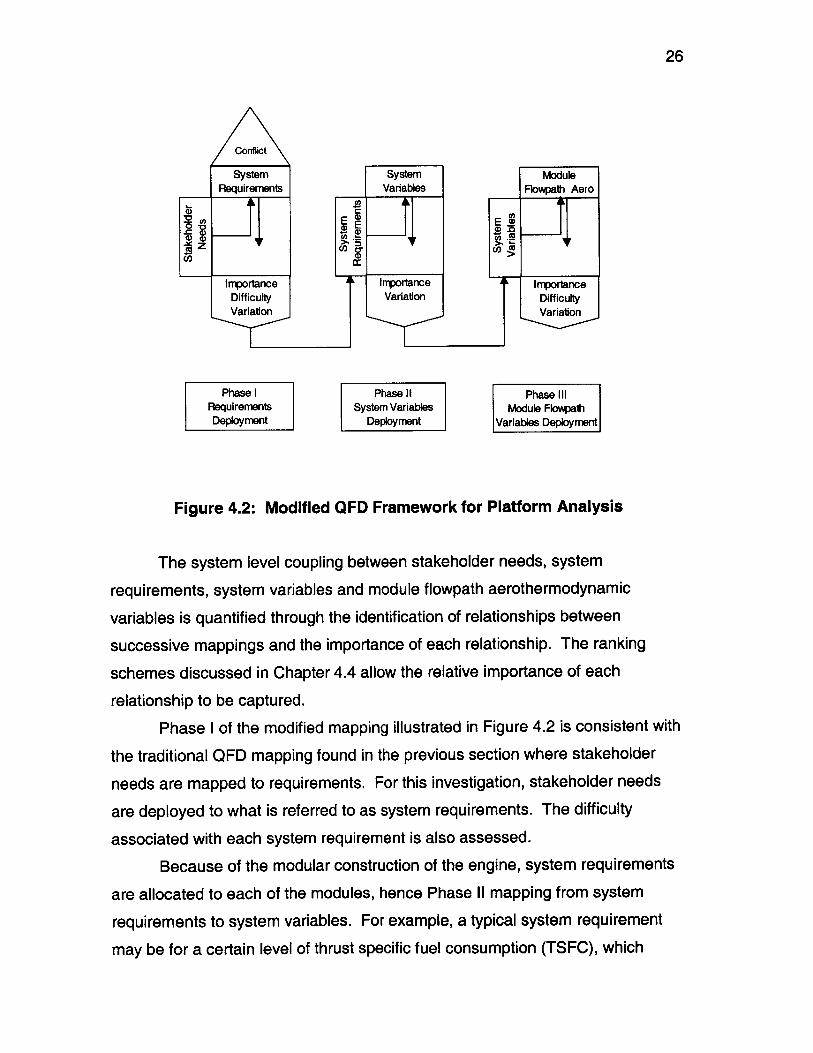
Conflict
SystemRequirements
0
00
ImportanceDifficultyVariation
Phase IRequirementsDeployment
System ModuleVariables Flowpath Aero
E E)
C~CO
Importance ImportanceVariation Difficulty
Variation
Phase Il Phase ilSystem Variables Module Flowpath
Deployment Variables Deployment
Figure 4.2: Modified QFD Framework for Platform Analysis
The system level coupling between stakeholder needs, system
requirements, system variables and module flowpath aerothermodynamic
variables is quantified through the identification of relationships between
successive mappings and the importance of each relationship. The ranking
schemes discussed in Chapter 4.4 allow the relative importance of each
relationship to be captured.
Phase I of the modified mapping illustrated in Figure 4.2 is consistent with
the traditional QFD mapping found in the previous section where stakeholder
needs are mapped to requirements. For this investigation, stakeholder needs
are deployed to what is referred to as system requirements. The difficulty
associated with each system requirement is also assessed.
Because of the modular construction of the engine, system requirements
are allocated to each of the modules, hence Phase 11 mapping from system
requirements to system variables. For example, a typical system requirement
may be for a certain level of thrust specific fuel consumption (TSFC), which
26
27
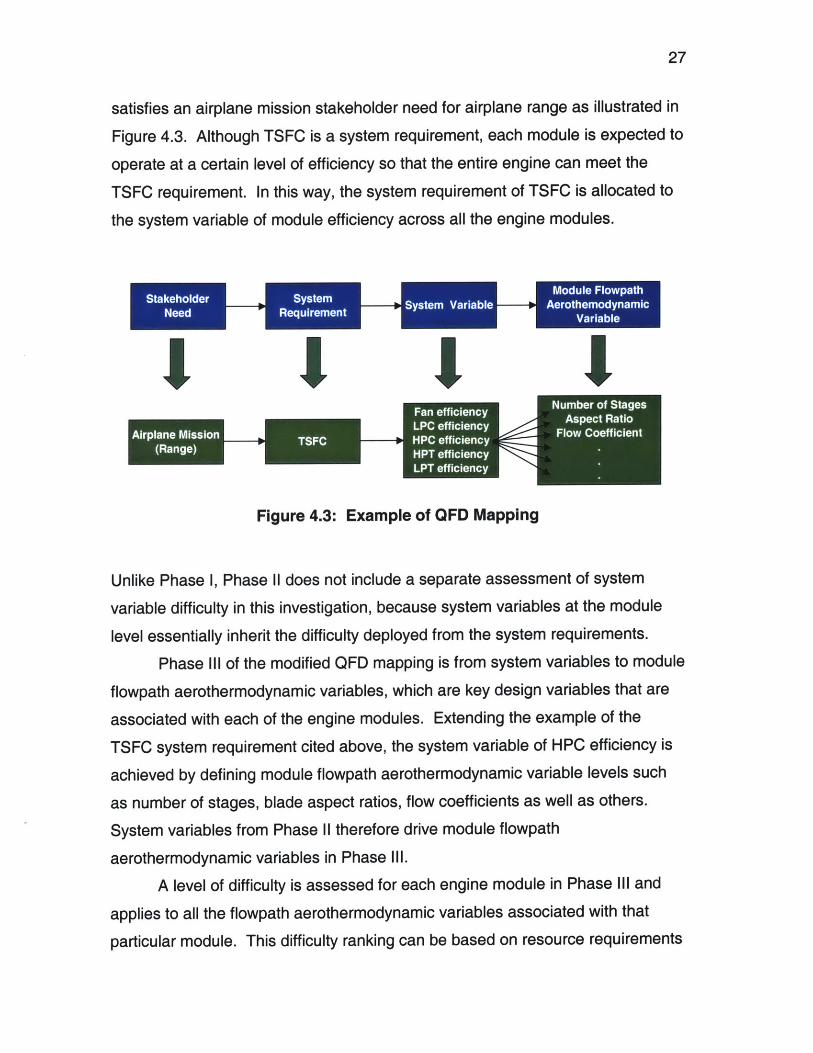
satisfies an airplane mission stakeholder need for airplane range as illustrated in
Figure 4.3. Although TSFC is a system requirement, each module is expected to
operate at a certain level of efficiency so that the entire engine can meet the
TSFC requirement. In this way, the system requirement of TSFC is allocated to
the system variable of module efficiency across all the engine modules.
Stakeholder Requ emen Sysem Variable- Aerothemn narn c
Figure 4.3: Example of QFD Mapping
Unlike Phase 1, Phase I does not include a separate assessment of system
variable difficulty in this investigation, because system variables at the module
level essentially inherit the difficulty deployed from the system requirements.
Phase Ill of the modified QFD mapping is from system variables to module
flowpath aerothermodynamic variables, which are key design variables that are
associated with each of the engine modules. Extending the example of the
TSFC system requirement cited above, the system variable of HPC efficiency is
achieved by defining module flowpath aerothermodynamic variable levels such
as number of stages, blade aspect ratios, flow coefficients as well as others.
System variables from Phase 11 therefore drive module flowpath
aerothermodynamic variables in Phase Ill.
A level of difficulty is assessed for each engine module in Phase Ill and
applies to all the flowpath aerothermodynamic variables associated with that
particular module. This difficulty ranking can be based on resource requirements
28
for personnel, as well as module hardware and non module hardware required
during development. As discussed in the introduction, the degree of difficulty is
used as a discriminator for identifying platform elements so that they can be
leveraged across multiple products. This can reduce subsequent product
development effort and cost.
What differentiates the modified QFD framework for platform analysis from
the traditional QFD is the quantification of parameter variation at each phase of
the mapping. Later sections discuss how the normalized variation of actual
aerothermodynamic design data is calculated and how potential platform
elements are identified for Phase Ill of this mapping process. Knowing the level
of normalized variation as well as normalized coupling then allows platform
elements to be identified.
A detailed description of different elements for each phase of the modified
QFD mapping used to identify platform elements is described in the next section.
These include stakeholder needs, system requirements, system variables, and
module flowpath aerothermodynamic variables.
4.3 Elements of the Platform QFD
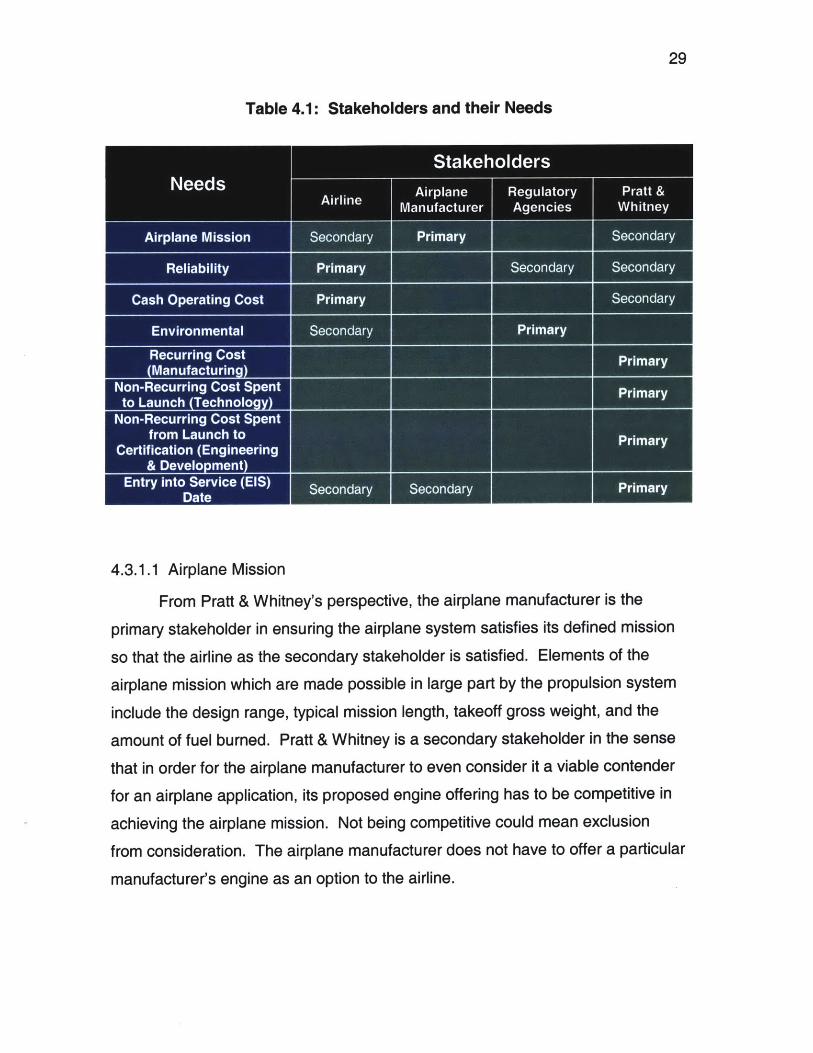
4.3.1 Stakeholders and their Needs
Pratt & Whitney uses a balanced scorecard approach to design engines
[Kaplan and Norton, 1996]. Engine designs are driven by the needs of many
stakeholders including airlines, airplane manufacturers, regulatory agencies as
well as Pratt & Whitney. Airlines are the end user of Pratt & Whitney engines.
Airplane manufacturers consider the engine to be an airplane subsystem.
Regulatory agencies like the Federal Aviation Administration (FAA), International
Civil Aviation Organization (ICAO), and Environmental Protection Agency (EPA)
define policies and guidelines to protect the public and the environment. Finally,
Pratt & Whitney, like any other company, is in the business to make a profit.
Table 4.1 lists the stakeholder needs used in Pratt & Whitney's balanced
scorecard approach and who the primary and secondary stakeholders are.
Below is a detailed description of stakeholders and their needs.
29
Table 4.1: Stakeholders and their Needs
4.3.1.1 Airplane Mission
From Pratt & Whitney's perspective, the airplane manufacturer is the
primary stakeholder in ensuring the airplane system satisfies its defined mission
so that the airline as the secondary stakeholder is satisfied. Elements of the
airplane mission which are made possible in large part by the propulsion system
include the design range, typical mission length, takeoff gross weight, and the
amount of fuel burned. Pratt & Whitney is a secondary stakeholder in the sense
that in order for the airplane manufacturer to even consider it a viable contender
for an airplane application, its proposed engine offering has to be competitive in
achieving the airplane mission. Not being competitive could mean exclusion
from consideration. The airplane manufacturer does not have to offer a particular
manufacturer's engine as an option to the airline.
30
4.3.1.2 Reliability
Airlines are the primary stakeholder for engine reliability, although the FAA
may become a more vocal stakeholder when flight safety issues have the
potential to adversely affect the flying public. Reliability is the ability of the
engine to operate safely and according to its original design intent. Engine
reliability is typically measured in terms of in-flight shutdowns, unscheduled
engine removals, and delays and/or cancellations.
When engine reliability poses a severe safety hazard, the FAA may
intervene and mandate that certain rectifying actions be taken to minimize risk to
the flying public. Poor reliability also increases an airline's direct and indirect
operating costs when it has to fix these problems. It may also lower their
revenues when flight delays or cancellations decrease passenger satisfaction.
In many ways, Pratt & Whitney is also a secondary stakeholder, because
the reliability of the engine influences the amount of post certification engineering
(PCE) effort required to resolve these problems. Given limited budgets, this may
impact the funding available for new engine development programs. Poor engine
reliability may also influence an airline's decision not to buy current or future
engines from a given manufacturer, because reliability problems like delays and
cancellations can result in lost revenues from low customer satisfaction.
4.3.1.3 Cash Operating Cost
Airlines are the primary stakeholder for cash operating cost (COC). COC
includes costs associated with operating the engine such as total maintenance
cost (TMC) and the cost of fuel burned. The stakeholder need is to minimize
COC via low maintenance costs and fuel efficient engines.
Pratt & Whitney can also be considered a stakeholder when it offers fixed
price maintenance contracts to airlines. This is where Pratt & Whitney maintains
an airline's fleet of engines and charges a certain maintenance rate based on the
number of hours the engines are operated. If actual maintenance costs exceed
negotiated contract levels, Pratt & Whitney stands to lose profit. In addition, if
31
maintenance costs are too high relative to the competition, Pratt & Whitney
stands to lose market share for these maintenance contracts.
4.3.1.4 Environmental
Regulatory agencies such as the FAA, ICAO and EPA are the primary
stakeholders acting on behalf of the public for ensuring that engines are
environmentally friendly when they are operated, as well as when they are
manufactured or repaired. There are published guidelines for allowable
emissions and noise levels. Airlines are secondary stakeholders because they
are penalized for operating engines that violate local emission and noise
restrictions.
4.3.1.5 Recurring Cost (Manufacturing)
Recurring cost is the cost for Pratt & Whitney to manufacture each engine.
As such, Pratt & Whitney is the primary stakeholder for ensuring that recurring
costs are minimized in order to maximize profit margins.
4.3.1.6 Non-Recurring Cost Spent to Launch (Technology)
Again, Pratt & Whitney is the primary stakeholder for this need. Non-
recurring costs include the development of technologies that will allow the engine
to achieve the airplane mission. New technologies must demonstrate a certain
level of maturity before they can be considered for inclusion in a new engine
program. It is the cost associated with the maturation of these technologies that
comprises this cost.
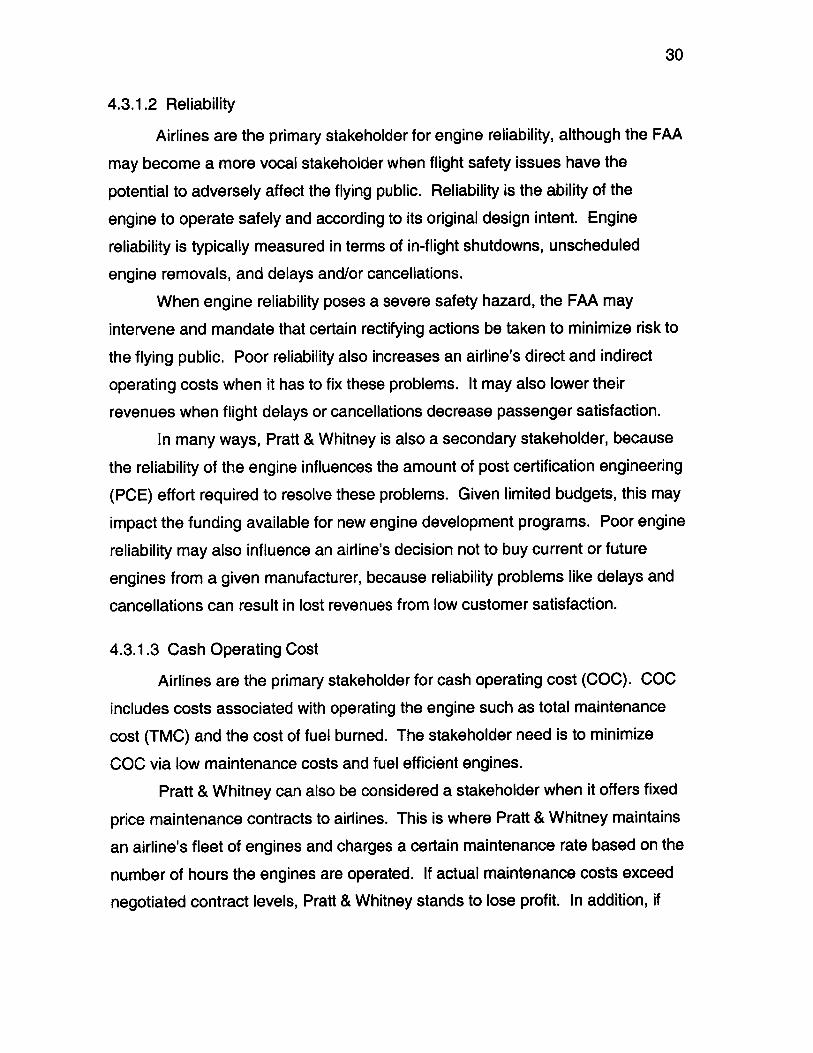
4.3.1.7 Non-Recurring Cost Spent from Launch to Certification (E&D)
Engineering and development (E&D) costs include that for manpower,
engine hardware, non-engine related equipment, and testing to ensure the
engine meets airplane mission requirements as well as passes FAA tests to be
certified as airworthy. Listed below are FAA tests prescribed by Federal Aviation
Regulations (FAR) Part 33, Airworthiness Standards: Aircraft Engines
[http://www.faa.gov/avr/AFS/FARS/far-33.txt].
32
Table 4.2: FAR Part 33 Aircraft Engine Certification Tests
E&D is essentially an affordability issue for Pratt & Whitney. There may be
instances when a development program may be technologically ready for launch
into full scale development and certification, but may end up being delayed
because of limited resources.
4.3.1.8 Entry into Service (EIS) Date
This is the date when the launch airline begins operating airplanes in
revenue service carrying passengers. This date is mutually agreed to by the
launch customer, airplane manufacturer and various suppliers, of which Pratt &
Whitney is an engine supplier. During the elapsed time between formal program
33
launch and EIS date, the development organizations must not only develop and
test hardware that meets airplane mission requirements, but also ensure the
engine passes FAA tests to be certified as flightworthy.
EIS date influences what technology can be incorporated into an engine
design, whether or not sufficient resources are available during the given
development period, and whether or not the engine can meet its requirements
when airlines begin revenue service operations. Although there are various
stakeholders, Pratt & Whitney is the primary stakeholder.
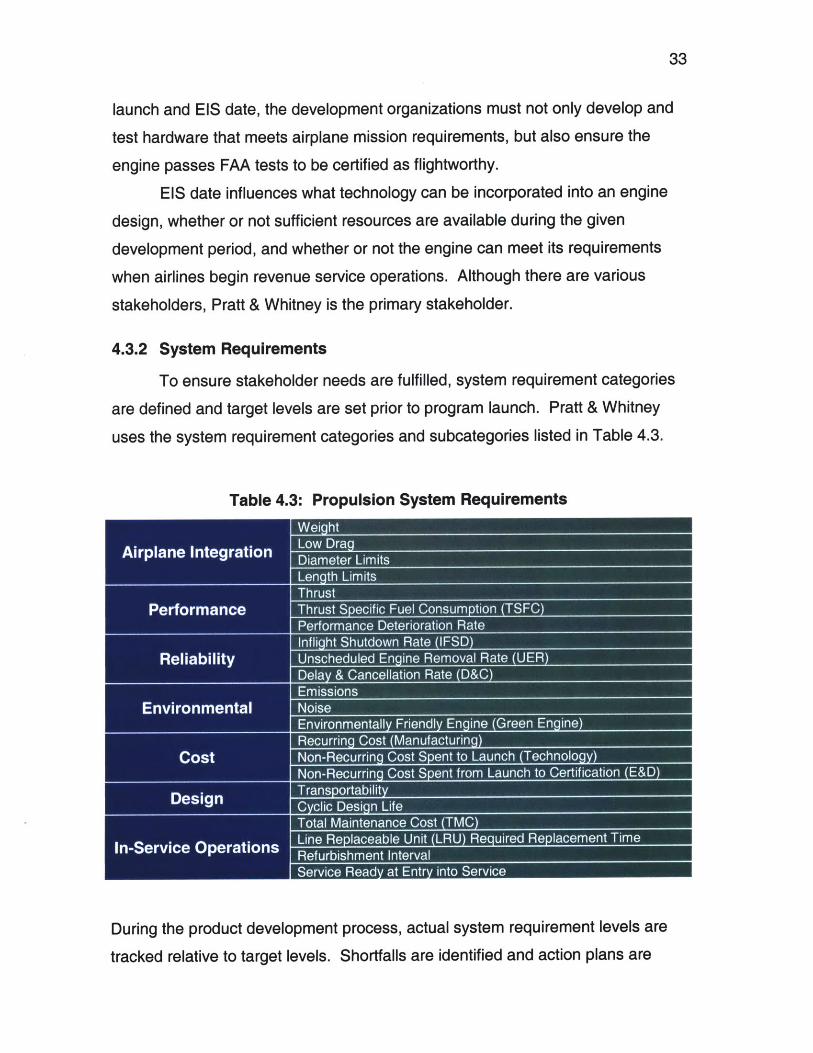
4.3.2 System Requirements
To ensure stakeholder needs are fulfilled, system requirement categories
are defined and target levels are set prior to program launch. Pratt & Whitney
uses the system requirement categories and subcategories listed in Table 4.3.
Table 4.3: Propulsion System Requirements
During the product development process, actual system requirement levels are
tracked relative to target levels. Shortfalls are identified and action plans are
34
implemented to ensure the engine meets all requirements. For example, the
engine's thrust specific fuel consumption (TSFC) is a performance requirement,
which is a measure of how efficiently the engine burns fuel to produce a given
thrust level. A target TSFC level is defined such that the stakeholder needs for
the airplane to fly a certain range with a given payload, low cash operating cost
due to fuel burned, and low recurring and non-recurring costs can all be
achieved. As discussed in Chapter 3.3, a deficiency in TSFC can be isolated to
certain parts of the engine, so that specific hardware changes can be
implemented to address the problem. This may mean changing the
aerodynamics of the turbomachinery airfoils or reducing tip clearances as
example solutions. The sections below describe in greater detail each of the
requirements listed in Table 4.3.
4.3.2.1 Airplane Integration
Requirements in this category involve system level interface issues
between the engine and the airplane and include engine weight, drag, diameter
limits and length limits. The engine is mounted to the airplane via the pylon.
Because the pylon is designed to support a certain load, the engine weight must
be kept within these limits. In addition, the diameter of the engine is constrained
for wing mounted engines because of the required clearance between the bottom
of the engine and the ground. This clearance is necessary to minimize ground
vortex as well as foreign object ingestion which may adversely affect engine
operation. Length limits are important since they affect how and where the
engine is mounted to the pylon.
4.3.2.2 Performance
Requirements in this category involve the primary function of the engine,
which is to generate thrust to propel an airplane in flight. Thrust is the force that
propels an airplane at a specified speed and altitude throughout its flight
envelope. Other requirements include thrust specific fuel consumption (TSFC)
and performance deterioration rate. TSFC is a measure of how efficiently the
engine burns fuel in terms of rate of fuel burned per pound of thrust generated.
35
Performance deterioration rate is how quickly an engine's fuel efficiency changes
over time and is typically measured in %TSFC change per a given number of
cycles. Worse TSFC means that the engine is operating less efficiently and has
to burn more fuel to achieve the same thrust level. For long range airplane
missions, fuel burn is critical given the finite amount of fuel the airplane is
designed to carry.
4.3.2.3 Reliability
Requirements in this category are associated with the engine's ability to
operate according to its original design intent. Engine reliability is measured in
terms of in-flight shutdown rate (IFSD), unscheduled engine removal rate (UER),
and delay and cancellation rate (D&C). Both the in-flight shutdown and
unscheduled engine removal rates are measured as events per one thousand
flight hours. The delay and cancellation rate is measured as events per one
hundred airplane departures. Although these reliability metrics are applicable to
airplane related problems as well, the descriptions below focus on engine related
problems.
An in-flight shutdown is when the pilot terminates fuel flow to the engine.
A pilot may elect to shutdown an engine when its continued operation after an
anomalous operating condition is deemed to have the potential of causing further
damage to the engine or creating a safety hazard for the airplane. Examples of
conditions that may cause an in-flight shutdown include a bearing failure which
may cause an oil filter clog indication and high vibration, compromised bearing
compartment seal which may cause an indication of low oil pressure, low oil level
and/or high oil temperature, and fractured airfoils that may cause a surge and
high vibration. Although an engine may be shutdown, the airplane can still
continue the flight if the other engine(s) are operating normally.
An unscheduled engine removal occurs when the engine's inability to
continue functioning within normal operating guidelines causes it to be removed
for repair or refurbishment. This can result from an in-flight shutdown, the
inability to correct a problem even after on-wing troubleshooting, as well as an
36
engine durability problem where a part deteriorates or fails before reaching its
predicted design life. An unscheduled engine removal is in contrast to a
scheduled removal where an airline deliberately plans to remove an engine for
scheduled maintenance or rotation purposes. Engines may be rotated on or off
wing for the same reason that tires are rotated on an automobile, so that they
wear evenly. In the case of engines, they are rotated on or off wing so that all
the engines in an airline's fleet accumulate similar flight hours and cycles and
have similar levels of performance.
A delay may be caused when an engine problem prevents a flight from
departing within 15 minutes of its scheduled departure time. A cancellation is
caused when an engine problem prevents the flight from taking off at all. Delays
and cancellations may be caused by an in-flight shutdown or an unscheduled
engine removal.
4.3.2.4 Environmental
Requirements in this category relate to how friendly the engine is to the
environment during its operation as well as during its manufacture and repair.
Requirements include emissions levels, noise levels and whether or not the
design utilizes environmentally friendly materials and processes.
Regulated engine emissions include nitrous oxides (NOx), carbon
monoxide (CO), hydrocarbons (HC), and smoke. NOx, CO and HC emissions
are measured as grams per kilo-newton of maximum thrust generated. Smoke is
identified as the matter in exhaust emissions that obscures the transmission of
light and is measured in terms of a dimensionless smoke number. There are
often local airport restrictions or guidelines on emissions where penalty fees are
imposed on airlines that operate engines which exceed these limits.
Noise levels are measured in decibels (EPNdB) and are also regulated.
There are typically local airport restrictions on cumulative noise generated by the
engine at three reference conditions including sideline during the takeoff roll,
cutback when engine power has been reduced from takeoff power on the climb
out from the airport, and approach for landing.
37
So called "green" engines are designed to take advantage of
environmentally friendly materials used in anti-gallants, anti-seize materials,
primers, adhesives, coatings, corrosion protection and wear resistance.
Hazardous materials pose a health risk not only to production and maintenance
personnel, but also to the environment.
4.3.2.5 Cost
Requirements in this category have to do with Pratt & Whitney
manufacturing and development costs and include recurring cost, non-recurring
cost of technology development required for program launch, and non-recurring
cost of engineering and development. Low recurring or manufacturing cost is
desired for business profitability. Non-recurring costs for technology, and
engineering and development are primarily affordability issues and impacts
whether or not a development program can be launched or completed with given
resources and within a given time frame. For example, development of high
temperature materials for high performance engines may be costly to develop
from a technology as well as manufacturing standpoint.
4.3.2.6 Design
Requirements in this category have to do with the general design of the
engine. Of primary concern is the cyclic design life of critical parts that are
exposed to extreme temperature and stress conditions. For example, extreme
temperature conditions typically occur during takeoff when the engine operates at
its hottest temperature. The engine is therefore designed to operate at these
conditions for a specified number of takeoff cycles.
4.3.2.7 In-Service Operations
Requirements in this category represent issues that are important to an
airline as it operates the engine. Requirements include total maintenance cost
(TMC), time required to replace externals and accessories while the engine is
installed on an airplane, refurbishment interval and the engine being service
ready at EIS. Total maintenance costs include that for parts and labor and is
38
measured as cost per engine flight hour. Time required to replace externals and
accessories is measured in terms of minutes and is important for minimizing
maintenance labor costs when it comes to performing on-wing maintenance.
Short part replacement times may also help to reduce the frequency of delays
and cancellations when an engine problem needs to be corrected between
flights. Refurbishment interval refers to how often parts in the engine need to be
replaced because of wear and is measured in terms of engine flight cycles.
Finally, an engine is considered service ready at EIS if all documentation and
support equipment needed to operate and maintain the engine are in place and
available for an airline to use.
4.3.3 System Variables at the Module Level
Due to the modular construction of Pratt & Whitney engines, many of the
system requirements described in the previous section are achieved by
specifying levels of system variables at the module level. In other words, many
system requirements are achieved by summing the contributions from each
major engine module. For example, one system requirement that is the sum of
the module contributions is that of engine weight.
Not all system requirements are merely the cumulative total of all module
contributions, as in the case of TSFC. From the earlier example illustrated in
Figure 4.3, it was shown that TSFC is a system requirement that is influenced by
the design efficiencies of the various engine modules including the fan, LPC,
HPC, HPT and LPT. In reality, the efficiencies of some modules have a greater
impact on TSFC than others. For example, a one percent change in HPT
efficiency has a greater impact on TSFC than does a one percent change in LPC
efficiency. These non-linear effects are captured in the QFD mappings.
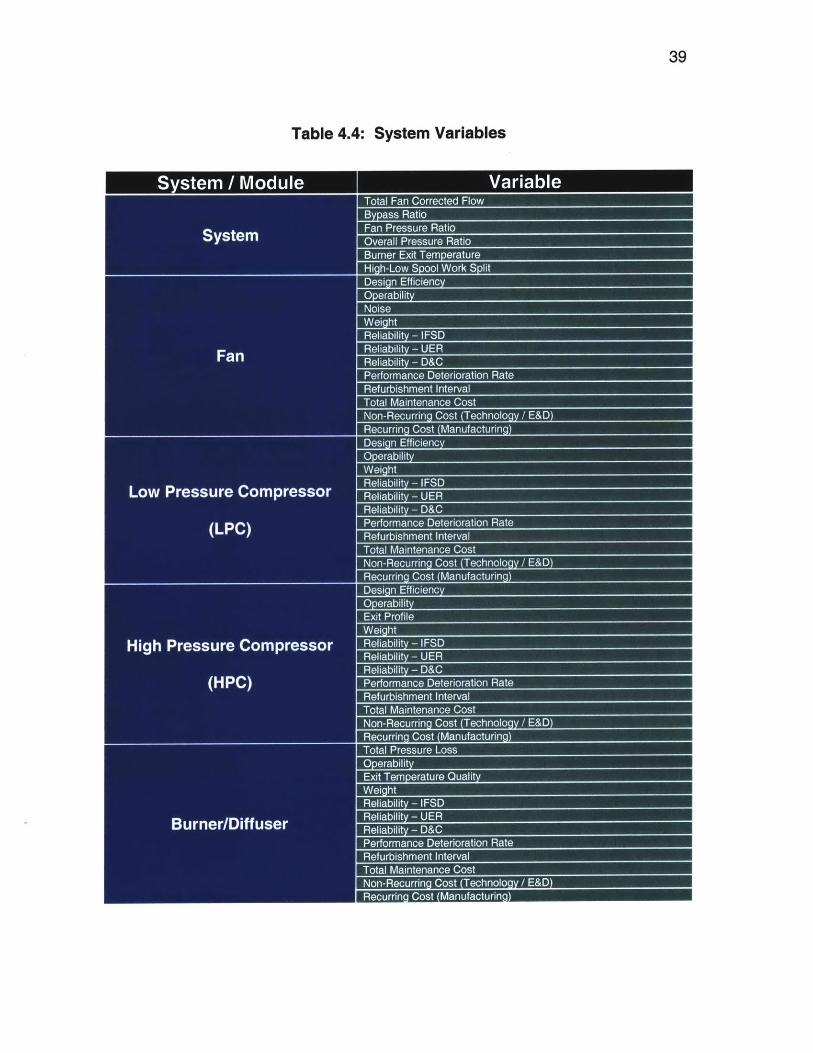
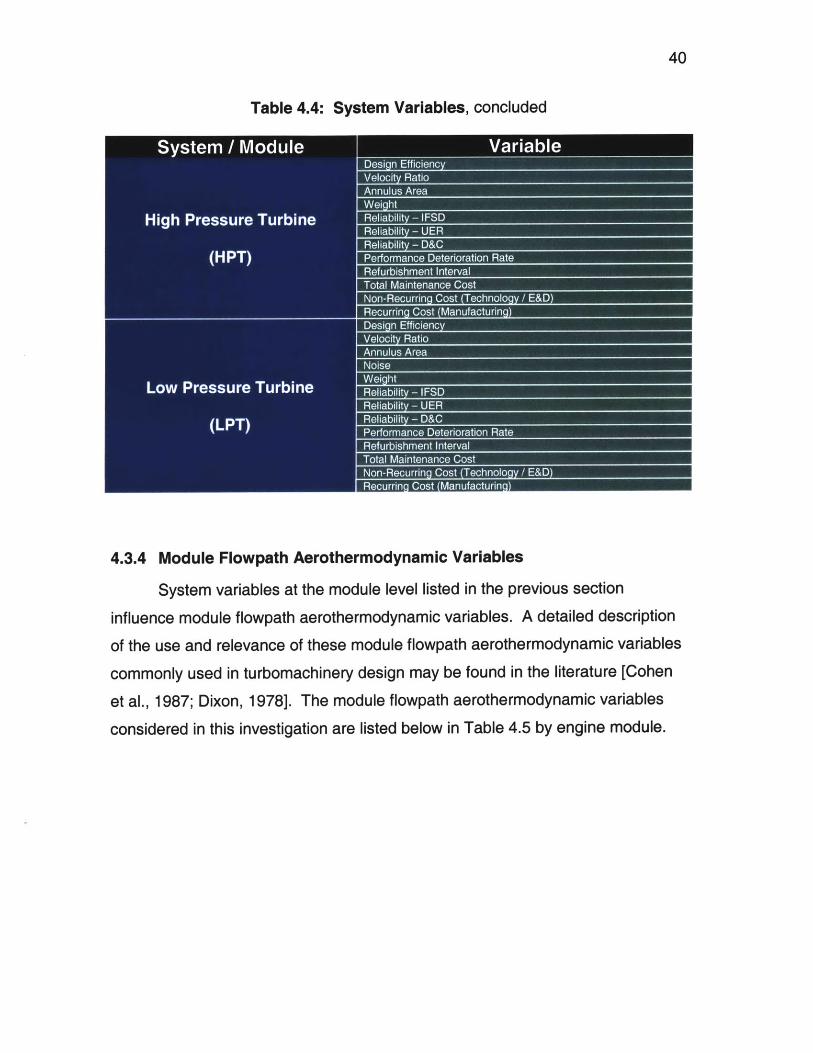
Listed below in Table 4.4 are the system variables associated with each of
the major engine modules, as well as a set of high level system variables that
may span across more than one module. These high level system variables are
commonly used in turbomachinery design. A detailed description of their use
and relevance may be found in the literature [Cohen et al., 1987; Dixon, 1978].
39
Table 4.4: System Variables
40
Table 4.4: System Variables, concluded
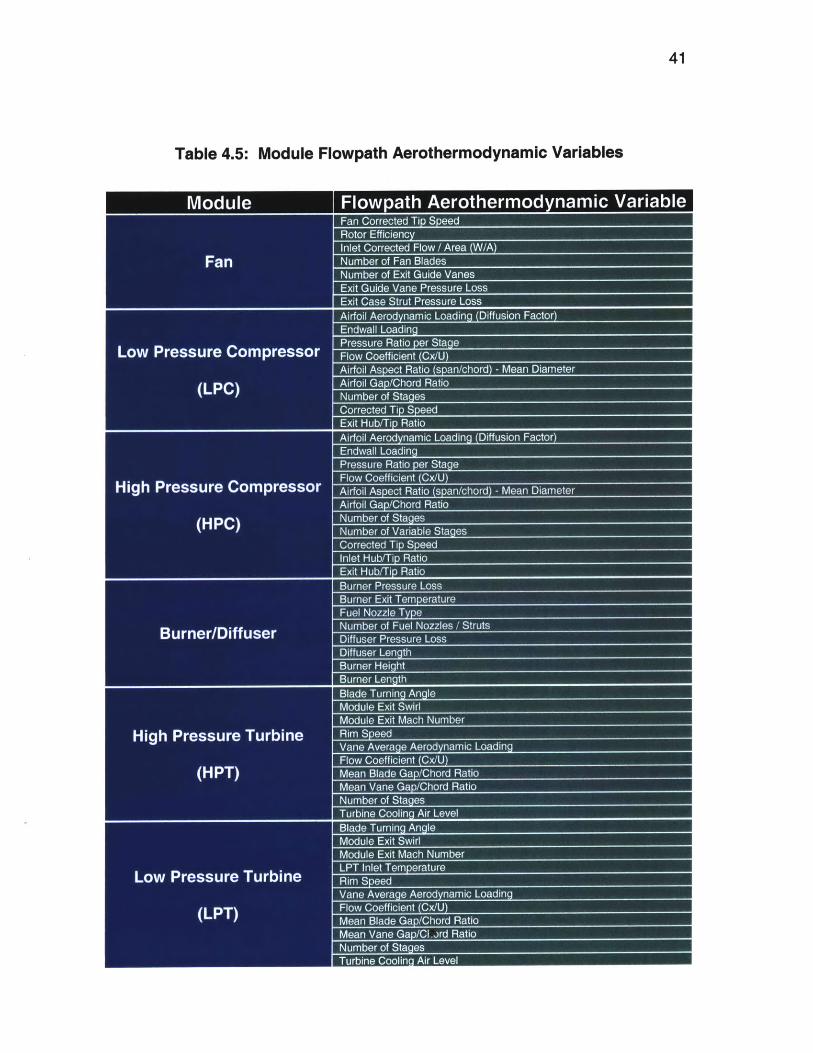
4.3.4 Module Flowpath Aerothermodynamic Variables
System variables at the module level listed in the previous section
influence module flowpath aerothermodynamic variables. A detailed description
of the use and relevance of these module flowpath aerothermodynamic variables
commonly used in turbomachinery design may be found in the literature [Cohen
et al., 1987; Dixon, 1978]. The module flowpath aerothermodynamic variables
considered in this investigation are listed below in Table 4.5 by engine module.
41
Table 4.5: Module Flowpath Aerothermodynamic Variables
42
Module flowpath aerothermodynamic variables listed above comprise the last
level of mapping addressed in this investigation. It is at this level where potential
platform elements are identified.
The next section discusses the interrelationships between stakeholder
needs, system requirements, system variables and module flowpath
aerothermodynamic variables and how these interrelationships are captured via
the QFD mapping. This will provide insight into the coupling of module flowpath
aerothermodynamic variables to stakeholder needs, system requirements and
system variables. Again, quantification of this coupling is necessary to validate
the hypothesis that system design variables with low normalized coupling and
low normalized variation are potential candidates as platform elements.
4.4 QFD Platform Mapping
In this section are discussed the modified QFD mapping process
illustrated in Figure 4.2 and how a quantitative assessment of platform elements
is derived from the mapping of importance relationships from Phase I through
Phase Ill. The mapping of importance relationships was made possible through
consultation with system engineers, technical experts and marketing specialists
that support Pratt & Whitney's Advanced Engine Programs. Individuals were
asked to offer their subjective, yet expert opinion on the relative importance of
relationships among stakeholder needs, system requirements, system variables
and module flowpath aerothermodynamic variables.
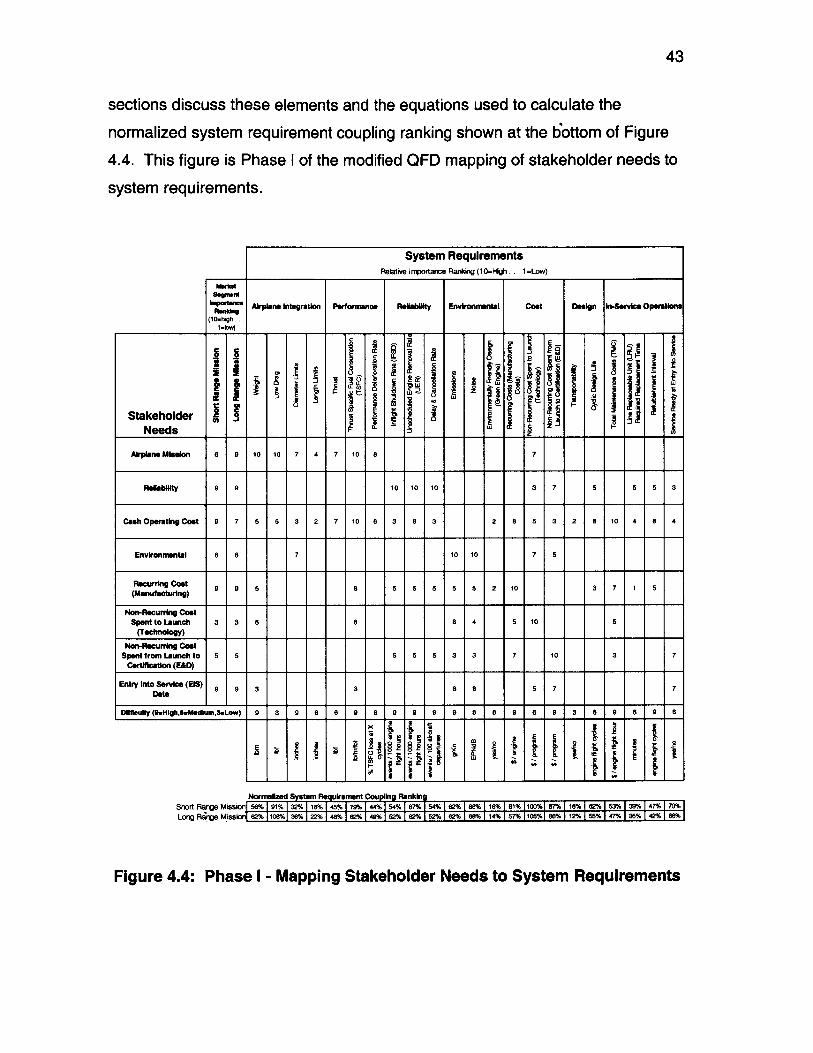
4.4.1 Mapping Stakeholder Needs to System Requirements
Various elements contributed to the mapping of stakeholder needs to
system requirements to derive the system requirement coupling ranking for
Phase I of the modified QFD mapping. These elements included the relative
importance of system requirements, stakeholder needs for different markets, and
the difficulty associated with achieving system requirements. The following
h1I
43
sections discuss these elements and the equations used to calculate the
normalized system requirement coupling ranking shown at the b'ottom of Figure
4.4. This figure is Phase I of the modified QFD mapping of stakeholder needs to
system requirements.
System RequirementsRelative Importance Ranking (10=ligh ... 1=Low)
mwkd
(10-Ngh..1=b"
Stakeholder-Needs
Ak plsne Mlsalon 8 9 10 10 7 4 7 10 8 7
RelIabIlIty 9 9 10 10 10 3 7 5 5 5 3
CashOperatingCost 9 7 5 5 3 2 7 10 8 3 8 3 2 8 5 3 2 8 10 4 8 4
Environmental 6 8 7 10 10 7 5
(Mnfatr 9g 9 5 8 5 5 5 5 5 2 10 3 7 1 5
Non-Racunring CostSpeit to Launch 3 3 8 8 8 4 5 10 5
teholdy)
CoshRecurring Cost 7 5 5 3 2 7 10 6 3 a 32 8 5 3 2 0 4 a 4
Spentcrom Launch to 5 5 5 5 5 3 3 7 10 3 7Certification (E&D) __ _
Entry Into Service (EIS) 3 3 8 5Date
Difficulty (9wHih,S=MedIum,3=Low) 9 3 9 6 8 9 6 9 9 9 9 6 8 9 8 9 3 6 9 6 9 8
:ti . t
I Ix
ii8
E
t
Nornulized Systemn Requirement Copling RnkgShari Range Missioni 58% 191% 132% 118% 145% 179% 144%154% 187% 54% 862% 188% 186% 181% 1100%187%1 18% 182%153% 139% 147% 170%
Long FtRge Misskx 82% 1108%138% 122% 148% 182% 149%152% 8 2% 152%182% 188% 114% 157% 105% 88% 112% 155%147% 135% 142% 88ff%I
Figure 4A4 Phase I - Mapping Stakeholder Needs to System Requirements
Airplane Integration
IE
Reliability In-Service OperationsPerformnence Environmentel Cost Dsn n
I
44
4.4.1.1 Relative Importance of System Requirements
The stakeholder needs and system requirements shown in Figure 4.4
were discussed in Chapters 4.3.1 and 4.3.2 respectively. System engineers
responsible for performing conceptual engine design studies were asked to rank
the relative importance of system requirements to stakeholder needs on a scale
of 1 to 10 with 1 denoting low importance and 10 denoting high importance. The
final rankings shown in Figure 4.4 were reached by consensus for the system
engineers surveyed.
The relative importance rankings answer two questions, namely (a) which
system requirements need to be met in order for a given stakeholder need to be
satisfied, and (b) how important is one system requirement relative to another in
meeting a stakeholder need. The second question of the relative importance
between system requirements and stakeholder needs is captured with a ranking
scale of 1 to 10. For example, a rank of 10 at the intersection of the thrust
specific fuel consumption requirement and airplane mission indicates that this
requirement is extremely important in meeting the need. Likewise, the thrust
specific fuel consumption requirement is equally important in meeting cash
operating cost needs with a rank of 10.
The first question of which system requirements have to be achieved to
meet a particular need is answered with a relative importance rank at the
intersection of a system requirement and a stakeholder need. Figure 4.4
illustrates that in general, a given stakeholder need is satisfied only after meeting
several system requirements. For example, the stakeholder need of airplane
mission is driven by system requirements of weight, low drag, diameter limits,
length limits, thrust, thrust specific fuel consumption, performance deterioration
rate and non-recurring cost of technology development.
4.4.1.2 Conflicts Between and Among System Requirements
More often than not, more than one system requirement is needed to
satisfy a particular stakeholder need as illustrated by the previous example of the
airplane mission. Tradeoffs between conflicting system requirements may be
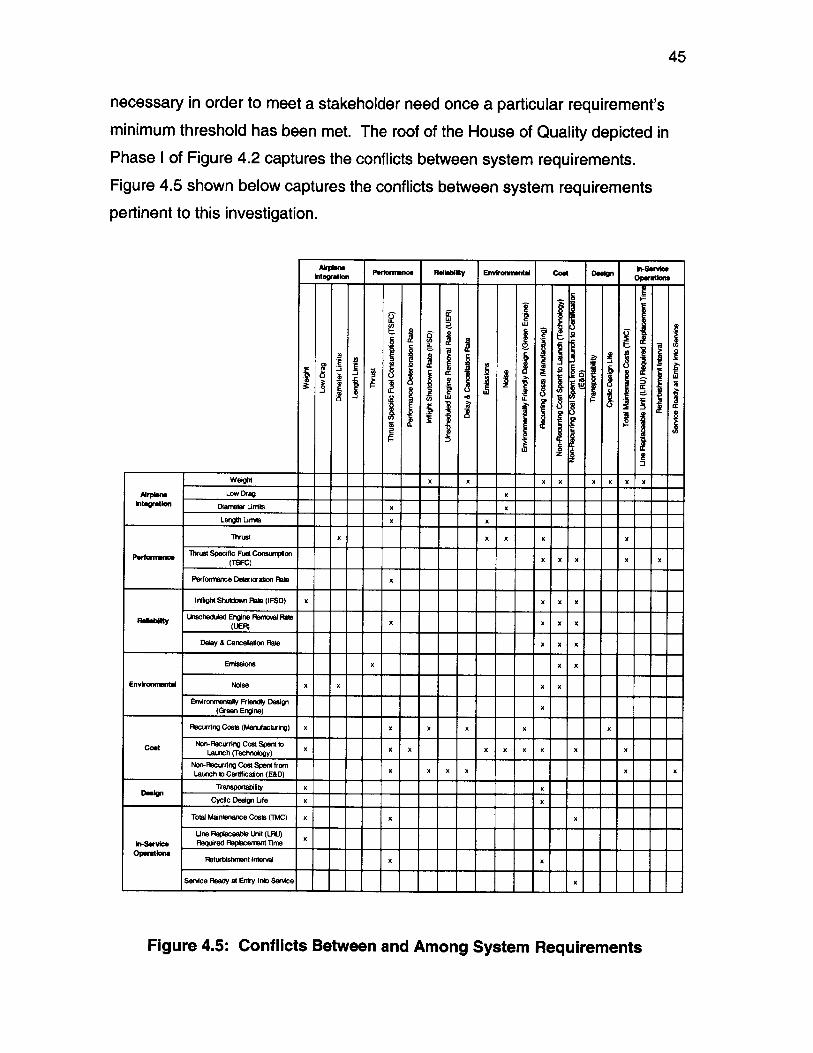
45
necessary in order to meet a stakeholder need once a particular requirement's
minimum threshold has been met. The roof of the House of Quality depicted in
Phase I of Figure 4.2 captures the conflicts between system requirements.
Figure 4.5 shown below captures the conflicts between system requirements
pertinent to this investigation.
'Performn " Refebility Enonmsnfal Coat Design flSInerto 4 " I I Operations
S
ZI
Co
2
S 5.toIL
Sa
Co
w
FIU
I
I1w
IjII
b
Ii
CI
LLIAI
1=
I5.
I
IIIi
Weight x x x x x x
Arplene Low Drag xintegrtlon Diameter Uxnits; x
LengtLh Urnits x
Thrust x x x x x
Thrust Specific Fuel CnsuIon(TSFC)
Performnce Deterioration Rale x
Infight ShudoWn Rate (IFSD) x x x x
Relmit kwaheduled Engine Renvsl RatsRelIab lIty UEJF)
Delay & Cancelation Rate x x x
Enissions x x x
Environnntal Noise x x x x
EnAronmsntey Friendly Design(Green Engine)
Recurring Costs (Manufacturing) x x x x x x
Launch (Technology) I I I I I INon-Rcrng Coat Spentfromx x x x x xLaunch toCertification(E&D)__
Transportabilty x x
Cyclic Design Life x x
Total Maintenance Costs (TMC) x x x
Une Rsplaceable Unit (LF)In-Service Required Raplacermnt TimreOperations efurbishrent Interval x x
SerAce Ready at Entry Into Serv4ce x
Figure 4.5: Conflicts Between and Among System Requirements
46
A possible scenario where system requirements might be traded off
against each other in order to meet a stakeholder need is when system
requirements of weight and recurring cost are traded off to meet airplane range,
which falls under the stakeholder need of airplane mission. Suppose that an
engine weighs more than originally intended and is predicted to burn more fuel to
meet a given range. Assuming the fuel consumption capability of the engine is
limited, a weight reduction effort may be implemented to ensure airplane range
can be met. This may necessitate the use of more exotic and higher strength
materials that weigh less than the materials currently being considered, but that
cost more to manufacture. Here, goodness is low weight, but low weight
translates into higher recurring costs, which is undesirable. The opposite is also
true in that the desire for lower recurring costs, which is goodness, can translate
into higher weight with less expensive, less exotic, lower strength materials which
is undesirable. The relationship between weight and cost is thus reflexive. This
is true for the other relationships considered in Figure 4.5. The decision of what
to do then becomes a question of the relative benefit and cost of weight versus
recurring cost.
A further complicating factor in this example is the pylon weight limit
imposed by the airplane manufacturer. This implies that the tradeoff between
weight and recurring manufacturing cost is constrained by a minimum weight
threshold. If the engine is heavier than this specified limit, there may be no
alternative in this hypothetical example but to use lighter, higher strength
materials that cost more to manufacture and then implement a cost reduction
plan. Timing is also an issue and whether or not there is sufficient development
time prior to EIS for a materials solution to be obtained. Improving fuel
consumption may also be required to resolve this requirement conflict. In this
case, both weight and fuel consumption may need to be improved
simultaneously.
47
4.4.1.3 Stakeholder Needs for Different Market Segments
The relative importance of stakeholder needs may vary depending on the
market segmentation. Traditionally, the engine market has been segmented by
airplane payload and range, with payload referring primarily to passenger
capacity and fuel carried. Figure 3.1 illustrated various airplane/engine
combinations and their passenger capacities and ranges. Although there may be
finer gradations for markets of different combinations of payload and range, this
investigation assumed two general markets consisting of short and long range
airplanes.
The relative importance of stakeholder needs for different market
segments was assessed on a 1 to 10 scale with 1 denoting low importance and
10 denoting high importance. Although four stakeholders are considered in Pratt
& Whitney's balanced scorecard approach, a single consolidated rank for each
need was chosen based on historical trends. Both marketing specialists and
value engineering experts at Pratt & Whitney were consulted for the rankings
used in this investigation.
An example of how stakeholder needs may vary according to short and
long range market segments is in the case of total maintenance cost (TMC),
which is a component of cash operating costs (COC). Engines designed for
short range missions are typically influenced more by TMC due to the greater
number of takeoff and landing cycles flown per year. In contrast, engines
designed for long range missions are driven more by the airplane mission and
the engine's fuel consumption to meet range requirements, and less by TMC.
An analogy to the automobile industry is city driving versus highway
driving. City driving with short trips is analogous to short range missions with
many takeoff and landing cycles. Highway driving is analogous to long range
missions where low fuel consumption is more important to allow the airplane to
fly its design mission without running out of fuel. Although TMC is still important
for long range missions, greater priority is placed on airplane mission needs and
range. Differences in stakeholder needs tend to drive engine design choices and
basic system architecture decisions.
48
4.4.1.4 System Requirement Difficulty and Core Competencies
Some system requirements may be perceived as harder to achieve than
others in terms of development cost and effort. For example, weight and thrust
specific fuel consumption requirements may be more difficult to achieve than the
engine's transportability or time required to replace LRU's as shown in Figure
4.4. Difficulty in achieving system requirements can certainly influence the
architecture of the design. If an organization excels in particular areas, the
system architecture and design may in turn reflect these core competencies. In
contrast, if an organization does not excel in areas important for achieving critical
requirements, it may need to develop or acquire the relevant core competencies
to be successful.
The difficulty in achieving a system requirement in this investigation was
based on the following scale:
. 9 = High Difficulty
. 6 = Medium Difficulty
. 3 = Low Difficulty
Again, Advanced Engine Programs system engineers involved in conceptual
design studies were surveyed to obtain the difficulty rankings shown in Figure
4.4. Although the difficulty in achieving a system requirement is primarily used in
the determination of the coupling effect described in the next section, ranking
each system requirement by its perceived difficulty also provides a roadmap for
guiding the development of key core competencies of the firm. The
recommendations in Chapter 7.5.1 discuss how this can be done.
4.4.1.5 Deriving the Normalized Coupling Measure
Assessing the importance relationships between system requirements and
stakeholder needs, the relative importance of market segment stakeholder
needs, and the difficulty in achieving system requirements were all used to derive
a measure of normalized coupling between system requirements and
stakeholder needs. This section explains how the normalized coupling in Phase I
was calculated.
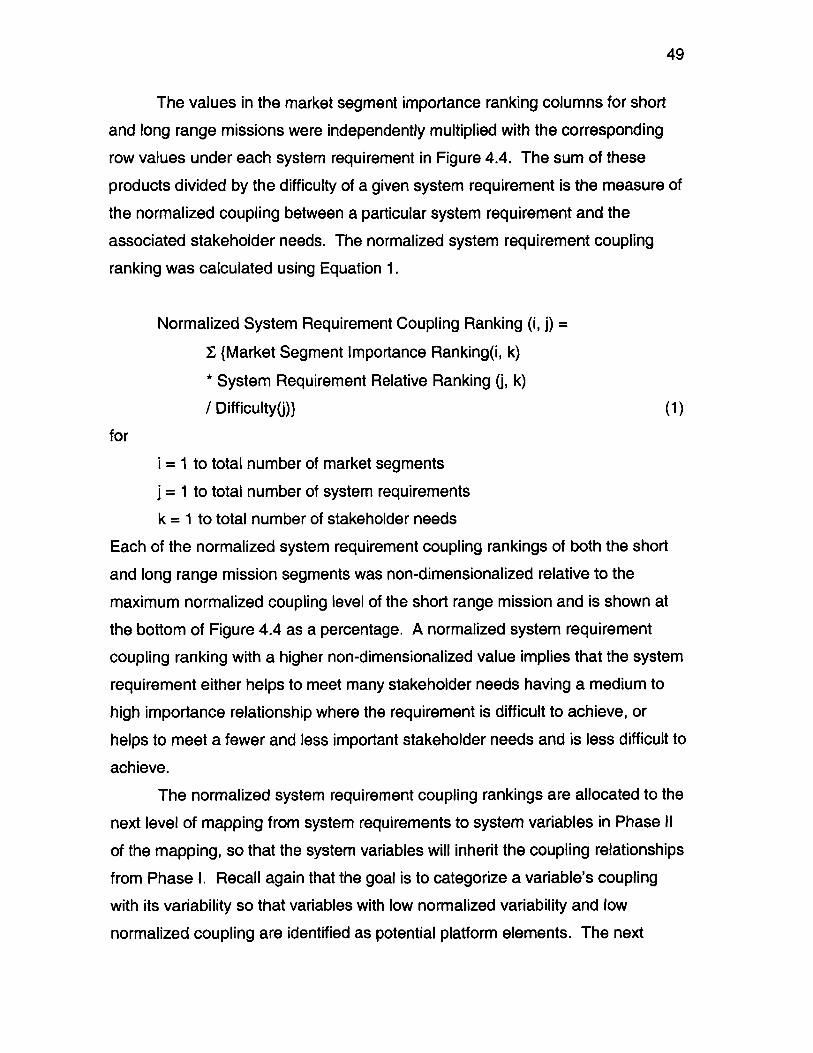
49
The values in the market segment importance ranking columns for short
and long range missions were independently multiplied with the corresponding
row values under each system requirement in Figure 4.4. The sum of these
products divided by the difficulty of a given system requirement is the measure of
the normalized coupling between a particular system requirement and the
associated stakeholder needs. The normalized system requirement coupling
ranking was calculated using Equation 1.
Normalized System Requirement Coupling Ranking (i, j) =
I {Market Segment Importance Ranking(i, k)
* System Requirement Relative Ranking (j, k)
/ Difficulty(j)} (1)
for
i = 1 to total number of market segments
j = 1 to total number of system requirements
k = 1 to total number of stakeholder needs
Each of the normalized system requirement coupling rankings of both the short
and long range mission segments was non-dimensionalized relative to the
maximum normalized coupling level of the short range mission and is shown at
the bottom of Figure 4.4 as a percentage. A normalized system requirement
coupling ranking with a higher non-dimensionalized value implies that the system
requirement either helps to meet many stakeholder needs having a medium to
high importance relationship where the requirement is difficult to achieve, or
helps to meet a fewer and less important stakeholder needs and is less difficult to
achieve.
The normalized system requirement coupling rankings are allocated to the
next level of mapping from system requirements to system variables in Phase II
of the mapping, so that the system variables will inherit the coupling relationships
from Phase I. Recall again that the goal is to categorize a variable's coupling
with its variability so that variables with low normalized variability and low
normalized coupling are identified as potential platform elements. The next
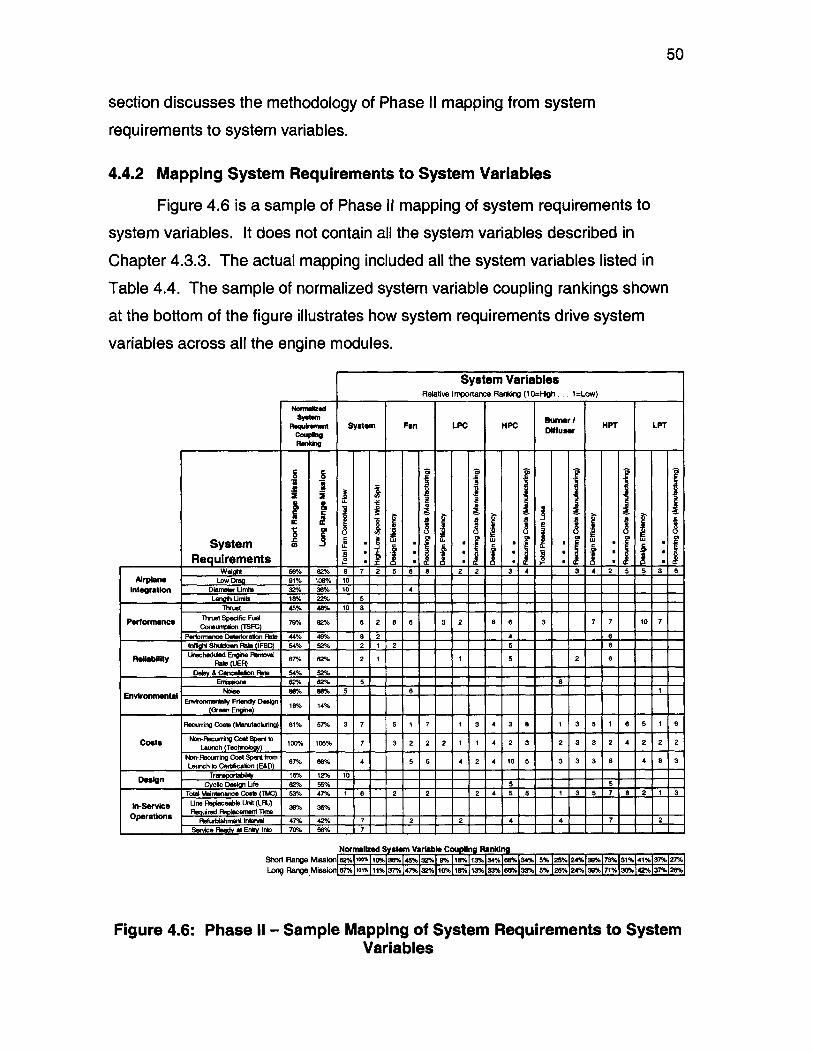
50
section discusses the methodology of Phase Il mapping from system
requirements to system variables.
4.4.2 Mapping System Requirements to System Variables
Figure 4.6 is a sample of Phase I mapping of system requirements to
system variables. It does not contain all the system variables described in
Chapter 4.3.3. The actual mapping included all the system variables listed in
Table 4.4. The sample of normalized system variable coupling rankings shown
at the bottom of the figure illustrates how system requirements drive system
variables across all the engine modules.
SystemRequirements
Nornafked
Requiement
S3
IE
S-I3
Iiis
U
System
6
System VariablesRelative Irnportance Ranking (10=1-Igh ... 1=Low)
Fan LPC HPC Burner /Diffuser
HPT
a
.2 I II.3 i
Weight 56% 62% 8 7 2 5 6 8 2 2 3 4 3 4 2 5 5 3 6Airplane Low Drag 91% 108% 10
integration Diameter Units 32% 36% 10 4_____ Length Uits 18% 22% 5
Thrust 45% 48% 10 8
Performance Thust Specific Fuel 79% 82% 6 2 8 6 3 2 8 6 3 7 7 10 7Coeun'plon (rSFC) I II I I III
Performance Deerloraion Rake 44%- 49% 8 2 4 6tnfight Shrlw Flats (I FSO) 54% 52% 2 1 2 ____ 58
RelIability Unscded Eng ne Reno 67% 62% 2 1 1 5 2 8Re~blily FRais (UEODeka & Cancelsion Pats 54% 52%
Emissions 62% 82% 5 8
Environmental Noise 88% 88% 5 8 1
Erwronmentaiy Friendly Design 18% 14%(Green Engine) I
Recurring Cosle (Mnufacturing) 61% 57% 3 7 5 1 7 1 3 4 3 8 1 3 5 1 6 5 1 6
Costs Non-ecwng CostSpent> 100% 105% 7 3 2 2 2 1 1 4 2 3 2 3 3 2 4 2 2 2Launch (Technology)I
N -ecurring CostSpentfrom 67% 88% 4 5 5 4 2 4 10 5 3 3 3 8 4 8 3__ _ __ _ _ Launch t Certfic aion (E&D) _ _ _
Tr li 16% 12% 10Cycic Desin Life 62% 55% 5 5
Total Maidnenance Costs MC) 53% 47% 1 6 2 2 2 4 5 5 1 3 5 7 8 2 1 3
In-Service Une Replacedde Unt (Tm11e 39% 35%Operations RFlurblahment interval 47% 42% 7 2 2 4 4 7 2
Service Ready at Entry rinto 70% 88% 7
Normalized System Variable Coupling RankiShort Range Mission 82% lO%138%145%132%18%118%113%134%188% 34%15%125%124%139%173%131% 1%137%12Long Range Missionl87% 101% 137%147%132%110%118%113%133%188%133%15%125%124% 39%171% 30%142%137% 28%
Figure 4.6: Phase I1- Sample Mapping of System Requirements to SystemVariables
-Ii U
II
II
LPT
-Wr
51
The normalized system variable coupling ranking is calculated using Equation 2.
Normalized System Variable Coupling Ranking (i, m) =
I {Normalized System Requirement Coupling Ranking (i, j)* System Variable Relative Ranking (m, j)} (2)
for
i = 1 to total number of market segments
m = 1 to total number of system variables
j = 1 to total number of system requirements
As in the mapping of system requirements to stakeholder needs, the values in
the body of the matrix denote the relative importance of each system variable in
achieving the corresponding system requirement with 1 denoting low importance
and 10 denoting high importance. As in Phase 1, Advanced Engine Programs
system engineers were consulted for appropriate ranking levels.
Note that the normalized system requirement coupling rankings used in
Equation 2 and which appear as columns in Figure 4.6 are the same as the rows
at the bottom of Figure 4.4 from the Phase I mapping. This illustrates the
deployment of system requirements to system variables from Phase I to Phase II.
The normalized system variable coupling rankings of Figure 4.6 thus inherit the
coupling characteristics associated with system requirements and stakeholder
needs.
The next section discusses the methodology for Phase IlIl of the mapping
from system variables to module flowpath aerothermodynamic variables.
4.4.3 Mapping System Variables to Module Flowpath Aerothermodynamic
Variables
Figure 4.7 is a sample of Phase IllI mapping of system variables to module
flowpath aerothermodynamic variables. It does not contain all the module
flowpath aerothermodynamic variables described in Chapter 4.3.4.
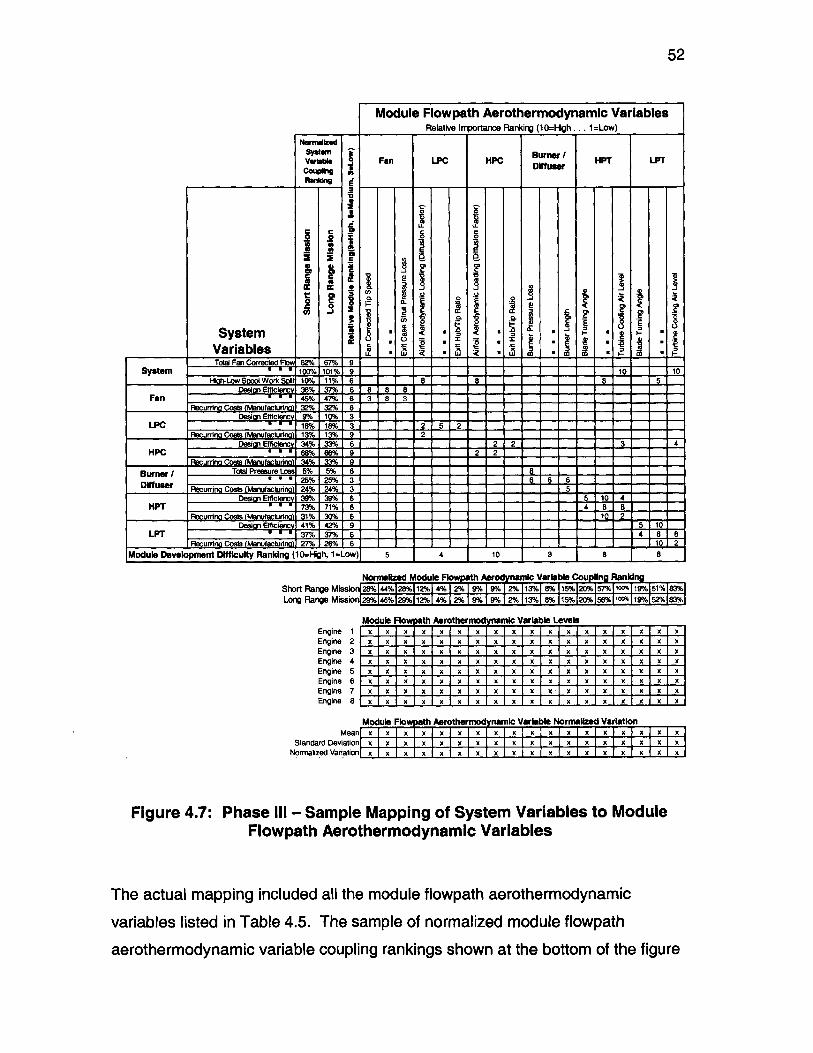
52
SystemVariablesTotal Fan Corrected
System_ -igh-Low Spool Work S 't
Desion EfficIencFan I
Recurring Costs (Manufacturina'Desian EfficIenc
LPC aRecurring Costs (Manufacturia'
HCDesio EMfcec
_ ecurring Costs (Manufcturing)
Burner /o Total Pressure LossDfume I'ecurrin Costs (Manufacturina
HIRTDesio Effic"ec
Rcrrin Cot ManufacturinaDesio Efficien,
LPT V
1 ecurrinu Costs (Manufacturina)Module Development Difffculty Ranking (I
Module Flowpath Aerothermodynamic VariablesRelative Importance Ranking (10=High ... 1=Low)
NormalftodFwr Burner / HPTvarhbm Fan LPC HPC Difsr HT Lr
Couplng ADiffuserRaning
-- 0
A2 8 iC 2c
.C (_ 10..
- --
62% 67% 9100% 101% 9 1 1 10 1010% 11% 6 -8 8 8 536% 37% 6 8 8 845% 47% 6 3 8 3
9% 10% 318% 18% 3 2 5 213% 13% 9 234% 33% 6 2 2 1 1 3 468% 66% 9 2 234% 95% 5% 6 8
25% 25% 3 6 6 624% 24% 3 539% 39% 6 5 10 473% 71% 6 4 8 831% 30% 641% 42% 9 5---37% 37% 6 4 8 827% 26% 6 10 20=Hgh, 1=Low) 5 4 10 3 8 8
Normalized Module Flowpath Aerodynamic Variable Coupling RankingShort Range Missiol 28%144%128%112%14% 12% 15%0%157 1011%8Lnnx Qasws- UlMinjni IOWIrVI0QdoW-Ij0,q-.AV- 1 o~ 901 W IO-12 113wl awlv [igo.w. I6% i2S~1w 1%15s 2w%183%
EngineEngineEngineEngineEngineEngineEngineEngine
12345678
MeanStandard Deviation
Normalized Variation
Module Flowpath Aerothermod ynamic Variable Levelsx x x Lx x x x x x x x x x x xx x x x x x x x x x x x x x x x x xx x x x x X x x x x x x x x x x x xx x x x x x x x x x x x x x x xx x j lx x x x x x x x x x x x x x xx x x x x x x x x x x x x x x x x x
x x x x x x x x x x x x x x xx x x x x x x x f x rtxo n x ox Ix x x x x x
Module Flo pth Aerothermodynamic Variable Normalized Variationx I x x x x x x x x x x x x x x x x
1-x I x I x I x I x I x Ix I x x IxIx x x x IxI x Ix x]x I x I x I x I x I x I x I x I x I x I x I x I x I x I x I x I x x
Figure 4.7: Phase IlIl - Sample Mapping of System Variables to ModuleFlowpath Aerothermodynamic Variables
The actual mapping included all the module flowpath aerothermodynamic
variables listed in Table 4.5. The sample of normalized module flowpath
aerothermodynamic variable coupling rankings shown at the bottom of the figure
53
illustrates how system variables drive module variables across all the engine
modules. The normalized module flowpath aerothermodynamic coupling ranking
is calculated using Equation 3.
Normalized Module Flowpath Aerothermodynamic Variable
Coupling Ranking (i, n) =
{I {Normalized System Variable Coupling Ranking (i, m)
* Module Flowpath Aerothermodynamic Var. Rel. Ranking (n, m)
* Relative Module Ranking (m)}}
/ Module Development Difficulty Ranking (p) (3)
for
i = 1 to total number of market segments
n = 1 to total number of module flowpath aerothermodynamic variables
m = 1 to total number of system variables
p = 1 to total number of engine modules
4.4.3.1 Relative Importance of Module Flowpath Aerothermodynamic Variables
The values in the body of the matrix denote the relative importance of the
module flowpath aerothermodynamic variable in achieving the corresponding
system variable with 1 denoting low importance and 10 denoting high
importance. Advanced Engine Program system engineers provided initial
ranking values, which were later validated by appropriate module technical
experts.
Note that the normalized system variable coupling rankings used in
Equation 3 and which appear in the columns of Figure 4.7 are the same as the
rows at the bottom of Figure 4.6 from the Phase 11 mapping. This illustrates the
deployment of system variables to module flowpath aerothermodynamic
variables. The normalized module flowpath aerothermodynamic variable
coupling rankings of Figure 4.7 thus inherit the coupling characteristics
associated with upstream system variables, system requirements and
stakeholder needs.
54
As alluded to earlier in Chapter 3.3, the modified QFD mapping captures
coupling effects between modules. One example illustrated in Figure 4.7 is
where both HPT and LPT turbine cooling air impact HPC design efficiency, since
the source of the cooling air is the HPC.
4.4.3.2 Relative Module Ranking
Another way that the modified QFD mapping captures the coupling effect
between modules is via the relative module ranking factor. This factor captures
the impact that a particular module system variable may have relative to another
module. A good example is the case described in Chapter 4.3.3 of how the
HPT's design efficiency, with a rank of 6 in Figure 4.7, has a greater effect on the
engine's TSFC than the LPC's design efficiency, which has a rank of 3. In this
example, the relative module impact was derived from powerplant performance
influence coefficients described in Chapter 3.3. Other relative module rankings
were similarly derived from other information sources for weight, reliability,
performance deterioration, refurbishment interval, total maintenance cost, non-
recurring cost, and recurring cost as examples. The relative module ranking
used in this investigation was based on the following scale
. 9 = high relative importance
. 6 = medium relative importance
. 3 = low relative importance
4.4.3.3 Module Development Difficulty Ranking
As discussed in the introduction, the difficulty in achieving different
aspects of a product design may motivate an organization to consider platforming
these elements to leverage the resources already expended across multiple
products. For gas turbine engine design, the module development difficulty
ranking factor is used to capture this difficulty on a module by module basis.
Rankings of the assessed difficulty appear in Figure 4.7 and are based on
resources expended during recent engine development programs. A rank of 1
denotes low difficulty while a rank of 10 denotes high difficulty.
55
4.4.4 Normalized Variation
The quantification of coupling and difficulty through all 3 phases of the
modified QFD mapping is now complete. The variation in actual levels of the
selected module flowpath aerothermodynamic variables is needed in order to
validate the hypothesis that system design variables with low normalized
variation from design to design and low normalized coupling are potential
candidates as platform elements. For the purposes of this investigation, the
normalized variation of each variable for a set of designs was calculated using
Equation 4.
Normalized Variation (n) = Standard Deviation (n) / Mean (n) (4)
for
n = 1 to total number of module flowpath aerothermodynamic variables
For example, in the PW4000 case study discussed in Chapter 5, one of
the parameters analyzed is HPT turbine cooling air level. The mean and
standard deviation of HPT turbine cooling air levels is calculated for the four
PW4000 engines considered in the case study. Dividing the standard deviation
by the mean yields the normalized variation of this variable for the set of engines.
Similarly, for the 8 engine case study, normalized variation of HPT turbine
cooling air is calculated for the sample of eight parameter values.
4.4.5 Defining Boundaries for High and Low Normalized Coupling and
Variation
Once the normalized coupling and normalized variation are calculated for
the set of module flowpath aerothermodynamic variables, they can be plotted in a
manner consistent with Figure 1.1. This requires that the boundaries between
low and high normalized coupling and low and high normalized variation be
properly defined. For the purposes of this investigation, a first approximation of
the boundary defining low and high normalized coupling can be calculated using
Equation 5.
56
Normalized Coupling Arithmetic Mean (i) =
{I Normalized Module Flowpath Aerothermodynamic Variable
Coupling Ranking (i, n)} / Total Number Of Module Flowpath
Aerothermodynamic Variables (5)
for
i = 1 to total number of market segments
n = 1 to total number of module flowpath aerothermodynamic variables
This first approximation is merely the arithmetic mean of all the normalized
module flowpath aerothermodynamic variable coupling rankings shown near the
bottom of Figure 4.7.
Likewise, a first approximation of the boundary defining low and high
normalized variation was calculated using Equation 6 as the arithmetic mean of
all the module flowpath variation factors shown at the bottom of Figure 4.7 for the
engines considered in a particular sample study.
Normalized Variation Arithmetic Mean =
{I Module Flowpath Aerothermodynamic Variable Normalized
Variation (n)} / Total Number Of Module Flowpath
Aerothermodynamic Variables (6)
for
n = 1 to total number of module flowpath aerothermodynamic variables
This completes the description of the modified QFD mapping framework
that was used to determine potential platform elements for a commercial gas
turbine engine. Chapter 5 discusses the results of two case studies performed to
validate the hypothesis that module flowpath aerothermodynamic variables with
low normalized coupling and low normalized variation should be considered as
potential platform elements.
57
5 Pratt & Whitney Case Studies
To demonstrate the viability of using the modified QFD framework to
determine potential platform elements, a four-step approach was undertaken.
The first step involved surveying appropriate experts supporting conceptual
design studies for Pratt & Whitney's Advanced Engine Programs for appropriate
relative importance rankings needed to populate the QFD mappings described in
Chapter 4.4. These rankings were required to assess the coupling and difficulty
of module flowpath aerothermodynamic variables and upstream stakeholder
needs, system requirements and system variables. The second step involved
obtaining and calculating the normalized variation of values of stakeholder
needs, system requirements, system variables, and module flowpath
aerothermodynamic variables from a sample of 8 engine designs.
The third and fourth steps involved performing two case studies, one for
an 8 engine sample, and the other for a subset of engines comprising the
PW4000 family of engines. The 8 engines were chosen for their wide variety of
thrust level capability from 24,000 to 98,000 pounds for both short and long
range missions. In contrast, the PW4000 family provided thrust capabilities in
the high end range between 52,000 and 98,000 pounds, and exclusively for long
range missions on widebody airplanes. The goal of performing these two case
studies was to compare and contrast predicted platform elements in each case
and to validate that the model appropriately predicted platform elements in the
PW4000 case, where deliberate system architecture decisions were made to
platform certain elements of the engine.
Platform elements were identified by plotting normalized coupling versus
normalized variation of module flowpath aerothermodynamic variables and using
the methodology discussed in Chapter 4.4.5 to determine the boundaries
between low and high normalized coupling, and low and high normalized
variation. Potential platform elements were predicted to cluster in a region of low
normalized coupling and low normalized variation, while non platform elements in
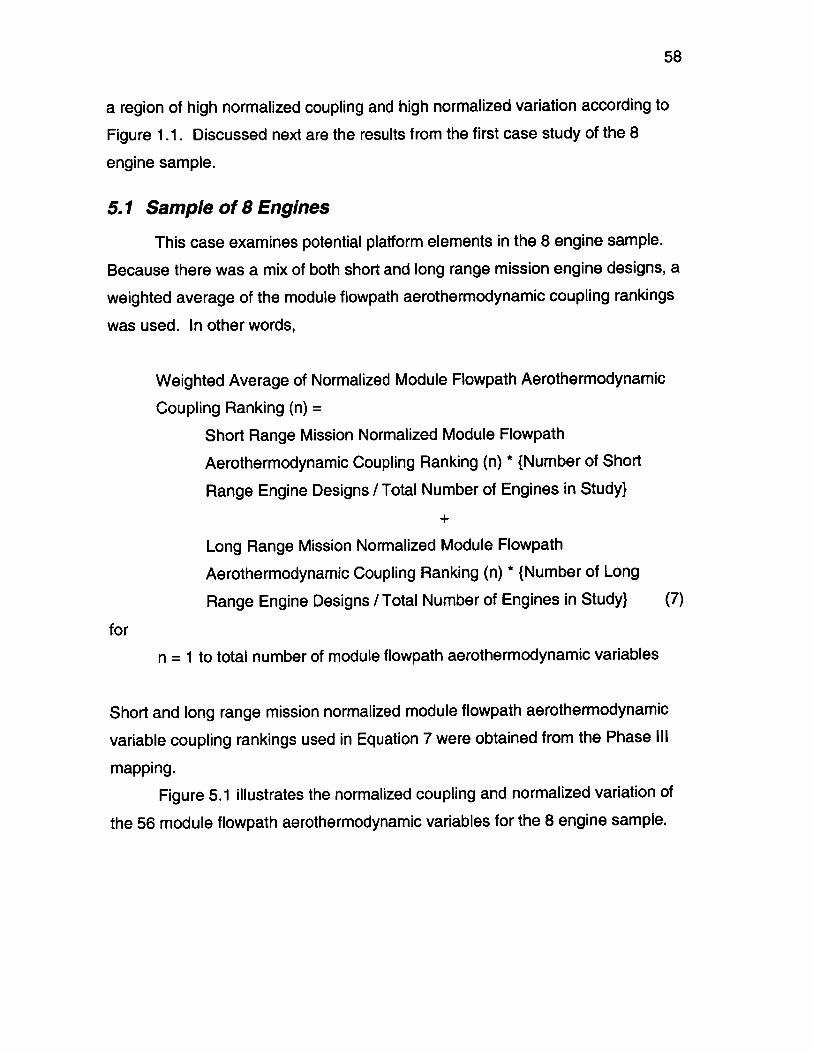
58
a region of high normalized coupling and high normalized variation according to
Figure 1.1. Discussed next are the results from the first case study of the 8
engine sample.
5.1 Sample of 8 Engines
This case examines potential platform elements in the 8 engine sample.
Because there was a mix of both short and long range mission engine designs, a
weighted average of the module flowpath aerothermodynamic coupling rankings
was used. In other words,
Weighted Average of Normalized Module Flowpath Aerothermodynamic
Coupling Ranking (n) =
Short Range Mission Normalized Module Flowpath
Aerothermodynamic Coupling Ranking (n) * {Number of Short
Range Engine Designs / Total Number of Engines in Study}
Long Range Mission Normalized Module Flowpath
Aerothermodynamic Coupling Ranking (n) * {Number of Long
Range Engine Designs / Total Number of Engines in Study} (7)
for
n = 1 to total number of module flowpath aerothermodynamic variables
Short and long range mission normalized module flowpath aerothermodynamic
variable coupling rankings used in Equation 7 were obtained from the Phase IlIl
mapping.
Figure 5.1 illustrates the normalized coupling and normalized variation of
the 56 module flowpath aerothermodynamic variables for the 8 engine sample.
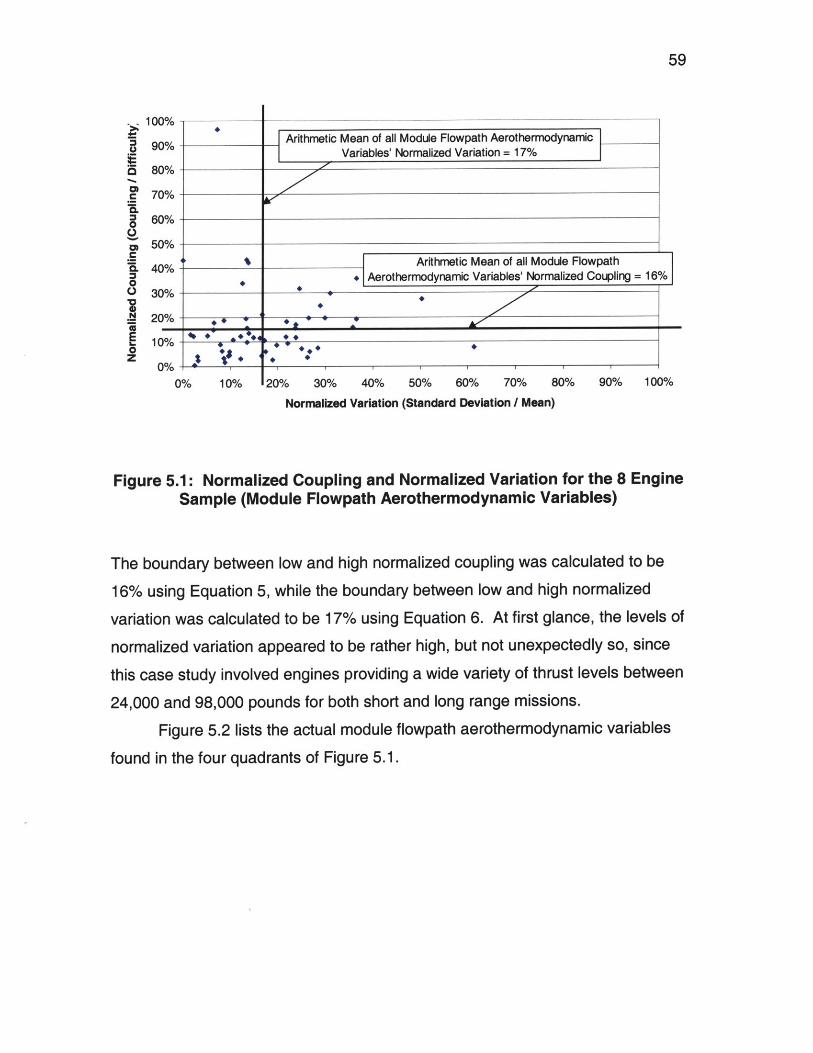
59
100%
90%
80%
70%
60%
50%
40%
30%
20%
10%
no/
Arithmetic Mean of all Module Flowpath AerothermodynamicVariables' Normalized Variation = 17%
" Arithmetic Mean of all Module Flowpath* Aerothermodynamic Variables' Normalized Coupling = 16%
0
C
02.
0% 10% 120% 30% 40% 50% 60% 70% 80% 90% 100%
Normalized Variation (Standard Deviation / Mean)
Figure 5.1: Normalized Coupling and Normalized Variation for the 8 EngineSample (Module Flowpath Aerothermodynamic Variables)
The boundary between low and high normalized coupling was calculated to be
16% using Equation 5, while the boundary between low and high normalized
variation was calculated to be 17% using Equation 6. At first glance, the levels of
normalized variation appeared to be rather high, but not unexpectedly so, since
this case study involved engines providing a wide variety of thrust levels between
24,000 and 98,000 pounds for both short and long range missions.
Figure 5.2 lists the actual module flowpath aerothermodynamic variables
found in the four quadrants of Figure 5.1.
* t . * *
60
Figure 5.2: Module Flowpath Aerothermodynamic Variable Classificationsfor the 8 Engine Sample
Design variables that appear in Quadrant I are those that the model would
recommend as platform elements because of their low normalized coupling and
low normalized variation. Recall that normalized coupling is defined as the
quotient of a particular variable's coupling and how difficult it is to achieve that
61
variable level. Elements with low coupling and low difficulty are as likely to
appear in Quadrant I as elements with high coupling and high difficulty.
Figure 5.2 shows that a large number of design variables evenly
distributed across all the engine modules appear in Quadrant I and are predicted
to be part of a platform, with no significant clustering in one particular module
versus another. In contrast, module flowpath aerothermodynamic variables in
Quadrant IV are those that the modified QFD framework would classify as non
platform elements. The high normalized variation of these parameters and their
high normalized coupling suggest that they not be considered as platform
elements and be allowed to vary as appropriate in order for each engine to meet
its particular stakeholder needs and system requirements. For example, the
number of LPC, HPC, HPT and LPT stages are Quadrant IV variables that
directly allow engine thrust variety, and as such, are correctly predicted by the
model as variables not to be platformed.
Although this case illustrates trends for why certain module flowpath
aerothermodynamic variables are not to be considered as platform elements in
Quadrant IV, there is no compelling evidence of why the variables in Quadrant I
should be considered as platform elements, especially since they are evenly
distributed across all engine modules and their average level of variation is 17%,
which seems high. In addition, it is not clear that even if these variables and their
average levels are assumed constant for a platform scenario and each engine
design is re-evaluated assuming these average levels, that each design would
still satisfy its respective stakeholder needs and system requirements. Again, the
normalized variation levels may be too high for this to be feasible.
Intuitively, the best case for platform elements is where there is no
coupling, low difficulty and no variation. Consequently, the criteria for defining an
appropriate boundary between low and high normalized coupling and normalized
variation can certainly be further refined by specifying lower arithmetic means.
However, an actual product platform implementation is needed as a benchmark
to provide the basis for this refinement. The PW4000 family of engines provides
such a benchmark perspective on an appropriate range of normalized coupling
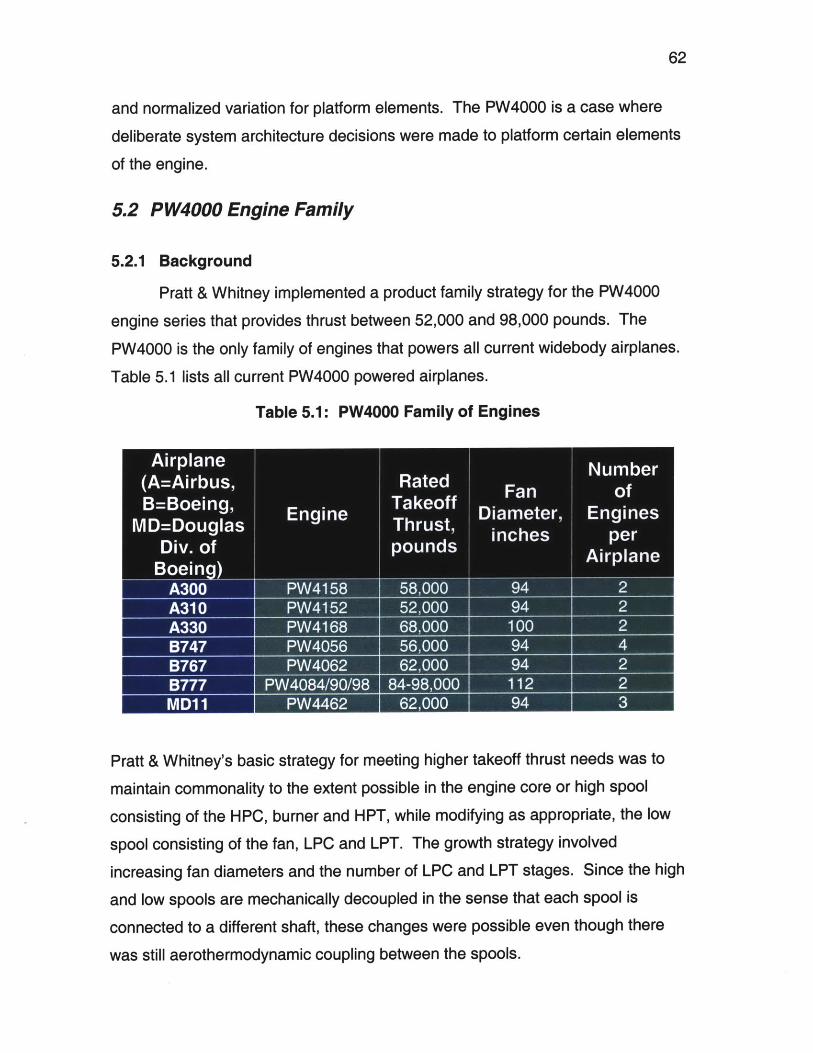
62
and normalized variation for platform elements. The PW4000 is a case where
deliberate system architecture decisions were made to platform certain elements
of the engine.
5.2 PW4000 Engine Family
5.2.1 Background
Pratt & Whitney implemented a product family strategy for the PW4000
engine series that provides thrust between 52,000 and 98,000 pounds. The
PW4000 is the only family of engines that powers all current widebody airplanes.
Table 5.1 lists all current PW4000 powered airplanes.
Table 5.1: PW4000 Family of Engines
Airplane(A=Airbus, Rated Fno
Prat Witey' ai taeyfrmeing hihero aefftrsfeeswst
maiain gt tEngine Tske Diameter, EnginesMD=Douglas Thrust' an ses perDiv. of poundsea plaisBoeing)A300 PW4158 58,000 94 2A31 0 PW4152 52,000 94 2A330 PW4168 68,000 100 2
B767 P46 2009B777 P40 4/09 84-98,000 12
Pratt & Whitney's basic strategy for meeting higher takeoff thrust needs was to
maintain commonality to the extent possible in the engine core or high spool
consisting of the HPC, burner and HPT, while modifying as appropriate, the low
spool consisting of the fan, LPC and LPT. The growth strategy involved
increasing fan diameters and the number of LPC and LPT stages. Since the high
and low spools are mechanically decoupled in the sense that each spool is
connected to a different shaft, these changes were possible even though there
was still aerothermodynamic coupling between the spools.
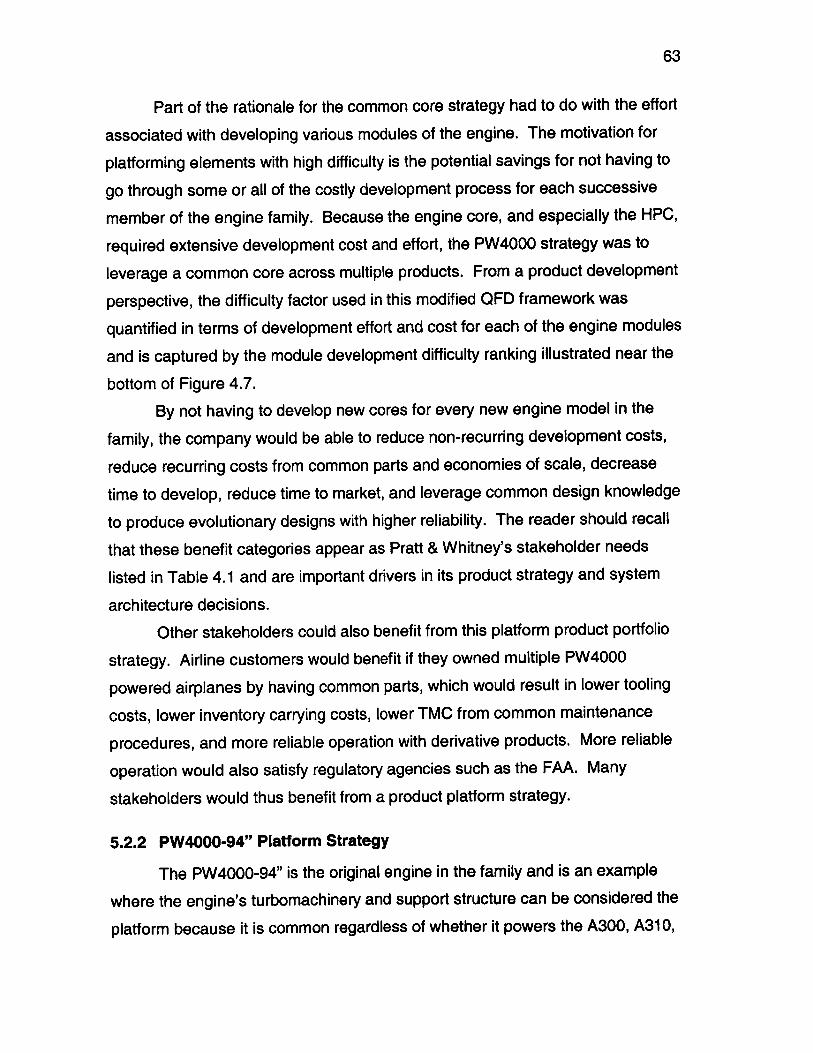
63
Part of the rationale for the common core strategy had to do with the effort
associated with developing various modules of the engine. The motivation for
platforming elements with high difficulty is the potential savings for not having to
go through some or all of the costly development process for each successive
member of the engine family. Because the engine core, and especially the HPC,
required extensive development cost and effort, the PW4000 strategy was to
leverage a common core across multiple products. From a product development
perspective, the difficulty factor used in this modified QFD framework was
quantified in terms of development effort and cost for each of the engine modules
and is captured by the module development difficulty ranking illustrated near the
bottom of Figure 4.7.
By not having to develop new cores for every new engine model in the
family, the company would be able to reduce non-recurring development costs,
reduce recurring costs from common parts and economies of scale, decrease
time to develop, reduce time to market, and leverage common design knowledge
to produce evolutionary designs with higher reliability. The reader should recall
that these benefit categories appear as Pratt & Whitney's stakeholder needs
listed in Table 4.1 and are important drivers in its product strategy and system
architecture decisions.
Other stakeholders could also benefit from this platform product portfolio
strategy. Airline customers would benefit if they owned multiple PW4000
powered airplanes by having common parts, which would result in lower tooling
costs, lower inventory carrying costs, lower TMC from common maintenance
procedures, and more reliable operation with derivative products. More reliable
operation would also satisfy regulatory agencies such as the FAA. Many
stakeholders would thus benefit from a product platform strategy.
5.2.2 PW4000-94" Platform Strategy
The PW4000-94" is the original engine in the family and is an example
where the engine's turbomachinery and support structure can be considered the
platform because it is common regardless of whether it powers the A300, A31 0,
64
B747, B767 or MD1 1. Differences in the engine design arise in external
components that interface with different airplanes such as mount locations and
air system off-takes. Variety is thus provided by externals design and the EBU
for each airplane installation, while the engine's internal turbomachinery and
support structure can be considered the platform. This platform portfolio strategy
is analogous to the topological design strategy of the Sony Walkman. In the
case of the PW4000-94", topological design changes providing product variety
are achieved via different external designs required for different airplane
applications.
In addition to the EBU, the ability of the PW4000-94" to provide thrust
variety with the same turbomachinery and support structure for different airplane
applications is accomplished by what is known as a programming plug in the
engine's full authority digital electronic control (FADEC). The modular
architecture of the FADEC and programming plug is a bus type [Ulrich, 1995] and
allows the PW4000-94" to generate between 52,000 and 62,000 pounds of thrust
with minimal physical changes to the engine. This programming plug contains
information used by the FADEC to direct appropriate engine operation depending
on the airplane installation. For example, if a pilot of a PW4152 powered A31 0
advances the throttle to full rated takeoff power, the engine will generate 52,000
pounds of static takeoff thrust. In contrast, if a pilot of a PW4056 powered B747
advances the throttle to full rated takeoff power, the engine will generate 56,000
pounds of static takeoff thrust.
The use of the programming plug to provide variety in thrust level can be
considered an enabler for a mass customization portfolio architecture, where the
programming plug is the adjustment variable that allows variety in thrust level.
This should not be confused with the topological design change platform portfolio
strategy discussed above that allows the engine to be used on different airplane
installations with different EBU's. Clearly, the PW4000-94" used a combination
of topological design change and mass customization portfolio architecture
strategies to satisfy market needs.
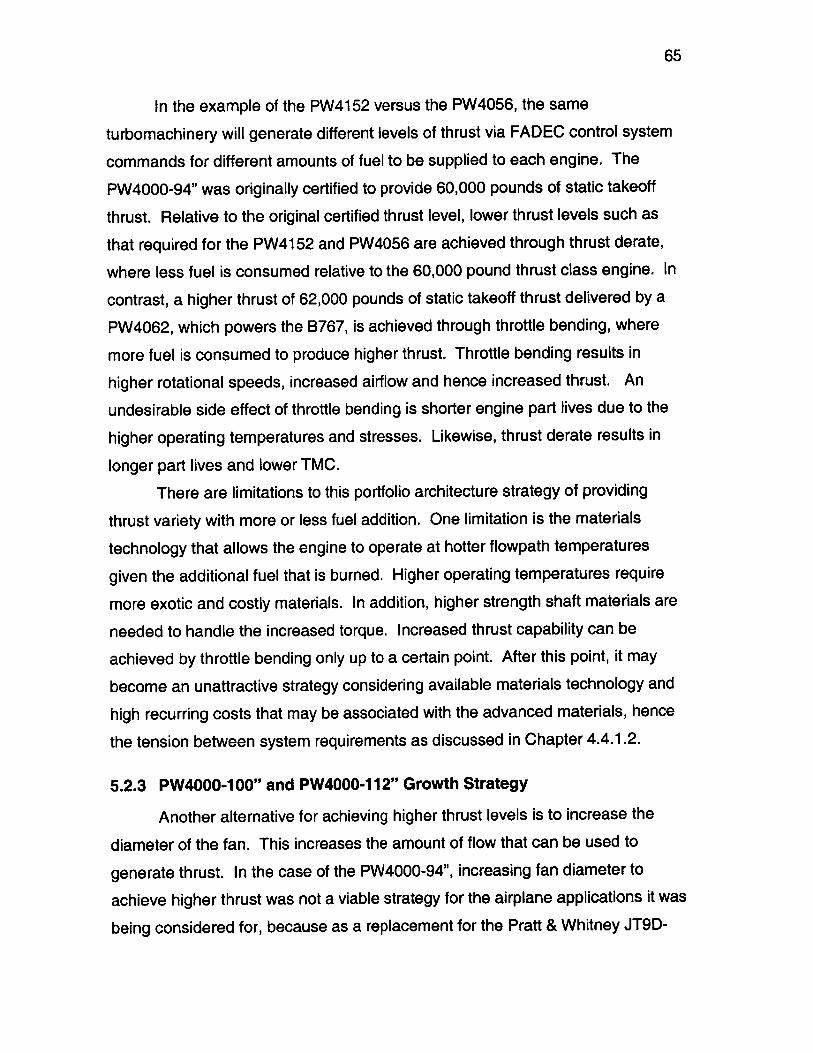
65
In the example of the PW4152 versus the PW4056, the same
turbomachinery will generate different levels of thrust via FADEC control system
commands for different amounts of fuel to be supplied to each engine. The
PW4000-94" was originally certified to provide 60,000 pounds of static takeoff
thrust. Relative to the original certified thrust level, lower thrust levels such as
that required for the PW4152 and PW4056 are achieved through thrust derate,
where less fuel is consumed relative to the 60,000 pound thrust class engine. In
contrast, a higher thrust of 62,000 pounds of static takeoff thrust delivered by a
PW4062, which powers the B767, is achieved through throttle bending, where
more fuel is consumed to produce higher thrust. Throttle bending results in
higher rotational speeds, increased airflow and hence increased thrust. An
undesirable side effect of throttle bending is shorter engine part lives due to the
higher operating temperatures and stresses. Likewise, thrust derate results in
longer part lives and lower TMC.
There are limitations to this portfolio architecture strategy of providing
thrust variety with more or less fuel addition. One limitation is the materials
technology that allows the engine to operate at hotter flowpath temperatures
given the additional fuel that is burned. Higher operating temperatures require
more exotic and costly materials. In addition, higher strength shaft materials are
needed to handle the increased torque. Increased thrust capability can be
achieved by throttle bending only up to a certain point. After this point, it may
become an unattractive strategy considering available materials technology and
high recurring costs that may be associated with the advanced materials, hence
the tension between system requirements as discussed in Chapter 4.4.1.2.
5.2.3 PW4000-1 00" and PW4000-112" Growth Strategy
Another alternative for achieving higher thrust levels is to increase the
diameter of the fan. This increases the amount of flow that can be used to
generate thrust. In the case of the PW4000-94", increasing fan diameter to
achieve higher thrust was not a viable strategy for the airplane applications it was
being considered for, because as a replacement for the Pratt & Whitney JT9D-
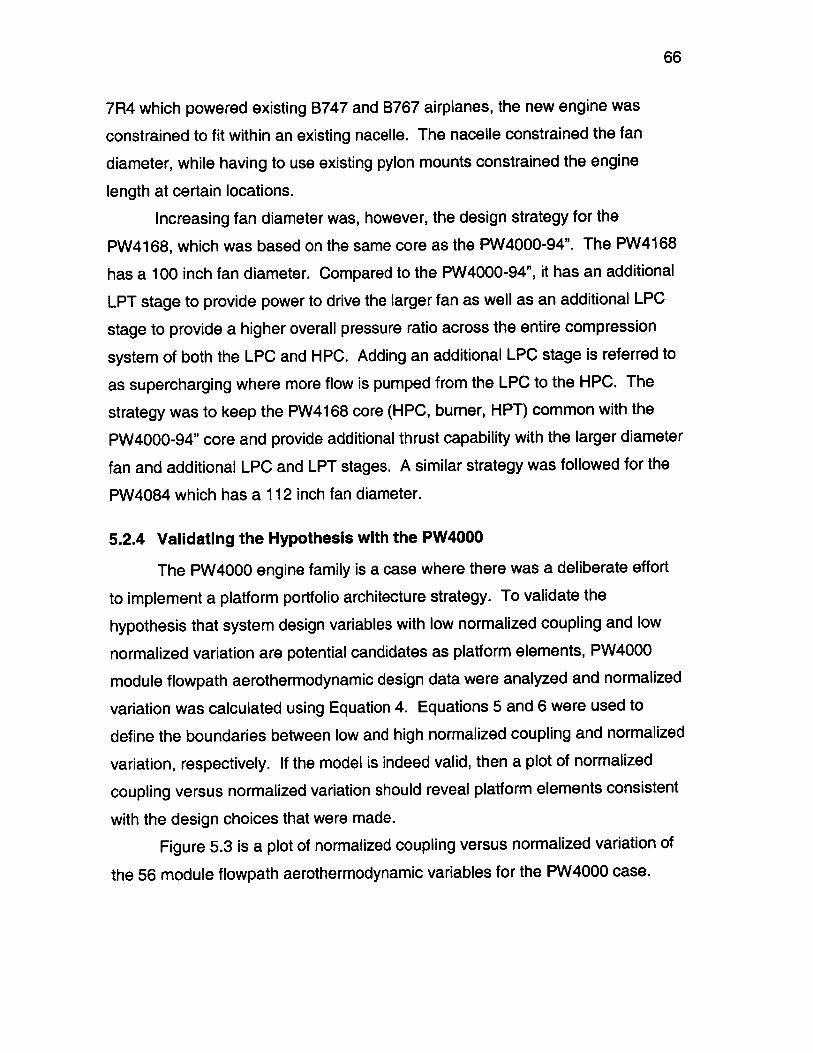
66
7R4 which powered existing B747 and B767 airplanes, the new engine was
constrained to fit within an existing nacelle. The nacelle constrained the fan
diameter, while having to use existing pylon mounts constrained the engine
length at certain locations.
Increasing fan diameter was, however, the design strategy for the
PW4168, which was based on the same core as the PW4000-94". The PW4168
has a 100 inch fan diameter. Compared to the PW4000-94", it has an additional
LPT stage to provide power to drive the larger fan as well as an additional LPC
stage to provide a higher overall pressure ratio across the entire compression
system of both the LPC and HPC. Adding an additional LPC stage is referred to
as supercharging where more flow is pumped from the LPC to the HPC. The
strategy was to keep the PW4168 core (HPC, burner, HPT) common with the
PW4000-94" core and provide additional thrust capability with the larger diameter
fan and additional LPC and LPT stages. A similar strategy was followed for the
PW4084 which has a 112 inch fan diameter.
5.2.4 Validating the Hypothesis with the PW4000
The PW4000 engine family is a case where there was a deliberate effort
to implement a platform portfolio architecture strategy. To validate the
hypothesis that system design variables with low normalized coupling and low
normalized variation are potential candidates as platform elements, PW4000
module flowpath aerothermodynamic design data were analyzed and normalized
variation was calculated using Equation 4. Equations 5 and 6 were used to
define the boundaries between low and high normalized coupling and normalized
variation, respectively. If the model is indeed valid, then a plot of normalized
coupling versus normalized variation should reveal platform elements consistent
with the design choices that were made.
Figure 5.3 is a plot of normalized coupling versus normalized variation of
the 56 module flowpath aerothermodynamic variables for the PW4000 case.
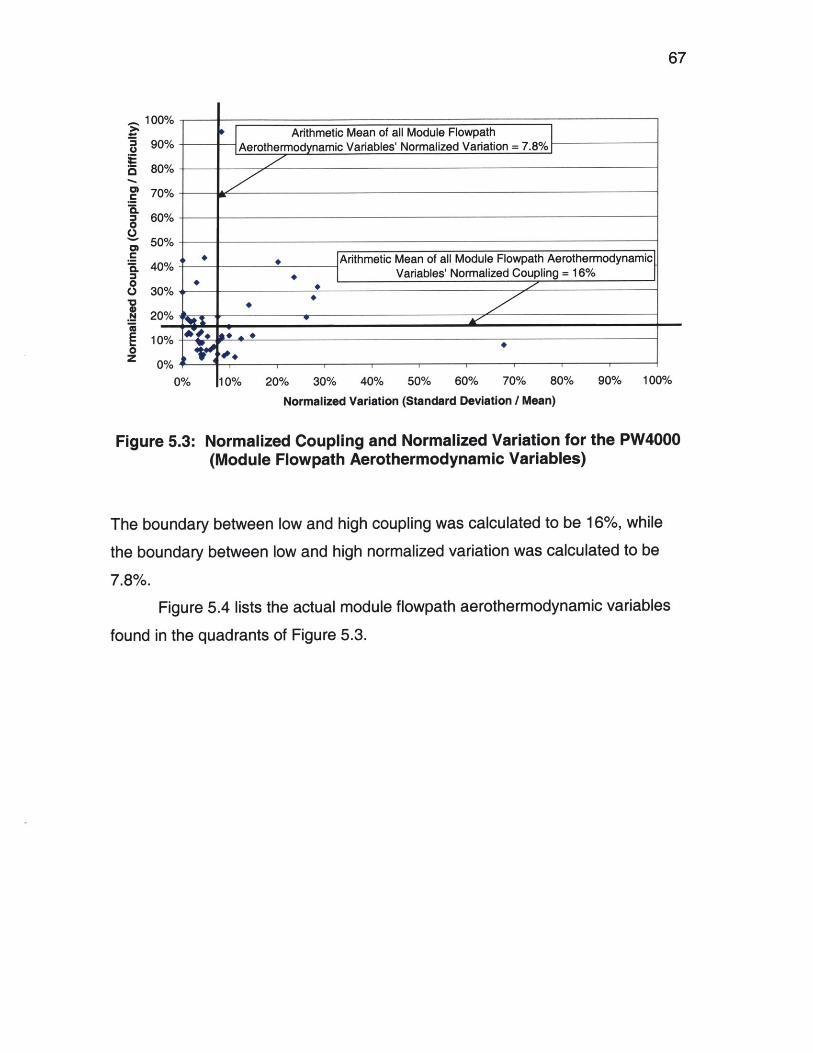
67
100%
90%
80%
70%
60%
50%
40%
30%
20%
10%
0%90% 100%
Figure 5.3: Normalized Coupling and Normalized Variation for the PW4000(Module Flowpath Aerothermodynamic Variables)
The boundary between low and high coupling was calculated to be 16%, while
the boundary between low and high normalized variation was calculated to be
7.8%.
Figure 5.4 lists the actual module flowpath aerothermodynamic variables
found in the quadrants of Figure 5.3.
10% 20% 30% 40% 50% 60% 70% 80%
Normalized Variation (Standard Deviation / Mean)
C
0
C
N
0
.5
0%
Arithmetic Mean of all Module Flowpath- -Aerothermodynamic Variables' Normalized Variation = 7.8%/
e + 4 Arithmetic Mean of all Module Flowpath Aerothermodynamic[Variables' Normalized Coupling = 16%
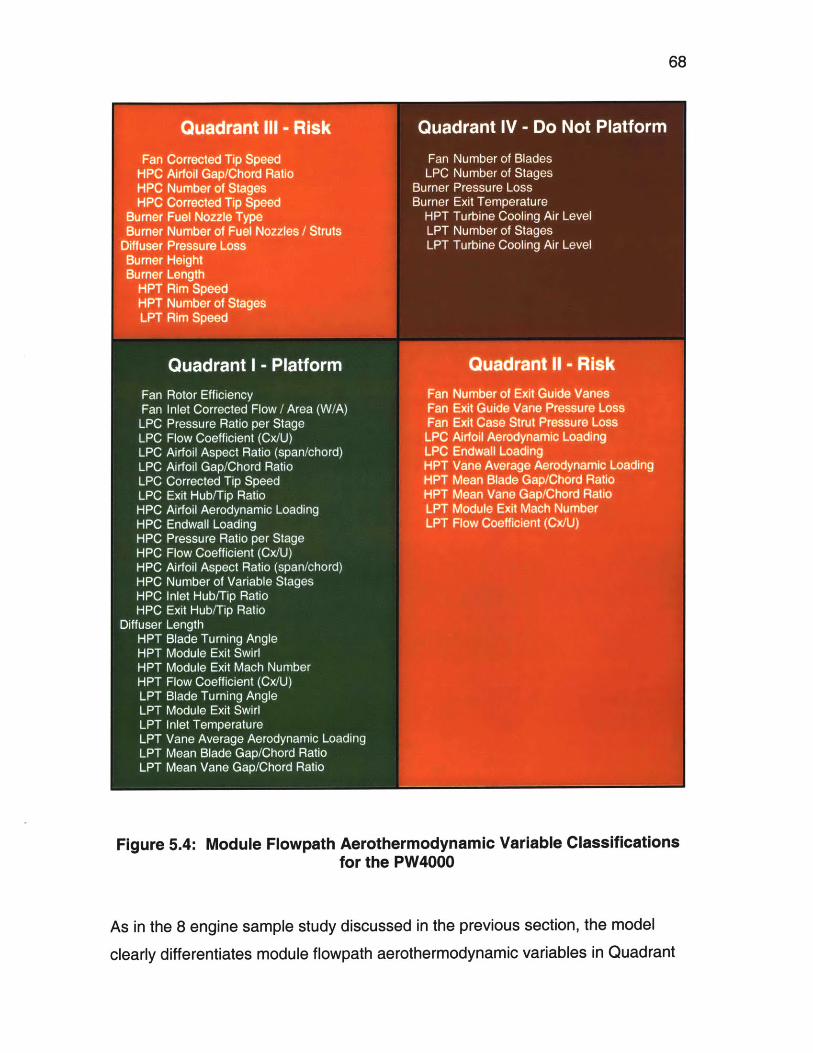
68
Figure 5.4: Module Flowpath Aerothermodynamic Variable Classificationsfor the PW4000
As in the 8 engine sample study discussed in the previous section, the model
clearly differentiates module flowpath aerothermodynamic variables in Quadrant
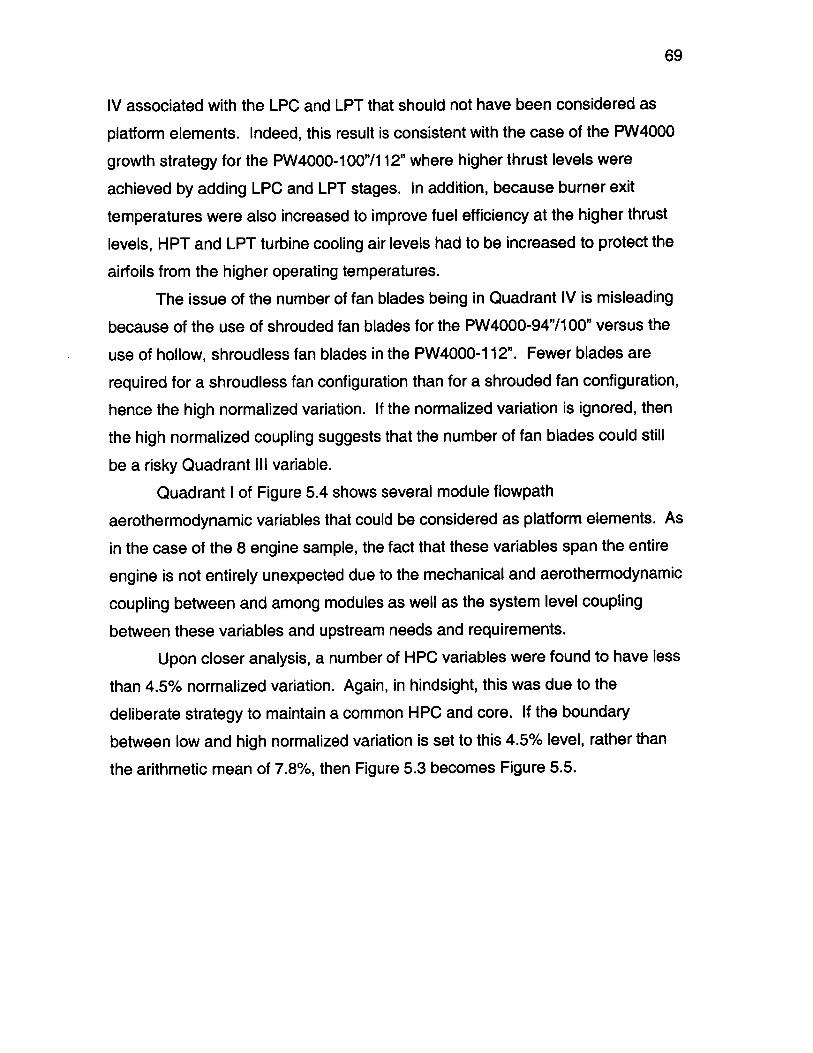
69
IV associated with the LPC and LPT that should not have been considered as
platform elements. Indeed, this result is consistent with the case of the PW4000
growth strategy for the PW4000-1 00"/112" where higher thrust levels were
achieved by adding LPC and LPT stages. In addition, because burner exit
temperatures were also increased to improve fuel efficiency at the higher thrust
levels, HPT and LPT turbine cooling air levels had to be increased to protect the
airfoils from the higher operating temperatures.
The issue of the number of fan blades being in Quadrant IV is misleading
because of the use of shrouded fan blades for the PW4000-94"/1 00" versus the
use of hollow, shroudless fan blades in the PW4000-112". Fewer blades are
required for a shroudless fan configuration than for a shrouded fan configuration,
hence the high normalized variation. If the normalized variation is ignored, then
the high normalized coupling suggests that the number of fan blades could still
be a risky Quadrant Ill variable.
Quadrant I of Figure 5.4 shows several module flowpath
aerothermodynamic variables that could be considered as platform elements. As
in the case of the 8 engine sample, the fact that these variables span the entire
engine is not entirely unexpected due to the mechanical and aerothermodynamic
coupling between and among modules as well as the system level coupling
between these variables and upstream needs and requirements.
Upon closer analysis, a number of HPC variables were found to have less
than 4.5% normalized variation. Again, in hindsight, this was due to the
deliberate strategy to maintain a common HPC and core. If the boundary
between low and high normalized variation is set to this 4.5% level, rather than
the arithmetic mean of 7.8%, then Figure 5.3 becomes Figure 5.5.
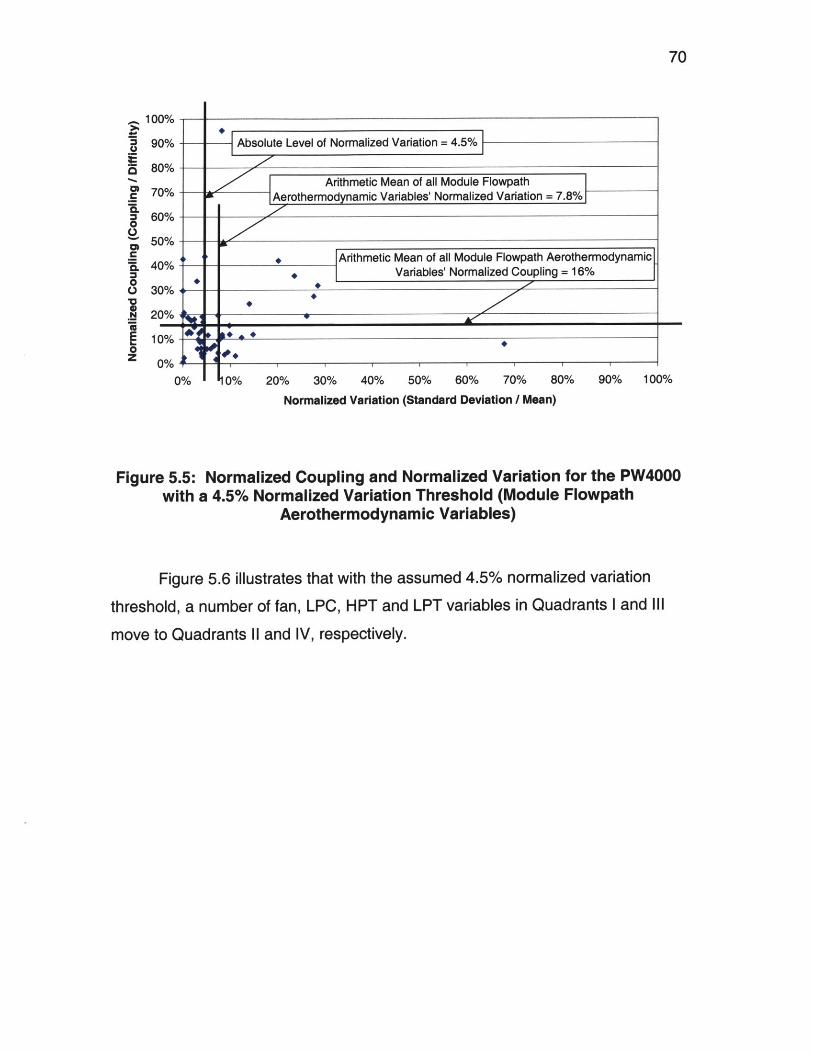
70
0I
Gb
0
E0Z
100%
90%
80%
70%
60%
50%
40%
30%
'OAO/L
10%
0%0 % 10% 20% 30% 40% 50% 60% 70% 80% 90% 100%
Normalized Variation (Standard Deviation / Mean)
Figure 5.5: Normalized Coupling and Normalized Variation for the PW4000with a 4.5% Normalized Variation Threshold (Module Flowpath
Aerothermodynamic Variables)
Figure 5.6 illustrates that with the assumed 4.5% normalized variation
threshold, a number of fan, LPC, HPT and LPT variables in Quadrants I and Ill
move to Quadrants I and IV, respectively.
---- Absolute Level of Normalized Variation = 4.5%]
Arithmetic Mean of all Module FlowpathAerothermodynamic Variables' Normalized Variatin = 1%
-- 4 Arithmetic Mean of all Module Flowpath Aerothermodynamic4 Variables' Normalized Coupling = 16%
-I
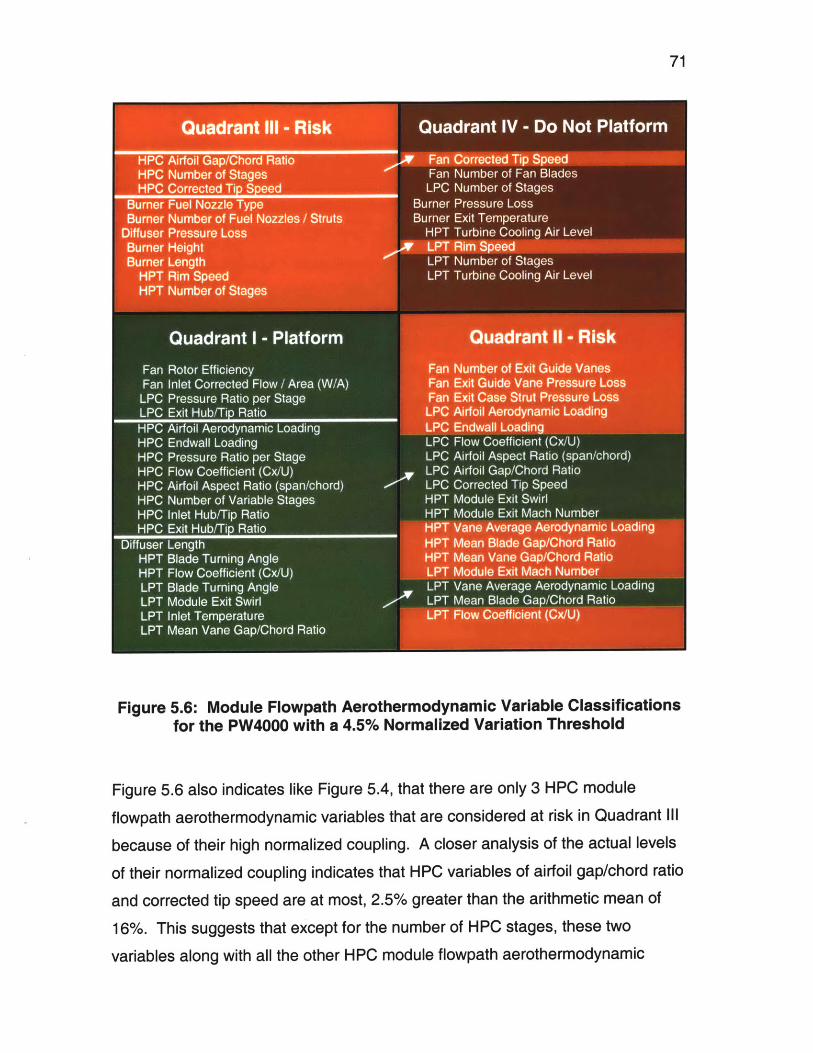
71
Figure 5.6: Module Flowpath Aerothermodynamic Variable Classificationsfor the PW4000 with a 4.5% Normalized Variation Threshold
Figure 5.6 also indicates like Figure 5.4, that there are only 3 HPC module
flowpath aerothermodynamic variables that are considered at risk in Quadrant Ill
because of their high normalized coupling. A closer analysis of the actual levels
of their normalized coupling indicates that HPC variables of airfoil gap/chord ratio
and corrected tip speed are at most, 2.5% greater than the arithmetic mean of
16%. This suggests that except for the number of HPC stages, these two
variables along with all the other HPC module flowpath aerothermodynamic
72
variables found in Quadrant 1, can be considered as platform elements with less
than 18.5% normalized coupling and less than 4.5% normalized variation. The
model thus presents compelling results which recommend that the HPC should
be the platform.
As far as the number of HPC stages, its high normalized coupling ranking
suggests that it is critical to several stakeholder needs, system requirements and
system variables. Although the number of HPC stages was kept the same for all
the PW4000 engine models, the modified QFD mapping framework predicted
that it was risky to do so, since the number of HPC stages was categorized as a
Quadrant III variable. Recall that there is risk for such a variable to move from
Quadrant IlIl to Quadrant IV due to some unanticipated growth potential or
condition. In the case of the 8 engine sample illustrated in Figure 5.2, the model
predicted that the number of HPC stages is also categorized as a Quadrant Ill
variable that should not be considered a platform variable. These two results are
consistent.
Not as many burner/diffuser and HPT variables comprising the rest of the
core appeared as predicted platform elements in Quadrant I as anticipated. The
majority of HPT variables appeared in Quadrant 11 with low normalized coupling,
but high normalized variation. A plausible explanation for this is that these
module variables acted as slack or adjustment variables for the entire core.
Recall that the HPC, burner and HPT are coupled modules that comprise the
core. Given that conditions upstream of the HPC have changed in the PW4000-
100"/112" due to supercharging with additional LPC stages and given the
strategy to keep the HPC as similar as possible, the burner and HPT tended to
act as slack modules which allowed nominal operation.
The normalized variation arithmetic mean for the PW4000 case was
nearly half that for the 8 engine sample. The trend of lower normalized variation
for the PW4000 case was expected because of the deliberate choice to platform
certain elements of the engine. The PW4000 case analysis also suggests that
an appropriate level at which to set the boundary for a platform scenario is 4.5%
for normalized variation and 18.5% for normalized coupling.
73
It is interesting to note that if the 4.5% normalized variation threshold level
is applied to the 8 engine sample, only 6 out of the 56 variables in that case are
recommended by the model to be platform elements compared to the 19 out of
56 platform variables in the PW4000 case, with 10 out of the 19 being from the
HPC. Again, the lower number of platform variables for the 8 engine sample is
expected, since no historical attempt was made to platform them.
74
6 Summary and Conclusions
This investigation was based on the premise that traditional methods for
identifying platform elements could not be appropriately applied to commercial
gas turbine engines because of the high degree of mechanical and
aerothermodynamic coupling between and among the various engine modules.
Therefore, an alternative framework was employed to quantify a truly system
level coupling, which accounted not only for mechanical and aerothermodynamic
coupling, but also coupling between design variables and both stakeholder needs
and system requirements. A modified QFD mapping process was used to
identify platform elements from among these design variables that exhibited low
normalized coupling and low normalized variation.
Actual design data from a sample of 8 Pratt & Whitney engine designs that
included the PW4000 engine family were used to exercise and validate the
model. Actual design choices in the case of the PW4000 validated model
predictions that the HPC should be considered the platform for a commercial gas
turbine engine based on the low normalized coupling and low normalized
variation of its associated module flowpath aerothermodynamic variables.
Although the burner and HPT are also considered part of the engine core along
with the HPC, the model suggests that the former modules be classified as slack
modules, whose module flowpath aerothermodynamic variables are allowed to
vary so that the engine system can meet stakeholder needs and system
requirements. Results suggest that an average normalized coupling level of less
than 18.5% and an average normalized variation level of less than 4.5% be used
to define the boundaries for potential platform elements.
The fact that model predictions agreed with the design choices made for
the PW4000 suggests that the model accurately represents Pratt & Whitney's
design philosophy. The design philosophy is captured by the importance
relationships and difficulty rankings in the modified QFD mapping. A change in
design philosophy would presumably change the normalized module flowpath
75
variable coupling rankings and perhaps predicted platform elements. The
methodology presented here can thus capture the effect of design philosophy
changes on platform recommendations.
Although the framework presented here was exercised with existing
conceptual design data and validated with historical design choices, it does
illustrate the potential for such a methodology to be used in designing new
product platforms based on stakeholder needs and system requirements. Again,
the key is to consider system design variables with low normalized coupling and
low normalized variation as potential platform elements. The next chapter
suggests how this methodology could be implemented in the conceptual design
process to determine elements of a product platform along with other
recommendations on how the strategic management of a company can influence
its product strategy.
76
7 Recommendations
Recommendations are provided for future work that may help Pratt &
Whitney refine its product strategy and design philosophy. A methodology for
using the framework presented here as a conceptual design tool for further
platform analyses is discussed. In addition, extending the analysis to include
additional QFD mappings to key support structure part characteristics and
manufacturing processes is recommended to identify platform elements at those
levels. An extension of this framework to other Pratt & Whitney business
segments such as military, small commercial and industrial gas turbine engines
is recommended to explore the potential for platform elements to be leveraged
across a wider variety of products, and not just large commercial engines.
Product platform strategy can also be viewed from the overall strategic
management of the company. It is from this perspective that other factors
influencing system architecture and product platform strategy can be analyzed.
Multi-project management is discussed as a portfolio planning strategy where
products developed concurrently can also share development resources and
platform elements. Finally, recommendations are made for strategic analyses of
the company's core competencies and in terms of Porter's five forces model.
7.1 Conceptual Design Tool
The modified QFD mapping proposed in this investigation captures the
basic design philosophy of Pratt & Whitney based on stakeholder needs and
system requirements. Stakeholders include not just Pratt & Whitney, but also
airlines, airplane manufacturers and regulatory agencies. Presumably, changes
in stakeholder needs would manifest themselves as changes in the design
philosophy and the relative importance and difficulty rankings in the modified
QFD mapping process. Assuming a constant design philosophy, the coupling
rankings can be used as a tool during the conceptual design process to evaluate
elements of new product platforms.
77
By considering actual conceptual design data for a set of new product
designs, the normalized variation for the key module flowpath
aerothermodynamic design variables identified in this investigation can be
calculated and plotted against the corresponding normalized coupling ranking as
in Figure 1.1. For potential platform elements predicted by the model, an
average or weighted average value can be calculated for each variable that will
be later used to re-evaluate the designs. An appropriate weighting factor for
each variable level, w(q), could be based on the expected number of engine
sales multiplied by some profitability factor per engine using Equation 8.
w(q) = s(q) *p(q) (8)
where
w = weighting factor
s = expected number of engines sold
p = profitability factor per engine
for
q = 1 to number of engine designs in sample study
Each of the conceptual designs would then be re-evaluated assuming a
constant weighted average platform variable level, X(r), calculated from Equation
9 to determine whether or not individual system requirements are still satisfied.
X(r) = X{x(q,r) * w(q)} / I w(q) (9)
where
X = weighted average level of module flowpath aerothermodynamic
variable
x = nominal level of module flowpath aerothermodynamic variable
for
q = 1 to number of engine designs in sample study
r = 1 to number of module flowpath aerothermodynamic variables
being considered as part of the platform
78
If system requirements cannot be met, then a negotiation process may
take place to arrive at a mutually optimal level for the particular module flowpath
aerothermodynamic variable in light of different mission constraints. If system
requirements are met, then those elements can be considered part of a platform.
An iterative process of platform analysis and re-evaluation of system
requirements can then lead to common platform elements across multiple
products.
7.2 Extensions of QFD Mapping
The modified QFD mapping methodology used in this investigation
focused on the three phases shown in Figure 4.2. Platform elements were then
investigated at Phase IlIl for module flowpath aerothermodynamic variables. In
contrast, the traditional QFD suggests two additional phases of mapping as
shown in Figure 4.1, namely for key process operations and production
requirements.
It is recommended that the modified QFD mapping introduced in this
investigation be extended to key process operations. Mapping to production
requirements which includes detailed information about quality control charts,
preventive maintenance, job instruction availability and others is not
recommended because this information is geared towards managing the
production process and not particularly useful for platform analyses during the
conceptual design process. The recommended mapping strategy is illustrated in
Figure 7.1.
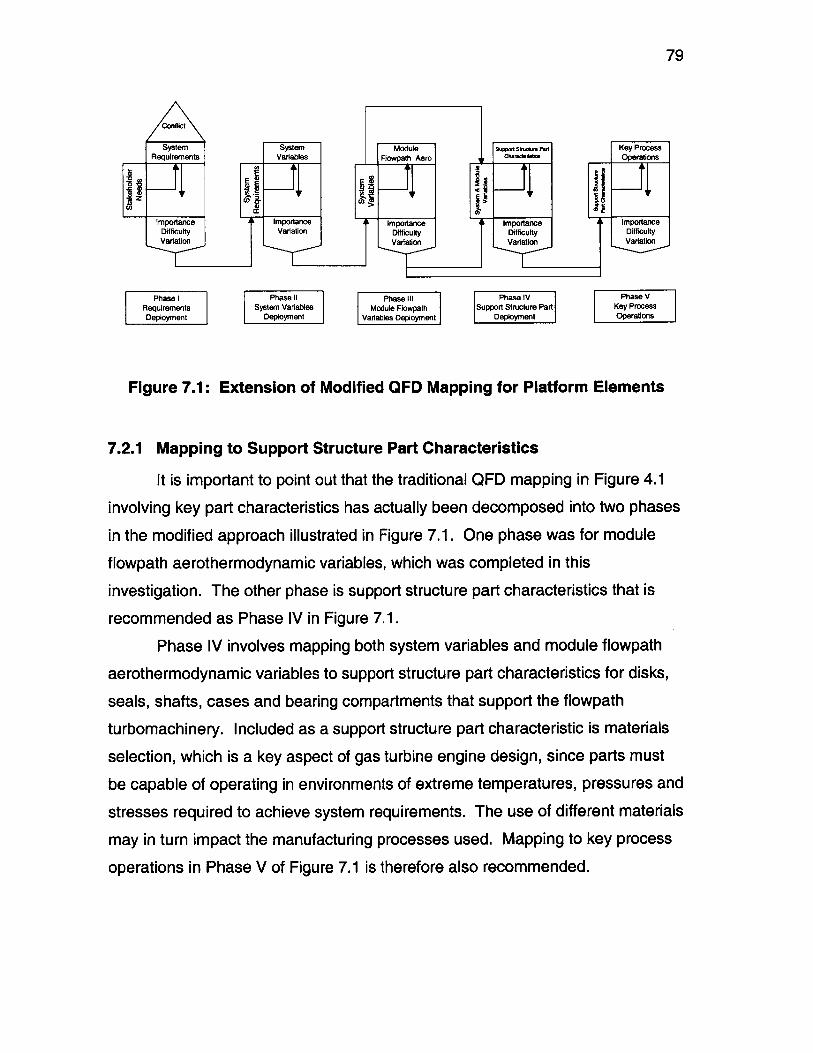
79
Conflict
System System Module supwn, soucum Part Key ProcessRequirements Varables Flowpath Aero Cho Operations
7..Capn o Supr.tutr5ar hrceitc
-- S
Importance Imp or t --I Importance L Importance g n Importancen ing key pa a tics Difficulty Difficulty Diff icultyVariation Variati T r pon variation
[eomed Phshase IV Phase IV Phase VPhRequirements I System Variables Module Flowpath Support Structure Part Key Process
elome n Deployment Variables Deployment Deployment Operations
Figure 7.1 : Extension of Modified QFD Mapping for Platform Elements
7.2.1 Mapping to Support Structure Part Characteristics
It is important to point out that the traditional QFD mapping in Figure 4.1
involving key part characteristics has actually been decomposed into two phases
in the modified approach illustrated in Figure 7.1. One phase was for module
flowpath aerothermodynamic variables, which was completed in this
investigation. The other phase is support structure part characteristics that is
recommended as Phase IV in Figure 7.1.
Phase IV involves mapping both system variables and module flowpath
aerothermodynamic variables to support structure part characteristics for disks,
seals, shafts, cases and bearing compartments that support the flowpath
turbomachinery. Included as a support structure part characteristic is materials
selection, which is a key aspect of gas turbine engine design, since parts must
be capable of operating in environments of extreme temperatures, pressures and
stresses required to achieve system requirements. The use of different materials
may in turn impact the manufacturing processes used. Mapping to key process
operations in Phase V of Figure 7.1 is therefore also recommended.
80
7.2.2 Mapping to Key Process Operations
Mapping to key process operations occurs in Phase V and involves
manufacturing processes that are required for both flowpath and support
structure parts. Because successive levels of mapping inherit coupling rankings,
the relationship between key process operations all the way back to stakeholder
needs is defined. This information is critical because it means that upstream
needs and system requirements such as TSFC, can be shown to influence
support structure characteristics such as material selection, case thicknesses,
surface treatments as well as others. Flowpath and support structure part
characteristics subsequently drive key process operations like grinding, laser
drilling, broaching and others.
A successful platform strategy will presumably include identical parts,
similar parts or a family of parts with similar key characteristics that allow them to
be manufactured with the same capital equipment and tooling. Ideally, using the
same capital equipment and tooling to produce identical or similar parts would
result in economies of scale and reduce piece part costs. Hence, having
identical or similar parts of a platform that are shared among many products can
help reduce overall recurring costs of manufacturing. The key then, is to
determine which parts or group of parts can be kept common or similar while
stakeholder needs are still satisfied. This determination can be made if the
mapping strategy shown in Figure 7.1 is followed.
7.3 Other Applications
7.3.1 Value Engineering
Although the purpose of the modified QFD mapping process in this
investigation was to serve as the framework for identifying potential platform
elements, it can also be used as it was originally intended, which is to deploy the
voice of the customer to the factory floor. In this case, it may fall under the
purview of value engineering. However, before it can be used in this way,
Phases IV and V mapping discussed in the previous section must be completed.
81
The mapping may also need to be completed on a finer scale than the system
level approach used in this investigation. For example, Phase IV mapping to
support structure part characteristics should be accomplished at the detailed
piece part level rather than on an overall module level. The same is true for key
process operations, which needs to be defined on the part level.
7.3.2 Military, Small Commercial and Industrial Engines
This investigation focused exclusively on large commercial gas turbine
engines. A similar mapping of stakeholder needs and system requirements
illustrated in Figure 7.1 can be completed for Pratt & Whitney's other business
segments, such as military engines, small commercial engines and industrial gas
turbine engines. Stakeholder needs could be so varied in these different
segments that they could drive system requirements and hence design variables
to different recommendations for what should be considered part of a platform.
However, there may be areas of similarity across large and small commercial
engines, military engines and industrial engines that could lead to a synergistic
system architecture for Pratt & Whitney's entire product portfolio. Being able to
leverage a platform across a wide variety of product offerings would provide
many benefits.
7.4 Multi-Project Management as a Portfolio Planning Strategy
Cusumano and Nobeoka [1998] performed a study of the automobile
industry and examined various aspects of multi-project management where
sharing resources as well as key common components across different product
development efforts allowed savings in development and production costs. This
represented a shift from previous trends of single-project management where
there was little sharing from one product to the next.
They discussed how multi-project management is significant in an
environment of slowing growth and lowered profits where companies can no
longer afford frequent investment in new product designs. In fact, Cusumano
and Nobeoka found that companies that utilized concurrent technology transfer
were not only able to increase their market share at a rate 2.5 times that of
82
companies that practiced sequential technology transfer, but they were also able
to achieve a 35% higher product introduction rate as well. Concurrent
technology transfer refers to the practice of platform teams sharing technology
across multiple products that are developed concurrently, while sequential
technology transfer is where one product is completed, and the next
development program begins and attempts to use elements common to the
previous product.
A good example of concurrent technology transfer at Pratt & Whitney was
the PW4168 and PW4084 development programs which overlapped in the early
1990's. Development engineers for the PW4000 program were collocated with
each other to facilitate this concurrent technology transfer. As a result, there are
many commonality aspects between the PW4168 and PW4084 engines.
Given the demonstrated benefit of multi-project management and
concurrent technology transfer, it would be worthwhile to examine similarities and
analogies between the automobile and gas turbine engine industries. One must
be aware, however, of the differences between the two industries. A few
differences are listed below for consideration.
7.4.1 Push versus Pull Market
The automobile industry can be characterized as a push industry where
automobiles are produced and pushed onto a consumer mass market. A new
automobile program is launched without necessarily having customers sign up
for firm purchases, although marketing studies would have presumably confirmed
the level of demand prior to launch. In contrast, the gas turbine engine industry
can be categorized as a pull industry where new products are introduced only
when there is sufficient demonstrated demand. Typically, a gas turbine engine
development program will be launched only after a specified number of firm
orders have been received from airline customers. Unlike automobiles,
airplane/engines are not manufactured and stored on a lot until a customer
purchases them, hence the phrase "order backlog."
83
With the gas turbine engine business being a pull type industry, it may be
challenging for a company to deliberately execute concurrent product
development for a platform strategy since program launch is contingent upon the
timing of sufficient demand. Sequential product development may occur as a
result of the lag between successive engine development programs. This may
precipitate a tendency to diverge from the basic platform and infuse the latest
technology into engines. Given these market conditions, defining and executing
a platform strategy is indeed a challenge.
7.4.2 Product Lifetime & Certification Costs
Gas turbine engine product lifetimes are on the order of twenty to thirty
years, while automobile model lifetimes are less than half that long. Life cycle
cost thus plays a key role in gas turbine engine platform strategy and design.
Because of the long product lifetimes, there may be a motivation to get the latest
technology into the engine at entry into service because it needs to last for the
next twenty to thirty years. Post certification engineering (PCE) budgets for
product improvements are limited, since the large majority of funds go into new
engine development. Product improvements after the engine is originally
certified by the FAA as flightworthy need to be re-certified before airlines are
allowed to incorporate these improvements into their fleets. Engine testing,
validation and re-certification of a product improvement is a costly process which
may motivate a divergence from a platform strategy.
7.4.3 Production Volume
Current annual commercial gas turbine engine production is on the order
of less than one thousand units for all of Pratt & Whitney's commercial gas
turbine engine offerings, while annual automobile production may be on the order
of 100-300,000 vehicles for a single model alone. There is a high level of
automated assembly for automobiles, while assembly of gas turbine engines is
entirely manual. Production levels as well as level of automated assembly will
have implications on the benefits of platform thinking.
84
7.4.4 Level of Technology Capability
Gas turbine engine technology has allowed thrust capabilities to almost
double in a span of a little over 10 years. The original PW4000-94" certified in
1986 could achieve 60,000 pounds of thrust, while the PW4098 certified in 1998
could achieve 98,000 pounds of thrust. This was due in large part to advances in
hollow, shroudless fan technology for larger diameter fans, advances in materials
technology allowing higher operating temperatures for better performance,
manufacturing processes as well as advanced analytical design tools. With such
an advancement in thrust variety, it is a challenge as well as an opportunity to
share common platform elements across these engines as discussed in this
investigation. It would be interesting to understand the level of technology
capability infused into automobiles over the recent past and how a platform
strategy emphasizing shared use is reconciled with technology advances or
improvements in new products over time.
7.5 Strategic Analysis
Perspectives related to the strategic management of the firm can also
provide insights into other factors that can influence system architecture and
product platform strategy. Discussed below are the concepts of core
competencies and Porter's five forces model.
7.5.1 Core Competencies & the Organization
The quantification of system requirement difficulty discussed in Chapter
4.4.1.4 points to the importance of identifying an organization's core
competencies [Prahalad and Hamel, 1990]. Meyer and Utterback [1993]
proposed an equally viable method for identifying a firm's core competencies
within four basic dimensions: product technology, understanding of customer
needs as reflected by products sold at that time, distribution and manufacturing.
Sustained success with a product platform strategy is fostered by the firm's
underlying core capabilities and its continuous renewal.
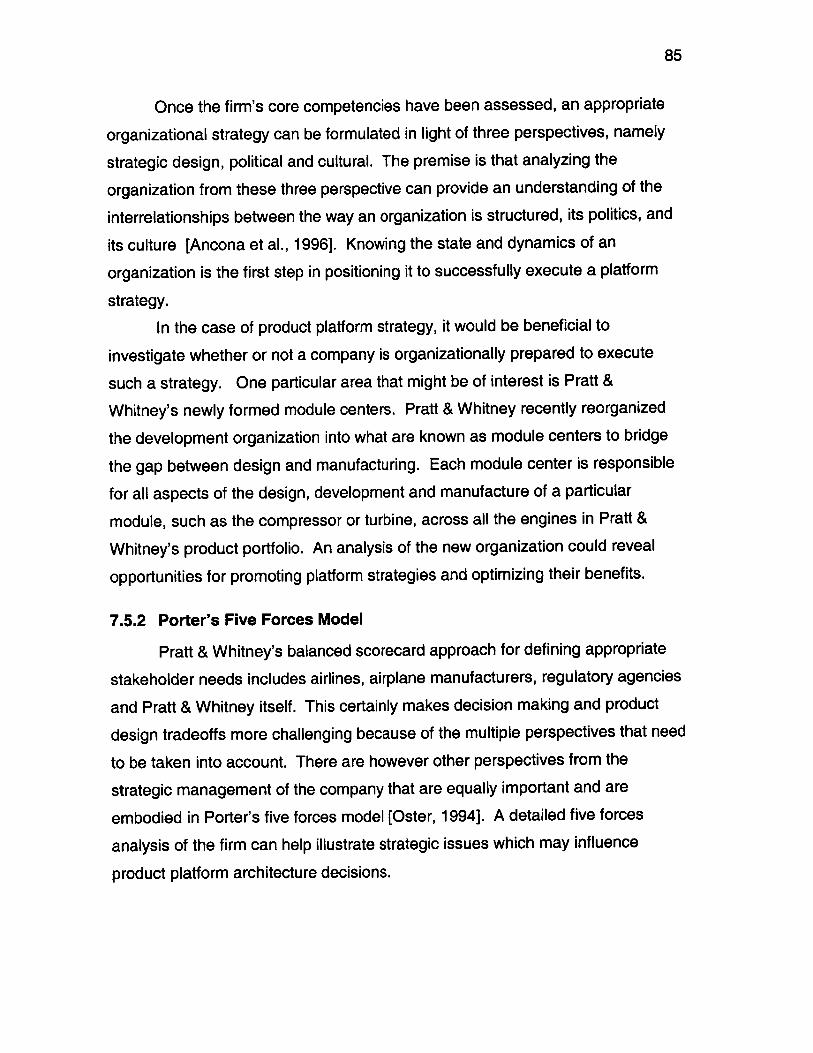
85
Once the firm's core competencies have been assessed, an appropriate
organizational strategy can be formulated in light of three perspectives, namely
strategic design, political and cultural. The premise is that analyzing the
organization from these three perspective can provide an understanding of the
interrelationships between the way an organization is structured, its politics, and
its culture [Ancona et al., 1996]. Knowing the state and dynamics of an
organization is the first step in positioning it to successfully execute a platform
strategy.
In the case of product platform strategy, it would be beneficial to
investigate whether or not a company is organizationally prepared to execute
such a strategy. One particular area that might be of interest is Pratt &
Whitney's newly formed module centers. Pratt & Whitney recently reorganized
the development organization into what are known as module centers to bridge
the gap between design and manufacturing. Each module center is responsible
for all aspects of the design, development and manufacture of a particular
module, such as the compressor or turbine, across all the engines in Pratt &
Whitney's product portfolio. An analysis of the new organization could reveal
opportunities for promoting platform strategies and optimizing their benefits.
7.5.2 Porter's Five Forces Model
Pratt & Whitney's balanced scorecard approach for defining appropriate
stakeholder needs includes airlines, airplane manufacturers, regulatory agencies
and Pratt & Whitney itself. This certainly makes decision making and product
design tradeoffs more challenging because of the multiple perspectives that need
to be taken into account. There are however other perspectives from the
strategic management of the company that are equally important and are
embodied in Porter's five forces model [Oster, 1994]. A detailed five forces
analysis of the firm can help illustrate strategic issues which may influence
product platform architecture decisions.
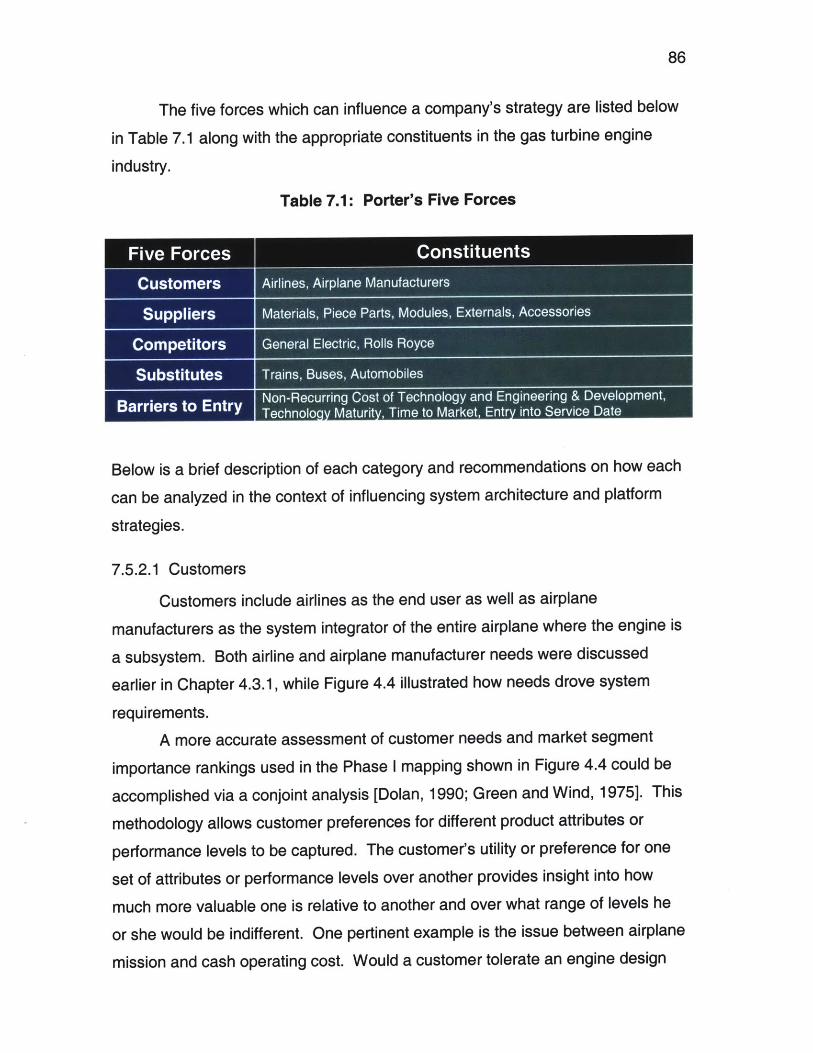
86
The five forces which can influence a company's strategy are listed below
in Table 7.1 along with the appropriate constituents in the gas turbine engine
industry.
Table 7.1: Porter's Five Forces
Five For ces Constituents
Customers Airlines, Airplane Manufacturers
Suppliers Materials, Piece Parts, Modules, Externals, Accessories
Competitors General Electric, Rolls Royce
Substitutes Trains, Buses, Automobiles
B a rIrie n t r T e ch n o l e M INrRt ,fi m o M e , E nt I nt o fvc D
Below is a brief description of each category and recommendations on how each
can be analyzed in the context of influencing system architecture and platform
strategies.
7.5.2.1 Customers
Customers include airlines as the end user as well as airplane
manufacturers as the system integrator of the entire airplane where the engine is
a subsystem. Both airline and airplane manufacturer needs were discussed
earlier in Chapter 4.3.1, while Figure 4.4 illustrated how needs drove system
requirements.
A more accurate assessment of customer needs and market segment
importance rankings used in the Phase I mapping shown in Figure 4.4 could be
accomplished via a conjoint analysis [Dolan, 1990; Green and Wind, 1975]. This
methodology allows customer preferences for different product attributes or
performance levels to be captured. The customer's utility or preference for one
set of attributes or performance levels over another provides insight into how
much more valuable one is relative to another and over what range of levels he
or she would be indifferent. One pertinent example is the issue between airplane
mission and cash operating cost. Would a customer tolerate an engine design
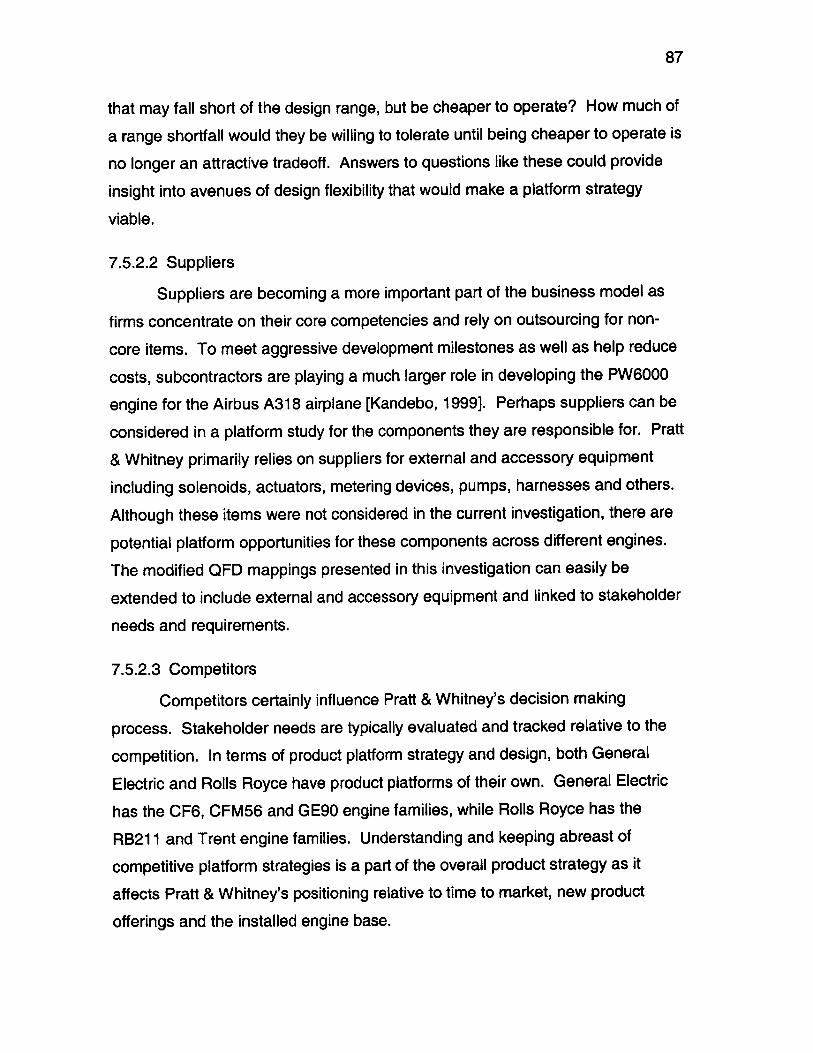
87
that may fall short of the design range, but be cheaper to operate? How much of
a range shortfall would they be willing to tolerate until being cheaper to operate is
no longer an attractive tradeoff. Answers to questions like these could provide
insight into avenues of design flexibility that would make a platform strategy
viable.
7.5.2.2 Suppliers
Suppliers are becoming a more important part of the business model as
firms concentrate on their core competencies and rely on outsourcing for non-
core items. To meet aggressive development milestones as well as help reduce
costs, subcontractors are playing a much larger role in developing the PW6000
engine for the Airbus A318 airplane [Kandebo, 1999]. Perhaps suppliers can be
considered in a platform study for the components they are responsible for. Pratt
& Whitney primarily relies on suppliers for external and accessory equipment
including solenoids, actuators, metering devices, pumps, harnesses and others.
Although these items were not considered in the current investigation, there are
potential platform opportunities for these components across different engines.
The modified QFD mappings presented in this investigation can easily be
extended to include external and accessory equipment and linked to stakeholder
needs and requirements.
7.5.2.3 Competitors
Competitors certainly influence Pratt & Whitney's decision making
process. Stakeholder needs are typically evaluated and tracked relative to the
competition. In terms of product platform strategy and design, both General
Electric and Rolls Royce have product platforms of their own. General Electric
has the CF6, CFM56 and GE90 engine families, while Rolls Royce has the
RB21 1 and Trent engine families. Understanding and keeping abreast of
competitive platform strategies is a part of the overall product strategy as it
affects Pratt & Whitney's positioning relative to time to market, new product
offerings and the installed engine base.
88
Part of the normal conceptual design process at Pratt & Whitney includes
benchmarking relative to the best in class. The traditional QFD allows one to
competitively track both stakeholder needs and requirements so that shortfalls
can easily be identified. Phase I of the modified QFD mapping presented in this
investigation can easily be expanded to track competitor levels in satisfying
stakeholder needs and system requirements.
7.5.2.4 Substitutes
Although air transportation may appear to be in a class by itself, other
forms of public transportation including trains and buses may be viable
substitutes for air travel. Three factors that may influence the degree of
substitution among planes, trains and buses are travel time, roundtrip cost and
departure frequency. A comparison of these alternatives for Monday through
Thursday travel from Hartford, Connecticut to Washington, DC are shown in
Table 7.2. Reservations offices of Southwest Airlines, Greyhound and Amtrak
were consulted for the information summarized in Table 7.2 [Southwest Airlines,
Greyhound, Amtrak].
Table 7.2: Travel Alternatives Between Hartford, CT and Washington, DC
One Way .Number oTraelSource Travel Time, RudrpDaily
Iternative hours Cost, $ Departure
Plane Southwest Airlines 1.2 88 8
Bus& f Greyhound 72
In the case of Southwest Airline's recent introduction of service between
Hartford's Bradley International Airport and Washington, DC's Baltimore-
Washington International Airport, the clear advantage to air travel is both in
shorter travel time and lower roundtrip cost. Although Greyhound offers nearly
three times as many daily departures as Southwest Airlines, the 7-hour travel
time by bus could be unattractive. At the time this research was conducted, the
... .... .. ........ ......
89
roundtrip airfare was even cheaper than either bus or train fares. In the past, this
was often not the case. Airlines lead by Southwest Airlines [Perry, 1995] who
offer frequent service with low cost fares are presenting serious competition to
buses and trains as low cost travel alternatives. Although buses and trains have
historically offered lower fares, Colleen Barrett, an executive vice president was
quoted as saying that Southwest's real competition was the automobile
[Hallowell, 1993].
As a result, airlines are increasingly driven to low cost business models to
compete with viable substitutes like buses, trains and automobiles. Many of the
larger airlines are creating subsidiaries to compete in the short haul, regional
markets. Some examples include United Airlines' United Express and Delta Air
Lines' Delta Express services. From the stakeholder needs identified in Figure
4.4, a key need for airlines is low cash operating costs which include total
maintenance costs and fuel costs. This need in turn drives the system
architecture towards low cost attributes. From a strategic analysis perspective
then, developing an understanding of a product's substitutes can help define a
system architecture that best addresses the appropriate stakeholder needs.
Issues like ultra low cost, safety and reliability for frequent short haul flights may
significantly affect an engine's system architecture. Perhaps further study of
these substitutes and identification of key attributes for comparison can be used
to develop platform concepts.
7.5.2.5 Barriers to Entry
Barriers to entry refer to what prevents a new or existing competitor from
entering a market. In the case of commercial gas turbine engines, there have
been no new single company entrants to the market for some time. However, a
number of alliances between existing players have been formed as summarized
in Table 7.3.
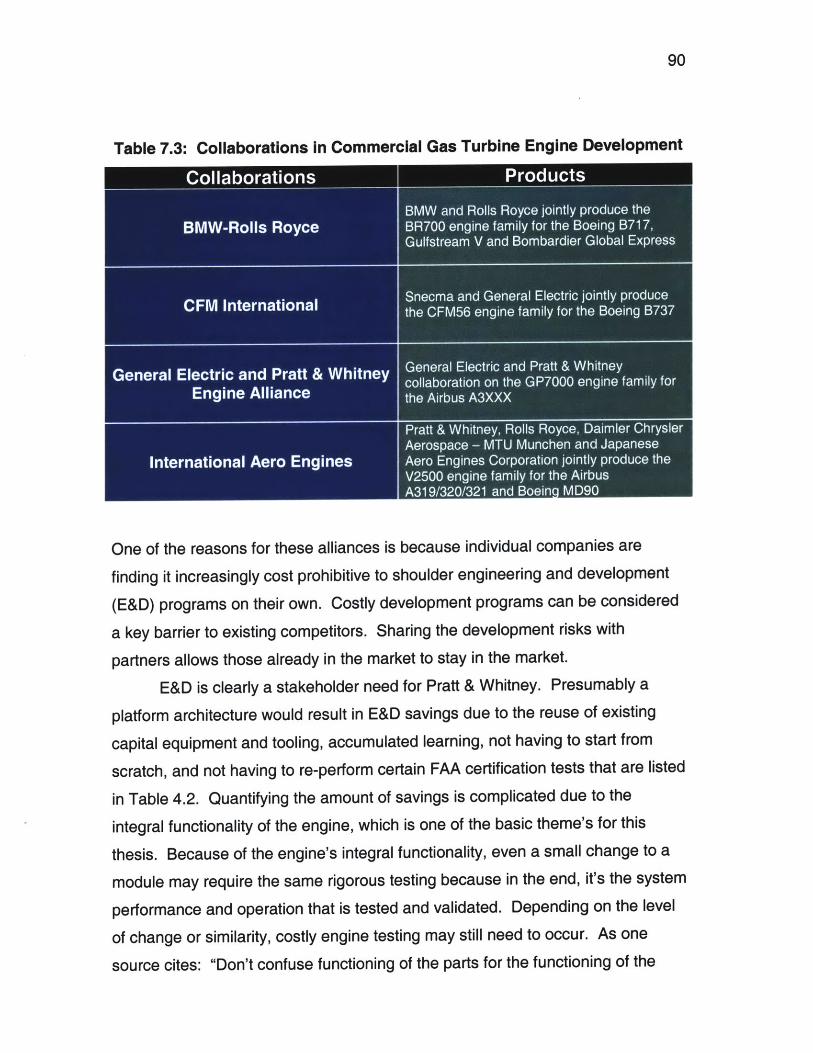
90
Table 7.3: Collaborations in Commercial Gas Turbine Engine Development
Collaborations Products
BMW and Rolls Royce jointly produce the
BMW-Rolls Royce BR700 engine family for the Boeing B717,Gulfstreamn V and Bombardier Global Express
Snecma and General Electric jointly produceCFM International the CFM56 engine family for the Boeing B737
General Electric and Pratt & Whitney Genera Eeic nd Prat n W inefiy fr
Engin Allancethe Airbus A3XXX
Pratt & Whitney, Rolls Royce, Daimler ChryslerAerospace - MTU Munchen and Japanese
International Aero Engines Aero Engines Corporation jointly produce the
V2500 engine family for the AirbusA319/320/321 and Boeing MD90
One of the reasons for these alliances is because individual companies are
finding it increasingly cost prohibitive to shoulder engineering and development
(E&D) programs on their own. Costly development programs can be considered
a key barrier to existing competitors. Sharing the development risks with
partners allows those already in the market to stay in the market.
E&D is clearly a stakeholder need for Pratt & Whitney. Presumably a
platform architecture would result in E&D savings due to the reuse of existing
capital equipment and tooling, accumulated learning, not having to start from
scratch, and not having to re-perform certain FAA certification tests that are listed
in Table 4.2. Quantifying the amount of savings is complicated due to the
integral functionality of the engine, which is one of the basic theme's for this
thesis. Because of the engine's integral functionality, even a small change to a
module may require the same rigorous testing because in the end, it's the system
performance and operation that is tested and validated. Depending on the level
of change or similarity, costly engine testing may still need to occur. As one
source cites: "Don't confuse functioning of the parts for the functioning of the
..... ......
91
system" [Rechtin and Maier, 1997]. A study to accurately quantify these savings
is thus recommended.
Time to market is another barrier to entry of an existing competitor to a
particular market. In the case of the PW4000-112", and in particular the
PW4084, this engine was the launch engine for Boeing's B777 airplane, meaning
it was the first of three competitive engines to be certified for airline operations.
This was due in large part to the platform strategy that allowed quicker time to
market with derivative engine technology. As a result, many of the early B777
sold were Pratt & Whitney powered. The sooner a competitor can come to
market and lock in engine sales, the less market remains for the other
competitors. This is especially critical given the 20-30 year product lifetimes
discussed in Chapter 7.4.2 where airlines do not necessarily order engines every
year.
Surely, the timing of technology development and insertion, product
development and entry into service have an impact on product strategy where
platforms are a way to address these timing considerations. Perhaps a study of
Pratt & Whitney's technology strategy can be completed to provide an integrated
framework of how to effectively address time to market as a barrier to entry.
92
References
Amtrak, Reservations Office, 1-800-872-7245.
Ancona, D., Kochan, T., Scully, M., Van Maanen, J. and Westney, D.E.,Managing for the Future: Organizational Behavior and Processes, South-Western College Publishing, Module 2,1996.
Boppe, Charles, "Requirement Priorities and Translation (QFD)," 16.880:Systems Engineering Class Notes, MIT System Design & Management Program,Summer, 1998.
Cohen, H., Rogers, G.F.C. and Saravanamuttoo, H.I.H, Gas Turbine Theory, 3rd
Edition, John Wiley & Sons, Inc., New York, 1987.
Cusumano, Michael A. and Nobeoka, Kentaro, Thinking Beyond Lean: HowMulti-Project Management is Transforming Product Development at Toyota andOther Companies, The Free Press, New York, 1998.
Dixon, S. L., Fluid Mechanics, Thermodynamics of Turbomachinery, 3rd Edition,Pergamon Press, New York, 1978.
Dolan, Robert J., "Conjoint Analysis: A Manager's Guide," Harvard BusinessSchool Case Number 9-590-059, 1990.
Elter, John F., "Xerox: The Role of Architecture in Product Strategy," 16.982:System Architecture Class Presentation, MIT System Design & ManagementProgram, October 2, 1998.
Gonzalez-Zugasti, J., Otto, K. and Baker, J., "A Method for Architecting ProductPlatforms with an Application to the Design of Interplanetary Spacecraft,"Proceedings of the 1998 Design Theory and Methodology Conference, ASMEDETC98/DAC-5608.
Green, Paul E. and Wind, Yoram, "New Way to Measure Consumers'Judgments," Harvard Business Review, July-August 1975.
Greyhound, Reservations Office, 1-800-231-2222.
Hagen, Dave, "What Modular Means," Ford Engineering World, 15(3),September 1990.
Hallowell, Roger H., "Southwest Airlines: 1993 (A)," Harvard Business SchoolCase Number 9-694-023, 1993.
93
Hauser, J. R. and Clausing, D., "The House of Quality," Harvard BusinessReview, May-June 1988.
http://www.faa.gov/avr/AFS/FA RS/far-33.txt
http://www.pratt-whitney.com/engines/gallery/Ig.p w4000.94cut.html
http://www.pratt-whitney.com/engines/terminology.html
Jackson, Paul, Editor in Chief, Jane's All the World's Aircraft, 1995-96, Jane'sInformation Group, Alexandria, 1995.
Jackson, Paul, Editor in Chief, Jane's All the World's Aircraft, 1997-98, Jane'sInformation Group, Alexandria, 1997.
Kandebo, Stanley W., "First PW6000 Tests Planned for July," Aviation Week andSpace Technology, McGraw-Hill, 150(23), June 7,1999, pp. 43-44.
Kaplan, Robert S. and Norton, David P., Translating Strategy into Action: TheBalanced Scorecard, Harvard Business School Press, Boston, 1996.
Krishnan, V., Singh, R and Tirupati, D., "A Model Based Approach for Planningand Developing a Family of Technology-Based Products," ManagementDepartment Working Paper, University of Texas at Austin, April 1998.
Meyer, Marc and Utterback, James M., "The Product Family and the Dynamics ofthe Core Capability," Sloan Management Review, Cambridge, 34(3), Spring1993.
Moore, W.L., Louviere, J. J. and Verma, R., "Using Conjoint Analysis to HelpDesign Product Platforms," Journal of Product Innovation Management, 16(1),1999.
Nelson, G., VanGelderen, G., Bhattacharyya, M., "Ford's Global ArchitectureProcess," 16.982: System Architecture Class Presentation, MIT System Design& Management Program, October 30,1998.
Oster, Sharon M., Modern Competitive Analysis, 2nd Edition, Oxford UniversityPress, New York, 1994.
Paula, Greg, "Reinventing a Core Product Line," Mechanical Engineering,119(10), October 1997, pp. 102-3.
Perry, Linda J., "The Response of Major Airlines to Low-Cost Airlines," TheHandbook of Airline Economics, McGraw-Hill, New York, 1995, pp. 297-304.
94
Prahalad, C. K. and Hamel, Gary, "The Core Competence of the Corporation,"Harvard Business Review, May-June 1990.
Quality Function Deployment Implementation Manual, Version 3.9, AmericanSupplier Institute, Michigan, 1989.
Rechtin, E. and Maier, M.W., The Art of Systems Architecting, CRC Press,Boston, 1997.
Roberson, Jo Ruetta, "Designing Effective Portfolio Variety Using CustomerNeed Discrimination Thresholds," Massachusetts Institute of Technology Masterof Science Thesis, May 7, 1999.
Robertson, David and Ulrich, Karl, "Planning for Product Platforms," SloanManagement Review, 39(4), Summer 1998, pp. 19-31.
Sanderson, Susan and Uzumeri, Mustafa, "Managing Product Families: TheCase of the Sony Walkman," Research Policy, 24 (1995), pp. 761-782.
Southwest Airlines, Reservations Office, 1-800-435-9792.
Ulrich, Karl, "The Role of Product Architecture in the Manufacturing Firm,"Research Policy, 24 (1995), pp. 419-40.
Yu, Janet, Gonzalez-Zugasti, Javier P. and Otto, Kevin N., "Product ArchitectureDefinition Based Upon Customer Demands," Proceedings of the 1998 DesignTheory and Methodology Conference, ASME DETC98/DTM-5679.
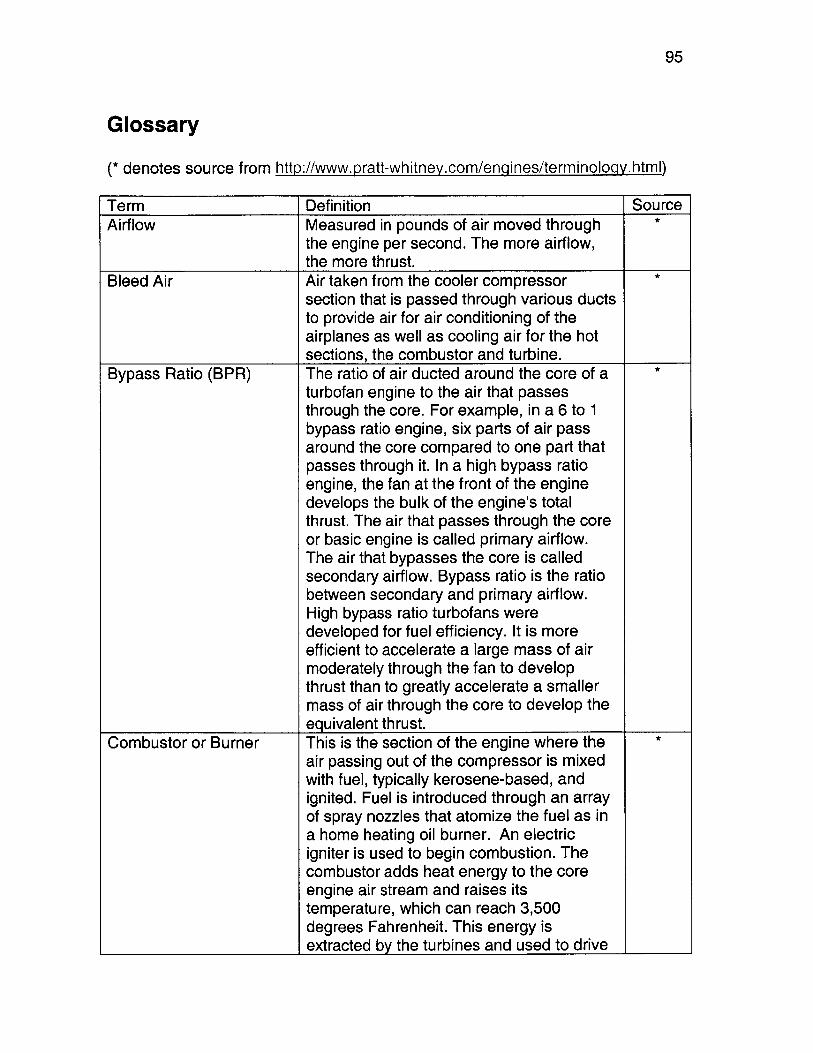
95
Glossary
(* denotes source from http://www.pratt-whitney.com/engines/terminology.html)
Term Definition SourceAirflow Measured in pounds of air moved through *
the engine per second. The more airflow,the more thrust.
Bleed Air Air taken from the cooler compressor *
section that is passed through various ductsto provide air for air conditioning of theairplanes as well as cooling air for the hotsections, the combustor and turbine.
Bypass Ratio (BPR) The ratio of air ducted around the core of a *
turbofan engine to the air that passesthrough the core. For example, in a 6 to 1bypass ratio engine, six parts of air passaround the core compared to one part thatpasses through it. In a high bypass ratioengine, the fan at the front of the enginedevelops the bulk of the engine's totalthrust. The air that passes through the coreor basic engine is called primary airflow.The air that bypasses the core is calledsecondary airflow. Bypass ratio is the ratiobetween secondary and primary airflow.High bypass ratio turbofans weredeveloped for fuel efficiency. It is moreefficient to accelerate a large mass of airmoderately through the fan to developthrust than to greatly accelerate a smallermass of air through the core to develop theequivalent thrust.
Combustor or Burner This is the section of the engine where the *
air passing out of the compressor is mixedwith fuel, typically kerosene-based, andignited. Fuel is introduced through an arrayof spray nozzles that atomize the fuel as ina home heating oil burner. An electricigniter is used to begin combustion. Thecombustor adds heat energy to the coreengine air stream and raises itstemperature, which can reach 3,500degrees Fahrenheit. This energy is
I extracted by the turbines and used to drive

96
Compressor I
the compressors and fan. Any energy notextracted by the turbines is expandedthrough the exhaust nozzle to producethrust.The combustion of fuel and air at sea levelpressure will not produce significant thrust.In order to produce thrust the air must becompressed or squeezed before the fuel isadded. In a car engine this is done by thepistons inside the engine's cylinders and isreferred to as compression ratio. In most jetengines a compressor is used. This is aseries of spinning blades that continuallycompress the engine air stream and speedit up before it enters the combustor. A wayto visualize this is to imagine a householdfan with a long shaft and several rows offan blades all turning together. As the air iscompressed, it is forced into a smaller andsmaller area as it passes through thecompressor's stages, thus raising thepressure ratio. In the automotive world thecompression ratio is typically 10-to-1. In ajet engine the compression ratio can be ashigh as 40-to-1. In most modern enginesthe compressor is divided into low pressure(LPC) and high pressure (HPC) sectionswhich run off two different shafts.
-I *
Compressor Pressure The ratio of the air pressure exiting the *Ratio compressor as compared to that entering. It
shows the amount of compression the airexperiences as it passes through thecompressor.
Cycle (Interval) Wear and tear on an engine occurs neither *
during cruising nor through flight time, buteach time high power settings are used toaccelerate and decelerate, such as duringtake off or reversing while landing. Throttlemovements change the speed of the rotor,causing fatigue. Each such high powersetting is called a cycle. The amount of timebetween inspections for wear and tear isdetermined by the number of these cycles aplane goes through, rather than the numberof hours it has been in the air.
Diffuser The diffuser is a large round structure *
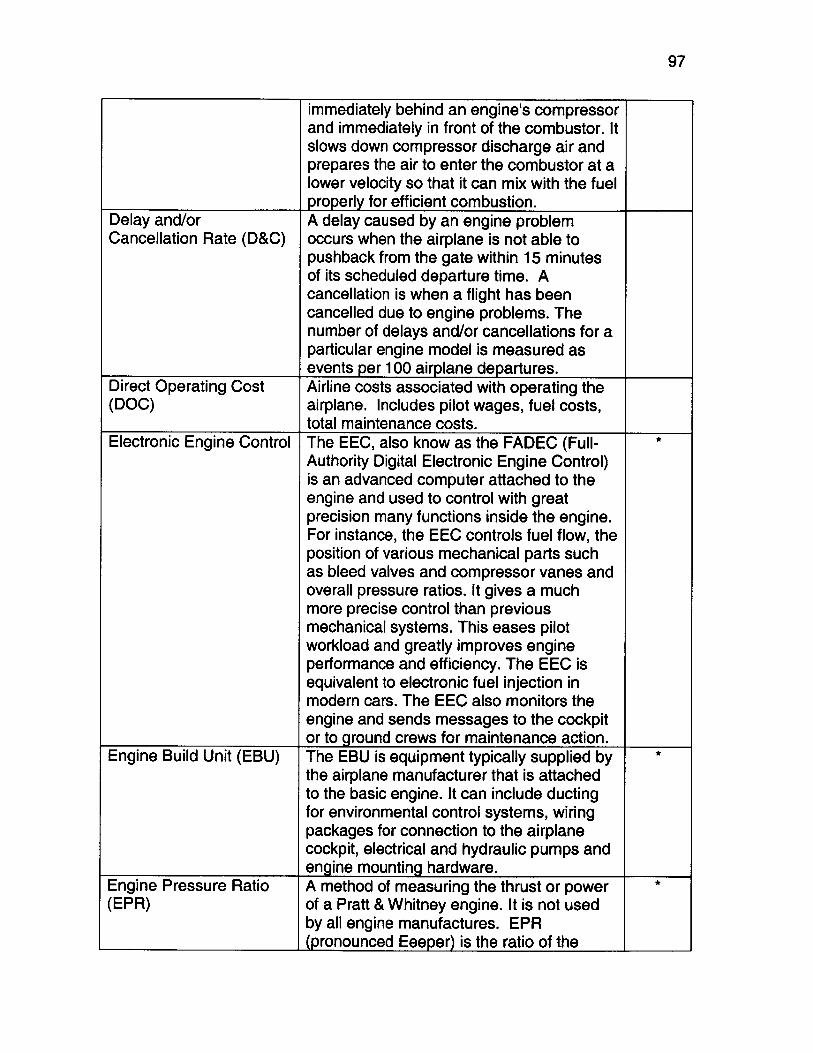
97
immediately behind an engine's compressorand immediately in front of the combustor. Itslows down compressor discharge air andprepares the air to enter the combustor at alower velocity so that it can mix with the fuelproperly for efficient combustion.
Delay and/or A delay caused by an engine problemCancellation Rate (D&C) occurs when the airplane is not able to
pushback from the gate within 15 minutesof its scheduled departure time. Acancellation is when a flight has beencancelled due to engine problems. Thenumber of delays and/or cancellations for aparticular engine model is measured asevents per 100 airplane departures.
Direct Operating Cost Airline costs associated with operating the(DOC) airplane. Includes pilot wages, fuel costs,
total maintenance costs.Electronic Engine Control The EEC, also know as the FADEC (Full- *
Authority Digital Electronic Engine Control)is an advanced computer attached to theengine and used to control with greatprecision many functions inside the engine.For instance, the EEC controls fuel flow, theposition of various mechanical parts suchas bleed valves and compressor vanes andoverall pressure ratios. It gives a muchmore precise control than previousmechanical systems. This eases pilotworkload and greatly improves engineperformance and efficiency. The EEC isequivalent to electronic fuel injection inmodern cars. The EEC also monitors theengine and sends messages to the cockpitor to ground crews for maintenance action.
Engine Build Unit (EBU) The EBU is equipment typically supplied by *
the airplane manufacturer that is attachedto the basic engine. It can include ductingfor environmental control systems, wiringpackages for connection to the airplanecockpit, electrical and hydraulic pumps andengine mounting hardware.
Engine Pressure Ratio A method of measuring the thrust or power *(EPR) of a Pratt & Whitney engine. It is not used
by all engine manufactures. EPRI (pronounced Eeeper) is the ratio of the
98
pressure of the engine air at the rear of theturbine section as opposed to the pressureof the air entering the compressor. Forinstance, in a typical wide-body commercialairplane engine, EPR might be 1.55 attakeoff and 1.39 at cruise.
Exhaust Gas The temperature of the engine's gas stream *Temperature (EGT) at the rear of the turbine. It is one of the
most critical of engine variables and is usedto monitor the mechanical integrity of theturbine section as well as the engine'soverall operating condition. A sudden rise inEGT usually indicates a problem. In amodern gas turbine EGT would typicallyrange between 1,000 degrees Fahrenheit attake off to 700 degrees at cruise.
Externals Includes components that are attached tothe engine case external to the flowpaththat are needed in fuel delivery, air flowcontrol within the flowpath, lubricationsystem, heat exchange, gearboxes.
Fan The large disc of blades, resembling an *
automobile fan, at the front of a turbofanengine. The fan takes in vast amounts of airand provides most of the engine's thrust.
Flowpath Part of the engine where air and exhaustgases travel through. Includes the fan,rotors and stators of the compressors, andblades and vanes of the turbines. Alsoreferred to as gaspath.
Full Authority Digital See EEC.Engine Control (FADEC)High Pressure See Compressor.Compressor (HPC)High Pressure Turbine See Turbine.(HPT)Indirect Operating Cost Airline costs not directly related to airplane
operations. Includes cost of delays andcancellations (putting passengers up inhotel rooms, tickets, ferrying engine back toa maintenance base, sending amaintenance crew to service the engine ata remote location away from a maintenancebase), variable passenger servicing costs,airplane servicing costs.
In-flight Shutdown Rate A measure of the reliability of an engine, *
99
(IFSD) expressed as the number of times perthousand flight hours an engine must beshut down in flight. A modernairplane/engine combination like the AirbusA330 and Boeing 777 must demonstrate anin-flight shutdown rate of .02 or lower perthousand flight hours to gain Extended TwinOperations (ETOPS) certification. This isone shutdown in 50,000 hours of flight. Innormal commercial service that equates toonce every 10 years.
Launch Customer First airline to order and operate a newairplane/engine.
Line Replaceable Unit A part or component that can be replaced *(LRU) fairly easily on the flight line at an airport.Low Pressure See Compressor.Compressor (LPC)Low Pressure Turbine See Turbine.(LPT)Mach The speed of sound is approximately 762 *
mph at sea level. Jet-powered airplanes flyat speeds measured in Mach numbers, ormultiples of the speed of sound.
Nacelle The cylindrical structure that surrounds an *
engine on the airplane. The nacelle protectsthe engine and improves aerodynamics. Itcontains the engine and thrust reverser andmany other mechanical components thatrun airplane systems. The nacelle andengines along with the EBU make up thepropulsion system.
N1 The rotational speed of the engine's low- *
pressure compressor and low pressureturbine measured in revolutions per minute(RPM).
N2 The rotational speed of the engine's high- *
pressure compressor and high pressureturbine measured in RPM.
Nozzle The rear portion of a jet engine in which the *
gases produced in the combustor areaccelerated to high velocities.
Overall Pressure Ratio The pressure ratio achieved by both the low(OPR) pressure compressor (including fan root)
and high pressure compressor.Performance Performance deterioration means that theDeterioration Rate engine has to burn more fuel to achieve the
100
same thrust level. Burning more fuelmeans that the gaspath temperatures arehotter than nominal. Although an engine iscertified to operate over a range oftemperatures, there is a limit as to how highthe gaspath temperature it is allowed tooperate. Operating above this temperaturelimit is not allowed for safety reasons.Therefore, when an engine has deterioratedto the point where its operating temperaturehas exceeded FAA certified levels, it mustbe removed and its parts replaced orrepaired.
Pounds of Thrust The measure of how much propulsion a jet *engine generates - literally, how manypounds it can move.
Surge Surge is a disturbance of the airflow *through the engine's compressor. It can becaused by a number of factors. It has alsobeen called a stall, but this is anaerodynamic stall, not like the stall in a car'sengine. In a surge the compressor bladeslose their lift, much like an airplane wingwhen it stalls. Surges occur for a widevariety of reasons and usually result in lossof power for only a fraction of a second,although they can damage an engine. Theyare sometimes accompanied by a loudbang and a puff of smoke. They have beenlikened to a car engine's backfire.
Thrust Thrust is the measurement of engine *power. Although it is difficult to equate thisdirectly with the commonly used term"horsepower," multiplying an engine'smaximum thrust rating by .62 will give arough equivalent horsepower.
Thrust Specific Fuel The pounds of fuel used per hour for each *Consumption (TSFC) pound of thrust an engine produces.Total Maintenance Cost The cost to maintain the engines, including(TMC) parts and labor. Measured in $ / engine
flight hour.Turbine The turbine consists of one or more rows of *
blades mounted on a disc or drumimmediately behind the combustor. Theturbine extracts energy from the hot gases
I coming out of the combustor. The spinning I
101
of the turbine turns the shafts which run thecompressors and the fan, as well as engineaccessories such as generators andpumps. Like the compressor, the turbine isdivided into a low- pressure and a high-pressure section. The high-pressure turbine(HPT) is closest to the combustor anddrives the high-pressure compressorthrough a shaft connecting the two. Thelow-pressure turbine (LPT) is next to theexhaust nozzle and drives the low-pressurecompressor and fan through a differentshaft. The low-pressure shaft is the longestand fits through the hollow high-pressureshaft. Temperatures at the entrance to aturbine can be as high as 3,000 degreesFahrenheit, considerably above the metal'smelting point. Complex cooling schemesare required to keep turbine blades frommelting. Many turbine airfoils are hollow socooler air can be passed through them andout hundreds of small holes in the blade. Inaddition, some blades are coated with aceramic thermal barrier.
Turbofan A term used to refer to a jet engine with a *
large fan at the front that produces most ofthe engine's thrust.
Unscheduled Engine A measure of how often a particular engine *
Removal Rate (UER) model must be removed from an airplanefor repair or refurbishment before thenormal maintenance interval or due to anunexpected engine anomaly preventing itfrom continued safe operation. Rates arequoted in terms of events per 1000 engine
I flight hours.