colour and image texture analysis in classification of commercial potato chips
TRANSCRIPT
www.elsevier.com/locate/foodres
Food Research International 40 (2007) 1146–1154
Colour and image texture analysis in classificationof commercial potato chips
Fernando Mendoza a,*, Petr Dejmek b, Jose M. Aguilera a
a Department of Chemical Engineering and Bioprocess, Pontificia Universidad Catolica de Chile, P.O. Box 306, Santiago, Chileb Department of Food Technology, Engineering and Nutrition, LTH, Chemical Center, Lund University, P.O. Box 124, 221 00 Lund, Sweden
Received 10 May 2006; accepted 19 June 2007
Abstract
The images of commercial potato chips were evaluated for various colour and textural features to characterize and classify the appear-ance and to model the quality preferences of a group of consumers. Features derived from the image texture contained better informationthan colour features to discriminate both the quality categories of chips and consumers’ preferences. Entropy of a* and V and energy ofb* from images of the total chip surface, average and variance of H and correlation of V from the images of spots and/or defects (if theyare present), and average of L* from clean images (chips free of spots and/or defects) showed the best correspondence with the four pro-posed appearance quality groups (A: ‘pale chips’, B: ‘slightly dark chips’, C: ‘chips with brown spots’, and D: ‘chips with naturaldefects’), giving classification rates of 95.8% for training data and 90% for validation data when linear discriminant analysis (LDA)was used as a selection criterion. The inclusion of independent colour and textural features from images of brown spots and/or defectsand their clean regions of chips improved the resolution of the classification model and in particular to predict ‘chips with naturaldefects’. Consumers’ preferences showed that in spite of the ‘moderate’ agreement among raters (Kappa-value = 0.51), textural featureshave potential to model consumer behaviour in the respect of visual preferences of potato chips. A stepwise logistic regression model wasable to explain 86.2% of the preferences variability when classified into acceptable and non-acceptable chips.� 2007 Elsevier Ltd. All rights reserved.
Keywords: Potato chips; Quality; Colour; Image texture; Classification; Preference
1. Introduction
One of the most important quality parameters of friedpotato products strictly related to consumer perception,is the colour (Segnini, Dejmek, & Oste, 1999). Colour iscritically appraised by consumers and often is the basisfor their selection or rejection of chips. Potato chip colouris the result of the Maillard reaction, which depends on thecontent of reducing sugars and proteins, temperature andtime of frying (Mackay, Brown, & Torrence, 1990; Mar-quez & Anon, 1986).
In potato chip manufacture the most important qualityparameters to be controlled are the intensity of darkening
0963-9969/$ - see front matter � 2007 Elsevier Ltd. All rights reserved.doi:10.1016/j.foodres.2007.06.014
* Corresponding author. Tel.: +56 2 354 4254; fax: +56 2 354 5803.E-mail address: [email protected] (F. Mendoza).
during frying, texture and crispness (Smith, 1975; Scanlon,Roller, Mazza, & Pritchard, 1994). However, there areother important factors that must be controlled to avoiddiminishing the sensorial properties and healthful qualityof potato chips. They are the amount of oil absorbed dur-ing frying and post-frying process, which can produce aslightly dark appearance of the chips and sometimes thepresence of oily or transparent regions on the surfaces.Numerous studies have shown that most of the oil is con-fined to the surface region of the fried product (Bouchon,Aguilera, & Pyle, 2003; Bouchon & Pyle, 2004; Rimac-Brncic, Lelas, Rade, & Simundic, 2004). Likewise, the pres-ence of dark and brown spots due to natural defects orinjuries in raw potatoes, which we believe that could beimmediately detected and rejected by the consumers. Con-sequently, an integral characterization of the surface of
F. Mendoza et al. / Food Research International 40 (2007) 1146–1154 1147
potato chips that identifies and quantifies those traits thatare desirable by consumers as well as defects, could providea useful tool in the quality control of the frying process.
An interesting alternative for analyzing the surface ofthe actual chips and quantifying appearance characteristicsis to use computerized image analysis techniques. Com-puter vision analysis is a non-destructive method to objec-tively measure colour patterns in non-uniformly colouredsurfaces, and also determine other physical features suchas image texture, morphological elements, and defects(Chen, Chao, & Kim, 2002; Mendoza & Aguilera, 2004).Moreover, with the advantage of superior speed, accuracy,and recent advances in hardware and software, computervision has attracted a significant amount of research aimedat replacing human inspection (Brosnan & Sun, 2002,2003). Colour sorting is a commercial reality, but quantita-tive analysis for quality control is not common.
In food research, colour is frequently represented usingL*a*b* colour space, which is an international standard forcolour measurements adopted by the Commission Interna-tionale de I’Eclairage (CIE) in 1976. L* is the luminance orlightness component that goes from 0 (black) to 100(white), and parameters a* (from green to red) and b* (fromblue to yellow) are the two chromatic components, varyingfrom �120 to +120. The system is based on the spectralsensitivity of human sight and its adaptation to prevailinglighting conditions. One of its disadvantages is that it is notintuitive. Another colour space less used in foods is HSV. Itis a user-oriented colour system based on the artist’s idea oftint, shade and tone. HSV separates colour into three com-ponents varying from 0 to 1 (when it is calculated using thefunction rgb2hsv available in Matlab�); H (hue) distin-guishes among the perceived colours, such as red, yellow,green and blue; S (saturation) refers to how much of thelight is concentrated at the hue’s specific wavelengths,respectively is made up of white light of all wavelengths;and V (value) represents the total brightness similar to L*
(Du & Sun, 2005).The meaning of the term texture in image processing is
completely different from the usual meaning of texture infoods. Image texture can be defined as the spatial organiza-tion of intensity variations in an image at various wave-lengths, such as the visible and infrared portions of thespectrum (Haralick, Shanmugam, & Dinstein, 1973).Image texture is an important aspect of images and texturalfeatures play a major role in image analysis (Li, Tan,Martz, & Heymann, 1999). These features provide sum-mary information defined from intensity maps of the scenewhich may be related to visual characteristics (coarsenessof the texture, regularity, presence of a privileged direction,etc.), and also to characteristics that cannot be visually dif-ferentiated (Basset, Buquet, Abouelkaram, Delachartre, &Culioli, 2000).
Numerous researches on the colour appearance ofpotato chips have employed colour measurements and clas-sification methods by image analysis techniques. A firststudy by Scanlon et al. (1994) used computerized video
image analysis to measure lightness of potato chips,expressed on a gray level scale. Segnini et al. (1999) devel-oped a procedure based on a video technique and imageanalysis to quantify the colour of potato chips in theL*a*b* colour space and the presence of undesirable brownspots from gray scale images. They showed that the sensi-tivity of this technique to separate colours correlated wellwith the perception of the human eye. Marique, Kharoubi,Bauffe, and Ducattillon (2003) modelled colour classifica-tion of fried potato chips by image analysis and artificialneural networks, but using gray scale images. Their resultsshowed a good agreement with human estimations, obtain-ing correlation coefficients of 0.972 for training data and of0.899 for validation data. Pedreschi, Mery, Mendoza, andAguilera (2004) used a pattern recognition approach forclassification of potato chips obtained under six differentprocessing conditions (e.g. blanching and frying tempera-ture). More than 1500 geometric and colour features (ingray level scale and L*a*b* colour space) were extractedfrom the colour digital images. Using 11 features and asimple classifier, they obtained a good classification perfor-mance in the confidence interval of 78% and 89%. How-ever, there are no studies that correlate features fromimages of commercial potato chips with colour appear-ances, defects, and preferences of consumers.
The objectives of this study were: (i) to evaluate thepotential of L*a*b*, HSV and gray scale intensities andtheir image texture information (energy, entropy, contrast,and homogeneity from each colour scale) to characterizeand to classify four quality categories of commercial potatochips, and (ii) to evaluate the capability of these extractedfeatures to characterize and to model the potato chip pref-erences of a group of consumers.
2. Materials and methods
2.1. Samples of potato chips
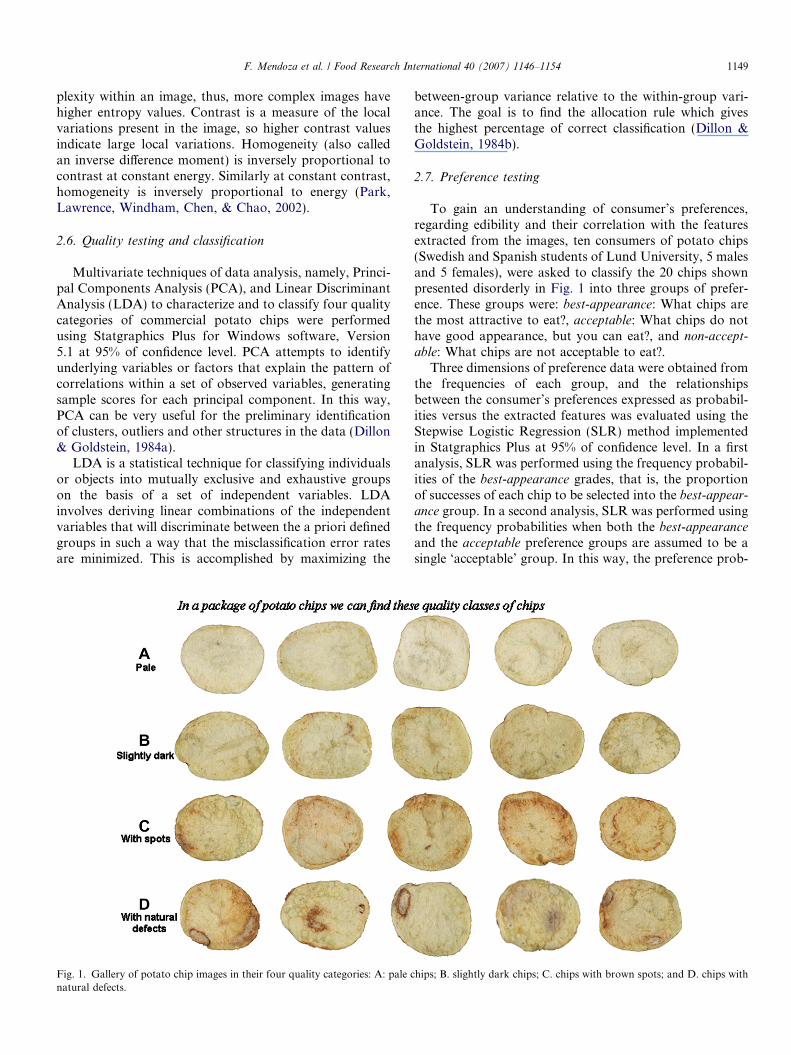
Potato chips (Lattsaltade, OLW, AB Sweden) weretaken randomly from four commercial packages and sortedsubjectively into four quality categories (18 samples percategory): (i) ‘pale chips’, having a clean surface, and noapparent spots; (ii) ‘slightly dark chips’, or chips withacceptable colour, but sometimes characterized by the pres-ence of oily or transparent regions; (iii) ‘chips with brownspots’, which also have an acceptable colour, but presentbrown spots due to the Maillard reaction; (iv) ‘chips withnatural defects’, which are chips with darker and brownerspots due to natural defects or injuries in raw potatoes.
2.2. Image acquisition
Images were captured using an image acquisition systemfor colour digital camera similar to that developed by Men-doza and Aguilera (2004). This system consists of the fol-lowing elements:
1148 F. Mendoza et al. / Food Research International 40 (2007) 1146–1154
2.2.1. Lighting system
Samples were illuminated using two parallel lamps (withtwo fluorescent tubes in each lamp, model TL-D Deluxe,Natural Daylight, 18W/965, Philips, NY, USA) with a col-our temperature of 6500 K and a colour-rendering index(Ra) close to 90% to approximate D65, a standard lightsource defined by CIE. The four fluorescent tubes (60 cmlong) were situated 35 cm above the sample and at an angleof 45� to the sample. Additionally, light diffusers coveringeach lamp and electronic ballasts, which eliminate allflicker and hum (stroboscopic effect) in fluorescent lamps,assured a uniform illumination system.
2.2.2. Digital camera and image acquisition
A Colour Digital Camera (CDC), model PowerShotA70 (Canon, NY, USA) was positioned vertically overthe sample at a distance of 30 cm. The angle between thecamera lens and the lighting source axis was around 45�.Considering that ambient illumination is very critical forreproducible imaging, sample illuminators and the CDCwere covered with a black cloth to avoid the external lightand reflections. Images of one face of the potato chips weretaken on a matte black background using the followingcamera settings: manual mode with the lens aperture atf = 4.5 and speed 1/125, no zoom, no flash, resolution ofthe CDC of 1024 · 768 pixels and storage of image inJPEG format of ‘high resolution’ and ‘superfine quality’.The white balance of the camera was set using the whitereference according to DIN 5033 (model Weib-StandardLZM 076, Dr Lange, Berlin, Germany), and its referencevalues were Xn = 78.2, Yn = 83.1, and Zn = 89.9. Thecamera was connected to the USB port of a PC (Pentium4, Intel (R), 2.8 GHZ, 512 MB RAM, 60 GB hard disk)provided with a Remote Capture Software (version 2.7.0,Canon, NY, USA) to visualize and acquire the digitalizedimages directly from the computer.
2.2.3. Image processing
All the algorithms for pre-processing of full images,image segmentation, colour analysis, and image textureanalysis were written in MATLAB 6.5 (The MathWorks,Inc., MA, USA).
2.3. Image segmentation
Background was removed from the pre-processed grayscale image using a threshold of 60 combined with an edgedetection technique based on the Laplacian-of Gauss(LoG) operator (Castleman, 1996). The gray scale imagewas obtained using the command ‘rgb2gray’ of Matlab.A threshold value of 60 was fixed since the average graylevels of the background and the darker chips were lessthan 50.1 ± 3.1 and higher than 152.2 ± 28.8, respectively.The LoG-operator involved a Gaussian lowpass filter withmask size [3 3] and sigma 0.5, which permits pre-smoothingof noisy images. This segmented image is a binary image,where ‘0’ (black) and ‘1’ (white) mean background and
object respectively. So, from this binary image, the localiza-tion of the pixels into the chip region permitted to extractfrom the original image the true colour image of the chip.
2.4. Colour analysis
The RGB signals generated by a CDC are device-depen-dent and not identical to the RGB intensities of the CIE(Commision Internationale de I’Eclairage) system. How-ever, a standard for the spectral sensitivities of practicalrecording devices has been adopted by the InternationalTelecommunication Union (Rec. ITU-R BT. 709-5,2002), and a linear transformation defines approximatelythe mapping between RGB signals from the CDC and adevice-independent system such as CIEXYZ (Stokes,Anderson, Chandrasekar, & Motta, 1996; Mendoza, Dej-mek, & Aguilera, 2006). Thus, after segmentation of theimage, the colour data were converted to CIEXYZ andL*a*b* as in Mendoza et al. (2006), and from ‘as is’recorded RGB values to HSV colour spaces, and gray scaleintensities (G) using MATLAB 6.5 Image Toolbox func-tions rgb2hsv and rgb2gray, respectively. The average valueof the segmented pixels in the chip image for each colourscale (L*, a*, b*,H, S, V, and G) was registered as the colourof the potato chip.
2.5. Image texture analysis
Image texture was analyzed studying the spatial depen-dence of pixel values represented by a co-ocurrence matrixPd,h with entry Pd,h(i,j) being the relative frequency or dis-tance for two pixels d-pixels apart in direction h to havevalues i and j, respectively. For a given directional orienta-tion and distance of the patterns, 14 textural features canbe extracted from a grayscale image using this matrix(Haralick et al., 1973). Since the texture of potato chipimages can reflect characteristics such as colour, size andarrangement of brown spots or defects it may be directlyor indirectly related to the quality categories and consum-ers’ preferences. Four textural features: energy, entropy,contrast and homogeneity were extracted from the seg-mented images in L*, a*, b*, H, S, V and G, and analyzedusing the texture average of four directions, h = 0, 45, 90,135� and distance, d = 1. They are computed by:
Energy ¼X
i
X
j
P dhði; jÞ2 ð1Þ
Entropy ¼ �X
i
X
j
P dhði; jÞ: logðP dhði; jÞÞ ð2Þ
Contrast ¼X
i
X
j
ði� jÞ2:P dhði; jÞ ð3Þ
Homogeneity ¼X
i
X
j
P dhði; jÞ1þ ði� jÞ2
ð4Þ
Energy measures the textural uniformity of the image, i.e.,the repetition of pixel pairs. Entropy measures disorder orrandomness of the image and it is an indication of the com-
F. Mendoza et al. / Food Research International 40 (2007) 1146–1154 1149
plexity within an image, thus, more complex images havehigher entropy values. Contrast is a measure of the localvariations present in the image, so higher contrast valuesindicate large local variations. Homogeneity (also calledan inverse difference moment) is inversely proportional tocontrast at constant energy. Similarly at constant contrast,homogeneity is inversely proportional to energy (Park,Lawrence, Windham, Chen, & Chao, 2002).
2.6. Quality testing and classification
Multivariate techniques of data analysis, namely, Princi-pal Components Analysis (PCA), and Linear DiscriminantAnalysis (LDA) to characterize and to classify four qualitycategories of commercial potato chips were performedusing Statgraphics Plus for Windows software, Version5.1 at 95% of confidence level. PCA attempts to identifyunderlying variables or factors that explain the pattern ofcorrelations within a set of observed variables, generatingsample scores for each principal component. In this way,PCA can be very useful for the preliminary identificationof clusters, outliers and other structures in the data (Dillon& Goldstein, 1984a).
LDA is a statistical technique for classifying individualsor objects into mutually exclusive and exhaustive groupson the basis of a set of independent variables. LDAinvolves deriving linear combinations of the independentvariables that will discriminate between the a priori definedgroups in such a way that the misclassification error ratesare minimized. This is accomplished by maximizing the
Fig. 1. Gallery of potato chip images in their four quality categories: A: pale cnatural defects.
between-group variance relative to the within-group vari-ance. The goal is to find the allocation rule which givesthe highest percentage of correct classification (Dillon &Goldstein, 1984b).
2.7. Preference testing
To gain an understanding of consumer’s preferences,regarding edibility and their correlation with the featuresextracted from the images, ten consumers of potato chips(Swedish and Spanish students of Lund University, 5 malesand 5 females), were asked to classify the 20 chips shownpresented disorderly in Fig. 1 into three groups of prefer-ence. These groups were: best-appearance: What chips arethe most attractive to eat?, acceptable: What chips do nothave good appearance, but you can eat?, and non-accept-
able: What chips are not acceptable to eat?.Three dimensions of preference data were obtained from
the frequencies of each group, and the relationshipsbetween the consumer’s preferences expressed as probabil-ities versus the extracted features was evaluated using theStepwise Logistic Regression (SLR) method implementedin Statgraphics Plus at 95% of confidence level. In a firstanalysis, SLR was performed using the frequency probabil-ities of the best-appearance grades, that is, the proportionof successes of each chip to be selected into the best-appear-
ance group. In a second analysis, SLR was performed usingthe frequency probabilities when both the best-appearance
and the acceptable preference groups are assumed to be asingle ‘acceptable’ group. In this way, the preference prob-
hips; B. slightly dark chips; C. chips with brown spots; and D. chips with
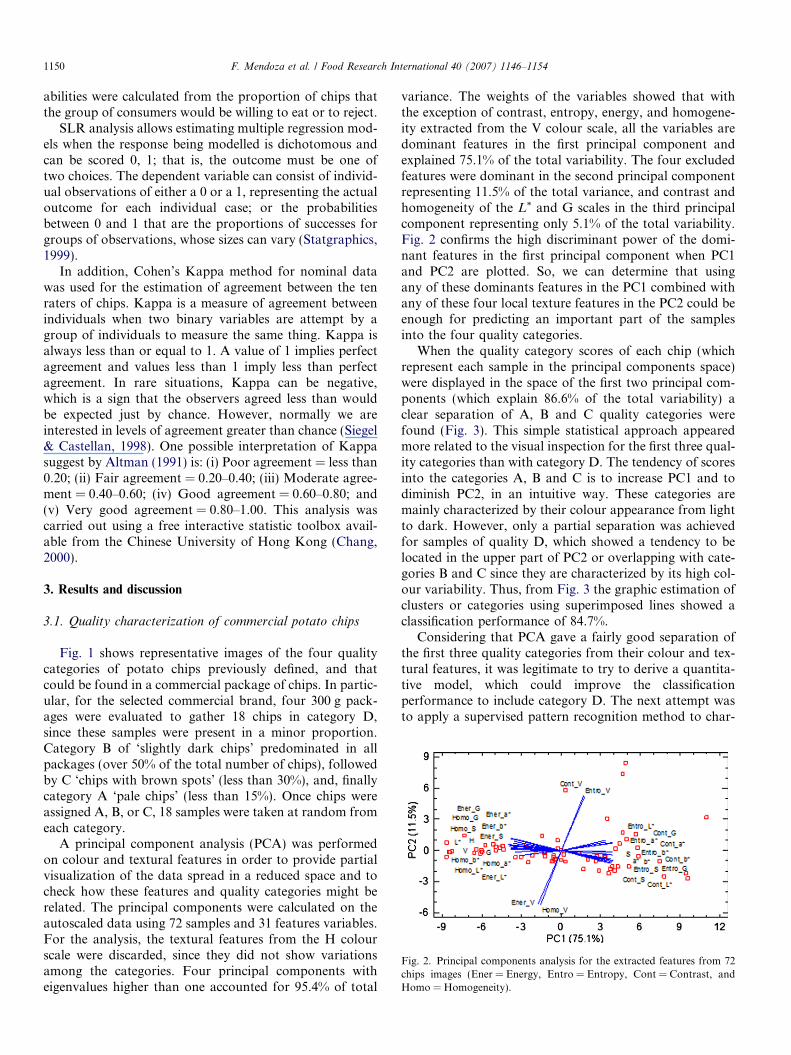
Fig. 2. Principal components analysis for the extracted features from 72chips images (Ener = Energy, Entro = Entropy, Cont = Contrast, andHomo = Homogeneity).
1150 F. Mendoza et al. / Food Research International 40 (2007) 1146–1154
abilities were calculated from the proportion of chips thatthe group of consumers would be willing to eat or to reject.
SLR analysis allows estimating multiple regression mod-els when the response being modelled is dichotomous andcan be scored 0, 1; that is, the outcome must be one oftwo choices. The dependent variable can consist of individ-ual observations of either a 0 or a 1, representing the actualoutcome for each individual case; or the probabilitiesbetween 0 and 1 that are the proportions of successes forgroups of observations, whose sizes can vary (Statgraphics,1999).
In addition, Cohen’s Kappa method for nominal datawas used for the estimation of agreement between the tenraters of chips. Kappa is a measure of agreement betweenindividuals when two binary variables are attempt by agroup of individuals to measure the same thing. Kappa isalways less than or equal to 1. A value of 1 implies perfectagreement and values less than 1 imply less than perfectagreement. In rare situations, Kappa can be negative,which is a sign that the observers agreed less than wouldbe expected just by chance. However, normally we areinterested in levels of agreement greater than chance (Siegel& Castellan, 1998). One possible interpretation of Kappasuggest by Altman (1991) is: (i) Poor agreement = less than0.20; (ii) Fair agreement = 0.20–0.40; (iii) Moderate agree-ment = 0.40–0.60; (iv) Good agreement = 0.60–0.80; and(v) Very good agreement = 0.80–1.00. This analysis wascarried out using a free interactive statistic toolbox avail-able from the Chinese University of Hong Kong (Chang,2000).
3. Results and discussion
3.1. Quality characterization of commercial potato chips
Fig. 1 shows representative images of the four qualitycategories of potato chips previously defined, and thatcould be found in a commercial package of chips. In partic-ular, for the selected commercial brand, four 300 g pack-ages were evaluated to gather 18 chips in category D,since these samples were present in a minor proportion.Category B of ‘slightly dark chips’ predominated in allpackages (over 50% of the total number of chips), followedby C ‘chips with brown spots’ (less than 30%), and, finallycategory A ‘pale chips’ (less than 15%). Once chips wereassigned A, B, or C, 18 samples were taken at random fromeach category.
A principal component analysis (PCA) was performedon colour and textural features in order to provide partialvisualization of the data spread in a reduced space and tocheck how these features and quality categories might berelated. The principal components were calculated on theautoscaled data using 72 samples and 31 features variables.For the analysis, the textural features from the H colourscale were discarded, since they did not show variationsamong the categories. Four principal components witheigenvalues higher than one accounted for 95.4% of total
variance. The weights of the variables showed that withthe exception of contrast, entropy, energy, and homogene-ity extracted from the V colour scale, all the variables aredominant features in the first principal component andexplained 75.1% of the total variability. The four excludedfeatures were dominant in the second principal componentrepresenting 11.5% of the total variance, and contrast andhomogeneity of the L* and G scales in the third principalcomponent representing only 5.1% of the total variability.Fig. 2 confirms the high discriminant power of the domi-nant features in the first principal component when PC1and PC2 are plotted. So, we can determine that usingany of these dominants features in the PC1 combined withany of these four local texture features in the PC2 could beenough for predicting an important part of the samplesinto the four quality categories.
When the quality category scores of each chip (whichrepresent each sample in the principal components space)were displayed in the space of the first two principal com-ponents (which explain 86.6% of the total variability) aclear separation of A, B and C quality categories werefound (Fig. 3). This simple statistical approach appearedmore related to the visual inspection for the first three qual-ity categories than with category D. The tendency of scoresinto the categories A, B and C is to increase PC1 and todiminish PC2, in an intuitive way. These categories aremainly characterized by their colour appearance from lightto dark. However, only a partial separation was achievedfor samples of quality D, which showed a tendency to belocated in the upper part of PC2 or overlapping with cate-gories B and C since they are characterized by its high col-our variability. Thus, from Fig. 3 the graphic estimation ofclusters or categories using superimposed lines showed aclassification performance of 84.7%.
Considering that PCA gave a fairly good separation ofthe first three quality categories from their colour and tex-tural features, it was legitimate to try to derive a quantita-tive model, which could improve the classificationperformance to include category D. The next attempt wasto apply a supervised pattern recognition method to char-
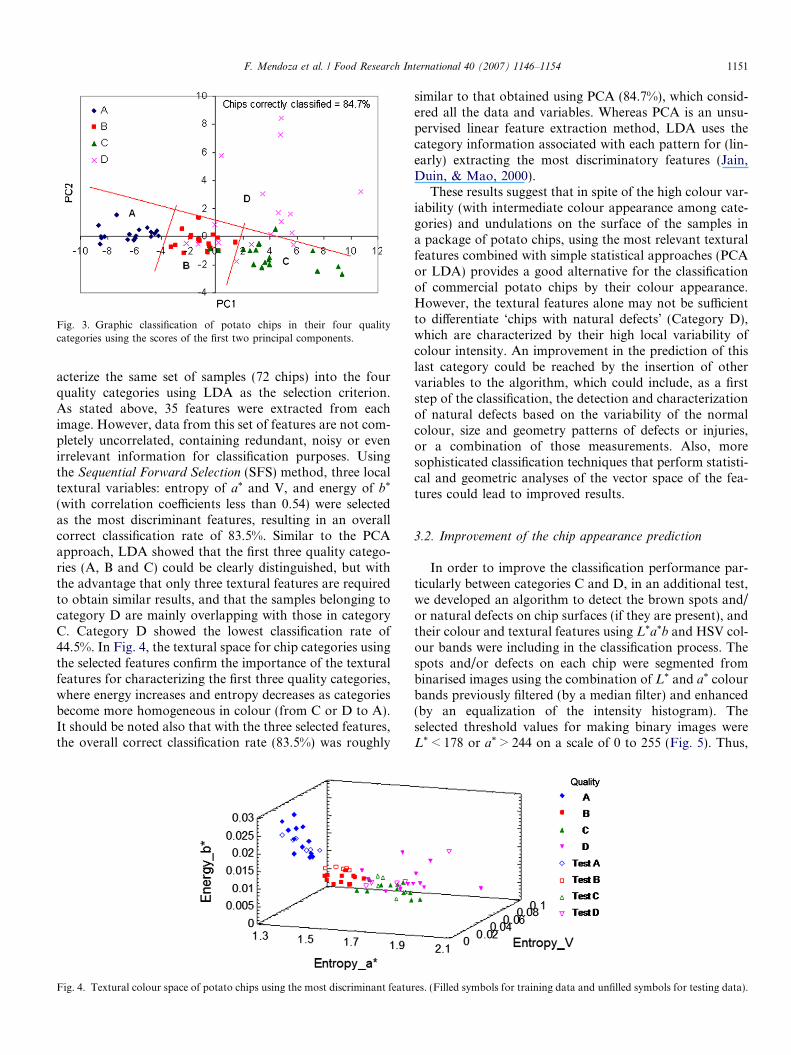
Fig. 3. Graphic classification of potato chips in their four qualitycategories using the scores of the first two principal components.
F. Mendoza et al. / Food Research International 40 (2007) 1146–1154 1151
acterize the same set of samples (72 chips) into the fourquality categories using LDA as the selection criterion.As stated above, 35 features were extracted from eachimage. However, data from this set of features are not com-pletely uncorrelated, containing redundant, noisy or evenirrelevant information for classification purposes. Usingthe Sequential Forward Selection (SFS) method, three localtextural variables: entropy of a* and V, and energy of b*
(with correlation coefficients less than 0.54) were selectedas the most discriminant features, resulting in an overallcorrect classification rate of 83.5%. Similar to the PCAapproach, LDA showed that the first three quality catego-ries (A, B and C) could be clearly distinguished, but withthe advantage that only three textural features are requiredto obtain similar results, and that the samples belonging tocategory D are mainly overlapping with those in categoryC. Category D showed the lowest classification rate of44.5%. In Fig. 4, the textural space for chip categories usingthe selected features confirm the importance of the texturalfeatures for characterizing the first three quality categories,where energy increases and entropy decreases as categoriesbecome more homogeneous in colour (from C or D to A).It should be noted also that with the three selected features,the overall correct classification rate (83.5%) was roughly
Fig. 4. Textural colour space of potato chips using the most discriminant featu
similar to that obtained using PCA (84.7%), which consid-ered all the data and variables. Whereas PCA is an unsu-pervised linear feature extraction method, LDA uses thecategory information associated with each pattern for (lin-early) extracting the most discriminatory features (Jain,Duin, & Mao, 2000).
These results suggest that in spite of the high colour var-iability (with intermediate colour appearance among cate-gories) and undulations on the surface of the samples ina package of potato chips, using the most relevant texturalfeatures combined with simple statistical approaches (PCAor LDA) provides a good alternative for the classificationof commercial potato chips by their colour appearance.However, the textural features alone may not be sufficientto differentiate ‘chips with natural defects’ (Category D),which are characterized by their high local variability ofcolour intensity. An improvement in the prediction of thislast category could be reached by the insertion of othervariables to the algorithm, which could include, as a firststep of the classification, the detection and characterizationof natural defects based on the variability of the normalcolour, size and geometry patterns of defects or injuries,or a combination of those measurements. Also, moresophisticated classification techniques that perform statisti-cal and geometric analyses of the vector space of the fea-tures could lead to improved results.
3.2. Improvement of the chip appearance prediction
In order to improve the classification performance par-ticularly between categories C and D, in an additional test,we developed an algorithm to detect the brown spots and/or natural defects on chip surfaces (if they are present), andtheir colour and textural features using L*a*b and HSV col-our bands were including in the classification process. Thespots and/or defects on each chip were segmented frombinarised images using the combination of L* and a* colourbands previously filtered (by a median filter) and enhanced(by an equalization of the intensity histogram). Theselected threshold values for making binary images wereL* < 178 or a* > 244 on a scale of 0 to 255 (Fig. 5). Thus,
res. (Filled symbols for training data and unfilled symbols for testing data).
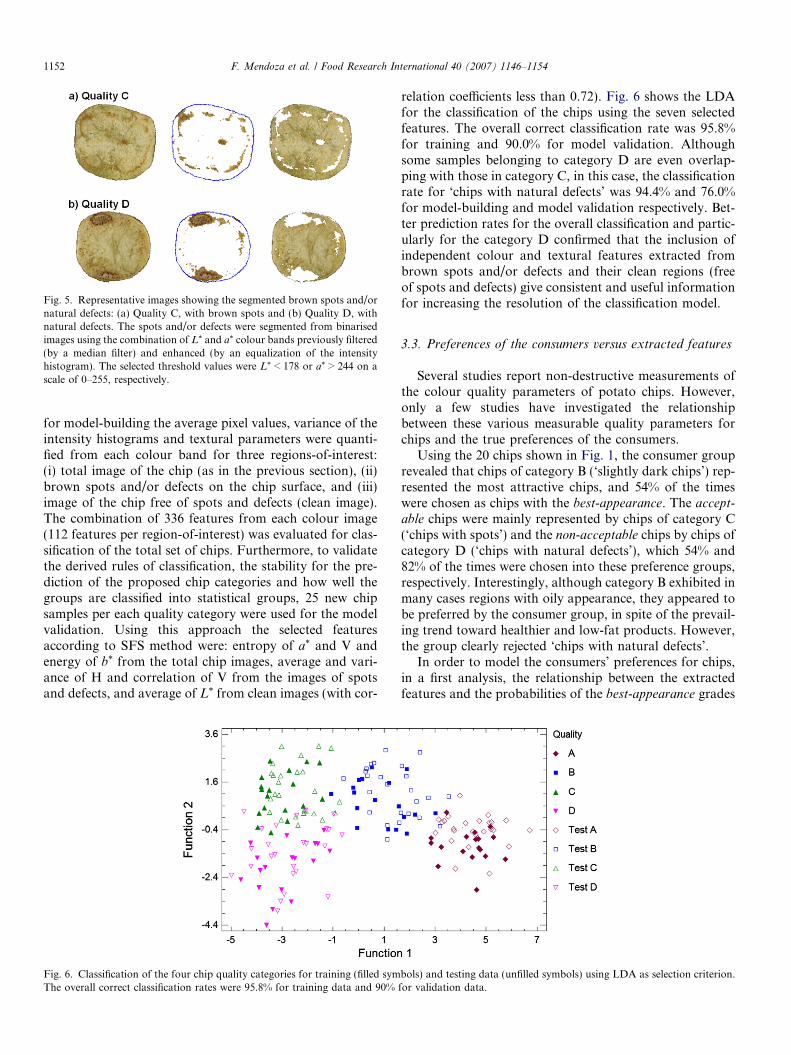
Fig. 5. Representative images showing the segmented brown spots and/ornatural defects: (a) Quality C, with brown spots and (b) Quality D, withnatural defects. The spots and/or defects were segmented from binarisedimages using the combination of L* and a* colour bands previously filtered(by a median filter) and enhanced (by an equalization of the intensityhistogram). The selected threshold values were L* < 178 or a* > 244 on ascale of 0–255, respectively.
1152 F. Mendoza et al. / Food Research International 40 (2007) 1146–1154
for model-building the average pixel values, variance of theintensity histograms and textural parameters were quanti-fied from each colour band for three regions-of-interest:(i) total image of the chip (as in the previous section), (ii)brown spots and/or defects on the chip surface, and (iii)image of the chip free of spots and defects (clean image).The combination of 336 features from each colour image(112 features per region-of-interest) was evaluated for clas-sification of the total set of chips. Furthermore, to validatethe derived rules of classification, the stability for the pre-diction of the proposed chip categories and how well thegroups are classified into statistical groups, 25 new chipsamples per each quality category were used for the modelvalidation. Using this approach the selected featuresaccording to SFS method were: entropy of a* and V andenergy of b* from the total chip images, average and vari-ance of H and correlation of V from the images of spotsand defects, and average of L* from clean images (with cor-
Fig. 6. Classification of the four chip quality categories for training (filled symThe overall correct classification rates were 95.8% for training data and 90%
relation coefficients less than 0.72). Fig. 6 shows the LDAfor the classification of the chips using the seven selectedfeatures. The overall correct classification rate was 95.8%for training and 90.0% for model validation. Althoughsome samples belonging to category D are even overlap-ping with those in category C, in this case, the classificationrate for ‘chips with natural defects’ was 94.4% and 76.0%for model-building and model validation respectively. Bet-ter prediction rates for the overall classification and partic-ularly for the category D confirmed that the inclusion ofindependent colour and textural features extracted frombrown spots and/or defects and their clean regions (freeof spots and defects) give consistent and useful informationfor increasing the resolution of the classification model.
3.3. Preferences of the consumers versus extracted features
Several studies report non-destructive measurements ofthe colour quality parameters of potato chips. However,only a few studies have investigated the relationshipbetween these various measurable quality parameters forchips and the true preferences of the consumers.
Using the 20 chips shown in Fig. 1, the consumer grouprevealed that chips of category B (‘slightly dark chips’) rep-resented the most attractive chips, and 54% of the timeswere chosen as chips with the best-appearance. The accept-able chips were mainly represented by chips of category C(‘chips with spots’) and the non-acceptable chips by chips ofcategory D (‘chips with natural defects’), which 54% and82% of the times were chosen into these preference groups,respectively. Interestingly, although category B exhibited inmany cases regions with oily appearance, they appeared tobe preferred by the consumer group, in spite of the prevail-ing trend toward healthier and low-fat products. However,the group clearly rejected ‘chips with natural defects’.
In order to model the consumers’ preferences for chips,in a first analysis, the relationship between the extractedfeatures and the probabilities of the best-appearance grades
bols) and testing data (unfilled symbols) using LDA as selection criterion.for validation data.
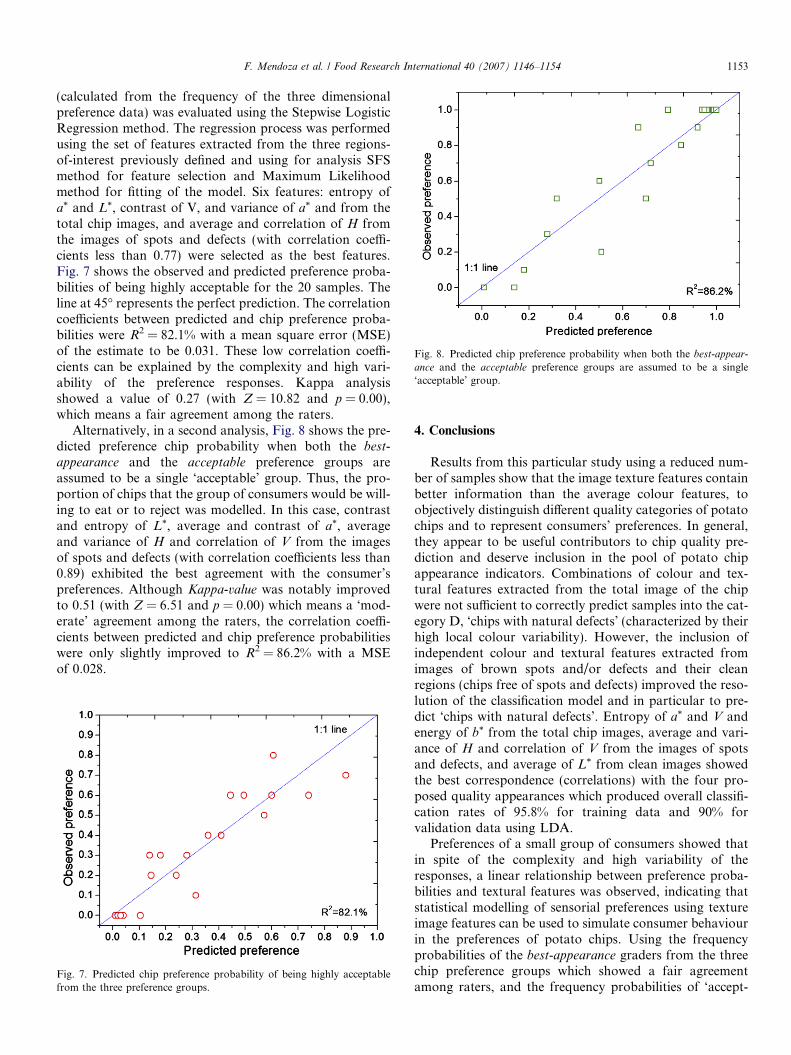
Fig. 8. Predicted chip preference probability when both the best-appear-
ance and the acceptable preference groups are assumed to be a single‘acceptable’ group.
F. Mendoza et al. / Food Research International 40 (2007) 1146–1154 1153
(calculated from the frequency of the three dimensionalpreference data) was evaluated using the Stepwise LogisticRegression method. The regression process was performedusing the set of features extracted from the three regions-of-interest previously defined and using for analysis SFSmethod for feature selection and Maximum Likelihoodmethod for fitting of the model. Six features: entropy ofa* and L*, contrast of V, and variance of a* and from thetotal chip images, and average and correlation of H fromthe images of spots and defects (with correlation coeffi-cients less than 0.77) were selected as the best features.Fig. 7 shows the observed and predicted preference proba-bilities of being highly acceptable for the 20 samples. Theline at 45� represents the perfect prediction. The correlationcoefficients between predicted and chip preference proba-bilities were R2 = 82.1% with a mean square error (MSE)of the estimate to be 0.031. These low correlation coeffi-cients can be explained by the complexity and high vari-ability of the preference responses. Kappa analysisshowed a value of 0.27 (with Z = 10.82 and p = 0.00),which means a fair agreement among the raters.
Alternatively, in a second analysis, Fig. 8 shows the pre-dicted preference chip probability when both the best-
appearance and the acceptable preference groups areassumed to be a single ‘acceptable’ group. Thus, the pro-portion of chips that the group of consumers would be will-ing to eat or to reject was modelled. In this case, contrastand entropy of L*, average and contrast of a*, averageand variance of H and correlation of V from the imagesof spots and defects (with correlation coefficients less than0.89) exhibited the best agreement with the consumer’spreferences. Although Kappa-value was notably improvedto 0.51 (with Z = 6.51 and p = 0.00) which means a ‘mod-erate’ agreement among the raters, the correlation coeffi-cients between predicted and chip preference probabilitieswere only slightly improved to R2 = 86.2% with a MSEof 0.028.
Fig. 7. Predicted chip preference probability of being highly acceptablefrom the three preference groups.
4. Conclusions
Results from this particular study using a reduced num-ber of samples show that the image texture features containbetter information than the average colour features, toobjectively distinguish different quality categories of potatochips and to represent consumers’ preferences. In general,they appear to be useful contributors to chip quality pre-diction and deserve inclusion in the pool of potato chipappearance indicators. Combinations of colour and tex-tural features extracted from the total image of the chipwere not sufficient to correctly predict samples into the cat-egory D, ‘chips with natural defects’ (characterized by theirhigh local colour variability). However, the inclusion ofindependent colour and textural features extracted fromimages of brown spots and/or defects and their cleanregions (chips free of spots and defects) improved the reso-lution of the classification model and in particular to pre-dict ‘chips with natural defects’. Entropy of a* and V andenergy of b* from the total chip images, average and vari-ance of H and correlation of V from the images of spotsand defects, and average of L* from clean images showedthe best correspondence (correlations) with the four pro-posed quality appearances which produced overall classifi-cation rates of 95.8% for training data and 90% forvalidation data using LDA.
Preferences of a small group of consumers showed thatin spite of the complexity and high variability of theresponses, a linear relationship between preference proba-bilities and textural features was observed, indicating thatstatistical modelling of sensorial preferences using textureimage features can be used to simulate consumer behaviourin the preferences of potato chips. Using the frequencyprobabilities of the best-appearance graders from the threechip preference groups which showed a fair agreementamong raters, and the frequency probabilities of ‘accept-
1154 F. Mendoza et al. / Food Research International 40 (2007) 1146–1154
able’ graders (considering acceptable and non-acceptable
chips) which showed a moderate agreement among raters,the logistic regression models were able to explain the82.1% and 86.2% of the variability in consumer preference,respectively.
Acknowledgements
Thanks to MECESUP/PUC 9903 Project (Chile) forgranting the first author a doctoral scholarship at theSchool of Engineering, Pontificia Universidad Catolica deChile, and ALFA Programme – EU Alfa Project II-0121-FA for financial assistance to develop part of this investiga-tion at Lund University.
References
Altman, D. G. (1991). Practical statistics for medical research. London,UK: Chapman and Hall, p. 404.
Basset, O., Buquet, B., Abouelkaram, S., Delachartre, P., & Culioli, J.(2000). Application of texture image analysis for the classification ofbovine meat. Food Chemistry, 69(4), 437–445.
Bouchon, P., Aguilera, J. M., & Pyle, D. L. (2003). Structure-oilabsorption kinetics relationships during deep-fat frying. Journal of
Food Science, 68(9), 2711–2716.Bouchon, P., & Pyle, D. L. (2004). Studying oil absorption in restructured
potato chips. Journal of Food Science, 69(3), 115–122.Brosnan, T., & Sun, D.-W. (2002). Inspection and grading of agricultural
and food products by computer vision systems – a review. Computers
and Electronics in Agriculture, 36(2–3), 193–213.Brosnan, T., & Sun, D.-W. (2003). Improving quality inspection of food
products by computer vision – a review. Journal of Food Engineering,
61(1), 3–16.Castleman, K. (1996). Digital image processing. Englewood Cliffs, New
Jersey: Prentice Hall, p. 667.Chang, A. (2000). Statistic Tool Box. Cohen’s Kappa test for nominal data
as concordance between multiple raters. Department of Obstetrics andGynaecology. The Chinese University of Hong Kong. http://depart-ment.obg.cuhk.edu.hk/researchsupport/statstesthome.asp (accessedMarch 2007).
Chen, Y.-R., Chao, K., & Kim, M. S. (2002). Machine vision technologyfor agriculture applications. Computers and Electronics in Agriculture,
36(2–3), 173–191.Dillon, W. R., & Goldstein, M. (1984a). Principal components analysis. In
Multivariate analysis. Methods and applications (pp. 23–54). NewYork: John Wiley and Sons.
Dillon, W. R., & Goldstein, M. (1984b). Discriminant analysis: the two-group problem. In Multivariate analysis. Methods and applications
(pp. 360–393). New York: John Wiley and Sons.Du, C.-J., & Sun, D.-W. (2005). Comparison of three methods for
classification of pizza topping using different colour space transfor-mations. Journal of Food Engineering, 68(3), 277–287.
Haralick, R. M., Shanmugam, K., & Dinstein, I. (1973). Textural featuresfor image classification. IEEE Transactions on Systems, Man and
Cybernetics SMC, 3(6), 610–621.Jain, A. K., Duin, R. P. W., & Mao, J. (2000). Statistical pattern
recognition: a review. IEEE Transactions Pattern Analysis Machine
Intelligence, 22(1), 4–37.Li, J., Tan, J., Martz, F. A., & Heymann, H. (1999). Image textural
features as indicators of beef tenderness. Meat Science, 53(1), 17–22.Mackay, G., Brown, J., & Torrence, C. (1990). The processing potential of
tubers of the cultivated potato, Solanum tuberosum L. after storage atlow temperatures. Potato Research, 33, 211–218.
Marique, T., Kharoubi, P., Bauffe, P., & Ducattillon, C. (2003). Modelingof fried potato chips colour classification using image analysis andartificial neural network. Journal of Food Science, 68(7), 2263–2266.
Marquez, G., & Anon, M. C. (1986). Influence of reducing sugars andamino acids in the colour development of fried potatoes. Journal of
Food Science, 51, 157–160.Mendoza, F., & Aguilera, J. M. (2004). Application of image analysis for
classification of ripening bananas. Journal of Food Science, 69(9),471–477.
Mendoza, F., Dejmek, P., & Aguilera, J. M. (2006). Calibrated colormeasurements of agricultural foods using image analysis. Postharvest
Biology and Technology, 41(3), 285–295.Park, B., Lawrence, K. C., Windham, W. R., Chen, Y.-R., & Chao, K.
(2002). Discriminant analysis of dual-wavelength spectral images forclassification poultry carcasses. Computers and Electronics in Agricul-
ture, 33(3), 219–231.Pedreschi, F., Mery, D., Mendoza, F., & Aguilera, J. M. (2004).
Classification of potato chips using pattern recognition. Journal of
Food Science, 69(6), 264–270.Scanlon, M. G., Roller, R., Mazza, G., & Pritchard, M. K. (1994).
Computerized video image analysis to quantify colour of potato chips.American Potato Journal, 71, 717–733.
Segnini, S., Dejmek, P., & Oste, R. (1999). A low cost video technique forcolour measurement of potato chips. Lebensm.-Wiss. u.-Technol.,
32(4), 216–222.Siegel, S., & Castellan, N. J. Jr., (1998). Nonparametric statistics for the
behavioral sciences (International Edition). New York: McGraw-HillBook Company, pp. 284–291.
Smith, O. (1975). Potato chips. In W. F. Talburt & O. Smith (Eds.), Potato
processing (pp. 305–402). The Avi Publishing Company, Inc..Statgraphics (1999). Advanced Regression. Using Logistic Regression. In
User Manual (Chapter 7). Statgraphics Plus for Windows. Version 5.1.Professional edition. Manugistics, Inc. Rockville, MD. USA.
Stokes, M., Anderson, M., Chandrasekar, S., & Motta, R. (1996). Astandard default colour space for the internet – sRGB. Version 1.10,Nov. 5, 1996. www.w3.org/Graphics/Color/sRGB.html (accessedFebruary 2007.
Rec. ITU-R BT. 709-5. (2002). Parameter values for the HDTV standards
for production and international programme exchange. International
Telecommunication Union, pp. 30. http://www.itu.int/publications/bookshop/index.html (accessed February 2007.
Rimac-Brncic, S., Lelas, V., Rade, D., & Simundic, B. (2004). Decreasingof oil absorption in potato strips during deep fat frying. Journal of
Food Engineering, 64(2), 237–241.