collaboration network and trends of global coronavirus
TRANSCRIPT
Received March 3, 2021, accepted March 12, 2021, date of publication March 17, 2021, date of current version March 26, 2021.
Digital Object Identifier 10.1109/ACCESS.2021.3066450
Collaboration Network and Trends of GlobalCoronavirus Disease Research:A Scientometric AnalysisJAKKRIT THAVORN 1, (Graduate Student Member, IEEE), CHUPUN GOWANIT1,VEERA MUANGSIN 2, AND NONGNUJ MUANGSIN 31Technopreneurship and Innovation Management Program, Graduate School, Chulalongkorn University, Bangkok 10330, Thailand2Department of Computer Engineering, Faculty of Engineering, Chulalongkorn University, Bangkok 10330, Thailand3Department of Chemistry, Faculty of Science, Chulalongkorn University, Bangkok 10330, Thailand
Corresponding author: Veera Muangsin ([email protected])
This work was supported in part by the National Research Council of Thailand (NRCT) through Research and Researchers forIndustries (RRI) Scholarship Program under Grant PhD62I0011, in part by the Technopreneurship and Innovation Management Program,Graduate School, Chulalongkorn University, Thailand, and in part by the National Nanotechnology Center (NANOTEC), National Scienceand Technology Development Agency (NSTDA), Ministry of Higher Education, Science, Research and Innovation, Thailand, through itsResearch Network NANOTEC (RNN) Program.
ABSTRACT As a global pandemic threatens health and livelihoods, finding effective treatments has becomea vital issue that requires worldwide collaboration. This study examines research collaboration and networkprofiles through a case study of coronavirus diseases, including both the extinct severe acute respiratorysyndrome coronavirus (SARS-CoV) and the emerging species (SARS-CoV-2). A scientometric processwas designed to apply quantitative tools and a qualitative approach employing technological expertiseto accomplish a three-level collaboration analysis. The text mining software, VantagePoint, was used toanalyze research articles from the Web of Science database to identify the key national, organizational,and individual players in the coronavirus research field combined with indicators, namely, the breadth anddepth of collaboration. The results show that China and the United States are at the center of coronavirusresearch networks at all three levels, including many endeavors involving single or joint entities. This studydemonstrates how governments, public sectors, and private sectors, such as the pharmaceutical industry, canuse scientometric analysis to gain insight into the holistic research trends and networks of players in this field,leading to the formulation of strategies to strengthen research and development programs. Furthermore, thisapproach can be utilized as a visualization and decision support tool for further policy planning, identificationand execution of collaboration, and research exchange opportunities. This scientometric process should bedirectly applicable to other fields.
INDEX TERMS Bibliometrics, scientometrics, network analysis, research collaboration, coronavirus.
I. INTRODUCTIONInternational collaboration has become an increasinglywidespread vehicle for scientific production, and someauthors have argued that the best science comes from inter-national collaboration [1]. By combining and thereby aug-menting data, techniques, competencies, equipment, andfacilities, collaboration ‘‘improves labor efficiency andresearch quality, and supports the process of scientific pro-duction, knowledge creation, and breakthroughs’’ [2]. Thus,every country in Europe collaborates with all the others in the
The associate editor coordinating the review of this manuscript andapproving it for publication was Wei Wei.
region to produce tens of thousands of publications. Scientistsin the United States regularly collaborate with their counter-parts in the United Kingdom andGermany to create a massivelevel of scientific output. Similarly, regional-scale networkslink scholars in Latin America, the Middle East, Africa, andAsia. Such networks are not constrained by political discord;the United States has increasingly collaborated with China,and the latter country has partneredwith Japan, Taiwan, SouthKorea, and Australia [3]. Collaboration is a vital and commonpractice in scientific and technological research. Through col-laboration, the sharing of tangible and intangible resources,such as knowledge, experience, resources, and instruments,can be exchanged and executed to generate ideas, techniques,
VOLUME 9, 2021 This work is licensed under a Creative Commons Attribution 4.0 License. For more information, see https://creativecommons.org/licenses/by/4.0/ 45001
J. Thavorn et al.: Collaboration Network and Trends of Global Coronavirus Disease Research
and tools to advance research [4]. Furthermore, formingnetworks among researchers and organizations effectivelyaddresses the increasingly complex challenges facing soci-eties [5], [6]. Technological advancements could create newopportunities to solve significant social problems by combin-ing a wide range of expertise and information.
A better understanding of how to form collaborative rela-tionships among scientists and researchers would be invalu-able for bolstering R&D efforts [7]. Knowledge of currentnetworks can serve as a map to formulate strategies for aresearch roadmap in the future [8]. Complex R&D commu-nities are often difficult to track because they entail multidis-ciplinary research involving a range of science, engineering,humanities, and social sciences [9]. Several tools have beendeveloped to explore patterns for potential R&D collabora-tion and forecasting pathways of innovation [10]–[13]. How-ever, traditional tools are not fully effective for grasping thehighly complex relationships among networks at the national,institutional, and individual scales and how collaborationoccurs within and among these levels. In addition, the rela-tionship between the profiles of the research network andthe areas or subareas of a particular research field is poorlyobserved.
Consequently, in this study, we propose an innovativeresearch networking model called the strategic technologyintelligence (STI) approach based on quantitative sciento-metric methods and qualitative research involving experts tointerpret the results obtained from the analysis. Understand-ing the important characteristics of such networks could helpscientists create complementary research networks to shortenthe time for R&D and ultimately benefit the world [7], [14].This model elucidates methods for understanding the struc-ture of collaborative relationships and patterns at multiplescales as well as mapping patterns of collaboration and theirassociated research themes. The outcomes can promote inno-vative and sustainable pathways that enhance competitive-ness, drive the economy, and provide social benefits.
In recent decades, novel infectious diseases have emergedat an unprecedented pace and have proven to be challeng-ing to healthcare systems worldwide [15]. Our respiratorysystems are highly vulnerable to infections via airbornetransmission as well as mucus and saliva droplets [16].Hence, respiratory viruses are a continuous epidemic threatregardless of age or gender. Since the beginning of the 21stcentury, the world has confronted severe acute respiratorysyndrome coronavirus (SARS-CoV) in 2002, swine-origininfluenza (H1N1) in 2009, and Middle East respiratory syn-drome coronavirus (MERS-CoV) in 2012 [17].Most recently,coronavirus disease 2019 (COVID-19), caused by severeacute respiratory syndrome coronavirus 2 (SARS-CoV-2),emerged in China in December 2019, leading to clustersof cases and a massive explosion of infections on a globalscale [18]. On January 30th, 2020, the World Health Orga-nization (WHO) declared the COVID-19 outbreak an inter-national public health emergency. As of September 2020,the pandemic has spread to over 200 countries worldwide,
causing over 34.4 million confirmed infections casesand more than 1,000,000 deaths [18]. The outbreak ofCOVID-19 has resulted in irreparable changes to daily lifeand economic functioning worldwide [19]. A viral infectionfor which manifestations range from mild or no symptoms tomore severe conditions, including fever, dry cough, dyspnea,respiratory disorders, and pneumonia, COVID-19 can resultin progressive pulmonary failure and death [20].
This pandemic has resulted in major social and economicdisruptions. Many community mitigation measures havebeen introduced, comprising physical distancing throughrestrictions on international travel, shifting to online learn-ing and work, closure of restaurants, movie theaters, andother venues, and banning of large public gatherings, suchas festivals, graduations, and sporting events [21]. Alam-oodi et al. [22] conducted sentiment analysis to understandthis pandemic by addressing people’s concerns. The eco-nomic impacts of these measures include massive unemploy-ment and the destruction of numerous businesses worldwide.Community mitigation efforts have also imposed a socialcost, as enforced social isolation has exacerbated existingmental health problems as well as engendering denial, anx-iety, fear, stress, depression, and posttraumatic stress disor-der [23], [24]. In the face of such massive global physical,social, and economic devastation, researchers have widelytouted the need to promote interdisciplinary and internationalcollaborative research that analyzes the COVID-19 problemfrom multiple perspectives, including those of ‘‘medical,epidemiologist, and environmental specialists, but also engi-neering, political, economic, social, and demographic sec-tors’’ [25]. In this context, rapid innovation of new medicinesand vaccines as well as solutions for symptom alleviation arecritical to saving lives. However, no single organization orcountry can mount an effective response.
Consequently, this study applies our proposed analysisapproach to the case of coronavirus disease. It aims to analyzescientific articles concerning COVID-19 and related coron-aviruses as a case study to explore the constituent entities ofcurrent research networks as well as prevalent research areas.Studies related to the analysis of research networks linked tocoronaviruses have been reviewed. Fry et al. [26] exploredthe pattern of research collaboration regarding COVID-19during the first four months of the pandemic by mainlyfocusing on country analysis. Nasir et al. [27] applied a bib-liometric analysis to explore research networking in terms ofcountry and affiliation. To our knowledge, a three-level (thecountry, affiliation, and individual levels) analysis of suchcollaborations together with the classification of researchareas to holistically understand the range of macro to microperspectives has not yet been presented. The explorationof current research themes and the mapping or clusteringof these themes to collaborative groups to track researchprogress and identify the appropriate groups (e.g., physicians,patients, and scientists) with which to connect are necessaryfor accelerating the discovery of solutions to the current andupcoming infectious disease challenges.
45002 VOLUME 9, 2021
J. Thavorn et al.: Collaboration Network and Trends of Global Coronavirus Disease Research
II. RELATED WORKSA. BIBLIOMETRIC ANALYSISBibliometrics is defined as a measurement of texts and infor-mation [28]. Bibliometric analysis is a widely used tool forexploring insights and matching future societies’ needs withcurrent science and technology. It is commonly used in manydifferent contexts to examine issues of interest in technical,scientific, or social databases [29], ranging from measure-ments of journals’ impacts to the identification of real-worldprogress and advanced technologies in fields such as environ-mental and health sciences [30]–[32]. In other words, uses ofthe bibliometric approach in both academic and professionalcommunities extend beyond the lists and numbers of sci-entific journals and citations. Instead, bibliometric analystspresent insightful outputs for managerial applications andpotentially forecast future technological trends [33].
Bibliometric analysis can involve both quantitative andqualitative methods, depending on the issues of inter-est. Quantitative approaches can explore and analyze awide range of indicators, namely, the number and typesof related publications, journals, keywords, and institu-tions [34], as well as gauge the quality of publications interms of indicators such as their impact measured accordingto the received number of citations [35]. In addition, the com-bination of bibliometric analysis with text mining has beenapplied to large databases and knowledge-based text docu-ments to analyze trends and insights between related domainsas a means to help researchers, scientists, and managers makedecisions for further development and execution [29].
B. CO-OCCURRENCE ANALYSISIn bibliometrics, co-occurrence analysis is used to find rela-tionships between terms or references that appear in the samedocuments [36]. Co-word analysis is one of the core co-occurrence analysis approaches [36], [37]. This techniquecompiles the frequency of words or phrases in documentsand clusters them to identify evolutionary trends and patternsby mapping the strength of relationships among terms [38].If keywords tend to appear together among multiple doc-uments, they are likely associated with each other [39],resulting in groups of related keywords. The higher the fre-quency of co-words, the stronger their correlation and thegreater the likelihood that those co-keywords are relatedto specific research themes [35]. Thus, using this approachcan help analysts understand prevalent areas to reveal entirechains of research. Accordingly, co-occurrence analysis canbe an effective method for knowledge discovery to identifythe essential components of a research field and associatedtrends [39].
Co-word analysis has been applied to various researchstreams, including the banking sector [40], marketing [41],the analysis of keywords used in authors’ publications [42],and technology [43]. For instance, Wei et al. [44] conducteda co-word analysis to identify emerging research themesrelated to human neural stem cells. Lis [45] explored severalresearch areas related to sustainable enterprises and identified
emerging topics targeted for further attention. Besselaar andHeimeriks [46] proposed a method of combining words fromtitles and cited references to identify sources for a dataset foranalysis to form a two-dimensional indicator.
C. DYNAMICS OF COLLABORATION AND NETWORKANALYSISA research collaboration occurs when a group of researchersworks together to generate scientific and technologicalknowledge to achieve a common goal [6]. Investigatingresearch collaborations helps enhance the understanding ofresearch resources and information, such as collaborationsamong countries and institutions [7]. Network analysis hasbeen utilized in various fields, such as engineering [47],university-industry linkages [48], and tourism [7]. Most stud-ies identifying scientific collaboration have been quantitativeprojects focused on publications and knowledge sharing, andqualitative indicators have been only rarely applied to suchnetwork mapping efforts.
As scientific collaboration networks continue to expandand demonstrate progress in addressing the increasinglycomplex problems facing societies, a growing interest hasdeveloped in explaining patterns of international scientificcollaborative networks for the social construction of sciencewithin and across different disciplines at the institutional,national, and international scales [49], [50]. Seminal studiesduring the 1970s highlighted the importance of internationalresearch collaboration across scientific disciplines [51], andlater studies have demonstrated differences in scientific pro-duction across countries and research institutions in variousdisciplines [52].
In addition to tracking levels of collaboration, scholarshave explored the effects of collaboration on research produc-tivity and quality [53], the impact of geographic proximity oncollaboration [54], and motivations and strategies for collab-oration. Bozeman and Corley [55] found that the implicationsof collaboration for human capital vary according to thestrategy employed, whereby some collaboration approachesare more useful for mentoring and advancing the develop-ment of early-career scientists. In contrast, others are moreclosely related to engendering mutual benefits from jointproductivity. Notably, the former strategy was shown to bemore closely linked to those who are tenured and more likelyto collaborate with women and be engaged with industryresearch. Other studies have explored the implications of such‘‘mentoring’’ relationships or others involving differences inrank on collaboration dynamics. Senior members appear tobenefit from network participation at the expense of juniorcollaborators and women, who may not even be named inresearch publications [56], which presents problems in mea-suring network size and composition.
Scholars have proposed various means and purposes formeasuring international collaboration. Luukkonen et al. [52]argued for applying a combination of absolute and rel-ative multilateral measures using multidimensional scal-ing methods to ensure accurate measurement that captures
VOLUME 9, 2021 45003
J. Thavorn et al.: Collaboration Network and Trends of Global Coronavirus Disease Research
relationships involving both small and large countries. New-man [57] used co-authorship patterns as a basis for the recon-struction of collaboration networks involving researchers inbiology and medicine, various subdisciplines of physics, andcomputer science. He described it as being highly clusteredand a ‘‘small world’’ in which the average distance betweenscientists linked by intermediate collaborators was correlatedwith the size of the scientific community.
Although such studies have yielded valuable information,questions remain about the ability to accurately measurethe dynamics of international research collaboration. Thisaspect is highly challenging due to the evolving nature ofscience, continuous shifts in the frontiers of research fieldsand interactions among them [2], as well as the numerousand complex relationships within and among networks atthe individual, institutional, national, and international scales.Studies examining the evolution of collaborative networkshave found them highly dynamic, with members joining andleaving the network at various points in time, which has sig-nificant implications for network stability and calculations ofnetwork size [58]. Coccia and Bozeman [59] studied the evo-lution of collaborative networks across scientific disciplinesfrom 1997–2012. They highlighted the increasing signifi-cance of international collaborations on the medical sciencesand related disciplines, which they related to the emergence ofnew disciplines that emerge from older disciplines or througha combination of two or more disciplines, such as biomedicalengineering, biochemistry, and molecular biology.
In the field of health research, Fonseca et al. [9]applied co-authorship network analysis to reveal connec-tions among individual researchers, organizations, and coun-tries collaborating to develop Chikungunya virus vaccines.Hagel et al. [60] analyzed publications on Ebola virus diseasethrough social network analysis to identify collaborationsamong authors, co-authors, and institutions. However, furtherquantitative analysis, including text mining of articles relatedto this disease, is needed to ensure the developmental progressof treatments. However, these studies demonstrate networkmapping without quantitative indicators.
D. INDICATORS RELATED TO THE COLLABORATION ANDNETWORK ANALYSISNetwork analysis can be employed to measure patterns ofcollaboration across multiple scales encompassing countries,institutions, and authors [61]. The indicator for measuringcollaboration can be defined as the degree of collaboration(DCO). Thus, the degree of collaboration at the country levelcan be calculated using the formula shown in (1):
DCO(Ci) =NM (Ci)∑N
i=1 (NM (Ci)+ NS(Ci)(1)
where Ci denotes an individual country, DCO(Ci) representsthe degree of collaboration of the country, NM(Ci) repre-sents the number of articles involving multiple countries,NS(Ci) represents the number of single-country articles, andN is the number of articles in a particular country. In other
words, the degree of collaboration is the ratio of the numberof cross-national journal publications in one country to thenumber of total journal publications in that country. We notethat this calculation should have a boundary or domain of thearticles in the dataset for the analysis.
Furthermore, degree centrality (DC) is another indicator tomeasure the level of collaboration. Degree centrality (DC)is defined as the number of nodes tied with a particularnode. Freeman [62] explained that this indicator measures thecentrality of a country with which other countries are engagedin a collaboration or network. If the focus of the collaborationinvolves exchange activities, then the degree centrality can beapplied as a basis of measurement.
We applied degree centrality for country-level analysis.Countries that have established links to other countries maybe in advantageous positions due to increased degree central-ity. The individual degree centrality can be calculated as (2).
DC ′(Ci) =
∑ni=1 a(Ci,Cj)n− 1
(2)
where DC’(Ci) is the standardized degree centrality of coun-try Ci,
∑ni=1 a(Ci,Cj) is the summation of the number of
edges attached to the node, and n is the number of nodes inthe selected network. For a particular network or group ofcollaborations, we can calculate the overall degree centralityof that network using (3).
DC =
∑ni=1
[N ∗ − NCi
](n− 1)(n− 2)
(3)
whereDC is the degree centrality for a particular network,N ∗
is the maximum number of edges, NCi is the number of edgesof country Ci, and n is the number of nodes in the selectednetwork.
III. METHODOLOGYIn this research, we applied the concept of technology intel-ligence, which is the activities to extract vital informationfor making a decision to achieve innovation growth [63].Furthermore, it helps to understand the scientific and tech-nological developments that lead to competitive position-ing [64]. Thus, scientometric analysis is utilized to analyzethe scientific literature, which refers to strategic technologyintelligence (STI), as an innovative approach for technologyopportunity analysis. This approach helps to identify currentresearch areas and explores patterns of research collaborationto provide useful information to accelerate the R&D processfor universities, research institutes, and private firms. Thisstudy employs bibliometric text mining to obtain insights byanalyzing raw big data from scientific articles.
As mentioned in Section I, we chose the research areaof viruses, in particular, severe acute respiratory syndromecoronavirus (SARS-CoV), and related fields, including coro-navirus disease 2019 (COVID-19), as a case study. This topicurgently needs attention to understand current research topicsand collaborations to accelerate research and development toimpede the outbreak and improve survival rates. The detailsof the materials and methods are in the following sections.
45004 VOLUME 9, 2021
J. Thavorn et al.: Collaboration Network and Trends of Global Coronavirus Disease Research
A. SAMPLE AND DATAWe identified the major keywords related to this issue. Searchstrings were used based on the Boolean approach fromPorter et al. [65]. Boolean search is a method that enablesthe combination or exclusion of keywords with operators toobtain more relevant results. Two criteria for producing thesearch terms are considered: 1) terms should be associatedwith a large quantity of articles and relevant to the field; and2) experts should be able to determine how well the termsare covered. For the latter criterion, the topical expert helpedto initiate search terms. We used the Web of Science (WoS)database as the data source for collecting scientific publi-cations. We used different search queries and searched fortitle, abstract, author, keywords, and the WoS Keywords Plustool, which consists of words and phrases extracted fromthe titles of the cited articles [66]. The final search strategywas ‘TITLE-ABS-KEY (‘‘COVID’’ OR ‘‘COVID-19’’ OR‘‘SARS-CoV-2’’ OR ‘‘SARS-CoV’’ OR ‘‘2019-nCoV’’ OR‘‘severe acute respiratory syndrome coronavirus’’)’. We iden-tified 2,882 publications published from January 2003 toApril 2020, and those data were imported to the software foranalysis.
B. MEASURES OF VARIABLESAnalysis of research collaborations and technological trendswas conducted. Specifically, research collaborations wereanalyzed from the macro to micro perspectives, namely,the country level, organizational level, and author level. Theexpert interpreted the results and provided technical knowl-edge for the analysis. Then, additional quantitative analysiswas conducted whereby the degree of collaboration (DCO),the degree centrality (DC), and other analyses were computedusing (1) - (3) to reconstruct networks at each collaborationlevel.
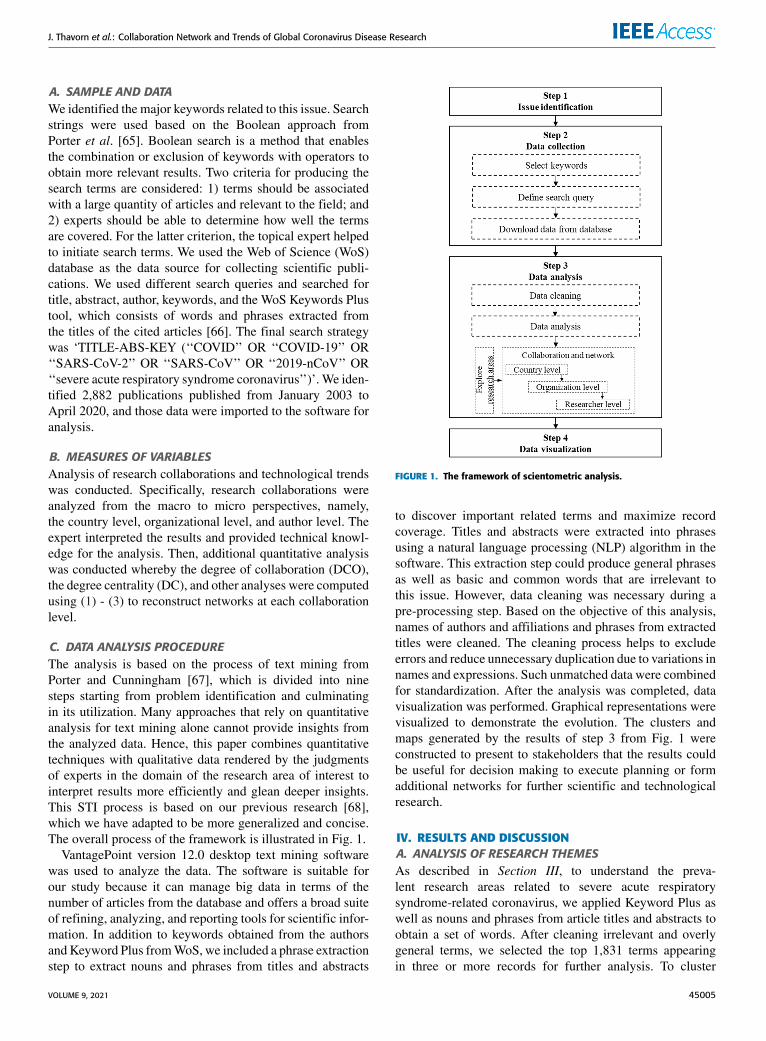
C. DATA ANALYSIS PROCEDUREThe analysis is based on the process of text mining fromPorter and Cunningham [67], which is divided into ninesteps starting from problem identification and culminatingin its utilization. Many approaches that rely on quantitativeanalysis for text mining alone cannot provide insights fromthe analyzed data. Hence, this paper combines quantitativetechniques with qualitative data rendered by the judgmentsof experts in the domain of the research area of interest tointerpret results more efficiently and glean deeper insights.This STI process is based on our previous research [68],which we have adapted to be more generalized and concise.The overall process of the framework is illustrated in Fig. 1.
VantagePoint version 12.0 desktop text mining softwarewas used to analyze the data. The software is suitable forour study because it can manage big data in terms of thenumber of articles from the database and offers a broad suiteof refining, analyzing, and reporting tools for scientific infor-mation. In addition to keywords obtained from the authorsandKeyword Plus fromWoS, we included a phrase extractionstep to extract nouns and phrases from titles and abstracts
FIGURE 1. The framework of scientometric analysis.
to discover important related terms and maximize recordcoverage. Titles and abstracts were extracted into phrasesusing a natural language processing (NLP) algorithm in thesoftware. This extraction step could produce general phrasesas well as basic and common words that are irrelevant tothis issue. However, data cleaning was necessary during apre-processing step. Based on the objective of this analysis,names of authors and affiliations and phrases from extractedtitles were cleaned. The cleaning process helps to excludeerrors and reduce unnecessary duplication due to variations innames and expressions. Such unmatched data were combinedfor standardization. After the analysis was completed, datavisualization was performed. Graphical representations werevisualized to demonstrate the evolution. The clusters andmaps generated by the results of step 3 from Fig. 1 wereconstructed to present to stakeholders that the results couldbe useful for decision making to execute planning or formadditional networks for further scientific and technologicalresearch.
IV. RESULTS AND DISCUSSIONA. ANALYSIS OF RESEARCH THEMESAs described in Section III, to understand the preva-lent research areas related to severe acute respiratorysyndrome-related coronavirus, we applied Keyword Plus aswell as nouns and phrases from article titles and abstracts toobtain a set of words. After cleaning irrelevant and overlygeneral terms, we selected the top 1,831 terms appearingin three or more records for further analysis. To cluster
VOLUME 9, 2021 45005
J. Thavorn et al.: Collaboration Network and Trends of Global Coronavirus Disease Research
TABLE 1. Cluster categories based on Web of Science and expertdeterminations.
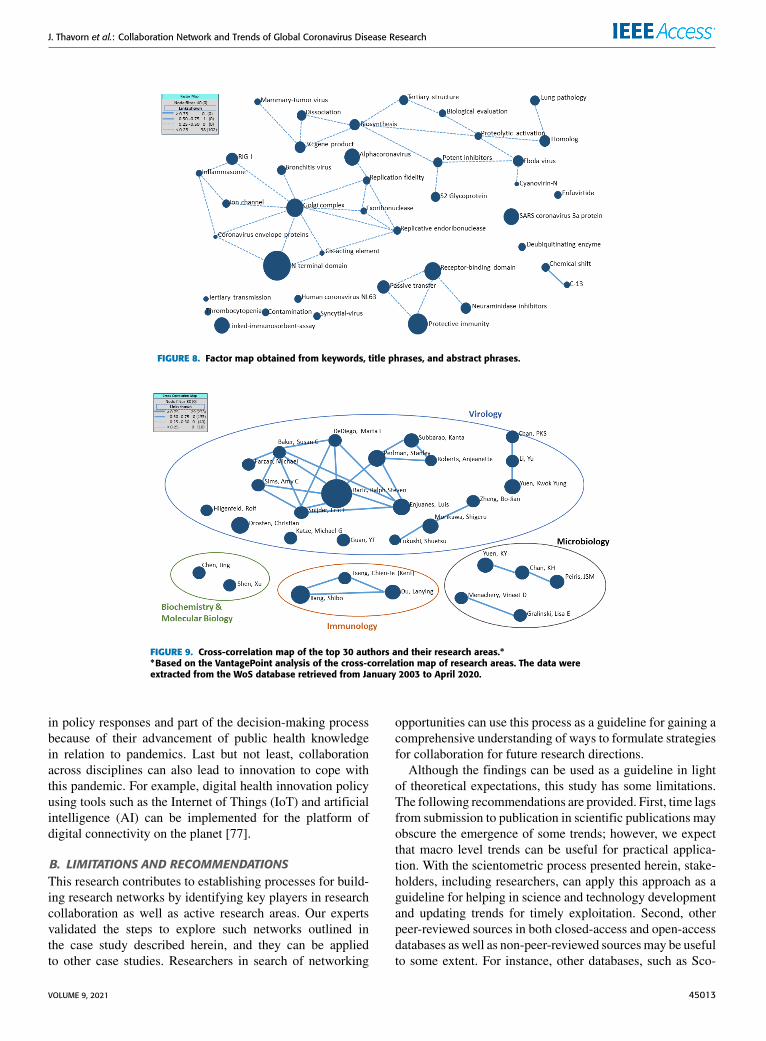
these terms, we used the factor map in VantagePoint, whichapplies the classic principal component analysis (PCA) sta-tistical technique to perform co-occurrence analysis [69].The co-occurrence analysis assisted in generating lists (callednodes) of items by combining all terms to generate signifi-cant clusters by identifying new terms with greater meaning.The result is shown in Appendix (Fig. 8), which illustrates40 nodes or clusters, each of which represents a principalcomponent or set of terms that tend to appear together.The node sizes denote relative numbers of records, and thelinkage lines represent the degree of relationship amongnodes based on a Path-Erasing algorithm [70]. Heavier linesindicate stronger relationships, whereas dashed lines indi-cate weaker relationships, and if the degree of relation-ship is below the threshold limit, the linkage line is notshown.
After that, the expert manually screened each node toprovide a better understanding of the meanings of techni-cal terms. We mapped the nodes into categories, the resultsof which are shown in Table 1. We first obtained the def-inition of each category from the Science Citation IndexExpanded (SCIE) database [71] and consulted with the expertto determine a concise definition of each category (Table 1).We identified three main nodes or categories, namely, virol-ogy, immunology, and biochemistry and molecular biology,in descending order of importance. We used these three areas
TABLE 2. Top 10 publication names and their indicators.∗
for further analysis in the collaboration and network analysisat the organizational and researcher levels. Table 2 presentsthe top 10 publication names along with the numbers ofpublished papers and their H-indices based on the SCImagojournal rank (SJR) database (https://www.scimagojr.com/),which identifies the scientific indicators of Scopus-indexedjournals as generated from information in that database. Theresults in Table 2 were analyzed based on data retrieved fromthe WoS database. Different databases could lead to differentresults and rankings.
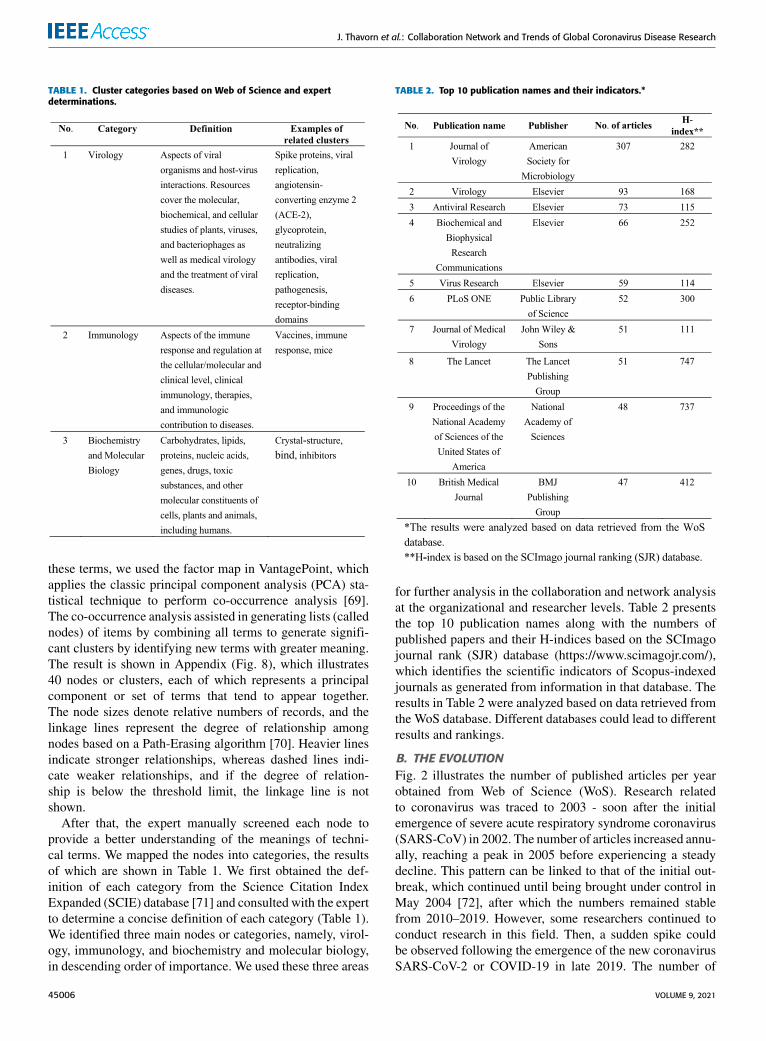
B. THE EVOLUTIONFig. 2 illustrates the number of published articles per yearobtained from Web of Science (WoS). Research relatedto coronavirus was traced to 2003 - soon after the initialemergence of severe acute respiratory syndrome coronavirus(SARS-CoV) in 2002. The number of articles increased annu-ally, reaching a peak in 2005 before experiencing a steadydecline. This pattern can be linked to that of the initial out-break, which continued until being brought under control inMay 2004 [72], after which the numbers remained stablefrom 2010–2019. However, some researchers continued toconduct research in this field. Then, a sudden spike couldbe observed following the emergence of the new coronavirusSARS-CoV-2 or COVID-19 in late 2019. The number of
45006 VOLUME 9, 2021
J. Thavorn et al.: Collaboration Network and Trends of Global Coronavirus Disease Research
FIGURE 2. Evolutionary trend of coronavirus research from 2003 toApril 2020.
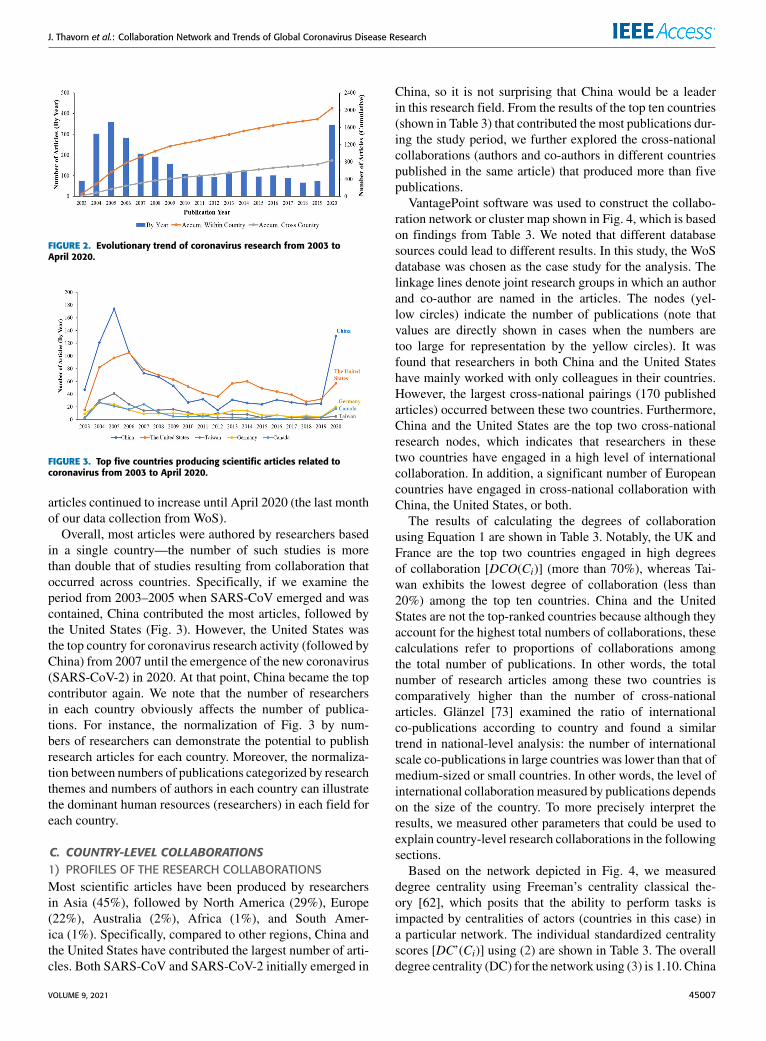
FIGURE 3. Top five countries producing scientific articles related tocoronavirus from 2003 to April 2020.
articles continued to increase until April 2020 (the last monthof our data collection from WoS).
Overall, most articles were authored by researchers basedin a single country—the number of such studies is morethan double that of studies resulting from collaboration thatoccurred across countries. Specifically, if we examine theperiod from 2003–2005 when SARS-CoV emerged and wascontained, China contributed the most articles, followed bythe United States (Fig. 3). However, the United States wasthe top country for coronavirus research activity (followed byChina) from 2007 until the emergence of the new coronavirus(SARS-CoV-2) in 2020. At that point, China became the topcontributor again. We note that the number of researchersin each country obviously affects the number of publica-tions. For instance, the normalization of Fig. 3 by num-bers of researchers can demonstrate the potential to publishresearch articles for each country. Moreover, the normaliza-tion between numbers of publications categorized by researchthemes and numbers of authors in each country can illustratethe dominant human resources (researchers) in each field foreach country.
C. COUNTRY-LEVEL COLLABORATIONS1) PROFILES OF THE RESEARCH COLLABORATIONSMost scientific articles have been produced by researchersin Asia (45%), followed by North America (29%), Europe(22%), Australia (2%), Africa (1%), and South Amer-ica (1%). Specifically, compared to other regions, China andthe United States have contributed the largest number of arti-cles. Both SARS-CoV and SARS-CoV-2 initially emerged in
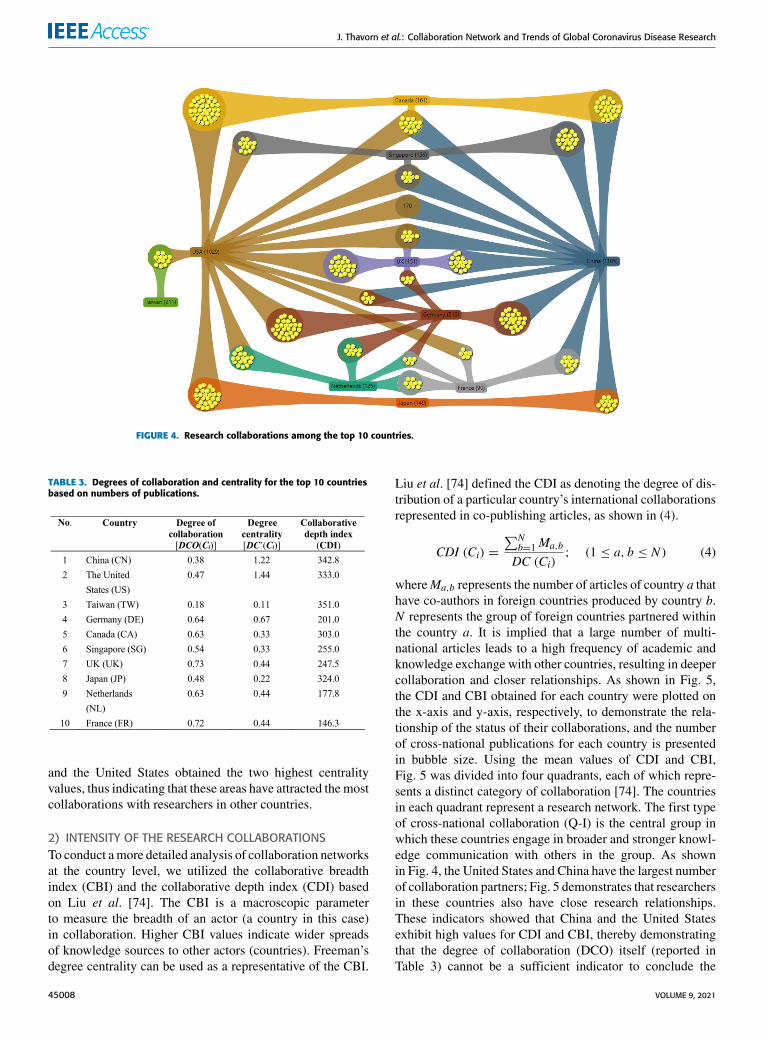
China, so it is not surprising that China would be a leaderin this research field. From the results of the top ten countries(shown in Table 3) that contributed the most publications dur-ing the study period, we further explored the cross-nationalcollaborations (authors and co-authors in different countriespublished in the same article) that produced more than fivepublications.
VantagePoint software was used to construct the collabo-ration network or cluster map shown in Fig. 4, which is basedon findings from Table 3. We noted that different databasesources could lead to different results. In this study, the WoSdatabase was chosen as the case study for the analysis. Thelinkage lines denote joint research groups in which an authorand co-author are named in the articles. The nodes (yel-low circles) indicate the number of publications (note thatvalues are directly shown in cases when the numbers aretoo large for representation by the yellow circles). It wasfound that researchers in both China and the United Stateshave mainly worked with only colleagues in their countries.However, the largest cross-national pairings (170 publishedarticles) occurred between these two countries. Furthermore,China and the United States are the top two cross-nationalresearch nodes, which indicates that researchers in thesetwo countries have engaged in a high level of internationalcollaboration. In addition, a significant number of Europeancountries have engaged in cross-national collaboration withChina, the United States, or both.
The results of calculating the degrees of collaborationusing Equation 1 are shown in Table 3. Notably, the UK andFrance are the top two countries engaged in high degreesof collaboration [DCO(Ci)] (more than 70%), whereas Tai-wan exhibits the lowest degree of collaboration (less than20%) among the top ten countries. China and the UnitedStates are not the top-ranked countries because although theyaccount for the highest total numbers of collaborations, thesecalculations refer to proportions of collaborations amongthe total number of publications. In other words, the totalnumber of research articles among these two countries iscomparatively higher than the number of cross-nationalarticles. Glänzel [73] examined the ratio of internationalco-publications according to country and found a similartrend in national-level analysis: the number of internationalscale co-publications in large countries was lower than that ofmedium-sized or small countries. In other words, the level ofinternational collaborationmeasured by publications dependson the size of the country. To more precisely interpret theresults, we measured other parameters that could be used toexplain country-level research collaborations in the followingsections.
Based on the network depicted in Fig. 4, we measureddegree centrality using Freeman’s centrality classical the-ory [62], which posits that the ability to perform tasks isimpacted by centralities of actors (countries in this case) ina particular network. The individual standardized centralityscores [DC’(Ci)] using (2) are shown in Table 3. The overalldegree centrality (DC) for the network using (3) is 1.10. China
VOLUME 9, 2021 45007
J. Thavorn et al.: Collaboration Network and Trends of Global Coronavirus Disease Research
FIGURE 4. Research collaborations among the top 10 countries.
TABLE 3. Degrees of collaboration and centrality for the top 10 countriesbased on numbers of publications.
and the United States obtained the two highest centralityvalues, thus indicating that these areas have attracted the mostcollaborations with researchers in other countries.
2) INTENSITY OF THE RESEARCH COLLABORATIONSTo conduct amore detailed analysis of collaboration networksat the country level, we utilized the collaborative breadthindex (CBI) and the collaborative depth index (CDI) basedon Liu et al. [74]. The CBI is a macroscopic parameterto measure the breadth of an actor (a country in this case)in collaboration. Higher CBI values indicate wider spreadsof knowledge sources to other actors (countries). Freeman’sdegree centrality can be used as a representative of the CBI.
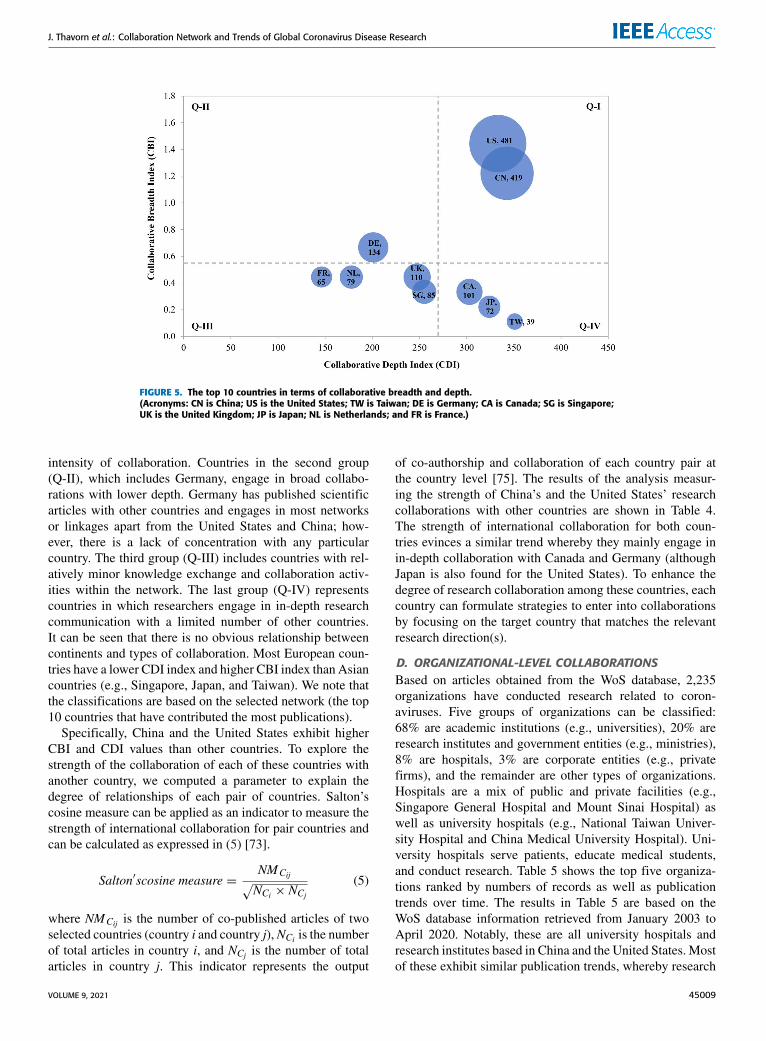
Liu et al. [74] defined the CDI as denoting the degree of dis-tribution of a particular country’s international collaborationsrepresented in co-publishing articles, as shown in (4).
CDI (Ci) =
∑Nb=1Ma,b
DC (Ci); (1 ≤ a, b ≤ N ) (4)
whereMa,b represents the number of articles of country a thathave co-authors in foreign countries produced by country b.N represents the group of foreign countries partnered withinthe country a. It is implied that a large number of multi-national articles leads to a high frequency of academic andknowledge exchange with other countries, resulting in deepercollaboration and closer relationships. As shown in Fig. 5,the CDI and CBI obtained for each country were plotted onthe x-axis and y-axis, respectively, to demonstrate the rela-tionship of the status of their collaborations, and the numberof cross-national publications for each country is presentedin bubble size. Using the mean values of CDI and CBI,Fig. 5 was divided into four quadrants, each of which repre-sents a distinct category of collaboration [74]. The countriesin each quadrant represent a research network. The first typeof cross-national collaboration (Q-I) is the central group inwhich these countries engage in broader and stronger knowl-edge communication with others in the group. As shownin Fig. 4, the United States and China have the largest numberof collaboration partners; Fig. 5 demonstrates that researchersin these countries also have close research relationships.These indicators showed that China and the United Statesexhibit high values for CDI and CBI, thereby demonstratingthat the degree of collaboration (DCO) itself (reported inTable 3) cannot be a sufficient indicator to conclude the
45008 VOLUME 9, 2021
J. Thavorn et al.: Collaboration Network and Trends of Global Coronavirus Disease Research
FIGURE 5. The top 10 countries in terms of collaborative breadth and depth.(Acronyms: CN is China; US is the United States; TW is Taiwan; DE is Germany; CA is Canada; SG is Singapore;UK is the United Kingdom; JP is Japan; NL is Netherlands; and FR is France.)
intensity of collaboration. Countries in the second group(Q-II), which includes Germany, engage in broad collabo-rations with lower depth. Germany has published scientificarticles with other countries and engages in most networksor linkages apart from the United States and China; how-ever, there is a lack of concentration with any particularcountry. The third group (Q-III) includes countries with rel-atively minor knowledge exchange and collaboration activ-ities within the network. The last group (Q-IV) representscountries in which researchers engage in in-depth researchcommunication with a limited number of other countries.It can be seen that there is no obvious relationship betweencontinents and types of collaboration. Most European coun-tries have a lower CDI index and higher CBI index than Asiancountries (e.g., Singapore, Japan, and Taiwan). We note thatthe classifications are based on the selected network (the top10 countries that have contributed the most publications).
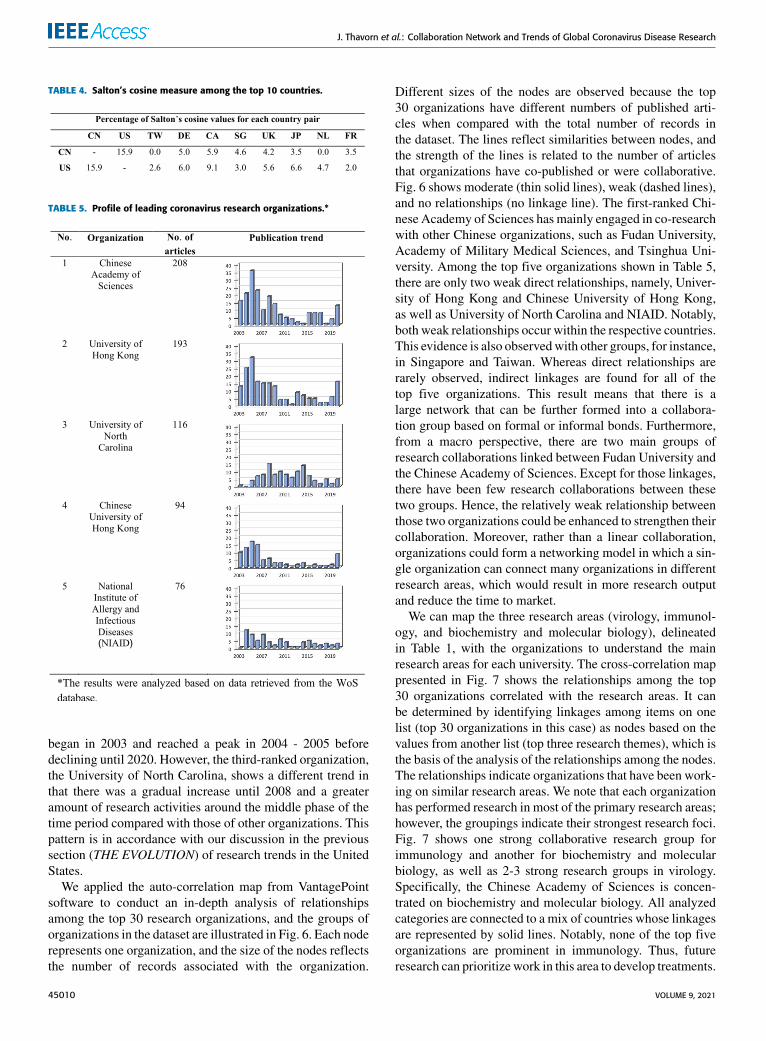
Specifically, China and the United States exhibit higherCBI and CDI values than other countries. To explore thestrength of the collaboration of each of these countries withanother country, we computed a parameter to explain thedegree of relationships of each pair of countries. Salton’scosine measure can be applied as an indicator to measure thestrength of international collaboration for pair countries andcan be calculated as expressed in (5) [73].
Salton′scosine measure =NMCij√NCi × NCj
(5)
where NMCij is the number of co-published articles of twoselected countries (country i and country j),NCi is the numberof total articles in country i, and NCj is the number of totalarticles in country j. This indicator represents the output
of co-authorship and collaboration of each country pair atthe country level [75]. The results of the analysis measur-ing the strength of China’s and the United States’ researchcollaborations with other countries are shown in Table 4.The strength of international collaboration for both coun-tries evinces a similar trend whereby they mainly engage inin-depth collaboration with Canada and Germany (althoughJapan is also found for the United States). To enhance thedegree of research collaboration among these countries, eachcountry can formulate strategies to enter into collaborationsby focusing on the target country that matches the relevantresearch direction(s).
D. ORGANIZATIONAL-LEVEL COLLABORATIONSBased on articles obtained from the WoS database, 2,235organizations have conducted research related to coron-aviruses. Five groups of organizations can be classified:68% are academic institutions (e.g., universities), 20% areresearch institutes and government entities (e.g., ministries),8% are hospitals, 3% are corporate entities (e.g., privatefirms), and the remainder are other types of organizations.Hospitals are a mix of public and private facilities (e.g.,Singapore General Hospital and Mount Sinai Hospital) aswell as university hospitals (e.g., National Taiwan Univer-sity Hospital and China Medical University Hospital). Uni-versity hospitals serve patients, educate medical students,and conduct research. Table 5 shows the top five organiza-tions ranked by numbers of records as well as publicationtrends over time. The results in Table 5 are based on theWoS database information retrieved from January 2003 toApril 2020. Notably, these are all university hospitals andresearch institutes based in China and the United States. Mostof these exhibit similar publication trends, whereby research
VOLUME 9, 2021 45009
J. Thavorn et al.: Collaboration Network and Trends of Global Coronavirus Disease Research
TABLE 4. Salton’s cosine measure among the top 10 countries.
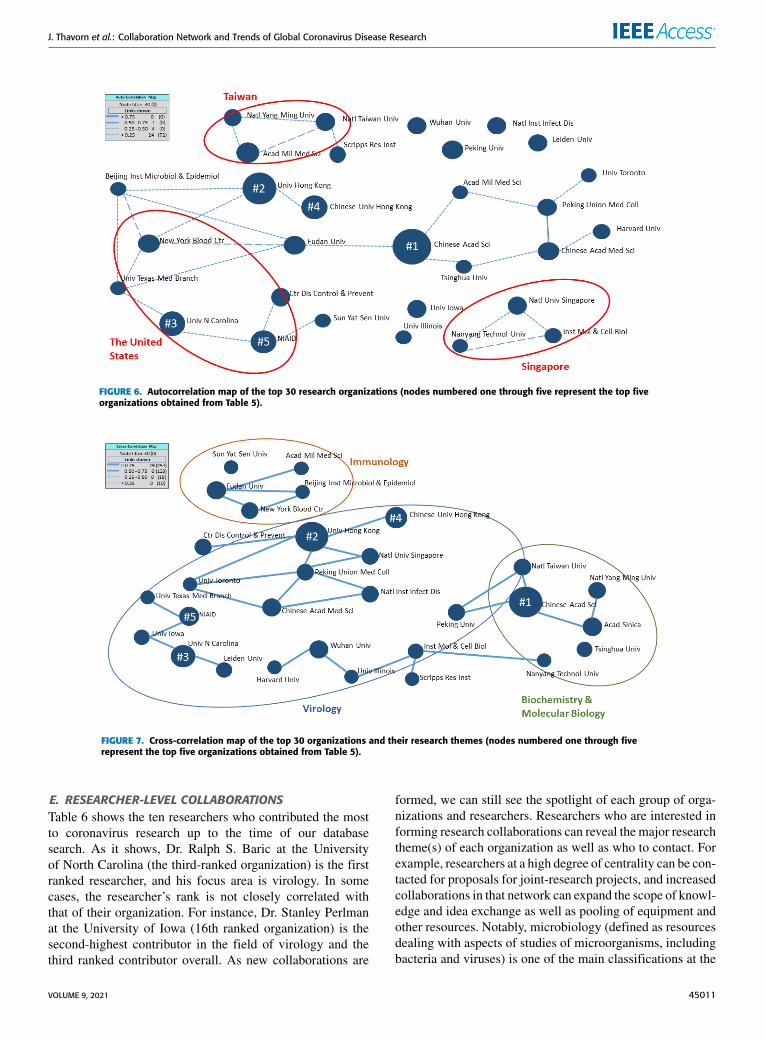
TABLE 5. Profile of leading coronavirus research organizations.∗
began in 2003 and reached a peak in 2004 - 2005 beforedeclining until 2020. However, the third-ranked organization,the University of North Carolina, shows a different trend inthat there was a gradual increase until 2008 and a greateramount of research activities around the middle phase of thetime period compared with those of other organizations. Thispattern is in accordance with our discussion in the previoussection (THE EVOLUTION) of research trends in the UnitedStates.
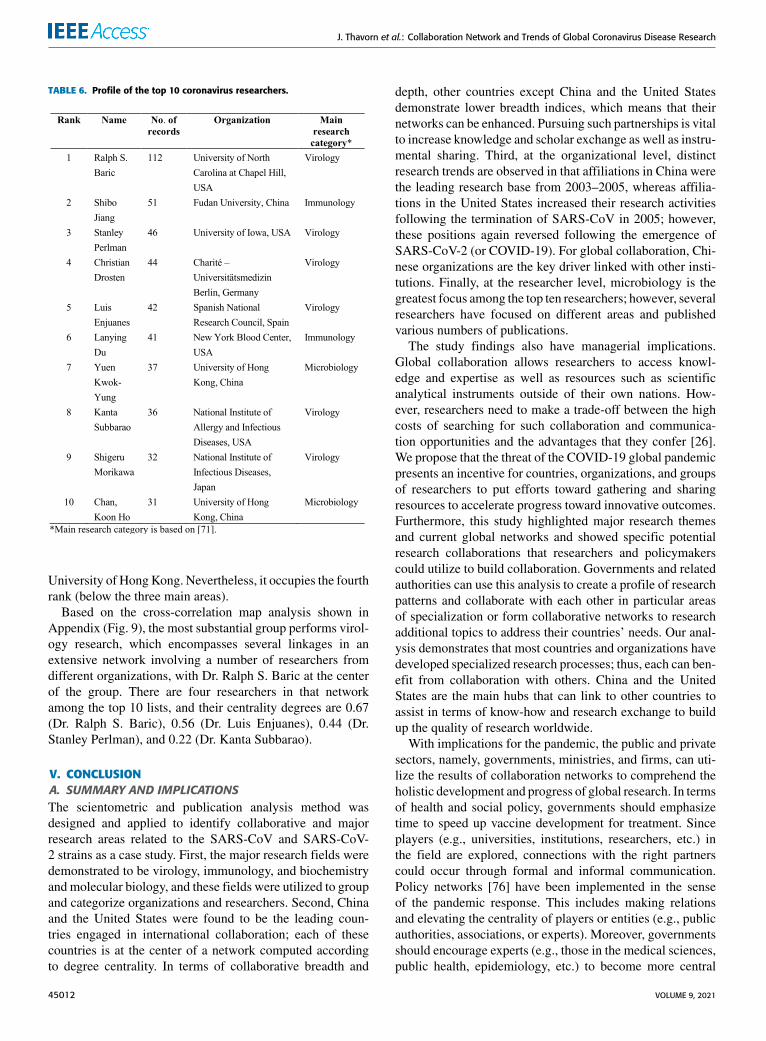
We applied the auto-correlation map from VantagePointsoftware to conduct an in-depth analysis of relationshipsamong the top 30 research organizations, and the groups oforganizations in the dataset are illustrated in Fig. 6. Each noderepresents one organization, and the size of the nodes reflectsthe number of records associated with the organization.
Different sizes of the nodes are observed because the top30 organizations have different numbers of published arti-cles when compared with the total number of records inthe dataset. The lines reflect similarities between nodes, andthe strength of the lines is related to the number of articlesthat organizations have co-published or were collaborative.Fig. 6 shows moderate (thin solid lines), weak (dashed lines),and no relationships (no linkage line). The first-ranked Chi-nese Academy of Sciences has mainly engaged in co-researchwith other Chinese organizations, such as Fudan University,Academy of Military Medical Sciences, and Tsinghua Uni-versity. Among the top five organizations shown in Table 5,there are only two weak direct relationships, namely, Univer-sity of Hong Kong and Chinese University of Hong Kong,as well as University of North Carolina and NIAID. Notably,both weak relationships occur within the respective countries.This evidence is also observedwith other groups, for instance,in Singapore and Taiwan. Whereas direct relationships arerarely observed, indirect linkages are found for all of thetop five organizations. This result means that there is alarge network that can be further formed into a collabora-tion group based on formal or informal bonds. Furthermore,from a macro perspective, there are two main groups ofresearch collaborations linked between Fudan University andthe Chinese Academy of Sciences. Except for those linkages,there have been few research collaborations between thesetwo groups. Hence, the relatively weak relationship betweenthose two organizations could be enhanced to strengthen theircollaboration. Moreover, rather than a linear collaboration,organizations could form a networking model in which a sin-gle organization can connect many organizations in differentresearch areas, which would result in more research outputand reduce the time to market.
We can map the three research areas (virology, immunol-ogy, and biochemistry and molecular biology), delineatedin Table 1, with the organizations to understand the mainresearch areas for each university. The cross-correlation mappresented in Fig. 7 shows the relationships among the top30 organizations correlated with the research areas. It canbe determined by identifying linkages among items on onelist (top 30 organizations in this case) as nodes based on thevalues from another list (top three research themes), which isthe basis of the analysis of the relationships among the nodes.The relationships indicate organizations that have been work-ing on similar research areas. We note that each organizationhas performed research in most of the primary research areas;however, the groupings indicate their strongest research foci.Fig. 7 shows one strong collaborative research group forimmunology and another for biochemistry and molecularbiology, as well as 2-3 strong research groups in virology.Specifically, the Chinese Academy of Sciences is concen-trated on biochemistry and molecular biology. All analyzedcategories are connected to a mix of countries whose linkagesare represented by solid lines. Notably, none of the top fiveorganizations are prominent in immunology. Thus, futureresearch can prioritize work in this area to develop treatments.
45010 VOLUME 9, 2021
J. Thavorn et al.: Collaboration Network and Trends of Global Coronavirus Disease Research
FIGURE 6. Autocorrelation map of the top 30 research organizations (nodes numbered one through five represent the top fiveorganizations obtained from Table 5).
FIGURE 7. Cross-correlation map of the top 30 organizations and their research themes (nodes numbered one through fiverepresent the top five organizations obtained from Table 5).
E. RESEARCHER-LEVEL COLLABORATIONSTable 6 shows the ten researchers who contributed the mostto coronavirus research up to the time of our databasesearch. As it shows, Dr. Ralph S. Baric at the Universityof North Carolina (the third-ranked organization) is the firstranked researcher, and his focus area is virology. In somecases, the researcher’s rank is not closely correlated withthat of their organization. For instance, Dr. Stanley Perlmanat the University of Iowa (16th ranked organization) is thesecond-highest contributor in the field of virology and thethird ranked contributor overall. As new collaborations are
formed, we can still see the spotlight of each group of orga-nizations and researchers. Researchers who are interested informing research collaborations can reveal the major researchtheme(s) of each organization as well as who to contact. Forexample, researchers at a high degree of centrality can be con-tacted for proposals for joint-research projects, and increasedcollaborations in that network can expand the scope of knowl-edge and idea exchange as well as pooling of equipment andother resources. Notably, microbiology (defined as resourcesdealing with aspects of studies of microorganisms, includingbacteria and viruses) is one of the main classifications at the
VOLUME 9, 2021 45011
J. Thavorn et al.: Collaboration Network and Trends of Global Coronavirus Disease Research
TABLE 6. Profile of the top 10 coronavirus researchers.
University of HongKong. Nevertheless, it occupies the fourthrank (below the three main areas).
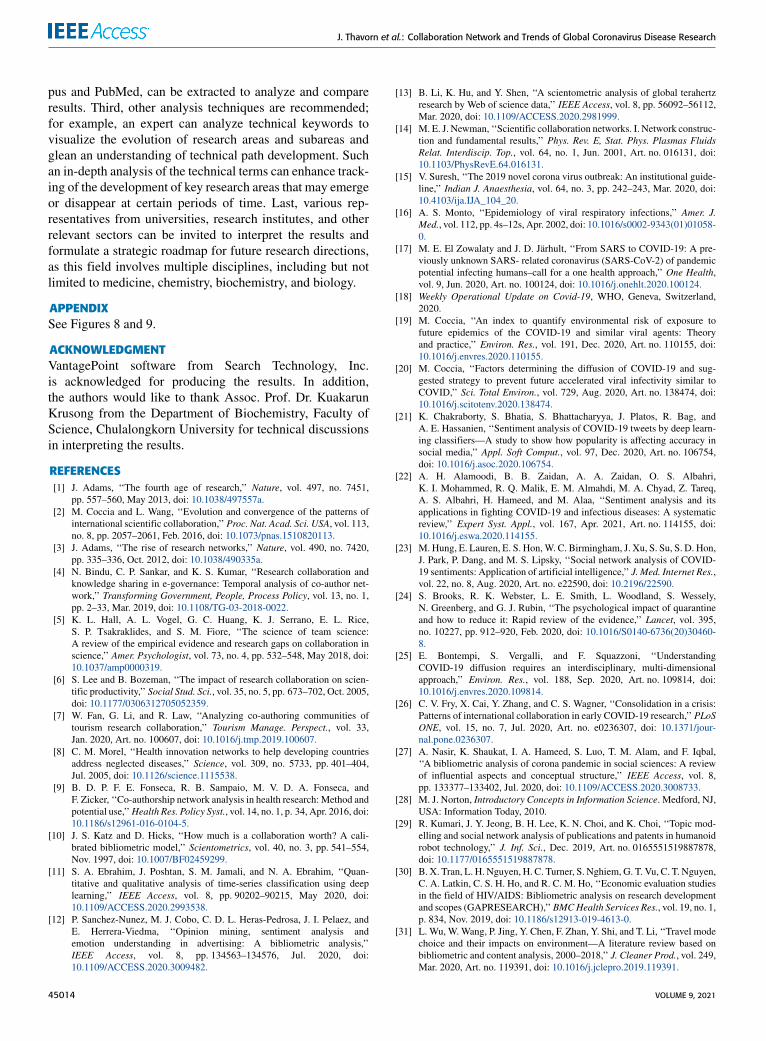
Based on the cross-correlation map analysis shown inAppendix (Fig. 9), the most substantial group performs virol-ogy research, which encompasses several linkages in anextensive network involving a number of researchers fromdifferent organizations, with Dr. Ralph S. Baric at the centerof the group. There are four researchers in that networkamong the top 10 lists, and their centrality degrees are 0.67(Dr. Ralph S. Baric), 0.56 (Dr. Luis Enjuanes), 0.44 (Dr.Stanley Perlman), and 0.22 (Dr. Kanta Subbarao).
V. CONCLUSIONA. SUMMARY AND IMPLICATIONSThe scientometric and publication analysis method wasdesigned and applied to identify collaborative and majorresearch areas related to the SARS-CoV and SARS-CoV-2 strains as a case study. First, the major research fields weredemonstrated to be virology, immunology, and biochemistryand molecular biology, and these fields were utilized to groupand categorize organizations and researchers. Second, Chinaand the United States were found to be the leading coun-tries engaged in international collaboration; each of thesecountries is at the center of a network computed accordingto degree centrality. In terms of collaborative breadth and
depth, other countries except China and the United Statesdemonstrate lower breadth indices, which means that theirnetworks can be enhanced. Pursuing such partnerships is vitalto increase knowledge and scholar exchange as well as instru-mental sharing. Third, at the organizational level, distinctresearch trends are observed in that affiliations in China werethe leading research base from 2003–2005, whereas affilia-tions in the United States increased their research activitiesfollowing the termination of SARS-CoV in 2005; however,these positions again reversed following the emergence ofSARS-CoV-2 (or COVID-19). For global collaboration, Chi-nese organizations are the key driver linked with other insti-tutions. Finally, at the researcher level, microbiology is thegreatest focus among the top ten researchers; however, severalresearchers have focused on different areas and publishedvarious numbers of publications.
The study findings also have managerial implications.Global collaboration allows researchers to access knowl-edge and expertise as well as resources such as scientificanalytical instruments outside of their own nations. How-ever, researchers need to make a trade-off between the highcosts of searching for such collaboration and communica-tion opportunities and the advantages that they confer [26].We propose that the threat of the COVID-19 global pandemicpresents an incentive for countries, organizations, and groupsof researchers to put efforts toward gathering and sharingresources to accelerate progress toward innovative outcomes.Furthermore, this study highlighted major research themesand current global networks and showed specific potentialresearch collaborations that researchers and policymakerscould utilize to build collaboration. Governments and relatedauthorities can use this analysis to create a profile of researchpatterns and collaborate with each other in particular areasof specialization or form collaborative networks to researchadditional topics to address their countries’ needs. Our anal-ysis demonstrates that most countries and organizations havedeveloped specialized research processes; thus, each can ben-efit from collaboration with others. China and the UnitedStates are the main hubs that can link to other countries toassist in terms of know-how and research exchange to buildup the quality of research worldwide.
With implications for the pandemic, the public and privatesectors, namely, governments, ministries, and firms, can uti-lize the results of collaboration networks to comprehend theholistic development and progress of global research. In termsof health and social policy, governments should emphasizetime to speed up vaccine development for treatment. Sinceplayers (e.g., universities, institutions, researchers, etc.) inthe field are explored, connections with the right partnerscould occur through formal and informal communication.Policy networks [76] have been implemented in the senseof the pandemic response. This includes making relationsand elevating the centrality of players or entities (e.g., publicauthorities, associations, or experts). Moreover, governmentsshould encourage experts (e.g., those in the medical sciences,public health, epidemiology, etc.) to become more central
45012 VOLUME 9, 2021
J. Thavorn et al.: Collaboration Network and Trends of Global Coronavirus Disease Research
FIGURE 8. Factor map obtained from keywords, title phrases, and abstract phrases.
FIGURE 9. Cross-correlation map of the top 30 authors and their research areas.∗∗Based on the VantagePoint analysis of the cross-correlation map of research areas. The data wereextracted from the WoS database retrieved from January 2003 to April 2020.
in policy responses and part of the decision-making processbecause of their advancement of public health knowledgein relation to pandemics. Last but not least, collaborationacross disciplines can also lead to innovation to cope withthis pandemic. For example, digital health innovation policyusing tools such as the Internet of Things (IoT) and artificialintelligence (AI) can be implemented for the platform ofdigital connectivity on the planet [77].
B. LIMITATIONS AND RECOMMENDATIONSThis research contributes to establishing processes for build-ing research networks by identifying key players in researchcollaboration as well as active research areas. Our expertsvalidated the steps to explore such networks outlined inthe case study described herein, and they can be appliedto other case studies. Researchers in search of networking
opportunities can use this process as a guideline for gaining acomprehensive understanding of ways to formulate strategiesfor collaboration for future research directions.
Although the findings can be used as a guideline in lightof theoretical expectations, this study has some limitations.The following recommendations are provided. First, time lagsfrom submission to publication in scientific publications mayobscure the emergence of some trends; however, we expectthat macro level trends can be useful for practical applica-tion. With the scientometric process presented herein, stake-holders, including researchers, can apply this approach as aguideline for helping in science and technology developmentand updating trends for timely exploitation. Second, otherpeer-reviewed sources in both closed-access and open-accessdatabases as well as non-peer-reviewed sourcesmay be usefulto some extent. For instance, other databases, such as Sco-
VOLUME 9, 2021 45013
J. Thavorn et al.: Collaboration Network and Trends of Global Coronavirus Disease Research
pus and PubMed, can be extracted to analyze and compareresults. Third, other analysis techniques are recommended;for example, an expert can analyze technical keywords tovisualize the evolution of research areas and subareas andglean an understanding of technical path development. Suchan in-depth analysis of the technical terms can enhance track-ing of the development of key research areas that may emergeor disappear at certain periods of time. Last, various rep-resentatives from universities, research institutes, and otherrelevant sectors can be invited to interpret the results andformulate a strategic roadmap for future research directions,as this field involves multiple disciplines, including but notlimited to medicine, chemistry, biochemistry, and biology.
APPENDIXSee Figures 8 and 9.
ACKNOWLEDGMENTVantagePoint software from Search Technology, Inc.is acknowledged for producing the results. In addition,the authors would like to thank Assoc. Prof. Dr. KuakarunKrusong from the Department of Biochemistry, Faculty ofScience, Chulalongkorn University for technical discussionsin interpreting the results.
REFERENCES[1] J. Adams, ‘‘The fourth age of research,’’ Nature, vol. 497, no. 7451,
pp. 557–560, May 2013, doi: 10.1038/497557a.[2] M. Coccia and L. Wang, ‘‘Evolution and convergence of the patterns of
international scientific collaboration,’’ Proc. Nat. Acad. Sci. USA, vol. 113,no. 8, pp. 2057–2061, Feb. 2016, doi: 10.1073/pnas.1510820113.
[3] J. Adams, ‘‘The rise of research networks,’’ Nature, vol. 490, no. 7420,pp. 335–336, Oct. 2012, doi: 10.1038/490335a.
[4] N. Bindu, C. P. Sankar, and K. S. Kumar, ‘‘Research collaboration andknowledge sharing in e-governance: Temporal analysis of co-author net-work,’’ Transforming Government, People, Process Policy, vol. 13, no. 1,pp. 2–33, Mar. 2019, doi: 10.1108/TG-03-2018-0022.
[5] K. L. Hall, A. L. Vogel, G. C. Huang, K. J. Serrano, E. L. Rice,S. P. Tsakraklides, and S. M. Fiore, ‘‘The science of team science:A review of the empirical evidence and research gaps on collaboration inscience,’’ Amer. Psychologist, vol. 73, no. 4, pp. 532–548, May 2018, doi:10.1037/amp0000319.
[6] S. Lee and B. Bozeman, ‘‘The impact of research collaboration on scien-tific productivity,’’ Social Stud. Sci., vol. 35, no. 5, pp. 673–702, Oct. 2005,doi: 10.1177/0306312705052359.
[7] W. Fan, G. Li, and R. Law, ‘‘Analyzing co-authoring communities oftourism research collaboration,’’ Tourism Manage. Perspect., vol. 33,Jan. 2020, Art. no. 100607, doi: 10.1016/j.tmp.2019.100607.
[8] C. M. Morel, ‘‘Health innovation networks to help developing countriesaddress neglected diseases,’’ Science, vol. 309, no. 5733, pp. 401–404,Jul. 2005, doi: 10.1126/science.1115538.
[9] B. D. P. F. E. Fonseca, R. B. Sampaio, M. V. D. A. Fonseca, andF. Zicker, ‘‘Co-authorship network analysis in health research: Method andpotential use,’’Health Res. Policy Syst., vol. 14, no. 1, p. 34, Apr. 2016, doi:10.1186/s12961-016-0104-5.
[10] J. S. Katz and D. Hicks, ‘‘How much is a collaboration worth? A cali-brated bibliometric model,’’ Scientometrics, vol. 40, no. 3, pp. 541–554,Nov. 1997, doi: 10.1007/BF02459299.
[11] S. A. Ebrahim, J. Poshtan, S. M. Jamali, and N. A. Ebrahim, ‘‘Quan-titative and qualitative analysis of time-series classification using deeplearning,’’ IEEE Access, vol. 8, pp. 90202–90215, May 2020, doi:10.1109/ACCESS.2020.2993538.
[12] P. Sanchez-Nunez, M. J. Cobo, C. D. L. Heras-Pedrosa, J. I. Pelaez, andE. Herrera-Viedma, ‘‘Opinion mining, sentiment analysis andemotion understanding in advertising: A bibliometric analysis,’’IEEE Access, vol. 8, pp. 134563–134576, Jul. 2020, doi:10.1109/ACCESS.2020.3009482.
[13] B. Li, K. Hu, and Y. Shen, ‘‘A scientometric analysis of global terahertzresearch by Web of science data,’’ IEEE Access, vol. 8, pp. 56092–56112,Mar. 2020, doi: 10.1109/ACCESS.2020.2981999.
[14] M. E. J. Newman, ‘‘Scientific collaboration networks. I. Network construc-tion and fundamental results,’’ Phys. Rev. E, Stat. Phys. Plasmas FluidsRelat. Interdiscip. Top., vol. 64, no. 1, Jun. 2001, Art. no. 016131, doi:10.1103/PhysRevE.64.016131.
[15] V. Suresh, ‘‘The 2019 novel corona virus outbreak: An institutional guide-line,’’ Indian J. Anaesthesia, vol. 64, no. 3, pp. 242–243, Mar. 2020, doi:10.4103/ija.IJA_104_20.
[16] A. S. Monto, ‘‘Epidemiology of viral respiratory infections,’’ Amer. J.Med., vol. 112, pp. 4s–12s, Apr. 2002, doi: 10.1016/s0002-9343(01)01058-0.
[17] M. E. El Zowalaty and J. D. Järhult, ‘‘From SARS to COVID-19: A pre-viously unknown SARS- related coronavirus (SARS-CoV-2) of pandemicpotential infecting humans–call for a one health approach,’’ One Health,vol. 9, Jun. 2020, Art. no. 100124, doi: 10.1016/j.onehlt.2020.100124.
[18] Weekly Operational Update on Covid-19, WHO, Geneva, Switzerland,2020.
[19] M. Coccia, ‘‘An index to quantify environmental risk of exposure tofuture epidemics of the COVID-19 and similar viral agents: Theoryand practice,’’ Environ. Res., vol. 191, Dec. 2020, Art. no. 110155, doi:10.1016/j.envres.2020.110155.
[20] M. Coccia, ‘‘Factors determining the diffusion of COVID-19 and sug-gested strategy to prevent future accelerated viral infectivity similar toCOVID,’’ Sci. Total Environ., vol. 729, Aug. 2020, Art. no. 138474, doi:10.1016/j.scitotenv.2020.138474.
[21] K. Chakraborty, S. Bhatia, S. Bhattacharyya, J. Platos, R. Bag, andA. E. Hassanien, ‘‘Sentiment analysis of COVID-19 tweets by deep learn-ing classifiers—A study to show how popularity is affecting accuracy insocial media,’’ Appl. Soft Comput., vol. 97, Dec. 2020, Art. no. 106754,doi: 10.1016/j.asoc.2020.106754.
[22] A. H. Alamoodi, B. B. Zaidan, A. A. Zaidan, O. S. Albahri,K. I. Mohammed, R. Q. Malik, E. M. Almahdi, M. A. Chyad, Z. Tareq,A. S. Albahri, H. Hameed, and M. Alaa, ‘‘Sentiment analysis and itsapplications in fighting COVID-19 and infectious diseases: A systematicreview,’’ Expert Syst. Appl., vol. 167, Apr. 2021, Art. no. 114155, doi:10.1016/j.eswa.2020.114155.
[23] M. Hung, E. Lauren, E. S. Hon,W. C. Birmingham, J. Xu, S. Su, S. D. Hon,J. Park, P. Dang, and M. S. Lipsky, ‘‘Social network analysis of COVID-19 sentiments: Application of artificial intelligence,’’ J. Med. Internet Res.,vol. 22, no. 8, Aug. 2020, Art. no. e22590, doi: 10.2196/22590.
[24] S. Brooks, R. K. Webster, L. E. Smith, L. Woodland, S. Wessely,N. Greenberg, and G. J. Rubin, ‘‘The psychological impact of quarantineand how to reduce it: Rapid review of the evidence,’’ Lancet, vol. 395,no. 10227, pp. 912–920, Feb. 2020, doi: 10.1016/S0140-6736(20)30460-8.
[25] E. Bontempi, S. Vergalli, and F. Squazzoni, ‘‘UnderstandingCOVID-19 diffusion requires an interdisciplinary, multi-dimensionalapproach,’’ Environ. Res., vol. 188, Sep. 2020, Art. no. 109814, doi:10.1016/j.envres.2020.109814.
[26] C. V. Fry, X. Cai, Y. Zhang, and C. S. Wagner, ‘‘Consolidation in a crisis:Patterns of international collaboration in early COVID-19 research,’’ PLoSONE, vol. 15, no. 7, Jul. 2020, Art. no. e0236307, doi: 10.1371/jour-nal.pone.0236307.
[27] A. Nasir, K. Shaukat, I. A. Hameed, S. Luo, T. M. Alam, and F. Iqbal,‘‘A bibliometric analysis of corona pandemic in social sciences: A reviewof influential aspects and conceptual structure,’’ IEEE Access, vol. 8,pp. 133377–133402, Jul. 2020, doi: 10.1109/ACCESS.2020.3008733.
[28] M. J. Norton, Introductory Concepts in Information Science. Medford, NJ,USA: Information Today, 2010.
[29] R. Kumari, J. Y. Jeong, B. H. Lee, K. N. Choi, and K. Choi, ‘‘Topic mod-elling and social network analysis of publications and patents in humanoidrobot technology,’’ J. Inf. Sci., Dec. 2019, Art. no. 0165551519887878,doi: 10.1177/0165551519887878.
[30] B. X. Tran, L. H. Nguyen, H. C. Turner, S. Nghiem, G. T. Vu, C. T. Nguyen,C. A. Latkin, C. S. H. Ho, and R. C. M. Ho, ‘‘Economic evaluation studiesin the field of HIV/AIDS: Bibliometric analysis on research developmentand scopes (GAPRESEARCH),’’ BMCHealth Services Res., vol. 19, no. 1,p. 834, Nov. 2019, doi: 10.1186/s12913-019-4613-0.
[31] L. Wu, W.Wang, P. Jing, Y. Chen, F. Zhan, Y. Shi, and T. Li, ‘‘Travel modechoice and their impacts on environment—A literature review based onbibliometric and content analysis, 2000–2018,’’ J. Cleaner Prod., vol. 249,Mar. 2020, Art. no. 119391, doi: 10.1016/j.jclepro.2019.119391.
45014 VOLUME 9, 2021
J. Thavorn et al.: Collaboration Network and Trends of Global Coronavirus Disease Research
[32] R. Pei and A. L. Porter, ‘‘Profiling leading scientists in nanobiomedicalscience: Interdisciplinarity and potential leading indicators of researchdirections,’’ R&D Manage., vol. 41, no. 3, pp. 288–306, Jun. 2011, doi:10.1111/j.1467-9310.2011.00643.x.
[33] D. K. R. Robinson, L. Huang, Y. Guo, and A. L. Porter, ‘‘Forecastinginnovation pathways (FIP) for new and emerging science and technolo-gies,’’ Technol. Forecasting Social Change, vol. 80, no. 2, pp. 267–285,Feb. 2013, doi: 10.1016/j.techfore.2011.06.004.
[34] L. Zhang, Y. Geng, Y. Zhong, H. Dong, and Z. Liu, ‘‘A bibliometricanalysis on waste electrical and electronic equipment research,’’ Envi-ron. Sci. Pollut. Res., vol. 26, no. 21, pp. 21098–21108, Jul. 2019, doi:10.1007/s11356-019-05409-2.
[35] S. Singh, S. Dhir, V. M. Das, and A. Sharma, ‘‘Bibliometric overviewof the technological forecasting and social change journal: Analysis from1970 to 2018,’’ Technol. Forecasting Social Change, vol. 154, May 2020,Art. no. 119963, doi: 10.1016/j.techfore.2020.119963.
[36] S. Jalal, ‘‘Co-authorship and co-occurrences analysis using BibliometrixR-package: A case study of India and Bangladesh,’’ Ann. Library Inf. Stud.,vol. 66, no. 2, pp. 57–64, Jun. 2019.
[37] J.-J. Nájera-Sánchez, E.-M. Mora-Valentín, M. Ortiz-de-Urbina-Criado,and P. Moura-Díez, ‘‘Mapping the conceptual structure of environmentalmanagement: A co-word analysis,’’Bus., Theory Pract., vol. 20, pp. 69–80,Feb. 2019, doi: 10.3846/btp.2019.07.
[38] B. Lee and Y.-I. Jeong, ‘‘Mapping Korea’s national R&D domain of robottechnology by using the co-word analysis,’’ Scientometrics, vol. 77, no. 1,pp. 3–19, Oct. 2008, doi: 10.1007/s11192-007-1819-4.
[39] M. Giannakos, Z. Papamitsiou, P. Markopoulos, J. Read, andJ. P. Hourcade, ‘‘Mapping child–computer interaction research throughco-word analysis,’’ Int. J. Child-Comput. Interact., vols. 23–24, Jun. 2020,Art. no. 100165, doi: 10.1016/j.ijcci.2020.100165.
[40] J. J. Nájera-Sánchez, ‘‘A systematic review of sustainable banking througha co-word analysis,’’ Sustainability, vol. 12, no. 1, pp. 1–23, Dec. 2020,doi: 10.3390/su12010278.
[41] M. Taqi and T. Izmir University of Economics, ‘‘Marketing concept evolu-tion: A bibliometrics co-occurrence analysis,’’Marketing Manage. Innov.,vol. 2, pp. 185–197, Mar. 2019, doi: 10.21272/mmi.2019.2-16.
[42] L. Bornmann, R. Haunschild, and S. E. Hug, ‘‘Visualizing the contextof citations referencing papers published by eugene garfield: A newtype of keyword co-occurrence analysis,’’ Scientometrics, vol. 114, no. 2,pp. 427–437, Feb. 2018, doi: 10.1007/s11192-017-2591-8.
[43] A. L. Porter and J. Youtie, ‘‘Where does nanotechnology belong in the mapof science?’’ Nature Nanotechnol., vol. 4, no. 9, pp. 534–536, Sep. 2009,doi: 10.1038/nnano.2009.207.
[44] W. J. Wei, B. Shi, X. Guan, J. Y. Ma, Y. C. Wang, and J. Liu, ‘‘Mappingtheme trends and knowledge structures for human neural stem cells: Aquantitative and co-word biclustering analysis for the 2013-2018 period,’’Neural Regener. Res., vol. 14, no. 10, pp. 1823–1832, Oct. 2019, doi:10.4103/1673-5374.257535.
[45] A. Lis, ‘‘Keywords co-occurrence analysis of research on sustainableenterprise and sustainable organisation,’’ J. Corporate ResponsibilityLeadership, vol. 5, no. 2, pp. 47–66, Mar. 2019. [Online]. Available:https://apcz.umk.pl/czasopisma/index.php/JCRL/article/view/JCRL.2018.011.doi: 10.12775/JCRL.2018.011.
[46] P. van den Besselaar and G. Heimeriks, ‘‘Mapping research topicsusing word-reference co-occurrences: A method and an exploratory casestudy,’’ Scientometrics, vol. 68, no. 3, pp. 377–393, Sep. 2006, doi:10.1007/s11192-006-0118-9.
[47] N. Gerdsri and A. Kongthon, ‘‘Identify potential opportunity for researchcollaboration using bibliometrics,’’ Int. J. Bus., vol. 23, pp. 248–260,Jan. 2018.
[48] C. T. S. Tatum, L. M. M. Tatum, J. P. Fabris, S. L. Russo, andF. F. Conceição, ‘‘University-industry cooperation network in academicand technological productivity,’’ Revista Gestão Inovação e Tecnologias,vol. 8, no. 4, pp. 4697–4709, Dec. 2018, doi: 10.7198/geintec.v8i4.1331.
[49] T. Luukkonen, O. Persson, and G. Sivertsen, ‘‘Understanding patterns ofinternational scientific collaboration,’’ Sci., Technol., Hum. Values, vol. 17,no. 1, pp. 101–126, Jan. 1992, doi: 10.1177/016224399201700106.
[50] M. E. J. Newman and M. Girvan, ‘‘Finding and evaluating commu-nity structure in networks,’’ Phys. Rev. E, Stat. Phys. Plasmas FluidsRelat. Interdiscip. Top., vol. 69, no. 2, Feb. 2004, Art. no. 026113, doi:10.1103/PhysRevE.69.026113.
[51] J. Davidson Frame and M. P. Carpenter, ‘‘International research collab-oration,’’ Social Stud. Sci., vol. 9, no. 4, pp. 481–497, Nov. 1979, doi:10.1177/030631277900900405.
[52] T. Luukkonen, R. J. W. Tijssen, O. Persson, and G. Sivertsen, ‘‘The mea-surement of international scientific collaboration,’’ Scientometrics, vol. 28,no. 1, pp. 15–36, Sep. 1993, doi: 10.1007/BF02016282.
[53] G. Abramo, A. C. D’Angelo, and G. Murgia, ‘‘The relationshipamong research productivity, research collaboration, and their determi-nants,’’ J. Informetrics, vol. 11, no. 4, pp. 1016–1030, Nov. 2017, doi:10.1016/j.joi.2017.09.007.
[54] H. Ma, C. Fang, B. Pang, and G. Li, ‘‘The effect of geographical proximityon scientific cooperation among chinese cities from 1990 to 2010,’’ PLoSONE, vol. 9, no. 11, Nov. 2014, Art. no. e111705, doi: 10.1371/jour-nal.pone.0111705.
[55] B. Bozeman and E. Corley, ‘‘Scientists’ collaboration strategies: Implica-tions for scientific and technical human capital,’’ Res. Policy, vol. 33, no. 4,pp. 599–616, May 2004, doi: 10.1016/j.respol.2004.01.008.
[56] B. Bozeman, M. Gaughan, J. Youtie, C. P. Slade, and H. Rimes, ‘‘Researchcollaboration experiences, good and bad: Dispatches from the frontlines,’’ Sci. Public Policy, vol. 43, no. 2, pp. 226–244, Apr. 2016, doi:10.1093/scipol/scv035.
[57] M. E. J. Newman, ‘‘The structure of scientific collaboration networks,’’Proc. Nat. Acad. Sci. USA, vol. 98, no. 2, pp. 404–409, Jan. 2001, doi:10.1073/pnas.021544898.
[58] R. Guimera, ‘‘Team assembly mechanisms determine collaboration net-work structure and team performance,’’ Science, vol. 308, no. 5722,pp. 697–702, Apr. 2005, doi: 10.1126/science.1106340.
[59] M. Coccia and B. Bozeman, ‘‘Allometric models to measure and ana-lyze the evolution of international research collaboration,’’ Scientometrics,vol. 108, no. 3, pp. 1065–1084, Sep. 2016, doi: 10.1007/s11192-016-2027-x.
[60] C. Hagel, F. Weidemann, S. Gauch, S. Edwards, and P. Tinnemann,‘‘Analysing published global ebola virus disease research using socialnetwork analysis,’’ PLOS Neglected Tropical Diseases, vol. 11, no. 10,Oct. 2017, Art. no. e0005747, doi: 10.1371/journal.pntd.0005747.
[61] J. Jordan, M. Wachsmann, S. Hoisington, V. Gonzalez, R. Valle,J. Lambert, M. Aleisa, R. Wilcox, C. L. Benge, andA. J. Onwuegbuzie, ‘‘Collaboration patterns as a function of articlegenre among mixed researchers: A mixed methods bibliometric study,’’ J.Educ. Issues, vol. 3, pp. 83–108, Apr. 2017, doi: 10.5296/jei.v3i1.10699.
[62] L. C. Freeman, ‘‘Centrality in social networks conceptual clarification,’’Soc. Netw., vol. 1, no. 3, pp. 215–239, Jan. 1978, doi: 10.1016/0378-8733(78)90021-7.
[63] L. Mortara, R. Thomson, C. Moore, K. Armara, C. Kerr, R. Phaal, andD. Probert, ‘‘Developing a technology intelligence strategy at Kodak Euro-pean research: Scan & target,’’ Res.-Technol. Manage., vol. 53, no. 4,pp. 27–38, Jul. 2010, doi: 10.1080/08956308.2010.11657638.
[64] O. F. Castellanos and L.M. Torres, ‘‘Technology intelligence:Methods andcapabilities for generation of knowledge and decision making,’’ in Proc.Technol. Manage. Global Econ. Growth (PICMET), Phuket, Thailand,2010, pp. 1–9.
[65] A. L. Porter, J. Youtie, P. Shapira, and D. J. Schoeneck, ‘‘Refiningsearch terms for nanotechnology,’’ J. Nanoparticle Res., vol. 10, no. 5,pp. 715–728, May 2008, doi: 10.1007/s11051-007-9266-y.
[66] Thomson Reuters. Web of Science: Quick Reference Card.Accessed: Apr. 30, 2020. [Online]. Available: http://wokinfo.com/media/pdf/qrc/wosqrc.pdf
[67] A. L. Porter and S. W. Cunningham, Tech Mining: Exploiting New Tech-nologies for Competitive Advantage. Hoboken, NJ, USA: Wiley, 2005.
[68] J. Thavorn, C. Gowanit, V. Muangsin, and N. Muangsin, ‘‘Foresightthrough strategic technology intelligence for collaboration and innovationpathways,’’ in Proc. ISPIM Connects Bangkok-Partnering Innov. Commu-nity, Bangkok, Thailand, 2020, pp. 1–16.
[69] N. C. Newman, A. L. Porter, D. Newman, C. C. Trumbach, andS. D. Bolan, ‘‘Comparing methods to extract technical content for tech-nological intelligence,’’ J. Eng. Technol. Manage., vol. 32, pp. 97–109,Apr. 2014, doi: 10.1016/j.jengtecman.2013.09.001.
[70] G. Lahoti, A. L. Porter, C. Zhang, J. Youtie, and B. Wang, ‘‘Tech miningto validate and refine a technology roadmap,’’ World Pat. Inf., vol. 55,pp. 1–18, Dec. 2018, doi: 10.1016/j.wpi.2018.07.003.
[71] (Web of Science). Web of Science: Categories and Collections. Accessed:May 30, 2020. [Online]. Available: https://mjl.clarivate.com/help-center
[72] China’s Latest Sars Outbreak Has Been Contained, But Biosafety Con-cerns Remain, WHO, Geneva, Switzerland, 2004.
[73] W. Glänzel, ‘‘National characteristics in international scientific co-authorship relations,’’ Scientometrics, vol. 51, no. 1, pp. 69–115,Apr. 2001, doi: 10.1023/A:1010512628145.
VOLUME 9, 2021 45015
J. Thavorn et al.: Collaboration Network and Trends of Global Coronavirus Disease Research
[74] Y. Liu, Y. Cheng, Z. Yan, and X. Ye, ‘‘Multilevel analysis of inter-national scientific collaboration network in the influenza virus vaccinefield: 2006–2013,’’ Sustainability, vol. 10, no. 4, p. 1232, Apr. 2018, doi:10.3390/su10041232.
[75] W. Glänzel, ‘‘Science in Scandinavia: A bibliometric approach,’’Scientometrics, vol. 48, no. 2, pp. 121–150, Sep. 2000, doi:10.1023/A:1005640604267.
[76] C. M. Weible, D. Nohrstedt, P. Cairney, D. P. Carter, D. A. Crow,A. P. Durnová, T. Heikkila, K. Ingold, A. McConnell, and D. Stone,‘‘COVID-19 and the policy sciences: Initial reactions and perspectives,’’Policy Sci., vol. 53, no. 2, pp. 225–241, Jun. 2020, doi: 10.1007/s11077-020-09381-4.
[77] M. Bayram, S. Springer, C. K. Garvey, andV. Özdemir, ‘‘COVID-19 digitalhealth innovation policy: A portal to alternative futures in the making,’’OMICS, A J. Integrative Biol., vol. 24, no. 8, pp. 460–469, Aug. 2020, doi:10.1089/omi.2020.0089.
JAKKRIT THAVORN (Graduate Student Member,IEEE) received the bachelor’s degree in chemicalengineering from the King Mongkut’s Institute ofTechnology Ladkrabang, the Master of Sciencedegree in petrochemical technology from Chula-longkorn University, and the Master of BusinessAdministration degree from Assumption Univer-sity. He is currently pursuing the Ph.D. degree withthe Technopreneurship and Innovation Manage-ment Program, Graduate School, Chulalongkorn
University. His current research interests include applications of paper andpatent information, technology foresight, innovation management, and busi-ness model innovation as well as scientific research in the bio-circular-greeneconomic (BCG) model.
CHUPUN GOWANIT received the Ph.D. degreefrom the Technopreneurship and Innovation Man-agement Program, Chulalongkorn University(CUTIP). She is currently a part-time Lecturerwith CUTIP. She developed one of the serviceinnovations and successfully commercialized theinsurance industry used in Thailand and Singa-pore. Her research interests include the develop-ment of service and process innovation, businessmodel innovation, innovation management, and
digital transformation. She is an External Committee Member serving forCUTIP.
VEERA MUANGSIN received the Ph.D. degree incomputer science from The University of Manch-ester, U.K. He is currently an Assistant Professorwith the Department of Computer Engineering,Faculty of Engineering, Chulalongkorn Univer-sity, Thailand. His research interests include paral-lel computing, software systems, and data science,including data mining and bibliometric analysis.
NONGNUJ MUANGSIN received the Ph.D.degree in chemistry from the University ofManch-ester Institute of Science and Technology, U.K.She is currently a Professor and the Assistant Deanof Research with the Faculty of Science, Chu-lalongkorn University, Thailand. She has severalpublications in international journals and confer-ences, including Carbohydrate Polymers and theEuropean Journal of Medicinal Chemistry. Herresearch interests include biopolymers, design and
synthesis of anticancer agents from herbs, drug delivery systems, and tech-nology opportunity analysis to form research directions.
45016 VOLUME 9, 2021