cochin shipyard ltd
TRANSCRIPT
BUY CMP Rs352 Target Rs516 Upside 47%
For important information about YES Securities (India) Ltd. and other disclosures, refer to the end of this material. 1
Cochin Shipyard Ltd Company Report | Sector: Defence February 14, 2020
Expect robust execution in FY21 Cochin Shipyard (CSL) delivered strong set of Q3FY20 results as sales/EBITDA/PAT grew by 25%/25%/32% driven by healthy execution of Indigenous Aircraft Carrier (IAC‐1) phase‐3 contract. CSL expects revenues of Rs29bn/Rs39bn in FY20/FY21 from shipbuilding (SB) division as work on IAC phase 3 (sales of Rs22bn/Rs25bn) would be in full swing while ship‐repairing (SR) division likely to post revenues of Rs6bn/Rs7bn in FY20/FY21. Management expects SB division margins to sustain at 20‐21% in FY21.
Healthy order book, MOAT of government preference and decades of learning place Cochin Shipyard (CSL) in a sweet spot. It is strongly poised to derive benefits from the government’s strong endeavor to increase its defence production under “Make in India” initiative (Indian Navy acquisition plan: Rs3trn till FY27); new business partnerships (JVs with Hooghly, Mumbai Port and Kolkata Port) and healthy balance sheet. Hence, we believe although execution growth & margins to taper off in FY22 (on a strong base of FY21), CSL could deliver sales CAGR of 9% over next decade (vs. 9% in FY09‐19) with avg. NOPAT margins of ~10% (vs 11% in FY09‐19). We retain BUY with DCF based TP of Rs516 (Cost of Equity: 14%, Assets Turns: 2.7x, Terminal growth: 3%). Valuations are attractive as stock is trading at 6.6x/8.4x FY21/FY22 earnings. Signing of IAC‐2 (Mega project worth Rs500bn) would be huge trigger for the stock while lower than expected margins in SB division due to ASW SWC contract is key risk to our estimates.
Order pipeline is looking strong; actualization remains key
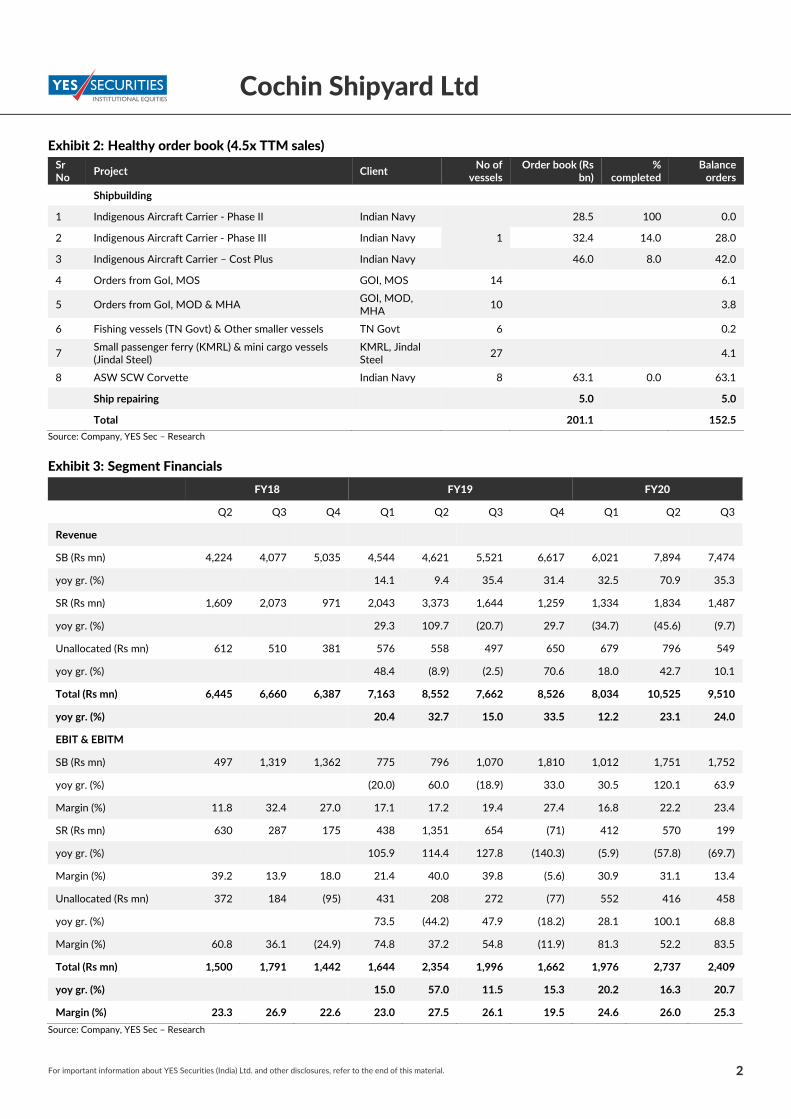
CSL has order book of Rs153bn (~4.5x TTM sales) as it has signed phase‐III contract of IAC. In addition, it has shipbuilding order pipeline of Rs180‐200bn+ comprising i) Next‐gen Missile Vessels (Rs130bn), ii) Multipurpose Vessels (Rs28‐30bn), iii) Fast Patrol Vessel (Rs8bn), iv) 12 Air Cushion Vessels for ICG (Rs6bn), v) Survey Training Vessel (Rs7.5bn), vii) Solar Research Vessels & vii) Passenger Ferry boats (Rs8bn). It has submitted RFPs for these projects & awarding is expected to get complete by FY21 end. CSL would be the biggest beneficiary of development of inland/coastal waterways.
Aiming to increase its ship‐repairing market share through expansion
CSL is targeting to increase its ship repairing (SR) market share through new initiatives like repairs of oil rigs and merchant vessels at Mumbai Port Trust, Andaman & Nicobar administration, Kolkata port trust and Hooghly Cochin Shipyard JV. Management expects incremental revenues of Rs3‐4bn/year once ISRF becomes operational by early FY22. We believe these initiatives will help CSL to keep the growth momentum going with SR revenue share (high margin of 30%) of Rs12bn+ from FY23 onwards.
Exhibit 1: Financial Summary Y/e 31 Mar (Rs m) FY18 FY19 FY20E FY21E FY22E Revenues 23,551 29,622 34,532 42,032 37,286 yoy growth (%) 14.4 25.8 16.6 21.7 (11.3) EBITDA 4,639 5,692 7,101 7,986 6,339 EBITDAM (%) 19.7 19.2 20.6 19.0 17.0 Adjusted PAT 3,963 4,778 6,545 6,968 5,449 yoy growth (%) 23.2 20.6 37.0 6.5 (21.8) EPS (Rs) 30.1 36.3 49.8 53.0 41.4 P/E (x) 11.6 9.6 7.0 6.6 8.4 Price/Book (x) 1.5 1.4 1.2 1.1 1.0 EV/EBITDA (x) 2.6 3.8 3.1 3.9 5.0 Debt/Equity (x) (1.0) (0.7) (0.6) (0.4) (0.3) RoE (%) 15.0 14.5 18.4 17.4 12.3 RoCE (%) 312.5 74.6 39.8 24.1 11.9
Source: Company, YES Sec – Research
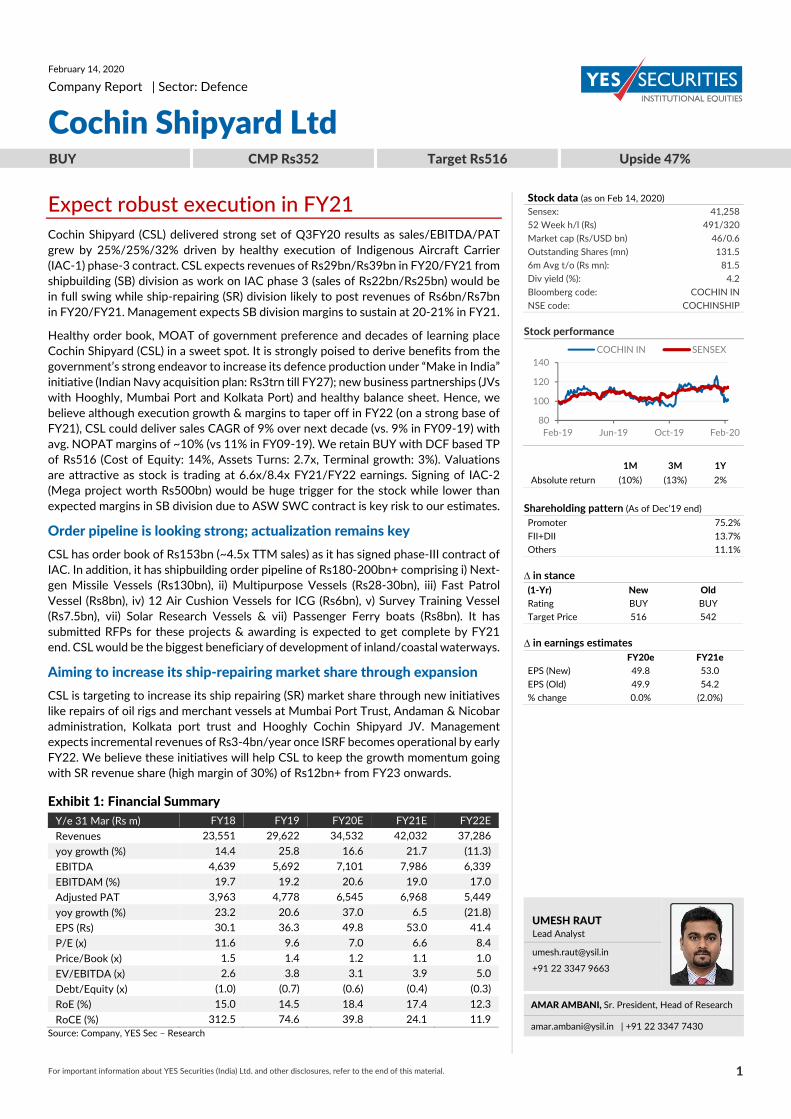
Stock data (as on Feb 14, 2020) Sensex: 41,258 52 Week h/l (Rs) 491/320 Market cap (Rs/USD bn) 46/0.6 Outstanding Shares (mn) 131.5 6m Avg t/o (Rs mn): 81.5 Div yield (%): 4.2 Bloomberg code: COCHIN IN NSE code: COCHINSHIP Stock performance
1M 3M 1Y
Absolute return (10%) (13%) 2%
Shareholding pattern (As of Dec’19 end) Promoter 75.2% FII+DII 13.7% Others 11.1% ∆ in stance (1‐Yr) New Old Rating BUY BUY Target Price 516 542 ∆ in earnings estimates FY20e FY21e EPS (New) 49.8 53.0 EPS (Old) 49.9 54.2 % change 0.0% (2.0%)
UMESH RAUT Lead Analyst
[email protected] +91 22 3347 9663
AMAR AMBANI, Sr. President, Head of Research
[email protected] | +91 22 3347 7430
80
100
120
140
Feb‐19 Jun‐19 Oct‐19 Feb‐20
COCHIN IN SENSEX
For important information about YES Securities (India) Ltd. and other disclosures, refer to the end of this material. 2
Cochin Shipyard Ltd
Exhibit 2: Healthy order book (4.5x TTM sales) Sr No
Project Client No of
vessels Order book (Rs
bn) %
completed Balance orders
Shipbuilding
1 Indigenous Aircraft Carrier ‐ Phase II Indian Navy
1
28.5 100 0.0
2 Indigenous Aircraft Carrier ‐ Phase III Indian Navy 32.4 14.0 28.0
3 Indigenous Aircraft Carrier – Cost Plus Indian Navy 46.0 8.0 42.0
4 Orders from GoI, MOS GOI, MOS 14 6.1
5 Orders from GoI, MOD & MHA GOI, MOD, MHA
10 3.8
6 Fishing vessels (TN Govt) & Other smaller vessels TN Govt 6 0.2
7 Small passenger ferry (KMRL) & mini cargo vessels (Jindal Steel)
KMRL, Jindal Steel
27 4.1
8 ASW SCW Corvette Indian Navy 8 63.1 0.0 63.1
Ship repairing 5.0 5.0
Total 201.1 152.5
Source: Company, YES Sec – Research
Exhibit 3: Segment Financials
FY18 FY19 FY20
Q2 Q3 Q4 Q1 Q2 Q3 Q4 Q1 Q2 Q3
Revenue
SB (Rs mn) 4,224 4,077 5,035 4,544 4,621 5,521 6,617 6,021 7,894 7,474
yoy gr. (%) 14.1 9.4 35.4 31.4 32.5 70.9 35.3
SR (Rs mn) 1,609 2,073 971 2,043 3,373 1,644 1,259 1,334 1,834 1,487
yoy gr. (%) 29.3 109.7 (20.7) 29.7 (34.7) (45.6) (9.7)
Unallocated (Rs mn) 612 510 381 576 558 497 650 679 796 549
yoy gr. (%) 48.4 (8.9) (2.5) 70.6 18.0 42.7 10.1
Total (Rs mn) 6,445 6,660 6,387 7,163 8,552 7,662 8,526 8,034 10,525 9,510
yoy gr. (%) 20.4 32.7 15.0 33.5 12.2 23.1 24.0
EBIT & EBITM
SB (Rs mn) 497 1,319 1,362 775 796 1,070 1,810 1,012 1,751 1,752
yoy gr. (%) (20.0) 60.0 (18.9) 33.0 30.5 120.1 63.9
Margin (%) 11.8 32.4 27.0 17.1 17.2 19.4 27.4 16.8 22.2 23.4
SR (Rs mn) 630 287 175 438 1,351 654 (71) 412 570 199
yoy gr. (%) 105.9 114.4 127.8 (140.3) (5.9) (57.8) (69.7)
Margin (%) 39.2 13.9 18.0 21.4 40.0 39.8 (5.6) 30.9 31.1 13.4
Unallocated (Rs mn) 372 184 (95) 431 208 272 (77) 552 416 458
yoy gr. (%) 73.5 (44.2) 47.9 (18.2) 28.1 100.1 68.8
Margin (%) 60.8 36.1 (24.9) 74.8 37.2 54.8 (11.9) 81.3 52.2 83.5
Total (Rs mn) 1,500 1,791 1,442 1,644 2,354 1,996 1,662 1,976 2,737 2,409
yoy gr. (%) 15.0 57.0 11.5 15.3 20.2 16.3 20.7
Margin (%) 23.3 26.9 22.6 23.0 27.5 26.1 19.5 24.6 26.0 25.3
Source: Company, YES Sec – Research
For important information about YES Securities (India) Ltd. and other disclosures, refer to the end of this material. 3
Cochin Shipyard Ltd
Key takeaways from earnings conference call Order pipeline & Order book
CSL has ~40% market share in Indian ship‐repairing market. ISRF could handle around 70‐72 vessels a year which could generate revenues of ~Rs3bn. CSL is targeting for 50%+ market share in next 2‐3 years through further penetration by leveraging its competitive advantage & experience.
CSL had participated in the bid for pollution control vessels and a large floating dock order for which the technical evaluation for both orders has been completed and the management is waiting for the price bid opening date
Update on the order pipeline: CSL is bidding for 8 FPV (Rs6bn) for Indian Coast Guard (ICG) & technical evaluation for the same is pending, 12 air cushion vessels for ICG (Rs5.5bn) for which the technical evaluation already started. CSL is also going to participate in 2 other bids which would be for 4 multipurpose vessels for the Indian Navy (Rs28‐30bn), & 1 survey training vessel for the Indian Navy (Rs7.5bn).
CSL has also submitted bid for Next Generation Missile Vessels (6 nos) project worth Rs130bn. GRSE, MDL, L&T are the other players in contention.
Total backlog as on 9MFY20 on IAC for Fixed price is around Rs28.5bn & cost plus is around Rs42.5bn
BCG has submitted its report for the 2030 organization target. Management is now focusing on its implementation.
Indigenous Aircraft Carrier (IAC) ‐2 would be relatively bigger vessel than IAC‐1. The new dry dock will be able to handle it.
Indian Navy has shortlisted MDL & L&T for P75‐I submarine project worth Rs500‐600bn. It is in advance stage of finalization. Project would be under strategic partnership where Indian Navy has also shortlisted 5 foreign OEMs.
Execution & Margins
Revenues grew 25% yoy to Rs8.9bn (+8% vs our est.) led by strong execution from IAC phase III. Shipbuilding revenues were up 35% yoy to Rs7.5bn. EBITDA margins came in at 22%, flat yoy (+284bps vs our est.) PAT reported strong growth of 32% yoy (+7% vs our est.) led by robust operational performance & lower tax outgo.
Sea trials of IAC‐1 should begin in April 2020. Targeted delivery in early FY21. Revenue of Rs8.3bn would be recognized post‐delivery up to FY24. Indigenization level for IAC‐1 is around 50‐60%. The management expects revenues of around Rs22/Rs25bn for FY20/FY21 from IAC
Anti‐Submarine Warfare Shallow Water Craft (ASW SWC) Project is currently in design phase. CSL would start fabrication work in H1FY21. Management expects revenues of around Rs6bn from ASW SWC
Total requirement of 75 boats for Cochin Water Metro Project. CSL has signed order for 23 boats for Rs1.75bn. These are fully electronic and first vessel is to be delivered by November 1, 2020.
Planning for sales growth of 12% yoy growth. Target to keep healthy order book more than 3x revenue.
Two months ago, CSL had taken 26% stake in Hoogly Cochin yard. June 2021 targeted completion date. This would be a facility for new building for inland water vessels
CSL has recently delivered 12 out of the 16 fishing vessel orders that were taken previously & 8 out of 10 ROPAX vessels have been delivered to IWAI. With regards to the Floating Border Outposts, steel cutting has commenced
For important information about YES Securities (India) Ltd. and other disclosures, refer to the end of this material. 4
Cochin Shipyard Ltd
Ship repair operations in Mumbai have picked up, & CSL has completed more than 20 projects in Mumbai. CSL Kolkata ship repair unit (CKSRU) has commenced (in the latter part of October 2020) and 2 vessels have been completed. Management is expecting revenues of Rs750mn/Rs1.2bn in FY20/FY21 from Mumbai operations
Management is expecting revenues of Rs7‐7.5bn from ship repair altogether in FY21
Agreement for commencement of operation and maintenance for marine dockyard in Port Blair has been executed. These operations would be pertaining solely to ship repair
Management expects the revenues from ship repair segment to be around Rs6.1bn for FY20 vs the estimated Rs6.5bn because majorly in Q3FY20, the dock was used for IAC business for almost 45 days due to which the dock could not be used for ship repair
For FY21, the total estimated revenues of CSL would be Rs39bn from shipbuilding segment
Shipbuilding revenue break up for Q3FY20:
Total revenues generated wereRs7.47bn out of which Rs6.35bn was from IAC, Rs1.12bn from non‐IAC projects,
Out of the IAC revenues, cost plus was Rs3.71bn
Revenues from ship repair for Q3FY20 were Rs1.49bn
Balance Sheet & Capex
Construction on new dry dock facility & ISRF is expected to be completed by FY22 end.
Management estimates the depreciation for FY23 (including dry dock and ISRF) to be around Rs1.80bn
CSL is expecting some cash crunch on the government side, but for the IAC project for Indian Navy, the company has already received an advance payment by the Indian Navy and CSL has around Rs4‐5bn in the bank account as advance payments by the Indian Navy. On the ship repair side, there are some outstanding amounts of Rs2bn from Indian Navy
Growth drivers for Shipbuilding business
Inland and coastal water segment: The government’s focus on development of inland and coastal waterways infrastructure is expected to spur demand of ships for this sector. The Government is investing substantially to improve the infrastructure in the major waterways. This will spur the demand for such vessels in the inland water segment. It is estimated that the vessels required to meet the demand by 2030 will triple which may be around 3000+ vessels. CSL is working closely with Inland Water Authority of India (IWAI) and other potential customers to provide efficient product solutions in this segment
Special purpose vessels: Various agencies are looking for modern and efficient vessels to equip and upgrade the assets to meet the operational demands. This gives an opportunity to CSL for custom made vessels such as Polar Research Vessels, Well Stimulation Vessel, Cement Carriers, etc.
Fishing segment: Government of India (GoI) has got an ambitious plan under the “Blue Revolution” to equip the segment with more modern and efficient fishing vessels. This segment is presently managed by unregulated players and gives a good opportunity for CSL to focus and position itself as a quality player. CSL is working closely with Tamil Nadu Fisheries by providing custom made solution to the fishermen and has contracted for the construction of 16 vessels as a pilot project. The total requirement for the department for fishermen is about 2000 vessels. In addition to the above there are also potential requirements for bigger and sophisticated vessels in this segment for the domestic and international market.
As per published report, the Indian Navy’s perspective plan aims to increase the Navy’s fleet from the present 137 to 200 nos. by 2027. This is expected to provide a spurt in the indigenous shipbuilding. Besides, the Indian Navy’s indigenization plan is also expected to
For important information about YES Securities (India) Ltd. and other disclosures, refer to the end of this material. 5
Cochin Shipyard Ltd
give a fillip to the growth of ancillaries and generally improve the shipbuilding environment in the country.
Potential opportunity for Ship repairing business in India
India’s share in global ship repair market is less than 1%, while around 7‐9% of global trade is passing within 300 NM of its coastline. India’s strategic position along the east bound and west bound international trade routes offers an opportunity to cater to vessels plying on these routes. A main container route connecting America and Europe to the East passes very close to the Indian coastline presenting a major opportunity. for repairs. This presents huge untapped potential which is valued around Rs35‐40bn.
As per the AT Kearney report, India has a market potential of Rs26bn from repair of domestic fleet out of which only 15% share is currently captured. The report has further highlighted that India can grow its ship repair industry to Rs90bn in the next 10 years through infrastructure and process improvement. The report has highlighted low levels of process efficiency, lack of infrastructure to service vessels above 10,000DWT and weak ancillary landscape as road blocks for developing the industry. A key recommendation of the report was to lease out the repair facilities at major ports to specialist to augment revenue opportunity.
MOU with the Mumbai Port Trust & Kolkata Port Trust for operations and management of respective ship repair facilities would be beneficial for CSL. It shall utilize these facilities for ship repair and allied services and for the growth of ship repair in the region.
CSL has also signed a MoU with Andaman & Nicobar (A&N) Administration for setting up its unit at Port Blair in September 2018. The agreement with A&N is in the administrative phase and is expected to be cleared in FY20. By entering into this arrangement with A&N Administration, CSL shall be developing an integrated ship repair ecosystem at A&N islands that includes modernization of facilities, maintenance of Administration owned vessels and skill development for the islanders.
CSL is planning to increase the throughput of a profitable business through International Ship Repair Facility (ISRF). This Facility will allow CSL to increase its repair throughput by 60‐70% as it includes a ship‐lift and transfer system. CSL will be able to repair 80 additional ships in the new ISRF and an additional 12 in the new dry dock. CSL will spend capex of ~Rs9.7bn on the ISRF.
International Ship Repair Facility (ISRF) to become operational by Q1FY22
CSL continued to operate the dry‐dock & existing facilities in the leased area (first phase) at Cochin Port premises. CSL completed the repairs of seven ships during the FY19. Meanwhile, gate of the existing dry‐dock was successfully replaced during the period, March‐October 2018. The construction works, which commenced on November 17, 2017, is progressing in full swing. More than 60% of the piling works are completed and the facility is expected to be commissioned in Q1FY22. As a part of CSL’s efforts to develop Kochi as a maritime hub of India, CSL is setting up a maritime park adjacent to the ISRF premises to house major OEMs and service providers of the ship repair industry. Civil construction is almost complete and it expects to allocate the initial units to service providers during Q3FY20. CSL expects to position Kochi as a major ship repair hub with major operations in the present ship repair dock coupled with increased capacities that would be available when the ISRF is commissioned.
For important information about YES Securities (India) Ltd. and other disclosures, refer to the end of this material. 6
Cochin Shipyard Ltd
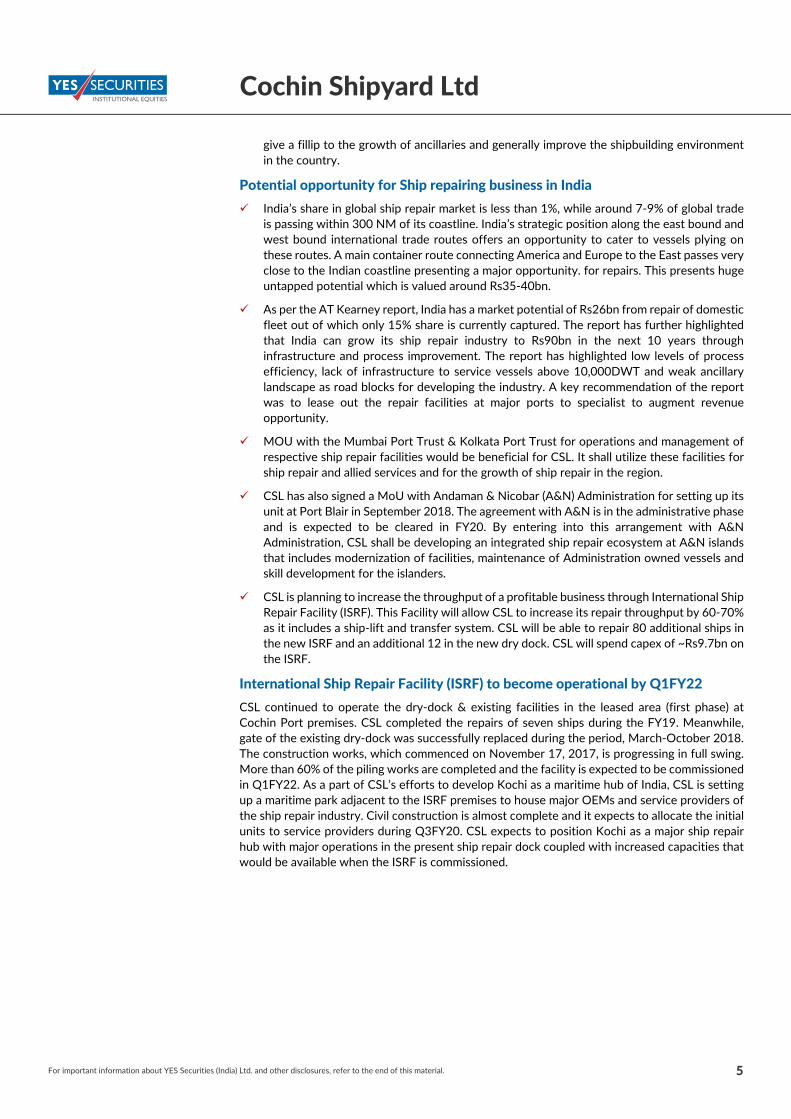
Exhibit 4: Strong execution of IAC phase 3 in FY21
Source: Company, YES Sec – Research
Exhibit 5: Ship repairing revenues to boost post FY21 with completion of ISRF
Source: Company, YES Sec – Research
Exhibit 6: Expect sales CAGR of 9% over FY19‐29E (vs 9% in FY09‐19)
Source: Company, YES Sec – Research
12,7
13
13,9
96
15,5
64
13,6
70
16,2
08
15,1
37
17,3
19
21,3
02 28,5
00 35,0
00
28,5
00
10 11
-12
19
-7
14
23
34
23
-19
-30
-20
-10
-
10
20
30
40
0
5000
10000
15000
20000
25000
30000
35000
40000
FY12 FY13 FY14 FY15 FY16 FY17 FY18 FY19 FY20E FY21E FY22E
(%)(Rs mn) Shipbuilding revenue YoY Growth
1,46
5
2,85
3
2,28
7
1,97
8 3,67
5 5,43
0
6,23
3 8,32
0
6,03
2
7,02
7 8,78
4
95
-20 -14
86
48
15
33
-28
17 25
-40
-20
-
20
40
60
80
100
120
0
1000
2000
3000
4000
5000
6000
7000
8000
9000
10000
FY12 FY13 FY14 FY15 FY16 FY17 FY18 FY19 FY20E FY21E FY22E
(%)(Rs mn) Shiprepairing revenue YoY Growth
14,2
02
14,6
17
14,0
65
16,7
99
17,9
79
15,8
33
19,9
00
20,5
89
23,5
51 29,6
22
34,5
32 42,0
32
37,2
86
13
3
-4
19
7
-12
26
3
14
26
17
22
-11 -15
-10
-5
-
5
10
15
20
25
30
0
5000
10000
15000
20000
25000
30000
35000
40000
45000
FY10 FY11 FY12 FY13 FY14 FY15 FY16 FY17 FY18 FY19 FY20E FY21E FY22E
(%)(Rs mn) Net revenues YoY Growth
For important information about YES Securities (India) Ltd. and other disclosures, refer to the end of this material. 7
Cochin Shipyard Ltd
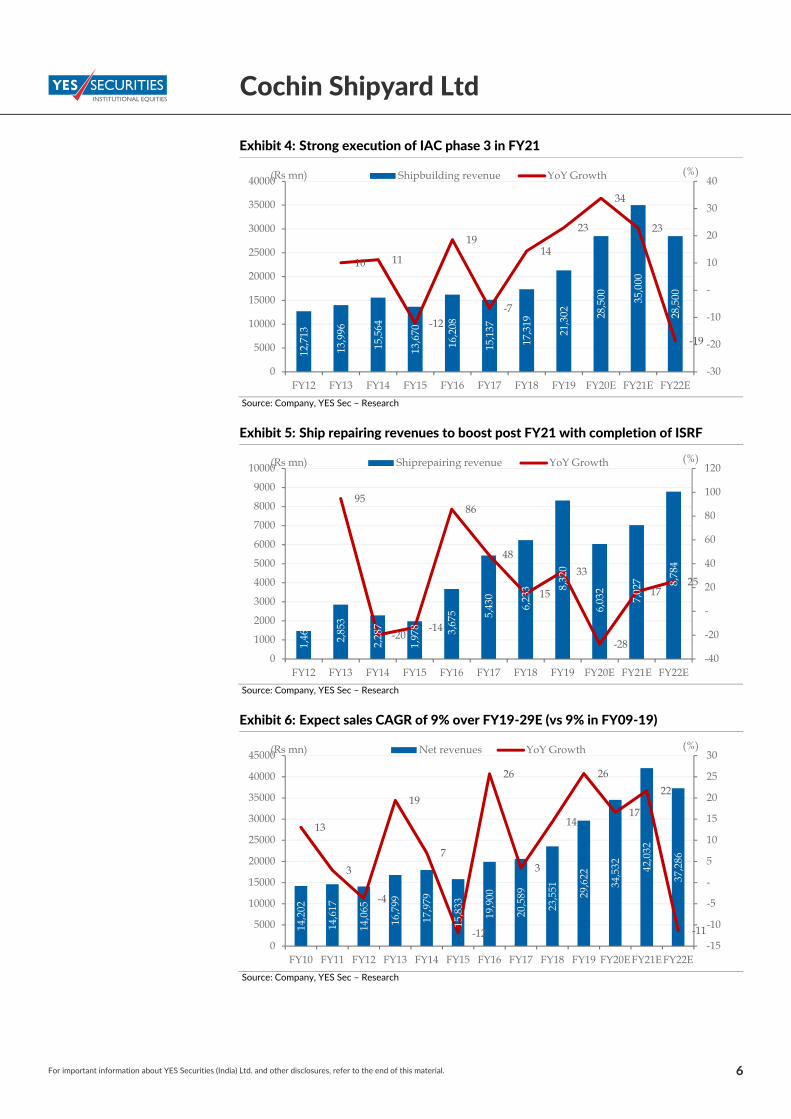
Exhibit 7: EBITDA margin likely to drop in FY22 which is factored in CMP
Source: Company, YES Sec – Research
Exhibit 8: CSL would be posting consistent profitability over long term (with Adj. ROE ~20%+)
Source: Company, YES Sec – Research
2,67
1
2,62
8
1,98
9 3,52
3
4,17
1
899
3,92
4
3,83
8
4,63
9
5,69
2 7,10
1
7,98
6
6,33
9
19 18
14
21
23
6
20 19
20 19 21
19 17
-
5
10
15
20
25
0
1000
2000
3000
4000
5000
6000
7000
8000
9000
FY10 FY11 FY12 FY13 FY14 FY15 FY16 FY17 FY18 FY19 FY20E FY21E FY22E
(%)(Rs mn) EBITDA EBITDAM
2,23
0
2,27
5
1,55
3
2,66
3
2,81
8
693 2,
918
3,21
5
3,96
3
4,77
8 6,54
5
6,96
8
5,44
9
55
28
16
24 21
5
17 17 15 15 18 17
12
-
10
20
30
40
50
60
0
1000
2000
3000
4000
5000
6000
7000
8000
FY10 FY11 FY12 FY13 FY14 FY15 FY16 FY17 FY18 FY19 FY20E FY21E FY22E
(%)(Rs mn) PAT ROE
For important information about YES Securities (India) Ltd. and other disclosures, refer to the end of this material. 8
Cochin Shipyard Ltd
FINANCIALS
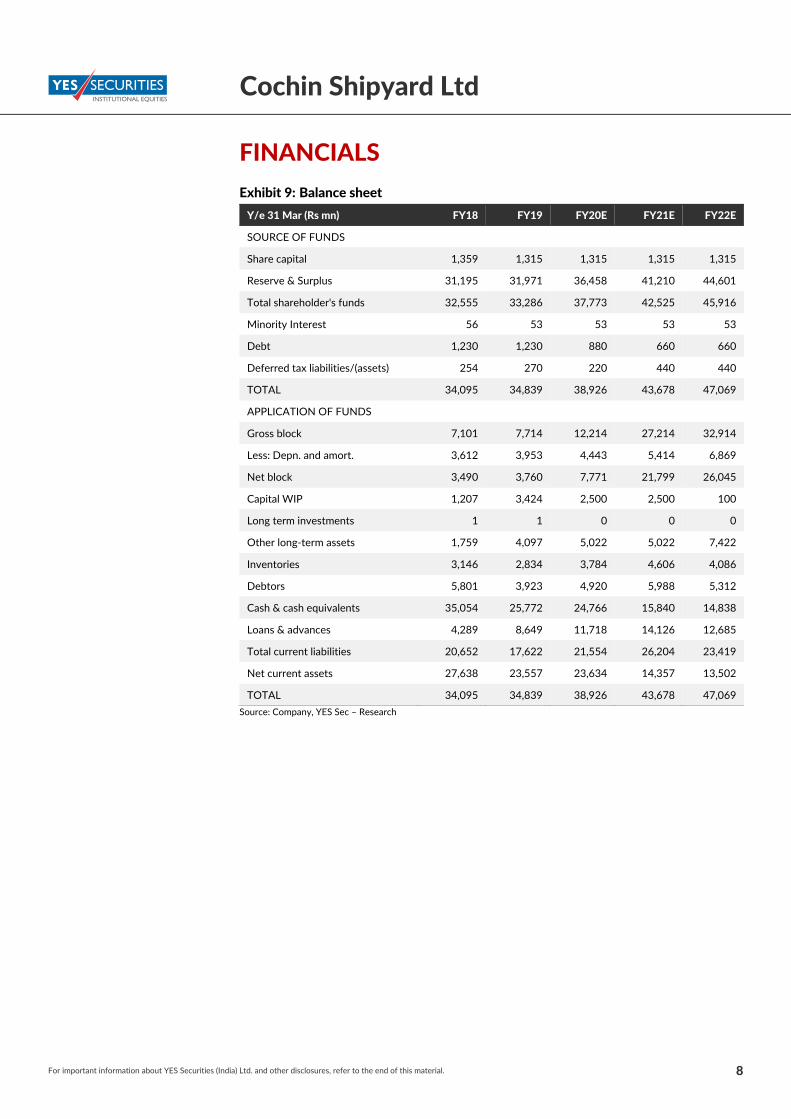
Exhibit 9: Balance sheet
Y/e 31 Mar (Rs mn) FY18 FY19 FY20E FY21E FY22E
SOURCE OF FUNDS
Share capital 1,359 1,315 1,315 1,315 1,315
Reserve & Surplus 31,195 31,971 36,458 41,210 44,601
Total shareholder's funds 32,555 33,286 37,773 42,525 45,916
Minority Interest 56 53 53 53 53
Debt 1,230 1,230 880 660 660
Deferred tax liabilities/(assets) 254 270 220 440 440
TOTAL 34,095 34,839 38,926 43,678 47,069
APPLICATION OF FUNDS
Gross block 7,101 7,714 12,214 27,214 32,914
Less: Depn. and amort. 3,612 3,953 4,443 5,414 6,869
Net block 3,490 3,760 7,771 21,799 26,045
Capital WIP 1,207 3,424 2,500 2,500 100
Long term investments 1 1 0 0 0
Other long‐term assets 1,759 4,097 5,022 5,022 7,422
Inventories 3,146 2,834 3,784 4,606 4,086
Debtors 5,801 3,923 4,920 5,988 5,312
Cash & cash equivalents 35,054 25,772 24,766 15,840 14,838
Loans & advances 4,289 8,649 11,718 14,126 12,685
Total current liabilities 20,652 17,622 21,554 26,204 23,419
Net current assets 27,638 23,557 23,634 14,357 13,502
TOTAL 34,095 34,839 38,926 43,678 47,069
Source: Company, YES Sec – Research
For important information about YES Securities (India) Ltd. and other disclosures, refer to the end of this material. 9
Cochin Shipyard Ltd
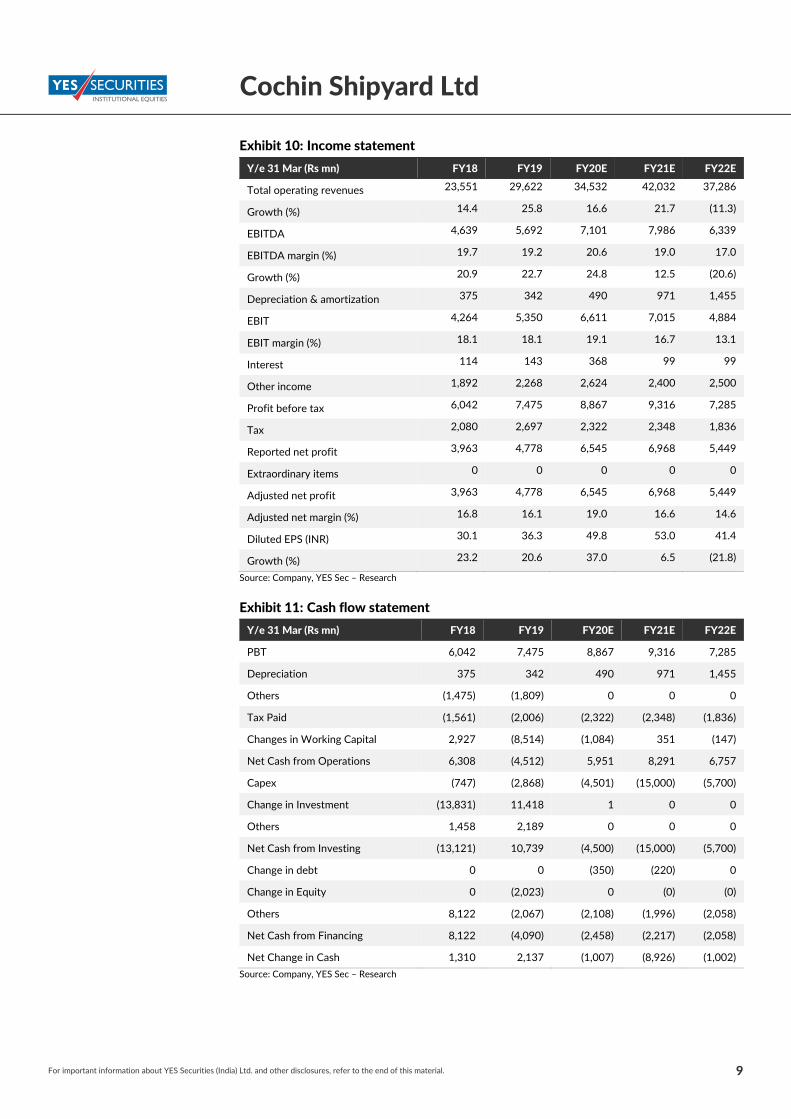
Exhibit 10: Income statement
Y/e 31 Mar (Rs mn) FY18 FY19 FY20E FY21E FY22E
Total operating revenues 23,551 29,622 34,532 42,032 37,286
Growth (%) 14.4 25.8 16.6 21.7 (11.3)
EBITDA 4,639 5,692 7,101 7,986 6,339
EBITDA margin (%) 19.7 19.2 20.6 19.0 17.0
Growth (%) 20.9 22.7 24.8 12.5 (20.6)
Depreciation & amortization 375 342 490 971 1,455
EBIT 4,264 5,350 6,611 7,015 4,884
EBIT margin (%) 18.1 18.1 19.1 16.7 13.1
Interest 114 143 368 99 99
Other income 1,892 2,268 2,624 2,400 2,500
Profit before tax 6,042 7,475 8,867 9,316 7,285
Tax 2,080 2,697 2,322 2,348 1,836
Reported net profit 3,963 4,778 6,545 6,968 5,449
Extraordinary items 0 0 0 0 0
Adjusted net profit 3,963 4,778 6,545 6,968 5,449
Adjusted net margin (%) 16.8 16.1 19.0 16.6 14.6
Diluted EPS (INR) 30.1 36.3 49.8 53.0 41.4
Growth (%) 23.2 20.6 37.0 6.5 (21.8)
Source: Company, YES Sec – Research
Exhibit 11: Cash flow statement
Y/e 31 Mar (Rs mn) FY18 FY19 FY20E FY21E FY22E
PBT 6,042 7,475 8,867 9,316 7,285
Depreciation 375 342 490 971 1,455
Others (1,475) (1,809) 0 0 0
Tax Paid (1,561) (2,006) (2,322) (2,348) (1,836)
Changes in Working Capital 2,927 (8,514) (1,084) 351 (147)
Net Cash from Operations 6,308 (4,512) 5,951 8,291 6,757
Capex (747) (2,868) (4,501) (15,000) (5,700)
Change in Investment (13,831) 11,418 1 0 0
Others 1,458 2,189 0 0 0
Net Cash from Investing (13,121) 10,739 (4,500) (15,000) (5,700)
Change in debt 0 0 (350) (220) 0
Change in Equity 0 (2,023) 0 (0) (0)
Others 8,122 (2,067) (2,108) (1,996) (2,058)
Net Cash from Financing 8,122 (4,090) (2,458) (2,217) (2,058)
Net Change in Cash 1,310 2,137 (1,007) (8,926) (1,002)
Source: Company, YES Sec – Research
For important information about YES Securities (India) Ltd. and other disclosures, refer to the end of this material. 10
Cochin Shipyard Ltd
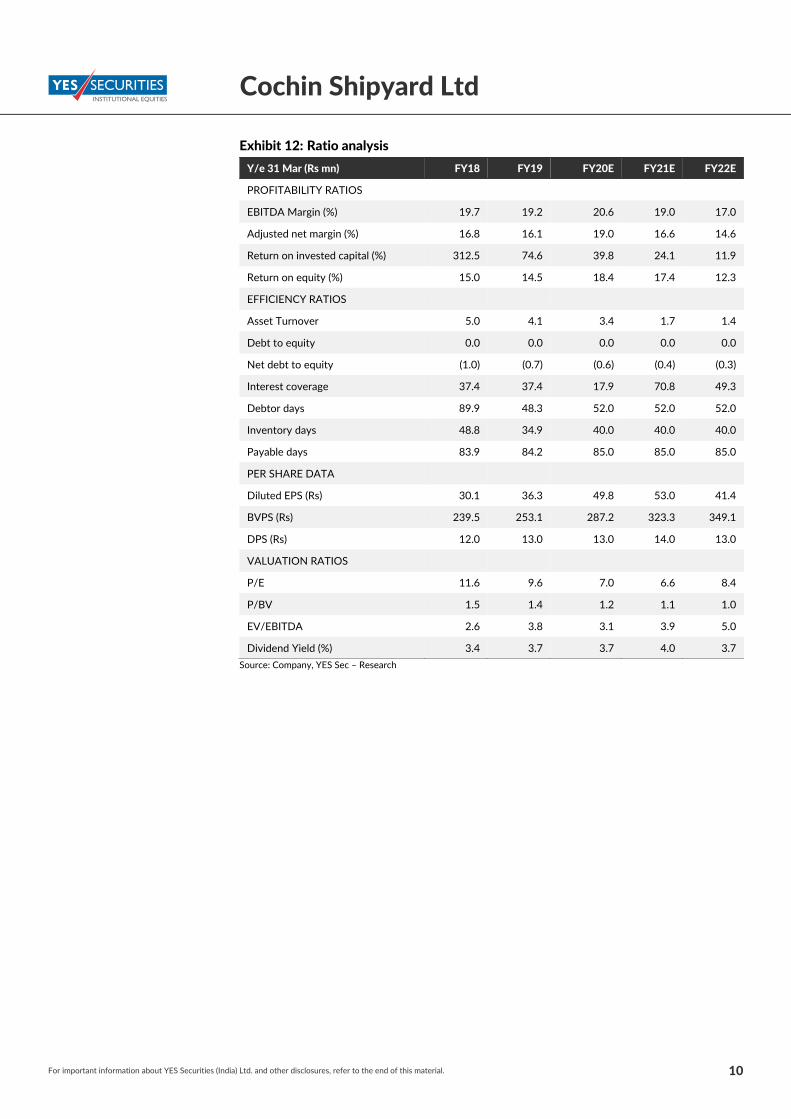
Exhibit 12: Ratio analysis
Y/e 31 Mar (Rs mn) FY18 FY19 FY20E FY21E FY22E
PROFITABILITY RATIOS
EBITDA Margin (%) 19.7 19.2 20.6 19.0 17.0
Adjusted net margin (%) 16.8 16.1 19.0 16.6 14.6
Return on invested capital (%) 312.5 74.6 39.8 24.1 11.9
Return on equity (%) 15.0 14.5 18.4 17.4 12.3
EFFICIENCY RATIOS
Asset Turnover 5.0 4.1 3.4 1.7 1.4
Debt to equity 0.0 0.0 0.0 0.0 0.0
Net debt to equity (1.0) (0.7) (0.6) (0.4) (0.3)
Interest coverage 37.4 37.4 17.9 70.8 49.3
Debtor days 89.9 48.3 52.0 52.0 52.0
Inventory days 48.8 34.9 40.0 40.0 40.0
Payable days 83.9 84.2 85.0 85.0 85.0
PER SHARE DATA
Diluted EPS (Rs) 30.1 36.3 49.8 53.0 41.4
BVPS (Rs) 239.5 253.1 287.2 323.3 349.1
DPS (Rs) 12.0 13.0 13.0 14.0 13.0
VALUATION RATIOS
P/E 11.6 9.6 7.0 6.6 8.4
P/BV 1.5 1.4 1.2 1.1 1.0
EV/EBITDA 2.6 3.8 3.1 3.9 5.0
Dividend Yield (%) 3.4 3.7 3.7 4.0 3.7
Source: Company, YES Sec – Research
For important information about YES Securities (India) Ltd. and other disclosures, refer to the end of this material. 11
Cochin Shipyard Ltd
DISCLAIMER
Investments in securities market are subject to market risks, read all the related documents carefully before investing.
The information and opinions in this report have been prepared by YSL and are subject to change without any notice. The report and information contained herein are strictly confidential and meant solely for the intended recipient and may not be altered in any way, transmitted to, copied or redistributed, in part or in whole, to any other person or to the media or reproduced in any form, without prior written consent of YSL.
The information and opinions contained in the research report have been compiled or arrived at from sources believed to be reliable and have not been independently verified and no guarantee, representation of warranty, express or implied, is made as to their accuracy, completeness, authenticity or validity. No information or opinions expressed constitute an offer, or an invitation to make an offer, to buy or sell any securities or any derivative instruments related to such securities. Investments in securities are subject to market risk. The value and return on investment may vary because of changes in interest rates, foreign exchange rates or any other reason. Investors should note that each security's price or value may rise or fall and, accordingly, investors may even receive amounts which are less than originally invested. The investor is advised to take into consideration all risk factors including their own financial condition, suitability to risk return profile and the like, and take independent professional and/or tax advice before investing. Opinions expressed are our current opinions as of the date appearing on this report. Investor should understand that statements regarding future prospects may not materialize and are of general nature which may not be specifically suitable to any particular investor. Past performance may not necessarily be an indicator of future performance. Actual results may differ materially from those set forth in projections.
Technical Analysis reports focus on studying the price movement and trading turnover charts of securities or its derivatives, as opposed to focussing on a company’s fundamentals and opinions, as such, may not match with reports published on a company’s fundamentals.
YSL, its research analysts, directors, officers, employees and associates accept no liabilities for any loss or damage of any kind arising out of the use of this report. This report is not directed or intended for distribution to, or use by, any person or entity who is a citizen or resident of or located in any locality, state, country or other jurisdiction, where such distribution, publication, availability or use would be contrary to law, regulation or which would subject YSL and associates to any registration or licensing requirement within such jurisdiction. The securities described herein may or may not be eligible for sale in all jurisdictions or to certain category of investors. Persons in whose possession this document may come are required to inform themselves of and to observe such restriction.
DISCLOSURE OF INTEREST
Name of the Research Analyst : Umesh Raut
The analyst hereby certifies that opinion expressed in this research report accurately reflect his or her personal opinion about the subject securities and no part of his or her compensation was, is or will be directly or indirectly related to the specific recommendation and opinion expressed in this research report.
Sr. No. Particulars Yes/No
1 Research Analyst or his/her relative’s or YSL’s financial interest in the subject company(ies) No
2
Research Analyst or his/her relative or YSL’s actual/beneficial ownership of 1% or more securities of the subject company(ies) at the end of the month immediately preceding the date of publication of the Research Report
No
3 Research Analyst or his/her relative or YSL has any other material conflict of interest at the time of publication of the Research Report
No
4 Research Analyst has served as an officer, director or employee of the subject company(ies) No
5 YSL has received any compensation from the subject company in the past twelve months No
6 YSL has received any compensation for investment banking or merchant banking or brokerage services from the subject company in the past twelve months
No
7
YSL has received any compensation for products or services other than investment banking or merchant banking or brokerage services from the subject company in the past twelve months
No
8 YSL has received any compensation or other benefits from the subject company or third party in connection with the research report
No
9 YSL has managed or co‐managed public offering of securities for the subject company in the past twelve months
No
10 Research Analyst or YSL has been engaged in market making activity for the subject company(ies) No
Since YSL and its associates are engaged in various businesses in the financial services industry, they may have financial interest or may have received compensation for investment banking or merchant banking or brokerage services or for any other product or services of whatsoever nature from the subject company(ies) in the past twelve months or associates of YSL may have managed or co‐managed public offering of securities in the past twelve months of the subject company(ies) whose securities are discussed herein.
Associates of YSL may have actual/beneficial ownership of 1% or more and/or other material conflict of interest in the securities discussed herein.
YES Securities (India) Limited
Registered Office: Unit No. 602 A, 6th Floor, Tower 1 & 2, Indiabulls Finance Centre, Senapati Bapat Marg, Elphinstone Road, Mumbai –
400013, Maharashtra, India.
Tel: +91‐22‐71123123 | Email: [email protected] | Website: www.yesinvest.in
CIN: U74992MH2013PLC240971 | SEBI Single Registration No.: NSE, BSE
& MCX: INZ000185632 | MERCHANT BANKER: INM000012227 | RESEARCH ANALYST: INH000002376 |INVESTMENT ADVISER:
INA000007331| AMFI ARN Code – 94338 |
Details of Compliance Officer: Name: Vaibhav Purohit, Email id: [email protected], Contact No‐+91‐22‐33479208
For important information about YES Securities (India) Ltd. and other disclosures, refer to the end of this material.
RECOMMENDATION PARAMETERS FOR FUNDAMENTAL REPORTS
Analysts assign ratings to the stocks according to the expected upside/downside relative to the current market price and the estimated target price. Depending on the expected returns, the recommendations are categorized as mentioned below. The performance horizon is 12 to 18 months unless specified and the target price is defined as the analysts’ valuation for a stock. No benchmark is applicable to the ratings mentioned in this report.
BUY: Potential return >15% over 12 months
ADD: Potential return +5% to +15% over 12 months
REDUCE: Potential return ‐10% to +5% over 12 months
SELL: Potential return <‐10% over 12 months
NOT RATED / UNDER REVIEW
ABOUT YES SECURITIES (INDIA) LIMITED
YES Securities (India) Limited (‘‘YSL’’) is a wholly owned subsidiary of YES BANK LIMITED. YSL is a SEBI registered stock broker holding membership of NSE, BSE and MCX. YSL is also a SEBI registered Category I Merchant Banker, Investment Adviser and a Research Analyst. YSL offers, inter alia, trading/investment in equity and other financial products along with various value‐added services. We hereby declare that there are no disciplinary actions taken against YSL by SEBI/Stock Exchanges.