co-incorporation of heterologously expressed arabidopsis cytochrome p450 and p450 reductase into...
TRANSCRIPT
Archives of Biochemistry and Biophysics 424 (2004) 141–153
ABBwww.elsevier.com/locate/yabbi
Co-incorporation of heterologously expressedArabidopsis cytochrome P450 and P450 reductase into soluble
nanoscale lipid bilayers
Hui Duan,a Natanya R. Civjan,b Stephen G. Sligar,b and Mary A. Schulera,*
a Department of Cell and Structural Biology, University of Illinois at Urbana-Champaign, Urbana, IL 61801, USAb Department of Biochemistry, University of Illinois at Urbana-Champaign, Urbana, IL 61801, USA
Received 17 December 2003, and in revised form 3 February 2004
Abstract
Heterologous expression of CYP73A5, an Arabidopsis cytochrome P450 monooxygenase, in baculovirus-infected insect cells
yields correctly configured P450 detectable by reduced CO spectral analysis in microsomes and cell lysates. Co-expression of a
housefly NADPH P450 reductase substantially increases the ability of this P450 to hydroxylate trans-cinnamic acid, its natural
phenylpropanoid substrate. For development of high-throughput P450 substrate profiling procedures, membrane proteins derived
from cells overexpressing CYP73A5 and/or NADPH P450 reductase were incorporated into soluble His6-tagged nanoscale lipid
bilayers (Nanodiscs) using a simple self-assembly process. Biochemical characterizations of nickel affinity-purified and size-frac-
tionated Nanodiscs indicate that CYP73A5 protein assembled into Nanodiscs in the absence of NADPH P450 reductase maintains
its ability to bind its t-cinnamic acid substrate. CYP73A5 protein co-assembled with P450 reductase into Nanodiscs hydroxylates
t-cinnamic acid using reduced pyridine nucleotide as an electron source. These data indicate that baculovirus-expressed P450s
assembled in Nanodiscs can be used to define the chemical binding profiles and enzymatic activities of these monooxygenases.
� 2004 Elsevier Inc. All rights reserved.
Keywords: Cytochrome P450 monooxygenases; Arabidopsis P450s; Nanoscale lipid bilayers (Nanodiscs); P450 reductases; Heterologous expression
systems
Plant cytochrome P450 monooxygenases play critical
roles in many different biosynthetic and detoxicative
pathways. In various reactions, their activities mediate
the synthesis of lignins, UV protectants, pigments, de-
fense compounds, fatty acids, hormones, and signaling
molecules as well as the catabolism of herbicides, insec-
ticides, and pollutants [1–4]. In the plant genomes whose
sequences are completed, P450 proteins are derived froma large superfamily of genes including 247 genes and 25
pseudogenes in the Arabidopsis genome (http://www.
biobase.dk/P450/; http://arabidopsis-P450.biotec.uiuc.
edu/) and 356 genes and 99 pseudogenes in the rice ge-
nome (http://drnelson.utmem.edu/rice.html).
The functions of only a small fraction of these and
other plant P450 genes have been defined at a bio-
* Corresponding author. Fax: 1-217-244-1336.
E-mail address: [email protected] (M.A. Schuler).
0003-9861/$ - see front matter � 2004 Elsevier Inc. All rights reserved.
doi:10.1016/j.abb.2004.02.010
chemical level because classical approaches to P450
characterization have typically relied on detergent sol-
ubilization and purification of individual endogenous
P450 proteins from endoplasmic reticulum membranes
under denaturing conditions followed by reconstitution
with its required electron transfer partner, NADPH
cytochrome P450 reductase. Due to their low abundance
and the many difficulties encountered in fractionatingindividual proteins from endogenous P450 pools, more
recent approaches to P450 characterization now rely on
heterologous expression in one of the four systems:
bacterial (most commonly Escherichia coli), yeast (Sac-
charomyces cerevisiae or Pichia pastoris), and insect cells
(baculovirus-infected Sf9 cultures). While use of the
bacterial system still necessitates purification and
reconstitution with heterologously expressed P450reductase, use of these eukaryotic systems allows en-
zyme activities to be defined in cell lysates or purified

1 Abbreviations used: MSP, membrane scaffold protein; FBS, fetal
bovine serum; MOI, multiplicity of infection.
142 H. Duan et al. / Archives of Biochemistry and Biophysics 424 (2004) 141–153
microsomes using the endogenous level of P450 reduc-tase or supplemented levels of a co-expressed P450 re-
ductase [4].
Among these systems, the insect cell baculovirus ex-
pression system has unique advantages, including the
ability to express P450s from many species at high levels,
the capacity of its endogenous P450 reductase to couple
well with different P450s and the flexibility of providing
varying levels of heterologously expressed P450 reduc-tase. For plant expression studies, the baculovirus system
also has the advantage of having codon preferences
similar to those present in dicotyledonous plant tran-
scriptsmaking itmore likely that the target protein will be
successfully expressed. As is the case with all of these
expression systems, the final level of expressed protein
depends on the compatibility of individual sequences
with each system�s cellular functions as well as its proteintargeting and stability determinants. Among plant P450
proteins, several clear examples now exist where suc-
cessful expression has been accomplished in the baculo-
virus-mediated insect system but not in the yeast system.
Included in this collection are the taxane 13a-hydroxylase(CYP725A2) from Taxus cuspidata (yew), whose ex-
pression was nonexistent in yeast [5], and the (S)-N -
methylcoclaurine 30-hydroxylase (CYP80B1) fromEschscholzia californica (poppy), whose CO-difference
profiles (measuring P450 content) were not reproducible
in yeast [6]. Other plant P450s that have also been ex-
pressed in the baculovirus-mediated insect system include
Arabidopsis thaliana CYP73A5 [7], Berberis stolonifera
CYP80A1 [8], peppermint CYP71D13 and CYP71D15,
spearmint CYP71D18 [9], soybean CYP93C1 [10], andT.
cuspidata CYP725A1 (10b-hydroxylase; [5]).Not surprisingly, these and other P450 heterologous
expression successes have highlighted limitations in the
level of endogenous insect cell P450 reductase available
for coupling with heterologously expressed P450s
[5,6,11–14]. In some cases, this limitation has been
partially surmounted by purification of the baculovirus-
expressed plant P450 and reconstitution with a purified
plant P450 reductase [7,8]. In other cases, P450s fromBerberis or Taxus have been co-expressed with P450
reductases from homologous sources at a single fixed
P450:P450 reductase ratio [5,6]. In these systems, there
has been relatively little discussion of the expression
parameters needed for optimal activity due to the lack of
control over stoichiometry. Owing to this absence of
information, as well as some of the previously cited
problems that may be encountered in attempting toexpress both P450s and P450 reductases in insect cells,
we have analyzed t-cinnamic acid hydroxylase in the
phenylpropanoid pathway under a variety of co-ex-
pression conditions in an attempt to better describe the
expression optimizations needed for functional analysis.
For these types of membrane-anchored P450:P450
reductase complexes as well as many other integral
membrane proteins, one of the biggest challenges in thefield of functional genomics and proteomics is the need
for maintaining the appropriate phospholipid environ-
ment required for enzymatic function or receptor bind-
ing [15,16]. One of the most classical and widely used
strategies for functional analysis in a membrane envi-
ronment generates micron-sized liposomes from sub-
fractionated natural cellular membranes. But, owing to
the physical characteristics of liposomes, membraneproteins targeted for analysis by this method are often
sequestered in the solvent-inaccessible interior of the li-
posome [17]. Another more recently developed method
that avoids this limitation assembles membrane proteins
into stable, soluble nanometer-scale lipid bilayer struc-
tures using either purified lipids or pools of lipids de-
rived from natural membranes [18–20]. Integral to this
technology is a bioengineered amphipathic multi-helicalmembrane scaffold protein (MSP)1 whose hydrophobic
faces can circumscribe the edges of small lipid bilayer
and whose polar faces interact with polar aqueous sol-
vents. Assembled with phospholipids and integral
membrane proteins in two solubilization and detergent-
removal steps, the MSP protein encircles lipids and
membrane proteins in a flat discoidal structure (termed
Nanodisc) nominally 10 nm in diameter. Pioneered withpurified proteins containing one or seven membrane-
spanning helices, this system has been demonstrated to
incorporate individual integral membrane proteins into
nanoscale bilayers making them amenable to standard
fractionation and display technologies that are typically
reserved for soluble proteins. Owing to this system�spotential for compartmentalizing P450s in a format
suitable for dispersal and high-throughput analysis ofplant P450 function, we have coupled strategies for
baculovirus-mediated expression of P450 and P450 re-
ductases with those for Nanodisc formation to assemble
P450-containing Nanodiscs suitable for high-through-
put analysis of substrate binding and P450/P450 reduc-
tase-containing Nanodiscs suitable for analysis of
substrate turnover. We chose the Arabidopsis CYP73A5
protein which has been optimized for expression in thebaculovirus expression system to compare and contrast
the spectral characteristics of a plant P450 in micro-
somal membranes with those of a plant P450 assembled
in Nanodiscs. In this communication, we present evi-
dence that the mild solubilization conditions used in the
process of transferring proteins from natural mem-
branes into Nanodiscs maintain the integrity of this
P450 target protein as assayed by its ability to bindcarbon monoxide and its ability to bind and metabolize
its previously identified substrate.

H. Duan et al. / Archives of Biochemistry and Biophysics 424 (2004) 141–153 143
Experimental procedures
Chemicals
trans-Cinnamic acid, NADPH, cytochrome c, heat-inactivated fetal bovine serum (FBS), and hemin were
obtained from Sigma (St. Louis, MO). Molecular biol-
ogy reagents, pFastBac1 expression vector, Sf9 insect
cells, SF-900 serum-free medium, and DH10Bac com-petent cells were purchased from Gibco-BRL/Life
Technology (Grand Island, NY). Penicillin/streptomy-
cin was obtained from Bio-Whittaker (Walkersville,
MD). Optima grade HPLC solvents were obtained from
Fisher Scientific (Pittsburgh, PA).
Construction of P450 and P450 reductase expression
vectors
The Arabidopsis CYP73A5 coding region was RT-
PCR amplified from 1 to 2 lg total RNA isolated from 7-
day-old seedlings in a 50 ll reaction containing 5 ll of10� PCR buffer, 1 ll of 10mM dNTP mix, 1.5 ll of
50mM MgCl2, 0.5 ll RNAsin, 2 ll of 20 pmol/ll of eachCYP73A5-specific primer, 0.5 ll AMV (Promega, Mad-
ison, WI), 0.25 ll Taq DNA polymerase, and 0.25 ll PfxDNA polymerase (Invitrogen, Carlsbad, CA), reverse-
transcribed at 45 �C for 30min, followed by 25 cycles of
95 �C for 1min, 65 �C for 1min, 72 �C for 2min, and a
final extension step at 72 �C for 10min. To facilitate
cloning into both yeast and baculovirus vectors, the
73A5-50 forward primer (50gcgaattcggtaccatggacctcctcttgctgg30) contained EcoRI and KpnI sites (in bold) im-
mediately upstream of the translation start codon andthe 73A5-30 reverse primer (50cggaattcgagctcgaaagttttaacagttccttgg30) contained SacI and EcoRI immediately
downstream of the stop codon. The PCR products were
cleaned up using a Qiagen (Valencia, CA) PCR purifi-
cation kit and cloned directly into the pGEM-Teasy
vector (Promega, Madison, WI) and the sequences of
positive clones were verified on both strands using a se-
ries of vector- and gene-specific internal primers. Thefull-length CYP73A5 cDNA was excised from the
pGEM-Teasy vector and subcloned into the pFastBac1
vector using the KpnI and SacI sites adjacent to its open
reading frame.
The Arabidopsis P450 reductase (ATR1) cDNA [21]
was PCR amplified using a 50 primer coding for the first
eight amino acids (ATR1FOR, 50-acatgacttctgctttgtatgcttcc-30) and a 30 primer complementary to the lastseven amino acids (ATR1REV, 50-gctcaccagacatctctgaggtc-30). The 50 ll reaction was amplified using Pfx
DNA polymerase (Invitrogen) for 25 cycles with each
cycle consisting of 94 �C for 1min, 60 �C for 1min, and
72 �C for 2min followed by a final extension step at
72 �C for 10min. The 2 kb PCR fragment was cleaned
up using Qiagen PCR purification kit, A-tailed for
30min at 70 �C in the presence of 0.2mM dATP and 5UTaq DNA polymerase, and cloned into the pGEM-
Teasy vector. The sequences of positive clones were
verified on both strands using a series of vector- and
gene-specific internal primers. The full-length ATR1
cDNA was excised using flanking EcoRI sites in the
pGEM-Teasy vector and subcloned into the EcoRI-di-
gested pFastBac1 vector.
The CYP73A5/pFastBac1 and ATR1/pFastBac1constructs were subsequently used to generate re-
combinant bacmid DNA by transformation of E. coli
strain DH10Bac according to Gibco-BRL/Life Tech-
nology�s protocols. Construction of the Musca domes-
tica (housefly) P450 reductase expression vector is
described [14].
Protein expression and microsome preparation
The initial CYP73A5 and P450 reductase viral stocks
obtained after transfection of Sf9 cells according to the
manufacturer�s directions were amplified for 48 h to
obtain high titer working stocks. The titers of each stock
were determined by end-point plaque assay as described
by Gibco-BRL/Life Technology. Control viral stocks
were generated using pFastBac1 vector containing noforeign DNA.
For determination of the optimal conditions for
CYP73A5 expression, various MOIs (multiplicity of
infection, pfu/cell) from 0.1 to 50 were used to infect Sf9
cells at a cell density of 0.8� 106 cells/ml in SF-900 se-
rum-free medium supplemented with 10% FBS, 50 lg/ml
streptomycin sulfate, and 50U/ml penicillin. Hemin was
added to a final concentration of 2 lg/ml after 24 h ofinfection to compensate for the low heme synthetic ca-
pacity of these insect cells. To determine the optimal
conditions for coexpression of CYP73A5 and P450 re-
ductases, a fixed MOI value of 1 for recombinant
CYP73A5 virus and variable MOI values for P450 re-
ductase virus (0.025 to 10) were used to simultaneously
infect Sf9 cells corresponding to CYP73A5:P450 re-
ductase ratios of 40 to 0.1.All cells were harvested 72 h after infection by cen-
trifugation at 500g for 5min, washed twice with one
volume of PBS buffer (pH 7.4) [8 g/L NaCl, 0.2 g/L KCl,
1.44 g/L Na2HPO4, 0.24 g/L KH2PO4], and resuspended
in 1/10 of the original cell volume of cold cell lysate
buffer [PBS buffer (pH 7.4), 1.1mM EDTA, 0.1mM
dithiothreitol, 0.5mM phenylmethylsulfonyl fluoride,
5 lg/ml leupeptin, and 20% glycerol]. Cells were lysed bysonication on ice using a Kontes KT50 micro-ultrasonic
cell disrupter (Vineland, NJ) and debris was removed by
centrifugation at 10,000g and 4 �C for 10min. The re-
sulting cell lysate was either used directly for enzymatic
analysis or used to prepare microsomes by centrifuging
it at 34,000g and 4 �C for 1 h and resuspending the mi-
crosomal pellet in 1/20–1/33 of the original cell volume

144 H. Duan et al. / Archives of Biochemistry and Biophysics 424 (2004) 141–153
of cold cell lysate buffer (pH 7.4). Microsomes were ei-ther assayed immediately or were frozen in liquid ni-
trogen and stored at )80 �C. For typical CO-difference
analysis, Type I-binding analysis, and activity assays, 1–
2 plates containing 8� 106 cells each were infected at
variable MOI and grown at 25 �C for 72 h and the final
microsomal pellets were resuspended in 1ml cold
grinding buffer. For typical Nanodisc assemblies, 10
plates containing 8� 106 cells were each infected atMOIs of 2 for P450 virus and 1 for P450 reductase and
used to prepare 3–5ml of microsomes.
Analysis of P450 content and activities
For reduced CO-difference analysis [22] of the P450
content in each sample, aliquots of cell lysates or mi-
crosomal protein were diluted 1:10 with cell lysate buf-fer, reduced with sodium dithionite, and background
scanned from 400 to 500 nm. Subsequently, the sample
was saturated with CO and the difference spectra were
recorded by comparison with the reduced baseline scan.
P450 content was calculated as (A450 )A490)/0.091� di-
lution factor¼ nmol P450/ml. P450 reductase contents
were monitored by measuring NADPH-dependent cy-
tochrome c reductase activities as described by Gu-engerich [23] with the rate of cytochrome c reduction
calculated from the A550 change using an extinction
coefficient of 21mM�1 cm�1 and the formula DA550/min/
0.021¼ nmol cytochrome c reduced/min. One unit of
reductase activity corresponding to 1 nmol cytochrome creduced/min.
trans-CAH activities in cell lysates and microsomes
were assayed in 500 ll reactions containing 50mM po-tassium phosphate (pH 7.4), 20 lM t-cinnamic acid,
300 lM NADPH, and 5 nM P450 (as defined by CO-
difference analysis). After 5min at 30 �C, the reaction
was stopped by adding 40 ll 6M HCl and the reaction
solution was microfuged to pellet debris. trans-CAH
activities in Nanodiscs were assayed in 250 ll reactionscontaining 50mM potassium phosphate (pH 7.4),
20 lM t-cinnamic acid, 300 lM NADPH, and 5 nMP450 and incubated for 60 or 90min. Production of p-coumaric acid was monitored by loading 15 ll of the
supernatant onto a Waters HPLC system equipped with
a 5 lm reverse phase RP18 4.6� 150mm column (Wa-
ters, Milford, MA) and eluting under isocratic condi-
tions using a mobile phase of water:acetonitrile:acetic
acid (83:15:2) at a flow rate of 1.5ml/min.
Assembly of Nanodiscs
CYP73A5 was assembled into Nanodiscs (www.
nanodiscinc.com) in the absence of P450 reductase as
described by Civjan et al. [20] using microsomal mem-
branes containing 10 lmol lipids and approximately
1 nmol P450 (derived from 10 plates of Sf9 cells ex-
pressing CYP73A5 alone) and 0.1 lmol His6-taggedMSP1 protein (approximately 2.4mg MSP1). CYP73A5
was assembled into Nanodiscs in the presence of P450
reductase by combining microsomal membranes con-
taining 5 lmol lipids and approximately 0.5 nmol P450
(derived from 5 plates of Sf9 cells expressing CYP73A5
alone) with microsomal membranes containing 5 lmol
lipids and M. domestica P450 reductase (derived from 5
plates of Sf9 cells expressing P450 reductase alone),adding 0.1 lmol His6-tagged MSP1 protein and then
proceeding with detergent solubilization as previously
described [20]. His6-tagged Nanodiscs were purified by
incubating with 1ml Ni–NTA agarose (Qiagen, Valen-
cia, CA) per 7.5mg His6-tagged MSP1 for 1 h at 4 �Cfollowed by centrifugation at 12,000g for 5min. MSP1
particles bound to the nickel matrix were washed three
sequential times with resin volumes of 0.1M sodiumphosphate (pH 7.4) containing 0.3M NaCl, 0.15M
NaCl, and no NaCl. MSP1 particles were eluted with
0.2ml of 0.1M sodium phosphate (pH 7.4), 0.25M
EDTA to preserve the integrity of the P450 protein that
is irreversibly inactivated by imidazole. Nickel affinity-
purified MSP1 particles were stored at 4 �C and injected
onto a Superdex TM 200 HR 20/30 gel filtration column
(Amersham Biosciences) equilibrated in 0.1M sodiumphosphate buffer (pH 7.4) at a flow rate of 0.5ml/min.
P450-containing fractions identified by their spectral
absorbance at 417 nm were collected and concentrated
using a Centricon YM-30 centrifugal filter device (Mil-
lipore, Billerica, MA) to final concentrations of ap-
proximately 50 nM. Protein samples electrophoresed on
precast 4–20% SDS–PAGE gels (Amersham Bio-
sciences, Piscataway, NJ) were stained with Coomassieblue.
Substrate binding analysis
Spectral binding titrations of CYP73A5 were per-
formed in cuvettes using the double beam mode on a
CARY 100 spectrophotometer. For assays of micro-
somal P450s, 1ml containing 100 pmol CYP73A5 wasdivided equally into two cuvettes and baseline scanned
from 350 to 500 nm. Sequential 0.5–2.0 ll aliquots of
0.1–10mM t-cinnamate dissolved in methanol were ad-
ded to the protein portion of the sample cuvette and the
same volume of methanol was added to the reference
cuvette. Thirty seconds after addition of substrate,
spectra were recorded from 350 to 450 nm and back-
ground corrected. For assays of Nanodisc-assembledP450s, 1ml containing 50 pmol CYP73A5 was divided
into cuvettes and assayed as above. For assays of
Nanodisc-assembled P450s in microtiter plates, 200 llcontaining 10 pmol CYP73A5 was dispensed into each
sample well of a 96-well plate. For controls, 200 ll of0.1M sodium phosphate (pH 7.4) was dispensed into
each buffer well. Substrate binding affinities were mon-

H. Duan et al. / Archives of Biochemistry and Biophysics 424 (2004) 141–153 145
itored by adding 1 ll of the t-cinnamate stock concen-tration shown in parentheses to yield final concentra-
tions of 0 lM (0), 1 lM (0.2mM), 10 lM (2mM), 50 lM(10mM), and 150 lM (30mM). The wells were scanned
at 1 nm increments from 350 to 500 nm using a Spec-
traMAX Plus microplate spectrophotometer (Molecular
Devices, Sunnyvale, CA) and were corrected for the
background absorbance in the paired buffer plus sub-
strate wells and the protein absorbance in P450-con-taining Nanodiscs with no substrate added.
Determination of P450:P450 reductase coupling efficiency
The coupling efficiency of CYP73A5 was measured
by monitoring NADPH consumption at 340 nm using
an extinction coefficient at A340 of 6.22mM�1 cm�1. For
these measurements 10 pmol of P450 from CYP73A5-expressing microsomes or CYP73A5- and P450 reduc-
tase-containing Nanodisc fractions 23–24 was diluted in
1ml PBS buffer (pH 7.4) containing 20 lM NADPH
yielding a final CYP73A5 concentration of 10 nM. The
solution was equally divided between the reference and
sample cuvettes and the baseline was recorded for 1min
at 340 nm. NADPH utilization was initiated by adding
2–8 ll aliquots of a t-cinnamate stock solution (1–100mM) to the sample cuvette and an equivalent
Fig. 1. MOI dependencies of CYP73A5 and P450 reductase expression in
combinant CYP73A5 virus were cultured for 72 h post-infection and monitor
transfected with a constant amount of recombinant CYP73A5 virus (MOI of
virus (MOI of 0.025 to 10) were cultured for 72 h post-infection and monito
NADPH P450 reductase activity (open bars). (C) Coomassie blue-stained m
CYP73A5 and housefly P450 reductase fractionated on 4–20% SDS–PAGE
amount of methanol solvent to the reference cuvette andmonitored for 30min (microsomes) or 60min (Nano-
discs) at 340 nm. Following turnover of all NADPH, the
proportion of p-coumaric product was defined by HPLC
analysis as previously described and the coupling effi-
ciency was calculated as the proportion of product
generated relative to NADPH consumed.
Results
CYP73A5 expression in insect cells
In the first experiments optimizing the expression of
functional CYP73A5 protein in the insect cell baculo-
virus expression system, P450 contents were monitored
in hemin supplemented media 72 h after transfectingwith varying MOIs for the recombinant CYP73A5 virus
as described in Experimental procedures. As shown in
Fig. 1A, no P450 was detected by CO-difference analysis
in control Sf9 cells transfected with an empty control
vector (MOI of 0). As the MOI increases from 0.1 to 5,
the CYP73A5 protein content increases fourfold to a
maximum at a range of MOIs between 1 and 5. At
higher MOI values (>5), the CYP73A5 protein contentwas reduced presumably because of limitations in the
Sf9 cells. (A) Sf9 cells transfected with varying concentrations of re-
ed for P450 content by reduced CO-difference analysis [22]. (B) Sf9 cells
1) and varying amounts of recombinant M. domestica P450 reductase
red for their P450 content (diamonds), t-CAH activity (squares), and
icrosomal proteins from Sf9 cells expressing varying MOI ratios of
gels.

146 H. Duan et al. / Archives of Biochemistry and Biophysics 424 (2004) 141–153
transcription and translation capacities of these cells. AtMOI of 5 or lower, expressed CYP73A5 protein was
detected only as P450 in CO-difference analysis. At MOI
of 10, expressed CYP73A5 protein was detected pre-
dominantly as P450 with a small amount of P420 also
present (not shown). In the range of MOI between 1 and
5, the P450 content detected by reduced CO-difference
analysis is approximately 1.2 nmol/10ml cell culture
corresponding to 1–2% of the total cell protein.
CYP73A5 expressed in insect cells binds substrate with
high affinity
To determine the substrate binding affinity of
CYP73A5 in microsomal membranes, substrate binding
was measured by Type I-binding analysis that quantifies
the ability of a substrate to displace water as the sixthligand to the P450 heme iron [24]. As shown in Fig. 2A,
additions of increasing concentrations of t-cinnamic
acid, the natural substrate for CYP73A5, to insect mi-
crosomes overexpressing this P450 generate typical Type
I-binding spectra with absorption peaks at 390 nm and
troughs at 420 nm. Reciprocal plots of the substrate-
dependent absorbance changes (A390–A420) versus in-
creasing concentration (Fig. 2C) indicate that CYP73A5in microsomes binds t-cinnamic acid with high affinity
(Ks 2.4 lM) in the absence of co-expressed P450 reduc-
tase. trans-Cinnamic acid binding at saturation to
CYP73A5 results in 84% conversion to high spin state as
determined by comparison with camphor binding to
bacterial CYP101 [25]. In control samples, no Type I
spectral shifts were observed for t-cinnamic acid added
to insect cell microsomes lacking CYP73A5 or for p-coumarate (the product of the CYP73A5 reaction) ad-
ded to insect cell microsomes containing CYP73A5.
CYP73A5 activity in insect cells requires supplementation
with heterologous P450 reductase
To optimize CYP73A5 activity, CYP73A5 metabo-
lism of t-cinnamic acid to p-coumaric acid was moni-tored in cell lysates from Sf9 cells overexpressing
Fig. 2. Substrate binding analysis for CYP73A5 in microsomes. (A) Type I
CYP73A5 incubated with varying concentrations of t-cinnamic acid (0.1–47lsamples containing 50 nM baculovirus-expressed CYP73A5.
CYP73A5 (MOI of 1) in the presence of the endogenousP450 reductase. Under these conditions where the en-
dogenous Sf9 cell P450 reductase is known to function
with insect P450s [14,26], CYP73A5 failed to metabolize
t-cinnamic acid, indicating that Sf9 cell P450 reductase
does not couple at all with the overexpressed Arabid-
opsis P450. To provide alternate electron transfer part-
ners for this P450, Sf9 cells were transfected with
varying MOI for recombinant baculovirus containingthe M. domestica (housefly) NADPH P450 reductase
coding sequence [14,27]. Sequence comparisons indicate
that this insect P450 reductase shares 37.3% and 38.7%
identity with those of the Arabidopsis P450 reductases
designated ATR1 and ATR2. Compared to the endog-
enous P450 reductase activity present in Sf9 cells (ap-
proximately 0.8 nmol cytochrome c reduced/min) [14],
overexpression of this housefly P450 reductase signifi-cantly increases cytochrome c reduction from 6.28 nmol
cytochrome c reduced/min at MOI of 0.05 (Fig. 1B,
MOI ratio of 20), 19.0 nmol/min at MOI of 0.2, 32 nmol/
min at MOI of 1, 40 nmol/min at MOI of 5, and
38 nmol/min at MOI of 10.
Because Sf9 cells reach limits in their capacity to
synthesize heterologously expressed proteins at very
high MOI, the baculovirus titers used to infect cells arerestricted in both one-component (P450) and two-com-
ponent (P450 and P450 reductase) expression systems.
To ensure that non-limiting levels of both P450 and
P450 reductase were co-expressed in our system, protein
contents and activities were assayed in Sf9 cells trans-
fected with a fixed amount of recombinant CYP73A5
virus (MOI of 1) and varying amounts of recombinant
housefly P450 reductase (MOIS of 0.025 to 10) whichcorrespond to P450:P450 reductase ratios from 40 to
0.1. As shown in Figs. 1B and C, increasing the re-
combinant P450 reductase viral titer increases the P450
reductase activity while decreasing the P450 content of
cell lysates (from 1.2 to 0.25 nmol:10:ml culture) as well
as the P450/P450 reductase ratios. In concert with these
changes, the t-CAH activities were significantly in-
creased from 6nmol t-CA metabolized/nmol P450/minat an MOI ratio of 40 to 45 nmol t-CA metabolized/
-binding spectra were defined in microsomes from Sf9 cells expressing
M). (B and C) Ligand binding titrations for t-cinnamic acid obtained in
H. Duan et al. / Archives of Biochemistry and Biophysics 424 (2004) 141–153 147
nmol P450/min at an MOI ratio of 1. At the very lowMOI ratio of 0.1 corresponding to the highest P450 re-
ductase titers analyzed, t-CAH activities were slightly
decreased compared to those obtained at an MOI ratio
of 1 probably due to decreases in total protein expres-
sion at high viral titers. At the high MOI ratio of 5, both
the yield and enzymatic activity of CYP73A5 protein are
high and this ratio was adopted as the optimal
P450:P450 reductase ratio for co-expression of thisP450. Measurements of kinetic parameters at this MOI
ratio indicate that CYP73A5 has a Km of 4.6 lM, Vmax of
31.2 nmol t-CA/nmol P450/min, and a maximal coupling
efficiency of 0.74 measured as a function of NADPH
consumption at saturating substrate (Table 1).
Comparable expression of recombinant Arabidopsis
P450 reductase (ATR1) baculovirus yielded substan-
tially less P450 reductase activity than the recombinanthousefly P450 reductase at all MOI analyzed, suggesting
either that the plant ATR1 coding sequence was not
efficiently translated in insect cells and/or that the ATR1
protein was not stable in this cell line. Co-expression of
CYP73A5 and ATR1 at a variety of MOI ratios failed
to increase CYP73A5 activity above 5 nmol t-CA me-
tabolized/nmol P450/min at an MOI ratio of 40.
Nanodiscs containing CYP73A5 bind substrate
To determine whether heterologously expressed plant
P450 proteins can be incorporated into nanoscale bi-
layers for more sensitive substrate binding analysis,
microsomal membranes from Sf9 cells expressing
CYP73A5 alone were assembled with His6-tagged MSP1
protein and nickel affinity-purified as schematically di-agrammed in Fig. 3 and described in Experimental
procedures. In the first assembly step, microsomal
membrane proteins were completely solubilized by
adding cholic acid, mixing with His6-MSP1 protein [28]
and incubating with Biobeads to remove detergent. In
the second affinity purification step, His6-MSP1-sup-
ported phospholipid bilayers formed as a result of the
assembly process and residual free His6-MSP1 proteinwas separated from free membrane proteins by incuba-
tion with nickel affinity agarose. SDS–PAGE gel elec-
trophoresis at this point in the assembly process
indicated that the nickel affinity-purified pool of as-
sembled Nanodiscs contained overexpressed CYP73A5
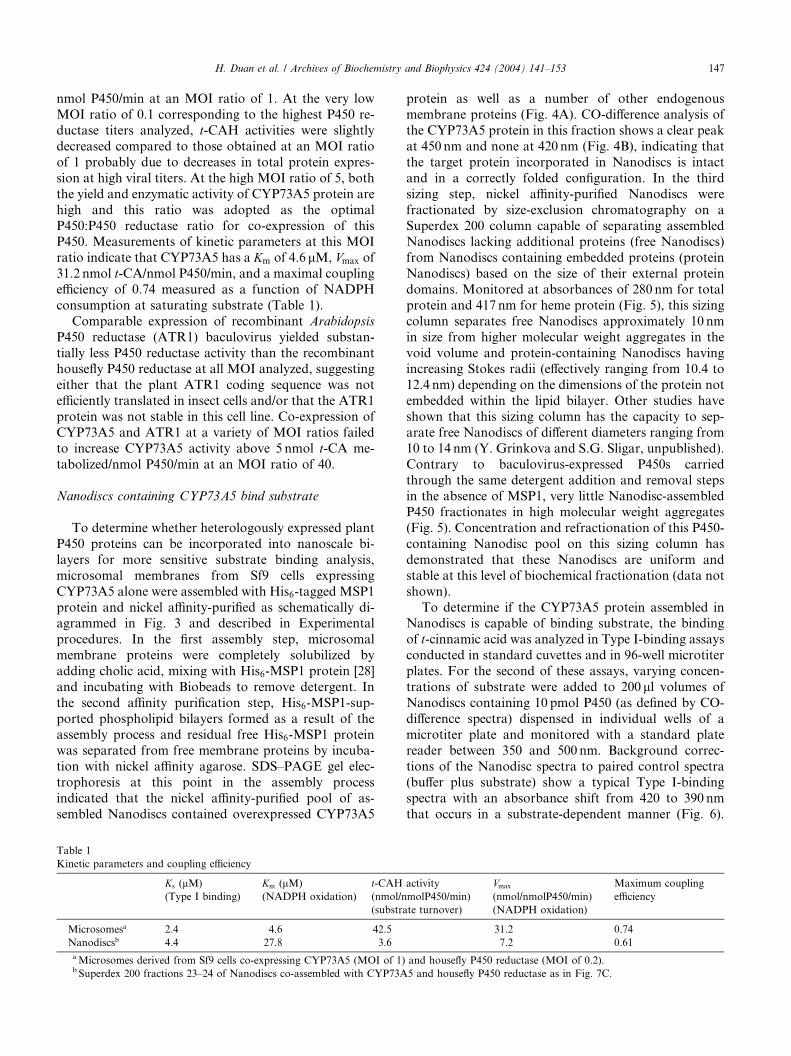
Table 1
Kinetic parameters and coupling efficiency
Ks (lM)
(Type I binding)
Km (lM)
(NADPH oxidation)
t-CAH
(nmol/n
(substra
Microsomesa 2.4 4.6 42.5
Nanodiscsb 4.4 27.8 3.6
aMicrosomes derived from Sf9 cells co-expressing CYP73A5 (MOI of 1)b Superdex 200 fractions 23–24 of Nanodiscs co-assembled with CYP73A
protein as well as a number of other endogenousmembrane proteins (Fig. 4A). CO-difference analysis of
the CYP73A5 protein in this fraction shows a clear peak
at 450 nm and none at 420 nm (Fig. 4B), indicating that
the target protein incorporated in Nanodiscs is intact
and in a correctly folded configuration. In the third
sizing step, nickel affinity-purified Nanodiscs were
fractionated by size-exclusion chromatography on a
Superdex 200 column capable of separating assembledNanodiscs lacking additional proteins (free Nanodiscs)
from Nanodiscs containing embedded proteins (protein
Nanodiscs) based on the size of their external protein
domains. Monitored at absorbances of 280 nm for total
protein and 417 nm for heme protein (Fig. 5), this sizing
column separates free Nanodiscs approximately 10 nm
in size from higher molecular weight aggregates in the
void volume and protein-containing Nanodiscs havingincreasing Stokes radii (effectively ranging from 10.4 to
12.4 nm) depending on the dimensions of the protein not
embedded within the lipid bilayer. Other studies have
shown that this sizing column has the capacity to sep-
arate free Nanodiscs of different diameters ranging from
10 to 14 nm (Y. Grinkova and S.G. Sligar, unpublished).
Contrary to baculovirus-expressed P450s carried
through the same detergent addition and removal stepsin the absence of MSP1, very little Nanodisc-assembled
P450 fractionates in high molecular weight aggregates
(Fig. 5). Concentration and refractionation of this P450-
containing Nanodisc pool on this sizing column has
demonstrated that these Nanodiscs are uniform and
stable at this level of biochemical fractionation (data not
shown).
To determine if the CYP73A5 protein assembled inNanodiscs is capable of binding substrate, the binding
of t-cinnamic acid was analyzed in Type I-binding assays
conducted in standard cuvettes and in 96-well microtiter
plates. For the second of these assays, varying concen-
trations of substrate were added to 200 ll volumes of
Nanodiscs containing 10 pmol P450 (as defined by CO-
difference spectra) dispensed in individual wells of a
microtiter plate and monitored with a standard platereader between 350 and 500 nm. Background correc-
tions of the Nanodisc spectra to paired control spectra
(buffer plus substrate) show a typical Type I-binding
spectra with an absorbance shift from 420 to 390 nm
that occurs in a substrate-dependent manner (Fig. 6).
activity
molP450/min)
te turnover)
Vmax
(nmol/nmolP450/min)
(NADPH oxidation)
Maximum coupling
efficiency
31.2 0.74
7.2 0.61
and housefly P450 reductase (MOI of 0.2).
5 and housefly P450 reductase as in Fig. 7C.
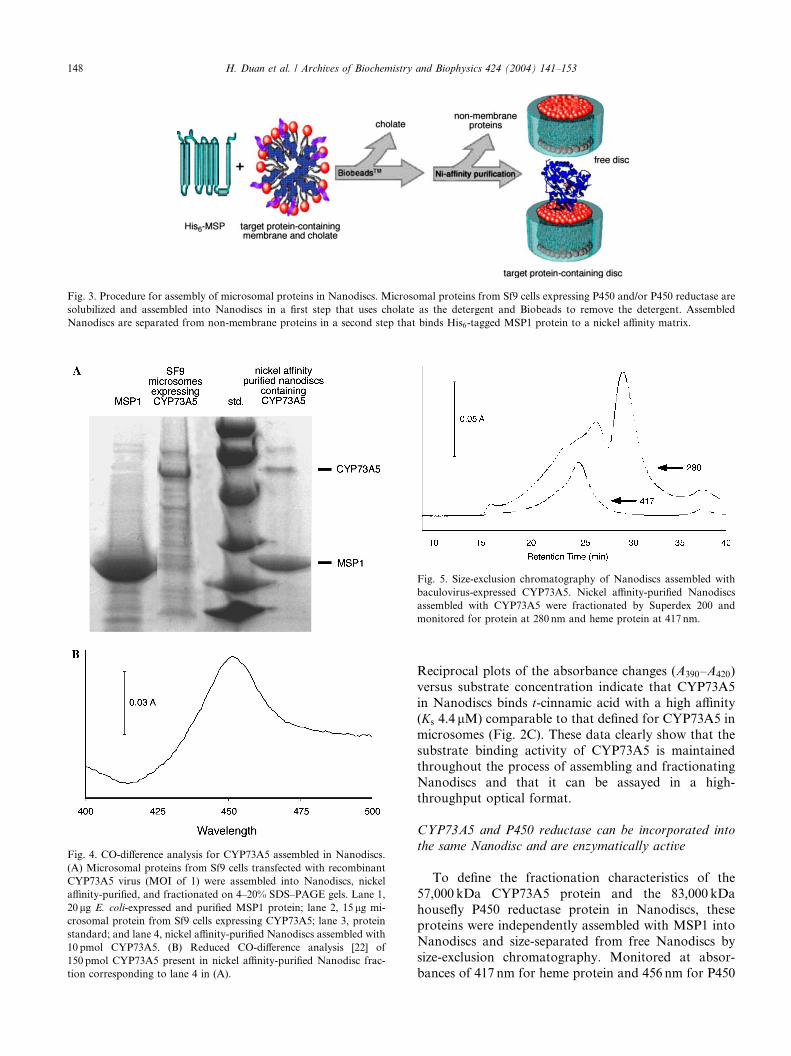
Fig. 4. CO-difference analysis for CYP73A5 assembled in Nanodiscs.
(A) Microsomal proteins from Sf9 cells transfected with recombinant
CYP73A5 virus (MOI of 1) were assembled into Nanodiscs, nickel
affinity-purified, and fractionated on 4–20% SDS–PAGE gels. Lane 1,
20 lg E. coli-expressed and purified MSP1 protein; lane 2, 15 lg mi-
crosomal protein from Sf9 cells expressing CYP73A5; lane 3, protein
standard; and lane 4, nickel affinity-purified Nanodiscs assembled with
10 pmol CYP73A5. (B) Reduced CO-difference analysis [22] of
150 pmol CYP73A5 present in nickel affinity-purified Nanodisc frac-
tion corresponding to lane 4 in (A).
Fig. 5. Size-exclusion chromatography of Nanodiscs assembled with
baculovirus-expressed CYP73A5. Nickel affinity-purified Nanodiscs
assembled with CYP73A5 were fractionated by Superdex 200 and
monitored for protein at 280 nm and heme protein at 417 nm.
Fig. 3. Procedure for assembly of microsomal proteins in Nanodiscs. Microsomal proteins from Sf9 cells expressing P450 and/or P450 reductase are
solubilized and assembled into Nanodiscs in a first step that uses cholate as the detergent and Biobeads to remove the detergent. Assembled
Nanodiscs are separated from non-membrane proteins in a second step that binds His6-tagged MSP1 protein to a nickel affinity matrix.
148 H. Duan et al. / Archives of Biochemistry and Biophysics 424 (2004) 141–153
Reciprocal plots of the absorbance changes (A390–A420)
versus substrate concentration indicate that CYP73A5
in Nanodiscs binds t-cinnamic acid with a high affinity
(Ks 4.4 lM) comparable to that defined for CYP73A5 in
microsomes (Fig. 2C). These data clearly show that the
substrate binding activity of CYP73A5 is maintained
throughout the process of assembling and fractionating
Nanodiscs and that it can be assayed in a high-throughput optical format.
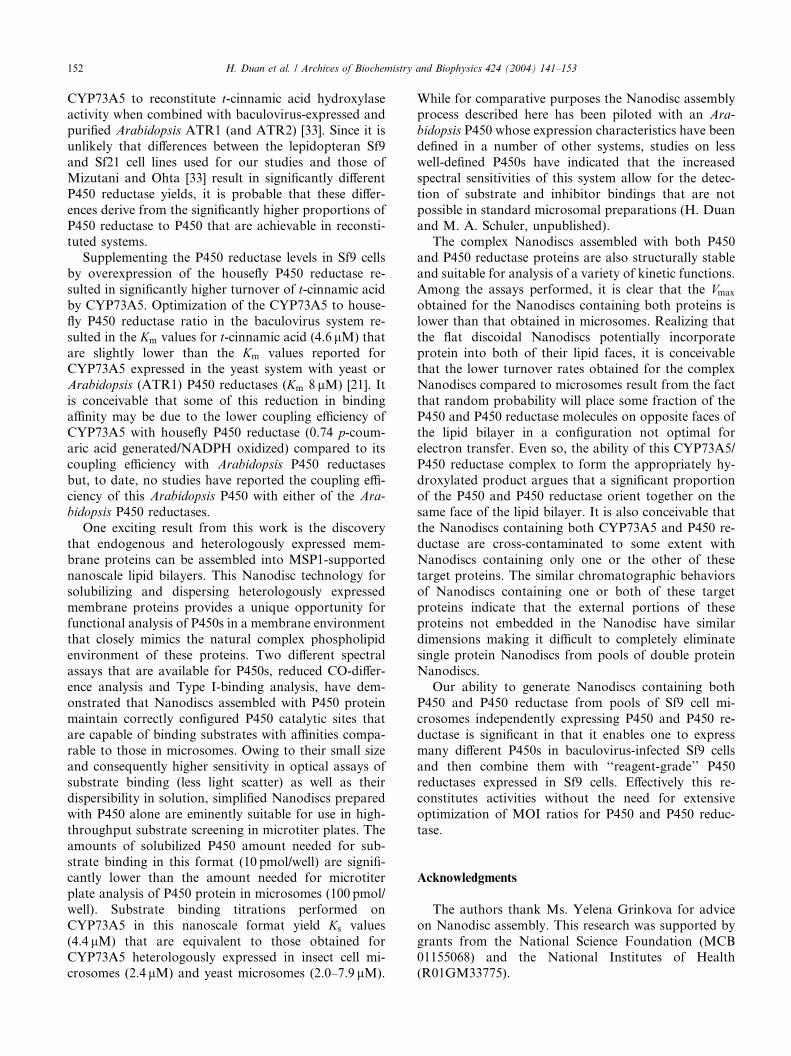
CYP73A5 and P450 reductase can be incorporated into
the same Nanodisc and are enzymatically active
To define the fractionation characteristics of the
57,000 kDa CYP73A5 protein and the 83,000 kDa
housefly P450 reductase protein in Nanodiscs, theseproteins were independently assembled with MSP1 into
Nanodiscs and size-separated from free Nanodiscs by
size-exclusion chromatography. Monitored at absor-
bances of 417 nm for heme protein and 456 nm for P450
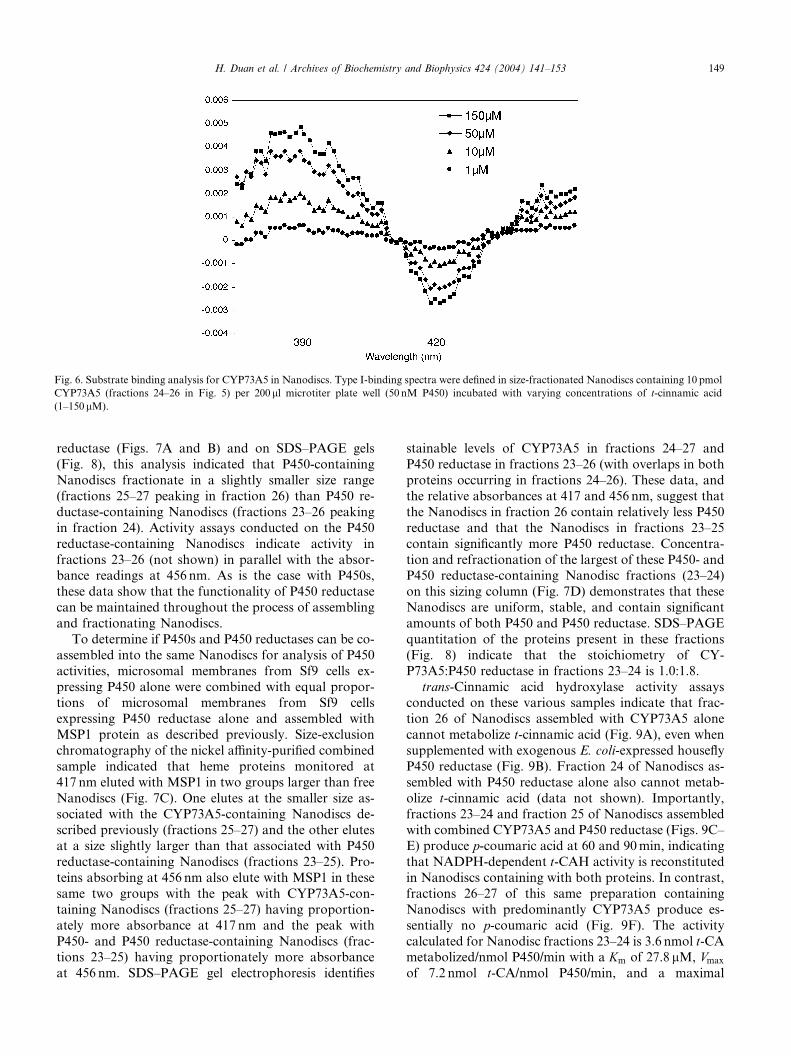
Fig. 6. Substrate binding analysis for CYP73A5 in Nanodiscs. Type I-binding spectra were defined in size-fractionated Nanodiscs containing 10 pmol
CYP73A5 (fractions 24–26 in Fig. 5) per 200ll microtiter plate well (50 nM P450) incubated with varying concentrations of t-cinnamic acid
(1–150lM).
H. Duan et al. / Archives of Biochemistry and Biophysics 424 (2004) 141–153 149
reductase (Figs. 7A and B) and on SDS–PAGE gels
(Fig. 8), this analysis indicated that P450-containing
Nanodiscs fractionate in a slightly smaller size range
(fractions 25–27 peaking in fraction 26) than P450 re-
ductase-containing Nanodiscs (fractions 23–26 peaking
in fraction 24). Activity assays conducted on the P450
reductase-containing Nanodiscs indicate activity in
fractions 23–26 (not shown) in parallel with the absor-bance readings at 456 nm. As is the case with P450s,
these data show that the functionality of P450 reductase
can be maintained throughout the process of assembling
and fractionating Nanodiscs.
To determine if P450s and P450 reductases can be co-
assembled into the same Nanodiscs for analysis of P450
activities, microsomal membranes from Sf9 cells ex-
pressing P450 alone were combined with equal propor-tions of microsomal membranes from Sf9 cells
expressing P450 reductase alone and assembled with
MSP1 protein as described previously. Size-exclusion
chromatography of the nickel affinity-purified combined
sample indicated that heme proteins monitored at
417 nm eluted with MSP1 in two groups larger than free
Nanodiscs (Fig. 7C). One elutes at the smaller size as-
sociated with the CYP73A5-containing Nanodiscs de-scribed previously (fractions 25–27) and the other elutes
at a size slightly larger than that associated with P450
reductase-containing Nanodiscs (fractions 23–25). Pro-
teins absorbing at 456 nm also elute with MSP1 in these
same two groups with the peak with CYP73A5-con-
taining Nanodiscs (fractions 25–27) having proportion-
ately more absorbance at 417 nm and the peak with
P450- and P450 reductase-containing Nanodiscs (frac-tions 23–25) having proportionately more absorbance
at 456 nm. SDS–PAGE gel electrophoresis identifies
stainable levels of CYP73A5 in fractions 24–27 and
P450 reductase in fractions 23–26 (with overlaps in both
proteins occurring in fractions 24–26). These data, and
the relative absorbances at 417 and 456 nm, suggest that
the Nanodiscs in fraction 26 contain relatively less P450
reductase and that the Nanodiscs in fractions 23–25
contain significantly more P450 reductase. Concentra-
tion and refractionation of the largest of these P450- andP450 reductase-containing Nanodisc fractions (23–24)
on this sizing column (Fig. 7D) demonstrates that these
Nanodiscs are uniform, stable, and contain significant
amounts of both P450 and P450 reductase. SDS–PAGE
quantitation of the proteins present in these fractions
(Fig. 8) indicate that the stoichiometry of CY-
P73A5:P450 reductase in fractions 23–24 is 1.0:1.8.
trans-Cinnamic acid hydroxylase activity assaysconducted on these various samples indicate that frac-
tion 26 of Nanodiscs assembled with CYP73A5 alone
cannot metabolize t-cinnamic acid (Fig. 9A), even when
supplemented with exogenous E. coli-expressed housefly
P450 reductase (Fig. 9B). Fraction 24 of Nanodiscs as-
sembled with P450 reductase alone also cannot metab-
olize t-cinnamic acid (data not shown). Importantly,
fractions 23–24 and fraction 25 of Nanodiscs assembledwith combined CYP73A5 and P450 reductase (Figs. 9C–
E) produce p-coumaric acid at 60 and 90min, indicating
that NADPH-dependent t-CAH activity is reconstituted
in Nanodiscs containing with both proteins. In contrast,
fractions 26–27 of this same preparation containing
Nanodiscs with predominantly CYP73A5 produce es-
sentially no p-coumaric acid (Fig. 9F). The activity
calculated for Nanodisc fractions 23–24 is 3.6 nmol t-CAmetabolized/nmol P450/min with a Km of 27.8 lM, Vmax
of 7.2 nmol t-CA/nmol P450/min, and a maximal
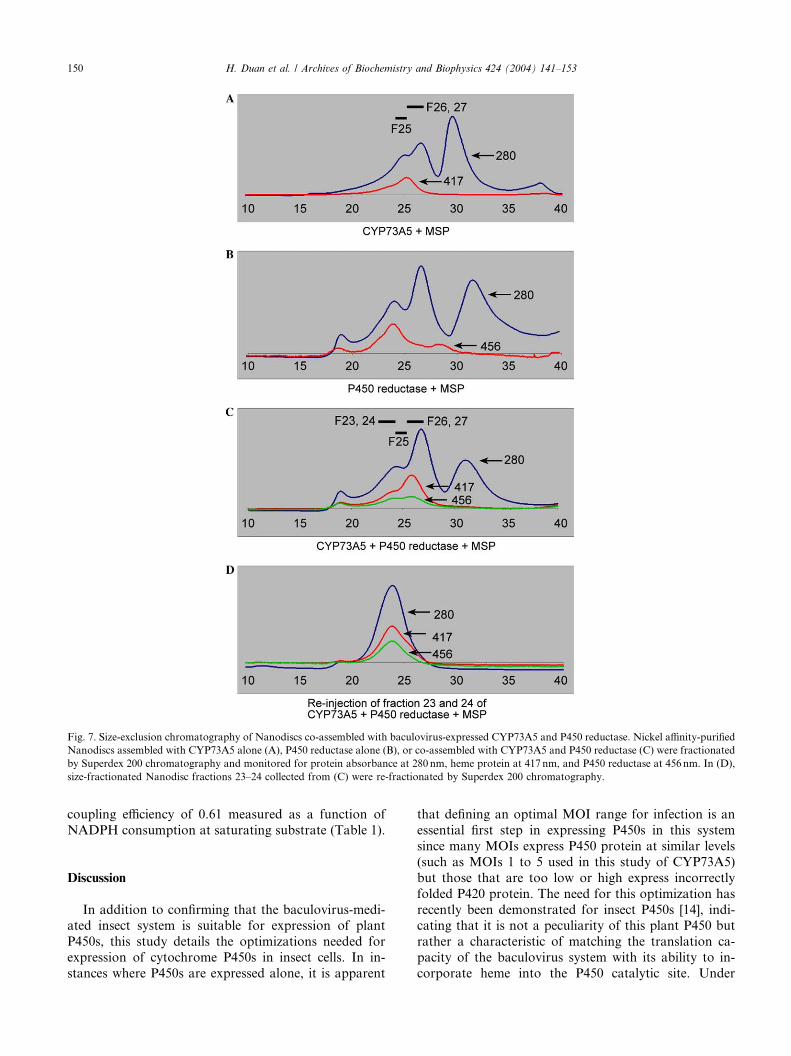
Fig. 7. Size-exclusion chromatography of Nanodiscs co-assembled with baculovirus-expressed CYP73A5 and P450 reductase. Nickel affinity-purified
Nanodiscs assembled with CYP73A5 alone (A), P450 reductase alone (B), or co-assembled with CYP73A5 and P450 reductase (C) were fractionated
by Superdex 200 chromatography and monitored for protein absorbance at 280 nm, heme protein at 417 nm, and P450 reductase at 456 nm. In (D),
size-fractionated Nanodisc fractions 23–24 collected from (C) were re-fractionated by Superdex 200 chromatography.
150 H. Duan et al. / Archives of Biochemistry and Biophysics 424 (2004) 141–153
coupling efficiency of 0.61 measured as a function of
NADPH consumption at saturating substrate (Table 1).
Discussion
In addition to confirming that the baculovirus-medi-ated insect system is suitable for expression of plant
P450s, this study details the optimizations needed for
expression of cytochrome P450s in insect cells. In in-
stances where P450s are expressed alone, it is apparent
that defining an optimal MOI range for infection is an
essential first step in expressing P450s in this system
since many MOIs express P450 protein at similar levels
(such as MOIs 1 to 5 used in this study of CYP73A5)
but those that are too low or high express incorrectly
folded P420 protein. The need for this optimization has
recently been demonstrated for insect P450s [14], indi-cating that it is not a peculiarity of this plant P450 but
rather a characteristic of matching the translation ca-
pacity of the baculovirus system with its ability to in-
corporate heme into the P450 catalytic site. Under

Fig. 8. SDS–PAGE analysis of P450 and P450 reductase-containing Nanodiscs. Nanodisc fractions from Superdex 200 columns shown in Fig. 7 were
fractionated on 4–20% SDS–PAGE gels and stained with Coomassie blue.
Fig. 9. t-Cinnamic acid hydroxylase assays on P450 and P450 reductase-containing Nanodiscs. HPLC fractionation of products derived from
fractions of Nanodiscs containing CYP73A5 alone (A), Nanodiscs containing CYP73A5 exogenously supplemented with E. coli-expressed housefly
P450 reductase (B), Nanodiscs containing co-assembled CYP73A5 and P450 reductase (C–E), and Nanodiscs of the same preparation containing
predominantly CYP73A5 (F). The p-coumaric acid (p-CA) product elutes at 10.1min and the t-cinnamic acid (t-CA) substrate elutes at 24.5min.
H. Duan et al. / Archives of Biochemistry and Biophysics 424 (2004) 141–153 151
optimal conditions, heterologous P450 expression can
account for 2–5% of the total cell protein yielding ap-
proximately 200 pmol P450/mg microsomal protein.
This yield is similar to that obtained for expression of
artichoke CYP73A1 in yeast cells reported to be
200 pmol P450/mg microsomal protein [29]. In Type I-
binding analysis, the binding affinity of baculovirus-ex-
pressed CYP73A5 for t-cinnamic acid is 2.4 lM, whichis within the range reported for CYP73A5 expressed in
yeast (Ks 2.0–7.9 lM) [29–31] and for endogenous t-CAH in Helianthus tuberosus (artichoke) microsomes
(Ks 1.5 lM) [32]. The high binding activity of CYP73A5
for t-cinnamic acid and the very high spin state con-
version associated with this binding (84%) indicate that
this substrate effectively binds and displaces heme-co-
ordinated water present in the catalytic site of this P450.Even with this optimal expression, it is apparent that
Arabidopsis CYP73A5 protein is incapable of coupling
with the low levels of P450 reductase present in Sf9 cells.
In instances such as this requiring co-expression of
compatible P450s and P450 reductases, defining a range
of optimal MOI ratios is an essential second step in
expressing P450 activities. Too high a ratio results in
insufficient electron transfer to the P450 under analysis
and too low a ratio results in low P450 activities due to
overexpression of P450 reductase and underexpression
of P450. Our first attempts at supplementing the P450
reductase levels in Sf9 cells with co-expressed Arabid-
opsis ATR1 P450 reductase resulted in unexpectedly lowturnover of t-cinnamic acid by CYP73A5. The fact that
cytochrome c reductase activities in Sf9 cells expressing
ATR1 in the presence and absence of CYP73A5 are
marginal indicate that this P450 reductase coding se-
quence is poorly translated presumably due to differ-
ences in the codon preferences of plant and insect
systems. Co-expression studies in yeast have similarly
reported that these Arabidopsis P450 reductases are ex-pressed at lower levels than the endogenous yeast P450
reductase [21,29]. The failure to supplement CYP73A5
activity with co-expressed Arabidopsis ATR1 in insect
microsomes stands in direct contrast with the ability
of baculovirus-expressed and purified Arabidopsis
152 H. Duan et al. / Archives of Biochemistry and Biophysics 424 (2004) 141–153
CYP73A5 to reconstitute t-cinnamic acid hydroxylaseactivity when combined with baculovirus-expressed and
purified Arabidopsis ATR1 (and ATR2) [33]. Since it is
unlikely that differences between the lepidopteran Sf9
and Sf21 cell lines used for our studies and those of
Mizutani and Ohta [33] result in significantly different
P450 reductase yields, it is probable that these differ-
ences derive from the significantly higher proportions of
P450 reductase to P450 that are achievable in reconsti-tuted systems.
Supplementing the P450 reductase levels in Sf9 cells
by overexpression of the housefly P450 reductase re-
sulted in significantly higher turnover of t-cinnamic acid
by CYP73A5. Optimization of the CYP73A5 to house-
fly P450 reductase ratio in the baculovirus system re-
sulted in the Km values for t-cinnamic acid (4.6 lM) that
are slightly lower than the Km values reported forCYP73A5 expressed in the yeast system with yeast or
Arabidopsis (ATR1) P450 reductases (Km 8 lM) [21]. It
is conceivable that some of this reduction in binding
affinity may be due to the lower coupling efficiency of
CYP73A5 with housefly P450 reductase (0.74 p-coum-
aric acid generated/NADPH oxidized) compared to its
coupling efficiency with Arabidopsis P450 reductases
but, to date, no studies have reported the coupling effi-ciency of this Arabidopsis P450 with either of the Ara-
bidopsis P450 reductases.
One exciting result from this work is the discovery
that endogenous and heterologously expressed mem-
brane proteins can be assembled into MSP1-supported
nanoscale lipid bilayers. This Nanodisc technology for
solubilizing and dispersing heterologously expressed
membrane proteins provides a unique opportunity forfunctional analysis of P450s in a membrane environment
that closely mimics the natural complex phospholipid
environment of these proteins. Two different spectral
assays that are available for P450s, reduced CO-differ-
ence analysis and Type I-binding analysis, have dem-
onstrated that Nanodiscs assembled with P450 protein
maintain correctly configured P450 catalytic sites that
are capable of binding substrates with affinities compa-rable to those in microsomes. Owing to their small size
and consequently higher sensitivity in optical assays of
substrate binding (less light scatter) as well as their
dispersibility in solution, simplified Nanodiscs prepared
with P450 alone are eminently suitable for use in high-
throughput substrate screening in microtiter plates. The
amounts of solubilized P450 amount needed for sub-
strate binding in this format (10 pmol/well) are signifi-cantly lower than the amount needed for microtiter
plate analysis of P450 protein in microsomes (100 pmol/
well). Substrate binding titrations performed on
CYP73A5 in this nanoscale format yield Ks values
(4.4 lM) that are equivalent to those obtained for
CYP73A5 heterologously expressed in insect cell mi-
crosomes (2.4 lM) and yeast microsomes (2.0–7.9 lM).
While for comparative purposes the Nanodisc assemblyprocess described here has been piloted with an Ara-
bidopsis P450 whose expression characteristics have been
defined in a number of other systems, studies on less
well-defined P450s have indicated that the increased
spectral sensitivities of this system allow for the detec-
tion of substrate and inhibitor bindings that are not
possible in standard microsomal preparations (H. Duan
and M. A. Schuler, unpublished).The complex Nanodiscs assembled with both P450
and P450 reductase proteins are also structurally stable
and suitable for analysis of a variety of kinetic functions.
Among the assays performed, it is clear that the Vmax
obtained for the Nanodiscs containing both proteins is
lower than that obtained in microsomes. Realizing that
the flat discoidal Nanodiscs potentially incorporate
protein into both of their lipid faces, it is conceivablethat the lower turnover rates obtained for the complex
Nanodiscs compared to microsomes result from the fact
that random probability will place some fraction of the
P450 and P450 reductase molecules on opposite faces of
the lipid bilayer in a configuration not optimal for
electron transfer. Even so, the ability of this CYP73A5/
P450 reductase complex to form the appropriately hy-
droxylated product argues that a significant proportionof the P450 and P450 reductase orient together on the
same face of the lipid bilayer. It is also conceivable that
the Nanodiscs containing both CYP73A5 and P450 re-
ductase are cross-contaminated to some extent with
Nanodiscs containing only one or the other of these
target proteins. The similar chromatographic behaviors
of Nanodiscs containing one or both of these target
proteins indicate that the external portions of theseproteins not embedded in the Nanodisc have similar
dimensions making it difficult to completely eliminate
single protein Nanodiscs from pools of double protein
Nanodiscs.
Our ability to generate Nanodiscs containing both
P450 and P450 reductase from pools of Sf9 cell mi-
crosomes independently expressing P450 and P450 re-
ductase is significant in that it enables one to expressmany different P450s in baculovirus-infected Sf9 cells
and then combine them with ‘‘reagent-grade’’ P450
reductases expressed in Sf9 cells. Effectively this re-
constitutes activities without the need for extensive
optimization of MOI ratios for P450 and P450 reduc-
tase.
Acknowledgments
The authors thank Ms. Yelena Grinkova for advice
on Nanodisc assembly. This research was supported by
grants from the National Science Foundation (MCB
01155068) and the National Institutes of Health
(R01GM33775).
H. Duan et al. / Archives of Biochemistry and Biophysics 424 (2004) 141–153 153
References
[1] M.A. Schuler, Crit. Rev. Plant Sci. 15 (1996) 235–284.
[2] C. Chapple, Annu. Rev. Plant Physiol. Plant Mol. Biol. 49 (1998)
311–343.
[3] R.A. Kahn, F. Durst, Recent Adv. Phytochem. 34 (2000) 151–189.
[4] M.A. Schuler, D. Werck-Reichhart, Annu. Rev. Plant Biol. 54
(2003) 629–667.
[5] S. Jennewein, C.D. Rithner, R.M. Williams, R.B. Croteau, Proc.
Natl. Acad. Sci. USA 98 (2001) 13595–13600.
[6] H.H. Pauli, T.M. Kutchan, Plant J. 13 (1998) 793–801.
[7] M. Mizutani, D. Ohta, R. Sato, Plant Physiol. 113 (1997) 755–763.
[8] P.F.X. Kraus, T.M. Kutchan, Proc. Natl. Acad. Sci. USA 92
(1995) 2071–2075.
[9] S. Lupien, F. Karp, M. Wildung, R. Croteau, Arch. Biochem.
Biophys. 368 (1999) 181–192.
[10] C.L. Steele, M. Gijzen, D. Qutob, R.A. Dixon, Arch. Biochem.
Biophys. 367 (1999) 146–150.
[11] M.J. Paine, D. Gilham, G.C. Roberts, C.R. Wolf, Arch. Biochem.
Biophys. 328 (1996) 143–150.
[12] L. Chen, J.T.M. Buters, J.P. Hardwick, S. Tamura, B.W. Penman,
F.J. Gonzalez, C.L. Crespi, Drug Metab. Dispos. 25 (1997) 399–
405.
[13] B.C. Dunkov, V.M. Guzov, G. Mocelin, F. Shotkoski, A. Brun,
M. Amichot, R.H. French-Constant, R. Feyereisen, DNA Cell
Biol. 16 (1997) 1345–1356.
[14] Z. Wen, L. Pan, M.R. Berenbaum, M.A. Schuler, Insect Biochem.
Mol. Biol. 33 (2003) 937–947.
[15] J. Kirilovsky, S. Steiner-Mordoch, Z. Selinger, M. Schramm,
FEBS Lett. 183 (1985) 75–80.
[16] S. Imaoka, Y. Imai, T. Shimada, Y. Funae, Biochemistry 31
(1992) 6063–6069.
[17] M. Angrand, A. Briolay, F. Ronzon, B. Roux, Eur. J. Biochem.
250 (1997) 168–176.
[18] T.H. Bayburt, J.W. Carlson, S.G. Sligar, J. Struct. Biol. 123
(1998) 37–44.
[19] T.H. Bayburt, S.G. Sligar, Protein Sci. 12 (2003) 2476–2481.
[20] N.R. Civjan, T.H. Bayburt, M.A. Schuler, S.G. Sligar, BioTech-
niques 35 (2003) 556–563.
[21] P. Urban, C. Mignotte, M. Kazmaier, F. Delorme, D. Pompon,
J. Biol. Chem. 272 (1997) 19176–19186.
[22] T. Omura, R. Sato, J. Biol. Chem. 239 (1964) 2370–2378.
[23] F.P. Guengerich, in: A.W. Hayes (Ed.), Principles and Methods of
Toxicology, Raven Press, New York, 1982, pp. 609–633.
[24] C.R. Jefcoate, Methods Enzymol. 52 (1978) 258–279.
[25] M.T. Fisher, S.F. Scarlata, S.G. Sligar, Arch. Biochem. Biophys.
240 (1985) 456–463.
[26] J.-S. Chen, M.R. Berenbaum, M.A. Schuler, Insect Mol. Biol. 11
(2002) 175–186.
[27] J.F. Koener, F.A. Carino, R. Feyereisen, Insect Biochem. Mol.
Biol. 23 (1993) 439–447.
[28] T.H. Bayburt, Y.V. Grinkova, S.G. Sligar, Nano Lett. 2 (2002)
853–856.
[29] P. Urban, D. Werck-Reichhart, H.G. Teutsch, F. Durst, S.
Regnier, M. Kazmaier, D. Pompon, Eur. J. Biochem. 222 (1994)
843–850.
[30] M.A. Pierrel, Y. Batard, M. Kazmaier, C. Mignotte-Vieux, F.
Durst, D. Werck-Reichhart, Eur. J. Biochem. 224 (1994) 835–
844.
[31] M. Schalk, S. Nedelkina, G. Schoch, Y. Batard, D. Werck-
Reichhart, Biochemistry 38 (1999) 6093–6103.
[32] B. Gabriac, D. Werck-Reichhart, H. Teutsch, F. Durst, Arch.
Biochem. Biophys. 288 (1991) 302–309.
[33] M. Mizutani, D. Ohta, Plant Physiol. 116 (1998) 357–367.