co emission and associated h? i absorption from a massive gas reservoir surrounding the z = 3 radio...
TRANSCRIPT

A&A 401, 911–925 (2003)DOI: 10.1051/0004-6361:20030171c© ESO 2003
Astronomy&
Astrophysics
CO emission and associated H I absorption from a massive gasreservoir surrounding the z = 3 radio galaxy B3 J2330+3927
C. De Breuck1,, R. Neri2, R. Morganti3, A. Omont1, B. Rocca-Volmerange1, D. Stern4, M. Reuland5,W. van Breugel5, H. Rottgering6, S. A. Stanford5,7, H. Spinrad8, M. Vigotti9, and M. Wright10
1 Institut d’Astrophysique de Paris, CNRS, 98bis boulevard Arago, 75014 Paris, Francee-mail:[debreuck, omont, rocca]@iap.fr
2 Institut de Radioastronomie Millim´etrique, 300 rue de la piscine, 38406 St. Martin-d’H`eres, Francee-mail:[email protected]
3 ASTRON, Postbus 2, 7990 AA Dwingeloo, The Netherlandse-mail:[email protected]
4 Jet Propulsion Laboratory, California Institute of Technology, Mail Stop 169-327, Pasadena, CA 91109, USAe-mail:[email protected]
5 IGPP/LLNL, L-413, 7000 East Ave, Livermore, CA 94550, USAe-mail:[mreuland, wil]@igpp.ucllnl.org
6 Sterrewacht Leiden, Postbus 9513, 2300 RA Leiden, The Netherlandse-mail:[email protected]
7 Department of Physics, University of California, Davis, CA 95616, USAe-mail:[email protected]
8 Department of Astronomy, University of California, Berkeley, CA 94720, USAe-mail:[email protected]
9 Istituto di Radioastronomia del CNR, Via Gobetti 101, 40129 Bologna, Italye-mail:[email protected]
10 Radio Astronomy Laboratory, University of California, Berkeley, CA 94720, USAe-mail:[email protected]
Received 12 August 2002/ Accepted 7 February 2003
Abstract. We present results of a comprehensive multi-frequency study of the radio galaxy B3 J2330+3927. The 1.′′9 wideradio source, consisting of 3 components, is bracketed by 2 objects in our KeckK-band image. Optical and near-IR Keckspectroscopy of these two objects yieldz = 3.087± 0.004. The brightest (K = 18.8) object has a standard type II AGNspectrum, and is the most likely location of the AGN, which implies a one-sided jet radio morphology.Deep 113 GHz observations with the IRAM Plateau de Bure Interferometer reveal COJ = 4−3 emission, which peaks at theposition of the AGN. The CO line is offset by 500 km s−1 from the systemic redshift of the AGN, but corresponds very closelyto the velocity shift of an associated H I absorber seen in Lyα. This strongly suggests that both originate from the same gasreservoir surrounding the AGN host galaxy. Simultaneous 230 GHz interferometer observations find a∼3× lower integratedflux density when compared to single dish 250 GHz observations with MAMBO at the IRAM 30 m telescope. This can beinterpreted as spatially resolved thermal dust emission at scales of 0.′′5 to 6′′.Finally, we present aτ < 1.3% limit to the H I 21 cm absorption against the radio source, which represents the seventh non-detection out of 8z > 2 radio galaxies observed to date with the WSRT.We present mass estimates for the atomic, neutral, and ionized hydrogen, and for the dust, ranging fromM(H I) = 2× 10⁷ Mderived from the associated H I absorber in Lyα up toM(H2) = 7× 10¹⁰ M derived from the CO emission. This indicates thatthe host galaxy is surrounded by a massive reservoir of gas and dust. TheK-band companion objects may be concentrationswithin this reservoir, which will eventually merge with the central galaxy hosting the AGN.
Key words. galaxies: individual: B3 J2330+3927 – galaxies: active – galaxies: formation – radio lines: galaxies –cosmology: observations
Send offprint requests to: C. De Breuck, e-mail:[email protected] Based on observations obtained with the IRAM Plateau de Bure
Interferometer, the W. M. Keck telescope, the Westerbork SynthesisRadio Telescope and the Very Large Array. Marie Curie fellow.
1. Introduction
The study of high redshift galaxies has for a long timebeen limited to the optical/near-IR and radio domains. Recenttechnological progress has now opened up other wavelengthregimes (sub-mm, X-ray and evenγ-ray) to high redshift
Article published by EDP Sciences and available at http://www.aanda.org or http://dx.doi.org/10.1051/0004-6361:20030171

912 C. De Breuck et al.: CO emission and H I absorption in B3 J2330+3927
studies. Together with the discovery of optically-selected“Lyman break” galaxies (e.g. Steidel et al. 1996, 1999; Ouchiet al. 2001), this has much broadened our knowledge of highredshift objects, which was previously based on galaxies con-taining bright AGN. Similarly, our knowledge of AGN has alsobenefited from this multi-wavelength approach. The fraction ofgalaxies hosting AGN can now be estimated from deep blank-field X-ray and optical surveys (e.g. Barger et al. 2001; Steidelet al. 2002), providing an estimate of the duration of their activephase.
The presence of an AGN introduces a number of complica-tions when studying the host galaxy. This is especially true fortype I (broad-lined) AGN, where the host galaxy can only beseen after a careful subtraction of the dominating AGN emis-sion. This problem does not manifest itself in type II (narrow-lined) AGN, where the bright central emission is convenientlyshielded by optically thick material. We can therefore use theAGN signatures to pinpoint the host galaxies, while still havinga relatively unbiased view of the stellar population.
The downside of using type II AGN is that their signa-tures are much fainter at optical wavelengths, and thus intrin-sically more difficult to detect out to high redshifts. Surveysfor distant type II AGN have therefore relied on manifesta-tions of the AGN at other wavelengths. Historically, the mostsuccessful technique has been the selection using powerful ra-dio synchrotron emission from the AGN, which has lead tothe discovery of almost 150 radio-loud type II AGN atz > 2(De Breuck et al. 2000b), with the most distant known atz = 5.19 (van Breugel et al. 1999). This predominance of radioselection has lead to the almost unique identification of highredshift type II AGN as “high redshift radio galaxies” (HzRGs,z > 2). However, recently radio-quiet type II AGN atz > 2 havealso been found in submm (Ivison et al. 1998; but see Vernet &Cimatti 2001), X-ray (Stern et al. 2002; Norman et al. 2002)and optical surveys (Steidel et al. 2002).
Despite these new developments, radio galaxies remainamongst the best studied galaxies at high redshift, because theyrepresent some of the most luminous stellar systems known outto z > 5 (e.g. Best et al. 1998; De Breuck et al. 2002). For ex-ample, deep optical spectropolarimetry can reveal a wealth ofinformation on the stellar population of the host galaxy (e.g.Dey et al. 1997), the presence of a scattered quasar compo-nent (e.g. Vernet et al. 2001a), and the kinematics, ionizationmechanism and metallicity of the extended emission line re-gions (e.g. Villar-Mart´ın et al. 2000; De Breuck et al. 2000b).Their emission lines (especially Lyα) are often bright enoughto derive information on the density and metallicity of associ-ated absorbers (van Ojik et al. 1997a; Binette et al. 2000; Jarviset al. 2003).
The radio selection has the advantage of being insensitive tothe dust properties, unlike optical selection techniques, whichmay miss heavily obscured systems. Such objects may beidentified by their strong dust emission at far-IR wavelengths.Early observations at 800µm and 1.2 mm by Dunlop et al.(1994) and Ivison (1995) detected strong thermal dust emis-sion in the radio galaxies 4C 41.17 (z = 3.8) and 8C 1425+635(z = 4.25), suggesting that several HzRGs do indeed con-tain significant amounts of dust. Archibald et al. (2001)
observed 47 1< z < 4.4 radio galaxies at 850µm using theSCUBA bolometer (Holland et al. 1999) on the JCMT. Even af-ter correcting for the strong negative k–correction effects on theRayleigh-Jeans tail of the thermal dust spectrum (e.g. Blain &Longair 1993), they found a substantial increase in the 850µmluminosity with redshift. This is confirmed by Reuland et al.(2003c), who detect more than half of the sources with SCUBAin a sample of 15 radio galaxies atz > 3. Such a redshift de-pendence is not seen for quasars, whose mm and submm lu-minosity remains almost unchanged betweenz ∼ 2 andz ∼ 4(Omont et al. 2003; Priddey et al. 2003). From a matched sam-ple of 1.37 < z < 2.0 quasars and radio galaxies selected at151 MHz, Willott et al. (2002) found that the quasars are ac-tually >∼2 times brighter at submm wavelengths than the radiogalaxies. They also find an anti-correlation between the far-IRluminosity and radio size, and interpret this as a synchroniza-tion between the jet-triggering event and processes controllingthe far-IR luminosity. A possible explanation for the differencebetween the (sub)mm redshift evolution of radio galaxies andquasars could then be that HzRGs are more massive, leading toa longer (sub)mm-luminous phase due to a larger supply of gas.
The relatively bright submm flux densities of HzRGs im-ply that they contain dust masses of 108−109 M, assumingstandard conversion factors (see Sect. 4.3). The presence of theAGN introduces an ambiguity on the mechanism powering thisdust emission: direct heating by the AGN or heating by mas-sive stars formed in starbursts (e.g. Sanders & Mirabel 1996;Carilli et al. 2000; Omont et al. 2001; Willott et al. 2002)?Although the AGN could easily introduce sufficient energy toproduce this emission, an increasing number of authors haveargued that the starbursts are the dominating mechanism (e.g.Rowan-Robinson 2000; Tadhunter et al. 2002). A strong argu-ment in favour of the starburst origin is the detection of dustand CO emission from regions several tens of kpc away fromthe AGN (Omont et al. 1996; Papadopoulos et al. 2000). Thehigh gas masses inferred from the CO detections could then bethe likely reservoirs feeding these massive starbursts. The pres-ence of CO in such reservoirs implies that they must be (at leastpartially) metal enriched, which is consistent with the recentdetection of ionized metal lines at scales of several tens of kpcin the z = 2.922 radio galaxy MRC 0943−242 (Villar-Martınet al. 2003). These metals may have been deposited by previousmerger events, or by galaxy-scale outflows (e.g. Dawson et al.2002).
These large dust and molecular gas masses are reminiscentof the often huge Lyα haloes seen around HzRGs (e.g. van Ojiket al. 1996; Venemans et al. 2002; Villar-Mart´ın et al. 2002;Reuland et al. 2003b). Moreover,K-band observations showthat HzRGs are amongst the most massive galaxies known ateach redshift (e.g. Best et al. 1998; De Breuck et al. 2002).However, to date, the relationship between the different gasand dust components and the AGN host galaxy has remainedelusive. What is the role in the galaxy formation process of theextended Lyα haloes and the associated absorbers seen in therest-frame UV emission lines? Are they composed of primor-dial material, or have they been enriched by material from thehost galaxy? Are the dust and CO reservoirs in any way linkedto these?

C. De Breuck et al.: CO emission and H I absorption in B3 J2330+3927 913
In this paper, we report the discovery of dust and CO emis-sion in thez = 3.087 radio galaxy B3 J2330+3927. This isonly the third z > 3 radio galaxy where CO has been de-tected, after 4C 60.07 and 6C 1908+7220 (z = 3.791 andz = 3.532; Papadopoulos et al. 2000), and despite several in-tensive searches (Evans et al. 1996; van Ojik et al. 1997b).Moreover, the CO emission is coincident in velocity space withassociated H I absorption in the Lyα line. This shows for thefirst time that these different components are indeed physicallyrelated, and trace a massive reservoir surrounding the AGNhost galaxy.
Throughout this paper, we use a cosmology with aΛ-dominated Universe with H0 = 65h65 km s−1 Mpc−1,ΩM = 0.3and ΩΛ = 0.7. At z = 3.087, the luminosity distance isDL = 28.34h−1
65 Gpc = 8.74 × 1026 h−165 m, and 1′′ corre-
sponds to 8.2 kpc. For comparison, in a flat Universe withH0 = 65h65 km s−1 Mpc−1, ΩM = 1.0 andΩΛ = 0.0,DL = 19.07h−1
65 Gpc, and 1′′ corresponds to 5.5 kpc.
2. Observations and data reduction
2.1. Source selection
Vigotti et al. (1999) defined the B3-VLA sample with the aimof constructing a homogeneous spectral database for a sam-ple of 1049 radio sources, containing flux densities in therange 151 MHz to 10.6 GHz. From this sample, we selected104 sources with steep optical spectra (α < −1;S ∝ να), whichremained undetected on the Palomar Observatory Sky Survey.Such sources are known to be good candidates to find HzRGs(e.g. De Breuck et al. 2000a). We first identify the host galaxiesof these candidates in sensitive optical or near-IR images, fol-lowed by optical spectroscopy to determine their redshift. In thefollowing, we report on one of these sources, B3 J2330+3927.
2.2. Optical and near-IR imaging and spectroscopy
On UT 1995 August 31, we obtained a 600 sR-band im-age of B3 J2330+3927 with the Low Resolution ImagingSpectrograph (LRIS; Oke et al. 1995) on the Keck I telescope.Conditions were photometric with 1.′′0 seeing. We reduced theimage using the standard techniques in the NOAO IRAF pack-age. We determined the astrometric solution using 19 stars alsodetected in the USNO 2.0 catalog (Monet et al. 1998). The un-certainty inrelative optical/radio astrometry is dominated bythe absolute uncertainty of the optical reference frame, which is∼0.′′4 (90% confidence limit; Deutsch 1999). Figure 1 presentsa finding chart, based on the KeckR-band image.
On UT 1996 September 10, we obtained a 1200 s spectrumwith LRIS on the Keck I telescope. We used the 300 mm−1
grating blazed at 5000 Å with the 1′′ wide slit resulting in a res-olution of∼10 Å (FWHM). The slit was oriented at PA= 168,and passes through objectsa andb (see Fig. 2). We correctedthe spectra for overscan bias, and flat-fielded them using in-ternal lamps taken after the observations. We extracted a one-dimensional spectrum using a 1′′ wide aperture. Because theconditions were not photometric, we initially flux calibratedthe spectrum with an archival sensitivity function. We then
DE
CL
INA
TIO
N (
J200
0)
RIGHT ASCENSION (J2000)23 30 28 27 26 25 24 23 22
39 28 00
27 45
30
15
00
26 45
30
Offset star
Fig. 1. R-band image of B3 J2330+3927 obtained with Keck/LRIS.The NVSS position of the radio source is marked with a cross. Thecoordinates of the offset star are listed in Table 1.
determined theR-band magnitude from the spectrum using theIRAF tasksbands, and adjusted the flux scale toR = 24.04,which is the 1′′ diameter aperture magnitude from our photo-metric R-band image. The main uncertainty in this procedurestems from the accuracy of the slit positioning on the peak oftheR-band emission. We estimate the resulting spectrophotom-etry to be accurate up to∼30%.
On UT 1997 September 12, we obtained near-IR imagingwith NIRC (Matthews et al. 1994) on the Keck I telescope.Conditions were photometric with 0.′′45 seeing inKS-band. Thetotal integration time of theKS-image was 1140 s. Observingprocedures, calibration and data reduction techniques weresimilar to those described by De Breuck et al. (2002). To deter-mine the astrometric solution, we used 16 stars also detected inour LRISR-band image. We estimate therelative near-IR/radioastrometric uncertainty to be∼0.′′5.
Following theKS-band imaging, we also obtained near-IRspectroscopy with NIRC. We used the gr120 grism in com-bination with theHK−filter. The position angle on the skywas 302, and includes only objecta. This position angle wasdictated by the need for a sufficiently bright guide star in theoffset guider. The dispersion was∼60 Å/pix, and the slit widthwas 0.′′68, resulting in a resolution of∼240 Å (FWHM). We ob-tained 10 exposures of 180 s each. We discarded two exposureswhich were useless due to poor seeing and/or high sky back-ground variability. The total integration time is thus 1440 s.We reduced the spectra following the procedures describedby De Breuck et al. (1998). We extracted a one-dimensionalspectrum using a 1.′′2 wide aperture. Because no near-IR line-lamps were available, we used the dispersion formula listed inthe NIRC manual to wavelength calibrate the spectrum. Thisdoes not allow an independent estimate of the uncertaintiesin the calibration, but a comparison of the 3 detected emis-sion lines with the optical spectrum suggests it is accurate

914 C. De Breuck et al.: CO emission and H I absorption in B3 J2330+3927
up to∼70 Å. To correct for atmospheric absorption lines, wedivided the spectrum by the atmospheric transmission curvefor Mauna Kea, produced using the program IRTRANS41. Toflux calibrate the spectrum, we used a spectrum of the A0 starHD 220750, which was obtained immediately subsequent toour B3 J2330+3927 observations. We reduced this spectrumin the same way as B3 J2330+3927. To construct a sensitivityfunction, we assumed HD 220750 has a blackbody spectrumwith Teff = 9850 K implyingV − K = −0.03 (Johnson 1966).Using V = 7.01 from the SIMBAD database, this provides afirst order flux calibration. To refine the absolute flux calibra-tion, we determined theKS-band magnitude from the spectrumusing the IRAF tasksbands, and adjusted the flux scale toK = 19.18, which is the 1′′ diameter aperture magnitude fromour photometricKS-band image.
We corrected both the optical and near-IR spectra forGalactic reddening using the Cardelli et al. (1989) extinctioncurve with AV = 0.39, as determined from the dust maps ofSchlegel et al. (1998).
2.3. VLA radio imaging
To determine the morphology of the radio source, we observedB3 J2330+3927 for 1 hour with the VLA (Napier et al. 1983)on UT 2002 March 30. We used the A-array at a frequencyof 8.46 GHz and a bandwidth of 50 MHz, resulting in a reso-lution of 0.′′35× 0.′′24. Due to technical problems, no primaryflux calibrator was observed. We used an observation of 3C 286from the next day to calibrate the data. However, the absoluteflux calibration cannot be considered reliable, and we there-fore only use this observation to determine the source mor-phology. We used the standard data reduction techniques inthe NRAOAIPS package. Because the source is too faint,we did not self-calibrate the data. Figure 2 shows the resulting8.46 GHz image.
2.4. IRAM interferometric observations
B3 J2330+3927 is one of the brightest 850µm sources detectedin the SCUBA survey ofz > 3 radio galaxies by Reuland et al.(2003c). Because gas and dust emission are often related, weselected B3 J2330+3927 as a prime target to search for red-shifted CO emission in HzRGs.
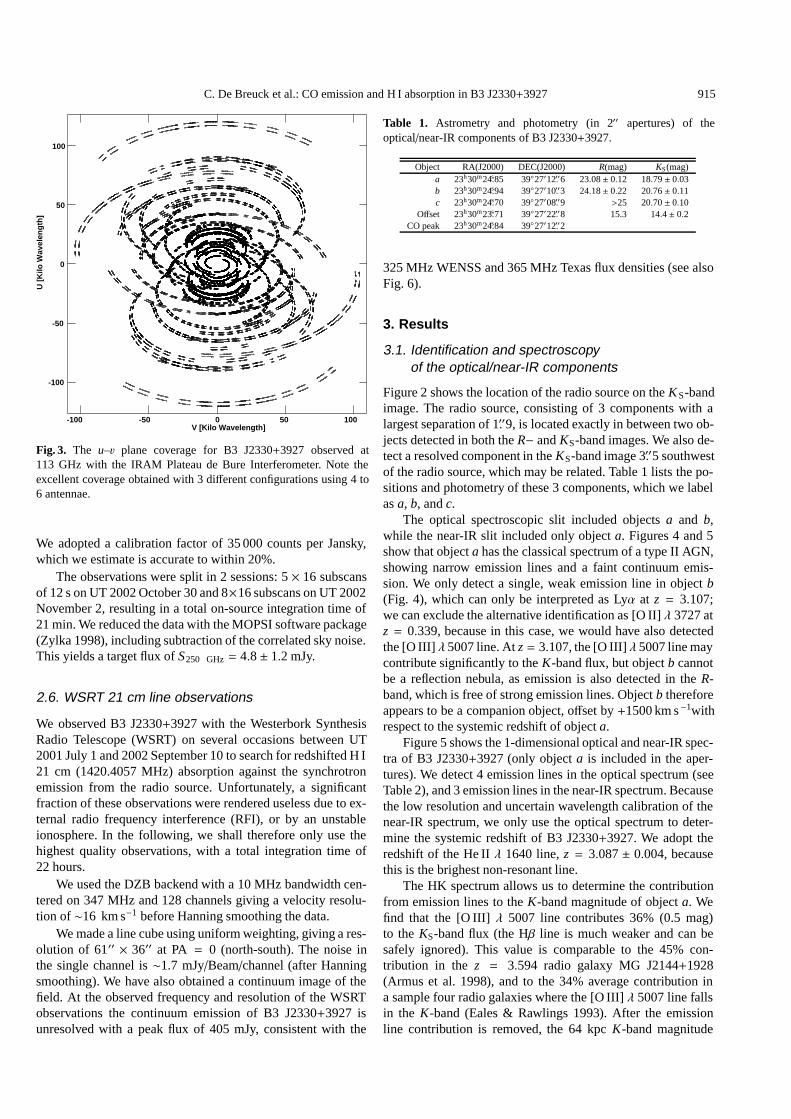
We observed B3 J2330+3927 with the IRAM Plateau deBure Interferometer during 8 individual sessions between 2001May and 2002 February. We used 3 different configurations(D, C and B) with 4 to 6 antennae, depending on availabil-ity. The total on-source observing time was∼27 hours (exclud-ing calibrations), with an excellent sampling of theuv-plane(Fig. 3). The resulting 112.798 GHz synthesized beam size is3.′′2 × 2.′′3 at position angle 56. The correlator setup for the3 mm receivers involved 4×160 MHz modules covering a totalbandwidth of 560 MHz tuned in single sideband (SSB) mode.
The central frequency was originally tuned to 112.834 GHzto observe CO (J = 4−3) (νrest = 461.040 GHz) atz = 3.086,the redshift of the Lyα line. However, after an initial assessment
1 This curve is available on the UKIRT world wide web pages.
DE
CL
INA
TIO
N (
J200
0)RIGHT ASCENSION (J2000)
23 30 25.1 25.0 24.9 24.8 24.7 24.6
39 27 14
13
12
11
10
09
08
a
b
c
Fig. 2. 8.46 GHz VLA map of B3 J2330+3927 overlaid on our KeckKS-band image (subject to a 0.′′5 uncertainty in the registration). Weidentify 3 componentsa, b, and c, which may be part of the samephysical system (the 2 small peaks west and north-west of objectaare bad pixels). The cross marks the position in the NVSS catalogue,which is within 0.′′2 from the position found in the 1.4 GHz A-arraydata of Vigotti et al. (1999). The FWHM of the synthesized 8.46 GHzVLA beam is shown in the bottom left corner.
of the data from the first session, we re-centered the centralfrequency to 112.780 GHz (z = 3.092) to better cover the fullextent of the detected emission line, which appeared to be offsetfrom the optical redshift (see below).
We simultaneously observed at 230.538 GHz (1.3 mm) indouble side-band (DSB) mode to probe the spatial extent ofthe thermal dust emission. However, in the following, we con-sider only those 1.3 mm data that were obtained when the at-mospheric water vapour content was<3 mm. The total 1.3 mmintegration time is therefore only 17.7 h. The synthesized beamsize at 1.3 mm is 1.′′9× 1.′′5.
After phase and amplitude calibration, we combined thedata with different central frequencies into an expanded data-set of 271 spectral channels of 2.5 MHz each, calculating theproper statistical weight of each channel individually. The outerchannels of the spectral cube therefore have larger uncertainties(see Fig. 8).
2.5. IRAM single dish bolometer observations
To determine the total 1.3 mm flux density, B3 J2330+3927was observed in service mode with the 117-channel MaxPlanck Bolometer array (MAMBO; Kreysa et al. 1998) at theIRAM 30 m telescope on Pico Veleta, Spain. The effectivebandwidth centre for steep thermal spectra is∼250 GHz. Weobserved the source with the array’s central channel, using thestandard “ON–OFF” observing sequence, in which the sec-ondary mirror chops in azimuth by 32′′ at a rate of 2 Hz.
C. De Breuck et al.: CO emission and H I absorption in B3 J2330+3927 915
U [
Kilo
Wav
elen
gth
]
V [Kilo Wavelength]-100 -50 0 50 100
100
50
0
-50
-100
Fig. 3. The u–v plane coverage for B3 J2330+3927 observed at113 GHz with the IRAM Plateau de Bure Interferometer. Note theexcellent coverage obtained with 3 different configurations using 4 to6 antennae.
We adopted a calibration factor of 35 000 counts per Jansky,which we estimate is accurate to within 20%.
The observations were split in 2 sessions: 5× 16 subscansof 12 s on UT 2002 October 30 and 8×16 subscans on UT 2002November 2, resulting in a total on-source integration time of21 min. We reduced the data with the MOPSI software package(Zylka 1998), including subtraction of the correlated sky noise.This yields a target flux ofS250 GHz= 4.8± 1.2 mJy.
2.6. WSRT 21 cm line observations
We observed B3 J2330+3927 with the Westerbork SynthesisRadio Telescope (WSRT) on several occasions between UT2001 July 1 and 2002 September 10 to search for redshifted H I21 cm (1420.4057 MHz) absorption against the synchrotronemission from the radio source. Unfortunately, a significantfraction of these observations were rendered useless due to ex-ternal radio frequency interference (RFI), or by an unstableionosphere. In the following, we shall therefore only use thehighest quality observations, with a total integration time of22 hours.
We used the DZB backend with a 10 MHz bandwidth cen-tered on 347 MHz and 128 channels giving a velocity resolu-tion of∼16 km s−1 before Hanning smoothing the data.
We made a line cube using uniform weighting, giving a res-olution of 61′′ × 36′′ at PA = 0 (north-south). The noise inthe single channel is∼1.7 mJy/Beam/channel (after Hanningsmoothing). We have also obtained a continuum image of thefield. At the observed frequency and resolution of the WSRTobservations the continuum emission of B3 J2330+3927 isunresolved with a peak flux of 405 mJy, consistent with the
Table 1. Astrometry and photometry (in 2′′ apertures) of theoptical/near-IR components of B3 J2330+3927.
Object RA(J2000) DEC(J2000) R(mag) KS(mag)a 23h30m24.s85 3927′12.′′6 23.08± 0.12 18.79± 0.03b 23h30m24.s94 3927′10.′′3 24.18± 0.22 20.76± 0.11c 23h30m24.s70 3927′08.′′9 >25 20.70± 0.10
Offset 23h30m23.s71 3927′22.′′8 15.3 14.4± 0.2CO peak 23h30m24.s84 3927′12.′′2
325 MHz WENSS and 365 MHz Texas flux densities (see alsoFig. 6).
3. Results
3.1. Identification and spectroscopyof the optical/near-IR components
Figure 2 shows the location of the radio source on theK S-bandimage. The radio source, consisting of 3 components with alargest separation of 1.′′9, is located exactly in between two ob-jects detected in both theR− andKS-band images. We also de-tect a resolved component in theKS-band image 3.′′5 southwestof the radio source, which may be related. Table 1 lists the po-sitions and photometry of these 3 components, which we labelasa, b, andc.
The optical spectroscopic slit included objectsa and b,while the near-IR slit included only objecta. Figures 4 and 5show that objecta has the classical spectrum of a type II AGN,showing narrow emission lines and a faint continuum emis-sion. We only detect a single, weak emission line in objectb(Fig. 4), which can only be interpreted as Lyα at z = 3.107;we can exclude the alternative identification as [O II]λ 3727 atz = 0.339, because in this case, we would have also detectedthe [O III] λ 5007 line. Atz = 3.107, the [O III]λ 5007 line maycontribute significantly to theK-band flux, but objectb cannotbe a reflection nebula, as emission is also detected in theR-band, which is free of strong emission lines. Objectb thereforeappears to be a companion object, offset by+1500 km s−1withrespect to the systemic redshift of objecta.
Figure 5 shows the 1-dimensional optical and near-IR spec-tra of B3 J2330+3927 (only objecta is included in the aper-tures). We detect 4 emission lines in the optical spectrum (seeTable 2), and 3 emission lines in the near-IR spectrum. Becausethe low resolution and uncertain wavelength calibration of thenear-IR spectrum, we only use the optical spectrum to deter-mine the systemic redshift of B3 J2330+3927. We adopt theredshift of the He IIλ 1640 line,z = 3.087± 0.004, becausethis is the brighest non-resonant line.
The HK spectrum allows us to determine the contributionfrom emission lines to theK-band magnitude of objecta. Wefind that the [O III] λ 5007 line contributes 36% (0.5 mag)to the KS-band flux (the Hβ line is much weaker and can besafely ignored). This value is comparable to the 45% con-tribution in the z = 3.594 radio galaxy MG J2144+1928(Armus et al. 1998), and to the 34% average contribution ina sample four radio galaxies where the [O III]λ 5007 line fallsin the K-band (Eales & Rawlings 1993). After the emissionline contribution is removed, the 64 kpcK-band magnitude

916 C. De Breuck et al.: CO emission and H I absorption in B3 J2330+3927
Table 2. Emission line measurements for objecta.
Line λobs zem 1016 × Fint ∆VaFWHM Wrest
λ
Å erg s−1 cm−2 km s−1 ÅLyα 4968.3± 0.7 3.086 4.4± 0.4 1500± 200 120± 20C IV λ 1549 6326.3± 3.0 3.084 0.44± 0.06 800± 300 14± 3He II λ 1640 6703.3± 2.0 3.087 0.56± 0.07 700± 225 20± 4C III] λ 1909 7791.6± 3.5 3.082 0.47± 0.07 700± 300 24± 8[O II] λ 3727 15280± 100 3.10 3.9± 0.3 ... 250± 150Hβ 19840± 100 3.08 0.7± 0.2 ... 27± 15[O III] λ 5007 20370± 100 3.07 11.5± 1.0 ... 370± 80
a Deconvolved with the instrumental resolution.
Fig. 4. Two-dimensional spectrum, centered on Lyα. Object b is acompanion object, offset by 1500 km s−1 with respect to the AGN.The y-axis has been reversed to facilitate comparison with Figure 2.Objecta is at the origin of they-axis.
(K = 18.79±0.03) is consistent with those for powerful HzRGsat this redshift (van Breugel et al. 1998). This shows that the in-clusion of the strong [O III]λ 5007 line can increase the scatterin theK − z diagram, but it is unlikely to be a dominant factor(see also Jarvis et al. 2001).
3.2. Where is the AGN?
Our spectroscopic results identify objecta as the most likelyposition of the AGN. This appears contradictory to the 8.4 GHzradio morphology shown in Fig. 2, and summarized in Table 3.The most straightforward interpretation of the VLA map isa core surrounded by 2 hotspots, as seen in many HzRGs(e.g. Carilli et al. 1997; Pentericci et al. 2000). The centralcomponent appears marginally resolved with our 0.′′35× 0.′′24resolution, which looks like a carbon-copy of thez = 4.25 radiogalaxy 8C 1435+635 (Lacy et al. 1994). The radio morphol-ogy therefore suggests that the central component marks the
Fig. 5. Optical and near-IR spectra of objecta, extracted with 1′′ × 1′′
and 0.′′68× 1.′′2 apertures, respectively.
Table 3. Radio components of B3 J2330+3927. The 8.4 GHz fluxesare normalized the northern component.
Component RA(J2000) DEC(J2000) Normalized fluxNVSS 23h30m24.s91 3927′11.′′4 –North 23h30m24.s836 3927′12.′′31 1.00
Centre 23h30m24.s897 3927′11.′′54 0.43South 23h30m24.s922 3927′10.′′67 0.23
position of the AGN. Unfortunately, we do not have spectralindex information on the individual radio components to ex-amine this interpretation in more detail.
Given the 0.′′4 astrometric uncertainty, we can state that thecentral radio component does not coincide with objecta. Ifthe nominal astrometry in Fig. 2 is correct, then the northern

C. De Breuck et al.: CO emission and H I absorption in B3 J2330+3927 917
and southern radio lobes coincide with objectsa andb, respec-tively. We can also exclude the presence of a significant radiocomponent north of objecta because the positions of the low-resolution radio data from the NVSS and from the VLA mapsof Vigotti et al. (1999) (cross in Fig. 2) are within 0.′′2 of thecentral radio component in our 8.4 GHz map.
We propose two possible interpretations of the observedradio/near-IR configuration. First, the northern componentmay be the radio core of an extremely asymmetrical source,or a one-sided jet, much like thez = 4.1 radio galaxyTN J1338−1942 (De Breuck et al. 1999). McCarthy et al.(1991) have argued that the extended optical emission lines arebrightest on the side of the closer of the two radio lobes, whichwould be consistent with our spectroscopy (Fig. 4). The slightmis-alignment of the 3 components may then indicate a preces-sion of the radio jet, which is often seen in FR II sources (e.g.Dennett-Thorpe et al. 2002).
The alternative interpretation is that the AGN is located atthe position of the central radio component, but is either heav-ily obscured by dust (e.g. Reuland et al. 2003a), or not locatedat the centre of the host galaxy (e.g. Quirrenbach et al. 2001). Apotential problem with this interpretation could be the ioniza-tion of gas at objecta, 10 kpc away from the AGN. However,spatially extended C IVλ 1549 and He IIλ 1640 emissionhas been seen in several HzRGs (e.g. Overzier et al. 2001;Maxfield et al. 2002).
3.3. Possible synchrotron contributionat mm wavelengths
Because B3 J2330+3927 is a powerful radio galaxy, it is im-portant to estimate the possible contribution from synchrotronemission in the observed mm and sub-mm bands. We used themulti-frequency data of Vigotti et al. (1999) to determine theradio to submm spectral energy distribution. We also addedthe 365 MHz flux density from the Texas survey (Douglaset al. 1996), our 250 GHz MAMBO detection (Sect. 2.5), theSCUBA 353 GHz (850µm) detection of Reuland et al. (2003c),and the 3 mm (112.7 GHz) continuum emission seen in ourPdBI data (see next section). We also include our tentative1.25 mm (230.5 GHz) detection, although we suspect that thisemission has been over-resolved (see Sect. 3.5).
Figure 6 shows this combined spectral energy distribution(SED). It is obvious that a synchrotron contribution would benegligible at 353 GHz (850µm), but may contribute to the113 GHz and 230 GHz detections. A constant power-law ex-trapolation of the synchrotron spectrum from the 10.6 GHz datawould predict a synchrotron flux density of 1.3 mJy at 113 GHzand 0.6 mJy at 230.5 GHz. However, the synchrotron spec-tra of powerful radio galaxies often steepen at high frequen-cies (Archibald et al. 2001; Andreani et al. 2002), with spectralsteepenings up to∆α ∼ 0.5 (Murgia et al. 1999). This suggeststhe constant power-law extrapolation should be considered asan upper limit. To estimate the 112.7 GHz contribution moreaccurately, we have fit the radio SED, using the ContinuousInjection model of Pacholczyk (1970) and the Single Injectionmodel of Jaffe & Perola (1973). Even with the latter model
Fig. 6. Radio to submm spectral energy distribution ofB3 J2330+3927. The solid line is a modified black body curvewith T = 50 K and β = 1.5, normalized at 352 GHz. The230.538 GHz PdBI measurement severely over-resolves the thermaldust emission.
(which leads to an exponential steepening of the spectrum athigh frequency), we found that the minimum flux density pre-dicted for the 112.7 GHz point is∼0.6−0.8 mJy. More obser-vations between 10.6 GHz and 113 GHz would be needed topredict this contribution more accurately.
Note that these values refer to the integrated flux density ofthe radio source. However, Fig. 2 shows that the radio source isresolved into three components, which appear to have roughlysimilar flux densities at 8.4 GHz. Unfortunately, we do not havespectral index information of the individual components, but inmost radio galaxies, the outer lobes have steeper spectra thanthe core (Carilli et al. 1997; Pentericci et al. 2000), althoughsources with relatively steep spectrum cores have also beenseen at high redshift (Athreya et al. 1997). The orientation ofthe 112.7 GHz PdBI synthesized beam is roughly perpendicu-lar to the radio axis, which means we should slightly resolve thesynchrotron component at 112.7 GHz. Depending on the spec-tral index of the northern hotspot, this further reduces the syn-chrotron contribution at the position of the AGN to<∼0.5 mJy.
3.4. Identification of the CO emission
Figure 7 shows the 3 mm PdBI data, integrated between112.515 GHz and 112.723 GHz, which represents the fullwidth of the redshifted COJ = 4−3 line (see below). The emis-sion clearly peaks at the position of objecta, which is the mostlikely position of the AGN (see Sect. 3.2). The emission doesnot follow the extension of the radio source, confirming that apossible synchrotron contribution would be minimal.

918 C. De Breuck et al.: CO emission and H I absorption in B3 J2330+3927D
EC
LIN
AT
ION
(J2
000)
RIGHT ASCENSION (J2000)23 30 25.4 25.2 25.0 24.8 24.6 24.4
39 27 18
16
14
12
10
08
06
Fig. 7. Integrated COJ = 4−3 emission towards B3 J2330+3927 over-laid on the Keck/NIRC K-band image. Contour levels start at 2σ, andincrease by 1σ, with σ = 0.2 mJy Beam−1 (negative contours aredotted). The 3 crosses mark the positions of the radio components inFig. 2. The FWHM of the synthesized beam is shown in the bottomleft corner.
Figure 8 shows the PdBI COJ = 4−3 spectrum ofB3 J2330+3927 extracted at the position of objecta. We showthe unbinned spectrum, and a spectrum binned to 105 km s−1.A broad emission line is clearly seen around 112.6 GHz, witha weak underlying continuum emission. We fit a Gaussian pro-file with an underlying continuum emission to determine theline and continuum parameters. Table 4 gives the fit parametersfor 5 different bin sizes used. As long as the bin size does notexceed 40 MHz, the derived parameters are not very sensitiveto the bin widths.
In the previous section, we estimated the contribution fromsynchrotron emission to be<0.5 mJy, so the broad,∼2 mJyline appears securely detected. We interpret this emission lineas COJ = 4−3 atz = 3.094, i.e. offset by∼500 km s−1 to thered from the optical redshift, determined from the He IIλ 1640line. Such offsets have also been seen in high S/N CO identi-fications of high redshift quasars (e.g. Guilloteau et al. 1999;Cox et al. 2002a). The∼0.3 mJy continuum emission seen inthe 3 mm spectrum (Fig. 8) is consistent with the extrapola-tion of the thermal dust spectrum (Fig. 6), but it is also likelythat there is a synchrotron contribution from the northern radiocomponent, especially if the latter would have a flatter spectralindex than the integrated radio emission.
The total velocity width of the CO-line is∼500 km s−1(seeFig. 8), and the integrated flux over these five 106.5 km s−1
channels isS CO∆V = 1.3 ± 0.3 Jy km s−1. Note that thisvalue has been corrected for the underlying continuum emis-sion (∼0.3 mJy). This represents one of the faintest un-lenseddetections of CO emission to date.
To determine if the CO emission in spatially resolved,we have subtracted different source models (point source,
Fig. 8. CO J = 4−3 spectrum of B3 J2330+3927 extracted at objecta.The top panel shows the unbinned spectrum, while the bottom panelhas been re-binned with∆νchan= 40 MHz (106.5 km s−1). The velocityscale is with respect to the central frequency of COJ = 4−3 at z =3.087. The solid line is a Gaussian fit with an underlying continuumemission.
Table 4. Gaussian fitting coefficients of the CO line in objecta.
Bin width # bins S cont S peak νcentre ∆VFWHM
MHz mJy mJy GHz km s−1
2.5 270 0.36 2.51 112.620 20710.0 67 0.33 2.55 112.620 21120.0 33 0.36 2.47 112.623 20840.0 16 0.28 2.51 112.621 22380.0 8 0.52 2.22 112.614 208
circular or elliptical Gaussians) from the UV-data. We find noclear evidence that the integrated CO emission is spatially re-solved, despite the suggestion in Fig. 7 that the emission ap-pears resolved towards objectc. The latter may be due to thelow S/N of the outer contours. Note that due to our limitedfrequency coverage, we may have missed CO emission fromcomponents with a large velocity offset. For example, objectbis known to have a velocity offset of 1500 km s−1 (Fig. 4), soany CO emission from this object would not have been detectedin our observations. Deeper integrations with a wider frequencycoverage would be needed to examine the spatial structure ofthe CO emission.
3.5. Identification of the spatially extended thermaldust emission
From the radio to submm spectral energy distribution (Fig. 6),it is obvious that the interferometer data under-estimate the dust

C. De Breuck et al.: CO emission and H I absorption in B3 J2330+3927 919
emission at 230 GHz. We now examine this possibility in detailusing our 230.5 GHz PdBI map (Fig. 9).
Extrapolating the 353 GHz (850µm) SCUBA detection(14.15± 1.65 mJy) using a blackbody withT = 50 K predictsan integrated dust emission flux density of 4.2 mJy at 230 GHzand 0.45 mJy at 113 GHz. Figure 9 shows the central part ofour 230.5 GHz PdBI map. We find a marginal detection of dustemission with an integrated flux density of 1.2± 0.9 mJy. Thisappears inconsistent with the SCUBA detection. Such a dis-crepancy has also been seen in high redshift quasars, wherethe PdB interferometer data underestimate the flux by as muchas an order of magnitude when compared to IRAM 30 m sin-gle dish measurements at the same frequency (Guilloteau et al.1999; Omont et al. 2001). The most likely explanation is thatthe dust emission is extended with respect to the much smallerinterferometer synthesized beam.
Although our 230 GHz detection is marginal at most, itis concentrated near the peak of the CO emission and themost likely position of the AGN (see Sect. 3.2), supportingthe reality of this detection. We conclude that there is ev-idence for a two-component spatial distribution of the dustemission: first, a compact component, which may be heatedby the AGN, and second, a component significantly larger thanthe 1.′′9× 1.′′5 PdBI synthesized beam at 230 GHz.
The fact that the∼0.3 mJy continuum emission seen in the113 GHz spectrum (Fig. 8) is close to the extrapolation of thethermal dust emission (despite a possible synchrotron contri-bution) suggests that the 3.′′2× 2.′′3 synthesized beam does notover-resolve this dust emission. In theory, we could determinethe scale size of the thermal dust emission by combining thezero-spacing MAMBO flux density (scaled to 230 GHz) withthe PdB interferometer data (Fig. 10). However, due to the lowsignal/noise of our data, we can only constrain the scale sizebetween 0.′′5 and 5′′.
3.6. No H I 21 cm absorption
Despite our deep and repeated WSRT observations, we havenot been able to convincingly detect H I 21 cm absorptionagainst the radio source. This is consistent with unsuccessfulWSRT searches in 6 HzRGs (R¨ottgering et al. 1999). To date,H I 21 cm absorption has been solidly detected in only oneHzRG, viz. B2 0902+34 (z = 3.3909 Uson et al. 1991; Briggset al. 1993). This raises the question as to why B2 0902+34stands out. One clue may come from its bizarre radio morphol-ogy (Carilli 1995). Rottgering et al. (1999) argue that the H Iis located in a kpc-sized disc, which can be seen in absorptiondue to a fortuitous orientation of the radio source. They furthersuggest that a high core fraction may characterize such orien-tations: 15% for B2 0902+34, compared to 0.6% and 2.9% forthe 6 HzRGs where no 21 cm absorption has been detected.However, in B3 J2330+3927, we find a core fraction of 60%or 26% (see Table 3), depending if we adopt the northern orcentral radio component as the core (see Sect. 3.2). We con-clude that the present sample of 8 HzRGs where H I 21 cmabsorption has been searched is clearly too small to address theorigin of the absorbing neutral gas.
DE
CL
INA
TIO
N (
J200
0)
RIGHT ASCENSION (J2000)23 30 25.4 25.2 25.0 24.8 24.6 24.4
39 27 18
16
14
12
10
08
06
Fig. 9. IRAM PdBI 230.5 GHz (1.3 mm) map of B3 J2330+3927 over-laid on the Keck/NIRC K-band image. Contour levels start at 1σ, andincrease by 1σ, with σ = 0.45 mJy beam−1 (negative contours aredotted). The 3 crosses mark the positions of the radio components inFig. 2. The FWHM of the synthesized beam is shown in the bottomleft corner.
4. Mass estimates
The detection of the different emission and absorption compo-nents in B3 J2330+3927 suggests it is a massive system. In thissection, we use the above data to derive 5 independent mass es-timates of the gas and dust components. We discuss each com-ponent separately, and summarize our results in Table 5. Wenote that several high redshift CO detections have been helpedby gravitational lensing (for reviews, see Combes et al. 1999;Cox et al. 2002b). However, from our radio and optical/near-IRimaging, we find no indications that B3 J2330+3927 could beamplified by gravitational lensing, and we do not consider thisin the following.
4.1. Molecular gas mass
We can estimate the molecular gas content from our CO linedetection by making an assumption for the standard conversionfactorXCO = M(H2)/L′CO(1−0), where
L′CO =
( c2
2k
)S CO∆Vν−2
obsD2L(1+ z)−3 (1)
is the CO line luminosity measured in K km s−1 pc2 (Solomonet al. 1992). The standard value for Galactic molecular cloudsis XCO = 4 M (K km s−1 pc2)−1. However, there are strong in-dications from studies of extreme starbursts in ultra luminousinfra-red galaxies (ULIRGs) that this value should be consider-ably smaller for dense starbursts and AGN. We shall thereforeassumeXCO ≈ 0.8 M (K km s−1 pc2)−1, as given by Downes& Solomon (1998).
Because we have observed the COJ = 4−3 transi-tion, we also need to estimate the (4−3)/(1−0) line ratior43.

920 C. De Breuck et al.: CO emission and H I absorption in B3 J2330+3927
Fig. 10. Visibility amplitude versus baseline radius in theuv-planefor the 230 GHz PdB interferometer data (black/thin points), andthe MAMBO/IRAM single dish data (thick/red point) interpolated to230 GHz. The solid line represents a point source of 1.8 mJy, thedotted/blue and dashed/magenta lines a circular Gaussian source witha FWHM of 0.′′5 and 5′′, respectively.
Papadopoulos et al. (2000) have used a large velocity gradi-ent code to predict ther43 ratio in two radio galaxies at similarredshifts as B3 J2330+3927. Using an interstellar matter envi-ronment similar to that of a local average starburst, they predictr43 = 0.45.
Following Solomon et al. (1992), we findL ′CO(4−3) = 3.9×10¹⁰ h−2
65 K km s−1 pc2. Inserting the values given above, wefind
M(H2) =
XCO
r34
L′CO(4− 3) ≈ 7h−265 × 1010 M.
This value is slightly lower than the ones found in the previoustwo HzRGs, 4C 60.07 and 6C J1908+7220 (2.4 and 1.35×10¹¹ M, respectively, in our adopted cosmology).
4.2. Dynamical mass from CO
Our PdBI CO data does not have sufficient S/N to derive de-tailed spatial and spectral information needed to fit models ofrotating disks, such as those often seen in local ULIRGs andrecently also at high redshift (z = 2.8; Genzel et al. 2003).However, we can derive a rough upper limit on the dynamicalmass by assuming that the size of a possible rotating disk issmaller than the resolution of our PdBI 113 GHz observations.Provided that the CO is effectively located in such a disk, thisis probably close to the actual extent, given our estimated scalesize of the dust emission, which is often correlated with the COemission.
Following Papadopoulos et al. (2000), the dynamicalmassMdyn is then given by
Mdyn ≈ 1.16× 10⁹
∆VFWHM
100 km s−1
2 L
kpc
(sin2 i)−1 M, (2)
wherei is the inclination of the disk. AdoptingL < 25 kpc and∆VFWHM = 220 km s−1, we find
Mdyn < 6.4× 10¹⁰(sin2 i)−1 M.
Although our estimates ofM(H2) andMdyn are very uncertain,this suggests that a substantial fraction of the total mass is inthe form of molecular gas.
4.3. Dust mass
Figure 6 shows that the 850µm flux of B3 J2330+3927 is al-most completely dominated by thermal dust emission. We cantherefore estimate the dust massMd using:
Md =SobsD2
L
(1+ z)κd(νrest)B(νrest, Td), (3)
with Sobs the observed flux density at a wavelength wherethe SED is dominated by thermal dust emission,κd(νrest)the rest-frequency mass absorption coefficient, B(ν rest, Td) thePlanck function for isothermal emission from dust grains radi-ating at a temperatureTd, andDL the luminosity distance.
We need to make some assumptions forT d and κd(νrest).Because we observe the steep Rayleigh-Jeans tail of the dustdistribution, a small change in the adopted dust temperaturemay cause a significant change in the derived dust mass (seee.g. Hughes et al. 1997; McMahon et al. 1999). The uncertain-ties in both the SCUBA 850µm and the MAMBO 1.3 mm fluxdensities cannot constrainTd tightly (see Fig. 6). We will there-fore adoptTd = 50 K, which has been used for most other highredshift AGN (e.g. Papadopoulos et al. 2000; Archibald et al.2001; Omont et al. 2001), and provides a good fit to the thermalpart of the SED of B3 J2330+3927.
The rest-frame mass absorption coefficientκd(νrest) can befound by extrapolation from other frequencies usingκ d ∝ νβ(Chini et al. 1986). This emissivity indexβ can be deter-mined from multi-frequency observations covering the entiredust emission spectrum. However, such observations are scarcefor high redshift objects, and assume that the dust emission isdominated by a single temperature component. Because bothβandTd determine the shape of the dust emission spectrum, theirvalues are coupled (Priddey & McMahon 2001). The publishedvalues ofβ vary betweenβ = 1.3 for T d = 36 K (Dunne et al.2000) andβ = 1.95 for T d = 41 K (Priddey & McMahon2001). We shall adopt the intermediate value ofβ = 1.5 forTd = 50 K (Benford et al. 1999). These values are consistentwith our 113 GHz to 352 GHz measurements (Fig. 6).
The value ofκd depends on the composition of the dustgrains. The estimates ofκd normalized to 850µm usingβ = 1.5vary betweenκd(850µm)=0.04 m2 kg−1 (Draine & Lee 1984)and κd(850 µm) = 0.3 m2 kg−1 (Mathis & Whiffen 1989).We shall normalize to an intermediate value ofκd(850µm) =0.11 m2 kg−1 (Hildebrand 1983).

C. De Breuck et al.: CO emission and H I absorption in B3 J2330+3927 921
Using these values andS850µm = 14.15±1.65 mJy (Reulandet al. 2003c), we find
Md ≈ 9× 10⁷ h−265
(0.11
κd(850µm)
)F(Td) M,
with F(Td) = (exp[hν/kTd] − 1)/(exp[hν/k · 50 K] − 1).Comparing with the molecular gas mass estimate, this
yields a gas-to-dust ratio
M(H2)Md
≈ 850F(Td)
(0.11
κd(850µm)
)·
This is comparable with values found in other HzRGs(Papadopoulos et al. 2000) and ULIRGs (Sanders et al. 1991).Alternatively, we can also compare the CO and 850µm fluxes,yielding a comparison that is independent of the assumedparameters. We find∆VS (CO)/S800 µm = 92 km s−1, againsimilar to the values found in the 2 HzRGs observed byPapadopoulos et al. 2000, the 3σ limit in 53W002 (Alloin et al.2000), and high redshift quasars (Cox et al. 2002b). This indi-cates a standard gas/dust ratio in B3 J2330+3927.
4.4. Ionized gas and associated H I absorption in Lyα
Figure 4 shows the complex velocity structure of the Lyα line.The emission spatially extends well beyond the radio lobes.This has been seen in several other HzRGs (e.g. De Breucket al. 2001; Villar-Mart´ın et al. 2002), and excludes shocks asthe ionization mechanism at this position. Because we do notdetect a discontinuity in the Lyα profile at the position of the ra-dio lobes, this implies that photo-ionization by the central AGNis the dominating ionization mechanism of the Lyα line.
Figure 11 zooms in on the Lyα line in the Keck/LRIS spec-trum (extraction width 1′′ × 1′′). To check if the velocity pro-file can be explained by pure velocity structure without absorp-tion, we have attempted to fit the Lyα profile with two or threeGaussian components, but this does not provide a good fit be-tween the two peaks, or on the blue wing. An alternative inter-pretation is that the double-peaked structure is caused by asso-ciated H I absorption. Such absorbers are often seen in the Lyαlines of HzRGs (e.g. van Ojik et al. 1997a; De Breuck et al.2000b; Jarvis et al. 2003).
We therefore modeled the profile with a Gaussian emis-sion profile, supplemented by two Voigt absorption compo-nents (a second component is needed to fit the non-Gaussianblue wing). Figure 11 presents our best fit, obtained througha χ2 minimization. We find that the profile can be closelyrepresented with this model. Although the central wavelengthof the Gaussian emission was a free parameter in our fit,it corresponds very well with the redshift obtained from theHe II λ 1640 line, providing a strong physical base for ourmodel.
We can estimate the mass of the associated H I absorberusing
M(H I) = mpR2absN kg, (4)
wheremp is the proton mass,Rabs is the size of the absorptionsystem, andN is the column density derived from the Voigt
Fig. 11. Lyα velocity profile of B3 J2330+3929 (solid/black his-togram). The solid/blue line is the model consisting of a Gaussianemission (dashed/red line) and two Voigt absorption profiles withthe indicated parameters. The dotted/green histogram is the scaledHe II λ 1640 profile. The horizontal bar indicates the full velocitywidth of the CO 4–3 line (Fig. 8).
profile fitting. In convenient astrophysical units (van Ojik et al.1997a), this becomes:
M(H I) = 108R235N19 M, (5)
whereR35 is in units of 35 kpc, andN19 is in units of 10−19 cm2.Because the red absorber has a∼10 000 times higher col-
umn density (N = 8.7× 1018 cm−2) than the blue one, we shallonly consider the red absorber in the following. From Fig. 4, weobtain a lower limit of>∼2′′ for the full spatial extent of the redabsorber. Assuming conservatively a size ofRabs∼ 17h−1
65 kpc,we derive a total mass estimate of the absorber
M(H I) >∼ 2× 10⁷ h−265 M.
We can also use the Lyα emission to estimate the mass ofionized hydrogenM(H II). Following McCarthy et al. (1990),we assume pure case B recombination at a temperature ofT = 104 K. Using the Lyα emission corrected for the associ-ated H I absorption (dashed line in Fig. 11), we obtainM(H II)using
M(H II) = 109( f−5L44V70)1/2 M, (6)
wheref−5 is the filling factor in units of 10−5, L44 is the Lyα lu-minosity in units of 1044 ergs s−1, andV70 is the total volume inunits of 1070 cm3. Assuming a filling factor of 10−5 (McCarthyet al. 1990), and a volume of 6′′ ×2′′ ×6′′ = 1.4×1069 h−3
65 cm3
(see Fig. 4), we find
M(H II) ≈ 2.5× 10⁸ h−1/265 M.

922 C. De Breuck et al.: CO emission and H I absorption in B3 J2330+3927
Table 5. Mass estimates of gas and dust components inB3 J2330+3927, subject to uncertainties discussed in Sect. 4.
Component Mass estimate Determined fromM
H2 7× 10¹⁰ CO lineDynamical <6.4× 10¹⁰(sin2 i)−1 CO line
Dust 9× 10⁷ 850µm continuumH I 2 × 10⁷ Lyα absorption
H II 2.5× 10⁸ Lyα emissionH I <2× 10⁸ H I 21 cm absorption
This value is consistent with those found in other HzRGs (e.g.van Ojik et al. 1997a).
4.5. H I 21 cm absorption againstthe radio source
We can determine an upper limit of the H I mass from our non-detection of the H I 21 cm line. The optical depth is defined as
τ = − ln(1− ∆S/(S cf )), (7)
where∆S is the H I absorption flux,S the continuum fluxandcf covering factor that is assumed to be 1. Assuming a 3σupper limit, we findτ < 1.3%.
A limit to the integrated column density can then be derivedfrom the expression (e.g. Rohlfs 1986):
NH 1.83× 10¹⁸Tspin
∫τdv cm−2, (8)
where Tspin is the spin temperature in Kelvin, and we as-sume a profile width of 300 km s−1. H I studies of high-redshiftdamped Lyα systems (Carilli et al. 1996; Kanekar & Chengalur2003) have found values as high asT spin = 1000 K, but therealso appears to be a trend for lowerT spin in the most luminousgalaxies. We therefore adopt theT spin = 100 K value found inGalactic clouds (e.g. Braun & Walterbos 1992). This yields
NH <∼ 9.3× 10²⁰(Tspin/100) cm−2.
Assuming that the absorption occurs only against the radiocore, we obtain an estimate of the scale-length of the absorberof Rabs∼ 0.′′5 ≈ 4 kpc. Using Eq. (4), this yields
M(H I) <∼ 1× 10⁸ h−265 M.
5. Discussion
5.1. The interaction between the different gascomponents
We now examine the relationship between the different compo-nents summarized in Table 5. The similarity of objectsb andcin both size andK-band magnitude suggests that objectc mayalso be part of the same system. We may therefore witness theaccretion of the smaller companion objectb (and possibly alsoobjectc) by a massive galaxy hosting an AGN (objecta, butsee Sect. 3.2), surrounded by a large reservoir of molecular
gas and dust. Such gas reservoirs are often directly seen in thehuge Lyα haloes, which extend out to>100 kpc from the AGN(e.g. van Ojik et al. 1996; Venemans et al. 2002; Villar-Mart´ınet al. 2002; Reuland et al. 2003b). From Fig. 4, we find that theextent of the Lyα halo in B3 J2330+3927 is∼6′′ (50 kpc), butour spectrum is not very deep, so this value should be consid-ered as a lower limit.
The peaks of the CO, dust and Lyα emission are all at ob-ject a, suggesting that the ionized hydrogen and the CO anddust emission are co-spatial. Figure 11 shows that the CO emis-sion also coincides very closely in velocity space with the mainassociated H I absorber. Because these components are bothco-spatial (at objecta), and have similar velocity shifts, thisstrongly suggests that we detect CO emission from the samecloud that absorbs the Lyα emission. Our mass estimate fromthe associated Lyα absorber is∼3500 times lower than the oneobtained from the CO emission (Table 5). Although both esti-mates are uncertain to almost an order of magnitude, this dif-ference does indicate that the associated Lyα absorber probesonly a tiny part of the total gas mass, either because most of thehydrogen is in molecular form, or due to the requirement of astrong background source to detect the H I in absorption.
Our multi-wavelength data of B3 J2330+3926 show for thefirst time a direct relationship between the associated H I ab-sorption and CO emission in a HzRG. High resolution spec-troscopy of the Lyα and C IV λ 1549 lines of two HzRGs(Binette et al. 2000; Jarvis et al. 2003) have shown that the ab-sorbers cannot be co-spatial with the emitting gas. The absorp-tion should therefore occur further outward, possibly in a shellpressurized by the expanding radio source (Binette et al. 2000).Our detection of CO emission from the absorbers suggests thatthis cloud may be quite extended, but it cannot be primordial,as it is already chemically enriched. This is also consistentwith the recent findings of Baker et al. (2002), who found astrong correlation between the equivalent width of C IVλ 1549absorbers and optical continuum slope in radio-loud quasars.They interpret this relation as evidence for the presence of dustin the associated C IVλ 1549 absorbers, which reddens the op-tical continuum. The gas and dust emission often trace eachother (e.g. Papadopoulos et al. 2000), suggesting that the asso-ciated absorbers seen in both quasars and radio galaxies probethe large gas and dust reservoirs surrounding AGNs.
The presence of CO from these reservoirs implies that theycontain processed material. This metal emission is sometimesalso seen in emission in extended haloes of C IVλ 1549,He II λ 1640 and N Vλ 1240 (Maxfield et al. 2002; Villar-Martın et al. 2003). They may have been deposited by previousmerger events, or by starburst-driven superwinds at even higherredshifts (e.g. Taniguchi et al. 2001a; Dawson et al. 2002; Ajikiet al. 2002; Furlanetto & Loeb 2003). Indeed, Taniguchi et al.(2001b) discuss evidence that a superwind occurs in az = 3.09“blob” of Lyα emission which also emits strongly at submmwavelengths (Chapman et al. 2001). Such objects may be re-lated to HzRGs, e.g. when observed during a radio-quiet phase.
To summarize, our observations of B3 J2330+3927 pro-vide further evidence that HzRGs are massive galaxies, lo-cated in a dense, interacting environment. Deep near-IR imag-ing with Keck (van Breugel et al. 1998; De Breuck et al. 2002),

C. De Breuck et al.: CO emission and H I absorption in B3 J2330+3927 923
HST (Pentericci et al. 2001), and ground-based adaptive op-tics (Steinbring et al. 2002) shows that the host galaxies areoften surrounded by fainter clumps, like objectsb and c inB3 J2330+3926. These clumps may well be concentrationswithin the large gas/dust reservoir surrounding the AGN, whichwill eventually merge with the massive central galaxy hostingthe AGN.
5.2. Star formation rate
Having found evidence that the host galaxy of B3 J2330+3927is surrounded by a large gas reservoir, which has already beenchemically enriched, it is of interest to estimate the ongoing starformation rate in this galaxy. We cannot use the rest-frame UVand optical emission lines, because they are mainly ionized bythe AGN, and not by massive stars. Similarly, the UV contin-uum emission is likely to be contaminated by a scattered quasarcomponent (e.g. Vernet et al. 2001a). We therefore determinean upper limit to the global star formation rate of the entiresystem using the far-IR (FIR) dust emission.
We can determine the total FIR luminosity by integratingthe thermal spectrum:
LFIR = 4πMd
∫ ∞
0κd(ν)B(ν, Td)dν, (9)
yielding:
LFIR =8πhc2· λβκd(λ)
cβ
kTd
h
β+4
Γ[β + 4]ζ[β + 4]Md, (10)
whereΓ andζ are the Gamma and Riemannζ functions, re-spectively.
Substituting Eq. (3) andx = hνrest/kTd, we find:
LFIR = 4πΓ[β + 4]ζ[β + 4]D2L x−(β+4)(ex − 1)Sobsνobs (11)
For the values adopted in this paper, we find:
LFIR ≈ 3.3× 10¹³ h−265 L.
In Sect. 3.5, we have argued that the dust emission probablyconsists of a central component near the AGN, and a spatiallyextended component. This would imply that the power sourceof the FIR emission is a combination of direct heating by theAGN (heating the central component) and by recently formedmassive stars in a starburst (heating the extended component).It is unlikely that the AGN can power the dust emission out toseveral tens of kpc, while the detection of several companionobjects in the optical and near-IR images suggests the presenceof stars out to∼40 kpc.
Following Omont et al. (2001), we can then calculate thestar formation rate
S FR = δMFδSB(LFIR/1010L) M yr−1, (12)
whereδMF is a function of the stellar mass function, andδSB
is the fraction of the FIR emission heated by the starburst.Assuming conservativelyδMF = 1, we find
S FR ≈ 3000δSB h65 M yr−1.
Papadopoulos et al. (2000) report star-formation rates up to1500 M yr−1 in the 2 other HzRGs where CO emission hasbeen detected. BecauseδSB is likely to be significantly smallerthan 1, our values are probably lower. Nevertheless, they arestill extremely high, indicating that we are witnessing a ma-jor starburst phase, possibly triggered by the interaction and/ormerging of the different nearby companion objects seen in theK-band image.
6. Conclusions
The main results from our multi-frequency observations ofB3 J2330+3927 are:•We detect the COJ = 4−3 line with a full velocity width
of∼500 km s−1 at the position of the AGN host galaxy. The lineis centered atz = 3.094, much closer to the central velocity ofthe associated H I absorber in Lyα than to the systemic redshiftdetermined from the He IIλ 1640 line. This strongly suggeststhe CO emission and associated H I absorption both originatefrom the same gas reservoir surrounding the HzRG.• We find a substantial discrepancy between our 250 GHz
single dish and 230 GHz interferometer measurements of thethermal dust emission. This strongly suggests that the dustemission is distributed at spatial scales larger than the 1.′′9×1.′′5synthesized interferometer beam. The combineduv-plane datacan be fit by a circular Gaussian profile with a size between 0.′′5and 5′′.• The optical/near-IR spectroscopy suggests that the AGN
is located at the brightestK-band source (objecta). This is sup-ported by the CO and dust emission, which both peak at thesame position. However, the radio morphology suggests thatthe AGN is located at the central radio component, 1′′ south ofobjecta. If the AGN is located at objecta, the radio source isextremely asymmetric. Alternatively, the AGN may be locatedat the central radio component, and could be either heavilyobscured in the optical/near-IR, or could be located off-centrefrom the host galaxy. However, this alternative appears unlikelygiven the position of the dust/CO peak.• We obtain aτ < 1.3% limit on the H I 21 cm absorp-
tion against the radio source. This represents the seventh non-detection out of 8 radio galaxies where H I 21 cm absorptionhas been searched.• We estimate the mass of the different components in
B3 J2330+3927, which indicates that the CO emission tracesthe largest fraction of the total mass in the system.
In summary, our multi-wavelength observations suggest thepresence of a large gas and dust reservoir surrounding the hostgalaxy of B3 J2330+3927. For the first time, we have foundstrong indications that these different observations may tracethe same material, both in emission and in absorption. The de-tection of CO emission therefore implies that a substantial partof this reservoir is not primordial, but must have been previ-ously enriched, possibly by a starburst-driven superwind.
Acknowledgements. We thank Alexandre Beelen and RichardWilman for their help with MOPSI and the Lyα profile fitting,Dennis Downes for useful discussions, and the Plateau de Burestaff for their efficient assistance. We thank the anonymous ref-eree for useful suggestions. We are indebted to Daniel Stevens for

924 C. De Breuck et al.: CO emission and H I absorption in B3 J2330+3927
obtaining the initial optical data on this source in 1995. IRAMis supported by INSU/CNRS (France), MPG (Germany) and IGN(Spain). The W. M. Keck Observatory is operated as a scien-tific partnership among the California Institute of Technology, theUniversity of California, and the National Aeronautics and SpaceAdministration. The Observatory was made possible by the gener-ous financial support of the W. M. Keck foundation. The WesterborkSynthesis Radio Telescope (WSRT) is operated by The NetherlandsFoundation for Research in Astronomy (NFRA) with financial sup-port of The Netherlands Organization for Scientific Research (NWO).The National Radio Astronomy Observatory (NRAO) is operated byAssociated Universities, Inc., under a cooperative agreement withthe National Science Foundation. This work was supported by aMarie Curie Fellowship of the European Community programme“Improving Human Research Potential and the Socio-EconomicKnowledge Base” under contract number HPMF-CT-2000-00721.The work of DS was carried out at the Jet Propulsion Laboratory,California Institute of Technology, under contract with NASA. Thework by MR and WvB at IGPP/LLNL was performed under the aus-pices of the U.S. Department of Energy, National Nuclear SecurityAdministration by the University of California, Lawrence LivermoreNational Laboratory under contract No. W-7405-Eng-48. This workwas carried out in the context of EARA, the European Association forResearch in Astronomy.
References
Ajiki, M., Taniguchi, Y., Murayama, T., et al. 2002, ApJ, 576, L25Alloin, D., Barvainis, R., & Guilloteau, S. 2000, ApJ, 528, L81Andreani, P., Fosbury, R., van Bemmel, I., & Freudling, W. 2002,
A&A, 381, 389Archibald, E., Dunlop, J., Hughes, D., et al. 2001, MNRAS, 323, 417Armus, L., Soifer, B., Murphy, T., et al. 1998, ApJ, 495, 276Athreya, R., Kapahi, V., McCarthy, P., & van Breugel, W. 1997,
MNRAS, 289, 525Baker, J., Hunstead, R. W., Athreya, R. M., et al. 2002, ApJ, 568, 592Barger, A., Cowie, L. L., Bautz, M. W., et al. 2001, AJ, 122, 2177Benford, D., Cox, P., Omont, A., Phillips, T., & McMahon, R. 1999,
ApJ, 518, L65Best, P., Longair, M., & R¨ottgering, H. 1998, MNRAS, 295, 549Binette, L., Kurk, J., Villar-Mart´ın, M., & Rottgering, H. 2000, A&A,
356, 23Blain, A., & Longair, M. 1993, MNRAS, 264, 509Braun, R., & Walterbos, R. 1992, ApJ, 386, 120Briggs, F., Sorar, E., & Taramopoulos, A. 1993, ApJ, 415, L99Cardelli, J., Clayton, G., & Mathis, J. 1989, ApJ, 345, 245Carilli, C. 1995, A&A, 298, 77Carilli, C., Lane, W., de Bruyn, A., Braun, R., & Miley, G. 1996, AJ,
111, 1830Carilli, C., Rottgering, H., van Ojik, R., Miley, G., & van Breugel, W.
1997, ApJS, 109, 1Carilli, C., Bertoldi, F., Menten, K. M., et al. 2000, ApJ, 533, L13Chapman, S., Lewis, G. F., Scott, D., et al. 2001, ApJ, 548, 17Chini, R., Krugel, E., & Kreysa, E. 1986, A&A, 167, 315Combes, F., Maoli, R., & Omont, A. 1999, A&A, 345, 369Cox, P., Omont, A., Djorgovski, S. G., et al. 2002a, A&A, 387, 406Cox, P., Omont, A., & Bertoldi, F. 2002b, EAS Publ. Ser., 4, 399Dawson, S., Spinrad, H., Stern, D., et al. 2002, ApJ, 570, 92De Breuck, C., Brotherton, M., Tran, H., van Breugel, W., &
Rottgering, H. 1998, AJ, 116, 13De Breuck, C., van Breugel, W., Minniti, D., et al. 1999, A&A, 352,
L51
De Breuck, C., van Breugel, W., R¨ottgering, H., & Miley, G. 2000a,A&AS, 143, 303
De Breuck, C., R¨ottgering, H., , Miley, G., et al. 2000b, A&A, 362,519
De Breuck, C., van Breugel, W., R¨ottgering, H., et al. 2001, AJ, 121,1241
De Breuck, C., van Breugel, W., Stanford, S. A., et al. 2002, AJ, 123,637
Dennett-Thorpe, J., Scheuer, P., Laing, R., et al. 2002, MNRAS, 330,609
Deutsch, E. 1999, AJ, 118, 1882Dey, A., van Breugel, W., Vacca, W., & Antonucci, R. 1997, ApJ, 490,
698Douglas, J. N., Bash, F. N., Bozyan, F. A., Torrence, G. W., & Wolfe,
C. 1996, AJ, 111, 1945Downes, D., & Solomon, P. 1998, ApJ, 507, 615Draine, B., & Lee, H. 1984, ApJ, 285, 89Dunne, L., Eales, S., Edmunds, M., et al. 2000, MNRAS, 315, 115Dunlop, J., Hughes, D., Rawlings, S., Eales, S., & Ward, M. 1994,
Nature, 370, 347Eales, S., & Rawlings, S. 1993, ApJ, 411, 67Evans, A., Sanders, D. B., Mazzarella, J. M., et al. 1996, ApJ, 457,
658Furlanetto, S., & Loeb, A. 2003, ApJ, in press [astro-ph/0211496]Genzel, R., et al. 2003, ApJ, in press [astro-ph/0210449]Guilloteau, S., Omont, A., Cox, P., McMahon, R., & Petitjean, P. 1999,
A&A, 349, 363Hildebrand, R. 1983, QJRAS, 24, 267Holland, W., Robson, E. I., Gear, W. K., et al. 1999, MNRAS, 303,
659Hughes, D., Dunlop, J., & Rawlings, S. 1997, MNRAS, 289, 766Ivison, R. 1995, MNRAS, 275, L33Ivison, R., Smail, I., Le Borgne, J.-F., et al. 1998, MNRAS, 298, 583Jaffe, W., & Perola, G. 1973, A&A, 26, 423Jarvis, M., Rawlings, S., Eales, S., et al. 2001, MNRAS, 326, 1585Jarvis, M., Wilman, R., R¨ottgering, H., & Binette, L. 2003, MNRAS,
338, 263Johnson, H. 1966, ARA&A, 4, 193Kanekar, N., & Chengalur, J. 2003, A&A, 399, 857Kreysa, E., Gemuend, H.-P., Gromke, J., et al. 1998, Proc. SPIE, 3357,
319Lacy, M., Miley, G., Rawlings, S., et al. 1994, MNRAS, 271, 504Mathis, J., & Whiffen, G. 1989, ApJ, 341, 808Matthews, K., & Soifer, B. 1994, in Proc. Infrared Astronomy with
Arrays: The Next Generation, ed. I. McLean (Dordrecht: Kluwer),239
Maxfield, L., Spinrad, H., Stern, D., Dey, A., & Dickinson, M. 2002,AJ, 123, 2321
McCarthy, P., Spinrad, H., Dickinson, M., et al. 1990, ApJ, 365, 487McCarthy, P., van Breugel, W., & Kapahi, V. 1991, ApJ, 371, 478McMahon, R., Priddey, R., Omont, A., Snellen, I., & Withington, S.
1999, MNRAS, 309, L1Monet, D., Canzian, B., Dahn, C., et al. 1998, USNO-SA2.0
(Washington DC: U.S. Naval Observatory)Murgia, M., Fanti, C., Fanti, R., et al. 1999, A&A, 345, 769Napier, P., Thompson, A., & Ekers, R. 1983, Proc. IEEE, 71, 1295Norman, C., Hasinger, G., Giacconi, R., et al. 2002, ApJ, 571, 218Oke, J., Cohen, J. G., Carr, M., et al. 1995, PASP, 107, 375Omont, A., Petitjean, P., Guilloteau, S., et al. 1996, Nature, 382, 428Omont, A., Cox, P., Bertoldi, F., et al. 2001, A&A, 374, 371Omont, A., Beelen, A., Bertoldi, F., et al. 2003, A&A, 398, 857Ouchi, M., Shimasaku, K., Okamura, S., et al. 2001, ApJ, 558, L83Pacholczyk, A. 1970, Series of Books in Astronomy and Astrophysics
(San Francisco: Freeman)
C. De Breuck et al.: CO emission and H I absorption in B3 J2330+3927 925
Papadopoulos, P., R¨ottgering, H. J. A., van der Werf, P. P., et al. 2000,ApJ, 528, 626
Pentericci, L., van Reeven, W., Carilli, C., et al. 2000, A&AS, 145,121
Pentericci, L., McCarthy, P., R¨ottgering, H., et al. 2001, ApJS, 135, 63Priddey, R., & McMahon, R. 2001, MNRAS, 324, L17Priddey, R., Isaak, K., McMahon, R., & Omont, A. 2003, MNRAS,
339, 1183Overzier, R., R¨ottgering, H., Kurk, J., & De Breuck, C. 2001, A&A,
367, L5Quirrenbach, A., Roberts, J., Fidkowski, K., et al. 2001, ApJ, 556, 108Reuland, M., van Breugel, W., R¨ottgering, H., et al. 2003a, ApJ, 582,
71Reuland, M., van Breugel, W., R¨ottgering, H., et al. 2003b, ApJ,
submittedReuland, M., et al. 2003c, in preparationRohlfs, K. 1986, Tools of Radio Astronomy (Berlin and New York:
Springer-Verlag)Rottgering, H., de Bruyn, G., & Pentericci, L. 1999, The Most Distant
Radio Galaxies, 113Rowan-Robinson, M. 2000, MNRAS, 316, 885Sanders, D., Scoville, N., & Soifer, B. 1991, ApJ, 370, 158Sanders, D., & Mirabel, I. 1996, ARA&A, 34, 749Schlegel, D., Finkbeiner, D., & Davis, M. 1998, ApJ, 500, 525Solomon, P., Downes, D., & Radford, S. 1992, ApJ, 398, L29Steidel, C., Giavalisco, M., Pettini, M., Dickinson, M., & Adelberger,
K. 1996, ApJ, 462, L17Steidel, C., Adelberger, K., Giavalisco, M., Dickinson, M., & Pettini,
M. 1999, ApJ, 519, 1Steidel, C., Hunt, M. P., Shapley, A. E., et al. 2002, ApJ, 576, 653
Steinbring, E., Crampton, D., & Hutchings, J. 2002, ApJ, 569, 611Stern, D., Moran, E. C., Coil, A. L., et al. 2002, ApJ, 568, 71Tadhunter, C., Dickson, R., Morganti, R., et al. 2002, MNRAS, 330,
977Taniguchi, Y., Ohyama, T., Murayama, T., et al. 2001a, ApJ, 559, L9Taniguchi, Y., Shioya, Y., & Kakazu, Y. 2001b, ApJ, 562, L15Uson, J., Bagri, D., & Cornwell, T. 1991, Phys. Rev. Lett., 67, 3328van Breugel, W., Stanford, S. A., Spinrad, H., Stern, D., & Graham, J.
1998, ApJ, 502, 614van Breugel, W., De Breuck, C., Stanford, S. A., et al. 1999, ApJ, 518,
L61van Ojik, R., Rottgering, H., Carilli, C., et al. 1996, A&A, 313, 25van Ojik, R., Rottgering, H., Miley, G., & Hunstead, R. 1997a, A&A,
317, 358van Ojik, R., Roettgering, H. J. A., van der Werf, P. P., et al. 1997b,
A&A, 321, 389Venemans, B., Kurk, J. D., Miley, G. K., et al. 2002, ApJ, 569, L11Vernet, J., Fosbury, R. A. E., Villar-Mart´ın, M., et al. 2001a, A&A,
366, 7Vernet, J., & Cimatti, A. 2001b, A&A, 380, 409Vigotti, M., Gregorini, L., Klein, U., & Mack, K.-H., A&AS, 139, 359Villar-Martın, M., Alonso-Herrero, A., di Serego Alighieri, S., &
Vernet, J. 2000, A&AS, 147, 291Villar-Martın, M., Vernet, J., di Serego Alighieri, S., et al. 2002,
MNRAS, 336, 436Villar-Martın, M., et al. 2003, in preparationWillott, C., Rawlings, S., Archibald, E., & Dunlop, J. 2002, MNRAS,
331, 435Zylka, R., The MOPSI Cookbook,www.mpifr-bonn.mpg.de/staff/bertoldi/mambo/