clustering 34 occupational groups by personality dimensions
TRANSCRIPT
http://epm.sagepub.com/Measurement
Educational and Psychological
http://epm.sagepub.com/content/33/2/267The online version of this article can be found at:
DOI: 10.1177/001316447303300206
1973 33: 267Educational and Psychological MeasurementGeorge E. Seymour, E.K. Eric Gunderson and Robin R. Vallacher
Clustering 34 Occupational Groups By Personality Dimensions
Published by:
http://www.sagepublications.com
found at: can beEducational and Psychological MeasurementAdditional services and information for
http://epm.sagepub.com/cgi/alertsEmail Alerts:
http://epm.sagepub.com/subscriptionsSubscriptions:
http://www.sagepub.com/journalsReprints.navReprints:
http://www.sagepub.com/journalsPermissions.navPermissions:
http://epm.sagepub.com/content/33/2/267.refs.htmlCitations:
What is This?
- Jul 1, 1973Version of Record >>
at FLORIDA ATLANTIC UNIV on April 30, 2013epm.sagepub.comDownloaded from
267
CLUSTERING 34 OCCUPATIONAL GROUPS BYPERSONALITY DIMENSIONS1
GEORGE E. SEYMOUR, E. K. ERIC GUNDERSON
AND
ROBIN R. VALLACHER2
Operational Psychiatry Division3Navy Medical Neuropsychiatric Research Unit
San Diego, California
EDUCATIONAL AND PSYCHOLOGICAL MEASUREMENT1973, 33, 267-284.
CLUSTERING of psychological variables is well-established in
the psychometric literature (Cronbach and Gleser, 1953; John-son, 1967; Pugh, Erickson, Rubin, Gunderson, and Rahe, 1971).Cluster analysis is a convenient method for reducing a largenumber of variables to a manageable number of salient dimen-sions or types. In other words, if a researcher with a large pool ofvariables wishes to know if certain subsets are internally homo-geneous or uniquely different from other subsets, cluster analysisis indicated. There are several methods of clustering includingsome methods which exclude unique variables. A choice was madeto use the method described by McQuitty and Clark (1968) whoreported that contrary to most pattern-analytic methods their
relatively new intercolumnar correlational method uses all in-
dices of association.
Essentially, this method of cluster analysis separates an orig-inal pool of variables into two subsets, each component beingmore highly correlated with the others in that subset than with
1 Report Number 72-11, supported by the Bureau of Medicine and Surgery,Department of the Navy, under Research Work Unit MF12.524.001-9003DF5G. Opinions expressed are those of the authors and are not to be con-strued as necessarily reflecting the official view or endorsement of the De-partment of the Navy.
2 Presently at Michigan State University, East Lansing, Michigan.3 Reprints should be requested from this address.
at FLORIDA ATLANTIC UNIV on April 30, 2013epm.sagepub.comDownloaded from
268 EDUCATIONAL AND PSYCHOLOGICAL MEASUREMENT
the components of the other subset. Each of these two subsets arefurther separated into two subsets by the same process. The sep-aration process is continued until eventually each component, orvariable, of the original pool has been separated from every othercomponent; however, by observing the successive steps, infor-mation about like components, or clusters, may be obtained.
Clustering is especially useful if the applied theoreticalmodel assumes that each original component must be an elementof one, and only one, of the eventual clusters. Without that as-sumption, however, the principal advantage of cluster analysismay become a potential disadvantage. For example, if one or
more of the original elements were completely unlike the rest ofthe original pool, they would cluster at successive steps until
they eventually separated into individual elements. The onlysafeguard against misinterpreting this occurrence is to observethe component intercorrelations, yet, as will be shown, even thismethod is not foolproof.
Generally, in this type of analysis variables are clusteredacross subjects; however, it is not unusual to require informationabout which of several groups are similar or related. When inter-
group comparisons are to be made on one variable, t tests or
correlations may be appropriate, but when comparisons are
made across more than one variable methodological problemsoften arise. It seemed appropriate, therefore, to use the clusteringprinciple, and thus cluster group means over variables. More
specifically, the clustering of groups across personality dimen-sions appeared to be a type of empirical profile analysis which,if relevant and meaningful, would provide information about
groups that are similar enough to be combined in future studieswhere cogent reasons for doing so exist. The process of empiricallycombining highly similar groups would effectively increase thenumber of subjects in any grouping thereby taking advantage ofthe stability in measurement that occurs with larger numbers.Further, the empirical grouping of occupations has been maderelevant by a recent finding that occupation sometimes acts as amoderator variable (Doll and Gunderson, 1969). This paperthen addresses the question of whether occupations can be mean-ingfully grouped on the basis of personality dimensions by clusteranalysis.
at FLORIDA ATLANTIC UNIV on April 30, 2013epm.sagepub.comDownloaded from
269GEORGE E. SEYMOUR, ET AL.
Method
Each year over the past several years there have been approx-imately 350 military and civilian applicants for Operation DeepFreeze. More detailed information about this yearly program ofexpeditions to the Antarctic may be found elsewhere (Doll andGunderson, 1969; Gunderson, in press). The program tradition-ally has been announced throughout the Navy which is responsi-ble for providing logistic support (construction and maintenancepersonnel, radio operators, medical personnel, cooks, etc.) for a
number of research programs. These yearly scientific programs,funded and managed by the National Science Foundation, haveenlisted the services of scientists and technicians from various
universities and government laboratories, such as the US WeatherBureau. Thus, the screening program encompassed an unusu-
ally large number of diverse occupations, both military and ci-
vilian.Each applicant was given routine medical and psychiatric ex-
aminations in addition to a small battery of standardized per-sonality and biographical inventories. Two of the three personal-ity inventories, the Opinion Survey and the Friend Description,have been repeatedly factor analyzed in order to derive 20 person-ality scales which, along with six other scales to be described below,were defined as personality dimensions for this study.The Opinion Survey consisted of approximately 150 statements
requesting information about attitudes and personality self-de-
scriptions. The contents of the 13 scales developed from this
inventory have been described elsewhere (Seymour and Gunder-son, 1971). The scales were labeled as follows: Achievement,Autonomy, Nurturance, Orderliness, Usefulness, Boredom, Con-fidence in Medical Care (Confidence I), Confidence in Organiza-tion (Confidence II), Motivation, Decisiveness, Excitableness,Bluntness, and Absent-mindedness.The Friend Description inventory consisted of 50 adjective
traits; the respondent indicated to what degree each trait wouldbe desired in a close friend. The seven scales derived from this
inventory were: Efficiency, Sympathy, Caution, Dignity, Opti-mism, Cynicism and Adventurousness.The FIRO-B, the remaining six scales used in this study, were
at FLORIDA ATLANTIC UNIV on April 30, 2013epm.sagepub.comDownloaded from
270 EDUCATIONAL AND PSYCHOLOGICAL MEASUREMENT
developed by Schutz (1958) and represent his tridimensional
theory of personality. For each dimension of Affection, Control,and Inclusion, each applicant was given both a Wanted and anExpressed score. All applicants’ scores for the 26 personalityscales were derived by computer programming.Each applicant was then assigned to a group based on his oc-
cupation. Military applicants were readily assignable because
groups were designated on the basis of a response to a specificbiographical inventory item. Not all civilian applicants were soeasily categorized; for example, some applicants indicated &dquo;stu-dent.&dquo; When an applicant’s occupation was in doubt, he was omit-ted from the study.There were 34 occupational groups with Ns sufficiently large to
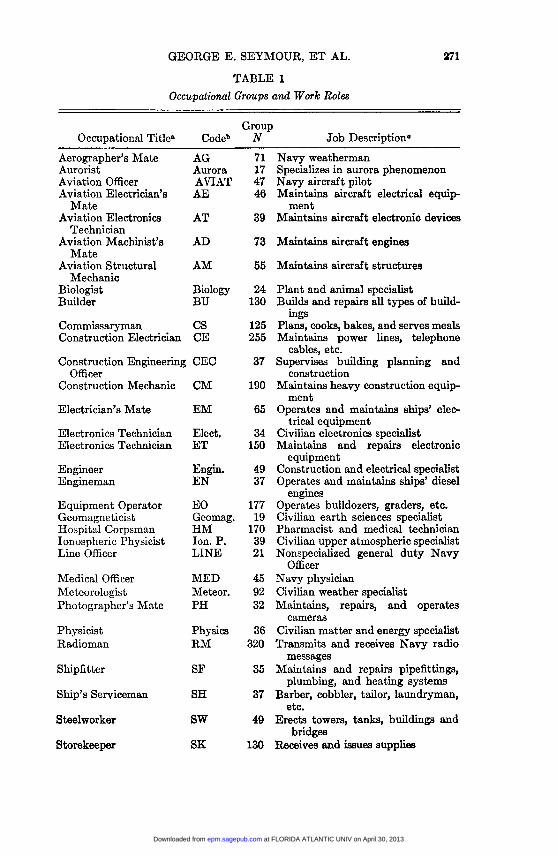
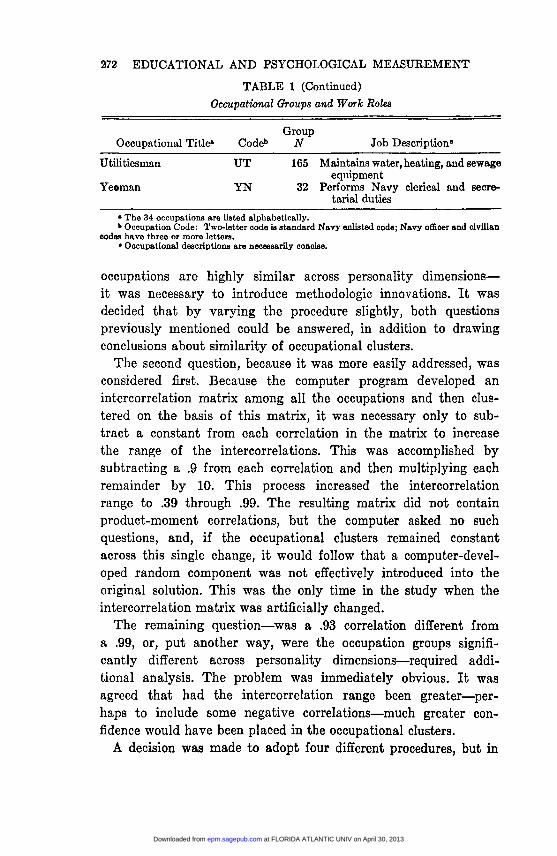
have their mean scores on the personality scales considered sta-ble ; 30 of the 34 groups had in excess of 30 applicants. The 34groups and brief descriptions of their work roles may be seen inTable 1. The 34 groups consisted of 22 military enlisted, 4 mili-tary officer, and 8 civilian occupational specialties. Each groupwas assigned an alphabetic code; the officers and civilians were
given three or more letters to distinguish them from the tradi-tional two-letter military enlisted occupation codes.Then a 34 by 26 matrix of mean scores for occupations by
scales was used as input to a cluster analysis computer program.This procedure was the first of five procedures used in this study.In order to explain the other procedures it will be necessary atthis point to mention briefly the results of the first procedure.As expected, the computer program produced clusters of oc-
cupations, some of which had high face validity. For example,the first division separated all military enlisted groups into onecluster, and all officers and civilians into the other. What was un-expected were the high intercorrelations among the 34 occupationsacross the 26 personality scales which ranged from .939 to .999.These results raised two major and somewhat related questions.These were: (1) Is a .93 correlation significantly different from a.99? and (2) Was the computer developing occupational clusterson the basis of some added random error, especially at the laterstages where group discrimination was necessary among in-
creasingly higher intercorrelations, the majority of which ex-
ceeded .97? To address the basic question of the study-which
at FLORIDA ATLANTIC UNIV on April 30, 2013epm.sagepub.comDownloaded from
271GEORGE E. SEYMOUR, ET AL.
TABLE 1
Occupational Groups and Work Roles
at FLORIDA ATLANTIC UNIV on April 30, 2013epm.sagepub.comDownloaded from
272
TABLE 1 (Continued)Occupational Groups and Work Roles
The 34 occupations are listed alphabetically.b Occupation Code: Two-letter code is standard Navy enlisted code; Navy officer and civilian
oodes have three or more letters.. Occupational descriptions are necessarily concise.
occupations are highly similar across personality dimensions-it was necessary to introduce methodologic innovations. It was
decided that by varying the procedure slightly, both questionspreviously mentioned could be answered, in addition to drawingconclusions about similarity of occupational clusters.The second question, because it was more easily addressed, was
considered first. Because the computer program developed an
intercorrelation matrix among all the occupations and then clus-tered on the basis of this matrix, it was necessary only to sub-tract a constant from each correlation in the matrix to increasethe range of the intercorrelations. This was accomplished bysubtracting a .9 from each correlation and then multiplying eachremainder by 10. This process increased the intercorrelation
range to .39 through .99. The resulting matrix did not containproduct-moment correlations, but the computer asked no suchquestions, and, if the occupational clusters remained constant
across this single change, it would follow that a computer-devel-oped random component was not effectively introduced into theoriginal solution. This was the only time in the study when theintercorrelation matrix was artificially changed.The remaining question-was a .93 correlation different from
a .99, or, put another way, were the occupation groups signifi-cantly different across personality dimensions-required addi-tional analysis. The problem was immediately obvious. It was
agreed that had the intercorrelation range been greater-per-haps to include some negative correlations-much greater con-fidence would have been placed in the occupational clusters.A decision was made to adopt four different procedures, but in
at FLORIDA ATLANTIC UNIV on April 30, 2013epm.sagepub.comDownloaded from
273GEORGE E. SEYMOUR, ET AL.
each leaving the occupational groups, their basic data, and thecomputer program as invariants. Procedure One consisted of thebasic group means as previously described. The four added pro-cedures are described below.Because the 34 group mean scores across personality dimen-
sions conceptually represented a sample of occupational pro-
files, it was conceivable that some future samples would deviategreatly about some unknown population profile. The only con-stant, it seemed, was each scale midpoint. Given this absolute
standard, it was possible for any or all 34 occupation groups tobe either below or above the midpoint on some scales, while
varying about the midpoint on other scales. Thus, the basic datafor Procedure Two consisted of subtracting each group mean
from the scale midpoint of each scale.Another line of thought suggested that by subtracting each
occupational mean for each scale from the grand mean for thatscale (N about 3,500), a great proportion of common variance
could be accounted for and the group intercorrelation rangewould be greatly increased. This process was called ProcedureThree.
Although Procedure Three had definite advantageous statisti-
cal properties, the group Ns varied greatly, as can be seen in Ta-ble 1, and certain occupational groups, such as the Radiomen
(RM) with an N of 320, would have contributed appreciablymore to the grand mean for each scale than other groups. The-oretically, it was possible that the groups with larger Ns, havingcontributed disproportionately more to the grand mean, wouldhave deviated least from the grand mean, and thus some propor-tion of their relationship would have been an artifact. It was notknown how great an effect this condition would have on the re-sults.
To counteract the possible effect due to the grand mean beingdisproportionately representative of the 34 groups, Procedure
Four consisted of summing the 34 group means for each scale,dividing that number by 34, and then subtracting this newly de-
veloped unweighted grand mean from each group mean. This
procedure implicitly assumed that the Ns for all groups were
effectively equal, and that each group should have contributedequally to the grand mean.
at FLORIDA ATLANTIC UNIV on April 30, 2013epm.sagepub.comDownloaded from
274 EDUCATIONAL AND PSYCHOLOGICAL MEASUREMENT
In the last procedure, Procedure Five, a z score was derivedfor each occupational group on each scale, based upon the grandmean and standard deviation for that scale. This procedure wasconsidered theoretically important because it effectively controlledfor different variances across personality scales. Further, Pro-cedure Five would be essential if it were assumed that each ofthe 26 personality dimensions should contribute equally to the
group intercorrelations.One other procedure was considered; a Fisher transformation
of r’s to z’s, and a clustering of the z’s. It was not used because theMcQuitty and Clark method requires the use of the diagonal cor-relations and there is no exact z equivalent for a correlation of1.00.
These last four procedures then were expected to provide ananswer to the question: Can occupations be meaningfully clus-tered across personality dimensions?
Finally, because McQuitty and Clark (1968) recommended
obtaining estimates of reliability, a split-half method was con-ducted. Since all applicants were originally put on computertape alphabetically within years, it was decided to create two
samples, A and B, of 34 occupations each by assigning alternateapplicants to each sample for each occupation. Each sample wasthen clustered by the same five procedures described above, andthe percentage of consistent occupational clusters between thetwo samples was used as an estimate of reliability.
Results
As briefly mentioned above, the results of Procedure One wereequivocal and further analyses were necessary to answer the twoquestions previously raised. When the intercorrelation inputmatrix was altered by a constant of .9, effectively increasing theintercorrelation range, the result of the clustering was identicalwith the original result. Thus, the cluster computer program wasable to make reliable discriminations at levels in which most
experimenters would feel uncomfortable. In other words, a com-puter-developed random component was not effectively intro-duced into the results.
With one exception the four additional procedures conformedto expectation, and greatly increased the range of the occupa-
at FLORIDA ATLANTIC UNIV on April 30, 2013epm.sagepub.comDownloaded from
275GEORGE E. SEYMOUR, ET AL.
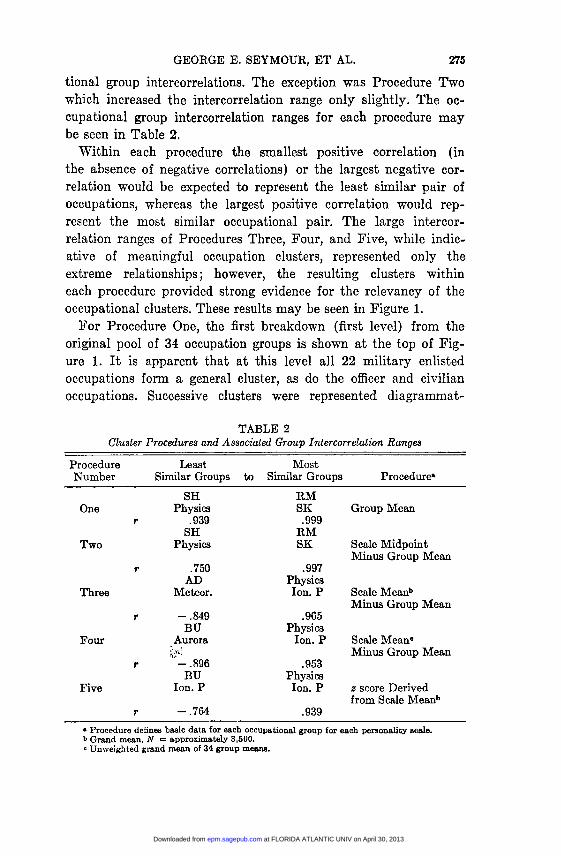
tional group intercorrelations. The exception was Procedure Twowhich increased the intercorrelation range only slightly. The oc-cupational group intercorrelation ranges for each procedure maybe seen in Table 2.Within each procedure the smallest positive correlation (in
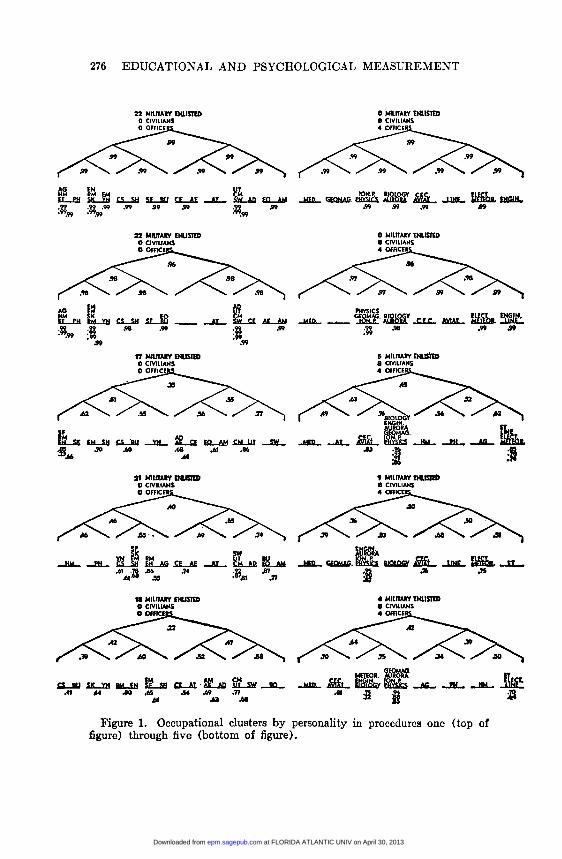
the absence of negative correlations) or the largest negative cor-relation would be expected to represent the least similar pair ofoccupations, whereas the largest positive correlation would rep-resent the most similar occupational pair. The large intercor-relation ranges of Procedures Three, Four, and Five, while indic-ative of meaningful occupation clusters, represented only theextreme relationships; however, the resulting clusters withineach procedure provided strong evidence for the relevancy of theoccupational clusters. These results may be seen in Figure 1.For Procedure One, the first breakdown (first level) from the
original pool of 34 occupation groups is shown at the top of Fig-ure 1. It is apparent that at this level all 22 military enlistedoccupations form a general cluster, as do the officer and civilian
occupations. Successive clusters were represented diagrammat-
TABLE 2Cluster Procedures and Associated Group Intercorrelation Ranges
. Procedure defines basic data for each occupational group for each personality scale.b Grand mean, N = approximately 3,500.° Unweighted grand mean of 34 group means.
at FLORIDA ATLANTIC UNIV on April 30, 2013epm.sagepub.comDownloaded from
276 EDUCATIONAL AND PSYCHOLOGICAL MEASUREMENT
Figure 1. Occupational clusters by personality in procedures one (top offigure) through five (bottom of figure).
at FLORIDA ATLANTIC UNIV on April 30, 2013epm.sagepub.comDownloaded from
277GEORGE E. SEYMOUR, ET AL.
ically until the fourth level, when the occupational groups thatwere still clustered were indicated by their codes. At this levelthere were 16 possible clusters (henceforth called cells) whichare represented by horizontal lines. This cell level was used as thebasis of comparison because, although arbitrary, it allowed rela-tively easy comparison, either above or below this level across
procedures. Within cells occupation groups in columns were morebasic than the others, and within columns those groups closest tothe cell line were most basic. Thus, in Cell 1 of Procedure One theoccupation groups of Aerographer’s Mate, Hospital Corpsman,Electronics Technician, and Photographer’s Mate (AG, HM, ET,and PH, respectively) were more similar to each other across 26personality dimensions than they were to any of the other groupsin this procedure. Since the cluster process continued until all
groups were eventually separated, the next level for Cell 1, inthis procedure, is represented by the Photographer’s Mate (PH)separating from the other three, indicating that this group wasleast like the others within the cell. At the sixth level, the Aer-ographer’s Mate (AG) separated leaving the Hospital Corpsman(HM) and Electronics Technician (ET) as more like each
other than either of them were to any other occupation in thisprocedure.As mentioned previously, the clustering of groups at any
level was only a partial indication of their relationship. To avoidpotential misinterpretation of clusters, intercorrelations were
shown for each cluster above and below the cell level. Where thenumber of occupational groups within a cluster exceeded two,untransformized average correlations are shown. For example,within the seventh cell of Procedure Four, the Construction
Mechanic, Utilitiesman, Steelworker, and Aviation Machinist’sMate (CM, UT, SW, and AD, respectively) occupations had amean intercorrelation of .81. At the next level, when the AD’s sep-arated, the mean intercorrelation for the CM, UT, and SW oc-cupations was .87, and finally the CM and UT intercorrelated at.92.
There were two occupational pairs that separated from othersin groups of two; therefore, the twelfth cell in Procedure Three,and the third cell of Procedure Four appear to be missing onecorrelation each.
at FLORIDA ATLANTIC UNIV on April 30, 2013epm.sagepub.comDownloaded from
278 EDUCATIONAL AND PSYCHOLOGICAL MEASUREMENT
Mean cluster correlations are also shown for levels precedingthe fourth. Thus, in Procedure Five, Cells 7 and 8 intercorrelatedat .58, Cells 5 through 8 intercorrelated at .47, and Cells 1
through 8 had a mean intercorrelation of .22. While not apparent,it should be noted that this .22 intercorrelation represents the
mean intercorrelation among all the occupations in Cells 1
through 8 (in Procedure Five), including the large intercorrela-tions shown. Thus, if the intercorrelations within Cells 1 through4 and Cells 5 through 8 were disregarded, the mean intercorrela-tion between the occupations in Cells 1 through 4 and Cells 5through 8 would have been a .02, having been comprised par-tially of 35 negative correlations which ranged from -..02 to
-.70. It is immediately apparent that the correlations were onlycomparable within procedures, and even then effectively useless
for the first two procedures. Despite the inconsistency in cor-
relation ranges, however, there was considerable consistencyamong occupational clusters across procedures. This was bestdemonstrated by the Construction Mechanic-Utilitiesman (CM-UT), the Radioman-Engineman (RM-EN), and the Physicist-Ionospheric Physicist (Physics-Ion. P) clusters which were con-
sistently clustered at cell level in all five procedures. Further,across procedures, there were clusters of occupations that mighthave plausibly been expected to be similar. Some examples werethe technical military &dquo;electrical&dquo; occupations of Construction
Electrician (CE), Aviation Electrician’s Mate (AE), and Avi-ation Electronics Technician (AT). Surprisingly, the Electron-
ics Technicians (ET) were not a part of that cluster, and tendedto be associated with the military officer and civilian occupations.It is known that the school for Electronics Technicians is one ofthe most difficult in the Navy and acceptance is partially a func-tion of superior performance on general classification tests.
Other examples of plausible occupation clusters were the
apparent &dquo;desk-type&dquo; or &dquo;non-outdoor&dquo; occupations of Radioman(RM), Storekeeper (SK), Yeoman (YN), Cook (CS), and, un-explainably, Engineman (EN) and Shipfitter (SF), as opposed tothe &dquo;outdoor&dquo; occupational cluster of the Steelworker (SW),Construction Mechanic (CM), Utilitiesman (UT), EquipmentOperator (EO), and Aviation Machinist’s Mate (AD).Within the civilian specialties, the Physicists, Ionospheric
at FLORIDA ATLANTIC UNIV on April 30, 2013epm.sagepub.comDownloaded from
279GEORGE E. SEYMOUR, ET AL.
Physicists, Geomagneticists, and Aurora Physicists (Physics,Ion. P, Geomag., and Aurora, respectively) formed a basic cluster,as did the civilian Electronics Technicians and Meteorologists(Elect. and Meteor., respectively). The Biologists and the En-gineers (Biology and Engin., respectively) were less stronglyrelated.
It was apparent that the criteria for accepting or rejecting anoccupation as part of a basic occupational cluster would be de-pendent in part upon a minimally acceptable intercorrelation
and/or the number of subjects available for study in each oc-cupation. Presumably one would accept increasingly dissimilar
occupational groups to augment sample size if necessary. An al-
ternative to this grouping procedure would be to consider oc-
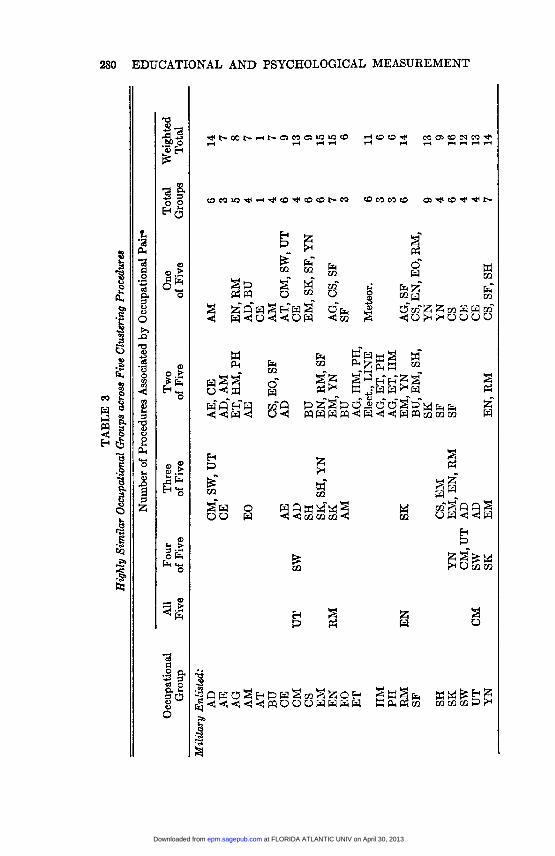
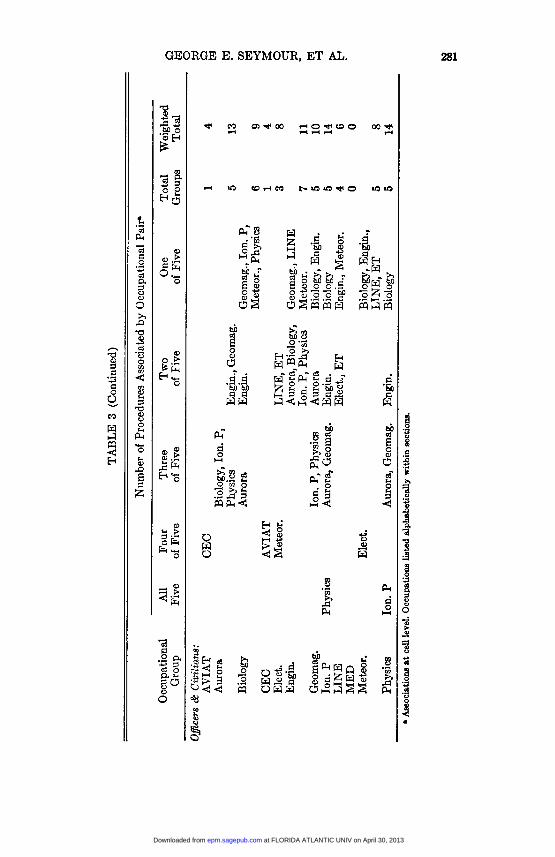
cupations that consistently clustered across the five procedures.A summary of the consistent clusters across procedures maybe seen in Table 3.
In Table 3 each occupational group was listed alphabeticallywithin the two general clusters of military enlisted and officer-
civilian occupations. For each occupation it is relatively easy toascertain which group or groups of occupations most closely re-semble other occupations across the five procedures at the celllevel. For example, it was obvious that Physicists and IonosphericPhysicists were highly homogeneous in every procedure across
the 26 personality dimensions, whereas the Aviation ElectronicsTechnicians formed a basic cluster in only one of the five pro-cedures. Unique among occupations were the Navy physicians(MED) who were unlike any other occupational group in per-sonality at the cell level, yet perhaps appropriately (as seen inFigure 1) were more like the other military officers and Geomag-neticists than any other occupation in this study. The total in
Table 3 indicates, for each occupation, the number of other oc-cupational groups related to that occupation at the cell level. Theweighted total reflects not only the number of related occupationsbut also the number of procedures for each relationship. As canbe seen in the total column the Shipfitters were related to moreoccupations (9) than any other occupation, yet these were not ashighly consistent across procedures as were the six relationshipsassociated with the Storekeepers. The weighted totals for these
two occupations were 13 and 16, respectively. Further, the high
at FLORIDA ATLANTIC UNIV on April 30, 2013epm.sagepub.comDownloaded from
280 EDUCATIONAL AND PSYCHOLOGICAL MEASUREMENT
at FLORIDA ATLANTIC UNIV on April 30, 2013epm.sagepub.comDownloaded from
281GEORGE E. SEYMOUR, ET AL.
at FLORIDA ATLANTIC UNIV on April 30, 2013epm.sagepub.comDownloaded from
282 EDUCATIONAL AND PSYCHOLOGICAL MEASUREMENT
specificity of Table 3 is indicated by its being representative ofonly 13% of all possible occupational clusters.
Discussion
Before attempting to relate and comment on these various
findings, there is one important possible theoretical constraint
concerning this study. This involves the personality dimensionsacross which the occupations were clustered. Presumably, ifdifferent personality dimensions were used the occupations mighthave clustered differently. Implicit in this study, therefore, wasthe assumption that the 26 personality scales were basicallyrepresentative of the personality profile for each occupation.
Accepting this possible constraint, attention can be directedtoward the questions raised by Procedure One. First, although theintercorrelations within Procedure. One convey no relative in-formation as presented in Figure 1, there can be little doubtthat they were in fact meaningful. The evidence consisted of boththe identical clusters when the intercorrelation matrix range was
artificially expanded, and the consistency of occupation clustersacross the other four procedures. Two striking examples were thethree cluster-pairs which were highly related at the cell levelacross all five procedures, and the consistency with which thePhysicians and a few other occupations were so poorly related toany other occupation across the five procedures.
Additionally, a third question might be raised concerning theappropriateness of group means (Procedure One) as basic datafor clustering. The answer would have to be an unhesitating&dquo;yes,&dquo; but whether the group means were the most appropriatemeasure for clustering was more difficult to ascertain. To answersuch a question an ideal index would presumably measure eachprocedure’s representativeness with respect to a concensus of sim-ilar clusterings across procedures. Such an index can be derivedfrom Table 3. For each occupational pair that was procedurallyassociated at the cell level in only three of the five procedures itwas noted which three procedures were represented. Then bysumming the number of times each procedure was represented itwas noted that a total of 48 unique procedural-pair relationshipswere formed. Analysis by this method indicated that ProceduresOne through Five were represented by 11, 11, 10, 11, and 5 as-
at FLORIDA ATLANTIC UNIV on April 30, 2013epm.sagepub.comDownloaded from
283GEORGE E. SEYMOUR, ET AL.
sociations, respectively. Thus, with the exception of Procedure
Five, all of the procedures were equally representative of the totalclustering consensus, and no single procedure could account formost of the cluster similarities across procedures. The implica-tion here is that the answer one gets depends, to some extent,upon the question that is being asked.When the total sample was split into Samples A and B, and
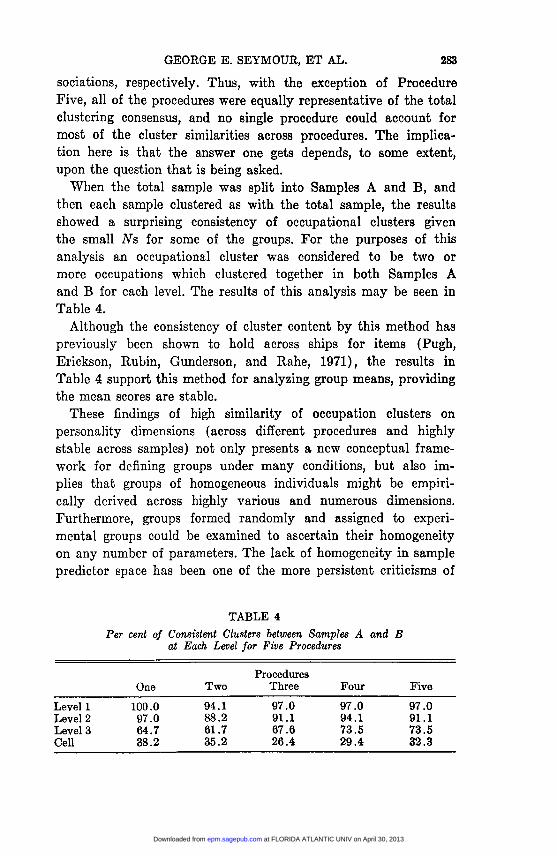
then each sample clustered as with the total sample, the resultsshowed a surprising consistency of occupational clusters giventhe small Ns for some of the groups. For the purposes of this
analysis an occupational cluster was considered to be two or
more occupations which clustered together in both Samples Aand B for each level. The results of this analysis may be seen inTable 4.
Although the consistency of cluster content by this method haspreviously been shown to hold across ships for items (Pugh,Erickson, Rubin, Gunderson, and Rahe, 1971), the results in
Table 4 support this method for analyzing group means, providingthe mean scores are stable.
These findings of high similarity of occupation clusters on
personality dimensions (across different procedures and highlystable across samples) not only presents a new conceptual frame-work for defining groups under many conditions, but also im-plies that groups of homogeneous individuals might be empiri-cally derived across highly various and numerous dimensions.
Furthermore, groups formed randomly and assigned to experi-mental groups could be examined to ascertain their homogeneityon any number of parameters. The lack of homogeneity in samplepredictor space has been one of the more persistent criticisms of
TABLE 4
Per cent of Consistent Clusters between Samples A and Bat Each Level for Five Procedures
at FLORIDA ATLANTIC UNIV on April 30, 2013epm.sagepub.comDownloaded from
284 EDUCATIONAL AND PSYCHOLOGICAL MEASUREMENT
psychological prediction (Lykken and Rose, 1963). Hopefully,empirical analysis of groups on relevant dimensions should re-
duce the problem. Seemingly, the clustering procedure is flexible
enough to be useful under various conditions.
Summary
Thirty-four military enlisted, officer, and civilian occupationalspecialties were clustered across 26 personality dimensions, andacross five procedures to test the efficacy of grouping occupationson the basis of personality dimensions. Clusters of occupationswith high face validity and stable across different procedureswere reported. While most of the 34 occupations were found tobe related to several other occupations across personality di-
mensions, a few occupations, most notably the occupations of
Physician and Navy enlisted Aviation Electronics Technicianwere only weakly related to any other occupations in this study.The concept of grouping occupations by personality dimensionswas discussed, and more general applications were suggested.
REFERENCES
Cronbach, L. J. and Gleser, Goldine C. Assessing similarity be-tween profiles. Psychological Bulletin, 1953, 50, 456-473.
Doll, R. E. and Gunderson, E. K. E. Occupational group as a
moderator of the job satisfaction-job performance relation-ship. Journal of Applied Psychology, 1969, 53, 359-361.
Gunderson, E. K. E. Individual behavior in confined or isolatedgroups. In J. E. Rasmussen (Ed.), Human Behavior in Isola-tion and Confinement. Chicago: Aldine, 1973.
Johnson, S. C. Hierarchical clustering schemes. Psychometrika, 1967,32,241-254.
Lykken, D. T. and Rose, R. Psychological prediction from actuar-ial tables. Journal of Clinical Psychology, 1963, 19,139-151.
McQuitty, L. L. and Clark, J. A. Clusters from iterative inter-columnar correlational analysis. EDUCATIONAL AND PSYCHO-LOGICAL MEASUREMENT, 1968, 20, 211-238.
Pugh, W., Erickson, J. M., Rubin, R. T., Gunderson, E. K. E., andRahe, R. H. Cluster analysis of life changes. II. Method andreplication in Navy subpopulations. Archives of GeneralPsychiatry, 1971, 25, 333-339.
Seymour, G. E. and Gunderson, E. K. E. Attitudes as predictors ofadjustment in extremely isolated groups. Journal of ClinicalPsychology, 1971, 27, 333-338.
Schutz, W. C. FIRO: A Three-Dimensional Theory of Interper-sonal Behavior. New York: Rinehart & Company, Inc., 1958.
at FLORIDA ATLANTIC UNIV on April 30, 2013epm.sagepub.comDownloaded from