clonal diversity and population genetic structure of arbuscular mycorrhizal fungi (glomus spp.)...
TRANSCRIPT
Molecular Ecology (2005)
14
, 743–752 doi: 10.1111/j.1365-294X.2005.02453.x
© 2005 Blackwell Publishing Ltd
Blackwell Publishing, Ltd.
Clonal diversity and population genetic structure of arbuscular mycorrhizal fungi (
Glomus
spp.) studied by multilocus genotyping of single spores
EVA H. STUKENBROCK
*
and SØREN ROSENDAHL
Institute of Biology, Department of Microbiology, University of Copenhagen, Oester Farimagsgade 2D, DK-1353 Copenhagen K, Denmark
Abstract
A nested multiplex PCR (polymerase chain reaction) approach was used for multilocusgenotyping of arbuscular mycorrhizal fungal populations. This method allowed us toamplify multiple loci from
Glomus
single spores in a single PCR amplification. Variableintrons in the two protein coding genes
GmFOX2
and
GmTOR2
were applied as codomin-ant genetic markers together with the LSU rDNA.
Genetic structure of
Glomus
spp. populations from an organically and a conventionallycultured field were compared by hierarchical sampling of spores from four plots in eachfield. Multilocus genotypes were characterized by SSCP (single stranded conformationpolymorphism) and sequencing.
All spore genotypes were unique suggesting that no recombination was taking place inthe populations. There were no overall differences in the distribution of genotypes in thetwo fields and identical genotypes could be sampled from both fields. Analysis of genediversity indicated that
Glomus
populations are subdivided between plots within eachfield. There were however, no subdivision between the fields.
Keywords
: arbuscular mycorrhiza, gene diversity,
Glomus
spp., multilocus genotyping, populationstructure, reproductive mode
Received 12 August 2004; revision received 5 December 2004; accepted 5 December 2004
Introduction
Arbuscular mycorrhizal (AM) fungi, Glomeromycota(Schüssler
et al
. 2001) are ancient asexuals which formsymbiotic associations with a broad range of host plantspecies. The fungi are abundant in most terrestrial eco-systems and play an important role for plant biodiversityand ecosystem function (Van der Heijden
et al
. 1998;Helgason
et al
. 2002).Although most known species of AM fungi appear to be
ubiquitous in their distribution in different ecosystems, itis possible that genetic drift and selection pressure affectthe spatial genetic structure of fungal populations. Geneticdrift or spatially restricted gene flow may lead to the ran-dom fixation of different alleles in different populations
thereby causing divergence of populations (Milgroom &Lipari 1995). Additionally, heterogeneous environmentsmay locally select for different genotypes in localizedpatches also leading to subdivision of populations. This isperhaps best exemplified by populations of pathogenic fungiwhere natural selection and genetic drift are expected toplay important roles in the spatial genetic structure ofpathogen populations resulting from selection for avirulencealleles in gene-for-gene interactions between plants andpathogens (Martens
et al
. 1970; Keen 1990). Only few studiesof AM fungi have attempted to assess spatial structurewithin populations. Koch
et al
. (2004) found high levels ofgenetic variability within
in vitro
propagated populationsof
Glomus intraradices
isolated from tillage/no tillage systems.Soil treatment had little influence on the distribution of geneticvariation whereas a spatial structure between plots wasobserved. Still, little is known about the extent or distributionof genetic variation in natural populations of AM fungior how genetic variation is influenced by environmentalfactors.
Correspondence: Eva H. Stukenbrock, *Present address: Institutefür Pflanzenwissenschaften, Gruppe Phytopatologie, ETH Zentrum/LFW, Universitätstrasse 2, CH-8092 Zürich, Switzerland. Fax:41-1-632-1572; E-mail: [email protected]
744
E . H . S T U K E N B R O C K and S . R O S E N D A H L
© 2005 Blackwell Publishing Ltd,
Molecular Ecology
, 14, 743–752
Population genetic analyses have been widely assessedto address questions about fungal population geneticstructure. Multiple markers provide the basic tools forsuch analyses as they are used to determine allele frequen-cies and to demonstrate the reproductive modes withinand between populations (Taylor & Fisher 2003). Both sex-ual and asexual reproduction may influence the amountand distribution of genetic variability. Populations withmainly asexual reproduction are characterized by multi-locus associations and identical genotypes composed ofunique alleles; whereas sexual reproduction leads to link-age equilibrium and high genotype diversity (Keller
et al
.1997). Population genetic studies of other fungal specieshave demonstrated that reproductive systems may rangefrom highly outcrossing in
Mycosphaerella graminicola
(Chen& McDonald 1996) to clonal in
Sclerotina sclerotiorum
(Kohli
et al
. 1995). AM fungi lack sexual structures and are believed tobe purely clonal. This has been confirmed by the associationof multiple AFLP (amplified fragment length polymorphism)markers (Rosendahl & Taylor 1997), however, indicationsof recombination were found in
Glomus
populations frompolluted soils analysed using ISSR (inter simple sequencerepeat) markers (Vandenkoornhuyse
et al
. 2001).So far population genetic studies have been based on
analysis of dominant markers, but recently multiple co-dominant genetic markers were developed from the proteincoding genes
GmFOX2
and
GmTOR2
for population geneticstudies of
Glomus mosseae
,
Glomus caledonium
and
Glomusgeosporum
(Stukenbrock & Rosendahl 2004). These markersare based on polymorphisms in intron regions in singlecopy genes. A nested multiplex PCR method was addition-ally developed for amplification of up to five loci fromsingle spores in one amplification reaction. With this approachit is possible to obtain multiple codominant genetic markersfrom the same spore which may otherwise be difficult becauseof low amounts of extractable DNA from single spores.
In the present study, these codominant genetic markerswere used in combination with sequences of the large sub-unit (LSU) rDNA to characterize populations of
G. mosseae
,
G. caledonium
and
G. geosporum
from two agricultural sys-tems. The objectives of this study were (i) to determine theamount and distribution of genetic variation in
Glomus
spp. populations by hierarchical sampling, (ii) to analyse thereproductive mode within each of the field populations, and(iii) to demonstrate the influence of different soil managementpractices on genetic structure of AM fungal populations.
Materials and methods
Field sites and sampling
Spores were collected in October 2003 from two fieldssituated at the experimental farm Højbakkegård (55
°
40
′
N,12
°
18
′
E) of the Royal Veterinary and Agricultural University,
Denmark. The soil is a moraine clay loam. One field hasbeen conventionally cultured with use of pesticides, whilethe other field has been organically cultured for 20 years. Thephosphorus content in the conventional field is
c.
45 mg/gwith pH 6.6 while in the organic field the phosphorouscontent is
c.
20 mg/g with pH 6.8 (L. Munkvold, personalcommunication). The last 3 years, the two fields have sharedthe same crop rotations of winter wheat (2001), springbarley (2002) and pea (2003). The organic field was fertilizedby rye grass in 2002. The two fields have been cultured forcenturies and mainly cropped with cereals for the last fourdecades (Hauggaard-Nielsen
et al
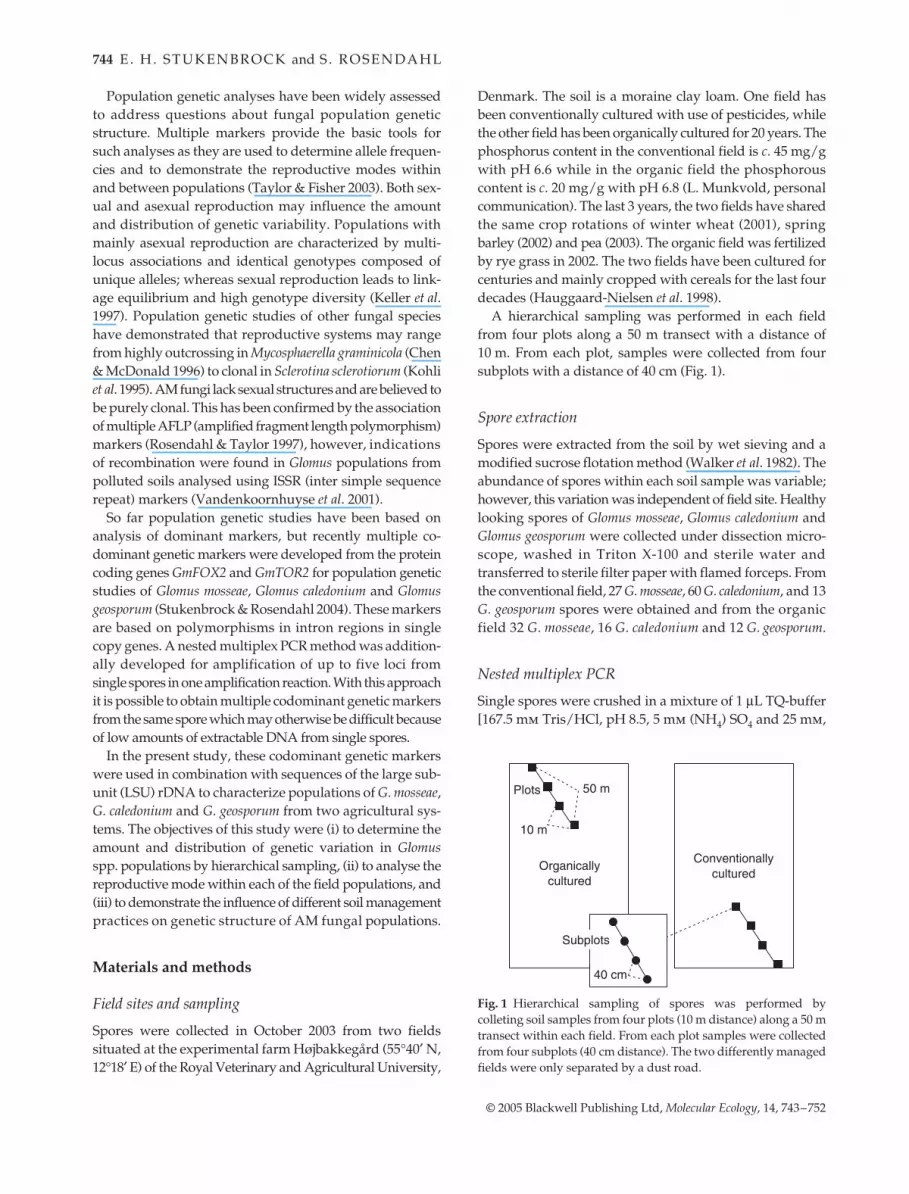
. 1998).A hierarchical sampling was performed in each field
from four plots along a 50 m transect with a distance of10 m. From each plot, samples were collected from foursubplots with a distance of 40 cm (Fig. 1).
Spore extraction
Spores were extracted from the soil by wet sieving and amodified sucrose flotation method (Walker
et al
. 1982). Theabundance of spores within each soil sample was variable;however, this variation was independent of field site. Healthylooking spores of
Glomus mosseae
,
Glomus caledonium
and
Glomus geosporum
were collected under dissection micro-scope, washed in Triton X-100 and sterile water andtransferred to sterile filter paper with flamed forceps. Fromthe conventional field, 27
G. mosseae
, 60
G. caledonium
, and 13
G. geosporum
spores were obtained and from the organicfield 32
G. mosseae
, 16
G. caledonium
and 12
G. geosporum
.
Nested multiplex PCR
Single spores were crushed in a mixture of 1
µ
L TQ-buffer[167.5 m
m
Tris/HCl, pH 8.5, 5 m
m
(NH
4
) SO
4
and 25 m
m
,
Fig. 1 Hierarchical sampling of spores was performed bycolleting soil samples from four plots (10 m distance) along a 50 mtransect within each field. From each plot samples were collectedfrom four subplots (40 cm distance). The two differently managedfields were only separated by a dust road.

C L O N A L D I V E R S I T Y A N D P O P U L A T I O N S T R U C T U R E O F A M F
745
© 2005 Blackwell Publishing Ltd,
Molecular Ecology
, 14, 743–752
β
mercaptoethanol] and 6
µ
L of H
2
O. This was used astemplate in primary multiplex PCR with: 1
µ
L TQ-buffer,0.2
µ
L of each primer for primary amplification (Table 1),2
µ
L H
2
O, 8
µ
l GATC-mix and 0.1
µ
l
Taq
polymerease(Amersham, Bioscience) yielding a total volume of
c.
20
µ
L.PCR conditions for primary multiplex PCR were: initialdenaturation at 94
°
C for 2 min followed by 30 cycles ofdenaturation at 94
°
C for 1 min, annealing at 53
°
C for1 min, extension at 72
°
C for 1 min + 4 min for each cycle;the last cycle was followed by a final extension at 72
°
C for7 min (Kjøller & Rosendahl 2000).
Amplicons were diluted 50
×
and used as templates inthree separate nested PCRs with specific primer combina-tions for nested PCR (Table 1). Nested PCR was performedin a total volume of
c.
40
µ
l containing 4
µ
l TQ-buffer, 4
µ
lof each primer pair for either FOX (603f/868r), TOR (1071f/1444r) or LSU (RK4f/RK7mr), 10
µ
l H
2
O, 16
µ
l GATC-mixand 0.2
µ
l
Taq
polymerase. Amplification cycles for nestedPCR were identical for all primer combinations: initialdenaturation at 94
°
C for 2 min followed by 25 cycles ofdenaturation at 94
°
C for 1 min, annealing at 60
°
C for1 min, extension at 72
°
C for 1 min; the last cycle wasfollowed by a final extension at 72
°
C for 7 min (Kjøller &Rosendahl 2000). PCR products were visualized by elec-trophoresis on 2% Nuesieve agarose gels stained withethidium bromide.
Single strand conformation polymorphism, SSCP
SSCP electrophoresis was performed as described by Banke& Rosendahl (2000) in a discontinuous system with cooledtriple Wide Mini-vertical Gel System (33(w)
×
10(l) cm
×
0.75(t)(mm) (CBS Scientific). Gels were run at 4.5 W/gel for30 min followed by 9 W/gel for 90 min for FOX and TORamplicons. Running conditions for LSU amplicons were4.5 W/gel for 60 min followed by 9 W/gel for 120 min. Tem-perature was maintained constant during electrophoresisat 10
°
C. Bands were visualized by silver staining using aDNA Silver Staining Kit provided by Pharmacia Biotech.
Polymorphic loci were detected on SSCP gels and re-presentatives of alleles from each genotype analysed bysequencing. Purification of PCR products was performedwith the QIAquick PCR Purification Kit (QIAGEN). Sequen-cing was carried out by MWG-biotech. Primers used forsequencing were FOX603f, TOR1071f and RK4f.
Data analysis
Sequence analyses
Sequences were manually aligned using the program
bioedit
Sequence Alignment Editor (http://www.mbio.ncsu.edu/BioEdit/bioedit.html/bioedit.com). LSU sequences wereused to ensure the identity of the three
Glomus
speciesby alignment to known sequences from NCBI (NationalCenter for Biotechnology Information) GenBank (AF145735–AF145749) (Kjøller & Rosendahl 2000). Gene homologiesof FOX and TOR were confirmed by sequence alignmentwith
Glomus mosseae
BEG12 sequences also from NCBIGenBank, AJ243538 and AJ276633, respectively. Silverstained SSCP gels were photographed and band patternscompared between isolates to detect polymorphisms anddetermine allele frequencies.
Gene diversity and genotype determination
Gene diversity was assayed by determining the numberof alleles at each locus in each species. Each allele wasassigned a unique number. Thereby, a three-digit numericidentifying code could be formulated for each spore byjoining together the numbers identifying the alleles presentfor each locus. This numeric code represented the multilocusgenotype for each spore.
To assess the adequacy of sampled genotypes a Jaccardspecies area curves was constructed for each species usingthe P
cord
4 software (McCune & Mefford 1999). The totalnumber of expected genotypes was estimated by a jackknifeanalysis.
Table 1 Primers used in nested multiplex PCR for amplification of polymorphic loci from single spores of Glomus spp. In primary PCR alllisted primer pairs were used simultaneously for multiplex PCR. Nested primer pairs were used separately in nested PCR on dilutedmultiplex PCR products
Intron Primary PCR forward reverse Nested PCR forward reverse Sequencing primer
FOX641-838 603f * 1376r* 603f * 868r* 603f *cgatggacgcactgttattg catgaatgttggcctttgc ctttgccaccagctttgata
TOR1540-1619 1071f * 1638r * 1071f * 1444r* 1638r*gaaatggatgtgggcaagt gacaattaccccttgaaagagc gtttggtcggctggtgtatt
LSU rDNA 0061† NDL22† RK4f‡ RK7mr§agcatatcaataagcggagga tggtccgtgtttcaagacg gggaggtaaatttctcctaaggc atcgaagcyacattcctcc RK4f‡
*Stukenbrock & Rosendahl, 2004; †Van Tuinen et al. (1998); ‡Kjøller & Rosendahl (2000); §Rosendahl & Stukenbrock (2004).

746
E . H . S T U K E N B R O C K and S . R O S E N D A H L
© 2005 Blackwell Publishing Ltd,
Molecular Ecology
, 14, 743–752
Index of association
Reproductive modes of the
Glomus
populations weretested by estimating the index of association (MaynardSmith
et al
. 1993) using the software provided by A. Burt(http://www.bio.ic.ac.uk/evolve/software/multilocus/).Index of Association (
I
A
):
I
A
= 1
−
V
0
/
V
E
(eqn 1)
tests for association among loci by calculating the varianceof similarities for all pairwise combinations of multilocusgenotypes. Where
V
0
is the observed variance and
V
E
theexpected variance, and
I
A
then becomes a rescaled variance.The
IA is zero if all alleles are unlinked indicating freerecombination in the population. The observed data setwas used to generate a scrambled data set as expected froma recombining population by resampling all alleles in eachlocus. The IA of the observed data was compared to thedistribution of IA for 1000 resampled data sets.
Population structure
The amount of genetic diversity in each field was estimatedby the Simpsons index corrected for finite samples, D (Peet1974):
D = 1 − ∑ ni (ni − 1)/N(N − 1) (eqn 2)
where ni is the number of samples within the genotype iand N is the total number of samples within the population.The index is ranging from zero in clonal populations with
only one genotype to one in populations where all sampleshave different genotypes.
Genetic variation in each population was estimatedusing measures of gene diversity (Nei 1973). Total genediversity (HT) was calculated for G. mosseae, Glomus caledo-nium and Glomus geosporum populations from both fields.HT can be decomposed into:
HT = HC + HCS + HST (eqn 3)
where HC is the average genotype diversity within plots,DCS is the average genotype diversity between plots andDST is the average genotype diversity between the con-ventionally and the organically cultured field. Averagegene diversity measures were used to estimate subdivisionof populations. The proportions of diversity attributable topopulation subdivision are GCS = DCS/HT for differences be-tween plots and GST = DST/HT for differences between fields.Analyses were performed by the program popgene32 (http://www.ualberta.ca/∼fyeh/popgene.pdf). Subplots from eachplot were pooled for the hierarchical gene diversity analysisas a result of the uneven spore extractions from subplots.
Results
Amplification of multiple markers
LSU, FOX and TOR loci were successfully amplified bynested multiplex PCR from spores of Glomus mosseae, Glomuscaledonium and Glomus geosporum and analysed by SSCPand sequencing (Fig. 2). SSCP band patterns of LSU rDNA
Fig. 2 Linked alleles of FOX and TOR atSSCP gels. Five allele types from Glomusmosseae (m2, m3 and m4) and Glomuscaledonium (c2 and c1) are shown. Numbersin the bottoms of each lane refers to thespore numbers. M: 100 bp DNA marker.

C L O N A L D I V E R S I T Y A N D P O P U L A T I O N S T R U C T U R E O F A M F 747
© 2005 Blackwell Publishing Ltd, Molecular Ecology, 14, 743–752
amplicons from G. caledonium showed in most cases morethan one band pattern. The presence of several bands fromeach spore suggests that several LSU rDNA sequenceswere amplified from each spore by nested multiplex PCR.An important observation was that the banding patternswere always linked, resulting in specific combination ofsequence types, which made it possible to assign each bandcombination to a specific genotype. The gene diversity ofLSU, FOX and TOR was similar for the three loci and
between the three fungal species (Fig. 3). Gene diversitywas highest in the G. mosseae and G. caledonium populationswhere seven alleles of each locus were assayed. Five allelesof each locus were assayed from G. geosporum.
Genotypes
Numeric codes of alleles were used for genotype char-acterization of each spore. Distinct genotypes of seven G.mosseae, seven G. caledonium and five G. geosporum sporeswere identified among all spores collected from thetwo fields (Table 2). Accession nos (AY835847–AY835885)for allele sequences in each locus are listed in Table 3. Severalgenotypes were present in both the conventional and theorganic field (Fig. 4). More unique genotypes of G. mosseaewere sampled from the organic field, while genotypediversity of G. caledonium was higher in the conventionalfield. The most abundant genotypes were dominant inboth fields.
Species-area curves of the sampled genotypes showedthat a substantial fraction of the total diversity was coveredby the sampling (Fig. 5). According to a Jaccard species-area curve, the total number of G. caledonium genotypes
Fig. 3 Gene diversity of LSU, FOX and TOR from Glomus mosseae,Glomus caledonium and Glomus geosporum populations determinedas the number of distinct alleles of each locus.
Table 2 Number of spores and distinct genotypes assayed from (a) Glomus mosseae (b) Glomus caledonium and (c) Glomus geosporum, andthe frequency of spore genotypes from the conventional (C) and the organic (O) field from all plots (C1–C4 and O1–O4)
No. of spores No. of genotypes 1 2 3 4 5 6 7
(a)C1 5 2 0.6 0.4C2 11 1 1.0C3 2 1 1.0C4 9 1 1.0O1 1 1 1.0O2 8 2 0.125 0.875O3 12 4 0.083 0.33 0.5 0.083O4 11 5 0.2 0.3 0.2 0.1 0.2
(b)C1 8 3 0.375 0.375 0.25C2 17 4 0.12 0.06 0.71 0.12C3 21 4 0.05 0.33 0.1 0.52C4 14 5 0.07 0.07 0.29 0.5 0.07O1 12 2 0.42 0.58O2 1 1 1.0O3 2 1 1.0O4 1 1 1.0
(c)C1 3 2 0.67 0.33C2 0 0C3 9 3 0.33 0.33 0.33C4 1 1 1.0O1 2 1 1.0O2 0 0O3 2 1 1.0O4 8 3 0.125 0.75 0.125

748 E . H . S T U K E N B R O C K and S . R O S E N D A H L
© 2005 Blackwell Publishing Ltd, Molecular Ecology, 14, 743–752
was recovered from sampling in the two fields, and forG. mosseae and G. geosporum, species-area curves wereapproaching saturation. Total genotype diversity of G. mosseaeestimated by a first order jackknife analysis was accountedfor by 9.8 genotypes of which seven were recovered in thisstudy. Total G. geosporum genotype diversity was estimatedto be 6.8, of which five were recovered.
Reproductive mode
Linkage between LSU, FOX and TOR loci was analysedby index of association. Strong linkage between the threeloci suggested a clonal structure of G. mosseae (IA = 1.9346,P < 0001) and G. caledonium (IA = 1.9434, P < 0001) (Fig. 6).This was confirmed by the composition of only uniquealleles in each genotype, and was also illustrated on theSSCP gels were band patterns of different loci were alwaysfound in specific combinations (Fig. 2).
Genetic structure
The magnitude of clonal diversity (D) was similar betweenthe three species (Table 4). No difference in diversitybetween the organic and the conventional field was seen,although the estimated diversity of G. mosseae was lower inthe conventional field. However, these estimates may bebiased by inefficient sampling of the species (Fig. 5).
Total gene diversity (HT) was also similar for the threespecies and reflected the estimated clonal diversities(Table 4). Analysis of the gene diversity suggested a sub-division between plots in each field as 49% to 56% of totalgene diversity was explained by subdivision between plots(GCS). Subdivision of the Glomus spp. populations betweenfields estimated as the proportion of the total gene diversity
Fig. 4 Distribution of genotypes shown as frequencies of (a)Glomus mosseae (b) Glomus caledonium and (c) Glomus geosporumbetween the conventionally and the organically cultured field. Fig. 5 Relationship between the amount of genotype diversity
and the number of spores sampled from the field of (a) Glomusmosseae (b) Glomus caledonium and (c) Glomus geosporum. The totalnumber of spores of each species from both fields was included inthe analysis.

C L O N A L D I V E R S I T Y A N D P O P U L A T I O N S T R U C T U R E O F A M F 749
© 2005 Blackwell Publishing Ltd, Molecular Ecology, 14, 743–752
attributable to variation between the conventional and theorganic field (GST) was clearly lower as only 2% and 7% ofthe total gene diversity of G. caledonium and G. mosseae,respectively, could be explained by subdivision betweenthe two fields (Table 4). The estimated GST and GCS valuesfor G. geosporum were similar to estimates from G. mosseaeand G. caledonium, but more uncertain because of the lownumber of sampled genotypes.
LSU alleles FOX alleles TOR alleles
Allele Accession no. Allele Accession no. Allele Accession no.
G. mosseaeGenotype 1 1 SSCP 1 AY835870 1 SSCPGenotype 2 2 AY835848 2 SSCP 2 SSCPGenotype 3 3 AY835847 3 AY835885 3 SSCPGenotype 4 4 AY835849 4 SSCP 4 AY835881Genotype 5 5 AY835850 5 SSCP 5 SSCPGenotype 6 6 AY835851 6 AY835871 6 SSCPGenotype 7 7 AY835852 7 SSCP 7 SSCP
G. caledoniumGenotype 1 1 AY835853 1 AY835865 1 SSCPGenotype 2 2 AY835854 2 AY835866 2 SSCPGenotype 3 3 AY835855 3 SSCP 3 SSCPGenotype 4 4 AY835856 4 AY835867 4 AY835883Genotype 5 5 AY835857 5 AY835868 5 AY835882Genotype 6 6 AY835858 6 SSCP 6 SSCPGenotype 7 7 AY835859 7 AY835869 7 SSCP
G. geosporumGenotype 1 1 AY835860 1 SSCP 1 SSCPGenotype 2 2 AY835861 2 AY835872 2 SSCPGenotype 3 3 AY835862 3 AY835873 3 SSCPGenotype 4 4 AY835863 4 AY835874 4 AY835884Genotype 5 5 AY835864 5 SSCP 5 SSCP
Table 3 Accession numbers (NCBI GenBank)of sequences from alleles in the three locifrom Glomus mosseae, Glomus caledonium andGlomus geosporum. The genotypes refer to thegenotypes listed in Table 2 and Fig. 4. SSCP:No accession number is given as the allelewas determined by SSCP
Table 4 Parameters for analysis of population genetic structure ofGlomus mosseae, Glomus caledonium and Glomus geosporum in theconventional (Con.) and the organic (Org.) field
Species Field D* HT† GST‡ GCS§
G. mosseae Con. 0.31 0.62 0.07 0.52Org. 0.72
G. caledonium Con. 0.76 0.75 0.02 0.49Org. 0.68
G. geosporum Con. 0.81 0.70 0.16 0.56Org. 0.56
D, clonal diversity, HT: total gene diversity; GST, the proportion of total gene diversity attributable to subdivision between fields; GCS, the proportion of total gene diversity attributable to subdivision between plots in each field.*D = 1− ∑ ni (ni − 1)/N (N − 1); †HT = HC + DCS + DST; ‡GST = DST/HT; §GCS = DCS/HT
Fig. 6 Observed index of association (arrow) compared to indicesof association computed from 1000 artificially recombined datasets (randomized test) for (a); G. mosseae and (b); G. caledonium.
750 E . H . S T U K E N B R O C K and S . R O S E N D A H L
© 2005 Blackwell Publishing Ltd, Molecular Ecology, 14, 743–752
Discussion
Here we demonstrate the use of three codominant geneticmarkers based on intron polymorphisms for populationgenetic studies of AM fungi. This allowed us to estimateclonal diversity and to analyse the genetic structure of AMfungal populations from differently managed agriculturalsystems.
The clonal diversity estimated in the present study is lowerthan reported by other authors. Previous studies have useddominant markers to demonstrate high levels of geneticdiversity in AM fungal populations (Vandenkoornhuyseet al. 2001). However, much information may be lost fromdominant markers where only one allele can be visualizedat each locus. Additionally, homology of the markerscannot be ensured without sequencing (Koch et al. 2004),and the observed variation between spores may actuallybe caused by variation between nonhomologous loci.This may also be the case when using ribosomal DNAsequences as genetic markers in population studies of AMfungi (Pringle et al. 2000). The presence of variable rDNAsequences within single spores has been demonstrated(Sanders et al. 1995), but the origin of this variation has notbeen proved yet. The presence of several bands on theSSCP gels of nested multiplex PCR products from Glomuscaledonium also suggested that more rDNA sequences typeswere amplified from each spore. We found, however, alwaysspecific band combinations representing spores of the samegenotype. This suggests that variable rDNA sequencesare linked. In a recent study of LSU rDNA diversity, itwas suggested by Rosendahl and Stukenbrock (2004) thatintrasporal variation of rDNA sequences was derived fromvariable repeats within each nucleus, and not as previouslysuggested, from different nuclei (Kuhn et al. 2001). In thecase of heterokaryotic spores, it is unlikely that we wouldobserve linked LSU rDNA band patterns as this wouldrequire an always identical distribution of a set of differentnuclei into every progeny spores. Instead, our results sup-port the observation of Rosendahl and Stukenbrock (2004)that intrasporal variation of LSU rDNA sequences is derivedfrom different repeats within each nucleus. Repeated sequ-ences may not solely be appropriate to determine geneticdiversity within AM fungal populations as sequencevariation within individuals may exceed variation withinpopulations (Pringle et al. 2000; Rosendahl & Stukenbrock2004).
Estimates of gene diversity within the conventionallyand the organically cultured field were similar and wefound no evidence of population subdivision between thetwo fields. This suggests that the Glomus spp. populationsare not influenced by the different management practisescarried out in the fields. Conventionally and organicallycultured replicate fields should however, be included insubsequent studies in order to confirm our results. Although
tillage has been shown to alter AM fungal communities(Jasper et al. 1991), to our knowledge, no other studies havetried to determine the effect of conventional managementpractices on mycorrhizal populations. Koch et al. (2004)compared populations of in vitro propagated Glomus intra-radices from tillage/no tillage systems, but found no variationin population genetic structure between the two differentsystems.
High GCS values estimated by the hierarchical genediversity analysis suggested a subdivision of the popula-tions within each field rather than between the two fields.Spatial distribution has been demonstrated in populationsof other soil-borne fungi. Gordon et al. (1992) comparedgenetic diversity of Fusarium oxysporum populations in anative and an agricultural field by hierarchical samplingand gene diversity analysis. Although overall gene diver-sity in the two fields was similar, the distribution ofF. oxysporum genotypes differed between the two fields. Thefinding of spatial structuring in the native soil was usedto suggest limited dispersal and clonal propagation ofF. oxysporum. Rosendahl & Stukenbrock (2004) found asimilar spatial structuring of a nonsporulating dominantAM fungus growing in undisturbed natural vegetationdominated by perennial plants. Spatial distribution of AMfungal populations may be the result of selection for differ-ent genotypes in a heterogeneous soil environment whichwould create a subdivision of glomalean clones. Anotherpossibility is that the high genetic diversity between plotsis a consequence of limited spore dispersal, hyphal pro-pagation and the formation of anastomosis between myceliaof the same genotype. AM fungi may form large mycelialnetworks by the interconnection of extraradical hyphaebetween individuals (Grime et al. 1987; Giovannetti et al.2004). The ability to form anastomosis with an alreadyestablished mycelia network may provide an importantadvantage for an AM fungus for its successful integrityand function ( Jakobsen 2004). So far, the genetic distancebetween fungal individuals required to prevent anastomosisis not known (Jakobsen 2004). If anastomosis is onlyformed between mycelia of the same or very similar geno-type, then individuals related to the dominant mycelialnetwork will be favoured while the establishment of genet-ically different individuals is restricted. The consequenceof this scenario would be an uneven distribution of geno-types between plots as observed here.
Strong linkage among the alleles was demonstrated inGlomus spp. populations in both fields by the Index ofAssociation analysis which is in concordance with previousresults based on multiple AFLP markers from G. mosseaeand G. caledonium (Rosendahl & Taylor 1997). Contrary,Vandenkoornhuyse et al. (2001) found indications of recom-bination in native Glomus species from polluted soils usingISSR markers to analyse the reproductive mode by indexof association. However, as homology cannot be ensured
C L O N A L D I V E R S I T Y A N D P O P U L A T I O N S T R U C T U R E O F A M F 751
© 2005 Blackwell Publishing Ltd, Molecular Ecology, 14, 743–752
from ISSR markers, it is possible that nonhomologousloci are compared and interpreted as linkage equilibrium.Although we did not find any indication of heterokaryosis,rare recombinant events may still take place between AMfungal genomes after anastomosis between geneticallydifferent mycelia (Giovannetti et al. 1999); however, moreinformation about the nuclear processes following anasto-mosis events are needed to confirm this hypothesis.
Although the present study is not conclusive regardingthe effects of conventional and organic management, itdemonstrates the use of multilocus genotyping to answerquestions at the population level of AM fungi. In this studyit is possible that the lack of differences between the gloma-lean populations from the two field sites cover a variationin functional adaptability of identical genotypes. Thiswould lead to differences only at an epigenetic level, e.g.by regulation of gene expression. The lack of divergencecould also be the result of the relatively small time framefor divergence to have occurred. The time needed for popu-lation divergence of AM fungi under different selectionpressures may be much more than 20 years. Little is knownabout the time scale for divergence of fungal populations;however, genealogical and coalescence methods have beendeveloped to determine the age of genetic changes. Thiswas demonstrated by Fisher et al. (2001) who used micro-satellite data and coalescence methods to estimate timeof introduction and expansion of the pathogenic fungiCoccidiodes immitis in relation to human migration intoSouth America. Future studies of AM fungi should applysuch methods to characterize divergence patterns of popu-lations and species.
Acknowledgements
This work was supported by a grant from the Danish NaturalScience Research Council (SNF), Grant nr. 51-00-0373. EHS wassupported by Docent Scient. Dr Lauritz Olsons Fond. We thankRasmus Kjøller and Jim Anderson for helpful comments on themanuscripts.
References
Banke S, Rosendahl S (2000) Development of genetic markers forpopulation studies of Penicillium spp. In: Integration of ModernTaxonomic Methods for Penicillium and Aspergillus Classification.(eds Samson RA, Pitt JI), pp. 199–208. Harwood AcademicPublishers, Amsterdam.
Chen RS, McDonald BA (1996) Sexual reproduction plays a majorrole in the genetic structure of populations of the fungusMycospharella graminicola. Genetics, 142, 1119–1127.
Fisher M, Koenig GL, White TJ et al. (2001) Biogeographic rangeexpansion into South America by Coccidiodes immitis mirrors NewWorld patterns of human migration. Proceedings of the NationalAcademy of Sciences of the United States of America, 98, 4558–4562.
Giovannetti M, Azzolini D, Citernesi AS (1999) Anastomosis for-mation and nuclear and protoplasmic exchange in arbuscular
mycorrhizal fungi. Applied Environmental Microbiology, 5, 5571–5575.
Giovannetti M, Sbrana C, Strani P (2004) Patterns of below groundplant interconnections established by means of arbuscular myc-orrhizal networks. New Phytologist, 164, 175–181.
Gordon TR, Okamoto D, Milgroom MG (1992) The structure andinterrelationship of fungal populations in native and cultivatedsoils. Molecular Ecology, 1, 241–249.
Grime JP, Mackey JML, Hillier SH, Read DJ (1987) Floristic diver-sity in a model system using experimental microcosms. Nature,328, 420–422.
Hauggaard-Nielsen H, de Neergaard A, Jensen LS, Høgh-Jensen H,Magid J (1998) A field study of nitrogen dynamics and springbarely growth as affected by the quality of incorporated residuesfrom white clover and ryegrass. Plant and Soil, 203, 91–101.
Helgason T, Merryweather JW, Denison J, Wilson P, Young JPW,Fitter A (2002) Selectivity and functional diversity in arbuscularmycorrhizas of co-occurring fungi and plants from a temperatedeciduous woodland. Journal of Ecology, 90, 371–384.
Jasper DA, Abbott LK, Robson AD (1991) The effect of soil dis-turbance on vesicular arbuscular mycorrhizal fungi in soils fromdifferent vegetation types. New Phytologist, 118, 471–476.
Keen NT (1990) Gene-for-gene complementary in plant pathogeninteractions. Annual Review of Genetics, 24, 447–463.
Keller SM, Wolfe MS, McDermott JM, McDonald BA (1997) Highgenetic similarity among populations of Phaeosphaeria nodorumacross wheat cultivars and regions in Switzerland. Phytopathology,87, 1134–1139.
Kjøller R, Rosendahl S (2000) Detection of arbuscular mycorrhizalfungi (Glomales) in roots by nested PCR (polymerase chainreaction) and SSCP (single stranded conformation polymorph-ism). Plant and Soil, 226, 189–196.
Koch AM, Kuhn G, Fontanillas P, Fumagalli L, Goudet J, Sanders IR(2004) High genetic variability and low local diversity inarbuscular mycorrhizal fungal population. Proceedings of theNational Academy of Sciences of the United States of America, 101,2369–2374.
Kohli Y, Brunner LJ, Yoell H et al. (1995) Clonal dispersal andspatial mixing in populations of the plant pathogenic fungusSchlerotinia schlerotium. Phytopathology, 81, 480–485.
Kuhn G, Hijri M, Sanders IR (2001) Evidence for the evolution ofmultiple genomes in arbuscular mycorrhizal fungi. Nature, vol414, pp. 745–748.
Maynard Smith J, Smith NH, O’Rourke M, Spratt BG (1993) Howclonal are bacteria? Proceedings of the National Academy of Sciencesof the United States of America, 90, 4384–4388.
McCune B, Mefford MJ (1999) PC-ORD: Multivariate Analysis of Ecolo-gical Data, version 4.0. MjM Software Design, Gleneden Beach,Oregon.
Martens, JW, McKenzie Green GJ (1970) Gene-for-gene relation-ships in the Avena puccinia graminis host–parasite system inCanada. Canadian Journal of Botany, 48, 969–975.
Milgroom MG, Lipari SE (1995) Spatial analysis of nuclear andmitochondrial RFLP genotypes in populations of the chestnutblight fungus, Cryphonectria parasitica. Molecular Ecology, 4, 633–642.
Nei M (1973) Analysis of gene diversity in subdivided popula-tions. Proceedings of the National Academy of Sciences of the UnitedStates of America, 70, 3321–3323.
Peet R (1974) The measurement of species diversity. Annual Reviewof Ecology and Systematics, 5, 285–307.

752 E . H . S T U K E N B R O C K and S . R O S E N D A H L
© 2005 Blackwell Publishing Ltd, Molecular Ecology, 14, 743–752
Pringle A, Moncalvo JM, Vilgalys R (2000) High levels of variationin ribosomal DNA sequences within and among spores of anatural population of the arbuscular mycorrhizal fungusAcaulospora colossica. Mycologia, 92, 259–268.
Rosendahl S, Stukenbrock E (2004) Community structure of arbuscularmycorrhizal fungi in undisturbed vegetation revealed by analysesof LSU rDNA sequences. Molecular Ecology, 13, 3179–3186.
Rosendahl S, Taylor JW (1997) Development of multiple geneticmarkers for studies of genetic variation in arbuscular mycor-rhizal fungi using AFLP. Molecular Ecology, 6, 821–829.
Sanders IR, Alt M, Groppe K, Boller T, Wiemken A (1995) Identi-fication of ribosomal DNA polymorphism among and withinspores of the Glomales — application to studies in the geneticdiversity of arbuscular mycorrhizal fungal communities. NewPhytologist, 130, 419–427.
Schüssler A, Gehrig H, Schwarzott D, Walker C (2001) Analysisof partial Glomales SSU rRNA genes: implications for primerdesign and phylogeny. Mycological Research, 105, 5–15.
Stukenbrock EH, Rosendahl S (2004) Development and amplifica-tion of multiple codominant genetic markers from single sporesof arbuscular mycorrhizal fungi by nested multiplex PCR.Fungal Genetics and Biology, in press.
Taylor JW, Fisher MC (2003) Fungal multilocus sequence typing —
it’s not just for bacteria. Current Opinion in Microbiology, 6 (4),351–356.
Van der Heijden MGA, Klironomos JN, Ursic M et al. (1998)Mycorrhizal fungal diversity determines plant biodiversity,ecosystem variability and productivity. Nature, 396, 69–72.
Van Tuinen D, Zhao B, Gianinazzi-Pearson V (1998) PCR in studiesof AM fungi: from primers to application. In Mycorrhiza Manual(ed. Varma A), pp. 387–400. Springer Verlag, Berlin Heidelberg.
Vandenkoornhuyse P, Leyval C, Bonnin I (2001) High geneticdiversity in arbuscular mycorrhizal fungi: evidence for recom-bination events. Heredity, 87, 243–253.
Walker C, Mize CW, McNabb HS (1982) Populations of endo-gonaceous fungi at two locations in central Iowa. Canadian Journalof Botany, 60, 2518–2529.
This work was part of the master thesis of Eva H. Stukenbrock.EHS is currently doing a PhD in population genetics of fungalpathogens in the lab of Prof Bruce McDonald at the ETH, Zurich.Søren Rosendahl is professor in mycology and is interested in popu-lation genetics and community structure of arbuscular mycorrhizalfungi and other symbiotic fungi.