cle-tv"ky - world bank documents
TRANSCRIPT

Document of nThe World Bank O Cle-Tv"kY
FOR OFFICIAL USE ONLY
Report No. 2155b-AR
STAFF APPRAISAL REPORT
SECOND RAILWAY PROJECT
ARGENTINA
March 14, 1979
Projects DepartmentLatin America and the Caribbean Regional Office
This document has a restricted distribution and may be used by recipients only in the performance oftheir official duties. Its contents may not otherwise be disclosed without World Bank aythorization.
Pub
lic D
iscl
osur
e A
utho
rized
Pub
lic D
iscl
osur
e A
utho
rized
Pub
lic D
iscl
osur
e A
utho
rized
Pub
lic D
iscl
osur
e A
utho
rized
Pub
lic D
iscl
osur
e A
utho
rized
Pub
lic D
iscl
osur
e A
utho
rized
Pub
lic D
iscl
osur
e A
utho
rized
Pub
lic D
iscl
osur
e A
utho
rized

Currency Equivalents
I Argentine Peso ($a) = US$ .0025US$1.00 = $a 400
$a I million = US$2,500
Fiscal Year
January 1 to December 31
Units of Weight and Measures: Metric
I kilometer (km) = 0.62 mile (mi)
1 meter (m) = 3.28 feet (ft)
1 kilogram (kg) = 2.20 pounds (lb)1 ton = 2,205 pounds
Abbreviations
AGP Administracion General de PuertosDNCPVN Direccion Nacional de Construcciones Portuarias y Vias NavegablesELMA Empresa Lineas Maritimas ArgentinasFA Ferrocarriles Argentinos (Argentine Railways)FF Flota Fluvial del Estado ArgentinoFONIT Fondo Nacional de Infraestructura del TransporteJNG Junta Nacional de GranosNTP National Transport PlanSEIM Secretaria de Estado de Intereses MaritimosSST Subsecretaria de TransporteSTPO Sectoral Transport Planning OfficeVN Vialidad NacionalYPF Yacimientos Petroliferos Fiscales

FOR OFFICIAL USE ONLY
ARGENTINA
STAFF APPRAISAL REPORT
SECOND RAILWAY PROJECT
TABLE OF CONTENTS
Page No.
I. THE TRANSPORT SECTOR .................................. 1
A. General .......................................... 1B. Railways ......................................... 2C. Roads ............... **.... *....................... 2
D. Ports ............................................ 3
E. Inland Waterways . ........................ .. ...... 3
F. Sea Transport .... ... . ............................ 4
G. Air Transport .......................... 4R. Pipelines ........................................ 4I. Urban Transport in Buenos Aires .................. 5J. Planning and Coordination ..... ................... 6
II. THE RAILWAY SUBSECTOR ................................. 6
A. Background ..............-. 6B. Redimensioning . .............. .O..-. . . . ................. . 7
C. FA Organization ....................................... 9D. Management, Staff and Training ................. .. 10E. Railway Facilities ............................... 11F. Traffic .............. ......................................... 14G. Intermodal Freight Competition ................... 18H. Operations ....... ................................ 21I. Commercial Department ............... ....... .. 21
J. Tariff and Costs ...... ........................... 22
K. Budgets, Accounting and Audit ................. ... 23
III. THE INVESTMENT PLAN AND THE PROJECT ................... 25
A. FA's Investment Plan (1979-1983) ................ . 25B. The Project and the Proposed Loar ....... .. ....... 26C. Main Project Items ..... .......................... 27D. Cost Estimates ...... ........................... 28
E. Financing Plan .. . ............ 29
F. Project Implementation ..... ...................... 30G. Plan of Action ................................... 30
H. Procurement ........ ............................... 32I. Disbursements ....... ............................. 32
This report is based on the findings of an appraisal mission which visitedArgentina in January-February 1978 and a followup mission in May 1978.The mission comprised Messrs. M. Lal and E. Karman, Deputy Division Chief(railway engineers), H. Jones (financial analyst), M. Staab (transporteconomist), and J. Kesson (consultant). The report has been edited byMiss V. Foster.
This document has a restricted distribution and may be used by recipients only in the performanceof their official duties. Its contents may not otherwise be disclosed without World Bank authorization.

(ii)TABLE OF CONTENTS (Continued)
Page No.
IV. ECONOMIC EVALUATION ...... ............................. 33
A. General Methodology .............................. 33B. Economic Benefits and Costs ...................... 33C. Economic Rates of Return ......................... 34D. Sensitivity Analysis and Risks .... ............... 34
V. FINANCIAL EVALUATION .................................. 35
A. General .......................................... 35B. Past Financial Performance ....................... 36C. Forecast Financial Performance .... ............... 39D. Pricing and Subsidy Policies ..................... 44E. Sensitivity Analysis ............................. 45
-F. Conclusion ....................................... 47
VI. AGREEMENTS REACHED AND RECOMMENDATION ........... ..... 47
TABLES
1.1 - Modal Composition of Traffic .492.1 - Route and Track Data .502.2 - Motive Power and Rolling Stock. 51
2.3 - Steam Locomotive Scrapping Program .522.4 - Diesel Locomotive Requirements .532.5 - Age of Freight Wagons 542.6 - Freight Wagon Scrapping Program 552.7 - Freight Traffic Statistics (2 pages) .56-572.8 - Freight Traffic Forecasts (2 pages) .58-59
2.9 - Forecasts of National Production of CommoditiesUsed to Forecast Freight Traffic .60
2.10 - Intercity Passenger Traffic .612.11 - Suburban Passenger Traffic .622.12 - Summary of Operating Statistics .632.13 - 1977 Operating Statistics by Gauge .643.1 - Investment Plan (1979-1983) .653.2 - Investment Plan and Project (2 pages) .66-673.3 - Project and Bank Loan .683.4 - List of Goods for Bank Financing .............. - 693.5 - Project Implementation Schedule .703.6 - Procurement Schedule .713.7 - Estimated Schedule of Disbursements .724.1 - Economic Evaluation (5 pages) .73-774.2 - Economic Rates of Return ......................... 78

TABLE OF CONTENTS (Continued) (iii)
Page No.
TABLES (Continued)
5.1 - Summary Cash Flow Statements - 1974-1977 ............ 795.2 - Income and Expense Statements -
Actual 1974 to 1977 (pesos) ............... ....... 805.3 - Income and Expense Statements - Actual 1974 to 1977,
Forecast 1978 to 1983 (US$ equivalent) .... 815.4 - 1976 Revenues and Costs by Service ........... 825.5 - Balance Sheets as of December 31, 1971 to 1977 ...... 835.6 - Balance Sheets as of December 31, 1973 to 1976,
1977 Estimated and 1978 to 1982 Forecast .......... 845.7 - Analysis of Operating Results by Gauge 1979-1982..... 855.8 - Forecast 1980 Operating Results by Railway Service .. 865.9 - Forecast Cash Flow 1978-1982 ............ 87
ANNEXES
1 Technical Assistance and Studies ....... . .................. 882. Selected Documents and Data Available in the Project File. 91
CHARTS
1. Organization of FA2. Organization of Component Railways of FA
MAPS
IBRD 13699 - Argentina - Argentine RailwaysIBRD 13700 - Argentina - Argentine Railways
Buenos Aires Metropolitan Area

I. THE TRANSPORT SECTOR
A. General
1.01 Argentina is characterized by a very high degree of population andeconomic concentration in and around Buenos Aires and by a high level ofspecialization of production among its various geographical regions. About70% of the country's 26 million inhabitants live within a 600-km radius ofBuenos Aires; this region also generates almost 85% of the country's GNP. Thetransport system reflects this spatial pattern of development. The bulk offreight generated by the economy consists of agricultural products and otherraw materials moving from the interior to the lower Parana River and theAtlantic coast around Buenos Aires, 1/ and of machinery and other productioninputs, vehicles and manufactured consumer goods moving in the oppositedirection. With its population of about 10 million, a port handling more thanone-quarter of total port traffic and its role as administrative, industrial,financial and commercial center of the country, metropolitan Buenos Aires isthe focal point for transport in Argentina. The La Plata-Buenos Aires-Rosario-Santa Fe-Cordoba corridor generates the main intercity passenger trafficdemands. Trade among the country's various specialized regions continues toincrease, but is comparatively less important. A Government estimate of themodal composition of traffic for 1976 is summarized below:
WaterTotal Road Transport Pipelines Rail Air
(billions) (%) (%) (%) (%) (%)
Ton-km 102.2 42 35 12 11 -
Inter-citypass-km 64.1 86 - - 10 4
1.02 Traffic decreases were experienced by almost all modes of transportduring the early 1970s, including roads (between 1973 and 1975), railways,coastal shipping and ports, generally reflecting the effects of changes inthe international oil market and the overall condition of the Argentineeconomy during this period. River transport remained relatively constant,pipeline traffic (oil and gas) continued to increase (5.3% per annum) anddomestic air traffic grew substantially (12% per annum). Traffic is nowincreasing in all modes (Table 1.1).
1/ Livestock and grains from the provinces of Buenos Aires, Cordoba, EntreRios, La Pampa and Santa Fe; wine and edible oil from the region ofMendoza, San Juan and San Luis; mutton and wool from the region ofPatagonia; tea from the province of Misiones; cotton from the Chacoregion; sugar from the region of Tucuman and Salta; zinc, lead, sulphurand manganese from the Northwest; and petroleum from the Northwest,Central West and South.

- 2 -
1.03 The distribution of investment among the modes has remained rela-
tively constant in the last few years with roads acounting for about 56%,railways 16%, ports 11%, aviation 9%, water transport 7%, and subways 1%.
Total investment in the transport sector has accounted for about 20% of totalpublic investment and for some 3% of GNP. These are rough approximations, butthey do suggest that the claims of the transport sector on national resources
have been quite substantial in the last several years. Furthermore, not onlyhave such expenditures accounted for a large proportion of total publicinvestment, but ithey have not always been used to the best advantage. The
National Transport Plan, now under preparation (para 1.18), is expected toimprove coordinal:ion within and among the modes and thereby lead to a moreefficient use of resources.
B. Railways
1.04 The ra:ilway subsector is reviewed in detail in Chapter II.
C. Roads
1.05 The road network expanded very rapidly in the 1960s and early 1970swith the construction of modern, limited-access multi-lane facilities at theentrances to the main urban centers and along a few of the most heavilytraveled routes. In 1976, Argentina had a system of about one million km ofroads (national and provincial), of which about 50% of the national networkand 2% of the provincial network were paved, totaling about 42,000 km. Exceptfor some peripheral areas, the present road system is generally adequate,although there are mounting requirements for rehabilitation and strengtheningof existing roads. The numerous interruptions of the road network and thelack of lateral links which earlier hampered coinmunications and transportbetween urban centers have been largely corrected in recent years by theexpansion of the primary and secondary networks,
1.06 The road vehicle fleet increased from 1.0 million vehicles in 1961
to 3.4 million vehicles in 1976, an average annual growth of 8%. The vehicle-population ratio of about one vehicle per eight inhabitants, approximately thelevel of motorization of Southern Europe, corresponds to the country's rela-tively high per capita income (US$1,550 in 1976) and advanced developmentof the automobile industry. The geographical distribution of the vehiclefleet is similar to the distribution of economic activity: 60% of the fleetis registered in the Federal Capital and Buenos Aires Province and another 25%in the provinces of Santa Fe, Cordoba, Corrientes and Mendoza. The actualsupply of trucking services has increased faster than the vehicle numberswould indicate because of a shift to larger size trucks. Truck transport isused for long ancl short hauls and for practically all commodities. Freightrates are low because of the generally flat terrain allowing the use of heavy
truck trailers with a low power-to-weight ratio. Trucking rates are notregulated by the Government. The average age of the trucking fleet has beenestimated by the Government at slightly over seven years. Both urban andinter-urban bus services, which are provided by private companies, areregulated. In general, these services are quite adequate.

-3-
D. Ports
1.07 Argentina's ports can be classified into three geographic zones:
(a) the Atlantic, whose main ports are Bahia Blanca, ComodoroRivadavia and Quequen;
(b) the Plata River, whose main ports are Buenos Aires and La Plata;and
(c) the Parana River, whose main ports are San Nicolas, Campana,Rosario, San Lorenzo and Santa Fe.
These ten ports handled about 76% of the total traffic in 1976 (78.6 milliontons), with Buenos Aires accounting for the largest share (27%). Most of theriver ports are affected by silting and require costly maintenance dredging.The main ports are somewhat specialized, handling general cargo (BuenosAires), mineral and petroleum products (Comodoro Rivadavia, La Plata, SanNicolas, San Lorenzo and Santa Fe), and grain products (Bahia Blanca, Quequen,Rosario, Santa Fe). Roughly 60% of the total tonnage handled in ports isdomestic waterborne bulk traffic--essentially petroleum products, gravel andsand. A serious problem is the cumbersome and inefficient way in which theports are managed, basically resulting from too many organizations havingcontrol of the several port operations without proper coordination. Forexample, while port management is entrusted to the Administracion General dePuertos (AGP), an autonomous enterprise under the Secretaria de Estado deIntereses Maritimos (SEIM), all dredging and marine construction are theresponsibility of another department under SEIM, the Direccion Nacional deConstrucciones Portuarias y Vias Navegables (DNCPVN). The construction orexpansion of buildings and warehouses is the responsibility of the Direccionde Arquitectura under the Secretaria de Obras Publicas y Transporte. Inaddition, in all major ports handling grains, there is an area reserved forthe Junta Nacional de Granos (JNG), under the Secretaria de Estado de Agri-cultura. JNG owns and operates all grain silos, operates and unloads trainswithin its territory and controls the arrival and departure of-ships to thegrain berths. Also, private stevedoring companies control and direct theloading and unloading gangs, and, in some ports, private shipping companies, byvirtue of their long standing rental contracts, operate sheds and warehouses.The lack of coordination with respect to all these different organizations isprobably the single most serious bottleneck in the port subsector today. Astudy of operations and management as well as physical facility requirementsat Bahia Blanca, Rosario, San Nicolas, San Pedro, Buenos Aires and La Plata ispresently under way with UNDP finance, with the Bank serving as executingagency. In addition, under the grain storage project (Loan 1521-AR), the Bankis financing a study to determine the feasibility of deepening the channel atBahia Blanca.
E. Inland Waterways
1.08 The Plata River and its tributaries--the Parana, Uruguay, Paraguayand Alto Parana Rivers--form a navigable system of more than 3,000 km. Thetributaries, particularly the Parana River, constitute an important outlet

- 4 -
for cereals and other exports and carry about 40% of the country's total grainexports. The depths of the rivers limit the draft of ships entering thesystem and, hence, exclude the larger bulk carriers or restrict their loadingcapacity. Insufficient and inadequate dredging equipment continues to be aproblem. A recent Spanish bilateral credit for dredges should help to resolvethis matter.
1.09 In the river trade, the largest Argentine carrier is the state-ownedFlota Fluvial del Estado Argentino (FF), which provides freight and passengerservices along the Parana, Paraguay and Uruguay Rivers, passenger servicesbetween Montevideo and Buenos Aires, and ferry services across all theserivers, including a special service between Colonia (Uruguay) and Buenos Aires.It also owns and operates tug boats in the main ports. FF showed a profit in1976.
F. Sea Transport
1.10 The Argenatine merchant marine fleet consists of 66 state-ownedvessels with a total of 479,000 DWT and an average age of 15 years. Withinthe state fleet, the largest owners are the Empresa Lineas Maritimas Argentinas(ELMA), a state enterprise which owns and operates 34 ships, and YacimientosPetroliferos Fiscales (YPF), which owns and operates 26 ships for the haulingof crude oil. The total participation of Argentine vessels in foreign tradewas 31% in 1974, of which ELMA accounted for 19%. The Government's objectiveis to obtain 50% for Argentine vessels.
G. Air Transport
1.11 Argentina's extensive area and the considerable distances separatinga number of its population and commercial centers have made civil air transportan important element in the country's transport system. Airport infrastruc-ture is highly developed, with modern runways and terminals in all major urbancenters. There are around 1,500 airports and airstrips of all standards, ofwhich about 90 are open to commercial aviation. There is some overdesign ofairport facilities., particularly along the Parana River where pairs of large,modern airports have been built at cities separated only by the river. Suchis the case of Resistencia and Corrientes and Santa Fe and Parana. The airtransport industry has enjoyed relatively steady growth for a number of years.The Government-owned, and financially profitable, Aerolineas Argentinasprovides internal and international services. The privately owned Austral andAero-Chaco provide national and regional services respectively. LADE, thedevelopment airline owned and operated by the Air Force, provides subsidizedservices to the southern part of the country.
H. Pipelines
1.12 Pipelines account for the bulk of crude oil and practically thetotal of gas transport in the country. There are about 6,100 km of oil pipe-lines and about 10.900 km of gas pipelines in the trunk system. The oil pipe-lines connect the oil fields and refineries in the North, Central West andSouthwest to the main urban centers. Pipelines also connect the refinery atLa Plata with Buenos Aires. Oil from the fields in the South is transported

-5-
by ship to the main refineries near Buenos Aires. The vast network of gaspipelines may be classified into four systems: (a) the Northern system, whichbrings gas from Bolivia and the Argentine fields near the Bolivian border tothe urban centers along its route to Buenos Aires; (b) the Central Westernsystem, used only for local distribution to Mendoza; and (c) the Southeasternand (d) the Southern systems, which are interconnected and bring the productionfrom fields in Neuquen, Comodoro Rivadavia and Tierra del Fuego to BahiaBlanca and Buenos Aires. There are no plans to expand the network of pipelinesfor oil products at present. There are, however, plans to expand the networkof pipelines for gas, mainly to interconnect the various sytems in the nearfuture. YPF and Gas del Estado, two Government enterprises, own and operatethe oil and gas pipelines respectively.
I. Urban Transport in Buenos Aires
1.13 The Buenos Aires metropolitan region has several corridors of urbandevelopment that extend westward for approximately 60 km from the centerof the city, with most of the urban development contained within a 25-km wideband (Map IBRD 13700). There are 25 suburban municipalities surrounding theFederal Capital. The population of the area is about 10 million, accountingfor 38% of the total population. Population growth in the region, some 2.4%per year, is low compared to the growth rates of other Latin American cities,but is 50% higher than the national growth rate of 1.6% per annum.
1.14 An important characteristic of the transport situation in the BuenosAires metropolitan region is the extensive use made of public transit servicesand the correspondingly small proportion of trips by private automobiles. Ofan estimated 14 million daily passenger trips in vehicles in 1977 (in whichchanges in mode are counted as separate trips), 23% were accounted for byautomobiles, 56% by buses, 8% by the suburban railway, 5% by the subway, and8% by taxi. While the ratio of passenger trips in public vehicles to totalpassenger trips in vehicles has decreased in the last few years (from 83% in1969 to about 77% in 1977), due in part to the lack of coordination of planningamong the different modes (para 1.15 following), it is still quite highcompared with many other countries. Preventing any further decline in thisratio is probably the most important challenge facing urban transport plannerstoday. The extent to which this can be accomplished will essentially dependon how successful Buenos Aires is in coordinating the routes, schedules andfares for the various public modes of transport as well as the specificmeasures taken to discourage the use of private automobiles in the downtownarea. Generally, in terms of physical facilities, Buenos Aires has a goodpublic transportation system for today's needs. The suburban railway service,however, could be improved and more passengers carried (paras 2.38-2.40). Thecoverage of the bus system is quite good. The system is privately owned andoperated with minimum Government regulation. The subway is Government-ownedand receives large annual operating subsidies.
1.15 The institutional and organizational structures for transportplanning and coordination in the metropolitan region have been seriouslyneglected to date; there is no agency responsible for the overall coordinationof transport planning. A 1972/73 preliminary study of transport in themetropolitan region recommended the creation of such an organization as wellas the separation of the suburban railway from Ferrocarriles Argentinos(FA) and the creation of a new company which would eventually merge with

-6-
the subway. The possibility of separating the suburban railway from FA andcreating a new company will be examined in a st:udy of the suburban railservice which is included in the project (Annex 1).
J. Planning and Coordination
1.16 Planning and coordination have traditionally been among the weakestaspects of Argentina's transport sector. in the past, the considerable degreeof independence of the largest Government agencies, such as Vialidad Nacional(roads) and FA (railways), and the loose Goverrment control in the water andair transport subsectors made it very difficult to have integrated and con-sistent transport plans and policies. Several attempts have been made toimprove this situation, including the creation of a Sectoral Transport PlanningOffice (STPO) in 1968. However, its staff members could seldom have theirpoints of view accepted by the numerous and sometimes more powerful transportagencies.
1.17 With the new Government-of March 1976, STPO has recruited new capablestaff and strengthened its position vis-a-vis the agencies. Nevertheless,coordination in the sector is still hampered by the fact that the managementof several of the modes is divided among a number of Secretariats within theMinistry of Economy (roads and railways come under the Secretariat of PublicWorks and Transport, ports and waterborne transport under the Secretariatof Maritime Affairs and pipelines under the Secretariat of Energy), and airtransport is totally outside the Ministry, being managed by the Air Force.
1.18 In 1977, because of the need for better planning and coordinationin the transport sector, the Bank, at the request of the Argentine Government,included financing for a National Transport Plan (NTP) under the Fourth High-way Project. The NTP could become the vehicle by which all transport agenciesare brought together under one integrated structure. Work on the NTP startedin early 1979, and the study part should be finished by the end of 1981.
II. THE RAILWAY SUBSECTOR
A. Background
2.01 During the half century preceding the first World War, the railwaysplayed a crucial role in the economic growth of the country by opening up newareas to development and providing the only transport link between primaryproduction areas and the main ports. Shortly thereafter, however, their rela-tive importance ,declined steadily with the growth in road, coastal shipping,river and pipeline transport. In 1946, the Government purchased the 12 privaterailway companies and combined them with six owned by the Federal Governmentand one by the Province of Buenos Aires, creating one railway organizationwhich was called Ferrocarriles Argentinos (FA). The railway network, consist-ing at that time of 44,000 km, was organized into six systems: four withbroad gauge (BG), one with standard gauge (SG) and one with narrow gauge (NG).However, the Government failed to create a fully unified organization or todiscontinue services which could no longer be p'rovided economically because ofchanged settlement patterns, the new distribution of economic activity and the

- 7 -
growth of other transport modes. Railway traffic declined from 16.5 billionton-km and 32.8 million tons in 1951 to 14.2 billion ton-km and 22.1 milliontons in 1970. FA experienced severe financial deficits combined with lowproductivity and poor services.
2.02 In 1970, the Government and FA adopted a plan to redimension therailway and to concentrate on traffic which the railway could carry moreeconomically than other modes. The Bank helped to finance this plan underLoan 733-AR. By February 1974, it was apparent that little or no improvementhad been achieved in FA's physical and financial condition during 1972 and1973 and that performance was well below the established targets. No lineclosures had occurred, workshop consolidation had not begun, staff strengthwas not reduced, locomotive availability had not improved and the railway wasshowing an operating ratio above 200. In April 1974, the Bank offered theGovernment and FA one of two alternatives: (a) to renegotiate the loan on thebasis of new targets and specific actions to be taken by the Government andFA; or (b) to cancel the balance of the loan. The Government and FA chose thelatter. The situation continued to deteriorate through early 1976. Over theperiod 1973-1976, FA employees increased from about 142,000 to about 158,000,and traffic continued to decline. While the initial decline in traffic waslargely due to competition from other modes of transport (principally road),the lack of railway capacity, caused mainly by poor availability of locomotivesand rolling stock, has been a significant contributing factor.
B. Redimensioning
2.03 Redimensioning the railway to make its scale, operations and manage-ment better suited and more responsive to modern conditions has been discussedby numerous Government administrations for the last 20 years. However, onlyin the last two years has any significant and concerted action been taken.Since the new Government assumed power in March 1976, 5,656 km of track havebeen closed (66% of which is planned for removal as well), reducing totalroute-km from 39,779 to 34,123 (Map IBRD 13699); 374 stations on other lineshave been closed; uneconomic intercity passenger train services have been cut,reducing intercity passenger train-km from 32.8 million to 18 million, a decreaseof 45%; and staff has been reduced from 156,000 to 117,000, a decrease of 25%.
2.04 By any standards, these changes, compressed within such a shortperiod of time, are impressive and represent the determination with which thepresent Government has sought to reform the railway. For this reason, morethan any other, the Bank has considered new lending operations for the railway.However, FA started from a particularly bad position and, while significantsteps in the right direction have been taken, much more needs to be done.Even with the reduction of 5,656 km of line, about 50% of the remaining systemstill carries only about 25% of the traffic; intercity passenger trafficdensities on many lines, which are paralleled by good roads, are well beloweconomic levels, leaving considerable room for further reduction of service;workshops need to be consolidated; and the staff strength of 117,000 is stillexcessively high (although there are some shortages in certain key operatingareas). The railway remains divided into six separately administered lines,which adversely affects operations. FA's management and the ArgentineGovernment are aware of these problems and are committed to their resolutionthrough further action as discussed below.

- 8 -
2.05 The Government, under the direction of the Subsecretaria deTransporte (SST), has agreed to undertake a study of uneconomic linesand stations, the foreign exchange cost of which is to be financed underthe proposed loan. The implementation schedule and cost of this study areshown in Annex 1. The Government agreed during negotiations to furnish tothe Bank, by June 30, 1980, a schedule for carrying out the recommendationsof the study, including a system of compensation for those uneconomic linesand stations which would continue in operation (para 3.15). The uneconomiclines study is intended to supplement work done by the railway, which, bythe end of 1978, studied some 21,430 km of line,of which about 9,159 km havebeen recommended by the railway for closure. The railway's studies arebased essentially on financial analysis (revenues and costs from the stand-point of the enterprise) and focus on the most conspicuous cases for aban-donment where traffic levels are extremely low and show little promise ofgrowth. To date, this approach has been adequate and has yielded usefulresults. The purpose of the study to be directed by SST is to introduceeconomic analysis and to include some of the less obvious cases not yetcovered by the railway's studies. The Government has agreed to the followingminimum program for line closures which has been incorporated into the Planof Action (para 3.14) pending the results of the study, at which time theBank and the Government will have to agree on a. revision of the Plan ofAction:
Lines to be closed System route-km(end of year) (end of year)
1976 - 39,7791977 5,000 34,7791978 856 33,9231979 3,644 30,2791980 1,500 28,7791981 500 28,2791982 500 27,779
12,000
2.06 The Government, under the direction of SST, has also agreed to under-take a study of intercity passenger services, the foreign exchange cost ofwhich is to be financed under the proposed loan. The implementation scheduleand c:ost of this study are shown in Annex 1. The Government agreed duringnegotiations to furnish to the Bank by April 30, 1980 a schedule for carryingout the recommendations of the study, including a system of compensation forthose uneconomic services which would continue to be provided (para 3.15). Asa minimum commitment, the Government has agreed (see Plan of Action, para3.14) to reduce intercity passenger train-km from 18 million in 1978 to 16million in 1980 and to hold this level of service constant over the remainderof the plan period pending the results of the study, at which time a final
program will have to be drawn up. The important role to be played by SST inthese studies will ensure adequate coordination, as appropriate, with the NTP(para 1.18). The possibilities for consolidating workshops will also beexamined in a study to be financed under the proposed loan (Annex 1). FAagreed during negotiations to furnish to the Bank, by September 30, 1980, aworkshop rationalization program that takes into account the long term needsof the railway (paras 2.25 and 3.15).
2.07 A study of future staff needs and salary levels will also befinanced under the proposed loan. The implementation schedule and cost ofthis study are shown in Annex 1. Pending the results of this study, FAplans to reduce staff from about 117,000 to 105,000 at the end of 1982. FAagreed during negotiations to furnish to the Bank, by December 31, 1980, afinal manpower plan based on the findings of the study (para 3.15). Themanpower targets set out in the Plan of Action (para 3.14) would at thattime be revised accordingly.
2.08 The foregoing redimensioning program should contribute significantlytoward achieving the project's overall objective of putting FA firmly on thepath of becoming a financially viable enterprise. It should be recognized,however, that, given the present situation, it would be unrealistic andperhaps even counter-productive, by setting unattainable goals, to expect FAto achieve full financial viability by the end of the railway's current planperiod (1979-1983). The proposed project (Chapter III) and redimensioningprogram have been designed so that full financial viability could be achievedwith reasonable likelihood within the succeeding plan period. It is in thislonger term perspective that the Bank's proposed participation in the projectshould be seen.
C. FA Organization
2.09 FA is a state enterprise under the supervision of SST. It isresponsible for the operation of the railway and has authority to approve itsinternal organization and regulate its affairs. As prescribed by its charter,FA is expected to operate along commercial lines. However, the Governmentexercises a considerable degree of control over FA in its review of its invest-ment plans, tariff levels, annual operating and capital budgets, and financialstatements. Government policy toward FA has been a key factor in determiningtariff levels, staff numbers and salaries, investment levels (and the costs ofitems procured from local industry), funds available for maintenance and therate at which uneconomic lines and services have been eliminated. The presentGovernment has exercised this responsibility with generally beneficial effectsin the areas of staff reductions, line closures, phasing out of uneconomicservices and tariff increases. On the other hand, it has failed to approveadequate budget allocations for permanent way and rolling stock maintenance,and it is currently requiring FA to borrow to finance a share of its operatingdeficits, which is detrimental to FA's longer term financial prospects. Thesematters were discussed during loan negotiations, and a coordinated plan wasprepared, not only for the redimensioning process but also for maintenance(para 2.60). FA also agreed not to incur any debt to finance its operatingexpenses (para 5.21). Once the basic redimensioning process is completed,rehabilitation is well advanced and an appropriate subsidy policy is introduced(para 5.23), the Government should permit FA to have greater autonomy. This

- 10 -
is a matter, however, which will have to be pursued by the Bank in possiblefuture lending operations. Assuming that satisfactory progress is made in theproposed loan, a second operation to finance projects beginning in the years1981/82 of FA's investment plan would be appropriate to continue the BanK'sparticipation in the long-term rehabilitation process.
2.10 The organization of FA is shown in Charts 1 and 2. Day-to-dayoperations are the responsibility of the General Managers of the six railwayswhich constitute FA. 1/ Overall planning, operating norms, inter-railwaycoordination and policy matters are handled in the headquarters office inBuenos Aires. The proposed loan includes provision for technical assistanceto help strengthen the planning capacity of FA's Planning Department which,although competent in engineering fields, is weak: in project evaluation andfinancial analysis (Annex 1).
2.11 In the early 1970s, FA attempted to reorganize by reducing thenumber of separate railway administrations from six to four (two broad gaugesubsystems, one standard gauge subsystem, and one narrow gauge subsystem), bycentralizing accounting and financial management, and by reorganizing thecommercial department. However, because of opposition from the railway unionsand the individual lines as well as an apparent lack of resolve by theGovernment at that time, this process was largely halted and, in some areas(e.g., accounting), even reversed. The process has now been renewed intraffic management, shop centralization, the commercial department and inaccounting and financial management (paras 2.60 to 2.65).
D. Management, Staff and Training
2.12 The management of FA is the responsibility of the President, a Boardof Directors and an Executive Vice President, all of whom are appointed by theGovernment. Military personnel continue to occupy a number of the senioradministrative positions, while senior technical posts are held by civilians.The management is generally competent in technical fields, but its experiencein business and commercial areas is weak, owing largely to the neglect ofthese matters in the past. Because of low salaries in comparison to otherenterprises, there is a shortage of middle management and technical staff.However, FA has recently increased salaries for management personnel by con-centrating wage increases among those in the higher positions, and it plansto continue this practice.
2.13 The number of staff has varied widely over the years - 219,000 in1956, 171,000 in 1966, 138,000 in 1973 - increasinrg again to 157,000 in early1976 and being reduced to some 117,000 in 1978. About half the reductionssince 1976 have been made possible by laws requiring early retirement in somecategories and the dismissal of so-called troublesome personnel and thosewith physical and mental disabilities. The other half of the reductions
1/ The six lines are the Roca, San Martin, Mitre and Sarmiento (broadgauge), the Urquiza (standard gauge) and the Belgrano (narrow gauge).

- 11 -
occurred for reasons of death, normal retirement and voluntary separation toseek higher pay in other jobs outside the railway. It is proposed to reducethe staff further, gradually, to achieve the target of 105,000 by the end of1982 through normal attrition. This goal should be possible by furtherrationalization of train operations, stations, yards, and shops and theclosure of uneconomic lines.
2.14 The rapid reduction in numbers has caused shortages in some areas,especially in permanent way gangs on the Roca and Sarmiento lines (there isa surplus on the Belgrano) and in certain key areas such as skilled shopmechanics, engineers and computer specialists. FA is authorized to recruitcertain key staff, but emphasis is first being placed on the transfer ofstaff from areas of geographical surplus to those where there are shortages.This transfer is difficult to achieve because of the lack of housing and thecompetition from other higher paying jobs in areas where deficienciesexist.
2.15 FA proposes to start recruiting key staff in 1979 and to embark ona program of recruiting apprentices to improve the age structure of itspersonnel. FA's personnel and training organizations were reviewed duringproject preparation and found to be well manned and equipped to handlerecruitment, training of new staff and retraining of staff redeployedbecause of rationalization programs.
2.16 FA clearly needs time to solve the problems created by the largestaff reductions of the last two years and to define its future manpowerrequirements. A study (Annex 1) to be financed by the proposed loan willaddress this problem and help to define an appropriate salary policy andstandards for manning low density lines. Until this study is completed andits conclusions are reviewed, the Government proposes that FA's total wage andbenefits bill be kept constant in real terms by proportionate reductions instaff. Staff salaries decreased by about 38% in real terms between 1975 and1977. They were increased by about 25% in 1978 over 1977, and further plannedincreases will help to restore an additional 10% by 1982. These increasesshould help to improve the situation until FA adopts an appropriate manpowerand salary policy as a result of the planned study.
E. Railway Facilities
(i) Track
2.17 Route-km total 34,123, distributed among three gauges as follows:20,656 km of broad gauge (1.676 m), 10,694 km of narrow gauge (1.000 m) and2,773 km of standard gauge (1.435 m). More detailed route and track data aregiven in Table 2.1. The suburban system in Buenos Aires accounts for 570 km,of which two broad gauge lines (Sarmiento and Mitre) and the one standardgauge line are electrified. Except in the Buenos Aires suburban system wherethere is double and - in some cases - quadruple track, most of the lines aresingle track, with favorable alignment characteristics. Nearly 90% of thetrack is straight with low gradients. The mountainous sections are compara-tively small and of minor importance from the point of view of traffic. Since

- 12 -
the FA system grew out of 19 different railways, the rails are of many varyingtypes in terms of profile and weight, ranging from 29 to 50 kg/m. Welded rail(30-36 m) exists on about 20% of FA's track length. Ties are predominantlytimber (quebracho) of very high quality.
2.18 Because of insufficient renewals over many years, some 40% of thetrack on the main lines is over 40 years old. Many of the bridges are in poorcondition, and several of them cannot support diesel locomotives withoutserious speed restrictions. The ballast situation is generally very poor,and, on most lines, the track is laid over a compacted earth bed or over amixture of gravel and earth, leading to poor drainage and weight distribution.Only about 8,000 km of main line track and about 2,000 km of the complementarynetwork are provided with broken stone ballast, often of limited thicknessand poor quality. Rail fractures and derailments due to rail and foundationdefects are frequenit.
2.19 The project includes the complete renewal of 1,142 km of track pluspartial renewal of 6545 km with the replacement of only some track components.In addition, several bridges will be strengthened, mainly on the trunk lineswhich are to be rehabilitated. The project also includes some light machineryfor track maintenance.
(ii) Motive Power and Rolling Stock
2.20 FA's motive power and rolling stock fleet is shown in Table 2.2.The fleet, as of January 1978, consisted of 1,171 diesel locomotives of 22different types, 681 steam locomotives, 57,351 wagons of various types in-cluding cabooses, 474 diesel rail cars, 653 electric coaches and 3,652passenger coaches.
2.21 Steam locomotives are used mainly as shunters in the yards and onsome trains in sections which cannot support the heavier diesel locomotives.FA plans to scrap the steam locomotives by eliminating them from train oper-
ation by 1980 and from the yards by 1982 (Table 2.3).
2.22 The average availability of diesel locomotives is about 63%. Suchpoor performance is due in large part to a chronic shortage of spare parts andto the multiplicity of types of locomotives, which makes maintenance andprocurement of spares difficult. The problem of importing spare parts hasbeen largely alleviated by a recent Government decree which allows FA toimport up to US$100 million worth of spare parts in three years despite the"Compre Argentino" law. 1/ The locomotive scrapping and purchase programshave been designed ito gradually reduce the number of types of locomotivesfrom the present figure of 22 to 14 in 1982. FA's diesel locomotive require-ments are shown in Table 2.4.
1/ The Compre Argentino" law provides that no import license will be issuedif the item to be imported is, or can be, manufactured in Argentina.

- 13 -
2.23 FA has a high percentage of over-aged wagons; roughly 68% are over40 years old (Table 2.5). FA plans to scrap almost 6,000 wagons by the endof 1981 (Table 2.6). To complement this program, FA plans to purchase newwagons and to rehabilitate others, largely through the replacement ofbogies.
2.24 FA's scrapping, rehabilitation and purchase programs for locomotivesand rolling stock through 1980 are reasonably well defined and have been derivedwith the assistance of consultants (ITALCONSULT, Italy) and the Bank. To definemore precisely FA's requirements after 1980, technical assistance is included inthe proposed loan (Annex 1). This program will be integrated with the programfor rationalizing the maintenance workshops (para 2.25).
(iii) Workshops
2.25 FA has 22 workshops for the maintenance and general repair ofmotive power and rolling stock, 12 of which are on the broad gauge, four onthe standard gauge and six on the narrow gauge. These workshops developedwith the individual railways, and each had several production lines forsteam and diesel locomotives, railcars, passenger cars and freight cars. Aprogram to rationalize the workshops was started under the first Bank loan,but no significant results were achieved. Under the present Governmentadministration, FA has begun to reorganize its workshops in order to achievegreater specialization and thereby to increase efficiency and improvequality control. Instructions have already been given for the closure ofthree workshops (Strobel, Cruz del Eje and Santa Fe). The Villa Luroworkshop is to be merged with Liniers, and there is a proposal to sell theMendoza workshop to private industry. The staff strength of FA workshops,which stood at 20,005 in 1976, was reduced to 15,300 by the end of 1978. Asmall team of experts from SOFRERAIL, France, is presently studying theworkshops and line maintenance sheds and is expected to present its recom-mendations within about one year, to be followed by a period of implementa-tion. The SOFRERAIL study will be made available to the Bank, and this workwill be coordinated with the study of motive power and rolling stock require-ments, to be financed under the proposed loan (Annex 1). The proposedBank-financed study is aimed at developing a workshop rationalizationprogram that takes into account the long-term needs of FA.
(iv) Signaling and Telecommunications
2r26 FA's signaling installations are generally very old (more than 30-40years), somewhat obsolete and of different types. Electric controls and inter-locking between signals and crossings are limited, and, in stations, they aremechanical. Many of the level crossings in urban areas are unprotected bysignals. The telecommunications system consists of telephone installationsfor train operation, for which transmission is by overhead lines. The wiresare old and unreliable, the equipment is heterogeneous, and the level ofcommunications over various parts of the railway is poor. FA will sooninstall automatic telephone exchanges in the zonal headquarters of BuenosAires, Tucuman and Cordoba and a long distance carrier system over much ofthe network.

- 14 -
2.27 There is a need for an integrated signaling and telecommunications
system to enable FA to change over to modern met:hods of train control and toprovide management with the necessary information systems. The projectincludes some signaling works in the suburban Buenos Aires area, ths reh I41i
tation of telephone transmission lines with the necessary ancillary equipment,and a study to be financed by the proposed loan for the development of anintegrated signaling and telecommunications network (para 3.06).
(v) Other Property
2.28 In general, the buildings, stations and plant of the railway are old
but reasonably well maintained. The project includes some locally financedminor buildings for housing for workers, stores, cabins, etc., to complement
the line works.
F. Traffic
(i) Freight Traffic
2.29 Freight traffic statistics by commodily and gauge for the period
1973-1977 and the forecasts, including provisional 1978 figures for tonnagesonly, for the period 1978-1983 are given in Tab:Les 2.7 and 2.8 respectively.Freight densities for 1977, and as forecast by the end of the plan period(1983), are shown on Map IBRD 13699.
2.30 Freight traffic reached its peak in 1928/29, declined during theDepression years of the early 1930s, recovered during the period of theSecond World War and then declined from 35.4 mi:Llion tons in 1946 to 23.4million tons in 1965, a decrease of 34%. Ton-km over the same period declinedless sharply from 17.3 to 14.2 billion, a decrease of only 18%, as shorter haultraffic was lost to highway competition and the average haul increased from490 to 607 km. While the shift to road transport during this period wasexperienced by many countries in the world, it probably would have been muchless in the case of Argentina (given the limited extent of the paved highwaynetwork that existed for most of this period) had the railways been able tohandle the business that was offered. The cont:inued neglect of the railwaysand the consequent progressive physical deterioration of the motive power,rolling stock and track prevented this from happening. During the rest ofthe 1960s and early 1970s, with increased competition and the continuedneglect of the railways, traffic showed a very gradual but persistent decline.In 1975, freight traffic had fallen to 16.3 mill-ion tons and 10.7 billionton-km (less than one-third the level of traffic that the railways once carried).
2.31 Freight traffic began to increase in 1.976; tonnage increased by 3%
and ton-km by 3.3%. In 1977, freight traffic inicreased again, reaching19.8 million tons and 11.5 billion ton-km, representing increases of 15% and
5.4% respectively. The very exceptional increase in tonnage and the modestbut significant :increase in ton-km in 1977 are raainly explained by a largeincrease in grain traffic (33%) which has an average length of haul (about270 km) considerably below the average for all traffic, which decreased from610 km in 1976 to 579 km in 1977.
2.32 The main commodities carried by the railway in 1977, in order of
importance in terms of ton-km, were: sugar (11,'), fuel oil (11%), wine (7%),wheat (7%), petroleum (6%), cement (5%), sorghum (5%), mineral products (5%),corn (5%), forestry products (4%), and limestone (4%). Some of the mostimportant traffic flows in the system include: sugar (over one million tons

- 15 -
per year) from Tucuman to Buenos Aires (over 1,000 km); wine (over 600,000
tons per year) from Mendoza/San Juan to Buenos Aires (about 1,000 km); grains(about 7.5 million tons per year) from the vast fertile plains surrounding andincluding the province of Buenos Aires to consumption centers and ports on thelower Parana River and Atlantic coast (an average distance of about 330 km);cement (about 600,000 tons per year) from the provinces of Cordoba, Neuquenand Santiago Estero to Buenos Aires (an average distance of about 650 km);heavy fuel oil (almost 900,000 tons per year) from Mendoza to San Lorenzo(900 km); limestone (about 212,000 tons per year) from Mendoza to Buenos Aires(over 1,000 km) and salt (about 270,000 tons per year) from Neuquen to BuenosAires (about 900 km). These main traffic flows alone account for about 50% ofFA's total freight traffic. Densities in 1977 (Map IBRD 13699) range from ahigh of over two million tons between Mendoza and Ruffino and over one milliontons between Buenos Aires and Bahia Blanca, Rico and Bahia Blanca and Rosarioand Santa Fe (all on the broad gauge subsystem), to less than 100,000 tons onsome parts of the standard and narrow gauge subsystems. Freight transferredbetween gauges is relatively small, amounting to 60,000 tons in 1977, or about3% of the total freight traffic.
2.33 Over the forecast period (1978-1983), tonnage is expected to increaseby 4.5% per annum to about 26 million, and ton-km by 3.7% per annum to about14.2 billion. The average length of haul for total traffic is expected todecrease to 547 km as grain traffic, with its shorter haul, becomes relativelymore important. These freight traffic forecasts are attainable provided, ofcourse, that FA accomplishes the Plan of Action described in paragraph 3.14,particularly with respect to the availability of locomotives and the produc-tivity of wagons. Also important in this regard are the purchases of new,locomotives and rolling stock and the rehabilitation of the track included inthe project. The forecasts, representing the combined work of consultantsand Bank staff, are largely based on regression analysis, with modifications.Regression equations for each commodity, relating total national supply (Table2.9, derived from detailed market and production possibility studies by regions)to railway traffic, were used. The results were modified to account for thosemarkets where, on the basis of more detailed information, it was believed that
the railway would have a greater or smaller role to play than *the regressionanalysis would indicate. 1/ (See paragraphs 2.41-2.49 for a discussion of
1/ Some of the most important adjustments which were made to the regressionanalysis include those for: petroleum, where railway traffic is expectedto decrease because of the decreased yield of the Carmancito oil field(at the same time, market expansion is not envisaged because of competi-tion from pipelines, para 2.42); fruits and flour where competition fromroad transport is expected to hold railway traffic to present levels;livestock (cattle), where increased competition from trucks is expected toprogressively diminish this traffic; firewood, where railway traffic is
expected to decrease as consumers substitute other fuels; petroleum coke(included in the category combustible minerals), where railway traffic isexpected to increase as the result of a recently negotiated contract withthe shipper; and grains, where the railway is expected to participate inan increasingly larger share of the market during the latter part of theplan period as the railway is rehabilitated and the grain storage projectis completed. The locations of the planned grain storage silos are shownon Map IBRD 13699.

- 16 -
FA's competitive position with respect to other modes of transport.) Ton-kmwere then forecast by commodity by applying estimates of average lengths ofhaul, which, for only a few commodities, are expected to be significantlydifferent from present averages. To obtain line densities, the tonnages bycommodity were then distributed among the lines irI the same proportions asexist at present with the exception of grain traffic, which was adjusted toaccount for the grain storage project planned to be in full operation in 1983;this project, at least over the forecast period, is the only factor expectedto alter significantly the relative importance of the railway's main originand destination pairs for principal commodities. L/
(ii) Intercity Passenger Traffic
2.34 Intercity passenger traffic statistics by gauge for the period1970-1977, together with the forecasts for 1978-1983, are given in Table 2.10.Intercity passenger traffic densities at present (1978) are shown on Map IBRD13699.
2.35 In contrast to freight, intercity passenger traffic continued togrow in the period following the Second World War, due partly to the growth ofpopulation and urbanization and probably also to the low level of faresmaintained during this period. However, intercity passenger traffic reachedits peak in 1965 with 53.7 million passengers and 6.4 billion pass-km. Sincethen, it has been steadily decreasing as the counitry's road system and roadvehicle fleet have increased. In 1977, the railway carried 15 millionintercity passengers for an average journey of 293 km per passenger, or4.4 billion pass-km.
2.36 The present Government has been following a policy of reducinguneconomic passenger services on those low density lines where public roadtransport is available at lower cost to the economy. Intercity passengertrain-km were reduced from an annual level of 32.8 million at the end of1975 to an estimated 18 million for 1978 (based on present train schedules),a decrease of 45% in a period of three years. While this progress is excep-tional judging from the experience of many other countries, there is stillscope for further reductions. Densities (Map IBRD 13699) on several parts ofthe narrow and standard gauge subsystems are below 200,000 passengers perannum. Preliminary comparative cost studies indicate that the breakevendensity (above which rail is less costly than bus transport) is likely to beconsiderably higher. Of course, there are a few lines where traffic isalready quite high (above one million passengers per annum) and, if theservice can be improved, the prospects for further growth appear good. Theselines are principally between Buenos Aires and Mar del Plata, Rosario andSanta Fe.
1/ Railway traffic forecasts derived from a full network analysis based oncommodity origin and destination matrices would, of course, have beenideal. The results from such an approach should be available in 1980under the National Transport Plan. In the meantime, the approach adoptedis considered sufficiently reliable for the purposes at hand, which are,basically, to identify immediate investment priorities and to forecastoperating and financial results for the next few years.

- 17 -
2.37 With the need to reduce some intercity passenger services furtherancl to develop others, the Government has agreed to have SST undertake a studyof the railways' intercity passenger services. The study, which would examinespecific lines, would be included in the proposed project. The implementationschedule and cost of this study are shown in Annex 1. Pending the results ofthis study, the Government has agreed to a target of 16 million train-km by1980 (2 million less than in 1978) to be held constant over the plan period(P:Lan of Action, para 3.14). Based on this level of service, the tentativeintercity passenger forecast, to be revised and agreed with the Bank when theresults from the study are available, shows a marginal decrease in bothpassengers and pass-km, from 15 million and 4.4 billion, respectively, in1977 to 14.9 million and 4.3 billion, respectively, in 1983.
(iii) Suburban Passenger Traffic
2.38 Suburban railway passenger traffic statistics for the period1970-1977, together with the forecasts for 1978-1983, are given in Table 2.11.Traffic densities are shown on Map IBRD 13700.
2.39 The suburban rail service in the Buenos Aires area extends forabout 60 km from the city. It accounts for about one million daily passengertrips at present, or about 8% of the total passenger trips in the metropolitanregion. The suburban rail service is actually of greater importance thanthese figures would indicate since it serves the people who make the longesttrips. The average journey distance for the suburban passenger is about 20km. The volume of passenger traffic on the suburban railway remained more orless constant during the 1960s, declined during the early 1970s, and then roseagain to 411 million passengers in 1976. However, in 1977, it decreased signifi-cantly to 387 million passengers, partly because of the deteriorating leveland quality of service, particularly on the southern (Roca) and narrow gaugelines and partly because of deliberate reductions in service in order torelease locomotives for the increased transport of grain as the railway wascaught short of the necessary motive power. This tradeoff was clearly benefi-cial to FA from the financial point of view.
2.40 The growth of suburban railway traffic in the future will dependon the demand but, also critically, and, perhaps most importantly for thenext few years, on the extent and rate at which improvements are made in thelevel and quality of service. Thus, it is impossible to separate the trafficforecasts for this service from the formulation of a master plan for thesuburban railway. The determination of traffic forecasts, therefore, isincluded as one of the tasks to be accomplished under an overall suburbanrailway master plan study to be financed by the proposed loan. The implemen-tation schedule and cost of this study are shown in Annex 1. For planningpurposes, pending the results of this study, the Government has agreed to holdsuburban passenger train-km constant at the estimated 1978 level of 27.2million (Plan of Action, para 3.14). Upon the assumption of constant train-km,the tentative suburban passenger forecast, to be revised and agreed with theBank when the master plan study is available, shows an increase from 387 millionpassengers in 1977 to 428 million passengers in 1983. In addition, FA and theGovernment agreed during negotiations to discontinue, by the end of 1979, thesmall suburban rail services that are provided in a few cities outside ofBuenos Aires where the densities are extremely low and bus services are moreeconomical.

- 18 -
G. Intermodal Freight Competition
2.41 In analyzing FA's competitive position with respect to freighttraffic, the latter may be divided into two basic categories--grains and othertraffic. Most of FA's non-grain traffic, the composition of which is fairlydiverse and comprised mostly of bulk commodities, has average hauls above800 km and, for several commodities, above 1,000 km. The following averagehauls for commodities, which constitute about 52% of total railway freighttraffic (grains account for another 18%), are representative: sugar, 1,115 km;wine, 1,071 km; combustible minerals, 938 km; other minerals such as sulphur,borax, iron, zinc and lead, 800 ki; heavy fuel oil, 792 km; cement, 547 km;salt, 827 km; limestone, 830 km and forestry products including logs andsawn lumaber, 1,178 km. For these principally bulk, long haul traffic flows,trucking in Argentina is not competitive on groun,ls of cost. Even for cement,with an average haul of 547 km, trucking is considerably more costly thanrail; at: an average haul of around 500 km, the railway tariffs and directcosts for transporting cement are about 50% and 43%, respectively, of thetruck tariffs and costs. It is quite apparent, therefore, that the inroadsthat trucking has made into the railway's market Eor these commodities in thepast, aside from the elimination of purely short-haul traffic, have been duenot to market factors but essentially to the railway's inability, through itsown inefficiency and generally deficient physical condition, to carry what itwas offered (para 2.30).
2.42 For petroleum and the lighter petroleum products, however, whichconstitute about 8%' of total railway freight trafiic, FA does compete directly
with pipelines, which provide a cheaper mode of transport for these commoditiesand which now interconnect most receiving ports, oil fields, refineries andstorage areas (para 1.12). No reversal in the railway's present downwardtrend for these commodities is expected. The railway is still competitive,however, in the transport of heavy fuel oil, which cannot be transported bythe pipelines now existing in Argentina.
2.43 The market for grain traffic deserves special attention since theaverage hauls are relatively short. The railway's average haul for thistraffic is about 270 km, a distance at which trucks are normally competitive.An analysis of tariffs in the province of Buenos Aires in November 1977indicates that, for the distance equal to the average length of haul by rail,the rail tariffs for wheat, corn, sorghum, vegetable oil seeds and othergrains are about 79%, 80%, 73%, 56% and 84% respectively of the truck tariffs.The rail tariff for grain tends to be about 25% lower than the truck tariffat distances above 100 km, specifically about 78% of the road tariff at275 km, 73% at 400 km and 74% at 600 km. In order to determine whether therail tariff for grain (USg1.75 per ton-km based on the average length of haul)covers costs and is, in fact, an accurate reflectiDn of FA's real competitiveposition or, if not, whether FA would be able to raise tariffs to remunerativelevels and still sell its services in a competitive market, both railway andtrucking costs must be considered. For this purpose, a comparative costanalysis was made based on current average trucking and railway operationsfor grains. Average avoidable costs for both modes (excluding administrativeand fixed right-of-way costs) were used. The results are summarized asfollows:

- 19 -
Road and Rail Grain Transport Costs(USe ton-km)
Rail: BG = 1.70; NG = 2.0; SG = 2.40
Truck: 2.0
2.44 First, it may be noted that the rail tariff for grain is about equalto the directly associated costs on the broad gauge subsystem, about 88% ofthe costs on the narrow gauge subsystem and only about 73% of the directlyassociated costs on the standard gauge subsystem. Thus, the comparison ofroad and rail tariffs for grain is a reasonably accurate reflection of FA'scompetitive position only on the broad gauge subsystem, which, at present,accounts for 88% of the railway's total grain traffic. Since the rail tarifffor grain is significantly less than the directly associated costs on boththe standard and narrow gauge subsystems, tariffs at present cannot be usedto measure the railway's competitive position on either of these two subsystems.
2.45 The comparative road and rail cost analysis indicates that, for thetransport of grains, the directly associated rail costs are below truck costsonly on the more important broad gauge subsystem. Rail costs for the trans-port of grain on the narrow gauge subsystem, which accounts for about 10% ofthe railway's total grain traffic, are equal to truck costs and are signifi-cantly more than truck costs on the standard gauge subsystem, which accountsfor about only 2% of the railway's total grain traffic. The relatively highcost on the standard gauge subsystem is partly explained by an average haulfor grain (about 203 km) which is about 25% below the average for the wholerailway. Thus, if the railway were to try to charge a remunerative tariff forgrain today, based on present costs, on either the narrow or standard gaugesubsystems, it would definitely lose grain traffic to trucking. The scope forraising grain tariffs in real terms on the broad gauge subsystem (wheretariffs are already about equal to the directly associated costs), in order tocover some of the railway's administrative overhead and fixed right-of-waycosts, is rather limited because the margin by which truck costs exceed railcosts on this subsystem is only about 18%. One would normally expect thismargin to be at least above 20% in order to neutralize such factors as door-to-door service and greater scheduling flexibility, which generally characterizetruck transport and which have not been taken into account in the direct costcomparisons.
2.46 By introducing improvements in operating efficiency as indicatedby the targets under the project, railway costs for the transport of graincan be reduced by about 9%, 7% and 12%, on the broad, narrow and standard gaugesubsystems respectively. This should enable FA to experiment with raisinggrain tariffs above the directly associated costs on the broad gauge subsystem.However, the envisaged cost reductions would not be sufficient to permit graintariffs to be raised to remunerative levels on either the narrow or standardgauge subsystems without substantial loss of traffic. It should be enough tomake the transport of grains on the narrow gauge subsystem an economical

- 20 -
proposition which is important in its own right by lowering rail costs belowtrucking costs. However, further cost reductions would be required on thestandard and narrow gauge subsystems before the former could be expected toprovide an economic service and both subsystems could charge a remunerativetariff for grain without losing traffic. It was agreed during negotiationsthat FA would prepare and furnish to the Bank, for its review, by December 31,1979, a program for the improvement of its total grain transport operations.
2.47 Thus, while the average hauls for grain are relatively short, it
appears that the railway can compete effectively for this traffic (with thepossible exception of the standard gauge subsystem which, in any case, isrelatively unimportant for such traffic) using modern, unitized methods ofhandling and transport. Better terminal facilities for grains on railwaysidings in both production and port areas and conversion of general wagons intospecialized hopper wagons, as provided under the Bank's grain storage project,more new specially designed hopper wagons, as provided under the proposedproject, and the usea of more block trains are all means toward achieving thisend. 1/ The alternative of not providing the railway with this capacity wouldmean that, in the short run at least, the country's grain export targetsprobably could not be achieved and, eventually, as trucks met the demand, thatthe cost of transport would be substantially higher than otherwise necessary.
2.48 The foregoing generally optimistic assessment of FA's present andprospective competitive position with respect to freight traffic should beinterpreted with a c:ertain degree of caution. The analysis is based on anevaluation of market: conditions (cost and demand characteristics). However,as the past record indicates (para 2.30), the inefficiency of the railway,as reflected in FA's inability to carry all the traffic it was offered, hasoften prevented the railway from assuming its real competitive position. Oneof the main objectives of the proposed Bank projecl: is to reduce this ineffi-ciency and allow FA to carry more freight. This aspect would have to be care-fully monitored by the Bank during the supervision process.
2.49 A somewhat special problem pertains to the standard gauge subsystem.This subsystem is involved in the transport of fore!stry products as well astea from the Misiones region in the northeastern corner of Argentina (the mainproduction area for this railway subsystem) to the Buenos Aires area. In thefuture, this subsystem could face severe competition from river transport oncethe rapids on the upper Parana River are eliminated. by the Yacyreta hydro-electric dam now planned for completion by the mid or late 1980's. In fact,once the Parana River, which parallels the entire trunk line of the standardgauge subsystem, becomes navigable throughout, and, if the river fleet isexpanded (at present it is too small to consider), the economic and finan-cial viability of the entire standard gauge subsystem could become an issue.
1/ About 70% of all railway grain traffic at present is carried in blocktrains. However, use of many non-specialized wagons and inadequateterminal facilities have prevented this method of operation from achiev-ing the full economies. Both the Bank's grain storage project and theproposed project: are directed at removing these constraints.

- 21 -
However, these developments are not likely to occur before the end of the nextdecade. In order to minimize risk, present investments in this subsystemshould be confined to meeting only immediate and near-term future requirements.The NTP, which has the perspective of a 20-year planning horizon, should be ableto provide further clarification of this issue.
H. Operations
2.50 Table 2.12 gives a summary of operating statistics for the years1968 to 1977. Statistics by gauge are given for 1977 (Table 2.13). Thereis room for considerable improvement in train loads and speeds, wagon utiliza-tion and locomotive and wagon availability. For suburban passenger trains,average occupancy is good (75%), and, for intercity passenger trains, theaverage occupancy is improving because of the recent reduction in the mostuneconomic services, which is not yet reflected in the available data.Serious accidents are not uncommon, and derailments due to track and vehicledefects are numerous.
2.51 FA is continuing to implement a plan, started with SOFRERAIL'stechnical assistance in 1970, to rationalize train operations. Implementationwas completed only on the standard gauge subsystem, and, although started alsoon other lines, the work was never completed because of a lack of locomotives.The plan involves dividing FA's system into operating zones within whichtrain programing and wagon management and control are carried out. FA alsoplans to improve wagon control by reducing the delivery time of empties. Apilot project is being carried out on one of the broad gauge lines. Fullimplementation of these improvements will depend upon the rate of improvementof FA's communications (presently under way) and the recruitment of qualifiedpersonnel in FA's computer center. FA is also carrying out a program (againwith SOFRERAIL's assistance) to reduce the number of yards, concentrating onsome 24 major yards and rationalizing their operations.
2.52 Other programs to increase the number of block and unit trains 1/and to generally increase the size of trains are being implemented as locomo-tive availability increases. FA's program of shop rationalization is describedin paragraph 2.25 preceding.
I. Commercial Department
2.53 In 1971, FA, with the assistance of SOFRERAIL, established theso-called first commercial zone office in Tucuman as a pilot project.Because of opposition from the unions, this project was stalled, and onlynow a second commercial zone in Cuyo is being established (apart from Cuyo,commercial zones are to be established in Villa Mercedes, Rosario andCordoba in the coming year). In all, 16 commercial zones will be establishedto replace the commercial departments on the individual lines. The zones
I/ A block train is composed of freight cars having the same origin anddestination, whereas a unit train is a block train carrying only onecommodity. Neither needs intermediate shunting of wagons.

- 22 -
overlap the geographical dividing lines between the individual railways ofthe FA system, which is consistent with the general policy of ignoring suchhistorically determined divisions in reorganizing the administration andoperations of FA. The new commercial zones will *be responsible directly toheadquarters in Buenos Aires. They are expected to give greater flexibilityin resolving problems (wagon shortages, for exampLe) and to reduce competi-tion between the lines, promote the efficiency, quality and sale of railwayservices and improve relations with users. Formerly these functions werecarried out by the local traffic departments when they had time, with theresult that the job was done poorly. The new commercial zones are to beestablished by personnel trained at the existing Tucuman office.
J. Tariff and Costs
2.54 One of the reasons for FA's poor financiial results has been itsfailure in the past to adjust tariffs frequently enough to offset the effectsof high rates of inflation on its operating costs. The new Government(March 1976) permitted significant real increases in passenger fares. Freightrates in real terms declined slightly and then were increased by a largepercentage in late 1977 and again in early 1978. The Government's policy hasbeen to approve tariff increases frequently enough to offset the effects ofhigh rates of inflation on FA's costs. In order to facilitate the implementa-tion of this policy, approval of tariff increases is now required only fromthe Subsecretary of Transport and no longer from higher levels in the Ministryof Economy, as was required formerly. The Government is now prepared to goeven further in granting commercial autonomy to FA. It was agreed duringnegotiations that the Government would not object to FA's changing freighttariffs, except in those cases where it felt that FA was exercising mono-polistic power. Passenger tariffs would still be subject to Governmentregulation; however, the Government is willing to adopt a rational tariff andsubsidy policy for these services (para 5.23). With these changes in policy,the Government is clearly moving in the right direction.
2.55 With respect to costs, FA has made traffic costing studies and hasdetermined the variable and fixed costs associated with the various railwayservices. There are many weaknesses, however, in these estimates, essentiallybecause inadequate material costs are used in establishing maintenance costsfor rolling stock and permanent way, inadequate depreciation allowances areincluded and there are general distortions which are inevitable in a highlyinflationary environment. With these caveats in mind, an analysis of 1976costs has been made. The results are reviewed in detail in Chapter V of thisreport, but some general findings are worth noting at this point.
2.56 Freight rates on the broad gauge subsystem did cover long-run marginalcosts, although by a very small amount in 1976. RLte increases projected inreal terms over the coming years will widen this margin and enable FA to reducethe losses from freight services on the standard arLd narrow gauge subsystems.
2.57 FA failed to recover the long-run marginal costs of the Buenos Airessuburban passenger services in 1976. With a projected increase of such ratesfrom the equivalent of USVO.6 per pass-km in 1976 (USV12 per average trip) to

- 23 -
USV1.35 (or US¢27 a trip), such losses should be eliminated by 1980 for FA as awhole. Suburban services in other cities, which contribute to the losses, arebeing phased out (para 2.40). Intercity passenger services have been consider-ably reduced since 1976 by eliminating the worst money losers. With these andfurther reductions planned, together with increases in fares from an average ofUSJ0.96 per pass-km in 1976 to an expected USV1.80 by 1980, FA should be ableto cover the long-run marginal costs of this service by the end of the planperiod.
2.58 Postal baggage and parcel post services are unremunerative as wellas uneconomic and they should be transferred to other modes. It was agreedduring negotiations that FA would prepare and furnish to the Bank for itsreview, by June 30, 1980, a program for the elimination of uneconomic parcel,baggage and postal services.
2.59 With the tariff increases envisaged, the phasing out of uneconomicservices and the general rehabilitation of the railway, FA's financial positionshould improve considerably. However, in addition to these improvements,a large increase in freight traffic will be needed before full financialviability can be achieved. Meanwhile, continuing Government subsidies willbe required, particularly where uneconomic lines or services are maintainedf or social or other reasons. The subsidy policy agreed with the Governmentduring loan negotiations is covered in detail in paragraph 5.23.
K. Budgets, Accounting and Audit
(i) Budgets
2.60 FA prepares detailed annual operating and investment budgets whichmust be approved by the Subsecretary of Transport and the Ministry of Economy.Reallocations are made from one budget category to another. However, sincepersonnel costs absorb some 70-80% of expenditures, transfers among the othercategories are not large. Procedures for approving and adjusting FA's budgetshave aggravated the spare parts problem. Although initial budget allocationsfor materials purchases (including spares) may have been adequate, subsequentsupplementary allocations have fallen short of those needed to offset infla-tionary price increases. Actual material purchases have, as a result, fallenshort of needs. To some extent, the responsibility for this problem lies withthe Purchasing Departments of FA which have been slow in ordering materials.Purchases have been concentrated in the latter part of the budget period whenthe effect of budget cutbacks tends to be greatest. The weaknesses in thepurchasing organization of FA were reviewed by the Bank, and recommendationswere made for improvements and further study. Consultants CONARSUD have beenentrusted with the task of improving procedures. FA has prepared estimates ofrolling stock and permanent way maintenance requirements in physical terms forthe plan period. These estimates were discussed with FA and Government repre-sentatives during loan negotiations. FA has agreed to carry out the programsand the Government has agreed to provide the necessary budgetary allocations.These estimates would, of course, be subject to review in the light of changinglevels of railway activity, but they would form the basis for review duringproject implementation.
(ii) Accounting
2.61 The accounting system of FA is very cumbersome, and the annualfinancial statements are produced only after long delays. Consequently,

- 24 -
the management of FA relies mainly on budget data for measuring financialperformance during the year. Each of the six railways of FA produces itsown financial statements, and these are consolidated, usually late in thefollowing year. Figures are presented in current pesos, so that comparisonsfum yeGr to year are difficult. Fixed assets were revalued in 1972, but,since then, only values for land and rolling stock were adjusted (to end1976). Fixed asset values and depreciation are therefore not representative.Materials consumed are recorded in expenses at cost of purchase so that, giventhe high rates of inflation, costs of materials consumed are seriously under-stated. Operating losses are also understated because of inadequate deprecia-tion and material costs.
2.62 FA started to centralize its accounting operations in headquartersin Buenos Aires in the early 1970s, but oppositiorn from the unions halted andthen reversed the process so that the situation int 1977 was as it had beenuntil 1970, almost completely decentralized. In 1.977, FA engaged consultantsCONARSUD/CONATEC tc restructure the financial/accounting system of FA.CONARSUD is the consulting subsidiary of FA, and CONATEC is the localconsulting branch of Henry Martin, Accountants, which had been involved inthe early 1970s accounting studies.
2.63 The studies are divided into three stages: (a) diagnosis of theproblems, reorganization proposals and priority recommendations; (b) detailedsystems design and programming; and (c) training, implementation and followup.Phase I was completed in June 1978. The consultants have made good progressto date and have identified a number of special problem areas which needprompt attention: (a) purchasing management; (b) fixed asset inventoriesand revaluation; (c) spare parts inventories and accounting procedures forstores; (d) the role of the computer center; (e) t:he organization of theinternal audit department; (f) control of cash receipts; and (g) the speedwith which purchased materials are cleared through customs. The consultantshave presented specific proposals for each of the above items, and work wasproceeding on a number of them. Phase 2 of the st:udies began in October 1978.Agreement was obtained during negotiations on the changes in accounting forstores (materials and spare parts) and for depreciation on a revalued assetbase.
2.64 At present, given the decentralized system of accounting and finan-cial reporting and the lack of adequate financial control over the enter-prise's operations, the reorganization is in line with other measures toimprove Headquarters' control over the administration and operations of therailway. FA agreed. during negotiations to submit copies of its ongoingfinancial and accounting studies for Bank comment.
(iii) External Audit
2.65 Prior to 1977, FA's last external audit was carried out for the year1973. In accordanc.e with the law establishing FA, a Sindico (a group attachedto the State Corporation which holds the Government's shares in Public Corpora-tions) has the responsibility for reviewing FA's compliance with its legal,administrative and financial reporting responsibi:Lities. This was interpretedto include external auditing responsibility. Unfortunately, the Sindico hasbeen slow in producing its audit reports (the report for 1974 was completed onlyin January 1978) and, at the Bank's urging, FA invited proposals from three

- 25 -
firms of independent external auditors to carry out FA's 1977 audit. The firmselected was Harteneck and Lopez (associated with Coopers and Lybrand), whichcompleted the 1977 audit at the end of October 1978. It was agreed duringnegotiations that an audit by independent external auditors satisfactory tothe Bank would henceforth be produced annually within four months of the endof FA's fiscal year.
III. THE INVESTMENT PLAN AND THE PROJECT
A. FA's Investment Plan (1979-1983)
3.01 Under UNDP financing, with the Bank serving as Executing Agency,consultants ITALCONSULT, in 1977, reviewed FA's first draft investment plan(1978-1982). The revised program, recommended by the consultants, was furthermodified, during discussions with the Bank, to account for investment limitsimposed by the Ministry of Economy, i.e., approximately US$300 million (mid-1977prices) annually in real terms for the next several years. The resulting plan,covering the period 1979-1983, represents a reasonable basis for the start ofthe rehabilitation of FA. It is evident that no short term plan can solve allof FA's problems. A long term approach is essential. The plan in general andthe Bank project in particular are aimed primarily at avoiding a furtherserious deterioration of railway services and at starting the rehabilitationprocess. While detailed studies are needed in several areas to develop theprogram over the latter part of the plan period (Annex 1), many well definedand justified investments exist for immediate implementation. These areincluded in the Bank project.
3.02 The investment plan, divided by type of work or equipment and brokendown by local and foreign costs, is shown in Table 3.1. The investment planhas also been broken down by subprojects and grouped into three main categories(Table 3.2) which include: (a)-the project, consisting of those economicallyjustified subprojects which are planned to begin in the first two years of theplan period (1979 or 1980); (b) subprojects which were begun before 1979 andare expected to be completed during the plan period; and (c) subprojects whichwill begin after 1980, either because this is the estimated best time tocommence work or because further preparatory work is necessary to define moreclearly the need and the scope of the work through studies and technicalassistance to be undertaken as part of the Bank-financed project. Consequently,the figures shown for many of the subprojects in the third category are verypreliminary at this stage. One of the main tasks envisaged for the advisors toFA's Planning Department (para 2.10) would be to assist FA in evaluating allof the subprojects in category (c). Category (a), the project, accounts for45% of the total investment plan (US$1.33 billion excluding contingencies).Categories (b) and (c) account for 31% and 24% respectively. It was agreedduring negotiations that FA would consult with the Bank before undertakinginvestments exceeding a total of US$10 million per year other than thoseincluded in the project and ongoing categories. In addition, FA has agreedto prepare and to furnish to the Bank, by July 1, 1980, for its review andcomments, a program of investments to begin in the period 1981/82.

- 26 -
3.03 One of the main items included in the ongoing category is a projectto electrify 44 route-km of track on the Roca suburban line. Some contractshave a:Lready been signed, and the credit has been arranged. So far as theGovernment is concerned, the decision to go ahead with this project is -vocable, and, for this reason, it is included in the ongoing category. Thetotal cost of this project, including rolling stock and track renewal, is esti-mated at US$290 million (mid 1977 prices). Because of its high cost, the Bankwas particularly concerned both from the point of view of the feasibility ofthe project itself and its overall impact on the availability of resources forcarrying out other higher priority investments on the railway. The Bank'sposition has been basically that, before embarking on a project of this kind,other alternatives, such as improving the existing diesel service, should beexamined more carefully. Nevertheless, the Government has decided to go ahead.The Bank has decidled not to object provided (a) policies are adopted to ensurethat an economicaL diversion of traffic from the road system to the electrifiedrail service occurs to make the latter a more economic proposition and (b) thecapital cost of thze investment is transferred from the railway budget to anotherbudget., preferably to one which is more closely associated with the beneficiarygroup. The Govern-ment has agreed to comply with both provisions. The policiesreferrred to in (a) above will be identified in the suburban rail masterplanstudy which is included in the project. Also, the Government agreed duringnegotiations to create a special federal budget for all suburban rail invest-ments, which would include the Roca electrification project among others, andto study the ways by which the affected local governments that are moreclosely related to the beneficiary group could eventually participate andfinance the new budget. The Government is also considering the possibility ofcreating a separate suburban railway company with its own accounts, and, aspreviously mentioned (para 1.15), this subject will be examined in a study ofthe suburban rail system which is included in the project.
B. The Project and the Proposed Loan
3.04 The objective of the project is to strengthen FA through redimen-sioning, rehabilitation and rationalization to eniable it to concentrate ontraffic for which it has a definite competitive advantage (principally longhaul bulk traffic). These measures should reduce FA's financial dependenceupon the Government. A longer term goal is, of course, the complete financialindependence of FA.
3.05 A comparison of the project and the Bank loan is detailed inTable 3.3, and a list of equipment and services to be financed by the Bankloan is given in 'Cable 3.4. The Bank loan would be equivalent to 34% of theforeign exchange costs of the project. A summary is shown below:
(F:igures in US$ Millions)Proposed
Total Project BankLocal Foreign Total Loan
Way and Works 247.71 91.59 339.30 37.5Track Rehabilitation Contract 4.70 3.50 8.20 3.5Signal and Telecommunications 16.63 15.61 32.24 -Motive Plower/Rolling Stock 103.04 113.02 216.06 38.0ConsultiLng Services 0.50 3.00 3.50 3.0Total wiLthout Contingencies 372.58 226.72 599.30 82.0Total with Contingencies 464.67 284.23 748.90 96.0

- 27 -
C. Main Project Items
3.06 The main items included in the project are as follows (see Table 3.2for more details):
(i) Permanent Way Works
(a) Access to silos, the Central Market in Buenos Aires andRosario Port.
(b) Full rehabilitation of permanent way, including track,bridges and telephone transmission lines in the Temperley-Mardel Plata, Temperley-Bahia Blanca, Concordia-Posadas,Retiro-Rosario, Rosario-Tucuman, Jose C. Paz-Mendoza andSanta Fe-Tostado-Pinedo sections.
(c) Partial track renewal and bridge rehabilitation in theCordoba-Tucuman and Tucuman-Guemes sections and only partialtrack renewal in the V. Const.-V. Tuerto, H. Renanco-Darregueira,Caseros-Haedo and Canada Verde-J. Daract sections.
(d) Permanent way rehabilitation on three broad gauge lines (SanMartin, Mitre and Sarmiento) in the Buenos Aires suburbansystem including track, signals, bridges and power sub-stations.
(e) Light track maintenance equipment.
(ii) Motive Power and Rolling Stock
(a) Line locomotives (BG-20) and shunting locomotives(BG-52; NG-1; SG-1).
(b) Rehabilitation of wagons (BG-429; NG-1490) and electricsuburban coaches (BG-116) and spare parts for locomotives,wagons, and coaches.
(c) Specialized wagons: grain hoppers (BG-363; NG-209; SG-175),mineral and stone wagons (BG-353, NG-141, SG-100), auto-carriers (BG-45, NG-10), platform wagons (BG-123), highsidedwagons (BG-219), multiuse wagons (NG-270), and wine tankers(BG-60).
(d) Modification of box cars (BG-4088).
(e) Passenger coaches (suburban service BG-14).
(iii) Technical Assistance and Studies
(a) Technical advisory assistance to strengthen FA's PlanningDepartment;
(b) Training abroad to assist FA in establishing a research, designand standards office;

- 28 -
(c) Studiles to be contracted by SST for (i) a master plan forthe suburban railway; (ii) intercity passenger servicesand (iii) uneconomic lines;
(d) Studies to be contracted by the ra:ilway for: (i) an integratedsigrLaling and telecommunications plan; (ii) motive power,rolling stock and mechanical maintenance workshop requirementsand (iii) a manpower plan; and
(e) Specific feasibility studies for (:L) new track and civil worksworkshop capacity and (ii) container operations.
During negotiations, the Terms of Reference for the studies were discussed andagreed upon with FA and the Government.
3.07 The main items to be procured under the proposed loan include: about42,000 tons of rails; track fittings; about 1,100 freight car bodies of varioustypes; about 2,700 bogies for both the above bodies and for modernizing existingfreight cars; and some track maintenance equipment, including inspection cars.The proposed loan would also finance the estimated foreign exchange componentof a track renewal contract and of the technical assistance program. Table 3.4gives the estimated cost of each item to be financed by the proposed loan.
D. Cost Estimates
3.08 The cost estimates for FA's investment plan, including the project,are expressed in US dollars and are based on mid-L977 prices (US$1 = 400 Argen-tine pesos). A more recent base year was not used in order to facilitatecomparisons with Government planning figures which use the same base year. TheArgentine Government has established an investmenl: ceiling for FA equivalentto about US$300 million per year expressed in constant mid-1977 prices, whichwould be maintained in real terms for the next several years (para 3.01).Physical contingencies to the extent of 5% have been included on all itemsexcept those covered by ongoing contracts where quantities are clearly known.Also included are price contingencies between mid*-1977 and the end of theconstruction period, applied to both local and foreign costs at the followingannual rates: civil works 8% in 1978, 7.5% in 1979 and 7% from 1980 onward;and equipment 7% in 1978, 6.5% in 1979 and 6% from 1980 onward. In Table 3.4,cost estimates for items proposed for Bank financLng are shown in both baseyear mid-1977 prices and, after allowing for contLngencies, in November 1978prices.
3.09 Some existing contracts with the local industry covering itemsincluded in the project had to be renegotiated, either because the priceswere considered excessive or the quantities on order and the delivery scheduleswere inappropriate in the light of present requiriements. The results of thecontract renegotiations were very satisfactory, and the situation has beensubstantially corrected.
3.10 Presenting cost estimates and measuring both foreign and local pricecontingencies in US dollar equivalents implies a c-ertain relation betweendomestic and foreign prices. Specifically, it has been assumed that the pesoexchange rate would change in order to maintain domestic and foreign prices in

- 29 -
the same proportion. The peso has been devalued roughly in accordance withthis pattern since 1975 and it is expected that, during the project implemen-tation period, this would continue.
E. Financing Plan
3.11 A forecast cash flow statement was prepared for FA for the years1978 to 1982 and is given in Chapter V. It estimates FA's financial require-ments and expected sources of finance for the Investment Plan plus debtservice and operating deficits. Principal sources of finance would be equitycontributions from the Ministry of Economy and FONIT (Fondo Nacional deInfraestructura del Transporte) as well as loans from financial institutions(Eximbank, Morgan Guaranty of the U.S.) and suppliers (FIAT of Argentina,SERCOBE of Spain, Buriasco of Argentina). As mentioned in paragraph 3.03, theGovernment agreed during negotiations to establish, by January 1, 1979, aseparate budget to finance the costs and ensuing debt service of the Rocaelectrification and other suburban railway investments. This would be animportant source of project financing and, together with the projected contri-butions of the Ministry of Economy and FONIT, the financing arranged and theproposed Bank loan, would cover practically all project financing needs, asshown below (additional financing is being arranged through the Central Bank):
Financing Plan for the Project and Ongoing Items(Current US$ millions)
Uses of Funds 1979 1980 1981 1982 Total
Project Cost 207 294 169 79 749Cost of other Ongoing Investments 94 95 89 175 453
301 389 258 254 1,202
Sources of Funds
Bank Loan 7 48 41 - 96Financial Institutions 81 56 14 8 159Suppliers 41 44 14 5 104Advances Made in Previous Years 6 5 4 - 15Other Financing to be Arranged - 33 33 4 70FONIT 74 78 43 30 225Ministry of Economy 9 - - - 9Special Budget for SuburbanRailway Investments 75 119 105 207 506
Sale of Railway Assets 8 6 4 - 18
301 389 258 254 1,202

- 30 -
3.12 As mentioned in paragraph 3.01, the Ministry of Economy indicatedthat FA would be permitted to spend approximately US$300 million equivalentin mid-1977 prices for investments in the next few years (US$250 million was
set for 1978, of which only an estimated US$191 million has been spei,.Project costs and the costs of other ongoing investments would exceed US$300million equivalent in 1980 and thereafter, but not if investments financedfrom the separate budget to be established to fiLnance suburban railway invest-ments are excluded. In any case, the project i'3 defined in physical terms,and, during negotiations, the Government agreed to carry it out and see thatadequate finance was available to do so.
F. Project Implementation
3.13 FA would be responsible for the implementation of the project, withthe exception of the studies for the suburban rail service, long distancepassenger services and uneconomic lines, which would be directed by SST. Aproject implementation schedule and a procurement schedule for the Bank-financed items are given in Tables 3.5 and 3.6 respectively. These wereagreed with FA during loan negotiations. The implementation periods of thesubprojects range from less than a year for some of the equipment and rollingstock to as much as four years for those involving permanent way rehabilitation.
G. Plan of Action
3.14 In order to achieve the project's objectives, FA agreed during nego-tiations to prepare and implement a Plan of Action designed to achieve thetargets set forth in the tabulation on the following page.
3.15 Based on the results of studies to be accomplished under the project,several of the targets cited in the Plan of Action will have to be revised. Toaccomplish this, FA and the Government agreed to the following schedule duringnegotiations:
(a) Send to the Bank, by January 31, 1980, for comment, a copy ofthe study of intercity passenger services which is included inthe proposed loan and furnish to the Bank, by April 30, 1980, aschedule for carrying out the recommendations.
(b) Send to the Bank, by March 31, 1980, for comment, a copy of thesuburban rail master plan study and furnish to the Bank, byJune 30, 1980, an action plan for carrying out the recommendations.
(c) Send to the Bank, by June 30, 1980, for comment, a copy of the studyon uneconomic lines, and furnish to the Bank, by September 30, 1980, a
schedule for carrying out the recommenclations of the study, includinga system of compensation for those uneconomic lines which wouldcontinue in operation.

- 31 -
Target 1979 1980 1981 1982
(1) Closure of uneconomic lines byyear end (km) cumulative fromMarch 1976 9,500 11,000 11,500 12,000
(2) Intercity passengertrain-km (million) 17 16 16 16
(3) Suburban passenger train-kmin Buenos Aires (million) 27.2 27.2 27.2 27.2
(4) Suburban passenger train-kmin other cities (million) 1.37 0 0 0
(5) Staff (year end) 112,500 110,000 107,500 105,000
(6) Annual locomotive-km per BG 100 100 100 100freight locomotive in SG 110 110 110 110service (000) NG 110 110 110 110
(7) Annual locomotive-km per BG 120 120 120 120intercity passenger SG 115 120 120 120locomotive in service (000) NG 110 110 110 110
(8) Annual locomotive-km per BG 125 130 135 135suburban passenger SG - - - -locomotive in service (000) NG 130 130 130 130
(9) Locomotive availability BG 68 72 73 75percentage SG 80 80 80 80
NG 65 70 72 75
(10) Freight car availability BG 79 81 83 85percentage SG 83 84 84 85
NG 68 72 76 80
(11) Average load of freight BG 32.5 32.8 33.1 33.5cars (tons) SG 20.7 21.3 21.8 22.4
NG 24.0 24.3 24.7 25.2
(12) Average turnaround of BG 18 17 16.5 16.0freight cars (days) SG 11.8 11.5 11.5 11.0
NG 18.3 17.5 16.5 15.5
(13) Working ratio BG 137 125 114 109SG 174 165 148 137NG 203 203 179 165FA 151 141 127 121
(14) Operating ratio BG 165 151 139 134SG 202 190 173 160NG 246 245 220 203FA 182 170 156 149

- 32 -
(d) Send to the Bank, by June 30, 1980, for comment, a copy of the studyof the scrapping, rehabilitation and purchase requirements forlocomotives and rolling stock for the period 1981-1983 and thelong-term position of the mechanical workshops and furnish to theBank, by September 30, 1980, a program for carrying out the recom-mendations of the study.
(e) Send to the Bank, by September 30, 198CI, for comment, a copy of themanpower study and furnish to the Bank, not later than December 31,1980, a manpower plan which would include (i) the departmentaldistribution of manpower year by year through 1983 and (ii) thepolicy actions in recruitment, training and salary required toachieve it.
H. Procurement
3.16 All items to be procured with the proceeds of the proposed loanwould be subject to ICB, in accordance with Bank guidelines. In bid evalua-tion, Argentine manufacturers of equipment would be allowed a preferentialmargin of 15% of the CIF cost of competing imports, or the relevantprevailing level of customs duties, whichever is lower. In addition, inview of the prevailing high costs of the local industry and the fact thatArgentine industry has not yet participated significantly in the inter-national export market, it is expected that only 30-50% of the ICBcould be won by the local industry.
I. Disbursements
3.17 Disbursements would be made as follows:
(a) 100% of the foreign expenditures for imported equipment andmaterials; and/or
(b) 100% of the ex-factory cost of locally manufactured equipmentand materials if local bidders are successful;
(c) 40% of the total cost of the track renewal contract for theTemperley-Bahia Blanca Section; and
(d) 86% of the total cost of technical assistance and studies.
3.18 An estimated schedule of disbursements is given in Table 3.7.Disbursements are based on the assumption that the proposed loan would becomeeffective by June 1979.

- 33 -
IV. ECONOMIC EVALUATION
A. General Methodology
4.01 The project, as defined in paragraph 3.02, consists of many subprojects,each of which--with a few exceptions (para 4.05)--was subject to an economicevaluation. Many of the subprojects, of course, are interrelated. For example,the benefits from permanent way rehabilitation depend partly on the level oftraffic, which depends partly on the availability of motive power and rollingstock, which, in turn, is affected by other subprojects which affect operatingefficiency, including, among others, permanent way rehabilitation, thuscompleting the causal circle. The subprojects, therefore,truly constitute anintegrated investment program. However, in order to evaluate the contributionthat each subproject would make to the program to decide whether that subprojectshould be included, omitted or in some way modified, it was necessary to isolatethe effects from each subproject. To do this, it was assumed, when evaluatingthe individual subprojects, that the without project case represents only theexclusion of the subproject in question and that the other subprojects wouldbe implemented according to the program, provided, of course, that they passedthe test when similarly individually evaluated. Thus, the resulting rate ofreturn on each subproject represents the economic contribution of that sub-project when all the other subprojects in the program to which it is relatedare undertaken. Alternatively stated, the realization of the rate of returnon any one of the subprojects is dependent upon the implementation of severalother subprojects in the program. The importance of implementing the invest-ments as an integrated program is clearly seen from these relationships.
B. Economic Benefits and Costs
4.02 For the subprojects involving permanent way rehabilitation outsidethe suburban system, the benefits taken into account include: (a) savingsin accident costs; (b) savings in emergency track maintenance costs requiredto accommodate the forecast traffic at a minimum standard of safety; and(c) reductions in some fixed train operating costs (namely, crew and traincapital costs) resulting from faster train speeds. The benefits not quantifiedinclude the savings to shippers and passengers from faster and more reliableservice. The benefits taken into account for the permanent way rehabilitationsubprojects within the Buenos Aires suburban system include: (a) reductionsin train (locomotive and coach) maintenance costs; and (b) the provision ofadditional capacity for traffic that would otherwise travel by road at ahigher cost. In calculating the latter benefit, only the direct vehicleoperating cost savings were used. Avoided road congestion costs in BuenosAires were not quantified.
4.03 For the subprojects to purchase new wagons and shunting locomotivesto replace some old wagons and steam shunting locomotives to be scrapped, thebenefits taken into account include the savings in railway vehicle operatingcosts. For the additional purchases of wagons and line locomotives needed tocarry more revenue traffic, the benefits taken into account consist of trans-port cost savings associated with the avoidance of the loss of railway trafficto trucking.

- 34 -
4.04 For the subprojects involving track maintenance equipment, thebenefits taken into account include the savings in costs derived from acomparison between the costs of carrying out the planned track maintenanceprogram with and without the proposed equipment. FA agreed during negotiationsto carry out the p:Lanned track maintenance program, and the Government agreedto provide the necessary resources. In the case of those subprojects whichprovide rail access, with the exception of the access to the silos which havealready been evaluated as part of the Bank's grain storage project, thebenefits taken into account are savings in road transport costs. For thesubproject to proviide ticketing machines and to enclose stations in the BuenosAires suburban system, the benefits (in this case, of a financial nature)include the additional revenue resulting from the reduction of fare evasion.
4.05 A few items were not evaluated either because they are not amenableto economic evaluation because of their basically miscellaneous nature orbecause there is an obvious need for them, and the economics, which would bedifficult in any case, would shed little additional light. They include:some miscellaneous repairs to buildings and stations; various small telecom-munications works on the lines; some equipment for the mechanical workshops(basically of a replacement nature); the rehabilitation of some wagons; wagonsfor service traffic required for FA's rehabilitation program; some receptionareas for the storage of ties; track inspection cars; and signals for thelevel crossings in the suburban system, which are needed for safety reasons.These items constitute only 19% of the total economic costs of the project.Thus, 81% of the total economic cost of the project has been subject to aneconomic evaluation. The economic costs include physical contingencies andexclude taxes.
C. Economic Rates of Return
4.06 The economic rates of return range from 11% for some large scalepermanent way rehabilitation works between Buenos Aires and Bahia Blanca, 13%for the renewal of some track on one of the lines in the broad gauge suburbansystem, 19% for the purchase of new diesel shunting locomotives to replacesome old steam locomotives, 21% for the purchase of new rolling stock neededto carry more revenue traffic, 38% for the light t:rack maintenance equipment,and 43% for the access to a new central market outside Buenos Aires to 49%for some small works on the high density line between Retiro (in Buenos Aires)and Rosario. Generally, the very high rates of return tend to be associatedwith those subprojects involving relatively little expenditure and which aredirected at quickly removing some of FA's most critical bottlenecks. Theweighted average economic rate of return on all the subprojects is 22%. Theeconomic rates of return on the individual subprojects and the details oftheir derivation are given in Table 4.1.
D. Sensitivity Analysis and Risks
4.07 The following sensitivity tests were performed:
(a) a 30% reduction in the rate of growth of freight traffic;
(b) a 10% shortfall in the attainment of the locomotive availabilityand wagon turnaround targets; and
(c) a 10% increase in all economic costs.

- 35 -
4.08 These changes tend to cover the most likely types of risk associatedwith the project. The results show that slower growth of traffic has onlya marginal effect on the economic viability of the permanent way rehabilitationsubprojects as expected, since the majority of the benefits from these subproj-ects accrue even without any growth in traffic. However, with lower trafficgrowth and less need for additional motive power and wagons, the economicviability of some of these subprojects is affected significantly. The short-fall in the attainment of the locomotive availability and wagon turnaroundtargets does tend to affect the relative costs of road and rail transport tothe disadvantage of the latter, but, with the magnitude of the most probablechanges considered (a 10% shortfall), the effect does not appreciably reducethe rates of return on those subprojects which involve savings in road trans-port costs. Also, an increase in project costs by 10% does not change thebasic conclusions. The weighted average economic rates of return undersensitivity tests (a), (b) and (c) are 20%, 20% and 18% respectively. Ifall these adverse factors are taken together, the overall rate of return wouldbe 16%. Thus, it appears that the economic viability of the investment programis not very sensitive to the types and magnitudes of changes most likely tooccur. This is explained by the fact that the project consists primarily ofworks to rehabilitate the railway, basically projects which are long overdue.The details of the results of the sensitivity tests are shown in Table 4.2.
V. FINANCIAL EVALUATION
A. General
5.01 With low traffic densities and a system which, despite significantline and station closings, still includes many uneconomic sections, FA has along way to go to become a financially viable enterprise. Freight trafficwill have to increase substantially, uneconomic lines and services will haveto be curtailed further and operations will have to be carried out more effi-ciently at lower unit costs before FA will be able to cover its operatingexpenses. Staff numbers will also have to be reduced further and labor pro-ductivity increased, especially among skilled workers still in short supplywhose salary levels must be raised in order to retain them. The high costof spare parts will have be reduced by a relaxation of the "Compre Argentino"law and by longer term measures to improve the efficiency of domestic spareparts suppliers. Recently, a committee of FA and Ministry of Economy officialswas established to renegotiate equipment contracts with domestic suppliers.This work is basically completed; however, the Government plans to maintainthis group for the purpose of reviewing contract prices generally. This willhave a salutary effect on the prices of goods produced by the local industry.
5.02 On the commercial side, further efforts will have to be made tomarket services, and railway tariffs will have to be increased in real termsas the efficiency and quality of railway services improve, not only forfreight but also for passenger services. Tariffs will also have to beincreased frequently and in sufficient amounts to offset the effect of rapidinflation on FA's costs.

- 36 -
5.03 FA has sustained large operating losses for many years on all gauges,but particularly on the standard and narrow gauge subsystems. Cash operatingdeficits financed by Government subsidies averaged some US$340 million a yearb2tween 1974 and 1977 (Table 5.1). Investments averaging US$97 million ayear and debt repayments averaging US$146 million were financed by furtherborrowing and by contributions from FONIT. Long-t:erm debt has remained atabout the same level since the end of 1974, and the ratio of debt to equityhas risen slightly (to 12% of the estimated total capitalization at the end of1977) as equity declined with the closing of uneconomic lines. Equity willdecline further in the future, as further line closures are affected.
B. Past Financial Performance
5.04 Income statements for the years 1974 through 1977 are given inTable 5.2 in pesos. Because of the extremely high rates of inflation, thefigures were converted to US dollar equivalents using average exchange ratesduring the period to make them more comparable year to year. Despite thedistortions that such conversions create, the figtLres in Table 5.3 providea basis for understanding the reasons for the changes in FA's operating resultsfor the last several years. The figures for 1974 to 1977 are summarized below:
(US$ million)
1974 1975 1976 1977
Total Operating Revenues 368 269 285 280Total Working Expenses 691 725 561 538Operating Loss beforeDepreciation 323 456 276 258
Depreciation 34 10 2 33
357 466 278 291
Financial Charges andNon-Operating Expenses 14 14 27 18
371 479 305 309
Working Ratio 188 269 196 192
5.05 Although total traffic units varied by only a few percentage pointsduring this period, operating revenues and expenses varied widely. Freight andpassenger tariffs were adjusted, but not fast enough to compensate for the largeincreases in FA's operating costs. Average freight tariffs, for example, variedbetween USf1.63 per ton-km in 1974, US01.29 in 1975 and US01.55 in 1976. Averageintercity passenger fares varied between USOO.96 and USf1.25 per pass-km, andsuburban passenger fares in Buenos Aires varied be!tween US¢12 and USf17 per pass-enger trip. On the other hand, costs were influenced principally by changes inthe number of staff (increasing from an average of 142,000 in 1974 to 154,000 in1976 and falling again to 140,000 in 1977) and by large changes in averageannual remuneration per worker (US$4,600 equivalent in 1974, US$2,736 in 1977).The very large decline in real salaries between 1975 and 1977 was part of the

- 37 -
Government's overall economic program, which is still continuing although theGovernment apparently plans to increase salaries gradually in real terms as theeconomy recovers. Other costs have varied much less. Material costs have beenunusually low considering the high cost of spare parts in Argentina. There hasbeen inadequate maintenance of both rolling stock and permanent way (para 2.22).Depreciation has been totally inadequate during the period (para 5.13 following).
5.06 Based on an analysis carried out by the costing division of FA'sPlanning Department, Table 5.4 shows revenues and long-run marginal costs bygauge and for each revenue-producing service. About 53% of FA's operatinglosses were produced on the broad gauge subsystem, some 10% on the standardgauge and 37% on the narrow gauge. Losses were distributed among the variousrailway services as follows:
Freight 28.5Buenos Aires suburban passengers 19.6Other suburban passengers 8.5Intercity passengers 21.6Postal service 5.9Parcel post and baggage 15.9
100.0
5.07 Freight long-run marginal costs (LRMC) (US41.54 per ton-kn) are notunreasonable overall, but those on the narrow and standard gauges are quitehigh, reflecting the lower traffic densities, the high costs of steam tractionand yard operations, the expensive ferry service (on the standard gauge, whichwas phased out in 1978), and the larger number of mixed passenger and freighttrains. The costs of operating the Buenos Aires suburban passenger servicecould be lower with improved operating efficiency, especially on the narrowgauge subsystem. Different costs among the gauges within the suburban systemprincipally reflect different train occupancy factors. The costs of operatingsuburban services in other cities are extremely high because of very lowoccupancy rates (poor patronage) and the use of steam traction in some cities;these services are being phased out (para 2.40). Intercity passenger servicecosts are generally reasonable--differences between gauges again being mainlyattributable to different occupancy rates. The costs of postal service,parcel post and baggage are excessive and cannot be recovered by rate increases.These services should be phased out or, if this is not possible, a specificsubsidy should be provided (para 5.23(d)).
5.08 It should be noted that the above costs are derived from FA's financialaccounts, with some adjustment to account for realistic depreciation. They donot, however, include adequate allowances for rolling stock and permanent waymaintenance. For the narrow gauge, fuel costs are understated because largepurchases in late 1975 were consumed in 1976; they were charged to expenses atpurchase price, which was much lower than the price when consumed. The sameproblem applies to materials which are acquired in one year and used in thenext. They are charged to expenses at historical values, which are much lowerthan the replacement value because of rapid inflation.

- 38 -
5.09 FA's balance sheets for the years ended December 31, 1971 through1976 and estimates for 1977 are shown in pesos in Table 5.5. Because ofinflation, year-to-year comparisons are not very meaningful. Moreover, fixedasset values have not been revised since 1972 (except for land and rollingstock, which were revised in 1976). In order to better understand the balancesheets of FA and its financial position, balance sheet figures were convertedto US dollar equivalents. The results are given in Table 5.6 for the years1973 to 1977 and are summarized as follows:
1973 1974 1975 1976 19771(US$ million)
Current assets 222 178 136 124 143Current liabilities 198 155 171 109 159
Net working capital(deficiency) 24 23 (35) 15 (16)
Net fixed assets 6,500 6,500 6,500 6,560 6,005Other assets 5 14 26 21 24
Total assets 6,529 6,537 6,491 6,596 6,013
Long term liabilities 169 149 245 176 176Deferred income 1 1 1 1 5Equity 6,359 6,387 6,245 6,420 5,832
6,529 6,537 6,491 6,596 6,013
5.10 FA's working capital position has fluctuated considerably, dependingprincipally on Government payments of subsidies (in 1975) and more recently onthe slow payment by official agencies. Accounts receivable at the end of1977 were high from the national, provincial and other levels of Government,the Armed Forces and Yacimientos Petroliferos Fiscales (YPF), the nationalpetroleum company, whose purchases of fuel by FA are credited to YPF's account.These accounts should be settled more promptly. During negotiations, it wasagreed that, by June 30, 1979, all amounts owed to FA by the Government or anyother public corporation would be paid not more than two months after theprovision of such services. At present, shippers are given 90 days to settletheir accounts before they are charged interest and before balances areadjusted for inflation. During negotiations, it was also agreed that, by June30, 1979, FA would, in its contractual relations with all users of its services,grant no more than 30 days as the grace period without the charging of anamount for interest and inflation.
5.11 In order to offset the effects of the slow payment of accounts byusers, FA has fallen behind in the payment of its own accounts. Large amountswere due to suppliers of material and equipment. These slow payments affectservice and the costs quoted to FA for purchases. As accounts receivable arereduced, FA should reduce its short-term obligations, which are excessive.

- 39 -
5.12 Long-term debt of FA has not changed much since the end of 1974.At the end of 1977, debt outstanding totaled US$176 million and was mainlydue to FIAT, Morgan Guaranty, Eximbank for locomotives; Ganz Mavag, Bogeco,Marubeni and Euskalonna for rails and railroad equipment and Banco Nacionalde Desarrollo to cover operating losses.
5.13 Net fixed asset replacement values were estimated from the revalua-tion totals estimated by FA in 1971 and entered into FA's accounts in 1972(and in 1976 for land and rolling stock). No adjustments have been made sincethen, with the result that book values are only a fraction of replacementvalues. The consultants reviewing FA's accounting and financial systems haveupdated the 1971 revaluation figures for rolling stock and land, and they planto complete the updating for other assets this year. At that time, revaluedasset figures should be recorded in FA's accounts. FA agreed, during negotia-tions, to do this by December 31, 1979 with the assistance of the financialconsultants referred to in paragraph 2.62. On the basis of the revaluationvalues estimated in 1971, plus estimated acquisitions, less estimated retire-ments and depreciation, FA's debt/equity ratio at the end of 1977 was 3/97,which is a very conservative capitalization.
C. Forecast Financial Performance
5.14 FA has prepared income and expense forecasts based on very optimisticassumptions about tariff increases which are unlikely to be realized. More-over, no allowances were made in the forecasts for depreciation. Revisedforecasts were prepared based on the assumptions outlined below. Balancesheet and cash flow forecasts were also prepared by Bank staff. All fore-casts are given in US dollar equivalents rather than constant pesos to makethem comparable with past years' figures given in Table 5.3.
5.15 The methodology and principal assumptions are given below:
(a) Income Accounts
(i) Revenues, based on traffic forecasts (paras 2.33, 2.37 and2.40). The following rates were applied per ton-km or pass-km:
1978 1979 1980 1981 1982… --------------- US -…
Freight 1.70 1.80 1.90 1.95 2.00Suburban Passengers 1.10 1.25 1.35 1.40 1.45Intercity Passengers 1.50 1.65 1.80 1.80 1.80
The 1980 freight rates and intercity passenger fares approxi-mate those just after the latest increase in April 1978 andshould be achievable on an average basis for the entire yearin 1980. It should be possible to increase freight ratesthereafter, as the quality of service is improved, to USJ2per ton-km by 1982. Intercity passenger fares can probablynot be increased above the 1980 level because of buscompetition. Suburban passenger fares were set to covermarginal costs by 1980 with modest increases thereafter.An average trip of 20 km will cost some USU29 in 1982, whichshould be obtainable.

- 40 -
(ii) Operating Expenses
a. Labor costs are constant throughout the period.Staff reductions from an average of 118,000 employeesin 1978 to 107,000 in 1982 are offset by salaryincreases in keeping with FA's stated policy.Average staff remuneration rises from US$2,736 in1977 to US$3,790 in 1982 to regain some of the lossin real income between 1974 and 1976.
b. Fuel costs are based on engine-km and reflect thephasing out of steam traction.
c. Material costs are based on an estimated acceptablelevel of spare parts consumption for rolling stockand permanent way maintenance and the high unit costsof locally procured items (66% cf spares are assumedto be purchased locally). An allowance was alsoincluded in the years 1978, 197S9 and 1980 for deferredmaintenance and heavy accident repairs which areexpected to continue until then.
d. Contractors. Higher costs for contractors reflectthe higher level of maintenance to be carried out.
(iii) Depreciation was calculated on the basis of the estimatedreplacement cost of depreciable asset:s. It amounted tosome 2.8% of asset values excluding Jand in 1978 and isincreased each year to reflect estimated additions.Taking into account expected future line and stationclosures, the amounts are probably aclequate.
(iv) Interest Charges
Forecast on the basis of: existing debt plus new debt,including the proposed Bank loan on t:he following terms:
InterestRepayment Period %
Internal Financial Institutions - 5 years plus 1 year grace - 9External Financial Institutions 6i years plus 1 year grace - 9-1/2Domestic Suppliers 5 years plus 1 year grace - 9Foreign Suppliers 5 years no grace period - 12SERCOBE-Spain 10 years no grace period - 7-1/2
Worlcl Bank Loan 15 years including3 years grace - 8
Special Financing 3 years no grace period - 9
(b) Balance Sheets
- Receivables and payables are reduced gradually over theforecast period as Government accounts are scaled downand as credit policies of FA are tightened.

- 41 -
- Fixed assets take into account revised fixed assetvalues as of end 1977 plus annual investments proposedin the investment plan. No allowance was made for lineclosure or the scrapping program although adjustmentsfor these factors could be significant.
5.16 The 1978 income account, based on preliminary figures, is given inTable 5.3 and is summarized below:
Estimate Forecast1978 1979 1980 1981 1982------------ (US$ million) -------------
Operating revenues 371 411 444 479 513Working expenses 605 622 626 612 622
Operating loss before depreciation 234 211 182 133 109Depreciation 122 127 129 135 141
Loss before financial charges 356 338 311 268 250Financial charges 20 32 44 51 44
Deficit 376 370 355 319 294
Working ratio 163 151 141 127 121Operating ratio 197 182 170 156 149
The working ratio would improve from 192 in 1977 to 121 in 1982 and the operat-ing ratio from an estimated 197 in 1978 to 149 in 1982. These improvementsare significant but are considered realistic provided that traffic forecastsmaterialize. They show clearly how far FA has to go to achieve financialviability. Because a large part of the investment plan is financed by loansand credits, financial charges increase significantly between 1978 and 1981 sothat the annual deficits of FA decline only an estimated US$80 million duringthe period. It may be that these results can be improved by setting highertariffs than those used in the forecasts. In any event, FA should undertaketo adjust its charges for freight, passenger and other services (whenever thewholesale price index rises by 10% or more since the last tariff increase) tocover increases in FA's costs or to allow for other factors affecting itscompetitive position. Costs of the individual railway services are revisedmonthly by FA's costing unit, and these would form the basis for globaladjustments (e.g., a 20% suburban passenger fare increase). Specific costingstudies would be used to adjust the tariff structure from time to time.
5.17 Costs and revenues for the years 1979-1982 were allocated to thethree gauges of FA's system to reflect differences between the basically viablesections (the broad gauge subsystem) and those which have major uneconomicsections (the narrow and standard gauge subsystems). The results are sum-marized in Table 5.7. Average revenue per ton-km of freight varies amongthe gauges because of the differences in average haul and the compositionof commodities carried; allowance was made for this on the basis of historical

- 42 -
differences. There are differences also in revenues per pass-km for suburbanand intercity passenger services but these are relatively minor and areexpected to be virtually eliminated in the future. They have thereforebeen ignored. The new operating and working ratios are as follows and areincluded as targets to be achieved in the Plan of Action (para 3.14).
1979 1980 1981 1982
Broad GaugeWorking ratio 137 125 114 109Operating ratio 165 151 139 134
Standard GaugeWorking ratio 174 165 148 137Operating ratio 202 190 173 160
Narrow GaugeWorking ratio 203 203 179 165Operating ratio 246 245 220 203
FA as a wholeWorking ratio 151 141 127 121Operating ratio 182 170 156 149
5.18 For 1980, operating results were estimated by service and theseare given in Table 5.8. By 1980, both freight and passenger services shouldcover marginal costs. Parcel post, baggage and postal services all continueto lose money. The marginal costs of passenger services are considerablyhigher than those shown for 1976, reflecting the higher repair costs of r6llingstock and permanent way (and, in the case of the narrow gauge, higher fuelcosts). Freight costs are generally lower than those for 1976, reflectinghigher utilization of rolling stock, lower yard costs and more efficient trainoperations.
5.19 The cash flow forecast for the years 1978 to 1982 is given inTable 5.9 and is summarized on the following page. As mentioned in paragraph5.03, Government financial support to FA averaged some US$340 million annuallyfrom 1974 to 1977. This support was reduced significantly in 1978 to anestimated US$218 million. The Government required FA to arrange a specialfinancing locally (repayable in three years with 9% interest) totaling US$96million equivalent - US$45.5 million for capital expenditures and US$50.5million to finance part of FA's expected operating deficit for 1978. This,of course, increased the debt service burden of FA and the total amount ofthe Government's eventual financial support to it. The Government and FAagreed during loan negotiations not to borrow to Einance operating expenses(para 5,21).
5.20 The contributions of FONIT were estimated by FA from discussionswith the Government; some of FONIT's contributions are for capital investments(principally permanent way investments) and operal:ing costs of FA (forpermanent way maintenance). The contributions of the Ministry of Economyare expected to be slightly above the 1978 level in 1979 and then increasefurther in 1980 when the Government finances the iotal operating deficitsof FA, including realistic depreciation. With these Government contributions,the loans and credits already arranged and the proposed Bank loan, some 92%

- 43 -
1978 1979 1980 1981 1982----------- (US$ million)------------
Uses of Funds
Net losses of FA 376 370 355 319 293Less: Depreciation 122 127 129 135 140
Net losses 254 243 226 184 153Investment Plan 191 301 389 401 460Debt payments and advances 67 46 92 119 102
512 590 707 704 715
Sources of Funds
Loans arranged 103 129 104 60 76Special financing 96 - - - -Proposed Bank Loan I - 7 48 41 -Other financing to be arranged - 44 41 43 21
199 180 193 144 97
Sale of railway assets 12 8 6 7 -FONIT 107 104 109 115 120Ministry of Economy 194 222 280 318 266Special Budget for SuburbanRailway Investments - 76 119 120 232
512 590 707 704 715
of total estimated financial needs will be covered in 1979 and 94% in 1980.FA will have to arrange some US$44 million equivalent of additional financingin 1979 and US$41 million in 1980. FA is attempting to negotiate such addi-tional financing through, and with the assistance of, the Central Bank. For1981 and 1982, a further US$64 million equivalent would be needed and thiscould form the basis for a second Bank operation if the present project issuccessful. This amount could be increased if items financed through thespecial budget for suburban railway investments were financed with Bank funds.
5.21 With the introduction of the proposed program of specific subsidiesby December 31, 1979 (para 5.24) and a general subsidy to cover remainingoperating losses (including depreciation and interest expenses), FA shouldgenerate cash from operations equal to its depreciation provision. The fundsso generated from operations should be sufficient to cover principal repaymentson debt, and this limitation on borrowing was agreed during loan negotiations.In addition, no borrowing would be done to cover its operating deficits.

- 44 -
5.22 Forecast balance sheets for the years 1978 to 1982 are given inTable 5.6 and are summarized as follows:
1978 1979 1980 1981 1982--------------- (US$ million)----------------
Current assets 155 170 170 143 122Current liabilities 125 139 131 118 110
Net working capital 30 31 39 25 12Net fixed assets 6,075 6,249 6,510 6,776 7,095Other assets 40 30 20 10 -
Total assets 6,145 6,310 6,569 6,811 7,107
Long-term debt 335 470 572 596 591Equity 5,810 5,840 5,997 6,215 6,516
Total liabilitiesand equity 6,145 6,310 6,569 6.811 7,107
Debt Equity Ratio 5/95 7/93 9/91 9/91 8/92
As mentioned in paragraph 5.10 preceding, the current asset and currentliability positions of FA depend principally upon measures to reduce Govern-ment obligations to FA and to changes in FA's credit policies. These measureswere agreed during negotiations. The debt/equity ratio will depend principallyupon the degree of Government support in covering FA's budget deficits andfinancing its investment plan, and this was also agreed during negotiations.
D. Pricing and Subsidy Policies
5.23 At various points in the economic and financial analyses, thepricing policies of FA and the subsidy policies o: the Government have beentouched upon. These policies were agreed during negotiations; they aresummarized as follows:
(a) Freight
Freight tariffs for all commodities should cover at least the longrun marginal costs of providing the service. Where this is notpossible within a reasonable period of time, those servicesshould be discontinued. On those routes and for those commoditieswhere competition permits, the railway should try to raise tariffsto levels which would enable FA to cover the total fixed costsassociated with the entire freight servlce. In order to implementthese policies, FA will, from time to time, prepare and furnishto the Bank marketing studies of the commodities carried by FA.

- 45 -
(b) Suburban passenger services
Suburban passengers should pay the long-run marginal costs ofthis service and a share of the related fixed costs. Achievement ofthis goal will depend upon a coordinated pricing policy for all trans-port modes and the rationalization of the service. These areas will
be reviewed in the study of the suburban railway service included inthe proposed project. From the costing analysis carried out, itappears likely that prices can cover marginal costs and a share ofthe fixed costs, except possibly on the narrow gauge subsystem wherethe rationalization of services (e.g., running smaller trains and
increasing occupancy rates) may not solve the problem. If thisservice is found to be economic but financially unremunerative, thena direct Government subsidy will be required. Otherwise the serviceshould be discontinued.
(c) Intercity passenger services
Some uneconomic intercity passenger services remain. The studyincluded in the project should identify them and make recom-mendations for abandonment. Those not phased out should besubject to a specific subsidy from the Government equal to theavoidable costs of such services less the related revenues.
(d) Other services
As already mentioned (para 2.58), FA has agreed to prepare andfurnish to the Bank, for its review by June 30, 1980, a programfor the elimination of uneconomic parcel, baggage and postalservices.
5.24 The general principle implied in the recommended pricing and subsidypolicy for FA is that general subsidies should be replaced with service-specific subsidies wherever possible. This would eliminate any disguisedelements in the subsidy and permit the Government to perceive the real costsassociated with its policy. The Government agreed during loan negotiations tointroduce by December 31, 1979 a program of payment of specific subsidies foruneconomic lines and services which the Government requires to remain inoperation. However, a general subsidy to cover remaining losses and debtservice payments will probably be required for some years, but the objectshould be to gradually replace this system with service-specific subsidies.The longer term objective, of course, is the complete elimination of theuneconomic services which a rational subsidy system should help to achieve.
E. Sensitivity Analysis
5.25 A sensitivity analysis was carried out to show the effects of thefollowing on FA's financial results:
(a) Slower freight growth than forecast (30% less than expected);
(b) Lower tariffs (tariffs 10% lower than in the base case forfreight and passenger services);

- 46 -
(c) Lower personnel costs (3% a year less than forecast compounded);
(d) Lower material costs (20% lower than forecast).
(a) Growth of freight traffic at 30% less than forecast
Operating Ratio
1979 1980 1981 1982
Forecast traffic growth 182 170 156 14930% less traffic growth 182 170 156 149
The effect is negligible since long-run variable costs fall almost as much asrevenues.
(b) 10% lower tariffs (on freight and passenger services)
Operating Ratio
1979 1980 1981 1982
Forecast tariffs 182 170 156 14910% lower tariffs 203 189 173 165
The operating ratio is very sensitive to lower tariffs.
(c) Personnel costs 3% less than expected because of further reductionsor lower salary levels
Operating Ratio
1979 1980 1981 1982
Forecast personnel costs 182 170 .156 149
3% a year reduction inpersonnel costs 179 165 148 140
(d) Materials costs 20% lower than forecast
Operating Ratio
1979 1980 1981 1982
Forecast malterials costs 182 170 156 149
Materials costs 20% lessthan forecast 176 164 151 144

- 47 -
F. Conclusion
5.26 The financial results are particularly sensitive to lower tariffadjustments than expected and to a steadily lower trend of increases inpersonnel costs. Lower materials costs also have a direct effect on theoperating ratio, but traffic growth has a more moderate effect as lower revenuesare almost exactly offset by lower operating costs (those which vary directlywith traffic). Strong measures are required to assure that prompt tariffadjustments are made to recover rapidly increasing costs and to reducematerials costs.
VI. AGREEMENTS REACHED AND RECOMMENDATION
6.01 During negotiations, agreement was reached with the Government andFA on the following:
(a) that the small suburban rail services would be discontinued(para 2.40);
(b) that, by December 31, 1979, FA would prepare and furnish to theBank, for its review, a program for the improvement of FA's totalgrain transport operations (para 2.46);
(c) that the Government would not object to FA's changing freighttariffs except where monopolistic practice is evident (para 2.54);
(d) that, by June 30, 1980, FA would prepare and furnish to the Bank,for its review, a program for the elimination of FA's uneconomicpostal, baggage and parcel post services (para 2.58);
(e) that an agreed program for maintenance of rolling stock andpermanent way would be carried out and the necessary budgetaryallocations would be provided (paras 2.60 and 4.04);
(f) that appropriate changes would be made in accounting for storesand for depreciation on a revalued fixed asset base (para 2.63);
(g) that copies of FA's ongoing financial and accounting studies wouldbe submitted to the Bank for comment (para 2.64);
(h) that an audit by independent external auditors satisfactory tothe Bank would be produced annually within four months of theend of FA's fiscal year (para 2.65);
(i) that FA would consult with the Bank prior to undertakinginvestments exceeding a total of US$10 million per year otherthan those included in the project and ongoing categories andthat FA would prepare and furnish to the Bank, by July 1, 1980,for its review and comment, a program of investments to beginin the period 1981-1982 (para 3.02);

- 48 -
(j) that the Government would establish a budget separate from FA'sto finance the Roca electrification project and other suburbanrailway investments and related debt service charges and studyalternative financing sources such as affected local governments(para 3.03);
(k) that the Government would provide adequate funds required by FAto carry out the project (para 3.12);
(1) that the project implementation and procurement schedules would beadhered to (para 3.13);
(m) that the Plan of Action would be implemented (para 3.14);
(n) that, on agreed dates, the following completed studies would besubmitted to the Bank; (i) uneconomic lines and stations, (ii) inter-city passenger services, (iii) locomotive and rolling stock require-ments and workshops (iv) manpower, and (v) the suburban railmaster plan (para 3.15);
(o) that, on agreed dates, the final programs based on the above studieswould be submitted to the Bank in order to revise the Plan ofAction (para 3.15);
(p) that, by June 30, 1979, all amounts owed to FA by the Government orany other public corporation would be paid not more than two monthsafter the provision of such services (para 5.10);
(q) that, by June 30, 1979, FA would, in its contractual relations withall users of its services, grant no more than 30 days as the graceperiod for the settlement of its accounts without the charging ofan amount for interest and inflation (para 5.10);
(r) that, by December 31, 1979, FA would revalue its fixed assets inoperation (para 5.13);
(s) that FA would not borrow to finance its operating deficits and wouldlimit its borrowing so that principal repayments on debt would notexceed its depreciation allowance (para 5.21);
(t) that FA would adjust its freight rates and suburban and intercitypassenger fares to cover the estimated relevant variable costs,would increase progressively such levels to cover its fixed costs,where competition permits, and would carry out marketing studies(para 5.23); and
(u) that by December 31, 1979, the Government would establish a systemof specific subsidies for uneconomic lines and services which theGovernment requires to remain in operation (para 5.24).
6.02 With the agreements and understandings obtained, the proposed projectis suitable for a Bank loan to FA of US$96 million for a period of 15 years,including three years of grace.
March 14, 1979

ARGENTINA
SECOND RAILWAY PROJECT
Modal Composition of Traffic
1965 1966 1967 1968 1969 1970 1971 1972 1973 1974 1975 1976Passenger Traffic(million pass-km)
Air 588 597 799 848 965 988 1,277 1,489 1,483 1,983 2,402 2,307Road 22,657 23,193 25,312 25,778 27,938 30,182 32,318 33,400 35,467 35,811 34,144 34,784Rail 6,373 5,981 5,428 6,203 6,154 4,737 4,983 5,243 5,720 6,417 6,890 6,509
Total 29,618 29,771 31,539 32,829 35,057 35,907 38,578 40,132 42,670 44,211 43,436 43,600
Freight Traffic(million toi3)
(Coastal,(Shipping 18,854 20,779 21,575 21,160 22,957 24,600 25,282 23,345 18,576 15,587 - -
Water ((River(Transport 5,154 5,188 4,848 5,128 5,209 5,289 4,825 4,800 4,750 4,850 - -
Air 118 122 175 214 268 293 335 390 417 524 547 496Road 35,953 37,947 41,297 41,861 45,160 46,296 49,838 53,338 55,792 54,813 49,915 52,752Pipelines(petroleum) 1,951 2,445 2,785 3,273 3,793 5,209 6,133 6,826 7,073 6,349 9,289 7,062Rail 14,186 14,148 11,241 12,709 13,318 13,640 13,654 12,489 12,508 12,357 10,659 10,865
Total 76,216 80,269 81,920 84,344 90,706 95,296 100,188 101,188 99,116 94,481 - -
Source: FAJuly 1978

ARGENTINA
SECOND RAILWAY PROJECTRoute and Track Data-/
Classification by TrackClassification by Traffic Condition (km)
Route Length (km) (Gross Tons per Year) (km) I
In Closed in I II III Iv Vary II III IV
System Service l9T6t,78n <2 mil 0.8-2 mil o.4-o.8 mil >0.4 mil Good Good Fair Bad
Broad Gauge (1.67 meters) 20,656 2,598 6,261 3,454 2,564 8,377 1,808 6,729 8,784 3,335
Roca 7,032 1,531 2,127 1,820 848 2,237 464 2,515 2,963 1,119
Mitre 5,636 6oo 1,984 361 473 2,818 428 1,649 1,944 1,466
San Martin 4,563 62 1,601 833 545 1,584 548 1,670 2,340 5
Sarmiento 3,425 405 549 440 698 1,738 389 744 1,567 795
Standard Gauge (1. 4 3-m) 2,773 315 529 675 477 1,092 424 906 690 753
(Urquiza)
Narrow Gauge (1.0 m) 10,694 2,714 460 2,90 2,100 5,184 1,122 6,o8l 3,321 220(Belgrano)
TOTAL 34,123 5,656 7,250 7,079 5,141 14,653 3,375 13,565 12,825 4,358
l/As of July 1978
Source: FA and Bank Staff
November 1978

- 51 -TABLE 2.2
ARGENTINA
SECOND RAILWAY PROJECT
Motive Power and Rolling Stock 1/
Broad Standard NarrowGauge Gauge Gauge FA
LOCOMOTIVES
Steam 138 123 420 681Diesel 794 65 312 14171
WAGONS
Traffic 32,589 2,942 15,207 50,738Service 3,663 576 1,203 5,442Vans 715 85 371 1,171
57,351
DIESEL RAILCARS 283 64 127 1474
LIECTRIC RAILCARS 557 96 - 653
COACHES
Traffic 1,581 137 669 2,387Service 467 151 198 816Vans 301 36 112 449
3,652
1/ as of December 31, 1977
Source: FA
December 1977
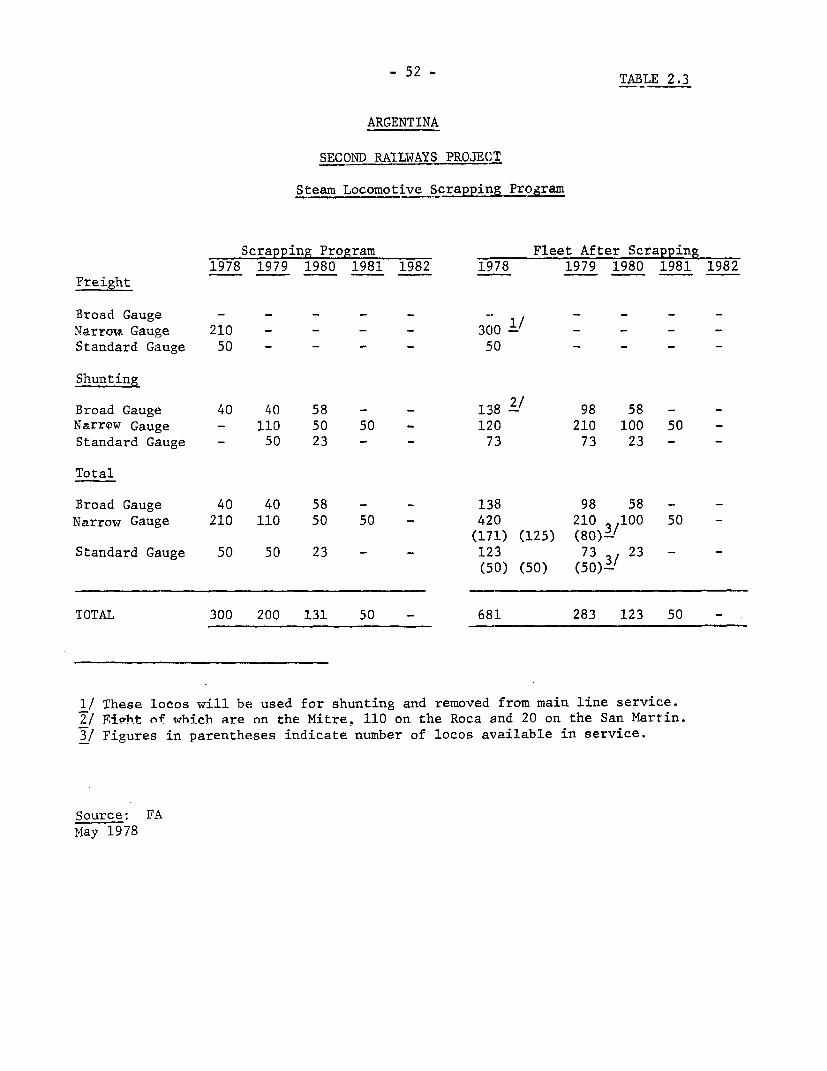
- 52 - TABLE 2.3
ARGENTINA
SECOND RAILWAYS PROJECT
Steam Locomotive Scrapping Program
Scrapping Program Fleet After Scrapping1978 1979 1980 1981 1982 1978 1979 1980 1981 1982
Freight
Broad Gauge - - - - - 1/ - - - -Narrow. Gauge 210 - - - - 300Standard Gauge 50 - - - - '0 - - - -
Shunting
Broad Gauge 40 40 58 - - 128 98 58 - -
Narrow Gauge - 110 50 50 - 120 210 100 50 -Standard Gauge - 50 23 - - 73 73 23 - _
Total
Broad Gauge 40 40 58 - - 138 98 58 - -
Narrow Gauge 210 110 50 50 - 420 210 31100 50 -
(171) (125) (80)-Standard Gauge 50 50 23 - - 123 73 / 23 - -
(50) (50) (50)'
TOTAL 300 200 131 50 - 681 283 123 50 -
1/ These locos will be used for shunting and removed from main line service.2/ RiPht of which are on the Mitre, 110 on the Roca and 20 on the San Martin.3/ Figures in parentheses indicate number of locos available in service.
Source: FAMay 1978

ARGENTINA
SE.COND) RAILWAY PROJECT
Diesel Locomotive kogulremen!
1978 1.979 -- 1 980 - ----- -- 1981 -- ----- 19828road Narrow SIa Ld.,d Broad Narrow Standard S t od Na Standr o1 Narrow Standard Broold Narro Stand,rd
iaago tGang Conlgo _ i.st Gauge G_nge_ Gangg Gan1gn Ga_ge Gangs Gauge Garn1ge Iasge Gauge Gauge_
FREIGHT
Freight -ton-km x 101 8,286 3,656 786 8,958 3,926 851 9,298 3,985 882 9,891 4,368 984 10,621 4,749 1,083
Operating/Fteight to-km 1.04 1.06 1.05 1.04 1.04 1.03 1.04 1.04 1.03 1.04 1.04 1.03 1.004 1.04 1.03
Operatis,g tLon- n 10 8,615 3,875 8835 9,316 4,083 076 9,671 4,144 908 10,287 4,543 1,013 11,043 4,938 1,115
Cross/net tons 6 2.3 2.0 2.2 2.3 2.0 2.2 2.3 2 0 2.2 2.3 2.0 2.2 2.3 2.0 2.2
Gross too-km n 10 19,814 7,750 t,815 21,427 8,166 1,927 22,241 8,288 1,988 23,660 9,086 2,230 23,406 9,876 2,453
Gross ton/train-kn i7030 720 675 1,030 720 675 1,030 720 675 1,030 720 675 1,030 720 675
Train-km x 10 19,237 10,764 2,689 20,803 11,342 2,855 21,593 11,541 2,960 22,971 12,619 3,303 24,666 13,717 3,634
Loooz-k6s/utasi%-km 1.15 1.20 1.15 1.15 1.20 1.15 1.15 1.20 1.15 1.15 1.20 1.15 1 15 1.20 1.15
Lono-k,n n 10 22,122 12,917 3,092 23,923 13,610 3,283 24,812 13,813 3,404 26,417 15,142 3,800 28,366 16,460 4,179
INTERCITY PASSRNGERS
Pass-kn x 106 3,007 449 460 3,221 372 303 3,211 160 268 3,417 149 268 3,417 147 268
Passonger- per train 257 199 114 260 200 190 265 200 236 282 200 236 282 200 236
Train-kii x 10 11,700 2,258 2,645 12,389 1,860 1,621 12,119 0,801 1,137 12,119 0,746 1,137 12,119 0,737 1,137
L-co-k,m/LraN-k 1.07 1.14 1.05 1.07 1.14 1.05 1.07 1.14 1.05 1.07 1.14 1.05 1.07 1.14 1.05
Lnrn-k/ x 1 k 12,519 2,574 1,941 13,256 2,120 1,702 12,967 0,913 1,195 12,967 0,850 1,194 12,967 0,840 1,194
UBUREBAN PASSENGERS
Pass-km x 10 3,490 775 - 3,524 783 _ 3,560 791 - 3,596 799 - 3,632 807 -
Pass per traik6 381 164 - 385 166 - 389 164 - 392 169 - 323 162 -
Train-km x 10 9,162 4,728 - 9,162 4,728 - 9,162 4,728 9 9,162 4,728 - 9,162 4,978 -
Loco-km/trsim kl 1.02 1.02 - 1.02 1.02 - 1.02 1.02 - 1.02 1.02 - 1.02 1.02 -
Loco-km x 10 9,345 4,823 - 9,345 4,823 - 9,345 4,823 - 9,345 4,823 - 9,345 5,078 -
_EQUIREMENT1
Freight 230 107 27 239 124 30 24a 126 31 264 138 34 284 150 38
Itercity 104 23 16 110 19 15 108 8 10 108 8 10 108 8 10
Suburban 78 37 - 75 37 - 72 37 - 70 37 - 69 39
412 167 43 424 180 45 428 171 41 442 183 44 461 197 48
% a-ilability 63 62 67 68 65 80 72 70 79 73 72 79 75 75 80
Line locos needed in fleet 654 270 54 623 277 56 594 244 52 605 254 56 615 263 60
Shonting locos needed i"n fleet 116 55 38 116 55 38 116 55 38 116 55 38 116 55 38
Source: FA and Bank Missiosn
November 1978

TABLE 2.5- 54 -
ARGENTINA
SECOND RAILWAY PROJECT1 /
Age of Freight Wagons
Total 0-10 11--20 21-30 31-40 Over 40Number Years Years Years Years Years
Broad Gauge 34,169 6,024 2,801 4,870 704 19,770
Standard Gauge 3,197 317 197 203 30 2,450
Narrow Gauge 17,200 1,858 200 769 289 14,084
FA 54,566 8,199 3,198 5,842 1,023. 36,304
1/ as of December 31, 1977
Source: FADecember 1977

TABLE 2. 6
_N C o 7 o
O aqWN- N 1oR o |Rl
Ul 0 w 71 n 7 7 4 O ON
C O 1 1N O. -< 0o N 0.00t0 a I
CI N ON N 1 ( N N .0NN1
O G I g N 1
NII iI
N:~ N I - 1
N ~ ( N C N7|_
OGI N NO
N N1
N v j - N N1~ | N < ' N
a N.N N 11
\ C' I N C O| ~ 1 - I | jNj |. 0 N
N11 11 ON ION N
C c0 ON N 0 a 0 1 °°~ RO N0
G N
81 ~ ~ ~ N N 11S 0 N 10 ONI o I I
! NU GI V NN G N 90 N 999 -N NO G IE {j l l>

TA4BLE 2.y7- 59 - ~~~~~~~~~~~~PageSI of?2
ARGENTINASECOND RAILWAY PROJECT
Freight Traffic Statistics
(1973-1977)
YEAR 1973
Bo N0 S0 TOTAL
PRODUCT Averge t-kxs t Average t-km C A-e-ge t-hes C Average t-1h(0007 HaulC1 (000) Rau.(. n (000) Haul(so (900) Hau.l (s)
Livetock 355 447 139 s0 407 33 121 465 36 556 445 249Core 1,539 254~ 391 163 202 33 45 198 9 1,749 248 433W,.heat 1,614 307 496 41 311 15 i11 543 61 1,767 323 570Sorghto 694 403 356 69 333 23 15 363 3 974 394 384Vrrotahis 111 Seeds 200 367 77 13 632 10 3 559 1 217 406 56Other rai-s 340 378 129 24 535 13 24 393 9 369 369 131Clteo Oris1,120 .1 10 1,369 14 159 661 103 169 705 119Fresh Orsite 13 1,013 10 2 651 2 12 563 7 24 752 15Vegetables 5 939 3 1,311 1 - - 6 970 6Potatoe 21 999 21 3 1,229 3 4 770 3 28 998 29Sugar 371 1,092 742 704 1,246 079 0 920 .0 926 1,210 1,122Wtar 104 1,040 526 122 1,051 13S - - 623 0,045 656Elou 1103 750 79 33 1,367 73 22 635 03 101 919 166Combussihlr 1lerl 41 933 132 21 1,373 30 1 11.1 164 983 162Os---sd 42 632 27 73 1,083 90 7 618 5 124 900 112Char-al 21 961 20 114 736 06 - - 135 796 107Other Fores rodorts 49 6021 30 353 1,233 436 199 1,123 223 653 1,146 691
Vebirles ~~~ ~~~~ ~~59 933 56 6 1,531 7 2 931 2 66 942 63Lize 240 636 133 99 010 81 0 1,160 .1 340 690 235Ce-rt 1,00)9 4~77 491 65 579 38 6 616 4 1,001 464 323Oalt 469 706 331 36 561 20 a 904 .1 505 696 352Li,-srt.. 426 910 392 232 620 1144 - - 0 639 813 536store 431 446 192 164 492 61 31 369 12 627 454 295Other P0ar1 rd-rts 225 933 215 416 509 337 6 339 2 653 648 554louSf rdot 301 345 133 135 1,221 165 5 603 3 327 372 302pot-l-s 1,403 046 _ 247 1,336 394 524 5 365 .1 2,803 632 1,771Orruole- Prod-rts 1,079 689 1,196 136 6023 94 36 553 32 1,693 791 1,523Fathages 926 633 774 447 1,049 469 231 779 105 1,607 683 1,423Sth-r 8rdrt6 467 40 59 676 45 19 460 9 164 544 09
Total 13,296 599 7,912 3,057 772 3,664 1,094 667 741 19,577 646 12,320
YEAR 1974
Li-et-rk 231 479 110 38 430 86 90 451 36 350 465 16Oars 3.~~~~~~~~2203 266 567 120 2053 35 49 216 15 2,443 261 637llheat I ~~~~ ~ ~~~,9t13 352 592 39 502 20 24 205 8 1,006 310 622
S-eghte 1.109 362 415 66 0008 06 40 212 9 1,256 331 441Vegetaie sOtl Seeds 175 365 64 31 535 17 1 163 .2 206 389 91Other Griai 019 415 91 13 639 6 19 622 12 251 443 112Citrus Fruits 0 953 .1 4o 973 4 144 647 93 145 636 97Fresh Feuits 22 915 21 5 1,346 7 20 614 1246 827 40Vegetables a 1,062 6 0 725 .1 (K - 5 6 1,927 6Potatoas 53 609 32 1 1,134 2 5 656 4 60 642 39Osga- 729 1,091 253 609 1,242 757 0 1,176 1 639 1,201 1.006lice 396 1,040 617 133 1,061 144 - - 0 722 1,049 757Flour 166 902 65 44 1,250 55 20 676 14 170 905 134Cb,shutihle herl 111 061 96 26 1,369 36 3 242 1 141 941 1533Tlre--d 42 617 26 53 1,004 57 5 620 4 100 661 67Oharroa 15 945 1-5 03 675 57(C - 0 152 706 72Other Foror Produrts 43 994 43 266 1,200 346 236 1,102 267 366 1,156 657Vehirle- 49 940 49 4 1,313 6 2 739 2 57 963 35Li.e 245 649 159 75 611 61 0 550 .1 321 667 221C-tee 9i7 524 507 28 612 17 4 511 3 1,000 526 526salt 456 709 324 21 516 11 1 326 1 479 699 333Li-sat-s 400 959 370 243 939 230 - - 0 632 920 691stose 399 572 149 135 503 68 61 303 19 396 394 235Other Hi.ecal Pradu-ts 062 1,006 207 414 672 341 3 725 2 700 961 631Sletal Frodurts 402 34,4 10~2 101 1,273 196 7915 3259 27Petteole- 1,011 826 1,901 1,435 406 302 - - 0 2,646 396 1,563?et-1l-a Produss 1.330 614 1,065 124 6908 76 29 520 13 1,462 791 1,156P-kages 71 477 34 47 671 32 17 486 6 135 546 74Other Prodect 922 615 791 347 1,069 572 265 625 219 1,5333 674 1,342
.tarl 13,673 560 7,605 4,507 764 3,302 1,066.1 701 747 19,5331 622 1,4
YEAR 1975
Li-at-kI 473 483 229 47 444 21 95 400 36 616 467 166C.r. 1,461 246 362 190 556 06 59 359 21 1,621 251 407Wheat 1,744 359 539 57 515 29 10 206 2 1,614 313 571S-rg-s 954 393 353 46 335 16 14 531 3 967 368 373
VgtbeOil SdreS 75 396 55 15 755 102 - 091 461 42Orhrr Ooic 157 453 71 11 576 7 20 563 13 169 472 899it-ru S-tatc 1,305 0 4 1,564 6 09 666 60 94 700 66Freh Frulrs 23 937 22 6 646 4 36 669 25 65 772 51Vegetchles 7 1,107 6 I 019 10 74 .1 8 1,060 9Potatoes r 1,155 7 0 2,113 12 1,033 3 9 1,152 11Sugar 175 994 175 456 1.307 597 -- 0 632 1,220 771
lOOse ~~~~ ~~~~~~628 1,056 664 130 1,084 142 -- 0 759 1,061 606Flou 116 772 99 31 961 31 19 692 14 167 802 135Combustible isrl 66 873 50 31 1.382 29 2 263 .4 90 976 66Firewood 55 624 22 61 1,549 65 6 613 4 104 875 91Charcoa 14 930 13 100 666 69 -- 0 114 719 62Other Forest Prdutrs 62 584 55 266 1,161 310 296 1,144 238 337 1,122 6033V.hi,les 37 660 32 7 1,521 12 2 855 2 47 966 46Lime 169 605 115 62 663 71 9 50 .1 272 683 1866C--ner 612 547 441 25 516 13 2 379 1 849 541 454Salt 476 772 569 25 423 11 2 344 1 505 731 360Liosee... 304 696 273 207 007 164 -- 0 312 692 437Sro.es 396 403 160 76 561 43 72 549 25 545 416 226Other Niceral Products 261 965 256 417 760 325 71 997 21 699 662 693-te1 Pr-dusts 341 355 121 02 1,101 91 6 345 2 430 497 214Fct-ol-t 1,015 770 762 1,156 396 459 - 2,173 371 1,240Peteol-se Ptod-rs 1,112 729 610 126 672 06 34 650 22 1,274 721 916P-khag- 76 463 55 46 671 31 16 403 6 139 532 74Other Products 645 021 694 316 1,010 321 266 911 216 1,429 661 1,231
Total 11,627 574 6,796 3,936 763 3,013 990 723 716 16,756 628 19,518

- 57 - TABLE 2.7Page 2 of 2
ARGENTINASECOND RAILWAY PROJECT
Freight Traffic Statistics(1973-1977)
YEAR 1976
BG NG SG TOTAL
PRODUCT t Average t-ku t Average t-km t Average t-km t Average t-km(000) Haul (e) (000) Haul (m) (000) Haul (T.) (000) Haul (M)
Livestock 544 497 270 60 461 29 130 447 59 735 487 358Ctut 1,601 244 390 101 228 23 72 199 14 1,773 241 427Wheat 2,204 252 556 85 361 31 31 247 8 2,320 256 595So,rghuo 1,185 541 642 126 425 54 62 335 21 1,374 521 716Vegetable Oil Seeds 88 377 33 7 568 4 0 175 0 95 390 37Other Grain 73 480 35 11 541 6 14 417 6 98 478 47Citrus Fruits .1 831 .1 5 1,143 6 110 618 68 116 643 75Fresh Fruits 36 1,032 37 11 543 6 22 612 14 69 819 57Vegetables 10 1,109 11 2 1,366 3 1 438 1 13 1,090 15Potatoes 9 1,231 11 1 1,304 1 2 981 2 12 1,190 15Sugar 220 989 218 601 1,216 731 0 - 0 822 1,155 949Wine 632 1,049 663 124 1,064 132 0 - 0 756 1,052 795Flour 111 758 84 40 1,128 45 21 630 13 172 827 142Combustible Minerals 96 915 87 16 1,246 20 4 194 1 116 935 109Firewood 28 620 17 70 1,057 74 5 516 3 103 910 94Charceal 12 906 11 72 784 56 0 - 0 83 801 67Other Foreet Products 61 1,030 63 294 1,138 335 166 1,186 197 521 1,141 594Vehicles 31 763 24 6 1,443 9 3 1,038 3 40 889 36Lire 177 649 115 100 814 82 .4 369 .1 277 708 196Cement 981 551 540 29 600 17 3 446 2 1,013 552 559Salt 452 809 365 34 586 20 2 560 1 488 792 386Limestoro 431 906 391 232 962 223 0 - 0 663 925 614Stones 291 493 144 196 487 95 65 360 23 552 475 262Other Mineral Products 190 1,042 198 390 880 343 36 1,007 36 616 937 577Metal Products 252 431 109 85 1,336 114 3 431 1 340 658 224Petroleum 992 685 679 295 259 76 0 - 0 1,287 587 755Petroleum Products 1,033 750 775 128 686 88 51 708 36 1,213 741 899Packages 55 395 22 32 1,012 33 14 516 7 102 609 62Other Products 851 801 682 317 1,016 322 251 797 200 1,419 849 1,204
Total 12,646 567 7,172 3,470 858 2,978 1,068 668 715 17,188 632 10,866
YEAR 1977
Livestock 291 487 141 54 499 27 148 393 58 493 460 226Core 2,336 211 494 255 210 53 72 175 13 2,663 210 560wheat 2,850 261 744 105 315 33 28 174 5 2,983 262 782SorghvO 1,354 360 488 269 400 107 27 205 6 1,650 364 601Vegetable Oil Seeds 43 425 18 7 652 4 0 170 0 49 455 23Other Grain 122 363 44 16 513 8 31 297 9 169 365 62Citrus Fruits 0 - 0 5 976 5 92 620 58 97 644 63Fresh Fruits 10 1,123 11 5 749 4 12 631 8 27 833 23Vegetables 2 1,062 2 2 888 2 .6 846 .5 5 959 5Potatoes 4 1,184 5 .5 525 .3 5 789 4 10 951 9Sugar 311 1,002 311 780 1,215 949 0 600 0 1,091 1,155 1,260Wine 627 1,073 672 128 1,064 136 0 - 0 755 1,071 809Flour 100 781 78 56 1,379 78 18 619 11 175 956 168Combustible Minerals 133 930 125 2.4 1,275 3.1 1 201 .2 137 938 128Firewood 21 645 14 62 1,126 70 6 607 3.6 89 977 87Chercoal 7 973 6 81 668 54 0 - 0 88 691 61Other Forest Prodocts 38 1,053 41 243 1,208 294 140 1,160 162 421 1,178 496Vehicles 32 761 24 4.6 1,258 5.8 4 1,012 4 40 844 34Lime 201 581 117 107 832 89 .2 421 .1 308 668 206Cement 1,091 548 598 23 529 12 10 452 5 1,125 547 615Silt 397 841 334 37 693 26 1 440 .5 435 827 360Lir.csto-t 306 946 290 284 705 200 0 800 0 590 830 490Stones 469 449 211 358 392 140 98 279 27 925 409 379Other Mineral Products 214 963 206 457 689 315 62 1,027 64 734 798 585Metal Products 364 378 138 83 1,353 112 10 421 4 457 556 254Petroleum 964 631 608 344 353 121 0 - 0 1,308 557 729Petroleum Products 1,322 811 1,072 183 692 127 52 675 35 1,558 792 1,234Packages 52 515 27 31 726 23 16 548 9 99 587 56Other Products 733 840 633 331 1,089 361 217 739 160 1,301 887 1,153
Total 14,415 517 7,452 4,313 779 3,359 1,051 614 646 19,782 579 11,460
Sourc;: FA
July 1978

H OHZOOOHOOHOHHLOH HocDo-SCOOICCO Ho C-CC-DO 0C-CCC00000000 00C-000CbO 000 HO tCC0H OOOH.CC-COHCOHCC 0 DC 0-SoO OCOC-CrOCO C-C OC-C0
0CDHO -d H�C0OH��0 C-C
O HOC,o0-C00C- S OooOOooooHoooOCDO< H-C-CO-C050 000C0C-C OOHOo 0 OC'CDbC-CC-CC000C-CZO-OC--"O00 00DC OOOCD0CDCCCDCD0 00 000000000000 0 OSOHOCOOo CDHC--CHDC-CHH0CDOS CO HCOC0C-CHOOSHH00
0000C-OOOCOHOOOCCSCD0CDD00000C-00000000000000CCC-D H O0000000000000C000 OO0OCDC-000C-D- 00000CDCD 0 00000 OCOHOOOC-C-CCD - 000-000 C-C- 0000 oooC-CZooC-oHC-.o ,-H 0000CCCDD 0 00000CC 0nC-CH 000000
000 00 0 C-0 000C Hoo 00 CC OC C-"OOCOC-OC--000 00 0HO 000 0 00100CC 000 OH 0 wo-Z 0 OHOOCC 00-Ct oHS 0 0C-D000 0 00OO�-C 000 OCHi 0
cOC- 0C�0C00O 0 0000-0 CC�-C-000-- 05 5
0C- OOC0. - 0000C- 0CD 0 CDO0OCD H 00000-0 0 H 00000 H O,- o -- a 00000 H0. 0.0 0 0 00-00- 0. 0�0 CD o dC-C-Co-C 0 0. 0.0 CD 000,g� 0 0 0 0000 00 00 0 CD CC-COO 0 00 SO 0 COOP H
C-CO COO 0 DC C-C "00 - 0C C-CO C-C� CC- o - 0
00. CC 0 00. CD H 0 00. 0 -CO H0 0 0 0 -CO 0 0 C-C CC H C-C 0 Ho C o CD o 0 0 0 0 0 0 o CD C-C
0 0. Ct 0 0. 0 o -� 0 0. 0 CD HCD 0. 0 0� 0 0- 0 0 0 0 0. 0 � 0.0 0 0- 0 0 - 0 0 0
0 C 0OCCC H -" - C- - H
H OH CC-HHOO H OHHHC0C0HC-O H 0CC-C HC-OHoH - OHHH-C-C-COHOOH 0-C OH H O,0HC 0H -"OH-COO HHHHHOo C-0OC---COH 0-C OCOCOOH CO HOHHHHOOHHOH OHOHHH -C0C-0C0C-0H OH OH HO0CHHH OC-HH- -P-O-HH UCOC--C0C-0-C0 0-0H HOHHOCOHHHHO-CHUCH-CC-H CO-OHHC---C-CH OCHHHO H OUCH OCOOOOO 00H0C-HHOOOH-J C -C-0HHC--C �--CH HOHO HHC-CC-OHOHO OC-CC-HHHOO,--C Hi HOHHOI 0
- - -- OC-C 0 0 - C-0 OHOC-C0 C-C->H HHOHOHOHH-.CHOOCOHOOHOC---C OHOHH CC- H HHOH
0000HOHHHOCCOOOOHOo OHHHH H OH HH000-OOH HHHHH-CC--C--CO HHHO 000CHH H 0<
-OH-C-DHHHOHH 0C-cOHOHOH H HOC-OH HH0OHH OHHOOHHHH NCOOCHHOCHHOOOCOH OH HHOH OH HHOHO0HHO -O0C-HHOCOHHOOOH H-C-HOC-C-C 00 HHHHC-HHHH OHHOHC--C-OO0C--CH CC--C--CC oH-OOH--C HHC-0H0400H-C-C HHOOHo-COO OHH,-C-CC-C -HHUC-HC- OHHO-CHHHH HHOHOoOOOO OC--0C0H 0-HH---D 00 0
0- C--COH o-., H
0 0
H �-CC-- 000 HHHHO0HOH 0C-� H OCH 0 C-JCHH OH UC- HUCCHOHO OH 0 OHO OCH -CO-COCOHHHC-O 0-C-C-CC--CCHHC---C HOUC OH H-.C-.DC-OHH H HHCOOHHC---CH OHHH HO HHH HOHOHO OH 0-OCHO 0-C�HHOH0-C- -H OHH HOHOCC-0OHOCHOHO OCOCOHO OHOHOHOOHO -C OOHOCCC-H H HOHOC-O OHHHHC-0C-0HH0OUCHH 0CC 0HHHO H COO 0-CO HHHHHC--COHH OOC-CC.CCHHOHHC H�H0CO C--S
0- - . - 0
0 H H H
0 HOC-CO 000 H HC-- 00 HoC-- H HHH 0HH 0 00 0 000 OHHHHH0 -O �--C 0 0 0 COH 0000 0H00H HC-OH HOH HHOCCOOH C-DC HOHHHHOHCaO - OHHoH OOHHOH 0 H00000000 OCDCO HOH OOHOHH Ho 00 0H 00CC-OC-OOHHHHCO OC--"--CHOHC-Oo C HHHHHOOOC-O H HHHC-CHoOOHOOHOOHHHHC H OHOHO CO-COO C-- HHC-HOHHOH OOHH HHHOC-- C -- LC-00-HHHH H H 0
- - C-C 6H H H o o H C-�-C C--CH H CO CO H
5000000 - - �-C--o�-�0C--C H 0 00-CO o6 C-A
O OOHHHC< HHHHHoHoHHOO COHO OOCHHH 0 C-O 0 0 OHHHOHH0OHC--COC-HHOH C-OHHOOOOHO COHHOHC-C-COHHHHHHHOHHOH 0-C-OHOHHH-C--C COO 0 0 CO 0 00 0H HHHHHHO OHOOCOHO H Hoo HHHHHHOH CO 0 0 HCJCHHC-CC- HO HHHOHCOH H 000 HHOHHH HO'c HC0 HOOHO 00 OHOOHOUC-000- OHOOHOHO 0 00 0 H 0 0 HOH CC-COOHHO-CHO HOC0OHH 0000 C HOHHOHOOCO HHHC-OHHH OOOCHUC-C-0C--C-HOHOOC HHHHOHHOC-c 0-C-C- 0C-OOOH 000 HOC-- CC-HO 0C-0C-0OC- HO OHOHOO -CO 00 H H C-C-C C
-0 100-C C-C Ho H 0 -� 0 H
0 0
OOHOoHOHHC-- 0 OC-HO OHO -- C�-C-HOHo 0 OHOCOC300HC--0 000 H0H 0-0000 -CC HHOC-OHOHH 0 HHO 000' HoOOO-C -C-C-C-C HCO OCcH0oOoH OHOC-HOC-OH00 CO C- OOHHHHHOCH 0 OHHHH0H OHHHOOH 0000-C- HOHOOO CC-OH 0 OHHO000HHOO OHooOH-j C 0000000C-CO 0-0
O 0 H 0 00 0
CO OHCOOOHHH 0 00 HO 0 H - HC0H ooOO 0 -COo OH C- 0 0-COO - 0-0 00 0CC-C- -C OHHC-H0CHHCoCH C- C- 00000 C 0000 0 HOC-HO- C- C- OCO COO Co C-H-C C 00000 C- 0CC-COO 0 HOC- OCUC-C-O C C-0C00CC-HC-COO COO C- 0000 00
0 00 -C -C-C 0-C
O HO 000 0000 OHHC-OOC-OC-HHoHH 0 00 000 00 00 0 0 H00 OH HoOH H HO OoH 0000 00 HC-0000 0000 H-CC- CCH oH 000 00 00 0 0 00000 0-COoCO H HO 000 OH HO 0 0 00000 000,0 0 HO 00,0 0 HoooO 00000 0,00-CO 00O HOC HoOC- HOC- 0-CC-C- OC- OC -CO 0HC--0-C-0000 0 HOC- OHOC OHCHOC- OC- 0CC 0 OHOHCH0HH H HOC- HOOC- OH-C P-CHCHC-CC-C-C-00000C-H0--C-CHH cC-C-
0 0
0 HOC H0HCHOCH0CC- C-HC- C- 00000 C- HHO 0 00C-HH0C HOC HOC- C-C-CC- 0000CC- HOHO CC- HOC OHC--CCC0HC-o0C-0C-0C-C0HHH-H000-C��-C
H 0 H oH 0 H 0 000 0
OHOOHO 00CC-HO C0 Ho0OC- OHOOOC-HH H HOOHOHOOHO Ho- H-HO 000-COOH H�O0OHoHOOH0 0000 C-H 0000 0CCO OOHH0OH0HHOH0HOOOHOOO OHOHHC-O0 0 00000 COOHHC--HHOOO 0000 HOHO HoHO - 000000 000oH 0000 0�-o oHOHo 0C0 HH HOoo0H 000000 O0C--C0H0000000000 0 OHHHOH 000000000 C-OCOOHC-0HH0000 OOHOHHOH 00000C-OHOoOOOHOHHOOHOO 0- OH
000000 H
0 00000000 OO�0000OoO OHOHOHOHO H 0HH00000 OOC-CHOoOOoOOOO 000000 H 00000000 OHoHOOOO000-C-C-CC-0 OHOCQO 0 0-0 H 0-O oooooooooooHoo 00000000000000 H ooOoooooooooooo-C 0000000 OCOHOHO 0 000000000 0oHO�o 00000000000 C-o 00 0 CC-H0 00-0-00< 00000-HO 000000000 Oo-oOC--0 0 OH-HOoHHHoO-HO O00000C-CC00000000 0-C OHHHOC--COHHoOHH 0000 OooOOOOoH 0 00 CC-
0 OC-
O 0 0 �0 0 0 0- 5
O HHHHO000 H 00 oC - 0000 0 oC---OooOC-C-C-o00--C C-Ce - 0000 0 OooooHooo H 00 0 H00� C--C-0 OooOOO 0oH0H0OOC0Oo�--C0-CH0 000000 C-C -000 OOOHOHOC-O0000HOHHHH00000 0HC-C--000000-HHHOH 000 0000000> -0000000 OHC--HOHOO C-0o00O0-�C-0�C0O00 HHC--COHC-C0H 00000000-0000000 OHOO0H 0 HCOCOHOHOH 0000000 OOoHOO-CH-C--C0000C.C-
0 0 0 HOC-O 0C-0 0

TA3LE 2.8Page 2 of 2
ARGENTINASECOND RAILWAY PROJECT
Freight Traffic Forenssts
(1978-1983)
YEAR 1981
lBG NG SG TOTAL
PRODUCT t Average t-km t Avrage t-k t A-erge t-ko t Average t-km(OD0) Hoc! rillio- (ODD) hal million (O00) Haul million (000) DouG nillion
Livestock 147 487 71 21 499 10 69 393 21 237 453 10lCorn 2,334 242 565 160 236 42 51 217 EL 2,565 241 618
Wheat 2,700 285 770 170 344 60 29 194 6 2,904 288 836Sorghur 1,914 384 735 215 427 92 21 217 0 2,150 387 832Vegetable Oil 215 373 80 27 576 I6 - - - 242 390 96Other Grains 312 451 140 38 632 24 30 361 11 381 460 175Citrua F-rits - - - 7 1,80Q 7 93 141 60 100 672 67Fresh Fruits 12 1,131 14 9 773 7 32 667 21 53 788 42
Vegetables 5 1,091 6 4 933 3 1 909 1 10 1,025 10Potatoes 66 1,200 79 - - - 32 795 25 98 1,065 104Sugar 242 1,000 242 655 1,216 797 - - - 897 1,158 1,039
Wine 776 1,054 817 182 1,050 191 - - - 9S8 1,054 1,010
Gloat 62 720 45 32 1,246 10 7 056 4 101 680 89Combustible Mimerala 407 949 386 4 1,306 5 - - 411 160 66
Fire-ood 5.7 661 3.8 17.8 1,153 20.5 0.5 623 0.3 24 1,018 24
Charcoal 15 1,000 15 235 687 162 - - - 250 707 177Other Forest Products 53 1,050 5 266 1,176 313 213 1,137 242 532 1,147 610Vehieles 36 766 27 7 1,261 9 2 1,024 2 45 854 38Lime 264 598 158 124 855 106 - - - 388 681 26.
Ceeo-t 1,393 540 752 29 524 15 14 447 6 1,436 52 75
Salt 457 837 392 40 706 26 5 500 3 502 842 423
Limestone 631 1,022 645 386 760 294 - - - 1,017 923 939Sto-es 556 463 257 244 406 99 311 290 90 1,111 401 446Other Mineral Prod-cts 230 1,054 242 548 757 414 106 1,125 119 884 875 774Metal Prodocts 429 371 160 103 1,330 137 11 422 5 543 557 302Petr-leum 782 508 397 289 285 82 - - - 1,071 447 479
Petroleum Praduccs 1,338 772 1,032 202 659 133 16 640 10 1,556 755 1,175
Othar Produnts 787 832 654 446 1,075 479 252 732 185 1,485 868 1,318
Total 16,168.7 540.5 8,739.8 4,485.8 799.3 3,585.5 1,295.5 643.2 833.3 21,951 552.9 12,136
YEAR 1982
L_vestack 123 487 60 18 499 9 58 393 22 199 458 91Corn 2,579 242 624 198 236 46 57 217 13 2,835 241 683NIt:eat 2,955 285 843 191 344 66 31 194 6 3,177 288 915So-ghun 2,333 384 895 262 427 112 26 217 7 2,621 387 1,014Vegetable Oil 235 373 87 29 576 17 - - - 264 396 104Other Graina 436 451 197 53 632 33 43 361 15 532 460 245Ctccus Fruits - - 7 1,000 7 93 641 60 100 672 67
tresh Fruits 12 1,151 14 10 770 7 34 667 23 56 788 44Vegetables 5 1,091 5 4 933 4 1 909 1 10 1,025 10
Potatoes 95 1,200 114 - - - 47 795 37 142 1,065 151
Sugar 247 1,000 247 669 1,211 810 - - - 916 1,158 1,061
Wine 832 1,054 877 195 1,050 205 - - 1,027 1,054 1,082
Flout 62 720 45 32 1,246 40 7 556 4 101 880 89
Combustil>le Minerals 416 141 395 4 1,306 5 - - - 420 160 67Firewood 4.1 661 3 12.6 1,153 14 0.3 12i D 17 1,OIS 07
Cha-acol 17 1,000 17 273 687 168 - - - 290 707 205
Other Fotent Products 8 1,050 61 291 1,176 342 233 3,137 265 582 1,147 669
Vehicles 39 766 30 7 1,261 9 2 1,024 2 48 854 41L.ne 275 598 164 130 855 111 - - - 405 681 276
Ctenat 1,454 540 785 30 524 16 10 447 7 1,499 52 7S
Salt 463 857 397 41 706 29 5 500 3 509 842 429
Lines tone 676 1,022 694 415 760 315 - - - 1,093 923 1,009
Stones 607 463 281 267 406 158 340 290 98 1,214 401 4S7
Other M+ineral Produets 256 1,054 270 609 757 461 118 1,125 132 983 875 860
Metal Prodocts 486 371 180 117 1,330 156 12 422 5 615 557 342
Petroleum 782 508 397 289 285 82 - - 1,071 447 479
Petroleum Products 1,385 772 1,069 209 659 138 16 640 10 1,611 755 1,216Other ProAunts 857 832 713 485 1,075 521 275 732 202 1,617 888 1,436
Total 17,691.1 534.9 9,464 4,847.6 794.4 3,651 1,413.3 646.0 913 23,954 549.6 13,166
YEAR 1983
Livestock 100 487 48 15 499 8 47 393 18 162 458 74.
Cerm 2,826 242 684 217 236 51 62 217 13 3,105 241 748
'Wheat 3,209 285 915 207 344 71 35 194 7 3,451 288 993Sorghum 2,752 384 1,057 309 427 132 31 217 7 3,092 387 1,196Vegetable Oil 255 373 95 32 576 18 - - - 287 396 113
Other Grains 560 451 253 68 632 43 55 361 20 683 460 316Citrus Fr-uit - - - 7 1,000 7 93 641 60 100 672 67Fresh Fruits 13 1,151 15 10 770 8 37 667 25 60 788 48Vegetables 5 1,091 6 4 933 4 1 909 1 10 1,025 10
Potatoee 121 1,200 145 - - - 60 795 48 181 1,065 193
Sugar 252 1,000 252 683 1,216 631 - - - 935 1,156 1,063
Wine 889 1,054 937 208 1,050 218 - - - 1,097 1,054 1,155Flour 62 720 45 32 1,246 40 7 556 4 101 880 89
Cob-ustible Minera]s 426 149 63 4 1,306 5 - - - 430 160 68irewood 2 661 1.3 9 1,153 10.4 1 623 .6 12 1,018 12.3
Charcoal 20 1,000 20 310 687 213 - - - 330 707 233
Other Forest Products 63 1,050 66 317 1,176 373 253 1,137 288 633 1,147 727Vehicles 40 766 31 8 1,261 10 2 1,024 2 50 854 43
Lim 287 598 172 135 855 115 - - - 422 681 287Cement 1,515 40 61 31 524 16 16 447 7 1,562 52 84
Salt 470 857 403 41 706 29 5 500 3 516 842 435Limestone 725 1,022 741 445 760 336 - - 1,170 923 1,079Stones 659 463 305 290 406 118 369 290 107 1,518 401 530Other Mi-eral Products 278 1,054 293 663 757 502 128 1,125 144 1,069 875 939
Metal Products 543 371 201 130 1,330 173 14 422 6 687 557 360Petroleu 782 506 397 289 265 82 - - - 1,071 447 479
Petroieum Froducon 1,434 772 1,107 217 608 143 16 640 10 1,667 755 1,260
Other Products 926 832 770 .525 1,075 564 297 732 217 1,748 888 1,551
Total 19,214 472.7 9,083.3 5,206 791.9 4,122.4 1,529 545,9 987.6 25,949 546.9 .14,192.3
Sutce: FA and Bank Staff
PFeruary 1979

ARGENTINASECOND RAILWAY PROJECT
Fqrecasts of National Production of Commodities Used to Forecast Railway Traffic
(000 tons)
Product 1a7fJ77 1978 1979 1980 1901 1962 1983
Livestock 5,807 9,423 9,770 10,346 10,601 10,759 11,029Corn 8,300 8,655 8,836 9,019 9,206 9,396 9,588Wheat 11,000 8,o45 8,206 8,364 8,518 8,670 8,819Sorgum 6,600 5,999 6,374 6,755 7,1143 7,539 7,940Vegetable Oil Seeds 900 978 1,005 1,033 1,061 1,089 1,118Other Grains 3,636 2,840 2,850 2,860 2,870 2,880 2,891Soy Bean - 1,181 1,399 1,628 1,873 2,136 2,420Citrus Fruits 1,484 1,492 1,603 1,685 1,789 1,851 1,937Fresh Fruits 2,158 2,146 2,217 2,291 2,369 2,449 2,525Sugar 1,46o 1,450 1,470 1,490 1,511 1,532 1,554Wine 21,748 22,900 23,215 23,543 23,958 24,286 24,620Flour 2,616 2,789 2,834 2,879 2,924 2,969 3,014Combustible Minerals 1,465 1,640 1,844 2,080 2,354 2,676 3,052Firewood 1,095 1,117 1,095 1,073 1,052 1,031 1,010Charcoal 278 422 434 447 461 474 489Othcr Forest Products 3,151 6,399 6,885 7,417 8,008 8*6u6 9,204Vehicles 313,174 342,803 397,688 448,206 505,409 569,876 642,785Cement - 4,623 4,851 5,100 5,356 5,627 5,932Salt 711 775 793 811 829 846 864Limestone 14,050 14,8oo 15,650 16,550 17,500 18,450 19,500Stones 8,070 8,604 9,196 9,817 10,510 11,242 12,039Other Mineral Products 3,198 3,530 3,914 44338 4,813 5,330 5,916Metal Products 8,603 9,004 9,416 9,870 10,356 10,888 11,460Petroleum - 22,500 23,100 23.600 24,200 24,800 25,400Petroleum Products 18,295 18,780 19,262 19,778 20,302 20,837 21,409
Source: CONARSUD, La Evoluci6n Historica y Proyecciones por Producto de los Traficos Ferroviarios
February 1979

ARGENTINA
SECOND RAILWAY PROJECT
Intercity Passenger Traffic
ACTUAL __ ____ FORECAST
1965 1966i1967 1966 1969 1970 1971 75 196 7 1978 1979 1980 1991 1982 1983
Passengers (million) 53.8 51.7 43.4 46.2 43.2 26.7 25.6 20.0 20.7 22.0 23.5 22.6 15.1 14.7 14.7 14.1 14.9 14.9 14.9
Broad Gauge 36.2 34.5 28.7 31.1 29.8 15.9 15.1 12.9 13.5 14.8 16.5 15.4 10.8 10.6 11.1 11.3 12.1 12.1 12.1
Narrow eGage 13.8 13.2 11.1 11.6 10.7 8.40 8.25 4.90 4.88 4.79 4.43 4.63 2.42 2.02 1.61 0.73 0.73 0.73 0.73
Standard Gauge 3.79 4.01 3.57 3.51 2.71 2.41 2.21 2.15 2.30 2.40 2.53 2.52 1.85 2.07 1.98 1.71 1.71 1.71 1.7l
Pans-km (billion) 5.43 6.20 6.15 4.74 4.98 5.03 5.51 6.20 6.56 6.04 4.41 4.36 4.34 4.13 4.36 4.36 4.36
Broad Gauge 3.78 4.33 4.33 3.32 3.52 3.64 4.07 4.66 4.91 4.48 3.40 3.34 3.50 3.57 3.80 3.80 3.80
Narrow Gauge n.a. 1.15 1.32 1.26 0.96 1.00 0.91 0.94 0.99 1.07 1.03 0.60 .50 .40 .18 .18 .18 .18
Standard Gauge .50 .55 .56 .46 .46 .48 .50 .55 .58 .53 .41 .46 .44 .38 .38 38 .38
Average Distance (ki) 125 134 142 178 195 252 266 282 279 267 292 292 292 292 292 292 292
Brond Gaulge 132 139 145 209 233 282 301 315 298 291 315 315 315 315 315 315 315
Narrow Gauge n.a. 104 114 118 114 121 186 193 207 242 222 248 248 248 248 248 248 248
Standard Gauge 140 157 207 191 208 223 217 229 229 210 222 222 222 222 222 222 222
Train-km, (regular service) 39.0 37.6 38.3 35.3 37.2 29.6 32.0 30.5 29.7 29.3 29.4 29.5 21.5
(million)
Broad Gaoge 26.7 25.0 25.7 23.8 24.3 17.6 19.5 18.1 18.9 19.1 19.8 19.8 15.0
Narrow Gauge 7.82 7.92 7.53 8.28 9.05 8.99 9.1 9.0 7.60 6.93 6.32 6.50 3.84 b/
Standard Gauge 4.50 4.68 5.06 3.26 3.88 2.96 3.4 3.4 3.20 3.27 3.30 3.14 2.65
Train-km (mixed trains) 9.07 11.27 9.06 8.09 7.11 6.69 6.57 6.78 6.83 7.04 3.23
(million)
Broad Gauge .. a. 4.94 4.73 4.83 4.71 4.50 4.14 4.16 4.29 4.17 4.22 2.06
Narrow Gauge 3.87 4.58 3.65 2.98 2.40 2.34 2.22 2.22 2.33 2.50 1.14
Standard Gauge .26 1,96 .58 .40 .21 .21 .19 .27 .33 .32 .03
Train-km (total) 47.4 46.6 46.3 37.7 39.1 37.2 36.3 36.1 36.2 36.5 24.7 18,15 17.78 16.0 16.0 16.0 16.0 V(miI ion)
Bread Gauge 30.6 28.5 29.1 22.3 24.0 22.2 23.1 23.4 24.0 24.0 17.1 13.0 13.47 13.47 13.47 13.47 13.47 I
Narrow Gauge .. a. 11.45 12.86 12.71 11.97 11.50 11.34 9.82 9.15 8.65 6.82 4.98 2.51 2.00 .91 .91 .91 .91 QStandard Gauge 5.32 5.22 4.46 3.36 3.61 3.61 3.39 3.54 3.63 3.46 2.68 2.64 2.32 1.62 1.62 1.62 1.62 ,
a/ To be confirmed and agreed witll the Bank after the results fwu, the study of the long-distance passenger service are available.
b/ Forecasts have been made only of total train-ka and not the composition between regular and mixed services. Mixed train services which were reduced by more than 50% in 1977 and which comprise about 127
of the total service at present, are expected to decrease further to about 57, of the total service by the end of the forecast period.
Source: F, and Bank
July 1978

ARGENTINA
SECOND RAILWAY PROJECT
Suburban Passtener Traffic
_ _____________ ACTUAL __ ____ __ - FORECAST -1965 1966 1967 1968 1969 1970 1971 1972 1973 1974 1975 1976 1977 1978 1979 1980 1981 1982 1983
Buenos Aires
Passengers (million) 444 429 406 446 450 414 409 379 363 393 412 411 387 396 401 404 409 413 416Broad Gauge 360 345 327 359 361 335 335 315 304 328 344 343 324 332 336 339 343 346 349Narrow Gauge 59.7 60.2 56.4 62.1 64.3 55.7 51.8 43.4 39.8 44.2 44.5 45.3 40.7 41.8 42.2 42.7 43.1 43.5 44.0Standard Gauge 24.1 24.0 22.9 24.6 24.5 22.8 21,9 20.2 18,7 20.5 23.7 22.4 22.7 22.1 22.3 22.5 22.8 23.0 23.2
Passenger-km (billion) 9.07 8.84 7.86 8.65 8.62 7.95 7.83 7.33 7.12 7.69 7.97 8.24 7.96 8.15 8.23 8.31 8.40 8.48 8.57Broad Gauge 7.71 7.49 6.56 7.22 7.15 6.65 6.62 6.28 6.15 6.64 6.86 7.09 6.85 7.03 7.10 7.17 7.24 7.32 7.39Narrow Gauge 1.054 1.056 1.008 1.112 1.153 1.008 .937 .788 .725 .779 .801 .847 .779 .800 .808 .816 .824 .832 .841Standard Gauge .304 .299 .292 .314 .312 .286 .273 .260 .241 .269 .309 .305 .329 .320 .323 .326 .330 .333 .336
Average Distance (km) 20.4 20.6 19.4 19.4 19.2 19.2 19.1 19.3 19.6 19.6 19.3 20.0 20.6 20.6 20.5 20.6 20.5 20.5 20.6Broad Gauge 21.4 21.7 20.1 20.1 19.8 19.9 19.8 19.9 20.2 20.2 19.9 20.7 21.1 21.2 21.1 21.2 21.1 21.2 21.2Narrow Gauge l7.7 17.5 17.9 17.9 17.9 18.1 18.1 18.2 18.2 17.6 18.0 18.7 19.1 19.1 19.1 19.1 19.1 19.1 19.1Standard Gauge 12.6 12.5 12.8 12.8 12.7 12.5 12.5 12.9 12.9 13.1 13.0 13.6 14.5 14.5 14.5 14.5 14.5 14.5 14.5
Iraisn--k (milli.oni) 30.3 30.6 32.4 33.0 31.8 33.5 34.1 31.9 32.1 32.6 31.9 31.5 29.6 27.2 27.2 27.2 27.2 27.2 27.2Broad Gauge 23.0 23.8 25.2 25.6 24.4 26.7 27.0 25.2 25.4 25.7 25.0 25.2 23.6 21.2 21.2 21.2 21.2 21.2 21.2
Narrow Gauge 6.00 5.58 5.73 5.62 5.56 4.98 5.60 5.01 5.03 5.04 4.89 4.60 4.36 4.98 4.98 4.98 4.98 4.98 4.98Standard Gauge 1.26 1.18 1.47 1.81 1.83 1.83 1.48 1.68 1.64 1.90 1.96 1.68 1.61 1.03 1.03 1.03 1.03 1.03 1.03
Other Cities b/
Passengers (million) 7.54 10.7 12.1 4.10 2.73 1.37 v.
Passenger-km (million) 210 315 353 133 89 44
Average distance (kw) n.a 27.8 29.5 29.2 32.4 21.6 10.1 M
Train-km (million) 4.03 4.38 5.13 3.40 2.27 1.13
a/ To be confirmed and agreed with the Bank after the results from the suburban rail masterplan study are available.b/ This service will be discontinued after 1979.
Soburce: FA a-nd Bank s.affJuTly 197

- 63
LI _GE'1_1 I C -,Q= 2.12-
Mc-c!" �RATI
19 68 9 19 71 __�R72 9 1974 19 7 5 19 7 6
i. SYSTEM
41 7 00 LD,',Co 39, 900 39,8M 39. Boo 39, 800 39,SOD 3-,vo 39, 80, 37. 20D
TI. TRAKKC
P- -b- 1 1 I L45 44' 7 413 �09 38 6 3, 6 3 3�3 405 346 �'3 27 �6 2C 28 1 32 5
.1 49� 493 440 - 406 391 123 437 148 406-b- 8 8, 600 F, . 7,830 7, 50 7, 12C 769C 7 890 8 � L02 7 9 62, 0
6. 3,',B 45�0, c100 711 5 000 5,coo 5,�21 6 14,910 12502.C6 0 L c 6,ASD00 _-:ioo I14,80 i i :7 4 2 OC 23�� 12,500 12,84D 4ilc -4,3707 19.4 1.3 19.4 g., 20.0 19.0 19.6 ',O.,All -z-y - =b_ '11� I 2- 2 2200 202 106 234�5-3, 43 74 12 042.9 2 18 .3 .0 6,3 17 13.S
P igh� t.- - i�g (�illi-) 9.8 0 22 I 19 2ft. ght -t t..-YI. --- -- in (.;Ili-) 12,BDO 13,13c 13,03 ��"Oo 12,500 12,5 0 -2,31 ]C,7 'O.905 11A51.2
�18 683 658 L �7A, -�. J..g1h f h..! 64 2,613 �15 - 64 656M ff- _it� (p- -K'. �I- t- y�) illi- 21,60N 7so 26,30o 26,500 25,03C 25,340 26.410 25,071 25""D 23,�3; 2
111. TRAFFIC DENSITY
1 367 318 321 316 323 354 362 3E7 3117'a5L IlL
273 32
ight I p- - t-K. 3 33i 31' 343 - 3114 31D 283
IV. OPERATIONS
(.illi-) 33.1 3L4 33 . 5 34.3 3' .6 321C 32.4 31.9 31,� n.6:g. 3 37.8 29.5 27.2 2 30.4 30.3 �4 12�7t_ �11-1� 0.2 3.0 5�., 61, - 11.1 2.8 6M 32
35:8 6.5 3�., 35�1 31 3-4 28.9 11.1 301-d 10.9 1.2 2 .3 10.2 3 �.9 5.8 I
117.3 117.7 IC8.3 109.5 loe.5 04.2 99.9 101.7 8��.,Tr.i.-K. by -d. f t-ti..
:t- 11 ..... ti,.. 25 23.6 291.3 4i 56- 0 7' 1 70.2 67 8:,� 51:345.7 .4 6 0. 7- 1
'5.8 3.9 12.1 12 8 14.7 11:7 13:7 13�7 12.9 _,41� 9 I - 1 - ,
10.3 lO.D .0 �s O.- 0 E -0 M -0L- ... ti,. k�:dt- 50.72 �3.3 42 35.2 28.4 21.9 78.9 16.4 -73 1 3
-ti- 7 82.9 85.1 SE�4 897.4 87.6 84.1 82.9 75.321,9 -26 2 12 3 4�8 9 .3 0&_5 10�.5 CO.2
di...l. 17 1 9 10'7 1-7 1 .2 18.1 !7.0 �1.5 1�9:;5' -6
�8:1 %.'2 ;4.2 55 1 5' 7 6 .9 57 6 59I I 7S 75:2 -0... 65�2 6.� 67.6 70'8 7"4 "I 1,; ?� '71 7 �'5
895 7� 6" , 490 "I 36397 79'8 740 698 6 726L--ti- -iI di -1 682 67,0 74' 776 11356 346 35 370 3co 335 332 29 279 256197 508 5351 534 L98 435 43'� 48 469 490
p- L.. ... il.bl./y, t.- 43,000 39,600 41,400 39,41,0 37:000 33,600 34,700 33,500 31,700 39,40D,di,�,-l M ' 121:111 115:111 111,110 118:11�1 117,111 118,400 120,50 119,200 1�2 2 0
R.il- yh - -il 18:'OO'� 57 000 9 000 12,DDO 55 00 54 300 55,500 58,8OC 39 10D 56�600.0 11 103,000 -41,coo -33 800 n2,20c 126,40 16:200;7 00 -0,000 103,000 00
3,56� 3,500 3,364 3,168 2,947, 2,813 2,87, 2,84i 2, 684 2:'3,9.(000) 499 428 351 362 155 34 351 343 327 2,7500 123,800p- ... ilbW y� 136,300 139,4CO 104 300 11 300 120 122,E 122,3.' 120,700 121,800
53,953 53,329 - 380 50,096 49,566 4S,599 44,192 43,016 43,305 40,8�6�(.illi-) 651 651 .. EOS 5670 .. 5 2 4�11_P 366 370 363 352 3 2 137 313 27' 26 I
_1- 1 �,017 1,021 996 960 932 875 8-3 727 717 764,P-i&� -- K. p- - 18:8,0 19,100 19,000 19,200 18,800 20,100 18,40� 16,900 16,60' 18,700.-b (DOO) 651 845 838 823 726 715 69 6 605 587
11 " 2 1, " 11, oao�G_ K. 770 6,20C 4,600 4,300 3,700 3,60aBoo "8:100 8 600 70' 39:111 31:600 3835,200 3 9 36:111 316:111 35'eco.1,5 5 "B 400'800� 100 - 0 1 c I00 I - - 1 50' 40, -2 �002,9 3,7 8 2,1 �,O 000 1,C 00 2 00 2 0 00 0 3 0 Co 90 _:"O.48,800 43 L2.ECO.I. , 11,40 54,400 52�800 51,600 5� 3 0 47,100 45 D 0 ?00
- K� ft.ight .. IY 30,80'0 32,000 32,800 31,603 3-:3,00 29,800 27,500 24:5'00 24:300 21,700.
2 �E��TTNG EFFIC=CY2' -1 21C 202 208 204 207 224 23' 222 239
4 .8 .0 6 .9 5 55_N`
.2 3 4�2 4 4F-igh, t..� 35,7 358 3 73 369 328 351 392 37' 29� 11 I 1123 21,6 271 252 25 7 27 249 2 5, -7
11,1 1,, 1,:�d�d (t.-) 2�.5 D.8 26206.4 2,., 26 .2 28.0 29.1- 26.9 29.3 3I01-d 64 .0 63 63.5 63�3 61.3 51-.i 61.6 61.6 61.1 59�1
51�? 53.7 58.0 11.5 57�9 52.2 2,0 57Zy� 1 9 I I .1 -�'716. 6.3 I,6.� .3 19.4 20.8 20
VI. STAFF EFFICIENCY
- b - -, -1" -- ", (011) 158 150 145 143 140 -L2 41 149 155 126.0N-b f -. 1 3.8 3 3.6. � y.. F. .7 3 , 7 3.� 3.7 3,6 3T-ffi. -1�. P- -Ply- (000) 175 1 6 182 185 1?9 i 76 157. 168 162 175G-- t.-K� p- -pl.y.. (000) 95 213 221 221 210 i95� 164 �4 303
S.-- FAM.y 1978

lOG -j 0 00 20 CoO-A -< 2 10 2 2 AA �G AOAAIAO A 'A -2, GA 002 A 10 A 20 A 0. A 0 01 �A A0 A A 0. 0) 02 A I A A (tOGA A A A A- AG A. A' AG A A 2 2 1002 A A A A) 2 2A 0 UG[G A-Allot AG IA It A AG 2 A 2 A A G'GAGA A I Al A AG2, A A 2 I 202, HGGAG GA GOI' A GA A IA A 12 2 AAA A I A 21 12A AG A AA 12 0� P. A 2A Al A A2A A <'III I 2AAGA A ,-, A- A A AAA CAA�A GAlA A A GA GAO A 2A A GG I I 122 A A 2GAAAAGA 222 Aa -. --0 A'AAAA GA IA A A AA GA AOAG A AG' 0111 2,2GAPAA 0ot AAG 12 <<A GA 020 2 II AAAGGA2CAAA A AGA AA -A 02 OGAII A OGAAGAAAAAO-0 A- GA t,110IG'2 AAA A AA. AG 22G21212- 20 Aa GA Al AA. A 2 I GA A AAAAG 0221222 A a/IA G22A GGAGAG .1111'' 2-2 AOAGAAA G'AGoo10 AAA 01-IAA.--A GA a 2,0
A A 2, A 2 2, - A 2 2 0 2 A I A I I I A A A A A A A 0 0 A 02 A 2 A 2 AG A ' A A 0 GA A 2 A A o A A GA A AAAAG.A 2 22 G-AGAA AAAA AIll Ill II A AAAAAA AGA 2022, 0
01-GA 02 A.A 2 GAO 001-'
AltO AA AA AA AGAG 2 AAA AA AG A2,1 AA GA-a A-i Al A
AG 22 GO A GA 02 -A ' Go
0000 A GA A A 00
AGOGI A
0-I' II> to 10100-00021 .GGAtOI2,I11010G01-.G.G AOG-0'2' Ut GA 10 10 1' 00 01 VGA02,10 10GAo' GA OA'A-200AG,' 001.A001GOAG2 00 00CG0C2,002,1002AtI.I, -2 A 10�(0112, -'1AGAG.G000000A1220 A'
OGGOOGIA -G'G'GI00AG-l'2,00 10'A 00A'101GGGA-IAAOO'ZG A1022G2002A002,' 200000000 OA10GA0000 110000100 1000 0000-A-10GA002-
2 2 0,12,00 0000A'10>0 I 0021020 00 A22,AOGO000000GAA2,
A 010 I 2 2GO GAGAGOGAGOGA 101000110 0000 10 0112102 200000'0010 10 000000 GA1020001.AA'10 00001-10000000002>00 '-'0- l2,210AA11000002 0G-00000001--1000' 1000A-00100-'G00A'00--2,2200200000000.G-2,001000A1
1- 1010101022 'G 12,02100 000-' 10A'-0020A01100000A-'210 0
2 -01 10 202, 01 001011.2,101000000000 101000100000 a002O11G0 000000000010 VA 0
10 00 00 00 2 2 A1000 1010 00 0000 [010,-' GA 10 01 01102 1010 1-' >00 10 0001,-'00101--'>001011--000 210 1010 001010 10 >1000 00
00110 GA 200010100 10 000111 00000011000I00002 00000 0000001 '-10010 02,2 10 10 GA 0010 101000 1'10100010A' A GA LI102100 010012210001010 102 1010�.1100GA0010GA00000A 000001021010 2,1000001001101 221-001000 0-01 000020'-100--10000001010 I.
10201010102100010 10 10 2 10 000010101010102 10010 G2,A'001000 10 A' 10>00 10 110 10
101-' 2 0101 0 000l1002,00000101010200001010�0010>2��01 1010 0002 tO 0,200101 10 02, IaCo '0 20011100100001 00000G0o0000AA0000A-0100000000000010O000110Afr�0010l01 20 00 010210 02,10 10-2,1G2001000000001-'00 10 IA00001000 0010001000000 000 0
t2,1010102002G-G1000-o000000000000000010000A000000100,--.0000 002002,0010 0000 00'0 10002001000.A0002 GO00100' 10 1000 00 10 - 000111001010002>10 00010'101000 100100000100000010000

- 65 -
TABLE 3.1
ARGENTINA
SECOND RAILWAY PROJECT
INVESTMENT PLAN (1979-1983)(Figures in 0S$ Millions)
Description - 1 9 7 9 1 9 8 0 1 9 8 1 9 ______9____Local Foreign Total Local Foreign Total Local Foreign Total Local Foreign Total Local Foreign Total
I. WAY ANS WORKS us$ us$ us$ us$ us$
Renewal 37.67 18.55 56.22 56.35 28.18 84.53 78.37 39.18 117.55 52.91 26.45 79.36 10.00 4.08 14.08Improvement 12.80 0.96 13.85 18.36 1.53 19.89 20.20 1.52 21.72 12.31 0.92 13.23 0.62 - 0.62
Bridges 4.27 1.07 5.34 5.38 1.38 6.76 6.02 1.47 7.49 4.00 0.27 4.27 2.00 0.14 2.14Stations 2.41 - 2.41 2.82 3.00 5.82 4.83 2.45 7.28 3.46 6.56 10.04 - - -
Accesses 18.33 - 18.33 17.73 - 17.73 1.88 - 1.88 0.56 - 0.56
Track Machinery 0.35 1.56 1.91 4.18 3.81 7.99 4.25 5.13 9.38 - - - -
Workshops 6.45 3.96 10.41 1.94 0.32 2,26 5.83 1.33 7.16 7.06 2.03 9.09 1.40 0.85 2.25Miscellaneous 2.29 - 2.29 3.37 - 3.37 2.77 - 2.77 1.00 - 1.00 0.37 - 0.37
Subtotal 84,56 26.10 110.66 110.13 38.22 148.35 124.15 51.08 175.23 81.30 36.25 117.55 14.39 5,07 19.46
II. SIGNALLING AND TELECOMMUNICATIONS
Signalling 2.00 3.87 5.87 3.17 7.87 11.04 2.24 9.38 11.62 10.62 8.19 18.81 0.83 - 0.83Telecotmmunications 4.12 2.22 6.34 3.27 1.25 4.52 4.39 - 4.39 2.70 0.85 3.55 0.72 - 0.72
Subtotal 6.12 6.09 12.21 6.44 9.12 15.56 6.63 9.38 16.01 13.32 9.04 22.36 1.55 - 1.55
III. MOTIVE POWER AND ROLLING STOCK
Locomotive rehabilitation 3.20 Q.68 3.88 10.00 1.50 11.50 5.61 1.02 6.63 2.00 2.00 - - -
Line Locomotives 7.00 8.55 15.55 5.20 1.30 6.50 10.13 1.70 11.83 -
Loco tractors - 7.95 7.95 5.40 2.00 7.40 7.00 2.60 9.60 7.40 2.60 10.20 2.71 1.00 3.71
Wagon bodies 13.10 0.40 13.50 7.30 20.41 27.71 - 20.00 20.00 - 39.72 39.72Wagon bogies 5.70 2.21 8.41 3.80 14.80 18.60 - 14.47 14.47 - 28.40 28.40Wagon rehabilitation 2.39 20.00 22.39 3.60 0.90 4.50 3.00 0.80 3.80 0.80 0.15 0.95 - -
Suburban teaches 7.10 1.68 8.78 1.30 0.31 1.61 - - - - - - - - -
Coaches rehabilitation 2.01 0.41 2.42 2.28 0.48 2.76 1.56 - 1.56 1.02 - 1.02-Wagon modification 5.20 - 5.20 3.60 - 3.60 0.50 0.50 0- 0.50Spare parts 3,10 24.59 27.69 2.30 17.49 19.79 0.90 10.45 11.35 1.00 9.52 10.52Workshop eqoipnent 1.90 0.80 2.70 3.00 - 3.00 2.00 - 2.00 - - - - - -
Substations 3.00 1.98 4.98 6.91 4.50 11.41 3.50 2.25 5.75 - --
Subtotal Motive Power and 53.70 69.75 123.45 54.69 63.69 118.38 34.20 53.29 87.49 12.72 80.59 93.31 2.71 1.00 3.71
Rolling Stock
IV. CONSULTING SERVICES l/ 0,30 1.50 1.80 0.20 1.50 1.70 - - - 2 3 2 1 6 2
TOTAL (without contingencies) 144.68 103.44 248.12 171.46 112.53 283.99 164.98 113.75 278.73 107.34 125.88 233.22 18,65 6.07 24.72
Physical contingencies 2/ 5.55 3.36 8.91 7.40 5.87 13.27 7.22 5.91 13.13 8.20 8.37 16.57 1.50 0.59 2.09
150.23 106.80 257.03 178.86 118.40 297.26 172.20 119.66 291.86 115.54 134.25 249.79 20.15 6.66 26.81
Price contingencies 3/ 18.71 13.40 32.11 35.71 23.20 58.91 42.53 29.90 72.43 39.03 36.72 75.75 8.62 2.86 11.4E
TOTAL (with contingencies) 168.94 120.20 289.14 214.57 141.60 356.17 214.73 149.56 364.29 154.57 170.97 325.54 28.77 9.52 38.29
ELENTRIFICATION (of Roca) 6.00 6.00 12.00 15.00 18.00 33.00 1.00 18.94 36.94 60.00 74.24 134,24 24.00 20.10 44.10
GRAMSD TOTAL (with eleptrificetion) 174.84 126.20 301.14 229.57 159.60 389.17 232.73 168.50 401.23 214.57 245.21 459,78 52,77 29.62 82.39
1B ased en 1978 costs which irclude enzet4a.esntles.
2t Five percent except where quantities are clearly dofined due to existing contracts.3/ Price contingencies have been taken as follows:
Equipment: 7% for 1978; 6.5% for 1979 and 6% fross' 1930 onward.Civil Works: 8% for 1978; 7.57 for 1979 and 7% for 19630 onward.
Source: FA
February 1979

9266 922
62C06 2613.(93 POJECT
1. 7220024969 (2 2 .39 1942
3902 12)1 T ota
2. Aoao a.A. Ca-tos ((-kOt 7P -7.9 (26267.49 (13262.9039 4.26 2). T-aakaitr
1aOqirer ( 7.99 7.931.9
3. AIate to Ro--rIrprr (2426(.61 (160 56)1.2
29.23 Oo 1.93 5.92 4.96
lraoa 72,•r2ta ~~~ ~ ~~~~.32 6.31 1.32
4. Rraffel, a•aa, a
Toa2aa7 Pagrp.215727
(Oe,rratlty-((ey Hey Plato) 6,~~~~123 13.77 24.22 23.32195
.3 3-0 .0971 22
Trr acyar-l (42.5260 (3 (2tSr 73.29 1 (29 X6) 24.22 794224913.312Z
n2)65
Taiot Li..32 (703 -c 0.29 (203 26 0.12 (,03 26, 0.22
23. -lOaing 4lt.9r5 a0(.
3. 3e2e6219rs62r,o Pc26arait 32y ~~~~~2.13 13.34 24.92 2.72
49.22(360 .
Stac Re0at 9 26 5.72 (114 li) 22.23 )1O47.5
4 rI O920LS 12.94
95
Partial Sacaroo 72~~~~~~~(1 r 0,322 (26 2.22 (97 oo 573
(27.2.5 1,5) 0.42 (-60-0) 6. _39S
OrOdoat (~~~~~~~~~120 a) 0.2 (02 Mg32 (23 a) 0.93 (90 0• .29
a)pteLine (70 li)-.7 (152 26 .3 22 2) 0.2 4 (252 26) 6.263)
6. ......66a6l . 6rrt(a25.
3(--r I & SaIa.e (aco 16,62
21.61
(Ocrrardta-Ploodce) ~~~~~ ~~~~ ~~7.99 9.50 3.14 53-
I5.25-'1.694 5.35 (36-194 7.03(90-341) 3.43
zractcor,402 (~~~~~~~~~~5) 6a( 7.29 (3 I ie) 7.73 3I9 26) 6.23 (23 6 5.135_
O 3
Em 34~~~~~~~~~~~~~~~~~~~~~~~~~~~~~~~~~~~~~~~~~~0-0632
7 6920 36 ) .2 (95r 23 (2 )03
2). A4rr Pa--e (30-106 3.39 ll~.45) 2,77 2.10
7. taOt40006a22ca Parascora 4123 oro 0.20
7.22 (i2~~~~~~~~~~~~~~~~~~~~~~~~~~~~~~~~~~~~~7( 2.03
2.05C) 3
.0
tl9O~~~~~~~~~ao ~~~~(00 ) 0.23.1-
- -2
2.266
9. achahiiitalip Peitaarol,9 2y 1.60 1.30 2.,63 71.9 29. Otill StOel Ocior 73-79 .72
6.29
PerT -k a 0 O)23 929 11 742)42
.726-20))6.27 v(2(4937 3.12
o 43
2ttOEa. 745 )0.0 (43 0.03
31 . pegre PahbOli-er(- 16.49590
3
(O0~~~~~~~~~~~~~~~13 3
( ~~~~~~~~~~~~~~3J4 (97-026) 4.30~~~~~~~~~~~~~~~~~~~~~~~~~~~~-2 RC16)45
266r0l 1-trlorr.a- r o 7.62 74.36 19.52 7.72 453.2
23.47)7.
77 C26, -a.(-dra
rr ar 3.76,.2
Trak Oarao-( (4226 6.47 (9 2 3.23 (1(4 Or61.93 ~17 (Or) 0.70
j7 lrOPy-6 r- icro (B2.2711 2.1 (-01923) 3.03I.
PirlioOOara--a (26 97 .09 72026 1.37 ()26) 1.7)7.
TeoOrstrc-)62 .6 20 a 0.07I, (63 r7 05.1
30. -trrr.Otb-arork,r 2t .403.6
T~~1.,--- 1- 0.0 11) C.11 (1043290,24 ((71 27) 0.03
10. 26 4
l7611ctrr"Pro 4r7,, 1.4o
34. 2-,01 96tro61.3
02.16 46.21
33. OaBr"r1Ortl,plrt -r 2.770 ,3
5.70
Parcool Rororal (~~~~~ ~~~20266.3 (624) 094
rottOr
222
Li 6abbtlitarr- I2r,are6 Wr1.0 3.23
33. R-tap-sr .aC- o Ol-po- 67 0.30
2.3
1-rac 0.40 7.90
Partial Ratacti (0626) Cr
ortor 0~~~~(65
0.20.40
32
OrOdgee (33 a) 0.14 (25 cr2 3~~~~~~~~~~~~~~~.7617
Z21 31
12.Uaatlla--.
39rr20-rt-y
Wir-iI-r 3.11 0)
Partial Orrocal ~~~~~~~(27 26..96 (9 26) 0.37 7626 0.51 3 O4a_
0727200 (0 a6 2.34 ~~~~~~~t2 .. ) 02.55 71202 1,77
13. 022b6 19o1-. Parcr,077EO)
06 . Or-Icr- 24 3aE-1 Erd-r ftc Rcbr-- 26 recaat
11-0
~~ ~ ~~~~~ ~ ~~~~~~~~~~~~~~~~~~~~1. ratr -ro -ralo 6-1" 4.79
4.22
Palaral 006070~ ~ ~~~~~ ~~2 )2
0a 1 .45 (4C -. ) 3.23 719262 1.34 5 --7ab cE(5hojo Oeoic 73-1 21 1.37 167-2
14. Pehobilitoeio-a, rc 7627
Iit 23 2 Od --o-Ur,.9 (~-3)162l8
(P. 0560022-caoco6 rerlo(
2. 22467604 Po2rla.Olrr Ray RabaR. 715 9,40 9.20 14.34~~~~~~~~~~~~~~~~~~~~~~~~~~.b~. .129,1
848 4.4 3.9
Partial 6260202 )lO lie)~~(2 1.52 (50 2. 3.23 (9207 266 (100 ra) 6.20 (7.Str
399
25. ahiletroPtorrty.26
bl-1
.c21620t0ro
Iccay Scbetrolreo 7~~~92 .6 9 1 21 (2 03
26. 206h40li-02- 72407010Ot7
.75 ct34ct49
27. 22t04012ra22cr ?a26oraaa .7~~~~~~~~~~~~~~~~~~~~ .96 r.rlrr
ttr P026702,.L (lay aatab, 10.46 26.50 759
34.49~~~~~~~~~~~~~~~~1.7.2 ( 5 . 10 , 2 5
fl2rrOrro.2eo 17017
(ta2640rsc(~~~~~~~~~~~~~~~~~~~~~~~~~~~~~~~~~~~~~~~~~~~~~~~~~~~~~~~~~24 f7(
(sr a,o( 2 07
09 3 IS) .'0 (0 220.459 6
19.
44ailttccPRaor
Oy2S. Orrloe-.4 34422600 )tcrirrr (72) a4 (.1 26 0) 0.6 (3Sr 1.01 725 cr176
23
telephrtrllyrt 7~~~~~~~~~~~13016 0,46 (,1376 .0 49 7030 26 .43 2 6~~~~~ ~ ~~~~~41.30 6-.23 1 9952 31.2 47.74
77.06 73.32 ~~~~~~~~~~~I 12, 50
Srro 62 loo-k -f01

:9 12 1a . 27
,322l12 ~ ~ ~ ~ ~ ~ ~ ~ ~ ~ ~ ~ ~ ~~I MU22L3177 521 81
1. 7121112 -. 21.2.12221 171 1,11 288, 1717 1'7 . 00 2171 1711317 157 1170 1182 1951 182 2827Lin1.
7752(.171.M222 2100) (, 17 l21~8 14521 77.711.5 0.02713-2-11--111014-
1121112 1 7 222.1 02 o-9 1 (7014211 (47. 40222 0522222 .77(21..0 731.2 7
(24 I.- (71 I'll 1,17~~~~~~~~~~~~71112 11 1 12 .7 22
241 1271 .-413221
722222122(.2121772.02I71122 72 421 -111.82
8.78 (121.2 2.2.12112.8 0 1 781225.12 (28 177 2.55~~~~~~I.ITI
2. 152 722221112 70-17 7'7 757.812.1 .0.7 00120201 111771221171222711 2212 7.277187 'S 21407104111.0 I-7~~~~~~~~~~~~~~~~777131211711111
72270212-71072271( (7277-123112~~~W-
82200222222 777 327 7 12 (1 2221 2.21 722 .12.02 221117~~~~ ~~~~~~~~~~~~~~~~~~11 71 ( ~ ~ 1
12.12222 7720022202020 13. 11121.11221171 7350177 (827 10 4.77 (87723 232 (72771M 2 78 2.71.1(12011-2222112.02217200077072 (32027777 (122(1.27 .2. 0202011.2(0102107 72727. (70002) l.14723502771(7232027 721- 1.58LI. 7
M-1~~~~~~~~~~~~~~~~~~~~~~~~~~~~~1 37 .132002.288 .2 22 7221. 2122 772212220 721 57 2728 2.1) 75 2277272727 82713221 (2) 22 lol (7 727 7 12 72~~~~~~~~~~~~~~~~~~~~~~~~~~~~~~~~~~~~~~~~~~~~~~~~~
22. 22 8121222201127012277 0.22 11. 1103733127222 5.52 15.-7
270202 1.12 (72- 7) 1.77(11-87 77.2 '22-127 7.2
.. ......... ... ... .. ..... ... (2...11).0.14

ARGENTINA
SECOND RAILWAY PROJECTProiject a Bd ank Loan
(Figures in Ug$ millions)
1 9 79 1 9 80 1 9 81 1 9 82 To talrjetLocal Foreign f Total Local Fot reg Total Local ei Total Local Foreign Total oal otal Bank Loan
Way and works 51.95 16.40 68.35 87.98 34.22 122.20 79.37 34.01 113,38 33.11 10.46 43.57 252.41 95.09 347.50 41.00
Signal and telecossunications 2.30 2.30 4.60 3.47 4.33 7.80 3.06 3.77 6.83 7.80 5.21 13.01 16.63 15.61 32.24 -
Motive power/.olling stock 52.90 48.83 101.73 48.18 58.88 107.06 1.96 5.31 7.27 - _ _ 103.04 113.02 216.06 38.00
Consulting cervices 0.30 1.50 1.80 0.20 1.50 1.70 - - - - - - 0.50 3.00 3.50 3.00
Total 107.45 69.03 176.48 139.83 98.93 238.76 84.39 43.09 127.48 40.91 15.67 56.58 372.58 226.72 599.30 82.00
Physical contiisgencies 3.54 2.93 6.47 5.12 4.21 9.33 3.34 1.69 5.03 1.61 0.58 2.19 13.61 9.41 23.02 3.40 w
Subtotal 110.99 71.95 182.95 144.95 103.14 248.09 87.73 44.78 132.51 42.52 16.25 58.77 386.19 236.13 622.32 85.4
Contingeocies price - 14.43 9.36 23.79 24.96 20.64 45.60 24.28 12.61 36.89 14.81 5.49 20.30 78.48 48.10 126.58 10.6
Total with contingencies 125.42 81.32 206.74 169.91 123.78 293.69 112.01 57.39 169.40 57.33 21.74 79.07 464.67 284.23 748.90 96.0
/ Details of Bank financed items are given in Table 3.4
2/ Physical contingencies are provided at the rate of 5% except where quantities are clearly known due to existing contracts.
3/ Price contingencies have been provided according to Bank Guidelines as follows:
For Equipsent: ' for 1979, 6.5% for 1979. 67. from 1980 onwardsFor Civil Works: 8% for 1978, 7.5% for 1979, 7% for 1980 onwards.
Source: FA and Bank staff
February 1979

- 69-
TABLE 3.4
ARGENTINA
SECOND RAILWAY PROJECT
List of Goods for Bank Financing(Figures in millions of US Do:Llars .'
1979 1980 L981 Total
Rails 3.0 6.o 7.0 16.0 (17-7)
Wagon bodies - 10.0 10.0 20.0 (22.1)
Wagon bogies - 10.0 8.0 18.0 (19-9)
Track fittings - 8.5 7.5 16.0 (17.7)
Track contract 0.5 2.0 1.0 3.5 (3-9)
Track machinery 1.0 3.0 1.5 5.5 (6.1)
Technical assistance 1.5 1.5 - 3.0 (3.3)
6.o 141.o 35.0 82.0 (90.7)
Contingencies 1.0 7.0 -6.0 14.0 (5.3)
TOTAL 7.0 48.0 41L.o 96.0 (96.0)
-/ In July 1977 prices except those in parentheses which are expressedin November 1978 prices.
Source: FA and Bank staff
November 1978

I~~~~~~~~~~~~~~~~~~~~~~~~~~~C SI SIXTf~
a~~~~~~~~,{ C =-IS SIa
H a S C O S. SI- SIS>da
P;~OS SI PC oSiI=8 ,, g d H x G a 1
o~~~~~S Cd SIP CC SI a - C ;Ugs<989eB
z~~~~~S ° 'C -$ *) r 7 < < < < j (} (] s
1S41<01-~~~S OS C IS I
CC SI SI SI SI Ct CC SI Ct SI CC 5C5
SI a * SI ed eS SI ae eL e
SI~~ SI SIC SI SI SI SI , SI C C SICS CC P SI C C i-i .
C- C5 SIC C} _r SI' CD C_ <P SII C-S''I '*

- 71 -
TABLE 3.6
ARGENTINA
SECOND RAILWAY PROJECT
Procurement Schedule
EvaluationSpecifications Issue of of Issue of
Tender Documents Tenders Tenders Orders Delivery
Rails February 1979 Yarch 1979 June 1979 July 1979 Aug. 1979December 1980
Rails Fittings March 1979 April 1979 July 1979 Aug. 1979 Nov.1979 toDec. 1980
Maintenance Machinery March 1980 toDec. 1980
Track Contract " Oct. 1979 toDec. 1980
Wagons " Jan. 1980 toDec. 1980
Consultants " " Sept. 1979 toDec. 1980
Source: FA and Bank staff
November 1978

- 72 -
TABLE 3.7
ARGENTINA
SECOND RAILWAY PROJECT
Estimated Schedule of Disbursements
Quarterly CummulativeIBRD Fiscal Year Disbursement Disbursement
1980
I December 1979 7.0 7.0II March 1980 7.0 14.0III June 1980 12.0 26.0
1981
I September 1980 14.0 4o.oII December 1980 15.0 55.0III March 1981 10.0 65.0IV June 1981 10.0 75.0
1982
I September 1981 10.0 85.0II December 1981 11.0 96.0
Source: FA and Bank staff
November 1978

ARGENTINA
SECOND RAILWAY PROJECT
1.ACCESS TO SILOS (46 K.)
Ecesa:aic Post 1970 1910 ERR =20% evlao spart oflaksgostEterge project.
0. ACCESS TOI 30E101 AIRES CENTRAL MARKET (lIen) 4.7 6.36
Projec Eeserption: Roil access ofe Ecoan-ic Cost: 19 79 __1980 1901 Sl Trffic: (motly fruits A Sogeables) Tra-os2ocLLCost SaiRsTR = 43%
market maw -nde -ostr-ti-o in the not- tO ~ 0.81 1524 1.57 0547 llt ton - to-km agia cots skirts fi I.E. (30 K.m) pins 4 i. of poetiol GtLje _ 1903 1990 3005 lR-. (4I5;pas-d ;1/5gfr..el,OOP- 9 t.m.; lad~.7)= 3.3track enswo1 hotwe.n Coscres ad Hnodo. 10-152 403 661
.q3 1~2 j~ 354 loll 13G =2.72 ; NGO 2.47; SG = 2.34'sG t 251~- Unit Innings
Total 306 725 1,166 BG = 0.51 NC0 = 0.83; S50 0.96
3.ACCEISSTO. ROSARI-OPORT
Projectlesncjlino..Roll a--no toon Ecoomic Cost: 1979 1980 Traffic: (graiss) Tranpor- nt aigme ri io to 1odor coorciW r (Illiem) 4.73 4.23 450 wagoss/doym26ldoys/yr-4j3:-s Too - km Magi-inl Costs(
Rosarlo Pr(COlt,Ino whh Is o h 3 wogo-n200kn = 981 million ton1-km/pr Read (4/5 pav-d,1/5 rav1, c-p.-24 tons, lnd=.7)=1.78ennlosie 'an o the Rilway. 87% nothe bend ganga and 137. anth- Rail 10 NG31 =1.38
4. REllAR PERMANijTIES1RPRLYMARMDL PLATA RO8
RI)
P-iac Inscr-ipti-c 307.3 km of track R_nm-ic Cost: 1979 1980 1901 ;9g2 Traffic: 1977 1933 1993 2000 2005 Pass trains Disto..ce T,,tL. time, her. end Searionsreealad replacement of Ielephone wire :sll 4.79 10.61 10.61 11.51 Te-os(0) 2T:l 83334.)929542(n/e (kon)(o)am asile facIlIitie en31 km of Ime .3 Pas..$.9OW 3.95, 4.58 Withnot Pen 03 382 4.6
(nilliens) With, Pro 95 4.0Pegt ten 200 250 297 362 400TIssai/tin06hPas tro 5214 5991 7370 9901 114800T-0.
s-venAR in crw and tral, capitl1 can: Accid-ts: 1977 1983 1990 2O0O 2003 'Track M,,i,te-o- C~ t Sonings:303.72/hr/pass train With-tr Pen Sl (-rena) 5 5 7 0 O12,500/.lo:/yr nithot Project i-"-eolog PrePcrti-mtclY with ro- t-cc9. after 1913 ER0=117.
With Pco. 0(hypcthctilnal ) 0 0 0I $ 3,000/Ikc/yr ith project.C-st/-c,id-st $3361
5. RERAB PERMANENT1 WAY (TBOIPPRLEY-1tSfAIF BLA940L_BG)
9roR-e2D g-Itino: 274 Inn of track remewa 147 kIns Feonmic C,,-t 1979 1900 1901 1902 Traffic: 1977 1953 1998 2000 2005 CS0-i.134OSp.4ds: Total timc bnten.def partial track troew1, 670 linor note- ni bridge (3 nilli-o) 1.63 14.72 19.12 2.07 Coos (nlno 01 1.4_0 020I - Y.80 47345- Spend (Inc,/kr) Distanc stati-o (h-rehahilitti-n and the replo-e-e cCtlpif : ic Pans (000) 420 472 472 472 472 Post ten Pe-ight ten (In-) Poss ten Igit trcno552 kc' of list Fe-ight tees 1664 2063 3109 5205 0764 wichnet Pen. 57 36 624 10.9 17.2
Pool tens 1976 2100 2100 7100 2100 With, Pro 75 40 8.3 15.5
Inning iii Crn andTroic topca Cones: Accidents 0977 1903 1990 2000 2003 Trook M,lite--c Cost Svns3'5'7.72/pass es/heT; 92.so0jfegt re/he. With-ot Pro 1 (act-o1) 013 _175 _7T _7t
1W2_500/Io/yr with not retw-lneeso peop-ti-mtely with gross
With Pen 0 (hypochntical) 9 51 15 10 te-age after 1983C-st/a-ideot: $3360 $7750/kin/yr withost po-tio en-w1 i-ee-io,g p-np-eto-tely with
gr..n too"oge after 1990.$3000/k,,/yr noolminene ith p-ojet. PlRR: ill
6. T-EILXS PE1P1NAENT WAS (C7SCORDIA-POSADOS,IT
Pr,',et Description: 19 Rn, of tenok teonso nod Econoic Conc: 1979 1980 1901 1982 Traffic: 1977 1987 1983 0990 2000 2003 CSsono pends: Total cisin k~t-ad1,26ln emtr fkig ailtto (3 cilli.nn 6_.08 7_73 5.96 2.51 Set tons (000) 409 984 595 679 020 020 2moed (lKs/He) Di.- teatie-
"g, ti_ , -t- ,f b,idg. babili "ti-Pans (000) 422 460 424 474 424 474 Paso Pei ghlt cano Pass PreightF-nigVht to. 2600 2912 2990 2990 2990 2990 teo tm (,::
Pan.c. 0- 32 074 883 883 883 0823 Withe-t pro. 405 70.9 9 14.98 29.17With pro 56.5 23.5 39 10.58 25.45
4.00 3,72
Sa gi,, Gi- a-d Trail Calo ots1: A-cideots 1977 1982 1990 2000 2003 Trash Mointn....- Cos. avns057.72/past to/he;: 092. 50/Cenight er/hr. with-ot Pro 4 (-ot-l) 5 5 3 5 (12,500 /Km/Ye cithont renewa in,o.e.si,,1 p-ep-etti..oely cih 9--gos ont..age after 1903
With, Pee. 0 (Hypothetioni) 8 0 0 0 0 3,000/11cY/T -ouo aitsa wick p-ejot EOR= 03%C-st/a...id-t 3360
Snurr: Os-l, ot.CI
Peb-uay 1979

SECOND RATIWAY PROJECT
EconomIc Evaluation
7 10 PSIIOPARIENT WAy TTIRO-ROSARIO;; BC)
Projec ~Description: 6 las of track renewal, 52 linear Economic Cost: 1979 1980 Traffic: 1977 1983 1990 2000 2085 C-ersecial Speeds:
n'l8Thf rOT"Stl gd"Yhalitation and replanenent of T'8 0.15 Toes (050) 482 729 78 6 0 pe k/ritne Total time betend 8tations
telephono wires on 118 lao Of tine. Pass (million) 2.4 2.6 2.99 3.64 4.02 Pass ti-n Fceight trn (la-) PstisFeig ht tr.
Frgtn tens 2496 3095 3320 3664 3851 withou.t Pro. 80 45 303 3.8 6.7
Pass tens 12272 1302 14988 18246 28145 with pro. 95 50 3.2 6.1Saig : 06- 06.6-
Savings in Crew aed Train Capital Cents: Accidents: 1977 1983 1990 2000 2005 Track Maintenance Cost Savings
$S7.7 2/ps- tn/hr; 92.50/freight It/h rWi~thout Pro. 10 -(atuasi) 11 T1 1 1 $12500/las/yr without prnject increasi.g proportionately with
with Pro. 2(hypothetical) 2 2 2 3 gross to..na5e after 1983
Clost/accident: $3368 $3000/las/yr with project iii: 497.
Prejet csciptin: 54 lan of track renewal EconOnlie Cost: 1979 1910 ' 9_01 Trafift: 1977 1982 1983 1990 21001 2005 oinmeoca pes
an]140 linear setrbfhcdarlnilita- ($ o:illion) 1-21 1.72 2.50 Tos(ctos .14 -1.39 -1.8-0 1.9 21 2,24 Iod(a/r itneTtltn aedsain
tia.. Pass (lOS) 647 713 722 7222 7222 227 Pass tro Freight tin (his) foss t-n irYe-t
Frgt icon 2308 2790 2837 3042 2357 3528 Without Pro 28 42 g52 10.9 20.3
Pass tr.s 1057 1111 1122 1122 1122 1127 With, Pro., 82 45 10.4 18.9Savings irs 0.5 1.4
S~avings in Crow and Train Capitzalfools: Accidents: 1977 1983 1990 2000 2005 Trank Mitnac at aig:
$37.72/pace, tr/hr; 92.50/treigl:i it/hr Withou,t Pro. 6(antaal) 7 7 5 1 512500/as/yr withent manalinw rain proportionately
With Pro. 1(hypothetical) 1I 1 1 1 with gross tonnage after 19i3
Cost/accident: $5368 $3000/las/yr .cr ERRi: 157.
Project Description: 244 kn at track is- Iconosic Cast: 1979 1980 1981 1982 Traffic: 1977 1983 1990 2000 21001 C -O-secia Speeds:
nea,65 kn at partial track reneal, 85 (nilli-n) 6.21 11.37 14.69 2.01 Tons (nidllians) 1.41 1.09 2.03 7.24 2. 35 Speed (Las/hjyj Jislta- Total tine hoten,d statli.ss
lisear n-tocs of bridgs. r-lsailitatian and Pass (ooo) 632 756 716 316 716 Pass ten freigt_n (in:) Pas ira, fg-t ti
ths replarossos ef sires no 1: in of Sine.prt Irns 3036 3739 4016 4431 4657 Withas.t Pro 78 31 lit, 34.7 31.7
Pans irns 1365 1450 1410 1450 1450 With Pro. 90 40 11.9 21.9
Savin,gs/tm. 1.9 70
Saving nCe n TanCptlCot: Acdns 1977 1983 1990 2000 2005 Track WimnnnCotSvns$57.
7 2/pa.. tse/hr; 92.50/frgt tr/he Wiihnnt Pro. 7(csl '.20" o6 21 -23 728/a/rwtotreea nraigpo
With Pro. 7 (hypothelica1) 0 8 9 9 p-ntionately with gross tonnage after 1983.
Cost/accident: $3368 $ 7750/las/yr with-nt parsial renewl incroasiog
proportiona.tely with gr... tonnage after 1990
~3O00/AO/yrnn-at naintesan.rc with project. CRR1:
Pisoget Dracripie: 125 Ins of track renewal a-:d lEsomie Cost: 1979 1980 1981 Traffic: 1977 1983 1990 7000 2005 issenil peds
15 hr of partial track renewl ($mlin .6364 99 os(ilon) 11 .1 15 16 .66 dl /hr) Distance Total sin het.end ntatisna
Pass (000) 160 180 100 180 155 Pass tin Frit5$t train (l-) Paso inn Ptte
Fegi t..s 3536 4667 4998 3528 5810 Without Pro. 35 25 54 15.5 21.1
Pass train 416 4:42 442 442 442 With Pen. 60 40 -9.1 13.6
Savings/Irs 6._4 0 .2-
Saviogs in Crew and rain Capitol Costs:Accidents: 19)77 1983 1990 7000 7005 Track Maintenance Cost Savinpg.:
$82.19/paso tn/hr 168.31/freight tn/hr Without Pen.
34(-nt-1a) 44 46 51 52 $12500/lao/yr w,ithout renewal incrasing pro-
With Pro. 20(hypotl:ntieal) 26 28 30 '30 portisna.tel.y wish gross t onnage altec 1983
Cost/acc.ident: $3368 $7750/km:/yr without partial re-nwal increaing
1g. SF501 g~~~~5yg5f5ff WAT Ct:gDO8AT0Clf--p~~~~~~~~ NC) proportionately with grassti tonnageih afterton 1990ft-199il:R:277
rjc ecition: 11 las Of Partial track renwal CEonanic Csot: 1979 1900 Traffic: 1977 1983 1990 2000 coaoeralSees
and 520 linear neters of kiNgs rehahili tattoo oss-6 0~. 15 To.ns (000) 8~03 921 98-7 10o9-1 bead (lohe) Dstanc Total tine hei-ed stations
Poas (000) 122 137 137 137 Pass tin Freigh train lo as i p n
freight tnns 1768 2333 2500 2764 Without Pen. 47 27 542 11.5 20.1
Pans tens 728 773 773 773 With Pea. 60 33 16.4
lavi,gs/tro 2.5 3,7
av iegi Crew and Train_Ca_pital Casts: A-eldenta: 1977 1983 1990 2000 Track Maintenance Cast Invingo:-
$8 2
.19/pa.. tre/kr; 6 8
.30/fel`ghtitr/hr W-itho~tp Pr.17(actnal) -2 1 23 24 $1
/5 0
/k/yr without project
With Pro., 6(hypothetioa1) 7 8 9 $3000/khn/yn noral maintenan..e with prcjeet 55RR: 43%
Cost/accident: $ 3360
$vitgm Sank staffFebrsocy 1979

19:C0ND RAILWAY PROJECT
Projetloeito: 34 o.f partial track re.essol Po-oie Cost: 1979 1900 1991 Traffic: 1977 1903 1990 2000 Coonril pes
224 iUoce :-tcrs of brige eailitetico and 0 iOn ($ cillic.. ) 0.7/7 0,48 T.30e Tons (000) 40~o4 5-24 5~24- 22-4 Coeqk/k) Dsace crltmeScn
ot telephone line replecocioct. Pass (990) 104 117 117 117 laos ten l1401oht.. trafo104 117(Ion) Pos-ertro7L 0 0t O-
Pegt tee 1349 2298 3299 3390 Oitl:-s Pro.- 44, 39) 290 9,
Paso ceo 624 663 963 6f3 i-[,h Pr. 50 J 55.03
Se-iege/tee 0.0 1.4
$ŽL¶)t tne o Tao aitl Ctoots Actid-ist: 1077 1993 1990 2090 Track Mu - -Coot la-e 5
$07. 19/paso tr/hrir 60.30/fe ~iihc nc,/hr Wittiest Pen.- :3 (aetcol) 44 -4- 14750/lm:/ye wtthoct projectL
[With Pro. 9(kypsnfeticcl) II 0 8 3900/Ic/yr morse soitos ink projet 0:10: 457
C.tns/aeeidnct: $3,368
PrcEecIloripi: 90 of partial trak rec--l fEo-mir Coot: 1979 1990 1901 TrfIc 977 1903 1990 7000 tCeetr.iel S~eedo':
($ 00111c) 0.74 230 0.95 Tcs (000) 920 1131 [713 1340 Sceed~1 (ehe) lDist-c TotL1 tine hen, end steti-:
Pass (006) 274 1362 302 300 P-c tr- ic e rte (r) esieslo e
Proc tree 909 1214 1302 1439 Witko-t Pro. 40 37 140 4.0 5* I
Pes tens IJ44 1374 1326 1326 Winki Pr- 12 40 3.740
le-ings/rec .9310
$/mcoo to tew codTracetapaca ccst: Arrieoto 1977 199-3 1990 2011 track leicea-c otIsii
$5l.77/pann te/he;92.58/treighc cr/r WiSo r. fotej 3 7 0 $4750/be/yr oith.cec projecttWith Pro. 0(hypocheti-nl) 0 00 $3000/ho/yr corra noneoo sith p-j-ot liR: 137.
Ccst/Aetdent! $3T9R
14. 01_11A11 PriRoAONt WAY II.llAOtqo-DA _IECUIRIA, ICG)
$P$4f2>r_lor 2 79 180 kn of partial -e-wl Ico--mi tost: 0929 1980 1901 1992 I rs i_ic: 1973 1993 1990 2000 omcrjlCres
(1 itic 0.99 2.76 0).55 5.53 loe(oltoe 1.92 1.59 1.39 t.39 PreLIc/e lstco Ttal-tso ht end -coijoes
Peso (ill). 16 19 10 19 Peso -tc reigh e (too) Peso trains Proicks&h ten_
FPieilht cr-0 13(89 135 1035 1033 4nSeen Pro 42 25 350 8 314
Paetco t04, [ I 1c 121 With, Proj. 47 29 7.44 12.5
Sa-iogs/tr- 0.09 i1
Ceninco in trese and Train epitel tnsts: tirckdnots: 922 1993 1999 2000 sTock C-neonn totOjc:
397. 72/peon rr/hr; 92.50/f-etght ne/hr Withooc Pro. 4(aoct-l) 5 5 5 $750/1nn/yr lnkocit project
WinS Pro O(1:ypocl:etirl) 0 0 0 $3000/ton/ye -oros e:ltna ith p-ojnct ERR: 127.
-tos/o...elr-L 3340
leeico:93 Mic of partial crak re-own leooci.. tooc: 1979 1900 1961 Traffic 1977 1990 199 8 1990 2000toocil edo
(4 " IIiic: 9.41 1.08 2.39 Ner rLos (000)) 305 390 400 479 419 Dpe Oc Is- Tocltime Sot, en-d nrcnio-
Pans (000) 366 399 424 434 424 lane Frei ght Leoe Peso tr-i- FreightcrProuSt ic-n 364 009 423 506 423 tn nr - So
Pa-cer- 1664 1010 1929 1929 1079 WitLoIr~~ pro. 54 20 123 2.27 4.13
WI th pro. 07 23.5 1.50 5.23
tsatng in teen _ad Tr,ctptlton Aceide-cs: 1977 1992 1590 7000i Ta1k Maiet-oace toot Sa-ipg_:
$52 72/Pen ne/he; $92.59/fe-ight tn/hr Wichoac pro. 5(-ctoel) 6 6 6 $3750/lsYr ottlic- projec
With, Pro. 0(lyppetkncI-a) 0 0 0 $3000/;5i/Yr norma osoeoe ith project ERR: 117.
tC-t/acident: $3368
SU.BURBeAN PERMANEN1T1 WAY REHIA1TLITAT3ON (MITRE)
Project lescniption: 59 km of creek, -eeol 1,tce Ion-i tosetn 1979 4980 1991 1962 Tretfie: 1977 1988 5990) 210i 2005 AnotTi: 25.2 Nm- los ronoc oos (C pen-kr)
Retino-Tigte aed Retirc-B.Mit-e; aet-mtle Sloe4
(5 nilli-n) 5.94 7.43 9.51 9.09 PansnoCcc: 4.48; ll-,s 1.0; lOil: 0.83
sigoelliog berotce Meldoca.do cod Leon Co 1ee e tenir ell
signal at Reti-o Static and the -ehah of 23 p.0cc lsthoot Pro. 154, 0114 114 144 114 Podel S"plit c6 Snifike Not bcyrdS Rail if Project in
sehotaticos. ~~~~~~~~~~ ~~~~~~~~~~~~~~~~~~~~~~With Pco. 114 413 132.7 167.8 185.3 neqt _elperenid: _______
torn: .1; hen. .9
Train MaIntennc tnn: TORe: 827i.
Wi-thoor Pro :417/tream/kon/yr
Wink Pro.- 375/treioto/pr/y
1 7. SATBURBAN PERMANEN83T WAY ORE0IAl].1'tA'TteN(SAN MOARTIN)Probrlseite: 33 too e treek EromicCots: 1979 1900- 1981 Tratt ic: 1973 1980 1999 2000o 2005 neoeTp: 21.2 en. CotTosonte Cpes-Sn)
renwal ..t.e. Retire and J.C. Pa- ($ cila) 1.19 3.39 2.708 aoson-tr .8 o~10 RoiL 08.5
(oillioo)With-tn Po., 30 30 3o 38 30 Model Split of T-nffic net tarried hy Rail it Peojeet is
With Pt.. 39 30.9 30.9 45 49.7 oct ep-neete-d : tars: , 1;Ns9
Trcab Mciotocacoc toot: ERR: 197.
witn-ot Pee..: 417/train/ton/yr
with Pro. 375/teotn/tos/ye
boo: Back onsftickesa.ry 1979

ARGENTINA
SECOND RAILWAY PROJECT
Economic Eva1nation
15. SIiCRBAN PERMANFNT WAY REhABTLITATION (SARlfIENTO)
Pro ject _Descripti: 75 kI of track renewal between Economic Costs: 1979 1980) 1981 Traffic: 1977 1980 1990 2000 2005 Aver-ge Trip: 21.2 Em. liit Transport Costs: (U pas-im)
Onoc-Moreno and HNedo-Marmol and the rehab of 36 ($ million) 8.01 12.70 5.56 Passengers Car: 4.48; Nun: 1.0; Rail: 0.85
power substations. (million)
Without Pro. 120 120 120 120 120 Model Split of Traffic not taried by Rail if
with Pro, 120 121.2 148.3 178.3 196.9 Poject is n't TmP len:'ted:___
cars: . ; Bus .9
Train Maintenance Cast: ERR: 147.
Without Project: 417/trln/lk./yrWith Project: 375/trami//k/yr
19. 28iUNTING LOCOMOTIVSS POE REPL.ACEINTUmit Operating Cast for the Equivalent
Project Dnacriptioo: Sconomic Cnst: 1979 0s980 Prod-civity of One New Diesel Lcoi 1 Scrap Value: 75 tons a $400/ton 30,000/st.s.r Ioen ERrI"19%
ncrap: Replace with: ($ million) Old New Savings a
80 BC atea,:: shunting locos 32 BG diesel shooting locos 7.48 6.61 8G 75,000 47,000 28,000
3 NG steam shunting locos I NG diesel shunting locos No 96,500 38,000 58,500
4 SG steam shunting locos 1 SG diesel shunting lames SG 80,000 50,000 30,000
a/ The spread in operating costs is conserva-
tively assumed to grow at 5% per annum.
20. WAGONS FOR REPLACELNENTUnit Maintenance Costs for th:e Equivalent Average
Project Description: Economic Coot: 1979 1980 Prodnutivity of a New Wagon Scrap V.1e: 15 ton $400 $6,000/wagon ERR= 13%
Scrap: R~~~~~~~eplace with: (S ilin Old New favi:g - ca a:e 9tn 40 i00wgn IR17
23 BC grain 1o)pper wagons 12 BG grain hopper wagons 4.28 8.5S Hoppers & Tankers 2,560 320 2,240
37 NG mineral wagons 19 NG in mineral wagons Mineral Wagons 2,520 630 1,890
3 0G wine tankers 2 BG wi-:e tankers256 BG high sided wago-:a 128 BG high sided wagono Ni 8k _ idd L,280 160 1,120
a- T)se spread in operating cots is assumdto grow at 2.5% per annum.
21. LOCOMOTIVES AND WAGONS FOR MORE REVENUE TRAFFIC: (SEcludes platform and multiuse wagons needed for service traffic)
Project Description: line locomotives (20 BG); Economic Cost: 1979 1980 Transport Cost Savings:
grain hoppers (351 BG, 209 NG, 175 1G); mineral ($ million) Grain Mineral Auto Wine Savings Associated with Purchase
wagons (353 BG, 122 NG, 100 SG); auto carriers 4.54 39.23 Hopper Wagon Carrier Tanker of5 Additional Locos ERR- 217
(180G), and wine tankers (58 BG). Annual traffic/vehicle BG=48 BG= .44 BG=.09 BG-.47 Annual traffic/Ieee 37.5
(million ton-ki) NG-.32 NG' .54 NG0.09 (million ton-km)SG;-33 SG= .24 Road Unit Cost (c/ton-kI) 1.8
Road Unit Coat (f~/ton-kso, 1.8 2.65 4.9' 1.04 gail Deft Cos t (f/ton-ho,)/ 1.25Rail Unit Coat (f/ton-k.)/ _G=1.0 BG= .96 3.42 .92 Unit Saving (p/ton-km) 0.55
NG=1.17 NG=1.17SG=1.48 SG=2.2 a/
Unit Saving (f/ton-kI) BG.8 B-1.69 1.48 .92 Exclodes capital cost ofNG-.63 NG-1.51 1.48 ees. which are included in the
SG-32 8G=0.45 economic costs of this project.
a/ Bxcludes capital cost of wagons and line loc.s (needed as
motive Power for these wagons) which are included in the
economic costs of this project.
2Z. LIGHT TRACE MAINTENANCE EQUI PMENTEconomic Cost: 1979 1980 1981 Cost/Em/yr
5 yearn useful life ($ million) 1.83 5.18 4.9 Without With Saving/ ND to be 3iaintained ERR-387Pro, Pro. NDm/yr 199 98 1981 1982 1983 1984 1985 1986
Primary Network 21337 -20975 462 1860 2900 3710 4270 4970 5600 6200 6800
Secondary " 2850 2697 153 2000 3000 5000 7000 9000 10000 10000 10000
Tertiary " 2525 2410 115 2000 3000 5000 7000 9000 10 10080 10000
Source. Sank staffYfe5ruary 1979

ARGENTINA
SECONQ RAILWAY PROJECTEoononit Evaluation
22. GRASS CETTTNG TRACK MAINTENANCE EQUIPMENT:
_Eno0amiC Cout 1979 1980 1981 Maintenanc Cot/km/yr (US$) ERR56h(05$ ojilion) 0.02 1.31 1.31 Wlthoot oqaip. 1200
With equip. 150Saving/Im/yr 1050KE to he maintained with oqoipoe-t: 750 kl.Ttol onn-al benefit: 1050 x 750 a US$787,500Uionfal life * 10 yes.
24. ENCLOSINC SUBUTRBAN STATIONS AN50 INSTAILIN ICKETCINRTC MACHINES
Projeet Description: Enelosing ctatia:-o and installing ticketing acoir Costs: 1979 1980 1981 1982 Reveon. B-oefit- With ond Witho-t thnarhi-ns io the suburban tyctc- to -eduoe fare evasion: 87 stationc ($ million) 2,41 5<87 7.7 -10.0(pins uncool nachi-e nilnt.naoc c.ost equa 1979 1980 1981 1982 1983 1984 1990to 5% of the puecbaso price) Bclgranc
With 4.30 -- 4.30Witl:oolt 3.81- -- 5.61Savmiongs 0.69 -0.69
With 25.84 > 25.81Witli:ot 23.60 - > 23.60Savings. 2.24 -2.24
MitreWith 14.98 32.10 49.22-- >49.22Withoot 14.27 29.25 46.37 - >p46.37Savings 0.71 2.85 2.05 - 2.85
San MacticWith 9.08 09.52 30.42- >30.42Withot 9.08 18016 28.60 --- 28.60Savings 0 1.36 1.82 8--- -_ 0.02
Totl Savings 2.93 3.64 7.14 7.60 -- 7.60 ERR 96%
Solrcc: 0 a-k staff
No-eb-Er 19V8

- 78 -ARGEINIERA
TABLE 4.2SECOND RAILWAY PROJECTEconomic Rates of Return
Sensitivity Tests
Project Base Case 18 ' 2b/ 3$! 4/1. Access to Silos 20 18 19 19 16
2. Access to B.A. Central Market 43 42 40 41 37
3. Access to Rosario Port 28 26 25 25 22
4. Rehab. Perm. Way (Temperley_Mar del Plata) I1 11 11 10 10
5. Rehab. Perm. Way (Temperely-Bahia Blanca) 11 10 11 10 9
6. Rehab. Perm. Way (Concordia-Posadas) 13 13 1- 12 11
7. Rehab. Perm. Way (Retiro-Rosario) 49 49 -6 46
8. Rehab. Perm. Way (Rosario-Tucuman) 15 14 14 13 12
9. Rehab. Perm. Way (Jose C.Paz-Mendoza) 23 15 15 14 13
10.Rehab. Perm. Way (Santa Fe-Tostado-Pinedo) 27 26 25 25 22
ll.Rehab. Perm. Way (C5rdoba-Tucuman) 43 42 40 IC 36
12.Rehab. Perm. Way (Tucuman-Guemes) 15 14 14 13 12
13.Rehab. Perm. Way (V.Constituci6n-V.Tuerto) 13 13 13 12 11
14.Rehab. Perm. Way (H.Renanc6-Darregueira) 12 - 11 10
15. Rehab. Perm. Way (Canada Verde-J.Daract) 11 IC 10 9 9
16. Suburban Perm. Way Rehab. (Mitre) 12 12 11 11 1
17. Suburban Perm. Way Rehab. (San Martin) 13 13 12 12 11
18. Suburban Perm. Way Rehab. (Sarmiento) 14 14 13 13 12
19. Shunting loconotivcs for Replacementr 19 19 18 17 18
20. Wagons for Replacement 13 13 12 11 10
21. Locomotive and Wagons for more traffic 21 18 19 19 14
22. Light Track Maintenance Pbuinment 38 38 3R 32 32
23. Grass Cutting Track Maintenance Equipment 56 56 56 46 46
24. Enclosing Sib. Stat. & Ticketing Machines 96 96 96 62 62
Weighted Average a1.9 20.4 20.1 18 16
a/ A 30% reduction in the rate of growth of freight traffic.b/ A shortfall of 10% in the attainment of the loco availability and wagon turnaround time targets.c/ A 10% increase in all economic costs.d/ Sensitivity tests 1, 2 and 3 together.
Source: Banik staff
November 1978

- 79 -
TABLE 5.1
ARGENTINA
SECOND RAILWAY PROJECT
FA -_Summarv Cash Flow- Statements - 1974-1977
(Millions of US$)
1974 1975 1976 1977 Totals
Uses
Net Cash OperatingDeficit 355 399 353 289 1,396Loan Repayments 174 185 173 52 584Invest:ments 108 93 101 88 390
637 677 627 429 2,370
Sources
Loans - Foreign 25 5 21 32 83
Local 312 212 143 7 674337 217 164 39 757
FONIT-/ 86 43 44 36 209
Other 45 45
Government Subsidies 214 417 419 309 1,359
637 677 627 429 2,370
1/ Fondo Nacional de Infraestructura del Transporte
Source: FA
July 1978

- 80 -
ARGENTINA TABLE 5.2
SECOND RAILWAY PROJECT
FA - Income and Expense Statements
Actual 1974 to 1977
(Millions of Pesos)
1974 1975 1976 1977
Operating Revenues
Freight 1,788 3,759 24,222 62,981Suhurban Passengers 567 1,346 6,968 22,830Intercity Passengers 713 1,813 8,645 20,025Other 197 458 2,975 _ 5,991
3,265 7,376 42,810 111,827
Working Expenses
Personnel Costs 5,165 17,037 65,220 163,778Materials 352 1,197 7,995 22,100Fuel and Lubricants 419 1,035 7,665 19,501Contractors 108 329 1,815 4,984Other 83 258 1,458 4,579
6,127 19,856 84,153
Operating Loss Before Depreciation 2,862 12,480 41,343 103,115
Lepreciation 304 267 360 13,253
Operating Loss Before Financial Charges 3,166 12,747 41,703 116,368
Financial Charges and Non-operating.xpenses (net) 123 385 4,033 7,353
Net Loss 3,289 13,132 45,736 123,721
Working Ratic 188 269 196 192
Operating Ratio 197 273 197 204
Exchange rate: pesos to US$ 8.87 27.4 150 400
Source: FA and Bank Staff
Febrnary 1970

ARGENTINA
SECOND RAILWAY PROJECT
FA Income and Expense Statements
Actual - 1974 to 1977,5 Estimate 1978 and Forecast 1979 to 1982
(US$ million Equivalent)
1974 1975 1976 1977 1978 1979 1980 1981 1982
Operating Revenues
Freight 201.6 137.3 161.5 157.5 199.5 229.1 249.4 275.6 304.2Suburban Passengers 63.9 49.1 46,5 57.1 86.7 102.9 112.2 117.6 123.0Intercity Passengers 80.4 66.2 57.6 50.1 69.2 71.6 74,4 78.5 78.5Other 22.2 16.7 19.8 14.9 15.6 7.5 7.5 7.5 7.5
368.1 269.3 285,4 .6 371.0 411.1 443.5 479.2 513.2
Working Expenses
Personnel Costs 582.3 622.0 434.8 409.4 428.1 405.5 405.5 405.5 405.5Materials 39.7 43.7 53.3 55.3 77.4 129.0 133.0 116.6 121.6Fuel and Lubricants 47.2 37.8 51.1 48.8 61.5 49.8 47.6 46.6 48.8 X
Contractors 12.2 12.0 12.1 12.5 20.0 30.4 32.5 34.9 37.4 '
Other 9.4 9.4 9.8 11.4 18.5 7.8 7.5 8.0 8.6690.8 724.9 561.1 537.4 605.5 622.5 626.1 611.8 621.9
Operating Loss Before
Depreciation 322.7 4-55.6 275.7 257.8 234.5 211.4 182.6 132.6 108.7
Depreciation 34.3 9.7 2.4 33.1 121.7 127.2 128.6 135.2 141.0
Operating Loss BeforeFinancial Charges 357.0 465.3 278.1 290.9 356.2 338.6 311.2 267.8 249.7
Financial Charges andNon-Operating Expenses 13.8 14.1 26.8 18.4 19.9 32.1 43.8 51.1 43.4
Deficit 370.8 479.4 304.9 309.3 376.1 370.7 355.0 318.9 293.4
Working Ratio 188 269 196 192 163 151 141 127 121
Operating Ratio - - -197 182 170 156 149
Source: FA and Bank Staff
February 1979

- 82 -
TABLE 5.4
ARGENTINA
SECOND RAILWAY PROJECT
FA - 1976 Revenues and Costs by Service
(Millions of US$)
Broad Standard Narrow Share ofGauge Gauge Gauge Total Losses
Freight Revenues 114.0 14.0 40.8 168.8Long-run marginal costs 111.0 21.6 72.0 204.6
3.0 (7.6) (31.2) (35.8) 28.5%
Buenos Aires Revenues 39.8 2.2 5.6 47.6(Suburban Long-run marginal costs 57.9 3.4 10.9 72.2Services)
(18.1) (1.2) (5.3) (24.6) 19.6%
Suburban Revenues 0.9 - 1.7 2.6Services Long-run marginal costs 6.6 _ 6.6 13.2(OtherCities) (5.7) - (4.9) (10.6) 8.5%
Intercity Revenues 45.9 4.5 8.8 59.3Passenger Long-run marginal costs 58.4 8.9 18.9 86.3Services
(12.5) (4.4) (10.1) (27.0) 21.6%
Postal Revenues 4.3 0.8 1.9 7.0Services Long-run marginal costs 22.3 2.6 9.4 34.3Parcel Postand Baggage (18.0) (1.8) (7.5) (27.3) 21.8%
Total Revenues 204.9 21.6 58.9 285.4Total Long-run marginal costs 256.2 36.6 117.8 410.6
(51.3) (15.0) (58.9) (125.2) 100%
Fixed Costs 148.4 22.5 83.1 254.0
Total Operating Deficit (199.7) (37.5) (142.0) (379.2)
Share of Losses 52.7% 9.9% 37.4% 100%
Shares of Revenues 71.8% 7.6% 20.6% 100%
Revenues and Long-Run Marginal Costs per Traffic Unit
(USi)
Freight Revenue 1.58 1.96 1.37 1.55Long-run marginal costs 1.54 3.02 2.42 1.88
Buenos Aires Revenue 0.57 0.72 0.68 0.59Suburban Long-run marginal costs 0.83 1.11 1.33 0.89
Other Revenue 0.70 - 0.76 0.74Suburban Long-run marginal costs 5.11 - 2.95 3.74
Intercity Revenue 1.00 0.82 0.86 0.96Passengers Long-run marginal costs 1.27 1.63 1.85 1.40
Source: FA and Bank Staff
July 1978

ARGENTINA
SECOND RAILWAY PROJECT
FA Balance Sheets
As of December 31, 1971 to 1977
(Millions of Pesos)
ASSETS 1971 1972 1973 1974 1975 1976 1977
Current Assets
Cash and Bank Balances 73.1 85.5 154.4 490.5 899.7 5,114.5 11,500.0Accounts Receivable (Net) 681.6 913.4 1,086.0 1,990.6 3,820.0 16,165.0 34,210.0Materials and Supplies 425.3 533.7 837.8 1,079.0 2,096.1 13,942.0 39,798.0
1,180.0 1,532.6 2,078.2 3,560.1 6,815.8 35,221.5 85,508.0
Current Liabilities
Sundry Creditors 1,234.4 1,177.0 1,576.7 2,765.4 7,631.4 24,458.2 76,206.0Provisions and Accruals 112.5 225.7 271.2 336.3 925.0 6,339.7 19,052.0
1,346.9 1,402.7 1,847.9 3,101.7 8,556.4 30,797.9 95,258.0 m
Net Working Capital (166.9) 129.9 230.3 458.4 (1,740.6) 4,423.6 (9,750.0)
Fixed Assets - Net 2,812.2 32,180.1 32,909.2 32,615.4 34,261.2 2.11,809.4 1,093,535.0
Deferred Assets 1Al7.1 243.3 40f. 8 289.9 1, 72.6 6i,r0 n ,220.0
Total Assets 2,792.4 32,553,3 33,180.3 33,363.7 33,793.2 122,243.9 1,098,005.0
LIABILITIES AND CAPITAL
Long-Term Debt and Supplier's Credits 777.2 1,120.6 1,583.8 2,985.9 12,235.7 49,878.7 105,288.0
Deferred Income 3.9 5.1 8.3 11.3 55.1 168.8 2,976.0
Government Equity 2,011.3 31,427.6 31,588.2 30,366.5 21,502.4 72,196.4 989,741.0
2,792.4 32,553.3 33,180.3 33,363.7 33,793.2 122,243.9 1,098,005.0
HSource: FA
February 1979

ARGENTINA
SECONID RAILWAY PROJECT
FA Balance Sheets
As of 31st December 1973 to 1976, 1977 Estimated and 1978 to 1982 Forecast
(Millions of US$)
ASSETS 1973 1974 1975 1976 1977 1978 1979 1980 1981 1982
Cuirent Assets
Cash and Bank Balances 16.5 24.5 18.0 18.0 19.2 20.0 20.0 20.0 20.0 20.0
Accounts Receivable (Net) 116.2 99.5 76.4 57.0 57.0 60.0 55.0 50.0 45.0 40.0
Materials and Supplies 89.6 53.9 41.9 49.1 66.3 75.0 95.0 100.0 78.0 62.0
222.3 177.9 136.3 1247.1 i2.5 155.0 170.0 170.0 143 122.0
Current Liabilities
Sundry Creditors 168.6 138.3 152.6 86.3 127.0 105.0 100.0 95.0 90.0 85.0
Provisions and Accruals 29.0 16.8 18.5 22.4 31.8 20.0 21.0 22.0 23.0 __.
197.6 155.1 171.1 1o8.7 158.8 125.0 139.0 131.0 118.00 110.0
Net Working Capital 24.7 22.8 (34.8) 15.4 (16.3) 30.0 31.0 39.0 25.0 12.0 4-
Fixed Assets- Net 6,500.0 6,500.0 6,500.0 6,560.o 6,005.8 6,075.2 6,249.1 6,509.7 6,775.7 7,095.5
Deferred Assets 4.6 4.5 25.5 21.2 23.7 40.0 30.0 20.0 10.0 -
Total Assets 6,529.3 6,537.3 6,490.7 6,596.6 6,013.2 6,145.2 6,310.1 6,568.7 6,810.7 7.107.5
LIABILITIES AND CAPITAL
Long-Term Debt andSuppliers Credits 169.4 149.3 244.7 175.9 175.5 335.2 469.9 571.6 595.8 591.2
Deferred Income 0.9 1.2 1.1 o.6 5.0 - - -
Government Equity 6,359.0 6,386.8 6,244.9 6,420.1 5,832.7 5,810.0 5,840.2 5,997.1 6,214.9 6,516.3
6,529.3 6,537.3 6,490.7 6 596.6 62013.2 6j145.2 6 310.1 6,568.7 6 810.7 72107.5
Debt/Equity Ratio 3/97 2/98 4/96 3/97 3/97 5/95 7/93 9/91 9/91 8/92
Source: FA and Bank Staff r
February 1979

- 85 -TABLE 5.7
ARGENTINA
SECOND RAILWAY PROJECT'
Analysis of Operating Results By Gauge 1979-1982(Millions of US$)
1979Broad Standard NarrowGauge Gauge Gauge Total
Total Revenues 306.8 28.6 75.7 411.1Total long-run variable costs 302.9 33.3 101.4 437.6
3.9 4.7 25.7 28.0Fixed Costs 203.0 24.5 84.6 312.1
Total operating losses 199.1 29.2 110.3 340.1Operating ratio 165.0 202.0 246.0 182.0Working rates 137.0 174.0 203.0 151.0
1980
Total Revenues 336.5 30.2 76.8 443.5Total long-run variable costs 305.1 33.4 102.0 440.5
31.4 3.2 (25.2) 1.1Fixed Costs 203.4 24.5 86.3 314.2
Total operating losses 172.0 27.7 111.5 313.1Operating ratio 151.0 190.0 245.0 170.0Working ratio 125.0 165.0 203.0 141.0
1981
Total Revenues 361.0 33.2 85.0 479.2Total long-run variable costs 301.5 33.3 101.2 436.0
59.5 (0.1) 16.2 41.2Fixed costs 201.2 24.2 85.6 311.0
Total operating :Losses 141.7 24.3 101.8 269.8
Operating ratio 139.0 173.0 220.0 156.0Working ratio 114.0 148.0 179.0 127.0
1982
Total Revenues 382.9 36.4 93.9 513.2Total Latng-run variable costs 308.7 33.7 102.9 445.3
74.2 2.7 9.0 66.9Fixed costs 205.5 24.7 87.4 317.6Total operating losses 131.3 22.0 96.4 250.7
Operating ratio 134.0 160.0 203.0 149.0Working ratio 109.0 137.0 165.0 121.0
Source: Bank Staff.
September 1978

- 86 -
ARGENTINA TABLE 5.8
SECOND RAILWAY PROJECT
Forecast 1980 Operating Results by Railway Service
(US$ millions)
Broad Standard NarrowGauge Gauge Gaue Totals
(Urquiza) (Belgrano)
Freight Service
Revenues 165.5 14.5 69.4 249.4Long-run variable costs 137.2 17.9 69.0 224.1
28.3 (3.4) 0.4 25.3
Suburban Passenger Services
Revenues 96.8 4.4 11.0 112.2Long-run Variable costs 85,5 4.5 18.4 108.3
11.3 (0.1) ( 9.4) 3.9
Intercity Passenger Services
Revenues 64.2 6.9 3.3 74.4Long-run variable costs 58.7 8.2 4.6 71.5
5.5 (1.3) (1.3) 2.9
Parcel Post Baggage andPostal Service
Revenues 4.5 0.9 2.1 7.5Long-run variable costs 23.7 2.8 10.0 36.5
(19.2) (1.9) (7.9) (29.0)
Total Revenues 331.0 26.7 85.8 443.5Total Long-run Variable Costs 305.1 33.4 102.0 440.5
25.9 (6.7) (16.2) 3.0
Fixed Costs 203.4 24.5 86.3 314.2
Total Operating Losses (177.5) (31.2) (102.5) (311.2)
Revenues and Long-runMarginal Costs per unit - USi
Freight
Revenue per ton-km 1.90 1.90 1.90 1.90
Long-run variable cost per 1.58 2.34 1.89 1.71ton-km
Suburban Passengers
Revenue per pass-km 1.35 1.35 1.35 1.35
Long-run variable cost perpass-km 1.19 1.38 9.25 1.30
Intercity Passengers
Revenue per pass-km 1.80 1.80 1.80 1.80
Long-run variable cost perpass-km 1.65 2.14 2.53 1.73
Source: FA and Bank Staff
July 1978
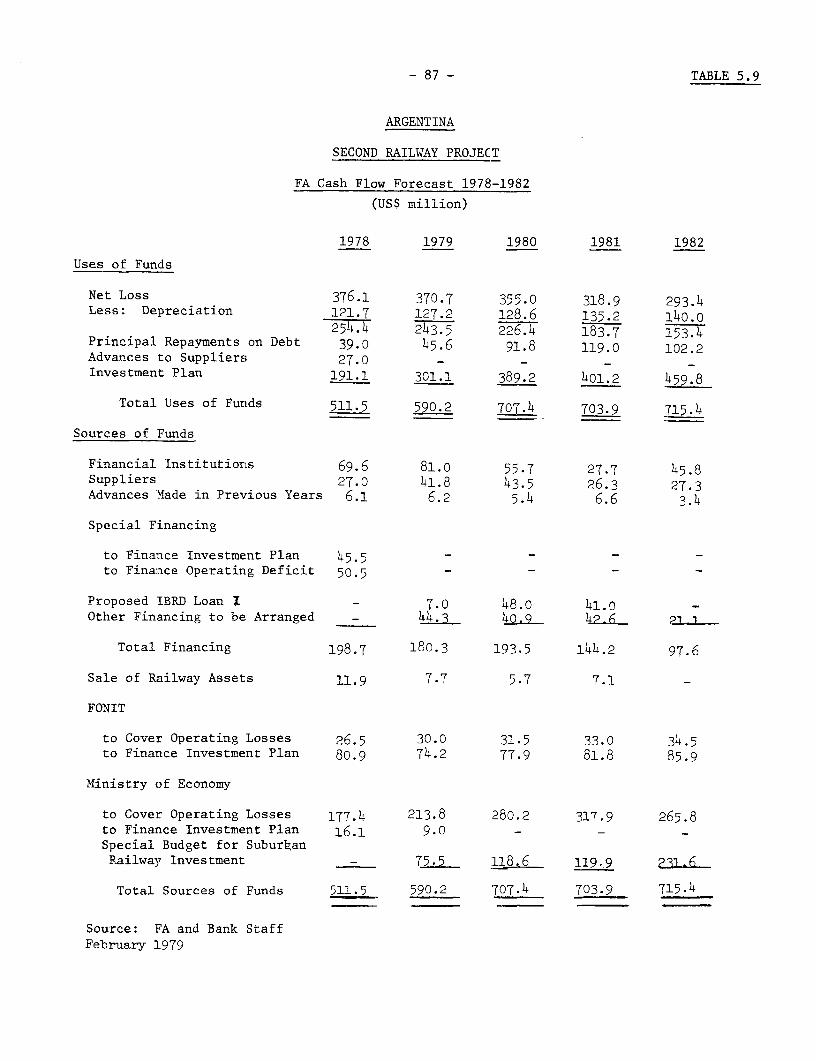
- 87 - TABLE 5.9
ARGENTINA
SECOND RAILWAY PROJECT
FA Cash Flow Forecast 1978-1982
(US$ million)
1978 1979 1980 1981 1982
Uses of Funds
Net Loss 376.1 370.7 355.0 318.9 293.4Less: Depreciation 121.7 127.2 128.6 135.2 140.0
254.4 243.5 226.4 183.7 153.4Principal Repayments on Debt 39.0 45.6 91.8 119.0 102.2Advances to Suppliers 27.0 - - - -Investment Plan 191.1 301.1 389.2 401.2 459.8
Total Uses of Funds 511.5 590.2 707.4 703.9 715.4
Sources of Funds
Financial Institutions 69.6 81.0 55.7 27.7 45.8Suppliers 27.0 41.8 43.5 26.3 27.3Advances Made in Previous Years 6.1 6.2 5.4 6.6 3.4
Special Financing
to Finance Investment Plan 45.5 - - - -to Finance Operating Deficit 50.5 - - - -
Proposed IBRD Loan I - 7.0 48.0o 41.0 -
Other Financing to be Arranged - 44.3 4o.9 42-6
Total Financing 198.7 180.3 193.5 144.2 97.6
Sale of Railway Assets 11.9 7.7 5.7 7.1 -
FONIT
to Cover Operating Losses 26.5 30.0 31.5 33.0 34.5to Finance Investment Plan 80.9 74.2 77.9 81.8 85.9
Ministry of Economy
to Cover Operating Losses 177.4 213.8 280.2 317.9 265.8to Finance Investment Plan 16.1 9.0 - -Special Budget for SuburkanRailway Investment - 75.5 18.6 119.9 231 6
Total Sources of Funds 511.5 590.2 707.4 703.9 715.4
Source: FA and Bank StaffFebruary 1979

- 88 -ANNEX IPage 1 of 3
ARGENTINA
SECOND RAILWAY PROJECT
Technical Assistance and Studies
I. Technical Advisory Assistance (Planning Department)
The Planning Department of FA is weak in the areas of projectevaluation and financial analysis. An economist, financial analyst,and engineer would be engaged as a team to train planning staff.
11. Training Abroad (Research, Design and Standards Office)
FA needs a Research, Design and Standards Office (RDSO) forpreparing specifications and designs and for doing research ontechnical problems peculiar to FA. To begin with, it is proposedto form an initial unit by selecting three engineers, one fromeach of the three departments (mechanical, track and signaling/telecommunications), who would study similar organizations onother railways and formulate a scheme for the creation ofsuch an organization in FA. The Bank would finance the studytour for these engineers and aid FA in the selection of theinitial team.
III. Studies to be Contracted by the Subsecretariat of Transport
(a) Master Plan for the Suburban Railway
This study would exa ine all aspects of the suburban railwayservice in Buenos AIres including: organization, operations,tariffs, investments and traffic as well as the interaction betweenthis service and the urban economy and the rest of the transportsystem in Buenos Aires. It would, in particular, study the questionof separating the suburban rail service from FA and creating a newcompany.
(b) Long Distance Passenger Services
This study would employ economic and financial analysis todetermine which long distance passenger services should bediscontinued and which, if any, should be improved.
(c) Uneconomic Lines
This study would employ economic and financial analysis todetermine which lines and stations should be closed to traffic andwhere facilities should be physically removed. The narrow andstandard gauge subsystems would be given particular attention.

- 89 -
ANNEX IPage 2 of 3
IV. Studies to be Contracted by FA
(a) Motive Power, Rolling Stock and Workshops
This study would determine FA's scrapping, rehabilitation andpurchase requirements for locomotives (including shuntinglocomotives), freight cars and passenger coaches for the period1981-1983. Based on the requirements thus worked out, a programwould be prepared for the rationalization of the maintenanceworkshops, taking into account the work being done bySOFRERAIL on the reorganization of the mechanical departmentand workshops.
(b) Signaling and Telecommunications
This study would develop an integrated plan for signaling andtelecommunications consistent with the needs of the redimensionedrailway system.
(c) Manpower Plan
This study would develop a manpower plan for FA, based on theredimensioned railway system indicating the departmentalcomposition through 1983. The study would indicate how thisplan could be achieved in terms of recruitment, training andsalary policies.
V. Feasibility Studies
(a) New Track and Civil Works Capacity
This study would determine the economic and technical feasibilityof building a new track workshop. The study would identify themost economic location and scale.
(b) Container Operations
This study would identify and prepare a container project for FAif one is found to be economically justified.

-9 -
ANNEX 1Page 3 of 3
ARGENTINASECOND RAILWAY PROJECT
Implementation Schedule and Costs
Estimatef.Forei n Exchange
ost1 9 79 1 9 8 0 (us 000)
Planning Department 8 me.x 3 cons= 54man- onth ; 460
Research, Design andStandards Office L2x4 = 48 man- onth 400
Suburban Rail Master Plan 12x4 = man mont Is 408
Long-Distance 9x3 27 man- 230
Passenger Service mont s9x3 = 27 man- 230
Uneconomic Lines mont s
Motive Power, Rolling 9x4 36 ' 306
Stocks and Workshops mont s
Signalling and 9x4 36 : ian- 306
Telecommunications mont s
Manpower Plan . r4-4 , 4 Tos6x2 = 12 nan 102
Track and Civil Works Workshop mont s
(feasibility) 6x2 = 12 nan 102
Container Handling Facilities mont s
(feasibility)
Subtotal US$2,748.oo
Contingencies 252.00
Total US$3,000.00
Estimated costs for consultants are taken as US$8,500 per man-month.
Source: FA and Bank Staff
November 1978

- 91 -
ANNEX 2ARGENTINA
SECOND RAILWAY PROJECT
Selected Documents and Data Available in the Project File
A. General Reports and Studies on the Transport: Sector
Al. Plan Nacional de Transporte; Plan de Corto Plazo, AntecedentesHistoricos 1965-1977, Argentina, November 1977.
A2. Estudio Preliminar del Transporte de la Region Metropolitana,Ministerio de Obras y Servicios Publicos, Argentina 1972.
A3. A Long Range Transportation Plan for Argentina, Ministry ofPublic Works and Services, Argentina 1962.
B. Selected Reports and Studies Relating to the Project
Bi. La Evolucion Historica y Projecciones por Producto de losTraficos Ferroviarios, CONARSUD, Asesoramiento y ConsultoriaS.A., Argentina, December 1977.
B2. Ferrocarriles Argentinos, Review of Development Plan UNDP,Italconsuilt, Italy, December 1977.
B3. Estudio de Factibilidad Economica - Financiera: ElectrificacionLinea Roca CONARSUD A y C.S.A., Argentina, December 1977.
B4. Operating Statistics, Ferrocarriles Argentinos 1970 - 1977.
B5. Ferrocarriles Argentinos - Historical Budget and Finance Data.
B6. Railway Tariff, Inflation and Exchange Ratio Data.
B7. Personnel Data.
B8. Management Studies - (CONARSUD, CONASEC).
C. Working Papers
Cl. Notes on the Forecast of Freight Traffic by Commodities.
C2. Analysis of 1976 and 1977 Operating Statistics.
C3. Costing Analysis by Subsystem - Ferrocarriles Argentinos.
C4. Debt Service and Financing Plan.
C5. Forecast Operating Results.
C6. Nuevas Planillas de Locomotoras (28, 6, 78).
September 1978

ARGENTINASECOND RAILWAY PROJECT
Organization of FA
Presidnt I Ioard of I
Oporatiom ~~~Relavon,,Adi
11-11-_ 1 F1 1_ = lE
0 - 0 g E 0 C5 Hr ~n i -- ~ ~t
S~~~~~~~~~~~~~~~~~~~~~~~~~~~~~~
0~~~~~~~
L ---J I I I- ----
.° 5 | l l Mitre l l San Martin l l Belgrano l l Sarmiento S M UnquieaO } l l R a ilw a y l l R a ilw a y l l R a ilw a y l R ail w a y lRa ilw a y R a ilw a y o
World Bank - 19286 -

ARGENTINASECOND RAILWAY PROJECT
Organization of Component Railways of FA1'
Vice President
nndu aafc Comercia c Ec Mechanical ive
r ~~~~~~~eltos L _ oTraining Operation Prometion Control Ralling Traclk Locos Pussrchase Rier
Personnel Tech Claims Salary Energy Works Inspecton
4 Costs l 4 Zones Zones eTreaury d S T Workshops lnvntorY
j Unions l q Accounts |z| Zones Zones
Each of the sin railways MitreSarmiento /RocaSan Martin has a basic organization indicated in this chart
BelgranoUrquiza J
2] Signal and telecommunications
Source: FAMay 1978
VVo,ld Bank - 192W a

~~~~F=F;: , - , ir / f 0 R A: ZD> ,. ti I
SPertoe > i 0 0 0 g # -ARG-NTINA: -SS;g %Eiffi<4_
:4;~~~~~~~~~~~~~~~~~~~~~~~~~~~~~~~~~~~ VD Ai y ,,
r E'usvl v- r 3 (I bco< \\t> /T ' ' !'%
: l / E / CAT^PhA3CA \ Dg 9 <X< t g y o 2X ) 3 L r ¢ * ;~~~~~~~~~~~~~~~~~~~~~~~~~~~~f:
r , k LA RIOJ~~~~~UCUA O Lou$A.. @Con@155 z s2; iS
rnt ~ ~~~ ~~ ~ ~~~~~~~~ M Ir E \ 4 7 t FtSSsm;y e-sRiStii9WY@ie J
i ' ti ~ ~ ~~~~~~~CATA.ARe CA M / s 3dj da tt+tt CA ee
b VC>* < t =N A ~~~.
-~~~~~~~~~~~~~~~~~~~~~P -' ' ;
5AN R. w l-\ . r '3- =>"Ax0 e 0 o o r 1
N IUI 3 1r' ;'
I / l O."d5~=~'~~~64 vVou 63_ d'5'''6

BRD14CC C 6,2CC ACCAC
SO¶�NAM�R�A
;VH
,2CC,2
ARGENTINA
ARGENTINE RA]LWAYSBUENOS AIRES METROPOlITAN AREA
CC UCCAY 42240CC
426CC M idA rCUMCF OCCPACCFC�C0C 10CC 4TIICWACCCSC
ACCCALNACCCORCC CJ,CCCACOC YCACC%CD.7
� C4�LT 2CI - -
(
CAIUFCS
CC CC � CCCCC tCL2A�CICANO