classification of individual articles from all of science by research level
TRANSCRIPT
NOTICE: This is the author’s version of a work that was accepted for publication in Journal of Informetrics. Changes resulting from the publishing process, such as peer review, editing, corrections, structural formatting, and other quality control mechanisms may not be reflected in
this document. Changes may have been made to this work since it was submitted for publication. A definitive version was subsequently published in Journal of Informetrics, 8(1), 1-12, DOI: 10.1016/j.joi.2013.10.005.
1
Classification of individual articles from all of science by research level
Kevin W. Boyacka, Michael Patekb, Lyle H. Ungarc, Patrick Yoonc, and Richard Klavansd a SciTech Strategies, Inc., Albuquerque, NM 87122 (USA) ([email protected]),
Corresponding author, phone: 1-505-856-1267 b SciTech Strategies, Inc., Keene, NH 03431 (USA) ([email protected])
c Department of Computer and Information Science, University of Pennsylvania, Philadelphia, PA 19104 (USA) ([email protected])
d SciTech Strategies, Inc., Berwyn, PA 19312 (USA) ([email protected])
Abstract
A system of four research levels, designed to classify scientific journals from most applied to most basic, was introduced by Francis Narin and colleagues in the 1970s. Research levels have been used since that time to characterize research at institutional and departmental levels. Currently, less than half of all articles published are in journals that been classified by research level. There is thus a need for the notion of research level to be extended in a way that all articles can be so classified. This article reports on a new model – trained from title and abstract words and cited references – that classifies individual articles by research level. The model covers all of science, and has been used to classify over 25 million articles from Scopus by research level. The final model and set of classified articles are further characterized.
Keywords: research level; basic science; applied science; multinomial logistic regression model; article-level classification
1. Introduction
There are a variety of means that have been introduced to characterize the scientific literature and the actors who produce it along different axes. For example, output is reported using publication counts while impact is reported using citation counts and other citation-based measures. Disciplinary profiles are used to characterize the content produced by institutions and department. Keywords and controlled vocabularies (such as MeSH), while intended primarily for information retrieval, are used to characterize the detailed topic space for individual researchers. Metrics of different types abound.
One perhaps underutilized way of characterizing scientific literature is classification of journals or articles as basic or applied. Narin et al. (1976) introduced a system of four research levels, ranging from most applied to most basic, classified journals by research level, and used those classifications to characterize institutional research. Research levels have the potential to aid in the characterization of translational pathways in medicine and other sciences (Cambrosio,

NOTICE: This is the author’s version of a work that was accepted for publication in Journal of Informetrics. Changes resulting from the publishing process, such as peer review, editing, corrections, structural formatting, and other quality control mechanisms may not be reflected in
this document. Changes may have been made to this work since it was submitted for publication. A definitive version was subsequently published in Journal of Informetrics, 8(1), 1-12, DOI: 10.1016/j.joi.2013.10.005.
2
Keating, Mercier, Lewison, & Mogoutov, 2006). Currently, less than half of all articles published are in journals that been classified by research level. There is thus a need for the notion of research level to be extended in a way that all articles can be so classified. We have thus undertaken this study to develop a new model that will allow individual articles to be classified by research level across all of science.
This article proceeds as follows. First, the history and use of research levels is set forth. A short description of multinomial logistic regression models, the type of model used in this study, is then presented. This is followed by a description of the various detailed models that were trained along with characteristics of the result sets. The article concludes with a characterization of the final model and of the classification of all Scopus documents by research level using the model, along with potential implications associated with their use.
2. Background
Narin et al. (1976) and CHI Research introduced a classification scheme representing the basic-to-applied spectrum when they classified 900 biomedical journals into four research levels (RL). Journals were assigned to a RL based on a combination of expert knowledge and citation patterns. The citation pattern portion was based on the assumption that clinical research would cite basic research, but that the reverse would not be true. For example, given the types in Table 1, journals in RL1 would cite journals in RL2, RL3, and RL4, but journals in RL4 would only cite other RL4 journals.
The CHI research level classification system was expanded in the 1980s to include journals in the physical sciences (Carpenter, et al., 1988). Although additional journals have been added to the research level list at various times, of the nearly 20,000 source titles (journals, conference proceedings, etc.) available in Scopus, only around 4,200 have assigned research levels (Boyack & Klavans, 2011).
Since their introduction, RL have been used to characterize research along the basic-to-applied continuum for academic institutions (Carpenter, et al., 1988; McAllister & Narin, 1983), departments and teams (Bordons & Zulueta, 1997), and the pharmaceutical industry (Narin & Rozek, 1988). They have been correlated to the attraction of funding (with basic research favored) in Australia (Butler, Biglia, & Bourke, 1998), and have been used to characterize arthritis-related articles with different funding acknowledgement types (Lewison & Devey, 1999). Bordons et al. (1996) correlated research level with collaboration type (local, domestic, international) for a number of biomedical research areas, finding that research level was slightly higher (more basic) for international collaborations. It has also been shown that the majority of the biomedical papers cited by industrial patents are from the basic science category (McMillan, Narin, & Deeds, 2000), while most papers cited by clinical guidelines are from the two most applied categories (Grant, Cottrell, Cluzeau, & Fawcett, 2000).

NOTICE: This is the author’s version of a work that was accepted for publication in Journal of Informetrics. Changes resulting from the publishing process, such as peer review, editing, corrections, structural formatting, and other quality control mechanisms may not be reflected in
this document. Changes may have been made to this work since it was submitted for publication. A definitive version was subsequently published in Journal of Informetrics, 8(1), 1-12, DOI: 10.1016/j.joi.2013.10.005.
3
Table 1. CHI research levels and exemplars.
RL Biomedical definition
Non-biomedical definition
Example journals
1 Clinical observation
Applied technology British Medical Journal Journal of Urology Energy and Fuels IEEE Transactions on Industrial Electronics International Journal of Product Research Journal of Environmental Management
2 Clinical mix Engineering-technological mix
New England Journal of Medicine International Journal of Cardiology Key Engineering Materials Materials Science and Engineering A Computers & Industrial Engineering Scientometrics
3 Clinical investigation
Applied research Blood Journal of Immunology Applied Physics Letters Journal of Physical Chemistry B Journal of Chemical Education Journal of the American Statistical Society
4 Basic research Basic scientific research
Journal of Biological Chemistry Nature Journal of the American Chemical Society Physical Review E Social Studies of Science
When using the CHI set of research level classifications, three deficiencies must be acknowledged – these deal with drift, uniformity, and coverage.
• Drift: Most of the CHI classification system dates to 20 years or more. It is not only possible, but likely, that some journals have shifted their focus over time. However, the CHI system does not account for drift.
• Uniformity: All papers in a single journal are assumed to be of the same RL regardless of their actual level. It is highly likely that there is a mix of research levels in most journals.
• Coverage: While 55% of the records in the 1996 fileyear of Scopus are in journals with a CHI research level, only 38% of the records in the 2011 fileyear of Scopus can be classified by research level. This diminishing coverage in terms of research level will continue to grow as new titles are indexed by the large citation databases.
These deficiencies suggest there is a need for a way to classify individual articles by research level. Lewison and Paraje (2004) took the first step in this direction by creating a method for classifying biomedical articles by RL based on sets of “basic” and “applied” words. Their word sets were created using a combination of processing of word count lists derived from titles of
NOTICE: This is the author’s version of a work that was accepted for publication in Journal of Informetrics. Changes resulting from the publishing process, such as peer review, editing, corrections, structural formatting, and other quality control mechanisms may not be reflected in
this document. Changes may have been made to this work since it was submitted for publication. A definitive version was subsequently published in Journal of Informetrics, 8(1), 1-12, DOI: 10.1016/j.joi.2013.10.005.
4
papers in RL1 (applied) and RL4 (basic) journals, followed by manual fine tuning of those lists to produce sets of words with high discriminatory power. This method discriminates very well between RL1 and RL4, and does a reasonable job of discriminating RL2 and RL3, which are interpolated. It has the advantage of being very simple and reproducible. The greatest advantage, however, of any word-based approach to assigning RL is that it provides a standardized method that can be used with any scientific document, whether it appears in a journal with an assigned RL or not.
Cambrosio et al. (2006) used the Lewison method in a practical study to show the change in the cancer landscape over time. They showed an increased linkage between research levels from 1980 to 2000. In 1980, cancer research was divided into two groupings – RL1+RL2 and RL3+RL4 – that had little connection. By 2000, the landscape showed a much more smooth transition from RL1 to RL2+RL3 to RL4 with a much higher level of connectivity. This is important in that it shows that the potential for translation between levels is higher today than it was decades ago.
More recently, Tijssen (2010) proposed using knowledge utilization as an alternative to research levels by replacing the basic-to-applied spectrum with a classification system based on author affiliation addresses. The resulting classification system has six categories: academic, industry relevant, industry practice, clinical relevant, clinical practice, and industry-clinical relevant.
Lewison and Devey (1999) reminded us that there is a positive correlation between journal impact and journal research level, and suggested that impact assessment should account for expected values due to differences in research level. Despite this knowledge, recent studies that characterize research institutions or their impact seem to have largely ignored research level. We feel this is a mistake, particularly given the recent interest in translational medicine, and the potential shown by research level to aid in understanding of the type of connectivity that could lead to shortening of translational pathways. The model of Lewison and Paraje (2004) showed that language could be used as the basis for classifying biomedical articles by research level. We have thus undertaken this study to develop a new model that will allow individual articles to be classified by research level across all of science.
3. Methodology
All of the models trained in this study used multinomial logistic regression, an extension of logistic regression to situations where there are more than two discrete outcomes (cf., Hosmer & Lemeshow, 2000). In this case there are four possible outcomes – the four research levels – each of which is modeled as a standard logistic regression in which the log of the probability of each outcome is linear in the features. These features, sometimes called “predictors,” were taken, for example, to be indicator functions for the presence or absence of a large set of words in the title or abstract. Our model is thus log(p(y=yj))) = b0,j + bj•x where j ranges over the four outcomes, so that there is one equation for each outcome. As the equation shows, the vectors of coefficients bj have length equal to the number of features, and indicate the contribution of the feature (e.g. the presence of a word in the abstract of a paper) to the log probability of the paper being of a given research level, yj. The feature vector is, of course, highly sparse, since most words do not occur in any given title or abstract.
NOTICE: This is the author’s version of a work that was accepted for publication in Journal of Informetrics. Changes resulting from the publishing process, such as peer review, editing, corrections, structural formatting, and other quality control mechanisms may not be reflected in
this document. Changes may have been made to this work since it was submitted for publication. A definitive version was subsequently published in Journal of Informetrics, 8(1), 1-12, DOI: 10.1016/j.joi.2013.10.005.
5
In standard multinomial regression, the coefficients in the logistic models for the different outcomes are jointly estimated, using regularization to avoid overfitting. We used the Logistic Regression function from the SKLearn package (http://scikit-learn.org/), which actually implements a faster one-vs.-all method with L1/L2 regularization, rather than “true” multinomial regression. SKLearn takes advantage of the sparsity of the feature vectors to provide computationally efficient solutions.
4. Experiments and Results
Development of a model to classify articles by research level for all of science is a significant step forward from a model that operates only on articles in biomedicine. In addition to creating a working model, it was our goal to optimize the accuracy of the model to the extent possible given computational constraints. Thus, we chose to work toward a final model through a progression of experiments that would allow us to gauge progress and understand the effects of changes to the inputs.
4.1 Model of Biomedical Science
The first step in the study was to determine if we could develop a word-based model to classify biomedical articles that would be even more discriminatory than that developed by Lewison & Paraje (2004), particularly with respect to RL2 and RL3. To this end we chose a corpus of biomedical articles that could be used to develop the classification system. Using Scopus data from 2010, PubMed data from 2010, and the UCSD journal classification system (Börner, et al., 2012), we designated as medical disciplines those UCSD subdisciplines where at least half of the Scopus articles were also available in PubMed. The corpus was limited to journals (and their papers) from these medical disciplines with an assigned CHI research level, resulting in a set of 415,898 papers from 2,183 journals.
Two different models of research level were trained from these data. First, a multinomial logistic regression model was created using title and abstract words as features. The 8,384 words that appeared in at least 100 titles and the 30,362 words that appeared in at least 100 abstracts were used in the model. Although stemming can reduce the number of unique words used in text-based applications, it has not been shown to systematically improve results. Thus, no stemming or lemming was applied in this study. Title and abstract words were considered separately. For example, the word urology in titles and abstracts was considered as two separate features – t: urology, and a: urology. The model was trained against the CHI research levels using binary matrix entries rather than actual word counts; only papers containing two or more features were used. The resulting Word Feature Model (WFM) contained weights for each feature – research level combination.
Since the original CHI research levels were partially based on citation patterns, we created a second multinomial logistic regression model with eight features. Observations are now papers. The first four features for each paper are the research level probabilities calculated by the WFM. The second set of four features is comprised of the relative proportions of references to journals associated with the various research levels. For example, if a paper cites one paper from each research level, then the last four input feature values would be (0.25, 0.25, 0.25, 0.25). If a paper does not cite anything from journals associated with a research level, then the last four input features are zeros. The resulting Combined Feature Model (CFM) is represented as a set of
NOTICE: This is the author’s version of a work that was accepted for publication in Journal of Informetrics. Changes resulting from the publishing process, such as peer review, editing, corrections, structural formatting, and other quality control mechanisms may not be reflected in
this document. Changes may have been made to this work since it was submitted for publication. A definitive version was subsequently published in Journal of Informetrics, 8(1), 1-12, DOI: 10.1016/j.joi.2013.10.005.
6
coefficients and intercepts. For each research level, a model has an intercept and a vector of positive/negative coefficients of length equal to the number of features. The probability of each research level is computed as a dot product between the feature vector of the paper and the coefficients, with the intercept being added as a coefficient.
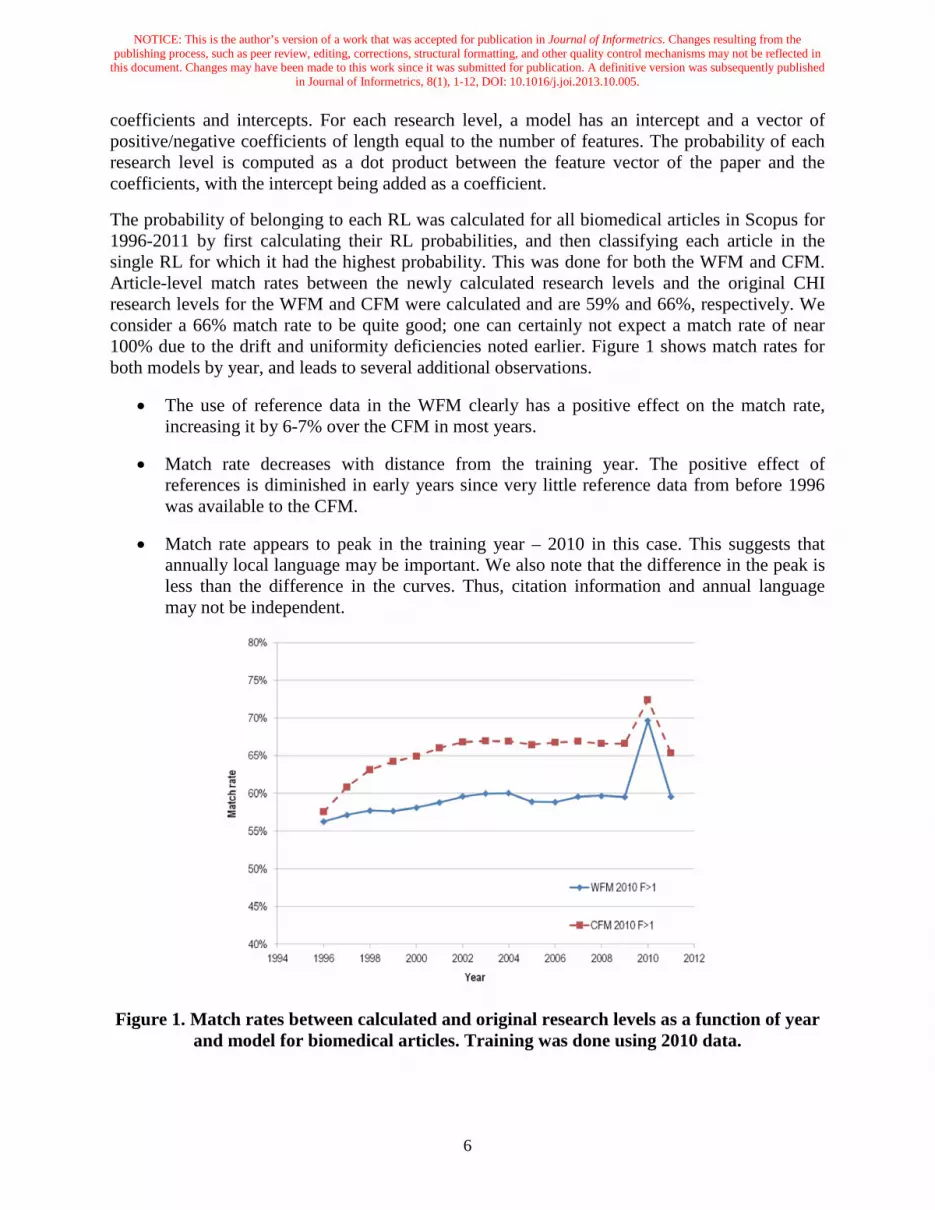
The probability of belonging to each RL was calculated for all biomedical articles in Scopus for 1996-2011 by first calculating their RL probabilities, and then classifying each article in the single RL for which it had the highest probability. This was done for both the WFM and CFM. Article-level match rates between the newly calculated research levels and the original CHI research levels for the WFM and CFM were calculated and are 59% and 66%, respectively. We consider a 66% match rate to be quite good; one can certainly not expect a match rate of near 100% due to the drift and uniformity deficiencies noted earlier. Figure 1 shows match rates for both models by year, and leads to several additional observations.
• The use of reference data in the WFM clearly has a positive effect on the match rate, increasing it by 6-7% over the CFM in most years.
• Match rate decreases with distance from the training year. The positive effect of references is diminished in early years since very little reference data from before 1996 was available to the CFM.
• Match rate appears to peak in the training year – 2010 in this case. This suggests that annually local language may be important. We also note that the difference in the peak is less than the difference in the curves. Thus, citation information and annual language may not be independent.
Figure 1. Match rates between calculated and original research levels as a function of year and model for biomedical articles. Training was done using 2010 data.
NOTICE: This is the author’s version of a work that was accepted for publication in Journal of Informetrics. Changes resulting from the publishing process, such as peer review, editing, corrections, structural formatting, and other quality control mechanisms may not be reflected in
this document. Changes may have been made to this work since it was submitted for publication. A definitive version was subsequently published in Journal of Informetrics, 8(1), 1-12, DOI: 10.1016/j.joi.2013.10.005.
7
This first experiment was reported previously in Boyack et al. (2013). Given the superiority of the CFM over the WFM, the balance of the paper, and all of the additional experiments that were run use the Combined Feature Model (CFM) based on title and abstract words and references.
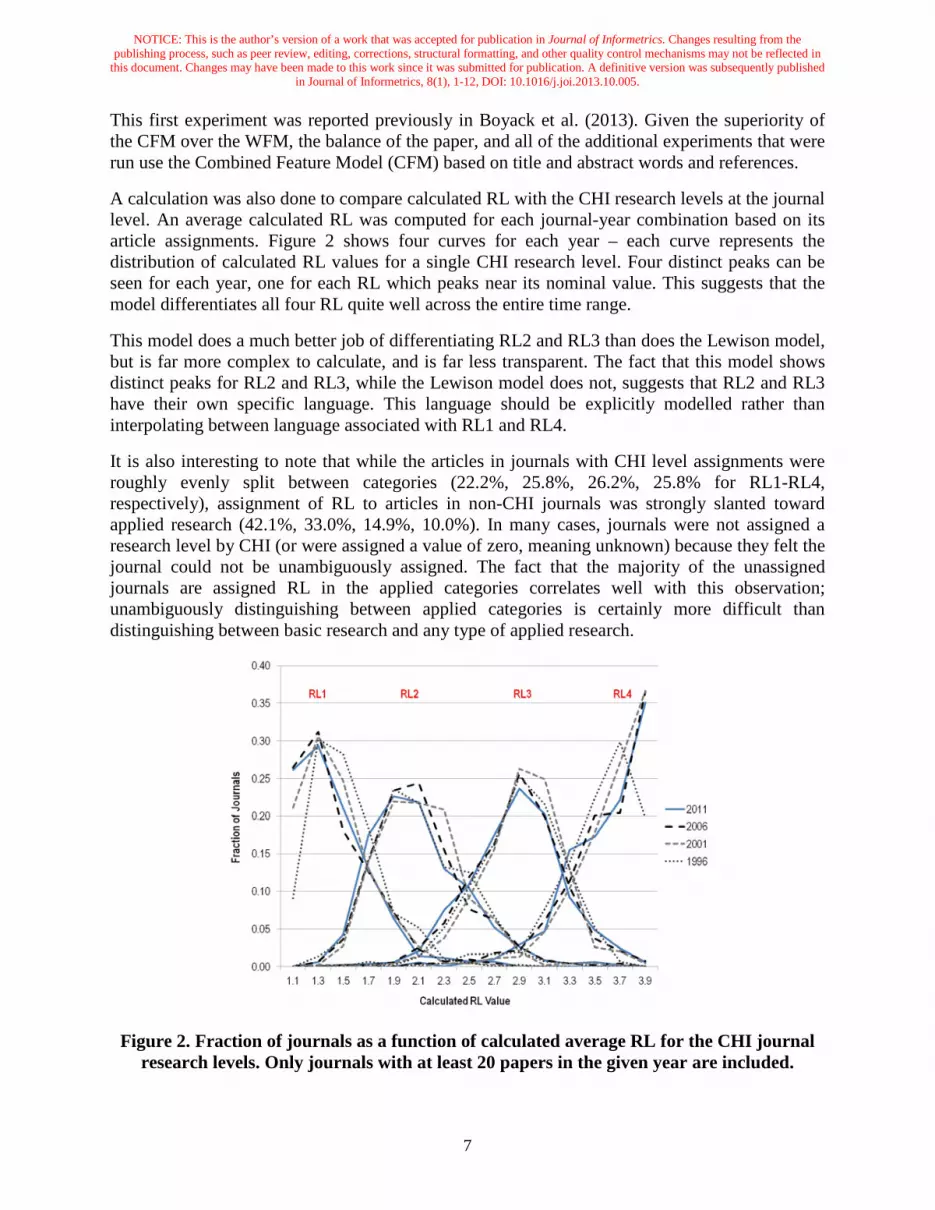
A calculation was also done to compare calculated RL with the CHI research levels at the journal level. An average calculated RL was computed for each journal-year combination based on its article assignments. Figure 2 shows four curves for each year – each curve represents the distribution of calculated RL values for a single CHI research level. Four distinct peaks can be seen for each year, one for each RL which peaks near its nominal value. This suggests that the model differentiates all four RL quite well across the entire time range.
This model does a much better job of differentiating RL2 and RL3 than does the Lewison model, but is far more complex to calculate, and is far less transparent. The fact that this model shows distinct peaks for RL2 and RL3, while the Lewison model does not, suggests that RL2 and RL3 have their own specific language. This language should be explicitly modelled rather than interpolating between language associated with RL1 and RL4.
It is also interesting to note that while the articles in journals with CHI level assignments were roughly evenly split between categories (22.2%, 25.8%, 26.2%, 25.8% for RL1-RL4, respectively), assignment of RL to articles in non-CHI journals was strongly slanted toward applied research (42.1%, 33.0%, 14.9%, 10.0%). In many cases, journals were not assigned a research level by CHI (or were assigned a value of zero, meaning unknown) because they felt the journal could not be unambiguously assigned. The fact that the majority of the unassigned journals are assigned RL in the applied categories correlates well with this observation; unambiguously distinguishing between applied categories is certainly more difficult than distinguishing between basic research and any type of applied research.
Figure 2. Fraction of journals as a function of calculated average RL for the CHI journal research levels. Only journals with at least 20 papers in the given year are included.
NOTICE: This is the author’s version of a work that was accepted for publication in Journal of Informetrics. Changes resulting from the publishing process, such as peer review, editing, corrections, structural formatting, and other quality control mechanisms may not be reflected in
this document. Changes may have been made to this work since it was submitted for publication. A definitive version was subsequently published in Journal of Informetrics, 8(1), 1-12, DOI: 10.1016/j.joi.2013.10.005.
8
4.2 Additional Experiments
Given the success of the first CFM in classifying biomedical articles by research level, we trained a variety of additional models intended to help us 1) understand the effects that might be seen by varying the inputs, and 2) meet our final goal of creating a model that will accurately classify articles from all of science by research level. As with the first experiment, these additional experiments (see Table 2) were all conducted with Scopus data, and used a CFM of the same type that was used for the first experiment. Also as before, each trained model was used to calculate probabilities for each article in each RL, and each article was then classified by the single RL for which it had the highest probability.
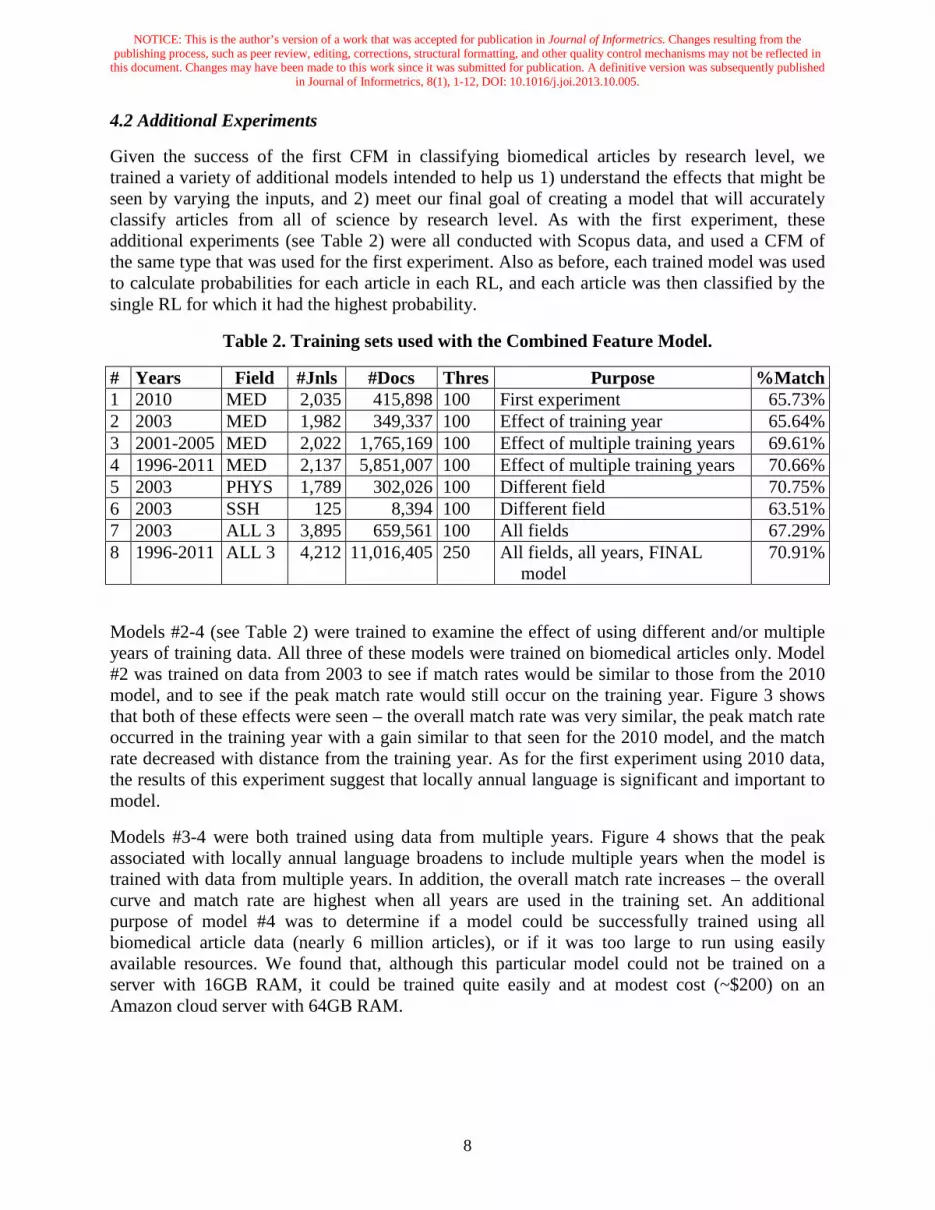
Table 2. Training sets used with the Combined Feature Model.
# Years Field #Jnls #Docs Thres Purpose %Match 1 2010 MED 2,035 415,898 100 First experiment 65.73% 2 2003 MED 1,982 349,337 100 Effect of training year 65.64% 3 2001-2005 MED 2,022 1,765,169 100 Effect of multiple training years 69.61% 4 1996-2011 MED 2,137 5,851,007 100 Effect of multiple training years 70.66% 5 2003 PHYS 1,789 302,026 100 Different field 70.75% 6 2003 SSH 125 8,394 100 Different field 63.51% 7 2003 ALL 3 3,895 659,561 100 All fields 67.29% 8 1996-2011 ALL 3 4,212 11,016,405 250 All fields, all years, FINAL
model 70.91%
Models #2-4 (see Table 2) were trained to examine the effect of using different and/or multiple years of training data. All three of these models were trained on biomedical articles only. Model #2 was trained on data from 2003 to see if match rates would be similar to those from the 2010 model, and to see if the peak match rate would still occur on the training year. Figure 3 shows that both of these effects were seen – the overall match rate was very similar, the peak match rate occurred in the training year with a gain similar to that seen for the 2010 model, and the match rate decreased with distance from the training year. As for the first experiment using 2010 data, the results of this experiment suggest that locally annual language is significant and important to model.
Models #3-4 were both trained using data from multiple years. Figure 4 shows that the peak associated with locally annual language broadens to include multiple years when the model is trained with data from multiple years. In addition, the overall match rate increases – the overall curve and match rate are highest when all years are used in the training set. An additional purpose of model #4 was to determine if a model could be successfully trained using all biomedical article data (nearly 6 million articles), or if it was too large to run using easily available resources. We found that, although this particular model could not be trained on a server with 16GB RAM, it could be trained quite easily and at modest cost (~$200) on an Amazon cloud server with 64GB RAM.

NOTICE: This is the author’s version of a work that was accepted for publication in Journal of Informetrics. Changes resulting from the publishing process, such as peer review, editing, corrections, structural formatting, and other quality control mechanisms may not be reflected in
this document. Changes may have been made to this work since it was submitted for publication. A definitive version was subsequently published in Journal of Informetrics, 8(1), 1-12, DOI: 10.1016/j.joi.2013.10.005.
9
Figure 3. Comparison of match rates for models trained on 2003 and 2010 biomedical articles.
Figure 4. Comparison of match rates for models trained on multiple years of biomedical articles with the 2003 trained model.
Models #5-7 were trained to see if the match rates obtained using biomedical articles could be sustained using articles from the physical (PHYS) and social sciences (SSH). Biomedical disciplines and journals had been identified previously as mentioned in the description of the first experiment. The remainder of the Scopus data was split into PHYS and SSH segments using the high level categories of the UCSD classification system. The PHYS segment included disciplines

NOTICE: This is the author’s version of a work that was accepted for publication in Journal of Informetrics. Changes resulting from the publishing process, such as peer review, editing, corrections, structural formatting, and other quality control mechanisms may not be reflected in
this document. Changes may have been made to this work since it was submitted for publication. A definitive version was subsequently published in Journal of Informetrics, 8(1), 1-12, DOI: 10.1016/j.joi.2013.10.005.
10
from physics, chemistry, materials science, engineering, earth sciences, and computer science; while the SSH segment contained only those disciplines that were clearly based in the social sciences or humanities.
Rather than training PHYS and SSH models using data from all years, we limited those tests to data from 2003 (to minimize computation requirements) to see if match rates would be similar to those from the MED set for 2003. We also trained a model (#7) on all 2003 data to test if the three models were reasonably independent of each other, or if they would dilute each other’s effects. This could happen if words that load heavily on one RL in one model load heavily on a different RL in another model. Figure 5 shows that the model for the physical sciences has a match rate that is roughly 5% higher than the one for biomedicine. The physical sciences are home to processes that are more exact and reproducible (less stochastic) than those in biomedical sciences. Thus it should come as no surprise that the language used to describe the physical sciences is perhaps more exact and reproducible than that of biomedicine, resulting in a higher match rate. The match rate for the social sciences is roughly 2% lower than that for biomedicine, and also seems somewhat more variable. The variability could result from the fact that the training set for the social sciences is much smaller (by a factor of around 40) than those used for the MED and PHYS sets.
Figure 5. Comparison of match rates for models trained on biomedical, physical sciences, and social sciences articles from 2003.
Figure 5 also shows that the match rate for the training set that combines all of science is roughly at the average of its three constituent sets. Thus, it appears that the three vocabularies are not diluting each other, but are independent enough that they can be merged into a single model covering all of science.
To this point we had determined that 1) training on data from all years gave the best results, and 2) a single model could be used for all of science without any degradation in performance. Given this, we trained our final model (#8) using data from all years and all areas of science. Note that
NOTICE: This is the author’s version of a work that was accepted for publication in Journal of Informetrics. Changes resulting from the publishing process, such as peer review, editing, corrections, structural formatting, and other quality control mechanisms may not be reflected in
this document. Changes may have been made to this work since it was submitted for publication. A definitive version was subsequently published in Journal of Informetrics, 8(1), 1-12, DOI: 10.1016/j.joi.2013.10.005.
11
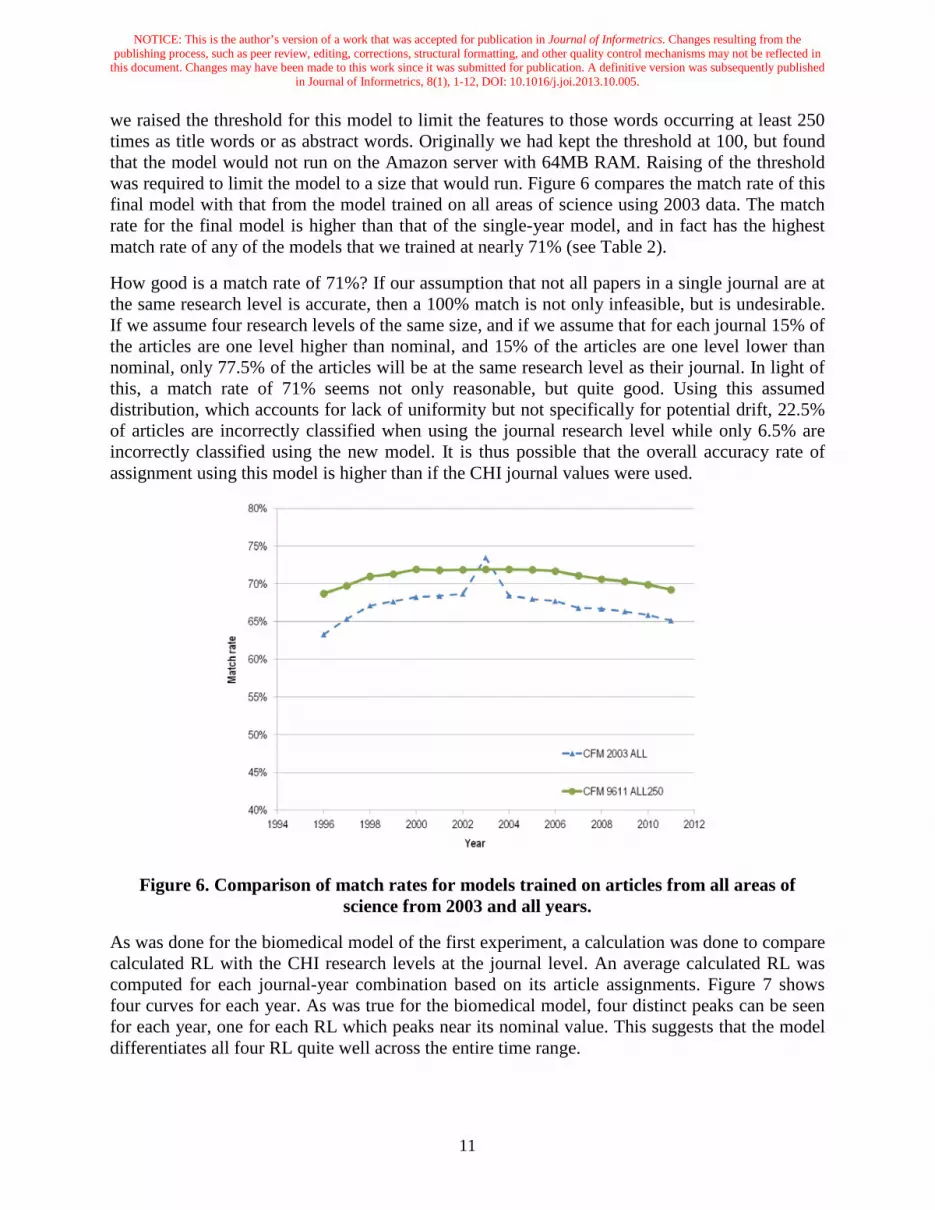
we raised the threshold for this model to limit the features to those words occurring at least 250 times as title words or as abstract words. Originally we had kept the threshold at 100, but found that the model would not run on the Amazon server with 64MB RAM. Raising of the threshold was required to limit the model to a size that would run. Figure 6 compares the match rate of this final model with that from the model trained on all areas of science using 2003 data. The match rate for the final model is higher than that of the single-year model, and in fact has the highest match rate of any of the models that we trained at nearly 71% (see Table 2).
How good is a match rate of 71%? If our assumption that not all papers in a single journal are at the same research level is accurate, then a 100% match is not only infeasible, but is undesirable. If we assume four research levels of the same size, and if we assume that for each journal 15% of the articles are one level higher than nominal, and 15% of the articles are one level lower than nominal, only 77.5% of the articles will be at the same research level as their journal. In light of this, a match rate of 71% seems not only reasonable, but quite good. Using this assumed distribution, which accounts for lack of uniformity but not specifically for potential drift, 22.5% of articles are incorrectly classified when using the journal research level while only 6.5% are incorrectly classified using the new model. It is thus possible that the overall accuracy rate of assignment using this model is higher than if the CHI journal values were used.
Figure 6. Comparison of match rates for models trained on articles from all areas of science from 2003 and all years.
As was done for the biomedical model of the first experiment, a calculation was done to compare calculated RL with the CHI research levels at the journal level. An average calculated RL was computed for each journal-year combination based on its article assignments. Figure 7 shows four curves for each year. As was true for the biomedical model, four distinct peaks can be seen for each year, one for each RL which peaks near its nominal value. This suggests that the model differentiates all four RL quite well across the entire time range.
NOTICE: This is the author’s version of a work that was accepted for publication in Journal of Informetrics. Changes resulting from the publishing process, such as peer review, editing, corrections, structural formatting, and other quality control mechanisms may not be reflected in
this document. Changes may have been made to this work since it was submitted for publication. A definitive version was subsequently published in Journal of Informetrics, 8(1), 1-12, DOI: 10.1016/j.joi.2013.10.005.
12
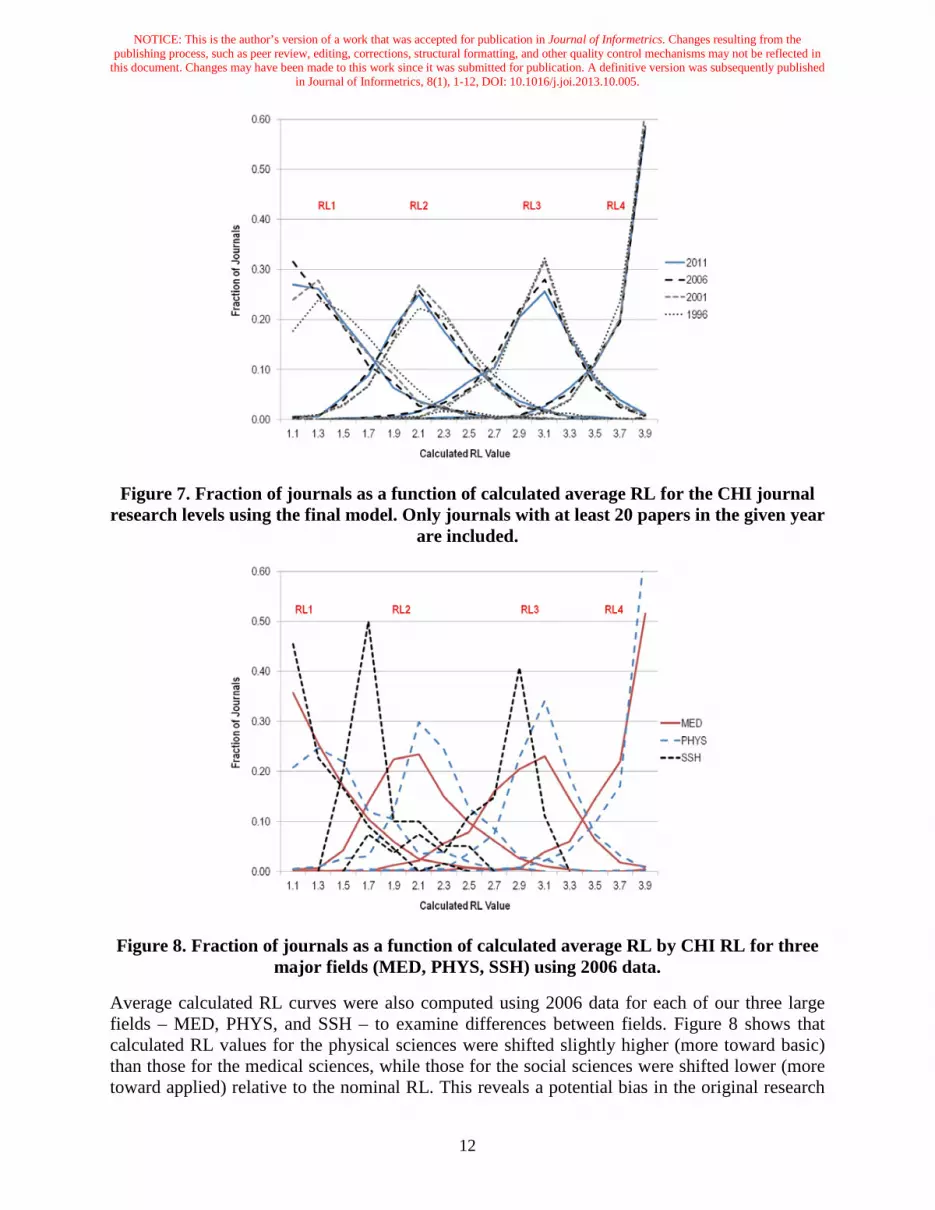
Figure 7. Fraction of journals as a function of calculated average RL for the CHI journal research levels using the final model. Only journals with at least 20 papers in the given year
are included.
Figure 8. Fraction of journals as a function of calculated average RL by CHI RL for three major fields (MED, PHYS, SSH) using 2006 data.
Average calculated RL curves were also computed using 2006 data for each of our three large fields – MED, PHYS, and SSH – to examine differences between fields. Figure 8 shows that calculated RL values for the physical sciences were shifted slightly higher (more toward basic) than those for the medical sciences, while those for the social sciences were shifted lower (more toward applied) relative to the nominal RL. This reveals a potential bias in the original research
NOTICE: This is the author’s version of a work that was accepted for publication in Journal of Informetrics. Changes resulting from the publishing process, such as peer review, editing, corrections, structural formatting, and other quality control mechanisms may not be reflected in
this document. Changes may have been made to this work since it was submitted for publication. A definitive version was subsequently published in Journal of Informetrics, 8(1), 1-12, DOI: 10.1016/j.joi.2013.10.005.
13
level assignments between the major fields. No curve is shown for RL4 for the SSH set since there were only 5 journals in that part of the training set.
5. Model Characterization
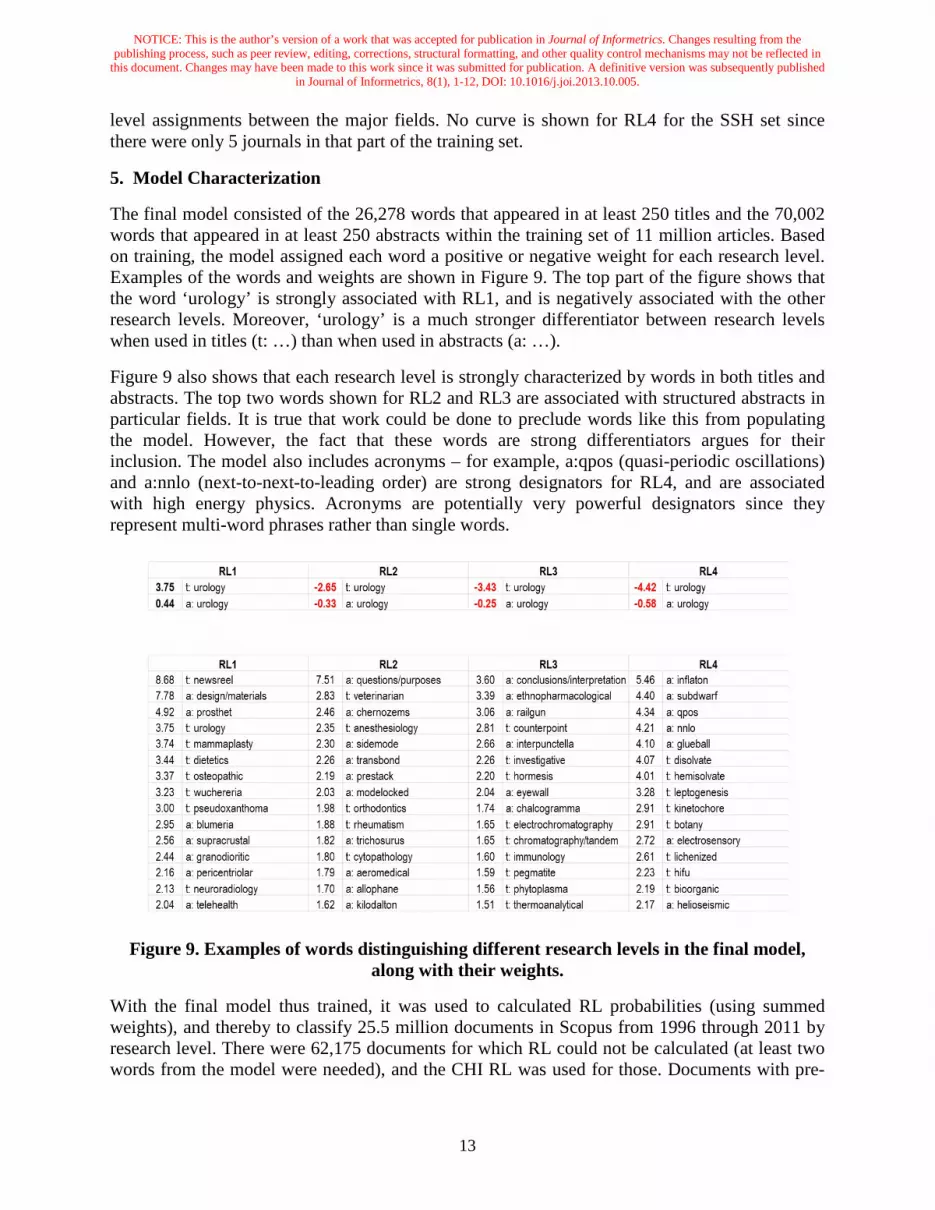
The final model consisted of the 26,278 words that appeared in at least 250 titles and the 70,002 words that appeared in at least 250 abstracts within the training set of 11 million articles. Based on training, the model assigned each word a positive or negative weight for each research level. Examples of the words and weights are shown in Figure 9. The top part of the figure shows that the word ‘urology’ is strongly associated with RL1, and is negatively associated with the other research levels. Moreover, ‘urology’ is a much stronger differentiator between research levels when used in titles (t: …) than when used in abstracts (a: …).
Figure 9 also shows that each research level is strongly characterized by words in both titles and abstracts. The top two words shown for RL2 and RL3 are associated with structured abstracts in particular fields. It is true that work could be done to preclude words like this from populating the model. However, the fact that these words are strong differentiators argues for their inclusion. The model also includes acronyms – for example, a:qpos (quasi-periodic oscillations) and a:nnlo (next-to-next-to-leading order) are strong designators for RL4, and are associated with high energy physics. Acronyms are potentially very powerful designators since they represent multi-word phrases rather than single words.
Figure 9. Examples of words distinguishing different research levels in the final model, along with their weights.
With the final model thus trained, it was used to calculated RL probabilities (using summed weights), and thereby to classify 25.5 million documents in Scopus from 1996 through 2011 by research level. There were 62,175 documents for which RL could not be calculated (at least two words from the model were needed), and the CHI RL was used for those. Documents with pre-

NOTICE: This is the author’s version of a work that was accepted for publication in Journal of Informetrics. Changes resulting from the publishing process, such as peer review, editing, corrections, structural formatting, and other quality control mechanisms may not be reflected in
this document. Changes may have been made to this work since it was submitted for publication. A definitive version was subsequently published in Journal of Informetrics, 8(1), 1-12, DOI: 10.1016/j.joi.2013.10.005.
14
assigned CHI research levels were not evenly distributed across levels as shown in Table 3, but were weighted toward RL4. The calculated research levels for these same documents had a similar distribution, but were even more weighted toward RL4. The distribution of calculated research levels among documents in non-CHI journals had a very different distribution, weighted heavily toward the most applied level, RL1. The overall distribution (CHI and non-CHI journals) was more even with two levels (RL2 and RL4) at roughly 25% each. RL1 is the most heavily populated level, while RL3 has the lowest fraction of documents.
The difference in distribution between documents in CHI and non-CHI journals is very interesting. Our listing of the CHI research level assignments came from the U.S. National Science Foundation (personal communication with Lawrence Burton, Feb. 2008), which uses the list of assignments maintained by ipiQ Global, a spin-off of Narin’s original CHI company. The NSF master file contained not only level assignments from 1 to 4, but also a large number of zero values – RL=0 and RL=4 have roughly the same number of entries. A research level of zero indicates that the journal was considered, but that no research value was assigned because an unambiguous assignment could not be made. A distribution for non-CHI journals that is weighted toward the applied research levels correlates well with this observation; unambiguously distinguishing between applied categories is certainly more difficult than distinguishing between basic research and any type of applied research. In addition, we note that the overall fraction of RL1 papers has increased from 25% in 1996 to 31% in 2010. The number of documents indexed annually by Scopus doubled over this same time period, suggesting that the new source titles added by Scopus over the years are more applied than the core set that was indexed as of 1996.
Table 3. Distribution of documents by research level for different document groups.
#Doc RL1 RL2 RL3 RL4 CHI RL 11,975,727 15.6% 23.4% 27.5% 33.6% Calculated 11,975,727 15.1% 22.6% 26.1% 36.3% Non-CHI Calculated 13,586,680 40.1% 27.5% 13.8% 16.9% Overall 25,562,407 28.5% 25.2% 19.5% 25.9%
To further characterize the RL distribution from the model, we have computed the average research level by location on a map of all of science created from the same 16-year set of Scopus data. Briefly, a map of science (see Figure 10) was created by clustering documents using a combination of co-citation and bibliographic coupling, and then creating a visual layout of those clusters using text analysis (Boyack & Klavans, 2013). This map was further subdivided into over 4000 sections using a grid structure, which allows metrics of various types to be calculated for each subsection of the map. The lower panel of Figure 10 shows the average research level for each gridded subsection of the map. Each circle is sized to represent the number of documents in the grid, and is colored to show research level. Comparison of the two maps in Figure 10 enables a rough characterization of field by research level. For example, most research in chemistry (blue), physics (purple), and biology (green) is on the basic end of the spectrum, while most research in engineering (cyan), computer science (pink), and the social sciences (light orange) is on the applied end of the spectrum. In the medical areas (reds, oranges), there is a shift from basic to applied as one moves from the center of the map outward toward the bottom and left.

NOTICE: This is the author’s version of a work that was accepted for publication in Journal of Informetrics. Changes resulting from the publishing process, such as peer review, editing, corrections, structural formatting, and other quality control mechanisms may not be reflected in
this document. Changes may have been made to this work since it was submitted for publication. A definitive version was subsequently published in Journal of Informetrics, 8(1), 1-12, DOI: 10.1016/j.joi.2013.10.005.
15
Figure 10. A map of science showing relative positions of different fields (upper) and
average research levels (lower) for over 4000 subsections of the map.
NOTICE: This is the author’s version of a work that was accepted for publication in Journal of Informetrics. Changes resulting from the publishing process, such as peer review, editing, corrections, structural formatting, and other quality control mechanisms may not be reflected in
this document. Changes may have been made to this work since it was submitted for publication. A definitive version was subsequently published in Journal of Informetrics, 8(1), 1-12, DOI: 10.1016/j.joi.2013.10.005.
16
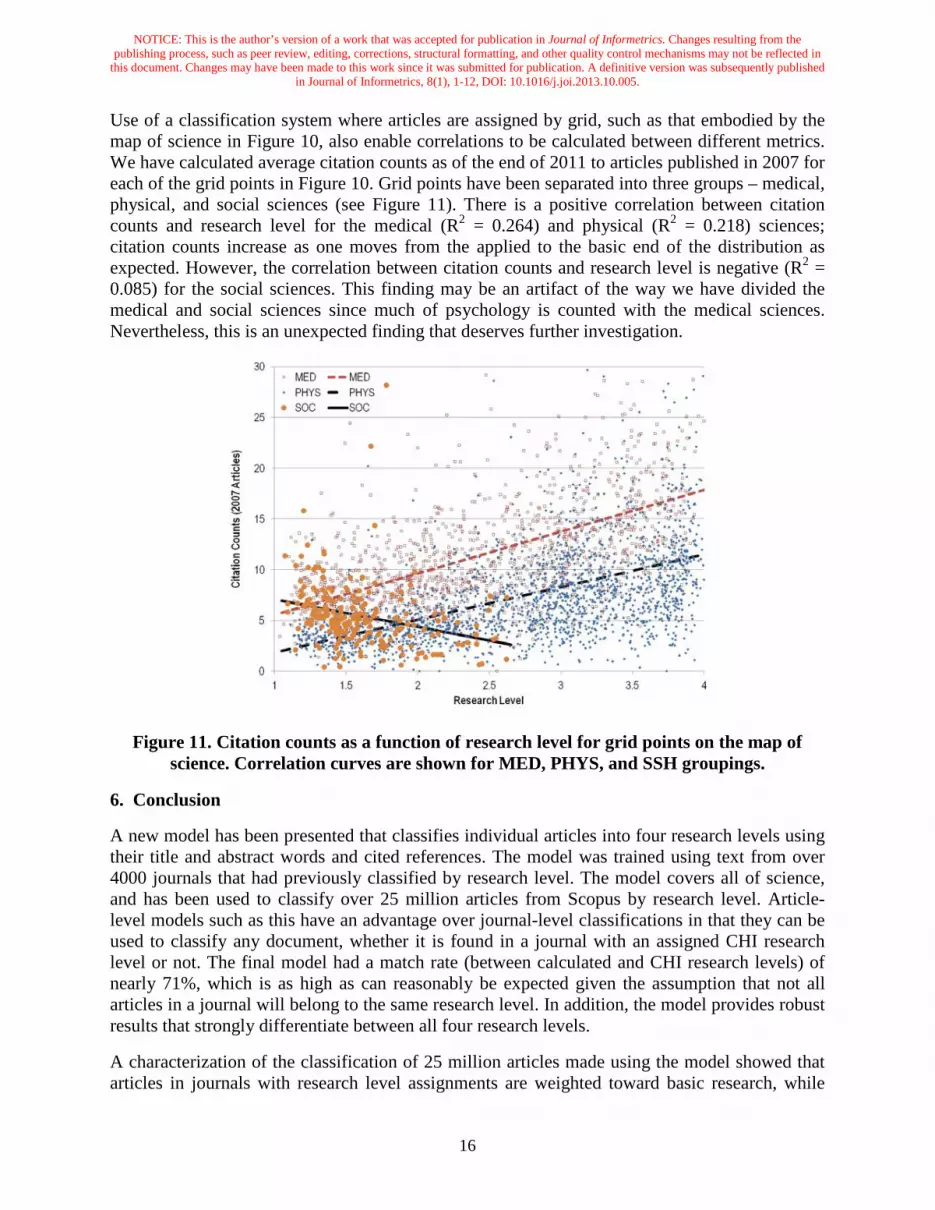
Use of a classification system where articles are assigned by grid, such as that embodied by the map of science in Figure 10, also enable correlations to be calculated between different metrics. We have calculated average citation counts as of the end of 2011 to articles published in 2007 for each of the grid points in Figure 10. Grid points have been separated into three groups – medical, physical, and social sciences (see Figure 11). There is a positive correlation between citation counts and research level for the medical (R2 = 0.264) and physical (R2 = 0.218) sciences; citation counts increase as one moves from the applied to the basic end of the distribution as expected. However, the correlation between citation counts and research level is negative (R2 = 0.085) for the social sciences. This finding may be an artifact of the way we have divided the medical and social sciences since much of psychology is counted with the medical sciences. Nevertheless, this is an unexpected finding that deserves further investigation.
Figure 11. Citation counts as a function of research level for grid points on the map of science. Correlation curves are shown for MED, PHYS, and SSH groupings.
6. Conclusion
A new model has been presented that classifies individual articles into four research levels using their title and abstract words and cited references. The model was trained using text from over 4000 journals that had previously classified by research level. The model covers all of science, and has been used to classify over 25 million articles from Scopus by research level. Article-level models such as this have an advantage over journal-level classifications in that they can be used to classify any document, whether it is found in a journal with an assigned CHI research level or not. The final model had a match rate (between calculated and CHI research levels) of nearly 71%, which is as high as can reasonably be expected given the assumption that not all articles in a journal will belong to the same research level. In addition, the model provides robust results that strongly differentiate between all four research levels.
A characterization of the classification of 25 million articles made using the model showed that articles in journals with research level assignments are weighted toward basic research, while
NOTICE: This is the author’s version of a work that was accepted for publication in Journal of Informetrics. Changes resulting from the publishing process, such as peer review, editing, corrections, structural formatting, and other quality control mechanisms may not be reflected in
this document. Changes may have been made to this work since it was submitted for publication. A definitive version was subsequently published in Journal of Informetrics, 8(1), 1-12, DOI: 10.1016/j.joi.2013.10.005.
17
articles in journals without a research level assignment are heavily weighted toward applied research. The fields of physics, chemistry, biology, and parts of medicine are associated with basic research, while the fields of engineering, computer science, social sciences, and the more clinical areas of medicine are more associated with applied research. In addition, the positive correlation between citation counts and research level was verified for the medical and physical sciences. However, citation counts and research level appear to be negatively correlated for the social sciences.
Article-based classification by research level has the potential to expand our understanding about translational pathways and how institutions and researchers are positioned to effect translational research. For example, we recently characterized the output of the top 20 researchers (in terms of publication counts) in the field of Alzheimer’s Disease (Boyack, et al., 2013) by research level. Seven of these 20 researchers have a large fraction of their publications (>30%) in each of two research levels; the other 13 publish primarily in only one research level. It is possible that researchers who publish in multiple research levels are more capable of moving their work along translational pathways than are researchers who only publish in a single level. We expect to continue work in this area of research and encourage others to do the same.
Acknowledgements
This research is supported by the Intelligence Advanced Research Projects Activity (IARPA) via Department of Interior National Business Center (DoI/NBC) contract number D11PC20152. The U.S. Government is authorized to reproduce and distribute reprints for Governmental purposes notwithstanding any copyright annotation thereon. Disclaimer: The views and conclusions contained herein are those of the authors and should not be interpreted as necessarily representing the official policies or endorsements, either expressed or implied, of IARPA, DoI/NBC, or the U.S. Government. The sponsor had no role in study design, collection, analysis and interpretation of data, writing of the article, or in the decision to publish.
References
Bordons, M., Gomez, I., Fernandez, M. T., Zulueta, M. A., & Mendez, A. (1996). Local, domestic and international scientific collaboration in biomedical research. Scientometrics, 37(2), 279-295.
Bordons, M., & Zulueta, M. A. (1997). Comparison of research team activities in two biomedical fields. Scientometrics, 40(3), 423-436.
Börner, K., Klavans, R., Patek, M., Zoss, A. M., Biberstine, J. R., Light, R. P., Lariviere, V., & Boyack, K. W. (2012). Design and update of a classification system: The UCSD map of science. PLoS ONE, 7(7), e39464.
Boyack, K. W., & Klavans, R. (2011). Multiple dimensions of journal specificity: Why journals can't be assigned to disciplines. 13th International Conference of the International Society for Scientometrics and Informetrics, 123-133.
Boyack, K. W., & Klavans, R. (2013). Creation of a highly detailed, dynamic, global model and map of science. Journal of the American Society for Information Science and Technology, DOI: 10.1002/asi.22990.
NOTICE: This is the author’s version of a work that was accepted for publication in Journal of Informetrics. Changes resulting from the publishing process, such as peer review, editing, corrections, structural formatting, and other quality control mechanisms may not be reflected in
this document. Changes may have been made to this work since it was submitted for publication. A definitive version was subsequently published in Journal of Informetrics, 8(1), 1-12, DOI: 10.1016/j.joi.2013.10.005.
18
Boyack, K. W., Klavans, R., Patek, M., Yoon, P., & Ungar, L. H. (2013). An indicator of translational capacity of biomedical researchers. In 18th International Conference on Science and Technology Indicators. Berlin, Germany.
Butler, L., Biglia, B., & Bourke, P. (1998). Australian Biomedical Research: Funding acknowledgements and performance. In report to the National Health & Medical Research Council, Australia.
Cambrosio, A., Keating, P., Mercier, S., Lewison, G., & Mogoutov, A. (2006). Mapping the emergence and development of translational cancer research. European Journal of Cancer, 42, 3140-3148.
Carpenter, M. P., Gibb, F., Harris, M., Irvine, J., Martin, B. R., & Narin, F. (1988). Bibliometric profiles for British academic institutions: An experiment to develop research output indicators. Scientometrics, 14(3-4), 213-233.
Grant, J., Cottrell, R., Cluzeau, F., & Fawcett, G. (2000). Evaluating 'payback' on biomedical research from papers cited in clinical guidelines: Applied bibliometric study. British Medical Journal, 320, 1107-1111.
Hosmer, D. W., & Lemeshow, S. (2000). Applied Logistic Regression (2nd Edition). New York: John Wiley & Sons, Inc.
Lewison, G., & Devey, M. E. (1999). Bibliometrics methods for the evaluation of arthritis research. Rheumatology, 38, 13-20.
Lewison, G., & Paraje, G. (2004). The classification of biomedical journals by research level. Scientometrics, 60(2), 145-157.
McAllister, P. R., & Narin, F. (1983). Characterization of the research papers of U.S. medical schools. Journal of the American Society for Information Science, 34(2), 123-131.
McMillan, G. S., Narin, F., & Deeds, D. L. (2000). An analysis of the critical role of public science in innovation: The case of biotechnology. Research Policy, 29, 1-8.
Narin, F., Pinski, G., & Gee, H. H. (1976). Structure of the biomedical literature. Journal of the American Society for Information Science, 27(1), 25-45.
Narin, F., & Rozek, R. P. (1988). Bibliometric analysis of U.S. pharmaceutical industry research performance. Research Policy, 17, 139-154.
Tijssen, R. J. W. (2010). Discarding the 'basic science/applied science' dichotomy: A knowledge utilization triangle classification system of research journals. Journal of the American Society for Information Science and Technology, 61(9), 1842-1852.