civil design guide - engineering ministries international
TRANSCRIPT

Civil Design Guide
i
Civil Design Guide

Introduction
Civil Design Guide
i
Introduction EMI DESIGN PHILOSOPHY
Vision
People restored by God and the world restored through design.
Mission
To develop people, design structures, and construct facilities which serve communities and the
Church.
Core Values
EMI revolves around the person of Jesus and serves the global Church to glorify God through:
Design: EMI works within the local context to design and construct culturally-appropriate
facilities that are sustainable, affordable, and transformational.
Discipleship: EMI develops people spiritually and professionally through intentional
discipleship and mentoring.
Diversity: EMI builds the Church by connecting people of diverse backgrounds, abilities
and ethnicities to demonstrate our love for God, our love for the nations and the unity we
share in Christ.
DESIGN GUIDE FEATURES
The purpose of this design guide is to support the vision, mission, and core values of EMI in
civil engineering design. The standards and procedures contained in this guide combine
experience of EMI staff and volunteers as well as many other external resources. Since each
project, client, and context is unique, this guide does not propose one-size-fits-all solutions.
Instead, it provides consistent methods for common EMI designs and it equips civil engineers
with a resource for evaluating alternative and appropriate designs where applicable.
This design guide contains hyperlinks and references to provide access to supporting
material. The user must ensure to have the entire and latest EMI Civil Design Manual folder,
which includes the EMI Civil Design Guide (this document) and all supporting files, to include
the following subfolders:
Design Tools provide templates that aid in collecting information on the site and
processing data in Microsoft Excel. There are three subfolders:

Introduction
Civil Design Guide
ii
o Checklists to aid in Client Needs Assessments, Preliminary Research Guide
and Site Evaluations.
o Global Templates provide EMI standard design templates for EMI projects.
These templates should be used for the project for standard calculations.
o Testing Field Packets are printable guides that aid in Soil Testing, Solid Waste,
and Water Quality Testing and provide templates for collecting data.
References provide external resources and supporting documentation for the topics
discussed in the design guide.
Training Videos provide videos for accessing the design guide file structure and how
to use templates.
DISCLAIMER
It is expected that the reader possesses the proper education/training to apply this
information properly; this Guide is NOT as substitute for professional expertise.
EMI works in many countries with no established design standards or code enforcement.
Therefore, this document complies with internationally accepted standards whenever
possible. The office specific detailed descriptions may include specific design standards for
the country where the office is located. For specific projects, any governing standards and
codes applicable to the site location take priority. Design shall follow the latest edition of the
local standards regardless of any specifications explicitly or implicitly set forth in this
document.
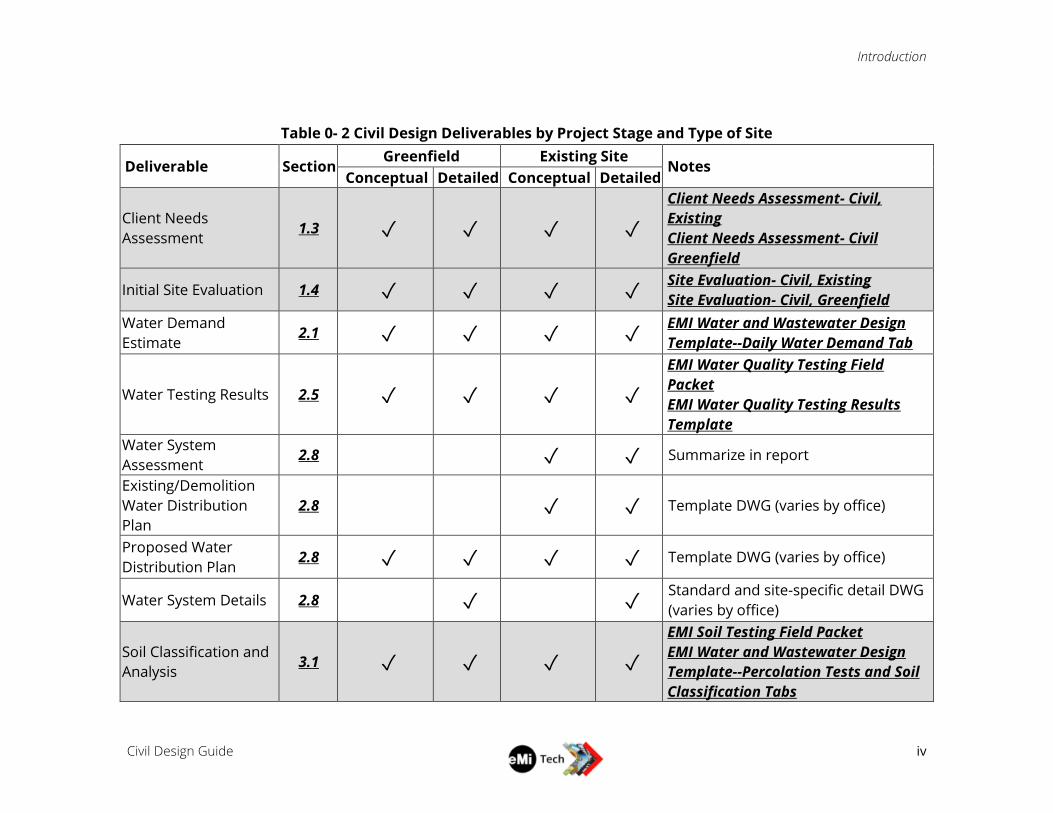
DETERMINING SCOPE OF WORK
As part of project planning, EMI staff will determine the scope of work for each approved
project. The project leader will coordinate with the design professionals to determine the
necessary design work required to support the overall project objectives and develop an
appropriate work scope with the designer(s) for the project. Civil Design Deliverables by
Project Stage and Type of Site outlines the typical deliverables/analysis that are required for
specific projects based on the level of design (conceptual vs. detailed) and type of site
(undeveloped or “greenfield” vs. modification to existing buildings). Experienced volunteers
can use the design guide to better understand the level of detail expected for EMI project
since it is different than industry experience. While young professionals can learn how to
design in an EMI context.
EDITION
This document is a living document and is intended to capture best practices for preliminary
design and provide a guide to up-to-date design information needed to complete EMI
projects properly. To continually improve the contents of this document, please provide your

Introduction
Civil Design Guide
iii
project leader with feedback on any errors you find, suggested improvements we could
make, or your opinion on ways we could do things better. We are particularly interested in
adapting this manual to different cultural contexts in which EMI operates.
Table 0- 1 Edition History
Edition Date Editors List of
Updates/Comments
Global Civil Design
Guide Version 1.0
May
2021
Jason Chandler, Natalie
Thompson
CONTRIBUTORS
Many EMI staff and volunteers with expertise in Civil Engineering have contributed to this
Design Guide. Most of the sections were started from EMI’s Uganda office and edited to apply
to a global context. A list of contributors can be found in Table 0- 3 List of Contributors serves
as a list of expertise to contact if there are additional questions.
FEEDBACK
This is a living document and a review committee will be reviewing the Civil Design Guide
and its’ file structure on an annual basis. General feedback regarding the guide and platform
can be recorded on the User Feedback Form for Civil Design Guide. Any comments and
suggestions can be made on the Suggestion Form for Civil Design Guide. Any urgent error
that needs to be addressed before the annual review can be sent to [email protected].
Introduction
Civil Design Guide
iv
Table 0- 2 Civil Design Deliverables by Project Stage and Type of Site
Deliverable Section Greenfield Existing Site
Notes Conceptual Detailed Conceptual Detailed
Client Needs
Assessment 1.3 ✓ ✓ ✓ ✓
Client Needs Assessment- Civil,
Existing
Client Needs Assessment- Civil
Greenfield
Initial Site Evaluation 1.4 ✓ ✓ ✓ ✓ Site Evaluation- Civil, Existing
Site Evaluation- Civil, Greenfield
Water Demand
Estimate 2.1 ✓ ✓ ✓ ✓
EMI Water and Wastewater Design
Template--Daily Water Demand Tab
Water Testing Results 2.5 ✓ ✓ ✓ ✓
EMI Water Quality Testing Field
Packet
EMI Water Quality Testing Results
Template
Water System
Assessment 2.8 ✓ ✓ Summarize in report
Existing/Demolition
Water Distribution
Plan
2.8 ✓ ✓ Template DWG (varies by office)
Proposed Water
Distribution Plan 2.8 ✓ ✓ ✓ ✓ Template DWG (varies by office)
Water System Details 2.8 ✓ ✓ Standard and site-specific detail DWG
(varies by office)
Soil Classification and
Analysis 3.1 ✓ ✓ ✓ ✓
EMI Soil Testing Field Packet
EMI Water and Wastewater Design
Template--Percolation Tests and Soil
Classification Tabs
Introduction
Civil Design Guide
v
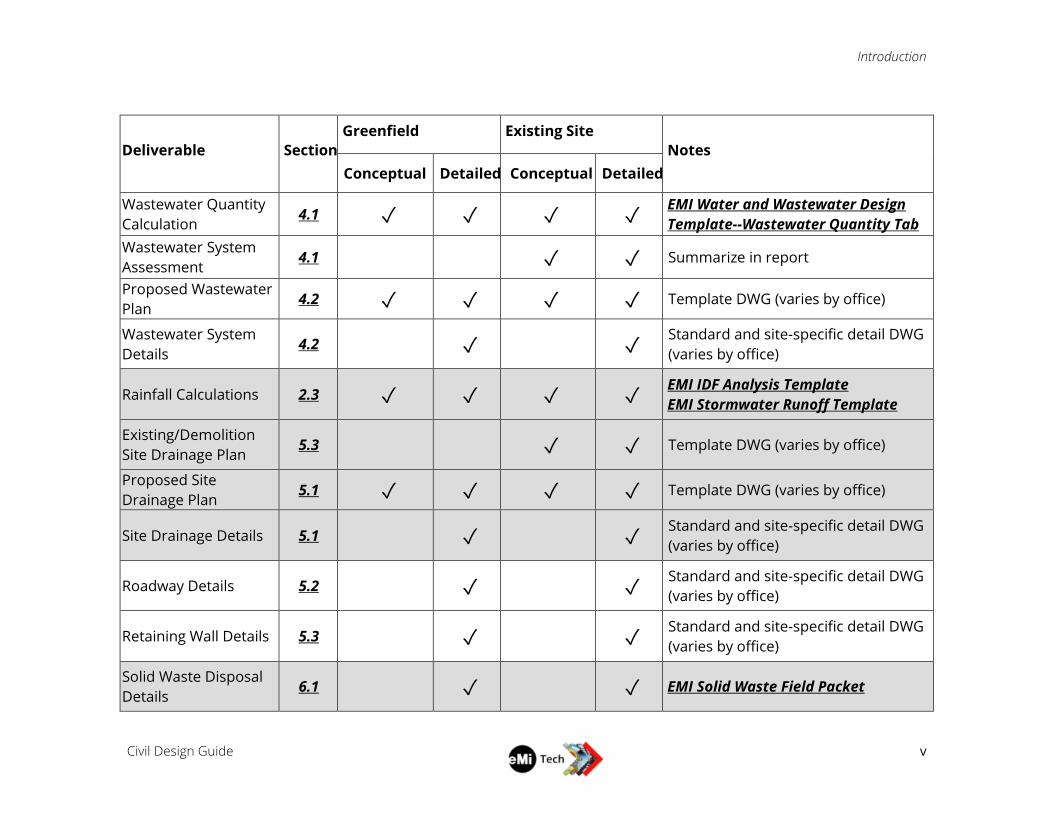
Deliverable Section
Greenfield Existing Site Notes
Conceptual Detailed Conceptual Detailed
Wastewater Quantity
Calculation 4.1 ✓ ✓ ✓ ✓
EMI Water and Wastewater Design
Template--Wastewater Quantity Tab
Wastewater System
Assessment 4.1 ✓ ✓ Summarize in report
Proposed Wastewater
Plan 4.2 ✓ ✓ ✓ ✓ Template DWG (varies by office)
Wastewater System
Details 4.2 ✓ ✓
Standard and site-specific detail DWG
(varies by office)
Rainfall Calculations 2.3 ✓ ✓ ✓ ✓ EMI IDF Analysis Template
EMI Stormwater Runoff Template
Existing/Demolition
Site Drainage Plan 5.3 ✓ ✓ Template DWG (varies by office)
Proposed Site
Drainage Plan 5.1 ✓ ✓ ✓ ✓ Template DWG (varies by office)
Site Drainage Details 5.1 ✓ ✓ Standard and site-specific detail DWG
(varies by office)
Roadway Details 5.2 ✓ ✓ Standard and site-specific detail DWG
(varies by office)
Retaining Wall Details 5.3 ✓ ✓ Standard and site-specific detail DWG
(varies by office)
Solid Waste Disposal
Details 6.1 ✓ ✓ EMI Solid Waste Field Packet
Contents
Civil Design Guide
vi
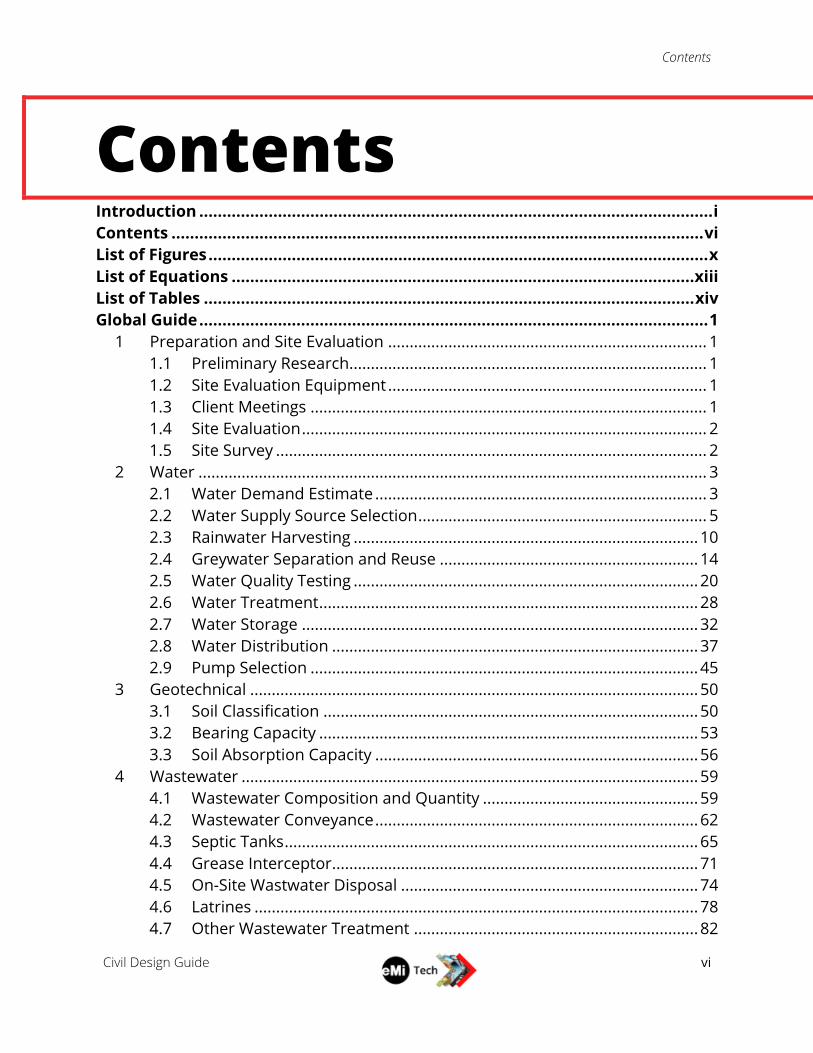
Contents Introduction ............................................................................................................... i
Contents ................................................................................................................... vi
List of Figures ............................................................................................................ x
List of Equations .................................................................................................... xiii
List of Tables .......................................................................................................... xiv
Global Guide .............................................................................................................. 1
1 Preparation and Site Evaluation .......................................................................... 1
1.1 Preliminary Research................................................................................... 1
1.2 Site Evaluation Equipment .......................................................................... 1
1.3 Client Meetings ............................................................................................ 1
1.4 Site Evaluation .............................................................................................. 2
1.5 Site Survey .................................................................................................... 2
2 Water ...................................................................................................................... 3
2.1 Water Demand Estimate ............................................................................. 3
2.2 Water Supply Source Selection ................................................................... 5
2.3 Rainwater Harvesting ................................................................................ 10
2.4 Greywater Separation and Reuse ............................................................ 14
2.5 Water Quality Testing ................................................................................ 20
2.6 Water Treatment ........................................................................................ 28
2.7 Water Storage ............................................................................................ 32
2.8 Water Distribution ..................................................................................... 37
2.9 Pump Selection .......................................................................................... 45
3 Geotechnical ........................................................................................................ 50
3.1 Soil Classification ....................................................................................... 50
3.2 Bearing Capacity ........................................................................................ 53
3.3 Soil Absorption Capacity ........................................................................... 56
4 Wastewater .......................................................................................................... 59
4.1 Wastewater Composition and Quantity .................................................. 59
4.2 Wastewater Conveyance ........................................................................... 62
4.3 Septic Tanks ................................................................................................ 65
4.4 Grease Interceptor ..................................................................................... 71
4.5 On-Site Wastwater Disposal ..................................................................... 74
4.6 Latrines ....................................................................................................... 78
4.7 Other Wastewater Treatment .................................................................. 82
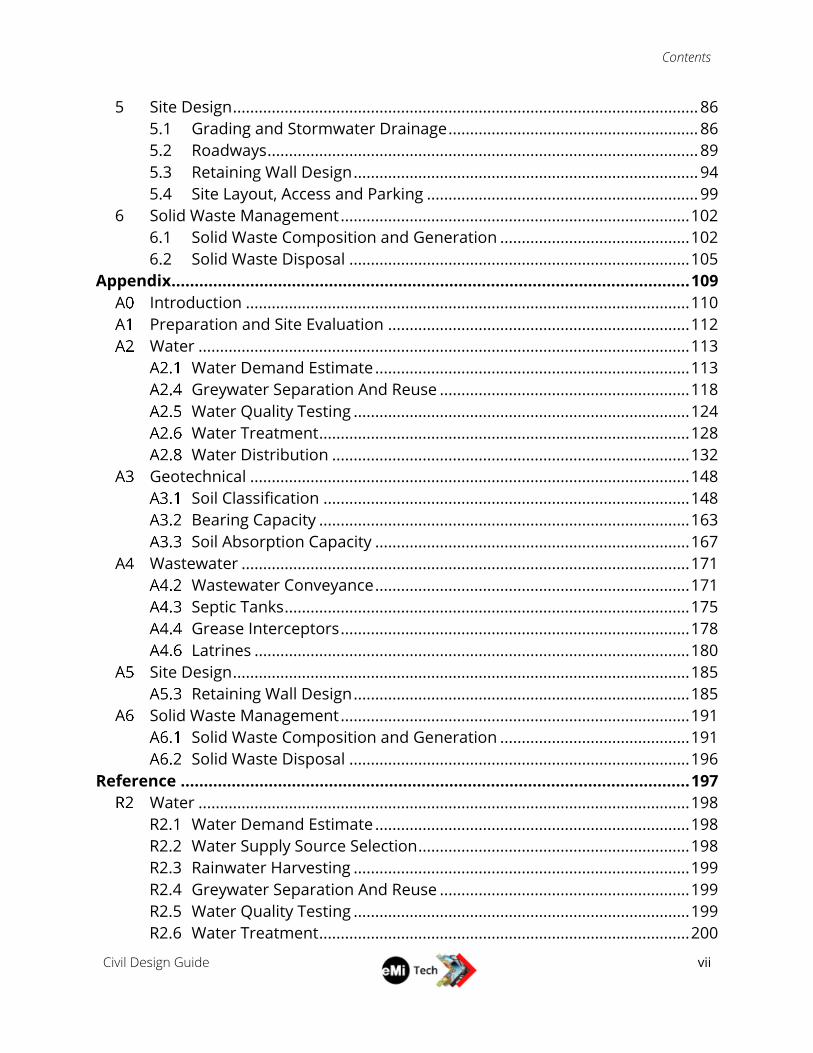
Contents
Civil Design Guide
vii
5 Site Design ............................................................................................................ 86
5.1 Grading and Stormwater Drainage .......................................................... 86
5.2 Roadways .................................................................................................... 89
5.3 Retaining Wall Design ................................................................................ 94
5.4 Site Layout, Access and Parking ............................................................... 99
6 Solid Waste Management ................................................................................. 102
6.1 Solid Waste Composition and Generation ............................................ 102
6.2 Solid Waste Disposal ............................................................................... 105
Appendix ................................................................................................................ 109
Introduction ....................................................................................................... 110
Preparation and Site Evaluation ...................................................................... 112
Water .................................................................................................................. 113
Water Demand Estimate ......................................................................... 113
Greywater Separation And Reuse .......................................................... 118
Water Quality Testing .............................................................................. 124
Water Treatment ...................................................................................... 128
Water Distribution ................................................................................... 132
Geotechnical ...................................................................................................... 148
Soil Classification ..................................................................................... 148
Bearing Capacity ...................................................................................... 163
Soil Absorption Capacity ......................................................................... 167
Wastewater ........................................................................................................ 171
Wastewater Conveyance ......................................................................... 171
Septic Tanks .............................................................................................. 175
Grease Interceptors ................................................................................. 178
Latrines ..................................................................................................... 180
Site Design .......................................................................................................... 185
Retaining Wall Design .............................................................................. 185
Solid Waste Management ................................................................................. 191
Solid Waste Composition and Generation ............................................ 191
Solid Waste Disposal ............................................................................... 196
Reference .............................................................................................................. 197
Water .................................................................................................................. 198
R2.1 Water Demand Estimate ......................................................................... 198
R2.2 Water Supply Source Selection ............................................................... 198
R2.3 Rainwater Harvesting .............................................................................. 199
R2.4 Greywater Separation And Reuse .......................................................... 199
R2.5 Water Quality Testing .............................................................................. 199
R2.6 Water Treatment ...................................................................................... 200
Contents
Civil Design Guide
viii
R2.7 Water Storage .......................................................................................... 200
R2.8 Water Distribution ................................................................................... 200
R2.9 Pump Selection ........................................................................................ 201
Geotechnical ...................................................................................................... 202
R3.1 Soil Classification ..................................................................................... 202
R3.2 Bearing Capacity ...................................................................................... 202
R3.3 Soil Absorption ......................................................................................... 203
Wastewater ........................................................................................................ 204
R4.1 Wastewater Composition and Quantity ................................................ 204
R4.2 Wastewater Conveyance ......................................................................... 204
R4.3 Septic Tanks .............................................................................................. 204
R4.4 Grease Interceptors ................................................................................. 205
R4.5 On-Site Wastewater Disposal ................................................................. 205
R4.6 Latrines ..................................................................................................... 206
R4.7 Other Wastewater Treatment ................................................................ 207
Site Design .......................................................................................................... 208
R5.1 Grading and Stormwater Drainage ........................................................ 208
R5.2 Roadways .................................................................................................. 208
R5.3 Retaining Wall Design .............................................................................. 208
R5.4 Site Layout, Access and Parking ............................................................. 209
Solid Waste Management ................................................................................. 210
R6.1 Solid Waste Composition ........................................................................ 210
R6.2 Solid Waste Disposal ............................................................................... 210
Uganda Specific Guidelines ................................................................................. 211
UG1 Preparation and Site Evaluation ...................................................................... 212
UG2 Water .................................................................................................................. 213
Water Demand Estimate ........................................................................ 213
Water Supply Source Selection ............................................................. 217
Rainwater Harvesting ............................................................................. 227
Greywater Separation and Reuse ......................................................... 237
Water Quality Testing ............................................................................. 241
Water Treatment .................................................................................... 243
Water Storage ......................................................................................... 244
Water Distribution .................................................................................. 246
Pump Selection ....................................................................................... 246
UG3 Geotechnical ...................................................................................................... 247
Soil Classification .................................................................................... 247
Soil Bearing Capacity .............................................................................. 248
Soil Absorption Capacity ........................................................................ 249
Contents
Civil Design Guide
ix
UG4 Wastewater ........................................................................................................ 255
Wastewater Composition and Quantity ............................................... 255
Wastewater Conveyance ....................................................................... 256
Septic Tanks ............................................................................................ 259
Grease Inceptor ...................................................................................... 261
On-Site Wastewater Disposal ................................................................ 262
Latrines .................................................................................................... 278
Other Wastewater Treatment ............................................................... 279
UG5 Site Design .......................................................................................................... 297
Grading and Stormwater Drainage ...................................................... 297
Roadways ................................................................................................ 304
Retaining Wall Design ............................................................................ 304
Site Layout, Access, and Parking ........................................................... 304
UG6 Solid Waste Management ................................................................................. 305
Solid Waste Composition and Generation ........................................... 305
Solid Waste Disposal .............................................................................. 305

List of Figures
Civil Design Guide
x
List of Figures Global Guide
Figure 2.3-1 First Flush Tee Device ....................................................................................................... 11
Figure 2.3-2 Example Rainwater Catchment System ........................................................................ 12
Figure 2.3-3 Example Rainwater Treatment Process ........................................................................ 12
Figure 2.4-1 Typical Solids Trap ............................................................................................................ 17
Figure 2.4-2 Standard Solids Trap Detail (For Greywater) ................................................................ 17
Figure 2.5-1 Microbiological Contaminants Relationship Flow Chart ............................................. 23
Figure 2.7-1 Example Water Demand Patterns .................................................................................. 33
Figure 2.9-1 Example System Curve .................................................................................................... 49
Figure 3.2-1 Types of Bearing Capacity Failures ................................................................................ 54
Figure 4.2-1 Example of a Junction Box Where Pipes Intersect. ...................................................... 63
Figure 4.2-2 Example of a Cleanout at the End of a Line .................................................................. 63
Figure 4.3-1 Septic Tank Design ........................................................................................................... 66
Figure 4.6-1 Sketch of a Typical Latrine ............................................................................................... 78
Figure 5.3-1 Types of Structural Failures ............................................................................................. 96
Figure 5.3-2 Diagram of Wall Drainage Details .................................................................................. 97
Figure 6.1-1 Types of Solid Wastes..................................................................................................... 103
Appendix
Figure A 2.4-1 Stocking Filter ............................................................................................................... 118
Figure A 2.4-2 Reed Bed Filtration System ........................................................................................ 119
Figure A 2.4-3 Slow Sand Filtration System ...................................................................................... 120
Figure A 2.4-4 Slow Sand Filtration System with Vent ..................................................................... 121
Figure A 2.4-5 Solar Distillation Unit .................................................................................................. 122
Figure A 2.6-6 Ceramic Filter ............................................................................................................... 128
Figure A 2.6-7 Cartridge Filter ............................................................................................................. 128
Figure A 2.6-8 Solar Disinfection ........................................................................................................ 129
Figure A 2.6-9 Chemical Disinfectants ............................................................................................... 129
Figure A 2.6-10 UV Disinfection .......................................................................................................... 130
Figure A 2.6-11 Ceramic Pot Filter with Silver ................................................................................... 130
Figure A 2.6-12 Biosand Filter ............................................................................................................. 131
Figure A 2.6-13 Chemical Treatment and Disinfection ................................................................... 131
Figure A 2.8-14 90 Degree Short Radius Elbow ................................................................................ 146
Figure A 2.8-15 90 Degree Long Radius Elbow ................................................................................. 146
Figure A 2.8-16 180 Degree Elbow ..................................................................................................... 146
Figure A 2.8-17 45 Degree Short Radius Elbow ................................................................................ 146
Figure A 2.8-18 Poly Propylene Compression Fittings .................................................................... 147
List of Figures
Civil Design Guide
xi
Figure A 2.8-19 PCV Pipe Fittings ........................................................................................................ 147
Figure A 3.1-20 Soil Pat in Hand ......................................................................................................... 148
Figure A 3.1-21 Classification Pyramid .............................................................................................. 151
Figure A 3.1-22 Angularity of Particles ............................................................................................... 152
Figure A 3.1-23 Examples of Grading ................................................................................................ 152
Figure A 3.1-24 Sieve Sizes .................................................................................................................. 153
Figure A 3.1-25 Stratified Soil Layers ................................................................................................. 155
Figure A 3.1-26 Fissured Breaks ......................................................................................................... 155
Figure A 3.1-27 Slickensided ............................................................................................................... 156
Figure A 3.1-28 Soil Types .................................................................................................................... 156
Figure A 3.1-29 Saprolitic Soils ............................................................................................................ 157
Figure A 3.1-30 Guide to Texture by Feel .......................................................................................... 158
Figure A 3.1-31 Sieve Opening and Grain Size ................................................................................. 159
Figure A 4.2-32 PRP model for residential water use ...................................................................... 172
Figure A 4.2-33 Comparison between PRP-Gumbel approach and other empirical methods . 172
Figure A 4.6-34 Ventilated Improved Pit Latrine (VIP) ..................................................................... 180
Figure A 4.6-35 Double Vault Latrine (WEDC) ................................................................................... 181
Figure A 4.6-36 Compost Latrine ........................................................................................................ 183
Figure A 4.6-37 Aqua Privy (WEDC) .................................................................................................... 184
Figure A 4.6-38 Pour Flush Latrine ..................................................................................................... 184
Figure A 5.3-39 Gravity Wall ................................................................................................................ 185
Figure A 5.3-40 Cantilever Wall ........................................................................................................... 185
Figure A 5.3-41 Sheet Pile Wall ........................................................................................................... 185
Figure A 5.3-42 MSE Wall ..................................................................................................................... 186
Figure A 5.3-43 Anchored Retaining Wall .......................................................................................... 186
Figure A 5.3-44 Gravity Wall ................................................................................................................ 187
Figure A 5.3-45 Cantilever Wall ........................................................................................................... 187
Figure A 5.3-46 Case 1: Vertical Backface and Horizontal Granular Backfill ................................ 190
Figure A 5.3-47 Case 2: Vertical Backface and Inclined Granular Backfill .................................... 190
Figure A 5.3-48 Case 3: Inclined Backface and Inclined Granular Backfill .................................... 190
Figure A 6.1-49 Example Waste Segregation Flowchart.................................................................. 195
Uganda Specific Guidelines
Figure UG 2.2-1 Typical pumping well diagram ............................................................................... 219
Figure UG 2.2-2 Solar powered water supply system diagram ..................................................... 219
Figure UG 2.2-3 Sustainable Groundwater yields in Uganda ......................................................... 220
Figure UG 2.2-4 Spring capture structure diagram ......................................................................... 222
Figure UG 2.2-5 Surface water intake structure ............................................................................... 223
Figure UG 2.2-6 Summary of suitability of various water sources ................................................ 224
Figure UG 2.3-7 Typical rainwater capture system .......................................................................... 228
Figure UG 2.3-8 Average Annual Rainfall in Uganda ....................................................................... 229
Figure UG 2.3-9 Observed (1960-2009) and projected (2010-2039) Rainfall and Temperature 230
Figure UG 2.3-10 Rainwater First Flush Capture Box ...................................................................... 231
List of Figures
Civil Design Guide
xii
Figure UG 2.3-11 Average Monthly Temperature and Rainfall of Uganda for 1901-2016 ......... 232
Figure UG 2.3-12 Average Monthly Temperature and Rainfall of Uganda for 1991-2016 ......... 233
Figure UG 2.3-13 Average Precipitation in Gulu, Uganda (2019) ................................................... 233
Figure UG 2.3-14 Average Precipitation in Jinja, Entebbe and Kajjansi (2019) ............................ 234
Figure UG 2.3-15 Average Precipitation in Mbarara, Uganda (2019) ............................................ 234
Figure UG 2.3-16 Annual Mean Rainfall (1990-2008) ...................................................................... 236
Figure UG 3.3-17 Depiction Of Site Ground Slope Classification (EPA2002) ................................ 250
Figure UG 3.3-18 Allowable Infiltration Rates for Trenches and Fields (USEPA, 1980) .............. 254
Figure UG 4.2-19 Typical inspection pipe .......................................................................................... 256
Figure UG 4.2-20 Typical gully trap (underconstruction.placemakers.co.nz) .............................. 257
Figure UG 4.2-21 Typical distribution box ......................................................................................... 257
Figure UG 4.5-22 Wastewater treatment zone ................................................................................. 262
Figure UG 4.5-23 Typical Absorption Trench .................................................................................... 263
Figure UG 4.5-24 Typical Trench Configuration ............................................................................... 265
Figure UG 4.5-25 Schematic Of An Absorption Field System ......................................................... 266
Figure UG 4.5-26 Typical Absorption Mound Cross Section .......................................................... 267
Figure UG 4.5-27 Lined Seepage Pit ................................................................................................... 270
Figure UG 4.5-28 Unlined Seepage Pit With Brick Collar ................................................................ 271
Figure UG 4.5-29 Unlined Seepage Pit Without Collar .................................................................... 271
Figure UG 4.5-30 Serial Distribution Using Drop Boxes ................................................................. 273
Figure UG 4.5-31 Drop Box Configuration ........................................................................................ 273
Figure UG 4.5-32 Serial Distribution Using An Overflow Point In The Relief Line ....................... 274
Figure UG 4.5-33 Piping Schematic For Serial Distribution Using Relief Lines ............................ 274
Figure UG 4.5-34 Distribution To Stepped Trenches Using A Distribution Box .......................... 275
Figure UG 4.5-35 Curtain Drain Conceptual Sketch ........................................................................ 276
Figure UG 4.5-36 Typical Shallow Trench .......................................................................................... 276
Figure UG 4.7-37 Typical manually cleaned bar screens ................................................................ 280
Figure UG 4.7-38 Schematic of a grit removal tank ......................................................................... 281
Figure UG 4.7-39 Typical Water Treatment Layout.......................................................................... 282
Figure UG 4.7-40 Schematic of Stabilization Pond System ............................................................. 282
Figure UG 4.7-41 Typical Stabilization Pond System ....................................................................... 283
Figure UG 4.7-42 Schematic of a horizontal flow subsurface constructed wetland ................... 285
Figure UG 4.7-43 Schematic of Horizontal Flow Subsurface Constructed Wetland ................... 287
Figure UG 4.7-44 Schematic of surface flow constructed wetland ............................................... 288
Figure UG 4.7-45 Schematic of a submerged membrane bioreactor system ............................. 290
Figure UG 4.7-46 Schematic of an oxidation ditch system ............................................................. 291
Figure UG 4.7-47 Small Oxidation Ditch System .............................................................................. 292
Figure UG 4.7-48 Anaerobic Baffled Reactor (ABR) ......................................................................... 293
Figure UG 4.7-49 Anaerobic Filter ...................................................................................................... 295
List of Equations
Civil Design Guide
xiii
List of Equations
Equation 2.5-1 Residual Chlorine Calculation .................................................................................... 25
Equation 3.2-1 Allowable Bearing Capacity ........................................................................................ 55
Equation 4.3-1 Septic Tank Volume ..................................................................................................... 67
Equation 4.4-1 Grease Interceptor Design Flowrate ......................................................................... 72
Equation 4.4-2 Grease Interceptor Volume ........................................................................................ 73
Equation A2.5-1 Langelier Saturation Index ..................................................................................... 126
Equation A3.2-2 Simplified Ultimate Bearing Capacity ................................................................... 166
Equation A4.3-3 Alternative Septic Tank Calculations ..................................................................... 175

List of Tables
Civil Design Guide
xiv
List of Tables Introduction
Table 0- 1 Edition History ........................................................................................................................ iii
Table 0- 2 Civil Design Deliverables by Project Stage and Type of Site ............................................ iv
Table 0- 3 List of Contributors ............................................................................................................ 110
Global Guide
Table 2.2-1 Water Source Suitability ....................................................................................................... 6
Table 2.2-2 Setback Distances for Well Protection ............................................................................... 7
Table 2.4-3 Suitable Greywater Reuse Application According To Treatment ................................ 16
Table 2.8-4 Maximum Pressure for Different Pipe Classes .............................................................. 40
Table 2.8-5 Commonly Available Pipe Sizes ....................................................................................... 41
Table 4.3-6 Setback Distance Between Septic Tanks and Nearby Features .................................. 66
Table 4.5-7 Setback Distance Between Absorption Systems and Nearby Features ..................... 75
Appendix
Table A 2.1-1 Minimum water quantities required in the health-care setting ............................ 113
Table A 2.1-2 Water Requirements for Domestic Purposes in India ............................................ 113
Table A 2.1-3 Sphere Minimum Water Quantities ........................................................................... 114
Table A 2.1-4 Typical Non-Domestic Usage ...................................................................................... 115
Table A 2.1-5 Water for Domestic and Non-Domestic Needs in India.......................................... 115
Table A 2.1-6 Consumption of Water for Domestic Animals and Livestock in India .................. 115
Table A 2.1-7 Typical Livestock Usage ............................................................................................... 116
Table A 2.1-8 Water Usage for Domestic Purposes in Southern Asia ........................................... 116
Table A 2.1-9 Typical domestic water usage for different types of water supply ....................... 116
Table A 2.1-10 Various Water Requirements in Developing Countries ........................................ 117
Table A 2.4-11 Reed Bed Strengths and Weaknesses ..................................................................... 119
Table A 2.4-12 Strengths and Weakness of Slow Sand Filtration System .................................... 121
Table A 2.5-13 Global Water Quality Standards ............................................................................... 124
Table A 2.5-14 EMI Water Testing Kits Contents .............................................................................. 127
Table A 2.8-15 Peaking Factors ........................................................................................................... 132
Table A 2.8-16 WSFU Counts As Adopted In Various Plumbing Codes ......................................... 136
Table A 2.8-17 Correlation Between WSFUs And Design Flows ..................................................... 137
Table A 3.1-18 Moisture Content Based on Field Test .................................................................... 151
Table A 3.1-19 Grain Size ..................................................................................................................... 153
Table A 3.1-20 Plasticity ....................................................................................................................... 153
Table A 3.1-21 Soil Consistency (Coarse Grained Soils) .................................................................. 154
Table A 3.1-22 Soil Consistency (Fine Grained Soils) ....................................................................... 154

List of Tables
Civil Design Guide
xv
Table A 3.1-23 USDA and USCS Classifications ................................................................................ 159
Table A 3.1-24 USCS and USDA Classifications ................................................................................ 160
Table A 3.2-25 Typical Bearing Capacity based on Soil Type ......................................................... 163
Table A 3.2-26 Factors of Safety for Various Structures ................................................................. 164
Table A 3.3-27 Recommended Rates of Wastewater Application ................................................. 168
Table A 3.3-28 Accepted Application Rate for Conventional Soils ................................................. 168
Table A 3.3-29 Accepted Application Rate for Saprolitic Soil.......................................................... 169
Table A 3.3-30 Influence of Site and Soil Evaluation Factors on Application Rate ...................... 169
Table A 3.3-31 Suggested hydraulic and organic loading ............................................................... 170
Table A 4.2-32 Peak Factor Methods ................................................................................................. 171
Table A 4.4-33 Grease Interceptor Design Parameters .................................................................. 178
Table A 5.3-34 Typical Soil Properties ................................................................................................ 188
Table A 5.3-35 Failure Modes .............................................................................................................. 188
Table A 5.3-36 Ultimate Friction Factors and Adhesion for Dissimilar Materials ........................ 189
Table A 6.1-37 Solid Waste Sources in Hospitals ............................................................................. 191
Table A 6.1-38 Average Waste Generation Rates ............................................................................ 193
Table A 6.1-39 Bulk Densities of Solid Waste by Component ........................................................ 194
Uganda Specific Guidelines
Table UG 2.1-1 Household water usage in Uganda ......................................................................... 215
Table UG 2.1-2 Water for institutional needs in Uganda ................................................................ 215
Table UG 2.3-3 Basic statistical characteristics of annual rainfall data (1940-2009) .................. 235
Table UG 2.4-4 Criteria to Consider Greywater Re-Use .................................................................. 238
Table UG 2.4-5 Approximate Percentage of Wastewater ............................................................... 238
Table UG 2.4-6 Characteristics of Different Greywater Streams ................................................... 239
Table UG 2.4-7 Guidelines for Treated Greywater Quality ............................................................. 239
Table UG 2.4-8 Sampling Regime for Treated Greywater Quality ................................................. 240
Table UG 2.5-9 Uganda Potable Water Specifications .................................................................... 242
Table UG 2.7-10 Crestanks Ltd. Standard Tank Sizing .................................................................... 245
Table UG 3.3-11 Absorption System Siting Potential Based On Slope Classification ................. 251
Table UG 4.3-12 Recommended Septic Tank Retention Times ..................................................... 259

Civil Design Guide
1
Global Guide

Global Guide Section 1 Preparation and Site Evaluation, 1.1 Preliminary Research
Civil Design Guide
1
1 Preparation and Site Evaluation
1.1 PRELIMINARY RESEARCH Prior to conducting a site visit, the team must conduct research and prepare to maximize the
limited time available on-site. This includes research through online resources and satellite
maps as well as questionnaires that the client can complete. This data provides a starting
point that is confirmed through in-person interviews, on-site evaluation, and coordination
with the rest of the design team. The following design tools are available and for
customization as necessary for the specific project.
Preliminary Research Guide- Civil provides research guidance for the designer(s) prior to the
site visit and will be archived as background information for the project.
Client Needs Assessment- Civil, Existing provides preliminary questions that the client can
answer for the specific project and location where existing facilities are present. This is to be
customized for the project and sent to the client via the project leader.
Client Needs Assessment- Civil, Greenfield provides preliminary questions that the client can
answer for the specific project and location where the site is vacant. This is to be customized
for the project and sent to the client via the project leader.
1.2 SITE EVALUATION EQUIPMENT In addition to any general packing recommendations for a project trip or site visit, some civil
engineering specific tools and equipment may be necessary for the site evaluation
depending on the scope of the project. As part of the site visit preparation, the team must
make plans for getting any necessary equipment to the site. This could include equipment
for water testing, soil testing, and/or surveying. Consult with the project leader on the
availability of specific equipment from the EMI office. Refer to EMI Water Quality Testing
Field Packet, and EMI Soil Testing Field Packet which include packing lists for the specific
needs of surveying, water quality testing, and soil testing respectfully. These documents can
be modified to meet your project or office needs.
1.3 CLIENT MEETINGS The initial meeting with the client will mostly focus on the clients’ vision for development.
Depending on the scope of the project, this may not get into details of civil engineering right
away. However, this is a chance for the civil engineer to begin verifying the preliminary
research and client needs assessment checklists. After the initial meeting, the civil engineer
can schedule to meet with the client to review (or complete) the client needs assessment.
If the site has existing facilities, include someone familiar with daily operations and a tour of
the existing facilities as part of this meeting. The EMI team may need to refrain from pointing
out issues to the maintenance personnel if it is unsolicited. This may cause embarrassment
and damage the relationship. Document any current issues and challenges as well as any
Global Guide Section 1 Preparation and Site Evaluation, 1.4 Site Evaluation
Civil Design Guide
2
needs perceived by the client, and/or plans for proposed development. Ask open-ended
questions that do not lead the client to specific responses.
1.4 SITE EVALUATION The goal of the site evaluation is to gather all data necessary to complete the design without
requiring multiple visits. Due to time limitations, correct prioritization is essential such as
stakeholder meetings, sanitary surveys, maintenance tours, and data collection. In addition
to assessments that take place on the project site, visits may also be necessary to
neighboring sites, contractors, suppliers, and/or government offices to acquire necessary
information. Such visits will be coordinated through the client and the project leader. The
following design tools are available to assist with the site evaluation and are customizable
for the specific project:
Site Evaluation- Civil, Existing provides guiding questions and typical evaluations for a site
with existing facilities.
Site Evaluation- Civil, Greenfield provides guiding questions and typical evaluations for a
vacant site.
1.5 SITE SURVEY A topographical survey may be required for proper design of the civil features. In some cases,
a client may provide a survey before the project trip. It is important to review the survey
before the trip to get an idea of the land and any problem areas to look into once on site. If
a survey is not conducted and an EMI survey team is going during or prior to the trip, ensure
that information is collected around the site and specific to water and wastewater lines. If
there are bodies of water near the site, then surveying may be required off the property line
for stormwater modeling.

Global Guide Section 2 Water, 2.1 Water Demand Estimate
Civil Design Guide
3
2 Water
2.1 WATER DEMAND ESTIMATE Estimating water demand is a critical design step for most EMI projects. The water demand
estimate is the foundation for evaluating design components such as water source selection,
distribution, storage, and treatment, as well as wastewater conveyance and disposal. There
are several methods for estimating water demand, but since many people can work on an
EMI project at different times, it is paramount that a typical method be followed and
assumptions documented clearly, so that others can follow the work that was done. Be sure
to look into the detailed descriptions for local regulations and applications.
2.1.1 DESIGN STAGE
Frequency of Use: All EMI projects involving water and wastewater designs will include a
water demand estimate.
Conceptual Design: Perform an initial estimate of the Average Daily Demand (ADDs) and
Maximum Daily Demands (MDDs) for the project. Depending on the project, the future
estimates may be by phase, or may be for the full buildout of the facility.
Detailed Design: Review and refine the initial demand estimates along with the detailed
design scope and any applicable masterplan changes to inform required site infrastructure
and building plumbing design. Estimate the peak-hour demand to use in sizing distribution
pipes.
2.1.2 DESIGN CRITERIA
An accurate estimate of water use will take into account many factors, such as:
Actual usage from existing buildings on site by observing the tank volume over time
or installed water meters;
Observations of typical water use within the specific local context;
Determination of all water uses particular to a site and client application;
Forecast of population and user type;
Seasonal fluctuations in water use; and
Guideline estimation criteria for different types of users and facilities that may be
country or region specific.
Water use in the developing world will typically be less than water use in many parts of the
developed world, primarily due to limited availability. Increased water availability will
typically increase water demand. For example, typical domestic water use for drinking,
bathing, cooking, etc. in the developing world can range from 10 liters per capita per day
(lpcd) where water is carried long distances to the users, up to 150 lpcd where water is piped
to a home or building. In some cases, domestic demands can be higher, particularly in more
Global Guide Section 2 Water, 2.1 Water Demand Estimate
Civil Design Guide
4
affluent urban areas or where a high concentration of foreigners are present, and this is to
be factored into the water use estimate. Other water uses for various institutions, irrigation,
animals, etc. must also be considered for the specific context of the project.
The average day demand (ADD) represents the average water usage on a typical day. This
can be calculated by observing typical usage on site or by using the tables in Appendix A2.1.
The maximum daily demand (MDD) is the highest expected use on any single day. This can
be estimated by using a peaking factor or by determining special events that would exceed
the ADD.
The following resources and tools are to be used in developing the water demand estimate:
The Client Needs Assessment and Site Evaluation discussed in Section 1 include
sample guiding questions and evaluation criteria that can inform the water
demand estimate.
Appendix A2.1 Water Demand Estimate provides guideline tables for various
water uses in different parts of the world.
References and additional resources can be found in R2.1 Water Demand
Estimate.
Region specific guidelines for Uganda can be found in UG2.1 Water Demand
Estimate.
The EMI Water and Wastewater Design Template is to be used as a starting point
for the estimate.
2.1.3 DESIGN PROCEDURE
Step 1: Review the information in Client Needs Assessment and Site Evaluation.
Step 2: Determine project lifecycle and phasing.
Step 3: Identify all existing and proposed water using facilities in the EMI Water and
Wastewater Design Template.
Step 4: Identify all the user types and total number of users for each facility at final
buildout.
Step 5: Estimate and input the water use for each user performing each activity at each
facility, in lpcd. Use A2.1 Water Demand Estimate, office specific detailed
descriptions, Client Needs Assessment, Initial Site Evaluation, and other
observations from client meetings to inform these estimates. Include notes in
the spreadsheet to document assumptions.
Step 6: Verify calculations of ADD and MDD for each user type and facility type.
Step 7: Record water demand estimate in the appendix of the Project Report.
Appendix tables are included in the water demand template for this purpose.
Global Guide Section 2 Water, 2.2 Water Supply Source Selection
Civil Design Guide
5
2.2 WATER SUPPLY SOURCE SELECTION Selecting reliable water supply sources is an important part of providing for on-site water
demands. Consider all possible water sources regardless of initial opinions regarding
feasibility for development and use. Consider local regulations, including water rights, in the
evaluation.
2.2.1 DESIGN STAGE
Frequency of Use: All EMI projects involving water and wastewater designs will evaluate
water supply sources.
Conceptual Design: Perform an initial evaluation of available water supply sources for the
project using the design criteria and based on water demand (Section 2.1). There could be
multiple sources utilized depending on water demand, types of use, and availability.
Detailed Design: Collect more information regarding the selected source(s); verify capacity,
quality and reliability of the source. Detailed design will also include appropriate water
catchment structures, water storage facilities, and water conveyance/distribution systems
for each source.
2.2.2 DESIGN CRITERIA
Potential water sources are listed below in order of desirability, based on expected water
quality and ability to protect sources from contamination. The desirability/suitability of water
sources will be site specific.
1. Municipal water supply (piped water supply)—not available in all situations but if the
source is reliable and affordable than could be considered.
2. Drilled wells, existing or new future wells—recommendations for a well location can
be made but a professional driller will be required to determine optimum location
and cost.
3. Shallow/dug wells—EMI would like make a recommendation of the location and make
recommendations to the maintenance team of how deep to dig the well.
4. Springs—naturally clean water that should be contained to prevent contamination
from exposure to the environment.
5. Surface water—a stream or lake that could be used but would likely need treatment
because of exposure to the environment.
6. Rainwater harvesting—collected from the rooftops, would require further treatment
and analysis of rainwater data, see Section 2.3 Rainwater Harvesting for more
information.
7. Greywater reuse—water that has not been in contact with human waste that can be
treated for reuses, see Section 2.4 Greywater Separation and Reuse for more information.
The table below shows the suitability of a water source for the intended water use.
Global Guide Section 2 Water, 2.2 Water Supply Source Selection
Civil Design Guide
6
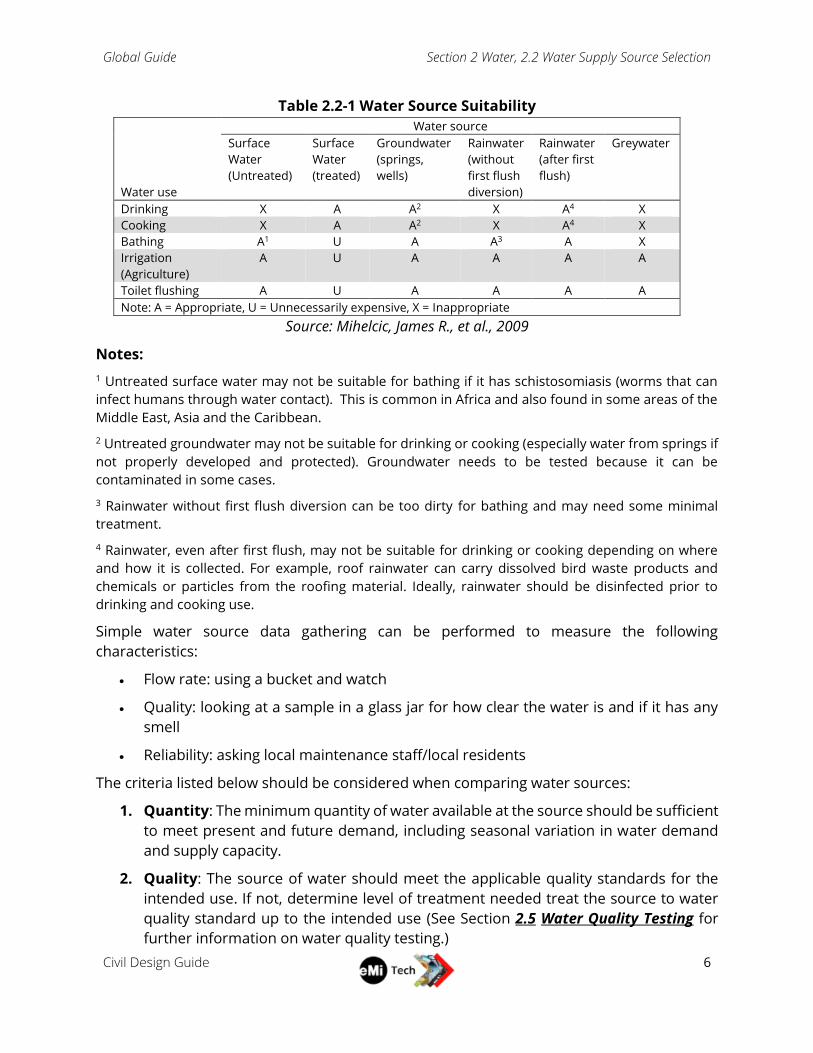
Table 2.2-1 Water Source Suitability
Water source
Water use
Surface
Water
(Untreated)
Surface
Water
(treated)
Groundwater
(springs,
wells)
Rainwater
(without
first flush
diversion)
Rainwater
(after first
flush)
Greywater
Drinking X A A2 X A4 X
Cooking X A A2 X A4 X
Bathing A1 U A A3 A X
Irrigation
(Agriculture)
A U A A A A
Toilet flushing A U A A A A
Note: A = Appropriate, U = Unnecessarily expensive, X = Inappropriate
Source: Mihelcic, James R., et al., 2009
Notes:
1 Untreated surface water may not be suitable for bathing if it has schistosomiasis (worms that can
infect humans through water contact). This is common in Africa and also found in some areas of the
Middle East, Asia and the Caribbean.
2 Untreated groundwater may not be suitable for drinking or cooking (especially water from springs if
not properly developed and protected). Groundwater needs to be tested because it can be
contaminated in some cases.
3 Rainwater without first flush diversion can be too dirty for bathing and may need some minimal
treatment.
4 Rainwater, even after first flush, may not be suitable for drinking or cooking depending on where
and how it is collected. For example, roof rainwater can carry dissolved bird waste products and
chemicals or particles from the roofing material. Ideally, rainwater should be disinfected prior to
drinking and cooking use.
Simple water source data gathering can be performed to measure the following
characteristics:
Flow rate: using a bucket and watch
Quality: looking at a sample in a glass jar for how clear the water is and if it has any
smell
Reliability: asking local maintenance staff/local residents
The criteria listed below should be considered when comparing water sources:
1. Quantity: The minimum quantity of water available at the source should be sufficient
to meet present and future demand, including seasonal variation in water demand
and supply capacity.
2. Quality: The source of water should meet the applicable quality standards for the
intended use. If not, determine level of treatment needed treat the source to water
quality standard up to the intended use (See Section 2.5 Water Quality Testing for
further information on water quality testing.)
Global Guide Section 2 Water, 2.2 Water Supply Source Selection
Civil Design Guide
7
3. Cost: The capital as well as the operation and maintenance costs of the source should
be acceptable to the ministry. And if needed complete a cost benefit analysis to
compare viable options, see the EMI General Treatment Matrix Template for
guidance.
4. Technology: Verify that the ministry has the appropriate technology (equipment,
power, treatment chemicals, etc.) and expertise to operate and maintain the water
source and associated water treatment and transmission facilities. Compare the
relative demands for operation and maintenance of each viable source.
5. Protection: The water source must be protected from present and future pollution
and contamination. Determine the vulnerability of each viable source to future
changes including groundwater depletion, weather pattern changes (longer dry
season, heavier storms), future development in the watershed for the source, etc.
Include a setback distance of 30 meters and uphill from septic tanks, soak pits,
property lines, livestock and animals and the water source, see Table 4.3-6 Setback
Distance Between Septic Tanks and Nearby Features and Table 4.5-7 Setback
Distance Between Absorption Systems and Nearby Features for more information.
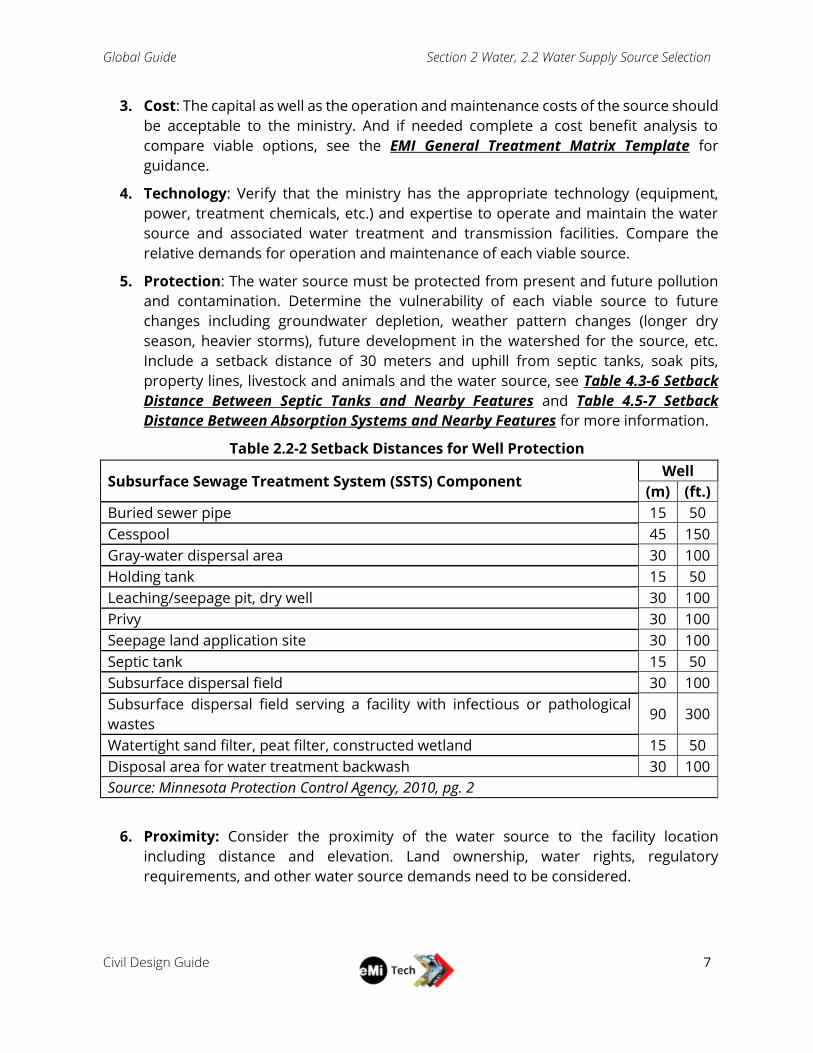
Table 2.2-2 Setback Distances for Well Protection
Subsurface Sewage Treatment System (SSTS) Component Well
(m) (ft.)
Buried sewer pipe 15 50
Cesspool 45 150
Gray-water dispersal area 30 100
Holding tank 15 50
Leaching/seepage pit, dry well 30 100
Privy 30 100
Seepage land application site 30 100
Septic tank 15 50
Subsurface dispersal field 30 100
Subsurface dispersal field serving a facility with infectious or pathological
wastes 90 300
Watertight sand filter, peat filter, constructed wetland 15 50
Disposal area for water treatment backwash 30 100
Source: Minnesota Protection Control Agency, 2010, pg. 2
6. Proximity: Consider the proximity of the water source to the facility location
including distance and elevation. Land ownership, water rights, regulatory
requirements, and other water source demands need to be considered.
Global Guide Section 2 Water, 2.2 Water Supply Source Selection
Civil Design Guide
8
7. Reliability: The water source needs to be reliable for the water demand that is
required and sustainable long term. Any equipment and infrastructure required
needs to be considered including pumping and availability of electricity.
The following resources and tools are to be used in selecting the water source:
The Client Needs Assessment and Site Evaluation discussed in Section 1 include
sample guiding questions and evaluation criteria that can inform the water
supply source selection process.
References and additional resources can be found in R2.2 Water Supply Source
Selection.
Region specific guidelines for Uganda can be found in UG2.2 Water Supply Source
Selection.
The EMI General Treatment Matrix Template can be used to determine a cost
benefit analysis if treatment is required for the water source.
2.2.3 DESIGN PROCEDURE
Step 1: Complete and review Section 2.1 Water Demand Estimate.
Step 2: Identify all potential water supply sources at, or near, the project site. Consider
all of the sources listed under 2.2.2 Design Criteria. Eliminate any that are not
present or practical to use at the site.
Step 3: Collect sufficient information about each of the viable water sources at the
project site, including the likely minimum capacity (including seasonal
variations) of the system, the expected quality of the water, reliability, and the
capital and operating cost of each viable source.
Step 4: Ask the ministry, or local well drillers, if there are any well drilling reports
available for wells drilled at or near the site. Review the report, and any
anecdotal information about the performance of nearby wells, to estimate the
potential depth to groundwater, well yield, and water quality for any possible
new proposed wells.
Step 5: Determine the suitability of each source for the intended use of the water.
Consult Table 2.2-1 Water Source Suitability.
Step 6: Compare each viable source with the other options based on the criteria listed
under Design Criteria.
Step 7: For wells, surface waters and springs, examine the required minimum setback
distances to ensure the water source (and if applicable, a replacement source)
can be located on the project site in accordance with these recommended
setback distances see Table 4.3-6 Setback Distance Between Septic Tanks and
Nearby Features and Table 4.5-7 Setback Distance Between Absorption
Systems and Nearby Features.

Global Guide Section 2 Water, 2.2 Water Supply Source Selection
Civil Design Guide
9
Step 8: Consider the five criteria and appropriate setback distances, select at least one
primary water source and one secondary water source. Multiple source may
be specified for different water uses (e.g. rainwater harvesting for cleaning,
and a well for drinking). Document the selection process.
Step 9: If an existing well will be used as a source, review the well testing report to
ensure the sustainable yield of the well is great enough to supply the
maximum water demand with the well pump running less than 12 hours per
day (see Section 2.9 Pump Selection). The well should recover to its original
water depth in less than 12 hours after the pump stops. If the existing well
does not have sufficient capacity, propose either a deeper, larger well or a
second well. If no well report is available, contact a well driller to perform a
pump test on the existing well to determine its capacity.
Step 10: Complete the preliminary design of the selected water source(s),
transmission and storage facilities, and overall water distribution system for
the site master plan. If new well(s) are proposed, suggest to the ministry
partner that the well should be drilled as soon as possible to ensure there is
adequate water available and to determine the exact position of the well(s).
Global Guide Section 2 Water, 2.3 Rainwater Harvesting
Civil Design Guide
10
2.3 RAINWATER HARVESTING Note that using rainwater or graywater for drinking water would require additional
treatment beyond this section, described in Section 2.6 Water Treatment. Rainwater is rarely
used for drinking due to the cost and complexity of treating it to a high enough quality to
allow for human consumption depending on the local requirements and practices.
2.3.1 DESIGN STAGE
Frequency of Use: Rainwater is not often used to supplement other water supplies, but can
be considered where potable water is very difficult or expensive to obtain. However, small,
simple rainwater capture systems are commonly used for small amounts of water used for
cleaning or irrigation. Rainwater is can be used for potable water but requires extensive
treatment and disinfection before they can be made suitable for human consumption.
Conceptual Design: Determine if rainwater capture is needed to meet the water demand of
the facility. If so, provide design recommendations for collection, treatment, piping and
storage for the system. Before recommending water treatment, ensure the client has the
resources and personnel needed to properly monitor and operate the treatment system.
Detailed Design: Refine the calculations for storage and provide a detailed piping design,
storage tank(s) and support designs as needed. Design any treatment system
recommended.
2.3.2 DESIGN CRITERIA
Determine the desired amount of rainwater storage. Stored rainwater provides water for
use during dry periods. The amount of water to be stored can vary from a small amount to
supplement other sources, or it can be designed to provide water throughout the year. To
provide a year-round source of non-potable water, there must be enough storage to meet
the demand during the longest anticipated dry period. The storage volume will depend on
the demand for rainwater and the frequency and duration of dry periods in the region.
Review historic precipitation records to determine the required storage time, then estimate
the storage volume by multiplying by the daily rainwater usage.
Using the EMI IDF Analysis Template, estimate the average storm intensity and duration.
This information allows you to calculate the normal rainfall amounts during wet periods. The
volume of rainwater available for capture can be calculated by multiplying the normal rainfall
amounts by the roof area being used to capture the water, and subtracting the first flush
water diverted during each storm even. Ensure there is sufficient roof area to generate the
required water retention volume (daily storage volume available equals the net water
captured per day minus rainwater used each day) during rainy periods of the year. Situate
one or more rainwater storage tanks near the buildings where rainwater is being captured.
In many cases, rainwater is seen as only a supplement to other sources and the roof area for
capture is arbitrarily chosen. This roof area multiplied by the rainfall intensity and duration
then determines the storage tank volume, assuming the tank will be sized to handle a certain
number of large rain events.
Global Guide Section 2 Water, 2.3 Rainwater Harvesting
Civil Design Guide
11
Depending on the usage of the rainwater, this section will explain the primary treatment
required which can be used for non-potable uses. If rainwater is intended for drinking use,
then the treatment provided is preliminary and Section 2.6 Water Treatment would be
required.
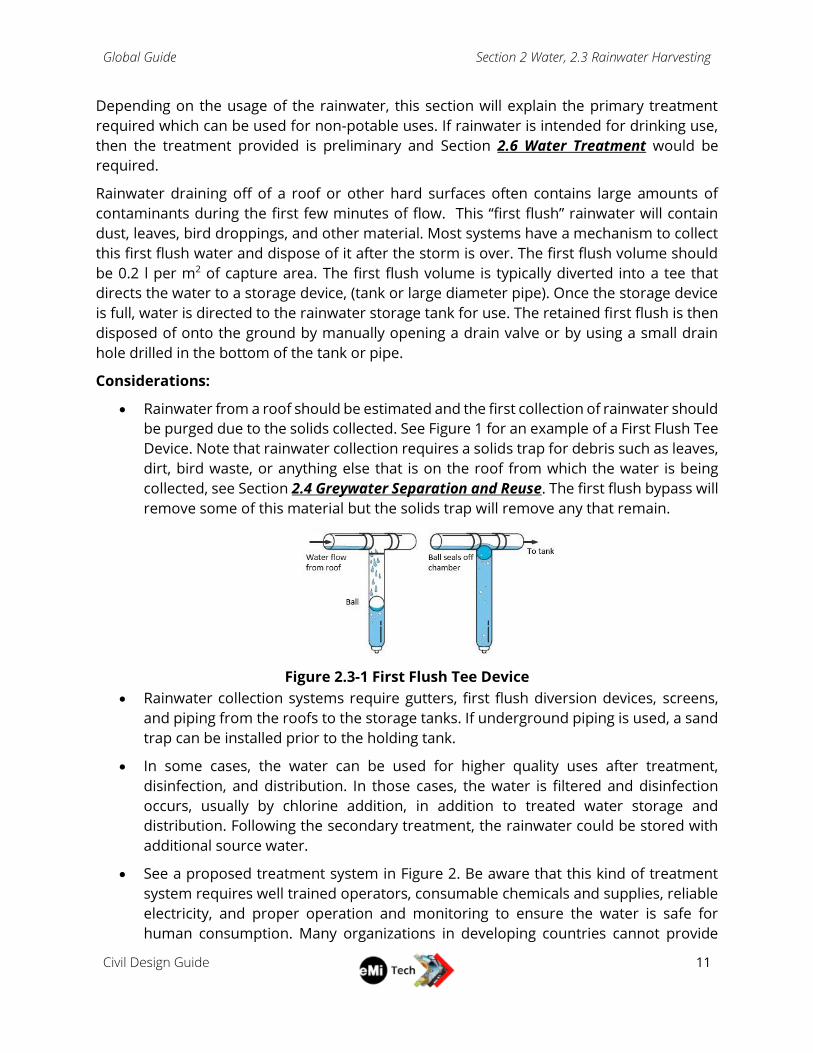
Rainwater draining off of a roof or other hard surfaces often contains large amounts of
contaminants during the first few minutes of flow. This “first flush” rainwater will contain
dust, leaves, bird droppings, and other material. Most systems have a mechanism to collect
this first flush water and dispose of it after the storm is over. The first flush volume should
be 0.2 l per m2 of capture area. The first flush volume is typically diverted into a tee that
directs the water to a storage device, (tank or large diameter pipe). Once the storage device
is full, water is directed to the rainwater storage tank for use. The retained first flush is then
disposed of onto the ground by manually opening a drain valve or by using a small drain
hole drilled in the bottom of the tank or pipe.
Considerations:
Rainwater from a roof should be estimated and the first collection of rainwater should
be purged due to the solids collected. See Figure 1 for an example of a First Flush Tee
Device. Note that rainwater collection requires a solids trap for debris such as leaves,
dirt, bird waste, or anything else that is on the roof from which the water is being
collected, see Section 2.4 Greywater Separation and Reuse. The first flush bypass will
remove some of this material but the solids trap will remove any that remain.
Figure 2.3-1 First Flush Tee Device
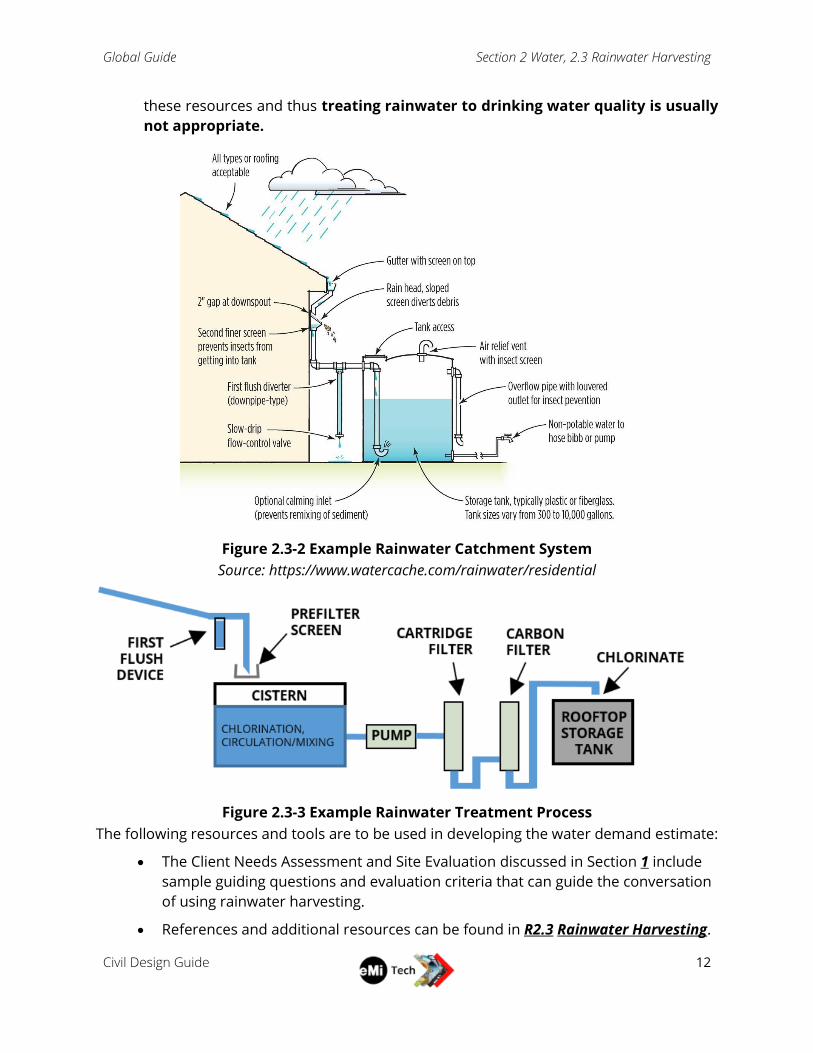
Rainwater collection systems require gutters, first flush diversion devices, screens,
and piping from the roofs to the storage tanks. If underground piping is used, a sand
trap can be installed prior to the holding tank.
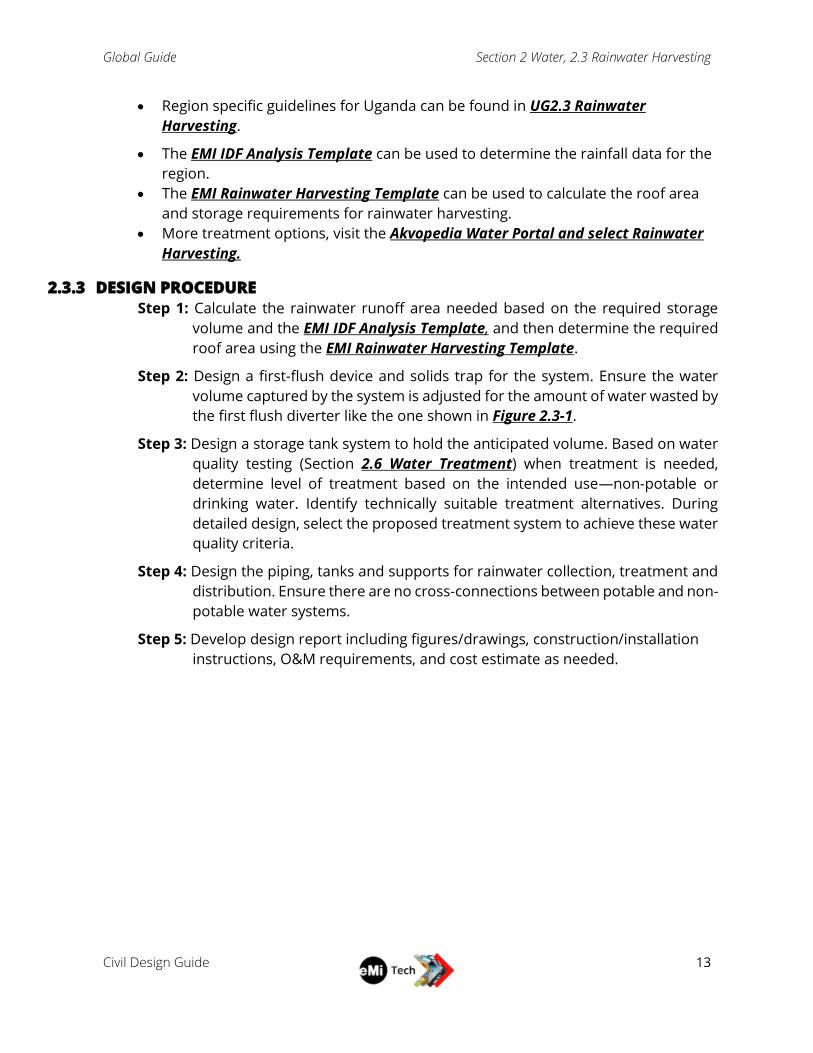
In some cases, the water can be used for higher quality uses after treatment,
disinfection, and distribution. In those cases, the water is filtered and disinfection
occurs, usually by chlorine addition, in addition to treated water storage and
distribution. Following the secondary treatment, the rainwater could be stored with
additional source water.
See a proposed treatment system in Figure 2. Be aware that this kind of treatment
system requires well trained operators, consumable chemicals and supplies, reliable
electricity, and proper operation and monitoring to ensure the water is safe for
human consumption. Many organizations in developing countries cannot provide
Global Guide Section 2 Water, 2.3 Rainwater Harvesting
Civil Design Guide
12
these resources and thus treating rainwater to drinking water quality is usually
not appropriate.
Figure 2.3-2 Example Rainwater Catchment System
Source: https://www.watercache.com/rainwater/residential
Figure 2.3-3 Example Rainwater Treatment Process
The following resources and tools are to be used in developing the water demand estimate:
The Client Needs Assessment and Site Evaluation discussed in Section 1 include
sample guiding questions and evaluation criteria that can guide the conversation
of using rainwater harvesting.
References and additional resources can be found in R2.3 Rainwater Harvesting.
Global Guide Section 2 Water, 2.3 Rainwater Harvesting
Civil Design Guide
13
Region specific guidelines for Uganda can be found in UG2.3 Rainwater
Harvesting.
The EMI IDF Analysis Template can be used to determine the rainfall data for the
region.
The EMI Rainwater Harvesting Template can be used to calculate the roof area
and storage requirements for rainwater harvesting.
More treatment options, visit the Akvopedia Water Portal and select Rainwater
Harvesting.
2.3.3 DESIGN PROCEDURE
Step 1: Calculate the rainwater runoff area needed based on the required storage
volume and the EMI IDF Analysis Template, and then determine the required
roof area using the EMI Rainwater Harvesting Template.
Step 2: Design a first-flush device and solids trap for the system. Ensure the water
volume captured by the system is adjusted for the amount of water wasted by
the first flush diverter like the one shown in Figure 2.3-1.
Step 3: Design a storage tank system to hold the anticipated volume. Based on water
quality testing (Section 2.6 Water Treatment) when treatment is needed,
determine level of treatment based on the intended use—non-potable or
drinking water. Identify technically suitable treatment alternatives. During
detailed design, select the proposed treatment system to achieve these water
quality criteria.
Step 4: Design the piping, tanks and supports for rainwater collection, treatment and
distribution. Ensure there are no cross-connections between potable and non-
potable water systems.
Step 5: Develop design report including figures/drawings, construction/installation
instructions, O&M requirements, and cost estimate as needed.
Global Guide Section 2 Water, 2.4 Greywater Separation and Reuse
Civil Design Guide
14
2.4 GREYWATER SEPARATION AND REUSE Greywater refers to wastewater from laundry tubs, showers, hand basins and baths. It
excludes wastewater from a kitchen, toilet, urinal or bidet. Greywater is not directly
contaminated by fecal material or other sources of human pathogens. Because the water
does not come into contact with human waste, it is as low strength wastewater with much
lower concentrations of BOD, nutrients and pathogens compared to sewage from toilet
wastewater (blackwater). Greywater, if it is segregated from blackwater, can either be
disposed of by soil absorption systems or reused for a non-potable use on site. In this
section, greywater separation will be discussed.
2.4.1 DESIGN STAGE
Frequency of Use: Greywater is not often used to supplement other water supplies, but can
be considered where potable water is very difficult or expensive to obtain and if
supplemental water is required for site gardens. Separate collection and disposal of gray
water is fairly common where this approach can reduce the cost of septic tanks enough to
justify the additional complexity of the sewer system.
Conceptual Design: Determine if greywater is needed to meet the water demand of the
facility. If so, provide design recommendations for collection, treatment, piping, storage for
the system, distribution to irrigation for gardens and outlet designs such as free-flow to
mulch, concealed flow within rocks or subsurface infiltration gallery. Before recommending
water treatment, ensure the client has the resources and personnel needed to properly
monitor and operate the treatment system. For greywater disposal only, design the
necessary sewer piping and related features.
Detailed Design: Refine the calculations for storage and provide a detailed piping design.
Design any treatment system recommended.
2.4.2 DESIGN CRITERIA
In an effort to reduce the demand on the potable water supply, or in an area with an
unreliable water source, greywater reuse may be considered. Reuse of greywater can be
recommended, but to be accepted by the end user, there must be considerations beyond
engineering judgement. Clients must be aware of the operational requirements to use either
system successfully. Treated greywater can be used for various non-potable uses like surface
cleaning (floors, sidewalks, walls), vehicle cleaning, laundry, animal care, irrigation, toilet
flushing (manual pour flush or cistern flush if suitable infrastructure exists to pipe
pressurized greywater to toilets). It is not recommended that greywater be reused for
drinking water.
In many cases, greywater is not needed to supplement the potable water supply so it can be
disposed of along with black water from toilets and kitchens. Since greywater usually does
not contain large amounts of solids or organic material, it can be discharged to the on-site
wastewater disposal system without pretreatment in septic tanks. This requires designing
separate sewers to collect the gray water and direct it to the absorption system’s distribution
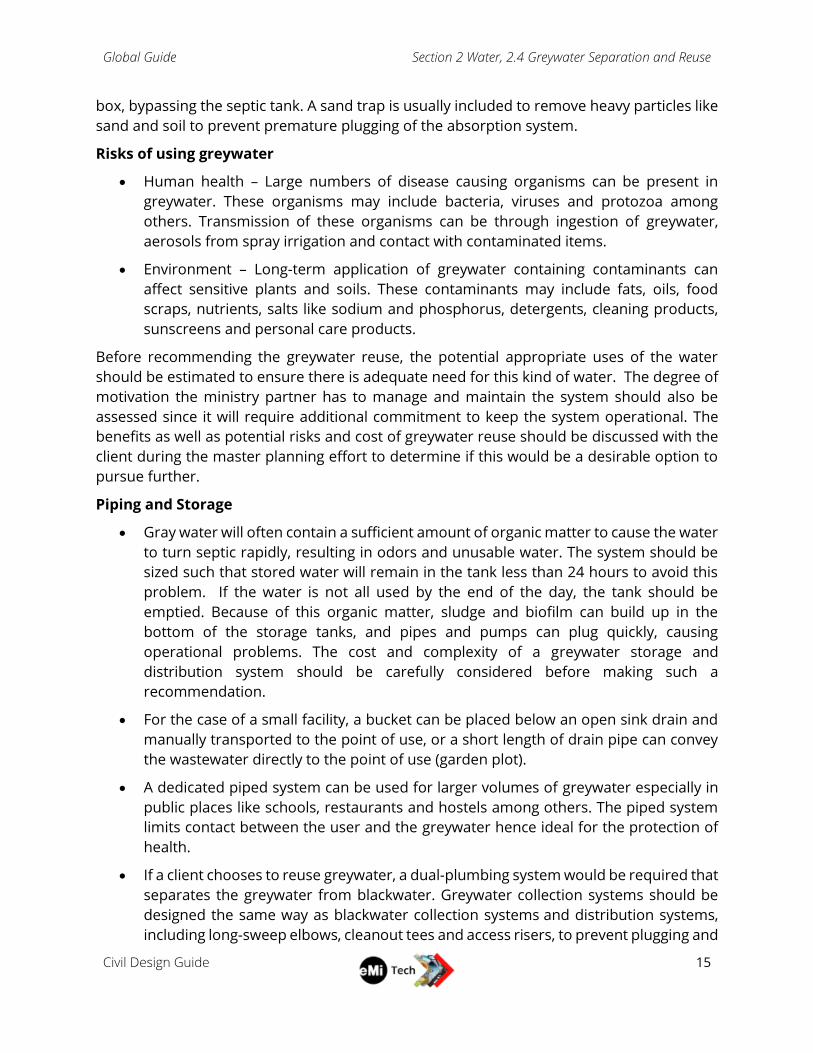
Global Guide Section 2 Water, 2.4 Greywater Separation and Reuse
Civil Design Guide
15
box, bypassing the septic tank. A sand trap is usually included to remove heavy particles like
sand and soil to prevent premature plugging of the absorption system.
Risks of using greywater
Human health – Large numbers of disease causing organisms can be present in
greywater. These organisms may include bacteria, viruses and protozoa among
others. Transmission of these organisms can be through ingestion of greywater,
aerosols from spray irrigation and contact with contaminated items.
Environment – Long-term application of greywater containing contaminants can
affect sensitive plants and soils. These contaminants may include fats, oils, food
scraps, nutrients, salts like sodium and phosphorus, detergents, cleaning products,
sunscreens and personal care products.
Before recommending the greywater reuse, the potential appropriate uses of the water
should be estimated to ensure there is adequate need for this kind of water. The degree of
motivation the ministry partner has to manage and maintain the system should also be
assessed since it will require additional commitment to keep the system operational. The
benefits as well as potential risks and cost of greywater reuse should be discussed with the
client during the master planning effort to determine if this would be a desirable option to
pursue further.
Piping and Storage
Gray water will often contain a sufficient amount of organic matter to cause the water
to turn septic rapidly, resulting in odors and unusable water. The system should be
sized such that stored water will remain in the tank less than 24 hours to avoid this
problem. If the water is not all used by the end of the day, the tank should be
emptied. Because of this organic matter, sludge and biofilm can build up in the
bottom of the storage tanks, and pipes and pumps can plug quickly, causing
operational problems. The cost and complexity of a greywater storage and
distribution system should be carefully considered before making such a
recommendation.
For the case of a small facility, a bucket can be placed below an open sink drain and
manually transported to the point of use, or a short length of drain pipe can convey
the wastewater directly to the point of use (garden plot).
A dedicated piped system can be used for larger volumes of greywater especially in
public places like schools, restaurants and hostels among others. The piped system
limits contact between the user and the greywater hence ideal for the protection of
health.
If a client chooses to reuse greywater, a dual-plumbing system would be required that
separates the greywater from blackwater. Greywater collection systems should be
designed the same way as blackwater collection systems and distribution systems,
including long-sweep elbows, cleanout tees and access risers, to prevent plugging and
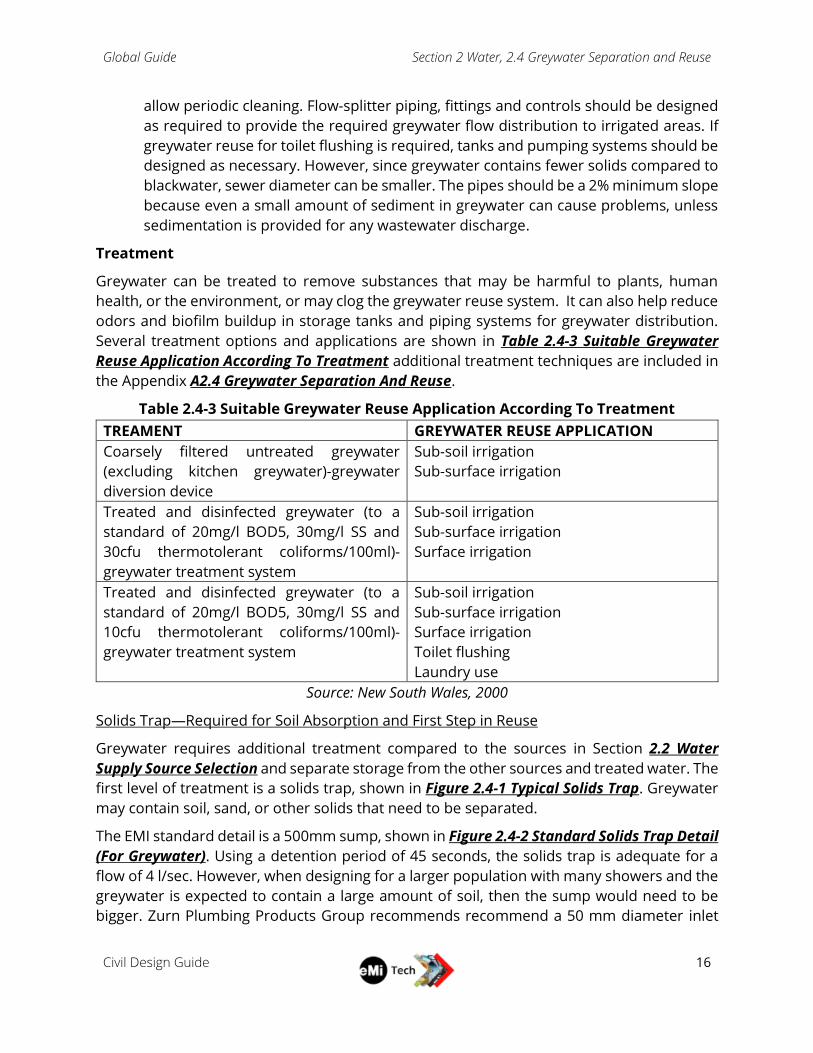
Global Guide Section 2 Water, 2.4 Greywater Separation and Reuse
Civil Design Guide
16
allow periodic cleaning. Flow-splitter piping, fittings and controls should be designed
as required to provide the required greywater flow distribution to irrigated areas. If
greywater reuse for toilet flushing is required, tanks and pumping systems should be
designed as necessary. However, since greywater contains fewer solids compared to
blackwater, sewer diameter can be smaller. The pipes should be a 2% minimum slope
because even a small amount of sediment in greywater can cause problems, unless
sedimentation is provided for any wastewater discharge.
Treatment
Greywater can be treated to remove substances that may be harmful to plants, human
health, or the environment, or may clog the greywater reuse system. It can also help reduce
odors and biofilm buildup in storage tanks and piping systems for greywater distribution.
Several treatment options and applications are shown in Table 2.4-3 Suitable Greywater
Reuse Application According To Treatment additional treatment techniques are included in
the Appendix A2.4 Greywater Separation And Reuse.
Table 2.4-3 Suitable Greywater Reuse Application According To Treatment
TREAMENT GREYWATER REUSE APPLICATION
Coarsely filtered untreated greywater
(excluding kitchen greywater)-greywater
diversion device
Sub-soil irrigation
Sub-surface irrigation
Treated and disinfected greywater (to a
standard of 20mg/l BOD5, 30mg/l SS and
30cfu thermotolerant coliforms/100ml)-
greywater treatment system
Sub-soil irrigation
Sub-surface irrigation
Surface irrigation
Treated and disinfected greywater (to a
standard of 20mg/l BOD5, 30mg/l SS and
10cfu thermotolerant coliforms/100ml)-
greywater treatment system
Sub-soil irrigation
Sub-surface irrigation
Surface irrigation
Toilet flushing
Laundry use
Source: New South Wales, 2000
Solids Trap—Required for Soil Absorption and First Step in Reuse
Greywater requires additional treatment compared to the sources in Section 2.2 Water
Supply Source Selection and separate storage from the other sources and treated water. The
first level of treatment is a solids trap, shown in Figure 2.4-1 Typical Solids Trap. Greywater
may contain soil, sand, or other solids that need to be separated.
The EMI standard detail is a 500mm sump, shown in Figure 2.4-2 Standard Solids Trap Detail
(For Greywater). Using a detention period of 45 seconds, the solids trap is adequate for a
flow of 4 l/sec. However, when designing for a larger population with many showers and the
greywater is expected to contain a large amount of soil, then the sump would need to be
bigger. Zurn Plumbing Products Group recommends recommend a 50 mm diameter inlet
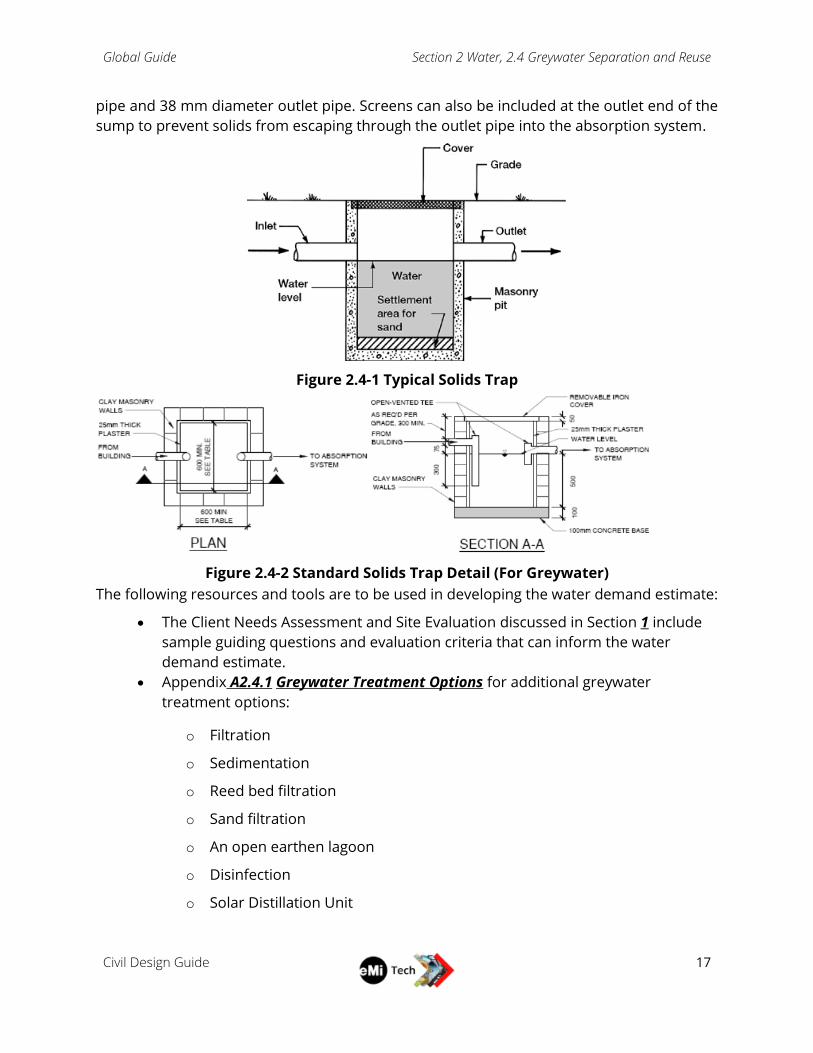
Global Guide Section 2 Water, 2.4 Greywater Separation and Reuse
Civil Design Guide
17
pipe and 38 mm diameter outlet pipe. Screens can also be included at the outlet end of the
sump to prevent solids from escaping through the outlet pipe into the absorption system.
Figure 2.4-1 Typical Solids Trap
Figure 2.4-2 Standard Solids Trap Detail (For Greywater)
The following resources and tools are to be used in developing the water demand estimate:
The Client Needs Assessment and Site Evaluation discussed in Section 1 include
sample guiding questions and evaluation criteria that can inform the water
demand estimate.
Appendix A2.4.1 Greywater Treatment Options for additional greywater
treatment options:
o Filtration
o Sedimentation
o Reed bed filtration
o Sand filtration
o An open earthen lagoon
o Disinfection
o Solar Distillation Unit
Global Guide Section 2 Water, 2.4 Greywater Separation and Reuse
Civil Design Guide
18
References and additional resources can be found in R2.4 Greywater Separation
And Reuse.
Region specific guidelines for Uganda can be found in UG2.4 Greywater
Separation and Reuse.
The EMI Water and Wastewater Design Template can be used to separate the
wastewater streams.
2.4.3 DESIGN PROCEDURE
Greywater Disposal to Absorption Field
Step 1: Identify the greywater streams. These may include wastewater from washing
machines, laundry tubs, showers, hand basins and baths.
Step 2: Calculate the greywater volume using the EMI Water and Wastewater Design
Template. In the template, columns can be added to quantify greywater and
black water (wastewater from kitchen, toilet, and urinal) separately.
Step 3: Design a sewer to collect the greywater and direct it to either a dedicated
absorption system or to the system used for disposal of septic tank effluent.
Use the volume to design the disposal system. The required setback distances
should be incorporated during the process of siting locations for these
systems. Refer to Section 4.3 Septic Tanks.
Step 4: Design a solids trap for the system as shown in Figure 2.4-1 Typical Solids Trap
and Figure 2.4-2 Standard Solids Trap Detail (For Greywater).
Step 5: Design the separate sewer system for greywater. Sewers should be designed
with the proper slopes to ensure that the greywater is safely delivered to the
absorption system. Refer to the Section 4.2 Wastewater Conveyance.
Step 6: Develop design report with drawings, cost estimates and general O&M
procedures
Greywater Reuse
Step 1: Identify the greywater streams. These may include wastewater from washing
machines, laundry tubs, showers, hand basins and baths.
Step 2: Design a solids trap, or other pre-treatment system as required, for each
segment of the collection system as shown in Figure 2.4-1 Typical Solids Trap
and Figure 2.4-2 Standard Solids Trap Detail (For Greywater).
Step 3: Calculate the greywater volume using the EMI Water and Wastewater Design
Template. In the template columns can be added to quantify greywater and
black water (wastewater from kitchen, toilet, and urinal) separately.
Step 4: Use the volume to design the treatment and storage system, if one is needed
to prepare the water for use, determine level of treatment based on the

Global Guide Section 2 Water, 2.4 Greywater Separation and Reuse
Civil Design Guide
19
intended use—sub-surface irrigation, surface irrigation, laundry, toilets, or
washing buildings. If greywater is to be used for irrigation, the layout and
design of the crops or landscaping should be based on the projected volume
of greywater available.
Step 5: Design the separate sewer system to collect greywater for storage and
treatment as necessary.
Step 6: Design a treated water distribution system from the treatment system to the
point of use. Ensure there is no potential for no cross contamination with the
potable water system.
Step 7: Develop design report with drawings, cost estimates and general O&M
procedures.
Global Guide Section 2 Water, 2.5 Water Quality Testing
Civil Design Guide
20
2.5 WATER QUALITY TESTING Water quality testing may be important to determine if any contaminants are present in the
source water or if natural materials are present in high enough concentrations to cause
problems with the use of the water. Determining the water quality will inform appropriate
water treatment. Note that the EMI Water Quality Test Kits (Table A 2.5-14 EMI Water Testing
Kits Contents) are limited and the accuracy and precision of these tests is often low and care
is needed when assessing the results of the testing. If available, sending water samples to a
local laboratory that has an ISO certification would be beneficial.
2.5.1 DESIGN STAGE
Frequency of Use: Most projects with an on-site water supply.
Conceptual Design: Perform testing of all potential and existing water sources to determine
the need for water treatment.
Detailed Design: Repeat testing or submit samples for more complete or authoritative
analysis to a certified laboratory if a question remains.
2.5.2 DESIGN CRITERIA
Water Sources:
Groundwater
Arsenic and fluoride occur naturally in some groundwater aquifers. Both present a health
concern if levels are elevated. Elevated levels of nitrate/nitrite are typically caused by poor
quality subsurface sewage disposal practices. They may also result from infiltration of
agricultural fertilizers, although this is less common in developing countries where fertilizer
use is less common.
Iron and manganese also occur naturally. They are often found together. They do not
present a health concern but elevated levels of iron and manganese can make the water
unacceptable aesthetically, to the extent that people will not wish to use the source.
Unfortunately, treatment options for arsenic, fluoride, nitrate/nitrite, iron, and manganese
can be complicated and expensive. In some cases, a different source of water may need to
be used. Refer to section 2.6 Water Treatment.
The microbiological quality is a concern for any water, whether groundwater or surface
water. Generally speaking, if a groundwater well is drilled to below a confining layer and is
properly constructed with a sanitary seal, it should preclude microbiological contamination.
Depending on the well construction, including the well screen, and the aquifer matrix, a well
may produce sand, total dissolved solids (TDS), and/or turbidity. These could contribute to
making a water undesirable aesthetically, and could also interfere with disinfection, if
disinfection was needed.
It is also possible that a groundwater source would have unacceptably high levels of alkalinity
and hardness. These are also aesthetic properties.
Global Guide Section 2 Water, 2.5 Water Quality Testing
Civil Design Guide
21
Surface Waters
The microbiological quality is always a concern for a surface water source, whether a river or
lake. This may also be the case for springs. See the specific discussion on springs that follows.
A surface source is always vulnerable to microbiological contamination, with levels varying
depending on storm events and upstream activities of humans and animals.
The turbidity level of surface waters is a concern. It is not a direct health concern, but has
treatment implications. Turbidity will need to be reduced to make a water aesthetically
acceptable and to allow disinfection to be more effective. A challenge with measuring
turbidity in a surface source is that it may vary significantly seasonally or even daily because
of storm events. Measurements of turbidity during a site visit will provide at best a limited
understanding of the range and average levels.
Naturally occurring color in a surface water is also a factor to consider. Color may result from
organic or inorganic sources. Elevated levels of color may render a water source
unacceptable from an aesthetic perspective. Elevated levels of color may also interfere with
disinfection if ultraviolet (UV) light is used or may indicate a high chlorine demand. Color
could also result from industrial discharges into the water body, which may indicate other
contaminants are present as well.
If the location has seasonal variations in climate, it is helpful to know the range of water
temperatures. These may impact treatment decisions.
Generally, elevated levels of iron and manganese are not a concern in surface waters, but
this is not always true. There may be iron and manganese that accumulate in the streambed,
and they may periodically be released into the water column when there are reducing
conditions.
Springs
Ideally, a spring is a groundwater source, where the aquifer intersects the ground surface. In
this case, it may provide microbiologically safe water. The discussion about groundwater
quality would apply. A spring may be influenced by surface water runoff and if so, will not
reliably provide microbiologically safe water. The absence of turbidity spikes during storm
events can be an indication that the spring is a groundwater source. Another method of
determination is temperature—a spring will tend to have a constant temperature
throughout the year, such as water from a well will, if it is mostly or solely groundwater.
Parameters:
An explanation of relevant parameters is listed below. First priority should be to research the
local water quality standard, as a minimum WHO standards, shown in Table A 2.5-13 Global
Water Quality Standards of Appendix A2.5 Water Quality Testing should be followed. The
USEPA and other national standards in this appendix may not be directly applicable in most
cases but might be useful for comparison.
Global Guide Section 2 Water, 2.5 Water Quality Testing
Civil Design Guide
22
pH
While there is no health-based guideline, pH is important for all water sources because it
reflects the acidity of the water, which can cause scaling or corrosion in the distribution
system. Additionally, chlorine disinfection of water becomes less effective at higher pH. In
general, the pH should be below 8.0 for effective chlorination. The WHO recommends a pH
between 6.5—8.5 but an exact pH should be determined based on the composition of the
water and construction materials used in the water distribution system (WHO Guidelines
2017, pg. 227).
Microbiological
Microbial quality presents the greatest health risks for consumers of all potential
contaminants in drinking water. Microbiological contaminates can cause various health
issues, such as gastrointestinal illnesses, if consumed. Infants, elderly, and
immunocompromised individuals are at even higher risk for developing serious health
concerns from contaminated drinking water consumption. Typically, as water seeps into the
ground, microbiological contaminants are filtered and removed by microorganisms in the
soil as water returns to underground aquifers. However, ground water can still contain
microbiological contaminants even at significant depth. Leaks in well piping or improper
disposal of wastewater can also introduce microbiological contaminants into ground water
source. Groundwater can also be contaminated once removed from the ground by
improperly built storage tanks or cross contamination. Therefore, it is essential that ground
water be tested for microbiological contaminants at the time of drilling, tested on a regular
basis as the water is being used, and treated as necessary to sanitize the water.
Total coliform, are used to indicate the presence of bacteria in a water sample and the
general cleanliness of the water. Some coliforms have a fecal origin but other coliforms can
originate from the environment. As a result, the presence of total coliform does not
necessarily indicate the presence of fecal contamination or microbiological pathogens.
Therefore, the count of total coliforms in a sample of water from a tap is used to determine
if bacteria may be entering or growing in the system.
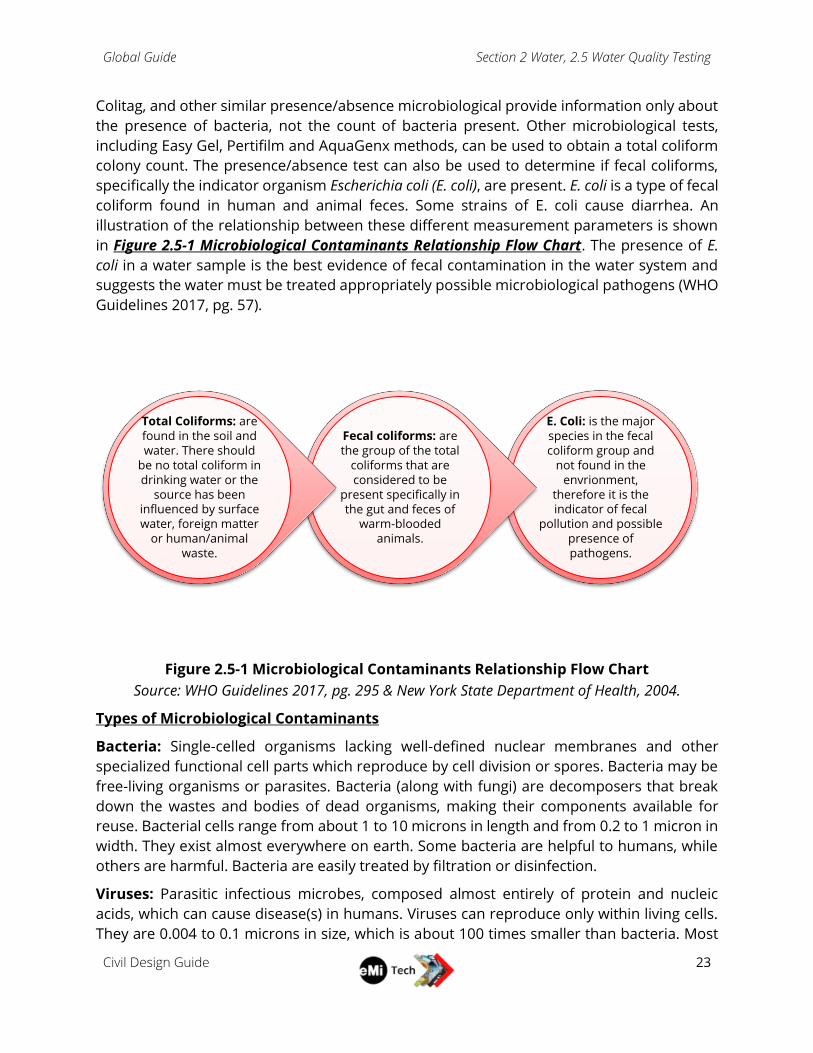
Global Guide Section 2 Water, 2.5 Water Quality Testing
Civil Design Guide
23
Colitag, and other similar presence/absence microbiological provide information only about
the presence of bacteria, not the count of bacteria present. Other microbiological tests,
including Easy Gel, Pertifilm and AquaGenx methods, can be used to obtain a total coliform
colony count. The presence/absence test can also be used to determine if fecal coliforms,
specifically the indicator organism Escherichia coli (E. coli), are present. E. coli is a type of fecal
coliform found in human and animal feces. Some strains of E. coli cause diarrhea. An
illustration of the relationship between these different measurement parameters is shown
in Figure 2.5-1 Microbiological Contaminants Relationship Flow Chart. The presence of E.
coli in a water sample is the best evidence of fecal contamination in the water system and
suggests the water must be treated appropriately possible microbiological pathogens (WHO
Guidelines 2017, pg. 57).
Figure 2.5-1 Microbiological Contaminants Relationship Flow Chart
Source: WHO Guidelines 2017, pg. 295 & New York State Department of Health, 2004.
Types of Microbiological Contaminants
Bacteria: Single-celled organisms lacking well-defined nuclear membranes and other
specialized functional cell parts which reproduce by cell division or spores. Bacteria may be
free-living organisms or parasites. Bacteria (along with fungi) are decomposers that break
down the wastes and bodies of dead organisms, making their components available for
reuse. Bacterial cells range from about 1 to 10 microns in length and from 0.2 to 1 micron in
width. They exist almost everywhere on earth. Some bacteria are helpful to humans, while
others are harmful. Bacteria are easily treated by filtration or disinfection.
Viruses: Parasitic infectious microbes, composed almost entirely of protein and nucleic
acids, which can cause disease(s) in humans. Viruses can reproduce only within living cells.
They are 0.004 to 0.1 microns in size, which is about 100 times smaller than bacteria. Most
E. Coli: is the major species in the fecal coliform group and
not found in the envrionment,
therefore it is the indicator of fecal
pollution and possible presence of pathogens.
Fecal coliforms: are the group of the total
coliforms that are considered to be
present specifically in the gut and feces of
warm-blooded animals.
Total Coliforms: are found in the soil and water. There should
be no total coliform in drinking water or the
source has been influenced by surface water, foreign matter
or human/animal waste.
Global Guide Section 2 Water, 2.5 Water Quality Testing
Civil Design Guide
24
viruses can be treated by disinfection. Most water filters do not remove viruses but some
special types of filters are designed to remove viruses as well as bacteria.
Protozoa: Capsules or protective sacs are produced by many protozoans (as well as some
bacteria and algae) as preparation for entering a resting or a specialized reproductive stage.
Similar to spores, cysts tend to be more resistant to destruction by disinfection. Fortunately,
protozoan cysts are typically 2 to 50 microns in diameter and can be removed from water by
fine filtration. The most common types of protozoa in drinking water are giardia and
cryptosporidium. Protozoa are infectious at small numbers and resistant to chlorine, but
easily removed by filtration methods with a pore size small enough to eliminate them (Water
Quality Association).
Turbidity
Turbidity, or cloudiness, of water is an important physical parameter to maintain in a potable
water system. Turbidity accounts for the suspended solids such as clay, silt, and other
organic matter in a water source. Turbidity can be tested by shining a light through a water
sample and measuring how much light is scattered by the suspended particles. The more
light that is scattered, the higher the turbidity of the water. The standard for turbidity is 4
Nephelometric Turbidity Unit (NTU) while disinfection requires at least 0.5 NTU, but
averaging 0.2 NTU or less to be disinfect successfully (WHO Guidelines 2017, pg. 285). While
turbidity is not necessarily a health concern itself, particles in the water can shield pathogens
from chlorine and prevent them from being inactivated. This increases chlorine demand, the
total amount of chlorine needed to maintain the target residual, and can also cause
sedimentation in the tanks and pipes. Highly turbid water entering small filter membranes,
such as reverse osmosis (RO) units, can overwhelm and damage the fragile internal
membranes resulting in more operation and maintenance costs. For these reasons, it is most
often necessary to reduce the turbidity in water before it begins other treatment or enters
into a distribution system. The most common method of turbidity treatment found locally is
sand filters or sedimentation basins.
Turbidity can be measured in the field using an electronic turbidimeter. Other methods, such
as a secchi disk, use a visual method estimate turbidity
Total Dissolved Solids (TDS)
TDS is another physical parameter of water that refers to the dissolved salts, ions and other
molecules dissolved in water. Testing for TDS provides information only on the amount of
dissolved solids in the water, and not the type of them. While there is no health-based
guideline for TDS, the palatability of water less than 600 mg/L is considered good while above
1,000 mg/L becomes increasingly unpalatable (WHO Guidelines 2017, pg. 285). Elevated TDS
levels can cause the water to be more corrosive and damage water piping or contain a
“brackish taste.” The U.S. Geological Survey states that most of the dissolve solids include
calcium, magnesium, sodium, potassium, bicarbonate, sulfate, chloride, nitrate, and silica
which can form salt compounds in the water (USGS, 2020). The dissolved ions that result in
a high TDS value can include ions such as nitrates, lead, and copper, which present their own
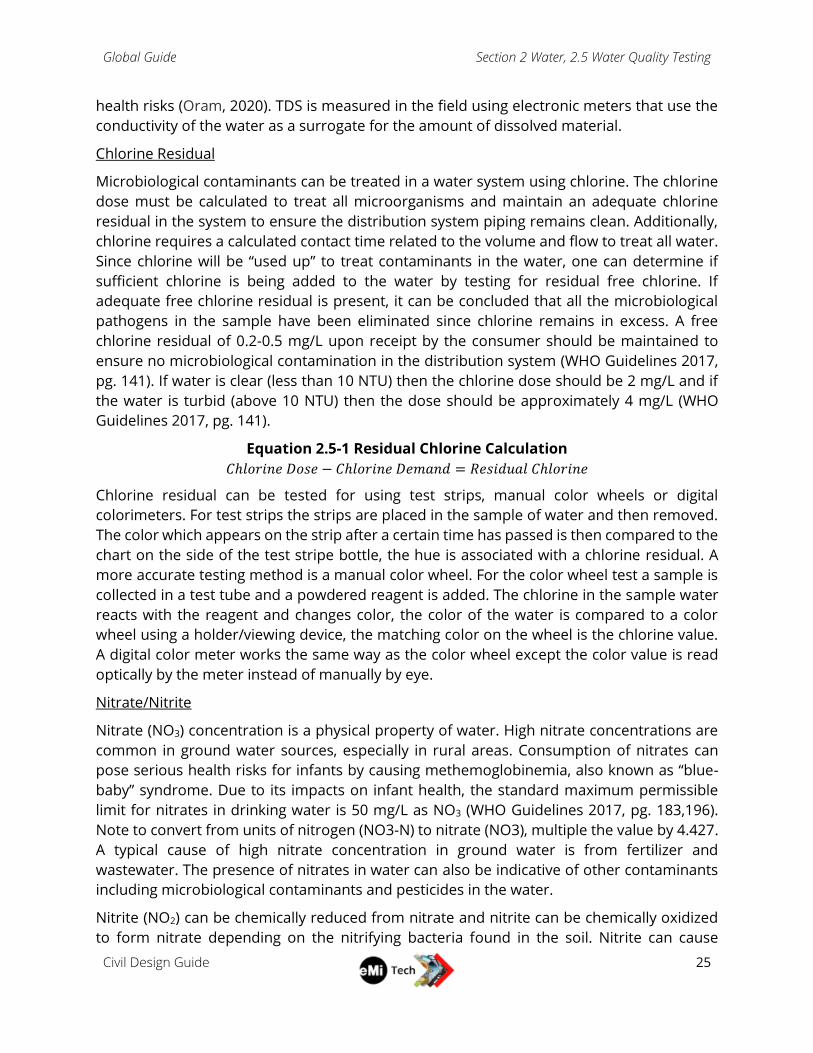
Global Guide Section 2 Water, 2.5 Water Quality Testing
Civil Design Guide
25
health risks (Oram, 2020). TDS is measured in the field using electronic meters that use the
conductivity of the water as a surrogate for the amount of dissolved material.
Chlorine Residual
Microbiological contaminants can be treated in a water system using chlorine. The chlorine
dose must be calculated to treat all microorganisms and maintain an adequate chlorine
residual in the system to ensure the distribution system piping remains clean. Additionally,
chlorine requires a calculated contact time related to the volume and flow to treat all water.
Since chlorine will be “used up” to treat contaminants in the water, one can determine if
sufficient chlorine is being added to the water by testing for residual free chlorine. If
adequate free chlorine residual is present, it can be concluded that all the microbiological
pathogens in the sample have been eliminated since chlorine remains in excess. A free
chlorine residual of 0.2-0.5 mg/L upon receipt by the consumer should be maintained to
ensure no microbiological contamination in the distribution system (WHO Guidelines 2017,
pg. 141). If water is clear (less than 10 NTU) then the chlorine dose should be 2 mg/L and if
the water is turbid (above 10 NTU) then the dose should be approximately 4 mg/L (WHO
Guidelines 2017, pg. 141).
Equation 2.5-1 Residual Chlorine Calculation
𝐶ℎ𝑙𝑜𝑟𝑖𝑛𝑒 𝐷𝑜𝑠𝑒 − 𝐶ℎ𝑙𝑜𝑟𝑖𝑛𝑒 𝐷𝑒𝑚𝑎𝑛𝑑 = 𝑅𝑒𝑠𝑖𝑑𝑢𝑎𝑙 𝐶ℎ𝑙𝑜𝑟𝑖𝑛𝑒
Chlorine residual can be tested for using test strips, manual color wheels or digital
colorimeters. For test strips the strips are placed in the sample of water and then removed.
The color which appears on the strip after a certain time has passed is then compared to the
chart on the side of the test stripe bottle, the hue is associated with a chlorine residual. A
more accurate testing method is a manual color wheel. For the color wheel test a sample is
collected in a test tube and a powdered reagent is added. The chlorine in the sample water
reacts with the reagent and changes color, the color of the water is compared to a color
wheel using a holder/viewing device, the matching color on the wheel is the chlorine value.
A digital color meter works the same way as the color wheel except the color value is read
optically by the meter instead of manually by eye.
Nitrate/Nitrite
Nitrate (NO3) concentration is a physical property of water. High nitrate concentrations are
common in ground water sources, especially in rural areas. Consumption of nitrates can
pose serious health risks for infants by causing methemoglobinemia, also known as “blue-
baby” syndrome. Due to its impacts on infant health, the standard maximum permissible
limit for nitrates in drinking water is 50 mg/L as NO3 (WHO Guidelines 2017, pg. 183,196).
Note to convert from units of nitrogen (NO3-N) to nitrate (NO3), multiple the value by 4.427.
A typical cause of high nitrate concentration in ground water is from fertilizer and
wastewater. The presence of nitrates in water can also be indicative of other contaminants
including microbiological contaminants and pesticides in the water.
Nitrite (NO2) can be chemically reduced from nitrate and nitrite can be chemically oxidized
to form nitrate depending on the nitrifying bacteria found in the soil. Nitrite can cause

Global Guide Section 2 Water, 2.5 Water Quality Testing
Civil Design Guide
26
additional health implications for adults if consumed. However, if nitrate levels are
maintained to be below the standard of 3 mg/L as NO2, the health risks of nitrite are
mitigated (WHO Guidelines 2017, pg. 183).
Nitrate testing in the field can be done using test strips, color wheels, or electronic
colorimeters.
Total Hardness
Hardness is the amount of calcium and magnesium or other dissolved minerals in the water.
Especially with groundwater there can be high hardness. The USGS guidelines for
classification of waters are: 0 to 60 mg/L (milligrams per liter) as calcium carbonate is
classified as soft; 61 to 120 mg/L as moderately hard; 121 to 180 mg/L as hard; and more
than 180 mg/L as very hard (USGS, 2021). Depending on the hardness of water, corrosion
can be determined. The Langelier Saturation Index (LSI) can be used to determine the
solution’s ability to dissolve or deposit calcium carbonate based on pH, temperature, calcium
hardness, total alkalinity, and total dissolved solids. See Equation A2.5-1 Langelier
Saturation Index for the calculation information.
Office Test Kits
Each office may have different test kits, however the US office has a relationship with Hach
Company in Colorado that manufactures and distributes most of the products in the EMI
Test Kits, contents are shown in Table A 2.5-14 EMI Water Testing Kits Contents.
If an office requires any tests, contact the WASH coordinator, Jason Chandler.
Many of the tests are very low tech, especially the test strips, and are a good indicator if there
is a serious concern. More precise measurements should be taken if there is a parameter of
concern. Due to the complexity of water quality standards, and EMI’s limited analytical tests,
which only give a rough indictor of water safety, EMI is not capable of determining if a given
water system is safe to drink. EMI personnel should refrain from stating that a water supply
is safe based on the field tests performed. Even if the tests performed did not identify a
problem, the water could become contaminated during storage or use, or parameters that
were not tested could make the water unfit for human consumption (a common example of
this is fluoride, which is difficult to analyze in the field but is a common contaminant of
groundwater in Africa).
The following resources and tools are to be used for water quality testing:
The Client Needs Assessment and Site Evaluation discussed in Section 1 include
sample guiding questions and evaluation criteria that can inform the strategy for
water quality testing on site.
Table A 2.5-13 Global Water Quality Standards shown in Appendix A2.5 Water
Quality Testing provides a list of water quality parameter guidelines from WHO
and USPEA in addition to a brief explanation the health concerns.
Global Guide Section 2 Water, 2.5 Water Quality Testing
Civil Design Guide
27
Equation A2.5-1 Langelier Saturation Index shown in Appendix A2.5 Water
Quality Testing provides details on how to calculate corrosivity in water.
Table A 2.5-14 EMI Water Testing Kits Contents shown in Appendix A2.5 Water
Quality Testing provides a list of the testing supplies EMI typically uses.
References and additional resources can be found in R2.5 Water Quality Testing.
Region specific guidelines for Uganda can be found in UG2.5 Water Quality
Testing.
The EMI Water Quality Testing Field Packet provides information that is relevant
for field work and can be easily printed. The following is provided:
o Water Quality Testing Packet List that can be modified to meet project
needs.
o Water Quality Testing form that can be modified and printed to document
water quality testing results in the field. These forms should be scanned
upon returning from the project trip as a way to log the water quality
testing done in the field.
o Water Quality Testing Procedures that include instructions and pictures for
the EMI test kits.
The EMI Water Quality Testing Results Template provides a template to log field
results from the project trip and compare to WHO or national water quality
standards.
2.5.3 DESIGN PROCEDURE
Step 1: Review the client questionnaire to determine if any water quality testing has
been done previously and if there are any parameters of concern and how
many testing sites are present.
Step 2: Use the packing checklist to prepare for your project trip and print enough
water sampling forms.
Step 3: During project trip collect water samples, conduct the appropriate water
quality tests, and record results in the water sampling form. If there is a
parameter with results high enough to be of concern, look into a local ISO
certified lab to do further testing.
Step 4: Compile results in the EMI Water Quality Testing Results Template.
Global Guide Section 2 Water, 2.6 Water Treatment
Civil Design Guide
28
2.6 WATER TREATMENT The need for water treatment will depend on the quality and consistency of the water supply
as well as the quality of the design, operation, and maintenance of the distribution system.
Due to the unreliability of field bacterial testing results, and the fact that EMI is not involved
with ongoing testing, maintenance or and monitoring programs for client ministries after the
design or construction is complete, EMI typically suggests that drinking water should be
treated even if the original source testing results (if such testing was done during the design
phase) indicated no contamination was present. Such treatment can involve centralized
treatment of the source or point-of-use treatment of only the water used for drinking or
cooking. If initial testing indicates the source is known to be contaminated, of likely to
become contaminated in the future, a water treatment system should be included in the
project design.
When designing a water system, consult local sources to determine if there are any regional
regulations in effect that govern design, installation, and testing of water supply, treatment
or distribution systems.
2.6.1 DESIGN STAGE
Frequency of Use: Most projects with an on-site water supply.
Conceptual Design: Determine the need for treatment of water at the source. If source
treatment is needed, research locally available water treatment options and make
recommendations. This may involve visits to nearby facilities and discussions with local
vendors. If only point-of-use treatment is being suggest, provide several locally-available
options that the client can implement. Consider local acceptability of water treatment
options before making recommendations. For example, some cultures will not drink water
with the taste of chlorine or water that has been boiled. If centralized treatment is
recommended, prepare a preliminary selection and sizing of the recommended system.
Detailed Design: Conduct further water testing and analyses. For complex treatment
schemes, a pilot test of the treatment process may be needed. Reassess the preliminary
selection of the treatment approach and verify the sizing of facilities, identification and
recommendation of specific equipment, complete the hydraulic design, and possibly
prepare detailed construction drawings.
Ensure the client has the financial and personnel resources to operate and maintain
such a water treatment system. If there are doubts the client can properly operate
and maintain the facility, consider looking for an alternate water source that does not
require treatment.
If only point of use treatment is being recommended, no detailed design is required.
2.6.2 DESIGN CRITERIA
The type of source water described in Section 2.2 Water Supply Source Selection and based
on the water quality testing results as described in Section 2.5 Water Quality Testing will
impact the water treatment design. When the source is a properly constructed deep well,
Global Guide Section 2 Water, 2.6 Water Treatment
Civil Design Guide
29
that is regularly tested to show it is free of bacterial commination at the source, and the
produced water is regularly tested at several points of use, it may be possible for the client
to provide water without treatment. An ongoing testing program is needed to verify the
source remains clean and the water throughout the distribution system is clean to ensure
the water is safe to drink without treatment. When the quality of the source is poor or
unreliable, or the storage or distribution systems are subject to contamination, low pressure,
leakage, cross contamination, or poor maintenance, treatment of the water is
recommended. Such conditions are very common in developed countries, and thus water
supplied by such systems should usually be considered potentially contaminated.
Piped municipal source: Water provided by a government agency may be
improperly treated, treatment may be incomplete (inadequate chlorine to keep it
clean in the pipeline), or it can be contaminated by dirty water entering the pipe
during periods of low water pressure. The primary concern is microbiological
contamination. The safest approach it is to provide point-of-entry disinfection or
point-of-use disinfection for only the drinking water.
Well: Water from drilled wells may be safe and may not need to be treated if the well
was installed properly and the sanitary seal remains in good condition. Ideally, well
water should be periodically tested by a qualified laboratory to ensure it remains safe.
However, if the quality and integrity of the well is uncertain, or if the well has not been
tested to confirm the water is clean, the water should be disinfected before
consumption. As noted in Section 2.5 Water Quality Testing, water produced from a
well may require treatment for other parameters, including arsenic, fluoride, iron,
manganese, or nitrates.
Surface water (streams, lakes, shallow wells, unknown sources): Water collected
from untreated, natural sources, including surface water and shallow, hand-dug wells,
will require treatment for microbiological contaminants and particulate removal. For
disinfection to be effective, the sediment and suspended material needs to be
removed. Both centralized and household treatment systems can be considered.
Determining Water Treatment System
There are two general categories for water treatment: centralized and point-of-use (POU).
Centralized systems may consist of treatment of a water source developed for a facility (e.g.,
iron and manganese removal treatment for a new well) or may consist of point-of-entry (POE)
treatment which is a subset of centralized treatment, for a city supply to a facility. POU
treatment may consist of treatment installed for a single faucet or group of faucets (e.g., a
kitchen area), or it may consist of installation of household-scale treatment for residences in
a facility.
Point of Use Treatment Systems
A POU treatment system should be suggested based on the water quality and needs of the
campus. Selecting a system that is locally available and easily trainable is also essential. See
Appendix A2.6.1 Point of Use Treatment for Low Turbidity Waters and Appendix A2.6.2 Point
Global Guide Section 2 Water, 2.6 Water Treatment
Civil Design Guide
30
of Use Treatment for Surface Water for a list of EMI’s recommended POU systems. The
choice of a POU system is usually up to the client once construction is complete. However,
EMI can provide suggested alternatives based on an assessment of locally available systems.
Centralized Treatment Systems
Centralized treatment plants may not be desirable because of the complexity of operation,
availability of replacement parts and consumable chemicals, and high potential for
contamination if not properly operated or maintained. Some larger clients such as hospitals
or universities may utilize a centralized treatment plant since they would have the resources
to operate them properly. In order to consider designing centralized treatment for a
ministry, the minimum requirements would be a robust a maintenance program with
personnel that have the required technical knowledge, a treatment system design that
includes components and consumables that can be sourced locally in the event of repairs or
replacements, the clients ability to properly maintain and operate the system, and a
commitment to ensuring regular and routine testing to ensure treated water is meeting
target standards. A matrix of various treatment systems available is a good resource to
create if considering a centralized system. If a centralized system is considered, local
suppliers should be contacted and supplied with the relevant site-specific water quality
information to provide options of treatment equipment available locally. Developing a water
treatment matrix can be helpful to see the benefits of each type of system, the EMI General
Treatment Matrix Template is a good start. It might be wise to consult local water engineers
or NGOs that provide water treatment systems to get advice on suitable water treatment
options, if such exist in the project area.
The following resources and tools are to be used in developing the water storage design:
The Client Needs Assessment and Site Evaluation discussed in Section 1 include
sample guiding questions and evaluation criteria that can inform the water
treatment design process.
Appendix A2.6.1 Point of Use Treatment for Low Turbidity Waters and Appendix
A2.6.2 Point of Use Treatment for Surface Water are helpful researched lists of
water treatment.
References and additional resources can be found in R2.6 Water Treatment.
Region specific guidelines for Uganda can be found in UG2.6 Water Treatment.
An example matrix to compare treatment technologies can be created using the
EMI General Treatment Matrix Template. The following information should be
researched for each treatment:
o Methodology
o Product Examples
o Advantages and Disadvantages
o Operational Requirements

Global Guide Section 2 Water, 2.6 Water Treatment
Civil Design Guide
31
o Capital Cost
o Life Cycle Cost
2.6.3 DESIGN PROCEDURES
Step 1: Review source water Section 2.2 Water Supply Source Selection and the water
quality testing results as described in Section 2.5 Water Quality Testing.
Step 2: Determine the campus needs—either POU or centralized.
Step 3: Research locally available technologies and maintenance capabilities of the
ministry team.
Step 4: Complete a water treatment using the EMI General Treatment Matrix
Template to determine the best options for satisfying centralized, POU or
centralized treatment needs that are sustainable in the local context.
Global Guide Section 2 Water, 2.7 Water Storage
Civil Design Guide
32
2.7 WATER STORAGE Water storage design aims to accomplish several goals, including balancing diurnal swing of
water demand, providing pressure to a water distribution system, and providing
uninterrupted water supply during temporary water source failures. Water storage can also
be a factor in the water treatment design process, such as allowing sufficient chlorination
contact time, or to allow a water treatment facility to operate at a constant rate, as opposed
to matching the fluctuating demand (diurnal swing).
2.7.1 DESIGN STAGE
Frequency of Use: Most EMI projects involving water demand will provide a
recommendation for water storage.
Conceptual Design: Determine desired number of days and volume of water storage, size
water storage tanks/facilities, and identify water storage locations and elevations within the
project area. Determine if facility will be served by a single pressure zone (with multiple
reservoirs, if provided, set at the same maximum water level) or if multiple zones will be
used. If multiple pressure zones, consider if storage will be provided in each or how storage
provided in an upper zone will also serve a lower zone.
Detailed Design: Provide detail drawings on non-standard water storage facilities (vaults,
concrete tanks, reservoirs etc.).
2.7.2 DESIGN CRITERIA
An accurate water storage design takes many factors into account. Below are several
important considerations in the water storage design process.
Diurnal Swing of Water Demand
Although the water demand is usually calculated in terms of Average Daily Demand, water
demand fluctuates throughout the day. It is important to ensure that the water storage
provided will act as a sufficient buffer to withstand the increased demand during the peak
periods.
The peak flow factor can vary widely depending on the type of facility and the size of the
population it is serving. A larger population will typically result in a smaller peak factor, and
a smaller population will typically result in a larger peak factor.
The pattern of water demand can also vary depending on the type of facility. For instance, in
largely commercial water networks, demand tends to peak in the middle of the day, whereas
in general population networks, demand peaks in the morning and evening.
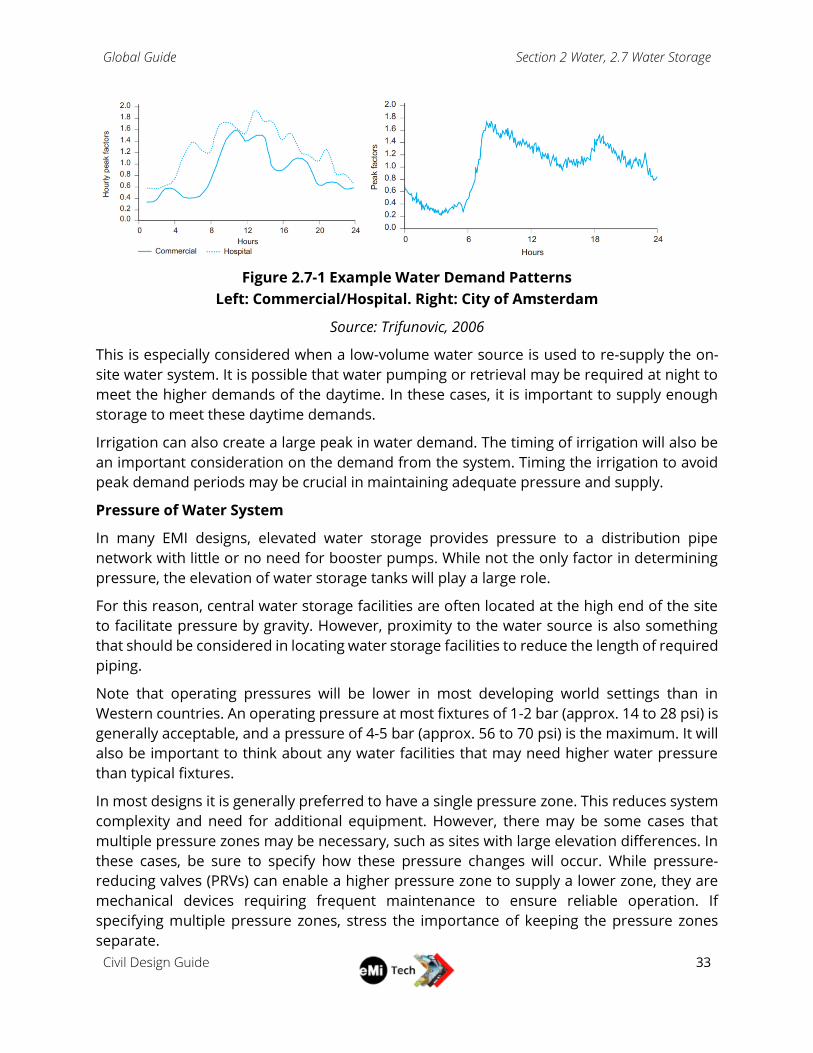
Global Guide Section 2 Water, 2.7 Water Storage
Civil Design Guide
33
Figure 2.7-1 Example Water Demand Patterns
Left: Commercial/Hospital. Right: City of Amsterdam
Source: Trifunovic, 2006
This is especially considered when a low-volume water source is used to re-supply the on-
site water system. It is possible that water pumping or retrieval may be required at night to
meet the higher demands of the daytime. In these cases, it is important to supply enough
storage to meet these daytime demands.
Irrigation can also create a large peak in water demand. The timing of irrigation will also be
an important consideration on the demand from the system. Timing the irrigation to avoid
peak demand periods may be crucial in maintaining adequate pressure and supply.
Pressure of Water System
In many EMI designs, elevated water storage provides pressure to a distribution pipe
network with little or no need for booster pumps. While not the only factor in determining
pressure, the elevation of water storage tanks will play a large role.
For this reason, central water storage facilities are often located at the high end of the site
to facilitate pressure by gravity. However, proximity to the water source is also something
that should be considered in locating water storage facilities to reduce the length of required
piping.
Note that operating pressures will be lower in most developing world settings than in
Western countries. An operating pressure at most fixtures of 1-2 bar (approx. 14 to 28 psi) is
generally acceptable, and a pressure of 4-5 bar (approx. 56 to 70 psi) is the maximum. It will
also be important to think about any water facilities that may need higher water pressure
than typical fixtures.
In most designs it is generally preferred to have a single pressure zone. This reduces system
complexity and need for additional equipment. However, there may be some cases that
multiple pressure zones may be necessary, such as sites with large elevation differences. In
these cases, be sure to specify how these pressure changes will occur. While pressure-
reducing valves (PRVs) can enable a higher pressure zone to supply a lower zone, they are
mechanical devices requiring frequent maintenance to ensure reliable operation. If
specifying multiple pressure zones, stress the importance of keeping the pressure zones
separate.
Global Guide Section 2 Water, 2.7 Water Storage
Civil Design Guide
34
Volume of Water Storage Provided
There are many factors that will play into ascribing the actual volume of the water storage
provided.
Types of Water Storage to consider
Operational Storage (volume needed to meet daily demands of site)
Equalizing Storage (related to the diurnal swing mentioned previously)
Emergency Storage (need for reserve water in case of failure, discussed more below)
Fire Suppression Storage (usually not required, check with local requirements)
Consequences of temporary failure in water source
In the event of a failure in the water system, there are several factors to think about when
determining the amount of storage-days provided for the site:
Importance of maintaining uninterrupted supply of water to users (e.g. it is usually
more important to maintain supply in a hospital than in a school).
Reliability of water source(s)
Number and variety of water sources (design redundancy)
Availability of qualified technicians for repair
Tank Design
Unusable storage in water tanks (outlet pipes are usually installed several inches from
the bottom of the tank). Typically, this is a 2-5% adjustment, but engineering
judgement should be used.
Pumps that feed water storage tanks often operate on a float switch that will turn on
the pump when the water reaches a certain level, meaning that the water storage
tanks will often not be full.
Further tank design considerations are discussed below.
Water Storage Tank Design and Appurtenances
When considering materials for the water storage tanks, manufactured plastic water storage
tanks are typically recommended on EMI projects. These tanks are usually readily available
in most countries, making the replacement and repair of the water storage system much
simpler (in most cases).
When considering the quantity of tanks to hold the required volume, a battery of tanks is
usually recommended over a single large tank. A battery of tanks allows maintenance or
replacement of one of the tanks to occur without disrupting the water supply to the site.
Global Guide Section 2 Water, 2.7 Water Storage
Civil Design Guide
35
If providing detail drawings, storage tanks should always include:
Screened vents (with a downturned elbow being ideal)
Valve drain
Overflow with a screened outlet or flap valve
Access hatch.
Options to consider:
o If hatch should include a hasp and lock
o Water level gauge
o Method of interconnecting tanks to allow for removing one for
service/maintenance and to accomplish the desired flow pattern, whether in
series or parallel.
Other Considerations
Existing water storage facilities should be examined for reusability and need for
maintenance or improvements.
Local and regional water storage regulations, practices, and available products should
be considered and carefully adhered to where appropriate and safe. In rare cases,
local practice (or even code requirements) will require water storage provisions for
fire suppression. In this case, consult the local code and engineers for these design
provisions.
Cost implications, both initial and recurring should be considered when proposing
solutions. Seek for ways to reduce cost to the client if possible and safe.
As previously mentioned, water storage can also factor into water quality designs, like
allowing sufficient chlorine contact time or allowing a water treatment facility to
operate at a constant rate, despite fluctuating demand.
In some water systems, it may be desirable to only treat water for certain uses. For
instance, if a project includes irrigation for crops it may not be necessary (and perhaps
less economic) to treat such water. In these cases, it could be advantageous to specify
both untreated and treated water storage.
Provide sample taps upstream and downstream of storage tanks to facilitate water
quality measurements.
The following resources and tools are to be used in developing the water storage design:
The Client Needs Assessment and Site Evaluation discussed in Section 1 include
sample guiding questions and evaluation criteria that can inform the water
storage design.
References and additional resources can be found in R2.7 Water Storage.
Global Guide Section 2 Water, 2.7 Water Storage
Civil Design Guide
36
The EMI Water and Wastewater Design Template includes a tab for water storage
that will link to the water demand for the site. This template allows for the
possibility of a single and/or multiple storage locations.
Region specific guidelines for Uganda can be found in UG2.7 Water Storage.
2.7.3 DESIGN PROCEDURE
Step 1: Complete and review information in Client Needs Assessment and Site
Evaluation.
Step 2: Determine desired water storage (in days of storage and volume). Include any
adjustment factors, such as unusable water volume in tanks, design
redundancy, etc. Traditionally EMI has recommended at least two days of
reserve water storage as a starting point but may vary based on factors listed
in Section 2.7.2. Volume required is typically calculated by using the Average
Day Demand (ADD) determined in Section 2.1.Water Demand Estimate
Step 3: Determine whether water storage will be in a single, centralized location, in
several locations, or a combination of both. Determine location(s) of water
storage facilities. Evaluate the pressure head that will be provided to
determine the desired elevation for storage. Based on this evaluation,
determine if a tank stand will be needed and what its base height should be.
Step 4: Determine the quantity and size of tanks, to provide the required storage
volume. Coordinate location(s) and space required with architects. Provide
detailed design drawings if necessary.
Step 5: Write all assumptions, summarize design, and record results in report. Keep
longer calculations and large tables in the Appendices.
Global Guide Section 2 Water, 2.8 Water Distribution
Civil Design Guide
37
2.8 WATER DISTRIBUTION Water distribution is the system that transports water from the source, through any water
storage and treatment facilities, and to all of the various water users at the site. Such systems
are designed to provide water at a sufficient pressure to prevent contamination even at the
highest expected flow rate. Different methods of calculating peak flows and different
assumption about timing of water usage onsite can produce dramatically differing results
and engineering judgment is always needed in the design of water distribution systems. The
designer must have a very thorough understanding of the fixtures and usage patterns on
the site as well as a strong understanding of the benefits and downfalls of the various
methods for calculating peak flow.
Other types of water distribution systems may be required depending on the project. These
include gravity water pipelines from springs, water for agricultural purposes, or fire-fighting
water systems. This section does not cover these types of systems.
2.8.1 DESIGN STAGE
Frequency of Use: Projects that include any water distribution at concept or detailed level
of design.
Conceptual Design: Determine the preliminary layout for the main water distribution
system. Identify approximate pipe sizes for main pipe loops based on calculated peak flows
in the system. Determine the volume, location and height of required tanks and if the water
distribution system is gravity flow, or if pumped systems or segments are required.
Detailed Design: Refine the piping system design as the site layout matures. Determine final
pipe placement, pipe sizing and type, as well as appurtenances needed, trenching and
supports for above grade pipe sections (including elevated pipe stands/towers as applicable).
And storage tank height, type and size, see Section 2.7 Water Storage. If pumped systems
are required, the location, flow rate and pressure, and types of pumps required need to be
designed, see Section 2.9 Pump Selection. If very high pressures are encountered from
collection of spring water high on a mountainside, for example, pressure regulation might
be required to reduce the water pressures to safe values—final design should include this
as necessary. Prepare construction drawings for installation. For irrigation pipe design, pipe
turnouts, gate structures, drop structures, culvert structures and sometimes energy
dissipation structures need to be designed.
2.8.2 DESIGN CRITERIA
A looped piping system should be used where feasible, but a branched system may be
necessary when the building is confined in an urban setting. Looped systems provide the
following advantages over dead-end pipe runs:
More evenly distributes pressure and flow throughout the system
Provides redundancy and flexibility, allowing portions of the system to be shut off for
maintenance
Eliminates long, dead-end runs of pipe where water may sit and become stagnant
Global Guide Section 2 Water, 2.8 Water Distribution
Civil Design Guide
38
Because of variable conditions encountered in hydraulic design, it is impractical to specify
definite and detailed rules for designing water distribution systems in all cases. In small,
simple installations, it is often possible to size pipes based on rules of thumb derived from
experience and convention. In more complicated cases, the pipe sizes and system layout
shall be designed in accordance with good engineering practice utilizing the methods
discussed below.
The information presented below applies to the design of site water distribution systems.
While much of the theory can also be applied to the design of building plumbing systems,
interior plumbing is not specifically addressed in this section.
Methods for Determining Flow Rates
One of the most critical components of designing a water distribution system is to determine
the design flow rates within the system. The designer must assign a flow rate (in liters per
second, lps, or liters per minute, lpm) for each building or other discharge point on the site.
The designer must use engineering judgment and the methods discussed below to
determine flow rates that provide an accurate, conservative design that meets the needs of
the water users. It is usually necessary to consider multiple different flow scenarios and
ensure that the distribution system can provide adequate service under various
combinations of flows.
Peak Factor Method:
Peak Flow = Average Daily Demand x Peak Factor
The designer should use the Average Daily Demand based on the EMI Water and
Wastewater Design Template and Water Usage Rates described in A2.1 Water
Demand Estimate. An appropriate peak factor for each individual building should be
determined. Typical values range from 1.5 to 2 depending on facility type.
See more detailed about the Peak Flow method in addition to two detailed methods,
Fixture Count and Water Service Fixture Unit, in Appendix A2.8.1 Detailed Description
Of Methods For Determining Flow Rates.
Minimum Acceptable Pressure
EMI’s current design standard is to ensure that common plumbing fixtures, and all points in
the water distribution system, maintain a minimum of 2.0-5.0 meters of hydraulic head
(residual pressure, static pressure minus pressure losses) under peak flow conditions.
Designing to a minimum residual pressure standard is a simple a way to ensure that under
peak flow conditions, the distribution system still has a bit of excess capacity and is not too
close to failure. Designing for a minimum residual pressure ensures the water pressure is
always positive to prevent infiltration of possibly contaminated water into the distribution
system, contaminating the water and piping system. Typically, 3.5 m (5 psi) for sinks, low-
pressure showers or toilets in single story faciliities with gravity flow in the developing world.
An irrigation sprinkler head typically requires about 30 psi (21 m) of pressure, while irrigation
drip systems require pressure between 9 and 21 m (10-30 psi).

Global Guide Section 2 Water, 2.8 Water Distribution
Civil Design Guide
39
In many developed countries, the requirements for a high residual pressure is based on the
need to be able to provide fire-fighting flows when needed. As this criterion is not applied to
most EMI projects in the developing world, there is not a need for a high residual pressure
as long as the system is effectively supplying the peak flow rates required and maintains at
least 2m of head throughout the system under peak flow conditions. For fire-fighting flows,
minimum pressures need to be in accordance with local regulations and are usually much
higher, typically 30 to 40 m. When designing a system for firefighting purposes, the larger
flow rates needed, as well as the higher pressure, must be take into consideration.
Higher service pressure may be needed if the system is used for irrigation or to meet local
regulations. Higher pressure may also be needed if the system will use point-of-use
treatment, depending on the type of treatment. However, be careful when recommending
minimum residual pressures greater than 2-5m. Piping and pipe fittings in developing
countries are often of poor quality and installation practices are often poor, leading to major
leakage or system failures where pressure is highest. Water consumption will also increase
with higher pressure which would increase water demand and require a larger capacity
wastewater disposal system.
Building A Distribution System Model
Designing distribution systems, particularly a looped system, is a complex process. EMI
typically uses EPANET software to build a model of the site’s distribution system. EPANET
allows the entire distribution system to be modeled to determine the effects of varying flow
rates, elevations of inlet and outlets and pipe size and material. Such a model allows many
parameters to be altered to arrive at the desired 2-5m pressure at all points in the system
under the most demanding situation. See Appendix A2.8.2 EMI EPANet Guidelines for more
instructions. Other software for modelling water distribution systems is available, but all
require similar inputs from the designer.
The sections above discussed methods for determining the peak flow rates to the buildings,
or if a building has multiple water inlet points, the peak flow at each inlet. These flow rates
now must be built into a model that accurately represents the water usage patterns on the
site. If the peak flow to each building is calculated individually and then each of those is built
into the model, you will likely be over-estimating the actual usage on the site. It is unlikely
that every building on the site will experience peak flow at the same time. For example, at a
boarding school, the peak flow in the dorms might be in the evening when students are
showering, while the peak flow in the academic buildings will likely occur during the school
day – to model both dorms and academic buildings experiencing peak flow at one time is
probably overly conservative.
You must run many different scenarios in your water distribution model. Use the calculated
peak flows for each building as a guideline and then use engineering judgment to consider
different times of day and different types of usage patterns that will occur on the site. The
water distribution system should provide adequate pressures under many different usage
and flow conditions. You should also consider unusual situations, such as when parts of the
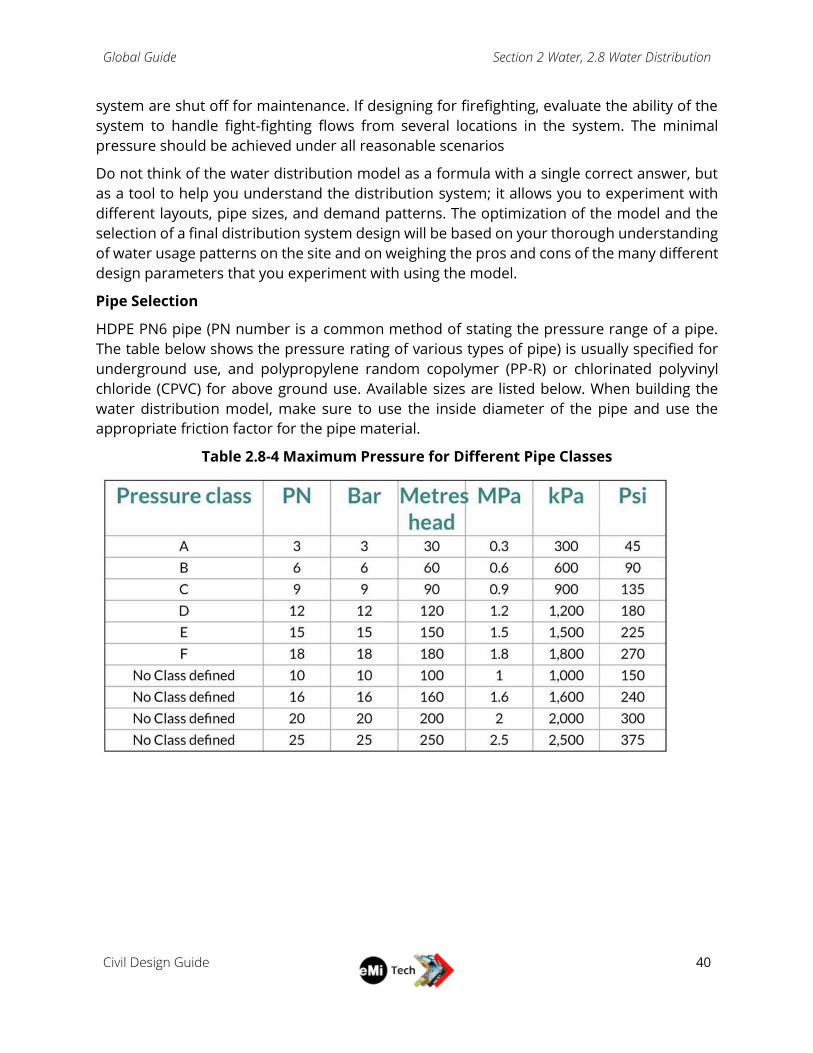
Global Guide Section 2 Water, 2.8 Water Distribution
Civil Design Guide
40
system are shut off for maintenance. If designing for firefighting, evaluate the ability of the
system to handle fight-fighting flows from several locations in the system. The minimal
pressure should be achieved under all reasonable scenarios
Do not think of the water distribution model as a formula with a single correct answer, but
as a tool to help you understand the distribution system; it allows you to experiment with
different layouts, pipe sizes, and demand patterns. The optimization of the model and the
selection of a final distribution system design will be based on your thorough understanding
of water usage patterns on the site and on weighing the pros and cons of the many different
design parameters that you experiment with using the model.
Pipe Selection
HDPE PN6 pipe (PN number is a common method of stating the pressure range of a pipe.
The table below shows the pressure rating of various types of pipe) is usually specified for
underground use, and polypropylene random copolymer (PP-R) or chlorinated polyvinyl
chloride (CPVC) for above ground use. Available sizes are listed below. When building the
water distribution model, make sure to use the inside diameter of the pipe and use the
appropriate friction factor for the pipe material.
Table 2.8-4 Maximum Pressure for Different Pipe Classes
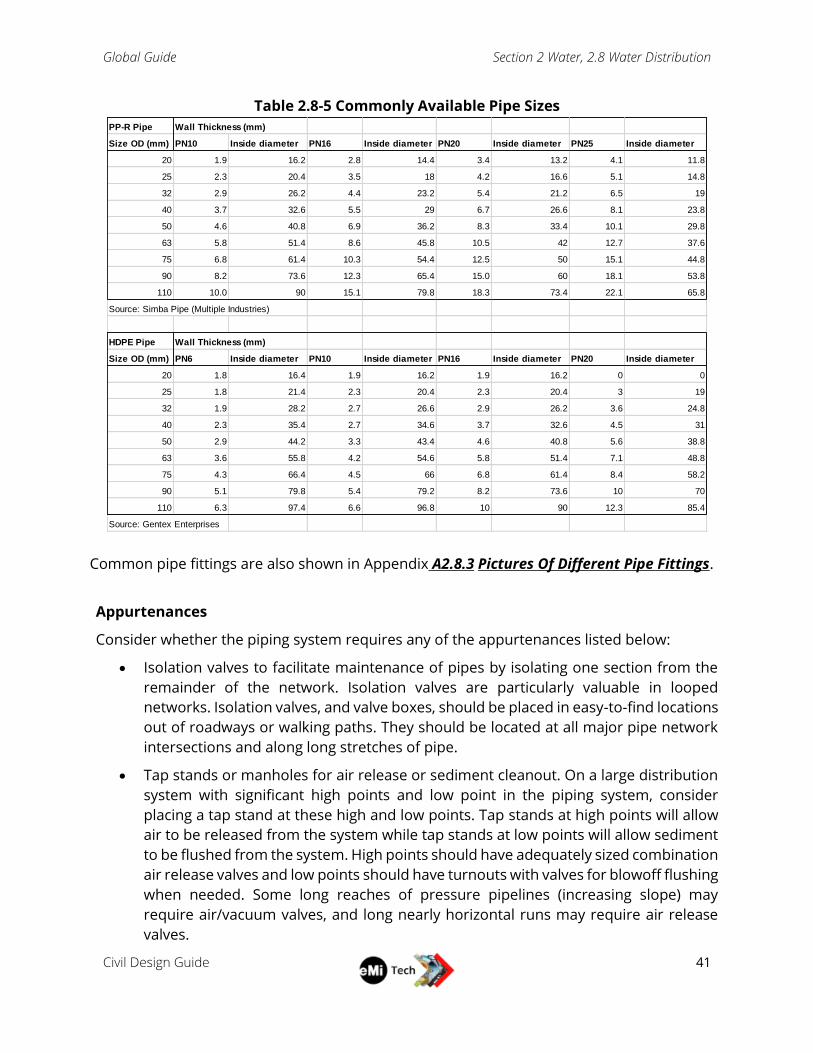
Global Guide Section 2 Water, 2.8 Water Distribution
Civil Design Guide
41
Table 2.8-5 Commonly Available Pipe Sizes
Common pipe fittings are also shown in Appendix A2.8.3 Pictures Of Different Pipe Fittings.
Appurtenances
Consider whether the piping system requires any of the appurtenances listed below:
Isolation valves to facilitate maintenance of pipes by isolating one section from the
remainder of the network. Isolation valves are particularly valuable in looped
networks. Isolation valves, and valve boxes, should be placed in easy-to-find locations
out of roadways or walking paths. They should be located at all major pipe network
intersections and along long stretches of pipe.
Tap stands or manholes for air release or sediment cleanout. On a large distribution
system with significant high points and low point in the piping system, consider
placing a tap stand at these high and low points. Tap stands at high points will allow
air to be released from the system while tap stands at low points will allow sediment
to be flushed from the system. High points should have adequately sized combination
air release valves and low points should have turnouts with valves for blowoff flushing
when needed. Some long reaches of pressure pipelines (increasing slope) may
require air/vacuum valves, and long nearly horizontal runs may require air release
valves.
PP-R Pipe Wall Thickness (mm)
Size OD (mm) PN10 Inside diameter PN16 Inside diameter PN20 Inside diameter PN25 Inside diameter
20 1.9 16.2 2.8 14.4 3.4 13.2 4.1 11.8
25 2.3 20.4 3.5 18 4.2 16.6 5.1 14.8
32 2.9 26.2 4.4 23.2 5.4 21.2 6.5 19
40 3.7 32.6 5.5 29 6.7 26.6 8.1 23.8
50 4.6 40.8 6.9 36.2 8.3 33.4 10.1 29.8
63 5.8 51.4 8.6 45.8 10.5 42 12.7 37.6
75 6.8 61.4 10.3 54.4 12.5 50 15.1 44.8
90 8.2 73.6 12.3 65.4 15.0 60 18.1 53.8
110 10.0 90 15.1 79.8 18.3 73.4 22.1 65.8
Source: Simba Pipe (Multiple Industries)
HDPE Pipe Wall Thickness (mm)
Size OD (mm) PN6 Inside diameter PN10 Inside diameter PN16 Inside diameter PN20 Inside diameter
20 1.8 16.4 1.9 16.2 1.9 16.2 0 0
25 1.8 21.4 2.3 20.4 2.3 20.4 3 19
32 1.9 28.2 2.7 26.6 2.9 26.2 3.6 24.8
40 2.3 35.4 2.7 34.6 3.7 32.6 4.5 31
50 2.9 44.2 3.3 43.4 4.6 40.8 5.6 38.8
63 3.6 55.8 4.2 54.6 5.8 51.4 7.1 48.8
75 4.3 66.4 4.5 66 6.8 61.4 8.4 58.2
90 5.1 79.8 5.4 79.2 8.2 73.6 10 70
110 6.3 97.4 6.6 96.8 10 90 12.3 85.4
Source: Gentex Enterprises
Global Guide Section 2 Water, 2.8 Water Distribution
Civil Design Guide
42
Water meters are needed at key locations in the distribution system to track usage of
water and to identify potential leakage points. If a pay-for-use system will be put in
place, water meters will be needed at each significant user to track consumption.
Unless special high-pressure pipe and fittings are specified, break-pressure tanks are
needed under certain circumstances when the water supply source or storage tanks
are located at a much higher elevation (over 100m this will depend upon the type and
pressure rating of the pipe and joints, example steel pipe with butt welded joints can
often take higher pressures than HDPE or PVC) than the project site. This situation is
common in spring capture systems that utilize a gravity flow pipeline to convey the
water to the site. For high pressure long delivery pipelines, water hammer (pulsed
water pressure added when a downstream valve is closed) also needs to be
considered in the design.
The following resources and tools are to be used in developing the water demand estimate:
The Client Needs Assessment and Site Evaluation discussed in Section 1 include
sample guiding questions and evaluation criteria that can inform the water
demand estimate.
Appendix A2.8.1 Detailed Description Of Methods For Determining Flow Rates
provides alternative calculations for flow rates such as:
o Peak Factor Method
o Fixture Count Method
o Water Service Fixture Unit Method
Appendix A2.8.2 EMI EPANet Guidelines offers guidance on the use of EPANET. It
is public domain software that is free and available on the internet that can aid in
complex looped networks.
Appendix A2.8.3 Pictures Of Different Pipe Fittings helps designers identify pipe
fittings.
References and additional resources can be found in R2.8 Water Distribution.
Region specific guidelines for Uganda can be found in UG2.8 Water Distribution.
The EMI Pipe and Channel Sizing Template uses Manning’s Equation to calculate
pipe and channels sizing. This is a detailed tool and not used in concept level
design.
2.8.3 DESIGN PROCEDURE
Different methods of calculating peak flows and different assumptions about timing of water
usage onsite can produce dramatically differing results and engineering judgment is always
needed in the design of water distribution systems. The designer must have a very thorough
understand of the fixtures and usage patterns on the site as well as a strong understanding
of the benefits and downfalls of the various methods for calculating peak flow. Document
any assumptions used in this design process.
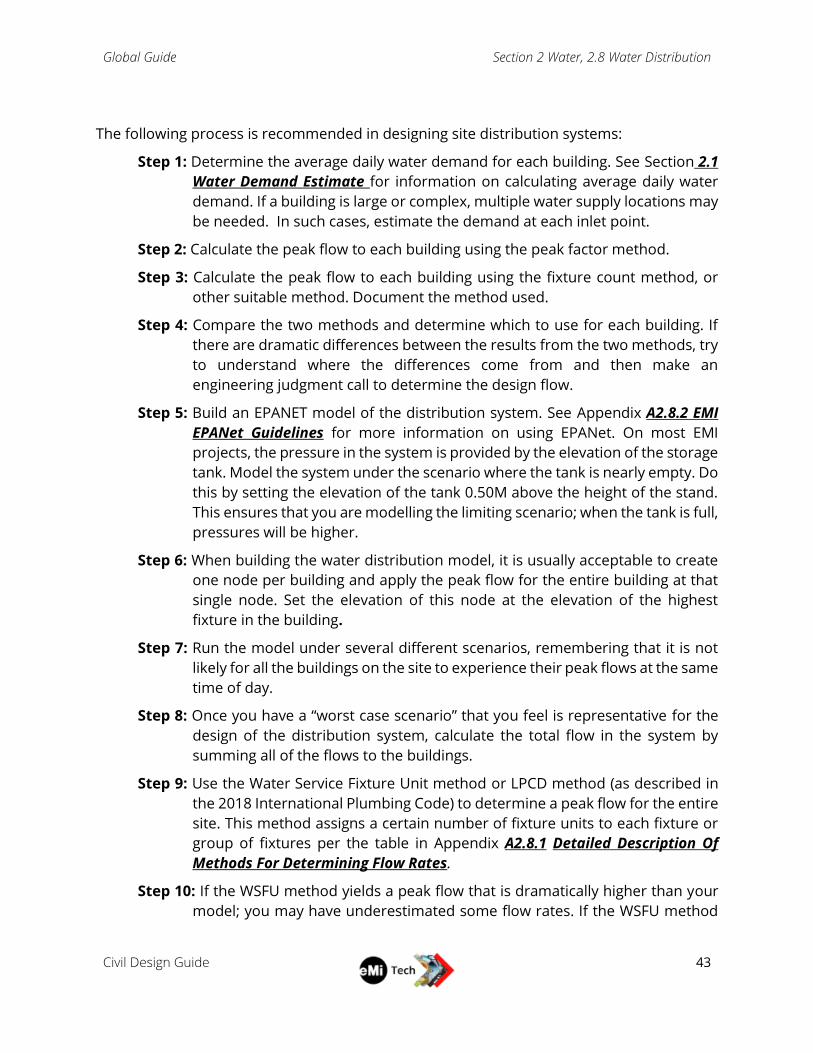
Global Guide Section 2 Water, 2.8 Water Distribution
Civil Design Guide
43
The following process is recommended in designing site distribution systems:
Step 1: Determine the average daily water demand for each building. See Section 2.1
Water Demand Estimate for information on calculating average daily water
demand. If a building is large or complex, multiple water supply locations may
be needed. In such cases, estimate the demand at each inlet point.
Step 2: Calculate the peak flow to each building using the peak factor method.
Step 3: Calculate the peak flow to each building using the fixture count method, or
other suitable method. Document the method used.
Step 4: Compare the two methods and determine which to use for each building. If
there are dramatic differences between the results from the two methods, try
to understand where the differences come from and then make an
engineering judgment call to determine the design flow.
Step 5: Build an EPANET model of the distribution system. See Appendix A2.8.2 EMI
EPANet Guidelines for more information on using EPANet. On most EMI
projects, the pressure in the system is provided by the elevation of the storage
tank. Model the system under the scenario where the tank is nearly empty. Do
this by setting the elevation of the tank 0.50M above the height of the stand.
This ensures that you are modelling the limiting scenario; when the tank is full,
pressures will be higher.
Step 6: When building the water distribution model, it is usually acceptable to create
one node per building and apply the peak flow for the entire building at that
single node. Set the elevation of this node at the elevation of the highest
fixture in the building.
Step 7: Run the model under several different scenarios, remembering that it is not
likely for all the buildings on the site to experience their peak flows at the same
time of day.
Step 8: Once you have a “worst case scenario” that you feel is representative for the
design of the distribution system, calculate the total flow in the system by
summing all of the flows to the buildings.
Step 9: Use the Water Service Fixture Unit method or LPCD method (as described in
the 2018 International Plumbing Code) to determine a peak flow for the entire
site. This method assigns a certain number of fixture units to each fixture or
group of fixtures per the table in Appendix A2.8.1 Detailed Description Of
Methods For Determining Flow Rates.
Step 10: If the WSFU method yields a peak flow that is dramatically higher than your
model; you may have underestimated some flow rates. If the WSFU method

Global Guide Section 2 Water, 2.8 Water Distribution
Civil Design Guide
44
yields a peak flow that is lower than your model; you are likely overestimating
the peak flow rates.
Step 11: Adjust peak flow rates as needed based on engineering judgment and a
comparison of the three peak flow calculation methods.
Step 12: Run the model under several different scenarios, changing system
parameters to as needed to ensure that the minimum acceptable pressures
are maintained. The goal is to have a minimum of 2.0 meters of residual head
at the critical fixture (highest elevation fixture) within the building and each
node within the system. If you have modeled the entire building as a single
node, make sure that the node has a minimum residual pressure of 2.3
meters. Experience on past projects leads to the estimate that about 0.30
meters of head will be lost to friction within the interior building piping system.
Step 13: If the model is producing unacceptably low pressures the following are some
ways to increase the pressure in the system:
Increase sizes of critical pipes. In EPAnet you can view the unit head loss in
each pipe and quickly see which pipes might be undersized.
Add extra loops/connecting pipes into the system.
Branch the system as early as possible. The pipe coming out of the tank will
have the highest flow rate and likely high friction losses. Branch the system
early to shorten the distance in which the flow for the entire site is
contained in a single pipe.
Increase the height of the tank stand or add pump station(s) into the
system.
Step 14: Update CAD drawings to include the proposed piping system on the Civil Site
Layout and include CAD standard details for appurtenances where needed.
Step 15: Determine the regionally appropriate pipe material by contacting vendors or
researching online or in country.
Step 16: Use the material cost and CAD drawing to determine a cost estimate, if
needed.
Global Guide Section 2 Water, 2.9 Pump Selection
Civil Design Guide
45
2.9 PUMP SELECTION In some cases, water distribution may be possible to be carried out entirely by gravity.
However, in many cases pumps are needed to add sufficient pressure to distribute water to
treatment facilities, to water storage tanks, or to fixtures within buildings.
In EMI designs, pumps are most commonly applied in water distribution, so this section will
be based on water pump design with some additional attention to pump design in wellbore
use. In the event of designing a pump for a liquid other than fresh water, it is important to
adapt the process and calculations to the circumstances.
In EMI designs, pumps are most commonly used to transport fresh water to storage tanks
(as opposed to pressurizing a distribution system) and the section below reflects this design
intent. In the event of designing a pump to pressurize a distribution system or for a liquid
other than fresh water, it is important to adapt the process and calculations to the
circumstances.
2.9.1 DESIGN STAGE
Frequency of Use: All EMI projects that will require a pump.
Conceptual Design: Identify where pumps will be needed. Identify location and elevation of
water supply and elevated water tanks. Define preliminary system curve and identify design
operating point. Identify commonly used pump types, pump manufacturers, and pump
suppliers for the project location.
Detailed Design: Finalize system curve. Identify preferred and/or optional pump types for
identified applications. Final pump selection should be deferred to local pump
manufacturers who will recommend the pump to best fit the system curve and conditions.
2.9.2 DESIGN CRITERIA
Aside from the pump sizing, several factors should be considered in the specification and
design of a pump:
Pump and pipe material(s) locally available. Pipe material will change the friction loss
through the pipe.
Duty cycle and pump cycling (see additional information in design procedure)
Characteristics of fluids being handled
o Temperature and resulting viscosity and vapor pressure of water
o Presence of solids in water (may need to take greater care in ensuring that
solids don’t settle in pipes)
Materials of construction (consideration of longevity and corrosion resistance)
Ministry’s knowledge/ability to maintain and repair pumps
Quality and cost
Global Guide Section 2 Water, 2.9 Pump Selection
Civil Design Guide
46
For well pumps: diameter of submersible pump, depth of setting, available power,
pump to waste feature
Consideration of dual or possibly more pumps for a booster pump system
o Added redundancy
o Varying pumping rates
As mentioned above, this section is primarily used for design of fresh water pumps. While
not extensive or complete, below are some things to consider when pumping a liquid other
than fresh water:
Temperature and viscosity of liquid
Presence of suspended solids (e.g. sewage pumps may require macerating or ‘trash’
pumps)
Materials needed for certain applications (e.g. seawater systems require stainless
steel or bronze components)
Constant Speed vs. Variable Speed
Constant speed pumps operate at one speed, and one power level usage. Depending on the
pressure in the system, the pump will operate at a given flow rate. Variable speed pumps,
on the other hand, have the capability to use less electricity and slow the speed of the motor.
This allows the pump to have varying flow rates within the same pressure range.
For reasons of simplicity, most EMI designs will incorporate the use of a constant speed
pump. Variable speed pumps will be a higher up-front investment, but may reduce power
use (and therefore power costs). They can also be more adaptable in systems with changing
pressure levels. However, variable speed pumps are also more complex and will require
higher expertise in maintenance. Therefore, careful consideration of these factors should be
taken into account if specifying a variable speed pump.
Solar Pumps
While not often specified, solar powered pumps may also be worth considering in certain
circumstances. Here are some factors to consider when deciding if solar pumps may be
suitable:
Solar pumps have a much higher up-front investment.
Due to the value of the above-ground equipment, solar systems should be carefully
guarded. It may only be suitable within walled compounds or areas that can be easily
secured.
Solar pumps will usually have much lower flow rates than pumps using more
traditional power sources (~15-20 L/min or 4-5 gal/min)
The following resources and tools are to be used in developing the pump design:
Global Guide Section 2 Water, 2.9 Pump Selection
Civil Design Guide
47
The Client Needs Assessment and Site Evaluation discussed in Section 1 include
sample guiding questions and evaluation criteria that can inform the pump design.
References and additional resources can be found in R2.9 Pump Selection.
Region specific guidelines for Uganda can be found in UG2.9 Pump Selection.
The EMI Pump Design Template can be used to input the variables and will help
determine the appropriate pipe size and define the system curve.
For more information about pumps see:
https://akvopedia.org/wiki/Powered_pumps
2.9.3 DESIGN PROCEDURE
For Steps 3 through 6, see the EMI Pump Design Template for calculations.
Step 1: Complete and review information in Client Needs Assessment and Site
Evaluation.
Step 2: Determine flow rate required from pump to meet site demands based on
results in Section 2.1 Water Demand Estimate. It is important to address the
duty cycle of the pump. The frequency of pump starts should be limited to
reduce wear on the pump and motor. Additionally, when the pump does start,
it should be operated for a minimum length of time to allow for cooling after
the higher inrush of power for the motor start. The frequency of pump starts
and minimum run time depend on the motor size and pump size. The
following values provide reasonable targets for 10 hp and smaller motors:
Operate the pump for no more than 8 hours total each day
Pump starts: No more than once every 30 minutes
Minimum pump operating time: 10 minutes
These values generally can be achieved by selecting the appropriate pump size
and by considering the operating band in the receiving reservoir. Operating
band refers to the conditions in which the pump will start (low level) and when
it will stop (high level). Also important to consider is the presence and volume
of storage being provided. Larger storage volumes mean that the pump can
operate more consistently and at lower flows since the storage acts as a
buffer. A smaller storage volume could mean that the pump flow rate will need
to be closer to the peak water demand rate.
In well applications, borehole drilling logs and draw-down/build-up tests may
indicate the time needed for a borehole/aquifer to recharge before operating
the pump again (e.g. every 2 hours of operation requires 1 hour of recharge).
If pumps are needed to run for more than 8 hours each day, confirm with
pump manufacturers that the pump can run for the hours needed – this is
commonly referred to as the “duty cycle”.
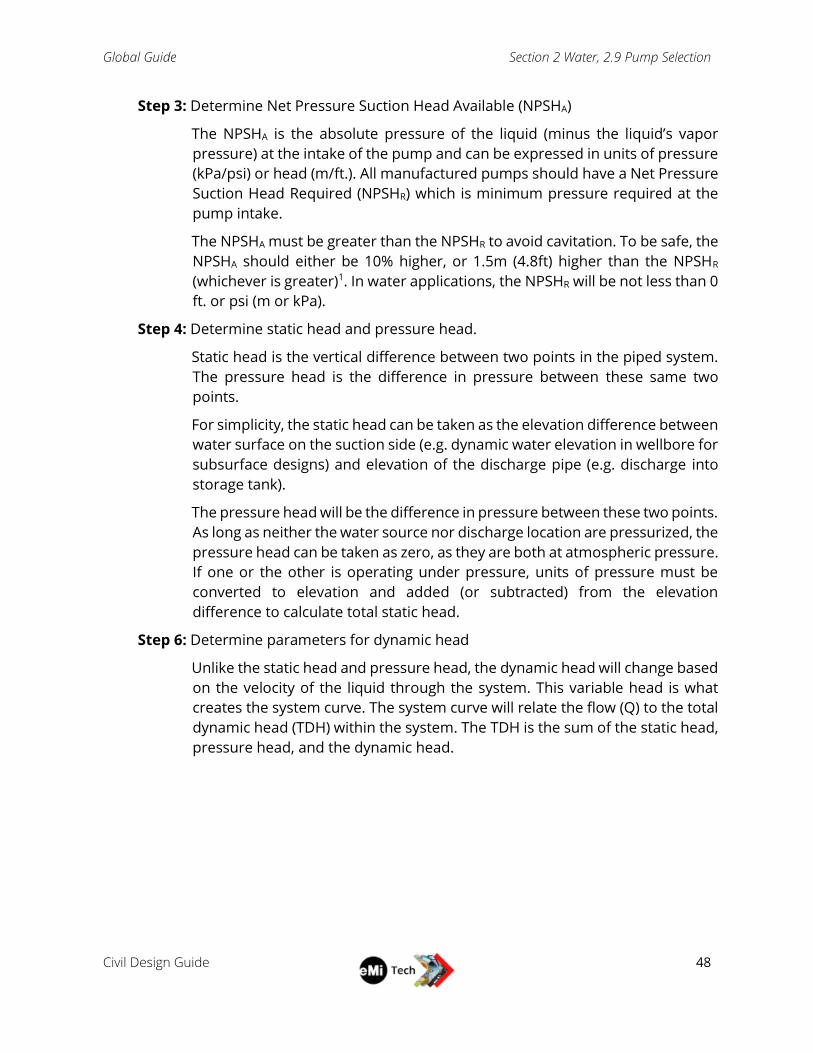
Global Guide Section 2 Water, 2.9 Pump Selection
Civil Design Guide
48
Step 3: Determine Net Pressure Suction Head Available (NPSHA)
The NPSHA is the absolute pressure of the liquid (minus the liquid’s vapor
pressure) at the intake of the pump and can be expressed in units of pressure
(kPa/psi) or head (m/ft.). All manufactured pumps should have a Net Pressure
Suction Head Required (NPSHR) which is minimum pressure required at the
pump intake.
The NPSHA must be greater than the NPSHR to avoid cavitation. To be safe, the
NPSHA should either be 10% higher, or 1.5m (4.8ft) higher than the NPSHR
(whichever is greater)1. In water applications, the NPSHR will be not less than 0
ft. or psi (m or kPa).
Step 4: Determine static head and pressure head.
Static head is the vertical difference between two points in the piped system.
The pressure head is the difference in pressure between these same two
points.
For simplicity, the static head can be taken as the elevation difference between
water surface on the suction side (e.g. dynamic water elevation in wellbore for
subsurface designs) and elevation of the discharge pipe (e.g. discharge into
storage tank).
The pressure head will be the difference in pressure between these two points.
As long as neither the water source nor discharge location are pressurized, the
pressure head can be taken as zero, as they are both at atmospheric pressure.
If one or the other is operating under pressure, units of pressure must be
converted to elevation and added (or subtracted) from the elevation
difference to calculate total static head.
Step 6: Determine parameters for dynamic head
Unlike the static head and pressure head, the dynamic head will change based
on the velocity of the liquid through the system. This variable head is what
creates the system curve. The system curve will relate the flow (Q) to the total
dynamic head (TDH) within the system. The TDH is the sum of the static head,
pressure head, and the dynamic head.
Global Guide Section 2 Water, 2.9 Pump Selection
Civil Design Guide
49
Figure 2.9-1 Example System Curve
The dynamic head will consist of the pipe friction loss, and minor head loss.
Aside from the flow rate, the friction loss will be dependent on the pipe
diameter, material, and length of piping, as well as characteristics of the fluid
being pumped (temperature, viscosity, etc.).
Pipe material should be based on what is locally available and most likely to
be used, and length of piping will be determined by what is needed to
transport the water to its destination. The diameter of the pipe can be varied
to obtain a desirable velocity based on the design flow rate (too low and solids
may settle, too high and the friction head will increase exponentially – square
of velocity).
The minor head loss is the head loss in the system due to bends, fittings,
valves, etc. Each is treated as a “singularity” and assigned a coefficient (K). The
sum of the coefficients produces a head loss proportional to the square of
velocity.
Based on Step 1, plot your design flow point on the system curve.
Step 7: Write all assumptions, summarize design, and record results in report. This
includes the NPSHA and the system curve (with preferred design point), which
the pump manufacturer/contractor will need to select a suitable pump. Keep
longer calculations and tables in the Appendices.
Step 8: If needed, once a pump is selected it should be plotted against the system
curve and verify the resulting flowrate will meet the site demands and not
exceed any maximum flow rates (e.g. in boreholes).

Global Guide Section 3 Geotechnical, 3.1 Soil Classification
Civil Design Guide
50
3 Geotechnical
3.1 SOIL CLASSIFICATION Soil classification is imperative for estimating the on-site soil properties used to predict soil
behavior. Soil properties are used to determine the soil’s bearing capacity (see Section 3.2
Bearing Capacity) when designing foundations and the absorption rate (see Section 3.3 Soil
Absorption Capacity) used to design certain wastewater treatment systems.
It is important to know the purpose for which the Soil Classification is to be used: Foundation
Design, Drainage and Flood Control, Leach Fields, Agricultural Use.
3.1.1 DESIGN STAGE
Frequency of Use: Soil classification should be performed on every project.
Conceptual Design: Soil properties can be estimated based on accepted correlations.
Detailed Design: A soils report from a local geotechnical engineering firm should be
obtained to confirm and/or add additional information about the soils’ physical and hydraulic
properties. A thorough soils report is especially important when designing a foundation
deeper than a shallow footing or slab.
3.1.2 DESIGN CRITERIA
There are many different ways to classify soils and each agency/company typically uses their
own standard. In this guide, a mix of USDA and USCS sources are used.
Native soils are comprised of various minerals and form three primary categories: coarse
grained material, silt, and clay. Most soils are a combination, but the percentage of each is
very important when determining the soils’ properties.
Coarse grained materials include cobbles, gravel, and sand. These are the largest of
the three components and can be seen with the naked eye. Sand has a gritty feeling
when rubbed between two fingers and will not form into a ball. Gravel behaves very
similarly to sand, but is larger, passing through a 75mm (3 in) sieve and being retained
on a 2.0 mm (No. 10) sieve.
Silt has a smooth, floury like texture and is “non-plastic” or very slightly plastic.
Clay feels sticky when moist and displays putty-like properties within a range of water
contents. It is considered plastic.
Individual particles of silt and clay cannot be identified with the naked eye. “Fine-grained”
material is made up of more than 50% silt and clay particles (“fines”) while a “coarse-grained”
material is made up of greater than 50% sand particles (ASTM D 2487).
Fill material is imported and used to artificially change the grade or elevation of a property
or fill in depressions. It is important to know if fill material is used and whether it has been
compacted well or not. Good fill is typically free from organic matter and biological activity
Global Guide Section 3 Geotechnical, 3.1 Soil Classification
Civil Design Guide
51
and taken from another area of the site where soil is being removed or transported from
another site that is leveling an area for construction. However, most fills will have unnatural
materials like trash, metal, or brick and have a mottled color due to its make up as a mixture
of different colored soil types.
The following can help in identifying native vs fill soils:
1. Presence of buried organic material (stumps, branches, root mass) below the
ground surface.
2. Presence of man-made materials: concrete, slag, garbage, debris, etc.
3. Inconsistent soil structure
4. Inconsistent terrain and landforms
5. Misplaced rounded gravel or angular rock formations
Depending on the availability of public information, background research, or a desk study,
should be completed prior to every project. Desk studies help to identify geologic hazards
and determine the scope of a geotechnical investigation. Lists of available resources are
provided in the detailed descriptions for each EMI office.
The Client Needs Assessment and Site Evaluation discussed in Section 1 include
sample guiding questions and evaluation criteria that can inform where soil
characterization should take place on the site during the project trip.
Appendix A3.1.1 Test Procedures Manual Tests provides step-by-step instructions for
performing various soil classification tests.
Appendix A3.1.2 Additional Information provides flow charts, photos, and additional
information for classifying soil correctly.
Appendix A3.1.3 Classification Comparison provides correlations between USDA and
USCS soil classification.
Appendix A3.1.4 Hand Augering/Boring Location provides information regarding
hand auger use and boring locations.
References and additional resources can be found in R3.1 Soil Classification.
Region specific guidelines for Uganda can be found in UG3.1 Soil Classification.
EMI Soil Testing Field Packet can be printed and taken on the project trip to aid in
classifying soil and ensure all pertinent information is recorded.
3.1.3 DESIGN PROCEDURES
The following steps are helpful in classifying the soil type:
Step 1: Identify soil texture by performing a manual test, jar test or sieve analysis as
described in Appendix A3.1.1 Test Procedures Manual Tests and estimate
relative proportions of gravel, sand, silt and clay. (e.g. fine-grained or coarse-
grained)

Global Guide Section 3 Geotechnical, 3.1 Soil Classification
Civil Design Guide
52
Step 2a: If the soil is coarse-grained, estimate the gradation (range of grain sizes) if a
sieve is available, moisture content (dry, moist, wet), angularity (angular, sub-
angular, sub-rounded, rounded), and color.
Step 2b: If the soil is fine-grained, estimate the moisture content (dry, moist, wet),
consistency (very soft, … very stiff), plasticity, and color.
Step 3: Identify whether collapsible, expansive soils, organic soils, or additional
hazardous soils are present.
Collapsible soils reduce in volume when wet. They tend to exhibit high
strength and stiffness at normal water contents but collapsible when water is
added. Difficult to identify by eye.
Expansive soils shrink or expand in volume depending on the water content.
Volume change causes great damage to low-rise buildings that do not have
sufficient weight to resist the forces due to expansion.
Step 4: Record the soil description including: Group name (group symbol) – color,
moisture, description of angularity and gradation (coarse-grained), plasticity
(only for fine-grained soils), structure, soil consistency (density or stiffness),
and other notable features (cementation).
Examples:
Sandy CLAY (CL) – light grey, moist, stiff, non-plastic.
Sandy GRAVEL (GW) – brown, dry, sub rounded, dense, well-graded.

Global Guide Section 3 Geotechnical, 3.2 Bearing Capacity
Civil Design Guide
53
3.2 BEARING CAPACITY Soil bearing capacity is the capacity of soil to carry a distributed load applied by a foundation
element. It is the maximum average pressure between the soil and foundation without
failing or allowing significant settlement.
3.2.1 DESIGN STAGE
When buildings will be present on site, the suitability of a soil’s bearing capacity should be
evaluated to determine appropriate building locations, feasibility of number of stories, and
appropriate foundations for structures on the site. For example, if the bearing capacity of
the soil at a shallow depth is sufficient for the structure, then a shallow foundation can be
used. If the structure has a larger loading pressure, the foundation may need to be at a depth
with adequate soil bearing capacity. The estimated settlement should also be analyzed
during further study.
Frequency of Use: Bearing capacity should be evaluated on every project involving design
of a structure.
Conceptual Design: Bearing capacity can be estimated using safe values depending on the
soil type.
Detailed Design: A soils report from a local geotechnical engineering firm, if available,
should be obtained to better estimate the soils bearing capacity using Equation A3.2-2
Simplified Ultimate Bearing Capacity. Alternatively, a local geotechnical engineering firm
can estimate the bearing capacity following testing.
3.2.2 DESIGN CRITERIA
Bearing capacity should be estimated in locations of future footings at the anticipated
subgrade depth because an understanding of a soil’s bearing capacity is essential for
designing foundations and ensuring overall building stability. An allowable bearing capacity
should limit both settlement and shear stress of the soils in the influence zone, either of
which can lead to failure. Typically, the design will work to minimize bearing pressure to meet
the allowable bearing capacity of the soil; however, in some cases it might be feasible to
consider soil reinforcement to increase a soil’s bearing capacity.
Bearing capacity depends on:
Soils shear strength
Foundations shape, size, depth, and type
Spacing between foundation
Erosion and seepage
Seismic forces
Frost Action
Subsurface voids
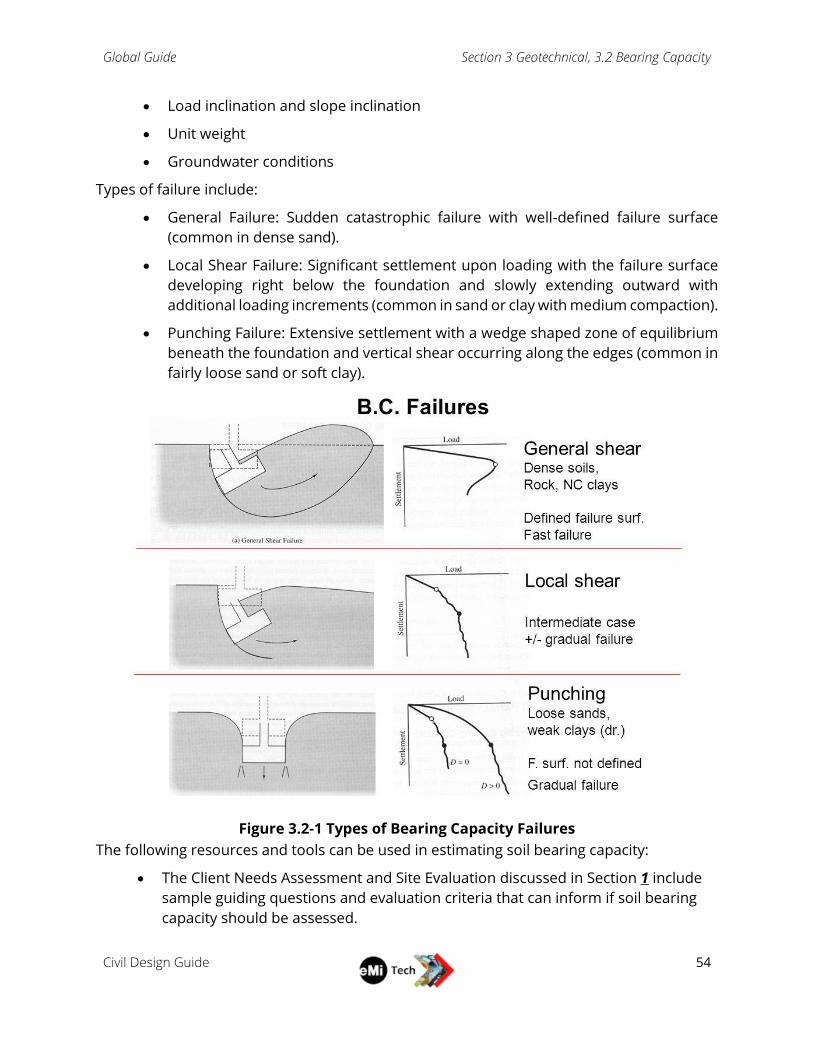
Global Guide Section 3 Geotechnical, 3.2 Bearing Capacity
Civil Design Guide
54
Load inclination and slope inclination
Unit weight
Groundwater conditions
Types of failure include:
General Failure: Sudden catastrophic failure with well-defined failure surface
(common in dense sand).
Local Shear Failure: Significant settlement upon loading with the failure surface
developing right below the foundation and slowly extending outward with
additional loading increments (common in sand or clay with medium compaction).
Punching Failure: Extensive settlement with a wedge shaped zone of equilibrium
beneath the foundation and vertical shear occurring along the edges (common in
fairly loose sand or soft clay).
Figure 3.2-1 Types of Bearing Capacity Failures
The following resources and tools can be used in estimating soil bearing capacity:
The Client Needs Assessment and Site Evaluation discussed in Section 1 include
sample guiding questions and evaluation criteria that can inform if soil bearing
capacity should be assessed.
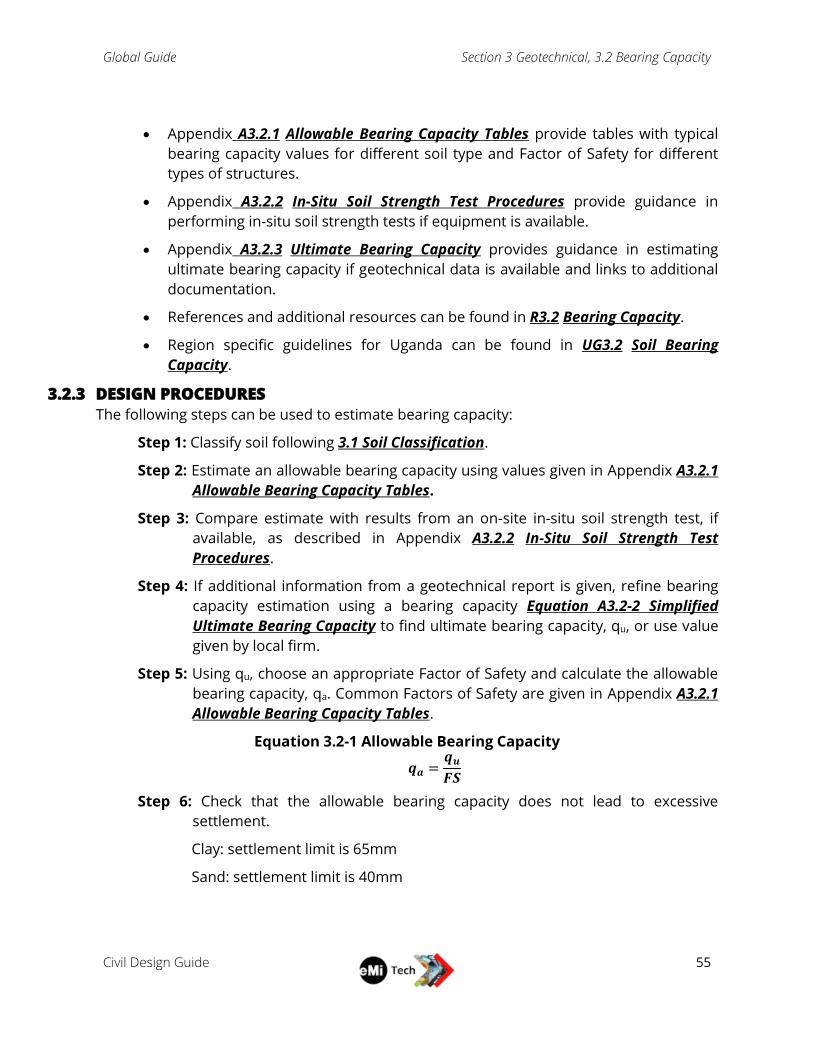
Global Guide Section 3 Geotechnical, 3.2 Bearing Capacity
Civil Design Guide
55
Appendix A3.2.1 Allowable Bearing Capacity Tables provide tables with typical
bearing capacity values for different soil type and Factor of Safety for different
types of structures.
Appendix A3.2.2 In-Situ Soil Strength Test Procedures provide guidance in
performing in-situ soil strength tests if equipment is available.
Appendix A3.2.3 Ultimate Bearing Capacity provides guidance in estimating
ultimate bearing capacity if geotechnical data is available and links to additional
documentation.
References and additional resources can be found in R3.2 Bearing Capacity.
Region specific guidelines for Uganda can be found in UG3.2 Soil Bearing
Capacity.
3.2.3 DESIGN PROCEDURES
The following steps can be used to estimate bearing capacity:
Step 1: Classify soil following 3.1 Soil Classification.
Step 2: Estimate an allowable bearing capacity using values given in Appendix A3.2.1
Allowable Bearing Capacity Tables.
Step 3: Compare estimate with results from an on-site in-situ soil strength test, if
available, as described in Appendix A3.2.2 In-Situ Soil Strength Test
Procedures.
Step 4: If additional information from a geotechnical report is given, refine bearing
capacity estimation using a bearing capacity Equation A3.2-2 Simplified
Ultimate Bearing Capacity to find ultimate bearing capacity, qu, or use value
given by local firm.
Step 5: Using qu, choose an appropriate Factor of Safety and calculate the allowable
bearing capacity, qa. Common Factors of Safety are given in Appendix A3.2.1
Allowable Bearing Capacity Tables.
Equation 3.2-1 Allowable Bearing Capacity
𝒒𝒂 =𝒒𝒖
𝑭𝑺
Step 6: Check that the allowable bearing capacity does not lead to excessive
settlement.
Clay: settlement limit is 65mm
Sand: settlement limit is 40mm
Global Guide Section 3 Geotechnical, 3.3 Soil Absorption Capacity
Civil Design Guide
56
3.3 SOIL ABSORPTION CAPACITY Soil absorption capacity refers to the ability of the soil pores to absorb water and is typically
given as a rate. An understanding of the site specific soil absorption capacity is essential for
designing the on-site wastewater disposal systems and can determine whether a site is
suitable to develop or not. Such information can also be used when designing a soil
absorption system for stormwater management (e.g. infiltration ponds, or rain gardens) or
to assess soils in agricultural areas for suitability.
3.3.1 DESIGN STAGE
A soil’s absorption capacity should be estimated for every EMI project where on-site
wastewater treatment is recommended as the wastewater treatment option.
Frequency of Use: Soil absorption capacity is estimated on most EMI projects.
Conceptual Design: Soil absorption capacity is determined by completing a percolation test
and then comparing this result to an absorption rate estimated using typical absorption rates
based on the soil’s classification.
Detailed Design: Repeat percolation tests and soil classifications performed in the
preliminary design and additional tests at the depths and locations of the proposed
wastewater treatment options. If possible, a detailed geotechnical investigation should be
performed and initial estimates refined using laboratory test results for moisture content,
particle size, and hydraulic conductivity.
3.3.2 DESIGN CRITERIA
A soil’s absorption capacity will help inform where on-site wastewater treatment should be
located on the site. If there is inadequate absorption capacity and no municipal sewage
system, an alternative wastewater treatment and disposal system will be necessary.
The absorption capacity depends primarily on the soil texture, determined by the relative
percentages of clay, silt, sand and gravel and the macro-structure of the soil (i.e., granular,
layered, massive, etc.). Refer to Section 3.1 Soil Classification for more information.
Additional factors include the soil’s consistency, density, in-situ moisture content, depth to
seasonally high ground water table and soil’s potential to experience freeze/thaw.
Acceptable wastewater application rates based on the percolation rates and soil
type/structure have been determined through empirical testing. These empirical
relationships consider the effects of the bacterial biofilm that develops at the
soil/wastewater interface and greatly retards the rate of absorption of wastewater. These
relationships are displayed in a number of tables, some of which are shown in the Appendix
A3.3.2 Application Rates.
Typically, soils primarily comprised of sand and gravel have a higher application rate than
silt and clay. Additionally, soils with high organic content will hold more water, and thus have
a lower application rate than soil with no organic matter. The soil particle’s arrangement in
the undisturbed soil column also has a significant effect on the allowable application rate.
The tables in Appendix A3.3.2 Application Rates include many of these factors.
Global Guide Section 3 Geotechnical, 3.3 Soil Absorption Capacity
Civil Design Guide
57
Non-wastewater applications (groundwater recharge, stormwater disposal, agriculture) that
depend on knowledge of the absorption potential of soil require additional design resources.
The tables provided in the appendix are not applicable. While the direct measurement of
infiltration rates as determined by the percolation test may provide some of the information
needed for these application, additional information may be necessary.
The following resources and tools are to be used when determining the soil’s absorption
capacity.
The Client Needs Assessment and Site Evaluation discussed in Section 1 include
sample guiding questions and evaluation criteria that can inform the soil absorption
capacity project needs and where soil testing should occur at the site.
Appendix A3.3.1 Percolation Test Procedure provide detailed instructions for
performing a percolation test.
Appendix A3.3.2 Application Rates provide tables for typical application rates of
various soils and the influence of other parameters on application rate.
References and additional resources can be found in R3.3 Soil Absorption.
Region specific guidelines for Uganda can be found in UG3.3 Soil Absorption Capacity.
The EMI Soil Testing Field Packet can be printed and taken on the project trip to aid
in classifying soil and ensure all pertinent information is recorded.
The EMI Water and Wastewater Design Template has a tab that calculates the
Percolation test results and aids in determining the Wastewater Application Rate.
3.3.3 DESIGN PROCEDURE
Step 1: Perform a Site Assessment as described in Section 1 paying particular attention
to possible locations for on-site wastewater treatment systems.
Step 2: Perform Percolation Tests as described in Appendix A3.3.1 Percolation Test
Procedure in areas where on-site wastewater treatment systems are
anticipated.
Step 3: Determine the maximum allowable wastewater application rate based on the
Percolation Test results using Table A 3.3-27 Recommended Rates of
Wastewater Application provided in Appendix A3.3.2 Application Rates. This
is the first estimate.
Step 4: Classify soil based on soil texture/structure as described in 3.1 Soil
Classification. The soil profile and macro structure from the surface to below
the intended depth of the absorption system should be classified and
documented. A test pit, 1-2m deep, that exposes the undisturbed soil column
is recommended.
Step 5: Determine the maximum allowable wastewater application rate based on soil
texture/structure using the other Tables provided in Appendix A3.3.2

Global Guide Section 3 Geotechnical, 3.3 Soil Absorption Capacity
Civil Design Guide
58
Application Rates. Use the application rate of the least porous soil layer below
the bottom of the absorption system, because it will likely control the
application rate. This is the second estimate.
It is important to note that additional site characteristics will influence the
application rate including soil depth, structure, landscape position, and type
of wastewater effluent. Use Table A 3.3-30 Influence of Site and Soil
Evaluation Factors on Application Rate in Appendix A3.3.2 Application Rates
to incorporate these influences to refine the application rate estimation.
Step 6: Compare the maximum allowable wastewater application rates from both
estimates to ensure agreement. If rates do not agree, perform the percolation
tests and soil classification tests again. If the two figures still do not agree,
make a conservative engineering judgement as to which value to use and
document the choice.
Underestimation of application rate will cause the size of the treatment and
disposal field to be too small thus leading to early failure.
Overestimation of application rate will cause the size of the treatment and
disposal field to be too large, wasting space and resources.
Global Guide Section 4 Wastewater, 4.1 Wastewater Composition and Quantity
Civil Design Guide
59
4 Wastewater
4.1 WASTEWATER COMPOSITION AND QUANTITY After estimating water demand, it is important to consider how to treat and safely dispose
of wastewater flows. Wastewater composition describes the concentration of dissolved
organic material and suspended solids material in the wastewater. Loading is the weight of
these wastewater components that must be removed from the wastewater per day. The load
is calculated by multiplying the wastewater volume per day by the concentration of the
various constituents that must be removed. The wastewater quantity is derived from the
average water demand estimate by applying a wastewater generation rate (often 85-90%) to
the estimated water demand and adding some amount of flow to account for infiltration and
inflow of storm water.
4.1.1 DESIGN STAGE
Frequency of Use: All EMI projects involving wastewater treatment system designs include
a wastewater composition and quantity. Projects that utilize only septic systems normally
require only the daily wastewater volume to design the system, assuming the wastewater is
typical sanitary sewage. Wastewater composition is not normally an issue, unless the
wastewater in significantly different from normal sanitary wastewater (large fraction of
industrial wastewater).
Conceptual Design: Determine the need for some type of wastewater treatment, beyond
septic systems. When necessary, perform an initial estimate of wastewater composition
based on information about the processes generating the wastewater or laboratory testing
of representative samples of the wastewater. The preliminary estimate of loading can then
be calculated based on the Average Daily Water Demand, multiplied by the wastewater
generation rate.
Detailed Design: Review and refine the initial wastewater quantity estimate along with the
detailed design scope and any applicable masterplan changes to inform required
wastewater treatment system design and other site infrastructure.
4.1.2 DESIGN CRITERIA
An accurate estimate of wastewater composition and load primarily considers the amount
of waste expected from each water use. The wastewater is usually broken down into the
following two categories:
Greywater: wastewater generated from water uses without fecal contamination,
generally all uses except for wastewater from toilets. Sources include sinks, showers,
baths and laundry facilities. Refer to Section 2.4 Greywater Separation and Reuse on
greywater for more information.
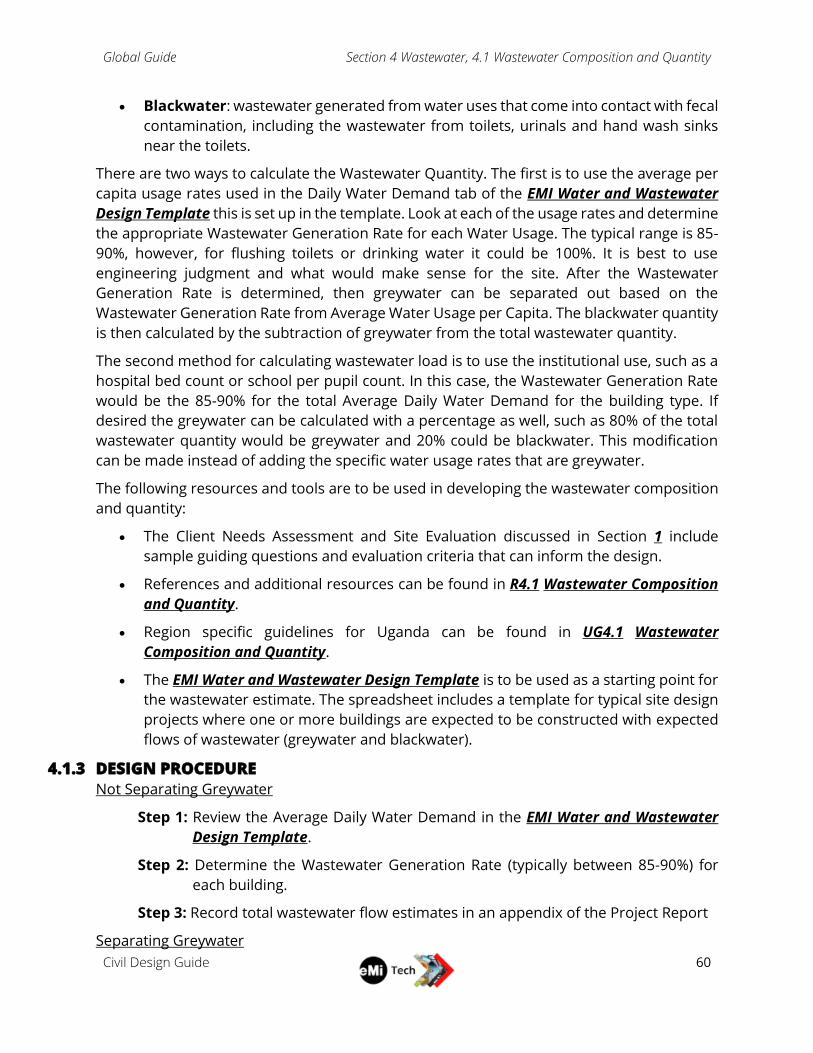
Global Guide Section 4 Wastewater, 4.1 Wastewater Composition and Quantity
Civil Design Guide
60
Blackwater: wastewater generated from water uses that come into contact with fecal
contamination, including the wastewater from toilets, urinals and hand wash sinks
near the toilets.
There are two ways to calculate the Wastewater Quantity. The first is to use the average per
capita usage rates used in the Daily Water Demand tab of the EMI Water and Wastewater
Design Template this is set up in the template. Look at each of the usage rates and determine
the appropriate Wastewater Generation Rate for each Water Usage. The typical range is 85-
90%, however, for flushing toilets or drinking water it could be 100%. It is best to use
engineering judgment and what would make sense for the site. After the Wastewater
Generation Rate is determined, then greywater can be separated out based on the
Wastewater Generation Rate from Average Water Usage per Capita. The blackwater quantity
is then calculated by the subtraction of greywater from the total wastewater quantity.
The second method for calculating wastewater load is to use the institutional use, such as a
hospital bed count or school per pupil count. In this case, the Wastewater Generation Rate
would be the 85-90% for the total Average Daily Water Demand for the building type. If
desired the greywater can be calculated with a percentage as well, such as 80% of the total
wastewater quantity would be greywater and 20% could be blackwater. This modification
can be made instead of adding the specific water usage rates that are greywater.
The following resources and tools are to be used in developing the wastewater composition
and quantity:
The Client Needs Assessment and Site Evaluation discussed in Section 1 include
sample guiding questions and evaluation criteria that can inform the design.
References and additional resources can be found in R4.1 Wastewater Composition
and Quantity.
Region specific guidelines for Uganda can be found in UG4.1 Wastewater
Composition and Quantity.
The EMI Water and Wastewater Design Template is to be used as a starting point for
the wastewater estimate. The spreadsheet includes a template for typical site design
projects where one or more buildings are expected to be constructed with expected
flows of wastewater (greywater and blackwater).
4.1.3 DESIGN PROCEDURE
Not Separating Greywater
Step 1: Review the Average Daily Water Demand in the EMI Water and Wastewater
Design Template.
Step 2: Determine the Wastewater Generation Rate (typically between 85-90%) for
each building.
Step 3: Record total wastewater flow estimates in an appendix of the Project Report
Separating Greywater

Global Guide Section 4 Wastewater, 4.1 Wastewater Composition and Quantity
Civil Design Guide
61
Step 1: Review the Average Daily Water Demand in the EMI Water and Wastewater
Design Template.
Step 2: Determine the Greywater and Blackwater Generation Rate (typically between
85-90%) for each building.
Step 3: Record total wastewater flow estimates in an appendix of the Project Report
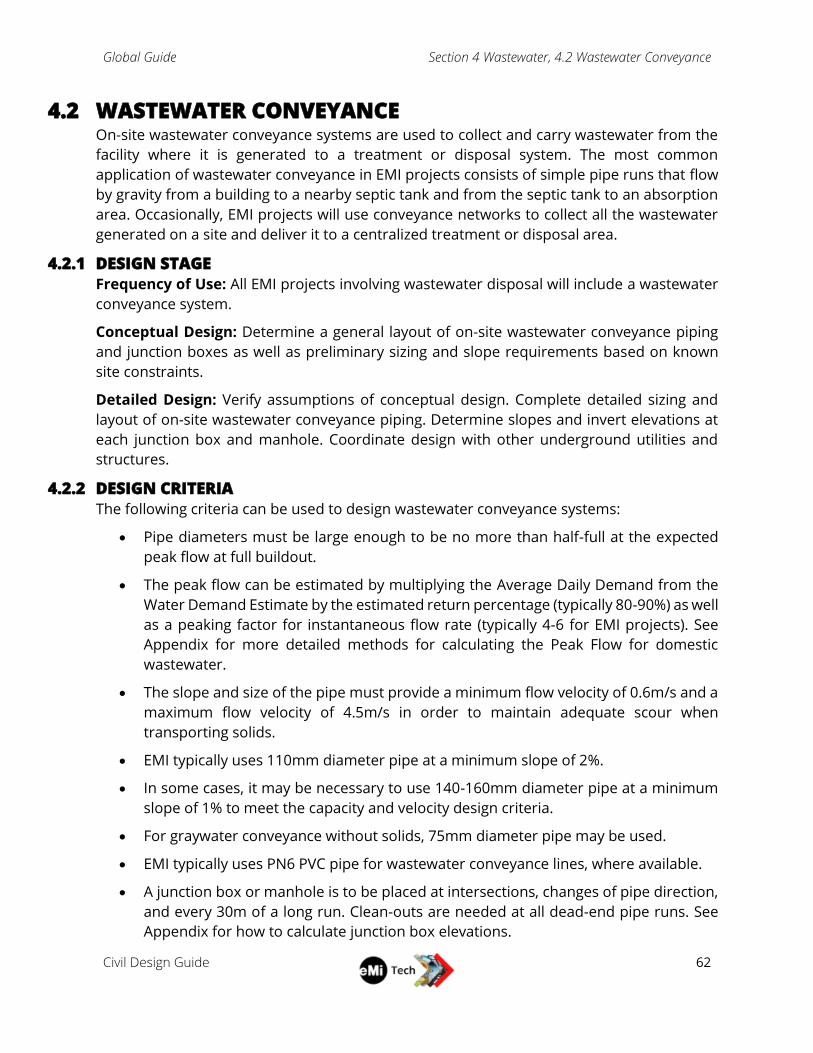
Global Guide Section 4 Wastewater, 4.2 Wastewater Conveyance
Civil Design Guide
62
4.2 WASTEWATER CONVEYANCE On-site wastewater conveyance systems are used to collect and carry wastewater from the
facility where it is generated to a treatment or disposal system. The most common
application of wastewater conveyance in EMI projects consists of simple pipe runs that flow
by gravity from a building to a nearby septic tank and from the septic tank to an absorption
area. Occasionally, EMI projects will use conveyance networks to collect all the wastewater
generated on a site and deliver it to a centralized treatment or disposal area.
4.2.1 DESIGN STAGE
Frequency of Use: All EMI projects involving wastewater disposal will include a wastewater
conveyance system.
Conceptual Design: Determine a general layout of on-site wastewater conveyance piping
and junction boxes as well as preliminary sizing and slope requirements based on known
site constraints.
Detailed Design: Verify assumptions of conceptual design. Complete detailed sizing and
layout of on-site wastewater conveyance piping. Determine slopes and invert elevations at
each junction box and manhole. Coordinate design with other underground utilities and
structures.
4.2.2 DESIGN CRITERIA
The following criteria can be used to design wastewater conveyance systems:
Pipe diameters must be large enough to be no more than half-full at the expected
peak flow at full buildout.
The peak flow can be estimated by multiplying the Average Daily Demand from the
Water Demand Estimate by the estimated return percentage (typically 80-90%) as well
as a peaking factor for instantaneous flow rate (typically 4-6 for EMI projects). See
Appendix for more detailed methods for calculating the Peak Flow for domestic
wastewater.
The slope and size of the pipe must provide a minimum flow velocity of 0.6m/s and a
maximum flow velocity of 4.5m/s in order to maintain adequate scour when
transporting solids.
EMI typically uses 110mm diameter pipe at a minimum slope of 2%.
In some cases, it may be necessary to use 140-160mm diameter pipe at a minimum
slope of 1% to meet the capacity and velocity design criteria.
For graywater conveyance without solids, 75mm diameter pipe may be used.
EMI typically uses PN6 PVC pipe for wastewater conveyance lines, where available.
A junction box or manhole is to be placed at intersections, changes of pipe direction,
and every 30m of a long run. Clean-outs are needed at all dead-end pipe runs. See
Appendix for how to calculate junction box elevations.
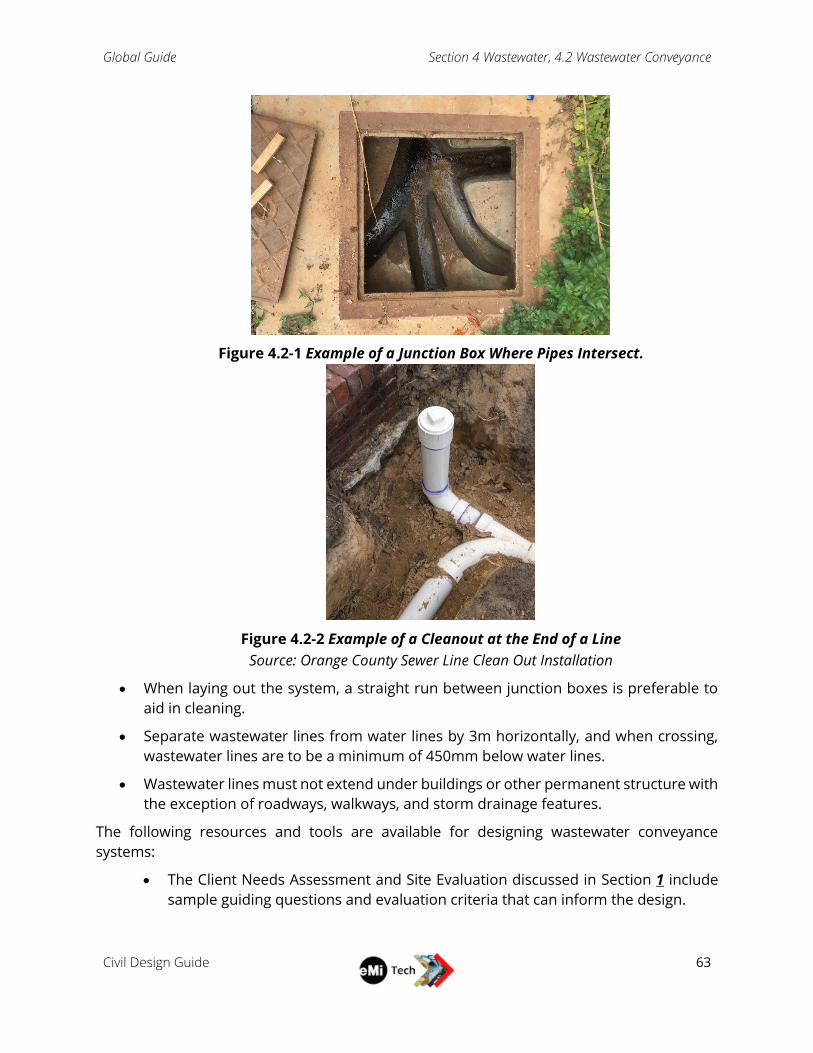
Global Guide Section 4 Wastewater, 4.2 Wastewater Conveyance
Civil Design Guide
63
Figure 4.2-1 Example of a Junction Box Where Pipes Intersect.
Figure 4.2-2 Example of a Cleanout at the End of a Line
Source: Orange County Sewer Line Clean Out Installation
When laying out the system, a straight run between junction boxes is preferable to
aid in cleaning.
Separate wastewater lines from water lines by 3m horizontally, and when crossing,
wastewater lines are to be a minimum of 450mm below water lines.
Wastewater lines must not extend under buildings or other permanent structure with
the exception of roadways, walkways, and storm drainage features.
The following resources and tools are available for designing wastewater conveyance
systems:
The Client Needs Assessment and Site Evaluation discussed in Section 1 include
sample guiding questions and evaluation criteria that can inform the design.
Global Guide Section 4 Wastewater, 4.2 Wastewater Conveyance
Civil Design Guide
64
References and additional resources can be found in R4.2 Wastewater
Conveyance.
Region specific guidelines for Uganda can be found in UG4.2 Wastewater
Conveyance.
The EMI Water and Wastewater Design Template is used to help determine
wastewater system loading.
The EMI Pipe and Channel Sizing Template uses Manning’s Equation to calculate
pipe and channels sizing. This is a detailed tool and not used in concept level
design.
The EMI Wastewater Junction Box Design Template is an example project that
shows how to design junction box elevations. This is a detailed tool and not used
in concept level design.
4.2.3 DESIGN PROCEDURE
Step 1: Identify site constraints and wastewater disposal recommendations to
determine wastewater conveyance needs. See the Client Needs Assessment
and Site Evaluation for more information.
Step 2: Sketch a layout of wastewater conveyance piping from the buildings to the
wastewater disposal areas.
Step 3: Use the information in the EMI Water and Wastewater Design Template to
estimate wastewater loading along proposed conveyance lines.
Step 4: For each facility, estimate the time over which wastewater will be generated to
calculate the average wastewater flow rate in cubic meters per second (m3/s).
Step 5: Apply a peaking factor (typically 4-6 for EMI projects). to the average
wastewater flow rate for an estimate of the instantaneous flow rate.
Step 6: Determine minimum pipe sizing using the EMI Pipe and Channel Sizing
Template.
Step 7: Provide a layout of wastewater conveyance lines on the Proposed Wastewater
Site Plan DWG.
Step 8: Continue to detailed descriptions for detailed design and office specific
applications.
Global Guide Section 4 Wastewater, 4.3 Septic Tanks
Civil Design Guide
65
4.3 SEPTIC TANKS Septic systems including septic tanks are used for on-site treatment and disposal of
wastewater whenever there are no other cost-effective alternatives such as a municipal
wastewater treatment system. Septic tanks, which separate solids and oil/grease in
wastewater streams, are utilized for primary on-site wastewater treatment. Septic tanks
must be accompanied by suitable means of disposal of the treated wastewater, such as an
absorption system, further treatment, or transport.
4.3.1 DESIGN STAGE
Frequency of Use: Almost every project.
Conceptual Design: Due to the importance of knowing early in the design process if a site
is suitable for on-site disposal, preliminary design tasks are usually similar to final design,
except for determining construction details of the septic tanks. The approximate size and
layout of all septic system components needed should be determined during preliminary
design and the systems shown on the Masterplan. Refer to the design manual section on
absorption system design (Section 4.5 On-Site Wastwater Disposal) for determining the
preliminary size for these elements.
Detailed Design: The sizing calculations for the septic tank should be reviewed and updated
as necessary after the architectural program is finalized. septic tank size should be verified
and internal details designed. Carefully document the design process.
4.3.2 DESIGN CRITERIA
Not every site can utilize a conventional septic tank and absorption system for on-site
disposal of wastewater. Review Other Wastewater Solutions (Section 4.7 Other Wastewater
Treatment) for other options to consider.
Septic tanks provide the following:
1. Primary sedimentation to remove suspended solids, as well as oil and grease.
2. Digestion through anaerobic decomposition, which can decompose more than 1/3 of
the original sludge volume.
3. Storage of solids, and grease and oil accumulating between successive cleanings.
The septic tank design used by EMI consists of two chambers, separated by an intermediate
wall. The first chamber removes and stores the bulk of the solids and floating scum. It is sized
to provide 2/3 of the total retention time. The second, which has 1/3 of the total volume,
provides for additional removal of solids and scum. Baffles are required at the inlet and
outlet ends to improve the treatment process.
Since bacteria and viruses remain in sewage effluent from septic tanks, it must be disposed
of through subsurface absorption (see Section 4.5 On-Site Wastwater Disposal) or through
proper treatment and disinfection before being discharged at the surface.
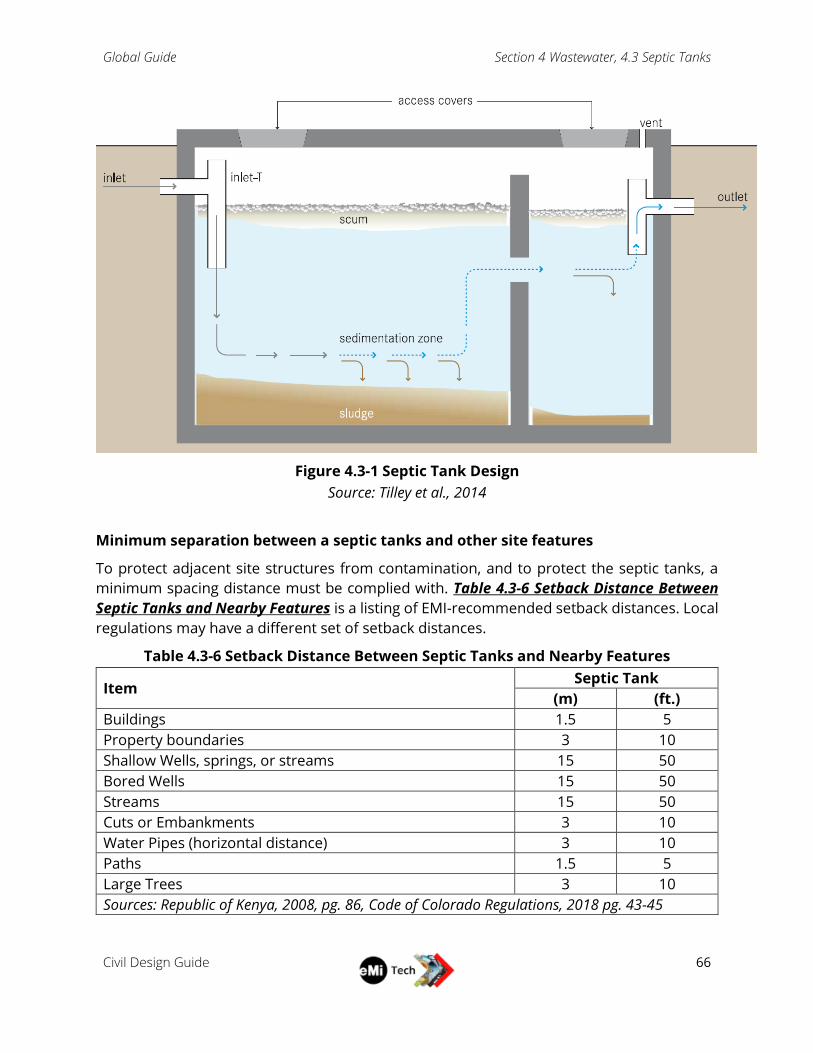
Global Guide Section 4 Wastewater, 4.3 Septic Tanks
Civil Design Guide
66
Figure 4.3-1 Septic Tank Design
Source: Tilley et al., 2014
Minimum separation between a septic tanks and other site features
To protect adjacent site structures from contamination, and to protect the septic tanks, a
minimum spacing distance must be complied with. Table 4.3-6 Setback Distance Between
Septic Tanks and Nearby Features is a listing of EMI-recommended setback distances. Local
regulations may have a different set of setback distances.
Table 4.3-6 Setback Distance Between Septic Tanks and Nearby Features
Item Septic Tank
(m) (ft.)
Buildings 1.5 5
Property boundaries 3 10
Shallow Wells, springs, or streams 15 50
Bored Wells 15 50
Streams 15 50
Cuts or Embankments 3 10
Water Pipes (horizontal distance) 3 10
Paths 1.5 5
Large Trees 3 10
Sources: Republic of Kenya, 2008, pg. 86, Code of Colorado Regulations, 2018 pg. 43-45

Global Guide Section 4 Wastewater, 4.3 Septic Tanks
Civil Design Guide
67
Calculating Septic Tank Volume
A septic tank must have sufficient volume to provide a liquid hydraulic retention time (HRT)
of at least 24 hours when the tank is at maximum scum and sludge storage capacity (not
including stored sludge and scum volume). To ensure adequate volume for sludge and scum
storage, the design HRT is usually 48 to 72 hours. The required volume is based on the
average daily wastewater flow rate. This method is usually accurate for preliminary design.
Size tank for 2 times the daily wastewater flow rate to provide space for sludge and scum.
Equation 4.3-1 Septic Tank Volume
𝑉 = 𝑄 𝑥 2
(where Q = design sewage quantity per day in L/day)
The EMI Water and Wastewater Design Template is used to determine septic tank sizes
based on estimated wastewater volume. The spreadsheet includes calculations using this
method. See Appendix A4.3.1 Alternative Septic Tank Calculations for alternative methods
to calculate the septic tank volume.
The tank water volume calculated does not include the volume of the intermediate wall, the
gas space above the water line, and the water proof cement plaster lining (if used). Septic
tank walls should be as leak-proof as possible, and the walls are usually coated with some
type of waterproof material, such as cement plaster. Ensure the tank design volume takes
these factors into account.
Minimum Septic Tank Size
Regardless of flow, septic tanks should have a minimum internal water volume of between
1,300-3000L, typically 2,000L, to provide adequate space to properly construct the tank and
to allow access into the tank to remove accumulated sludge and scum and maintain
internal components.
Maximum Septic Tank Size
There is no maximum tank size; however, when the required tank water volume is over
20,000L, the use of multiple tanks in parallel, with flow split equally by a flow splitter box,
should be considered. Structural engineers should be consulted for tanks larger than
20,000L.
Material of Construction
Septic tanks can be site-built from reinforced concrete, concrete block, or fired brick.
Manufactured tanks may be available, made from plastic, fiberglass or precast concrete.
Check local availability of manufactured tanks since the quality of manufactured tanks is
usually superior to site-built tanks. Ensure tanks are leak-proof and consider tank buoyancy
to prevent the tank from floating during wet periods. (More information can be found in the
office-specific details.)
Global Guide Section 4 Wastewater, 4.3 Septic Tanks
Civil Design Guide
68
Septic Tank Configuration
Septic tanks are divided into two chambers separated by an interior wall. The first
chamber provides 2/3 of total volume to ensure adequate waste storage capacity.
The tank length is usually 2-3 times the width to minimize short circuiting.
Water depth is usually 1.5m but can range from 1.2-2.0m. The maximum depth is
three times the width.
Tank width is at least 600mm for constructability, and can be up to 2.4m wide.
Inlet and outlet baffles are required and are usually constructed of 4” or 6” PVC plastic
tees. Larger tank may require two or more inlet or outlet tees.
The Inlet tee extends upward to 20% of the water depth above the static water level
and downward below the water level to a depth of 20% of the water depth.
The outlet baffle extends 75mm above the water level and 375mm below the water
depth or 35-40% of water depth.
Provide a minimum 25mm gap between the top of the inlet baffle and underside of
tank top for ventilation. Ensure there is a minimum 75mm gap between the top of
the outlet baffle and the tank top.
Baffles extend into the tank interior far enough to provide 50mm space between the
outside of the baffle and the unfinished tank wall.
The interior baffle wall should have multiple round openings or a rectangular slot
sized keep the water velocity through opening less than 0.1m/s. Typically two 4” pipe
segments, with 90° elbows on the upstream side, are built into the wall. Locate the
openings at 300mm apart with the top of the pipes 150mm below the water surface
(most guidance says at 35-40% of water depth, and 250mm above maximum sludge
depth). Large tanks may require more than two pipes.
The top of the interior wall should extend at least 75mm above the water surface.
Set the inlet pipe invert 75mm above outlet pipe invert (static water level).
Provide access hatches for inspection, desludging and maintenance, above the inlet
and outlet baffles. If the second chamber is over 1.5m long, provide a third access
hatch above the interior wall.
Interior surfaces are sealed with a 25mm thick layer of waterproof cement plaster
applied in two courses. Round interior corners to make cleaning easier. (This is region
specific and could be a different thickness and material.)
The following resources and tools are to be used when designing the On-Site Wastewater
Disposal system:
The Client Needs Assessment and Site Evaluation discussed in Section 1 include
sample guiding questions and evaluation criteria that can inform the design.
Global Guide Section 4 Wastewater, 4.3 Septic Tanks
Civil Design Guide
69
Appendix A4.3.1 Alternative Septic Tank Calculations includes detailed calculations
for septic tank volumes. Equation A4.3-3 Alternative Septic Tank Calculations is not
included in the templates.
Appendix A4.3.2 Maintaining Septic Tank and Absorption Field System provides
guidance for clients to maintain the septic tanks and soak fields.
References and additional resources can be found in R4.3 Septic Tanks.
Region specific guidelines for Uganda can be found in UG4.3 Septic Tanks.
The EMI Water and Wastewater Design Template is used to determine septic tank
sizes based on estimated wastewater volume. The spreadsheet includes calculations
references to Equation 4.3-1 Septic Tank Volume. Be sure to check if greywater is
being separated and not sent to the septic tank.
4.3.3 DESIGN PROCEDURES
Step 1: Establish a preliminary plan for collecting, treating and disposing of
wastewater from the various facilities being designed. The plan will determine
how many septic systems are needed and the general location of the systems.
Small sites with only a few facilities could be handled with a single septic tank
and absorption system, but large complex sites could require many
independent systems due to topography and the building layout.
Step 2: Review wastewater composition, loading and volumes (see Section 4.1
Wastewater Composition and Quantity).
Step 3: Conduct a site assessment to determine if the ground surface elevations allow
for the required minimum 2% slope in the sewer between the source and the
septic tank and a 1% slope between the septic tank and the absorption system.
(This could change the location of the septic tank.)
Step 4: Based on the site assessment results, and in coordination with the
architectural team, produce a preliminary layout of the wastewater treatment
system for the site. Septic tanks are usually installed relatively close to the
source of wastewater to minimize sewer length and reduce the likelihood of
plugging. To prevent damage to the system, and to reduce the likelihood of
exposure to the wastewater, the setback distances in Table 4.3-6 Setback
Distance Between Septic Tanks and Nearby Features must be maintained
between septic tanks and other structures, including water supplies,
structures, stream, lakes and other absorption systems. When selecting the
location for septic tanks, ensure there is adequate room for a vehicle to access
each septic tank to remove accumulated solids and scum.
Step 5: Calculate the sizes of septic tanks. Use the average daily wastewater flow rates
to size the tank. Determine the outside dimension of each septic tank, which
must be large enough to hold the required water, sludge and scum volumes
as well as the intermediate wall, gas space and inner waterproof lining.

Global Guide Section 4 Wastewater, 4.3 Septic Tanks
Civil Design Guide
70
Step 6: Determine the geometry and inner details of the septic tanks during the
detailed design phase. Include the detailed drawings and layout in the
construction drawings.
Global Guide Section 4 Wastewater, 4.4 Grease Interceptor
Civil Design Guide
71
4.4 GREASE INTERCEPTOR Wastewater generated by food preparation contains high levels of organic matter, high
temperatures, detergents, and significant amounts of fats, oil, and grease (FOG). If the FOG
is discharged to an on-site wastewater septic system, the floating layer of FOG will
prematurely fill the portion of the septic tank designed to capture and store floating material,
allowing the FOG to pass through to the absorption system. Excessive FOG in the septic tank
effluent will plug the absorption system soil surface, resulting in premature failure of the
field or leach pit. To ensure the oil and grease does not disrupt the operation of the septic
tank and absorption system, FOG must be removed prior to the septic tank by a grease
interceptor (GI).
4.4.1 DESIGN STAGE
Frequency of Use: Any project with a kitchen serving more than just a few simple meals will
involve grease interceptor design. The clean-up area for dishes may also require a GI, if
separate from the kitchen.
Conceptual Design: Identify location of grease interceptor(s) and provide preliminary sizing.
Detailed Design: Determine size and provide detail drawing(s) of grease interceptor(s).
4.4.2 DESIGN CRITERIA
Location: In determining the location of the grease interceptor, there are three primary
considerations:
1. The GI should be as far upstream as possible. The shorter the length of pipe between
the fixtures and the GI, the lower the chance that grease will cool and solidify within
the pipes. This also reduces the length of pipe that would need to be maintained or
replaced in the event of grease build-up. On a flat site, a longer pipe means a deeper
pipe and GI – increasing the cost of installing and decreasing the ease of maintaining.
For a large facility, multiple GIs may be required: one near each kitchen or wash-up
area.
2. The GI must be accessible by vehicles for regular cleaning. Ensure road access to the
GI.
3. Areas around grease interceptors are often unsightly and can be slippery due to
spilled grease. Try to avoid placing the GI near a highly frequented area, especially
sitting areas. Although grease interceptors can be vented, some can still produce an
unpleasant smell.
Design of a grease interceptor is similar to a septic tank, but has several key differences:
GI tanks are usually smaller than septic tanks and the size is based on an estimate of
the maximum expected flow rate into the tank rather than the average wastewater
volume.
Global Guide Section 4 Wastewater, 4.4 Grease Interceptor
Civil Design Guide
72
In addition to the inlet and outlet, a grease interceptor will use a pipe tee at the baffle
wall instead of an elbow. This allows inspection and cleaning out FOG accumulation
within the pipe as needed.
Instead of extending to the mid-level of the water depth, the pipe tees at the baffle
wall and outlet pipe will extend closer to the bottom of the tank to aid in transporting
solids and maximize space for FOG accumulation.
If desired, a grease interceptor can include a small venting pipe routed to the roof a
nearby structure to reduce the odor seeping through the manhole and cleanout lids.
If a vent pipe is used, the end of the vent pipe should be covered to prevent rainfall
from entering and screened to prevent undesired debris and vermin from entering
the pipe.
Construction techniques
Refer to region-specific design manuals and details.
The following resources and tools are to be used in developing the grease interceptor
design:
The Client Needs Assessment and Site Evaluation discussed in Section 1 include
sample guiding questions and evaluation criteria that can inform the grease
interceptor design.
See Table A 4.4-33 Grease Interceptor Design Parameters in Appendix A4.4 Grease
Interceptors for additional information on design parameters for grease interceptors.
References and additional resources can be found in R4.4 Grease Interceptors.
Region specific guidelines for Uganda can be found in UG4.4 Grease Inceptor.
The EMI Water and Wastewater Template includes a tab for sizing grease
interceptors.
4.4.3 DESIGN PROCEDURE
Before sizing the grease interceptor, complete and review any information in the Client
Needs Assessment and Site Evaluation related to grease interceptors.
Step 1: Calculate maximum instantaneous flow rate (Design Flow Rate) to the grease
interceptor. The flow rate to a given GI can be calculated as shown below:
Equation 4.4-1 Grease Interceptor Design Flowrate
𝑫𝒆𝒔𝒊𝒈𝒏 𝑭𝒍𝒐𝒘 𝑹𝒂𝒕𝒆 = (𝑻𝒐𝒕𝒂𝒍 𝒗𝒐𝒍𝒖𝒎𝒆 𝒐𝒇 𝒔𝒊𝒏𝒌𝒔 𝒙 𝟕𝟓%
𝒕𝒊𝒎𝒆 𝒕𝒐 𝒅𝒓𝒂𝒊𝒏 𝒔𝒊𝒏𝒌𝒔+ (𝒐𝒕𝒉𝒆𝒓 𝒆𝒙𝒑𝒆𝒄𝒕𝒆𝒅 𝒇𝒍𝒐𝒘𝒔))
Time to drain sinks can be taken as 1-2 minutes, depending on the size of sink,
size of drainage pipe leaving the sink, and size of the drain within the sink.
One-minute drainage time will yield a more conservative answer. Other
expected flows may be hand wash sinks or floor drains connected to the
Global Guide Section 4 Wastewater, 4.4 Grease Interceptor
Civil Design Guide
73
grease interceptor and other dishwashing facilities. The flow from these
sources will be relatively small. The 75% factor accounts for sinks not being
completely full.
For conceptual designs, it is unlikely you will know the size of the sink. In this
case you can either find an example kitchen sink in an existing facility or make
a conservative estimate.
Step 2: Determine the required GI volume. This can be determined as below
Equation 4.4-2 Grease Interceptor Volume
𝑮𝑰 𝑽𝒐𝒍𝒖𝒎𝒆 = 𝑫𝒆𝒔𝒊𝒈𝒏 𝒇𝒍𝒐𝒘 𝒓𝒂𝒕𝒆 𝒙 𝟏𝟐𝟓% 𝒙 𝟑𝟎 𝒎𝒊𝒏.
The 125% factor will add additional volume for FOG storage.
Step 3: Determine interior dimensions of grease interceptor to hold design volume.
Make sure to factor in the additional space between the water surface and the
top of the grease interceptor (freeboard). The length must also be at least two
times the width.
It is possible that the design volume may yield a grease interceptor with
dimensions too small to construct with typical build-in-place techniques that
rely on brick and plaster. In this case, the minimum size grease interceptor can
be specified as 0.5m wide, 1.0m long, and 1.0m deep (interior dimensions).
Such a tank would yield a storage volume of approximately 250-400L
(depending on desired freeboard), able to handle maximum design flows of 8-
13 liters per minute. Be aware that using a larger-than-needed grease
interceptor may result in odors due to decomposing food solids that will
collect in the bottom of the tank.
Step 4: Determine location of grease interceptor, accounting for the considerations
mentioned in the Design Criteria (Section 4.4.2). Show on drawings with
accurate dimensions according to the sizing in Step 4, taking into account the
wall thickness to get the outside dimensions. Ensure the location allows for
vehicular access to clean out the tank.
Step 5: Write all assumptions, summarize design, and record results in report. Keep
longer calculations and large tables in the Appendices.
Global Guide Section 4 Wastewater, 4.5 On-Site Wastwater Disposal
Civil Design Guide
74
4.5 ON-SITE WASTWATER DISPOSAL On-site wastewater disposal systems are used on almost every EMI project due to the lack
of alternatives such as municipal wastewater treatment systems. Wastewater is typically sent
through a septic tank prior to being discharged below ground surface where it is absorbed
and treated by the soil and then percolates to the groundwater.
4.5.1 DESIGN STAGE
Frequency of Use: Almost every project.
Conceptual Design: Estimate approximate size and layout of absorption systems using
preliminary estimates of wastewater volume and application rate. Identify possible location
based on site conditions.
Detailed Design: Verify estimates and supplement with additional site investigations as
needed refer to the Client Needs Assessment—Civil, Existing to assist in a thorough site
assessment. Review conceptual drawings and add internal details for the system. Details
include wastewater piping design, distribution box design, elevations of all elements of the
structure and details of any structures. If possible, reevaluate the seasonal high groundwater
table during a period of extended wet weather.
4.5.2 DESIGN CRITERIA
EMI projects typically include an absorption system to provide final treatment of the
wastewater to protect the quality of the groundwater. Absorption is a simple, stable, low cost
method to dispose of wastewater under proper soil conditions since soil is an excellent
treatment medium requiring little wastewater pretreatment. The fields typically consist of an
arrangement of trenches containing perforated pipe and porous material covered by a layer
of soil. The filtration surface along with piping should be flat and systems typically use gravity
distribution. The absorption process is aerobic, so the entire infiltration surface should be
used for treatment.
Septic systems involving on-site absorption should only be considered if the site subsurface
soil has sufficient porosity to absorb the wastewater load, where the seasonally high
groundwater table, bedrock, or any other low-permeability soil layer is at least two meters
below the ground surface, and where there is sufficient land available for siting the
absorption system (including an area reserved for a replacement absorption system), while
complying with the minimum setback requirements, shown in Table 4.5-7 Setback Distance
Between Absorption Systems and Nearby Features.
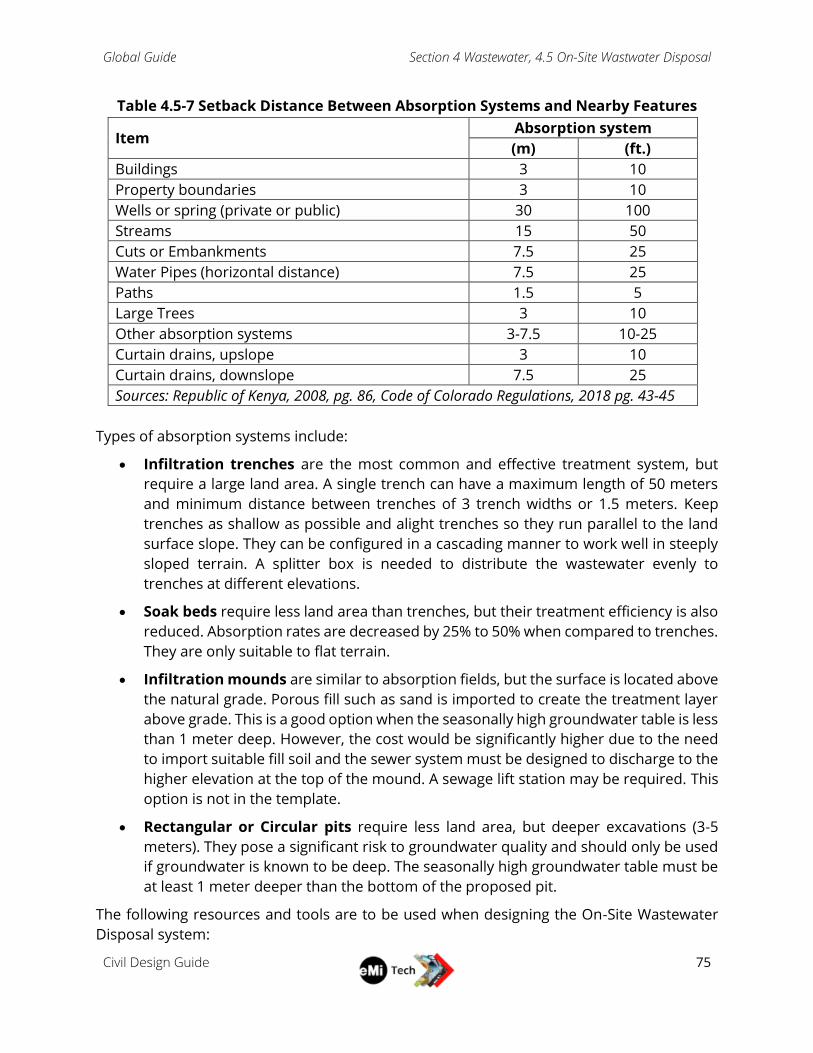
Global Guide Section 4 Wastewater, 4.5 On-Site Wastwater Disposal
Civil Design Guide
75
Table 4.5-7 Setback Distance Between Absorption Systems and Nearby Features
Item Absorption system
(m) (ft.)
Buildings 3 10
Property boundaries 3 10
Wells or spring (private or public) 30 100
Streams 15 50
Cuts or Embankments 7.5 25
Water Pipes (horizontal distance) 7.5 25
Paths 1.5 5
Large Trees 3 10
Other absorption systems 3-7.5 10-25
Curtain drains, upslope 3 10
Curtain drains, downslope 7.5 25
Sources: Republic of Kenya, 2008, pg. 86, Code of Colorado Regulations, 2018 pg. 43-45
Types of absorption systems include:
Infiltration trenches are the most common and effective treatment system, but
require a large land area. A single trench can have a maximum length of 50 meters
and minimum distance between trenches of 3 trench widths or 1.5 meters. Keep
trenches as shallow as possible and alight trenches so they run parallel to the land
surface slope. They can be configured in a cascading manner to work well in steeply
sloped terrain. A splitter box is needed to distribute the wastewater evenly to
trenches at different elevations.
Soak beds require less land area than trenches, but their treatment efficiency is also
reduced. Absorption rates are decreased by 25% to 50% when compared to trenches.
They are only suitable to flat terrain.
Infiltration mounds are similar to absorption fields, but the surface is located above
the natural grade. Porous fill such as sand is imported to create the treatment layer
above grade. This is a good option when the seasonally high groundwater table is less
than 1 meter deep. However, the cost would be significantly higher due to the need
to import suitable fill soil and the sewer system must be designed to discharge to the
higher elevation at the top of the mound. A sewage lift station may be required. This
option is not in the template.
Rectangular or Circular pits require less land area, but deeper excavations (3-5
meters). They pose a significant risk to groundwater quality and should only be used
if groundwater is known to be deep. The seasonally high groundwater table must be
at least 1 meter deeper than the bottom of the proposed pit.
The following resources and tools are to be used when designing the On-Site Wastewater
Disposal system:
Global Guide Section 4 Wastewater, 4.5 On-Site Wastwater Disposal
Civil Design Guide
76
The Client Needs Assessment and Site Evaluation discussed in Section 1 include
sample guiding questions and evaluation criteria that can inform the design.
References and additional resources can be found in R4.5 On-Site Wastewater
Disposal.
Region specific guidelines for Uganda can be found in UG4.5 On-Site Wastewater
Disposal.
The EMI Water and Wastewater Design Template is used to determine the area and
number of systems required for adequate loading. The spreadsheet includes
calculations for infiltration trenches, soak beds, rectangular pits, and circular pits.
4.5.3 DESIGN PROCEDURE
Prior to designing absorption systems, the general configuration of the wastewater
collection, treatment, and disposal system must be known. Depending on the complexity of
the site, the overall wastewater scheme may require only a single disposal system or multiple
systems located through the project site. Each system will need to be designed separately
using information specific to each location.
Step 1: Refer to Section 4.3 Septic Tanks to determine primary treatment method and
design.
Step 2: Perform a site assessment by referring to Section 1. Pay special attention to
site topography in order to ensure the required minimum 1% slope between
septic tank and absorption system can be achieved. Using the site
topographical map, make sure the proposed absorption systems are located
in areas that do not flood or retain rainwater after a storm.
Step 3: Perform one or more soil classification tests, shown in Section 3.1 Soil
Classification, in areas identified previously to verify the feasibility of
absorption field locations. Use test results, and identify the soil type and
structure, to estimate subsurface soil permeability and groundwater
conditions, described in Section 3.3 Soil Absorption Capacity. Percolation tests
should be performed in test holes that are as deep as the bottom of the
proposed system. Follow the test protocol in Appendix A3.3.1 Percolation Test
Procedure as closely as possible since deviations can cause large errors in the
allowable application rate. While testing, note soil texture as shown in
Appendix A3.3.2 Application Rates, depth to seasonally high water table,
depth to bedrock and depth to restrictive layers. Note that suitable soils have
a percolation rate between 1 min/25mm to 60 min/25mm.
Step 4: Determine the maximum allowable wastewater application rate based on
Section 3.3 Soil Absorption Capacity. For pits, average two percolate rates, one
measured at ½ the pit depth and the other at the bottom of the pit. If there
are more than one valid percolation test results for a single area, average the

Global Guide Section 4 Wastewater, 4.5 On-Site Wastwater Disposal
Civil Design Guide
77
results. Chose conservative design application rates during preliminary design
to avoid major changes during detailed design.
Step 5: Determine the type of wastewater absorption system for each disposal site.
Systems must have a minimum of 1 meter of porous unsaturated soil between
the bottom of the system and uppermost limiting layer (impermeable soil,
rock, or seasonally high groundwater table) and uniform wastewater
distribution is required. Additional requirements include no standing water,
flooding, vehicular traffic, or permanent construction over the system. Avoid
placing absorption systems at the base of slopes to avoid subsurface
saturation from groundwater moving down from uphill areas.
Step 6: Determine the size of the absorption system using the EMI Water and
Wastewater Design Template.
Step 7: Confirm location of absorption system with architecture team and check that
the distances shown in Table 4.5-7 Setback Distance Between Absorption
Systems and Nearby Features are met.
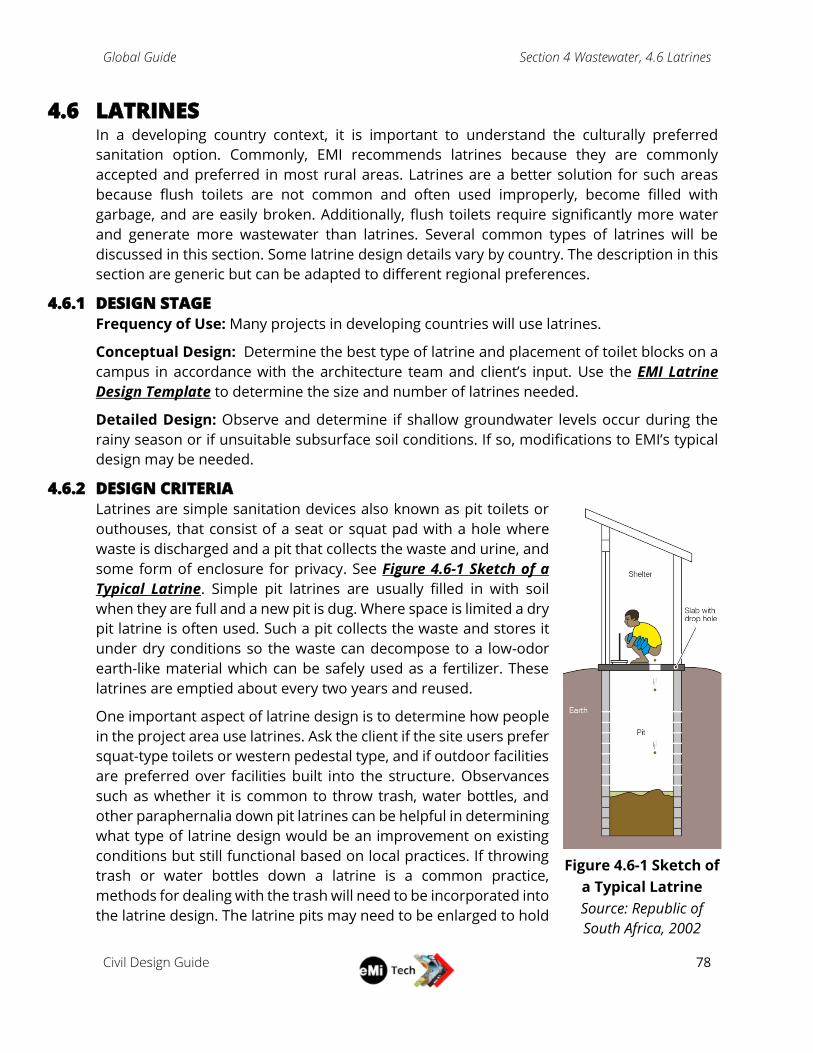
Global Guide Section 4 Wastewater, 4.6 Latrines
Civil Design Guide
78
4.6 LATRINES In a developing country context, it is important to understand the culturally preferred
sanitation option. Commonly, EMI recommends latrines because they are commonly
accepted and preferred in most rural areas. Latrines are a better solution for such areas
because flush toilets are not common and often used improperly, become filled with
garbage, and are easily broken. Additionally, flush toilets require significantly more water
and generate more wastewater than latrines. Several common types of latrines will be
discussed in this section. Some latrine design details vary by country. The description in this
section are generic but can be adapted to different regional preferences.
4.6.1 DESIGN STAGE
Frequency of Use: Many projects in developing countries will use latrines.
Conceptual Design: Determine the best type of latrine and placement of toilet blocks on a
campus in accordance with the architecture team and client’s input. Use the EMI Latrine
Design Template to determine the size and number of latrines needed.
Detailed Design: Observe and determine if shallow groundwater levels occur during the
rainy season or if unsuitable subsurface soil conditions. If so, modifications to EMI’s typical
design may be needed.
4.6.2 DESIGN CRITERIA
Latrines are simple sanitation devices also known as pit toilets or
outhouses, that consist of a seat or squat pad with a hole where
waste is discharged and a pit that collects the waste and urine, and
some form of enclosure for privacy. See Figure 4.6-1 Sketch of a
Typical Latrine. Simple pit latrines are usually filled in with soil
when they are full and a new pit is dug. Where space is limited a dry
pit latrine is often used. Such a pit collects the waste and stores it
under dry conditions so the waste can decompose to a low-odor
earth-like material which can be safely used as a fertilizer. These
latrines are emptied about every two years and reused.
One important aspect of latrine design is to determine how people
in the project area use latrines. Ask the client if the site users prefer
squat-type toilets or western pedestal type, and if outdoor facilities
are preferred over facilities built into the structure. Observances
such as whether it is common to throw trash, water bottles, and
other paraphernalia down pit latrines can be helpful in determining
what type of latrine design would be an improvement on existing
conditions but still functional based on local practices. If throwing
trash or water bottles down a latrine is a common practice,
methods for dealing with the trash will need to be incorporated into
the latrine design. The latrine pits may need to be enlarged to hold
Figure 4.6-1 Sketch of
a Typical Latrine
Source: Republic of
South Africa, 2002
Global Guide Section 4 Wastewater, 4.6 Latrines
Civil Design Guide
79
this debris as well as the human waste. Don’t assume that sanitation habits will change to
suite the latrine design.
Another observation would be to note what population is using each toilet facility. It is
possible that different user groups have different preferences (e.g., western teachers and
staff may have different preferences than students or the local population). Where possible,
each group’s preference should be met so they can use the facilities intuitively. For consistent
group of users, such as staff or students at a school training on how to use an unfamiliar
type of toilet may be more effective than for a transient population of users such as patients
at a clinic that are constantly changing. Where training is possible, a more advanced type of
latrine may be suitable, but the client should agree to this approach.
For example, EMI Uganda has found that the dual vault system they typically specify was not
being used properly at several facilities and was causing more maintenance challenges than
benefits. In accordance with this, EMI amended the latrine design to include only one vault
that would be filled and then cleaned out when full. This reduced construction cost and made
the use and maintenance of the facility simpler, though operating cost will be higher.
If recommending a single vault, it is prudent to determine if they have access to a pump truck
for more frequent clean-out. If recommending a dual vault system, it is critical that
maintenance staff understand and are committed to properly using and maintaining the
two-year rotation of vaults. It is recommended to line the vault walls with concrete but not
the bottom of the vault floor.
As much information about groundwater conditions during the rainy season should be
collected to decide if the latrine pits should be raised higher than the normal depth, French
drains added around the pits, or other considerations that high groundwater may have an
influence on. Previous EMI clients have experienced vaults that have filled with groundwater,
creating odors and interfering with the decomposition of the waste material. Periodically
checking for water or saturated conditions in nearby test holes or construction excavations.
Looking for soil conditions that indicate saturated soil such as wet, organic soil, or wetland
plants may help.
Urine diversion has commonly been implemented into EMI latrine design. Urine diversion
can reduce odor and improve the composting of solid waste in the latrine pit. The collected
urine can be used as a fertilizer if there is a nearby location to use apply material. It has been
found to be more effective for facilities such as dorms where the user population is small
and can be trained and monitored to ensure they use it properly, than for latrines that
service a larger transient population such as a primary school or clinic. In such cases, normal
squat toilet stances, or simple holes in the latrine slab, can be used.
It is recommended to always install urinals in male latrines and it is simple to connect these
urinals to a urine diversion system.
Global Guide Section 4 Wastewater, 4.6 Latrines
Civil Design Guide
80
Sizing Pit Latrines
The EMI Latrine Design Template may be used for assistance with sizing pit latrines. It is
important to ensure accurate information such as the number of users is known before
starting design. Other resources for designing and siting pit latrines can be found in the
references R4.6. It suggests a latrine is located 20 m from the nearest well or stream (EMI
suggests 50 m when possible), 6 m from the nearest dwelling and 3 m from the nearest
property line. WEDC Guides 22 through 30 also provide helpful information on pit latrines.
Consult any applicable local regulations on latrine size and location that may differ from
these common practices.
Types of Latrines
See Appendix A4.6.1 Description Of Types Of Latrines for a detailed description and
advantages and disadvantages of each type of latrine. The most common type of latrine used
will vary by region. Observe local practices to select the type of latrine people are most
familiar with. Some clients may specify other type of latrines, so consult the client before
making this choice. One site may use several different types of latrines for different users.
Ventilated Improved Pit (VIP) Latrine
Double Vault Latrines
Dry Vault Latrine with Urine Diversion (Urine-Diverting Dry Toilet, UDDT)
Compositing Toilets
Pour-Flush and Aqua Privy
Design of Latrines
Latrine design involves estimating the volume of human waste that will need to be stored,
then calculating the pit volume required to hold this volume for the anticipated time interval
between cleaning-out the pits. The type of latrine will determine some of the design
parameters. Dual vault, VIP, and composting latrines are usually designed to hold the waste
generated during a 2-year use period in each vault before they are sealed. For dual pit
latrines, only one vault should be used at a time. Once the first pit is full and sealed, the
second pit is put into use. After 2 more years, the waste in the first vault will be fully
composted and can be emptied and prepared for reuse. Single pit latrines are emptied as
soon as they are full, exposing the workers cleaning the pits to greater amounts of viable
human pathogens and odors. The anticipated time between cleaning out these pits must be
known to properly size them.
Waste generation rates vary by type of latrine, method of anal cleaning, environmental
factors and diet of the community using the latrine. EMI Latrine Design Template will help
with pit sizing; however, this step is usually completed during detailed design and exact pit
sizes may not be needed for the Masterplan.
Conventional latrines, VIP latrines, or composting latrines do not use water, thus there is no
need to estimate wastewater volume or devise a wastewater disposal system. If a pour-flush
Global Guide Section 4 Wastewater, 4.6 Latrines
Civil Design Guide
81
or water-flush toilet system is proposed, the wastewater generated must be included in the
wastewater treatment system design. A soil absorption system may be required for this type
of latrine. If urine separation is included in the design, and use of the urine is not anticipated,
the urine should be routed to a common sewer or dedicated soak pit (no septic tank is
required).
The following resources and tools are to be used in designing latrines for a site:
The Client Needs Assessment and Site Evaluation discussed in Section 1 include
sample guiding questions and evaluation criteria that can inform the latrine
design.
Appendix A4.6.1 Description Of Types Of Latrines provides a description of the
types of latrines.
References and additional resources can be found in R4.6 Latrines.
Region specific guidelines for Uganda can be found in UG4.6 Latrines.
The EMI Latrine Design Template can be used to design the latrine blocks for a
site.
4.6.3 DESIGN PROCEDURES
Step 1: Use A4.6.1 Description Of Types Of Latrines to determine the type of latrine
best suited to the site and client’s cultural background and preferences.
Step 2: Determine how many users of each latrine type are anticipated, how many
latrines of which types will be required, and where latrines will be located on
the site in conjunction with the architectural team. Observe required setback
distances from the latrines and other structures.
Step 3: Use the EMI Latrine Design Template to determine solids storage depth and
number of stalls required. Maximum vault depth is usually 2m. Shallower but
wider vaults may be needed where shallow bedrock or groundwater is present
or anticipated. These details are usually completed during detailed design, but
the number of latrines and approximate size of each latrine block should be
known during the Masterplan stage.
Step 4: Document all information, and sources of that information, used to complete
the preliminary design of the latrines to aid in the dallied design process. Refer
to the region specific details to ensure all information has been considered.
Global Guide Section 4 Wastewater, 4.7 Other Wastewater Treatment
Civil Design Guide
82
4.7 OTHER WASTEWATER TREATMENT Wastewater collection and treatment is a critical element of nearly all EMI projects. Each
project has its own challenges but ideally EMI should consider connecting to a local
wastewater sewer system or designing a septic tanks, described in Section 4.3 Septic Tanks,
and soil absorption systems consisting of soak pits, absorption trenches or absorption fields,
described in Section 4.5 On-Site Wastewater Disposal. However, in some instances the site
conditions or regulatory requirements do not permit such a treatment and disposal system.
In such cases, alternate wastewater treatment system must be considered.
4.7.1 DESIGN STAGE
Frequency of Use: Rarely.
Conceptual Design: Preliminary determination of need for a special wastewater treatment
system.
Detailed Design: Determine wastewater characteristics, evaluate treatment alternatives,
and make the final determination of treatment technology. Conduct final process design,
hydraulic design, and design details.
4.7.2 DESIGN CRITERIA
Site Conditions Requiring Alternative Wastewater Treatment
Site conditions or situations that do not permit the use of typical wastewater disposal
systems include the following. These conditions are usually identified during Site Evaluation
in Section 1.4 performed during the project trip or on subsequent site visits.
1. Seasonally high groundwater table elevation at the proposal location of the soil
absorption system that is less than 2 meters below the ground surface (the bottom
of absorption system must be at least 1m above the seasonally high groundwater
elevation to function properly).
2. Uppermost limiting layer (layer of low-permeability or compacted soil or rock that
interferes with the downward migration of treated wastewater) that is less than 1m
below the bottom of the proposed soil absorption system.
3. Soil immediately below the bottom of the absorption system has a percolation rate
that falls outside of the acceptable range of 1 min/25mm to 60 min/25mm. Less than
1 min/25mm means the soil is too coarse for adequate treatment of wastewater,
result in groundwater contamination. A percolation rate greater than 60 min/25mm
means the soil is not porous enough for the wastewater to migrate away from the
disposal site quickly enough to handle the required wastewater volume. An
excessively large and expensive absorption system would be required under such
conditions. See Section 3.3 Soil Absorption Capacity, A3.3.1 Percolation Test
Procedure and A3.3.2 Application Rates for more information
4. The minimum setback distances between the wastewater disposal system and the
nearest water supply, water pipes, property boundaries, and surface water cannot be
Global Guide Section 4 Wastewater, 4.7 Other Wastewater Treatment
Civil Design Guide
83
satisfied due to the size or configuration of the site. Refer to the Table 4.5-7 Setback
Distance Between Absorption Systems and Nearby Features in Section 4.3 Septic
Tanks.
5. The site contains unsuitable subsurface soil or surface water drainage conditions. Soil
conditions that interfere with on-site wastewater disposal are very fine sands; heavy
clays; expandable clays; organic soil, coarse sand; gravel or fractured rock; or
limestone with solution cavities. Locations on a site that are not suitable for on-site
wastewater disposal are depressions, the foot of slopes, concave slopes, floodplains,
and wetlands.
6. Site topography is such that there is inadequate slope to allow for gravity flow of
wastewater to, though, and away from the septic system, including any absorption
systems. However, land slopes greater than 25% are unsuitable.
7. Site is densely wooded with trees or other vegetation with deep roots.
8. Local regulations prohibit on-site wastewater treatment systems that utilize disposal
of wastewater to the soil column.
9. Site does not have enough suitable land area for the wastewater treatment and
disposal system.
Note: Some of these situations can be mitigated with proper design, such as by installing
curtain drains to depress groundwater depth, excavation of unsuitable soil layers, or use of
shallow trenches and fields, or above-ground mound systems. These are discussed in
Section 4.5 On-Site Wastewater Disposal. However, some of these mitigations could be
costly.
Selecting an Alternative Wastewater Treatment
Almost all alternatives to septic system represent a significant increase in construction and
operating cost, complexity, operator and maintenance personnel sophistication, special
equipment or consumable chemicals, and the need for reliable electricity. Care is needed to
adequately assess the available alternatives to ensure the system proposed is affordable,
operable, sustainable, and will meet the necessary discharge limits.
Several alternative wastewater treatment systems used in resource-poor developing include:
Wastewater treatment lagoons
Constructed wetlands
Evapotranspiration beds
Oxidation ditches
Membrane bioreactors
Anaerobic treatment systems (anaerobic biological filters, anaerobic baffled reactors,
up flow anaerobic sludge blanket systems)

Global Guide Section 4 Wastewater, 4.7 Other Wastewater Treatment
Civil Design Guide
84
Combined treatment systems (DEWATS)
Biogas generator
See https://akvopedia.org/wiki/Sanitation_Portal for descriptions, design considerations,
advantages and disadvantages, and other helpful research. Note that the determination of
which type of treatment systems is optimal for a given site is a complex process that requires
significant amount of site specific information about the wastewater being treated; local
environmental regulations; conditions of the site where the treatment system would be
located; land area available; slope of available land; cost of electrical power, treatment
chemicals, expendable materials, spare parts, and any specialty services required; any many
other aspects.
Because of the rarity of such wastewater treatment systems for EMI projects, there are no
standard design templates or AutoCAD details for these treatment systems. Design
information for such systems will need to be obtained from published literature. Design of
any of these systems requires significant experience and expertise and suitably qualified
engineers who know local regulations and conditions should be consulted prior to selection
and design. It is strongly recommended that the design of wastewater treatment
systems such as these be performed by professional engineers with considerable
experience in their design, construction and operation rather than attempting a
design based solely on published literature. Consider both internal EMI design resources
and external design engineers with experience in the region you are working in. Also
consider the cost implications of using external design resources.
The following resources and tools are to be used in designing an alternative wastewater
treatment system:
The Client Needs Assessment and Site Evaluation discussed in Section 1 include
sample guiding questions and evaluation criteria that can help determine if an
alternative wastewater treatment system is needed.
References and additional resources can be found in R4.7 Other Wastewater
Treatment.
Region specific guidelines for Uganda can be found in UG4.7 Other Wastewater
Treatment.
An example matrix to compare treatment technologies can be created using the
EMI General Treatment Matrix Template. The following information should be
researched for each treatment:
o Methodology
o Product Examples
o Advantages and Disadvantages
o Operational Requirements
o Capital Cost
o Life Cycle Cost
Global Guide Section 4 Wastewater, 4.7 Other Wastewater Treatment
Civil Design Guide
85
4.7.3 DESIGN PROCEDURE
Step 1: Evaluate the project site for the feasibility of utilizing a typical septic system for
on-site wastewater treatment and disposal. Review Section 4.3 Septic Tanks
and the Site Evaluation in Section 1.4. Also explore applicable regulatory
requirements, if there are any.
Step 2: If the site is not suitable for a typical septic system, determine if an alternate
special septic system design could be successful. These include shallow
trenches, mound systems, curtain walls, removal of unsuitable soil layers, or
other alternate approaches discussed in Section 4.5 On-Site Wastewater
Disposal. The septic system section or other sources. These alternate design
are not common in EMI, so exercise caution in proposing such a system.
Ensure adequately trained and experienced personnel are available to
complete the design properly.
Step 3: If an alternative system is not feasible, consider all appropriate wastewater
treatment technologies to propose an alternate to septic system. Also
consider recommending to the client that they look for an alternate location
that allows for on-site wastewater disposal. Such a change could be the most
cost effective and sustainable solution to unsuitable site conditions.
Step 4: Create a EMI General Treatment Matrix Template to help select the preferred
treatment system. To complete the design, use local design professionals or
system vendors if a manufactured system is being considered.
Global Guide Section 5 Site Design, 5.1 Grading and Stormwater Drainage
Civil Design Guide
86
5 Site Design
5.1 GRADING AND STORMWATER DRAINAGE Grading and stormwater evaluation ensures that the site design makes consideration for the
effects of rainfall on the site as well as the impacts of existing and proposed topography on
the buildings and vehicle/pedestrian paths. These investigations are important for
preventing flooding, sizing rainwater harvesting equipment, and protecting against erosion.
They also help to identify the need for stairs, retaining walls, and special grading on the site.
There are several methods for estimating site runoff, but since many people can work on an
EMI project at different times, it is recommended that a typical method be followed and
assumptions documented clearly, so that others can follow the work that was done. Site
grading will depend largely on locally recognized standards for slopes and the ability for local
contractors to perform cut and fill operations on the site.
5.1.1 DESIGN STAGE
Frequency of Use: All EMI projects involving new or expanded buildings will include
information on grading and stormwater drainage.
Conceptual Design: Perform an initial estimate of the expected rainfall for the site; set
preliminary ground floor elevations for proposed structures; identify approximate wall and
stair heights and locations on the site; determine expected drainage flow paths on the site;
and perform preliminary sizing for rainwater storage.
Detailed Design: Review and refine the initial rainfall estimate along with the detailed design
scope and any applicable masterplan changes to inform required site infrastructure and
building plumbing design (gutters, roof downspouts, etc.). Specify the site stormwater
drainage system; including conveyance (pipes, culverts) and any required attenuation
measures (retention ponds, flow controls, etc.); determine slopes and spot elevations for site
features (driveways, parking areas, walls, stairs, etc.).
5.1.2 DESIGN CRITERIA
Generally, building ground floor elevations should be set as closely as possible to existing
grade to minimize cut and fill. The ground surface should slope away from buildings at a
minimum grade of 1% to prevent rainwater from ponding at the foundation and
undermining footings or causing other concerns. A well-designed site considers the effects
of runoff and provides safe pathways for drainage to leave the site, with protections against
erosion as needed. It is important to prevent ponding of storm water on the site to minimize
the breeding of mosquitos, especially in malaria-prone areas. Special consideration must be
taken to analyses grading both on steep sites and on flat sites to ensure that rain water does
not become problematic or interfere with the expected site functions.
An accurate estimate of rainfall for the site will take into account many factors, such as:
Desired design storm;
Global Guide Section 5 Site Design, 5.1 Grading and Stormwater Drainage
Civil Design Guide
87
Historic rainfall data for the region;
Site characteristics (elevation, topography, proximity to oceans, prevailing winds,
etc.);
The degree of detail selected for stormwater calculations depends on the needs of the site
and expected purposes. For sites requiring only preliminary drainage paths and approximate
water storage, and where storm runoff is not expected to be problematic, using regional
monthly rainfall rates may be sufficient. Where harvested rainfall will be used for irrigation
or to offset water use, or if a high erosion or flooding potential exists on the site, more
detailed calculations to determine runoff should be undertaken.
Design Tips:
Wherever possible, limit retaining wall height to 1m (use multiple staggered walls for
bigger grade differences). As a general rule, the horizontal spacing between multiple
staggered walls should not be less than two times the height of the lower wall. Where
walls over 1m in height are unavoidable, seek input from a structural engineer and
communicate to the owner the importance of adhering to design details in
construction of site walls.
In general, designed slopes should not exceed 3H:1V. Exceptions are made for
reinforced slopes.
Design for exceedance by considering the scenarios of extreme rain events that
exceed the design storm, and also may consider additional risks from off site.
International Standards for Accessible Construction and local accessibility standards
should be consulted in identifying site layout and grading features such as widths and
slopes for exterior pathways, ramp and stair standards, and building access.
(Chapters 10 and 11 of the International Building Code (IBC) discuss requirements for
accessibility and is free online https://codes.iccsafe.org/content/IBC2018.)
The following resources and tools are to be used in developing the grading plan and
stormwater runoff estimate:
The Client Needs Assessment and Site Evaluation discussed in Section 1 include
sample guiding questions and evaluation criteria that can inform important grading
and drainage design components such as the selection of design storm, desirability
of stairs in building access, and need for accessible design considerations.
References and additional resources can be found in R5.1 Grading and Stormwater
Drainage.
Region specific guidelines for Uganda can be found in UG5.1 Grading and Stormwater
Drainage.
Monthly average rainfall data for the nearest available location using a reputable
website such as https://www.weather-atlas.com/en/climate. Where possible,
average results from multiple sources.
Global Guide Section 5 Site Design, 5.1 Grading and Stormwater Drainage
Civil Design Guide
88
The EMI IDF Analysis Template should be used to generate rainfall values where more
detailed storm system sizing calculations are needed, or where EMI anticipates
moving into detailed design. The spreadsheet generates overall rainfall for multiple
storm frequencies, as well as adjustments in intensity for each frequency based on
typical storm durations.
The EMI Stormwater Runoff Template can be used to estimate a drainage plan for
the site.
The International Building Code 2018 is available online for free:
https://codes.iccsafe.org/content/IBC2018
5.1.3 DESIGN PROCEDURE
Step 1: Review the information in Client Needs Assessment and Site Evaluation.
Step 2: Determine project lifecycle and phasing.
Step 3: Identify expected rainfall using monthly averages, or the EMI IDF Analysis
Template. Use office-specific detailed descriptions, Site Evaluation discussed
in Section 1 and other observations from client meetings to determine which
method to use, and (if using IDF) what design storm is appropriate.
Step 4: Determine building ground-floor elevations and general slopes around the
site. Provide this information in a CAD file, or hand marked on the site plan.
Include drainage arrows for expected flow directions, and dashed lines for
locations of constructed channels.
Step 5: Evaluate topography of the surrounding area to determine locations of run-on
from neighboring properties. Determine locations and types of systems to
safely convey this water off-site using the EMI Stormwater Runoff Template.
Step 6: Locate and size site storm water system.
Step 7: Provide all calculations related to rainfall in the report Appendices.
Global Guide Section 5 Site Design, 5.2 Roadways
Civil Design Guide
89
5.2 ROADWAYS While much of the master planning layout of the site will be performed by the architecture
team, the civil team should be involved in the process. Most EMI projects do not have a
complicated vehicular circulation pattern, often there is a short access road leading to a
parking lot. Most often, EMI designs involve onsite private roads and so EMI is not bound by
design codes. Determining the road design and layout is an exercise in engineering judgment
and will depend on the intended use of the road, the size and slope of the site. If designing
a public road, consult with the local design codes to determine governing requirements.
5.2.1 DESIGN STAGE
Frequency of Use: During a master plan or any project that has a site layout.
Conceptual Design: An initial assessment of vehicular circulation through the site. This
should include the layout of proposed and existing roadways, a preliminary typical road
cross section with widths defined, and parking areas should be identified with approximate
sizes needed.
Detailed Design: Roadways plans are further developed in close collaboration with grading
and drainage plans. The typical cross sections should show widths, cross slopes, drainage
swales or ditches and culverts should be designed based upon estimated peak flows from
drainage areas as necessary. This should include a pavement section design in most cases.
5.2.2 DESIGN CRITERIA
There are several factors to consider such as:
Vehicular access: determine from the Section 1 checklists which questions are
relevant to the master plan;
Roadway wearing course material see the recommendations below.
Horizontal design— see the recommendations below;
Vertical design—see the recommendations below;
Drainage plan based on Section 5.1 Grading and Stormwater Drainage;
Anticipated frequency and type of vehicles entering the site
Facilities requiring access (kitchen, septic tanks for maintenance, etc.)
Pavement subgrade consistency and uniformity
Base and subbase material and compaction
Vehicular Circulation
Any areas where special access is needed (i.e. Kitchen deliveries, maintenance trucks
for septic tanks, water facilities, etc.)
Any needs for multiple entrances
Global Guide Section 5 Site Design, 5.2 Roadways
Civil Design Guide
90
Site conditions, soil types, grades, wet areas, drainage patterns which might make
some areas unsuitable for roadways
Parking and parking traffic
Roadway Wearing Course Material
Typical materials are listed below:
Murram is gravel road with clay binder elsewhere (clay typically comprises about 3 to
12 percent of the material by weight), this term is common in sub-Saharan Africa.
Tarmac is typically crushed rock mixed with tar (contraction of tarmacadam), and is a
term commonly used for airport taxiways and parking areas (although most of these
are concrete now).
Macadam is a gravel road treated with either oil or tar to provide a hard surface for
all-weather use.
Gravel. A good quality gravel (or murram) for roads should have sound, angular gravel
with a maximum size of 20 to 50 mm, with a silt-clay binder content of about 3 to 12
percent by weight.
Asphalt: The local asphalt mix should be a fair recommendation.
Paving stones.
Concrete.
Most EMI projects specify the use of a compacted murram, or gravel, wearing course. On
some sites, high-quality murram (a clay/gravel mixture) will be available onsite for
harvesting, but on most sites, high-quality murram, or roadway gravel, should be imported.
EMI typically recommends a compacted gravel surface of 150 mm thickness is sufficient if
the subgrade is adequate. If subgrade is soft, or if heavy truck traffic is anticipated, then the
gravel thickness might need to be 225 mm, or more. If asphalt, or concrete, is used for
pavement, typically it has a sub-base layer over the subgrade, which is similar to a compacted
gravel road material. This requires subgrade information such as CBR (California Bearing
Ratio), or subgrade modulus etc. and requires more site geotechnical information to design.
For a tarmac or macadam pavement, a sub-base layer is typically not used because such
surfaces are just improved, or hardened, gravel roads. Some areas, such as Rwanda, have
used paving stones which area a good option if local practices and materials allow. The
designer can look at roads coming up to the site, checking for thickness of asphalt and if any
sort of base course is under it.
The use of higher quality finishing materials (paving stones, tarmac, or asphalt) may be
requested by the ministry. EMI currently does not have specific tarmac paving design
standards and the engineer will have to evaluate materials and make a site-specific
recommendation in cases where tarmac, asphalt or concrete is requested.
Global Guide Section 5 Site Design, 5.2 Roadways
Civil Design Guide
91
Note that site topography is very important, particularly if the access road, or site roads, are
in a mountainous area and the road sections need to be constructed with cut and compacted
fill with downslope stabilization or retaining walls.
Horizontal Design Considerations
If the road is short, and there is not much likelihood of vehicles meeting each other
head-to-head, then 3.0 meters is an acceptable road width. If the area adjacent to the
roadway is flat and clear, it may be acceptable to expect vehicles to pull to the side of
the road when passing is needed.
If the road is long, and possibly busy, with a higher likelihood of vehicles meeting each
other, consider a 6.0-meter-wide roadway. This would allow vehicles to pass each
other without pulling off of the road, but would require them to slow down and pass
carefully.
If higher speed passing is necessary, the roadway should be a minimum of 7.5-m
width for this type of roadway (two 12-ft, 3.65-m, wide lanes is standard in US and
much of the world especially if two-way truck traffic is required).
Most EMI-designed roads are not high-speed roads and do not require detailed
consideration for other horizontal design parameters related to design speeds and
site distances. Engineering judgment should be used when determining curve radii
and if access roads to a site will have public traffic with speeds over 50 km/hr, regional
codes should be consulted to determine horizontal curve radii. For site roads,
passenger vehicles might only need curve radii of about 6m while trucks might
require curve radii of 10m or more. If particularly tight corners are needed, or the
roadway will serve large vehicles, some EMI offices may have access to software
packaged with Civil 3D that will allow the designer to run various vehicles through a
roadway and check for clearances.
Vertical Design Considerations
Vertical roadway design for private, onsite roads will be dependent on the engineering
judgment of the designer.
If possible, roadways should maintain a slope of 10% or less. Short reaches of access
roads or driveways may be up to 12% if the surfacing is adequate. Steeper roadways
may be acceptable, but will require special consideration based on the type of vehicle
expected to use the road. (If any projects are in areas where it can be icy, then slopes
should be flatter than 10%.
Roadways of 10% or less may be finished with compacted clay/gravel mixture on
steeper roadways, asphalt pavement or pavers should be considered to help avoid
tire slipping.
Special consideration should be given in areas where the vertical design of the road
experiences a large grade change – vertical curves may be needed in this area. For example,
Global Guide Section 5 Site Design, 5.2 Roadways
Civil Design Guide
92
if a roadway is running flat, at 0.0%, and then suddenly transitions to a 12% climb, this
transition should be achieved through either a vertical curve or a carefully laid out series of
grade changes so that vehicles do not scrape bottom while navigating the grade change.
Vertical curves may be needed on top of curbs to ensure sight distance, especially if
pedestrians and vehicles share roads.
Drainage Considerations
Roadway layout should be considered in close collaboration with drainage design, see
Section 5.1 Grading and Stormwater Drainage. Most gravel roads will function nicely if they
are graded properly and drain. Thus, considering how water will flow across the site and
road is important. Roadways often cut across the site and block drainage channels. If clear
points are not identified for culverts or grated channels to allow water to cross the road, the
road will either act as a dam or prevent water from flowing, or water will flow across the road
and cause ruts and potholes. If the road is not crowned, the road may become the drainage
channel.
Most roads on EMI projects are relatively narrow roads placed along a slope. In this scenario
it is often advisable to have the cross slope of the road slope in a single direction, rather than
crowning the road. The cross slope of the road should follow the slope of the site to limit the
grading requirement. Asphalt or concrete pavements (or tarmac or macadam) should have
a surface drainage slope, or crown slope, of 2% minimum, and gravel (or murram) roads
should have a surface drainage slope of at least 3%.
If there is a significant area of land and development (either onsite or offsite) on the uphill
side of the road or if the road has drainage from an adjacent hillside, a ditch should be placed
along the uphill side of the road to collect this runoff and direct it to a crossing point and
culverts should typically be designed to convey runoff from an uphill drainage ditch under
the roadway to prevent washouts. This ditch will protect the road from the uphill runoff
which would deteriorate the roadway surface. On the downhill side of the road,
consideration should be given for how the runoff from the road will be handled. If there are
buildings located near the road, on the downhill side, a roadside ditch may be needed to
catch the roadway runoff and carry it to a discharge point. If there is sufficient landscaped
area along the downhill side of the road, it may be appropriate to allow the runoff from the
road to sheet-flow off of the road and flow into the landscaping. If this is the intention, care
should be taken during construction to ensure that there is a flush connection between the
roadway surface and the adjacent landscaping, it the contractor leave a berm of cut in this
area, the water will not enter the landscaping and will run along the edge of the road, causing
erosion.
The following resources and tools are to be used in developing the roadways for the site:
The Client Needs Assessment and Site Evaluation discussed in Section 1 include
sample guiding questions and evaluation criteria that can inform the roadway
design.
References and additional resources can be found in R5.2 Roadways.
Global Guide Section 5 Site Design, 5.2 Roadways
Civil Design Guide
93
Region specific guidelines for Uganda can be found in UG5.2 Roadways.
5.2.3 DESIGN PROCEDURE
Step 1: Work with architecture team to develop a vehicle circulation plan for the site.
Step 2: Determine the width of each roadway on site. Deciding on road widths will
require engineering judgment.
Step 3: Determine the material that will be used for the roadway surface based on the
vertical design considerations.
Step 4: Develop a site drainage plan and ensure that the roadway layout fits in with
this plan. Be sure to specify culvert crossings at key points.
Step 5: In coordination with the drainage plan, draw a roadway section for key
portions of the road.
Step 6: Refine the horizontal layout of the road based on modeling software, if
available.
Step 7: Consider the vertical layout of the road.
Step 8: Pavement section design, including drainage structures and embankment
design as necessary.
Global Guide Section 5 Site Design, 5.3 Retaining Wall Design
Civil Design Guide
94
5.3 RETAINING WALL DESIGN Retaining walls are structures primarily used to hold soil to a slope it would not naturally
keep. They may also be used to mitigate soil erosion, expand the useable area of a sloped
site, protect facilities below a slope, and prevent soil collapse and settlement. In the
developing world, retaining walls are typically constructed from reinforced concrete, timber
logs, concrete blocks, brick, stone, reinforced earth or a combination of the above materials.
Soldier pile walls with steel piles or lagging are also used in some areas. Soil nails or shotcrete
walls are uncommon but available in some regions.
5.3.1 DESIGN STAGE
EMI typically recommends that sites are developed in a manner which avoids or minimizes
the need for retaining walls. Walls less than 1m in height are typically recommended during
conceptual design.
Frequency of Use: Varies depending on site topography.
Conceptual Design: If necessary, identify proposed retaining wall locations, type and
perform initial calculations to estimate size based on preliminary soil data from the site
investigation or geotechnical report if obtained. Defer to conservative standards of locally
practiced methods if retaining walls are commonly used locally.
Detailed Design: Refine initial calculations and develop construction documents if using
reinforced concrete. A site-specific geotechnical report should be obtained. Use the
applicable regional and national codes and ensure proper licensing requirements are met.
5.3.2 DESIGN CRITERIA
Types of retaining walls include:
Gravity Retaining Wall: Depends on self-weight, base interface friction, and passive
earth pressure to resist lateral earth pressure; typically, economical up to a height of
3m. Can include stacked stone, masonry, or concrete blocks, and gabion basket
system (wire meshes cages filled with rock).
Cantilever Retaining Wall: Composed of a vertical stem wall, horizontal base slab,
and sometimes a shear key to resist sliding. It requires a thinner section of concrete
than a gravity wall but is more complex and expensive to construct, since it must resist
the moment applied by active earth pressure. Typically, economical up to height of
8m.
Piled Retaining Wall: Constructed by driving piles or drilling caissons along the
length of the slope to be retained. Piles may be driven at close spacing, or have
additional elements inserted between each pile to create a solid wall face. Sheet pile
wall can also be used to protect adjoining structures or as a temporary measure.
Typically, economical up to a height of 6m.
Global Guide Section 5 Site Design, 5.3 Retaining Wall Design
Civil Design Guide
95
Mechanically Stabilized Earth (MSE) Retaining Wall: A wall face is backfilled with
select granular material layered with reinforcements (either metallic strips or plastic
geogrids); economical where available, but not universally used or familiar.
Anchored Retaining Wall: Deep cable rods or wires are installed deep into the earth
and the ends are filled with concrete to provide an anchor. Suitable for loose soil over
rocks and best employed when space is limited or a thin retaining wall is required.
Note that different types of retaining walls will require substantially different analysis,
details, and construction methods. However, all retaining walls depend heavily on good
drainage design. A majority of retaining wall failures can be attributed to poor drainage.
Soil parameters required for design are:
Soil Classification
Unit Weight
Wall & Base Interface Friction
Angles
Strength Parameters such as:
Soil Friction Angle and Cohesion
Undrained Shear Strength
Soil Layer Depth
Site parameters required for
design are
Retained soil height
Location of water table (and
seasonal variation)
Local stormwater runoff and
drainage
Site seismic acceleration
Construction access to the slope
Material availability and properties
Site Slope (i.e. slope cross section)
Surcharge loads from adjacent
structures or live loads.
Types of Structural Failure:
Sliding Failure: evident when the wall moves away from the retained soil because the
horizontal driving forces are greater than the resisting forces.
Overturning Failure (eccentricity): evident when the wall rotates about its front edge because
the sum of the moments causing overturning is greater than the sum of the moments
resisting overturning.
Bearing Failure: evident by soil failure below the wall caused by excessive vertical live loads,
surcharge loads, and induced incremental seismic stresses.
Structural Failure: evident by excessive cracking or deflection in the vertical wall of the
retaining structure. The wall is not adequately designed for the applied moment.
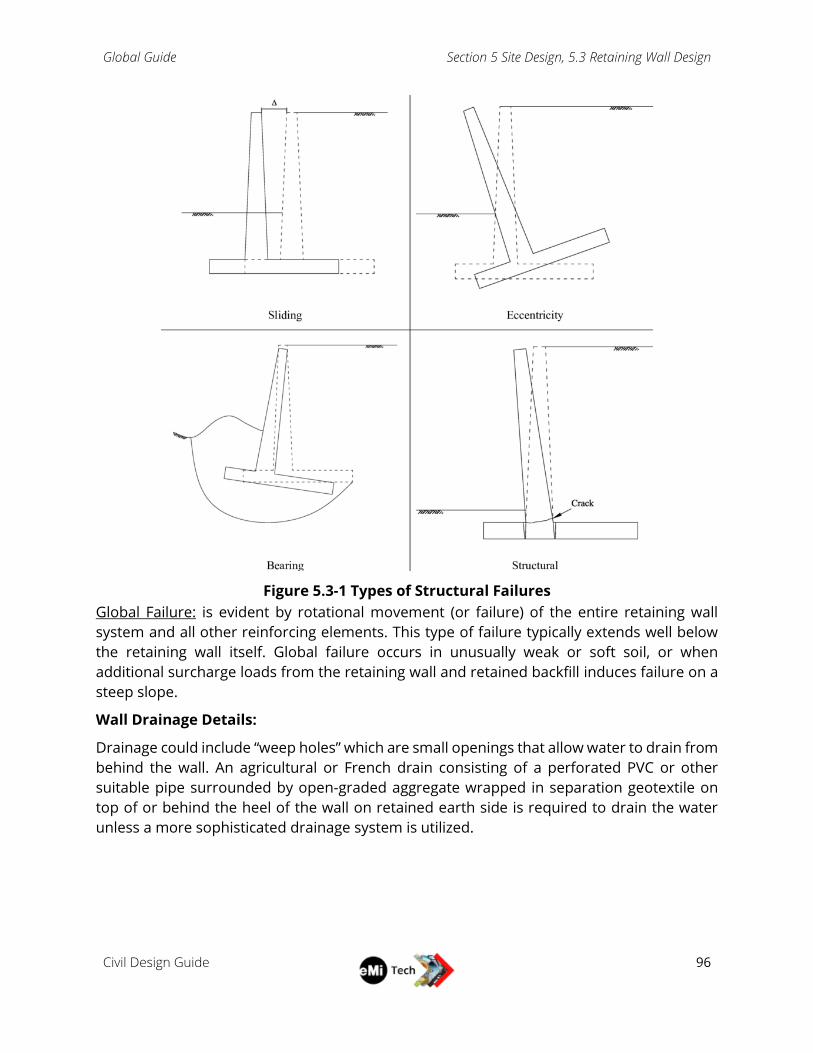
Global Guide Section 5 Site Design, 5.3 Retaining Wall Design
Civil Design Guide
96
Figure 5.3-1 Types of Structural Failures
Global Failure: is evident by rotational movement (or failure) of the entire retaining wall
system and all other reinforcing elements. This type of failure typically extends well below
the retaining wall itself. Global failure occurs in unusually weak or soft soil, or when
additional surcharge loads from the retaining wall and retained backfill induces failure on a
steep slope.
Wall Drainage Details:
Drainage could include “weep holes” which are small openings that allow water to drain from
behind the wall. An agricultural or French drain consisting of a perforated PVC or other
suitable pipe surrounded by open-graded aggregate wrapped in separation geotextile on
top of or behind the heel of the wall on retained earth side is required to drain the water
unless a more sophisticated drainage system is utilized.
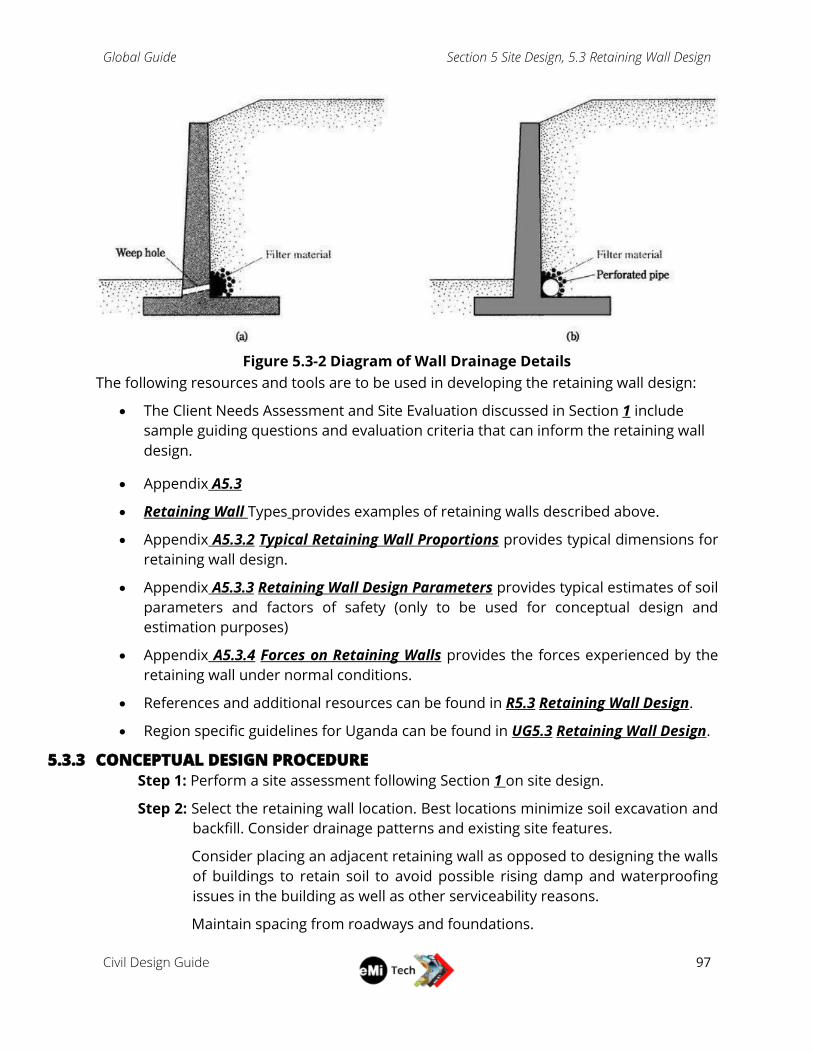
Global Guide Section 5 Site Design, 5.3 Retaining Wall Design
Civil Design Guide
97
Figure 5.3-2 Diagram of Wall Drainage Details
The following resources and tools are to be used in developing the retaining wall design:
The Client Needs Assessment and Site Evaluation discussed in Section 1 include
sample guiding questions and evaluation criteria that can inform the retaining wall
design.
Appendix A5.3
Retaining Wall Types provides examples of retaining walls described above.
Appendix A5.3.2 Typical Retaining Wall Proportions provides typical dimensions for
retaining wall design.
Appendix A5.3.3 Retaining Wall Design Parameters provides typical estimates of soil
parameters and factors of safety (only to be used for conceptual design and
estimation purposes)
Appendix A5.3.4 Forces on Retaining Walls provides the forces experienced by the
retaining wall under normal conditions.
References and additional resources can be found in R5.3 Retaining Wall Design.
Region specific guidelines for Uganda can be found in UG5.3 Retaining Wall Design.
5.3.3 CONCEPTUAL DESIGN PROCEDURE
Step 1: Perform a site assessment following Section 1 on site design.
Step 2: Select the retaining wall location. Best locations minimize soil excavation and
backfill. Consider drainage patterns and existing site features.
Consider placing an adjacent retaining wall as opposed to designing the walls
of buildings to retain soil to avoid possible rising damp and waterproofing
issues in the building as well as other serviceability reasons.
Maintain spacing from roadways and foundations.

Global Guide Section 5 Site Design, 5.3 Retaining Wall Design
Civil Design Guide
98
Step 3: Evaluate if surcharges due to vehicular traffic or adjacent structures will be
applied to the wall. Where possible, avoid locations with heavy surcharge
loads interacting with walls.
Step 4: Determine soil parameters, see Table A 5.3-34 Typical Soil Properties.
Step 5: Determine the optimal type of retaining wall for the site based on local
practices and site demands, Appendix A5.3
Retaining Wall Types.
Step 6: Determine retaining wall geometry using Appendix A5.3.2 Typical Retaining
Wall Proportions for guidance.
Step 7: Check for failure modes see Figure 5.3-1 Types of Structural Failures.
Step 8: Design site drainage and provide wall drainage details to minimize effects of
water on wall stability, see Figure 5.3-2 Diagram of Wall Drainage Details.
Global Guide Section 5 Site Design, 5.4 Site Layout, Access and Parking
Civil Design Guide
99
5.4 SITE LAYOUT, ACCESS AND PARKING Although the architectural concept often drives the site layout, many important
factors influence final placement of site features, and the civil team should provide
input into the master plan early in the process to ensure important factors are not
overlooked. Civil input will ensure that adequate space is reserved in appropriate
locations for utility infrastructure, assess feasibility and appropriate placement of
access point(s), and confirm that adequate parking is included to meet the needs of
the program. The design guidance from the other Civil Sections (water, wastewater,
grading, roadways, etc.) will inform this section.
5.4.1 DESIGN STAGE
Frequency of Use: All EMI projects should evaluate site layout, access and parking.
Conceptual Design: Evaluate placement and orientation of all site components in
conjunction with architecture team; confirm setback, maximum building coverage,
building height, or other local requirements are followed; coordinate locations and
approximate sizing for site infrastructure (water, wastewater, solar, storm drainage,
storage tanks, trash collection, etc.); evaluate or design vehicle and pedestrian access
point(s); and locate and size parking areas.
Detailed Design: Review and refine the initial layout along with the detailed design
scope and any applicable masterplan changes. Confirm locations and space
requirements for site infrastructure based on detailed design of those systems; verify
parking numbers and locations, and design parking lots (including maneuvering
spaces); verify sight distance and vehicle maneuvering is achieved at all access points
to and within the site; coordinate with site grading, utilities, waste management, and
architecture as necessary.
Phasing Considerations: If the site is existing, and the ministry is expanding, phasing
of proposed changes will need to be considered. Can construction happen when
school is not in session, for example? If the ministry must remain open, access will
need to be considered during the construction phases. In addition, staging areas for
construction material storage should be considered. Final design may need to be
adjusted to make construction easier.
5.4.2 DESIGN CRITERIA
Effective site layout should consider not only the buildings on the site, but also all of
the supporting features required for the site to function as intended. This includes
utility systems (water, wastewater, electrical, etc.), trash storage and collection,
staging areas, vehicle types needing access to various parts of the site, required
parking areas, security, etc.
Wind direction is an important factor to consider for site placement of features such
as wastewater treatment facilities, trash storage or on-site refuse burning. Avoid
placement or provide sufficient screening for locations that would direct odors or
Global Guide Section 5 Site Design, 5.4 Site Layout, Access and Parking
Civil Design Guide
100
smoke towards ventilated or frequently populated areas. Coordinate with Section 6.2
Solid Waste Disposal.
Grading of the site should be taken into account when placing facilities that rely on
gravity to perform their functions. Infiltration systems and stormwater ponds will
usually be placed at the low end of the site, while water storage facilities will typically
be placed at the higher end. It may be prudent to evaluate the surrounding watershed
to determine stormwater runoff that occurs from upslope of the project site. Refer to
Section 5.1 Grading and Stormwater Drainage for grading and drainage
considerations.
Existing access points on a site are typically maintained whenever feasible, but should
always be assessed for safety and functionality. Where an access point has not been
established (greenfield site) or when relocating or adding access points, consult local
regulations to determine the approval process and location requirements (if any). Site
access should at a minimum consider:
Sight distance for vehicles on the adjacent roadway based on the design speed
Need for bypass lanes or turning bays for concentrated high-volume arrivals
such as school pickup/drop-off or church start/end
Proximity to access points for adjacent properties
Vehicle size that must be accommodated at each access point
Need for separate entrances for visitors and/or staff/maintenance
Security requirements of the access point
Where access to the site is controlled by a gate, the gate should be set back a sufficient
distance to allow one or more vehicles to pull completely out of active traffic while
waiting for the gate to be opened. Refer to Section 5.2 Roadways for discussion on
horizontal and vertical requirements for driveways on site.
Along with the primary site access, the following should also be considered:
Access to trash collection for disposal off-site
Access to septic tanks for periodic maintenance
Access for drilling or maintenance of water supply well(s)
Access to maintenance buildings (pump house, generator building, etc.)
Access for deliveries (confirm vehicle type and turning requirements)
Need for building access that accommodates special needs persons
(wheelchair access, etc.) Refer to Section 5.1 Grading and Stormwater
Drainage for guidance on accessible design.
Global Guide Section 5 Site Design, 5.4 Site Layout, Access and Parking
Civil Design Guide
101
Refer to local design standards for parking bay and access aisle design. Typical
90-degree parking bay dimensions are 2.5m x 5m, and a typical 2-way access
aisle is 7m wide.
The following resources and tools are to be used in developing the site layout, access
and parking design:
The Client Needs Assessment and Site Evaluation discussed in Section 1
include sample guiding questions and evaluation criteria that can inform
important access, layout and parking considerations.
References and additional resources can be found in R5.4 Site Layout, Access
and Parking.
Region specific guidelines for Uganda can be found in UG5.4 Site Layout,
Access, and Parking.
5.4.3 DESIGN PROCEDURE
Step 1: Review the information in Client Needs Assessment and Site Evaluation.
Step 2: Identify major site and surrounding features that influence layout
(slope, wind direction, access location, views, existing vegetation, water
features, existing facilities to remain, soil profile and suitability to
support planned infrastructure, etc.). Document these features and
their impact on the design in the report.
Step 3: Assess surrounding properties or potential developments to determine
potential for impacts to/from any changes to the project site (drainage,
waste management, etc.).
Step 4: Consider desired locations of infrastructure features (tanks, solar
panels, soak away systems, trash collection, paths, pump house, etc.).
Coordinate with Architectural team to designate approximate areas for
these systems in the conceptual site layout.
Step 5: Determine access needs to various site features and design appropriate
road/path and maneuvering spaces for these areas. Identify preferred
location and desired amount of parking and lay out sufficient parking
bays and access aisles.
Step 6: Once conceptual design for utility systems is complete, update these
areas on the site layout to show actual expected footprints and access
routes. If phasing is needed, provide sample phasing plan.
Step 7: Provide discussion on site layout, access and parking for the design
report. Include recommendations on new site access location, or
improvements to the current access or adjacent roadway to improve
safety or function.
Global Guide Section 6 Solid Waste Management, 6.1 Solid Waste Composition and Generation
Civil Design Guide
102
6 Solid Waste Management
6.1 SOLID WASTE COMPOSITION AND GENERATION Identifying Solid Waste composition and estimating generation are important
considerations for any EMI project but are crucial for medical facilities. The source
and nature of Solid Waste depends on the nature of activities being conducted on-
site, and an assessment of quality and quantity of waste generated at full build-out
must be considered.
6.1.1 DESIGN STAGE
Solid waste composition and generation rates should be analyzed on every EMI
project, and is of particular importance on hospital projects.
Frequency of Use: All hospital projects include a Solid Waste analysis. Other projects
should assess whether any non-standard or hazardous waste is expected to be
generated on-site, and complete an assessment accordingly. For most projects a
simple discussion of solid waste generation is sufficient to include in the Master Plan
report.
Conceptual Design: Identify potential sources of solid waste on the site and estimate
the quantity produced on a regular basis.
Detailed Design: Compile a detailed list of expected normal and hazardous waste
generated on-site, along with expected daily, weekly, monthly or annual disposal
volumes.
6.1.2 DESIGN CRITERIA
Quantity and quality are the two major considerations in solid waste design. Quantity
is the most important parameter required in the design of management and
subsystems; it is given in terms of generation rate (i.e. the amount of waste generated
by a person or a facility in one day). Solid waste quality encompasses not only the
different types and sources, but also physical, chemical, and biological characteristics
of the waste. Of particular importance are any hazardous characteristics. Materials
suitable for recycling such as food processing waste, metal, glass or plastic suitable
for recycling are also identified, however, recycling facilities in the area should be
confirmed before proposing recycling.
Waste quantities are measured using either volume or weight measurement;
however, the weight measurement is preferred as the most accurate. Worldwide,
waste generated averages 0.74kg/person/day, but this ranges widely from 0.11 to
4.54 kg/person/day. The volume measurement uses the anticipated density of the
waste as produced and is more applicable for facilities that do not have an on-site
compactor. There is a positive correlation between waste generation and income
levels; high-income countries account for 34% of waste generated, but only 16% of

Global Guide Section 6 Solid Waste Management, 6.1 Solid Waste Composition and Generation
Civil Design Guide
103
the world’s population. Consult with local experts to determine the appropriate
generation rate to use on each particular project.
Quality indicates the type of waste generated which may require special handling and
disposal. Types of waste include medical waste, biohazard waste, chemically
hazardous waste, organic waste, animal waste, recyclable materials, physically
dangerous items (needles, broken glass, sharp metal debris), hazardous organic
waste from wastewater disposal, etc.
Understanding of solid waste generated at health-care facilities, research centers and
laboratories or any other facility related to medical procedures is particularly critical.
Between 75% to 90% of the generated waste is comparable to domestic waste and
considered “non-hazardous”. The remaining 10-25% is considered hazardous and
may pose a variety of environmental and health risks (WHO, 1986, pg. 3).
Figure 6.1-1 Types of Solid Wastes
Source: WHO, 1986
The following resources and tools are to be used in developing the site’s solid waste
generation:
The Client Needs Assessment and Site Evaluation discussed in Section 1
include sample guiding questions and evaluation criteria that can inform the
site’s solid waste generation.
Table A 6.1-37 Solid Waste Sources in Hospitals in Appendix A6.1 outlines
examples of health-care waste from different departments
Table A 6.1-38 Average Waste Generation Rates in Appendix A6.1 provides
average waste generation estimates based on health-care facilities
Table A 6.1-39 Bulk Densities of Solid Waste by Component in Appendix A6.1
typical densities of solid waste
Global Guide Section 6 Solid Waste Management, 6.1 Solid Waste Composition and Generation
Civil Design Guide
104
Figure A 6.1-49 Example Waste Segregation Flowchart in Appendix A6.1
example waste segregation flow chart
References and additional resources can be found in R6.1 Solid Waste
Composition.
Region specific guidelines for Uganda can be found in UG6.1 Solid Waste
Composition and Generation.
EMI Solid Waste Field Packet can be used to evaluate and discuss with the
ministry to understand anticipated or existing solid waste generation during a
project trip.
6.1.3 DESIGN PROCEDURE
Step 1: Evaluate existing waste composition and generation using the provided
EMI Solid Waste Field Packet. If at a Greenfield site, skip to Step 3.
Step 2: At existing sites, verify the gathered information by observing waste
collection locations and processes.
Step 3: Attempt to estimate the current volume of waste generated.
Step 4: Determine the rough percentages of waste composition and any
unusual or hazardous waste.
Step 5: Estimate the average future amount of waste of each type to be
generated (typically kilogram per occupied bed per day, or kilogram per
person per day) based on responses from the EMI Solid Waste Field
Packet, Section 1 checklists, and provided tables in Appendix A6.1.
Step 6: Determine if there are appropriate recommendations to minimize
waste. These could include on-site organic waste composting, or
separation and recycling of some waste.
Global Guide Section 6 Solid Waste Management, 6.2 Solid Waste Disposal
Civil Design Guide
105
6.2 SOLID WASTE DISPOSAL Solid Waste Disposal encompasses the removal and destruction of typically solid or
semi-solid materials that are useless, unwanted, or hazardous. Disposal typically
means landfilling waste for the purpose of final burial/ destruction or placing it for
future recovery as a form of pollution control. Isolating it minimizes the wastes
environmental impact.
Structures to handle and dispose of solid waste for EMI projects are usually very
simple, often consisting of sorting and storage facilities and simple burial or burn pits
for waste that cannot be reused.
6.2.1 DESIGN STAGE
Solid Waste Disposal should be considered on every project and is essential for
healthcare facilities.
Frequency of Use: All EMI projects should provide general recommendations
regarding waste storage, handling and disposal. Healthcare projects always consider
additional Solid Waste Disposal due to the hazardous nature of medical waste.
Conceptual Design: Evaluate existing solid waste disposal practices (if applicable)
and make recommendations regarding future waste disposal based on the amounts
and types of waste generated on the site. Ensure that adequate space is allocated on
the site for solid waste disposal (if appropriate) and locate structures and facilities on
plan.
Detailed Design: Depends on local or regional requirements. Typically, design any
processing, storage, treatment and disposal facilities needed to safely handle and
dispose of the solid waste on site in a manner consistent with requirements.
6.2.2 DESIGN CRITERIA
Solid Waste Disposal depends greatly on the available treatment methods and local
conditions. Secondary considerations include waste characteristics, technology and
requirements, environmental and safety factors, and cost.
Waste-treatment options include:
Thermal Processes: rely on heat to destroy pathogens in the waste and is the
most commonly used practice in facilities across the world.
Chemical Processes: use of disinfectants.
Biological Processes: use of enzymes to speed up the destruction of organic
waste containing pathogens.
In the developing world, incineration is the most common waste-treatment system.
Incinerators range from small-batch units to large, complex treatment plants and
should have flue gas cleaning systems to minimize pollutant releases and meet
national or international emission limits. Additional waste-treatment systems include:
Global Guide Section 6 Solid Waste Management, 6.2 Solid Waste Disposal
Civil Design Guide
106
Autoclaves
Integrated or hybrid steam-based treatment systems
Microwave treatment technologies
Dry-heat treatment technologies
Chemical treatment technologies
Incineration requires limited pretreatment. Sorting solid waste to remove items such
as pressurized, highly flammable, toxic or radioactive items, heavy metals, PVC, or
explosives is necessary prior to incineration. If properly operated and maintained, the
incinerator will eliminate pathogens from waste and reduce waste to a small volume
of ash. Basic required waste characteristics include:
Content of combustible matter above 60%
Content of non-combustible solids below 5%
Content of non-combustible fines below 20%
Moisture content below 30%
Three generic kinds of incineration technology commonly used are
1. Dual-Chamber Starved-Air Incinerators: designed to burn infectious
healthcare waste
2. Multiple Chamber Incinerators
3. Rotary Kilns: reach temperatures that break down genotoxic substances and
heat-resistant chemicals
The treated waste is then disposed of in a landfill in a controlled fashion.
However, instead of disposing of waste, it is often allowed to accumulate at the facility
where it is openly burnt or spread indiscriminately around the facility’s grounds. This
produces a far higher risk of transmission of infection than controlled disposal at a
landfill site. Different communities have different customs for disposing of solid
waste. Ensure you have an adequate understanding of how waste (i.e. anatomical
waste) should be disposed of in a culturally or religiously acceptable way. Examples
of this include placenta pits, hiding the morgue.
The following resources and tools are to be used in developing the solid waste
disposal plan:
The Client Needs Assessment and Site Evaluation discussed in Section 1
include sample guiding questions and evaluation criteria that can inform the
solid waste disposal plan.
Appendix A6.2
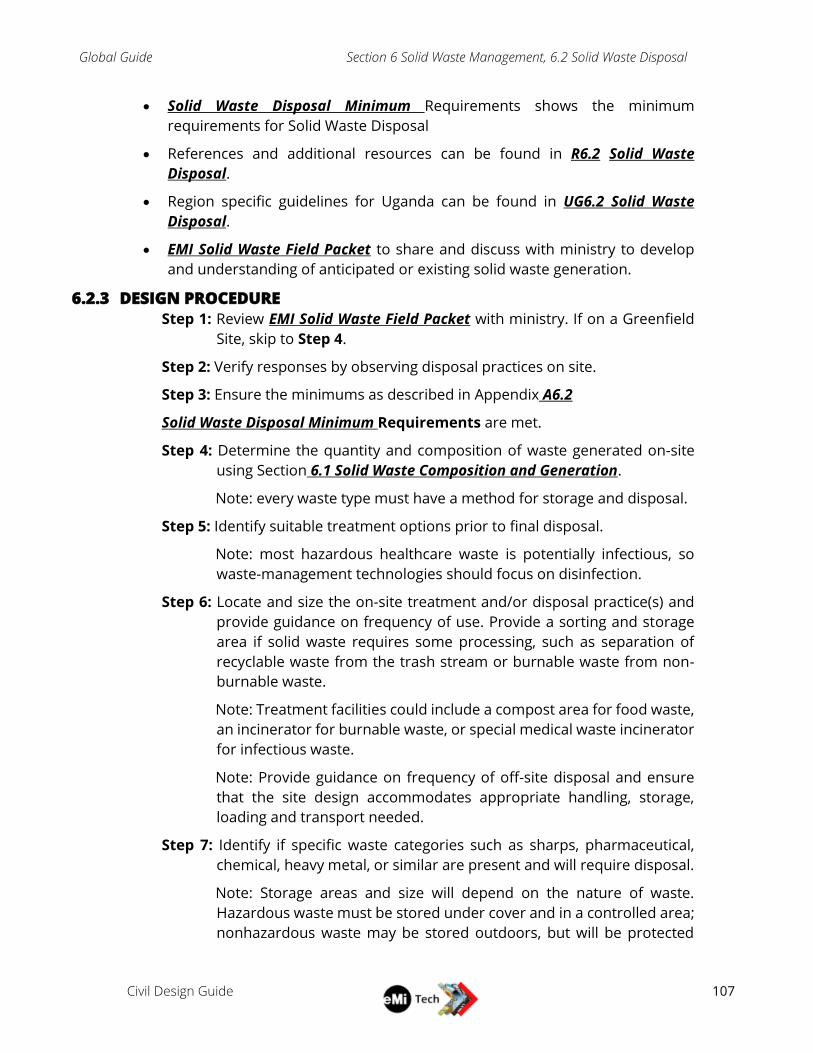
Global Guide Section 6 Solid Waste Management, 6.2 Solid Waste Disposal
Civil Design Guide
107
Solid Waste Disposal Minimum Requirements shows the minimum
requirements for Solid Waste Disposal
References and additional resources can be found in R6.2 Solid Waste
Disposal.
Region specific guidelines for Uganda can be found in UG6.2 Solid Waste
Disposal.
EMI Solid Waste Field Packet to share and discuss with ministry to develop
and understanding of anticipated or existing solid waste generation.
6.2.3 DESIGN PROCEDURE
Step 1: Review EMI Solid Waste Field Packet with ministry. If on a Greenfield
Site, skip to Step 4.
Step 2: Verify responses by observing disposal practices on site.
Step 3: Ensure the minimums as described in Appendix A6.2
Solid Waste Disposal Minimum Requirements are met.
Step 4: Determine the quantity and composition of waste generated on-site
using Section 6.1 Solid Waste Composition and Generation.
Note: every waste type must have a method for storage and disposal.
Step 5: Identify suitable treatment options prior to final disposal.
Note: most hazardous healthcare waste is potentially infectious, so
waste-management technologies should focus on disinfection.
Step 6: Locate and size the on-site treatment and/or disposal practice(s) and
provide guidance on frequency of use. Provide a sorting and storage
area if solid waste requires some processing, such as separation of
recyclable waste from the trash stream or burnable waste from non-
burnable waste.
Note: Treatment facilities could include a compost area for food waste,
an incinerator for burnable waste, or special medical waste incinerator
for infectious waste.
Note: Provide guidance on frequency of off-site disposal and ensure
that the site design accommodates appropriate handling, storage,
loading and transport needed.
Step 7: Identify if specific waste categories such as sharps, pharmaceutical,
chemical, heavy metal, or similar are present and will require disposal.
Note: Storage areas and size will depend on the nature of waste.
Hazardous waste must be stored under cover and in a controlled area;
nonhazardous waste may be stored outdoors, but will be protected

Global Guide Section 6 Solid Waste Management, 6.2 Solid Waste Disposal
Civil Design Guide
108
from human or animal contact. Combustible waste must be stored well
away from other facilities.
Step 8: Determine location of final disposal. Desirable features include
restricted access to prevent scavenging, daily soil cover to prevent
odors, proximity to property line and buildings, regular compaction, an
organized deposit of wastes to prevent contamination of groundwater
and surrounding areas, and trained staff. Disposal facilities could
include burial pits for non-burnable waste, ash, glass, infectious waste
or tissue.

Civil Design Guide
109
Appendix
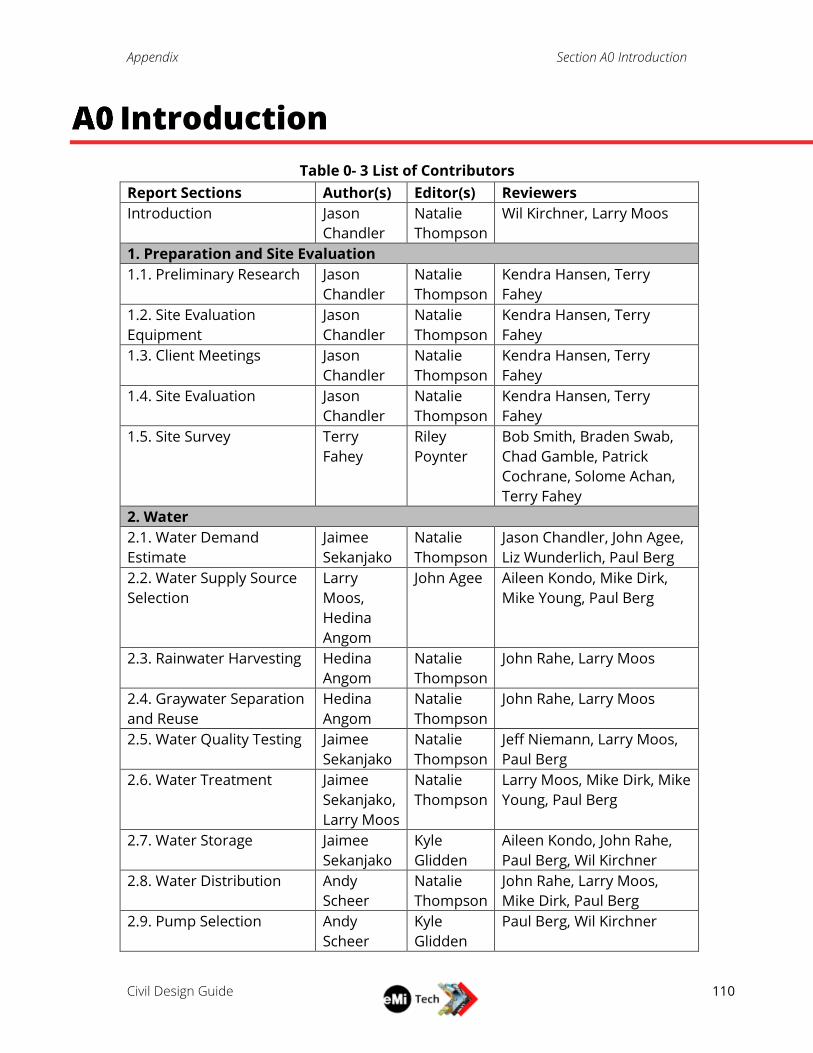
Appendix Section A0 Introduction
Civil Design Guide
110
Introduction
Table 0- 3 List of Contributors
Report Sections Author(s) Editor(s) Reviewers
Introduction Jason
Chandler
Natalie
Thompson
Wil Kirchner, Larry Moos
1. Preparation and Site Evaluation
1.1. Preliminary Research Jason
Chandler
Natalie
Thompson
Kendra Hansen, Terry
Fahey
1.2. Site Evaluation
Equipment
Jason
Chandler
Natalie
Thompson
Kendra Hansen, Terry
Fahey
1.3. Client Meetings Jason
Chandler
Natalie
Thompson
Kendra Hansen, Terry
Fahey
1.4. Site Evaluation Jason
Chandler
Natalie
Thompson
Kendra Hansen, Terry
Fahey
1.5. Site Survey Terry
Fahey
Riley
Poynter
Bob Smith, Braden Swab,
Chad Gamble, Patrick
Cochrane, Solome Achan,
Terry Fahey
2. Water
2.1. Water Demand
Estimate
Jaimee
Sekanjako
Natalie
Thompson
Jason Chandler, John Agee,
Liz Wunderlich, Paul Berg
2.2. Water Supply Source
Selection
Larry
Moos,
Hedina
Angom
John Agee Aileen Kondo, Mike Dirk,
Mike Young, Paul Berg
2.3. Rainwater Harvesting Hedina
Angom
Natalie
Thompson
John Rahe, Larry Moos
2.4. Graywater Separation
and Reuse
Hedina
Angom
Natalie
Thompson
John Rahe, Larry Moos
2.5. Water Quality Testing Jaimee
Sekanjako
Natalie
Thompson
Jeff Niemann, Larry Moos,
Paul Berg
2.6. Water Treatment Jaimee
Sekanjako,
Larry Moos
Natalie
Thompson
Larry Moos, Mike Dirk, Mike
Young, Paul Berg
2.7. Water Storage Jaimee
Sekanjako
Kyle
Glidden
Aileen Kondo, John Rahe,
Paul Berg, Wil Kirchner
2.8. Water Distribution Andy
Scheer
Natalie
Thompson
John Rahe, Larry Moos,
Mike Dirk, Paul Berg
2.9. Pump Selection Andy
Scheer
Kyle
Glidden
Paul Berg, Wil Kirchner
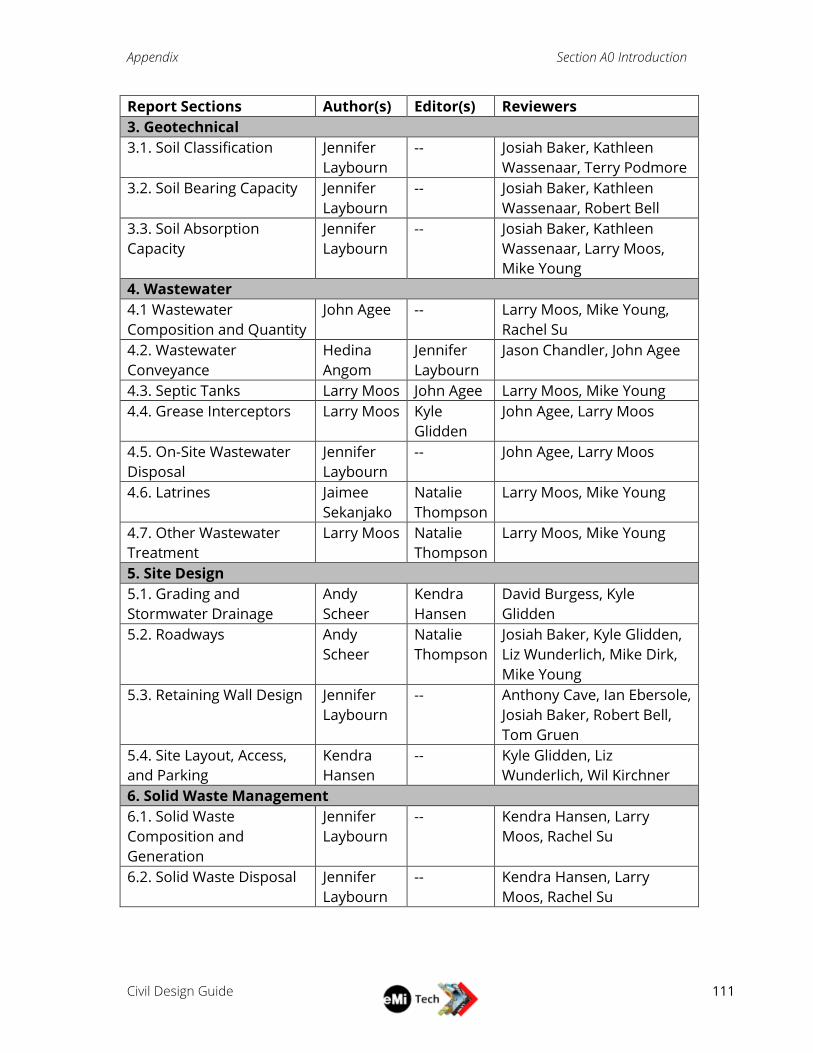
Appendix Section A0 Introduction
Civil Design Guide
111
Report Sections Author(s) Editor(s) Reviewers
3. Geotechnical
3.1. Soil Classification Jennifer
Laybourn
-- Josiah Baker, Kathleen
Wassenaar, Terry Podmore
3.2. Soil Bearing Capacity Jennifer
Laybourn
-- Josiah Baker, Kathleen
Wassenaar, Robert Bell
3.3. Soil Absorption
Capacity
Jennifer
Laybourn
-- Josiah Baker, Kathleen
Wassenaar, Larry Moos,
Mike Young
4. Wastewater
4.1 Wastewater
Composition and Quantity
John Agee -- Larry Moos, Mike Young,
Rachel Su
4.2. Wastewater
Conveyance
Hedina
Angom
Jennifer
Laybourn
Jason Chandler, John Agee
4.3. Septic Tanks Larry Moos John Agee Larry Moos, Mike Young
4.4. Grease Interceptors Larry Moos Kyle
Glidden
John Agee, Larry Moos
4.5. On-Site Wastewater
Disposal
Jennifer
Laybourn
-- John Agee, Larry Moos
4.6. Latrines Jaimee
Sekanjako
Natalie
Thompson
Larry Moos, Mike Young
4.7. Other Wastewater
Treatment
Larry Moos Natalie
Thompson
Larry Moos, Mike Young
5. Site Design
5.1. Grading and
Stormwater Drainage
Andy
Scheer
Kendra
Hansen
David Burgess, Kyle
Glidden
5.2. Roadways Andy
Scheer
Natalie
Thompson
Josiah Baker, Kyle Glidden,
Liz Wunderlich, Mike Dirk,
Mike Young
5.3. Retaining Wall Design Jennifer
Laybourn
-- Anthony Cave, Ian Ebersole,
Josiah Baker, Robert Bell,
Tom Gruen
5.4. Site Layout, Access,
and Parking
Kendra
Hansen
-- Kyle Glidden, Liz
Wunderlich, Wil Kirchner
6. Solid Waste Management
6.1. Solid Waste
Composition and
Generation
Jennifer
Laybourn
-- Kendra Hansen, Larry
Moos, Rachel Su
6.2. Solid Waste Disposal Jennifer
Laybourn
-- Kendra Hansen, Larry
Moos, Rachel Su

Appendix Section A1 Preparation and Site Evaluation
Civil Design Guide
112
Preparation and Site Evaluation
No appendices.
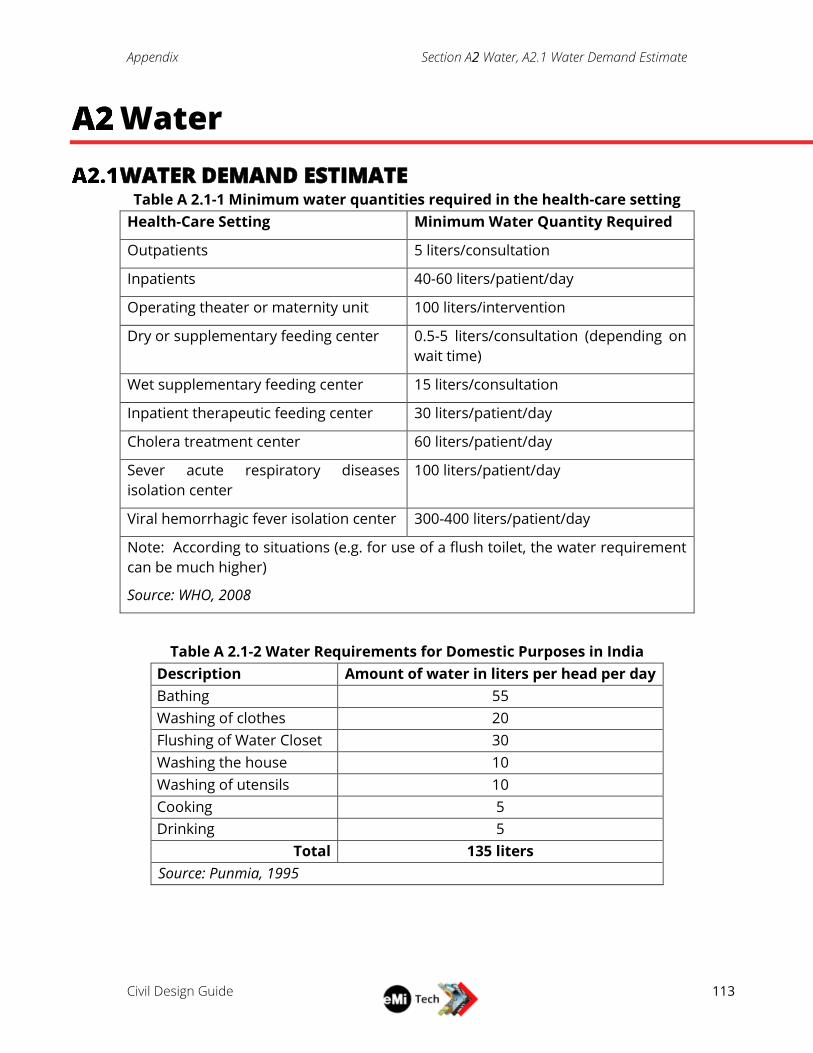
Appendix Section A2 Water, A2.1 Water Demand Estimate
Civil Design Guide
113
Water
WATER DEMAND ESTIMATE Table A 2.1-1 Minimum water quantities required in the health-care setting
Health-Care Setting Minimum Water Quantity Required
Outpatients 5 liters/consultation
Inpatients 40-60 liters/patient/day
Operating theater or maternity unit 100 liters/intervention
Dry or supplementary feeding center 0.5-5 liters/consultation (depending on
wait time)
Wet supplementary feeding center 15 liters/consultation
Inpatient therapeutic feeding center 30 liters/patient/day
Cholera treatment center 60 liters/patient/day
Sever acute respiratory diseases
isolation center
100 liters/patient/day
Viral hemorrhagic fever isolation center 300-400 liters/patient/day
Note: According to situations (e.g. for use of a flush toilet, the water requirement
can be much higher)
Source: WHO, 2008
Table A 2.1-2 Water Requirements for Domestic Purposes in India
Description Amount of water in liters per head per day
Bathing 55
Washing of clothes 20
Flushing of Water Closet 30
Washing the house 10
Washing of utensils 10
Cooking 5
Drinking 5
Total 135 liters
Source: Punmia, 1995
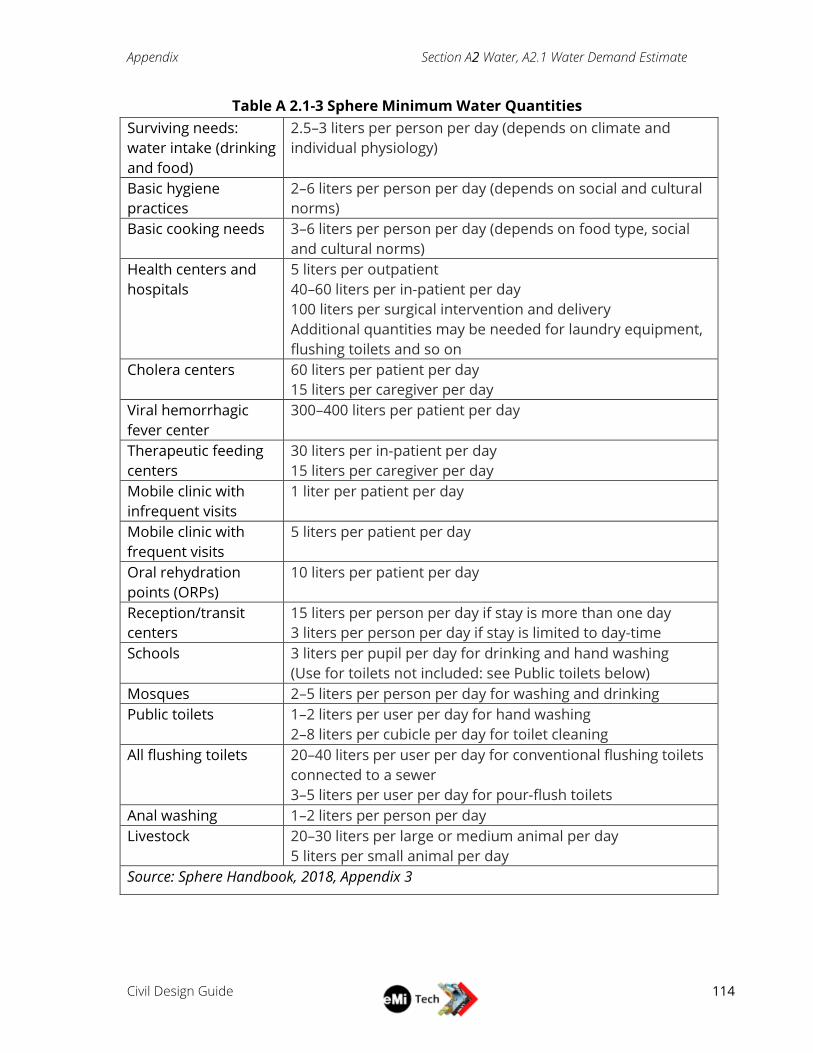
Appendix Section A2 Water, A2.1 Water Demand Estimate
Civil Design Guide
114
Table A 2.1-3 Sphere Minimum Water Quantities
Surviving needs:
water intake (drinking
and food)
2.5–3 liters per person per day (depends on climate and
individual physiology)
Basic hygiene
practices
2–6 liters per person per day (depends on social and cultural
norms)
Basic cooking needs 3–6 liters per person per day (depends on food type, social
and cultural norms)
Health centers and
hospitals
5 liters per outpatient
40–60 liters per in-patient per day
100 liters per surgical intervention and delivery
Additional quantities may be needed for laundry equipment,
flushing toilets and so on
Cholera centers 60 liters per patient per day
15 liters per caregiver per day
Viral hemorrhagic
fever center
300–400 liters per patient per day
Therapeutic feeding
centers
30 liters per in-patient per day
15 liters per caregiver per day
Mobile clinic with
infrequent visits
1 liter per patient per day
Mobile clinic with
frequent visits
5 liters per patient per day
Oral rehydration
points (ORPs)
10 liters per patient per day
Reception/transit
centers
15 liters per person per day if stay is more than one day
3 liters per person per day if stay is limited to day-time
Schools 3 liters per pupil per day for drinking and hand washing
(Use for toilets not included: see Public toilets below)
Mosques 2–5 liters per person per day for washing and drinking
Public toilets 1–2 liters per user per day for hand washing
2–8 liters per cubicle per day for toilet cleaning
All flushing toilets 20–40 liters per user per day for conventional flushing toilets
connected to a sewer
3–5 liters per user per day for pour-flush toilets
Anal washing 1–2 liters per person per day
Livestock 20–30 liters per large or medium animal per day
5 liters per small animal per day
Source: Sphere Handbook, 2018, Appendix 3
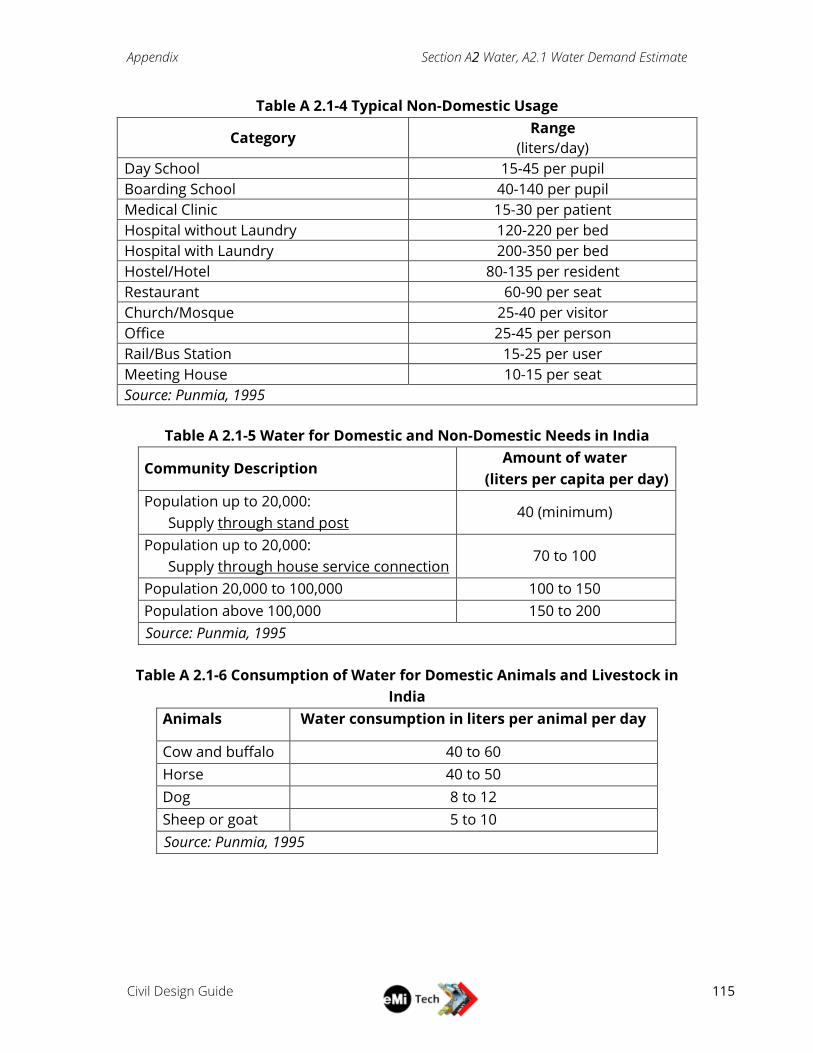
Appendix Section A2 Water, A2.1 Water Demand Estimate
Civil Design Guide
115
Table A 2.1-4 Typical Non-Domestic Usage
Category Range
(liters/day)
Day School 15-45 per pupil
Boarding School 40-140 per pupil
Medical Clinic 15-30 per patient
Hospital without Laundry 120-220 per bed
Hospital with Laundry 200-350 per bed
Hostel/Hotel 80-135 per resident
Restaurant 60-90 per seat
Church/Mosque 25-40 per visitor
Office 25-45 per person
Rail/Bus Station 15-25 per user
Meeting House 10-15 per seat
Source: Punmia, 1995
Table A 2.1-5 Water for Domestic and Non-Domestic Needs in India
Community Description Amount of water
(liters per capita per day)
Population up to 20,000:
Supply through stand post 40 (minimum)
Population up to 20,000:
Supply through house service connection 70 to 100
Population 20,000 to 100,000 100 to 150
Population above 100,000 150 to 200
Source: Punmia, 1995
Table A 2.1-6 Consumption of Water for Domestic Animals and Livestock in
India
Animals Water consumption in liters per animal per day
Cow and buffalo 40 to 60
Horse 40 to 50
Dog 8 to 12
Sheep or goat 5 to 10
Source: Punmia, 1995
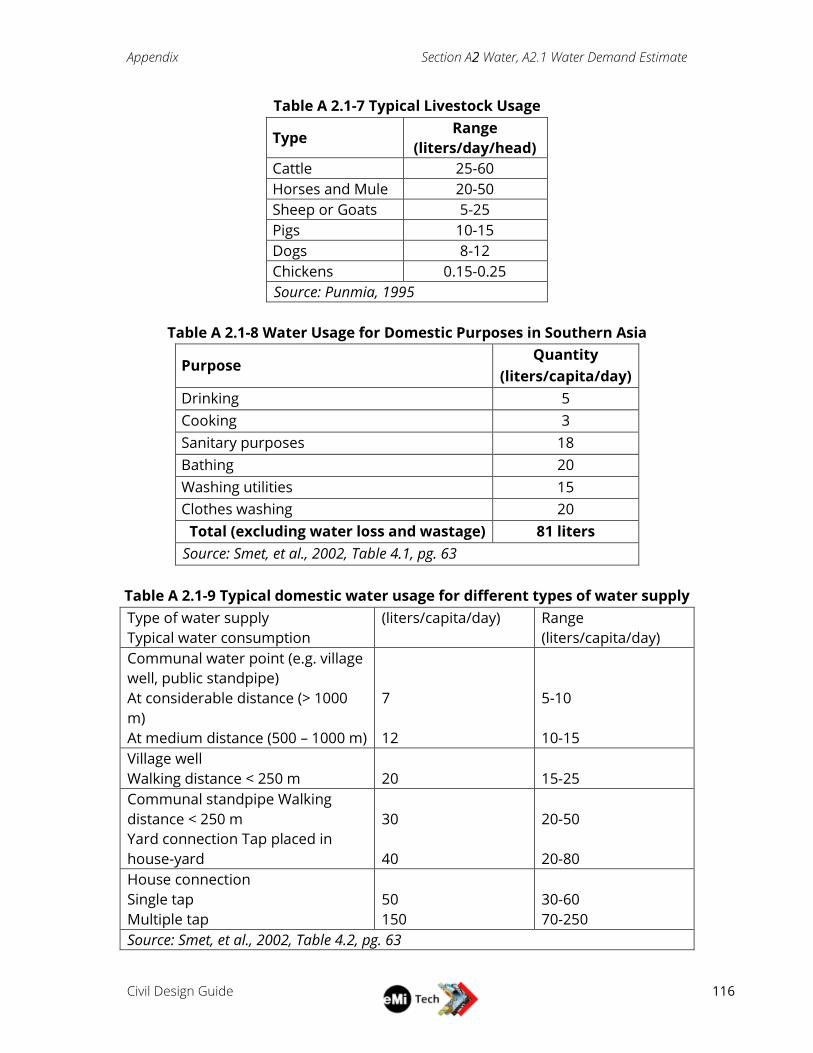
Appendix Section A2 Water, A2.1 Water Demand Estimate
Civil Design Guide
116
Table A 2.1-7 Typical Livestock Usage
Type Range
(liters/day/head)
Cattle 25-60
Horses and Mule 20-50
Sheep or Goats 5-25
Pigs 10-15
Dogs 8-12
Chickens 0.15-0.25
Source: Punmia, 1995
Table A 2.1-8 Water Usage for Domestic Purposes in Southern Asia
Purpose Quantity
(liters/capita/day)
Drinking 5
Cooking 3
Sanitary purposes 18
Bathing 20
Washing utilities 15
Clothes washing 20
Total (excluding water loss and wastage) 81 liters
Source: Smet, et al., 2002, Table 4.1, pg. 63
Table A 2.1-9 Typical domestic water usage for different types of water supply
Type of water supply
Typical water consumption
(liters/capita/day) Range
(liters/capita/day)
Communal water point (e.g. village
well, public standpipe)
At considerable distance (> 1000
m)
At medium distance (500 – 1000 m)
7
12
5-10
10-15
Village well
Walking distance < 250 m
20
15-25
Communal standpipe Walking
distance < 250 m
Yard connection Tap placed in
house-yard
30
40
20-50
20-80
House connection
Single tap
Multiple tap
50
150
30-60
70-250
Source: Smet, et al., 2002, Table 4.2, pg. 63

Appendix Section A2 Water, A2.1 Water Demand Estimate
Civil Design Guide
117
Table A 2.1-10 Various Water Requirements in Developing Countries
Category Typical Water Use
School
Day schools 15-30 l/day per pupil
Boarding schools 90-140 l/day per pupil
Hospitals (with laundry facilities) 220-300 l/day per bed
Hostels 80-120 l/day per resident
Restaurants 65-90 l/day per seat
Cinema houses, concert halls 10-15 l/day per seat
Offices 25-40 l/day per person
Railway and bus stations 15-20 l/day per users
Livestock
Cattle 25-45 l/day per head
Horses and mules 20-35 l/day per head
Sheep 15-25 l/day per head
Pigs 10-15 l/day per head
Poultry
Chicken 15-25 l/day per 100
Source: Smet, et al., 2002, Table 4.3, pg. 64
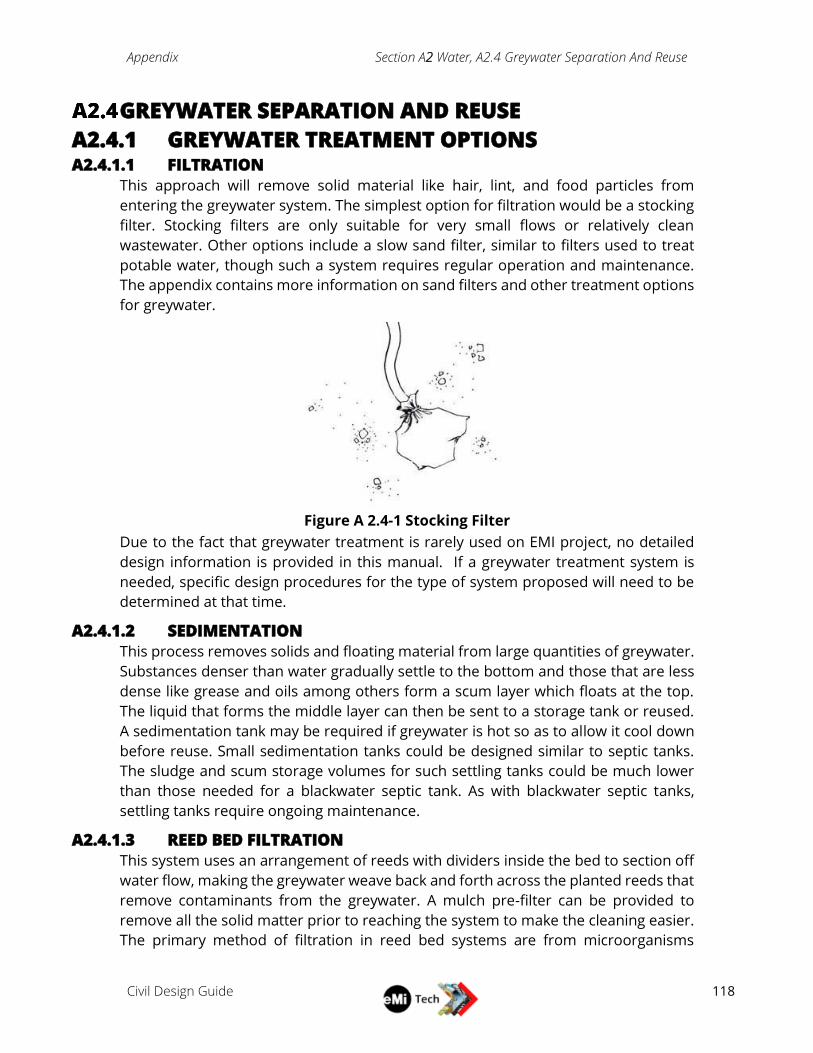
Appendix Section A2 Water, A2.4 Greywater Separation And Reuse
Civil Design Guide
118
GREYWATER SEPARATION AND REUSE
A2.4.1 GREYWATER TREATMENT OPTIONS A2.4.1.1 FILTRATION
This approach will remove solid material like hair, lint, and food particles from
entering the greywater system. The simplest option for filtration would be a stocking
filter. Stocking filters are only suitable for very small flows or relatively clean
wastewater. Other options include a slow sand filter, similar to filters used to treat
potable water, though such a system requires regular operation and maintenance.
The appendix contains more information on sand filters and other treatment options
for greywater.
Figure A 2.4-1 Stocking Filter
Due to the fact that greywater treatment is rarely used on EMI project, no detailed
design information is provided in this manual. If a greywater treatment system is
needed, specific design procedures for the type of system proposed will need to be
determined at that time.
A2.4.1.2 SEDIMENTATION
This process removes solids and floating material from large quantities of greywater.
Substances denser than water gradually settle to the bottom and those that are less
dense like grease and oils among others form a scum layer which floats at the top.
The liquid that forms the middle layer can then be sent to a storage tank or reused.
A sedimentation tank may be required if greywater is hot so as to allow it cool down
before reuse. Small sedimentation tanks could be designed similar to septic tanks.
The sludge and scum storage volumes for such settling tanks could be much lower
than those needed for a blackwater septic tank. As with blackwater septic tanks,
settling tanks require ongoing maintenance.
A2.4.1.3 REED BED FILTRATION
This system uses an arrangement of reeds with dividers inside the bed to section off
water flow, making the greywater weave back and forth across the planted reeds that
remove contaminants from the greywater. A mulch pre-filter can be provided to
remove all the solid matter prior to reaching the system to make the cleaning easier.
The primary method of filtration in reed bed systems are from microorganisms
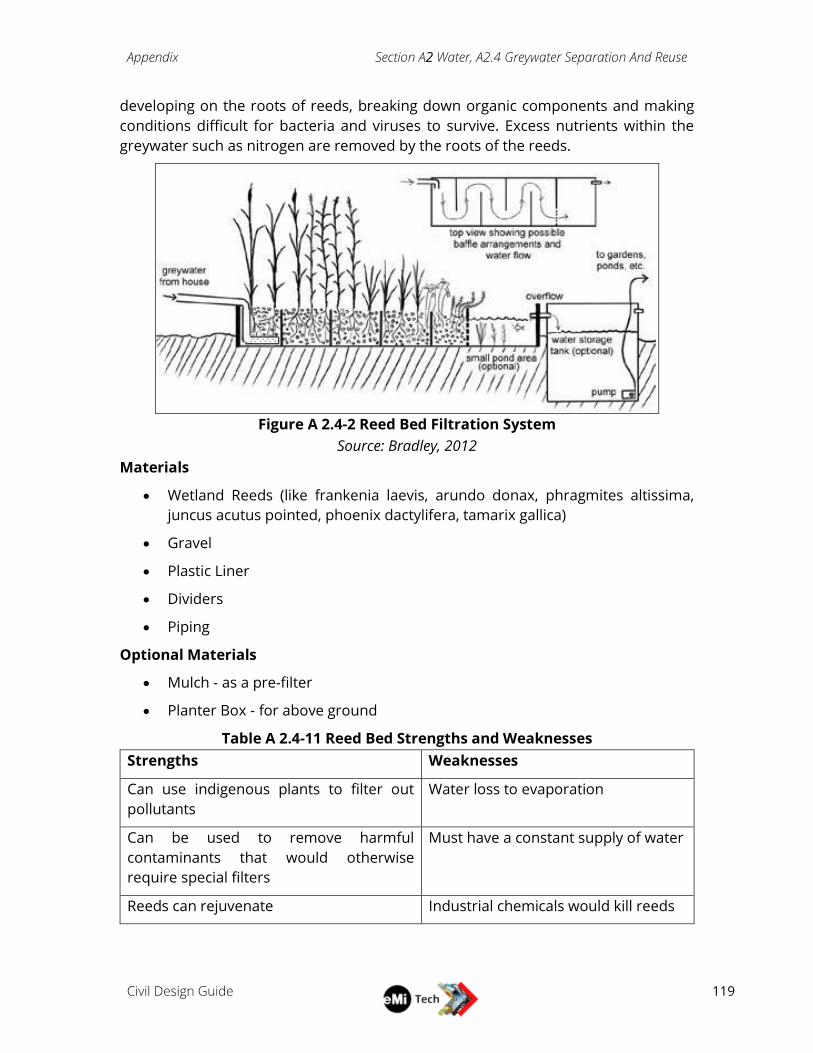
Appendix Section A2 Water, A2.4 Greywater Separation And Reuse
Civil Design Guide
119
developing on the roots of reeds, breaking down organic components and making
conditions difficult for bacteria and viruses to survive. Excess nutrients within the
greywater such as nitrogen are removed by the roots of the reeds.
Figure A 2.4-2 Reed Bed Filtration System
Source: Bradley, 2012
Materials
Wetland Reeds (like frankenia laevis, arundo donax, phragmites altissima,
juncus acutus pointed, phoenix dactylifera, tamarix gallica)
Gravel
Plastic Liner
Dividers
Piping
Optional Materials
Mulch - as a pre-filter
Planter Box - for above ground
Table A 2.4-11 Reed Bed Strengths and Weaknesses
Strengths Weaknesses
Can use indigenous plants to filter out
pollutants
Water loss to evaporation
Can be used to remove harmful
contaminants that would otherwise
require special filters
Must have a constant supply of water
Reeds can rejuvenate Industrial chemicals would kill reeds
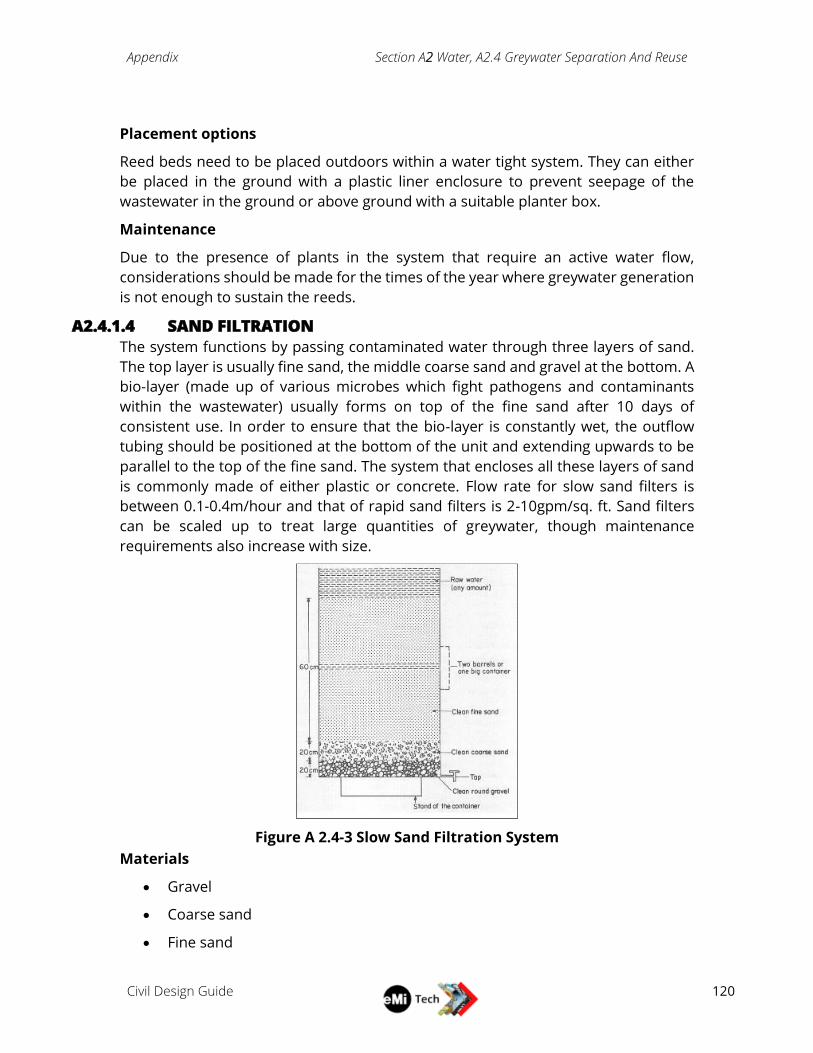
Appendix Section A2 Water, A2.4 Greywater Separation And Reuse
Civil Design Guide
120
Placement options
Reed beds need to be placed outdoors within a water tight system. They can either
be placed in the ground with a plastic liner enclosure to prevent seepage of the
wastewater in the ground or above ground with a suitable planter box.
Maintenance
Due to the presence of plants in the system that require an active water flow,
considerations should be made for the times of the year where greywater generation
is not enough to sustain the reeds.
A2.4.1.4 SAND FILTRATION
The system functions by passing contaminated water through three layers of sand.
The top layer is usually fine sand, the middle coarse sand and gravel at the bottom. A
bio-layer (made up of various microbes which fight pathogens and contaminants
within the wastewater) usually forms on top of the fine sand after 10 days of
consistent use. In order to ensure that the bio-layer is constantly wet, the outflow
tubing should be positioned at the bottom of the unit and extending upwards to be
parallel to the top of the fine sand. The system that encloses all these layers of sand
is commonly made of either plastic or concrete. Flow rate for slow sand filters is
between 0.1-0.4m/hour and that of rapid sand filters is 2-10gpm/sq. ft. Sand filters
can be scaled up to treat large quantities of greywater, though maintenance
requirements also increase with size.
Figure A 2.4-3 Slow Sand Filtration System
Materials
Gravel
Coarse sand
Fine sand
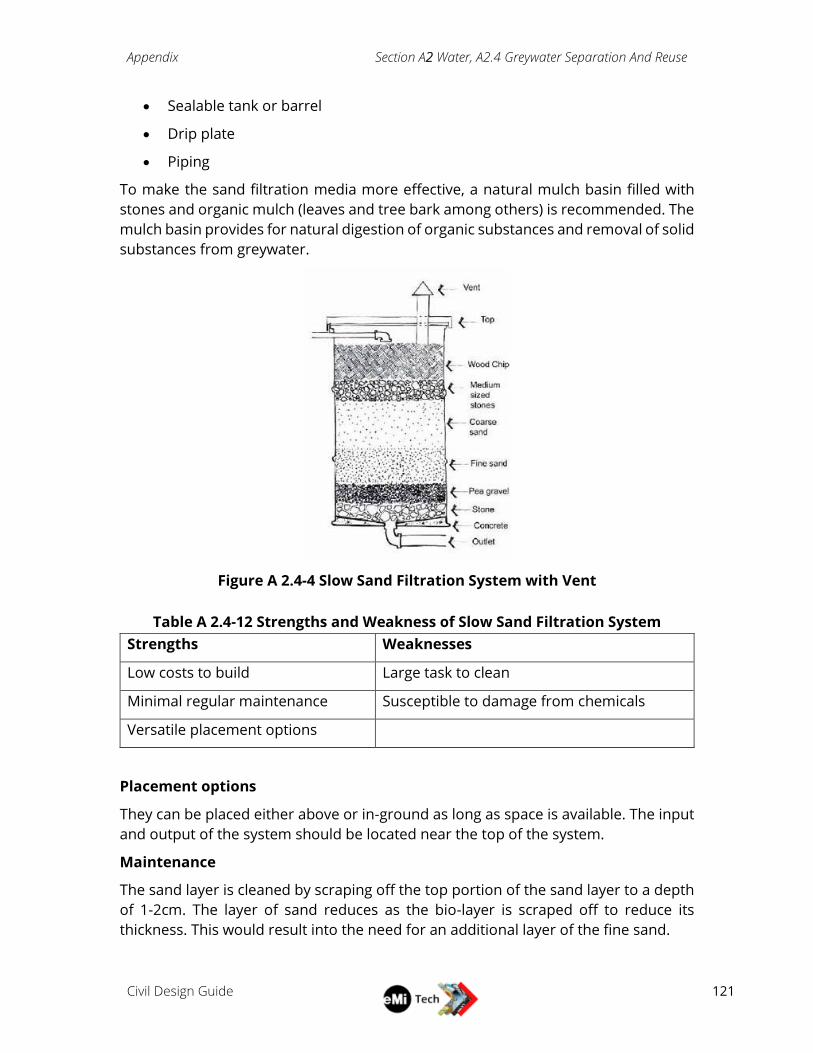
Appendix Section A2 Water, A2.4 Greywater Separation And Reuse
Civil Design Guide
121
Sealable tank or barrel
Drip plate
Piping
To make the sand filtration media more effective, a natural mulch basin filled with
stones and organic mulch (leaves and tree bark among others) is recommended. The
mulch basin provides for natural digestion of organic substances and removal of solid
substances from greywater.
Figure A 2.4-4 Slow Sand Filtration System with Vent
Table A 2.4-12 Strengths and Weakness of Slow Sand Filtration System
Strengths Weaknesses
Low costs to build Large task to clean
Minimal regular maintenance Susceptible to damage from chemicals
Versatile placement options
Placement options
They can be placed either above or in-ground as long as space is available. The input
and output of the system should be located near the top of the system.
Maintenance
The sand layer is cleaned by scraping off the top portion of the sand layer to a depth
of 1-2cm. The layer of sand reduces as the bio-layer is scraped off to reduce its
thickness. This would result into the need for an additional layer of the fine sand.
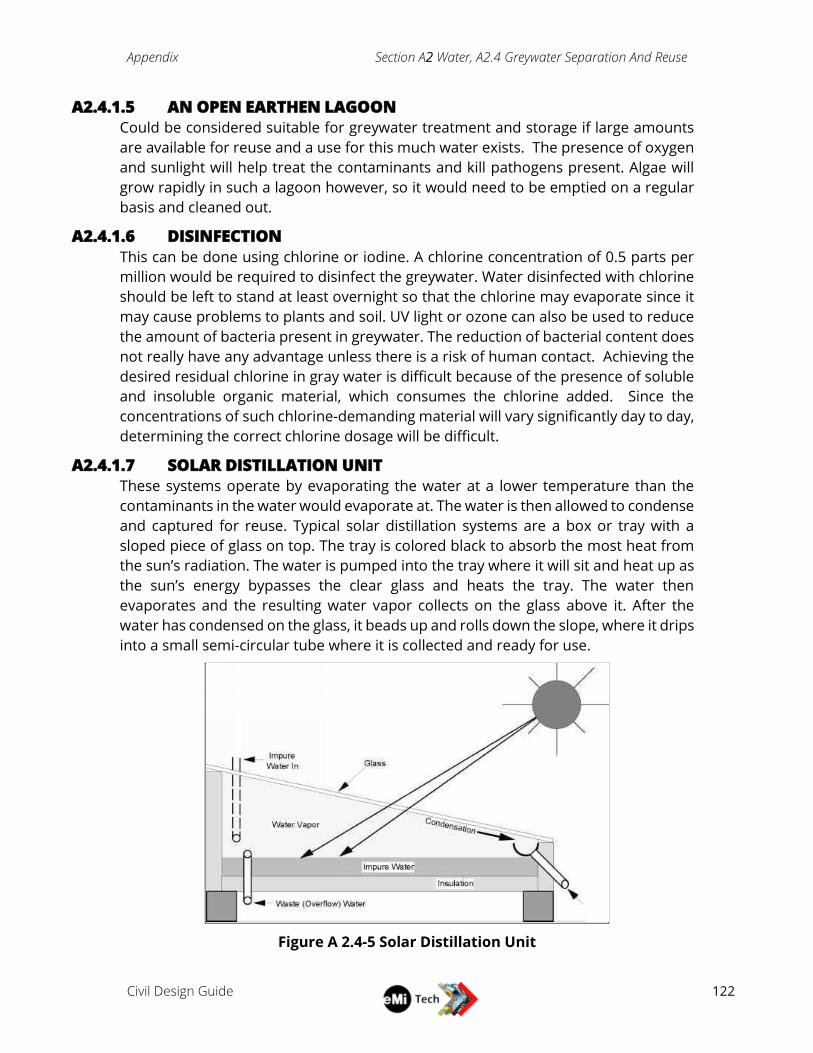
Appendix Section A2 Water, A2.4 Greywater Separation And Reuse
Civil Design Guide
122
A2.4.1.5 AN OPEN EARTHEN LAGOON
Could be considered suitable for greywater treatment and storage if large amounts
are available for reuse and a use for this much water exists. The presence of oxygen
and sunlight will help treat the contaminants and kill pathogens present. Algae will
grow rapidly in such a lagoon however, so it would need to be emptied on a regular
basis and cleaned out.
A2.4.1.6 DISINFECTION
This can be done using chlorine or iodine. A chlorine concentration of 0.5 parts per
million would be required to disinfect the greywater. Water disinfected with chlorine
should be left to stand at least overnight so that the chlorine may evaporate since it
may cause problems to plants and soil. UV light or ozone can also be used to reduce
the amount of bacteria present in greywater. The reduction of bacterial content does
not really have any advantage unless there is a risk of human contact. Achieving the
desired residual chlorine in gray water is difficult because of the presence of soluble
and insoluble organic material, which consumes the chlorine added. Since the
concentrations of such chlorine-demanding material will vary significantly day to day,
determining the correct chlorine dosage will be difficult.
A2.4.1.7 SOLAR DISTILLATION UNIT
These systems operate by evaporating the water at a lower temperature than the
contaminants in the water would evaporate at. The water is then allowed to condense
and captured for reuse. Typical solar distillation systems are a box or tray with a
sloped piece of glass on top. The tray is colored black to absorb the most heat from
the sun’s radiation. The water is pumped into the tray where it will sit and heat up as
the sun’s energy bypasses the clear glass and heats the tray. The water then
evaporates and the resulting water vapor collects on the glass above it. After the
water has condensed on the glass, it beads up and rolls down the slope, where it drips
into a small semi-circular tube where it is collected and ready for use.
Figure A 2.4-5 Solar Distillation Unit

Appendix Section A2 Water, A2.4 Greywater Separation And Reuse
Civil Design Guide
123
Materials
Glass plane
Black trough
Piping
Gutter tubing
Waterproofing bonding agent
Frame for the still to sit on
Placement options
The solar stills should be placed in an outdoor location with high exposure to sunlight.
The units can vary in size depending on the desired outflow of distilled water.
Maintenance
Some greywater usually remains in the black trough after the solar distillation
process. This needs to be emptied either manually and disposed or using a pipe that
directs it to a black water disposal system.
Optimal conditions
This system would work best for a home with few people. Such a home should be
located in a scarcely populated area to minimize shadows that could interfere with
the distillation process.
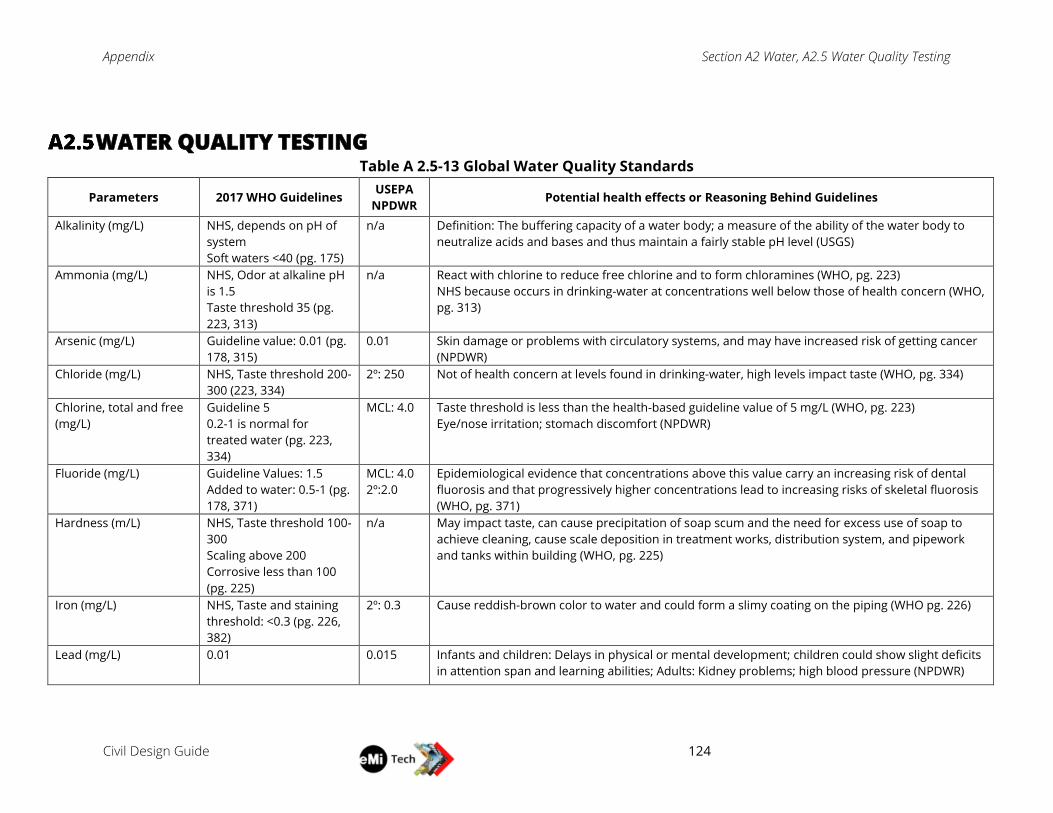
Appendix Section A2 Water, A2.5 Water Quality Testing
Civil Design Guide
124
WATER QUALITY TESTING Table A 2.5-13 Global Water Quality Standards
Parameters 2017 WHO Guidelines USEPA
NPDWR Potential health effects or Reasoning Behind Guidelines
Alkalinity (mg/L) NHS, depends on pH of
system
Soft waters <40 (pg. 175)
n/a Definition: The buffering capacity of a water body; a measure of the ability of the water body to
neutralize acids and bases and thus maintain a fairly stable pH level (USGS)
Ammonia (mg/L) NHS, Odor at alkaline pH
is 1.5
Taste threshold 35 (pg.
223, 313)
n/a React with chlorine to reduce free chlorine and to form chloramines (WHO, pg. 223)
NHS because occurs in drinking-water at concentrations well below those of health concern (WHO,
pg. 313)
Arsenic (mg/L) Guideline value: 0.01 (pg.
178, 315)
0.01 Skin damage or problems with circulatory systems, and may have increased risk of getting cancer
(NPDWR)
Chloride (mg/L) NHS, Taste threshold 200-
300 (223, 334)
2º: 250 Not of health concern at levels found in drinking-water, high levels impact taste (WHO, pg. 334)
Chlorine, total and free
(mg/L)
Guideline 5
0.2-1 is normal for
treated water (pg. 223,
334)
MCL: 4.0 Taste threshold is less than the health-based guideline value of 5 mg/L (WHO, pg. 223)
Eye/nose irritation; stomach discomfort (NPDWR)
Fluoride (mg/L) Guideline Values: 1.5
Added to water: 0.5-1 (pg.
178, 371)
MCL: 4.0
2º:2.0
Epidemiological evidence that concentrations above this value carry an increasing risk of dental
fluorosis and that progressively higher concentrations lead to increasing risks of skeletal fluorosis
(WHO, pg. 371)
Hardness (m/L) NHS, Taste threshold 100-
300
Scaling above 200
Corrosive less than 100
(pg. 225)
n/a May impact taste, can cause precipitation of soap scum and the need for excess use of soap to
achieve cleaning, cause scale deposition in treatment works, distribution system, and pipework
and tanks within building (WHO, pg. 225)
Iron (mg/L) NHS, Taste and staining
threshold: <0.3 (pg. 226,
382)
2º: 0.3 Cause reddish-brown color to water and could form a slimy coating on the piping (WHO pg. 226)
Lead (mg/L) 0.01 0.015 Infants and children: Delays in physical or mental development; children could show slight deficits
in attention span and learning abilities; Adults: Kidney problems; high blood pressure (NPDWR)
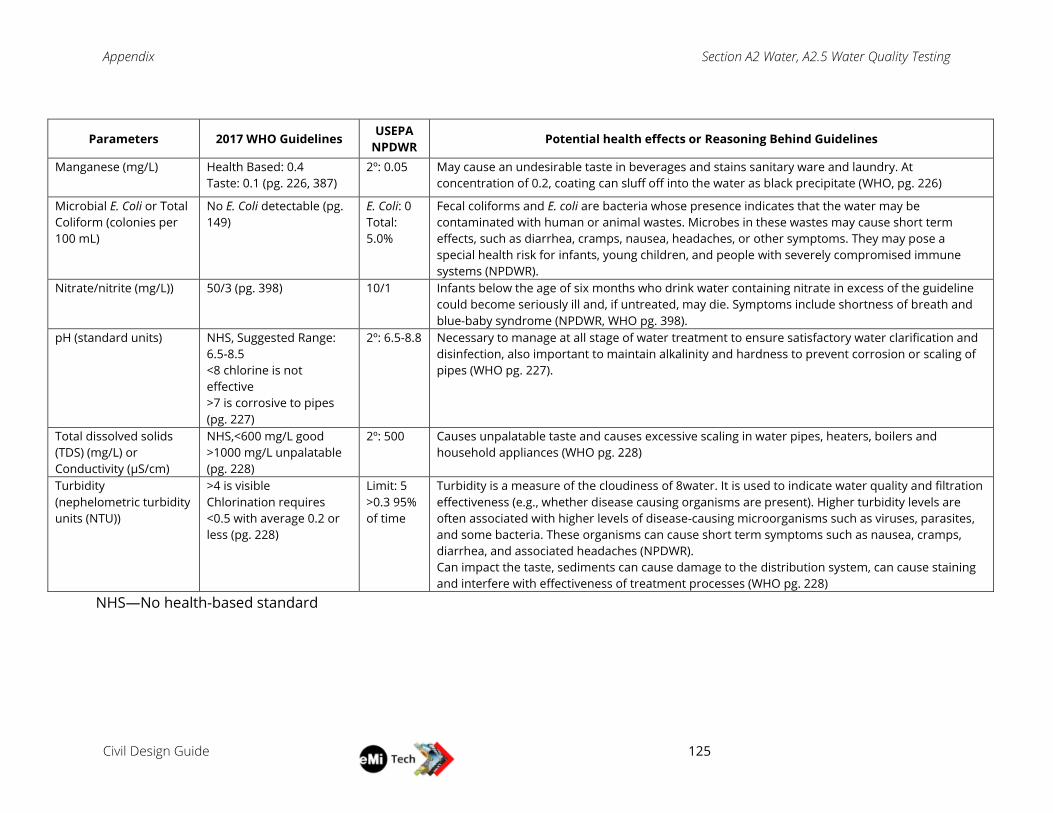
Appendix Section A2 Water, A2.5 Water Quality Testing
Civil Design Guide
125
Parameters 2017 WHO Guidelines USEPA
NPDWR Potential health effects or Reasoning Behind Guidelines
Manganese (mg/L) Health Based: 0.4
Taste: 0.1 (pg. 226, 387)
2º: 0.05 May cause an undesirable taste in beverages and stains sanitary ware and laundry. At
concentration of 0.2, coating can sluff off into the water as black precipitate (WHO, pg. 226)
Microbial E. Coli or Total
Coliform (colonies per
100 mL)
No E. Coli detectable (pg.
149)
E. Coli: 0
Total:
5.0%
Fecal coliforms and E. coli are bacteria whose presence indicates that the water may be
contaminated with human or animal wastes. Microbes in these wastes may cause short term
effects, such as diarrhea, cramps, nausea, headaches, or other symptoms. They may pose a
special health risk for infants, young children, and people with severely compromised immune
systems (NPDWR).
Nitrate/nitrite (mg/L)) 50/3 (pg. 398) 10/1 Infants below the age of six months who drink water containing nitrate in excess of the guideline
could become seriously ill and, if untreated, may die. Symptoms include shortness of breath and
blue-baby syndrome (NPDWR, WHO pg. 398).
pH (standard units) NHS, Suggested Range:
6.5-8.5
<8 chlorine is not
effective
>7 is corrosive to pipes
(pg. 227)
2º: 6.5-8.8 Necessary to manage at all stage of water treatment to ensure satisfactory water clarification and
disinfection, also important to maintain alkalinity and hardness to prevent corrosion or scaling of
pipes (WHO pg. 227).
Total dissolved solids
(TDS) (mg/L) or
Conductivity (µS/cm)
NHS,<600 mg/L good
>1000 mg/L unpalatable
(pg. 228)
2º: 500 Causes unpalatable taste and causes excessive scaling in water pipes, heaters, boilers and
household appliances (WHO pg. 228)
Turbidity
(nephelometric turbidity
units (NTU))
>4 is visible
Chlorination requires
<0.5 with average 0.2 or
less (pg. 228)
Limit: 5
>0.3 95%
of time
Turbidity is a measure of the cloudiness of 8water. It is used to indicate water quality and filtration
effectiveness (e.g., whether disease causing organisms are present). Higher turbidity levels are
often associated with higher levels of disease-causing microorganisms such as viruses, parasites,
and some bacteria. These organisms can cause short term symptoms such as nausea, cramps,
diarrhea, and associated headaches (NPDWR).
Can impact the taste, sediments can cause damage to the distribution system, can cause staining
and interfere with effectiveness of treatment processes (WHO pg. 228)
NHS—No health-based standard
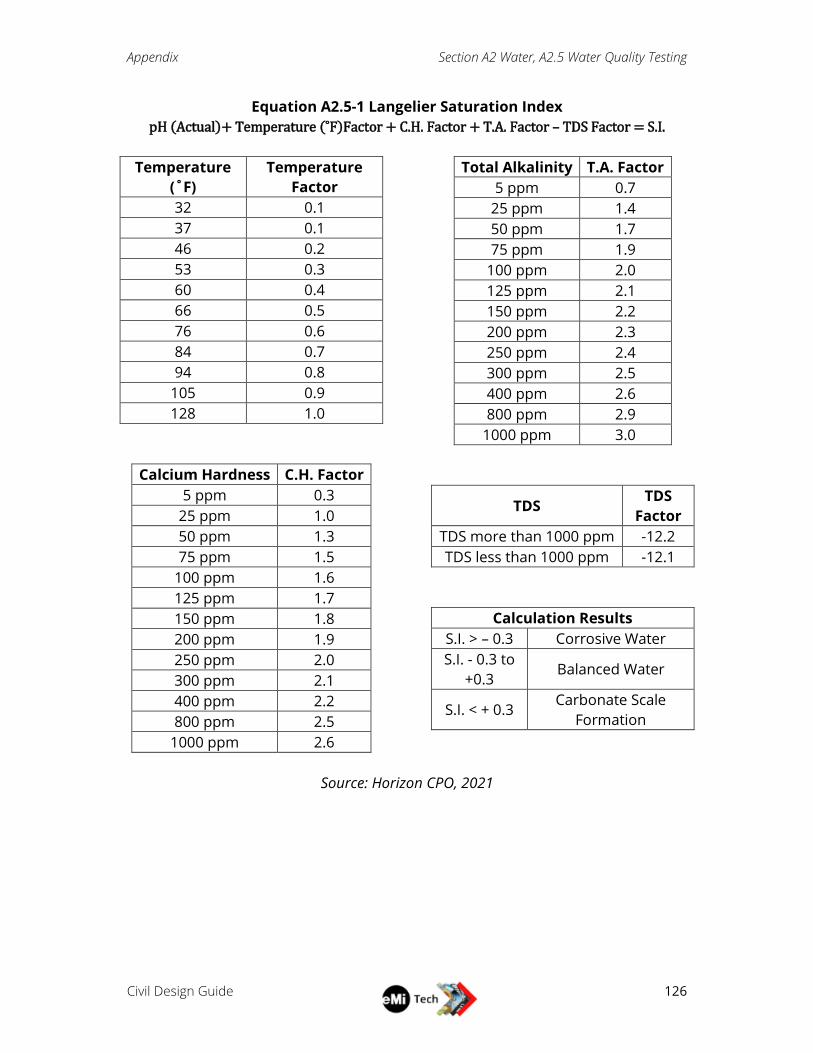
Appendix Section A2 Water, A2.5 Water Quality Testing
Civil Design Guide
126
Equation A2.5-1 Langelier Saturation Index
pH (Actual)+ Temperature (˚F)Factor + C.H. Factor + T.A. Factor – TDS Factor = S.I.
Temperature
(˚F)
Temperature
Factor
32 0.1
37 0.1
46 0.2
53 0.3
60 0.4
66 0.5
76 0.6
84 0.7
94 0.8
105 0.9
128 1.0
Calcium Hardness C.H. Factor
5 ppm 0.3
25 ppm 1.0
50 ppm 1.3
75 ppm 1.5
100 ppm 1.6
125 ppm 1.7
150 ppm 1.8
200 ppm 1.9
250 ppm 2.0
300 ppm 2.1
400 ppm 2.2
800 ppm 2.5
1000 ppm 2.6
Total Alkalinity T.A. Factor
5 ppm 0.7
25 ppm 1.4
50 ppm 1.7
75 ppm 1.9
100 ppm 2.0
125 ppm 2.1
150 ppm 2.2
200 ppm 2.3
250 ppm 2.4
300 ppm 2.5
400 ppm 2.6
800 ppm 2.9
1000 ppm 3.0
TDS TDS
Factor
TDS more than 1000 ppm -12.2
TDS less than 1000 ppm -12.1
Calculation Results
S.I. > – 0.3 Corrosive Water
S.I. - 0.3 to
+0.3 Balanced Water
S.I. < + 0.3 Carbonate Scale
Formation
Source: Horizon CPO, 2021
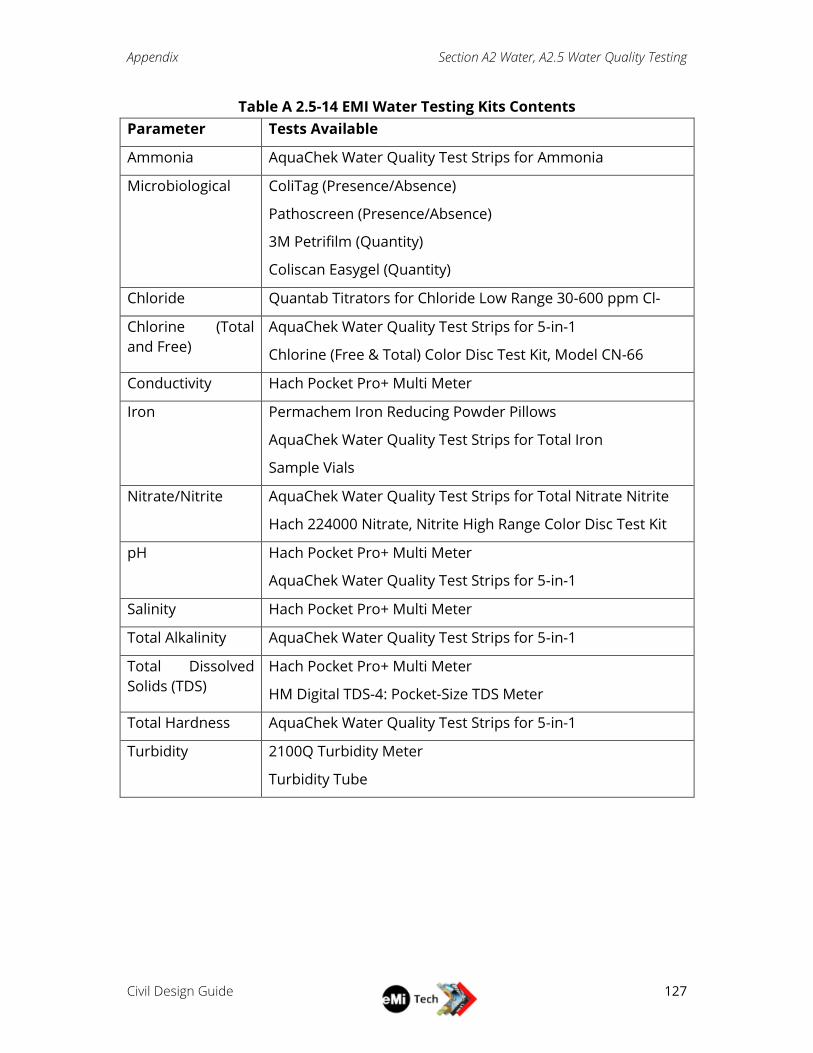
Appendix Section A2 Water, A2.5 Water Quality Testing
Civil Design Guide
127
Table A 2.5-14 EMI Water Testing Kits Contents
Parameter Tests Available
Ammonia AquaChek Water Quality Test Strips for Ammonia
Microbiological ColiTag (Presence/Absence)
Pathoscreen (Presence/Absence)
3M Petrifilm (Quantity)
Coliscan Easygel (Quantity)
Chloride Quantab Titrators for Chloride Low Range 30-600 ppm Cl-
Chlorine (Total
and Free)
AquaChek Water Quality Test Strips for 5-in-1
Chlorine (Free & Total) Color Disc Test Kit, Model CN-66
Conductivity Hach Pocket Pro+ Multi Meter
Iron Permachem Iron Reducing Powder Pillows
AquaChek Water Quality Test Strips for Total Iron
Sample Vials
Nitrate/Nitrite AquaChek Water Quality Test Strips for Total Nitrate Nitrite
Hach 224000 Nitrate, Nitrite High Range Color Disc Test Kit
pH Hach Pocket Pro+ Multi Meter
AquaChek Water Quality Test Strips for 5-in-1
Salinity Hach Pocket Pro+ Multi Meter
Total Alkalinity AquaChek Water Quality Test Strips for 5-in-1
Total Dissolved
Solids (TDS)
Hach Pocket Pro+ Multi Meter
HM Digital TDS-4: Pocket-Size TDS Meter
Total Hardness AquaChek Water Quality Test Strips for 5-in-1
Turbidity 2100Q Turbidity Meter
Turbidity Tube
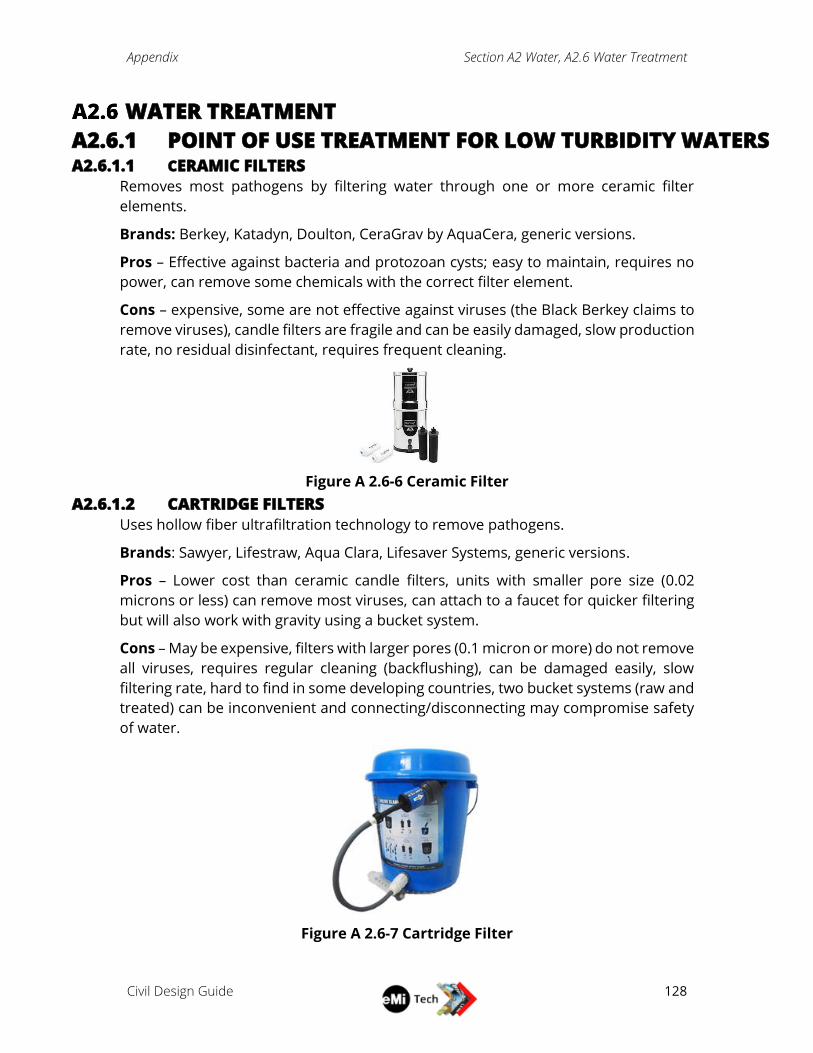
Appendix Section A2 Water, A2.6 Water Treatment
Civil Design Guide
128
WATER TREATMENT
A2.6.1 POINT OF USE TREATMENT FOR LOW TURBIDITY WATERS A2.6.1.1 CERAMIC FILTERS
Removes most pathogens by filtering water through one or more ceramic filter
elements.
Brands: Berkey, Katadyn, Doulton, CeraGrav by AquaCera, generic versions.
Pros – Effective against bacteria and protozoan cysts; easy to maintain, requires no
power, can remove some chemicals with the correct filter element.
Cons – expensive, some are not effective against viruses (the Black Berkey claims to
remove viruses), candle filters are fragile and can be easily damaged, slow production
rate, no residual disinfectant, requires frequent cleaning.
Figure A 2.6-6 Ceramic Filter
A2.6.1.2 CARTRIDGE FILTERS
Uses hollow fiber ultrafiltration technology to remove pathogens.
Brands: Sawyer, Lifestraw, Aqua Clara, Lifesaver Systems, generic versions.
Pros – Lower cost than ceramic candle filters, units with smaller pore size (0.02
microns or less) can remove most viruses, can attach to a faucet for quicker filtering
but will also work with gravity using a bucket system.
Cons – May be expensive, filters with larger pores (0.1 micron or more) do not remove
all viruses, requires regular cleaning (backflushing), can be damaged easily, slow
filtering rate, hard to find in some developing countries, two bucket systems (raw and
treated) can be inconvenient and connecting/disconnecting may compromise safety
of water.
Figure A 2.6-7 Cartridge Filter
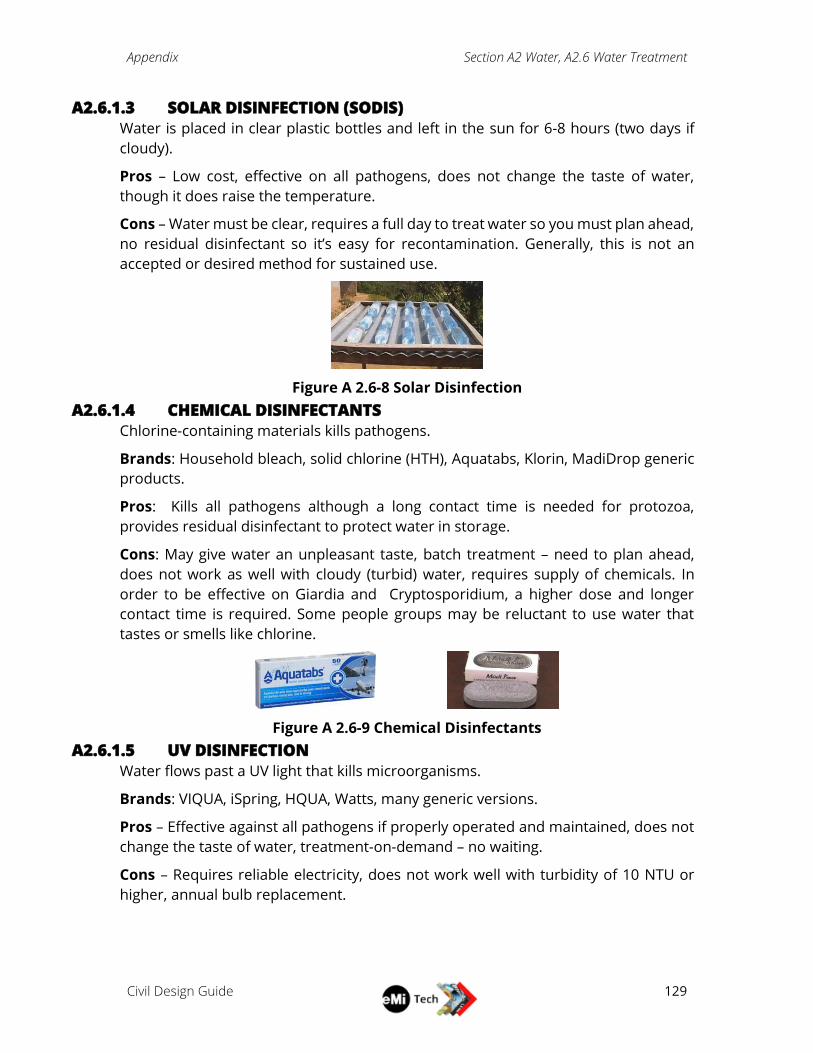
Appendix Section A2 Water, A2.6 Water Treatment
Civil Design Guide
129
A2.6.1.3 SOLAR DISINFECTION (SODIS)
Water is placed in clear plastic bottles and left in the sun for 6-8 hours (two days if
cloudy).
Pros – Low cost, effective on all pathogens, does not change the taste of water,
though it does raise the temperature.
Cons – Water must be clear, requires a full day to treat water so you must plan ahead,
no residual disinfectant so it’s easy for recontamination. Generally, this is not an
accepted or desired method for sustained use.
Figure A 2.6-8 Solar Disinfection
A2.6.1.4 CHEMICAL DISINFECTANTS
Chlorine-containing materials kills pathogens.
Brands: Household bleach, solid chlorine (HTH), Aquatabs, Klorin, MadiDrop generic
products.
Pros: Kills all pathogens although a long contact time is needed for protozoa,
provides residual disinfectant to protect water in storage.
Cons: May give water an unpleasant taste, batch treatment – need to plan ahead,
does not work as well with cloudy (turbid) water, requires supply of chemicals. In
order to be effective on Giardia and Cryptosporidium, a higher dose and longer
contact time is required. Some people groups may be reluctant to use water that
tastes or smells like chlorine.
Figure A 2.6-9 Chemical Disinfectants
A2.6.1.5 UV DISINFECTION
Water flows past a UV light that kills microorganisms.
Brands: VIQUA, iSpring, HQUA, Watts, many generic versions.
Pros – Effective against all pathogens if properly operated and maintained, does not
change the taste of water, treatment-on-demand – no waiting.
Cons – Requires reliable electricity, does not work well with turbidity of 10 NTU or
higher, annual bulb replacement.
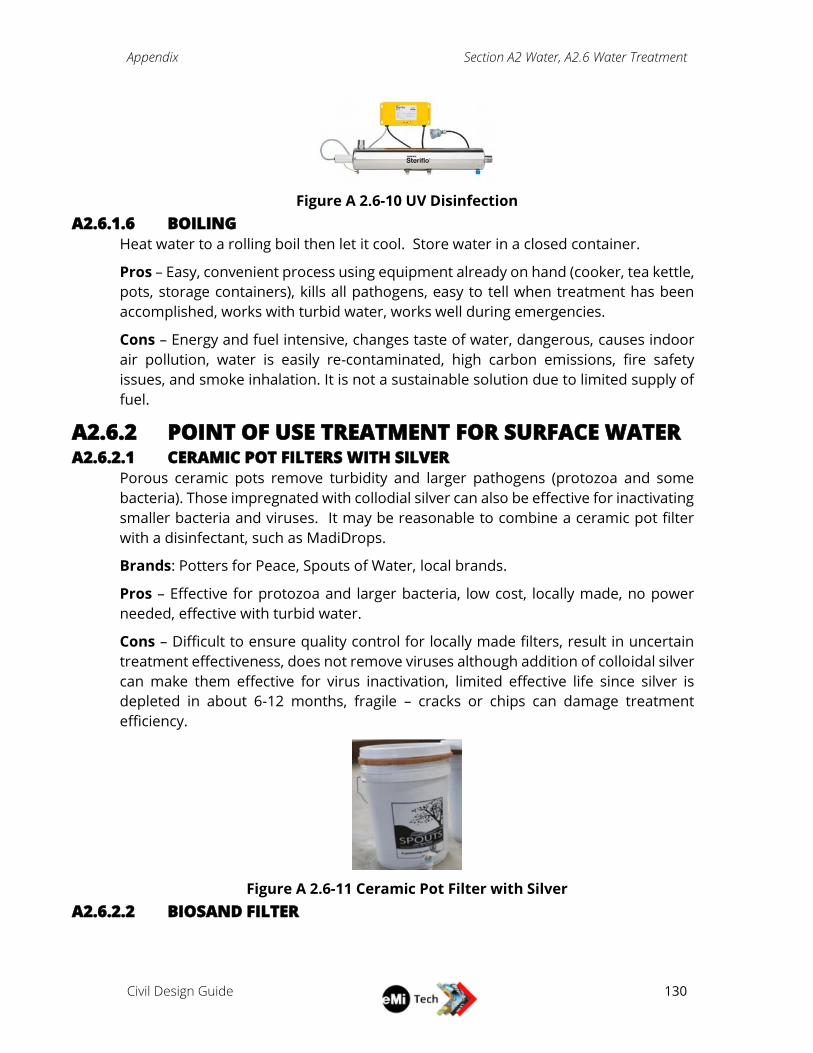
Appendix Section A2 Water, A2.6 Water Treatment
Civil Design Guide
130
Figure A 2.6-10 UV Disinfection
A2.6.1.6 BOILING
Heat water to a rolling boil then let it cool. Store water in a closed container.
Pros – Easy, convenient process using equipment already on hand (cooker, tea kettle,
pots, storage containers), kills all pathogens, easy to tell when treatment has been
accomplished, works with turbid water, works well during emergencies.
Cons – Energy and fuel intensive, changes taste of water, dangerous, causes indoor
air pollution, water is easily re-contaminated, high carbon emissions, fire safety
issues, and smoke inhalation. It is not a sustainable solution due to limited supply of
fuel.
A2.6.2 POINT OF USE TREATMENT FOR SURFACE WATER A2.6.2.1 CERAMIC POT FILTERS WITH SILVER
Porous ceramic pots remove turbidity and larger pathogens (protozoa and some
bacteria). Those impregnated with collodial silver can also be effective for inactivating
smaller bacteria and viruses. It may be reasonable to combine a ceramic pot filter
with a disinfectant, such as MadiDrops.
Brands: Potters for Peace, Spouts of Water, local brands.
Pros – Effective for protozoa and larger bacteria, low cost, locally made, no power
needed, effective with turbid water.
Cons – Difficult to ensure quality control for locally made filters, result in uncertain
treatment effectiveness, does not remove viruses although addition of colloidal silver
can make them effective for virus inactivation, limited effective life since silver is
depleted in about 6-12 months, fragile – cracks or chips can damage treatment
efficiency.
Figure A 2.6-11 Ceramic Pot Filter with Silver
A2.6.2.2 BIOSAND FILTER
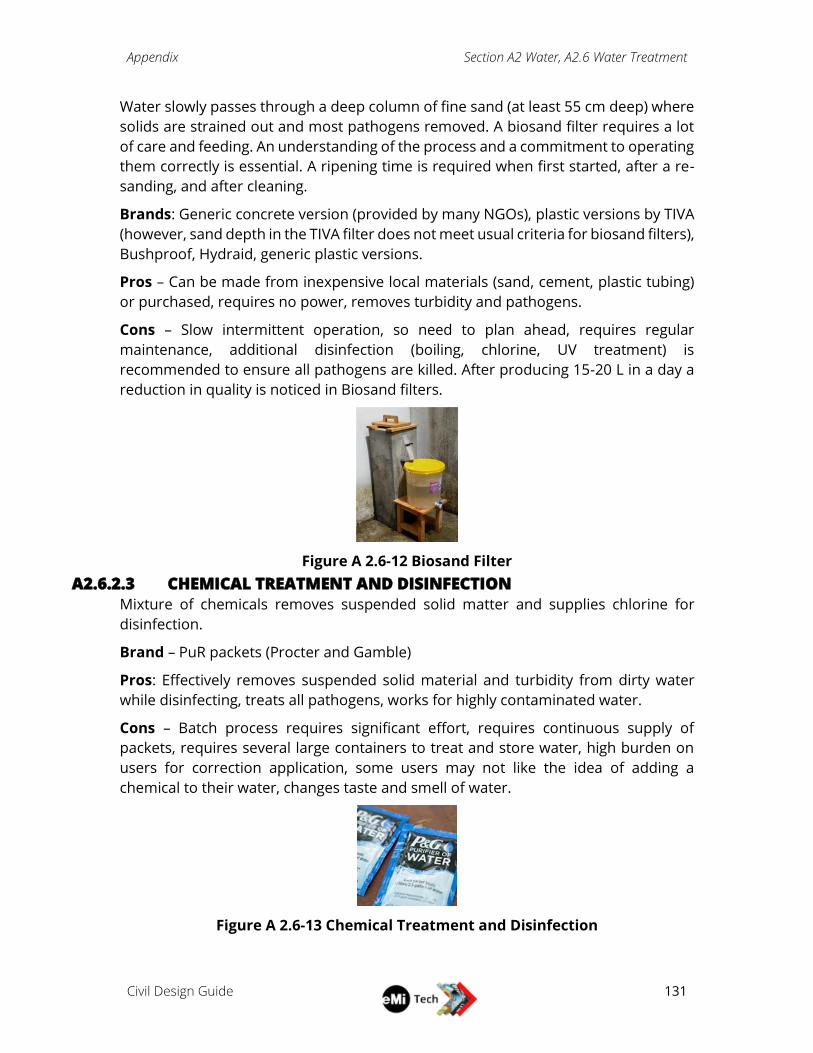
Appendix Section A2 Water, A2.6 Water Treatment
Civil Design Guide
131
Water slowly passes through a deep column of fine sand (at least 55 cm deep) where
solids are strained out and most pathogens removed. A biosand filter requires a lot
of care and feeding. An understanding of the process and a commitment to operating
them correctly is essential. A ripening time is required when first started, after a re-
sanding, and after cleaning.
Brands: Generic concrete version (provided by many NGOs), plastic versions by TIVA
(however, sand depth in the TIVA filter does not meet usual criteria for biosand filters),
Bushproof, Hydraid, generic plastic versions.
Pros – Can be made from inexpensive local materials (sand, cement, plastic tubing)
or purchased, requires no power, removes turbidity and pathogens.
Cons – Slow intermittent operation, so need to plan ahead, requires regular
maintenance, additional disinfection (boiling, chlorine, UV treatment) is
recommended to ensure all pathogens are killed. After producing 15-20 L in a day a
reduction in quality is noticed in Biosand filters.
Figure A 2.6-12 Biosand Filter
A2.6.2.3 CHEMICAL TREATMENT AND DISINFECTION
Mixture of chemicals removes suspended solid matter and supplies chlorine for
disinfection.
Brand – PuR packets (Procter and Gamble)
Pros: Effectively removes suspended solid material and turbidity from dirty water
while disinfecting, treats all pathogens, works for highly contaminated water.
Cons – Batch process requires significant effort, requires continuous supply of
packets, requires several large containers to treat and store water, high burden on
users for correction application, some users may not like the idea of adding a
chemical to their water, changes taste and smell of water.
Figure A 2.6-13 Chemical Treatment and Disinfection
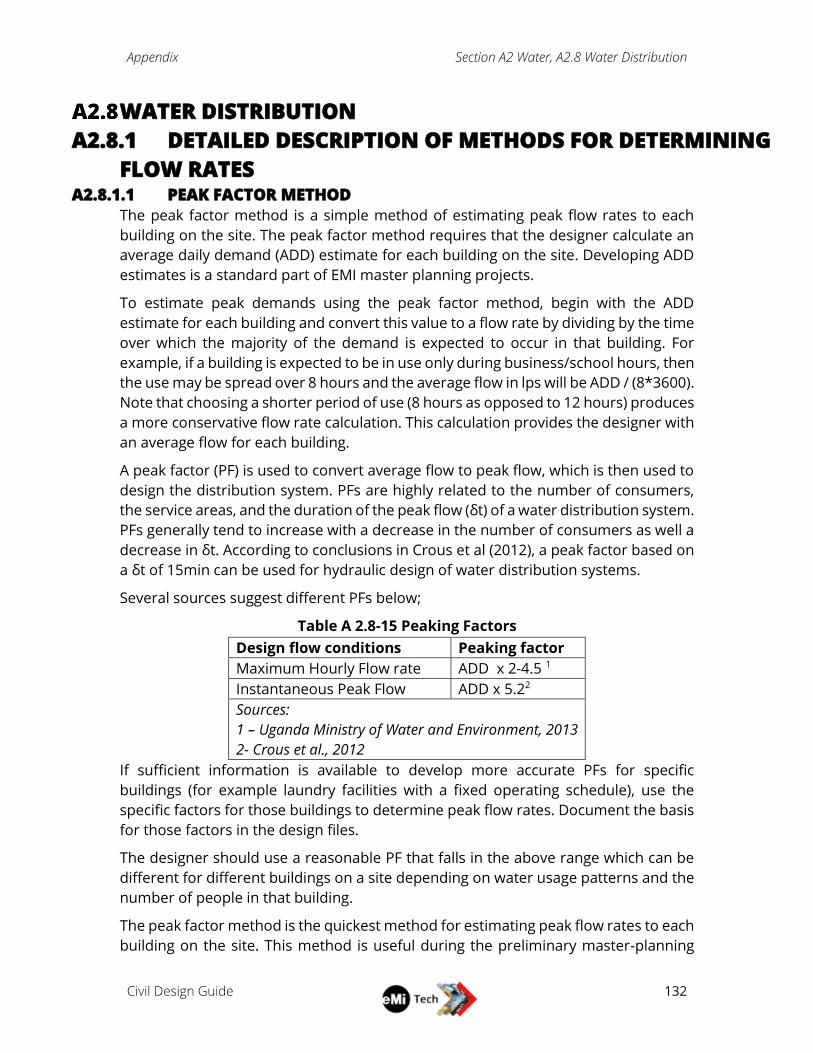
Appendix Section A2 Water, A2.8 Water Distribution
Civil Design Guide
132
WATER DISTRIBUTION
A2.8.1 DETAILED DESCRIPTION OF METHODS FOR DETERMINING
FLOW RATES A2.8.1.1 PEAK FACTOR METHOD
The peak factor method is a simple method of estimating peak flow rates to each
building on the site. The peak factor method requires that the designer calculate an
average daily demand (ADD) estimate for each building on the site. Developing ADD
estimates is a standard part of EMI master planning projects.
To estimate peak demands using the peak factor method, begin with the ADD
estimate for each building and convert this value to a flow rate by dividing by the time
over which the majority of the demand is expected to occur in that building. For
example, if a building is expected to be in use only during business/school hours, then
the use may be spread over 8 hours and the average flow in lps will be ADD / (8*3600).
Note that choosing a shorter period of use (8 hours as opposed to 12 hours) produces
a more conservative flow rate calculation. This calculation provides the designer with
an average flow for each building.
A peak factor (PF) is used to convert average flow to peak flow, which is then used to
design the distribution system. PFs are highly related to the number of consumers,
the service areas, and the duration of the peak flow (δt) of a water distribution system.
PFs generally tend to increase with a decrease in the number of consumers as well a
decrease in δt. According to conclusions in Crous et al (2012), a peak factor based on
a δt of 15min can be used for hydraulic design of water distribution systems.
Several sources suggest different PFs below;
Table A 2.8-15 Peaking Factors
Design flow conditions Peaking factor
Maximum Hourly Flow rate ADD x 2-4.5 1
Instantaneous Peak Flow ADD x 5.22
Sources:
1 – Uganda Ministry of Water and Environment, 2013
2- Crous et al., 2012
If sufficient information is available to develop more accurate PFs for specific
buildings (for example laundry facilities with a fixed operating schedule), use the
specific factors for those buildings to determine peak flow rates. Document the basis
for those factors in the design files.
The designer should use a reasonable PF that falls in the above range which can be
different for different buildings on a site depending on water usage patterns and the
number of people in that building.
The peak factor method is the quickest method for estimating peak flow rates to each
building on the site. This method is useful during the preliminary master-planning
Appendix Section A2 Water, A2.8 Water Distribution
Civil Design Guide
133
stages when ADD has been estimated for each building, but the exact number of
fixtures in each building has not yet been determined.
While the peak factor method is a widely used method and is useful for generating
quick, conceptual designs, it should not be used as the sole basis for design on
detailed design projects for the following reasons:
The peak factor method relies on estimates of ADD for each building. ADD
calculations require a large amount of engineering judgment and may not
provide an accurate starting point for calculation of peak flow.
Engineering judgment is required to estimate the number of hours of usage
for each building.
While research generally points toward using a peak factor of 2-5, this is a
large range and it can be difficult to decide what peak factor to use for a
given building.
The peak factor method is based purely on ADD and assumptions about the
usage patterns in the building and it does not take into account the number
of fixtures which are present in the building. This can lead to peak flow
estimates which are not grounded in the physical realities of the building
plumbing design.
Appendix Section A2 Water, A2.8 Water Distribution
Civil Design Guide
134
A2.8.1.2 FIXTURE COUNT METHOD
The fixture count method does not rely on the ADD but only on the number and types
of fixtures present in each building.
This method assumes a flow rate per fixture (that may vary by type of fixture) and
then multiplies this by the number of fixtures that are expected to be in operation
during peak time.
EMI has typically assigned a flow rate of between 0.08 lps and 0.12 lps to each fixture.
While there are tables which list recommended minimum flow rates for various types
of fixtures, these tables are generally produced for countries which demand higher
flow rates than typically expected on EMI projects.
Determining an appropriate flow rate to apply to each fixture is an area of ongoing
research within EMI. The following are some justifications for the currently used rates
of 0.08 lps to 0.12 lps:
While a choice of 0.08 lps to 0.12 lps may seem a bit low, the designer should
think of this as the minimum acceptable flow rate for each fixture.
Throughout the majority of the day, fixtures will experience higher flow
rates than this, but may drop down to 0.08 lps during peak times of water
usage on the site.
At 0.08 lps, it would take around 4 minutes to fill a 20-liter jerry can or about
a minute to fill a typical toilet tank. This is slow, but may be acceptable
during times of heavy water usage on the site.
The designer must not only apply a flow rate to each fixture, but must
decide how many fixtures are likely to be on at a given peak time. This
determination requires engineering judgement and a strong understanding
of water usage patterns. Some examples are below:
In determining the peak flow to a school kitchen which has 10 taps for dish
washing, it should be assumed that all 10 of these taps will be on at one
time while the students queue up to wash dishes.
In a residential bathroom that contains a sink, toilet, and shower; it should
be assumed that only 2 of those fixtures will be in operation at a given time
(toilet tank filling while hands are being washed).
While the designer should consider various scenarios for each building, it is
common practice to assume that 50% to 75% percent of fixtures will be on
at peak time.
The fixture count method requires a strong understanding of the usage and fixtures
of each building on the site. While the fixture count method requires engineering
judgement in the determination of a flow rate for each fixture and an estimate of
number of fixtures being used at a peak time, it is more grounded in actual project
parameters than the peak factor method.

Appendix Section A2 Water, A2.8 Water Distribution
Civil Design Guide
135
To demonstrate the advantage of the fixture, count method, imagine a school kitchen
that cooks for hundreds of students but only has three fixtures in the building. Given
the high number of students, the ADD will be high, and the peak factor method will
produce a very high estimate of peak flows. It is possible that the peak factor method
would produce a flow rate that is not physically possible given the presence of only
three fixtures. The fixture count method would simply assume that all three fixtures
will be on at a given time and therefore produce of flow rate estimate that is more
grounded in the reality of the building design.
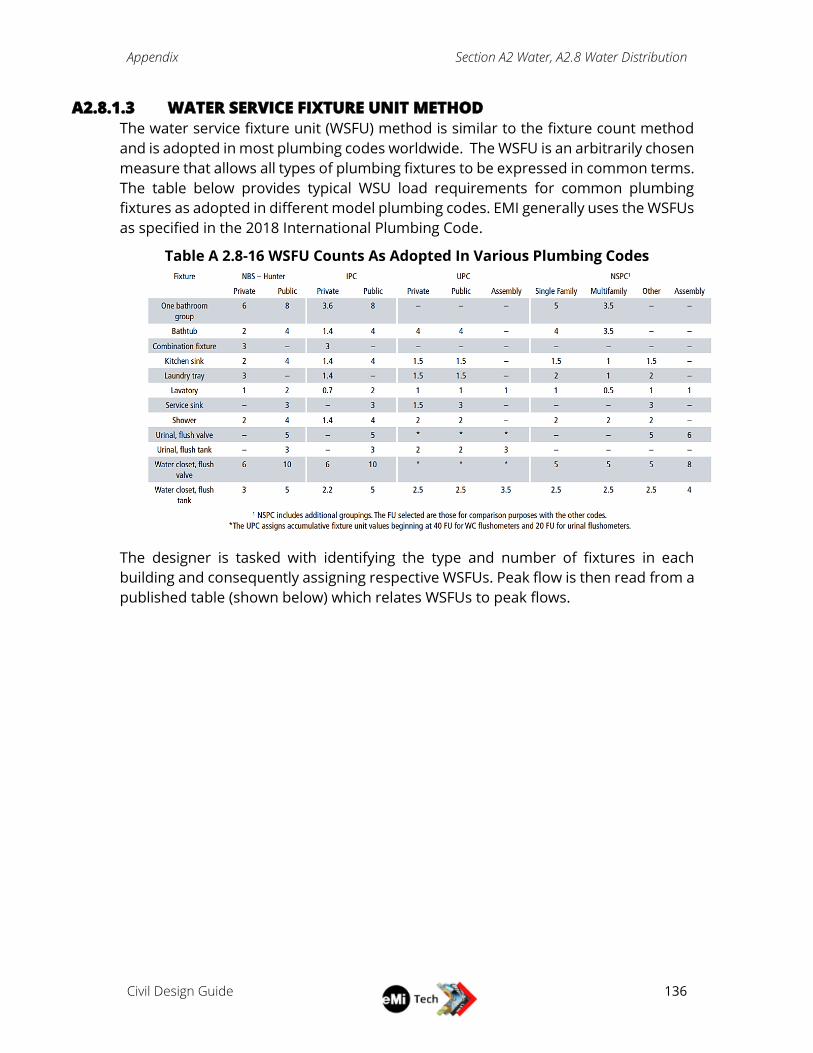
Appendix Section A2 Water, A2.8 Water Distribution
Civil Design Guide
136
A2.8.1.3 WATER SERVICE FIXTURE UNIT METHOD
The water service fixture unit (WSFU) method is similar to the fixture count method
and is adopted in most plumbing codes worldwide. The WSFU is an arbitrarily chosen
measure that allows all types of plumbing fixtures to be expressed in common terms.
The table below provides typical WSU load requirements for common plumbing
fixtures as adopted in different model plumbing codes. EMI generally uses the WSFUs
as specified in the 2018 International Plumbing Code.
Table A 2.8-16 WSFU Counts As Adopted In Various Plumbing Codes
The designer is tasked with identifying the type and number of fixtures in each
building and consequently assigning respective WSFUs. Peak flow is then read from a
published table (shown below) which relates WSFUs to peak flows.
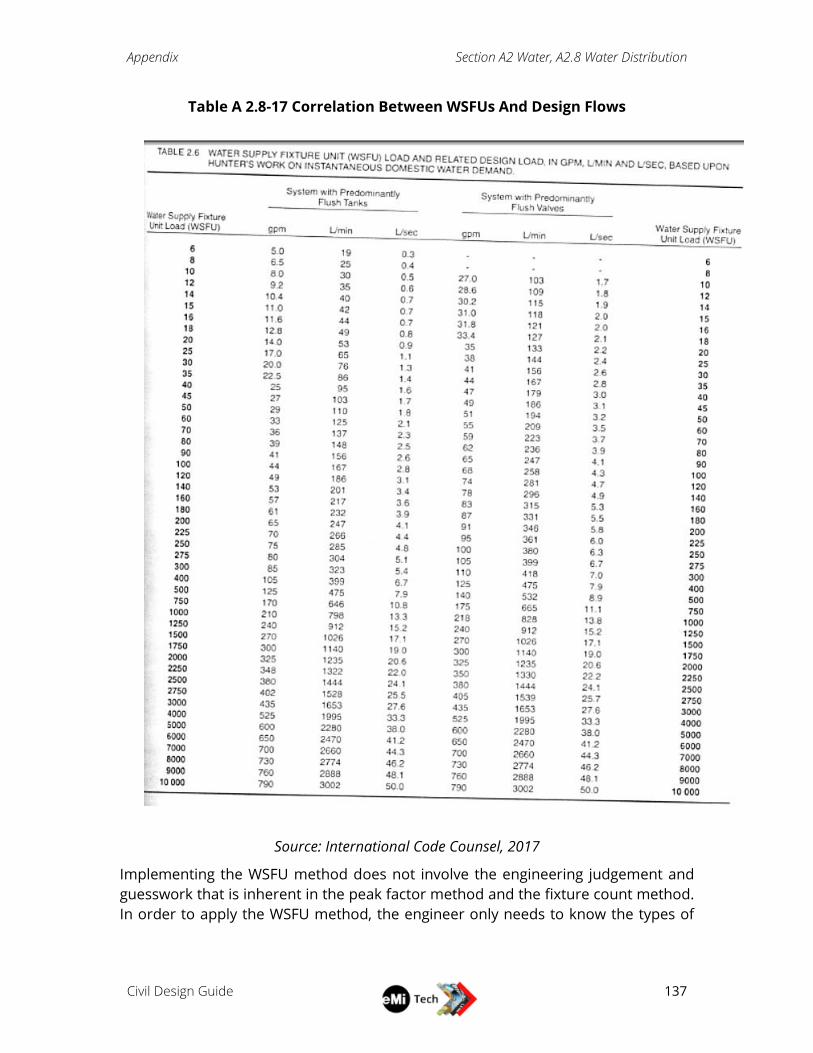
Appendix Section A2 Water, A2.8 Water Distribution
Civil Design Guide
137
Table A 2.8-17 Correlation Between WSFUs And Design Flows
Source: International Code Counsel, 2017
Implementing the WSFU method does not involve the engineering judgement and
guesswork that is inherent in the peak factor method and the fixture count method.
In order to apply the WSFU method, the engineer only needs to know the types of
Appendix Section A2 Water, A2.8 Water Distribution
Civil Design Guide
138
fixtures in the building and can then read the appropriate design flow rates from
published charts.
While the fixture count method requires the designer to estimate how many fixtures
will be in use during peak time, the WSFU method automatically accounts for this
factor. The relationship between the total number of WSFUs in a system and the
design flow rate is not linear. The relationship was developed through research as
well as statistical methods to determine an appropriate flow rate for a given number
of WSFUs, taking into account the fact that not all fixture will be on at once. The
example below demonstrates the value of this method:
Imagine that you are designing a small office building with only three fixtures. It would
be logical to design assuming that all three of those fixtures will be on at one time.
Now imagine that you are designing an airport with 500 fixtures. If you were to design
assuming that all 500 fixtures were on, you would massively overdesign the piping in
the building. The WSFU charts automatically account for the fact that the larger the
number of WSFUs in the project, the smaller percentage of fixtures will be on at one
time. The WSFU method can be used to calculate a peak flow rate for a small building
with a few fixtures all the way to the peak flow rate for a city with thousands of fixtures
– automatically accounting for the ratio of fixtures that are likely to be on at one time.
While the WSFU method eliminates some of the guesswork inherent in the other
methods, it still requires engineering judgement in its application to water
distribution modelling. Imagine a site with 10 dormitories. If the WSFU method is used
to determine the peak flow to a single dorm, and then that number is multiplied by
10, the resulting flow rate will be significantly higher than if the WSFUs for all 10 dorms
are added together, and then the flow rate is read from the chart. Again, this is
because the relationship between WSFUs and peak flow is not linear. If the WSFU
method is used to calculate a peak flow for each building on a site and then that peak
flow is applied to the model, the model will be overly conservative.
Appendix Section A2 Water, A2.8 Water Distribution
Civil Design Guide
139
A2.8.1.4 RECOMMENDED PROCESS FOR WATER DISTRIBUTION
Different methods of calculating peak flows and different assumption about timing
of water usage onsite can produce dramatically differing results and engineering
judgment is always needed in the design of water distribution systems. The designer
must have a very thorough understand of the fixtures and usage patterns on the site
as well as a strong understanding of the benefits and downfalls of each of the peak
flow calculation methods discussed above.
The following process is recommended in designing site distribution systems:
Calculate the peak flow to each building using the peak factor method
Calculate the peak flow to each building using the fixture count method
Compare the two methods and determine which to use for each building. If there
are dramatic differences between the results from the two methods, try to
understand where the differences come from.
On most EMI projects, the pressure in the system is provided by the elevation of
the storage tank. Model the system under the scenario where the tank is nearly
empty. Do this by setting the elevation of the tank 0.50M above the height of the
stand. This ensures that you are modelling the limiting scenario; when the tank is
full, pressures will be higher.
When building the water distribution model, it is usually acceptable to create one
node per building and apply the peak flow for the entire building at that single
node. Set the elevation of this node at the elevation of the highest fixture in the
building.
Run the model under several different scenarios, remembering that it is not likely
for all the buildings on the site to experience their peak flows at the same time of
day.
Once you have a “worst case scenario” that you feel is representative for the
design of the distribution system, calculate the total flow in the system by
summing all of the flows to the buildings.
Use the WSFU method to determine a peak flow for the entire site.
If the WSFU method yields a peak flow that is dramatically higher than your model;
you may have underestimated some flow rates. If the WSFU method yields a peak
flow that is lower that your model; you are likely overestimating the peak flow
rates.
Adjust peak flow rates as needed based on engineering judgment and a
comparison of the three peak flow calculation methods.
Run the model under several different scenarios and ensure that minimum
acceptable pressures are maintained. The goal is to have a minimum of 2.0 meters
of residual head at each fixture within the building. If you have modeled the entire

Appendix Section A2 Water, A2.8 Water Distribution
Civil Design Guide
140
building as a single node, make sure that the node has a minimum residual
pressure of 2.3 meters. Experience on past projects leads to the estimate that
about 0.30 meters of head will be lost to friction within the interior building piping
system.
If the model is producing unacceptably low pressures the following are some ways
to increase the pressure in the system:
o Increase sizes of critical pipes. In EPAnet you can view the unit head loss in
each pipe and quickly see which pipes might be undersized.
o Add extra loops/connecting pipes into the system.
o Branch the system as early as possible. The pipe coming out of the tank
will have the highest flow rate and likely high friction losses. Branch the
system early to shorten the distance in which the flow for the entire site is
contained in a single pipe.
o Increase the height of the tank stand.
Appendix Section A2 Water, A2.8 Water Distribution
Civil Design Guide
141
A2.8.2 EMI EPANET GUIDELINES Introduction
EPAnet is a modeling software that runs a simulation of hydraulic and water quality
behavior within pressurized pipe networks. EMI uses EPAnet to model and design
water distribution systems. This guide is not intended to be comprehensive, but
simply to give some guidance on how to set up an EPAnet model. Consult the EPAnet
user manual for further guidance on using the program.
Further EPAnet Guidance can be found: R2.8 Water Distribution
Downloading EPAnet Program
EPAnet is a free resource provided by the United States Environmental Protection
Agency (EPA) and can be found at this website: https://www.epa.gov/water-
research/epanet.
Setting up the Model
Dimensions (View >> Dimensions) enable user to set map units (in EMI, we will be
using meters)
The title can be set in the Summary menu, found in the Project tab (this title will be
the label for the printed document)
EMI Standards
I. Defaults (Projects >> Defaults) enable the user to set different properties of
the model
Properties – set physical parameters of the model.
Pipe Roughness: coefficient for the model. Use 140 for HDPE/PP-R pipe (double check
is using different pipe material).
Hydraulics – Other hydraulic parameters.
Flow Units: Use Liters per second (LPS).
Headloss Formula: Use Hazen Williams (H-W).
For gravity-flow pipe applications, such as irrigation delivery pipelines or water-supply
pipelines from reservoirs or diversion points higher in elevation than the site,
Manning’s Equation is typically used.
II. Junction Settings
Elevation
Type Guideline
Underground 0.5 m below ground
Tank Outlet elevation + 0.5 m
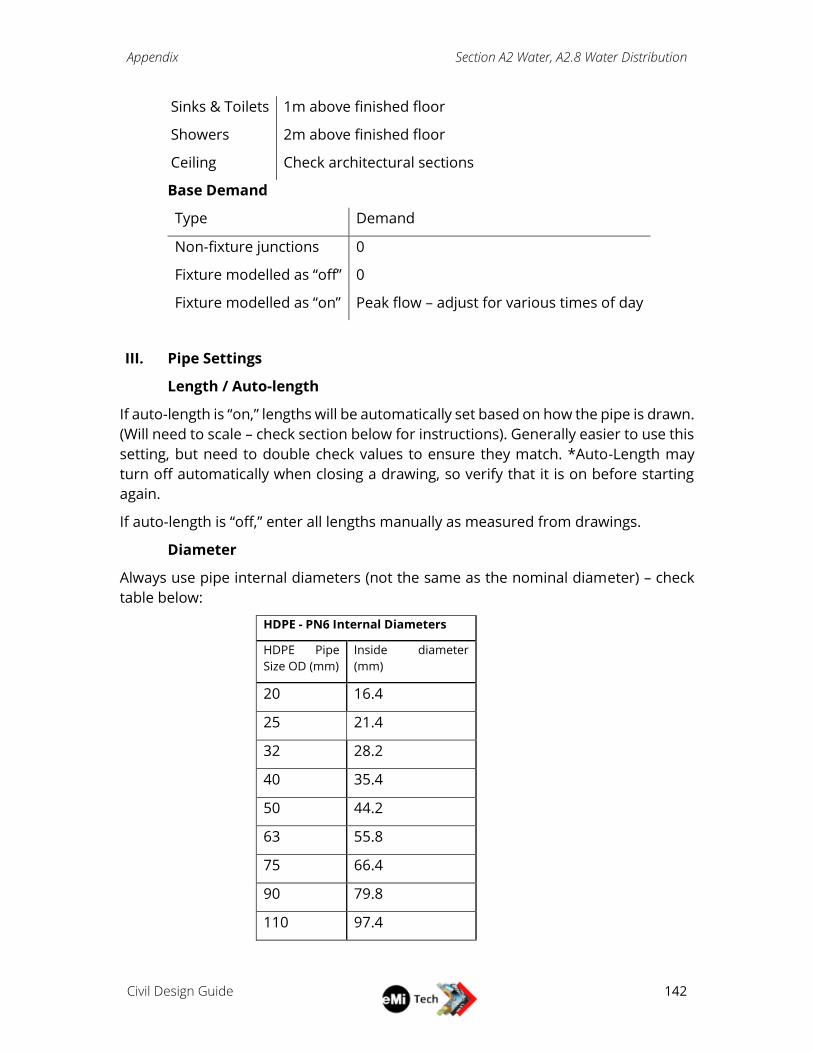
Appendix Section A2 Water, A2.8 Water Distribution
Civil Design Guide
142
Base Demand
Type Demand
Non-fixture junctions 0
Fixture modelled as “off” 0
Fixture modelled as “on” Peak flow – adjust for various times of day
III. Pipe Settings
Length / Auto-length
If auto-length is “on,” lengths will be automatically set based on how the pipe is drawn.
(Will need to scale – check section below for instructions). Generally easier to use this
setting, but need to double check values to ensure they match. *Auto-Length may
turn off automatically when closing a drawing, so verify that it is on before starting
again.
If auto-length is “off,” enter all lengths manually as measured from drawings.
Diameter
Always use pipe internal diameters (not the same as the nominal diameter) – check
table below:
HDPE - PN6 Internal Diameters
HDPE Pipe
Size OD (mm)
Inside diameter
(mm)
20 16.4
25 21.4
32 28.2
40 35.4
50 44.2
63 55.8
75 66.4
90 79.8
110 97.4
Sinks & Toilets 1m above finished floor
Showers 2m above finished floor
Ceiling Check architectural sections
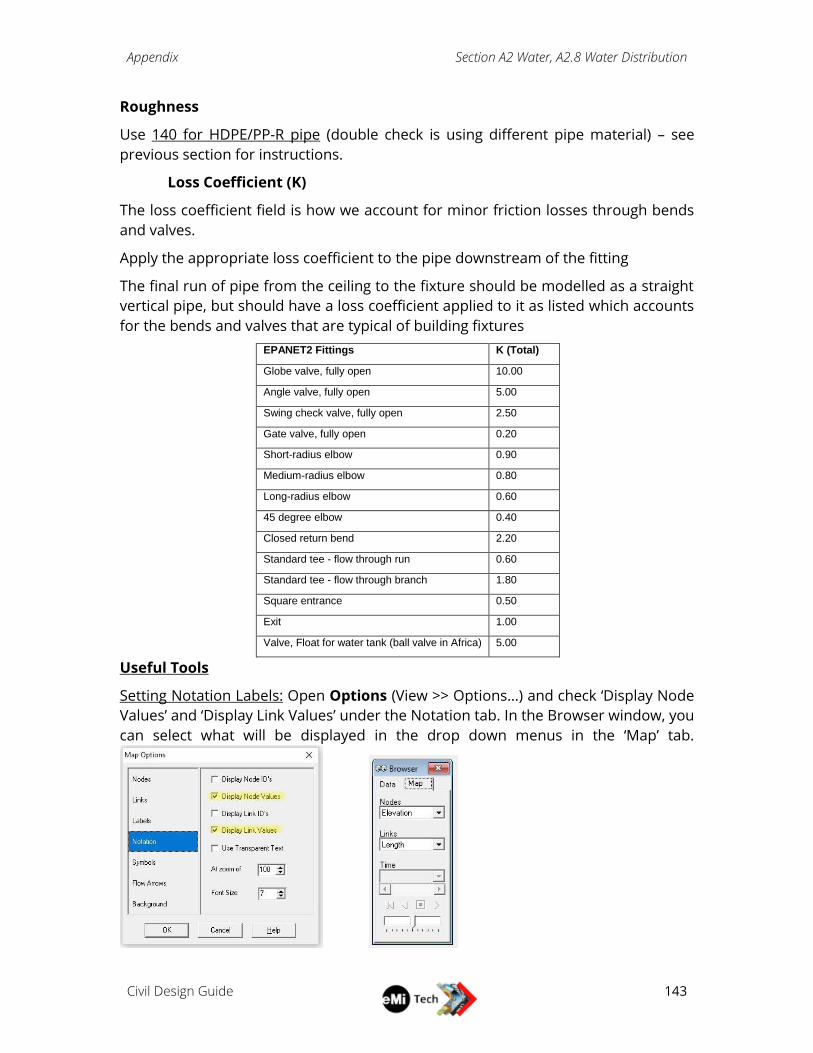
Appendix Section A2 Water, A2.8 Water Distribution
Civil Design Guide
143
Roughness
Use 140 for HDPE/PP-R pipe (double check is using different pipe material) – see
previous section for instructions.
Loss Coefficient (K)
The loss coefficient field is how we account for minor friction losses through bends
and valves.
Apply the appropriate loss coefficient to the pipe downstream of the fitting
The final run of pipe from the ceiling to the fixture should be modelled as a straight
vertical pipe, but should have a loss coefficient applied to it as listed which accounts
for the bends and valves that are typical of building fixtures
EPANET2 Fittings K (Total)
Globe valve, fully open 10.00
Angle valve, fully open 5.00
Swing check valve, fully open 2.50
Gate valve, fully open 0.20
Short-radius elbow 0.90
Medium-radius elbow 0.80
Long-radius elbow 0.60
45 degree elbow 0.40
Closed return bend 2.20
Standard tee - flow through run 0.60
Standard tee - flow through branch 1.80
Square entrance 0.50
Exit 1.00
Valve, Float for water tank (ball valve in Africa) 5.00
Useful Tools
Setting Notation Labels: Open Options (View >> Options…) and check ‘Display Node
Values’ and ‘Display Link Values’ under the Notation tab. In the Browser window, you
can select what will be displayed in the drop down menus in the ‘Map’ tab.
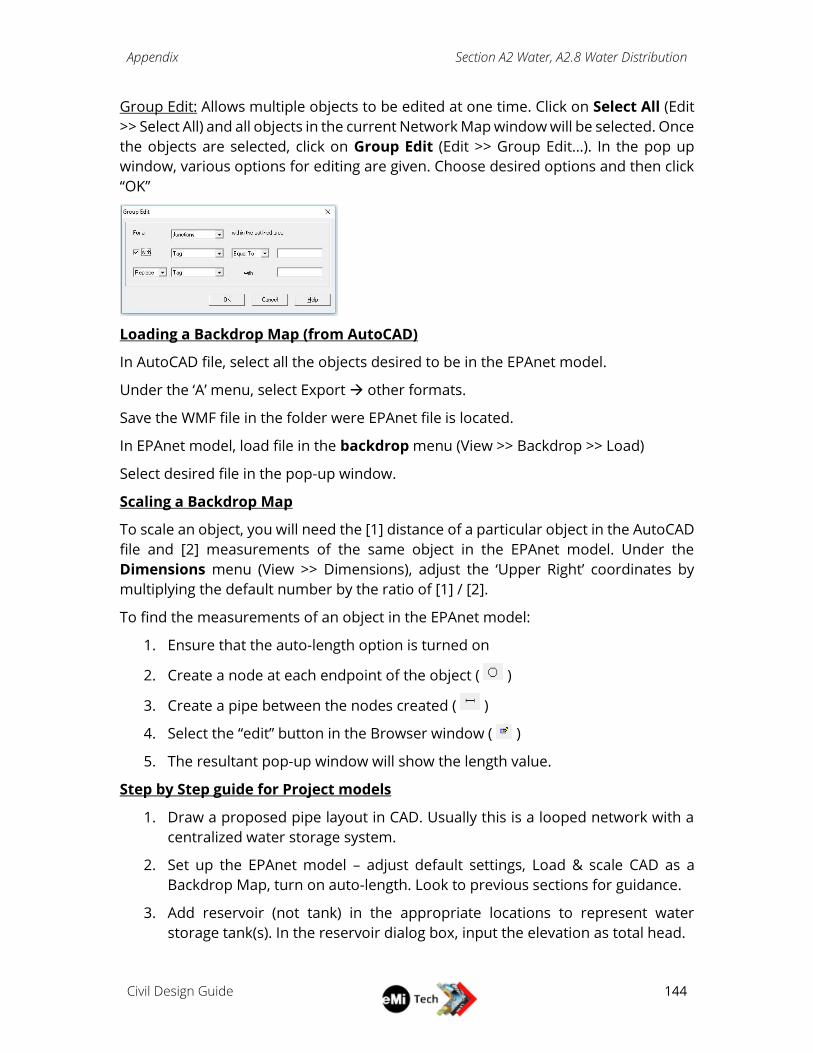
Appendix Section A2 Water, A2.8 Water Distribution
Civil Design Guide
144
Group Edit: Allows multiple objects to be edited at one time. Click on Select All (Edit
>> Select All) and all objects in the current Network Map window will be selected. Once
the objects are selected, click on Group Edit (Edit >> Group Edit…). In the pop up
window, various options for editing are given. Choose desired options and then click
“OK”
Loading a Backdrop Map (from AutoCAD)
In AutoCAD file, select all the objects desired to be in the EPAnet model.
Under the ‘A’ menu, select Export other formats.
Save the WMF file in the folder were EPAnet file is located.
In EPAnet model, load file in the backdrop menu (View >> Backdrop >> Load)
Select desired file in the pop-up window.
Scaling a Backdrop Map
To scale an object, you will need the [1] distance of a particular object in the AutoCAD
file and [2] measurements of the same object in the EPAnet model. Under the
Dimensions menu (View >> Dimensions), adjust the ‘Upper Right’ coordinates by
multiplying the default number by the ratio of [1] / [2].
To find the measurements of an object in the EPAnet model:
1. Ensure that the auto-length option is turned on
2. Create a node at each endpoint of the object ( )
3. Create a pipe between the nodes created ( )
4. Select the “edit” button in the Browser window ( )
5. The resultant pop-up window will show the length value.
Step by Step guide for Project models
1. Draw a proposed pipe layout in CAD. Usually this is a looped network with a
centralized water storage system.
2. Set up the EPAnet model – adjust default settings, Load & scale CAD as a
Backdrop Map, turn on auto-length. Look to previous sections for guidance.
3. Add reservoir (not tank) in the appropriate locations to represent water
storage tank(s). In the reservoir dialog box, input the elevation as total head.

Appendix Section A2 Water, A2.8 Water Distribution
Civil Design Guide
145
4. Add junctions at every building and at major pipe branches. Set elevations and
base demand as described above. For most models, it is appropriate to model
an entire building as a single node. Set the elevation of the building node as
the elevation of the highest fixture in that building.
5. Connect adjacent junctions by adding pipes to form the network proposed in
1) above. Estimate pipe diameters to start.
6. Run the model. The run will either be successful or return some errors.
7. Adjust the system (pipe layout, pipe diameters, height of tank stands) until he
pressures in the system are acceptable.
8. Run the model under various peak flow assumptions. Think through various
times of day and the varying water use patterns that the site might experience.
You can run various flow scenarios either by using the demand pattern
function in EPAnet or by save several copies of the model, each with different
flow inputs.
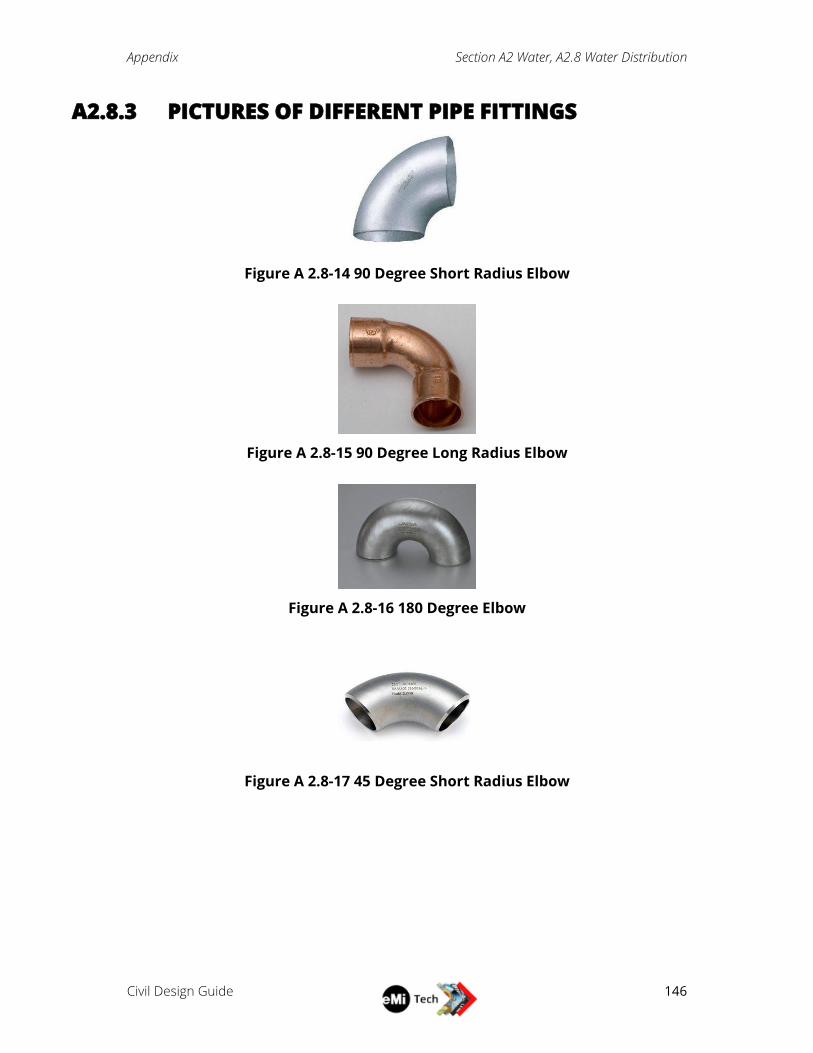
Appendix Section A2 Water, A2.8 Water Distribution
Civil Design Guide
146
A2.8.3 PICTURES OF DIFFERENT PIPE FITTINGS
Figure A 2.8-14 90 Degree Short Radius Elbow
Figure A 2.8-15 90 Degree Long Radius Elbow
Figure A 2.8-16 180 Degree Elbow
Figure A 2.8-17 45 Degree Short Radius Elbow
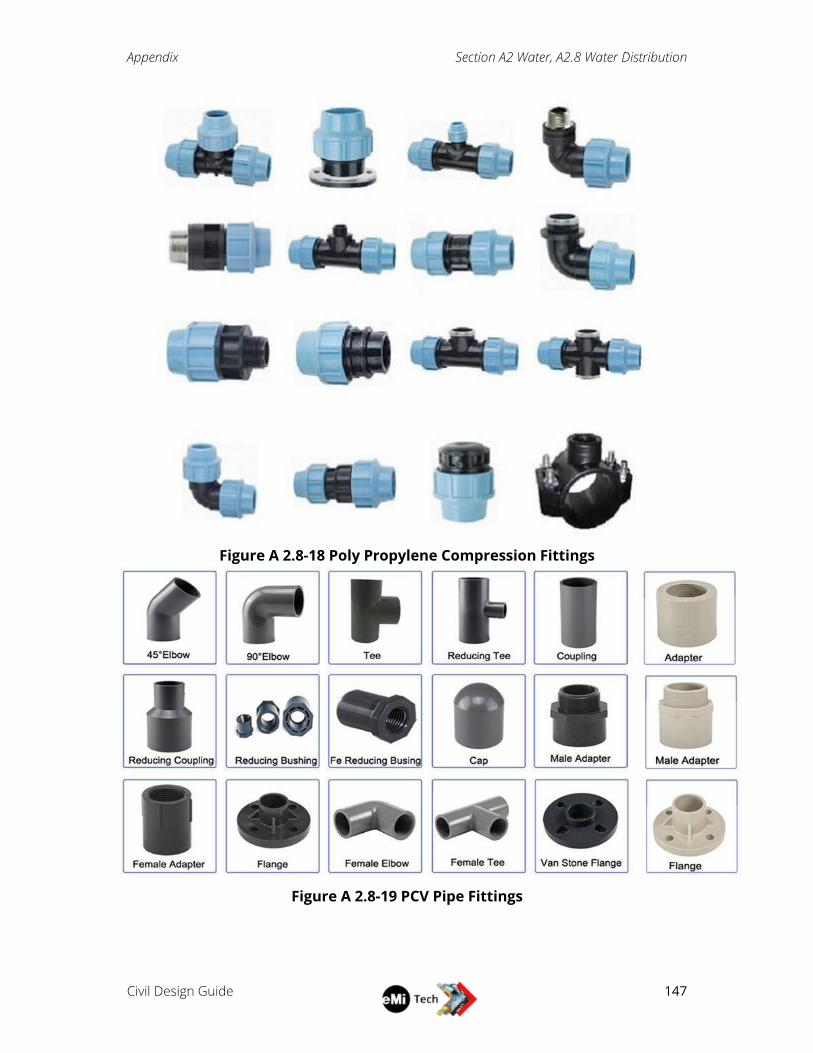
Appendix Section A2 Water, A2.8 Water Distribution
Civil Design Guide
147
Figure A 2.8-18 Poly Propylene Compression Fittings
Figure A 2.8-19 PCV Pipe Fittings

Appendix Section A3 Geotechnical, A3.1 Soil Classification
Civil Design Guide
148
Geotechnical
SOIL CLASSIFICATION
A3.1.1 TEST PROCEDURES MANUAL TESTS A3.1.1.1 SOIL PAT IN HAND
Distinguish between fine sand and fines (silt and clay):
Take soil and rub in the palm of your hand
Turn palms down and shake
Sand grains will fall off; silt and clay will stick.
Distinguish between clay and silt:
Place soil in hand with palm facing upward.
Mix soil with some water until the soil is moldable and form into pat (see figure
below)
Firmly tap edge of hand for 5 to 10 seconds
Silt: surface of the soil starts shining and the water rises to the surface;
Clay: water does not rise to the surface.
o Clay will also feel stickier than silt when wet.
Figure A 3.1-20 Soil Pat in Hand
A3.1.1.2 FEEL TEST
Rub some moist soil between fingers
Sand feels gritty
Silt feels smooth (or soapy)
Clay feels sticky (or greasy)
A3.1.1.3 BALL SQUEEZE TEST
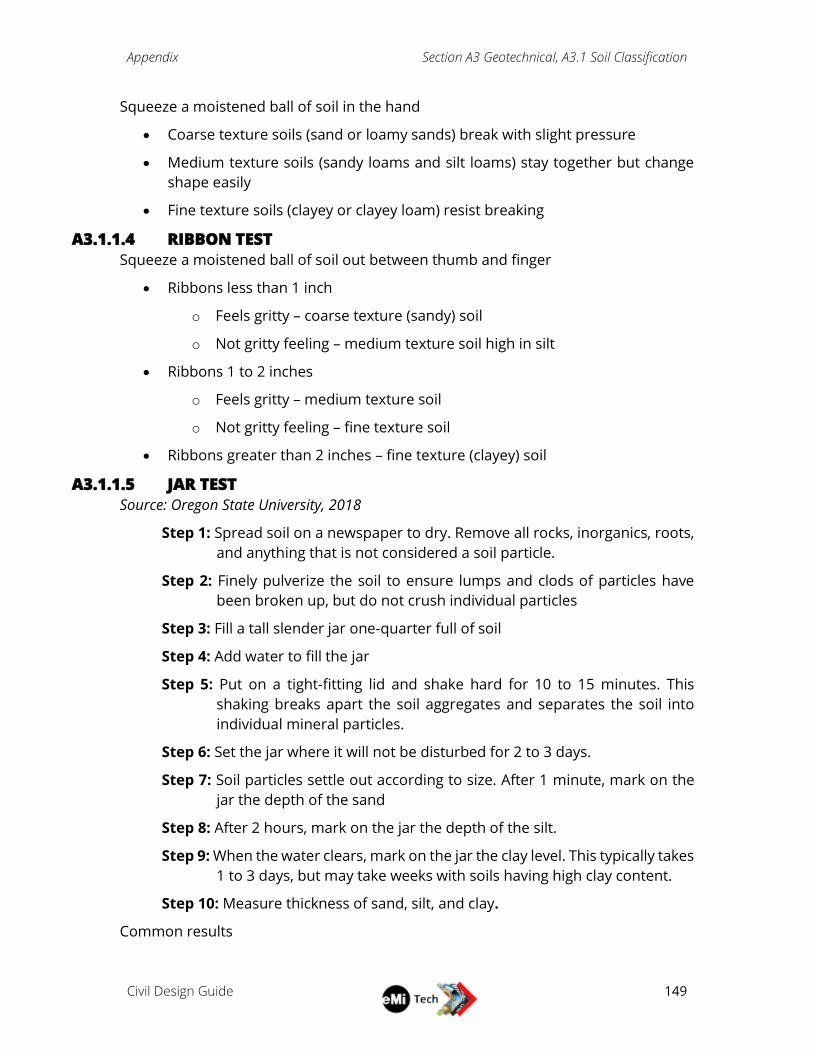
Appendix Section A3 Geotechnical, A3.1 Soil Classification
Civil Design Guide
149
Squeeze a moistened ball of soil in the hand
Coarse texture soils (sand or loamy sands) break with slight pressure
Medium texture soils (sandy loams and silt loams) stay together but change
shape easily
Fine texture soils (clayey or clayey loam) resist breaking
A3.1.1.4 RIBBON TEST
Squeeze a moistened ball of soil out between thumb and finger
Ribbons less than 1 inch
o Feels gritty – coarse texture (sandy) soil
o Not gritty feeling – medium texture soil high in silt
Ribbons 1 to 2 inches
o Feels gritty – medium texture soil
o Not gritty feeling – fine texture soil
Ribbons greater than 2 inches – fine texture (clayey) soil
A3.1.1.5 JAR TEST
Source: Oregon State University, 2018
Step 1: Spread soil on a newspaper to dry. Remove all rocks, inorganics, roots,
and anything that is not considered a soil particle.
Step 2: Finely pulverize the soil to ensure lumps and clods of particles have
been broken up, but do not crush individual particles
Step 3: Fill a tall slender jar one-quarter full of soil
Step 4: Add water to fill the jar
Step 5: Put on a tight-fitting lid and shake hard for 10 to 15 minutes. This
shaking breaks apart the soil aggregates and separates the soil into
individual mineral particles.
Step 6: Set the jar where it will not be disturbed for 2 to 3 days.
Step 7: Soil particles settle out according to size. After 1 minute, mark on the
jar the depth of the sand
Step 8: After 2 hours, mark on the jar the depth of the silt.
Step 9: When the water clears, mark on the jar the clay level. This typically takes
1 to 3 days, but may take weeks with soils having high clay content.
Step 10: Measure thickness of sand, silt, and clay.
Common results
Appendix Section A3 Geotechnical, A3.1 Soil Classification
Civil Design Guide
150
Sandy soil: sand particles sink and form a layer on the bottom of the jar. Water
will appear fairly clear, quickly.
Clayey soil: water remains cloudy with a thin layer of particles on the bottom.
Water stays murky longer, because clay particles settle slowly.
Silty soil: behaves similarly to clay, so it is difficult to determine the difference
between clay and silt.
Loamy soil: clear water with a layer of sediment on the bottom and fine
particles on the top.
Organic matter: floats on the surface
A3.1.1.6 WASH TEST
Step 1: Collect and moisten enough minus No. 40 sieve size material (fine sand)
to form a 25 mm cube of soil.
Step 2: Cut the cube in half and set one half aside.
Step 3: Place one half of the cube in a cup and cover with water.
Step 4: Agitate the mixture to ensure all fine particles are suspended.
Step 5: Carefully pour out the water and suspended fines without losing any
sand particles.
Step 6: Repeat the wetting, agitating, and pouring process until all fines have
been washed out and the water is clear. Again, take care not to lose any
sand particles.
Step 7: Compare the two samples (the half of the cube set aside and the half
of the cube with the fines washed out) to roughly estimate the
percentage of sand and fines.
Step 8: Use percentages to determine if the soil is fine or coarse grained.
Note: fines include both silt and clay, therefore, this test will only be able to narrow
down the type of soil to a few different classifications. Take note of any of the possible
classifications.
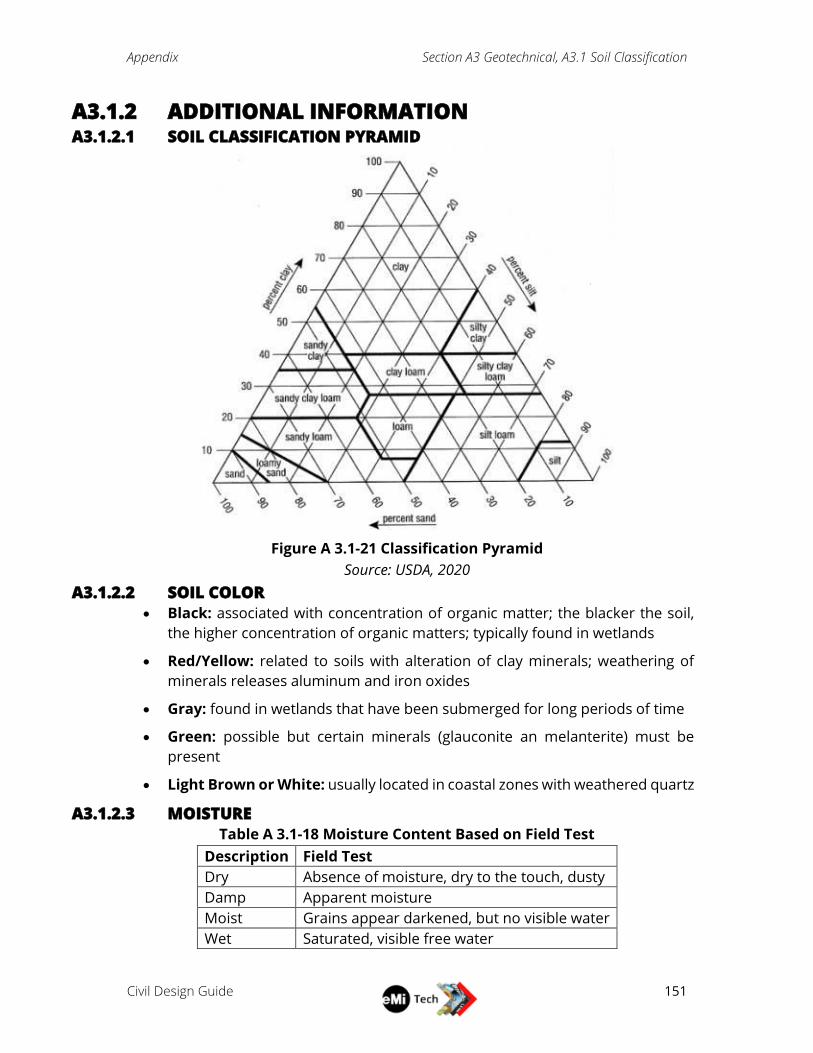
Appendix Section A3 Geotechnical, A3.1 Soil Classification
Civil Design Guide
151
A3.1.2 ADDITIONAL INFORMATION A3.1.2.1 SOIL CLASSIFICATION PYRAMID
Figure A 3.1-21 Classification Pyramid
Source: USDA, 2020
A3.1.2.2 SOIL COLOR
Black: associated with concentration of organic matter; the blacker the soil,
the higher concentration of organic matters; typically found in wetlands
Red/Yellow: related to soils with alteration of clay minerals; weathering of
minerals releases aluminum and iron oxides
Gray: found in wetlands that have been submerged for long periods of time
Green: possible but certain minerals (glauconite an melanterite) must be
present
Light Brown or White: usually located in coastal zones with weathered quartz
A3.1.2.3 MOISTURE
Table A 3.1-18 Moisture Content Based on Field Test
Description Field Test
Dry Absence of moisture, dry to the touch, dusty
Damp Apparent moisture
Moist Grains appear darkened, but no visible water
Wet Saturated, visible free water
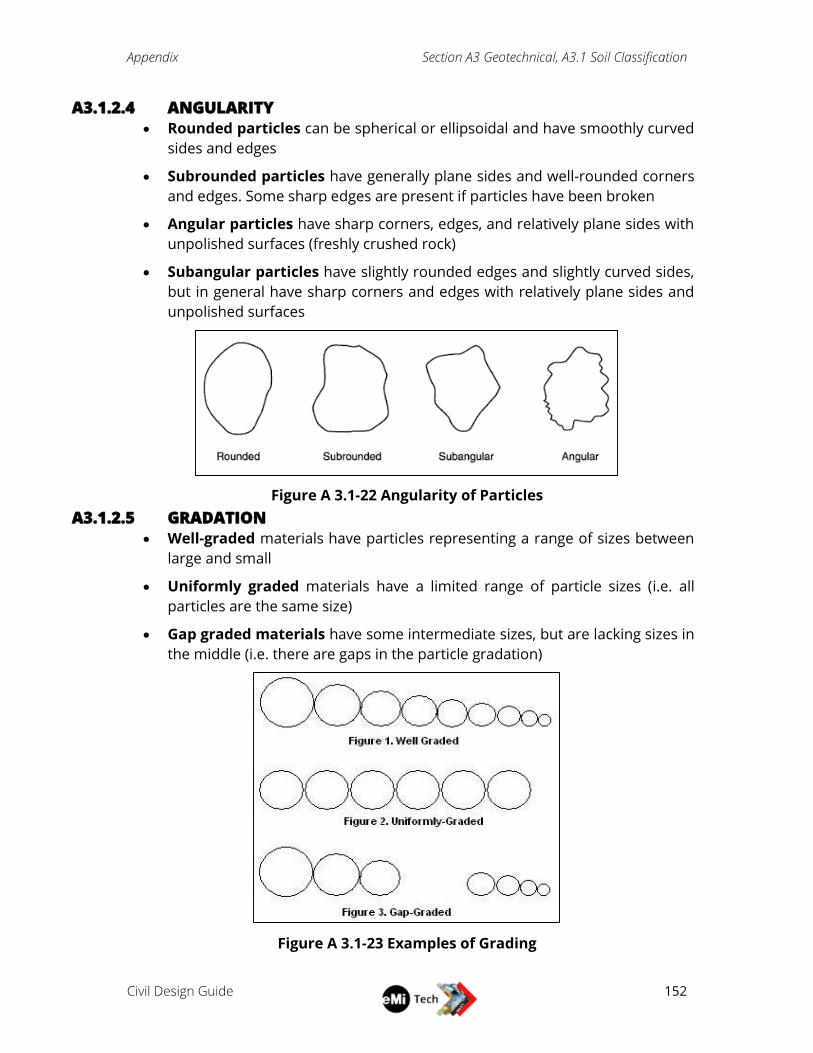
Appendix Section A3 Geotechnical, A3.1 Soil Classification
Civil Design Guide
152
A3.1.2.4 ANGULARITY
Rounded particles can be spherical or ellipsoidal and have smoothly curved
sides and edges
Subrounded particles have generally plane sides and well-rounded corners
and edges. Some sharp edges are present if particles have been broken
Angular particles have sharp corners, edges, and relatively plane sides with
unpolished surfaces (freshly crushed rock)
Subangular particles have slightly rounded edges and slightly curved sides,
but in general have sharp corners and edges with relatively plane sides and
unpolished surfaces
Figure A 3.1-22 Angularity of Particles
A3.1.2.5 GRADATION
Well-graded materials have particles representing a range of sizes between
large and small
Uniformly graded materials have a limited range of particle sizes (i.e. all
particles are the same size)
Gap graded materials have some intermediate sizes, but are lacking sizes in
the middle (i.e. there are gaps in the particle gradation)
Figure A 3.1-23 Examples of Grading
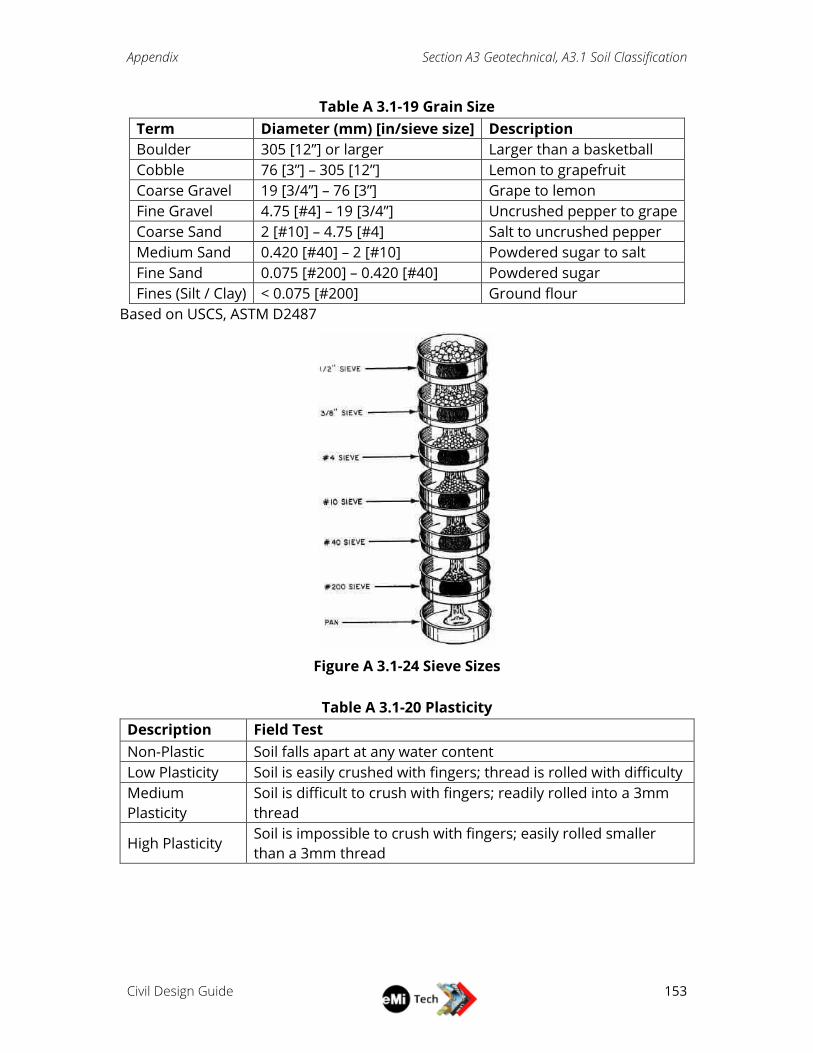
Appendix Section A3 Geotechnical, A3.1 Soil Classification
Civil Design Guide
153
Table A 3.1-19 Grain Size
Term Diameter (mm) [in/sieve size] Description
Boulder 305 [12”] or larger Larger than a basketball
Cobble 76 [3”] – 305 [12”] Lemon to grapefruit
Coarse Gravel 19 [3/4”] – 76 [3”] Grape to lemon
Fine Gravel 4.75 [#4] – 19 [3/4”] Uncrushed pepper to grape
Coarse Sand 2 [#10] – 4.75 [#4] Salt to uncrushed pepper
Medium Sand 0.420 [#40] – 2 [#10] Powdered sugar to salt
Fine Sand 0.075 [#200] – 0.420 [#40] Powdered sugar
Fines (Silt / Clay) < 0.075 [#200] Ground flour
Based on USCS, ASTM D2487
Figure A 3.1-24 Sieve Sizes
Table A 3.1-20 Plasticity
Description Field Test
Non-Plastic Soil falls apart at any water content
Low Plasticity Soil is easily crushed with fingers; thread is rolled with difficulty
Medium
Plasticity
Soil is difficult to crush with fingers; readily rolled into a 3mm
thread
High Plasticity Soil is impossible to crush with fingers; easily rolled smaller
than a 3mm thread
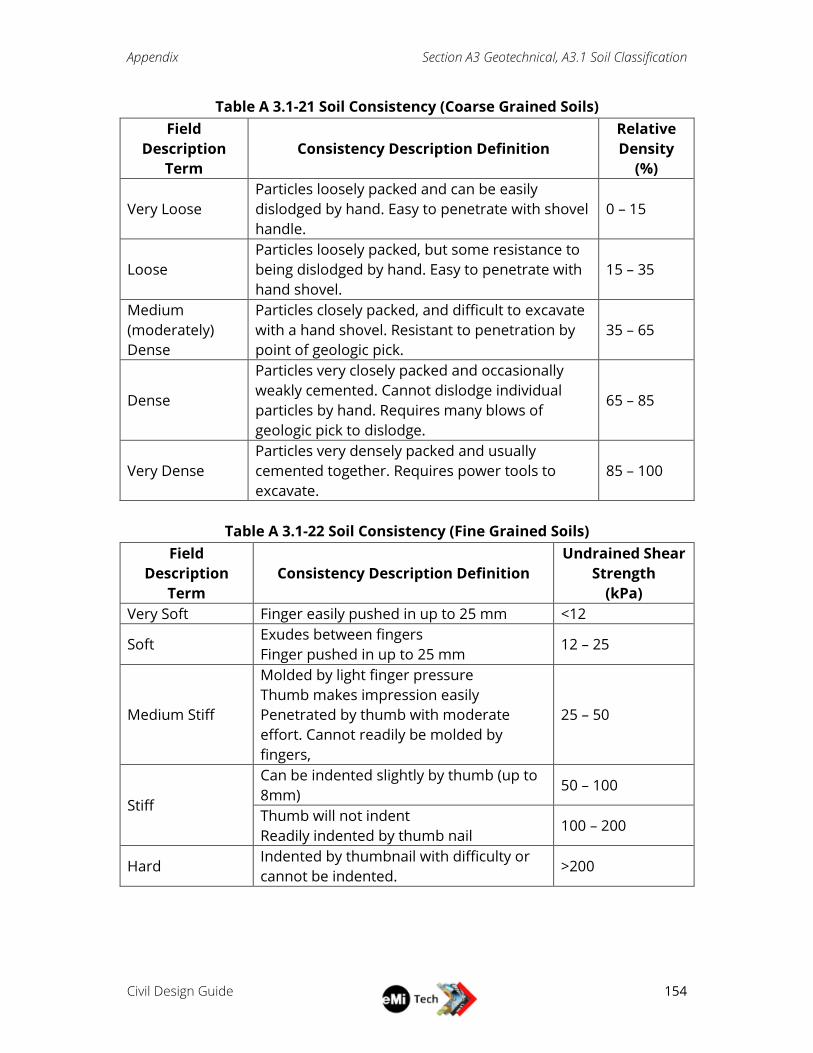
Appendix Section A3 Geotechnical, A3.1 Soil Classification
Civil Design Guide
154
Table A 3.1-21 Soil Consistency (Coarse Grained Soils)
Field
Description
Term
Consistency Description Definition
Relative
Density
(%)
Very Loose
Particles loosely packed and can be easily
dislodged by hand. Easy to penetrate with shovel
handle.
0 – 15
Loose
Particles loosely packed, but some resistance to
being dislodged by hand. Easy to penetrate with
hand shovel.
15 – 35
Medium
(moderately)
Dense
Particles closely packed, and difficult to excavate
with a hand shovel. Resistant to penetration by
point of geologic pick.
35 – 65
Dense
Particles very closely packed and occasionally
weakly cemented. Cannot dislodge individual
particles by hand. Requires many blows of
geologic pick to dislodge.
65 – 85
Very Dense
Particles very densely packed and usually
cemented together. Requires power tools to
excavate.
85 – 100
Table A 3.1-22 Soil Consistency (Fine Grained Soils)
Field
Description
Term
Consistency Description Definition
Undrained Shear
Strength
(kPa)
Very Soft Finger easily pushed in up to 25 mm <12
Soft Exudes between fingers
Finger pushed in up to 25 mm 12 – 25
Medium Stiff
Molded by light finger pressure
Thumb makes impression easily
Penetrated by thumb with moderate
effort. Cannot readily be molded by
fingers,
25 – 50
Stiff
Can be indented slightly by thumb (up to
8mm) 50 – 100
Thumb will not indent
Readily indented by thumb nail 100 – 200
Hard Indented by thumbnail with difficulty or
cannot be indented. >200
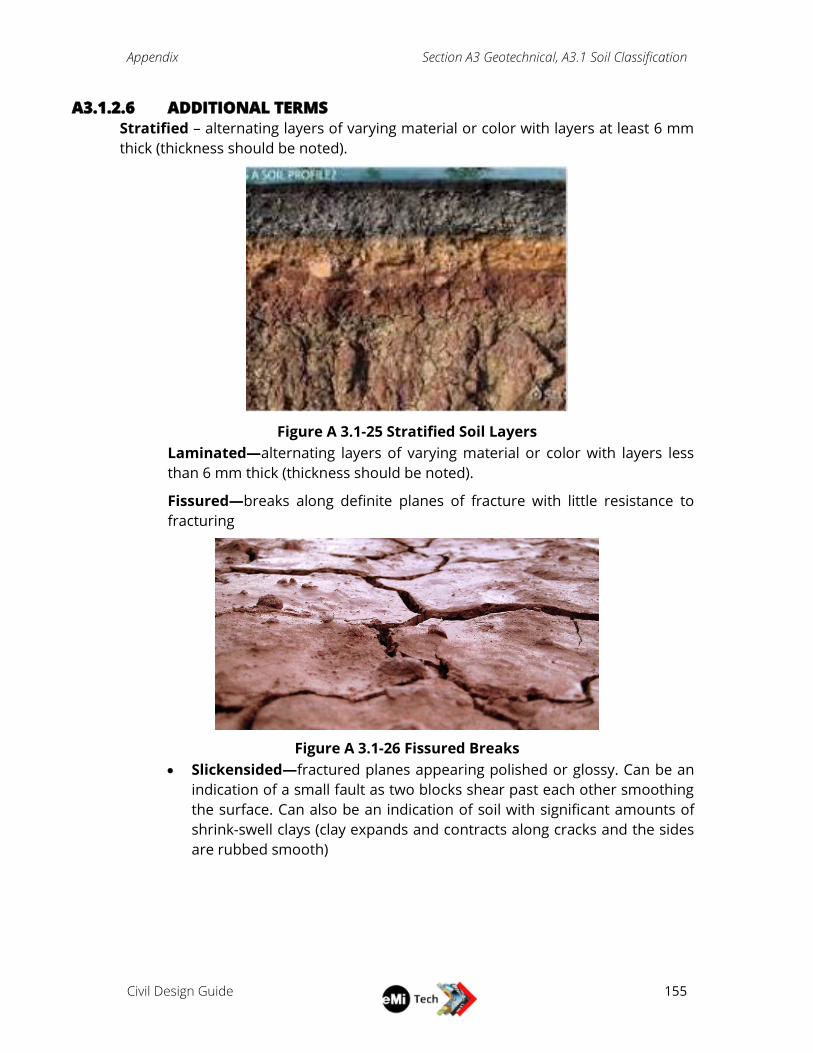
Appendix Section A3 Geotechnical, A3.1 Soil Classification
Civil Design Guide
155
A3.1.2.6 ADDITIONAL TERMS
Stratified – alternating layers of varying material or color with layers at least 6 mm
thick (thickness should be noted).
Figure A 3.1-25 Stratified Soil Layers
Laminated—alternating layers of varying material or color with layers less
than 6 mm thick (thickness should be noted).
Fissured—breaks along definite planes of fracture with little resistance to
fracturing
Figure A 3.1-26 Fissured Breaks
Slickensided—fractured planes appearing polished or glossy. Can be an
indication of a small fault as two blocks shear past each other smoothing
the surface. Can also be an indication of soil with significant amounts of
shrink-swell clays (clay expands and contracts along cracks and the sides
are rubbed smooth)
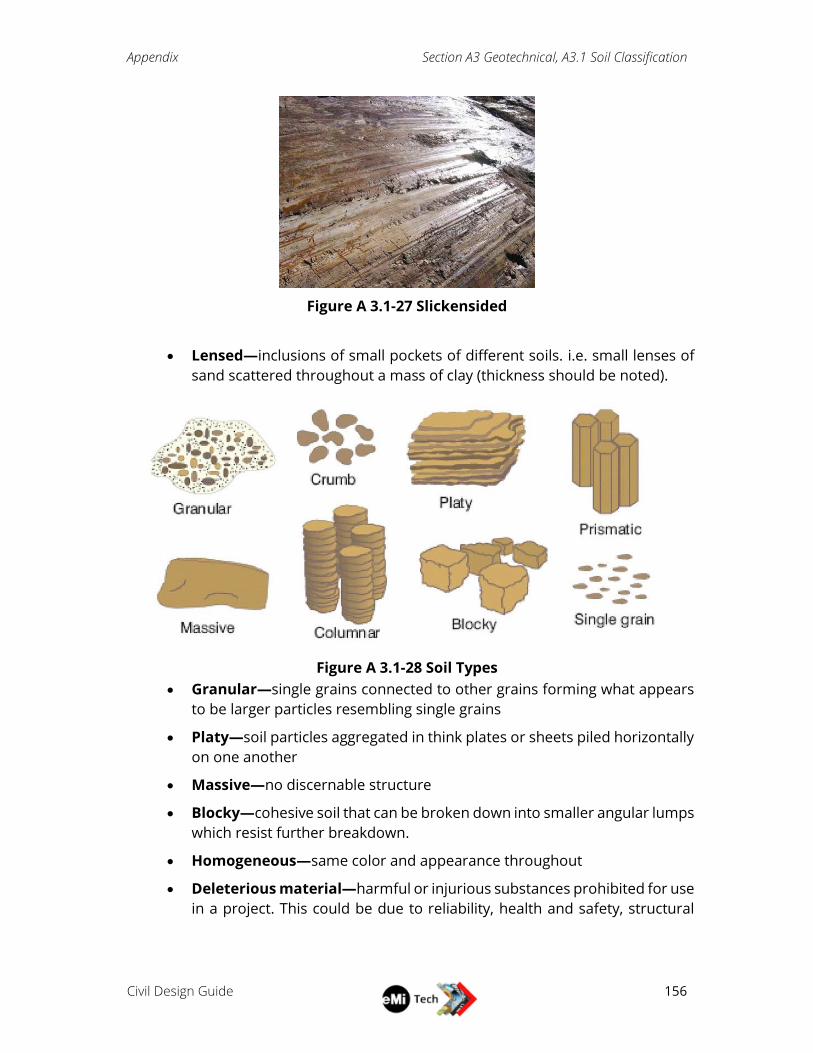
Appendix Section A3 Geotechnical, A3.1 Soil Classification
Civil Design Guide
156
Figure A 3.1-27 Slickensided
Lensed—inclusions of small pockets of different soils. i.e. small lenses of
sand scattered throughout a mass of clay (thickness should be noted).
Figure A 3.1-28 Soil Types
Granular—single grains connected to other grains forming what appears
to be larger particles resembling single grains
Platy—soil particles aggregated in think plates or sheets piled horizontally
on one another
Massive—no discernable structure
Blocky—cohesive soil that can be broken down into smaller angular lumps
which resist further breakdown.
Homogeneous—same color and appearance throughout
Deleterious material—harmful or injurious substances prohibited for use
in a project. This could be due to reliability, health and safety, structural
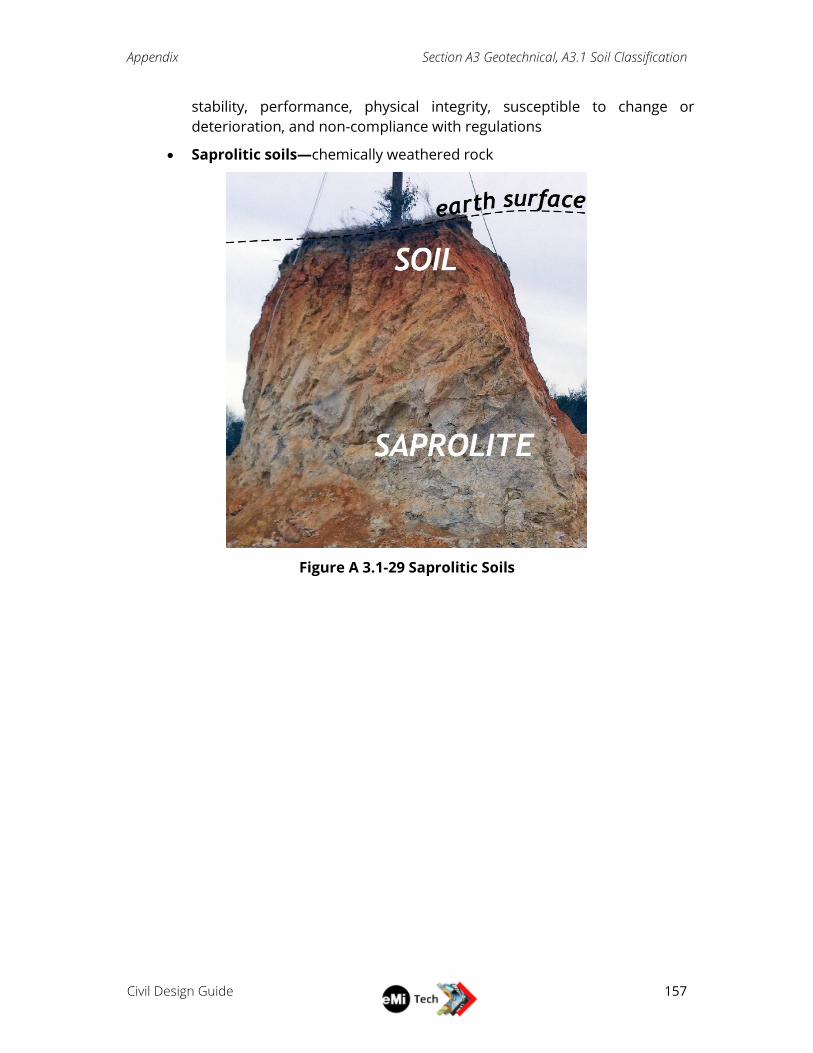
Appendix Section A3 Geotechnical, A3.1 Soil Classification
Civil Design Guide
157
stability, performance, physical integrity, susceptible to change or
deterioration, and non-compliance with regulations
Saprolitic soils—chemically weathered rock
Figure A 3.1-29 Saprolitic Soils
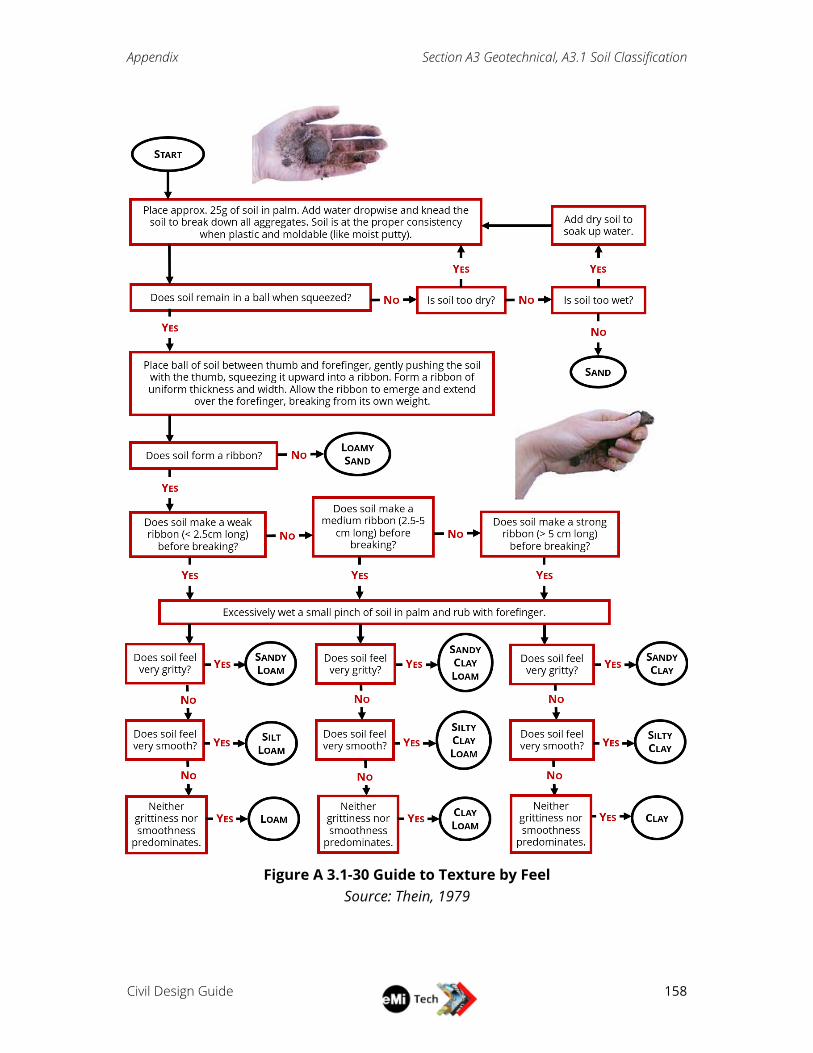
Appendix Section A3 Geotechnical, A3.1 Soil Classification
Civil Design Guide
158
Figure A 3.1-30 Guide to Texture by Feel
Source: Thein, 1979
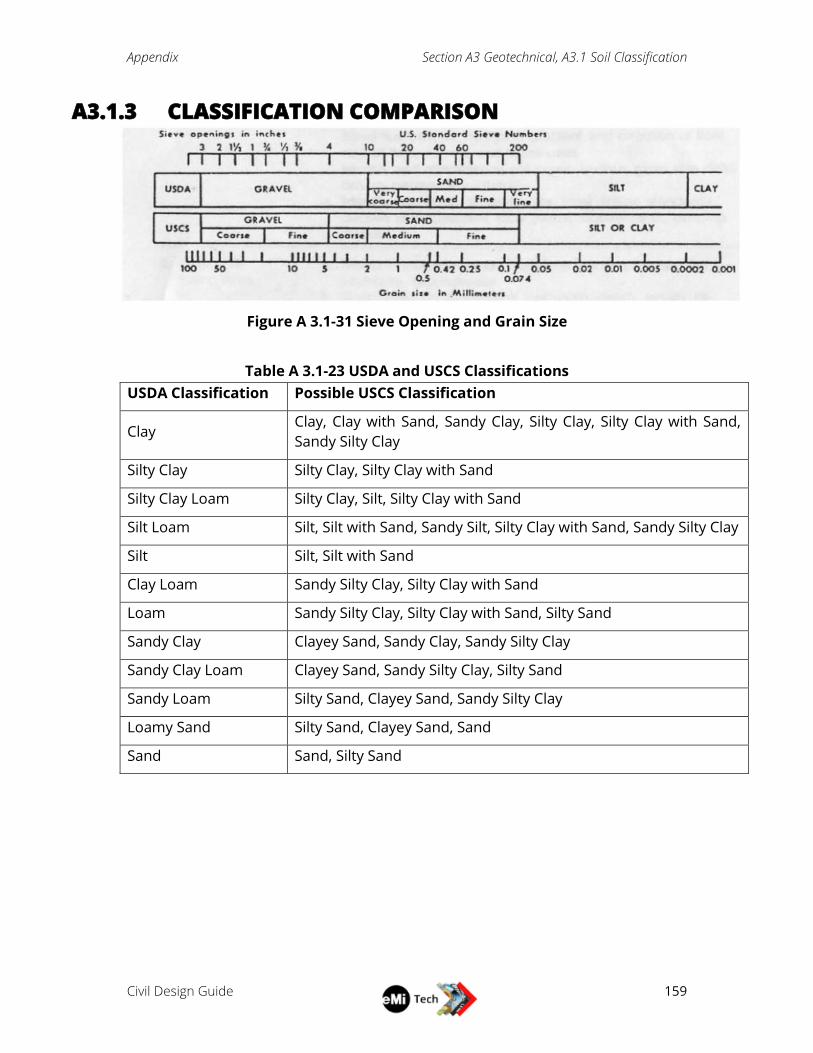
Appendix Section A3 Geotechnical, A3.1 Soil Classification
Civil Design Guide
159
A3.1.3 CLASSIFICATION COMPARISON
Figure A 3.1-31 Sieve Opening and Grain Size
Table A 3.1-23 USDA and USCS Classifications
USDA Classification Possible USCS Classification
Clay Clay, Clay with Sand, Sandy Clay, Silty Clay, Silty Clay with Sand,
Sandy Silty Clay
Silty Clay Silty Clay, Silty Clay with Sand
Silty Clay Loam Silty Clay, Silt, Silty Clay with Sand
Silt Loam Silt, Silt with Sand, Sandy Silt, Silty Clay with Sand, Sandy Silty Clay
Silt Silt, Silt with Sand
Clay Loam Sandy Silty Clay, Silty Clay with Sand
Loam Sandy Silty Clay, Silty Clay with Sand, Silty Sand
Sandy Clay Clayey Sand, Sandy Clay, Sandy Silty Clay
Sandy Clay Loam Clayey Sand, Sandy Silty Clay, Silty Sand
Sandy Loam Silty Sand, Clayey Sand, Sandy Silty Clay
Loamy Sand Silty Sand, Clayey Sand, Sand
Sand Sand, Silty Sand
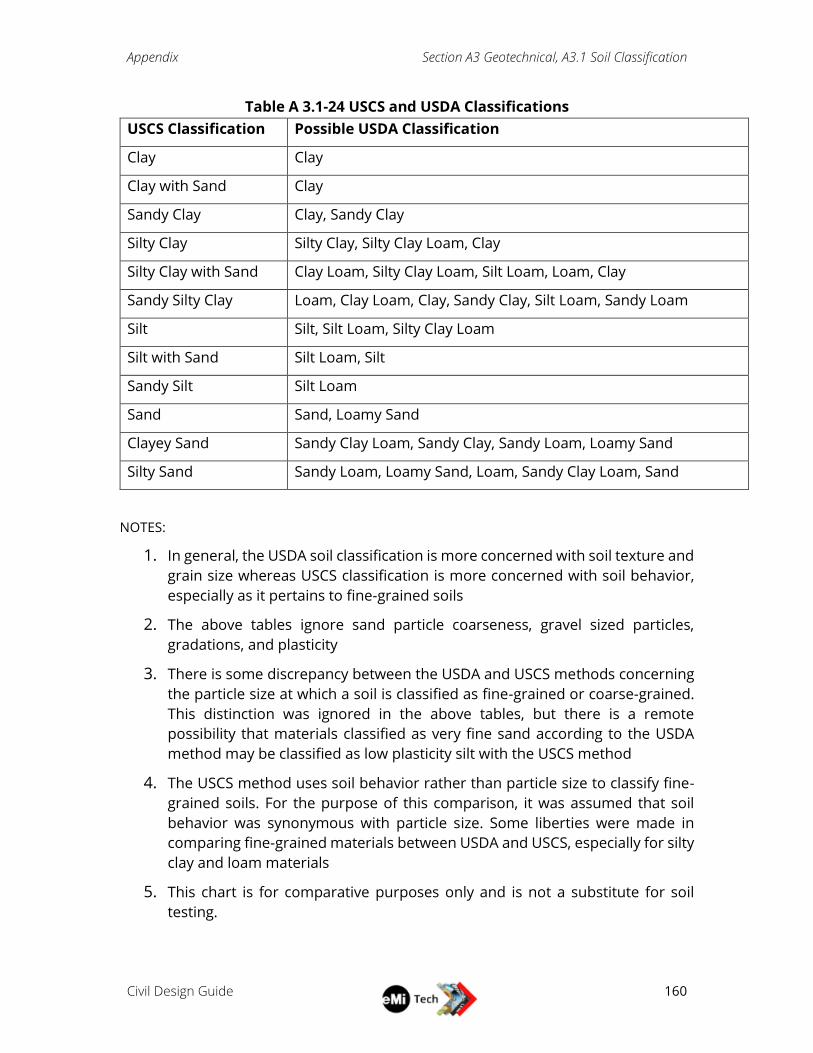
Appendix Section A3 Geotechnical, A3.1 Soil Classification
Civil Design Guide
160
Table A 3.1-24 USCS and USDA Classifications
USCS Classification Possible USDA Classification
Clay Clay
Clay with Sand Clay
Sandy Clay Clay, Sandy Clay
Silty Clay Silty Clay, Silty Clay Loam, Clay
Silty Clay with Sand Clay Loam, Silty Clay Loam, Silt Loam, Loam, Clay
Sandy Silty Clay Loam, Clay Loam, Clay, Sandy Clay, Silt Loam, Sandy Loam
Silt Silt, Silt Loam, Silty Clay Loam
Silt with Sand Silt Loam, Silt
Sandy Silt Silt Loam
Sand Sand, Loamy Sand
Clayey Sand Sandy Clay Loam, Sandy Clay, Sandy Loam, Loamy Sand
Silty Sand Sandy Loam, Loamy Sand, Loam, Sandy Clay Loam, Sand
NOTES:
1. In general, the USDA soil classification is more concerned with soil texture and
grain size whereas USCS classification is more concerned with soil behavior,
especially as it pertains to fine-grained soils
2. The above tables ignore sand particle coarseness, gravel sized particles,
gradations, and plasticity
3. There is some discrepancy between the USDA and USCS methods concerning
the particle size at which a soil is classified as fine-grained or coarse-grained.
This distinction was ignored in the above tables, but there is a remote
possibility that materials classified as very fine sand according to the USDA
method may be classified as low plasticity silt with the USCS method
4. The USCS method uses soil behavior rather than particle size to classify fine-
grained soils. For the purpose of this comparison, it was assumed that soil
behavior was synonymous with particle size. Some liberties were made in
comparing fine-grained materials between USDA and USCS, especially for silty
clay and loam materials
5. This chart is for comparative purposes only and is not a substitute for soil
testing.
Appendix Section A3 Geotechnical, A3.1 Soil Classification
Civil Design Guide
161
A3.1.4 HAND AUGERING/BORING LOCATION A hand auger may be used for subsurface exploration and is suitable for sand, silt
and soft clay. Stiff clays, hard materials and gravels are difficult or impossible to drill
through or remove. Augers can be used up to a depth of about 15-25 meters,
depending on geology. Above the water table, the borehole generally stays open
without the need for support, but a temporary PVC casing may be used below the
water table to prevent the hole from collapsing. Hand augers are rotated into the
ground until they are filled, then lifted out of the hole and emptied. Parts include
extendable steel rods, a handle, and steel auger bits. Hand augers are widely used in
parts of Africa, Central America, and western countries.
Using a Hand Auger
1. Follow equipment instructions to assemble auger. Typically, connect the auger
to the handle and secure with pin.
2. Make a starter hole by turning the handle in a clockwise direction until it has
drilled approximately 30cm into the soil.
3. Once the auger is filled with soil, lift the auger out of the borehole and shake
auger away from the hole to remove the cuttings
4. Place the auger back into the hole and repeat the process: turn handle until
auger is filled, lift auger out of hole, shake auger away from hole to remove
cuttings
5. Continue process until the completion depth or handle has almost reached
the ground
6. Once handle has almost reached the ground, remove pin and handle, add
extension rod and replace handle and pin.
7. Repeat turn, lift, shake process until completion depth or an additional rod
must be added
Tips:
If drilling in dry sand and cuttings fall out of the auger or sides cave in, add
water to make the sand stickier if not performing in situ moisture testing
Ensure a straight trajectory when drilling the borehole, especially in the first
few meters
Ensure extensions and handles are securely fastened to prevent losing
equipment in the hole.
Appendix Section A3 Geotechnical, A3.1 Soil Classification
Civil Design Guide
162
Take care when drilling below the groundwater table if temporary casing is
not used.
Borehole Location Suggestions
The objective of subsurface exploration is to distributed borings to determine
foundation soil layering. Boreholes should be located near foundations or other
structures especially in locations and depths where surface soils are obviously
different. Do not locate borings further than 10 meters from the proposed structure.
The number of borings depends on cost, size of structure, availability of equipment
and labor. However, a greater number of borings will give greater soil information
and reduce the possibility of encountering unexpected soil conditions during
construction. The depth of boring can vary between one to three times the shorter
foundation or structure side length. If the stiffness and strength are known and
bedrock is located at a depth that matches the base of the structure, 2 m depth is
sufficient. If small foundations or structures are designed, a depth of 1.5 the shorter
side length can be used.
Notes:
1. Consider the possibility of buried objects when choosing locations
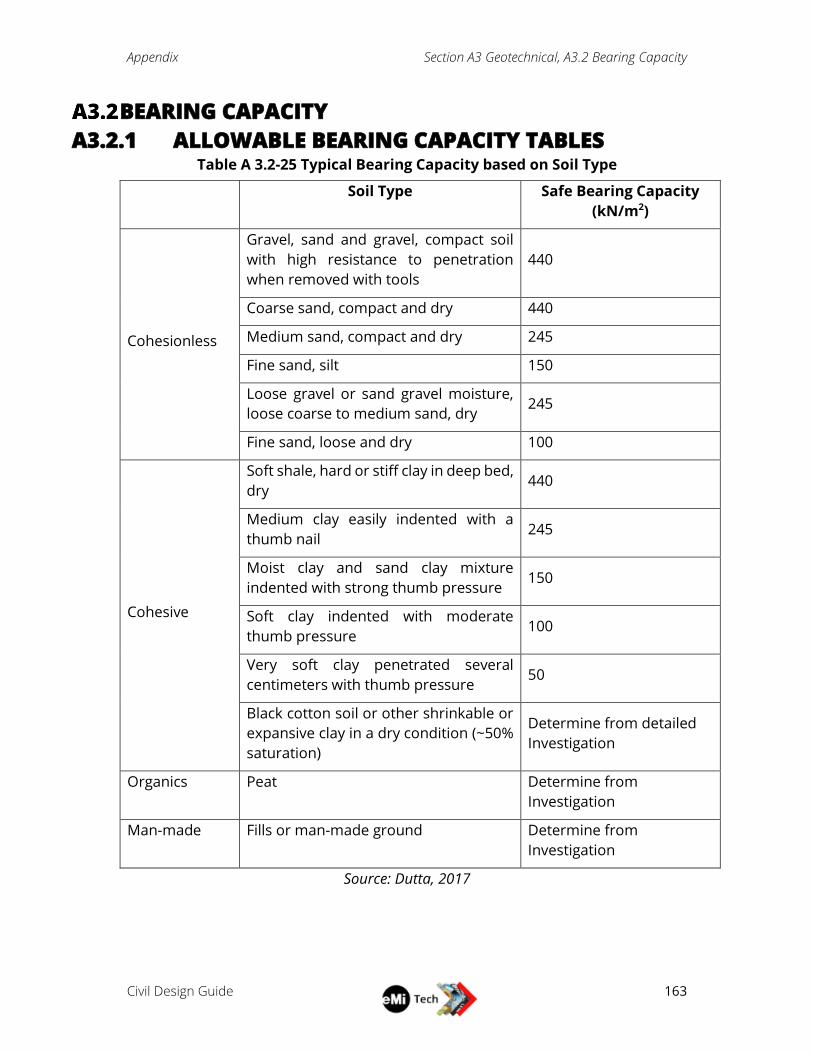
Appendix Section A3 Geotechnical, A3.2 Bearing Capacity
Civil Design Guide
163
BEARING CAPACITY
A3.2.1 ALLOWABLE BEARING CAPACITY TABLES Table A 3.2-25 Typical Bearing Capacity based on Soil Type
Source: Dutta, 2017
Soil Type Safe Bearing Capacity
(kN/m2)
Cohesionless
Gravel, sand and gravel, compact soil
with high resistance to penetration
when removed with tools
440
Coarse sand, compact and dry 440
Medium sand, compact and dry 245
Fine sand, silt 150
Loose gravel or sand gravel moisture,
loose coarse to medium sand, dry 245
Fine sand, loose and dry 100
Cohesive
Soft shale, hard or stiff clay in deep bed,
dry 440
Medium clay easily indented with a
thumb nail 245
Moist clay and sand clay mixture
indented with strong thumb pressure 150
Soft clay indented with moderate
thumb pressure 100
Very soft clay penetrated several
centimeters with thumb pressure 50
Black cotton soil or other shrinkable or
expansive clay in a dry condition (~50%
saturation)
Determine from detailed
Investigation
Organics Peat Determine from
Investigation
Man-made Fills or man-made ground Determine from
Investigation
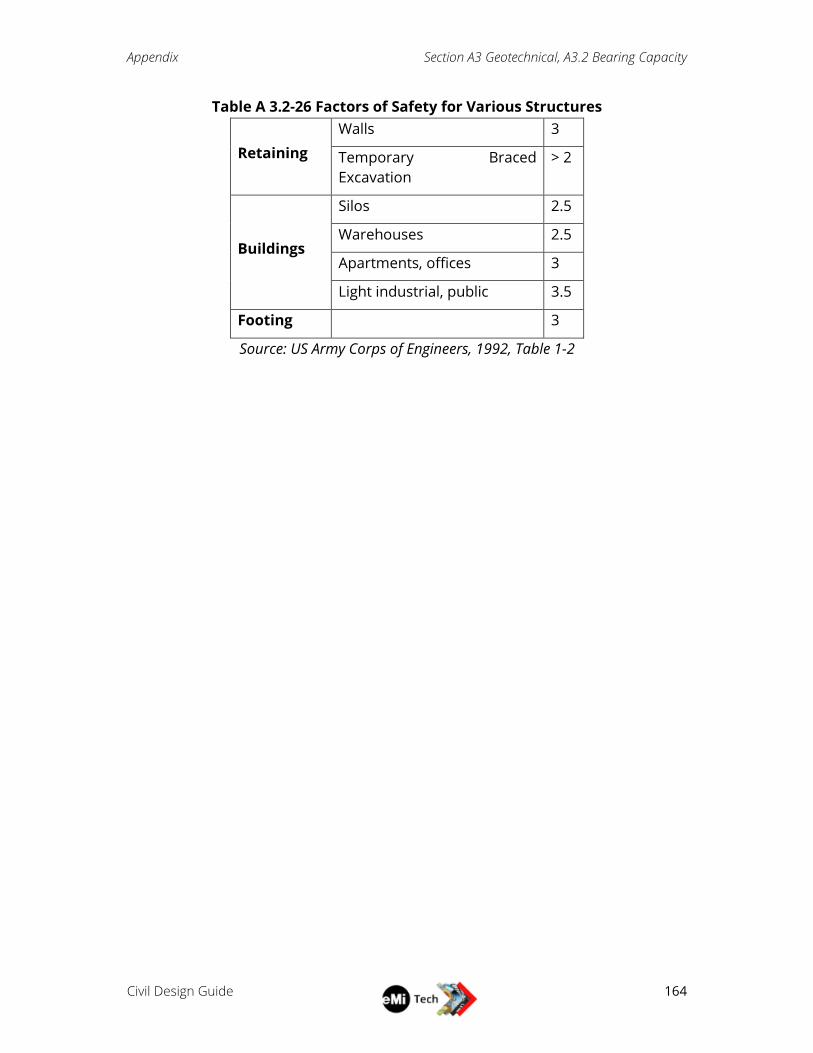
Appendix Section A3 Geotechnical, A3.2 Bearing Capacity
Civil Design Guide
164
Table A 3.2-26 Factors of Safety for Various Structures
Retaining
Walls 3
Temporary Braced
Excavation
> 2
Buildings
Silos 2.5
Warehouses 2.5
Apartments, offices 3
Light industrial, public 3.5
Footing 3
Source: US Army Corps of Engineers, 1992, Table 1-2
Appendix Section A3 Geotechnical, A3.2 Bearing Capacity
Civil Design Guide
165
A3.2.2 IN-SITU SOIL STRENGTH TEST PROCEDURES Pocket Penetrometer
Used to determine unconfined compressive strength of saturated, cohesive
soils
Gives direct reading calibrated in tsf or kPa (error ±20-40%)
Spring-operated instrument
To use: push into soil and read indicator sleeve.
Shear Vane
To use: press vane into level section of undisturbed soil. Slowly turn torsional knob
until soil failure occurs. Multiply the reading by 2 for results in kPa.
Dynamic Cone Penetrometer (DCP) Test
An 8 kg free fall hammer lifted and dropped from a height of 575mm
Correlation of DCP and Bearing Capacity (Paige-Green 2009)
o Bearing capacity = 3426DN-1.014
Where DN = Cone penetration rate (mm/blow)
To use: Record the distance of cone tip penetration after every 5 blows.

Appendix Section A3 Geotechnical, A3.2 Bearing Capacity
Civil Design Guide
166
A3.2.3 ULTIMATE BEARING CAPACITY Equation A3.2-2 Simplified Ultimate Bearing Capacity
𝑞𝑢 = 𝑐 ∗ 𝑁𝑐 +1
2∗ 𝐵 ∗ 𝛾𝐻
′ ∗ 𝑁𝛾 + 𝛾𝐷′ ∗ 𝐷 ∗ 𝑁𝑞
qu = ultimate bearing capacity pressure
c = soil cohesion (undrained shear strength)
B = foundation width
D = foundation depth
γH’ = effective unit weight beneath foundation base within failure zone
γD’ = effective unit weight of surcharge soil within the foundation depth (D)
Nc,γ,σ = dimensionless bearing capacity factors
Equation used for continuous footings only.
Assumption: soil below foundation along the critical plane of failure is on the verge of
failure. Additional factors added for general applicability.
Refer to FHWA Circular No. 6, Chapter 5, for additional information.
Appendix Section A3 Geotechnical, A3.3 Soil Absorption Capacity
Civil Design Guide
167
SOIL ABSORPTION CAPACITY
A3.3.1 PERCOLATION TEST PROCEDURE 1. Dig or drill a 150mm dia. hole to the intended depth of the absorption system
(usually 1-2m deep, 3-5m for seepage pits).
2. Scrape the inside surface of the hole with a sharp implement to remove any
smearing or plugging of the surface caused by the digging process.
3. Place a 50mm thick fine gravel layer in the bottom of the hole.
4. Fill the hole to 300mm above the top of the gravel layer with clean water and
keep the water level at this depth for at least 4 hours, 24 hours if swelling clay
is present. If the hole drains two times within 10 min, no further saturation is
needed.
5. Refill the hole to 150mm and measure the distance from a fixed reference
point to the water surface multiple times over a sufficiently long interval
between measurements (1-30 min between measurements) to accurately
measure the rate of water surfaced drop. Continue making measurements
until the rate stabilizes (at least two consecutive tests where the water level
drop does not vary by more than 2mm for the same time interval). When the
water depth drops to less than 50mm, stop the test.
6. Refill the test hole to 150mm above the gravel and repeat the test at least two
more times for greater accuracy.
7. Calculate the percolation value (in units of min/25mm) as the time in minutes
for the water surface to drop 1” (25mm) after the rate has stabilized. Only the
last few measurements should be used to calculate the percolation test value.
8. Perform at minimum 2 tests per site. Perform additional for large sites.
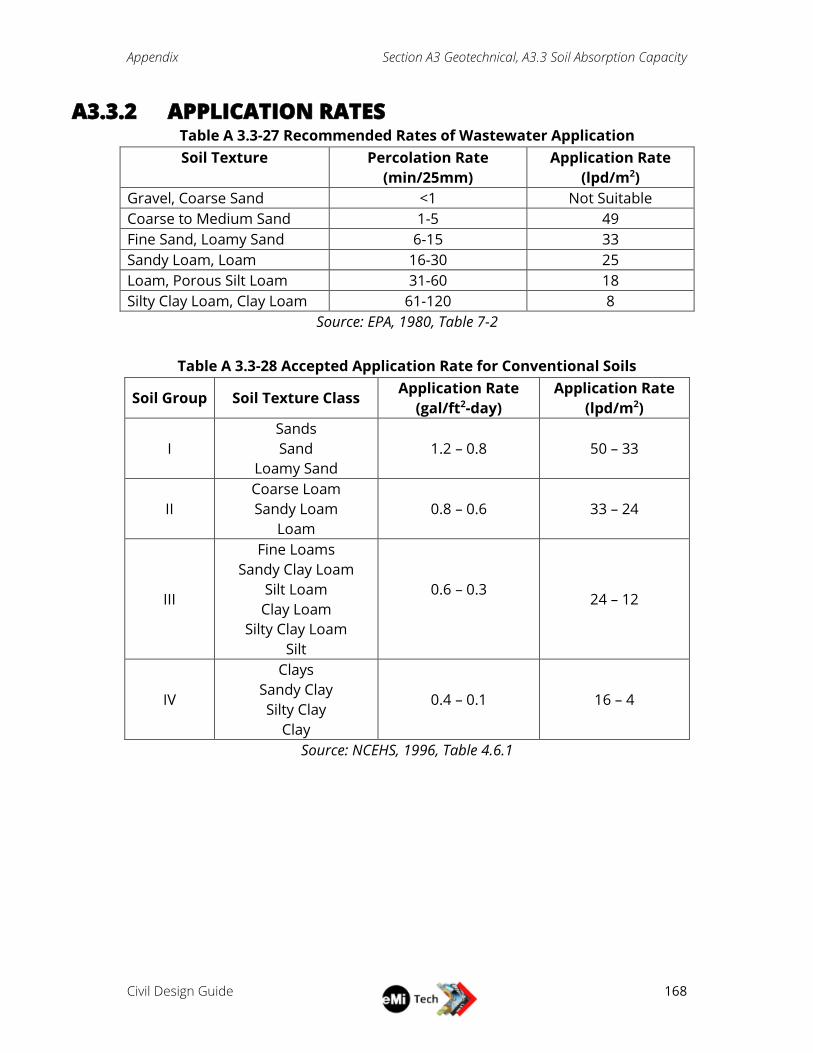
Appendix Section A3 Geotechnical, A3.3 Soil Absorption Capacity
Civil Design Guide
168
A3.3.2 APPLICATION RATES Table A 3.3-27 Recommended Rates of Wastewater Application
Soil Texture Percolation Rate
(min/25mm)
Application Rate
(lpd/m2)
Gravel, Coarse Sand <1 Not Suitable
Coarse to Medium Sand 1-5 49
Fine Sand, Loamy Sand 6-15 33
Sandy Loam, Loam 16-30 25
Loam, Porous Silt Loam 31-60 18
Silty Clay Loam, Clay Loam 61-120 8
Source: EPA, 1980, Table 7-2
Table A 3.3-28 Accepted Application Rate for Conventional Soils
Soil Group Soil Texture Class Application Rate
(gal/ft2-day)
Application Rate
(lpd/m2)
I
Sands
Sand
Loamy Sand
1.2 – 0.8 50 – 33
II
Coarse Loam
Sandy Loam
Loam
0.8 – 0.6 33 – 24
III
Fine Loams
Sandy Clay Loam
Silt Loam
Clay Loam
Silty Clay Loam
Silt
0.6 – 0.3
24 – 12
IV
Clays
Sandy Clay
Silty Clay
Clay
0.4 – 0.1 16 – 4
Source: NCEHS, 1996, Table 4.6.1
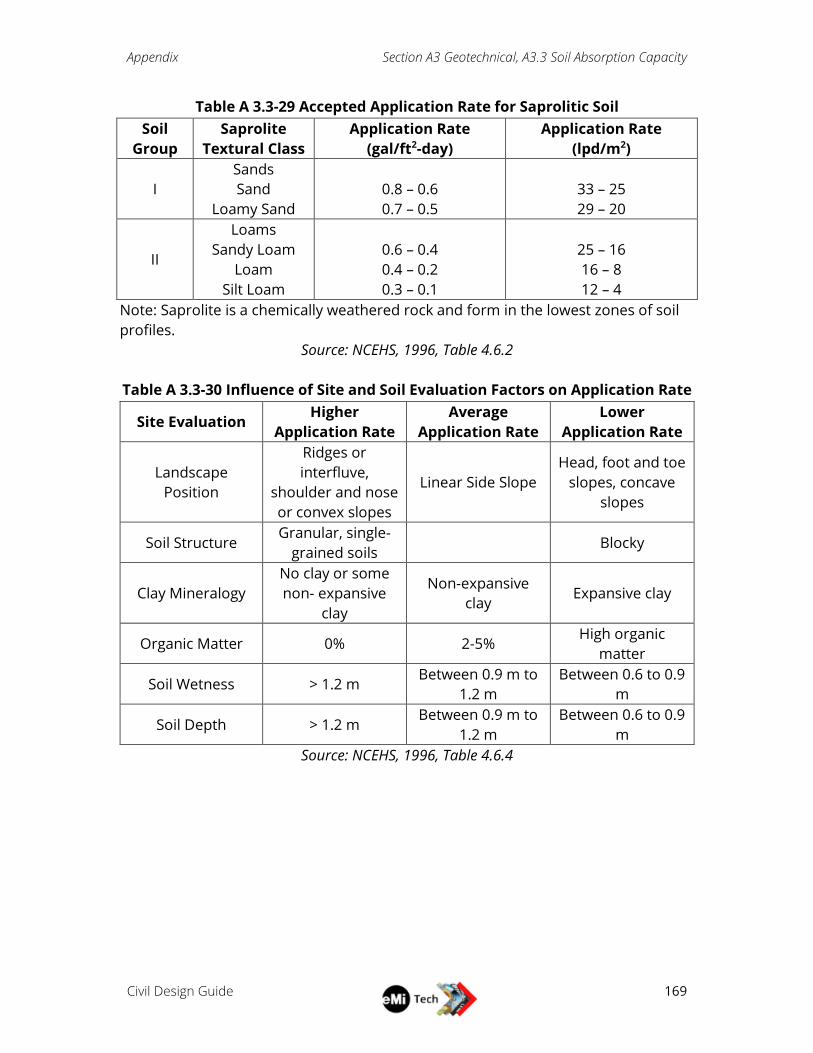
Appendix Section A3 Geotechnical, A3.3 Soil Absorption Capacity
Civil Design Guide
169
Table A 3.3-29 Accepted Application Rate for Saprolitic Soil
Soil
Group
Saprolite
Textural Class
Application Rate
(gal/ft2-day)
Application Rate
(lpd/m2)
I
Sands
Sand
Loamy Sand
0.8 – 0.6
0.7 – 0.5
33 – 25
29 – 20
II
Loams
Sandy Loam
Loam
Silt Loam
0.6 – 0.4
0.4 – 0.2
0.3 – 0.1
25 – 16
16 – 8
12 – 4
Note: Saprolite is a chemically weathered rock and form in the lowest zones of soil
profiles.
Source: NCEHS, 1996, Table 4.6.2
Table A 3.3-30 Influence of Site and Soil Evaluation Factors on Application Rate
Site Evaluation Higher
Application Rate
Average
Application Rate
Lower
Application Rate
Landscape
Position
Ridges or
interfluve,
shoulder and nose
or convex slopes
Linear Side Slope
Head, foot and toe
slopes, concave
slopes
Soil Structure Granular, single-
grained soils Blocky
Clay Mineralogy
No clay or some
non- expansive
clay
Non-expansive
clay Expansive clay
Organic Matter 0% 2-5% High organic
matter
Soil Wetness > 1.2 m Between 0.9 m to
1.2 m
Between 0.6 to 0.9
m
Soil Depth > 1.2 m Between 0.9 m to
1.2 m
Between 0.6 to 0.9
m
Source: NCEHS, 1996, Table 4.6.4
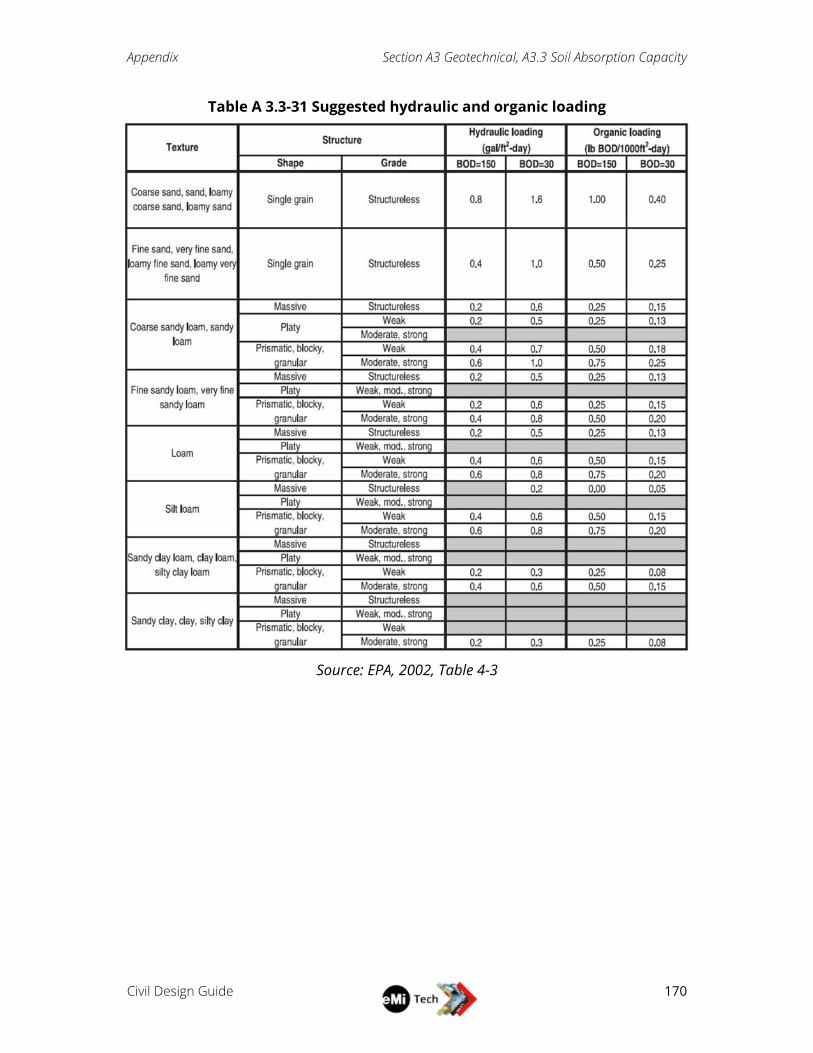
Appendix Section A3 Geotechnical, A3.3 Soil Absorption Capacity
Civil Design Guide
170
Table A 3.3-31 Suggested hydraulic and organic loading
Source: EPA, 2002, Table 4-3
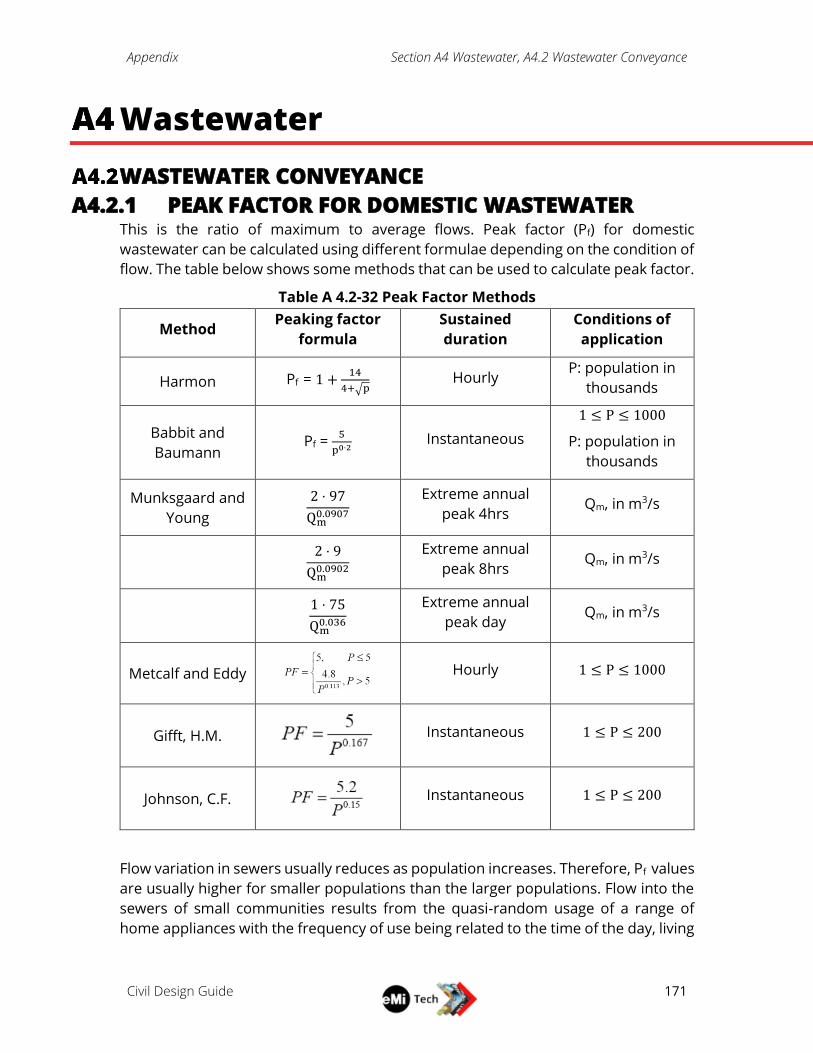
Appendix Section A4 Wastewater, A4.2 Wastewater Conveyance
Civil Design Guide
171
Wastewater
WASTEWATER CONVEYANCE
A4.2.1 PEAK FACTOR FOR DOMESTIC WASTEWATER This is the ratio of maximum to average flows. Peak factor (Pf) for domestic
wastewater can be calculated using different formulae depending on the condition of
flow. The table below shows some methods that can be used to calculate peak factor.
Table A 4.2-32 Peak Factor Methods
Method Peaking factor
formula
Sustained
duration
Conditions of
application
Harmon Pf = 1 +14
4+√p Hourly
P: population in
thousands
Babbit and
Baumann Pf =
5
p0⋅2 Instantaneous
1 ≤ P ≤ 1000
P: population in
thousands
Munksgaard and
Young
2 ⋅ 97
Qm0.0907
Extreme annual
peak 4hrs Qm, in m3/s
2 ⋅ 9
Qm0.0902
Extreme annual
peak 8hrs Qm, in m3/s
1 ⋅ 75
Qm0.036
Extreme annual
peak day Qm, in m3/s
Metcalf and Eddy
Hourly 1 ≤ P ≤ 1000
Gifft, H.M.
Instantaneous 1 ≤ P ≤ 200
Johnson, C.F.
Instantaneous 1 ≤ P ≤ 200
Flow variation in sewers usually reduces as population increases. Therefore, Pf values
are usually higher for smaller populations than the larger populations. Flow into the
sewers of small communities results from the quasi-random usage of a range of
home appliances with the frequency of use being related to the time of the day, living
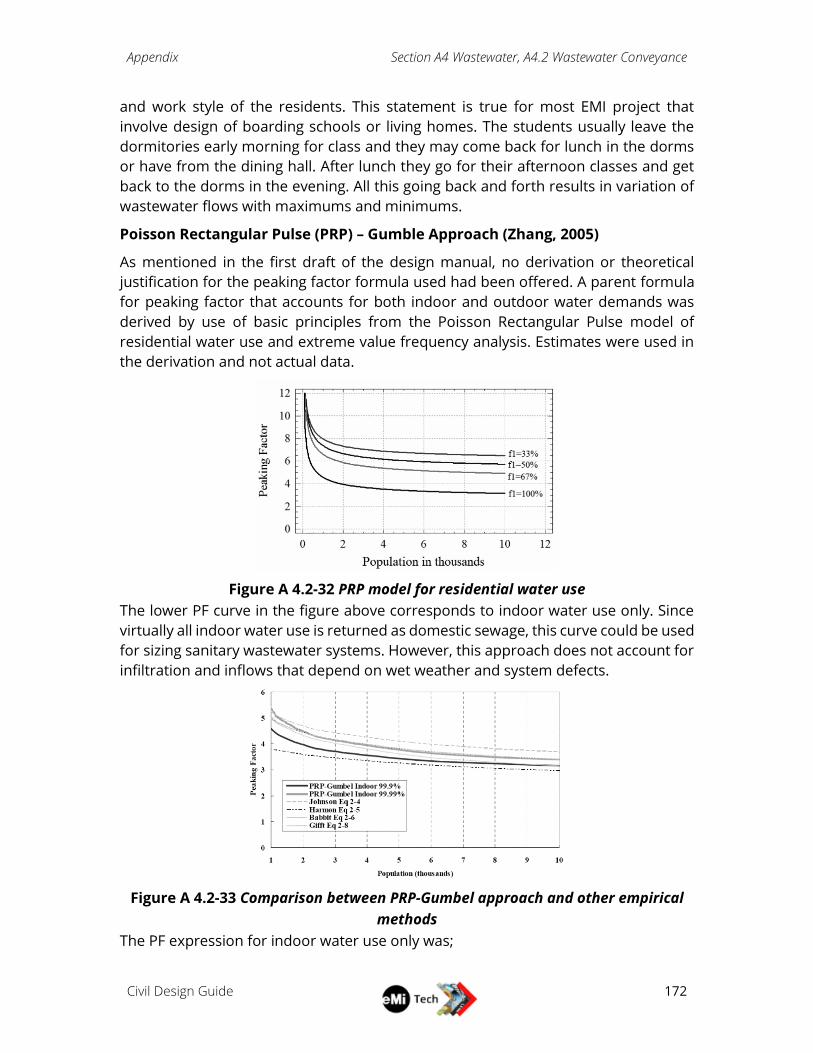
Appendix Section A4 Wastewater, A4.2 Wastewater Conveyance
Civil Design Guide
172
and work style of the residents. This statement is true for most EMI project that
involve design of boarding schools or living homes. The students usually leave the
dormitories early morning for class and they may come back for lunch in the dorms
or have from the dining hall. After lunch they go for their afternoon classes and get
back to the dorms in the evening. All this going back and forth results in variation of
wastewater flows with maximums and minimums.
Poisson Rectangular Pulse (PRP) – Gumble Approach (Zhang, 2005)
As mentioned in the first draft of the design manual, no derivation or theoretical
justification for the peaking factor formula used had been offered. A parent formula
for peaking factor that accounts for both indoor and outdoor water demands was
derived by use of basic principles from the Poisson Rectangular Pulse model of
residential water use and extreme value frequency analysis. Estimates were used in
the derivation and not actual data.
Figure A 4.2-32 PRP model for residential water use
The lower PF curve in the figure above corresponds to indoor water use only. Since
virtually all indoor water use is returned as domestic sewage, this curve could be used
for sizing sanitary wastewater systems. However, this approach does not account for
infiltration and inflows that depend on wet weather and system defects.
Figure A 4.2-33 Comparison between PRP-Gumbel approach and other empirical
methods
The PF expression for indoor water use only was;
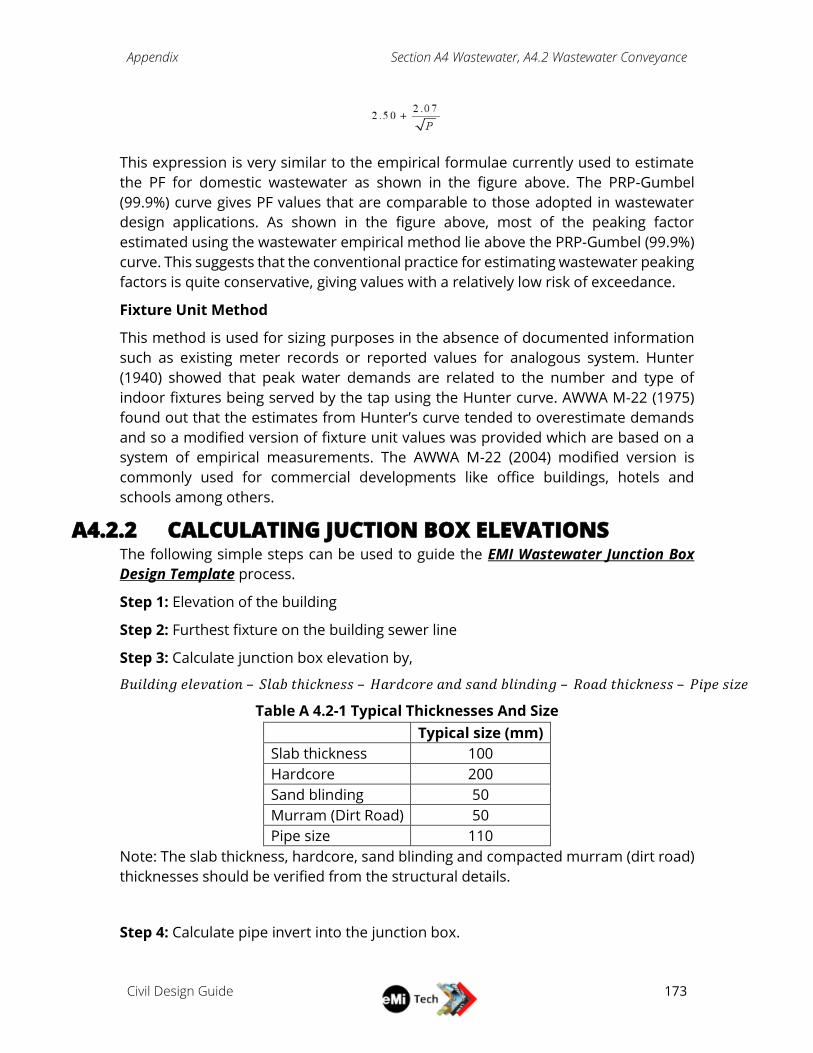
Appendix Section A4 Wastewater, A4.2 Wastewater Conveyance
Civil Design Guide
173
This expression is very similar to the empirical formulae currently used to estimate
the PF for domestic wastewater as shown in the figure above. The PRP-Gumbel
(99.9%) curve gives PF values that are comparable to those adopted in wastewater
design applications. As shown in the figure above, most of the peaking factor
estimated using the wastewater empirical method lie above the PRP-Gumbel (99.9%)
curve. This suggests that the conventional practice for estimating wastewater peaking
factors is quite conservative, giving values with a relatively low risk of exceedance.
Fixture Unit Method
This method is used for sizing purposes in the absence of documented information
such as existing meter records or reported values for analogous system. Hunter
(1940) showed that peak water demands are related to the number and type of
indoor fixtures being served by the tap using the Hunter curve. AWWA M-22 (1975)
found out that the estimates from Hunter’s curve tended to overestimate demands
and so a modified version of fixture unit values was provided which are based on a
system of empirical measurements. The AWWA M-22 (2004) modified version is
commonly used for commercial developments like office buildings, hotels and
schools among others.
A4.2.2 CALCULATING JUCTION BOX ELEVATIONS The following simple steps can be used to guide the EMI Wastewater Junction Box
Design Template process.
Step 1: Elevation of the building
Step 2: Furthest fixture on the building sewer line
Step 3: Calculate junction box elevation by,
𝐵𝑢𝑖𝑙𝑑𝑖𝑛𝑔 𝑒𝑙𝑒𝑣𝑎𝑡𝑖𝑜𝑛 – 𝑆𝑙𝑎𝑏 𝑡ℎ𝑖𝑐𝑘𝑛𝑒𝑠𝑠 – 𝐻𝑎𝑟𝑑𝑐𝑜𝑟𝑒 𝑎𝑛𝑑 𝑠𝑎𝑛𝑑 𝑏𝑙𝑖𝑛𝑑𝑖𝑛𝑔 – 𝑅𝑜𝑎𝑑 𝑡ℎ𝑖𝑐𝑘𝑛𝑒𝑠𝑠 – 𝑃𝑖𝑝𝑒 𝑠𝑖𝑧𝑒
Table A 4.2-1 Typical Thicknesses And Size
Typical size (mm)
Slab thickness 100
Hardcore 200
Sand blinding 50
Murram (Dirt Road) 50
Pipe size 110
Note: The slab thickness, hardcore, sand blinding and compacted murram (dirt road)
thicknesses should be verified from the structural details.
Step 4: Calculate pipe invert into the junction box.
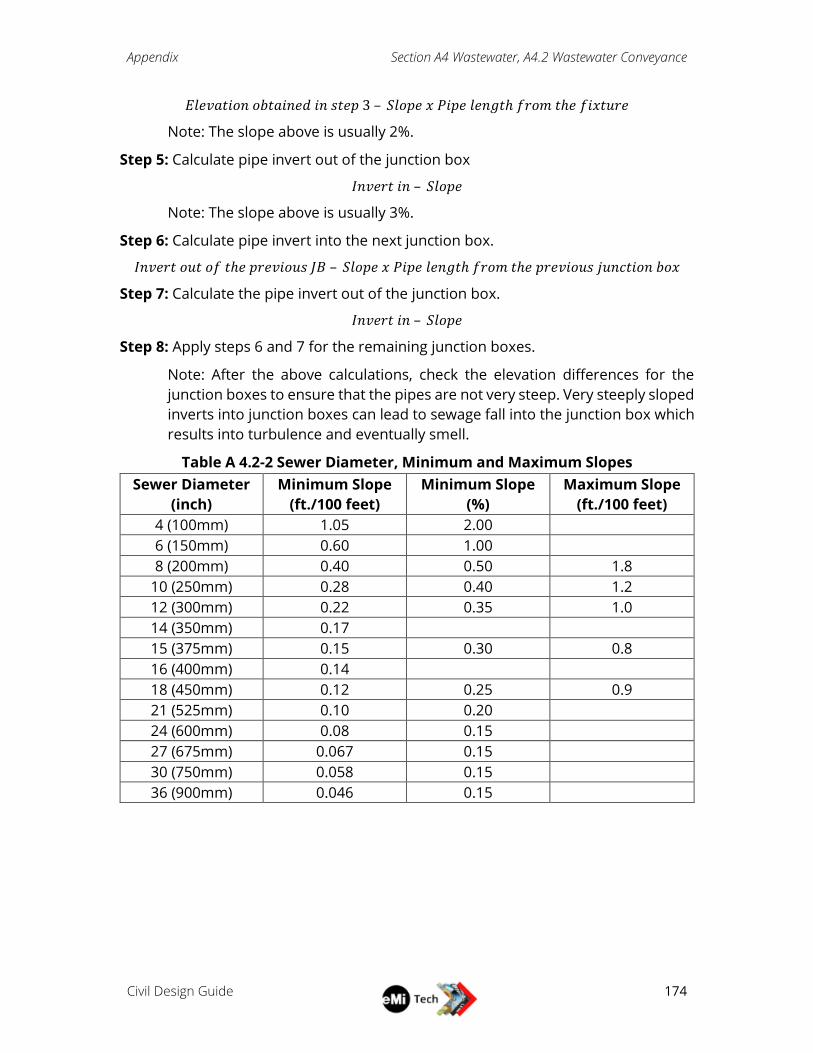
Appendix Section A4 Wastewater, A4.2 Wastewater Conveyance
Civil Design Guide
174
𝐸𝑙𝑒𝑣𝑎𝑡𝑖𝑜𝑛 𝑜𝑏𝑡𝑎𝑖𝑛𝑒𝑑 𝑖𝑛 𝑠𝑡𝑒𝑝 3 – 𝑆𝑙𝑜𝑝𝑒 𝑥 𝑃𝑖𝑝𝑒 𝑙𝑒𝑛𝑔𝑡ℎ 𝑓𝑟𝑜𝑚 𝑡ℎ𝑒 𝑓𝑖𝑥𝑡𝑢𝑟𝑒
Note: The slope above is usually 2%.
Step 5: Calculate pipe invert out of the junction box
𝐼𝑛𝑣𝑒𝑟𝑡 𝑖𝑛 – 𝑆𝑙𝑜𝑝𝑒
Note: The slope above is usually 3%.
Step 6: Calculate pipe invert into the next junction box.
𝐼𝑛𝑣𝑒𝑟𝑡 𝑜𝑢𝑡 𝑜𝑓 𝑡ℎ𝑒 𝑝𝑟𝑒𝑣𝑖𝑜𝑢𝑠 𝐽𝐵 – 𝑆𝑙𝑜𝑝𝑒 𝑥 𝑃𝑖𝑝𝑒 𝑙𝑒𝑛𝑔𝑡ℎ 𝑓𝑟𝑜𝑚 𝑡ℎ𝑒 𝑝𝑟𝑒𝑣𝑖𝑜𝑢𝑠 𝑗𝑢𝑛𝑐𝑡𝑖𝑜𝑛 𝑏𝑜𝑥
Step 7: Calculate the pipe invert out of the junction box.
𝐼𝑛𝑣𝑒𝑟𝑡 𝑖𝑛 – 𝑆𝑙𝑜𝑝𝑒
Step 8: Apply steps 6 and 7 for the remaining junction boxes.
Note: After the above calculations, check the elevation differences for the
junction boxes to ensure that the pipes are not very steep. Very steeply sloped
inverts into junction boxes can lead to sewage fall into the junction box which
results into turbulence and eventually smell.
Table A 4.2-2 Sewer Diameter, Minimum and Maximum Slopes
Sewer Diameter
(inch)
Minimum Slope
(ft./100 feet)
Minimum Slope
(%)
Maximum Slope
(ft./100 feet)
4 (100mm) 1.05 2.00
6 (150mm) 0.60 1.00
8 (200mm) 0.40 0.50 1.8
10 (250mm) 0.28 0.40 1.2
12 (300mm) 0.22 0.35 1.0
14 (350mm) 0.17
15 (375mm) 0.15 0.30 0.8
16 (400mm) 0.14
18 (450mm) 0.12 0.25 0.9
21 (525mm) 0.10 0.20
24 (600mm) 0.08 0.15
27 (675mm) 0.067 0.15
30 (750mm) 0.058 0.15
36 (900mm) 0.046 0.15
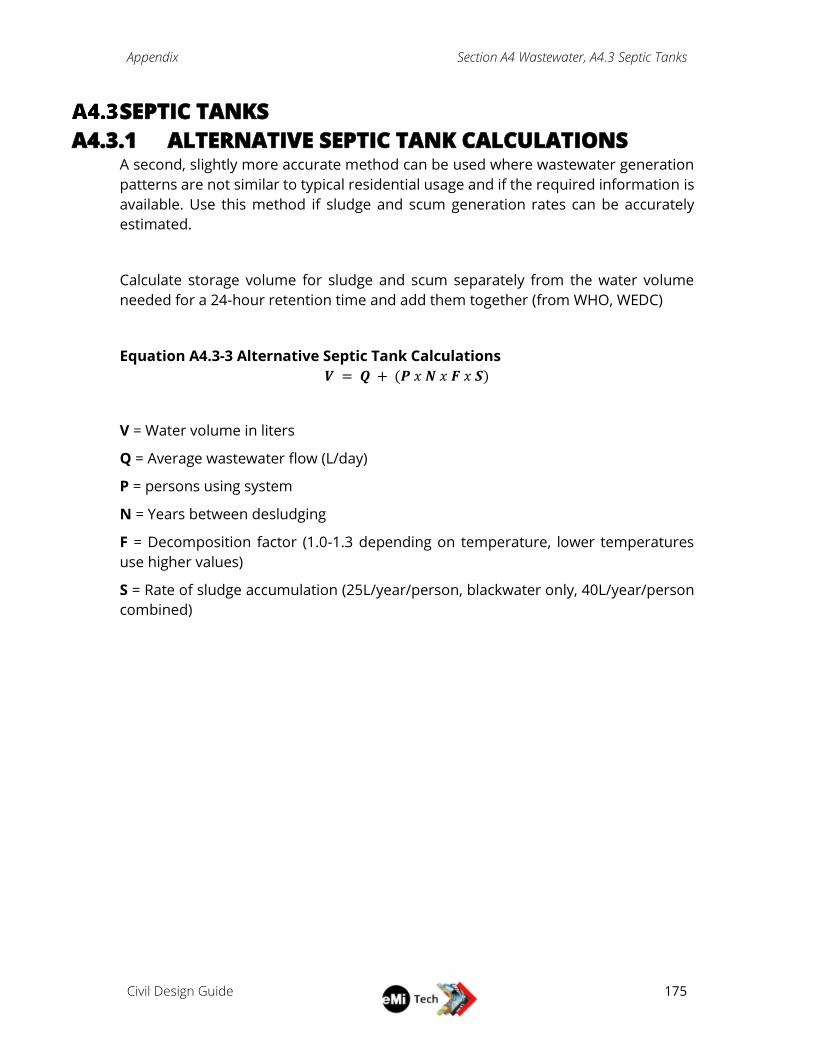
Appendix Section A4 Wastewater, A4.3 Septic Tanks
Civil Design Guide
175
SEPTIC TANKS
A4.3.1 ALTERNATIVE SEPTIC TANK CALCULATIONS A second, slightly more accurate method can be used where wastewater generation
patterns are not similar to typical residential usage and if the required information is
available. Use this method if sludge and scum generation rates can be accurately
estimated.
Calculate storage volume for sludge and scum separately from the water volume
needed for a 24-hour retention time and add them together (from WHO, WEDC)
Equation A4.3-3 Alternative Septic Tank Calculations
𝑽 = 𝑸 + (𝑷 𝑥 𝑵 𝑥 𝑭 𝑥 𝑺)
V = Water volume in liters
Q = Average wastewater flow (L/day)
P = persons using system
N = Years between desludging
F = Decomposition factor (1.0-1.3 depending on temperature, lower temperatures
use higher values)
S = Rate of sludge accumulation (25L/year/person, blackwater only, 40L/year/person
combined)
Appendix Section A4 Wastewater, A4.3 Septic Tanks
Civil Design Guide
176
A4.3.2 MAINTAINING SEPTIC TANK AND ABSORPTION FIELD
SYSTEM Do
Do obtain necessary permits from the appropriate local agency before doing
any construction or repairs.
Do use professional certified installers when needed.
Do keep your septic tank and distribution box accessible for pumping and
adjustment. Install risers if necessary. The covers should be locked or of
sufficient weight to prevent a child from lifting them.
Do have your septic system inspected annually and tank pumped out every 2
to 5 years by a professional contractor.
Do keep a detailed record of repairs, pumping, inspections, permits issued and
other maintenance activities.
Do conserve water to avoid overloading the system. Repair dripping faucets
and leaking toilets, avoid long showers and run washing machines and
dishwashers only when full. Use water-saving features in faucets, shower
heads and toilets.
Do divert other sources of water, such as roof drains, house footing drains,
sump pump outlets, and driveway and hillside runoff away from the septic
system. Use curtain drains, surface diversions, downspout extensions,
retaining walls, etc. to divert water.
Do take leftover hazardous household chemicals to an approved hazardous
waste collection center for disposal. Use bleach, disinfectants and drain and
toilet bowl cleaners sparingly and in accordance with product labels.
Don't
Don't go down into a septic tank for any reason. Toxic gases in the tank can be
explosive and can cause asphyxiation.
Don't allow anyone to drive or park over any part of the system.
Don't cover the absorption field with a hard surface, such as concrete or
asphalt. Grass is the best cover for promoting proper functioning of the field.
The grass will not only prevent erosion but will help remove excess water.
Don't plant a garden, trees or shrubbery over or near the absorption field area.
Tillage may cut absorption trenches. The roots can clog and damage the drain
lines.
Don't make or allow repairs to your septic system without obtaining the
necessary permits.

Appendix Section A4 Wastewater, A4.3 Septic Tanks
Civil Design Guide
177
Don't pour into drains any grease, cooking fats, chemical drain openers, paint,
varnishes, solvents, fuels, waste oil, photographic solutions, pesticides or
other organic chemicals. They can upset the bacterial action in the tank and
pollute groundwater.
Don't use your toilet as a trash can. Keep out coffee grounds, bones, cigarette
butts, disposable diapers, feminine hygiene products, paper towels, facial
tissues and other materials that decompose very slowly.
Don't add enzyme or yeast additives to the septic tank in hopes of improving
bacterial action. None have been proven beneficial and some actually cause
damage to soil and vegetation and may pollute groundwater.
Source: Schultheies, 2001
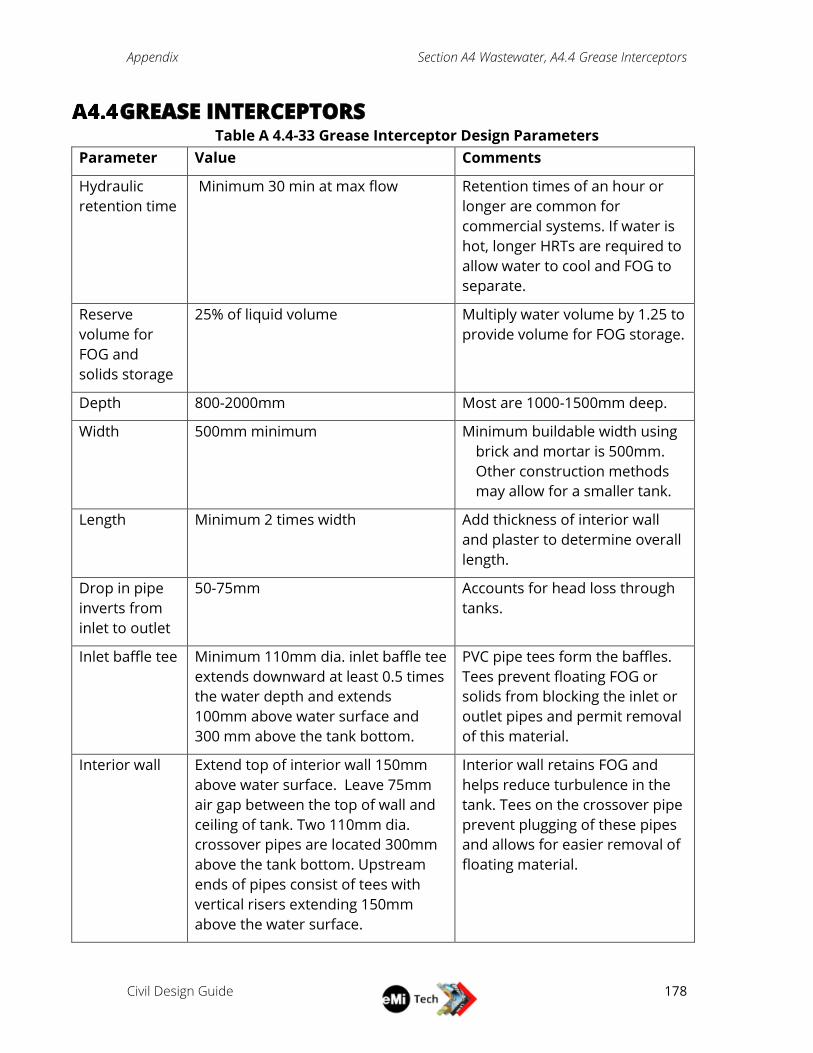
Appendix Section A4 Wastewater, A4.4 Grease Interceptors
Civil Design Guide
178
GREASE INTERCEPTORS Table A 4.4-33 Grease Interceptor Design Parameters
Parameter Value Comments
Hydraulic
retention time
Minimum 30 min at max flow Retention times of an hour or
longer are common for
commercial systems. If water is
hot, longer HRTs are required to
allow water to cool and FOG to
separate.
Reserve
volume for
FOG and
solids storage
25% of liquid volume Multiply water volume by 1.25 to
provide volume for FOG storage.
Depth 800-2000mm Most are 1000-1500mm deep.
Width 500mm minimum Minimum buildable width using
brick and mortar is 500mm.
Other construction methods
may allow for a smaller tank.
Length Minimum 2 times width Add thickness of interior wall
and plaster to determine overall
length.
Drop in pipe
inverts from
inlet to outlet
50-75mm Accounts for head loss through
tanks.
Inlet baffle tee Minimum 110mm dia. inlet baffle tee
extends downward at least 0.5 times
the water depth and extends
100mm above water surface and
300 mm above the tank bottom.
PVC pipe tees form the baffles.
Tees prevent floating FOG or
solids from blocking the inlet or
outlet pipes and permit removal
of this material.
Interior wall Extend top of interior wall 150mm
above water surface. Leave 75mm
air gap between the top of wall and
ceiling of tank. Two 110mm dia.
crossover pipes are located 300mm
above the tank bottom. Upstream
ends of pipes consist of tees with
vertical risers extending 150mm
above the water surface.
Interior wall retains FOG and
helps reduce turbulence in the
tank. Tees on the crossover pipe
prevent plugging of these pipes
and allows for easier removal of
floating material.
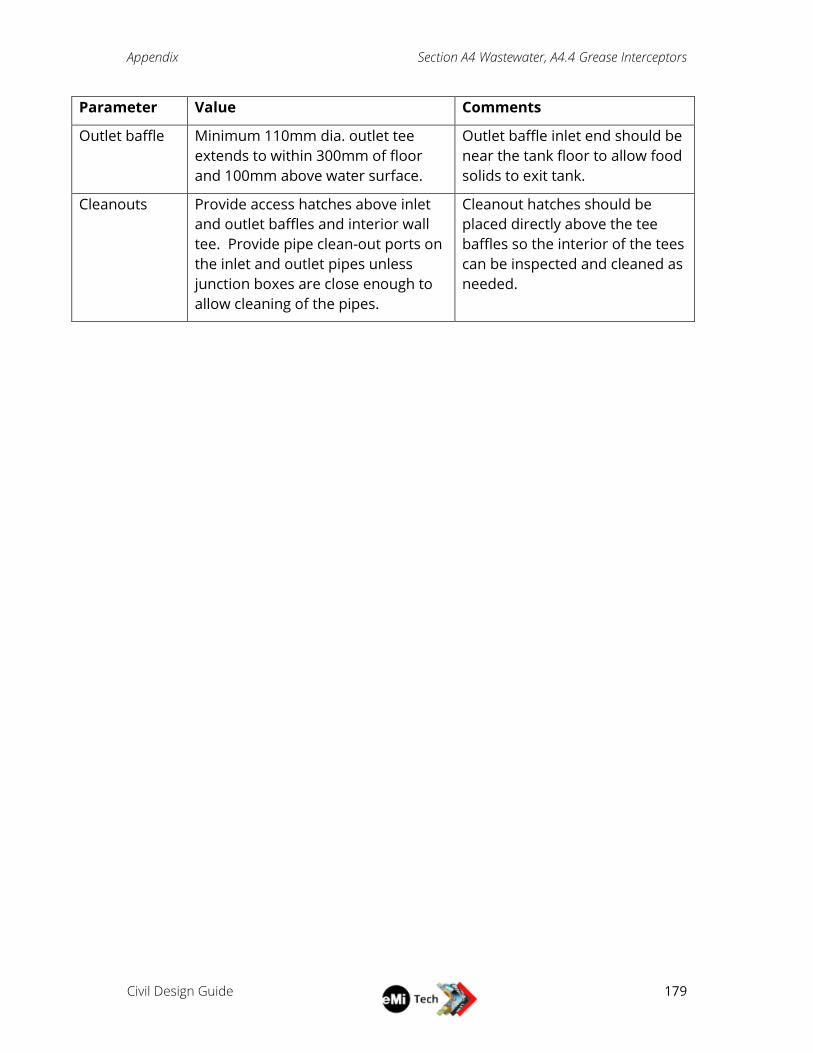
Appendix Section A4 Wastewater, A4.4 Grease Interceptors
Civil Design Guide
179
Parameter Value Comments
Outlet baffle Minimum 110mm dia. outlet tee
extends to within 300mm of floor
and 100mm above water surface.
Outlet baffle inlet end should be
near the tank floor to allow food
solids to exit tank.
Cleanouts Provide access hatches above inlet
and outlet baffles and interior wall
tee. Provide pipe clean-out ports on
the inlet and outlet pipes unless
junction boxes are close enough to
allow cleaning of the pipes.
Cleanout hatches should be
placed directly above the tee
baffles so the interior of the tees
can be inspected and cleaned as
needed.
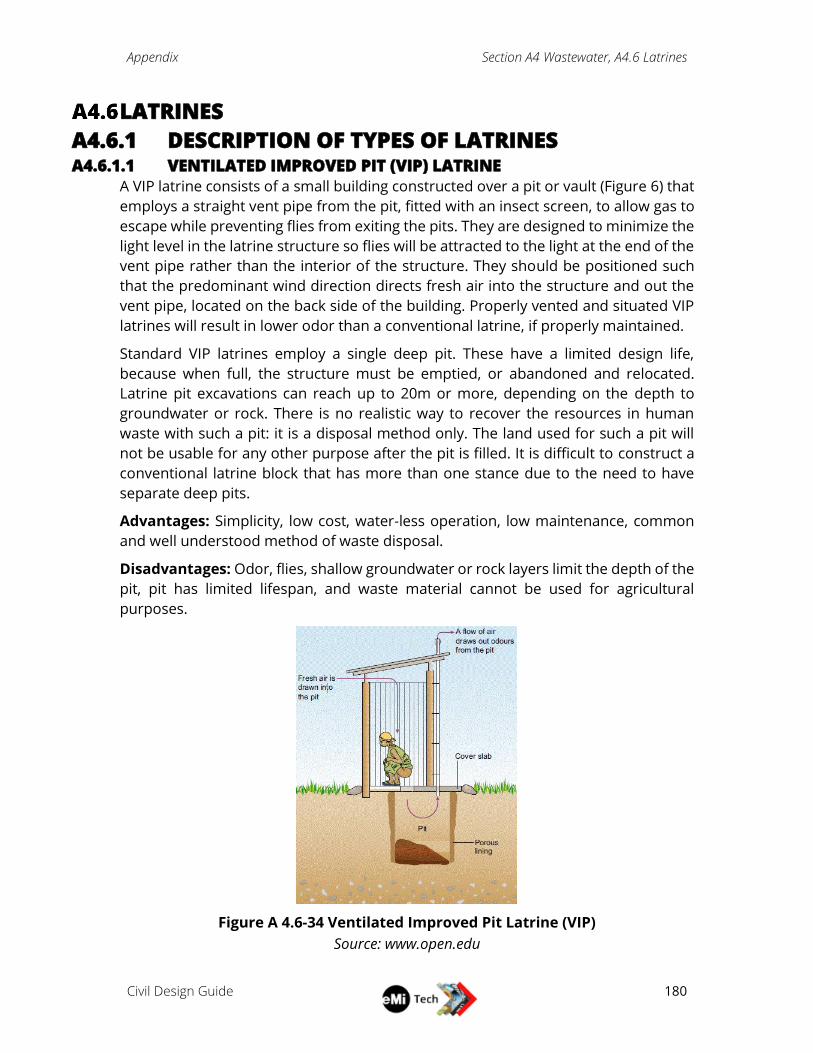
Appendix Section A4 Wastewater, A4.6 Latrines
Civil Design Guide
180
LATRINES
A4.6.1 DESCRIPTION OF TYPES OF LATRINES A4.6.1.1 VENTILATED IMPROVED PIT (VIP) LATRINE
A VIP latrine consists of a small building constructed over a pit or vault (Figure 6) that
employs a straight vent pipe from the pit, fitted with an insect screen, to allow gas to
escape while preventing flies from exiting the pits. They are designed to minimize the
light level in the latrine structure so flies will be attracted to the light at the end of the
vent pipe rather than the interior of the structure. They should be positioned such
that the predominant wind direction directs fresh air into the structure and out the
vent pipe, located on the back side of the building. Properly vented and situated VIP
latrines will result in lower odor than a conventional latrine, if properly maintained.
Standard VIP latrines employ a single deep pit. These have a limited design life,
because when full, the structure must be emptied, or abandoned and relocated.
Latrine pit excavations can reach up to 20m or more, depending on the depth to
groundwater or rock. There is no realistic way to recover the resources in human
waste with such a pit: it is a disposal method only. The land used for such a pit will
not be usable for any other purpose after the pit is filled. It is difficult to construct a
conventional latrine block that has more than one stance due to the need to have
separate deep pits.
Advantages: Simplicity, low cost, water-less operation, low maintenance, common
and well understood method of waste disposal.
Disadvantages: Odor, flies, shallow groundwater or rock layers limit the depth of the
pit, pit has limited lifespan, and waste material cannot be used for agricultural
purposes.
Figure A 4.6-34 Ventilated Improved Pit Latrine (VIP)
Source: www.open.edu
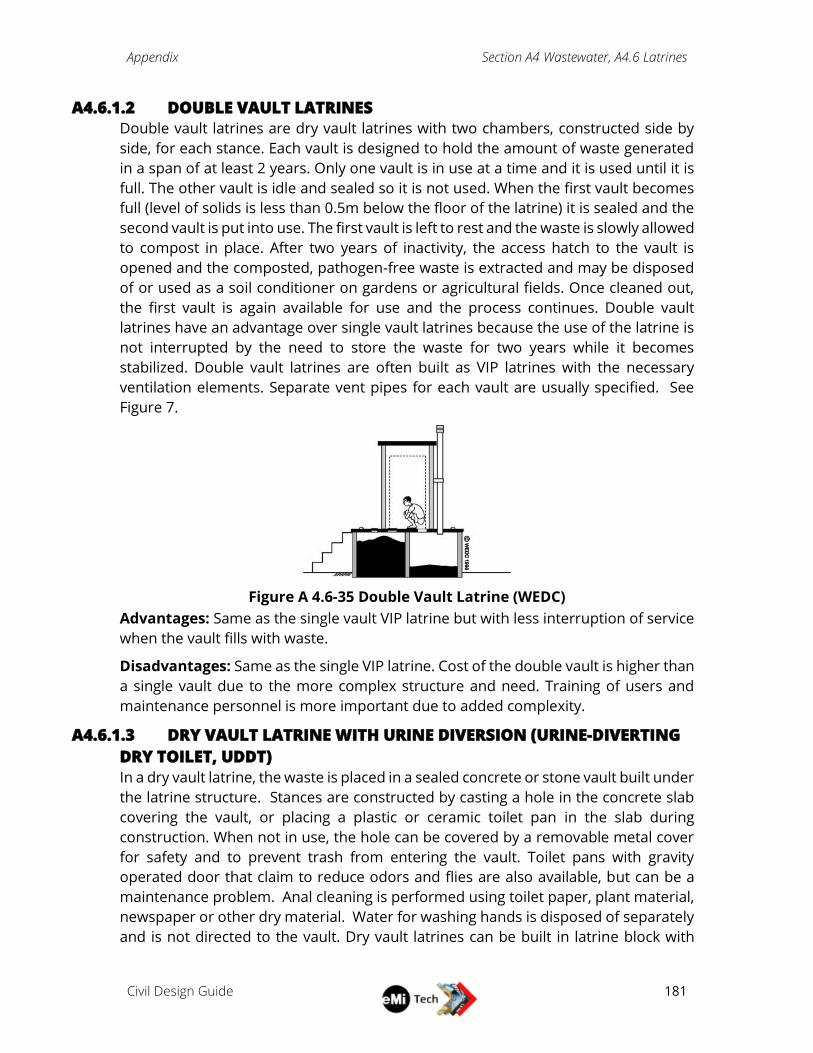
Appendix Section A4 Wastewater, A4.6 Latrines
Civil Design Guide
181
A4.6.1.2 DOUBLE VAULT LATRINES
Double vault latrines are dry vault latrines with two chambers, constructed side by
side, for each stance. Each vault is designed to hold the amount of waste generated
in a span of at least 2 years. Only one vault is in use at a time and it is used until it is
full. The other vault is idle and sealed so it is not used. When the first vault becomes
full (level of solids is less than 0.5m below the floor of the latrine) it is sealed and the
second vault is put into use. The first vault is left to rest and the waste is slowly allowed
to compost in place. After two years of inactivity, the access hatch to the vault is
opened and the composted, pathogen-free waste is extracted and may be disposed
of or used as a soil conditioner on gardens or agricultural fields. Once cleaned out,
the first vault is again available for use and the process continues. Double vault
latrines have an advantage over single vault latrines because the use of the latrine is
not interrupted by the need to store the waste for two years while it becomes
stabilized. Double vault latrines are often built as VIP latrines with the necessary
ventilation elements. Separate vent pipes for each vault are usually specified. See
Figure 7.
Figure A 4.6-35 Double Vault Latrine (WEDC)
Advantages: Same as the single vault VIP latrine but with less interruption of service
when the vault fills with waste.
Disadvantages: Same as the single VIP latrine. Cost of the double vault is higher than
a single vault due to the more complex structure and need. Training of users and
maintenance personnel is more important due to added complexity.
A4.6.1.3 DRY VAULT LATRINE WITH URINE DIVERSION (URINE-DIVERTING
DRY TOILET, UDDT)
In a dry vault latrine, the waste is placed in a sealed concrete or stone vault built under
the latrine structure. Stances are constructed by casting a hole in the concrete slab
covering the vault, or placing a plastic or ceramic toilet pan in the slab during
construction. When not in use, the hole can be covered by a removable metal cover
for safety and to prevent trash from entering the vault. Toilet pans with gravity
operated door that claim to reduce odors and flies are also available, but can be a
maintenance problem. Anal cleaning is performed using toilet paper, plant material,
newspaper or other dry material. Water for washing hands is disposed of separately
and is not directed to the vault. Dry vault latrines can be built in latrine block with
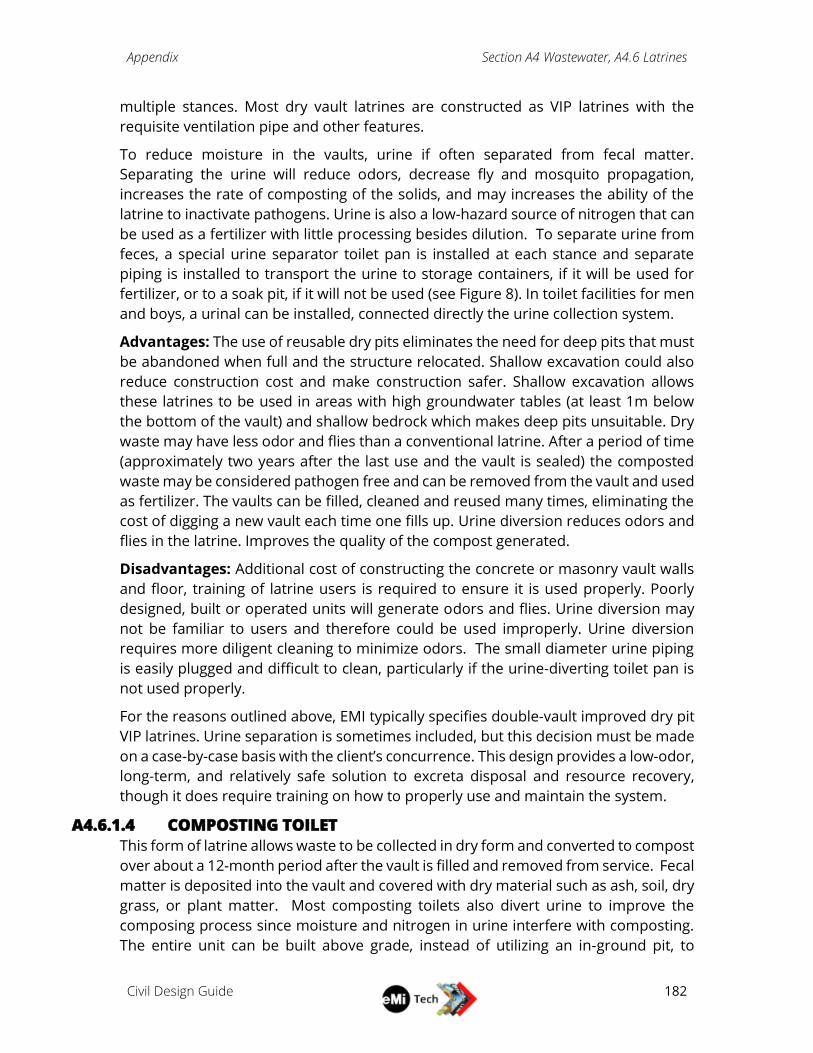
Appendix Section A4 Wastewater, A4.6 Latrines
Civil Design Guide
182
multiple stances. Most dry vault latrines are constructed as VIP latrines with the
requisite ventilation pipe and other features.
To reduce moisture in the vaults, urine if often separated from fecal matter.
Separating the urine will reduce odors, decrease fly and mosquito propagation,
increases the rate of composting of the solids, and may increases the ability of the
latrine to inactivate pathogens. Urine is also a low-hazard source of nitrogen that can
be used as a fertilizer with little processing besides dilution. To separate urine from
feces, a special urine separator toilet pan is installed at each stance and separate
piping is installed to transport the urine to storage containers, if it will be used for
fertilizer, or to a soak pit, if it will not be used (see Figure 8). In toilet facilities for men
and boys, a urinal can be installed, connected directly the urine collection system.
Advantages: The use of reusable dry pits eliminates the need for deep pits that must
be abandoned when full and the structure relocated. Shallow excavation could also
reduce construction cost and make construction safer. Shallow excavation allows
these latrines to be used in areas with high groundwater tables (at least 1m below
the bottom of the vault) and shallow bedrock which makes deep pits unsuitable. Dry
waste may have less odor and flies than a conventional latrine. After a period of time
(approximately two years after the last use and the vault is sealed) the composted
waste may be considered pathogen free and can be removed from the vault and used
as fertilizer. The vaults can be filled, cleaned and reused many times, eliminating the
cost of digging a new vault each time one fills up. Urine diversion reduces odors and
flies in the latrine. Improves the quality of the compost generated.
Disadvantages: Additional cost of constructing the concrete or masonry vault walls
and floor, training of latrine users is required to ensure it is used properly. Poorly
designed, built or operated units will generate odors and flies. Urine diversion may
not be familiar to users and therefore could be used improperly. Urine diversion
requires more diligent cleaning to minimize odors. The small diameter urine piping
is easily plugged and difficult to clean, particularly if the urine-diverting toilet pan is
not used properly.
For the reasons outlined above, EMI typically specifies double-vault improved dry pit
VIP latrines. Urine separation is sometimes included, but this decision must be made
on a case-by-case basis with the client’s concurrence. This design provides a low-odor,
long-term, and relatively safe solution to excreta disposal and resource recovery,
though it does require training on how to properly use and maintain the system.
A4.6.1.4 COMPOSTING TOILET
This form of latrine allows waste to be collected in dry form and converted to compost
over about a 12-month period after the vault is filled and removed from service. Fecal
matter is deposited into the vault and covered with dry material such as ash, soil, dry
grass, or plant matter. Most composting toilets also divert urine to improve the
composing process since moisture and nitrogen in urine interfere with composting.
The entire unit can be built above grade, instead of utilizing an in-ground pit, to
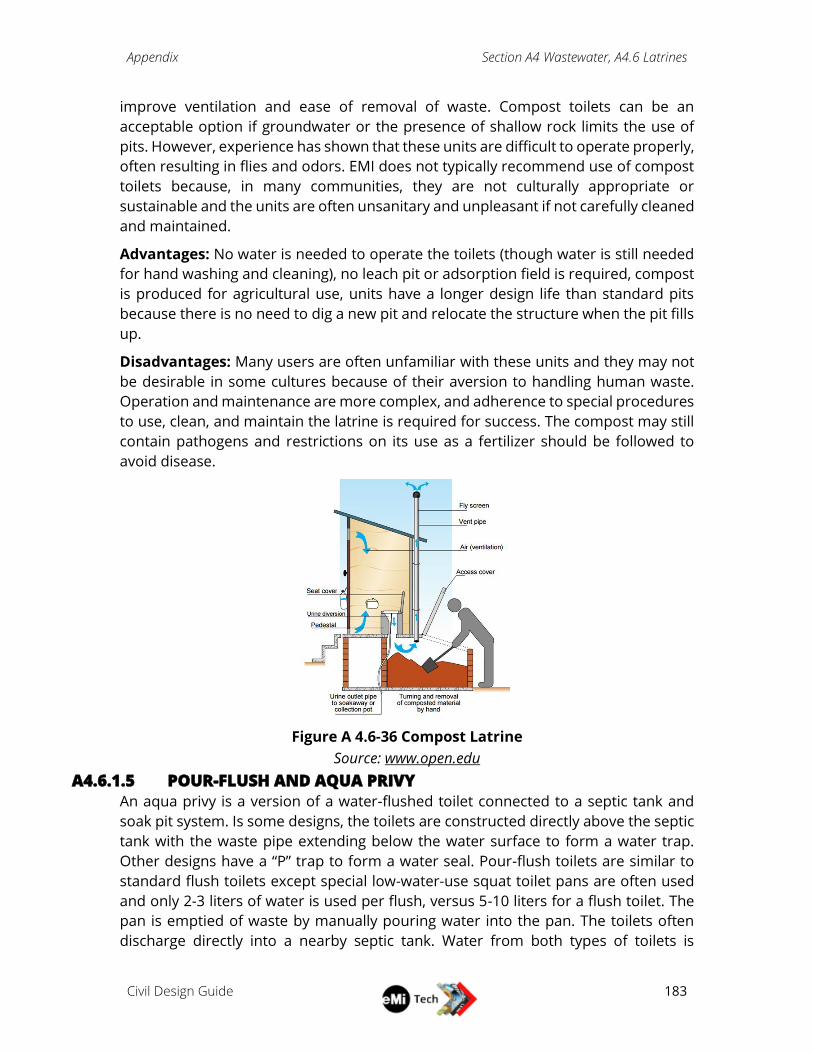
Appendix Section A4 Wastewater, A4.6 Latrines
Civil Design Guide
183
improve ventilation and ease of removal of waste. Compost toilets can be an
acceptable option if groundwater or the presence of shallow rock limits the use of
pits. However, experience has shown that these units are difficult to operate properly,
often resulting in flies and odors. EMI does not typically recommend use of compost
toilets because, in many communities, they are not culturally appropriate or
sustainable and the units are often unsanitary and unpleasant if not carefully cleaned
and maintained.
Advantages: No water is needed to operate the toilets (though water is still needed
for hand washing and cleaning), no leach pit or adsorption field is required, compost
is produced for agricultural use, units have a longer design life than standard pits
because there is no need to dig a new pit and relocate the structure when the pit fills
up.
Disadvantages: Many users are often unfamiliar with these units and they may not
be desirable in some cultures because of their aversion to handling human waste.
Operation and maintenance are more complex, and adherence to special procedures
to use, clean, and maintain the latrine is required for success. The compost may still
contain pathogens and restrictions on its use as a fertilizer should be followed to
avoid disease.
Figure A 4.6-36 Compost Latrine
Source: www.open.edu
A4.6.1.5 POUR-FLUSH AND AQUA PRIVY
An aqua privy is a version of a water-flushed toilet connected to a septic tank and
soak pit system. Is some designs, the toilets are constructed directly above the septic
tank with the waste pipe extending below the water surface to form a water trap.
Other designs have a “P” trap to form a water seal. Pour-flush toilets are similar to
standard flush toilets except special low-water-use squat toilet pans are often used
and only 2-3 liters of water is used per flush, versus 5-10 liters for a flush toilet. The
pan is emptied of waste by manually pouring water into the pan. The toilets often
discharge directly into a nearby septic tank. Water from both types of toilets is
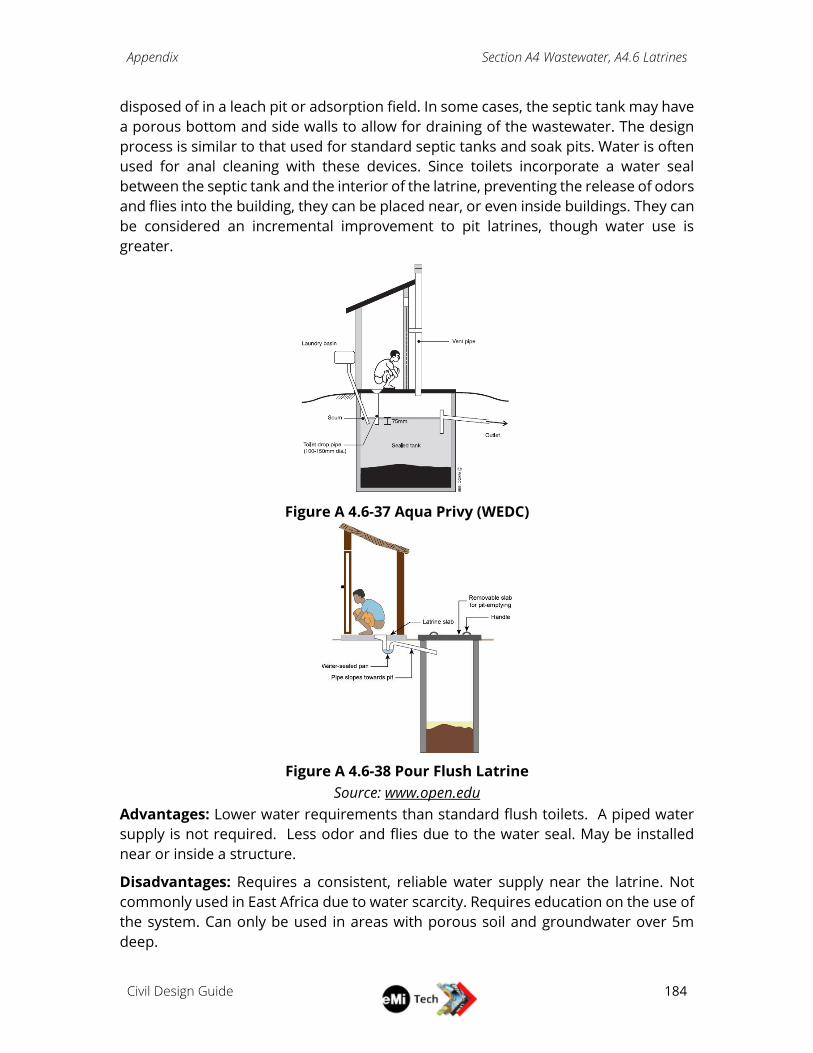
Appendix Section A4 Wastewater, A4.6 Latrines
Civil Design Guide
184
disposed of in a leach pit or adsorption field. In some cases, the septic tank may have
a porous bottom and side walls to allow for draining of the wastewater. The design
process is similar to that used for standard septic tanks and soak pits. Water is often
used for anal cleaning with these devices. Since toilets incorporate a water seal
between the septic tank and the interior of the latrine, preventing the release of odors
and flies into the building, they can be placed near, or even inside buildings. They can
be considered an incremental improvement to pit latrines, though water use is
greater.
Figure A 4.6-37 Aqua Privy (WEDC)
Figure A 4.6-38 Pour Flush Latrine
Source: www.open.edu
Advantages: Lower water requirements than standard flush toilets. A piped water
supply is not required. Less odor and flies due to the water seal. May be installed
near or inside a structure.
Disadvantages: Requires a consistent, reliable water supply near the latrine. Not
commonly used in East Africa due to water scarcity. Requires education on the use of
the system. Can only be used in areas with porous soil and groundwater over 5m
deep.
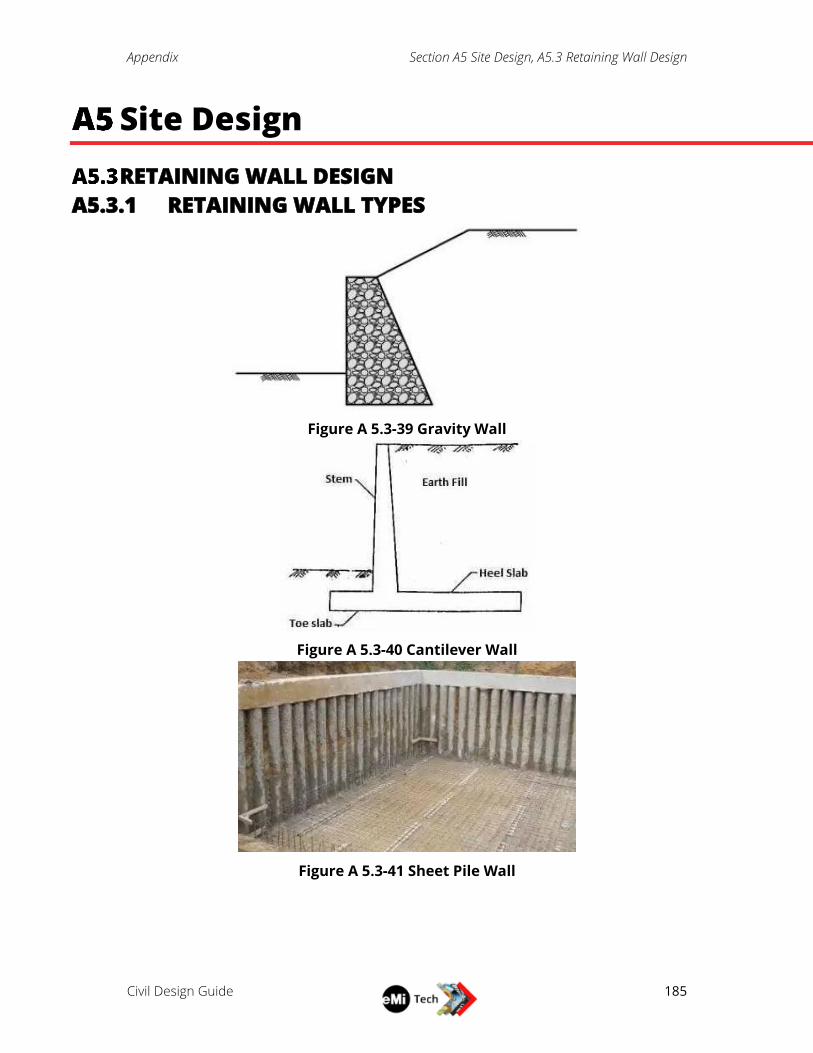
Appendix Section A5 Site Design, A5.3 Retaining Wall Design
Civil Design Guide
185
Site Design
RETAINING WALL DESIGN
A5.3.1 RETAINING WALL TYPES
Figure A 5.3-39 Gravity Wall
Figure A 5.3-40 Cantilever Wall
Figure A 5.3-41 Sheet Pile Wall
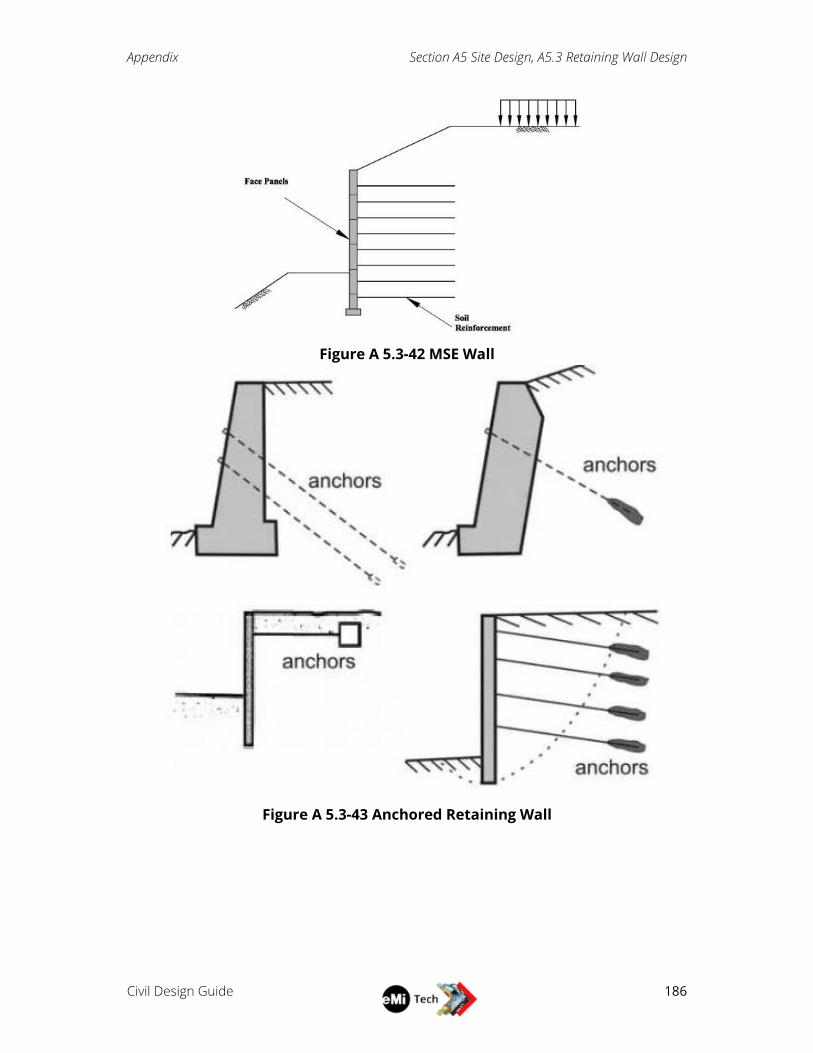
Appendix Section A5 Site Design, A5.3 Retaining Wall Design
Civil Design Guide
186
Figure A 5.3-42 MSE Wall
Figure A 5.3-43 Anchored Retaining Wall
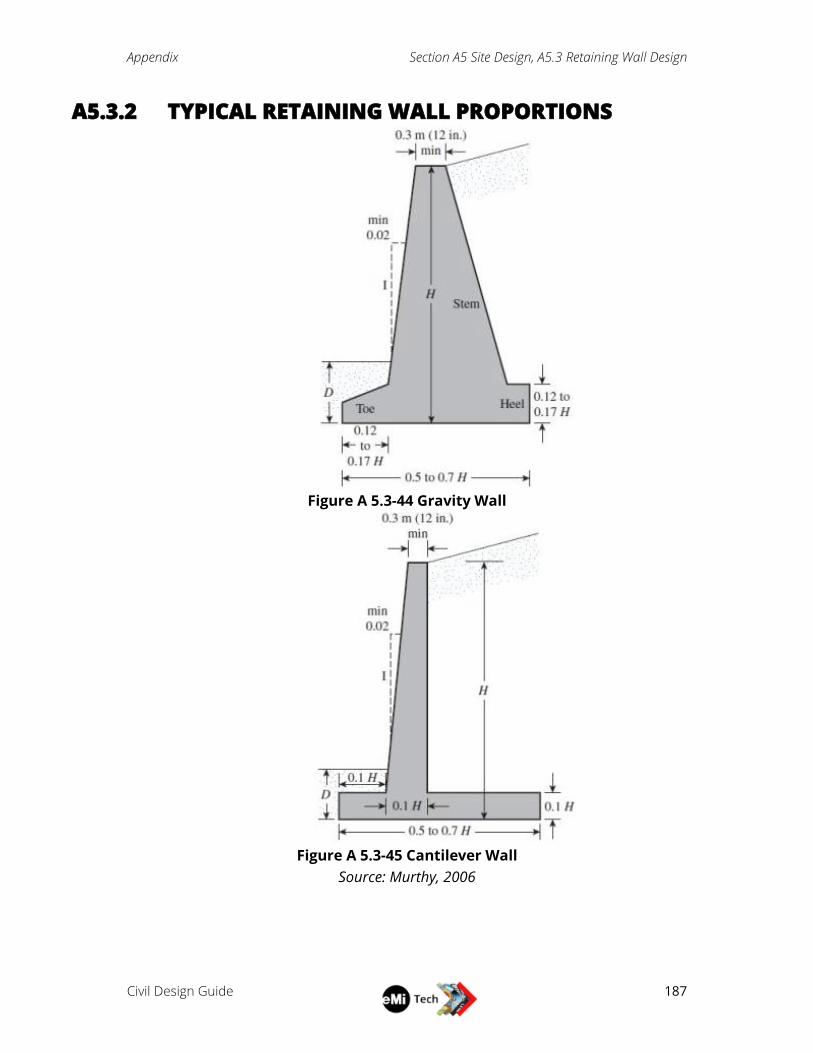
Appendix Section A5 Site Design, A5.3 Retaining Wall Design
Civil Design Guide
187
A5.3.2 TYPICAL RETAINING WALL PROPORTIONS
Figure A 5.3-44 Gravity Wall
Figure A 5.3-45 Cantilever Wall
Source: Murthy, 2006
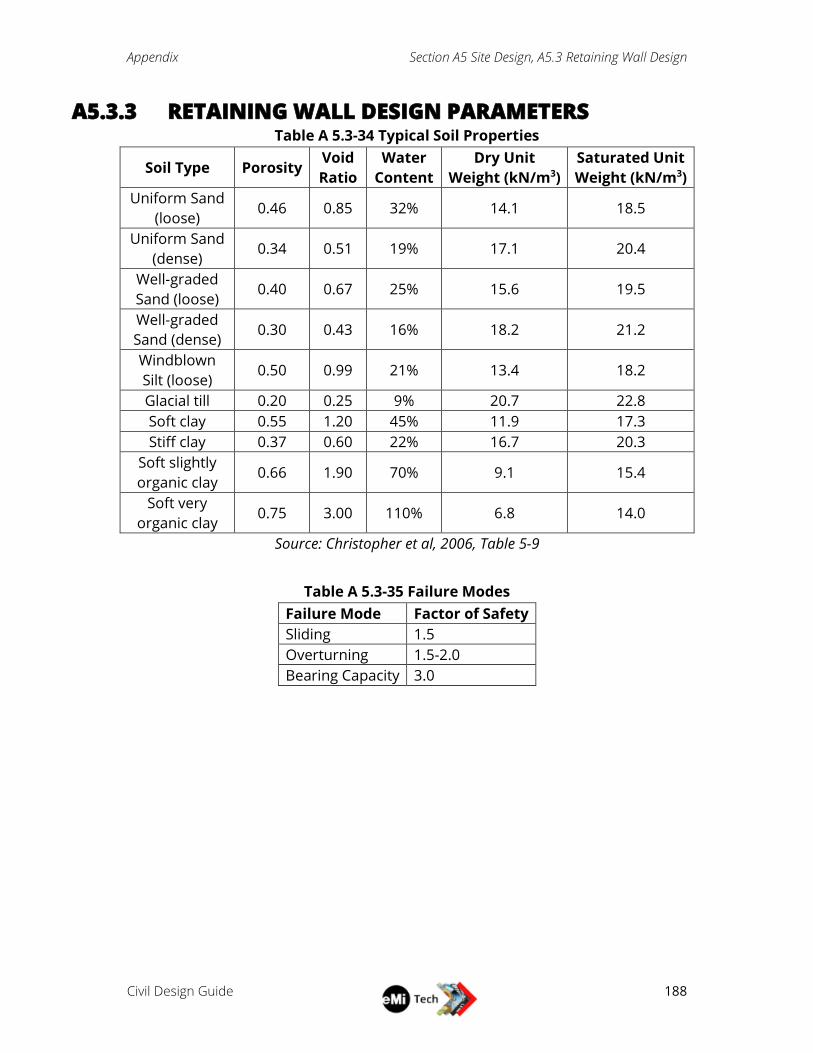
Appendix Section A5 Site Design, A5.3 Retaining Wall Design
Civil Design Guide
188
A5.3.3 RETAINING WALL DESIGN PARAMETERS Table A 5.3-34 Typical Soil Properties
Soil Type Porosity Void
Ratio
Water
Content
Dry Unit
Weight (kN/m3)
Saturated Unit
Weight (kN/m3)
Uniform Sand
(loose) 0.46 0.85 32% 14.1 18.5
Uniform Sand
(dense) 0.34 0.51 19% 17.1 20.4
Well-graded
Sand (loose) 0.40 0.67 25% 15.6 19.5
Well-graded
Sand (dense) 0.30 0.43 16% 18.2 21.2
Windblown
Silt (loose) 0.50 0.99 21% 13.4 18.2
Glacial till 0.20 0.25 9% 20.7 22.8
Soft clay 0.55 1.20 45% 11.9 17.3
Stiff clay 0.37 0.60 22% 16.7 20.3
Soft slightly
organic clay 0.66 1.90 70% 9.1 15.4
Soft very
organic clay 0.75 3.00 110% 6.8 14.0
Source: Christopher et al, 2006, Table 5-9
Table A 5.3-35 Failure Modes
Failure Mode Factor of Safety
Sliding 1.5
Overturning 1.5-2.0
Bearing Capacity 3.0
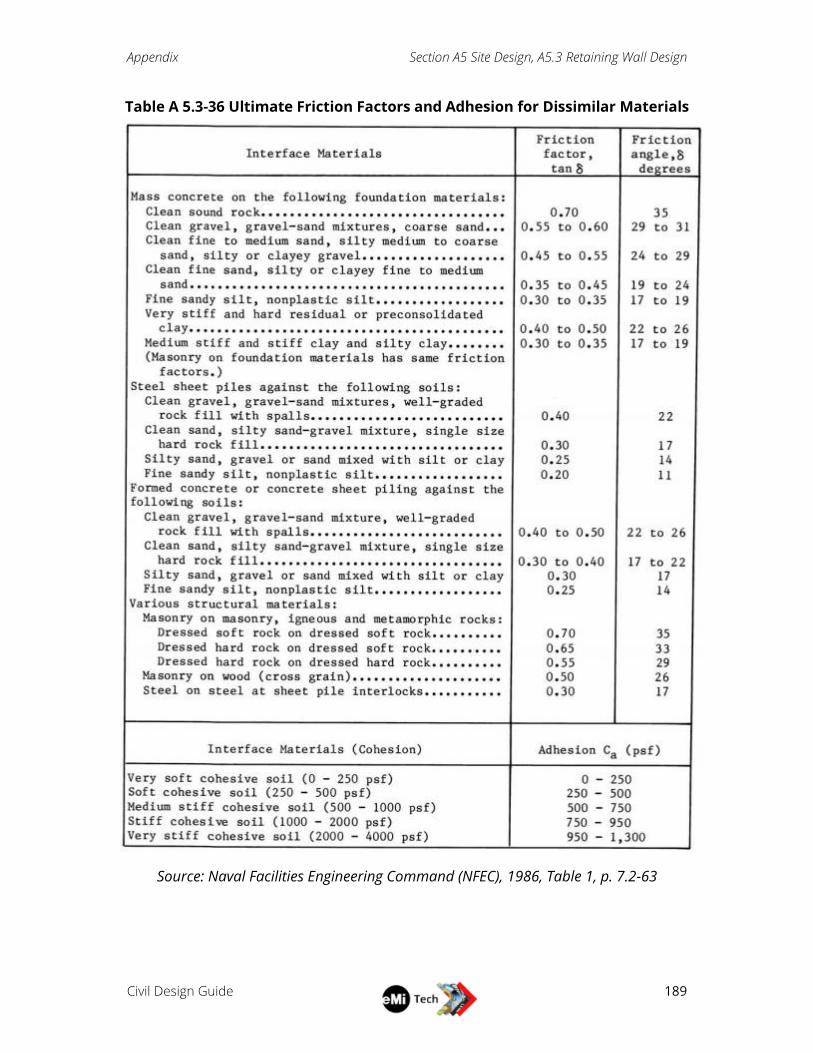
Appendix Section A5 Site Design, A5.3 Retaining Wall Design
Civil Design Guide
189
Table A 5.3-36 Ultimate Friction Factors and Adhesion for Dissimilar Materials
Source: Naval Facilities Engineering Command (NFEC), 1986, Table 1, p. 7.2-63
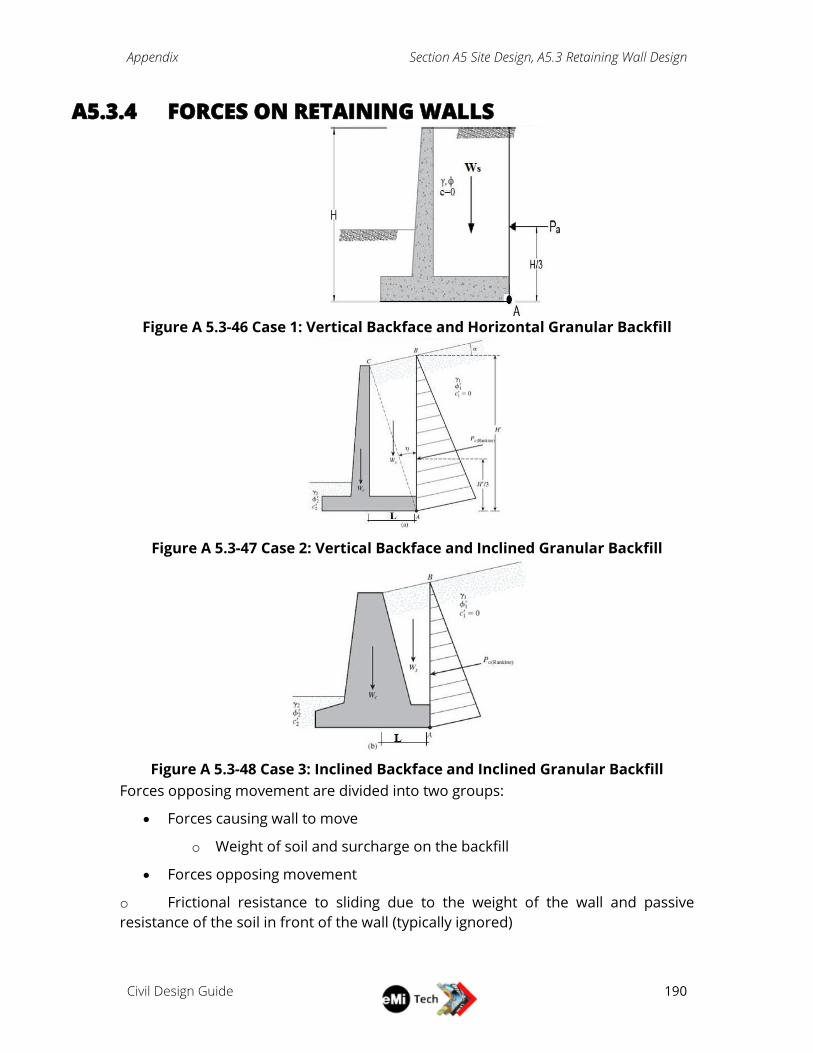
Appendix Section A5 Site Design, A5.3 Retaining Wall Design
Civil Design Guide
190
A5.3.4 FORCES ON RETAINING WALLS
Figure A 5.3-46 Case 1: Vertical Backface and Horizontal Granular Backfill
Figure A 5.3-47 Case 2: Vertical Backface and Inclined Granular Backfill
Figure A 5.3-48 Case 3: Inclined Backface and Inclined Granular Backfill
Forces opposing movement are divided into two groups:
Forces causing wall to move
o Weight of soil and surcharge on the backfill
Forces opposing movement
o Frictional resistance to sliding due to the weight of the wall and passive
resistance of the soil in front of the wall (typically ignored)
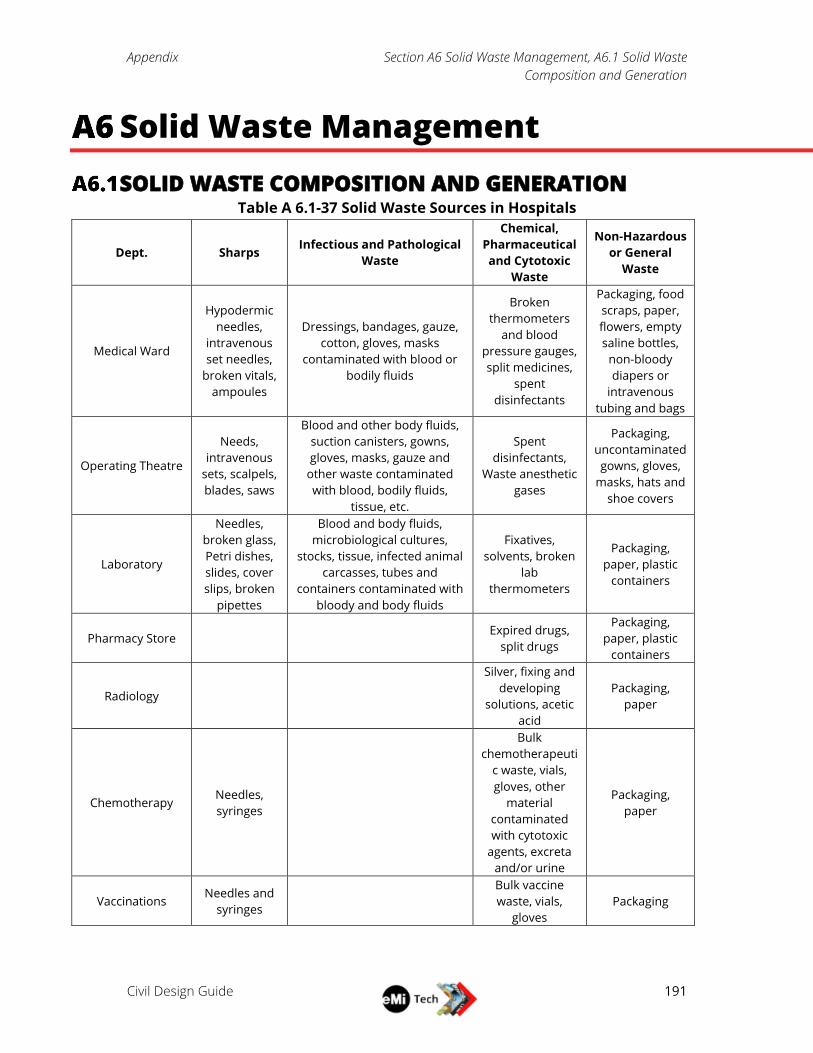
Appendix Section A6 Solid Waste Management, A6.1 Solid Waste
Composition and Generation
Civil Design Guide
191
Solid Waste Management
SOLID WASTE COMPOSITION AND GENERATION Table A 6.1-37 Solid Waste Sources in Hospitals
Dept. Sharps Infectious and Pathological
Waste
Chemical,
Pharmaceutical
and Cytotoxic
Waste
Non-Hazardous
or General
Waste
Medical Ward
Hypodermic
needles,
intravenous
set needles,
broken vitals,
ampoules
Dressings, bandages, gauze,
cotton, gloves, masks
contaminated with blood or
bodily fluids
Broken
thermometers
and blood
pressure gauges,
split medicines,
spent
disinfectants
Packaging, food
scraps, paper,
flowers, empty
saline bottles,
non-bloody
diapers or
intravenous
tubing and bags
Operating Theatre
Needs,
intravenous
sets, scalpels,
blades, saws
Blood and other body fluids,
suction canisters, gowns,
gloves, masks, gauze and
other waste contaminated
with blood, bodily fluids,
tissue, etc.
Spent
disinfectants,
Waste anesthetic
gases
Packaging,
uncontaminated
gowns, gloves,
masks, hats and
shoe covers
Laboratory
Needles,
broken glass,
Petri dishes,
slides, cover
slips, broken
pipettes
Blood and body fluids,
microbiological cultures,
stocks, tissue, infected animal
carcasses, tubes and
containers contaminated with
bloody and body fluids
Fixatives,
solvents, broken
lab
thermometers
Packaging,
paper, plastic
containers
Pharmacy Store Expired drugs,
split drugs
Packaging,
paper, plastic
containers
Radiology
Silver, fixing and
developing
solutions, acetic
acid
Packaging,
paper
Chemotherapy Needles,
syringes
Bulk
chemotherapeuti
c waste, vials,
gloves, other
material
contaminated
with cytotoxic
agents, excreta
and/or urine
Packaging,
paper
Vaccinations Needles and
syringes
Bulk vaccine
waste, vials,
gloves
Packaging
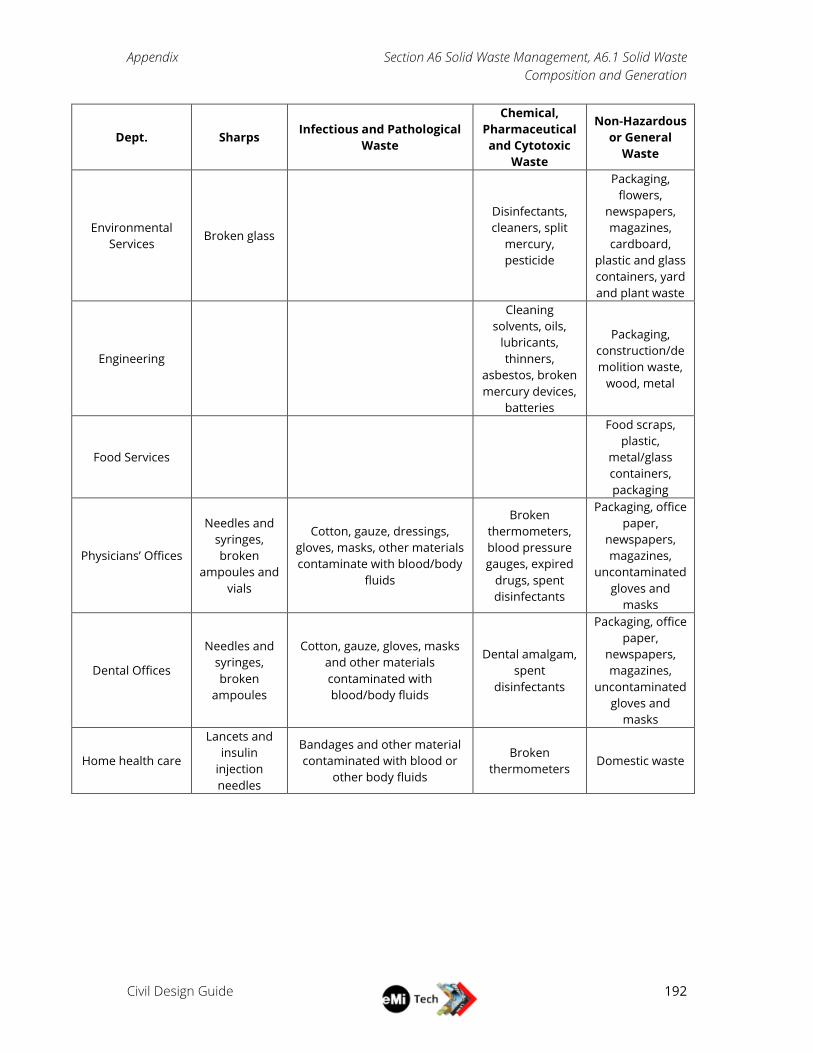
Appendix Section A6 Solid Waste Management, A6.1 Solid Waste
Composition and Generation
Civil Design Guide
192
Dept. Sharps Infectious and Pathological
Waste
Chemical,
Pharmaceutical
and Cytotoxic
Waste
Non-Hazardous
or General
Waste
Environmental
Services Broken glass
Disinfectants,
cleaners, split
mercury,
pesticide
Packaging,
flowers,
newspapers,
magazines,
cardboard,
plastic and glass
containers, yard
and plant waste
Engineering
Cleaning
solvents, oils,
lubricants,
thinners,
asbestos, broken
mercury devices,
batteries
Packaging,
construction/de
molition waste,
wood, metal
Food Services
Food scraps,
plastic,
metal/glass
containers,
packaging
Physicians’ Offices
Needles and
syringes,
broken
ampoules and
vials
Cotton, gauze, dressings,
gloves, masks, other materials
contaminate with blood/body
fluids
Broken
thermometers,
blood pressure
gauges, expired
drugs, spent
disinfectants
Packaging, office
paper,
newspapers,
magazines,
uncontaminated
gloves and
masks
Dental Offices
Needles and
syringes,
broken
ampoules
Cotton, gauze, gloves, masks
and other materials
contaminated with
blood/body fluids
Dental amalgam,
spent
disinfectants
Packaging, office
paper,
newspapers,
magazines,
uncontaminated
gloves and
masks
Home health care
Lancets and
insulin
injection
needles
Bandages and other material
contaminated with blood or
other body fluids
Broken
thermometers Domestic waste
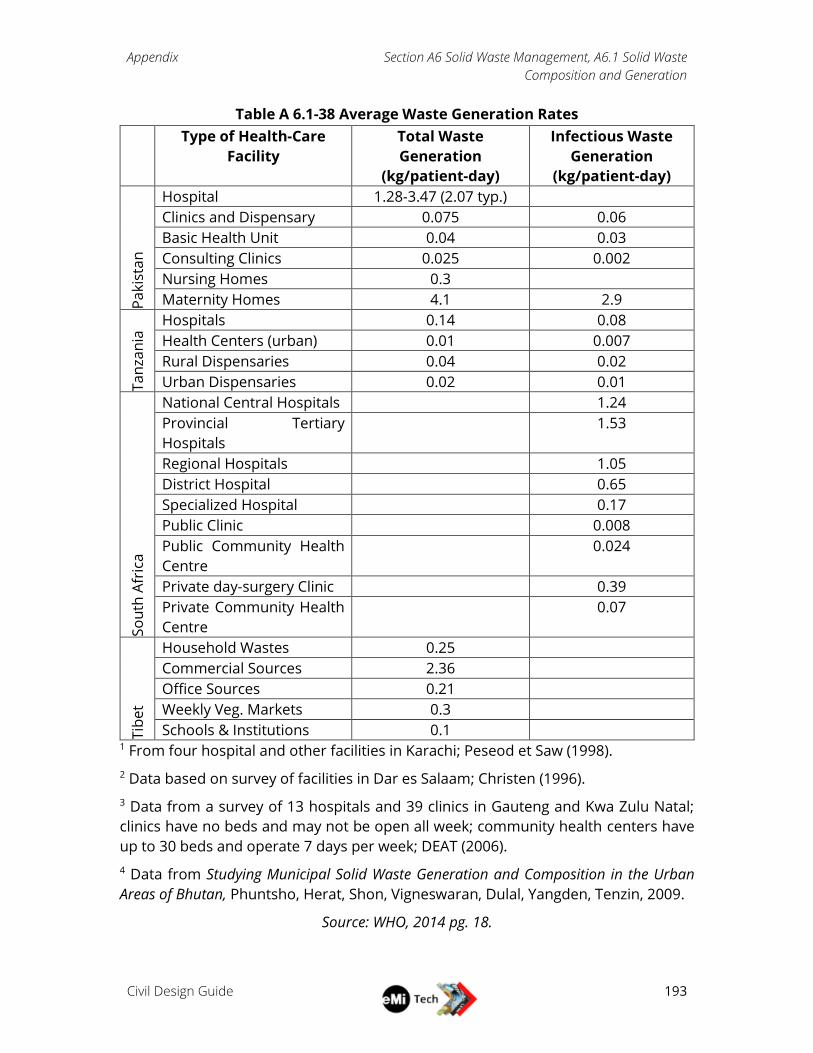
Appendix Section A6 Solid Waste Management, A6.1 Solid Waste
Composition and Generation
Civil Design Guide
193
Table A 6.1-38 Average Waste Generation Rates
Type of Health-Care
Facility
Total Waste
Generation
(kg/patient-day)
Infectious Waste
Generation
(kg/patient-day)
Pa
kis
tan
Hospital 1.28-3.47 (2.07 typ.)
Clinics and Dispensary 0.075 0.06
Basic Health Unit 0.04 0.03
Consulting Clinics 0.025 0.002
Nursing Homes 0.3
Maternity Homes 4.1 2.9
Ta
nza
nia
Hospitals 0.14 0.08
Health Centers (urban) 0.01 0.007
Rural Dispensaries 0.04 0.02
Urban Dispensaries 0.02 0.01
So
uth
Afr
ica
National Central Hospitals 1.24
Provincial Tertiary
Hospitals
1.53
Regional Hospitals 1.05
District Hospital 0.65
Specialized Hospital 0.17
Public Clinic 0.008
Public Community Health
Centre
0.024
Private day-surgery Clinic 0.39
Private Community Health
Centre
0.07
Tib
et
Household Wastes 0.25
Commercial Sources 2.36
Office Sources 0.21
Weekly Veg. Markets 0.3
Schools & Institutions 0.1 1 From four hospital and other facilities in Karachi; Peseod et Saw (1998).
2 Data based on survey of facilities in Dar es Salaam; Christen (1996).
3 Data from a survey of 13 hospitals and 39 clinics in Gauteng and Kwa Zulu Natal;
clinics have no beds and may not be open all week; community health centers have
up to 30 beds and operate 7 days per week; DEAT (2006).
4 Data from Studying Municipal Solid Waste Generation and Composition in the Urban
Areas of Bhutan, Phuntsho, Herat, Shon, Vigneswaran, Dulal, Yangden, Tenzin, 2009.
Source: WHO, 2014 pg. 18.
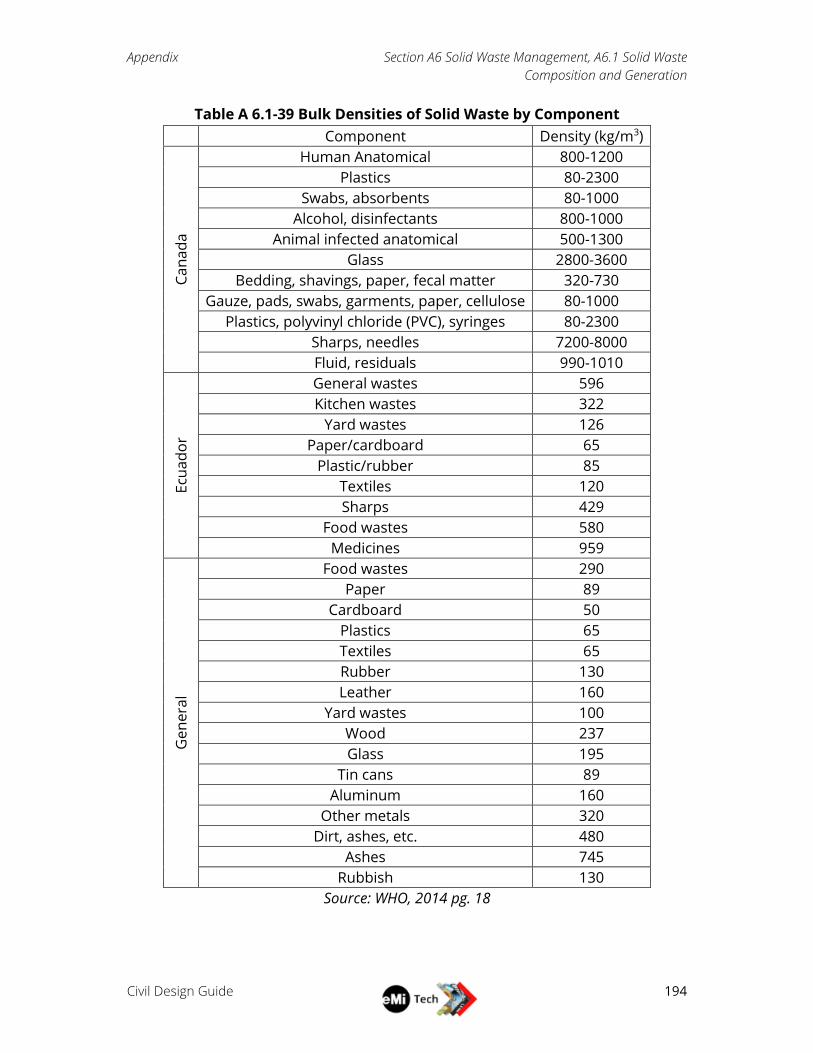
Appendix Section A6 Solid Waste Management, A6.1 Solid Waste
Composition and Generation
Civil Design Guide
194
Table A 6.1-39 Bulk Densities of Solid Waste by Component
Component Density (kg/m3)
Ca
na
da
Human Anatomical 800-1200
Plastics 80-2300
Swabs, absorbents 80-1000
Alcohol, disinfectants 800-1000
Animal infected anatomical 500-1300
Glass 2800-3600
Bedding, shavings, paper, fecal matter 320-730
Gauze, pads, swabs, garments, paper, cellulose 80-1000
Plastics, polyvinyl chloride (PVC), syringes 80-2300
Sharps, needles 7200-8000
Fluid, residuals 990-1010
Ecu
ad
or
General wastes 596
Kitchen wastes 322
Yard wastes 126
Paper/cardboard 65
Plastic/rubber 85
Textiles 120
Sharps 429
Food wastes 580
Medicines 959
Ge
ne
ral
Food wastes 290
Paper 89
Cardboard 50
Plastics 65
Textiles 65
Rubber 130
Leather 160
Yard wastes 100
Wood 237
Glass 195
Tin cans 89
Aluminum 160
Other metals 320
Dirt, ashes, etc. 480
Ashes 745
Rubbish 130
Source: WHO, 2014 pg. 18
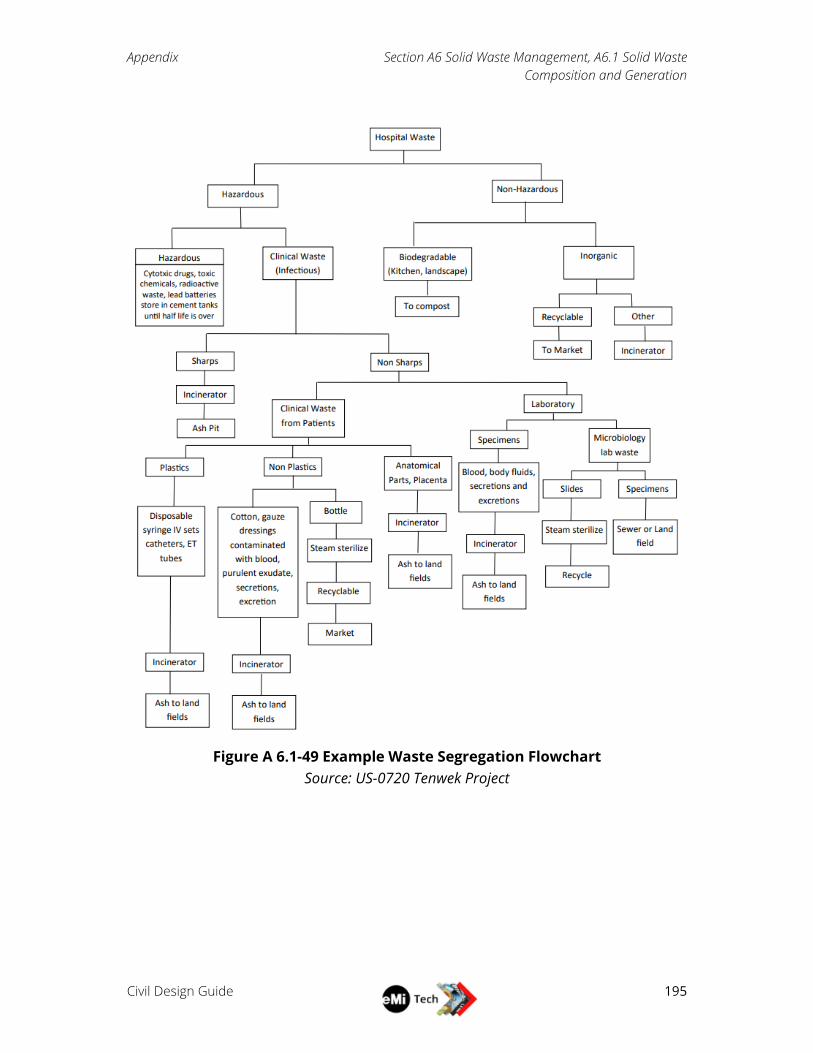
Appendix Section A6 Solid Waste Management, A6.1 Solid Waste
Composition and Generation
Civil Design Guide
195
Figure A 6.1-49 Example Waste Segregation Flowchart
Source: US-0720 Tenwek Project
Appendix Section A6 Solid Waste Management, A6.2 Solid Waste Disposal
Civil Design Guide
196
SOLID WASTE DISPOSAL
A6.2.1 SOLID WASTE DISPOSAL MINIMUM REQUIREMENTS 1. Reduce waste and segregate to minimize the amount of waste requiring
treatment
2. Choose a treatment process that achieves at least the minimum required
disinfection level
a. Treatment can be done on the premises or at a centralized treatment
facility.
b. Use appropriate technology when treating waste based on
characteristics, technology capacity and requirements, environment
and safety factors, and cost.
3. Dispose of waste safely
In extreme circumstances, where no treatment is possible, hazardous healthcare
waste from small facilities can be buried on the premises where public access can be
restricted. Larger healthcare facilities should arrange with local landfills to provide a
special area and restricted access.

Civil Design Guide
197
Reference
Reference Section R2 Water
Civil Design Guide
198
WATER
R2.1 WATER DEMAND ESTIMATE Punmia, B.C., et al. Environmental Engineering‐I: Water Supply Engineering. New Delhi:
Laxmi Publications, 1995. (Chapter 5.6) (PDF).
Smet, Jo and van Wijk, Christine (eds.). Small Community Water Supplies: Technology,
People and Partnership. Delft: IRC International Water and Sanitation Centre,
2002. ISBN: 9066870354 PDF.
Water, Engineering and Development Centre (WEDC). The Worth of Water, introduction
by John Pickford. London: Intermediate Technology Publications, 1991. ISBN:
1853390690
Sphere Association. The Sphere Handbook: Humanitarian Charter and Minimum
Standards in Humanitarian Response, fourth edition, Geneva: 2018.
WWW.SPHERESTANDARDS.ORG/HANDBOOK PDF.
Uganda Ministry of Water and Environment. Water Supply Design Manual Second
Edition. Kampala: Ministry of Water and Environment, 2013. (PDF).
WHO. Domestic Water Quantity, Service, Level and Health. Geneva: World Health
Organization, 2003. WHO/SDE/WSH/03.02 PDF.
WHO. Essential environmental health standards in health care, edited by John Adams,
Jamie Bartram, Yves Chartier, Geneva: WHO Press, 2008. ISBN 978 92 4 154723
9 PDF.
WHO. Minimum Water Quantity Needed for Domestic Uses New Delhi: WHO Regional
Office for South-East Asia, 2005. PDF.
R2.2 WATER SUPPLY SOURCE SELECTION Mihelcic, James R., et al. Field Guide to Environmental Engineering for Development
Workers: Water, Sanitation, and Indoor Air, Reston: ASCE Press, 2009. ISBN 978-
0-7844-0985-5
Minnesota Protection Control Agency (MPCA). Water Supply Well Setback Distances and
Subsurface Sewage Treatment System. St. Paul: MPCA, 2010. PDF.
Water for the World. Designing Intakes for Rivers and Streams: Technical Note No. RWS
1.D.3. Washington, D.C., USAID, 1982. PDF.
Water for the World. Designing Structures for Springs: Technical Note No. RWS 1.D.1.
Washington, D.C., USAID, 1982. PDF.
Reference Section R2 Water
Civil Design Guide
199
R2.3 RAINWATER HARVESTING African Development Bank. Assessment of Best Practices and Experience in Water
Harvesting, Rainwater Harvesting Handbook. Tunis-Belvedere, Tunisia: African
Development Bank (ADB), 2008. PDF.
Angima, Sam. Harvesting Rainwater for Use in the Garden. Corvallis: Oregon State
University, EM9101, 2010. PDF.
Fiddes, H., Forsgat, J.A., and Grigg, A.O. TRRL Laboratory Report 623: The Prediction of
Storm Rainfall in East Africa. Crowthorne, Berks: Environment Division,
Transport Systems Department, Transport and Road Research Laboratory,
1974. PDF.
R2.4 GREYWATER SEPARATION AND REUSE Carden, Kristy, Armitage, Neil, Sichone, Owen, and Winter, Kevin. The use and disposal
of greywater in the non-sewered areas of South Africa: Part 2 - Greywater
management options. Cape Town: WRC, 2007, pp. 433-442. PDF.
Center for the Study of the Built Environment (CSBE). Greywater Reuse in Other
Countries and its Applicability to Jordan. Jordan: Center for the Study of the Built
Environment, 2003. PDF.
Department of Energy, Utilities and Sustainability. NSW Guidelines for Greywater Reuse
in Sewered, Single Household Residential Premises. Sydney: State of NSW, 2008.
PDF.
NSW Health. Greywater Reuse in Sewered Single Domestic Premises. New Wales: Ministry
of Health (New South Wales), 2000. PDF.
PUB. Technical Guide for Greywater Recycling System. Singapore: PUB, 2014. PDF.
R2.5 WATER QUALITY TESTING EPA. National Primary Drinking Water Regulations. Washington, D.C.: United States
Environmental Protection Agency, 2009. EPA 816-F-09-004. PDF.
Horizon CPO. Langelier Saturation Index. Primary CH 6, 2021. PDF.
Lindsey, Bruce. Chloride, Salinity, and Dissolved Solids. USGS, 2020.
https://www.usgs.gov/mission-areas/water-resources/science/chloride-
salinity-and-dissolved-solids?qt-science_center_objects=0#qt-
science_center_objects
New York State Department of Health. Coliform Bacteria in Drinking Water Supplies,
2004,
www.health.ny.gov/environmental/water/drinking/coliform_bacteria.htm.
Reference Section R2 Water
Civil Design Guide
200
Oram, Brian. Water Testing Total Dissolved Solids Drinking Water Quality. Dallas: Water
Research Center, 2020. https://water-research.net/index.php/water-
treatment/tools/total-dissolved-solids
Uganda National Bureau of Standards. Potable Water—Specification. Kampala: UNBS,
2014. US EAS 12: 2014. PDF.
USGS. Alkalinity and Water. USGS, 2020. https://www.usgs.gov/special-topic/water-
science-school/science/alkalinity-and-water?qt-science_center_objects=0#qt-
science_center_object
USGS. Hardness of Water. USGS, 2021. https://www.usgs.gov/special-topic/water-
science-school/science/hardness-water?qt-science_center_objects=0#qt-
science_center_objects
Water Quality Association. Bacteria & Virus Issues. Water Quality Association, 2020.
www.wqa.org/learn-about-water/common-contaminants/bacteria-viruses
WHO. Guidelines for drinking-water quality: fourth edition incorporating the first
addendum. Geneva: World Health Organization; 2017. License: CC BY-NC-SA 3.0
IGO. PDF.
R2.6 WATER TREATMENT Akvopedia Water Portal Website: http://akvopedia.org/wiki/Water_Portal
RVA Reference Documents. Folder.
Tenwek Study. Folder.
R2.7 WATER STORAGE Crestanks Document. PDF. Link: https://www.crestanks.co.ug/product/crestank/
Kentank Document. PDF. Link: http://www.kentainers.co.ke/product-
category/water/above-ground/
Trifunovic, Nemanja. Introduction to Urban Water Distribution. London: Taylor & Francis
Ltd, 2006.
Water for the World. Designing an Elevated Storage Tank: Technical Note No. RWS.5.D3.
Washington, D.C., USAID, 1982. PDF.
Water for the World. Designing a Ground Level Storage Tank: Technical Note No.
RWS.5.D2. Washington, D.C., USAID, 1982. PDF.
Water for the World. Methods for Storing Water: Technical Note No. RWS.5M.
Washington, D.C., USAID, 1982. PDF.
R2.8 WATER DISTRIBUTION Building Water Supply System: Chapter 2, Fixture Unit Count. PDF.
Reference Section R2 Water
Civil Design Guide
201
Crous, P., Haarhoff, J., and Buckley, C.A. Water demand characteristics of shared water
and sanitation facilities: Experiences from community ablution blocks in eThekwini
Municipality, South Africa. Cape Town: Water Institute of Southern Africa (WISA),
2012. PDF.
EPA. EPANET2 User’s Manual. Cincinnati: EPA Water Supply and Resources Division,
2000. EPA/600/R-00/057. PDF.
International Code Counsel. 2018 International Plumbing Code. Country Club Hills: ICC,
2017. PDF.
Uganda Ministry of Water and Environment. Water Supply Design Manual Second
Edition. Kampala: Ministry of Water and Environment, 2013. (PDF).
R2.9 PUMP SELECTION Akvopedia Powered Pumps Website: https://akvopedia.org/wiki/Powered_pumps
Ferman, Randal. NPSH Margin—How Much?. Empowering Pumps & Equipment,2017.
https://empoweringpumps.com/npsh-net-positive-suction-head/
WEDC. Elements of Sustainable Solar Water Pumping System Design. Loughborough
University: 38thWEDC International Conference, 2015. Conference
Presentation. PDF.
WEDC. Elements of Sustainable Solar Water Pumping System Design. Loughborough
University: 38thWEDC International Conference, 2015. Participation Guide. PDF.

Reference Section R3 Geotechnical
Civil Design Guide
202
GEOTECHNICAL
R3.1 SOIL CLASSIFICATION ASTM D2487 (Laboratory Classification)
ASTM D2488 (Field Classification)
ASTM D4318 (Atterberg Limits)
ASTM D6913 (Coarse-Grained Soil Gradation – Sieve Analysis)
ASTM D7928 (Fine-Grained Soil Gradation – Hydrometer)
British Standards Institution. Code of practice for ground investigations. BSI Standards
Limited, 2015. PDF.
Jones, A., et al. Soil Atlas of Africa. Luxembourg: Publications Office of the European
Union, 2013. PDF.
Oregon State University Extension Service. Mechanical Analysis of Soils "The Jar Test".
Corvallis: OSU Extension Service, 2018. PDF. Link.
Thien, S.J. A flow diagram for teaching texture by feel analysis. Journal of Agronomic
Education, 1979. 8:54-55. Retrieved from: Link. JPG.
Unified Soil Classification System. Soil Mechanics—Level 1 Field Procedures. USCS. PDF.
USDA. Ch. 3 Examination and Description of Soil Profiles. USDA, 2020. PDF.
Water for the World. Determining Soil Suitability: Technical Note No. SAN. 2.P.3.
Washington, D.C., USAID, 1982. PDF.
Whiting, David, A. Card, C. Wilson, J. Reeder. Estimating Soil Texture. Colorado State
University Extension, 2011. PDF.
R3.2 BEARING CAPACITY Dutta, Sourav. Salient features of Foundation Construction. engineeringcivil.com, 2017.
PDF.
Gedeon, Gilbert. Bearing Capacity of Soils. Stony Point: Continuing Education and
Development, Inc., 1992. PDF.
Kimmerling, Robert. Geotechnical Engineering Circular No. 6: Shallow Foundations.
Washington, D.C.: PanGEO, Inc., 2002. PDF.
U.S. Army Corps of Engineers. Bearing Capacity of Soils. Washington, D.C.: Department
of the Army, 1992. Page. 4-15. PDF.
Reference Section R3 Geotechnical
Civil Design Guide
203
R3.3 SOIL ABSORPTION EPA. Design Manual: Onsite Wastewater Treatment and Disposal Systems. Washington,
D.C.: USEPA Office of Water Program Operations, 1980. EPA 625/1-80-012. PDF.
EPA. Onsite Wastewater Treatment Systems Manual. Washington, D.C.: USEPA Office of
Water, 2002. EPA/625/R-00/008. PDF.
Hargett, David, Tyler, E., and Siegrist, Robert. Soil Infiltration Capacity as Affected by
Septic Tank Effluent Application Strategies. Chicago: Onsite Sewage Treatment
Symposium, 1981. PDF.
North Carolina Environmental Health Services (NCEHS). Onsite Wastewater
Management Guidance Manual, Chapter 4.6 Onsite Wastewater Loading Rates.
Raleigh: NCEHS, 1996. PDF.
State of North Carolina. Laws and Rules for Sewage Treatment, and Disposal Systems, NC
Admin code 15A NCAC 18A. Raleigh: North Carolina Administrative Code, 1999.
PDF.
Water for the World. Determining Soil Suitability: Technical Note No. SAN 2.P.3.
Washington, D.C., USAID, 1982. PDF.
Reference Section R4 Wastewater
Civil Design Guide
204
WASTEWATER
R4.1 WASTEWATER COMPOSITION AND QUANTITY Water for the World. Estimating Sewage or Washwater Flows: Technical Note No. SAN
2.P.2. Washington, D.C., USAID, 1982. PDF.
R4.2 WASTEWATER CONVEYANCE AWWA. Sizing Water Meter Lines and Meters: M22 Third Edition. Denver: AWWA, 2014.
PDF.
NCDENR, North Carolina Department of Environment and Natural Resources.
Minimum Design Criteria for the permitting of Gravity Sewers. North Carolina:
NCDENR, 2008. PDF.
United Nations Economic and Social Commission for Asia and the Pacific (ESCAP),
United Nations Human Settlements Programme (UN-Habitat) and Asian
Institute of Technology (AIT). Policy Guidance Manual on Wastewater Management
with a Special Emphasis on Decentralized Wastewater Treatment Systems. Bangkok:
United Nations and Asian Institute of Technology (AIT), 2015. PDF.
Zhang, Xiaoyi. Estimating Peaking Factors with Poisson Rectangular Pulse Model and
Extreme Value Theory. Cincinnati: University of Cincinnati, 2005. PDF.
R4.3 SEPTIC TANKS Code of Colorado Regulations. Regulation No. 43- On-Site Wastewater Treatment System
Regulation, 5 CCR 1002-43. Denver: Water Quality Control Commission, 2018.
PDF.
Gross, Mark. Assessment of the Effects of Household Chemicals Upon Individual Septic
Tank Performances. Fayetteville: Arkansas Water Resource Center, 1987.
PUB131. 26. PDF.
Republic of Kenya. Final Practice Manual for Sewerage and Sanitation Services in Kenya.
Nairobi: Ministry of Water and Irrigation, 2008. PDF.
Schultheies, Robert A. Septic Tank/Absorption Field Systems: A Homeowner’s Guide to
Installation and Maintenance. Columbia: University of Missouri, 2001. PDF.
Tilley et al. Compendium of Sanitation Systems and Technologies 2nd Revised Edition.
International Water Association (IWA), the Water Supply and Sanitation
Collaborative Council (WSSCC) and Eawag, 2014. PDF.
Water for the World. Designing Septic Tanks: Technical Note No. SAN 2.D.3. Washington,
D.C., USAID, 1982. PDF.
Reference Section R4 Wastewater
Civil Design Guide
205
WEDC. WEDC Guide 030: Septic Tank and Aqua Privy Design. Leicestershire:
Loughborough University, 2014. PDF.
WHO. Septic Tank Fact Sheet 3.9. Geneva: WHO, 1996. PDF.
R4.4 GREASE INTERCEPTORS Calgary Water Resources. How to Size Your Grease Interceptor. Calgary: Industrial
Monitoring Group, 2021. 20-0010414 | ADV-7094. PDF.
Calgary Water Resources. Monitoring and Maintaining Your Grease Interceptor. Calgary:
Industrial Monitoring Group, 2016. 2016-1012. PDF.
Ducoste, Joel, Keener, K.M., Groninger, J.W., and Holt, L.M. FOG Interceptor Design and
Operation (FOGIDO) Guidance Manual. Alexandria: WERF, 2008. PDF.
EPA. Controlling Fats, Oils, and Grease Discharges from Food Service Establishments.
Washington, D.C.: Office of Water, 2012. EPA-833-F-12-003. PDF.
R4.5 ON-SITE WASTEWATER DISPOSAL Code of Colorado Regulations. Regulation No. 43- On-Site Wastewater Treatment System
Regulation, 5 CCR 1002-43. Denver: Water Quality Control Commission, 2018.
PDF.
EPA. Design Manual: Onsite Wastewater Treatment and Disposal Systems. Washington,
D.C.: USEPA Office of Water Program Operations, 1980. EPA 625/1-80-012. PDF.
EPA. Onsite Wastewater Treatment Systems Manual. Washington, D.C.: USEPA Office of
Water, 2002. EPA/625/R-00/008. PDF.
Kalbermatten, John M., Julius, DeAnne S., Gunnerson, Charles G. Appropriate
Technology for Water Supply and Sanitation. Washington, D.C.: The World Bank,
1980. PDF.
Lesikar, Bruce. Evapotranspiration bed. College Station: Texas A&M University, 1999.
L-5228. PDF.
Lesikar, Bruce. Septic tank/soil absorption field. College Station: Texas A&M University,
2008. L-5227. PDF.
Nebraska Department of Environmental Quality. Title 124 – Rules and Regulations for
The Design, Operation and Maintenance of Onsite Wastewater Treatment Systems.
Lincoln: Nebraska Department of Environmental Quality, 2012. PDF.
OXFAM. Technical Briefs—Septic Tanks and Drain Fields. Boston, OXFAM, 2008. PDF.
Republic of Kenya. Final Practice Manual for Sewerage and Sanitation Services in Kenya.
Nairobi: Ministry of Water and Irrigation, 2008. PDF.
Schultheies, Robert A. Septic Tank/Absorption Field Systems: A Homeowner’s Guide to
Installation and Maintenance. Columbia: University of Missouri, 2001. PDF.
Reference Section R4 Wastewater
Civil Design Guide
206
State of Illinois. Illinois Title 77: Public Health Chapter I: Department of Public Health
Subchapter R: Water and Sewage Part 905 Private Sewage Disposal Code Section
905.40 Septic Tanks. Springfield: Department of Health, 2013. PDF.
State of Kansas, Department of Health and Environment. Minimum Standards for
Design and Construction of Onsite Wastewater Systems. Topeka: Bureau of Water,
1997. PDF.
State of New York. Standards for Individual Onsite Water Supply and Individual Onsite
Wastewater Treatment Systems. New York: Department of Health, 2016. PDF.
State of North Carolina. Laws and Rules for Sewage Treatment, and Disposal Systems, NC
Admin code 15A NCAC 18A. Raleigh: North Carolina Administrative Code, 1999.
PDF.
State of Maryland, Department of the Environment Water Management
Administration. Design and Construction Manual for Sand Mound Systems.
Baltimore: Water Management Department, 2016. PDF.
R4.6 LATRINES Centre for Affordable Water and Sanitation Technology (CAWST). Technical Brief:
Designing and Selecting Latrines. Calgary, CAWST, 2014. PDF. Website:
www.cawst.org
Lifewater International. Latrine Design and Construction: Making Culturally-Appropriate
Latrines. San Luis Obispo, Lifewater International, 2011. Second Edition. PDF.
Republic of South Africa. Sanitation for a Healthy Nation: Sanitation Technology Options
Flyers. Cape Town: Department of Water Affairs and Forestry, 2002. PDF.
Water for the World. Designing Compositing Toilets: Technical Note No. SAND 1.D.6.
Washington, D.C., USAID, 1982. PDF.
Water for the World. Designing Aqua Privies: Technical Note No. SAND 1.D.4. Washington,
D.C., USAID, 1982. PDF.
Water for the World. Designing Pits for Privies: Technical Note No. SAND 1.D.2.
Washington, D.C., USAID, 1982. PDF.
Water for the World. Operating and Maintaining Composting Toilets: Technical Note No.
SAND 1.0.6. Washington, D.C., USAID, 1982. PDF.
Water for the World. Simple Methods of Excreta Disposal: Technical Note No. SAND 1.M.1.
Washington, D.C., USAID, 1982. PDF.
WEDC. WEDC Guide 023: Latrine Pit Design. Leicestershire: Loughborough University,
2016. PDF.
WEDC. WEDC Guide 030: Septic Tank and Aqua Privy Design. Leicestershire:
Loughborough University, 2014. PDF.

Reference Section R4 Wastewater
Civil Design Guide
207
WEDC. WEDC Guide 025: Simple Latrine Pit. Leicestershire: Loughborough University,
2016. PDF.
R4.7 OTHER WASTEWATER TREATMENT Mara, Duncan and Pearson, Howard. Design Manual for Waste Stabilization Ponds in
Mediterranean Countries. Leeds: Lagoon Technology International, 1998. PDF.
Mara, Duncan. Domestic Wastewater Treatment in Developing Countries. London:
Earthscan, 2004. PDF.
Tilley et al. Compendium of Sanitation Systems and Technologies 2nd Revised Edition.
International Water Association (IWA), the Water Supply and Sanitation
Collaborative Council (WSSCC) and Eawag, 2014. PDF.

Reference Section R5 Site Design
Civil Design Guide
208
SITE DESIGN
R5.1 GRADING AND STORMWATER DRAINAGE Bengtson, Harlan H. Rational Method Hydrologic Calculations with Excel. Woodcliff:
Continuing Education and Development, Inc., 2011. PDF.
Engineering Toolbox. Manning's Roughness Coefficient. Engineering Toolbox, 2021.
PDF. Link.
FHA. Urban Drainage Design Manual: Hydraulic Engineering Circular No. 22, Third Edition.
Washington, D.C.: Federal Highway Administration and National Highway
Institute, 2009. PDF.
Fiddes, H., Forsgat, J.A., and Grigg, A.O. TRRL Laboratory Report 623: The Prediction of
Storm Rainfall in East Africa. Crowthorne, Berks: Environment Division,
Transport Systems Department, Transport and Road Research Laboratory,
1974. PDF.
International Code Council. 2018 International Building Code, Fifth Printing. Falls
Church: International Code Council, 2020. Chapter 10 and 11. Link.
International Organization for Standardization. ISO 21542:2011 Building construction
— Accessibility and usability of the built environment. Geneva: ISO, 2011. Link.
Iowa Statewide Urban Design and Specifications. Design Manual, Chapter 2 –
Stormwater, 2B - Urban Hydrology and Runoff, Section 2B-3 - Time of Concentration.
Ames: Iowa State University of Science and Technology, 2013. PDF.
The Clean Water Team Guidance Compendium for Watershed Monitoring and
Assessment State Water Resources Control Board. Runoff Coefficient (C) Fact
Sheet-5.1.3. Sacramento: Water Resource Control Board, 2011. PDF.
USDA. Urban Hydrology for Small Watersheds TR-55. Washington, D.C.: U.S. Department
of Agriculture, Natural Resources Conservation Service, Conservation
Engineering Division, 1986. PDF.
R5.2 ROADWAYS Texas Forestry Services. Best Management Practices. Lufkin, Texas: Texas Forestry
Services, 2010. PDF.
R5.3 RETAINING WALL DESIGN Al-Agha, Ahmed S. Basics of Foundation Engineering with Solved Problems Based on
Principles of Foundation Engineering 7th Edition: Chapter 8 Retaining Walls. Online,
2015. PDF.
Reference Section R5 Site Design
Civil Design Guide
209
ASDIP Retain Structural Engineering Software. Example 3.16 Design of a cantilever
retaining wall (BS 8110). ASDIP, 2009. 9780415467193_C03b. PDF.
CDOT. Bridge Design Manual: Appendix A, Example 11 – Cast-in-Place Concrete Cantilever
Retaining Wall. Denver: CDOT, 2018. PDF.
Christopher, Barr R., Schwarts, Charles, and Boudreau, Richard. Geotechnical Aspects
of Pavements. Washington, D.C.: National Federal Highway Institute, 2006. PDF.
Murthy, V.N.S. Geotechnical Engineering: Principles and Practices of Soil Mechanics and
Foundation Engineering. New York: Marcel Dekker, Inc., 2003. pg. 836.
Naval Facilities Engineering Command (NFEC). Foundations and Earth Structures.
Alexandria: Naval Facilities Engineering Command, 1986. PDF.
Randall, Frank A. Small Gravity Retaining Walls. Portland: The Aberdeen Group, 1984.
PDF.
Shamsabadi, Anoosh, Dasmeh, Arastoo, and Taciroglu, Ertugrul. Guidelines for Analysis
and LRFD-based Design of Earth Retaining Structures. Los Angeles: UCLA, 2018.
PDF.
USDOT-FHA. Mechanically Stabilized Earth Walls and Reinforced Soil Slopes Design &
Construction Guidelines. Washington, D.C.: National Highway Institute, 2001.
PDF.
R5.4 SITE LAYOUT, ACCESS AND PARKING International Organization for Standardization. ISO 21542:2011 Building construction
— Accessibility and usability of the built environment. Geneva: ISO, 2011. Link.
FHA. Local and Rural Road Safety Briefing Sheets: Access Management (Driveways).
Washington, D.C.: USDOT Federal Highway Administration, 2014. PDF.
Reference Section R6 Solid Waste Management
Civil Design Guide
210
SOLID WASTE MANAGEMENT
R6.1 SOLID WASTE COMPOSITION Baterman, Stuart. Small-scale Medical Waste Incinerators: Evaluation of Risks and Best
Management Practices. Ann Arbor: University of Michigan, 2004. PDF.
EPA. Volume-to-Weight Conversion Factors. Washington, D.C.: U.S. Environmental
Protection Agency Office of Resource Conservation and Recovery, 2016. PDF.
Jain, Monika, Goshwami, C.S., and Jain, Praveen. Hospital Solid Waste and Its
Management in a Hospital of Bhopal, India. India: Jr. of Industrial Pollution
Control 23 (2), 2007. pp 223-226. PDF.
United Nations Environment Programme. National Health-Care Waste Management
Plan: Guidance: Fundamentals of health-care waste management. Geneva: World
Health Organization, 2004. PDF.
WHO. Safe management of wastes from health-care activities / edited by Y. Chartier et al.
– 2nd ed., Chapter 8: Treatment and disposal methods. Geneva: World Health
Organization, 2014. PDF.
R6.2 SOLID WASTE DISPOSAL Making Medical Injections Safer (MMIS). The Incinerator Guidebook. Washington, D.C.:
Global AIDS Coordinator (OGAC), the CDC, USAID, 2010. PDF.
MASS Design Group. Liberia Health Infrastructure Standards: Chapter 29 Medical and
Solid Waste. Liberia: Liberia Ministry of Health, 2014. PDF.
WHO. 3 Best practices for incineration. Geneva: World Health Organization, 2004. PDF.
WHO. Training modules in health-care waste management. Geneva: World Health
Organization, 2021. Link.

Civil Design Guide
211
Uganda Specific Guidelines

Uganda
Specific Guidelines
Section UG1 Preparation and Site Evaluation
Civil Design Guide
212
UG1 PREPARATION AND SITE EVALUATION No deviation from Global Guide section 1 Preparation and Site Evaluation.

Uganda
Specific Guidelines
Section UG2 Water
Civil Design Guide
213
UG2 WATER
WATER DEMAND ESTIMATE Critical Design Criteria: Per capita water demand rates for various uses (adjustable
for specific situations).
Critical Site-Specific Information:
A thorough understanding of the architectural program and how water
fixtures/usage will be distributed throughout the site.
Number of building of each type
Floor area for each building
Number of site users (residents and non-resident)
Water usage must be estimated as accurately as possible to ensure the correct design
of water sources, and water storage, water treatment, water distribution, wastewater
collection, wastewater treatment, and wastewater disposal systems. A projection of
future water needs as well as the immediate water needs post construction must also
be performed to ensure adequate capacity as the ministry grows.
Phased construction is a common feature of EMI designs, and the phasing process
will have a significant impact on water usage, water storage, and wastewater disposal
needs. Careful consideration of the expected project implementation process is
needed to ensure an adequate water supply and sanitary facilities for all phases of
the project.
Per capita water use rates in Africa are much lower than in the west. Different
standards of hygiene, different methods of human waste disposal, different methods
for preparing food and washing reduce water usage compared to the west; however,
the expected rate of water usage will vary significantly from ministry to ministry and
even between buildings at a given ministry.
Many sources of information on water use exist with varying estimates of per capita
water usage. Per capita rates vary by climate, cultural practices, cost of water,
transportation distances, and other factors. In the Uganda office, water demand is
usually estimated using the EMI Water and Wastewater Design Template. Typical per
capita usage estimates are contained in the template. These rates are based on
published values developed for India; however, they are generally consistent with
values developed for East Africa. The design template has the advantage of providing
an easy and logical way to adjust the published rates to account for project-specific
differences in water use habits and practices.
Uganda
Specific Guidelines
Section UG2 Water
Civil Design Guide
214
Ugandan Ministry of Water and Environment recommends the use of a factor of 1.3
that is applied to the average day demand (ADD) to estimate the maximum daily
demand (MDD). EMI has not traditionally used this peak factor, but has rather
traditionally used a peak factor of 2. Engineering judgement should be used as to not
overestimate a MDD, as maximum site conditions are commonly assumed (eg. an
auditorium at full capacity) when estimating the ADD.
If the template does not adequately capture all of the projected future water usage,
other means of estimating are included in the template, including several tables
generated by the Ugandan Ministry of Water and Environment for non-domestic
water uses. If the template and published tables are not adequate, alternate means
of estimating water usage might be needed. These could include observation of
current water use practices or measurement of current water usage by examining
water bills, if they exist, or by measuring the rate of water drawdown from water
storage tanks (with the inflow temporarily shut off), projecting this rate to a larger
future population. Water usage can also be measured using water flow rate
measurements such as the bucket-and-stopwatch method or installing a weir to
measure open channel flow. Since such instances are rare, they will not be discussed
in detail in the design manual.
It is also well known that the per capita rate of water usage increases as the supply of
water increases. Water usage in a home that has piped water will be greater than the
usage of water in the same home if the water is obtained from jerry cans or a hand
pumped well. Therefore, if a new project will increase the availability of water, the
per capita usage estimate must be increased over current practices to account for the
future additional water usage.
Level I – Preliminary Design
For a rough estimate of water usage for domestic purposes use a value of 135 liters
per capita per day (Lpcd) modified as needed to reflect local water usage patterns
(i.e., use of latrines versus flush toilets). The preliminary estimate can be used to
evaluate alternate sources and estimate water storage tank and wastewater disposal
land area requirements. Table A 2.1-2 Water Requirements for Domestic Purposes in
India lists the individual elements of water that contribute to the 135 Lpcd rate. The
135 Lpcd is based on the use of western-style showers and flush toilets. For more
accurate preliminary estimates, per capita water use values for household situations
and various institutions that are published by the Uganda Ministry of Water and
Environment. The EMI Water and Wastewater Design Template can also be used to
generate a preliminary estimate but it will need to be verified and refined during
detailed design.
If the masterplan includes providing water for off-site consumption by nearby
residents, this water demand can be estimated using the following tables, or the
tables in the Water Usage Rates tab of the water demand template. This estimated
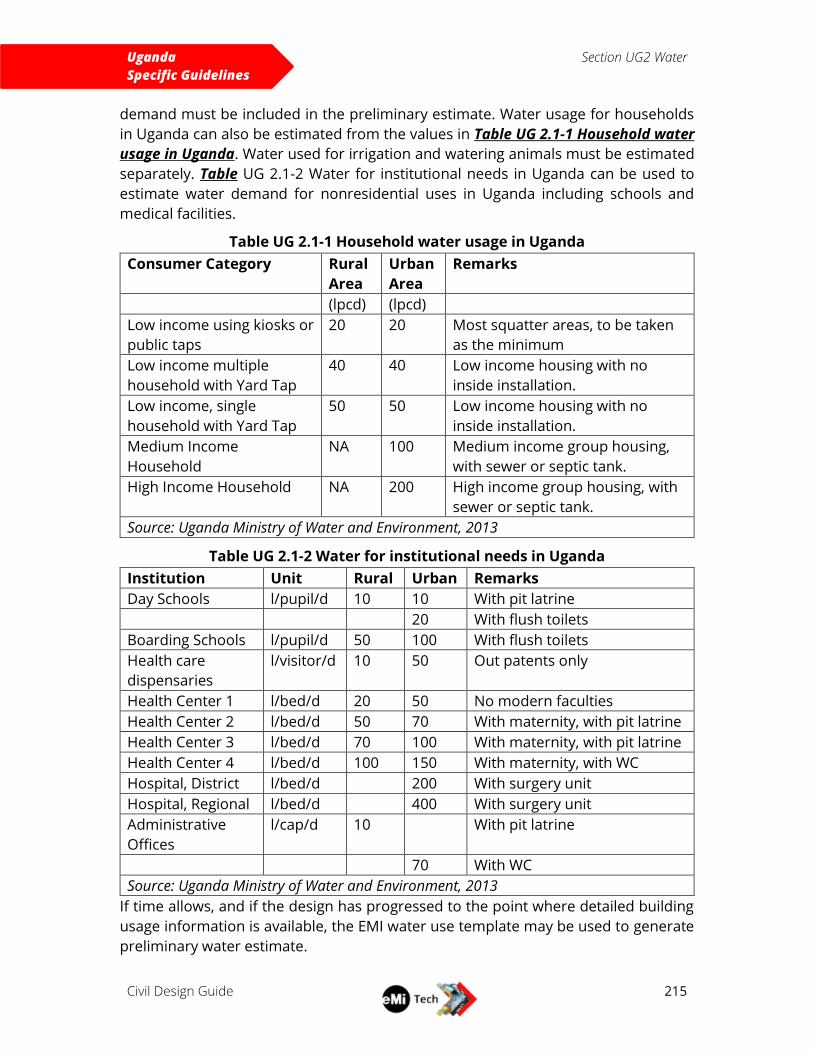
Uganda
Specific Guidelines
Section UG2 Water
Civil Design Guide
215
demand must be included in the preliminary estimate. Water usage for households
in Uganda can also be estimated from the values in Table UG 2.1-1 Household water
usage in Uganda. Water used for irrigation and watering animals must be estimated
separately. Table UG 2.1-2 Water for institutional needs in Uganda can be used to
estimate water demand for nonresidential uses in Uganda including schools and
medical facilities.
Table UG 2.1-1 Household water usage in Uganda
Consumer Category Rural
Area
Urban
Area
Remarks
(lpcd) (lpcd)
Low income using kiosks or
public taps
20 20 Most squatter areas, to be taken
as the minimum
Low income multiple
household with Yard Tap
40 40 Low income housing with no
inside installation.
Low income, single
household with Yard Tap
50 50 Low income housing with no
inside installation.
Medium Income
Household
NA 100 Medium income group housing,
with sewer or septic tank.
High Income Household NA 200 High income group housing, with
sewer or septic tank.
Source: Uganda Ministry of Water and Environment, 2013
Table UG 2.1-2 Water for institutional needs in Uganda
Institution Unit Rural Urban Remarks
Day Schools l/pupil/d 10 10 With pit latrine
20 With flush toilets
Boarding Schools l/pupil/d 50 100 With flush toilets
Health care
dispensaries
l/visitor/d 10 50 Out patents only
Health Center 1 l/bed/d 20 50 No modern faculties
Health Center 2 l/bed/d 50 70 With maternity, with pit latrine
Health Center 3 l/bed/d 70 100 With maternity, with pit latrine
Health Center 4 l/bed/d 100 150 With maternity, with WC
Hospital, District l/bed/d 200 With surgery unit
Hospital, Regional l/bed/d 400 With surgery unit
Administrative
Offices
l/cap/d 10 With pit latrine
70 With WC
Source: Uganda Ministry of Water and Environment, 2013
If time allows, and if the design has progressed to the point where detailed building
usage information is available, the EMI water use template may be used to generate
preliminary water estimate.
Uganda
Specific Guidelines
Section UG2 Water
Civil Design Guide
216
Level II – Detailed design
Use the EMI Water and Wastewater Design Template, modified to suit the project
specific situation. Instructions are provided in the first worksheet of the workbook.
The worksheet will need to be modified to match the architectural program document
and adjusting equations in the worksheet as needed to ensure accurate summation
of demand values. See example questions below to ask the client ministry to assist
with getting an accurate water demand estimate.
As the architectural details are developed during detailed design, the water demand
estimate generated by the spreadsheet should be updated and compared to any
preliminary estimates that had been generated. Water supply, water storage,
distribution piping, wastewater collection and conveyance systems, and wastewater
disposal facility sizing should be updated if needed.
Some ministries request that a water source be provided for nearby residential areas.
Take care in designing such a system. Since there is little control of water withdrawal
from public taps, steps should be taken to ensure these taps do not place a burden
on the site’s primary water supply. It is appropriate in such situations to recommend
that an independent source and distribution system be developed separately from
the client’s main system. Typically, a separate borehole fitted with a hand pump
without water storage is appropriate for a community supply.
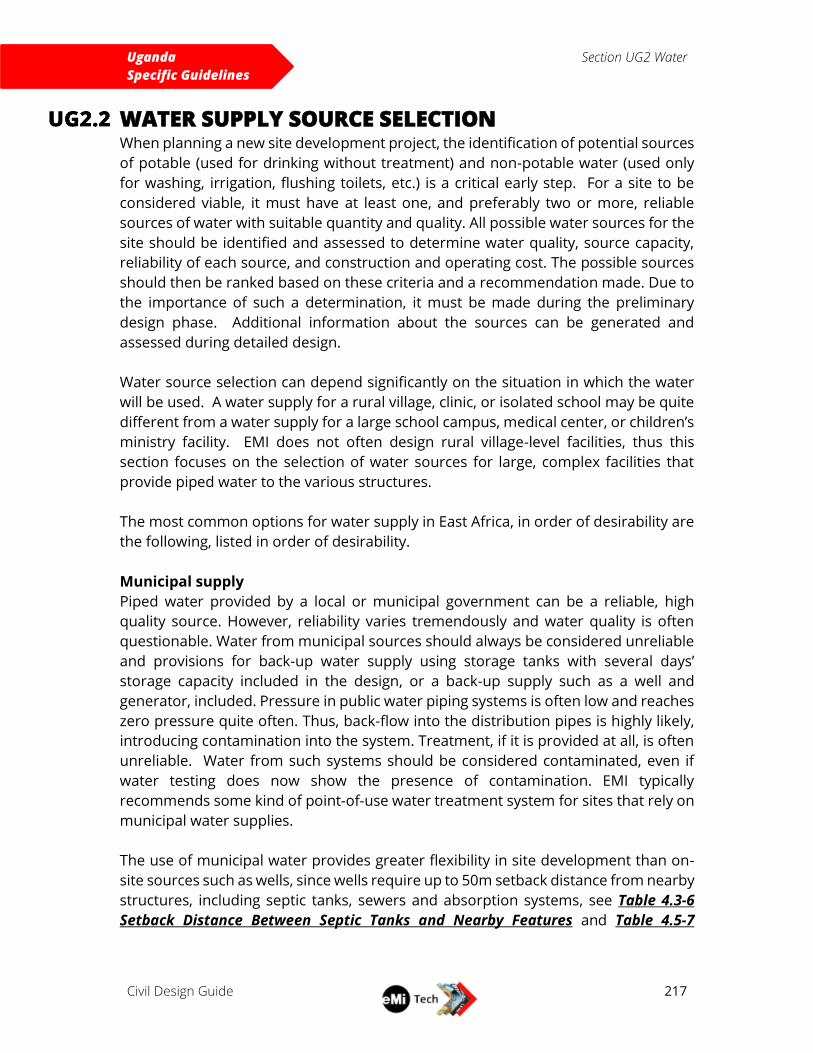
Uganda
Specific Guidelines
Section UG2 Water
Civil Design Guide
217
WATER SUPPLY SOURCE SELECTION When planning a new site development project, the identification of potential sources
of potable (used for drinking without treatment) and non-potable water (used only
for washing, irrigation, flushing toilets, etc.) is a critical early step. For a site to be
considered viable, it must have at least one, and preferably two or more, reliable
sources of water with suitable quantity and quality. All possible water sources for the
site should be identified and assessed to determine water quality, source capacity,
reliability of each source, and construction and operating cost. The possible sources
should then be ranked based on these criteria and a recommendation made. Due to
the importance of such a determination, it must be made during the preliminary
design phase. Additional information about the sources can be generated and
assessed during detailed design.
Water source selection can depend significantly on the situation in which the water
will be used. A water supply for a rural village, clinic, or isolated school may be quite
different from a water supply for a large school campus, medical center, or children’s
ministry facility. EMI does not often design rural village-level facilities, thus this
section focuses on the selection of water sources for large, complex facilities that
provide piped water to the various structures.
The most common options for water supply in East Africa, in order of desirability are
the following, listed in order of desirability.
Municipal supply
Piped water provided by a local or municipal government can be a reliable, high
quality source. However, reliability varies tremendously and water quality is often
questionable. Water from municipal sources should always be considered unreliable
and provisions for back-up water supply using storage tanks with several days’
storage capacity included in the design, or a back-up supply such as a well and
generator, included. Pressure in public water piping systems is often low and reaches
zero pressure quite often. Thus, back-flow into the distribution pipes is highly likely,
introducing contamination into the system. Treatment, if it is provided at all, is often
unreliable. Water from such systems should be considered contaminated, even if
water testing does now show the presence of contamination. EMI typically
recommends some kind of point-of-use water treatment system for sites that rely on
municipal water supplies.
The use of municipal water provides greater flexibility in site development than on-
site sources such as wells, since wells require up to 50m setback distance from nearby
structures, including septic tanks, sewers and absorption systems, see Table 4.3-6
Setback Distance Between Septic Tanks and Nearby Features and Table 4.5-7
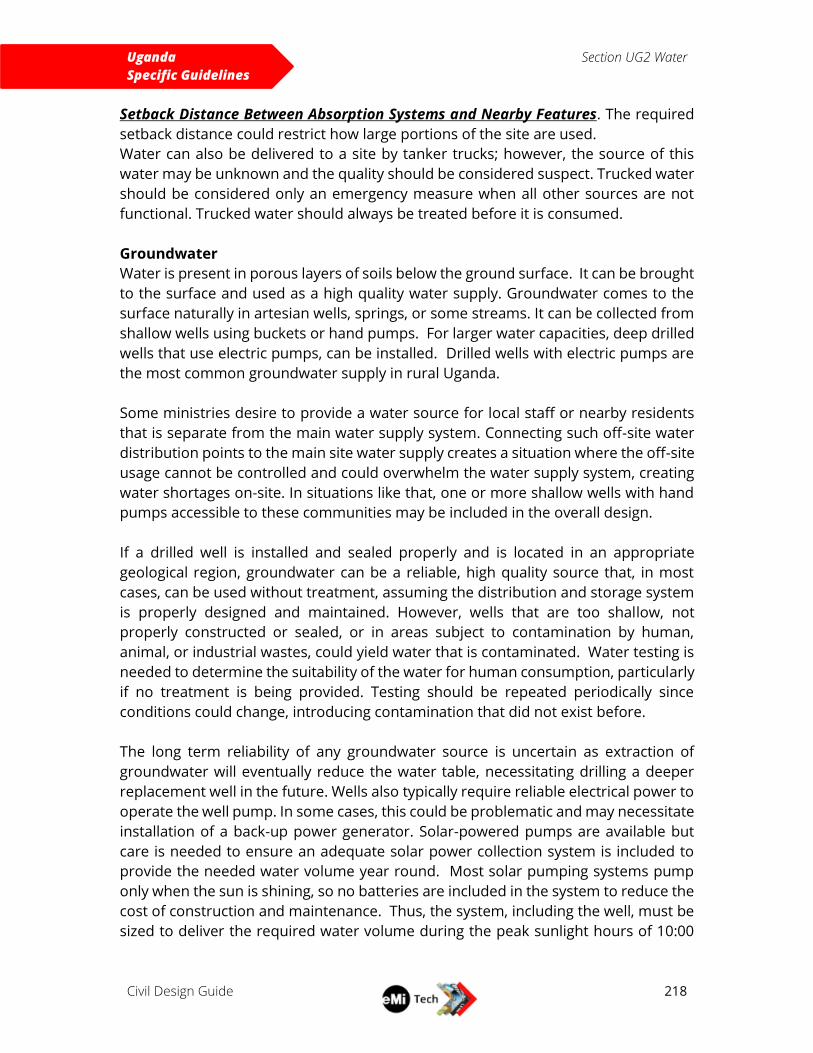
Uganda
Specific Guidelines
Section UG2 Water
Civil Design Guide
218
Setback Distance Between Absorption Systems and Nearby Features. The required
setback distance could restrict how large portions of the site are used.
Water can also be delivered to a site by tanker trucks; however, the source of this
water may be unknown and the quality should be considered suspect. Trucked water
should be considered only an emergency measure when all other sources are not
functional. Trucked water should always be treated before it is consumed.
Groundwater
Water is present in porous layers of soils below the ground surface. It can be brought
to the surface and used as a high quality water supply. Groundwater comes to the
surface naturally in artesian wells, springs, or some streams. It can be collected from
shallow wells using buckets or hand pumps. For larger water capacities, deep drilled
wells that use electric pumps, can be installed. Drilled wells with electric pumps are
the most common groundwater supply in rural Uganda.
Some ministries desire to provide a water source for local staff or nearby residents
that is separate from the main water supply system. Connecting such off-site water
distribution points to the main site water supply creates a situation where the off-site
usage cannot be controlled and could overwhelm the water supply system, creating
water shortages on-site. In situations like that, one or more shallow wells with hand
pumps accessible to these communities may be included in the overall design.
If a drilled well is installed and sealed properly and is located in an appropriate
geological region, groundwater can be a reliable, high quality source that, in most
cases, can be used without treatment, assuming the distribution and storage system
is properly designed and maintained. However, wells that are too shallow, not
properly constructed or sealed, or in areas subject to contamination by human,
animal, or industrial wastes, could yield water that is contaminated. Water testing is
needed to determine the suitability of the water for human consumption, particularly
if no treatment is being provided. Testing should be repeated periodically since
conditions could change, introducing contamination that did not exist before.
The long term reliability of any groundwater source is uncertain as extraction of
groundwater will eventually reduce the water table, necessitating drilling a deeper
replacement well in the future. Wells also typically require reliable electrical power to
operate the well pump. In some cases, this could be problematic and may necessitate
installation of a back-up power generator. Solar-powered pumps are available but
care is needed to ensure an adequate solar power collection system is included to
provide the needed water volume year round. Most solar pumping systems pump
only when the sun is shining, so no batteries are included in the system to reduce the
cost of construction and maintenance. Thus, the system, including the well, must be
sized to deliver the required water volume during the peak sunlight hours of 10:00
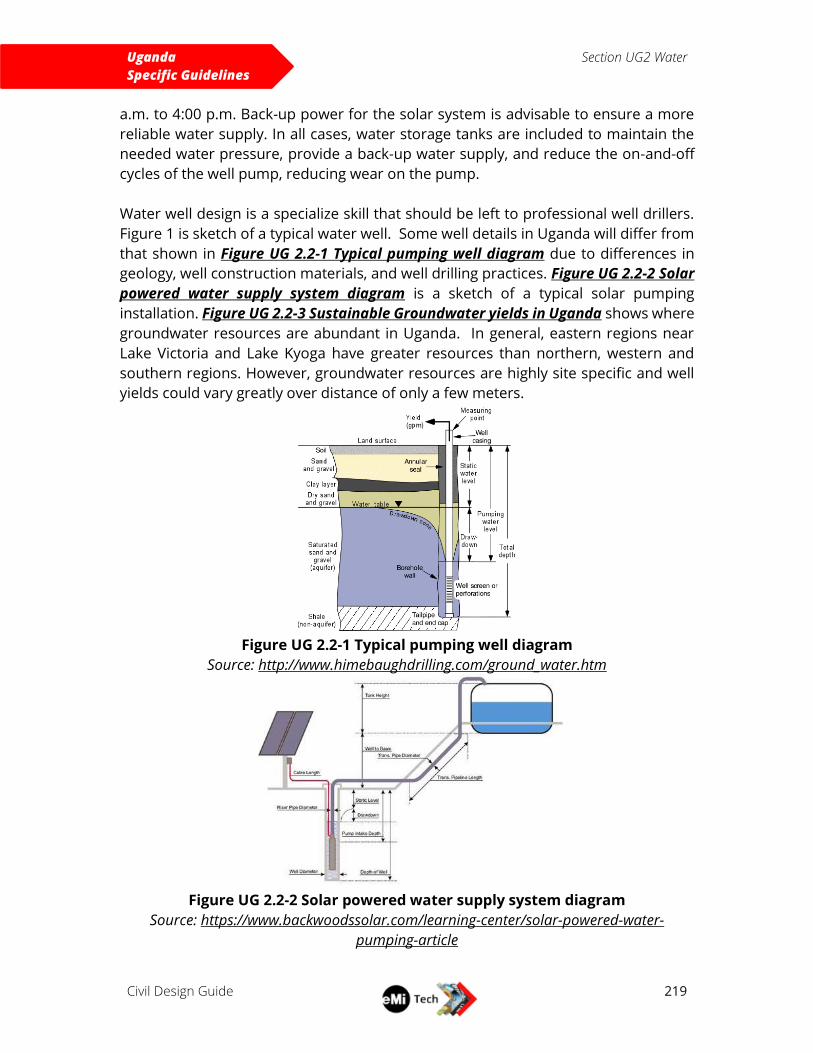
Uganda
Specific Guidelines
Section UG2 Water
Civil Design Guide
219
a.m. to 4:00 p.m. Back-up power for the solar system is advisable to ensure a more
reliable water supply. In all cases, water storage tanks are included to maintain the
needed water pressure, provide a back-up water supply, and reduce the on-and-off
cycles of the well pump, reducing wear on the pump.
Water well design is a specialize skill that should be left to professional well drillers.
Figure 1 is sketch of a typical water well. Some well details in Uganda will differ from
that shown in Figure UG 2.2-1 Typical pumping well diagram due to differences in
geology, well construction materials, and well drilling practices. Figure UG 2.2-2 Solar
powered water supply system diagram is a sketch of a typical solar pumping
installation. Figure UG 2.2-3 Sustainable Groundwater yields in Uganda shows where
groundwater resources are abundant in Uganda. In general, eastern regions near
Lake Victoria and Lake Kyoga have greater resources than northern, western and
southern regions. However, groundwater resources are highly site specific and well
yields could vary greatly over distance of only a few meters.
Figure UG 2.2-1 Typical pumping well diagram
Source: http://www.himebaughdrilling.com/ground_water.htm
Figure UG 2.2-2 Solar powered water supply system diagram
Source: https://www.backwoodssolar.com/learning-center/solar-powered-water-
pumping-article
Uganda
Specific Guidelines
Section UG2 Water
Civil Design Guide
220
Figure UG 2.2-3 Sustainable Groundwater yields in Uganda
Source: Uganda Ministry of Water and Environment, 2013
Well drilling is an uncertain science and the success of a given well can never be
guaranteed. In many cases, boreholes can come up dry and an additional attempt to
drill a productive well, at the client’s expense, is needed. Wells in Uganda could cost
$10,000-$50,000 for each attempt, depending on the depth needed and geology of
the drill site. Using a qualified professional well drilling company will increase the
likelihood of success. Performing geotechnical investigations of the site (soil
resistivity, seismic studies, or other soil analysis techniques) can also increase the
likelihood of success, although they do add to the cost. If there is any uncertainty
about the success of a well, such investigations are often worth the added cost.
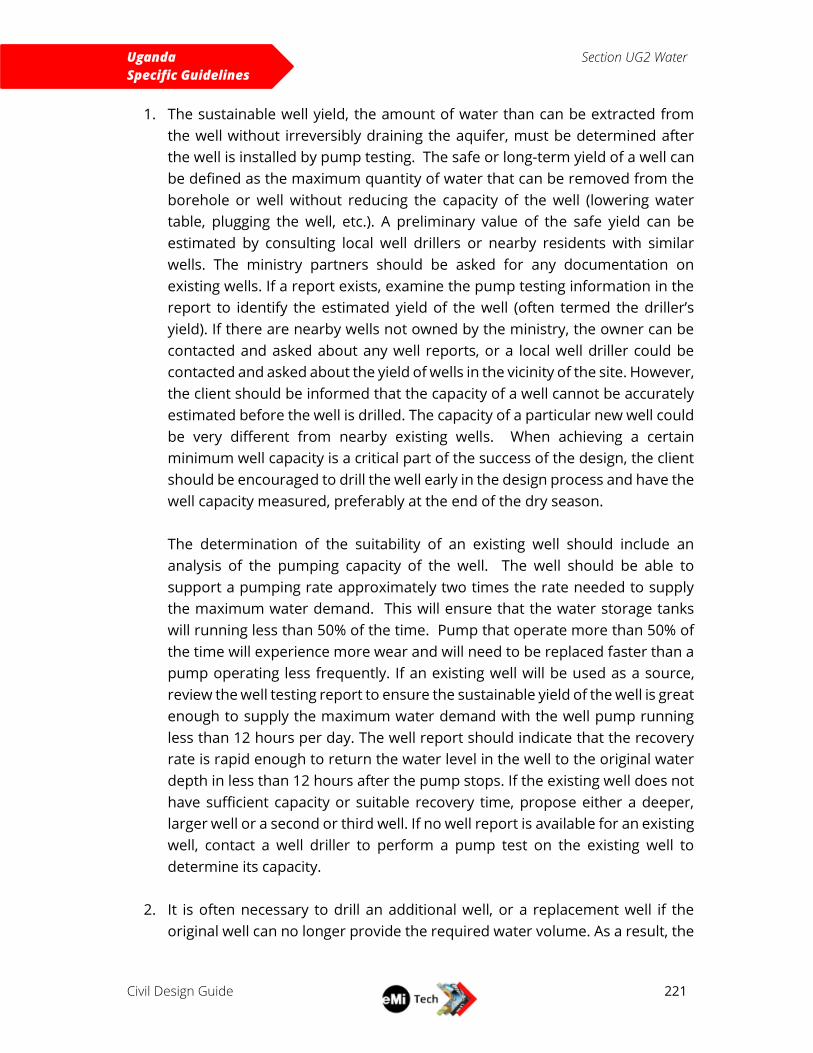
Uganda
Specific Guidelines
Section UG2 Water
Civil Design Guide
221
1. The sustainable well yield, the amount of water than can be extracted from
the well without irreversibly draining the aquifer, must be determined after
the well is installed by pump testing. The safe or long-term yield of a well can
be defined as the maximum quantity of water that can be removed from the
borehole or well without reducing the capacity of the well (lowering water
table, plugging the well, etc.). A preliminary value of the safe yield can be
estimated by consulting local well drillers or nearby residents with similar
wells. The ministry partners should be asked for any documentation on
existing wells. If a report exists, examine the pump testing information in the
report to identify the estimated yield of the well (often termed the driller’s
yield). If there are nearby wells not owned by the ministry, the owner can be
contacted and asked about any well reports, or a local well driller could be
contacted and asked about the yield of wells in the vicinity of the site. However,
the client should be informed that the capacity of a well cannot be accurately
estimated before the well is drilled. The capacity of a particular new well could
be very different from nearby existing wells. When achieving a certain
minimum well capacity is a critical part of the success of the design, the client
should be encouraged to drill the well early in the design process and have the
well capacity measured, preferably at the end of the dry season.
The determination of the suitability of an existing well should include an
analysis of the pumping capacity of the well. The well should be able to
support a pumping rate approximately two times the rate needed to supply
the maximum water demand. This will ensure that the water storage tanks
will running less than 50% of the time. Pump that operate more than 50% of
the time will experience more wear and will need to be replaced faster than a
pump operating less frequently. If an existing well will be used as a source,
review the well testing report to ensure the sustainable yield of the well is great
enough to supply the maximum water demand with the well pump running
less than 12 hours per day. The well report should indicate that the recovery
rate is rapid enough to return the water level in the well to the original water
depth in less than 12 hours after the pump stops. If the existing well does not
have sufficient capacity or suitable recovery time, propose either a deeper,
larger well or a second or third well. If no well report is available for an existing
well, contact a well driller to perform a pump test on the existing well to
determine its capacity.
2. It is often necessary to drill an additional well, or a replacement well if the
original well can no longer provide the required water volume. As a result, the
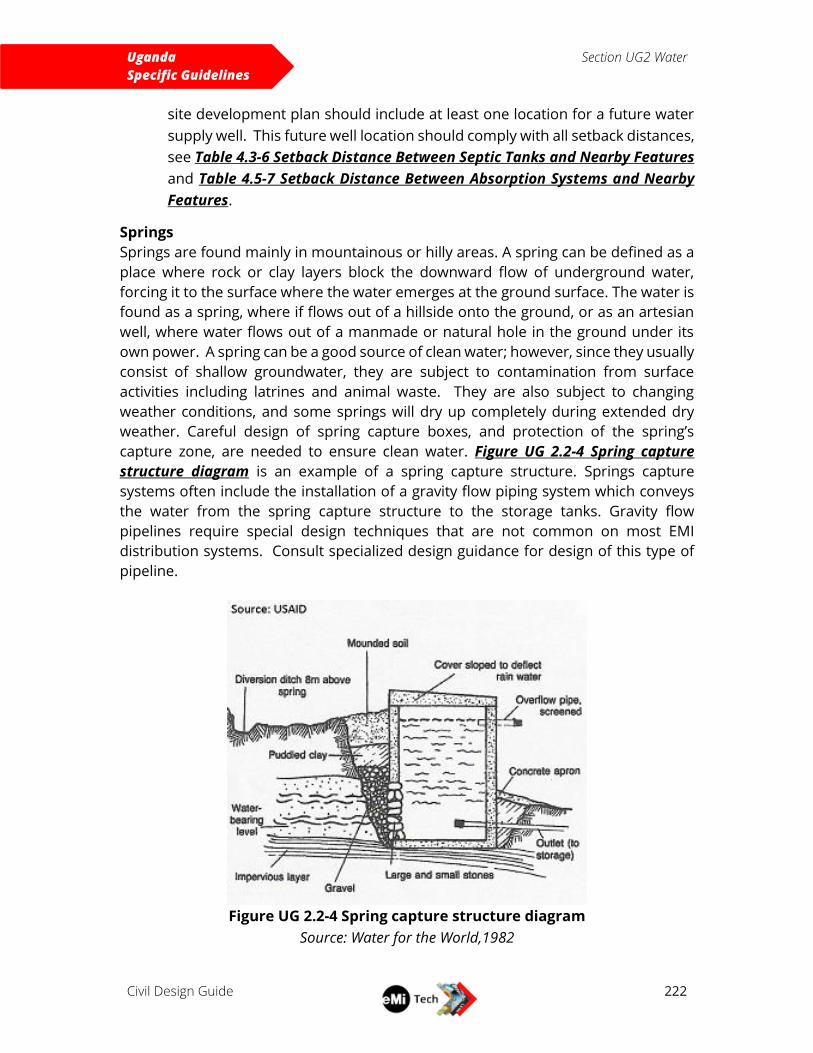
Uganda
Specific Guidelines
Section UG2 Water
Civil Design Guide
222
site development plan should include at least one location for a future water
supply well. This future well location should comply with all setback distances,
see Table 4.3-6 Setback Distance Between Septic Tanks and Nearby Features
and Table 4.5-7 Setback Distance Between Absorption Systems and Nearby
Features.
Springs
Springs are found mainly in mountainous or hilly areas. A spring can be defined as a
place where rock or clay layers block the downward flow of underground water,
forcing it to the surface where the water emerges at the ground surface. The water is
found as a spring, where if flows out of a hillside onto the ground, or as an artesian
well, where water flows out of a manmade or natural hole in the ground under its
own power. A spring can be a good source of clean water; however, since they usually
consist of shallow groundwater, they are subject to contamination from surface
activities including latrines and animal waste. They are also subject to changing
weather conditions, and some springs will dry up completely during extended dry
weather. Careful design of spring capture boxes, and protection of the spring’s
capture zone, are needed to ensure clean water. Figure UG 2.2-4 Spring capture
structure diagram is an example of a spring capture structure. Springs capture
systems often include the installation of a gravity flow piping system which conveys
the water from the spring capture structure to the storage tanks. Gravity flow
pipelines require special design techniques that are not common on most EMI
distribution systems. Consult specialized design guidance for design of this type of
pipeline.
Figure UG 2.2-4 Spring capture structure diagram
Source: Water for the World,1982
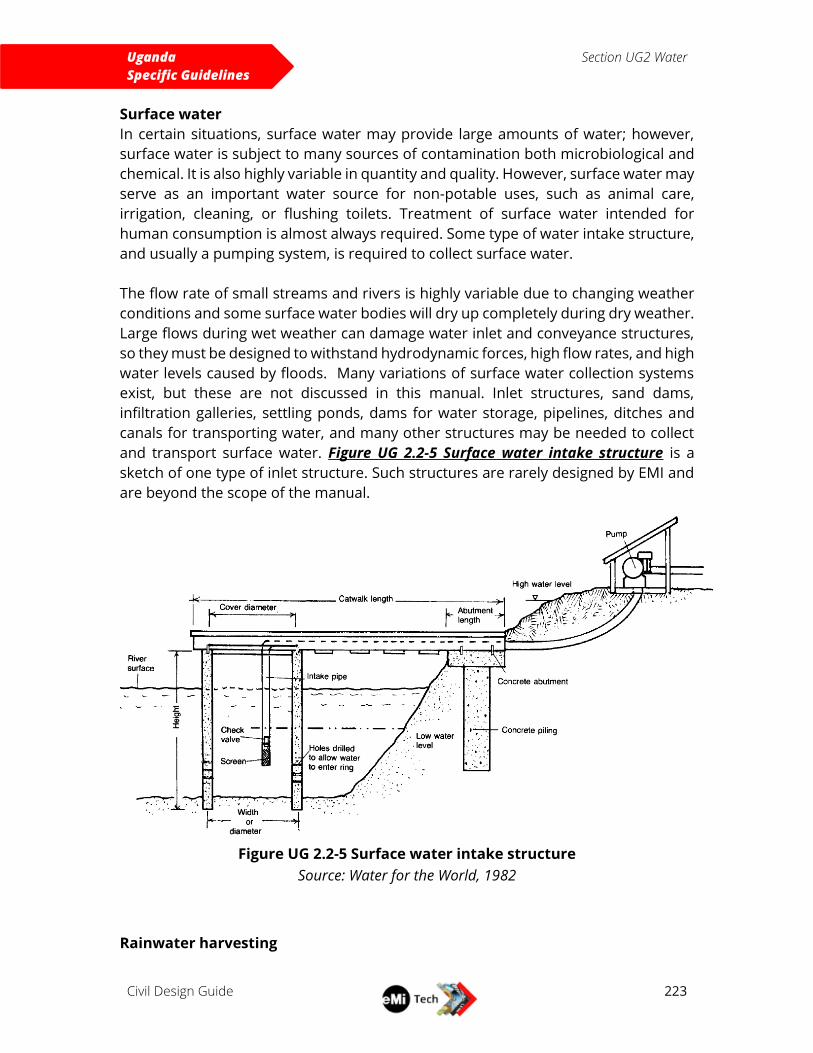
Uganda
Specific Guidelines
Section UG2 Water
Civil Design Guide
223
Surface water
In certain situations, surface water may provide large amounts of water; however,
surface water is subject to many sources of contamination both microbiological and
chemical. It is also highly variable in quantity and quality. However, surface water may
serve as an important water source for non-potable uses, such as animal care,
irrigation, cleaning, or flushing toilets. Treatment of surface water intended for
human consumption is almost always required. Some type of water intake structure,
and usually a pumping system, is required to collect surface water.
The flow rate of small streams and rivers is highly variable due to changing weather
conditions and some surface water bodies will dry up completely during dry weather.
Large flows during wet weather can damage water inlet and conveyance structures,
so they must be designed to withstand hydrodynamic forces, high flow rates, and high
water levels caused by floods. Many variations of surface water collection systems
exist, but these are not discussed in this manual. Inlet structures, sand dams,
infiltration galleries, settling ponds, dams for water storage, pipelines, ditches and
canals for transporting water, and many other structures may be needed to collect
and transport surface water. Figure UG 2.2-5 Surface water intake structure is a
sketch of one type of inlet structure. Such structures are rarely designed by EMI and
are beyond the scope of the manual.
Figure UG 2.2-5 Surface water intake structure
Source: Water for the World, 1982
Rainwater harvesting
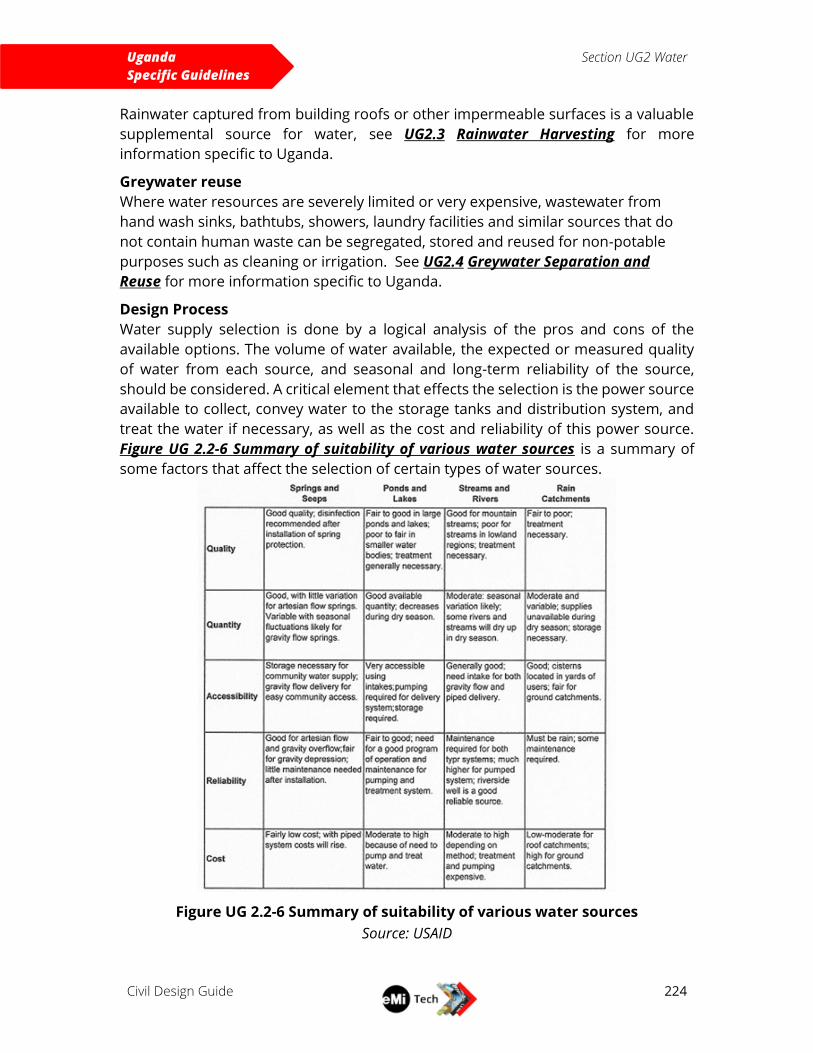
Uganda
Specific Guidelines
Section UG2 Water
Civil Design Guide
224
Rainwater captured from building roofs or other impermeable surfaces is a valuable
supplemental source for water, see UG2.3 Rainwater Harvesting for more
information specific to Uganda.
Greywater reuse
Where water resources are severely limited or very expensive, wastewater from
hand wash sinks, bathtubs, showers, laundry facilities and similar sources that do
not contain human waste can be segregated, stored and reused for non-potable
purposes such as cleaning or irrigation. See UG2.4 Greywater Separation and
Reuse for more information specific to Uganda.
Design Process
Water supply selection is done by a logical analysis of the pros and cons of the
available options. The volume of water available, the expected or measured quality
of water from each source, and seasonal and long-term reliability of the source,
should be considered. A critical element that effects the selection is the power source
available to collect, convey water to the storage tanks and distribution system, and
treat the water if necessary, as well as the cost and reliability of this power source.
Figure UG 2.2-6 Summary of suitability of various water sources is a summary of
some factors that affect the selection of certain types of water sources.
Figure UG 2.2-6 Summary of suitability of various water sources
Source: USAID
Uganda
Specific Guidelines
Section UG2 Water
Civil Design Guide
225
During the site investigation, identify all potential water supply sources and attempt
to estimate the quantity of water available from each source. Perform water quality
tests if possible on each source (not applicable to proposed new wells or pumped
water supplies). Utilize the Table A 2.5-14 EMI Water Testing Kits Contents. If the
potential exists for water quality problems the EMI test kit can’t determine, such as
fluoride, industrial chemical contamination, or arsenic, submit a sample to a local
qualified analytical testing laboratory.
If municipal water is available obtain information on the cost, location of the nearest
supply pipe, the pipe size and water pressure available at this location, and the
reliability and cost of this source. The local water supply organization should be
consulted prior to making a recommendation for use of this source to ensure there
is adequate capacity and pressure to supply the needed water.
Other considerations
Sources which require little or no treatment of raw water such as springs, wells
and boreholes should be given the highest selection priority provided their
yields are sufficient to meet the water demands of the scheme.
Sources from which water can be supplied by a gravity collection system are
preferred over those which require pumping.
Water extraction permits from the Directorate of Water Resources
Management are required for water abstraction in Uganda from sources such
as wells, springs, and surface water.
Set-back distances
To ensure the safety of any on-site water supply, water supply sources and on-site
wastewater disposal systems need to be kept a safe distance apart. Thus, careful
attention to the siting of water sources and wastewater facilities is needed. See Table
4.3-6 Setback Distance Between Septic Tanks and Nearby Features and Table 4.5-7
Setback Distance Between Absorption Systems and Nearby Features. There are also
requirements for ensuring minimum spacing between groundwater wells. Local
governments may have other setback requirements that must be followed.
Maintaining the minimum setback distances may have a significant impact on the
layout of site structures and infrastructure, particularly on small sites. Surface water
system, springs and shallow wells may also require establishment of a watershed
protection area that is protected from animal management, agricultural chemical use,
industrial activities, or any other source of contamination.
Based on a qualitative or quantitate assessment of these factors, recommend one or
more sources sufficient for the expected site needs. Multiple source may be specified
for different water uses (e.g. rainwater harvesting for cleaning, and a well for drinking

Uganda
Specific Guidelines
Section UG2 Water
Civil Design Guide
226
and cooking). Ways to segregate the water supplies to prevent intermixing of supplies
would be needed in such a case.
Uganda
Specific Guidelines
Section UG2 Water
Civil Design Guide
227
RAINWATER HARVESTING In Uganda, there is a deliberate effort by Ministry of Water and Environment to
promote Rainwater Harvesting for households, institutional and communal water
supply systems mainly for domestic purposes. Rainwater capture can be an effective
supplement to other water supplies, but it is rarely adequate as the sole source of
water. Because of the unreliability of rainfall and the expense of constructing and
maintaining a system large enough to hold adequate water for use during the dry
season, it is typically not used as a primary supply. In addition, water quality is often
poor due to rainwater washing dirt and animal fecal matter from the roof during a
storm. Use of captured rainwater should be limited to non-consumptive uses, such
as cleaning, laundry, or irrigation.
The goal of rainwater capture is to collect as much of the rainwater runoff during the
rainy season as possible, storing the water for use during the dry season. The
rainwater storage tank is sized based on the precipitation amount expected during
the rainy season. Smaller storage volumes can be used, but the water supply may
not be sufficient to provide water during the entire dry season. Rainwater may be
collected from multiple buildings and directed to a common tank.
Rainwater may be a feasible secondary supply where there is a large roof area, the
average annual precipitation amount is large, and water demand during the dry
season is low. Facilities where rainwater capture may be feasible include schools,
hospitals, churches, conference centers and other large structures.
Where no other water supply exists, and precipitation amounts are sufficient, a
central tank system, either at ground level or at a lower elevation than buildings, may
be designed to collect and store adequate water to supply the site for the entire year.
Extensive treatment of this water prior to consumption will be required. Great caution
should be exercised before rainwater is recommended as the sole source of water
due to the unreliability of precipitation.
Design Considerations to Maximize Rainwater Quality
Catchment material
Direct atmospheric deposition, overhanging foliage or bird and rodent debris
contribute to particle accumulation on roof surfaces but this is site specific. Roofs are
made of different materials which degrade and contribute to particulate or dissolved
solids in harvested rainwater. The chemicals that may be detected from roof run off
depending on the roof material may include; zinc, copper, lead, cadmium and
mercury among others.
Storage material
These are usually viewed as treatment means instead of contamination as it is with
catchment material. For example, rainwater is slightly acidic but when stored in
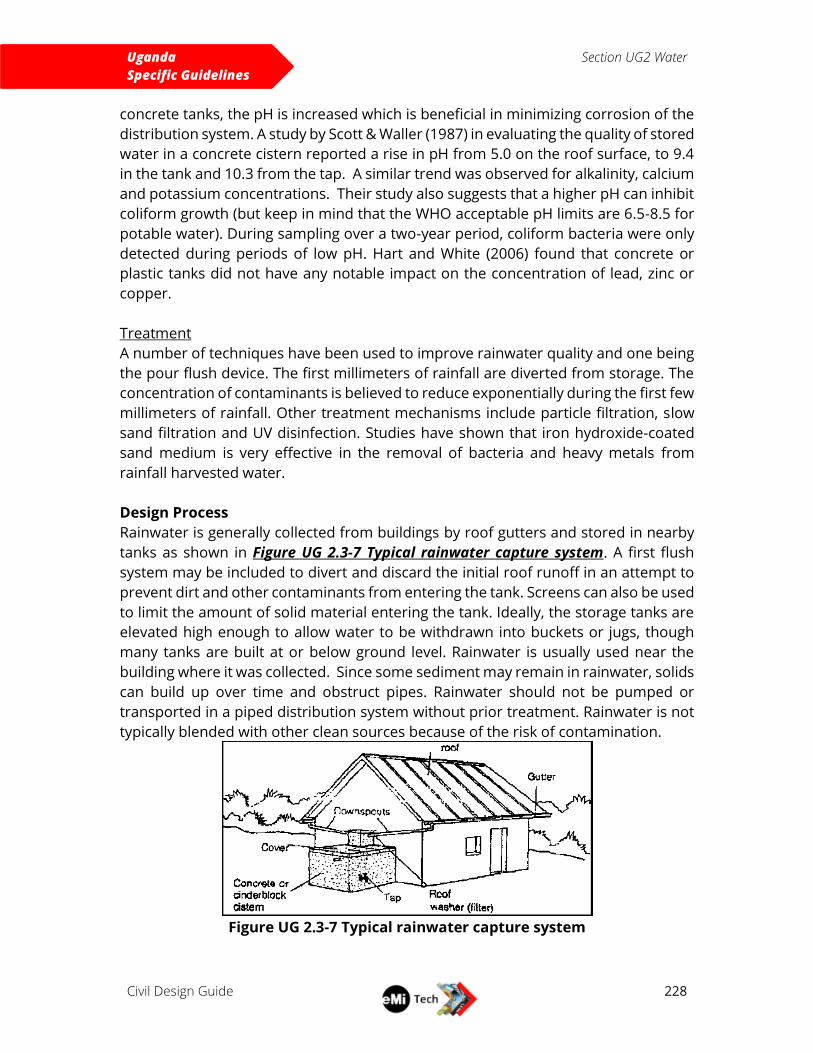
Uganda
Specific Guidelines
Section UG2 Water
Civil Design Guide
228
concrete tanks, the pH is increased which is beneficial in minimizing corrosion of the
distribution system. A study by Scott & Waller (1987) in evaluating the quality of stored
water in a concrete cistern reported a rise in pH from 5.0 on the roof surface, to 9.4
in the tank and 10.3 from the tap. A similar trend was observed for alkalinity, calcium
and potassium concentrations. Their study also suggests that a higher pH can inhibit
coliform growth (but keep in mind that the WHO acceptable pH limits are 6.5-8.5 for
potable water). During sampling over a two-year period, coliform bacteria were only
detected during periods of low pH. Hart and White (2006) found that concrete or
plastic tanks did not have any notable impact on the concentration of lead, zinc or
copper.
Treatment
A number of techniques have been used to improve rainwater quality and one being
the pour flush device. The first millimeters of rainfall are diverted from storage. The
concentration of contaminants is believed to reduce exponentially during the first few
millimeters of rainfall. Other treatment mechanisms include particle filtration, slow
sand filtration and UV disinfection. Studies have shown that iron hydroxide-coated
sand medium is very effective in the removal of bacteria and heavy metals from
rainfall harvested water.
Design Process
Rainwater is generally collected from buildings by roof gutters and stored in nearby
tanks as shown in Figure UG 2.3-7 Typical rainwater capture system. A first flush
system may be included to divert and discard the initial roof runoff in an attempt to
prevent dirt and other contaminants from entering the tank. Screens can also be used
to limit the amount of solid material entering the tank. Ideally, the storage tanks are
elevated high enough to allow water to be withdrawn into buckets or jugs, though
many tanks are built at or below ground level. Rainwater is usually used near the
building where it was collected. Since some sediment may remain in rainwater, solids
can build up over time and obstruct pipes. Rainwater should not be pumped or
transported in a piped distribution system without prior treatment. Rainwater is not
typically blended with other clean sources because of the risk of contamination.
Figure UG 2.3-7 Typical rainwater capture system
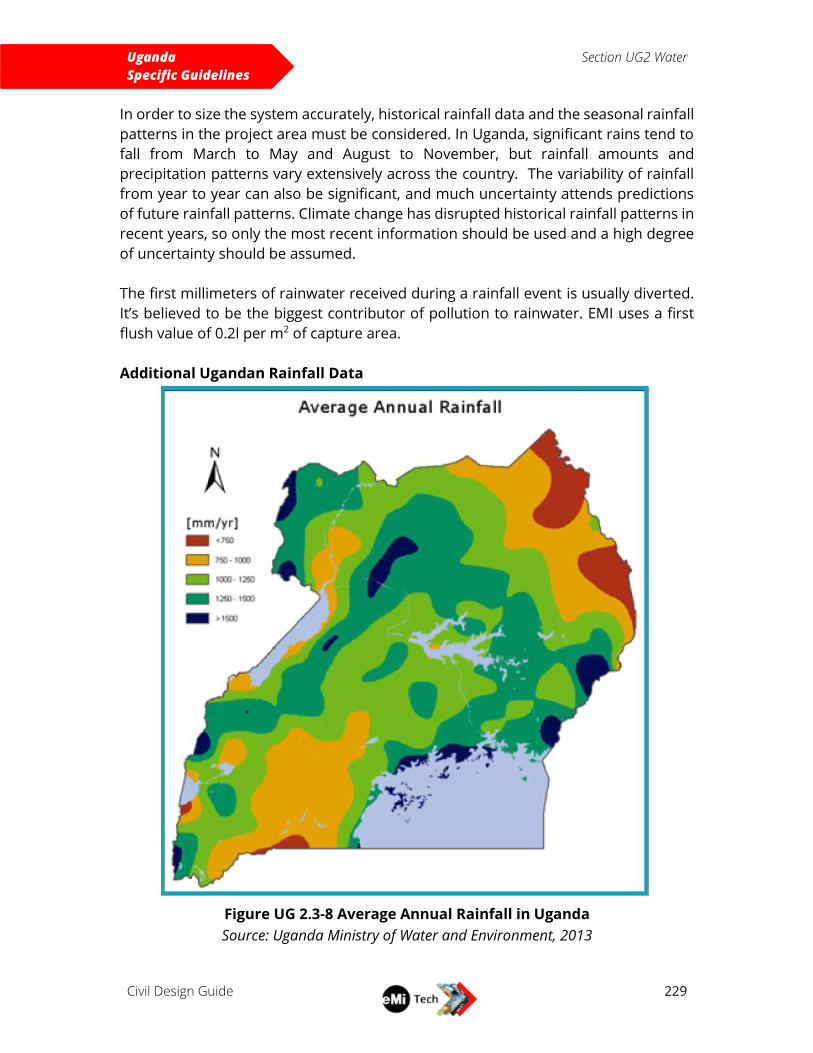
Uganda
Specific Guidelines
Section UG2 Water
Civil Design Guide
229
In order to size the system accurately, historical rainfall data and the seasonal rainfall
patterns in the project area must be considered. In Uganda, significant rains tend to
fall from March to May and August to November, but rainfall amounts and
precipitation patterns vary extensively across the country. The variability of rainfall
from year to year can also be significant, and much uncertainty attends predictions
of future rainfall patterns. Climate change has disrupted historical rainfall patterns in
recent years, so only the most recent information should be used and a high degree
of uncertainty should be assumed.
The first millimeters of rainwater received during a rainfall event is usually diverted.
It’s believed to be the biggest contributor of pollution to rainwater. EMI uses a first
flush value of 0.2l per m2 of capture area.
Additional Ugandan Rainfall Data
Figure UG 2.3-8 Average Annual Rainfall in Uganda
Source: Uganda Ministry of Water and Environment, 2013
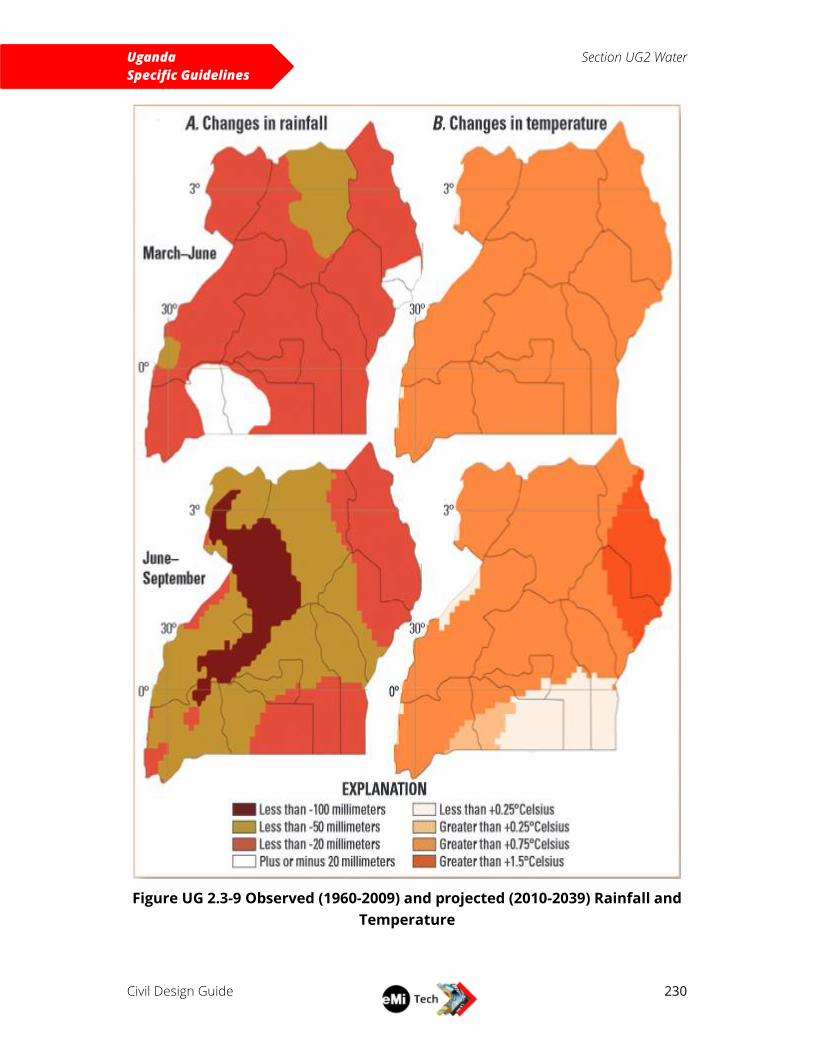
Uganda
Specific Guidelines
Section UG2 Water
Civil Design Guide
230
Figure UG 2.3-9 Observed (1960-2009) and projected (2010-2039) Rainfall and
Temperature
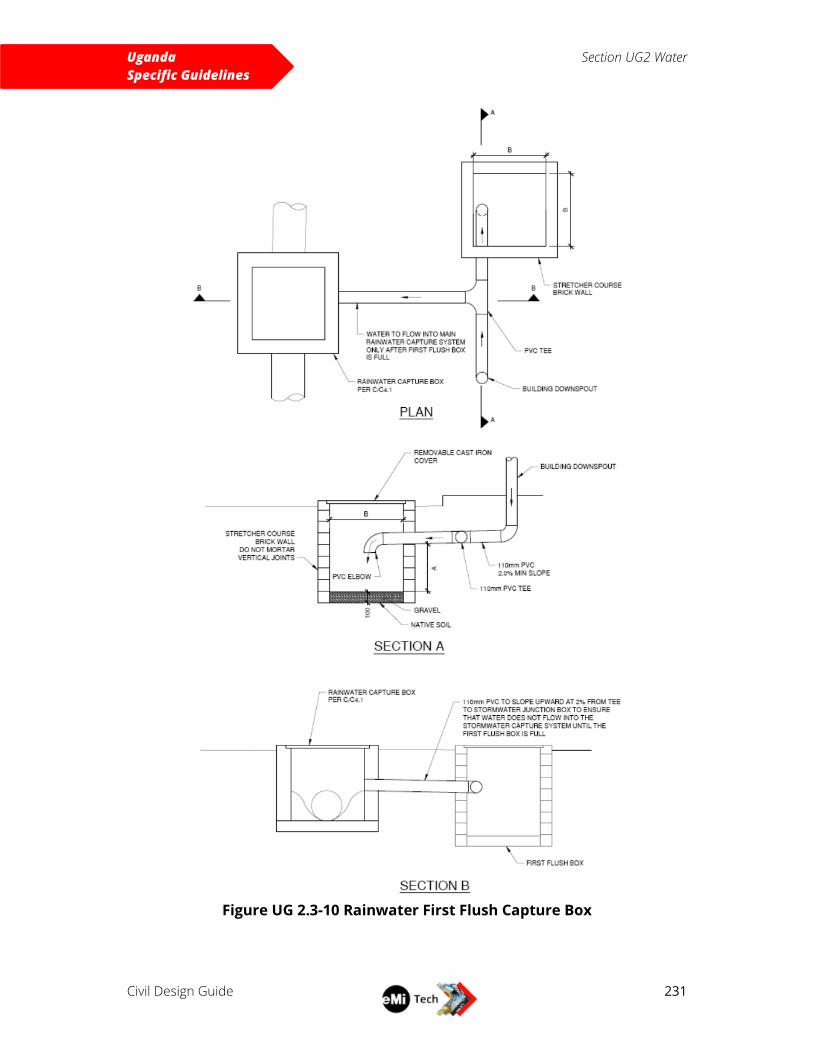
Uganda
Specific Guidelines
Section UG2 Water
Civil Design Guide
231
Figure UG 2.3-10 Rainwater First Flush Capture Box
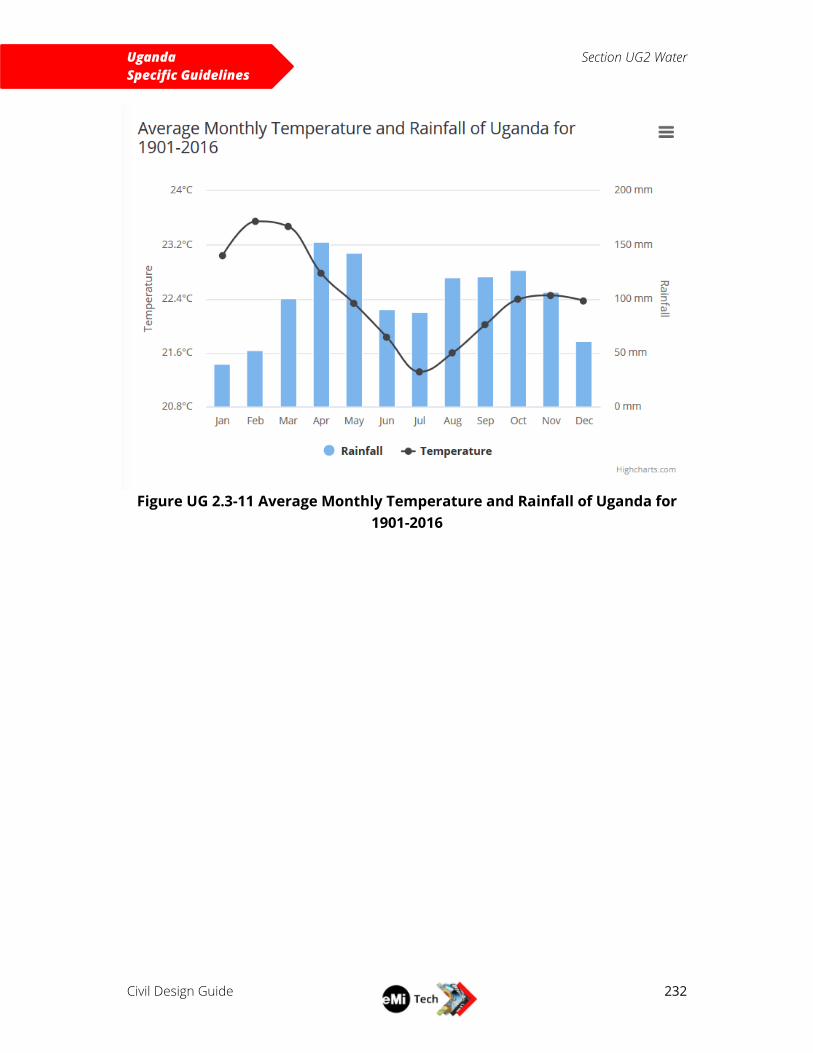
Uganda
Specific Guidelines
Section UG2 Water
Civil Design Guide
232
Figure UG 2.3-11 Average Monthly Temperature and Rainfall of Uganda for
1901-2016
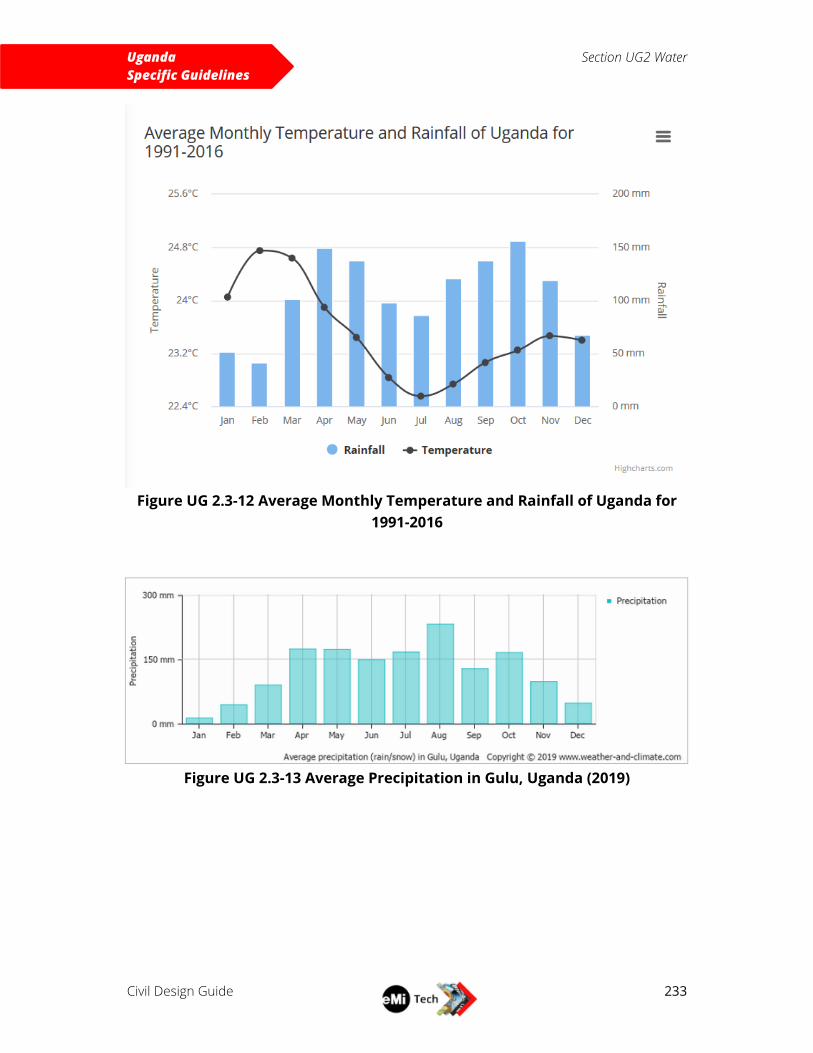
Uganda
Specific Guidelines
Section UG2 Water
Civil Design Guide
233
Figure UG 2.3-12 Average Monthly Temperature and Rainfall of Uganda for
1991-2016
Figure UG 2.3-13 Average Precipitation in Gulu, Uganda (2019)
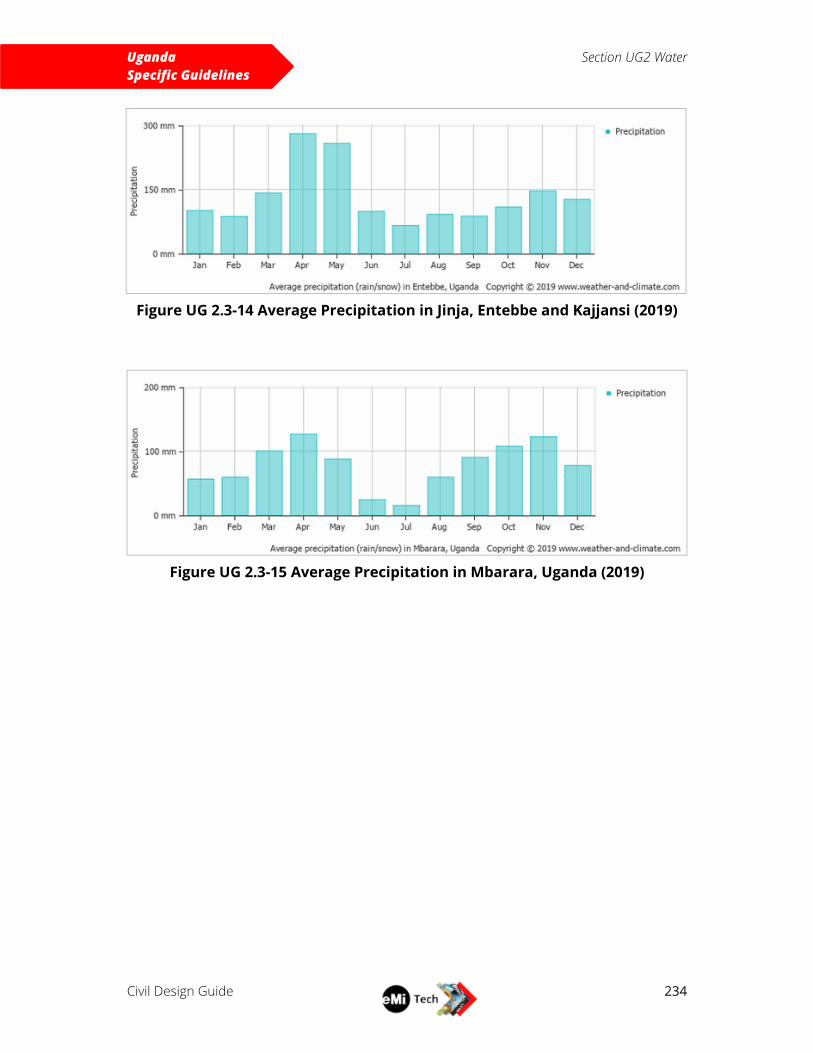
Uganda
Specific Guidelines
Section UG2 Water
Civil Design Guide
234
Figure UG 2.3-14 Average Precipitation in Jinja, Entebbe and Kajjansi (2019)
Figure UG 2.3-15 Average Precipitation in Mbarara, Uganda (2019)
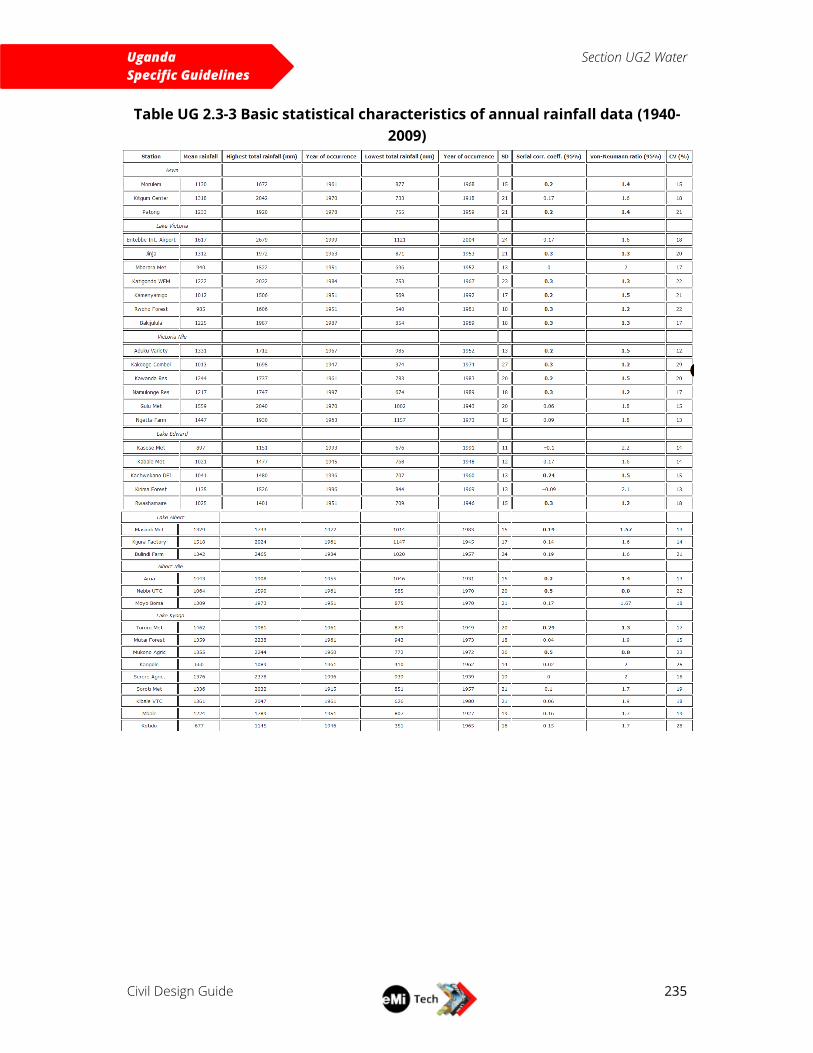
Uganda
Specific Guidelines
Section UG2 Water
Civil Design Guide
235
Table UG 2.3-3 Basic statistical characteristics of annual rainfall data (1940-
2009)
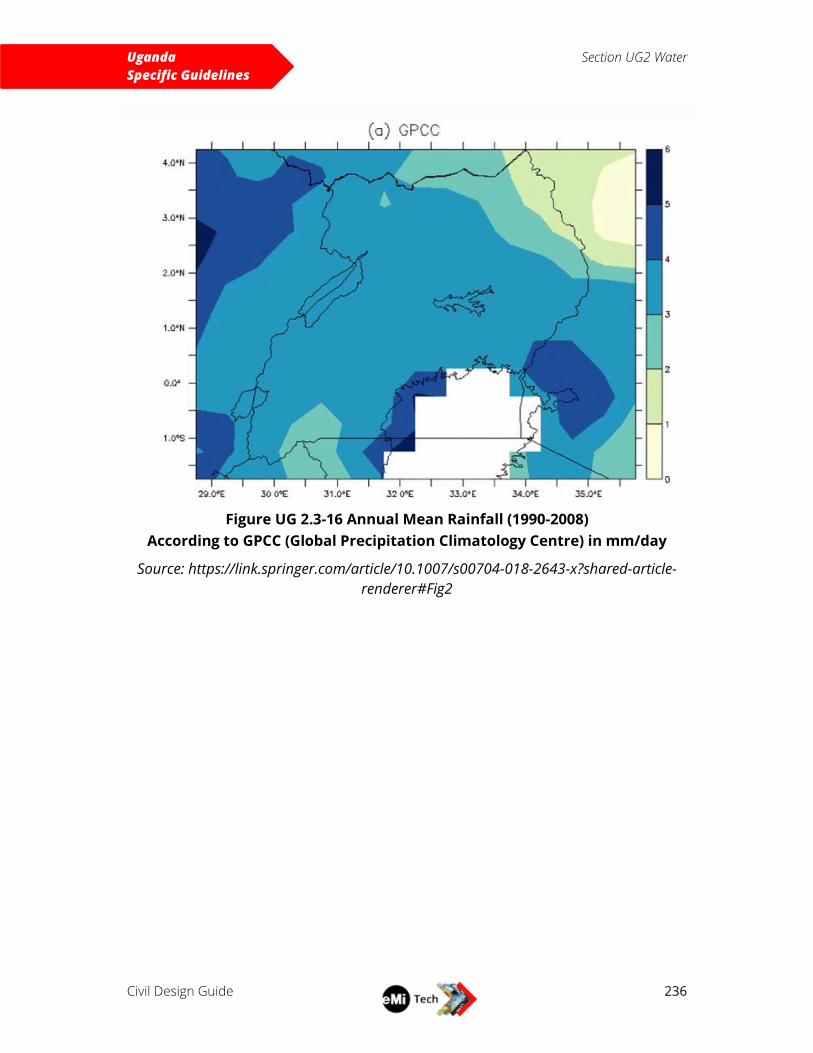
Uganda
Specific Guidelines
Section UG2 Water
Civil Design Guide
236
Figure UG 2.3-16 Annual Mean Rainfall (1990-2008)
According to GPCC (Global Precipitation Climatology Centre) in mm/day
Source: https://link.springer.com/article/10.1007/s00704-018-2643-x?shared-article-
renderer#Fig2
Uganda
Specific Guidelines
Section UG2 Water
Civil Design Guide
237
GREYWATER SEPARATION AND REUSE Two types of greywater disposal approaches are discussed in this guide. The first is
greywater segregation and disposal which is a simple process that requires little
additional cost or complexity. This approach is used on almost all of EMIs projects to
achieve a moderate reduction in the cost of wastewater treatment systems. The
second approach involves greywater reuse which is a much more complex approach
which requires considerable capital investment as well as ongoing maintenance and
operation. It is used only rarely in East Africa and is most suited for drought-prone
areas where water is scarce and expensive. Most locations in East Africa have other
reliable water supply options that are less costly, and much easier to operate than a
greywater reuse system. Great care should be exercised before recommending a
greywater reuse system, including a careful assessment of the pros and cons of such
a system.
Ways of reusing greywater include;
Greywater diversion which diverts greywater generated by a premise to the
garden or lawn for use in sub-surface irrigation.
Greywater treatment which treats greywater for other reuse such as toilet
flushing, washing machine and surface irrigation.
Manual bucketing which involves the reuse of relatively small quantities of
greywater for irrigation (Department of Energy, Utilities and Sustainability,
2008).
Greywater reuse on a large scale is uncommon due to many complicating factors.
However, small scale uses, such as collecting wastewater in buckets and pouring the
water on plants, is commonly done, but formalized collection, treatment, and storage
for reuse is not common. See the Table UG 2.4-4 for criteria to be determined when
considering greywater re-use. Additionally when determining the amount of
greywater generated, use
Table UG 2.4-5 Approximate Percentage of Wastewater for wastewater calculations
in the EMI Water and Wastewater Design Template. Greywater from a bathroom and
laundry stream will have different water quality characteristics and should be
considered in the design process. See
Table UG 2.4-6 Characteristics of Different Greywater Streams for these
considerations.
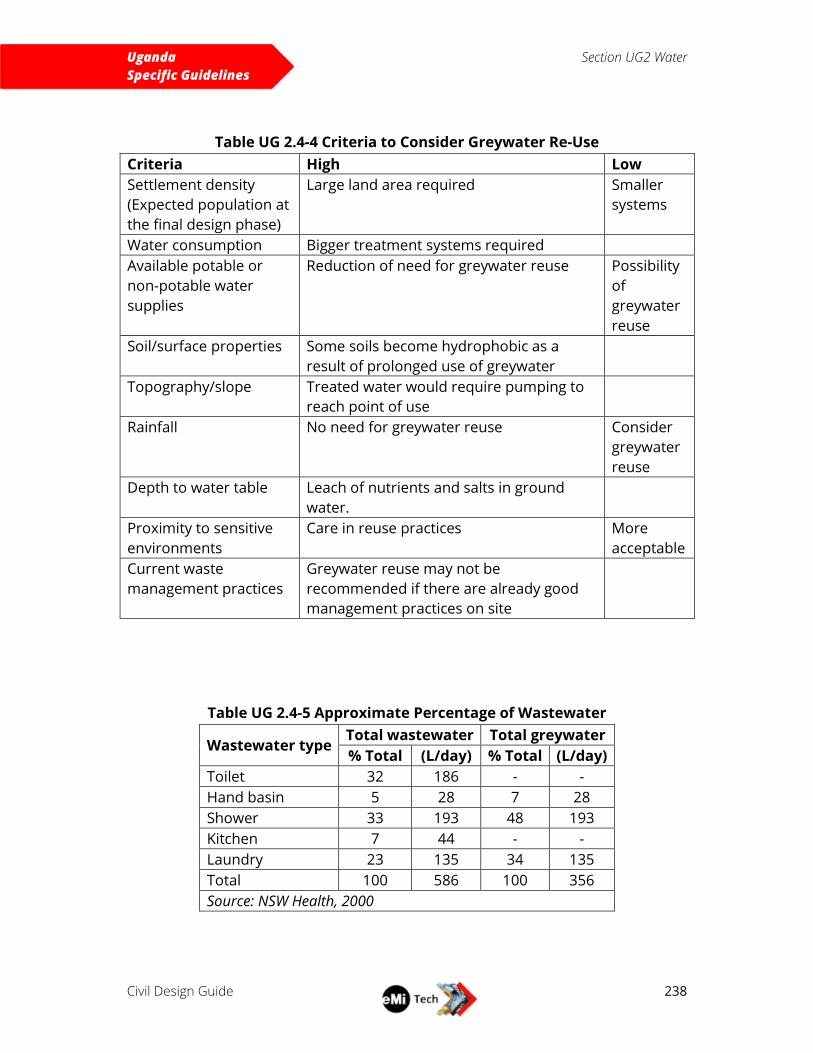
Uganda
Specific Guidelines
Section UG2 Water
Civil Design Guide
238
Table UG 2.4-4 Criteria to Consider Greywater Re-Use
Criteria High Low
Settlement density
(Expected population at
the final design phase)
Large land area required Smaller
systems
Water consumption Bigger treatment systems required
Available potable or
non-potable water
supplies
Reduction of need for greywater reuse Possibility
of
greywater
reuse
Soil/surface properties Some soils become hydrophobic as a
result of prolonged use of greywater
Topography/slope Treated water would require pumping to
reach point of use
Rainfall No need for greywater reuse Consider
greywater
reuse
Depth to water table Leach of nutrients and salts in ground
water.
Proximity to sensitive
environments
Care in reuse practices More
acceptable
Current waste
management practices
Greywater reuse may not be
recommended if there are already good
management practices on site
Table UG 2.4-5 Approximate Percentage of Wastewater
Wastewater type Total wastewater Total greywater
% Total (L/day) % Total (L/day)
Toilet 32 186 - -
Hand basin 5 28 7 28
Shower 33 193 48 193
Kitchen 7 44 - -
Laundry 23 135 34 135
Total 100 586 100 356
Source: NSW Health, 2000
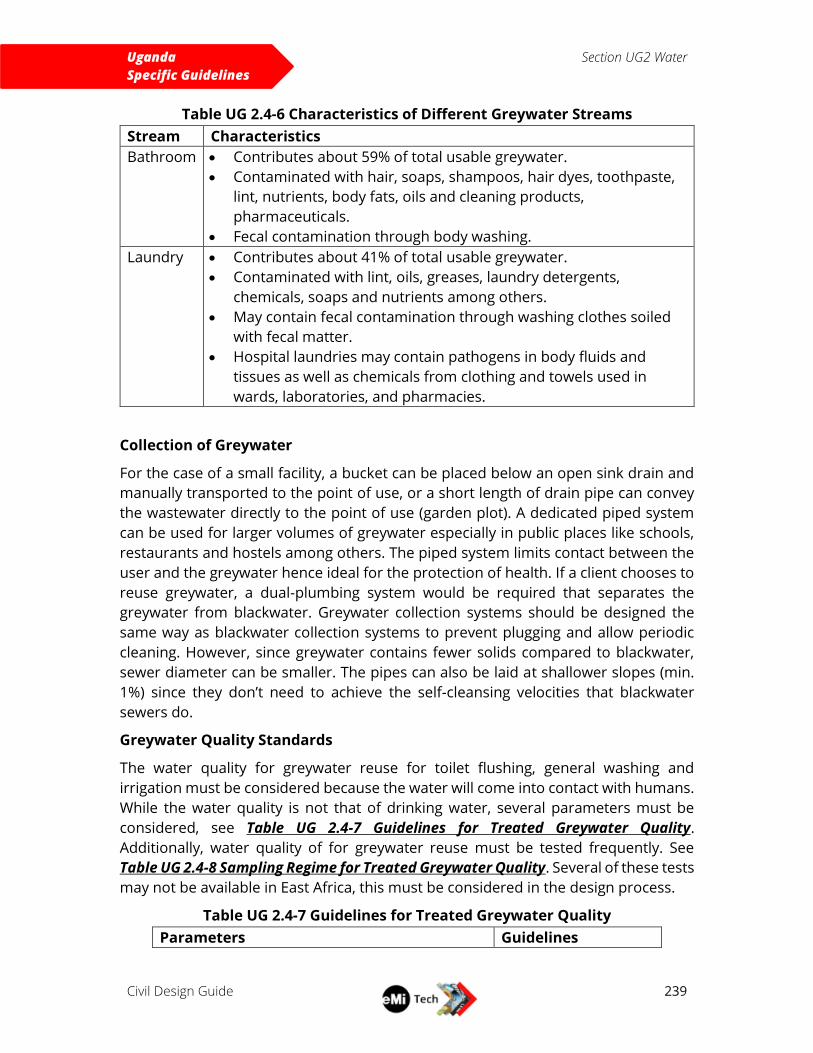
Uganda
Specific Guidelines
Section UG2 Water
Civil Design Guide
239
Table UG 2.4-6 Characteristics of Different Greywater Streams
Stream Characteristics
Bathroom Contributes about 59% of total usable greywater.
Contaminated with hair, soaps, shampoos, hair dyes, toothpaste,
lint, nutrients, body fats, oils and cleaning products,
pharmaceuticals.
Fecal contamination through body washing.
Laundry Contributes about 41% of total usable greywater.
Contaminated with lint, oils, greases, laundry detergents,
chemicals, soaps and nutrients among others.
May contain fecal contamination through washing clothes soiled
with fecal matter.
Hospital laundries may contain pathogens in body fluids and
tissues as well as chemicals from clothing and towels used in
wards, laboratories, and pharmacies.
Collection of Greywater
For the case of a small facility, a bucket can be placed below an open sink drain and
manually transported to the point of use, or a short length of drain pipe can convey
the wastewater directly to the point of use (garden plot). A dedicated piped system
can be used for larger volumes of greywater especially in public places like schools,
restaurants and hostels among others. The piped system limits contact between the
user and the greywater hence ideal for the protection of health. If a client chooses to
reuse greywater, a dual-plumbing system would be required that separates the
greywater from blackwater. Greywater collection systems should be designed the
same way as blackwater collection systems to prevent plugging and allow periodic
cleaning. However, since greywater contains fewer solids compared to blackwater,
sewer diameter can be smaller. The pipes can also be laid at shallower slopes (min.
1%) since they don’t need to achieve the self-cleansing velocities that blackwater
sewers do.
Greywater Quality Standards
The water quality for greywater reuse for toilet flushing, general washing and
irrigation must be considered because the water will come into contact with humans.
While the water quality is not that of drinking water, several parameters must be
considered, see Table UG 2.4-7 Guidelines for Treated Greywater Quality.
Additionally, water quality of for greywater reuse must be tested frequently. See
Table UG 2.4-8 Sampling Regime for Treated Greywater Quality. Several of these tests
may not be available in East Africa, this must be considered in the design process.
Table UG 2.4-7 Guidelines for Treated Greywater Quality
Parameters Guidelines
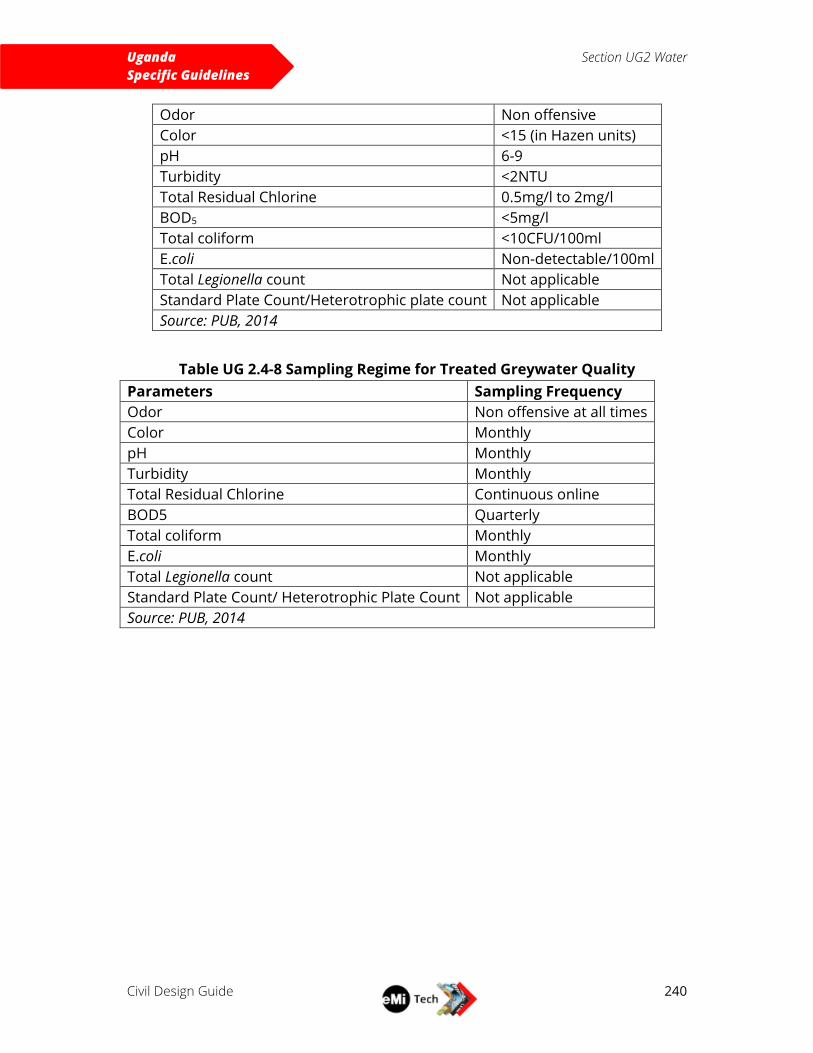
Uganda
Specific Guidelines
Section UG2 Water
Civil Design Guide
240
Odor Non offensive
Color <15 (in Hazen units)
pH 6-9
Turbidity <2NTU
Total Residual Chlorine 0.5mg/l to 2mg/l
BOD5 <5mg/l
Total coliform <10CFU/100ml
E.coli Non-detectable/100ml
Total Legionella count Not applicable
Standard Plate Count/Heterotrophic plate count Not applicable
Source: PUB, 2014
Table UG 2.4-8 Sampling Regime for Treated Greywater Quality
Parameters Sampling Frequency
Odor Non offensive at all times
Color Monthly
pH Monthly
Turbidity Monthly
Total Residual Chlorine Continuous online
BOD5 Quarterly
Total coliform Monthly
E.coli Monthly
Total Legionella count Not applicable
Standard Plate Count/ Heterotrophic Plate Count Not applicable
Source: PUB, 2014
Uganda
Specific Guidelines
Section UG2 Water
Civil Design Guide
241
WATER QUALITY TESTING The quality of water is as important as the volume of water available. An attempt
should be made to determine the expected quality of water for each source being
considered. The availability of official water testing services in East Africa is usually
limited to a few large universities and government laboratories. Since it is difficult to
get samples from a private organization analyzed in such facilities, EMI has assembled
a testing kit that can be used to generate limited information about water quality in
the field. The tests that can be performed using EMI’s test kits are limited to those
that have simple field testing capability. The accuracy and precision of these tests is
often low and care is needed when assessing the results of the testing. See Table A
2.5-14 EMI Water Testing Kits Contents.
Water quality standards may vary by each country, Table UG 2.5-9 Uganda Potable
Water Specifications are listed below and can be compared to Table A 2.5-13 Global
Water Quality Standards. Most water quality standards are highly complex and
include many different contaminants and naturally occurring materials. Documenting
that a water source meets these criteria requires highly specialized and expensive
analytical capabilities that do not exist in most parts of Africa.
Laboratory services for water and wastewater quality testing are offered at the
following place. It should be noted that EMI has limited experience with the quality
and reliability of the services offered at the following laboratory.
The NWSC Central Laboratory
Plot No. M11/12, Old Port Bell Road
Wankoko, next to Bugolobi Sewage treatment plant
Tel: 0414315799
E-mail: [email protected]
Due to the complexity of water quality standards, and EMI’s limited analytical tests,
which only give a rough indictor of water safety, EMI is not capable of determining
if a given water system is safe to drink. EMI personnel should refrain from
stating that a water supply is safe based on the field tests performed. Even if the
tests performed did not identify a problem, the water could become contaminated
during storage or use, or parameters that were not tested could make the water unfit
for human consumption (a common example of this is fluoride, which is difficult to
analyze in the field but is a common contaminant of groundwater in Africa).
Comparison of water quality data with numeric standards of water quality can only
confirm that the water was safe at the point the sample was taken. Contamination
can occur at many points downstream of this point, which can make the water unsafe
to drink. Therefore, water testing at the source does not guarantee a supply that is
safe to drink. Be cautious in project reports when discussing the quality of a water
source.
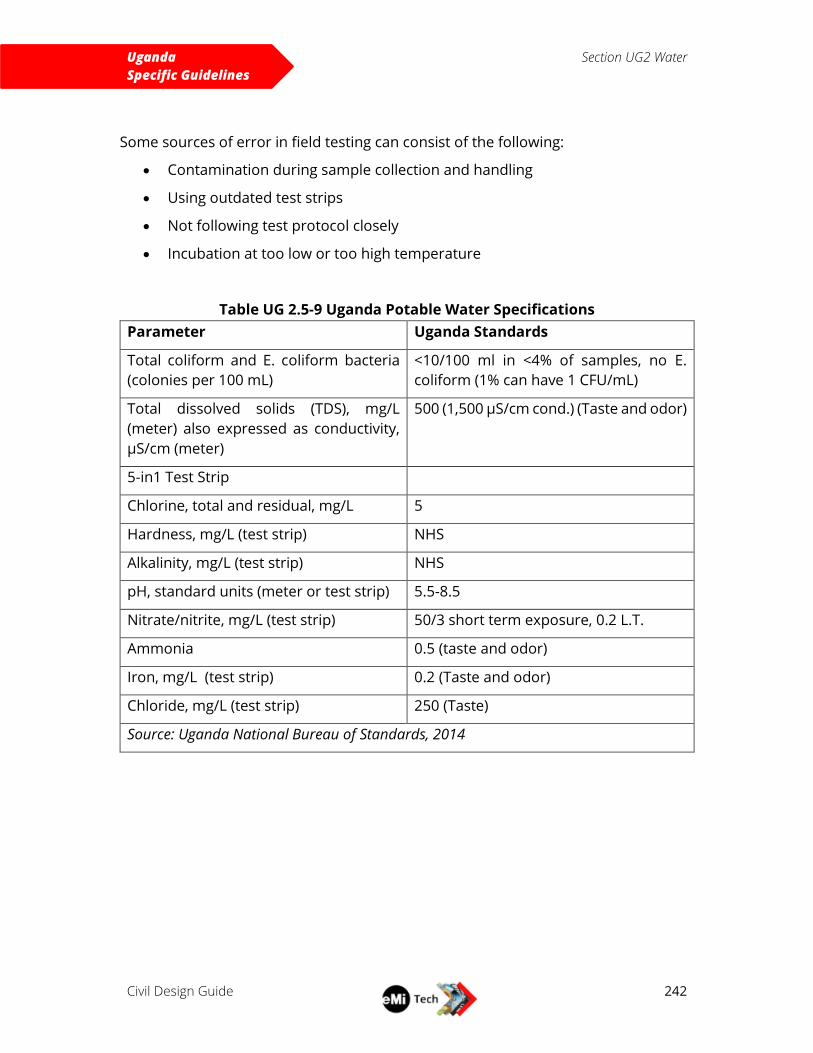
Uganda
Specific Guidelines
Section UG2 Water
Civil Design Guide
242
Some sources of error in field testing can consist of the following:
Contamination during sample collection and handling
Using outdated test strips
Not following test protocol closely
Incubation at too low or too high temperature
Table UG 2.5-9 Uganda Potable Water Specifications
Parameter Uganda Standards
Total coliform and E. coliform bacteria
(colonies per 100 mL)
<10/100 ml in <4% of samples, no E.
coliform (1% can have 1 CFU/mL)
Total dissolved solids (TDS), mg/L
(meter) also expressed as conductivity,
µS/cm (meter)
500 (1,500 µS/cm cond.) (Taste and odor)
5-in1 Test Strip
Chlorine, total and residual, mg/L 5
Hardness, mg/L (test strip) NHS
Alkalinity, mg/L (test strip) NHS
pH, standard units (meter or test strip) 5.5-8.5
Nitrate/nitrite, mg/L (test strip) 50/3 short term exposure, 0.2 L.T.
Ammonia 0.5 (taste and odor)
Iron, mg/L (test strip) 0.2 (Taste and odor)
Chloride, mg/L (test strip) 250 (Taste)
Source: Uganda National Bureau of Standards, 2014
Uganda
Specific Guidelines
Section UG2 Water
Civil Design Guide
243
WATER TREATMENT EMI does not typically design centralized or Point of Entry (POE) treatment systems,
but rather recommends point of use (POU) water treatment for drinking water. More
information can be found later in the document on POE systems and requirements
that need to be in place if this type of system is to be considered. EMI recommends
drinking water be treated regardless of whether or not the field testing indicated
contamination. See A2.6 Water Treatment for a list of complied water treatment
technologies.
Due to the unreliability of field test results, and the fact that EMI is not involved with
ongoing testing and monitoring programs for client ministries, drinking water should
be treated even if test results indicated no contamination.
Point of Entry or Centralized treatment plants are discouraged due to the complexity
of operation, availability of replacement parts, and high potential for contamination
if not properly operated or maintained. Some larger clients such as hospitals or
universities may require a Point of Entry treatment plant. In order to consider
designing point of entry treatment for a ministry, the minimum requirements would
be a robust maintenance program with personnel that have the required technical
knowledge, a treatment system design that includes components that can be sourced
locally in the event of repairs or replacements, a commitment to properly maintaining
and operating the system, and a commitment to ensuring regular and routine testing
to ensure treated water is meeting target standards. Some examples of centralized
treatment systems in East Africa include Uganda Christian University, Rift Valley
Academy, and Tenwek Hospital. A matrix of various treatment systems available,
such as EMI General Treatment Matrix Template is a good resource to create if
considering a Point of Entry system. If a POE system is considered, local suppliers
should be contacted and supplied with the relevant site specific water quality
information to provide options of treatment equipment available locally.
Uganda
Specific Guidelines
Section UG2 Water
Civil Design Guide
244
WATER STORAGE Storage tank design depends on the size and local availability of manufactured tanks.
Typically, manufactured plastic tanks are the preferred alternative in East Africa since
they have a long lifetime, are easy to install, and come in a large variety of sizes. Metal
tanks are also available, including corrugated steel, welded steel, bolted steel
segment tanks, and stainless steel. Manufactured tanks come in standard sizes that
range from 500 to over 10,000L. Tanks over 10,000L are difficult to transport and
install. EMI has used tanks greater than 10,000 L on a few projects and had quality
problems with the tanks cracking due to the heavy load of large volumes of water.
Multiple tanks give more flexibility for repair and replacement than fewer larger tanks
sized over 10,000 L. Thus if more than 10,000 L storage volume is needed, a tank farm
consisting of multiple tanks plumbed in parallel is needed, or alternate tank material
should be investigated. Ferro cement tanks built on ground are also an option for
large sites that have an adequate elevation change. Other options available locally
could also be investigated.
Project phasing can be accommodated by estimating storage requirements for each
phase and adding additional tanks to the tank farm as additional stages are
implemented. If a stand is required, it may be most cost effective to build a single
stand large enough to accommodate the number and size of storage tanks needed
at full build-out. Storage tank support structures, whether ground-level concrete pads
or elevated towers are a responsibility of the EMI Structural department.
Ensuring an adequate water supply during long-term periods of decreased water
availability, such as a spring or surface water supply that dries up during dry season,
cannot normally be achieved by using manufactured water storage tanks due to the
large volume of water storage needed. A better approach for such a situation may be
to find a secondary source for use during dry weather, such as a drilled borehole.
Alternately, special large capacity storage systems, such as large built-in-place tanks,
open water reservoirs or ponds, or sand dams, may be needed. These are not
common in East Africa and are not dealt with in the design manual.
Information on water storage tanks available in Uganda along with standard sizing
for Crestank and Kentank are available in R2.7 Water Storage.
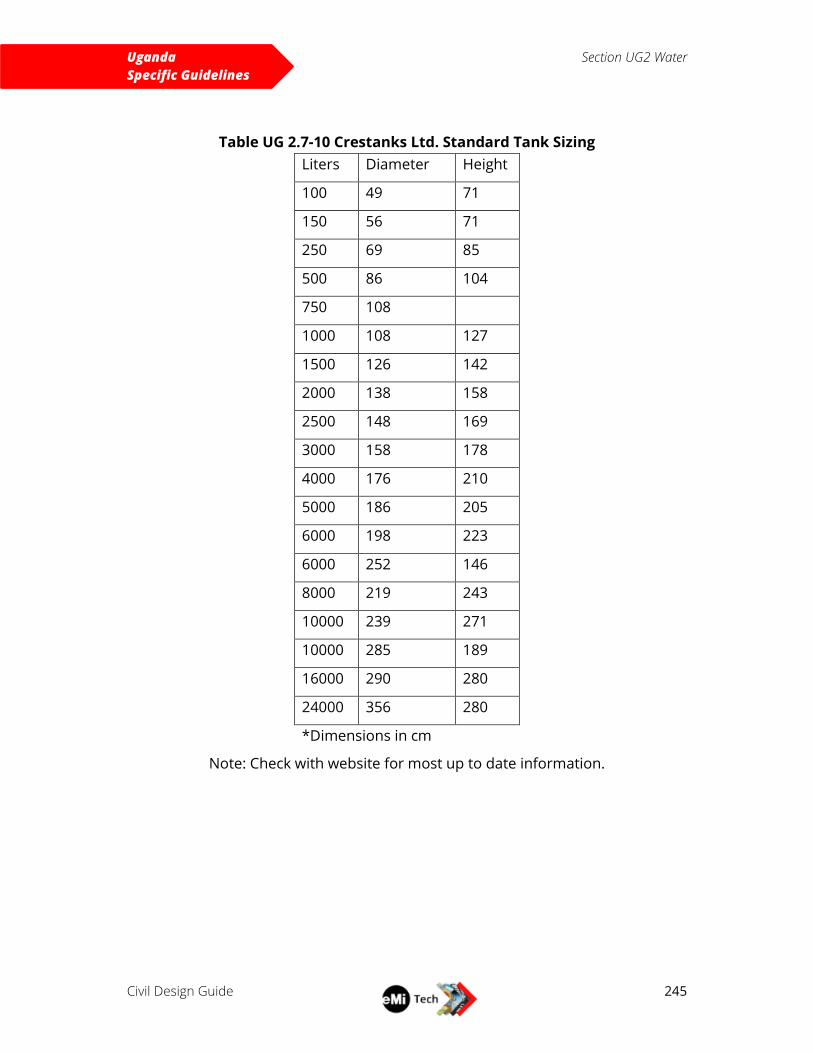
Uganda
Specific Guidelines
Section UG2 Water
Civil Design Guide
245
Table UG 2.7-10 Crestanks Ltd. Standard Tank Sizing
Liters Diameter Height
100 49 71
150 56 71
250 69 85
500 86 104
750 108
1000 108 127
1500 126 142
2000 138 158
2500 148 169
3000 158 178
4000 176 210
5000 186 205
6000 198 223
6000 252 146
8000 219 243
10000 239 271
10000 285 189
16000 290 280
24000 356 280
*Dimensions in cm
Note: Check with website for most up to date information.

Uganda
Specific Guidelines
Section UG2 Water
Civil Design Guide
246
WATER DISTRIBUTION No deviation from Global Guide section 2.8 Water Distribution.
PUMP SELECTION No deviation from Global Guide section 2.9 Pump Selection.
Uganda
Specific Guidelines
Section UG3 Geotechnical
Civil Design Guide
247
UG3 GEOTECHNICAL
SOIL CLASSIFICATION The use of soil properties to select allowable infiltration rates requires a careful
assessment of soil texture, structure, and color. Texture is usually determined in the
field using a manual test (feel test) developed by USDA. This test uses an estimate of
the relative proportions of sand, silt, and clay to identify soil texture. This is done by
manual manipulation of soil sample as explained in the USDA guide (A3.1.1 Test
Procedures Manual Tests). The soil types area depicted in the USDA Soil Triangle,
Figure A 3.1-21 Classification Pyramid. Figure A 3.1-30 Guide to Texture by Feel
contains a flow chart for this field analysis. Laboratory classification of soil samples
using standard analytical methods is more accurate, but such services are often not
available in many project areas.
In addition to soil texture, the macro-structure of the soil layers under the absorption
system has an effect on infiltration rates. Soil structure describes how individual soil
particles are assembled into peds, or clods. Undisturbed soil will often form
observable structures that can be seen in the walls of a test pit. The structure is
classified as platy (flat, plate-like structure), single grain (soil grains not connected to
other grains), columnar (peds in relatively long cylindrical, vertical structures), blocky
(peds with random shape and orientation), massive (no discernable structure), or
granular (single grains connected to other grains forming what appears to be larger
particles resembling single grains). Appendix A3.1.2 discusses the features of each
type of soil structure. In most cases, soil with a platy or massive structure is
considered not suitable for an absorption system since these structures interfere with
water movement through the soil. Is many cases in East Africa, soil with a high clay
content can form a granular structure which allows water to flow through at a much
faster rate than if the clay soil was not structured in this way, thus soil texture alone
can be misleading.
Consistence is a term that described how tightly the soil grains are bonded together
into the peds. A strong structure, such as dried clay, is difficult to break apart while a
weak structure, such as sand, comes apart easily.

Uganda
Specific Guidelines
Section UG3 Geotechnical
Civil Design Guide
248
SOIL BEARING CAPACITY No deviation from Global Guide section 3.2 Bearing Capacity.
Uganda
Specific Guidelines
Section UG3 Geotechnical
Civil Design Guide
249
SOIL ABSORPTION CAPACITY Suitable Site Hydrogeology
A suitable location for an absorption system must meet several criteria. Criteria
include no standing water or potential for flooding, not in the path of rainwater runoff
flow, no vehicular traffic, access for desludging, and adequate reserve space for a
replacement field. Avoid previously disturbed area or fill material. The most
important criteria, however, is the suitability of the subsurface soils.
An important concept with absorption stems in the limiting layer. The limiting layer is
the point at which wastewater treatment stops as the groundwater moved vertically
though the soil column. This can consist of a layer of bedrock, hardpan (a
mechanically compacted or chemically bound impervious soil layer), or clay soils that
stope vertical movement, or it can consist of a layer of coarse sand or fractured rock
that will transport wastewater quickly to groundwater, with little additional treatment.
It can also consist of the groundwater surface itself. The depth of suitable soil above
the limiting layer must be sufficient to treat the wastewater to level acceptable for
discharge to groundwater. This depth is typically set as 1-2m.
For the successful use for an absorption system, the subsurface conditions between
the bottom of the infiltration system and the limiting layer must allow for the
underground movement of treated wastewater away from the site at a rate greater
than the application rate of wastewater. If this condition is not met, wastewater will
accumulate under the absorption system and eventually creating a groundwater
mound and appearing at the surface, signaling failure of the system. Since soil
properties are so critical, an attempt should be made to characterize the soil and
groundwater depth as deep as possible under the site. Ideally this would be done
using drilling equipment, however, on most EMI project trips this kind of equipment
is not available.
Soil properties that effect water movement can be measured in a laboratory (using
the saturate hydraulic conductivity test) or estimated in the field using the percolation
test. The laboratory method requires the collection of undisturbed soil core samples
and the availability of a geotechnical laboratory, neither of which are possible at most
EMI project sites. The percolation test can approximate the hydraulic properties of in-
situ soil. The acceptable range of percolation test results is greater than 1min/25mm
to less than 60min/25mm (some agencies allow up to 120min/25mm). A site is not
suitable for absorption systems if the upper 1-2m of subsurface soil has a percolation
rate greater than 60/25mm or if there is a significant layer of expansive clay or other
impervious soil within 1-2m below the bottom of the absorption system. If the
percolation rate is less than 1 min/25mm, or fractured or fissured rock or coarse sand
and gravel are present, the wastewater infiltrates too fast may not be adequately
treated before it encounters groundwater or surface water, and is therefore
unsuitable. If it is not possible to perform a percolation test in accordance with the
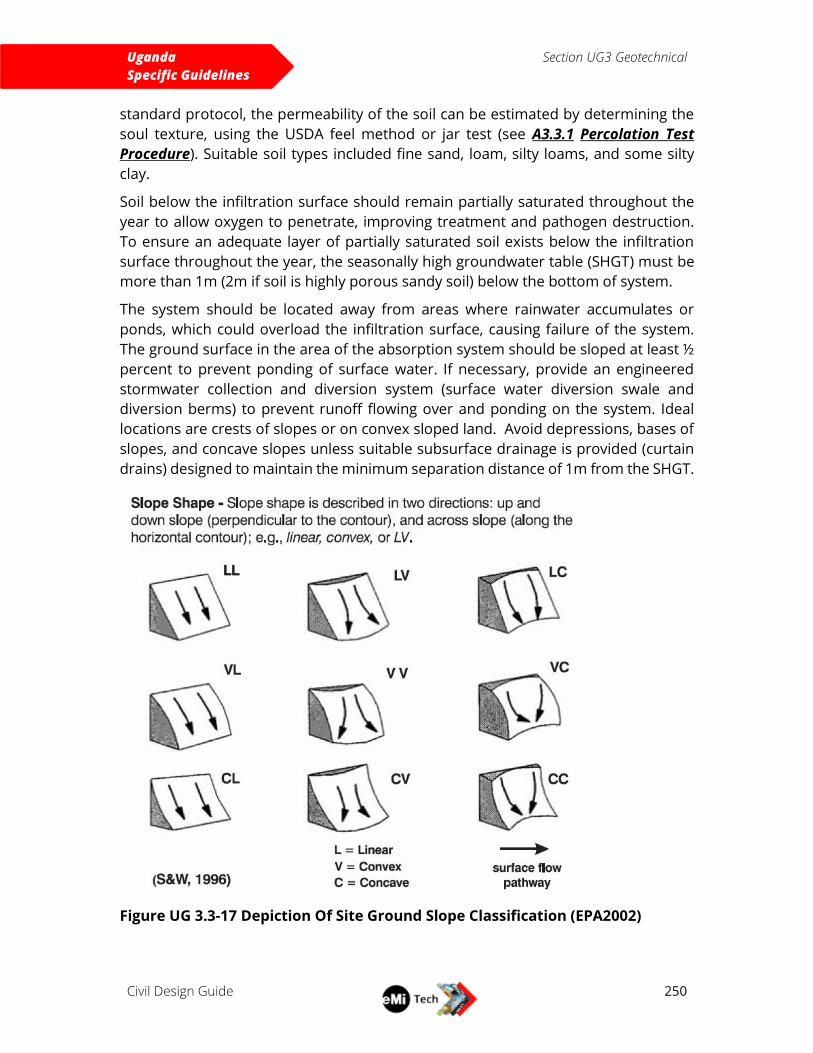
Uganda
Specific Guidelines
Section UG3 Geotechnical
Civil Design Guide
250
standard protocol, the permeability of the soil can be estimated by determining the
soul texture, using the USDA feel method or jar test (see A3.3.1 Percolation Test
Procedure). Suitable soil types included fine sand, loam, silty loams, and some silty
clay.
Soil below the infiltration surface should remain partially saturated throughout the
year to allow oxygen to penetrate, improving treatment and pathogen destruction.
To ensure an adequate layer of partially saturated soil exists below the infiltration
surface throughout the year, the seasonally high groundwater table (SHGT) must be
more than 1m (2m if soil is highly porous sandy soil) below the bottom of system.
The system should be located away from areas where rainwater accumulates or
ponds, which could overload the infiltration surface, causing failure of the system.
The ground surface in the area of the absorption system should be sloped at least ½
percent to prevent ponding of surface water. If necessary, provide an engineered
stormwater collection and diversion system (surface water diversion swale and
diversion berms) to prevent runoff flowing over and ponding on the system. Ideal
locations are crests of slopes or on convex sloped land. Avoid depressions, bases of
slopes, and concave slopes unless suitable subsurface drainage is provided (curtain
drains) designed to maintain the minimum separation distance of 1m from the SHGT.
Figure UG 3.3-17 Depiction Of Site Ground Slope Classification (EPA2002)
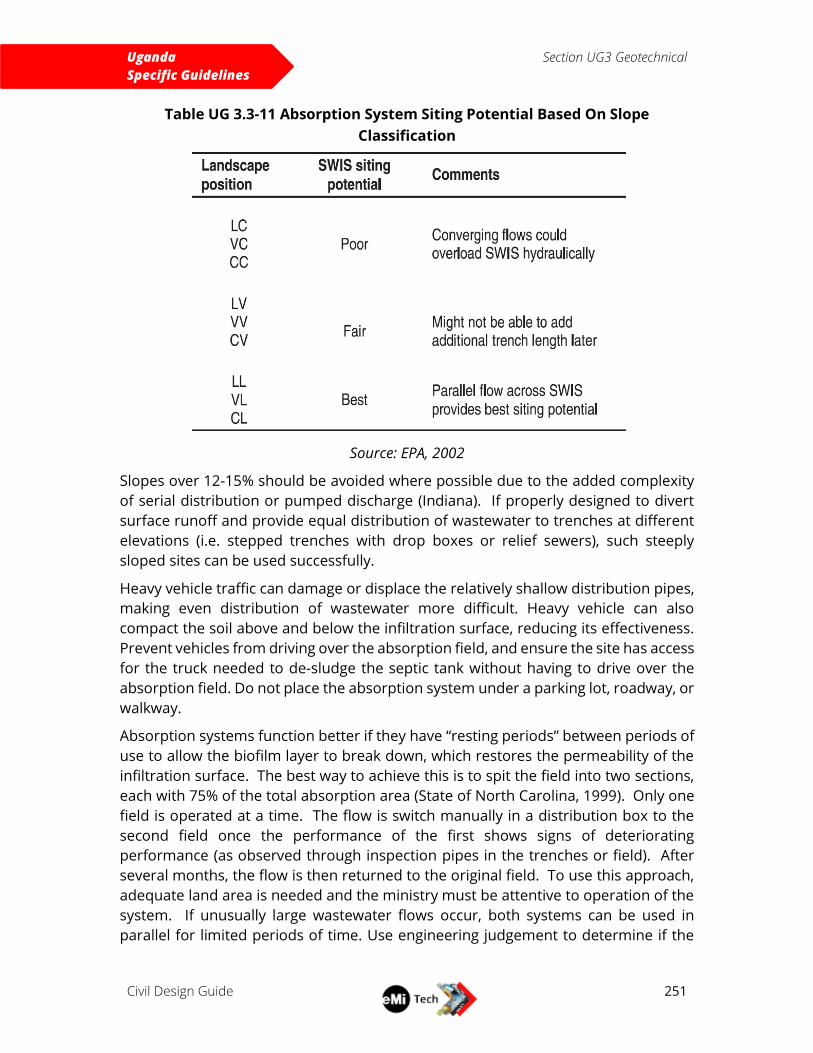
Uganda
Specific Guidelines
Section UG3 Geotechnical
Civil Design Guide
251
Table UG 3.3-11 Absorption System Siting Potential Based On Slope
Classification
Source: EPA, 2002
Slopes over 12-15% should be avoided where possible due to the added complexity
of serial distribution or pumped discharge (Indiana). If properly designed to divert
surface runoff and provide equal distribution of wastewater to trenches at different
elevations (i.e. stepped trenches with drop boxes or relief sewers), such steeply
sloped sites can be used successfully.
Heavy vehicle traffic can damage or displace the relatively shallow distribution pipes,
making even distribution of wastewater more difficult. Heavy vehicle can also
compact the soil above and below the infiltration surface, reducing its effectiveness.
Prevent vehicles from driving over the absorption field, and ensure the site has access
for the truck needed to de-sludge the septic tank without having to drive over the
absorption field. Do not place the absorption system under a parking lot, roadway, or
walkway.
Absorption systems function better if they have “resting periods” between periods of
use to allow the biofilm layer to break down, which restores the permeability of the
infiltration surface. The best way to achieve this is to spit the field into two sections,
each with 75% of the total absorption area (State of North Carolina, 1999). Only one
field is operated at a time. The flow is switch manually in a distribution box to the
second field once the performance of the first shows signs of deteriorating
performance (as observed through inspection pipes in the trenches or field). After
several months, the flow is then returned to the original field. To use this approach,
adequate land area is needed and the ministry must be attentive to operation of the
system. If unusually large wastewater flows occur, both systems can be used in
parallel for limited periods of time. Use engineering judgement to determine if the
Uganda
Specific Guidelines
Section UG3 Geotechnical
Civil Design Guide
252
added cost and complexity of such a system is worth extending the life of the
absorption field.
All absorption systems will eventually fail due to irreversible plugging of the
infiltrating surface due to plugging with inorganic materials or chemical reactions with
the soil, reducing its permeability. Prudent planning dictates that an area of the site
large enough, and in a suitable location (suitable elevation, adequate stormwater
drainage, subsurface conditions, and in compliance with separation distances),
should be identified on the site maps. This area should be and protected so no
excavation, construction, or heavy vehicle traffic is allowed.
Selecting Infiltration Area
The selection of a site for an absorption system and determination of the infiltration
area needed for that system is based on three pieces of information 1) a general
assessment of site characteristics that can impact the effectiveness of an absorption
system, based on the projected site configuration of proposed new structures and
infrastructure, 2) the determination of soil characteristics below the intended
absorption system location, and 3) direct measurement of the percolation rate of the
soil below the intended absorption system. It is possible to design a system using
either the soil classification approach or percolation tests by themselves, but using
both sources of information will yield the most effective design.
Once this information is gathered, the maximum allowable wastewater application
rate is determined by consulting published tables that relate site conditions to the
allowable wastewater application rate (USEPA, 1980 and USEPA, 2002). The chosen
design wastewater application rate for each site is then used to size the absorption
system by dividing the design flow rate by the application rate, giving a required
infiltration surface area. Ensure the absorption system is designed conservatively by
applying suitable safety factors to either the design flow or the application rate, but
not both. For either a trench or field system, this area represents the surface area of
the bottom of the trenches or excavation under the distribution system; Sidewall area
is not included. For mounds on flat ground, it represents the area below the porous
fill or sand that comprises the mound. For mounds built on a slope, the infiltration
area includes only the area under the distribution system and the sloped fill area
downhill of the distribution system. For seepage pits, the infiltration area is the
vertical side wall area below the inlet pipe and above the bottom of the pit; the pit
bottom area is not included.
Site Investigation
The site investigation will assess multiple aspects of a site to determine the suitability
of the site for on-site wastewater treatment. These aspects include existing site
slopes; presence of existing water supply sources (wells, springs, pipelines, etc.);
existing on-site or nearby structures; and natural features such as rock outcrops,
streams, wetlands, and vegetation; and stormwater drainage patterns and discharge
Uganda
Specific Guidelines
Section UG3 Geotechnical
Civil Design Guide
253
points. The general properties of subsurface soil are ideally determined by digging
test pits up to 2m deep and noting any changes in soil type or color, presence of rock
or clay layers, or the presence of groundwater. These test pits are different from the
percolation test holes mentioned below. It is also an opportunity to measure
structural properties of the soil such as bearing capacity using dynamic cone
penetrometers, or pocket penetrometer.
Based on the information developed by this investigation, and working in conjunction
with the rest of the design team, identify tentative locations for all absorption systems
needed at the site. Also identify tentative locations for any new wells, spring capture
devices, storage tanks, major water pipelines and roadways. Each absorption system
site should be assessed using one, and preferably both of the soil classification and
percolation tests. The depth to the seasonally high groundwater table should also be
estimated at each location. If the soil and groundwater conditions appear to be
uniform in composition and the site contours are relatively flat and not complex, it
may be possible to use test results from one location for the design of multiple
absorption systems.
Percolation Test Method
The percolation test is intended to provide a direct measurement of the ability of a
given soil stratum to absorb wastewater. A3.3.1 Percolation Test Procedure contains
a more detailed discussion of percolation testing. It is performed by digging a hole to
the intended depth of the absorption system, filling the hole with water to a
prescribed depth, and measuring the rate at which water is absorbed into the soil.
The percolation rate is usually given in units of minutes/25mm (or minutes/inch), the
time it takes for the water surface in the hole to drop 25mm. There is no standard
percolation test method and various procedures are used by different agencies. The
results of the test are highly dependent on several of the test conditions, including
the depth of water in the hole, the diameter of the hole, how the hole is prepared,
and the saturation time allowed before the test is run. Therefore, the percolation test
should be considered a qualitative parameter rather than a definitive measurement
of soil properties. In addition, the rate of absorption of wastewater into soil is not
determined solely by soil properties, but also by the presence of a biofilm layer on
the upper part of the soil directly below the infiltration surface (retarding layer). The
characteristics of this layer depend on properties of the wastewater, the method of
dosing wastewater to the surface, and soil properties.
As far back as 1929, the USEPA, and other regulatory bodies, have been developing
empirical relationships between percolation rates and allowable wastewater
infiltration rates that accounts for the effects of the biofilm retarding layer as well as
soil type. To most accurately use these relationships, the percolation test method
used to develop the percolation rates used should be followed. The use of any other
percolation test method makes the empirical relationship inaccurate. In addition,
none of these empirical relationships have been generated on tropical soils common
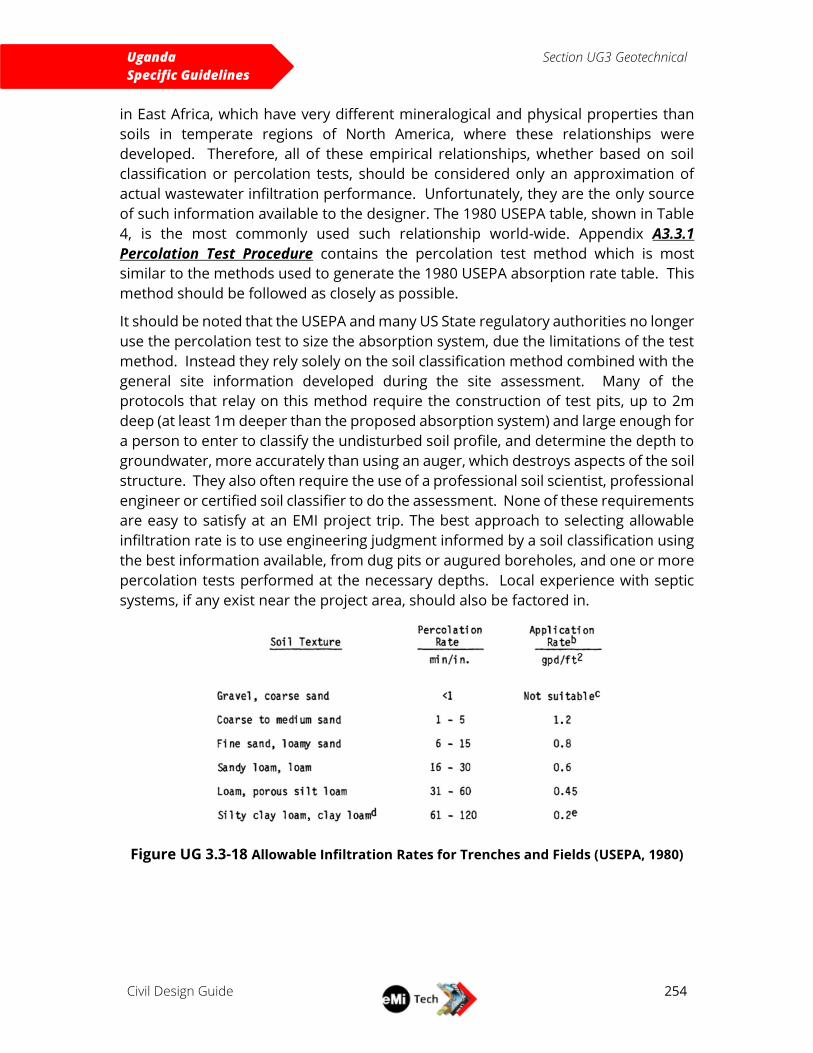
Uganda
Specific Guidelines
Section UG3 Geotechnical
Civil Design Guide
254
in East Africa, which have very different mineralogical and physical properties than
soils in temperate regions of North America, where these relationships were
developed. Therefore, all of these empirical relationships, whether based on soil
classification or percolation tests, should be considered only an approximation of
actual wastewater infiltration performance. Unfortunately, they are the only source
of such information available to the designer. The 1980 USEPA table, shown in Table
4, is the most commonly used such relationship world-wide. Appendix A3.3.1
Percolation Test Procedure contains the percolation test method which is most
similar to the methods used to generate the 1980 USEPA absorption rate table. This
method should be followed as closely as possible.
It should be noted that the USEPA and many US State regulatory authorities no longer
use the percolation test to size the absorption system, due the limitations of the test
method. Instead they rely solely on the soil classification method combined with the
general site information developed during the site assessment. Many of the
protocols that relay on this method require the construction of test pits, up to 2m
deep (at least 1m deeper than the proposed absorption system) and large enough for
a person to enter to classify the undisturbed soil profile, and determine the depth to
groundwater, more accurately than using an auger, which destroys aspects of the soil
structure. They also often require the use of a professional soil scientist, professional
engineer or certified soil classifier to do the assessment. None of these requirements
are easy to satisfy at an EMI project trip. The best approach to selecting allowable
infiltration rate is to use engineering judgment informed by a soil classification using
the best information available, from dug pits or augured boreholes, and one or more
percolation tests performed at the necessary depths. Local experience with septic
systems, if any exist near the project area, should also be factored in.
Figure UG 3.3-18 Allowable Infiltration Rates for Trenches and Fields (USEPA, 1980)

Uganda
Specific Guidelines
Section UG4 Wastewater
Civil Design Guide
255
UG4 WASTEWATER
WASTEWATER COMPOSITION AND QUANTITY No deviation from Global Guide section 4.1 Wastewater Composition and Quantity.
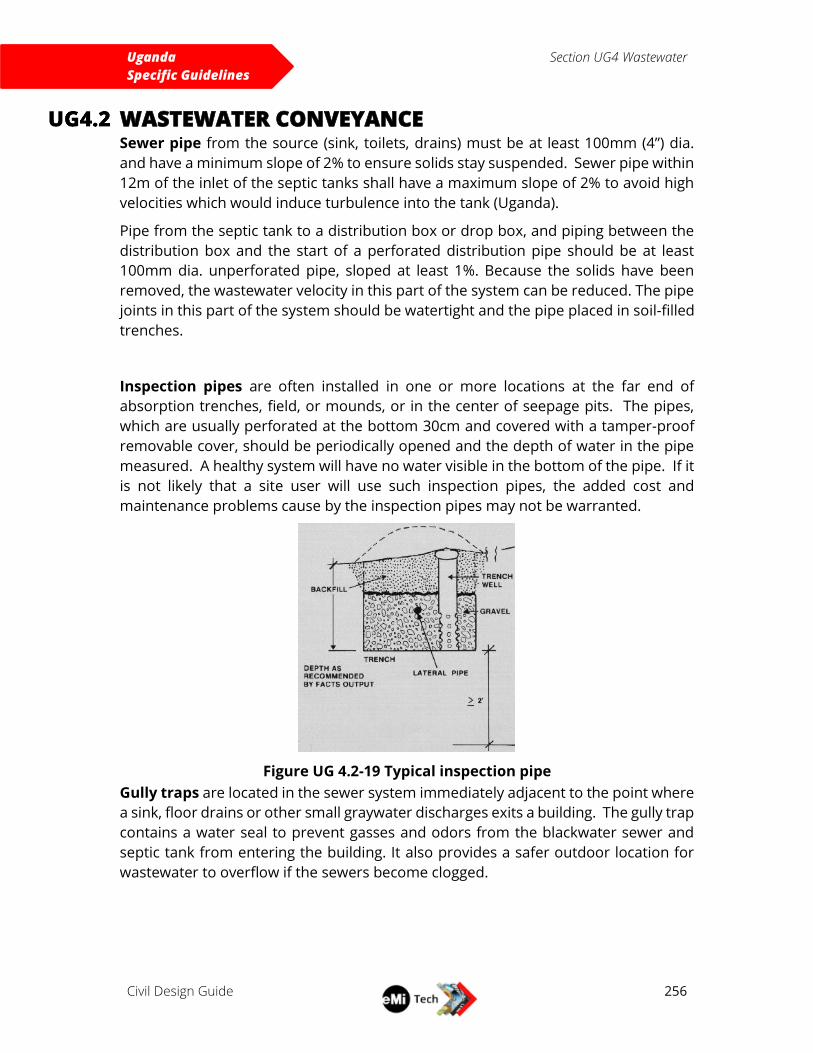
Uganda
Specific Guidelines
Section UG4 Wastewater
Civil Design Guide
256
WASTEWATER CONVEYANCE Sewer pipe from the source (sink, toilets, drains) must be at least 100mm (4”) dia.
and have a minimum slope of 2% to ensure solids stay suspended. Sewer pipe within
12m of the inlet of the septic tanks shall have a maximum slope of 2% to avoid high
velocities which would induce turbulence into the tank (Uganda).
Pipe from the septic tank to a distribution box or drop box, and piping between the
distribution box and the start of a perforated distribution pipe should be at least
100mm dia. unperforated pipe, sloped at least 1%. Because the solids have been
removed, the wastewater velocity in this part of the system can be reduced. The pipe
joints in this part of the system should be watertight and the pipe placed in soil-filled
trenches.
Inspection pipes are often installed in one or more locations at the far end of
absorption trenches, field, or mounds, or in the center of seepage pits. The pipes,
which are usually perforated at the bottom 30cm and covered with a tamper-proof
removable cover, should be periodically opened and the depth of water in the pipe
measured. A healthy system will have no water visible in the bottom of the pipe. If it
is not likely that a site user will use such inspection pipes, the added cost and
maintenance problems cause by the inspection pipes may not be warranted.
Figure UG 4.2-19 Typical inspection pipe
Gully traps are located in the sewer system immediately adjacent to the point where
a sink, floor drains or other small graywater discharges exits a building. The gully trap
contains a water seal to prevent gasses and odors from the blackwater sewer and
septic tank from entering the building. It also provides a safer outdoor location for
wastewater to overflow if the sewers become clogged.
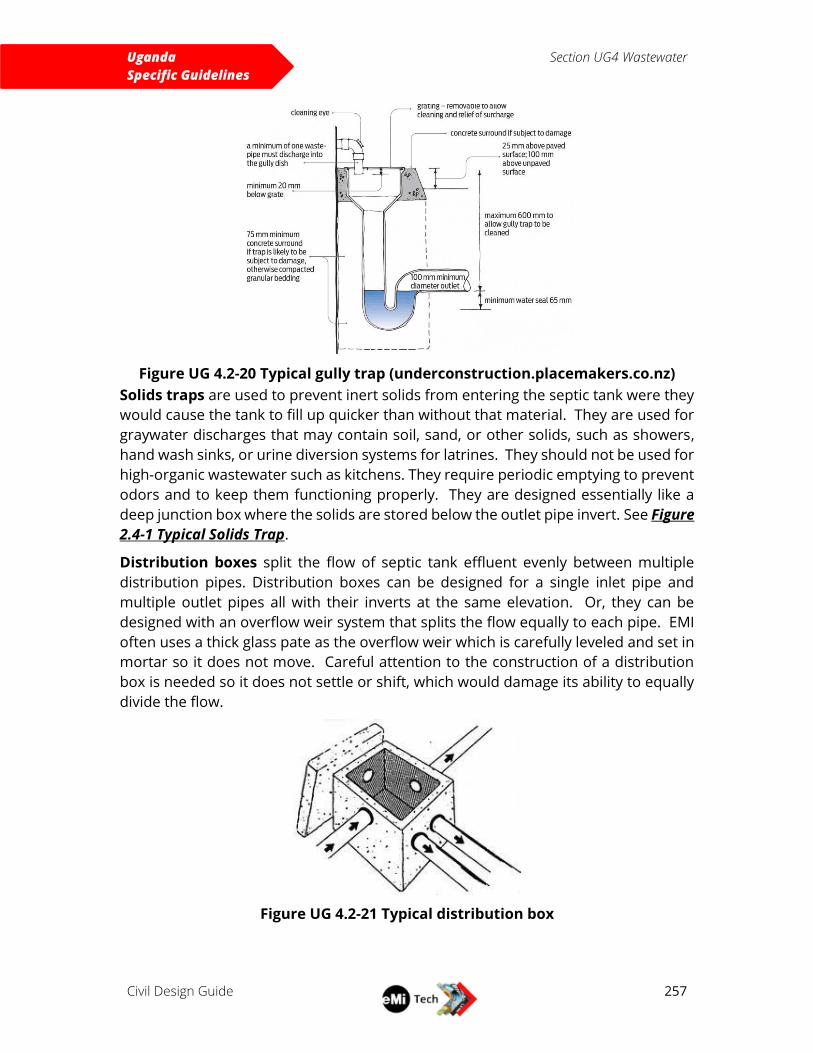
Uganda
Specific Guidelines
Section UG4 Wastewater
Civil Design Guide
257
Figure UG 4.2-20 Typical gully trap (underconstruction.placemakers.co.nz)
Solids traps are used to prevent inert solids from entering the septic tank were they
would cause the tank to fill up quicker than without that material. They are used for
graywater discharges that may contain soil, sand, or other solids, such as showers,
hand wash sinks, or urine diversion systems for latrines. They should not be used for
high-organic wastewater such as kitchens. They require periodic emptying to prevent
odors and to keep them functioning properly. They are designed essentially like a
deep junction box where the solids are stored below the outlet pipe invert. See Figure
2.4-1 Typical Solids Trap.
Distribution boxes split the flow of septic tank effluent evenly between multiple
distribution pipes. Distribution boxes can be designed for a single inlet pipe and
multiple outlet pipes all with their inverts at the same elevation. Or, they can be
designed with an overflow weir system that splits the flow equally to each pipe. EMI
often uses a thick glass pate as the overflow weir which is carefully leveled and set in
mortar so it does not move. Careful attention to the construction of a distribution
box is needed so it does not settle or shift, which would damage its ability to equally
divide the flow.
Figure UG 4.2-21 Typical distribution box

Uganda
Specific Guidelines
Section UG4 Wastewater
Civil Design Guide
258
Junction boxes are used in sewer system at all intersections where multiple pipes
come together and for long straight lengths of pipe to allow for inspection and
cleaning of the sewer. They are also used at pipe grade changes. There should be at
least a 30mm drop in elevation between the inlet an outlet pipe inverts. Gravity
sewers should run straight and at a uniform slope between junction boxes to allow
for cleaning. See Figure 4.2-1 Example of a Junction Box Where Pipes Intersect.
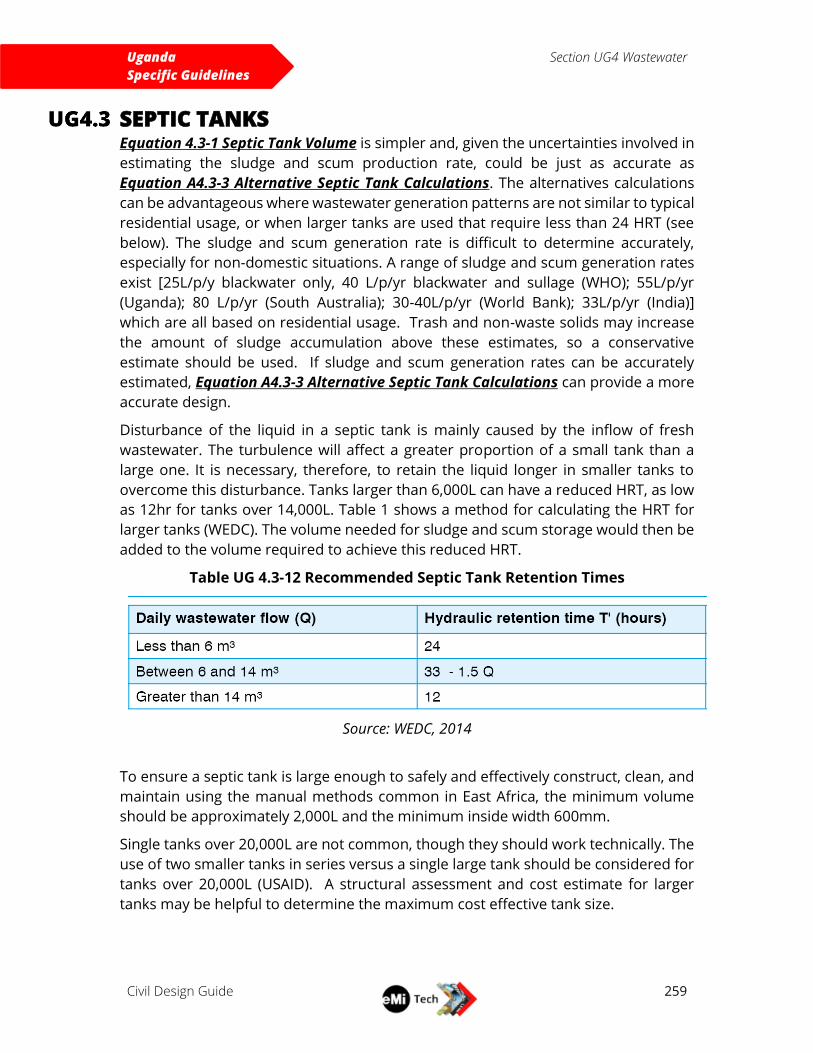
Uganda
Specific Guidelines
Section UG4 Wastewater
Civil Design Guide
259
SEPTIC TANKS Equation 4.3-1 Septic Tank Volume is simpler and, given the uncertainties involved in
estimating the sludge and scum production rate, could be just as accurate as
Equation A4.3-3 Alternative Septic Tank Calculations. The alternatives calculations
can be advantageous where wastewater generation patterns are not similar to typical
residential usage, or when larger tanks are used that require less than 24 HRT (see
below). The sludge and scum generation rate is difficult to determine accurately,
especially for non-domestic situations. A range of sludge and scum generation rates
exist [25L/p/y blackwater only, 40 L/p/yr blackwater and sullage (WHO); 55L/p/yr
(Uganda); 80 L/p/yr (South Australia); 30-40L/p/yr (World Bank); 33L/p/yr (India)]
which are all based on residential usage. Trash and non-waste solids may increase
the amount of sludge accumulation above these estimates, so a conservative
estimate should be used. If sludge and scum generation rates can be accurately
estimated, Equation A4.3-3 Alternative Septic Tank Calculations can provide a more
accurate design.
Disturbance of the liquid in a septic tank is mainly caused by the inflow of fresh
wastewater. The turbulence will affect a greater proportion of a small tank than a
large one. It is necessary, therefore, to retain the liquid longer in smaller tanks to
overcome this disturbance. Tanks larger than 6,000L can have a reduced HRT, as low
as 12hr for tanks over 14,000L. Table 1 shows a method for calculating the HRT for
larger tanks (WEDC). The volume needed for sludge and scum storage would then be
added to the volume required to achieve this reduced HRT.
Table UG 4.3-12 Recommended Septic Tank Retention Times
Source: WEDC, 2014
To ensure a septic tank is large enough to safely and effectively construct, clean, and
maintain using the manual methods common in East Africa, the minimum volume
should be approximately 2,000L and the minimum inside width 600mm.
Single tanks over 20,000L are not common, though they should work technically. The
use of two smaller tanks in series versus a single large tank should be considered for
tanks over 20,000L (USAID). A structural assessment and cost estimate for larger
tanks may be helpful to determine the maximum cost effective tank size.

Uganda
Specific Guidelines
Section UG4 Wastewater
Civil Design Guide
260
Ventilation is needed to release any gasses and odors produced by a septic tank
where they will not be a hazard. Septic tanks are usually vented to the atmosphere
through the nearest building’s plumbing vent stack. Should there be no nearby
buildings with a suitable vent stack, or if there is a possibility the sewer pipe will not
have a continuously open portion all the way to the vent stack, a separate 4” vent pipe
may be installed into the lid of the septic tank, terminating at least 2m above ground
with a screened cap.

Uganda
Specific Guidelines
Section UG4 Wastewater
Civil Design Guide
261
GREASE INCEPTOR Grease interceptors (grease traps) are used on wastewater from grease-producing
sources such as kitchens, dish cleaning stations, or automotive shops. They are
essentially small septic tanks designed to provide 20-30 minutes of hydraulic
retention time for the wastewater at the maximum expected instantaneous flow rate.
The short retention time allows floating grease and oil to separate without allowing
sludge to accumulate. The interior is fitted with inlet and outlet baffles and an
intermediate dividing wall similar to a septic tank. They are usually placed as close as
possible to the source of the oil and grease to minimize creating an oil-in-water
dispersion which is difficult to separate.
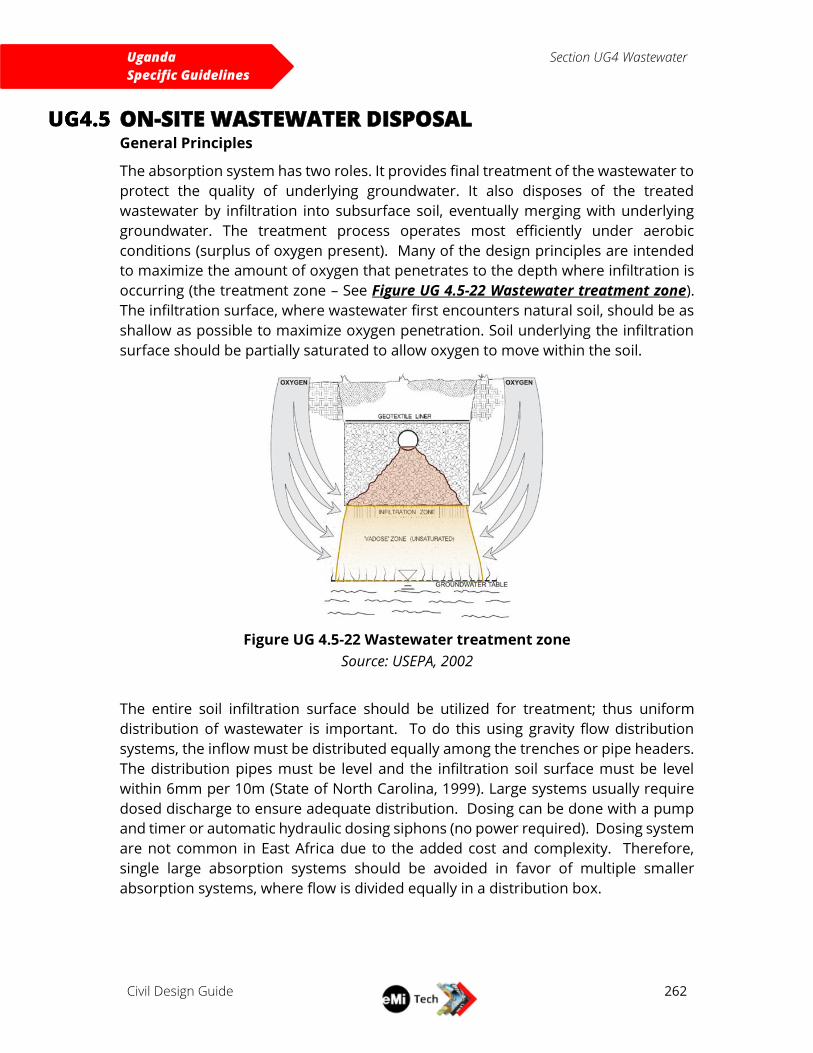
Uganda
Specific Guidelines
Section UG4 Wastewater
Civil Design Guide
262
ON-SITE WASTEWATER DISPOSAL General Principles
The absorption system has two roles. It provides final treatment of the wastewater to
protect the quality of underlying groundwater. It also disposes of the treated
wastewater by infiltration into subsurface soil, eventually merging with underlying
groundwater. The treatment process operates most efficiently under aerobic
conditions (surplus of oxygen present). Many of the design principles are intended
to maximize the amount of oxygen that penetrates to the depth where infiltration is
occurring (the treatment zone – See Figure UG 4.5-22 Wastewater treatment zone).
The infiltration surface, where wastewater first encounters natural soil, should be as
shallow as possible to maximize oxygen penetration. Soil underlying the infiltration
surface should be partially saturated to allow oxygen to move within the soil.
Figure UG 4.5-22 Wastewater treatment zone
Source: USEPA, 2002
The entire soil infiltration surface should be utilized for treatment; thus uniform
distribution of wastewater is important. To do this using gravity flow distribution
systems, the inflow must be distributed equally among the trenches or pipe headers.
The distribution pipes must be level and the infiltration soil surface must be level
within 6mm per 10m (State of North Carolina, 1999). Large systems usually require
dosed discharge to ensure adequate distribution. Dosing can be done with a pump
and timer or automatic hydraulic dosing siphons (no power required). Dosing system
are not common in East Africa due to the added cost and complexity. Therefore,
single large absorption systems should be avoided in favor of multiple smaller
absorption systems, where flow is divided equally in a distribution box.
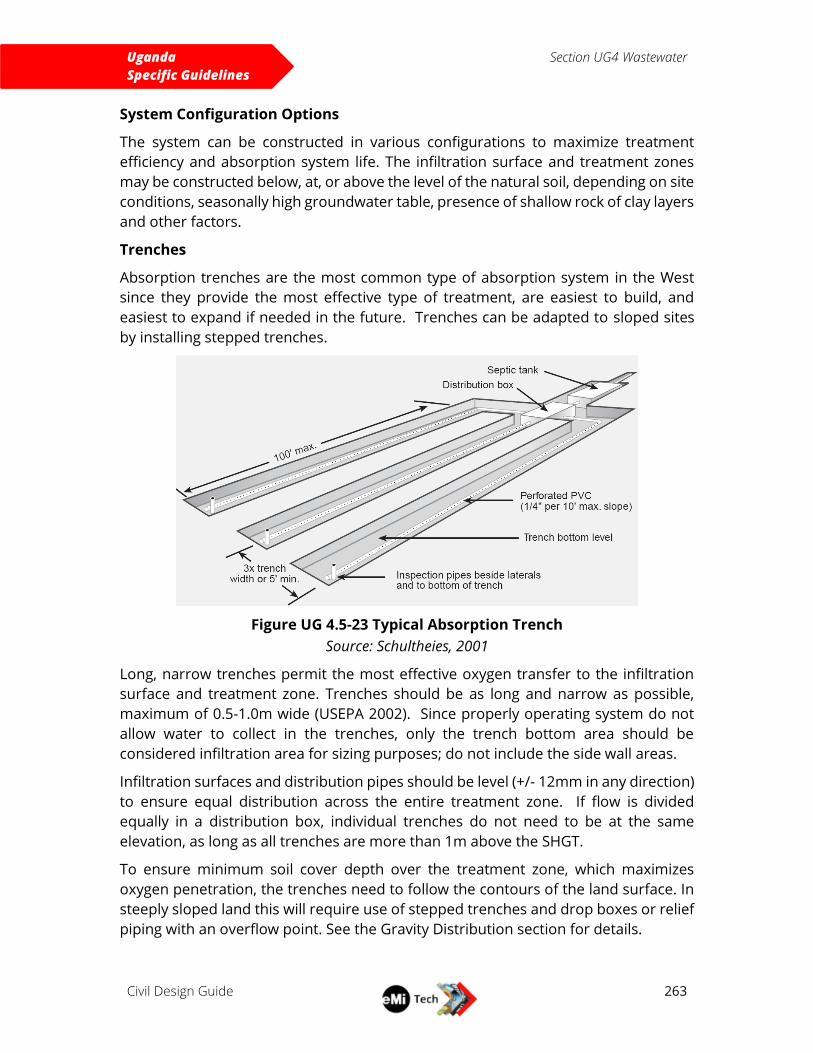
Uganda
Specific Guidelines
Section UG4 Wastewater
Civil Design Guide
263
System Configuration Options
The system can be constructed in various configurations to maximize treatment
efficiency and absorption system life. The infiltration surface and treatment zones
may be constructed below, at, or above the level of the natural soil, depending on site
conditions, seasonally high groundwater table, presence of shallow rock of clay layers
and other factors.
Trenches
Absorption trenches are the most common type of absorption system in the West
since they provide the most effective type of treatment, are easiest to build, and
easiest to expand if needed in the future. Trenches can be adapted to sloped sites
by installing stepped trenches.
Figure UG 4.5-23 Typical Absorption Trench
Source: Schultheies, 2001
Long, narrow trenches permit the most effective oxygen transfer to the infiltration
surface and treatment zone. Trenches should be as long and narrow as possible,
maximum of 0.5-1.0m wide (USEPA 2002). Since properly operating system do not
allow water to collect in the trenches, only the trench bottom area should be
considered infiltration area for sizing purposes; do not include the side wall areas.
Infiltration surfaces and distribution pipes should be level (+/- 12mm in any direction)
to ensure equal distribution across the entire treatment zone. If flow is divided
equally in a distribution box, individual trenches do not need to be at the same
elevation, as long as all trenches are more than 1m above the SHGT.
To ensure minimum soil cover depth over the treatment zone, which maximizes
oxygen penetration, the trenches need to follow the contours of the land surface. In
steeply sloped land this will require use of stepped trenches and drop boxes or relief
piping with an overflow point. See the Gravity Distribution section for details.
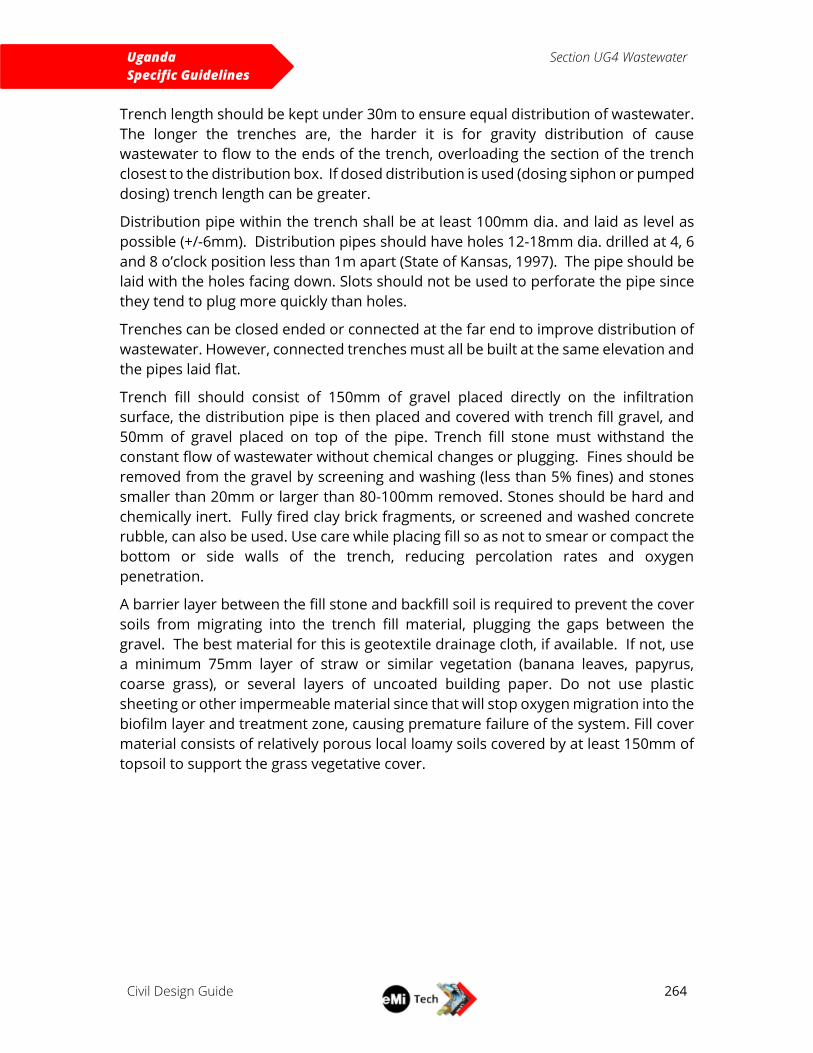
Uganda
Specific Guidelines
Section UG4 Wastewater
Civil Design Guide
264
Trench length should be kept under 30m to ensure equal distribution of wastewater.
The longer the trenches are, the harder it is for gravity distribution of cause
wastewater to flow to the ends of the trench, overloading the section of the trench
closest to the distribution box. If dosed distribution is used (dosing siphon or pumped
dosing) trench length can be greater.
Distribution pipe within the trench shall be at least 100mm dia. and laid as level as
possible (+/-6mm). Distribution pipes should have holes 12-18mm dia. drilled at 4, 6
and 8 o’clock position less than 1m apart (State of Kansas, 1997). The pipe should be
laid with the holes facing down. Slots should not be used to perforate the pipe since
they tend to plug more quickly than holes.
Trenches can be closed ended or connected at the far end to improve distribution of
wastewater. However, connected trenches must all be built at the same elevation and
the pipes laid flat.
Trench fill should consist of 150mm of gravel placed directly on the infiltration
surface, the distribution pipe is then placed and covered with trench fill gravel, and
50mm of gravel placed on top of the pipe. Trench fill stone must withstand the
constant flow of wastewater without chemical changes or plugging. Fines should be
removed from the gravel by screening and washing (less than 5% fines) and stones
smaller than 20mm or larger than 80-100mm removed. Stones should be hard and
chemically inert. Fully fired clay brick fragments, or screened and washed concrete
rubble, can also be used. Use care while placing fill so as not to smear or compact the
bottom or side walls of the trench, reducing percolation rates and oxygen
penetration.
A barrier layer between the fill stone and backfill soil is required to prevent the cover
soils from migrating into the trench fill material, plugging the gaps between the
gravel. The best material for this is geotextile drainage cloth, if available. If not, use
a minimum 75mm layer of straw or similar vegetation (banana leaves, papyrus,
coarse grass), or several layers of uncoated building paper. Do not use plastic
sheeting or other impermeable material since that will stop oxygen migration into the
biofilm layer and treatment zone, causing premature failure of the system. Fill cover
material consists of relatively porous local loamy soils covered by at least 150mm of
topsoil to support the grass vegetative cover.
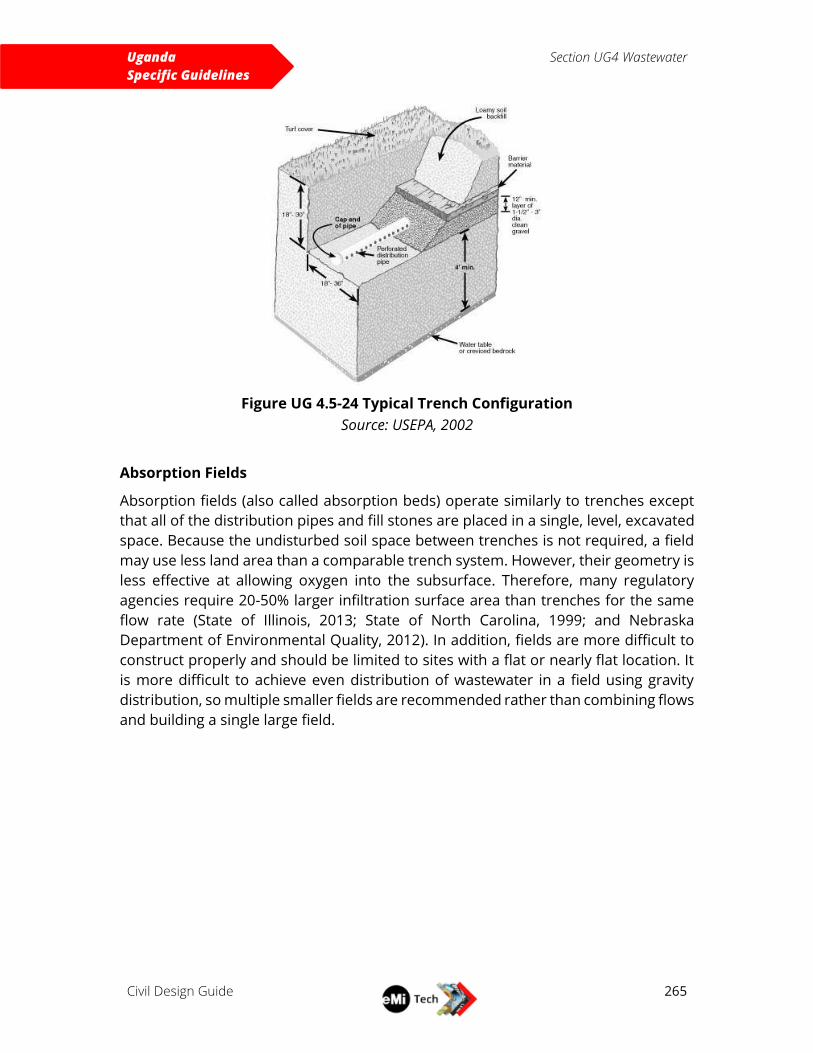
Uganda
Specific Guidelines
Section UG4 Wastewater
Civil Design Guide
265
Figure UG 4.5-24 Typical Trench Configuration
Source: USEPA, 2002
Absorption Fields
Absorption fields (also called absorption beds) operate similarly to trenches except
that all of the distribution pipes and fill stones are placed in a single, level, excavated
space. Because the undisturbed soil space between trenches is not required, a field
may use less land area than a comparable trench system. However, their geometry is
less effective at allowing oxygen into the subsurface. Therefore, many regulatory
agencies require 20-50% larger infiltration surface area than trenches for the same
flow rate (State of Illinois, 2013; State of North Carolina, 1999; and Nebraska
Department of Environmental Quality, 2012). In addition, fields are more difficult to
construct properly and should be limited to sites with a flat or nearly flat location. It
is more difficult to achieve even distribution of wastewater in a field using gravity
distribution, so multiple smaller fields are recommended rather than combining flows
and building a single large field.
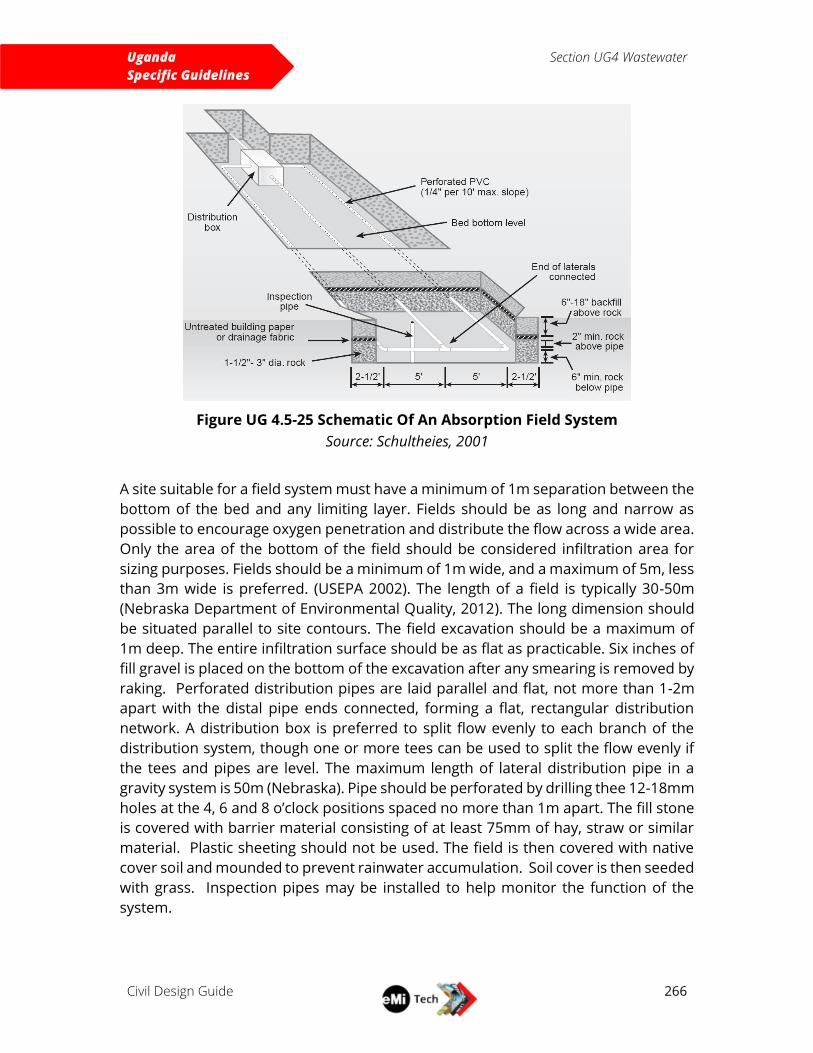
Uganda
Specific Guidelines
Section UG4 Wastewater
Civil Design Guide
266
Figure UG 4.5-25 Schematic Of An Absorption Field System
Source: Schultheies, 2001
A site suitable for a field system must have a minimum of 1m separation between the
bottom of the bed and any limiting layer. Fields should be as long and narrow as
possible to encourage oxygen penetration and distribute the flow across a wide area.
Only the area of the bottom of the field should be considered infiltration area for
sizing purposes. Fields should be a minimum of 1m wide, and a maximum of 5m, less
than 3m wide is preferred. (USEPA 2002). The length of a field is typically 30-50m
(Nebraska Department of Environmental Quality, 2012). The long dimension should
be situated parallel to site contours. The field excavation should be a maximum of
1m deep. The entire infiltration surface should be as flat as practicable. Six inches of
fill gravel is placed on the bottom of the excavation after any smearing is removed by
raking. Perforated distribution pipes are laid parallel and flat, not more than 1-2m
apart with the distal pipe ends connected, forming a flat, rectangular distribution
network. A distribution box is preferred to split flow evenly to each branch of the
distribution system, though one or more tees can be used to split the flow evenly if
the tees and pipes are level. The maximum length of lateral distribution pipe in a
gravity system is 50m (Nebraska). Pipe should be perforated by drilling thee 12-18mm
holes at the 4, 6 and 8 o’clock positions spaced no more than 1m apart. The fill stone
is covered with barrier material consisting of at least 75mm of hay, straw or similar
material. Plastic sheeting should not be used. The field is then covered with native
cover soil and mounded to prevent rainwater accumulation. Soil cover is then seeded
with grass. Inspection pipes may be installed to help monitor the function of the
system.
Uganda
Specific Guidelines
Section UG4 Wastewater
Civil Design Guide
267
Mounds
Mound-shaped absorption systems can be used at sites with shallow groundwater or
bedrock. To achieve the required depth of soil depth between the top of the
infiltration zone and the uppermost limiting layer, imported porous soil or fine sand
is placed on top of native soil. A distribution system, similar to an absorption field, is
then built on top of the imported soil or sand. Wastewater flows from the distribution
system into the sand or porous soil and then into the native soil layer. A suitable site
for such a system should have at least 60cm (24”) of unsaturated native soil between
the top of natural soil surface and seasonally high groundwater table or the limiting
layer. Figure 7 is a typical mound cross section.
Figure UG 4.5-26 Typical Absorption Mound Cross Section
Such a system is suited for flat or sloping land (less than 12%-25%); steeply slopped
land requires special design features and presents a potential risk of wastewater
emerging from the mound on the downhill side of the slope.
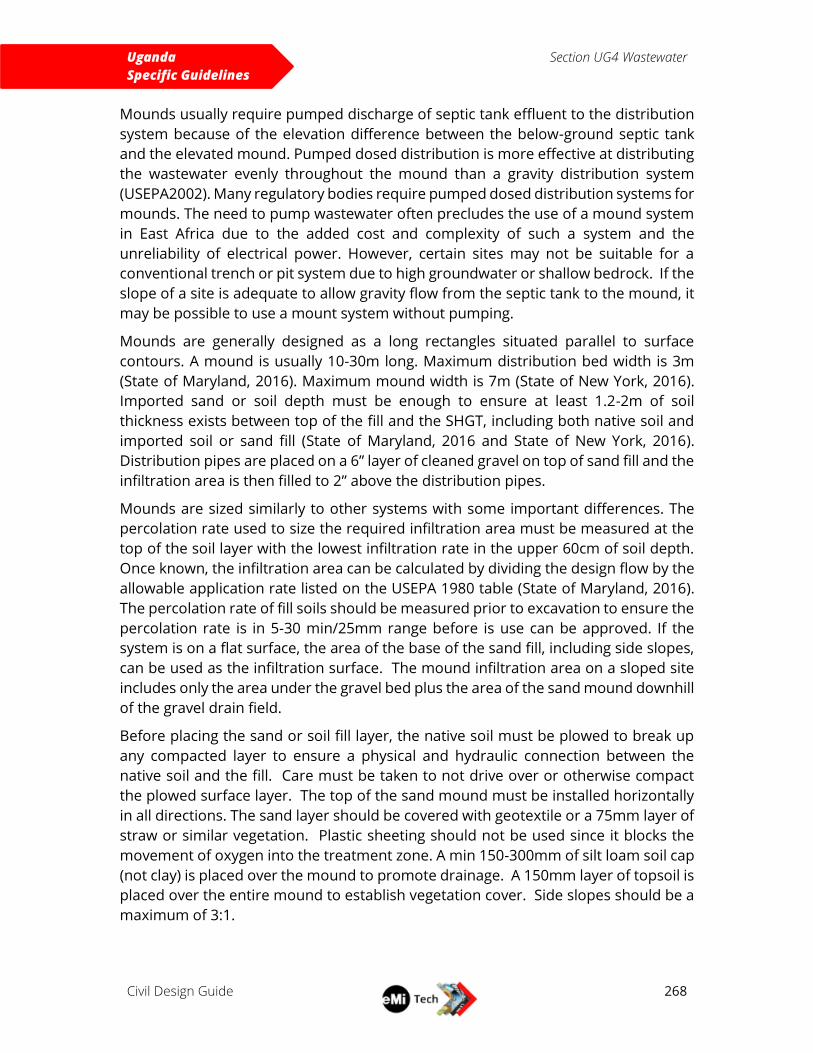
Uganda
Specific Guidelines
Section UG4 Wastewater
Civil Design Guide
268
Mounds usually require pumped discharge of septic tank effluent to the distribution
system because of the elevation difference between the below-ground septic tank
and the elevated mound. Pumped dosed distribution is more effective at distributing
the wastewater evenly throughout the mound than a gravity distribution system
(USEPA2002). Many regulatory bodies require pumped dosed distribution systems for
mounds. The need to pump wastewater often precludes the use of a mound system
in East Africa due to the added cost and complexity of such a system and the
unreliability of electrical power. However, certain sites may not be suitable for a
conventional trench or pit system due to high groundwater or shallow bedrock. If the
slope of a site is adequate to allow gravity flow from the septic tank to the mound, it
may be possible to use a mount system without pumping.
Mounds are generally designed as a long rectangles situated parallel to surface
contours. A mound is usually 10-30m long. Maximum distribution bed width is 3m
(State of Maryland, 2016). Maximum mound width is 7m (State of New York, 2016).
Imported sand or soil depth must be enough to ensure at least 1.2-2m of soil
thickness exists between top of the fill and the SHGT, including both native soil and
imported soil or sand fill (State of Maryland, 2016 and State of New York, 2016).
Distribution pipes are placed on a 6” layer of cleaned gravel on top of sand fill and the
infiltration area is then filled to 2” above the distribution pipes.
Mounds are sized similarly to other systems with some important differences. The
percolation rate used to size the required infiltration area must be measured at the
top of the soil layer with the lowest infiltration rate in the upper 60cm of soil depth.
Once known, the infiltration area can be calculated by dividing the design flow by the
allowable application rate listed on the USEPA 1980 table (State of Maryland, 2016).
The percolation rate of fill soils should be measured prior to excavation to ensure the
percolation rate is in 5-30 min/25mm range before is use can be approved. If the
system is on a flat surface, the area of the base of the sand fill, including side slopes,
can be used as the infiltration surface. The mound infiltration area on a sloped site
includes only the area under the gravel bed plus the area of the sand mound downhill
of the gravel drain field.
Before placing the sand or soil fill layer, the native soil must be plowed to break up
any compacted layer to ensure a physical and hydraulic connection between the
native soil and the fill. Care must be taken to not drive over or otherwise compact
the plowed surface layer. The top of the sand mound must be installed horizontally
in all directions. The sand layer should be covered with geotextile or a 75mm layer of
straw or similar vegetation. Plastic sheeting should not be used since it blocks the
movement of oxygen into the treatment zone. A min 150-300mm of silt loam soil cap
(not clay) is placed over the mound to promote drainage. A 150mm layer of topsoil is
placed over the entire mound to establish vegetation cover. Side slopes should be a
maximum of 3:1.
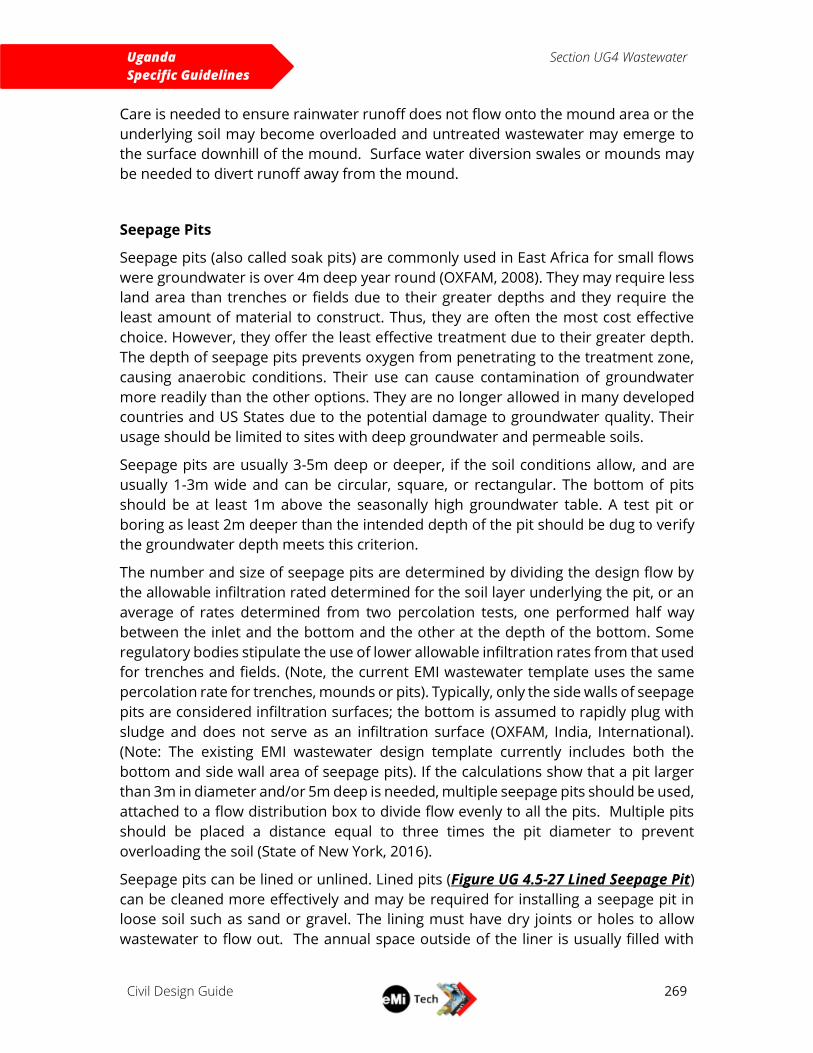
Uganda
Specific Guidelines
Section UG4 Wastewater
Civil Design Guide
269
Care is needed to ensure rainwater runoff does not flow onto the mound area or the
underlying soil may become overloaded and untreated wastewater may emerge to
the surface downhill of the mound. Surface water diversion swales or mounds may
be needed to divert runoff away from the mound.
Seepage Pits
Seepage pits (also called soak pits) are commonly used in East Africa for small flows
were groundwater is over 4m deep year round (OXFAM, 2008). They may require less
land area than trenches or fields due to their greater depths and they require the
least amount of material to construct. Thus, they are often the most cost effective
choice. However, they offer the least effective treatment due to their greater depth.
The depth of seepage pits prevents oxygen from penetrating to the treatment zone,
causing anaerobic conditions. Their use can cause contamination of groundwater
more readily than the other options. They are no longer allowed in many developed
countries and US States due to the potential damage to groundwater quality. Their
usage should be limited to sites with deep groundwater and permeable soils.
Seepage pits are usually 3-5m deep or deeper, if the soil conditions allow, and are
usually 1-3m wide and can be circular, square, or rectangular. The bottom of pits
should be at least 1m above the seasonally high groundwater table. A test pit or
boring as least 2m deeper than the intended depth of the pit should be dug to verify
the groundwater depth meets this criterion.
The number and size of seepage pits are determined by dividing the design flow by
the allowable infiltration rated determined for the soil layer underlying the pit, or an
average of rates determined from two percolation tests, one performed half way
between the inlet and the bottom and the other at the depth of the bottom. Some
regulatory bodies stipulate the use of lower allowable infiltration rates from that used
for trenches and fields. (Note, the current EMI wastewater template uses the same
percolation rate for trenches, mounds or pits). Typically, only the side walls of seepage
pits are considered infiltration surfaces; the bottom is assumed to rapidly plug with
sludge and does not serve as an infiltration surface (OXFAM, India, International).
(Note: The existing EMI wastewater design template currently includes both the
bottom and side wall area of seepage pits). If the calculations show that a pit larger
than 3m in diameter and/or 5m deep is needed, multiple seepage pits should be used,
attached to a flow distribution box to divide flow evenly to all the pits. Multiple pits
should be placed a distance equal to three times the pit diameter to prevent
overloading the soil (State of New York, 2016).
Seepage pits can be lined or unlined. Lined pits (Figure UG 4.5-27 Lined Seepage Pit)
can be cleaned more effectively and may be required for installing a seepage pit in
loose soil such as sand or gravel. The lining must have dry joints or holes to allow
wastewater to flow out. The annual space outside of the liner is usually filled with
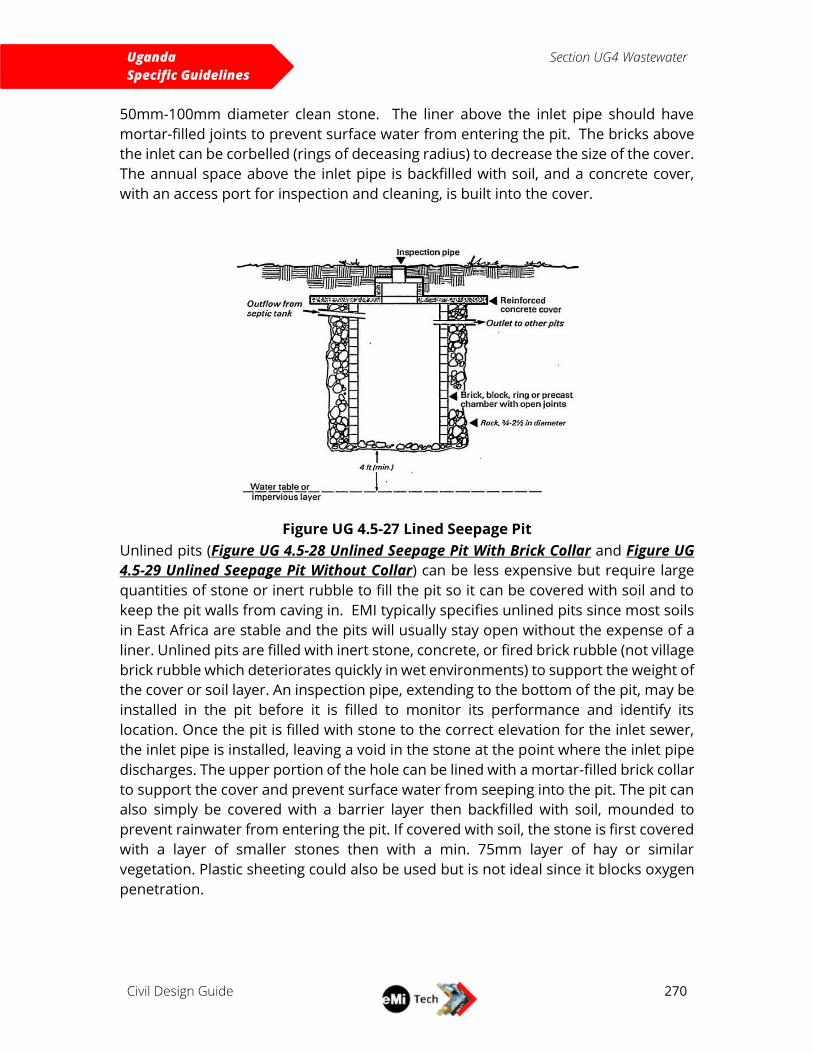
Uganda
Specific Guidelines
Section UG4 Wastewater
Civil Design Guide
270
50mm-100mm diameter clean stone. The liner above the inlet pipe should have
mortar-filled joints to prevent surface water from entering the pit. The bricks above
the inlet can be corbelled (rings of deceasing radius) to decrease the size of the cover.
The annual space above the inlet pipe is backfilled with soil, and a concrete cover,
with an access port for inspection and cleaning, is built into the cover.
Figure UG 4.5-27 Lined Seepage Pit
Unlined pits (Figure UG 4.5-28 Unlined Seepage Pit With Brick Collar and Figure UG
4.5-29 Unlined Seepage Pit Without Collar) can be less expensive but require large
quantities of stone or inert rubble to fill the pit so it can be covered with soil and to
keep the pit walls from caving in. EMI typically specifies unlined pits since most soils
in East Africa are stable and the pits will usually stay open without the expense of a
liner. Unlined pits are filled with inert stone, concrete, or fired brick rubble (not village
brick rubble which deteriorates quickly in wet environments) to support the weight of
the cover or soil layer. An inspection pipe, extending to the bottom of the pit, may be
installed in the pit before it is filled to monitor its performance and identify its
location. Once the pit is filled with stone to the correct elevation for the inlet sewer,
the inlet pipe is installed, leaving a void in the stone at the point where the inlet pipe
discharges. The upper portion of the hole can be lined with a mortar-filled brick collar
to support the cover and prevent surface water from seeping into the pit. The pit can
also simply be covered with a barrier layer then backfilled with soil, mounded to
prevent rainwater from entering the pit. If covered with soil, the stone is first covered
with a layer of smaller stones then with a min. 75mm layer of hay or similar
vegetation. Plastic sheeting could also be used but is not ideal since it blocks oxygen
penetration.
Uganda
Specific Guidelines
Section UG4 Wastewater
Civil Design Guide
271
Figure UG 4.5-28 Unlined Seepage Pit With Brick Collar
Figure UG 4.5-29 Unlined Seepage Pit Without Collar
Identification of Seasonally High Water Table (SHGT)
The movement of wastewater into the soil underlying the absorption system is highly
dependent on the moisture content of the soil. Fully saturated soil cannot absorb any
additional wastewater, and when the groundwater table is shallow, wastewater may
create a mound under the absorption system. In extreme cases, the top of this
underground mound will reach the soil surface, causing untreated wastewater to
migrate to the ground surface. In addition, saturated conditions reduce the amount
of oxygen that reaches the treatment zone, reducing treatment effectiveness. For
these reasons, most regulatory agencies require that at least 1m of unsaturated soil
exist between the bottom of the absorption system and the shallowest groundwater
table elevation that could occur during the year, termed the seasonally high
groundwater table (SHGT) elevation. An important part of the site assessment is it
determine the depth of the SHGT. However, it is usually difficult to assess this
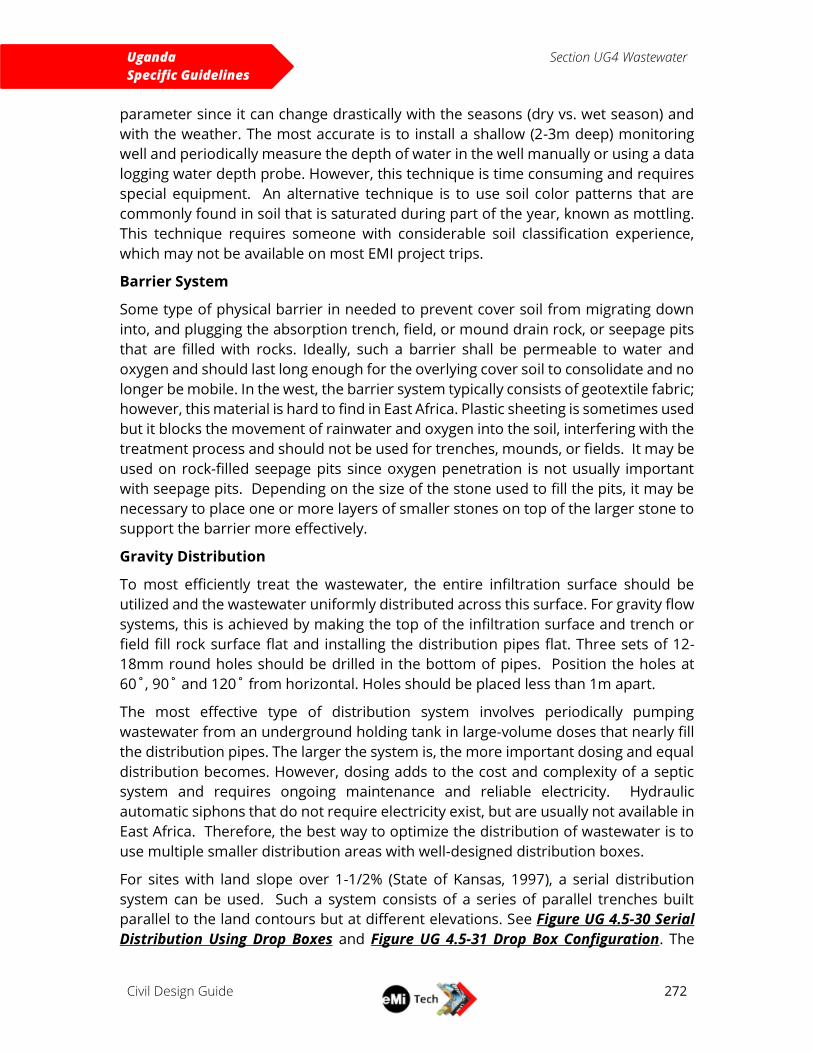
Uganda
Specific Guidelines
Section UG4 Wastewater
Civil Design Guide
272
parameter since it can change drastically with the seasons (dry vs. wet season) and
with the weather. The most accurate is to install a shallow (2-3m deep) monitoring
well and periodically measure the depth of water in the well manually or using a data
logging water depth probe. However, this technique is time consuming and requires
special equipment. An alternative technique is to use soil color patterns that are
commonly found in soil that is saturated during part of the year, known as mottling.
This technique requires someone with considerable soil classification experience,
which may not be available on most EMI project trips.
Barrier System
Some type of physical barrier in needed to prevent cover soil from migrating down
into, and plugging the absorption trench, field, or mound drain rock, or seepage pits
that are filled with rocks. Ideally, such a barrier shall be permeable to water and
oxygen and should last long enough for the overlying cover soil to consolidate and no
longer be mobile. In the west, the barrier system typically consists of geotextile fabric;
however, this material is hard to find in East Africa. Plastic sheeting is sometimes used
but it blocks the movement of rainwater and oxygen into the soil, interfering with the
treatment process and should not be used for trenches, mounds, or fields. It may be
used on rock-filled seepage pits since oxygen penetration is not usually important
with seepage pits. Depending on the size of the stone used to fill the pits, it may be
necessary to place one or more layers of smaller stones on top of the larger stone to
support the barrier more effectively.
Gravity Distribution
To most efficiently treat the wastewater, the entire infiltration surface should be
utilized and the wastewater uniformly distributed across this surface. For gravity flow
systems, this is achieved by making the top of the infiltration surface and trench or
field fill rock surface flat and installing the distribution pipes flat. Three sets of 12-
18mm round holes should be drilled in the bottom of pipes. Position the holes at
60˚, 90˚ and 120˚ from horizontal. Holes should be placed less than 1m apart.
The most effective type of distribution system involves periodically pumping
wastewater from an underground holding tank in large-volume doses that nearly fill
the distribution pipes. The larger the system is, the more important dosing and equal
distribution becomes. However, dosing adds to the cost and complexity of a septic
system and requires ongoing maintenance and reliable electricity. Hydraulic
automatic siphons that do not require electricity exist, but are usually not available in
East Africa. Therefore, the best way to optimize the distribution of wastewater is to
use multiple smaller distribution areas with well-designed distribution boxes.
For sites with land slope over 1-1/2% (State of Kansas, 1997), a serial distribution
system can be used. Such a system consists of a series of parallel trenches built
parallel to the land contours but at different elevations. See Figure UG 4.5-30 Serial
Distribution Using Drop Boxes and Figure UG 4.5-31 Drop Box Configuration. The
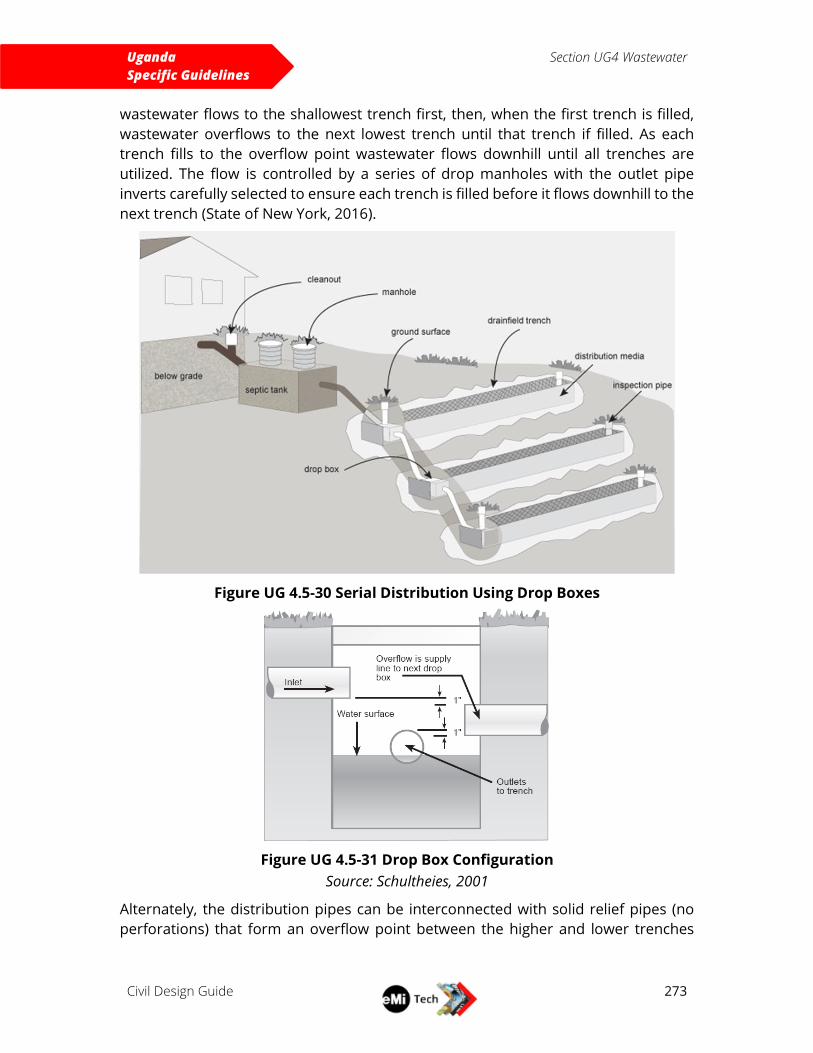
Uganda
Specific Guidelines
Section UG4 Wastewater
Civil Design Guide
273
wastewater flows to the shallowest trench first, then, when the first trench is filled,
wastewater overflows to the next lowest trench until that trench if filled. As each
trench fills to the overflow point wastewater flows downhill until all trenches are
utilized. The flow is controlled by a series of drop manholes with the outlet pipe
inverts carefully selected to ensure each trench is filled before it flows downhill to the
next trench (State of New York, 2016).
Figure UG 4.5-30 Serial Distribution Using Drop Boxes
Figure UG 4.5-31 Drop Box Configuration
Source: Schultheies, 2001
Alternately, the distribution pipes can be interconnected with solid relief pipes (no
perforations) that form an overflow point between the higher and lower trenches
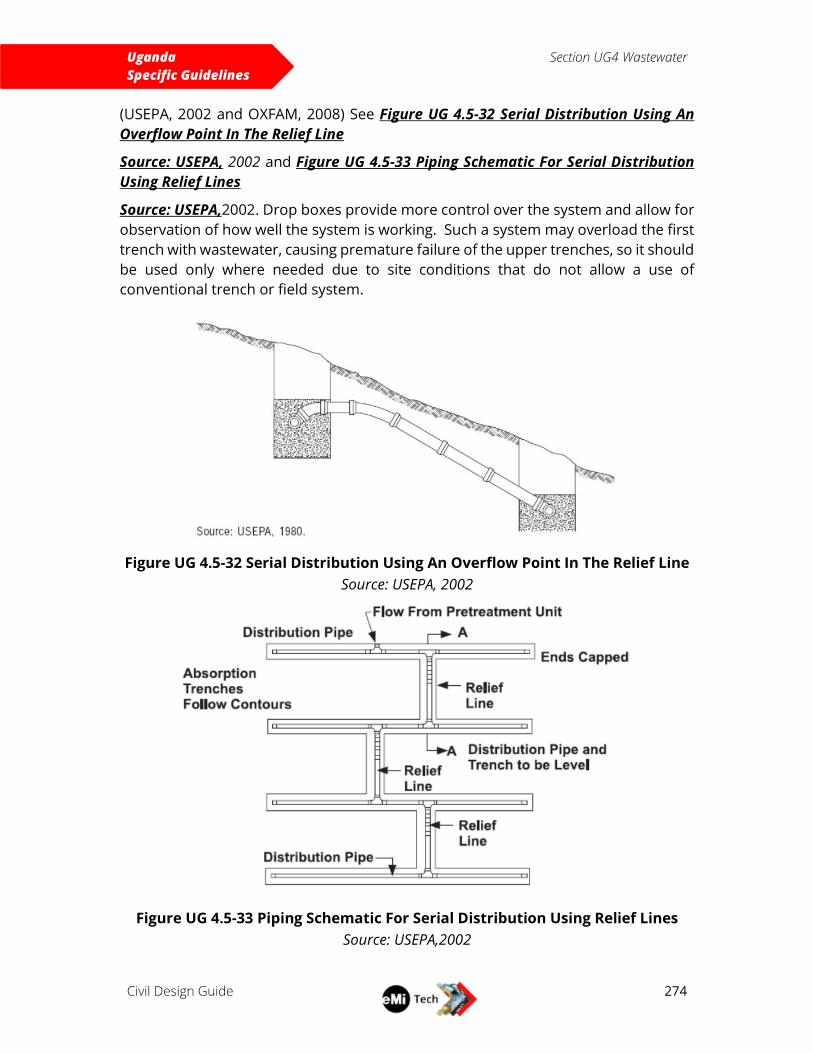
Uganda
Specific Guidelines
Section UG4 Wastewater
Civil Design Guide
274
(USEPA, 2002 and OXFAM, 2008) See Figure UG 4.5-32 Serial Distribution Using An
Overflow Point In The Relief Line
Source: USEPA, 2002 and Figure UG 4.5-33 Piping Schematic For Serial Distribution
Using Relief Lines
Source: USEPA,2002. Drop boxes provide more control over the system and allow for
observation of how well the system is working. Such a system may overload the first
trench with wastewater, causing premature failure of the upper trenches, so it should
be used only where needed due to site conditions that do not allow a use of
conventional trench or field system.
Figure UG 4.5-32 Serial Distribution Using An Overflow Point In The Relief Line
Source: USEPA, 2002
Figure UG 4.5-33 Piping Schematic For Serial Distribution Using Relief Lines
Source: USEPA,2002
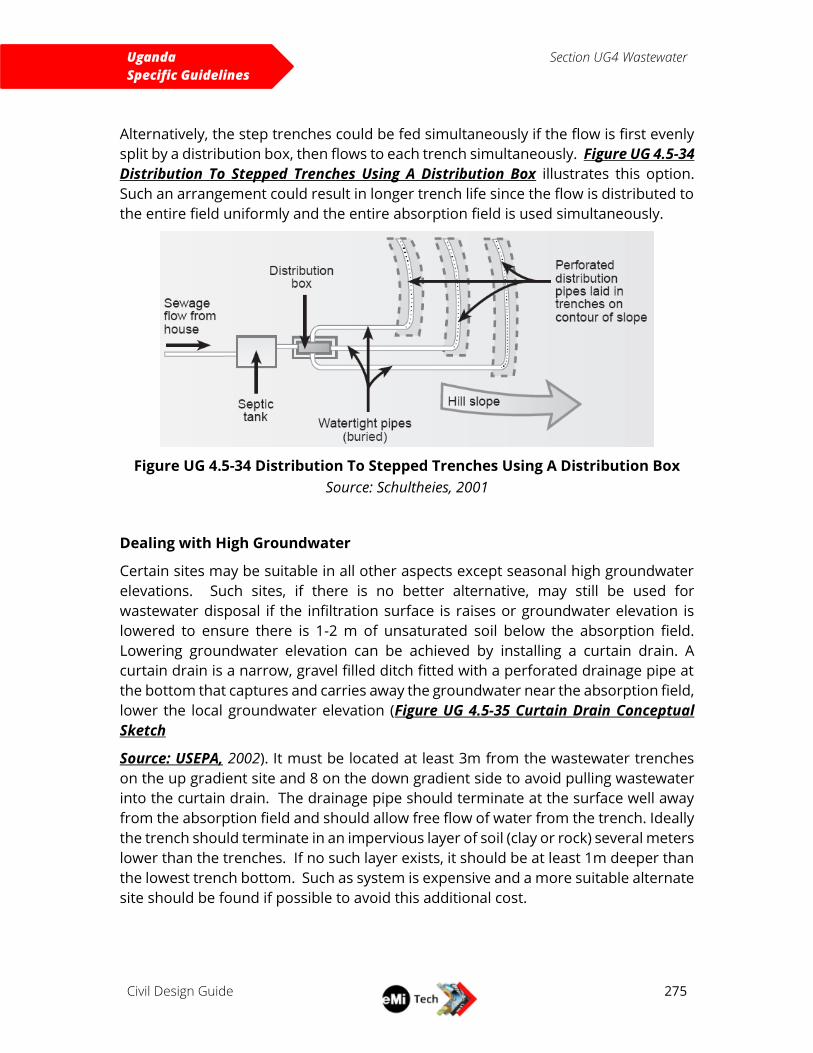
Uganda
Specific Guidelines
Section UG4 Wastewater
Civil Design Guide
275
Alternatively, the step trenches could be fed simultaneously if the flow is first evenly
split by a distribution box, then flows to each trench simultaneously. Figure UG 4.5-34
Distribution To Stepped Trenches Using A Distribution Box illustrates this option.
Such an arrangement could result in longer trench life since the flow is distributed to
the entire field uniformly and the entire absorption field is used simultaneously.
Figure UG 4.5-34 Distribution To Stepped Trenches Using A Distribution Box
Source: Schultheies, 2001
Dealing with High Groundwater
Certain sites may be suitable in all other aspects except seasonal high groundwater
elevations. Such sites, if there is no better alternative, may still be used for
wastewater disposal if the infiltration surface is raises or groundwater elevation is
lowered to ensure there is 1-2 m of unsaturated soil below the absorption field.
Lowering groundwater elevation can be achieved by installing a curtain drain. A
curtain drain is a narrow, gravel filled ditch fitted with a perforated drainage pipe at
the bottom that captures and carries away the groundwater near the absorption field,
lower the local groundwater elevation (Figure UG 4.5-35 Curtain Drain Conceptual
Sketch
Source: USEPA, 2002). It must be located at least 3m from the wastewater trenches
on the up gradient site and 8 on the down gradient side to avoid pulling wastewater
into the curtain drain. The drainage pipe should terminate at the surface well away
from the absorption field and should allow free flow of water from the trench. Ideally
the trench should terminate in an impervious layer of soil (clay or rock) several meters
lower than the trenches. If no such layer exists, it should be at least 1m deeper than
the lowest trench bottom. Such as system is expensive and a more suitable alternate
site should be found if possible to avoid this additional cost.
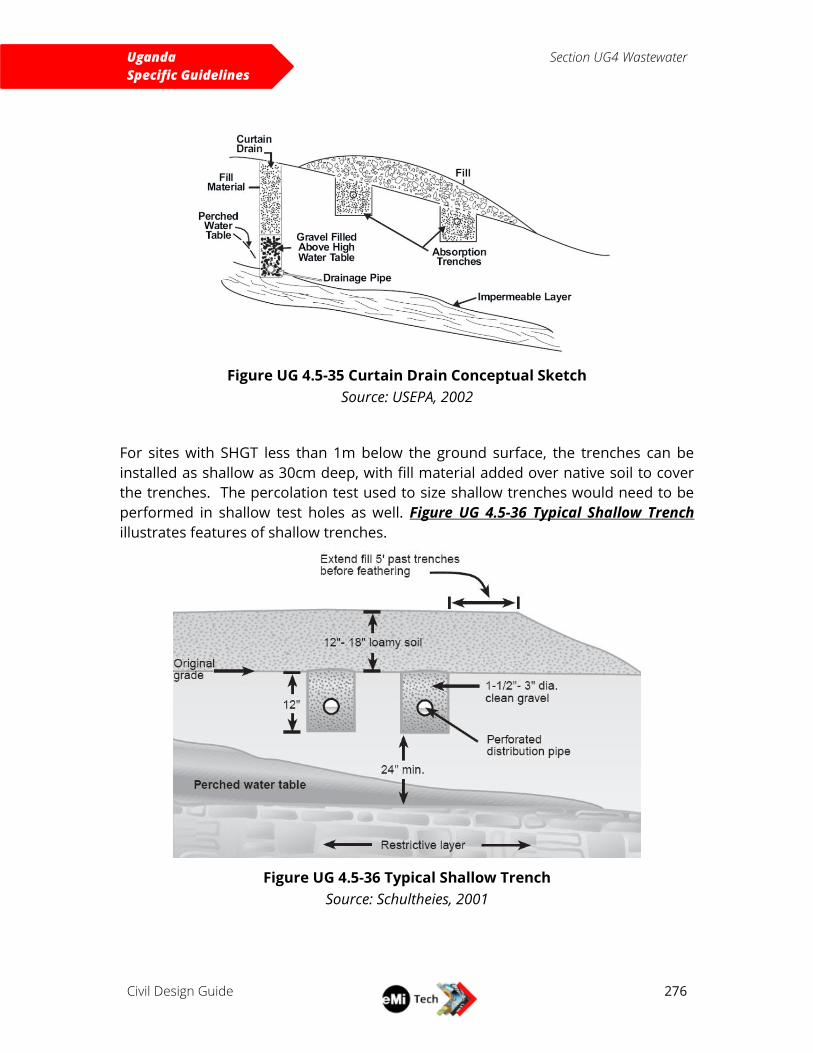
Uganda
Specific Guidelines
Section UG4 Wastewater
Civil Design Guide
276
Figure UG 4.5-35 Curtain Drain Conceptual Sketch
Source: USEPA, 2002
For sites with SHGT less than 1m below the ground surface, the trenches can be
installed as shallow as 30cm deep, with fill material added over native soil to cover
the trenches. The percolation test used to size shallow trenches would need to be
performed in shallow test holes as well. Figure UG 4.5-36 Typical Shallow Trench
illustrates features of shallow trenches.
Figure UG 4.5-36 Typical Shallow Trench
Source: Schultheies, 2001
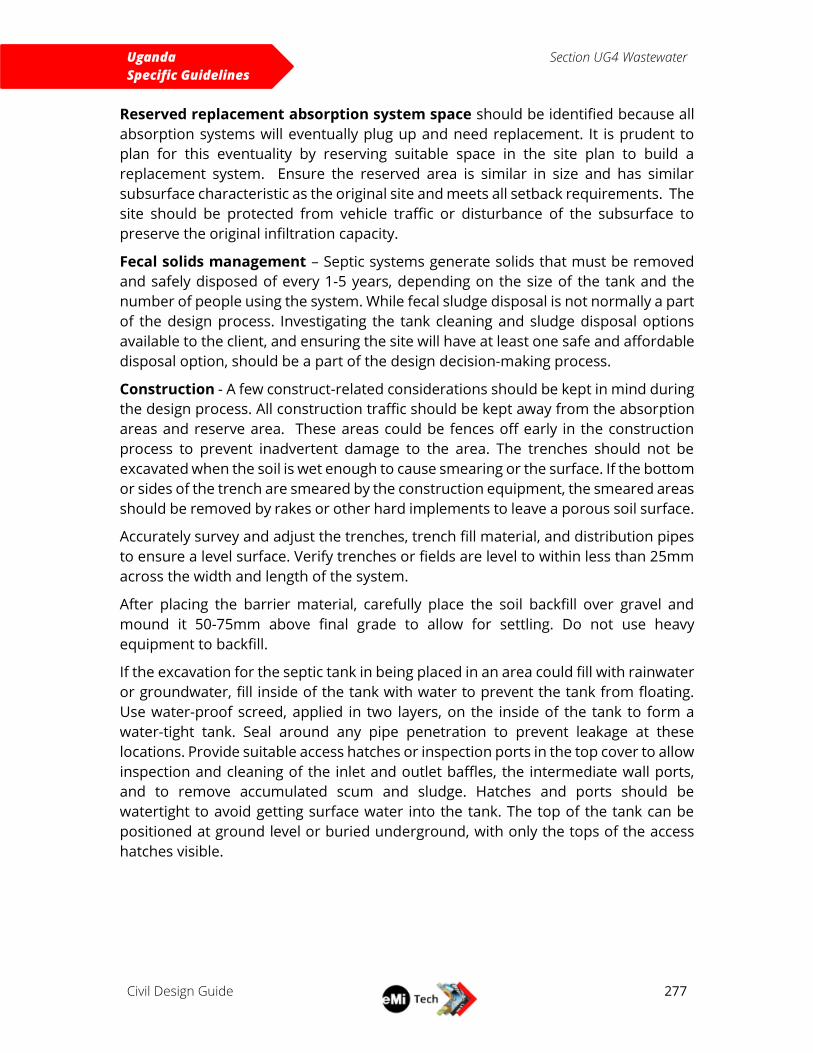
Uganda
Specific Guidelines
Section UG4 Wastewater
Civil Design Guide
277
Reserved replacement absorption system space should be identified because all
absorption systems will eventually plug up and need replacement. It is prudent to
plan for this eventuality by reserving suitable space in the site plan to build a
replacement system. Ensure the reserved area is similar in size and has similar
subsurface characteristic as the original site and meets all setback requirements. The
site should be protected from vehicle traffic or disturbance of the subsurface to
preserve the original infiltration capacity.
Fecal solids management – Septic systems generate solids that must be removed
and safely disposed of every 1-5 years, depending on the size of the tank and the
number of people using the system. While fecal sludge disposal is not normally a part
of the design process. Investigating the tank cleaning and sludge disposal options
available to the client, and ensuring the site will have at least one safe and affordable
disposal option, should be a part of the design decision-making process.
Construction - A few construct-related considerations should be kept in mind during
the design process. All construction traffic should be kept away from the absorption
areas and reserve area. These areas could be fences off early in the construction
process to prevent inadvertent damage to the area. The trenches should not be
excavated when the soil is wet enough to cause smearing or the surface. If the bottom
or sides of the trench are smeared by the construction equipment, the smeared areas
should be removed by rakes or other hard implements to leave a porous soil surface.
Accurately survey and adjust the trenches, trench fill material, and distribution pipes
to ensure a level surface. Verify trenches or fields are level to within less than 25mm
across the width and length of the system.
After placing the barrier material, carefully place the soil backfill over gravel and
mound it 50-75mm above final grade to allow for settling. Do not use heavy
equipment to backfill.
If the excavation for the septic tank in being placed in an area could fill with rainwater
or groundwater, fill inside of the tank with water to prevent the tank from floating.
Use water-proof screed, applied in two layers, on the inside of the tank to form a
water-tight tank. Seal around any pipe penetration to prevent leakage at these
locations. Provide suitable access hatches or inspection ports in the top cover to allow
inspection and cleaning of the inlet and outlet baffles, the intermediate wall ports,
and to remove accumulated scum and sludge. Hatches and ports should be
watertight to avoid getting surface water into the tank. The top of the tank can be
positioned at ground level or buried underground, with only the tops of the access
hatches visible.

Uganda
Specific Guidelines
Section UG4 Wastewater
Civil Design Guide
278
LATRINES No deviation from Global Guide section 4.6 Latrines.
Uganda
Specific Guidelines
Section UG4 Wastewater
Civil Design Guide
279
OTHER WASTEWATER TREATMENT Wastewater treatment typically consists of a number of step in series. The process
usually consists of preliminary treatment (removal of large objects and grit), primary
treatment (removal of organic solids), secondary treatment (removal of dissolved
organic and inorganic matter) and tertiary treatment (disinfections, removal of
nutrients, and filtration of treated wastewater). In developing countries tertiary
treatment is rarely provided, except for disinfection.
The determination of which type of treatment systems is optimal for a given site is a
complex process that requires significant amount of site specific information about
the wastewater being treated; local environmental regulations conditions of the site
where the treatment system would be located; land area available and slope of
available land; seasonally high ground water table elevation; cost and reliability of
electrical power, treatment chemicals, expendable materials, spare parts, and any
specialty services required; any many other aspects. One of the most important
aspects of process design is to understand the characteristics of the wastewater being
treated, information that is rarely available and very difficult to obtain in developing
countries. These characteristics must, therefore, be assumed based on extensive
experience with wastewater from similar institutions. The process design of any of
these systems requires significant experience and expertise. Suitably qualified
engineers who know local regulations and conditions should be consulted prior to
selection and design. The selection of the recommended treatment approach is
usually documented in a Feasibility Study Report.
The following general descriptions of a few of the possible appropriate treatment
systems will provide a general understand of each but do not provide sufficient
information to complete a process design, hydraulic design, or detailed design. (Most
of the information in the following sections was obtained comes from Mara and
Eawag_08276).
Preliminary Treatment
The first stage of most types of wastewater treatment is the removal of large floating
objects (such as rags, plastic bottles, leaves and sticks, and trash) and heavy mineral
particles (sand and grit). This is done in order to prevent floating material
accumulating in waste treatment units where they could interfere with the treatment
process, and heavy solids accumulating in the bottom of treatment units or causing
premature wear to mechanical equipment. This preliminary treatment steps consist
of screening and grit removal. A flow measurement and recording device is usually
included in the preliminary treatment process.
Coarse solids are removed by a series of closely spaced steel or stainless steel bars
placed across the flow. The velocity through the screen should be <1 m/s so that the
solids already trapped on the screen (the ‘screenings’) are not dislodged. The spacing
between the bars is usually 15–25 mm and the bars are commonly of rectangular
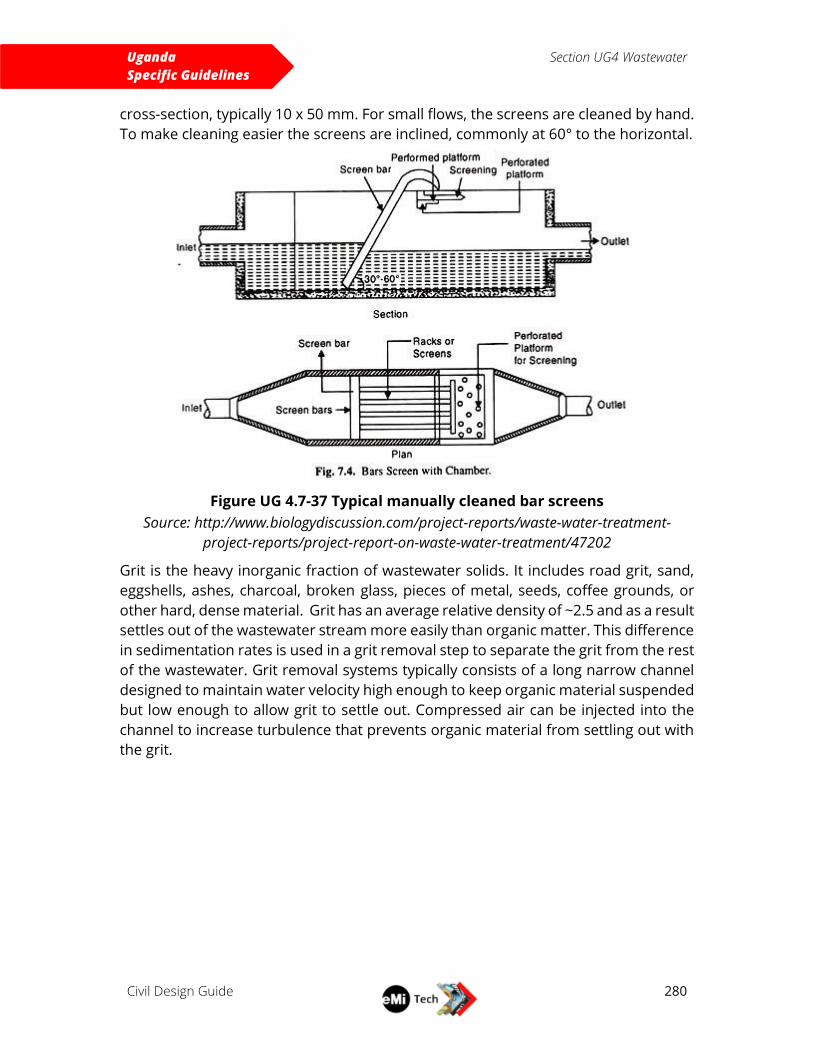
Uganda
Specific Guidelines
Section UG4 Wastewater
Civil Design Guide
280
cross-section, typically 10 x 50 mm. For small flows, the screens are cleaned by hand.
To make cleaning easier the screens are inclined, commonly at 60° to the horizontal.
Figure UG 4.7-37 Typical manually cleaned bar screens
Source: http://www.biologydiscussion.com/project-reports/waste-water-treatment-
project-reports/project-report-on-waste-water-treatment/47202
Grit is the heavy inorganic fraction of wastewater solids. It includes road grit, sand,
eggshells, ashes, charcoal, broken glass, pieces of metal, seeds, coffee grounds, or
other hard, dense material. Grit has an average relative density of ~2.5 and as a result
settles out of the wastewater stream more easily than organic matter. This difference
in sedimentation rates is used in a grit removal step to separate the grit from the rest
of the wastewater. Grit removal systems typically consists of a long narrow channel
designed to maintain water velocity high enough to keep organic material suspended
but low enough to allow grit to settle out. Compressed air can be injected into the
channel to increase turbulence that prevents organic material from settling out with
the grit.
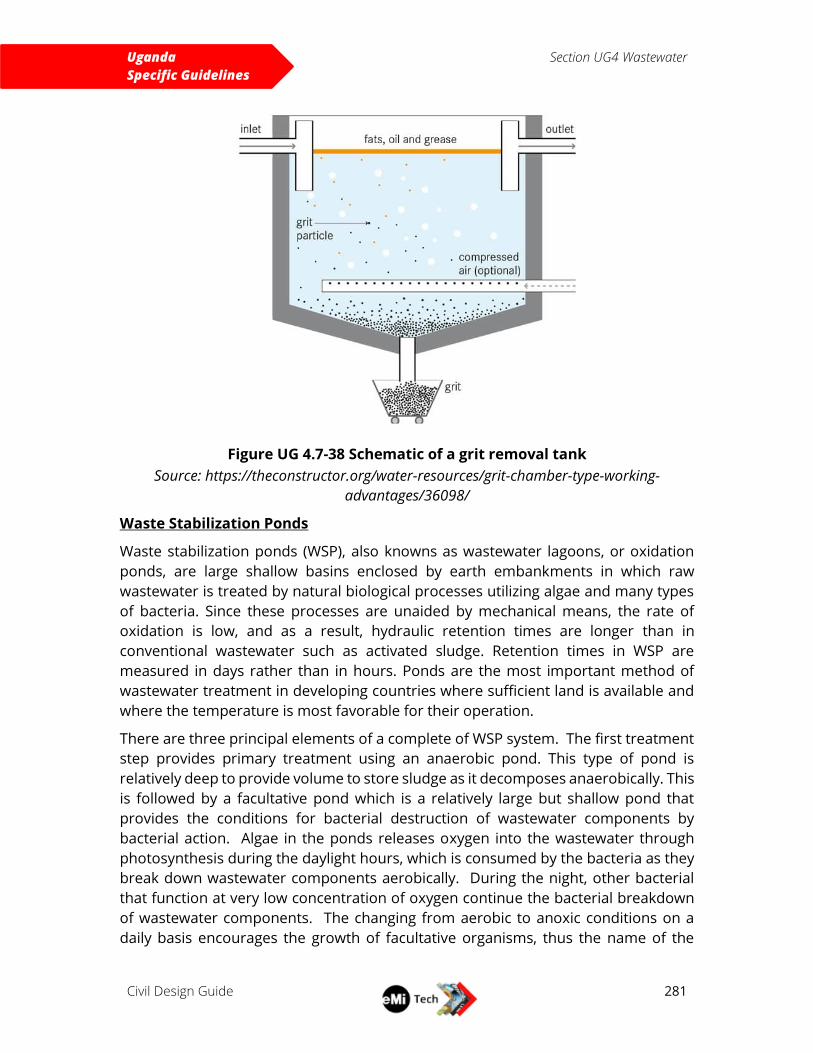
Uganda
Specific Guidelines
Section UG4 Wastewater
Civil Design Guide
281
Figure UG 4.7-38 Schematic of a grit removal tank
Source: https://theconstructor.org/water-resources/grit-chamber-type-working-
advantages/36098/
Waste Stabilization Ponds
Waste stabilization ponds (WSP), also knowns as wastewater lagoons, or oxidation
ponds, are large shallow basins enclosed by earth embankments in which raw
wastewater is treated by natural biological processes utilizing algae and many types
of bacteria. Since these processes are unaided by mechanical means, the rate of
oxidation is low, and as a result, hydraulic retention times are longer than in
conventional wastewater such as activated sludge. Retention times in WSP are
measured in days rather than in hours. Ponds are the most important method of
wastewater treatment in developing countries where sufficient land is available and
where the temperature is most favorable for their operation.
There are three principal elements of a complete of WSP system. The first treatment
step provides primary treatment using an anaerobic pond. This type of pond is
relatively deep to provide volume to store sludge as it decomposes anaerobically. This
is followed by a facultative pond which is a relatively large but shallow pond that
provides the conditions for bacterial destruction of wastewater components by
bacterial action. Algae in the ponds releases oxygen into the wastewater through
photosynthesis during the daylight hours, which is consumed by the bacteria as they
break down wastewater components aerobically. During the night, other bacterial
that function at very low concentration of oxygen continue the bacterial breakdown
of wastewater components. The changing from aerobic to anoxic conditions on a
daily basis encourages the growth of facultative organisms, thus the name of the
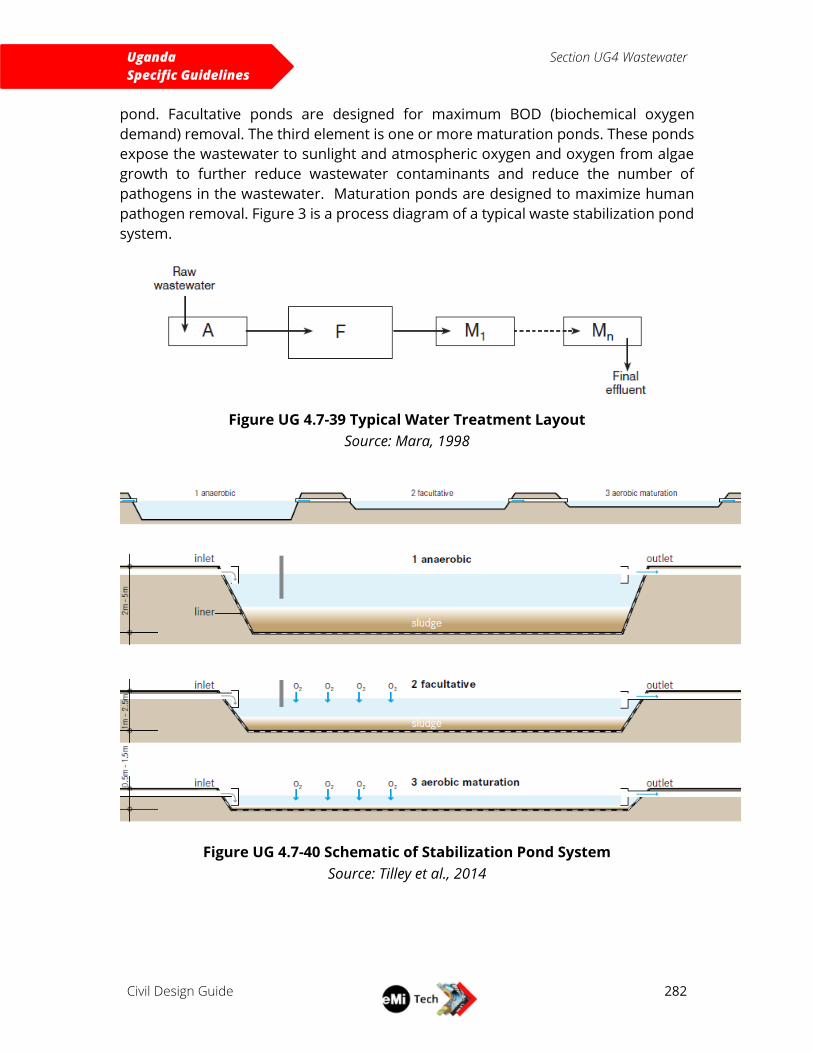
Uganda
Specific Guidelines
Section UG4 Wastewater
Civil Design Guide
282
pond. Facultative ponds are designed for maximum BOD (biochemical oxygen
demand) removal. The third element is one or more maturation ponds. These ponds
expose the wastewater to sunlight and atmospheric oxygen and oxygen from algae
growth to further reduce wastewater contaminants and reduce the number of
pathogens in the wastewater. Maturation ponds are designed to maximize human
pathogen removal. Figure 3 is a process diagram of a typical waste stabilization pond
system.
Figure UG 4.7-39 Typical Water Treatment Layout
Source: Mara, 1998
Figure UG 4.7-40 Schematic of Stabilization Pond System
Source: Tilley et al., 2014
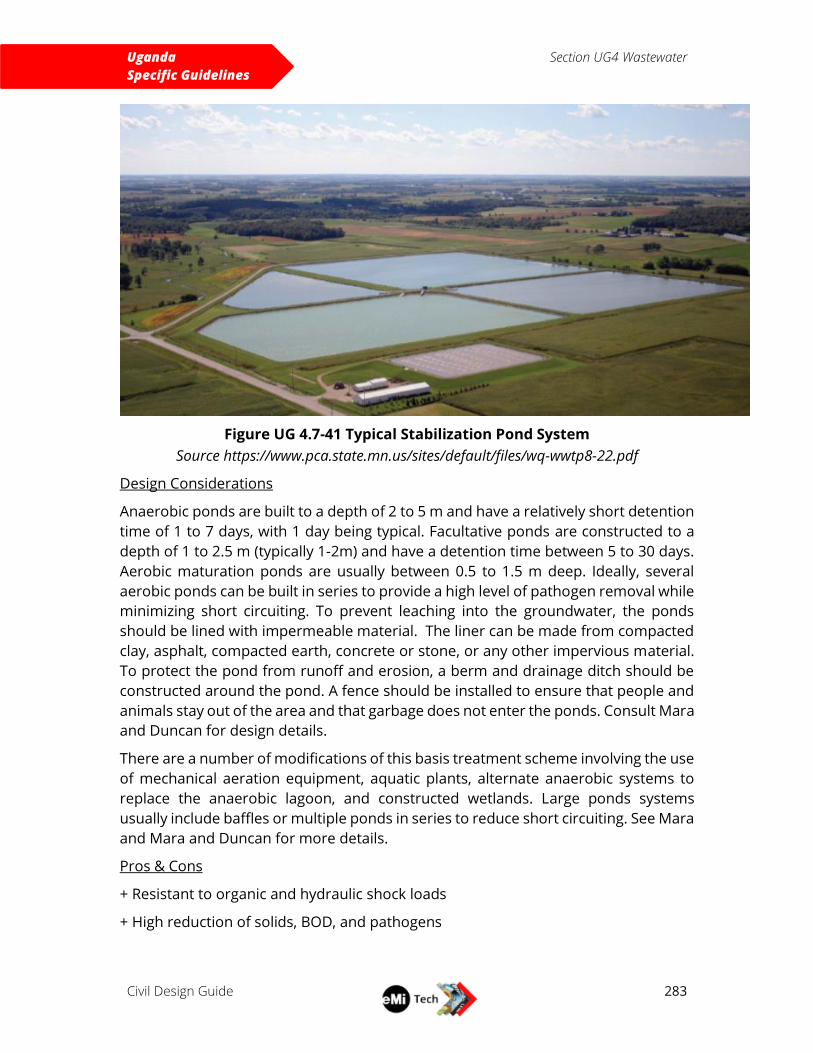
Uganda
Specific Guidelines
Section UG4 Wastewater
Civil Design Guide
283
Figure UG 4.7-41 Typical Stabilization Pond System
Source https://www.pca.state.mn.us/sites/default/files/wq-wwtp8-22.pdf
Design Considerations
Anaerobic ponds are built to a depth of 2 to 5 m and have a relatively short detention
time of 1 to 7 days, with 1 day being typical. Facultative ponds are constructed to a
depth of 1 to 2.5 m (typically 1-2m) and have a detention time between 5 to 30 days.
Aerobic maturation ponds are usually between 0.5 to 1.5 m deep. Ideally, several
aerobic ponds can be built in series to provide a high level of pathogen removal while
minimizing short circuiting. To prevent leaching into the groundwater, the ponds
should be lined with impermeable material. The liner can be made from compacted
clay, asphalt, compacted earth, concrete or stone, or any other impervious material.
To protect the pond from runoff and erosion, a berm and drainage ditch should be
constructed around the pond. A fence should be installed to ensure that people and
animals stay out of the area and that garbage does not enter the ponds. Consult Mara
and Duncan for design details.
There are a number of modifications of this basis treatment scheme involving the use
of mechanical aeration equipment, aquatic plants, alternate anaerobic systems to
replace the anaerobic lagoon, and constructed wetlands. Large ponds systems
usually include baffles or multiple ponds in series to reduce short circuiting. See Mara
and Mara and Duncan for more details.
Pros & Cons
+ Resistant to organic and hydraulic shock loads
+ High reduction of solids, BOD, and pathogens
Uganda
Specific Guidelines
Section UG4 Wastewater
Civil Design Guide
284
+ Low operating costs
+ No electrical energy is required
+ No real problems with insects or odors if designed and maintained correctly
- Requires a large land area
- High capital costs depending on the price of land
- Requires expert design and construction
- Sludge requires proper removal and treatment
- Security – sturdy fences are required to keep people and animals away from the
ponds
Prior EMI uses
A stabilization pond system was design for the Kibuye Hope Hospital in 2019,
but has not yet been constructed. Information regarding this design can be
found in the project files for UG-0186. The design was assisted by Shammah
Kiteme, a Kenyan engineer who also designed the lagoon system for the Kijabe
Hospital in central Kenya.
In February 2011, EMI designed a stabilization pond system for the Watoto
Babies Home, project 9105.
Other projects outside the Uganda office, most are only in the conceptual
stage.
US-0743 – BEAUTC Ethiopia, ponds conceptual
US-0733 – Nkhoma Malawi, existing ponds. Need more capacity. Conceptual
recommendations for increasing size.
Constructed Wetlands
Constructed wetlands are long, narrow, shallow biological reactors in which the
partially treated wastewater is provided secondary treatment by natural wetland
processes. Constructed wetlands function similar to natural wetlands, but they are
designed to intensify the wastewater treatment processes that occur in natural
wetlands. Rooted aquatic plants, termed macrophytes, are grown in gravel beds
which receive domestic wastewater after primary treatment. Constructed wetlands
are also called ‘reedbeds’ after the aquatic macrophyte most commonly grown in
them – Phragmites australis, the common reed. Other plants commonly used include
Schoenoplectus lacustris (bulrush), Typha latifolia (cattail) and Juncus effusus (soft
rush). Other wetland plants including papyrus can be used in some tropical regions.
Three types of constructed wetland are in common practice, the free-water surface
wetland, the horizontal flow subsurface wetland, and the horizontal flow subsurface
wetland. All three systems utilize bacteria growing on submerged media and plant
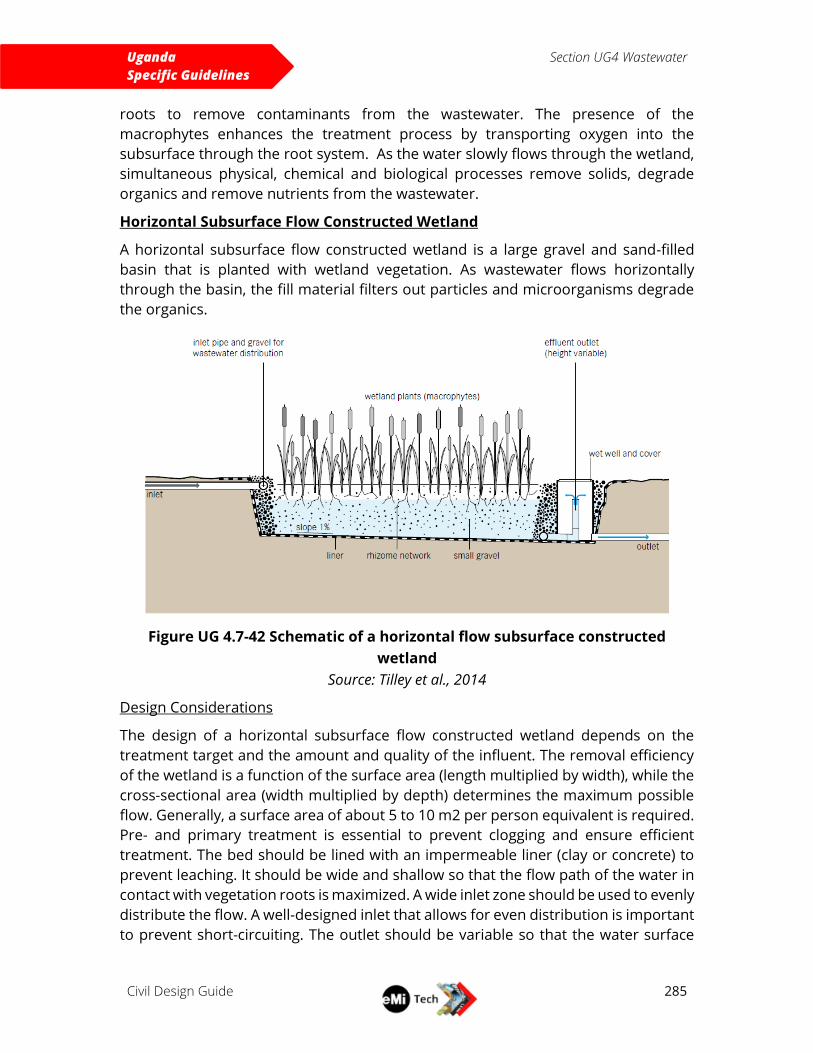
Uganda
Specific Guidelines
Section UG4 Wastewater
Civil Design Guide
285
roots to remove contaminants from the wastewater. The presence of the
macrophytes enhances the treatment process by transporting oxygen into the
subsurface through the root system. As the water slowly flows through the wetland,
simultaneous physical, chemical and biological processes remove solids, degrade
organics and remove nutrients from the wastewater.
Horizontal Subsurface Flow Constructed Wetland
A horizontal subsurface flow constructed wetland is a large gravel and sand-filled
basin that is planted with wetland vegetation. As wastewater flows horizontally
through the basin, the fill material filters out particles and microorganisms degrade
the organics.
Figure UG 4.7-42 Schematic of a horizontal flow subsurface constructed
wetland
Source: Tilley et al., 2014
Design Considerations
The design of a horizontal subsurface flow constructed wetland depends on the
treatment target and the amount and quality of the influent. The removal efficiency
of the wetland is a function of the surface area (length multiplied by width), while the
cross-sectional area (width multiplied by depth) determines the maximum possible
flow. Generally, a surface area of about 5 to 10 m2 per person equivalent is required.
Pre- and primary treatment is essential to prevent clogging and ensure efficient
treatment. The bed should be lined with an impermeable liner (clay or concrete) to
prevent leaching. It should be wide and shallow so that the flow path of the water in
contact with vegetation roots is maximized. A wide inlet zone should be used to evenly
distribute the flow. A well-designed inlet that allows for even distribution is important
to prevent short-circuiting. The outlet should be variable so that the water surface
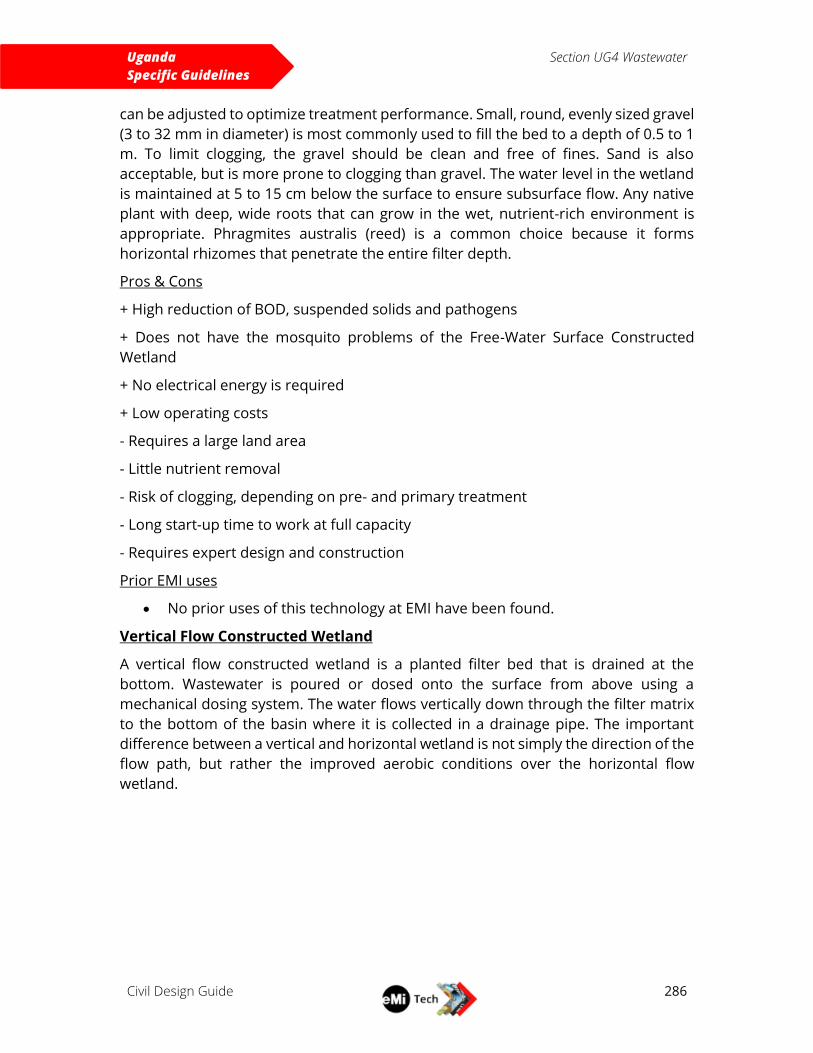
Uganda
Specific Guidelines
Section UG4 Wastewater
Civil Design Guide
286
can be adjusted to optimize treatment performance. Small, round, evenly sized gravel
(3 to 32 mm in diameter) is most commonly used to fill the bed to a depth of 0.5 to 1
m. To limit clogging, the gravel should be clean and free of fines. Sand is also
acceptable, but is more prone to clogging than gravel. The water level in the wetland
is maintained at 5 to 15 cm below the surface to ensure subsurface flow. Any native
plant with deep, wide roots that can grow in the wet, nutrient-rich environment is
appropriate. Phragmites australis (reed) is a common choice because it forms
horizontal rhizomes that penetrate the entire filter depth.
Pros & Cons
+ High reduction of BOD, suspended solids and pathogens
+ Does not have the mosquito problems of the Free-Water Surface Constructed
Wetland
+ No electrical energy is required
+ Low operating costs
- Requires a large land area
- Little nutrient removal
- Risk of clogging, depending on pre- and primary treatment
- Long start-up time to work at full capacity
- Requires expert design and construction
Prior EMI uses
No prior uses of this technology at EMI have been found.
Vertical Flow Constructed Wetland
A vertical flow constructed wetland is a planted filter bed that is drained at the
bottom. Wastewater is poured or dosed onto the surface from above using a
mechanical dosing system. The water flows vertically down through the filter matrix
to the bottom of the basin where it is collected in a drainage pipe. The important
difference between a vertical and horizontal wetland is not simply the direction of the
flow path, but rather the improved aerobic conditions over the horizontal flow
wetland.
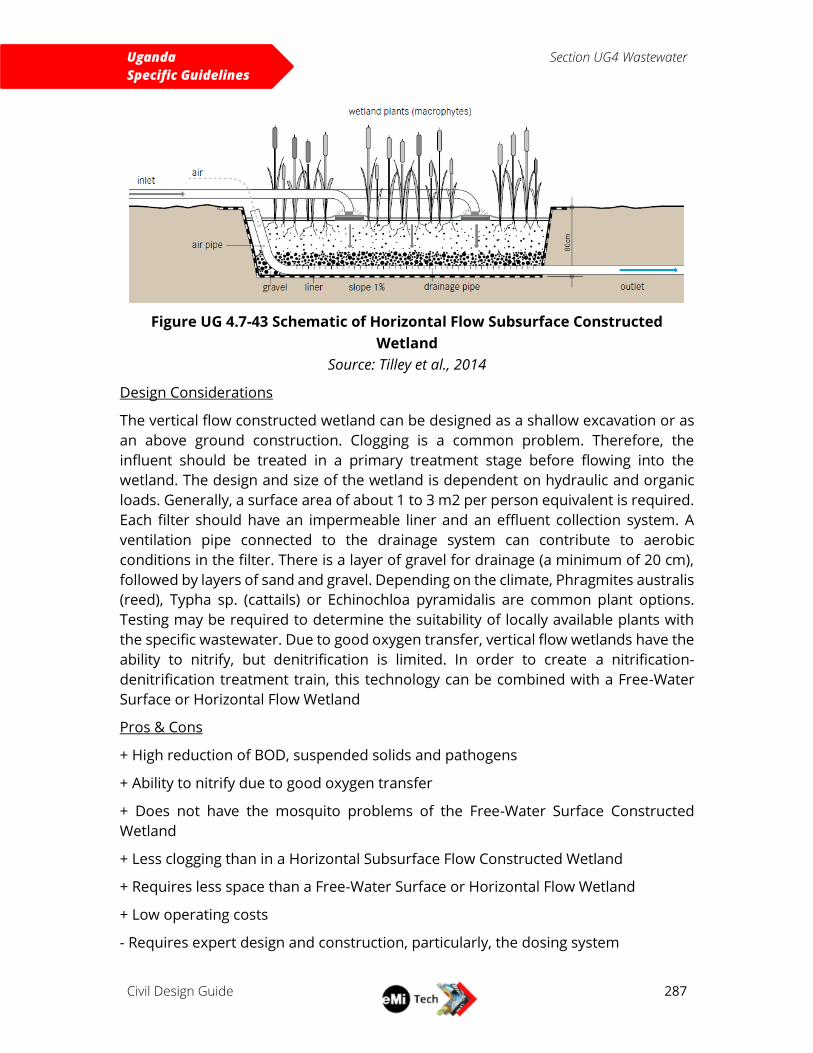
Uganda
Specific Guidelines
Section UG4 Wastewater
Civil Design Guide
287
Figure UG 4.7-43 Schematic of Horizontal Flow Subsurface Constructed
Wetland
Source: Tilley et al., 2014
Design Considerations
The vertical flow constructed wetland can be designed as a shallow excavation or as
an above ground construction. Clogging is a common problem. Therefore, the
influent should be treated in a primary treatment stage before flowing into the
wetland. The design and size of the wetland is dependent on hydraulic and organic
loads. Generally, a surface area of about 1 to 3 m2 per person equivalent is required.
Each filter should have an impermeable liner and an effluent collection system. A
ventilation pipe connected to the drainage system can contribute to aerobic
conditions in the filter. There is a layer of gravel for drainage (a minimum of 20 cm),
followed by layers of sand and gravel. Depending on the climate, Phragmites australis
(reed), Typha sp. (cattails) or Echinochloa pyramidalis are common plant options.
Testing may be required to determine the suitability of locally available plants with
the specific wastewater. Due to good oxygen transfer, vertical flow wetlands have the
ability to nitrify, but denitrification is limited. In order to create a nitrification-
denitrification treatment train, this technology can be combined with a Free-Water
Surface or Horizontal Flow Wetland
Pros & Cons
+ High reduction of BOD, suspended solids and pathogens
+ Ability to nitrify due to good oxygen transfer
+ Does not have the mosquito problems of the Free-Water Surface Constructed
Wetland
+ Less clogging than in a Horizontal Subsurface Flow Constructed Wetland
+ Requires less space than a Free-Water Surface or Horizontal Flow Wetland
+ Low operating costs
- Requires expert design and construction, particularly, the dosing system
Uganda
Specific Guidelines
Section UG4 Wastewater
Civil Design Guide
288
- Requires more frequent maintenance than a Horizontal Subsurface Flow
Constructed Wetland
- A constant source of electrical energy may be required
- Long start-up time to work at full capacity
Prior EMI uses
No prior uses of this technology at EMI have been found.
Free-Water Surface Constructed Wetland
Free-water surface constructed wetlands aim to replicate the naturally occurring
processes of a natural wetland, marsh or swamp. The surface of the water is exposed
to the atmosphere, improving oxygen transfer and exposing the water to ultraviolent
light which can kill pathogens. As water slowly flows through the wetland, particles
settle, pathogens are destroyed, and organisms and plants utilize the nutrients. This
type of constructed wetland is often used as an advanced treatment after other
secondary treatment processes.
Figure UG 4.7-44 Schematic of surface flow constructed wetland
Source: Tilley et al., 2014
Design Considerations
The channel or basin is lined with an impermeable barrier (clay or geo-textile) covered
with rocks, gravel and soil and planted with native vegetation (e.g., cattails, reeds
and/or rushes). The wetland is flooded with wastewater to a depth of 10 to 45 cm
above ground level. The wetland is compartmentalized into at least two independent
flow paths. The number of compartments in series depends on the treatment target.
The efficiency of the free-water surface constructed wetland also depends on how
well the water is distributed at the inlet. Wastewater can be fed into the wetland, using
weirs or by drilling holes in a distribution pipe, to allow it to enter at evenly spaced
intervals.
Pros & Cons
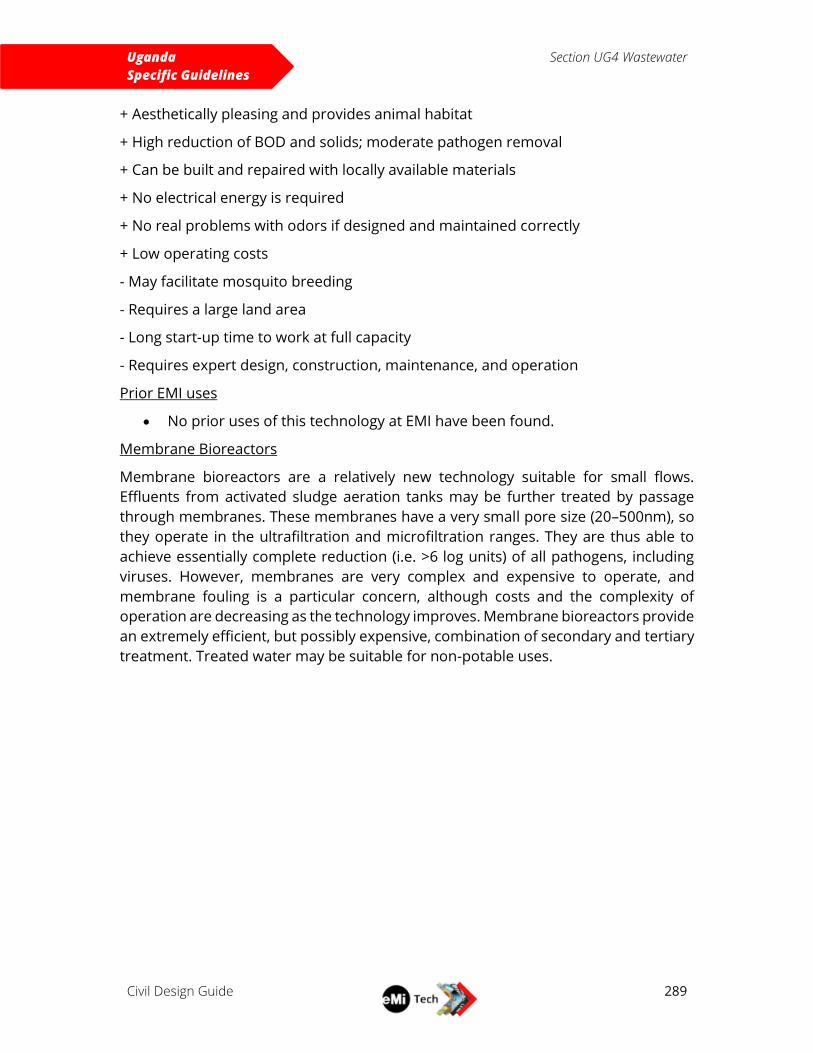
Uganda
Specific Guidelines
Section UG4 Wastewater
Civil Design Guide
289
+ Aesthetically pleasing and provides animal habitat
+ High reduction of BOD and solids; moderate pathogen removal
+ Can be built and repaired with locally available materials
+ No electrical energy is required
+ No real problems with odors if designed and maintained correctly
+ Low operating costs
- May facilitate mosquito breeding
- Requires a large land area
- Long start-up time to work at full capacity
- Requires expert design, construction, maintenance, and operation
Prior EMI uses
No prior uses of this technology at EMI have been found.
Membrane Bioreactors
Membrane bioreactors are a relatively new technology suitable for small flows.
Effluents from activated sludge aeration tanks may be further treated by passage
through membranes. These membranes have a very small pore size (20–500nm), so
they operate in the ultrafiltration and microfiltration ranges. They are thus able to
achieve essentially complete reduction (i.e. >6 log units) of all pathogens, including
viruses. However, membranes are very complex and expensive to operate, and
membrane fouling is a particular concern, although costs and the complexity of
operation are decreasing as the technology improves. Membrane bioreactors provide
an extremely efficient, but possibly expensive, combination of secondary and tertiary
treatment. Treated water may be suitable for non-potable uses.
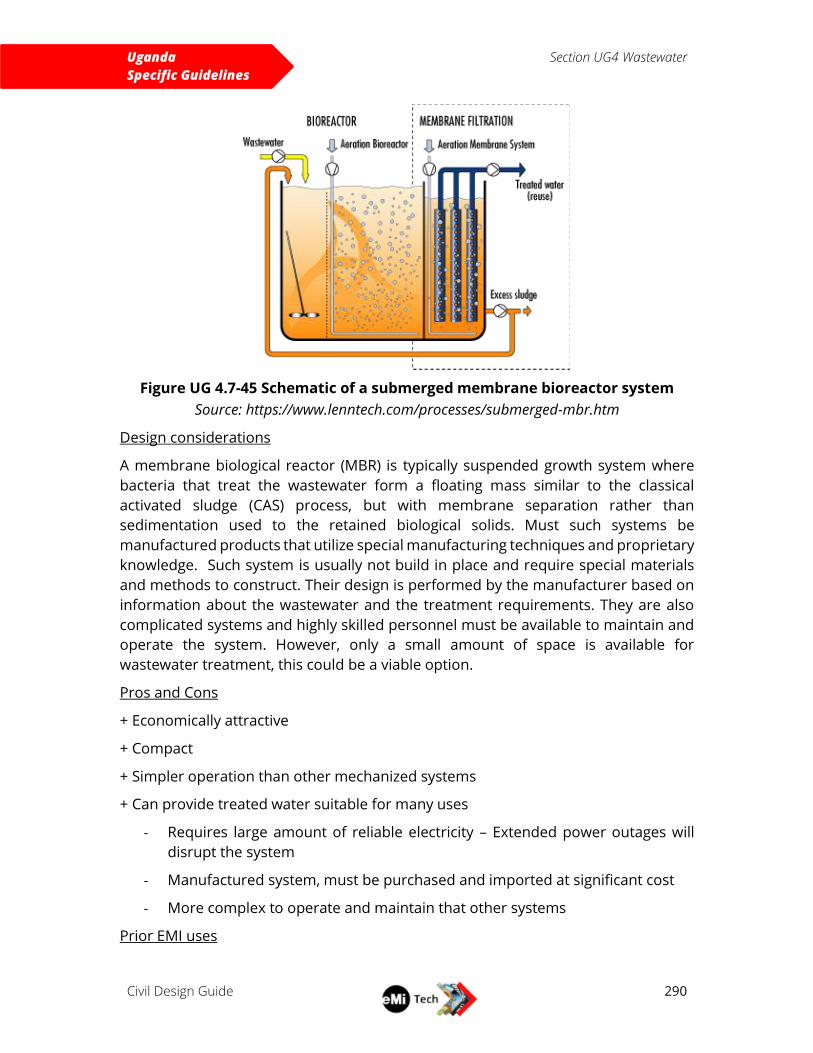
Uganda
Specific Guidelines
Section UG4 Wastewater
Civil Design Guide
290
Figure UG 4.7-45 Schematic of a submerged membrane bioreactor system
Source: https://www.lenntech.com/processes/submerged-mbr.htm
Design considerations
A membrane biological reactor (MBR) is typically suspended growth system where
bacteria that treat the wastewater form a floating mass similar to the classical
activated sludge (CAS) process, but with membrane separation rather than
sedimentation used to the retained biological solids. Must such systems be
manufactured products that utilize special manufacturing techniques and proprietary
knowledge. Such system is usually not build in place and require special materials
and methods to construct. Their design is performed by the manufacturer based on
information about the wastewater and the treatment requirements. They are also
complicated systems and highly skilled personnel must be available to maintain and
operate the system. However, only a small amount of space is available for
wastewater treatment, this could be a viable option.
Pros and Cons
+ Economically attractive
+ Compact
+ Simpler operation than other mechanized systems
+ Can provide treated water suitable for many uses
- Requires large amount of reliable electricity – Extended power outages will
disrupt the system
- Manufactured system, must be purchased and imported at significant cost
- More complex to operate and maintain that other systems
Prior EMI uses
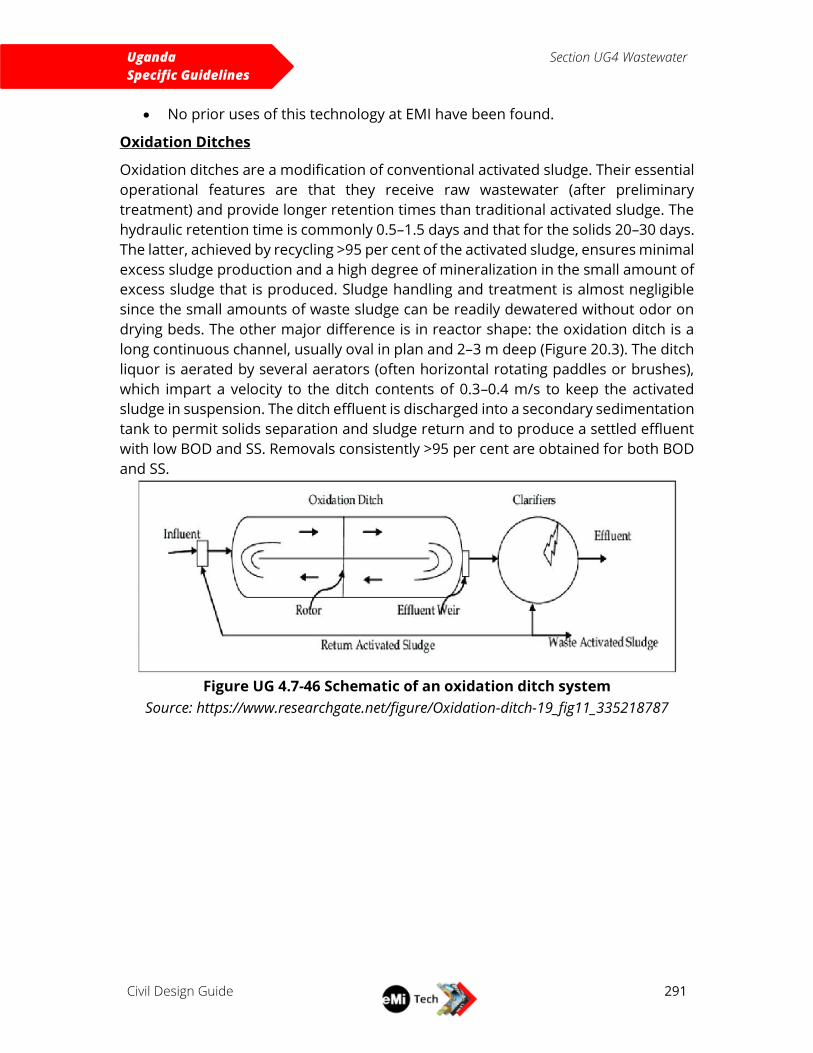
Uganda
Specific Guidelines
Section UG4 Wastewater
Civil Design Guide
291
No prior uses of this technology at EMI have been found.
Oxidation Ditches
Oxidation ditches are a modification of conventional activated sludge. Their essential
operational features are that they receive raw wastewater (after preliminary
treatment) and provide longer retention times than traditional activated sludge. The
hydraulic retention time is commonly 0.5–1.5 days and that for the solids 20–30 days.
The latter, achieved by recycling >95 per cent of the activated sludge, ensures minimal
excess sludge production and a high degree of mineralization in the small amount of
excess sludge that is produced. Sludge handling and treatment is almost negligible
since the small amounts of waste sludge can be readily dewatered without odor on
drying beds. The other major difference is in reactor shape: the oxidation ditch is a
long continuous channel, usually oval in plan and 2–3 m deep (Figure 20.3). The ditch
liquor is aerated by several aerators (often horizontal rotating paddles or brushes),
which impart a velocity to the ditch contents of 0.3–0.4 m/s to keep the activated
sludge in suspension. The ditch effluent is discharged into a secondary sedimentation
tank to permit solids separation and sludge return and to produce a settled effluent
with low BOD and SS. Removals consistently >95 per cent are obtained for both BOD
and SS.
Figure UG 4.7-46 Schematic of an oxidation ditch system
Source: https://www.researchgate.net/figure/Oxidation-ditch-19_fig11_335218787
Uganda
Specific Guidelines
Section UG4 Wastewater
Civil Design Guide
292
Figure UG 4.7-47 Small Oxidation Ditch System
Source: http://making-biodiesel-books.com/algae-bioproducts/algae-wastewater-
treatment/
Pros and Cons
+ Increased reliability over conventional systems
+ Eliminates the periodic effluent discharges common to other biological processes
+ Long hydraulic retention time and complete mixing minimize the impact of a shock
load or hydraulic surge.
+ Produces less sludge than other biological treatment processes owing to extended
biological activity during the activated sludge process
+ Energy efficient operation result in reduced energy costs compared with other
biological treatment processes
- Effluent suspended solids concentrations are relatively high compared to other
modifications of the activated sludge process.
- Requires a larger land area than other activated sludge treatment options
- Requires a dependable electrical supply
Prior EMI uses
There have been no known prior uses of this specific technology at EMI.
However, there have been some similar technologies proposed most only at
the conceptual level. A US project in Kenya, Tenwek Hospital (US-0720)
designed an activated sludge system in the preliminary design. A local
engineer is doing detailed design now and is now proposing moving bed
bioreactor.
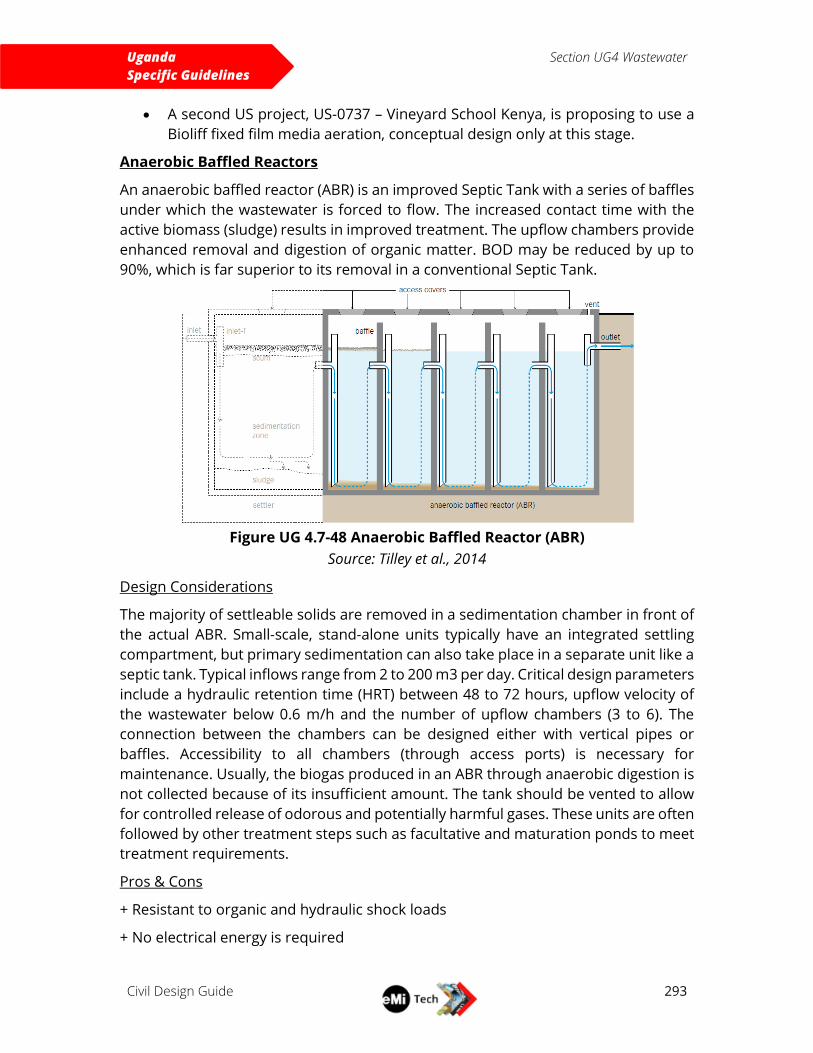
Uganda
Specific Guidelines
Section UG4 Wastewater
Civil Design Guide
293
A second US project, US-0737 – Vineyard School Kenya, is proposing to use a
Bioliff fixed film media aeration, conceptual design only at this stage.
Anaerobic Baffled Reactors
An anaerobic baffled reactor (ABR) is an improved Septic Tank with a series of baffles
under which the wastewater is forced to flow. The increased contact time with the
active biomass (sludge) results in improved treatment. The upflow chambers provide
enhanced removal and digestion of organic matter. BOD may be reduced by up to
90%, which is far superior to its removal in a conventional Septic Tank.
Figure UG 4.7-48 Anaerobic Baffled Reactor (ABR)
Source: Tilley et al., 2014
Design Considerations
The majority of settleable solids are removed in a sedimentation chamber in front of
the actual ABR. Small-scale, stand-alone units typically have an integrated settling
compartment, but primary sedimentation can also take place in a separate unit like a
septic tank. Typical inflows range from 2 to 200 m3 per day. Critical design parameters
include a hydraulic retention time (HRT) between 48 to 72 hours, upflow velocity of
the wastewater below 0.6 m/h and the number of upflow chambers (3 to 6). The
connection between the chambers can be designed either with vertical pipes or
baffles. Accessibility to all chambers (through access ports) is necessary for
maintenance. Usually, the biogas produced in an ABR through anaerobic digestion is
not collected because of its insufficient amount. The tank should be vented to allow
for controlled release of odorous and potentially harmful gases. These units are often
followed by other treatment steps such as facultative and maturation ponds to meet
treatment requirements.
Pros & Cons
+ Resistant to organic and hydraulic shock loads
+ No electrical energy is required

Uganda
Specific Guidelines
Section UG4 Wastewater
Civil Design Guide
294
+ Low operating costs
+ Long service life
+ High reduction of BOD
+ Low sludge production; the sludge is stabilized
+ Moderate area requirement (can be built underground)
- Requires expert design and construction
- Low reduction of pathogens and nutrients
- Effluent and sludge require further treatment and/or appropriate discharge
Prior EMI uses
The UCBC masterplan prepared in October of 208 (UG-0196) included a
proposal to use an anaerobic baffled reactor based on the following perceived
benefits
o The increased contact time with the active biomass (sludge) results in
improved treatment.
o Extends life of absorption fields
o Simple to build
o Would cost about the same price (or less) as building several septic
tanks
o Higher resistance to hydraulic and organic shock loads.
o Longer biomass retention times
o No mechanical mixing required
Anaerobic Filters
An anaerobic filter is a fixed-bed biological reactor with one or more filtration
chambers in series. Each chamber is partially filled with porous filter media, usually
consisting of gravel or coarse sand. As wastewater flows through the filter, particles
are trapped and organic matter is degraded by the active biomass that is attached to
the surface of the filter material. With this technology, suspended solids and BOD
removal can be as high as 90%, but is typically between 50% and 80%. The effluent is
much cleaner than a traditional septic system, but may still require additional
treatment if the wastewater will be discharged to surface water.
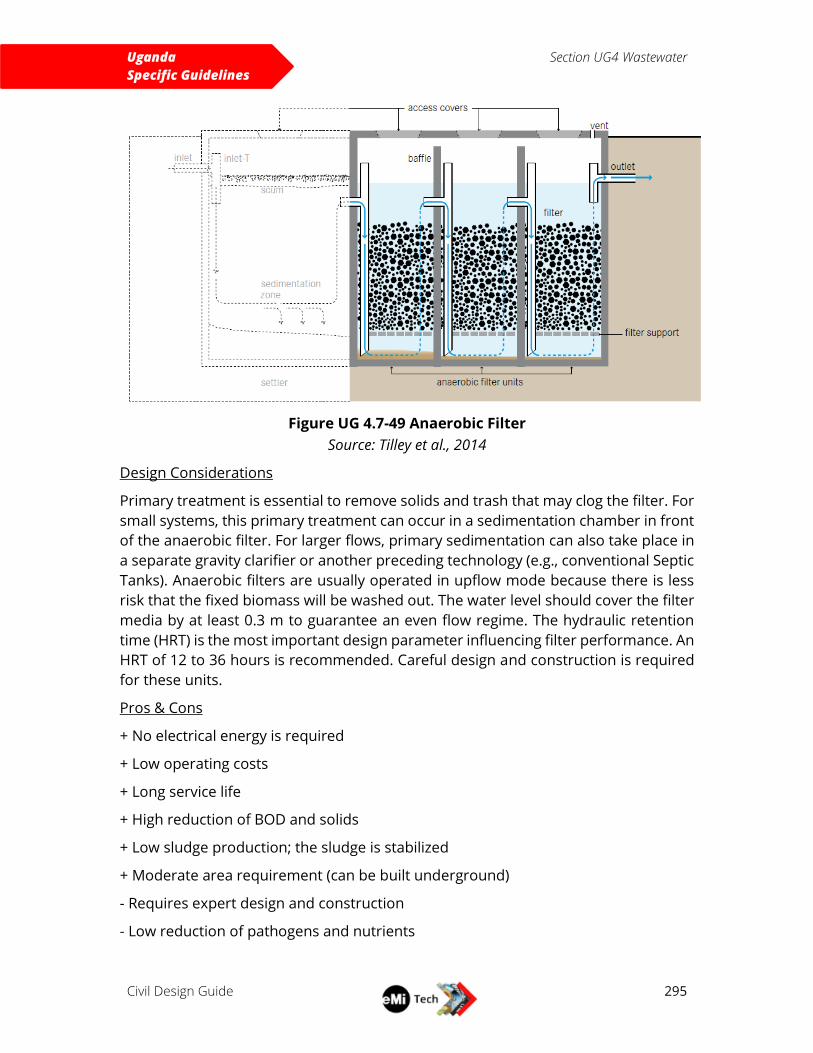
Uganda
Specific Guidelines
Section UG4 Wastewater
Civil Design Guide
295
Figure UG 4.7-49 Anaerobic Filter
Source: Tilley et al., 2014
Design Considerations
Primary treatment is essential to remove solids and trash that may clog the filter. For
small systems, this primary treatment can occur in a sedimentation chamber in front
of the anaerobic filter. For larger flows, primary sedimentation can also take place in
a separate gravity clarifier or another preceding technology (e.g., conventional Septic
Tanks). Anaerobic filters are usually operated in upflow mode because there is less
risk that the fixed biomass will be washed out. The water level should cover the filter
media by at least 0.3 m to guarantee an even flow regime. The hydraulic retention
time (HRT) is the most important design parameter influencing filter performance. An
HRT of 12 to 36 hours is recommended. Careful design and construction is required
for these units.
Pros & Cons
+ No electrical energy is required
+ Low operating costs
+ Long service life
+ High reduction of BOD and solids
+ Low sludge production; the sludge is stabilized
+ Moderate area requirement (can be built underground)
- Requires expert design and construction
- Low reduction of pathogens and nutrients

Uganda
Specific Guidelines
Section UG4 Wastewater
Civil Design Guide
296
- Effluent and sludge require further treatment and/or appropriate discharge
- Risk of clogging, depending on pre- and primary treatment
- Removing and cleaning the clogged filter media is cumbersome
Prior EMI uses
No prior uses of this technology at EMI have been found.

Uganda
Specific Guidelines
Section UG5 Site Design
Civil Design Guide
297
UG5 SITE DESIGN
GRADING AND STORMWATER DRAINAGE UG5.1.1 SETTING BUILDING ELEVATIONS
A significant component of grading is setting the finished floor elevations of the
proposed buildings. This is done when the building locations are tentatively finalized.
There are many ways to set an elevation for a building – the purpose of this guide is
to give a starting point and general instructions. Keep in mind that there are things
that will not be included in this guide that should be considered for each specific
project.
The finished floor elevation (FFE) is the elevation of the slab of the building. The
starting point of the FFE is the lowest elevation of existing ground in order to minimize
the amount of fill needed.
Factors that limit the upper and lower range of the floor elevation may include:
- If the floor is too low:
o Too much cut
o Steepness of a slope at the back of the building
o Drainage issues if building becomes a “bowl”
- If the floor is too high
o the entrance to the building may need stairs
o foundation wall might be too tall structurally (added expense)
Calculate the slopes to other building structures and/or pathways. Here is a table
showing the maximum allowable slopes. A retaining wall may have to be used if space
does not allow. There may be other preferences or considerations from the architects
or structural engineers, so be sure to consult other team members before finalizing
the elevations and drafting the contours. To find the slope, you can use the formula: 𝑒𝑙𝑒𝑣𝑎𝑡𝑖𝑜𝑛 (𝑚)
𝑑𝑖𝑠𝑡𝑎𝑛𝑐𝑒 (𝑚)× 100%. If the site is very steep, consider adjusting buildings to be more
aligned to the contours.
Type Maximum Grade /
Slope
Ideal Grade /
Slope
General – between buildings,
etc.
2:1 (50%) 3:1 (33%)
Pathway 10% < 5%
Roadway Depends on intended
use
<10%
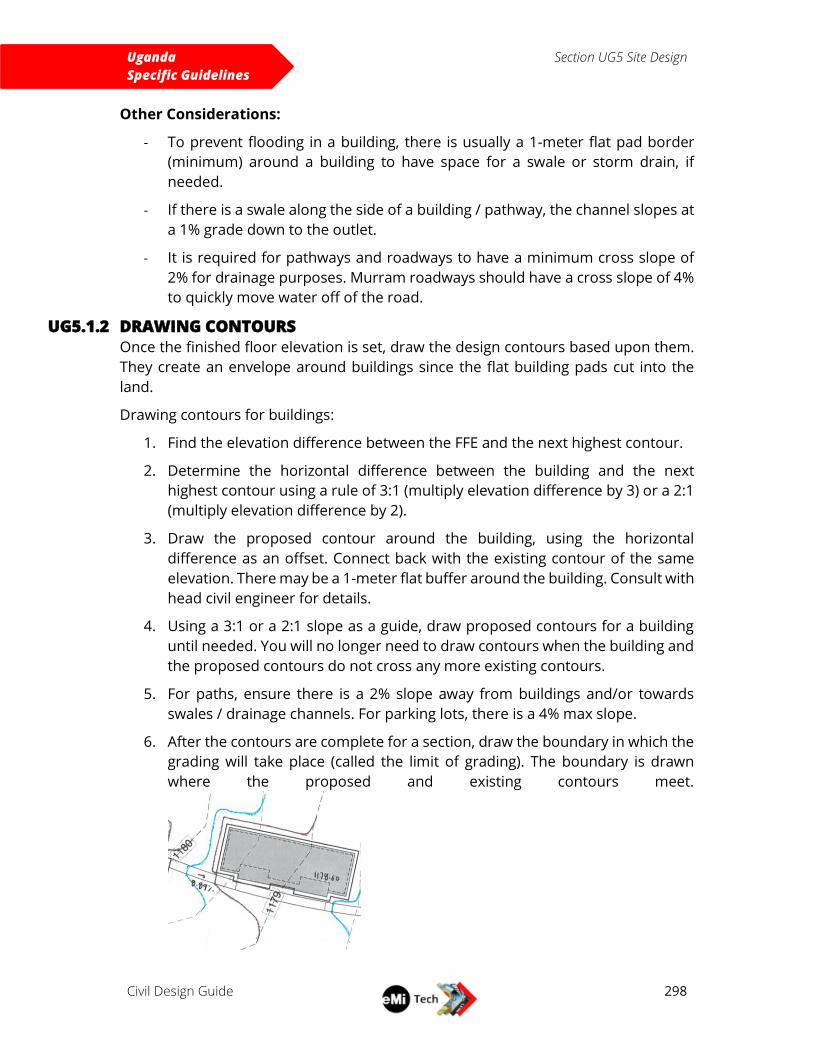
Uganda
Specific Guidelines
Section UG5 Site Design
Civil Design Guide
298
Other Considerations:
- To prevent flooding in a building, there is usually a 1-meter flat pad border
(minimum) around a building to have space for a swale or storm drain, if
needed.
- If there is a swale along the side of a building / pathway, the channel slopes at
a 1% grade down to the outlet.
- It is required for pathways and roadways to have a minimum cross slope of
2% for drainage purposes. Murram roadways should have a cross slope of 4%
to quickly move water off of the road.
UG5.1.2 DRAWING CONTOURS
Once the finished floor elevation is set, draw the design contours based upon them.
They create an envelope around buildings since the flat building pads cut into the
land.
Drawing contours for buildings:
1. Find the elevation difference between the FFE and the next highest contour.
2. Determine the horizontal difference between the building and the next
highest contour using a rule of 3:1 (multiply elevation difference by 3) or a 2:1
(multiply elevation difference by 2).
3. Draw the proposed contour around the building, using the horizontal
difference as an offset. Connect back with the existing contour of the same
elevation. There may be a 1-meter flat buffer around the building. Consult with
head civil engineer for details.
4. Using a 3:1 or a 2:1 slope as a guide, draw proposed contours for a building
until needed. You will no longer need to draw contours when the building and
the proposed contours do not cross any more existing contours.
5. For paths, ensure there is a 2% slope away from buildings and/or towards
swales / drainage channels. For parking lots, there is a 4% max slope.
6. After the contours are complete for a section, draw the boundary in which the
grading will take place (called the limit of grading). The boundary is drawn
where the proposed and existing contours meet.

Uganda
Specific Guidelines
Section UG5 Site Design
Civil Design Guide
299
UG5.1.3 CREATING A GRADING & DRAINAGE PLAN
A Grading plan is a drawing that shows the way the earth will change due to the
project. This is combined with the drainage plan, which shows the proposed changes
to accommodate runoff.
A Grading & Drainage plan must include (but not limited to) the following:
- Finished Floor Elevations of proposed buildings
- Coordinates of Buildings (preferably 3 points per building)
- Slopes of pathways and roadways (arrows point towards the downhill
direction)
- Existing Contours (from the survey)
- Design Contours (How the contours will change accordingly)
- Limit of grading (boundary of the grading)
- Survey Control Points
- Labels of the Control Points, Contours, Building Corners
- Grading sections of buildings, roads, paths, and other key areas where
significant grading is required
- Culverts under roads & walkways
- Drainage swales
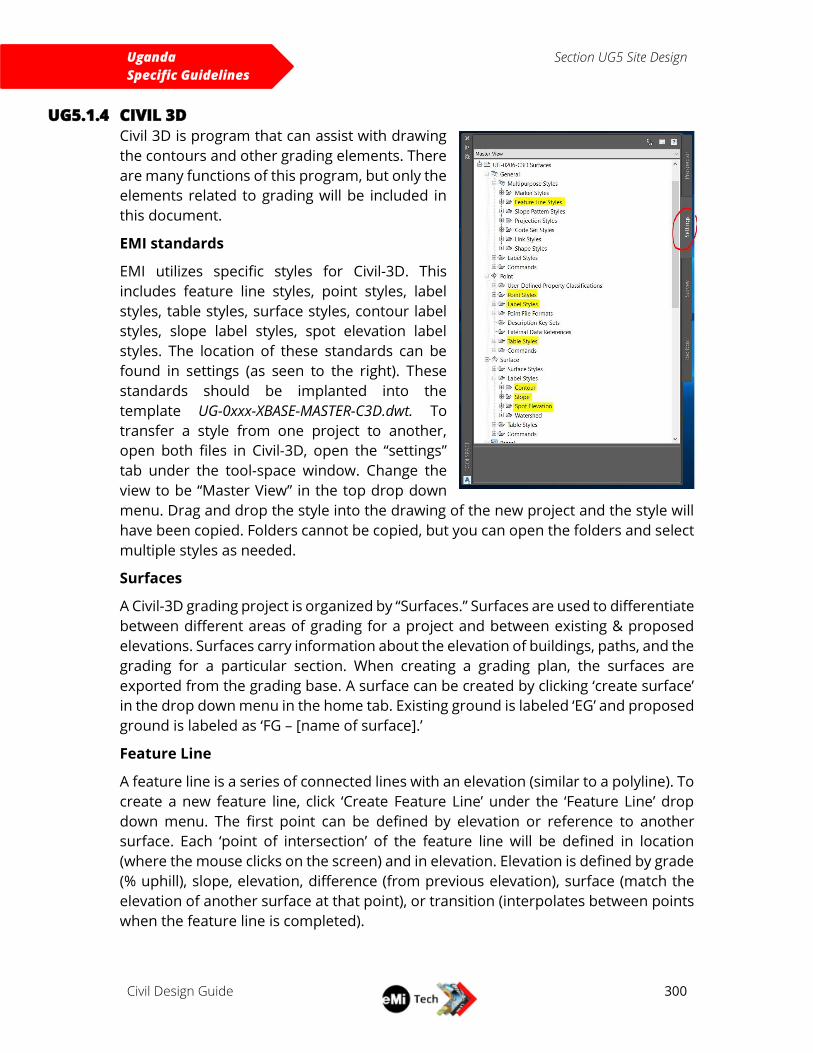
Uganda
Specific Guidelines
Section UG5 Site Design
Civil Design Guide
300
UG5.1.4 CIVIL 3D
Civil 3D is program that can assist with drawing
the contours and other grading elements. There
are many functions of this program, but only the
elements related to grading will be included in
this document.
EMI standards
EMI utilizes specific styles for Civil-3D. This
includes feature line styles, point styles, label
styles, table styles, surface styles, contour label
styles, slope label styles, spot elevation label
styles. The location of these standards can be
found in settings (as seen to the right). These
standards should be implanted into the
template UG-0xxx-XBASE-MASTER-C3D.dwt. To
transfer a style from one project to another,
open both files in Civil-3D, open the “settings”
tab under the tool-space window. Change the
view to be “Master View” in the top drop down
menu. Drag and drop the style into the drawing of the new project and the style will
have been copied. Folders cannot be copied, but you can open the folders and select
multiple styles as needed.
Surfaces
A Civil-3D grading project is organized by “Surfaces.” Surfaces are used to differentiate
between different areas of grading for a project and between existing & proposed
elevations. Surfaces carry information about the elevation of buildings, paths, and the
grading for a particular section. When creating a grading plan, the surfaces are
exported from the grading base. A surface can be created by clicking ‘create surface’
in the drop down menu in the home tab. Existing ground is labeled ‘EG’ and proposed
ground is labeled as ‘FG – [name of surface].’
Feature Line
A feature line is a series of connected lines with an elevation (similar to a polyline). To
create a new feature line, click ‘Create Feature Line’ under the ‘Feature Line’ drop
down menu. The first point can be defined by elevation or reference to another
surface. Each ‘point of intersection’ of the feature line will be defined in location
(where the mouse clicks on the screen) and in elevation. Elevation is defined by grade
(% uphill), slope, elevation, difference (from previous elevation), surface (match the
elevation of another surface at that point), or transition (interpolates between points
when the feature line is completed).
Uganda
Specific Guidelines
Section UG5 Site Design
Civil Design Guide
301
Feature lines can also be created from an existing surface (matches elevation of a
selected surface) or a stepped offset from another feature line. For creation of a
feature line from an existing surface, create a polyline and select ‘Create Feature Lines
from Objects.” In the new pop up window, select ‘Assign elevations.’ In the next
window, select “From Surface” and select the desired surface in the drop down menu.
A feature line from a stepped offset is useful for creating the other side of the path
that slopes downward. For creating a feature line from a stepped offset, you will need
the distance between the lines and the % grade between them
These can be used to define a surface by selecting the feature line and then clicking
‘Add to Surface as Breakline.’ Alternatively, you can go to ‘Breaklines’ (Surfaces a
[Name of Surface] a Definition a Breaklines). Right click on ‘Breaklines’ and click ‘Add’.
In both of these methods, a window will pop up. Click next to proceed and the feature
line will be added.
UG5.1.5 GENERAL INSTRUCTIONS
Grading
The grading function creates a feature line that follow specified rules regarding to
grading. There are no EMI standards for the grading criteria, so one will need to be
copied from another project or a criterion must be created. For the cut & fill slope
projection, choose a 2:1 or 3:1 slope dependent on the requirement of the project.
Tips for adjusting the contours
The contour lines produced by Civil-3D are often not smooth so it may be necessary
to manipulate the surface to display contours as desired.
- One method to adjusting the contours is manually drawing polylines at the
desired location and to setting them to contours of the surface. To add a
contour, you can go ‘Contours’ (Surfaces a [Name of Surface] a Definition a
Contours). Right click on ‘Contours’ and click ‘Add’.
- Another method for adjusting contours is to make a boundary with an
elevation of the existing ground (so the contours match back up to the existing
ground). Draw an enclosed polyline boundary around the area of the surface.
Create a feature line with the polyline from an existing surface. Add the line to
the surface as a Breakline and then set that Breakline to be a boundary of the
surface. To add a boundary, you can go ‘Boundary’ (Surfaces a [Name of
Surface] a Definition a Boundary). Right click on ‘Boundary’ and click ‘Add’.
Display to verify
There are a couple of helpful ways to display the surface to verify the contours are
created properly.
Contours - For the grading plan, the 0.5 and 1-meter contours are typically shown
(available in the EMI standards). It is sometimes helpful to display the contours at
Uganda
Specific Guidelines
Section UG5 Site Design
Civil Design Guide
302
small intervals (like 0.1). The properties for displaying contours is found by right
clicking on the surface of interest and then selecting ‘Surface Properties’ (in the
toolspace window).
Object Viewer – This function enables to view an object in 3 dimensions. Simply select
the lines of interest and click ‘Object Viewer.’
Export
The grading drawing is done in a base drawing, which will need to be exported to a
sheet to be arranged and printed for construction set.
1. In the base drawing, set the working folder. Right-click on ‘Data Shortcuts’ in
the toolspace window and select ‘Set Working Folder…’ The working folder can
be set to [S:\Design\Projects\UG-0XXX-Project Name\Drawings\Civil\Civil 3d
Files\Project Name], where the grading base is saved in the folder called ‘Civil
3D Files.’
2. In the sheet drawing, set the working folder to be the same location as the one
set in step 1.
3. In the base drawing, create data shortcuts. Right-click on ‘Data Shortcuts’ in
the toolspace window and select ‘Data Shortcuts.’ Select the surfaces to be
exported and click ‘OK’
4. In the sheet drawing, create a reference to that surface. Expand on the
‘surfaces’ tab under ‘Data Shortcuts’ and the surfaces that were selected in
step 3 will appear. Right click on the desired surface and select ‘Create
Reference…’ The new surfaces should appear on the ‘Surfaces’ tab in the main
menu of the toolspace selection. When the surface is referenced, changes in
the base drawing will synchronize with the sheet drawing. (don’t promote a
surface – the surface becomes “live” in the sheet and no longer has a
connection to the original surface in the base)
5. In the sheet drawing, change the contours. The contours may not appear
because they are under the default ‘standard’ style. Change the contour to be
the appropriate EMI standard style. *Note: the layer (which dictates the color
and linetype) of a contour is governed by surface style.
Labels
To add a label, highlight the desired surface and select ‘Add Labels’ and then click the
label type. To edit a label property, highlight the label and select ‘Label Properties’ and
click ‘Edit Label Style.’ You can also edit a label property in the Properties Manager.
Label Type Label Style
% Grade Slope with arrow Slope a two point Percent
Spot Elevations with X Spot Elevations Proposed
Finished Floor Elevations Spot Elevations FFE

Uganda
Specific Guidelines
Section UG5 Site Design
Civil Design Guide
303
Elevations Contour – Single or
Multiple
Major – Existing
To create a building marker, select ‘points’ a ‘Create points – Miscellaneous’ a ‘Manual.’
The elevation can be set to zero because only the coordinates are desired. Adjust the
(marker) style to be “eMi EA Standard” and the Point Label Style as “eMi EA Building
Marker.” These building markers can be easily made into a table with the coordinates
using “Add Tables.” Choose the table style to be “Bldg Corners” and select the desired
points. Additional points can be added at any time and coordinates will automatically
be updated if
Uganda
Specific Guidelines
Section UG5 Site Design
Civil Design Guide
304
ROADWAYS Most EMI projects specify the use of a compacted murram wearing course. On some
sites, high-quality murram (a clay/gravel mixture) will be available onsite for
harvesting, but on most sites, high-quality murram should be imported. EMI normally
specifies a 225mm thick layer of compacted murram.
The use of higher quality finishing materials (paving stones, tarmac) may be
requested by the ministry. EMI currently does not have specific tarmac paving design
standards and the engineer will have to evaluate materials and make a site-specific
recommendation in cases where tarmac is requested.
RETAINING WALL DESIGN No deviation from Global Guide section 5.3 Retaining Wall Design.
SITE LAYOUT, ACCESS, AND PARKING No deviation from Global Guide section 5.4 Site Layout, Access and Parking.
Uganda
Specific Guidelines
Section UG6 Solid Waste Management
Civil Design Guide
305
UG6 SOLID WASTE MANAGEMENT
SOLID WASTE COMPOSITION AND GENERATION No deviation from Global Guide section 6.1 Solid Waste Composition and Generation.
SOLID WASTE DISPOSAL No deviation from Global Guide section 6.2 Solid Waste Disposal.