city of marion annual report 2016-2017
TRANSCRIPT

City of Marion Annual Report 2016-2017
CONTENTS PART 1:
WELCOME FROM THE MAYOR 3
MESSAGE FROM THE CEO 4
OUR PURPOSE, VISION AND VALUES 5
ABOUT THE CITY OF MARION – FAST FACTS 6
STRATEGIC MANAGEMENT PLANS 7
BRIEF OVERVIEW OF FINANCIAL PERFORMANCE 8
COUNCIL AREA AND WARD BOUNDARIES 9
ELECTED MEMBERS 10
EXECUTIVE LEADERSHIP TEAM 12
PART 2: GOVERNANCE 13 - 24
PART 3: FINANCIAL MANAGEMENT 25 - 29
PART 4: KEY ACHIEMENTS THEMES 30 - 41
PART 5: CITY OF MARION AUDITED FINANCIAL STATEMENTS 42 91
PART 6: SOUTHERN REGION WASTE RESOURCE AUTHORITY AUDITED FINANCIAL STATEMENTS
92 - 121
PART 7: COUNCIL SOLUTIONS AUDITED FINANCIAL STATEMENTS 122 - 136
-
WELCOME FROM THE MAYOR This is my third annual report message since being elected Mayor in November 2014.
Since then we have seen reduced rate rises every year. In 2016/17 we adopted a rate rise of 2.5%. The downward trend continues.
Since 2014 we have also reduced Council debt. In 2016/17 Council’s debt reduced from $10.2 in June 2016 to 9.1m as at June 2017. The downward trend continues.
While reducing rate rises and paying off debt we have put millions of dollars toward popular infrastructure projects. Your Mayor's lobbying has brought in many millions of dollars of funding from State and Federal Governments, for which we are all very grateful. These projects will revive our parks, playgrounds and green spaces plus address critical traffic issues including;
A phenomenal $174 million in total for Oaklands Crossing has been secured ($95m from Federal Government, $74.3m from the State Government and $5m in-principle commitment from the City of Marion).
$8m redevelopment is committed for Edwardstown Oval Soldiers Memorial Ground ($4m from Federal Government, $4m from City of Marion).
$3.5m fully funded to build a Union Cycliste Internationale (UCI) standing BMX track in O’HalloranHill. Marion and Onkaparinga Councils contributing $750,000 each toward this project and $2m fromState Government.
Major projects aside, Council has continued to evaluate and improve its strategic vision adopting Annual Business Plans (1 and 3 year targets) and 10 Year Strategic Plan, re-evaluated its many facilities and properties – all to ensure we do better and potentially more with what we have.
With the support of Elected Members, our CEO Adrian Skull is improving the culture and efficiency of the organisation, so that we put the resident first in everything we do. He has also driven a series of service reviews to improve delivery of the 130 services we offer to the community. It's not just roads and rubbish!
A highlight toward the end of the financial year included a visit from Governor of SA, Hieu Van Le, AC, on his first official tour of Marion. His Excellency declared the renewed activity at Tonsley the “future of South Australia”.
Marion Council continues to seek extraction of maximum benefit from the Local Government Association. Our pressure and short-term departure from the LGA resulted in reduced membership fees and the promise of other benefits. We chose not to participate in the LGA "anti rate cap" campaign, since most Councillors and the Mayor agreed that we must steadfastly remain apolitical and constructive in the political environment. In any event, a Government-imposed cap on our rate rises would have little impact as we are performing so well financially.
As Mayor I have been fortunate to have solid support from most Councillors to achieve the successes described above. I'm equally glad to see we are developing a very strong management team and maintaining an enthusiastic and capable workforce. Thanks too to the residents who respond to our consultation efforts - their voices make our area a better place to live.
Yours faithfully,
Kris Hanna, Mayor City of Marion
Page 3
MESSAGE FROM THE CEO Welcome to our 2016/17 Annual Report. Reflecting on the past year, we have seen many positive changes in our city.
Of note, we continue to collaborate and build upon activating businesses in the city particularly within the Tonsley Innovation District with Tonsley’s key stakeholders including the State Government and Flinders University. This site now has 112 businesses operating with 6,500 tertiary students studying at Tonsley. We anticipate the number of students will increase to 8,500 by the end of the project.
We work closely with both Federal and State government in many areas including helping to activate the Tonsley POD, where we host and participate in interactive workshops and presentations.
We have continued to support the many thought leaders in our community, applauding 33 individual and group recipients of our Unsung Heroes Award.
Our Mayor bestowed Olympic gold medallist Kyle Chalmers with a Key to the City in late 2016. It was inspiring to hear Mr Chalmers' Olympic story and pleasing to hear him acknowledge our outstanding aquatic facilities.
Our major projects and achievements this year included:
A 50 percent commitment to the $19.75 million upgrade of our Mitchell Park Sports and Community Centre.We are seeking funding for the remaining 50 percent to enable this key project to proceed. Plans include anindoor recreation facility with multi-purpose sports courts, a two-storey community centre, club gym, function area and café.
There has been a considerable and ongoing transformation to the Oaklands Estate Reserve and RecreationPlaza. There are two distinct areas which will include Stage 2 of the Recreation Plaza and the development ofthe Oaklands Reserve area to the south of the site.
Improvements to the Recreation Plaza will include replacing the old Roundhouse with a new rotunda, linemarking for trike and bike riders, skate mounds, new table tennis and picnic tables, benches and a picnicshelter. Construction is due to commence in February 2018 and we anticipate this will be finished by mid-2018.
The Oaklands Estate Reserve development (south of the site) will include consideration of existing site features including the vineyard, Japanese garden, duck pond, play opportunities, biodiversity corridor and significant
trees. Construction is due to commence in mid-2018 and will be finished by the end of 2018.
These are just a few of the numerous projects in development. Marion continues to make inroads in urban activation, business development and providing a growing number of parks, playgrounds and sporting facilities. Central to these plans are providing areas to facilitate ongoing education as well as outdoor activities, supporting local sports and
encouraging community wellbeing.
I would like to thank the Mayor, Elected Members, the community, and staff for their contributions over the past year.
Regards,
Adrian Skull, Chief Executive Officer
Page 4
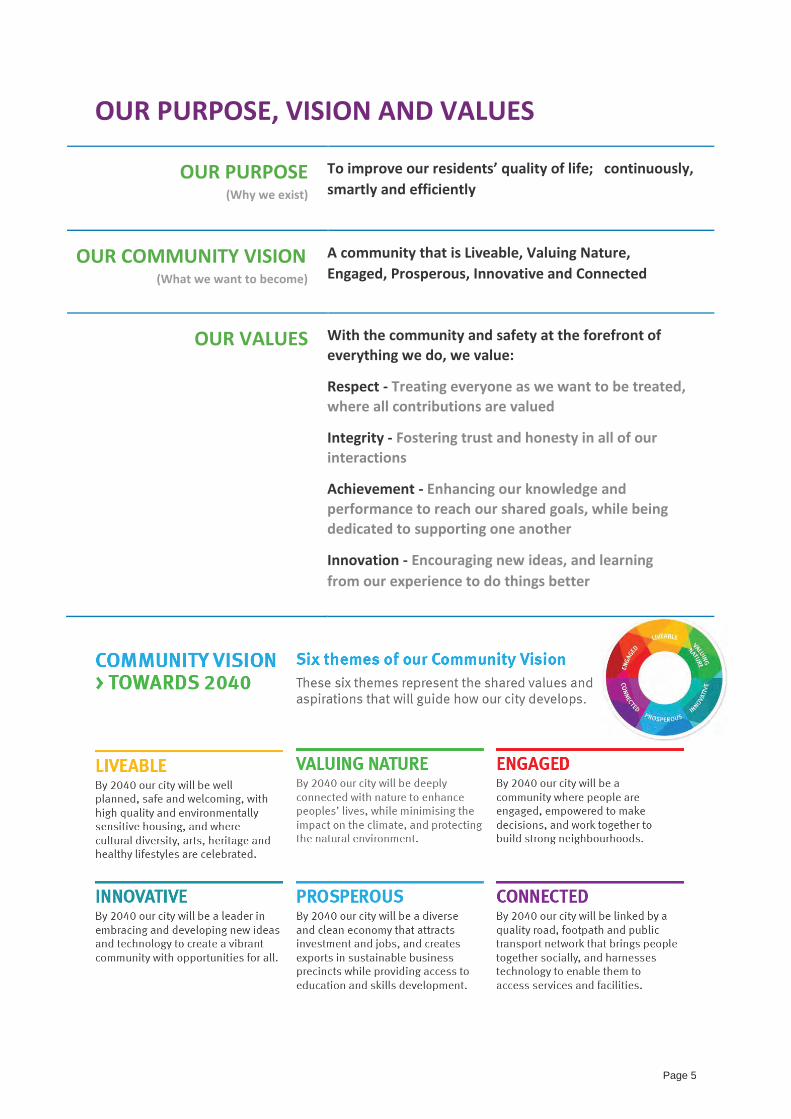
OUR PURPOSE, VISION AND VALUES
OUR PURPOSE (Why we exist)
To improve our residents’ quality of life; continuously, smartly and efficiently
OUR COMMUNITY VISION (What we want to become)
A community that is Liveable, Valuing Nature, Engaged, Prosperous, Innovative and Connected
OUR VALUES With the community and safety at the forefront of everything we do, we value: Respect - Treating everyone as we want to be treated, where all contributions are valued Integrity - Fostering trust and honesty in all of our interactions Achievement - Enhancing our knowledge and performance to reach our shared goals, while being dedicated to supporting one another Innovation - Encouraging new ideas, and learning from our experience to do things better
ABOUT CITY OF MARION – FAST FACTS
Page 5

ABOUT THE CITY OF MARION – FAST FACTS
Location Land area Estimated resident population Residents born overseas Landmarks Gross Regional Profit Leading Employment Sectors Elected Members Wards Operating Expenditure Revenue Rateable properties Average residential rate Rate increase from 2015/16 Library items loaned Website visit Volunteers Street trees planted Development applications Value of Development applications Distance of footpaths Distance of roads Distance of drains
South-Western suburbs of Adelaide 5,564 metres squared 88,7771 20,9262 Cove Civic Centre Hallett Cove Coastal Walking Trail 7.5km Hallett Cove Conservation Park Marion Cultural Centre Marion Outdoor Pool Morphettville Racecourse Oaklands Wetlands & Recreation Plaza SA Aquatic and Leisure Centre Tonsley Park Westfield Shopping Centre $3m3 Retail, Health, Community, Manufacturing 13 6 $76.5 million $88.2 million with $72.6 million from rates 42,289 $1381 2.5% (lowest rate rise in 15 years) 891,382 513,963 367 contributing 41,489 hrs totalling $1.1m 1400 1789 $180 million 783.21 kms 459.65 kms 264.8 kms (2.9km new drains laid 2016/17)
1 Source: http://profile.id.com.au/marion/home quoting Australian Bureau of Statistics Estimated Residential Population 2016. 2 Source: http://profile.id.com.au/marion/overseas-arrivals - figures utilising Australian Bureau of Statistics 2011 population data. 3 Source: http://economic-indicators.id.com.au/?Year=2016&StateId=4&submissionGuid=dff566ad-9f36-4bb3-a6bc-cf7bf400c39d. 2015/16 financial year data quoting: http://www.nieir.com.au/
Page 6

STRATEGIC MANAGEMENT PLANS The City of Marion has a strategic management framework as a mechanism to ensure strategic decision-making is aligned with the aspirational themes in Council’s 30-Year Community Vision – Towards 2040. During 2016/17 Council achieved the following key components of its framework: 10-Year Strategic Plan 2017-2027 This plan was adopted providing an overarching road map that identifies key areas of focus over the next 10 years to meet future key challenges and opportunities under each of the community vision themes. 4 3-Year Business Plan 2016-2019 The Business Plan was adopted providing action-oriented direction of the strategic priorities that are to be delivered over Council’s term to meet the aspirational themes of the community vision.5 3-Year Work Area Plans To support the delivery of projects in the 3-Year Business Plan, 25 Work Area Plans (including over 190 projects in additional to core services) have been developed and are at various stages of implementation. These plans identify objectives, timeframes and required resources of a project which are monitored on a monthly basis. These plans are a key tool used to ensure Council has the capacity to deliver on its strategic directions for our community.
4 City of Marion General Council meeting 13 June 2017, Reference: GC130617R08 5 City of Marion General Council meeting 27 September 2016, Reference: GC270916R03
Page 7
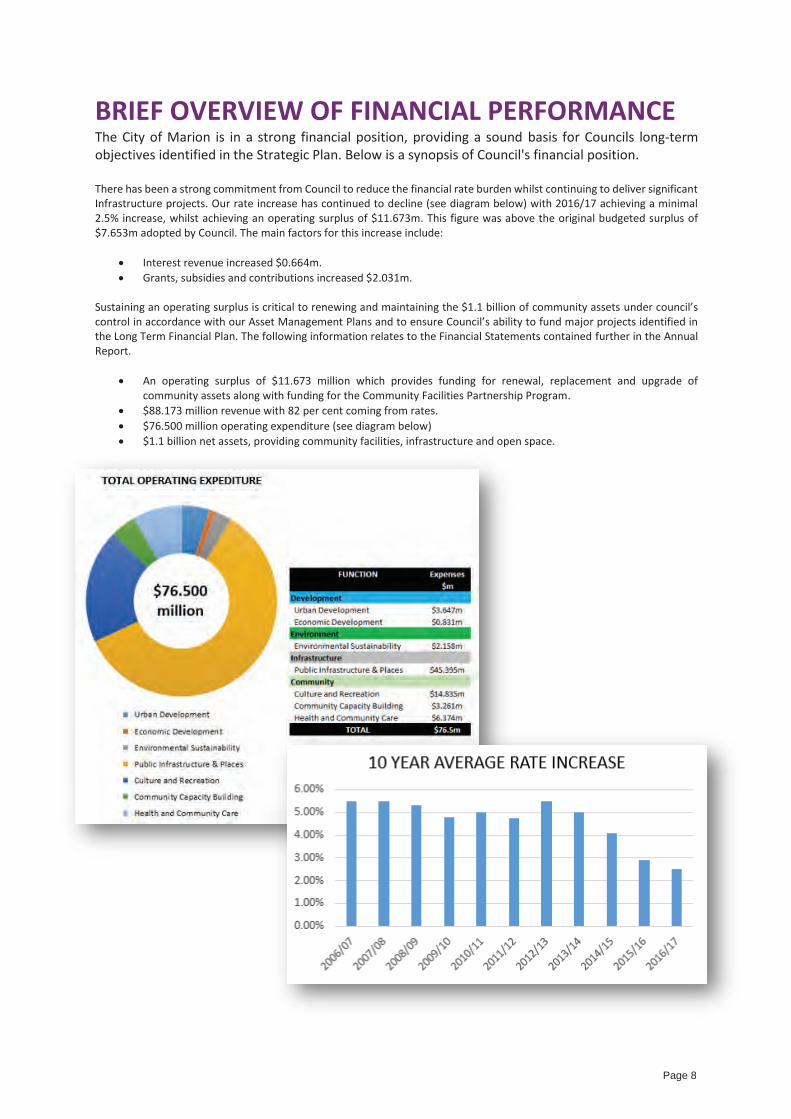
BRIEF OVERVIEW OF FINANCIAL PERFORMANCE The City of Marion is in a strong financial position, providing a sound basis for Councils long-term objectives identified in the Strategic Plan. Below is a synopsis of Council's financial position.
There has been a strong commitment from Council to reduce the financial rate burden whilst continuing to deliver significant Infrastructure projects. Our rate increase has continued to decline (see diagram below) with 2016/17 achieving a minimal 2.5% increase, whilst achieving an operating surplus of $11.673m. This figure was above the original budgeted surplus of $7.653m adopted by Council. The main factors for this increase include:
Interest revenue increased $0.664m. Grants, subsidies and contributions increased $2.031m.
Sustaining an operating surplus is critical to renewing and maintaining the $1.1 billion of community assets under council’s control in accordance with our Asset Management Plans and to ensure Council’s ability to fund major projects identified in the Long Term Financial Plan. The following information relates to the Financial Statements contained further in the Annual Report.
An operating surplus of $11.673 million which provides funding for renewal, replacement and upgrade ofcommunity assets along with funding for the Community Facilities Partnership Program.
$88.173 million revenue with 82 per cent coming from rates. $76.500 million operating expenditure (see diagram below) $1.1 billion net assets, providing community facilities, infrastructure and open space.
Page 8
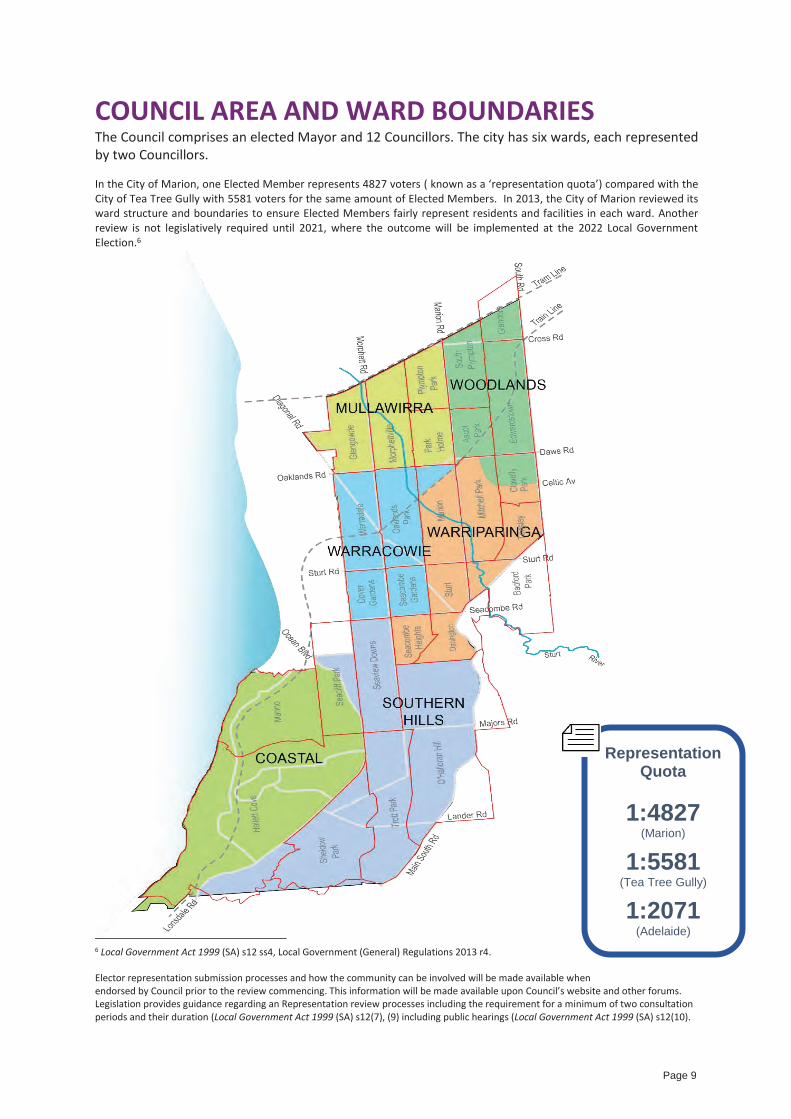
COUNCIL AREA AND WARD BOUNDARIES The Council comprises an elected Mayor and 12 Councillors. The city has six wards, each represented by two Councillors. In the City of Marion, one Elected Member represents 4827 voters ( known as a ‘representation quota’) compared with the City of Tea Tree Gully with 5581 voters for the same amount of Elected Members. In 2013, the City of Marion reviewed its ward structure and boundaries to ensure Elected Members fairly represent residents and facilities in each ward. Another review is not legislatively required until 2021, where the outcome will be implemented at the 2022 Local Government Election.6
6 Local Government Act 1999 (SA) s12 ss4, Local Government (General) Regulations 2013 r4. Elector representation submission processes and how the community can be involved will be made available when endorsed by Council prior to the review commencing. This information will be made available upon Council’s website and other forums. Legislation provides guidance regarding an Representation review processes including the requirement for a minimum of two consultation periods and their duration (Local Government Act 1999 (SA) s12(7), (9) including public hearings (Local Government Act 1999 (SA) s12(10).
Representation Quota
1:4827(Marion)
1:5581(Tea Tree Gully)
1:2071(Adelaide)
Page 9
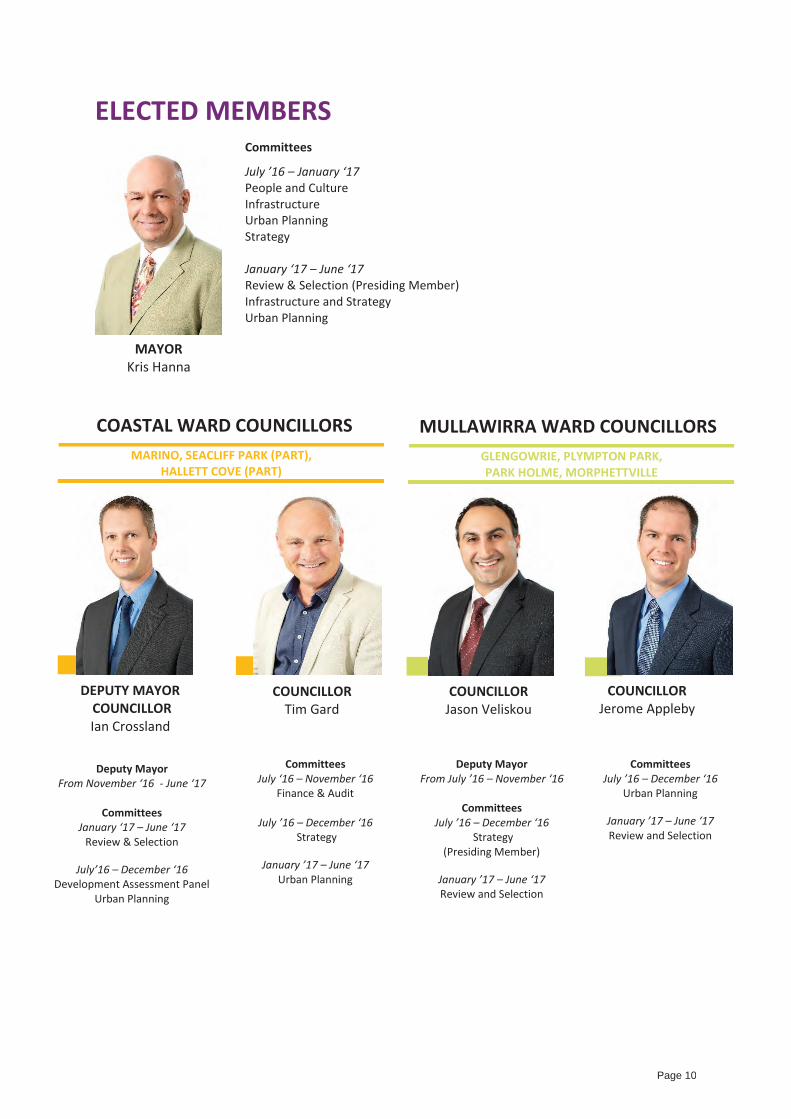
ELECTED MEMBERS
MAYOR Kris Hanna
Committees
July ’16 – January ‘17 People and Culture Infrastructure Urban Planning Strategy January ‘17 – June ‘17 Review & Selection (Presiding Member) Infrastructure and Strategy Urban Planning
DEPUTY MAYOR COUNCILLOR Ian Crossland
COUNCILLOR Tim Gard
COASTAL WARD COUNCILLORS
Deputy Mayor From November ‘16 - June ‘17
Committees
January ‘17 – June ‘17 Review & Selection
July’16 – December ‘16
Development Assessment Panel Urban Planning
Committees July ‘16 – November ‘16
Finance & Audit
July ’16 – December ‘16 Strategy
January ’17 – June ‘17
Urban Planning
MARINO, SEACLIFF PARK (PART), HALLETT COVE (PART)
MULLAWIRRA WARD COUNCILLORS
COUNCILLOR Jason Veliskou
COUNCILLOR Jerome Appleby
Deputy Mayor From July ’16 – November ‘16
Committees
July ’16 – December ‘16 Strategy
(Presiding Member)
January ’17 – June ‘17 Review and Selection
Committees July ’16 – December ‘16
Urban Planning
January ’17 – June ‘17 Review and Selection
GLENGOWRIE, PLYMPTON PARK, PARK HOLME, MORPHETTVILLE
Page 10

SOUTHERN HILLS WARD COUNCILLORS
COUNCILLOR Janet Byram
COUNCILLOR Nick Westwood
Committees July ’16 – December ‘16
Infrastructure (Presiding Member)
Jan ’17 – July ‘17
Infrastructure and Strategy (Presiding Member)
Committees July ’16 – December ‘16
Strategy
December ’16 – June ‘17 Development Assessment Panel
January ’17 – June ‘17
Infrastructure and Strategy
SEAVIEW DOWNS, O’HALLORAN HILL (PART), TROTT PARK, SHEIDOW PARK (PART),
SEACLIFF PARK (PART), HALLETT COVE (PART)
WARRACOWIE WARD COUNCILLORS
COUNCILLOR Bruce Hull
COUNCILLOR Nathan Prior
Committees July ’16 – December ‘16
People and Culture
January ’17 – June ‘17 Infrastructure and Strategy
Committees July ’16 – December ‘16
Urban Planning (Presiding Member)
January ’17 – June ‘17
Urban Planning
WARRADALE, OAKLANDS PARK, DOVER GARDENS, SEACOMBE GARDENS, MARION (PART)
WARRIPARINGA WARD COUNCILLORS
COUNCILLOR Raelene Telfer
COUNCILLOR Luke Hutchinson
Committees July ‘16 – November ‘16 November ’16 – June ‘17
Finance & Audit
July ’16 – December ‘16 People and Culture (Presiding Member)
January ’17 – June ‘17
Urban Planning
Committees July ‘16 – December ‘16 December ’16 – June ‘17
Development Assessment Panel
July ’16 – December ‘16 People and Culture
January ’17 – June ‘17
Urban Planning (Presiding Member)
MARION (PART), MITCHELL PARK (PART), STURT, BEDFORD PARK (PART), CLOVELLY PARK (PART),
SEACOMBE HEIGHTS, DARLINGTON (PART)
WOODLANDS WARD COUNCILLORS
COUNCILLOR Nick Kerry
COUNCILLOR Tim Pfeiffer
Committees July ‘16 – December ‘16 December ’16 – June ‘17
Development Assessment Panel
July ’16 – December ‘16 Infrastructure
November ’16 – June ‘17
Finance & Audit
January ’17 – June ‘17 Infrastructure and Strategy
Committees July ’16 – December ‘16
Infrastructure
January ’17 – June ‘17 Infrastructure and Strategy
SOUTH PLYMPTON, GLANDORE (PART), ASCOT PARK, EDWARDSTOWN, MITCHELL PARK (PART),
CLOVELLY PARK (PART)
Page 11
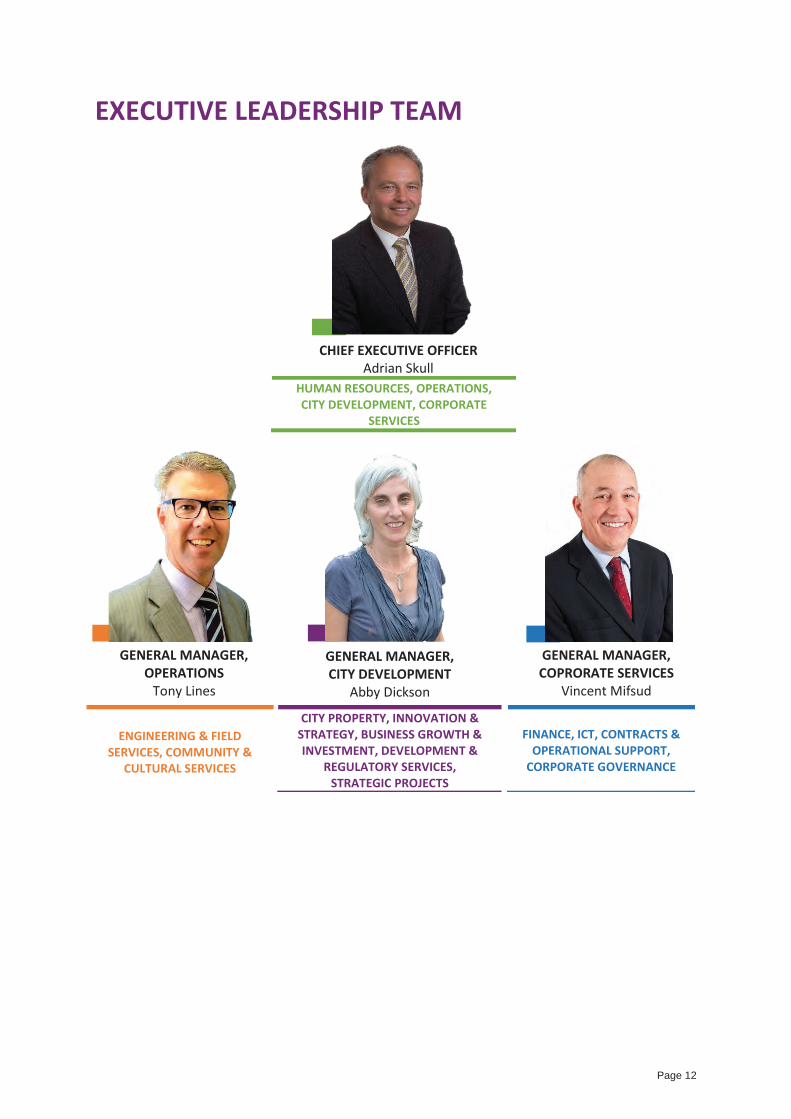
EXECUTIVE LEADERSHIP TEAM
GENERAL MANAGER, CITY DEVELOPMENT
Abby Dickson
CITY PROPERTY, INNOVATION & STRATEGY, BUSINESS GROWTH & INVESTMENT, DEVELOPMENT &
REGULATORY SERVICES, STRATEGIC PROJECTS
GENERAL MANAGER, OPERATIONS
Tony Lines
ENGINEERING & FIELD SERVICES, COMMUNITY &
CULTURAL SERVICES
GENERAL MANAGER, COPRORATE SERVICES
Vincent Mifsud
FINANCE, ICT, CONTRACTS &
OPERATIONAL SUPPORT, CORPORATE GOVERNANCE
CHIEF EXECUTIVE OFFICER Adrian Skull
HUMAN RESOURCES, OPERATIONS, CITY DEVELOPMENT, CORPORATE
SERVICES
Page 12
marion.sa.gov.au | City of Marion – Annual Report 2016/17
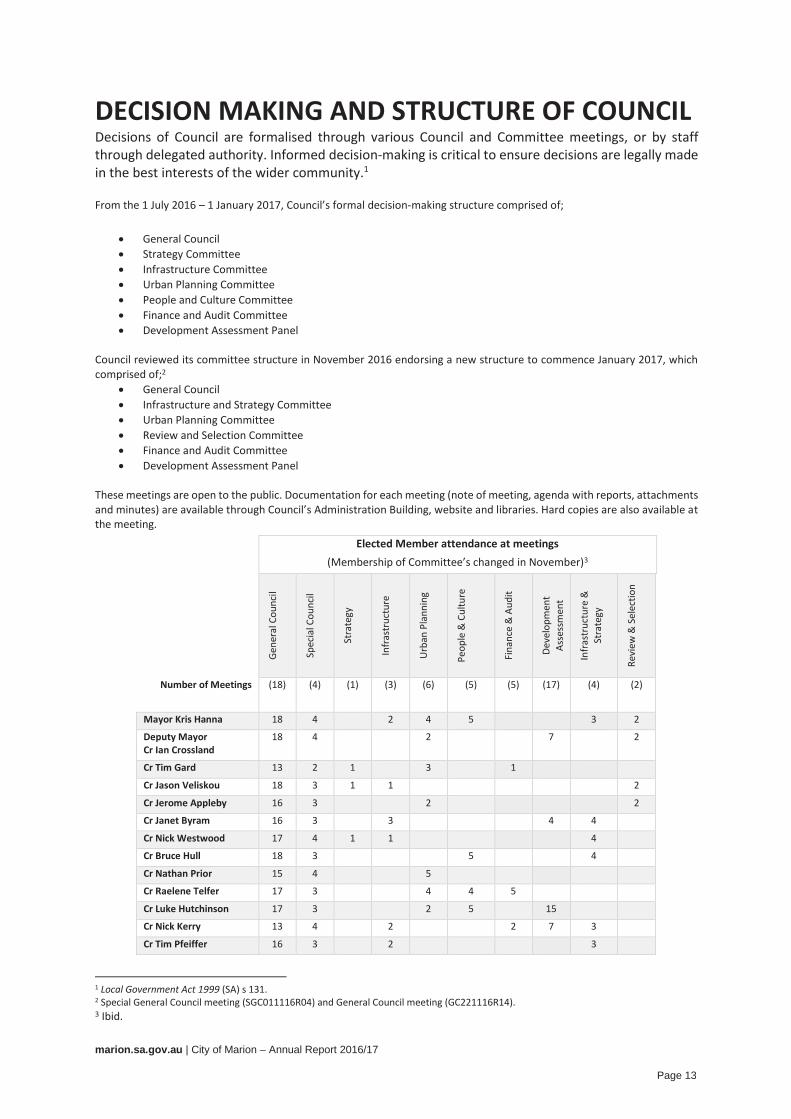
DECISION MAKING AND STRUCTURE OF COUNCIL Decisions of Council are formalised through various Council and Committee meetings, or by staff through delegated authority. Informed decision-making is critical to ensure decisions are legally made in the best interests of the wider community.1
From the 1 July 2016 – 1 January 2017, Council’s formal decision-making structure comprised of;
General Council Strategy Committee Infrastructure Committee Urban Planning Committee People and Culture Committee Finance and Audit Committee Development Assessment Panel
Council reviewed its committee structure in November 2016 endorsing a new structure to commence January 2017, which comprised of;2
General Council Infrastructure and Strategy Committee Urban Planning Committee Review and Selection Committee Finance and Audit Committee Development Assessment Panel
These meetings are open to the public. Documentation for each meeting (note of meeting, agenda with reports, attachments and minutes) are available through Council’s Administration Building, website and libraries. Hard copies are also available at the meeting.
1 Local Government Act 1999 (SA) s 131. 2 Special General Council meeting (SGC011116R04) and General Council meeting (GC221116R14). 3 Ibid.
Elected Member attendance at meetings (Membership of Committee’s changed in November)3
Gene
ral C
ounc
il
Spec
ial C
ounc
il
Stra
tegy
Infr
astr
uctu
re
Urb
an P
lann
ing
Peop
le &
Cul
ture
Fina
nce
& A
udit
Deve
lopm
ent
Asse
ssm
ent
Infr
astr
uctu
re &
St
rate
gy
Revi
ew &
Sel
ectio
n
Number of Meetings (18) (4) (1) (3) (6) (5) (5) (17) (4)
(2)
Mayor Kris Hanna 18 4 2 4 5 3 2
Deputy Mayor Cr Ian Crossland
18 4 2 7 2
Cr Tim Gard 13 2 1 3 1
Cr Jason Veliskou 18 3 1 1 2
Cr Jerome Appleby 16 3 2 2
Cr Janet Byram 16 3 3 4 4
Cr Nick Westwood 17 4 1 1 4
Cr Bruce Hull 18 3 5 4
Cr Nathan Prior 15 4 5
Cr Raelene Telfer 17 3 4 4 5
Cr Luke Hutchinson 17 3 2 5 15
Cr Nick Kerry 13 4 2 2 7 3
Cr Tim Pfeiffer 16 3 2 3
Page 13
marion.sa.gov.au | City of Marion – Annual Report 2016/17
COUNCIL MEETINGS The Local Government Act 1999 (SA) provides the legislative framework for legal and transparent Council decision-making expected from the City of Marion and wider South Australian community.
FUNCTION To make decisions on behalf of their constituents as a collective for the benefit of the community. OTHER DETAILS All Elected Members attend. Council meets on the second and/or fourth Tuesday of the Month with special meetings called when required. RESOLUTIONS OF GENERAL COUNCIL A ‘resolution’4 is a legal decision of the collective will of all Elected Members that unite to form the decision making body of Council. During the financial year, 610 resolutions were made by Council resulting from 221 corporate reports seeking a decision. Deputations heard:
Park Holme Community Hall (June 2016) Lapwing Street Reserve (October 2016) Maesbury Circuit Reserve Irrigation (December 2016) Asset Optimisation of Council Property – Louise Avenue Reserve (January 2017) Preservation of Community Facilities on Nannigai Reserve (February 2017) McConnell Reserve Courts (February 2017 Marion City Band Funding proposal (February 2017) Marion Outdoor Pool, Proposed Hughes Court Reserve Development (March 2017) Proposed Removal of Playground at Resolute Crescent Hallett Cove (May 2017) The repair and upgrade of winches at Cosgrove Hall (June 2017)
Petitions submitted:
Heavy Vehicle Traffic using Harding Street, Glengowrie (August 2016) Removal of Lapwing Street Reserve Playspace (October 2016) Irrigation of Parsons Grove (November 2016 – Adjourned to December 2016) Irrigation of Parsons Grove Reserve, Maesbury Circuit Reserve Irrigation (December 2016) Preservation of the Nannigai Reserve Playspace/Tennis Court (January 2017) McConnell Reserve Courts, Resolute Crescent Reserve (February 2017) Development Application 100/2016/1785 (March 2017)
Workshops/Presentations: (all occurring June 2017)
Castle Plaza Activity Centre DPA By Vicinity Centre’s Presentation regarding the re-zoning of the former Hills Industry Site
Public Submission on the Draft Annual Business Plan 2017/18 By representative of the Marino Residents Association.
Housing Diversity DPA By Department of Planning Transport and Infrastructure
ELECTED MEMBERS5 The Local Government Act 1999 (SA) provides the legislative framework and ambit of responsibility for an Elected Member as an individual and as they unite to form the decision making body of Council. Their role is fundamental in delivering upon the expectations of the local and wider community.
4 Source: http://www.lexisnexis.com.access.library.unisa.edu.au/au/legal/results/enhdocview.do?docLinkInd=true&ersKey=23_T26535371726&format=GNBFULL&startDocNo=0&resultsUrlKey=0_T26535374568&backKey=20_T26535374571&csi=267785&docNo=4&scrollToPosition=0. 5 Local Government Act 1999 (SA) s 59
Page 14
marion.sa.gov.au | City of Marion – Annual Report 2016/17
ELECTED MEMBER ALLOWANCES6 An elected member is entitled to an annual allowance determined every four years by the Remuneration Tribunal of South Australia. The tribunal’s determination on 28 July 2014 provides for a CPI increase each financial year as stated below. This adjustment came into effect as of 7 November 2016; Mayor $77,796 Deputy Mayor $24,311 Elected Members $19,449
TRAINING AND DEVELOPMENT7
Elected members have ongoing training based on current council business and their own professional development requirements. Mayor Kris Hanna attended two conferences (Engaging Connecting and Informing Business Conference/Breakfast and a Southern Business Conference/Breakfast). Clr Raelene Telfer attended the Friends of Hallett Cove Parks Forum and the Southern Business Conference/Breakfast. Other training sessions throughout the year (EM Forum) for Elected Members include;
Outlook Training session (September 2016)
Kaurna Cultural Heritage Awareness Training (October 2016)
Cash Flow – How the budget works (November 2016)
EM Professional Development – General (February 2017)
Conflict of Interest Provisions (May 2017)
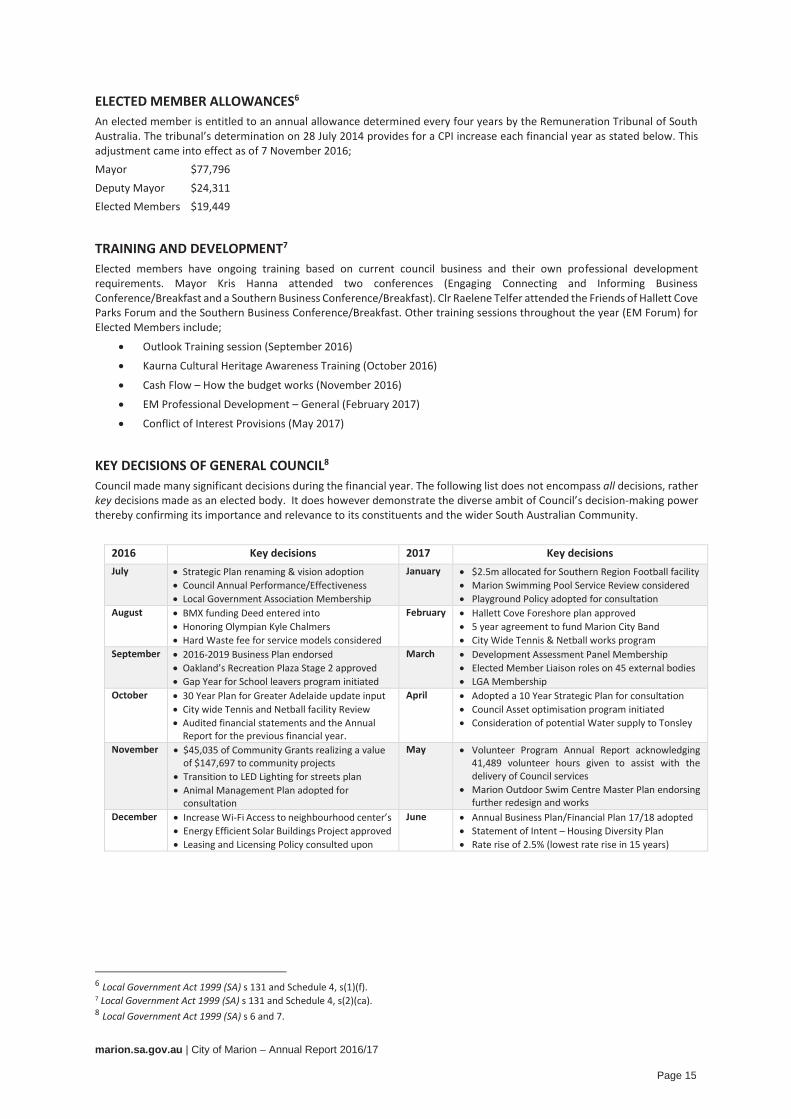
KEY DECISIONS OF GENERAL COUNCIL8 Council made many significant decisions during the financial year. The following list does not encompass all decisions, rather key decisions made as an elected body. It does however demonstrate the diverse ambit of Council’s decision-making power thereby confirming its importance and relevance to its constituents and the wider South Australian Community.
2016 Key decisions 2017 Key decisions July Strategic Plan renaming & vision adoption
Council Annual Performance/Effectiveness Local Government Association Membership
January $2.5m allocated for Southern Region Football facility Marion Swimming Pool Service Review considered Playground Policy adopted for consultation
August BMX funding Deed entered into Honoring Olympian Kyle Chalmers Hard Waste fee for service models considered
February Hallett Cove Foreshore plan approved 5 year agreement to fund Marion City Band City Wide Tennis & Netball works program
September 2016-2019 Business Plan endorsed Oakland’s Recreation Plaza Stage 2 approved Gap Year for School leavers program initiated
March Development Assessment Panel Membership Elected Member Liaison roles on 45 external bodies LGA Membership
October 30 Year Plan for Greater Adelaide update input City wide Tennis and Netball facility Review Audited financial statements and the Annual
Report for the previous financial year.
April Adopted a 10 Year Strategic Plan for consultation Council Asset optimisation program initiated Consideration of potential Water supply to Tonsley
November $45,035 of Community Grants realizing a value of $147,697 to community projects
Transition to LED Lighting for streets plan Animal Management Plan adopted for
consultation
May Volunteer Program Annual Report acknowledging 41,489 volunteer hours given to assist with the delivery of Council services
Marion Outdoor Swim Centre Master Plan endorsing further redesign and works
December Increase Wi-Fi Access to neighbourhood center’s Energy Efficient Solar Buildings Project approved Leasing and Licensing Policy consulted upon
June Annual Business Plan/Financial Plan 17/18 adopted Statement of Intent – Housing Diversity Plan Rate rise of 2.5% (lowest rate rise in 15 years)
6 Local Government Act 1999 (SA) s 131 and Schedule 4, s(1)(f). 7 Local Government Act 1999 (SA) s 131 and Schedule 4, s(2)(ca). 8 Local Government Act 1999 (SA) s 6 and 7.
Page 15
marion.sa.gov.au | City of Marion – Annual Report 2016/17
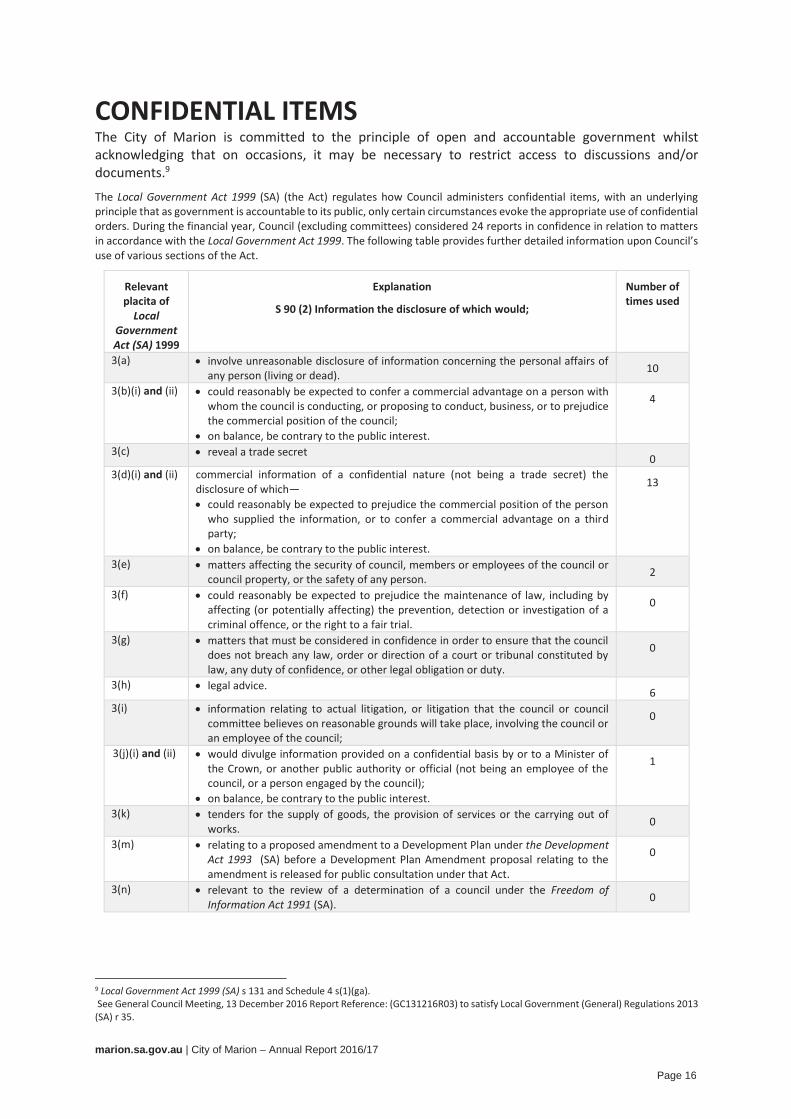
CONFIDENTIAL ITEMS The City of Marion is committed to the principle of open and accountable government whilst acknowledging that on occasions, it may be necessary to restrict access to discussions and/or documents.9
The Local Government Act 1999 (SA) (the Act) regulates how Council administers confidential items, with an underlying principle that as government is accountable to its public, only certain circumstances evoke the appropriate use of confidential orders. During the financial year, Council (excluding committees) considered 24 reports in confidence in relation to matters in accordance with the Local Government Act 1999. The following table provides further detailed information upon Council’s use of various sections of the Act.
Relevant placita of
Local Government Act (SA) 1999
Explanation
S 90 (2) Information the disclosure of which would;
Number of times used
3(a) involve unreasonable disclosure of information concerning the personal affairs of any person (living or dead). 10
3(b)(i) and (ii) could reasonably be expected to confer a commercial advantage on a person with whom the council is conducting, or proposing to conduct, business, or to prejudice the commercial position of the council;
on balance, be contrary to the public interest.
4
3(c) reveal a trade secret 0 3(d)(i) and (ii) commercial information of a confidential nature (not being a trade secret) the
disclosure of which— could reasonably be expected to prejudice the commercial position of the person
who supplied the information, or to confer a commercial advantage on a third party;
on balance, be contrary to the public interest.
13
3(e) matters affecting the security of council, members or employees of the council or council property, or the safety of any person. 2
3(f) could reasonably be expected to prejudice the maintenance of law, including by affecting (or potentially affecting) the prevention, detection or investigation of a criminal offence, or the right to a fair trial.
0
3(g) matters that must be considered in confidence in order to ensure that the council does not breach any law, order or direction of a court or tribunal constituted by law, any duty of confidence, or other legal obligation or duty.
0
3(h) legal advice. 6 3(i) information relating to actual litigation, or litigation that the council or council
committee believes on reasonable grounds will take place, involving the council or an employee of the council;
0
3(j)(i) and (ii) would divulge information provided on a confidential basis by or to a Minister of the Crown, or another public authority or official (not being an employee of the council, or a person engaged by the council);
on balance, be contrary to the public interest.
1
3(k) tenders for the supply of goods, the provision of services or the carrying out of works. 0
3(m) relating to a proposed amendment to a Development Plan under the Development Act 1993 (SA) before a Development Plan Amendment proposal relating to the amendment is released for public consultation under that Act.
0
3(n) relevant to the review of a determination of a council under the Freedom of Information Act 1991 (SA). 0
9 Local Government Act 1999 (SA) s 131 and Schedule 4 s(1)(ga). See General Council Meeting, 13 December 2016 Report Reference: (GC131216R03) to satisfy Local Government (General) Regulations 2013 (SA) r 35.
Page 16
marion.sa.gov.au | City of Marion – Annual Report 2016/17
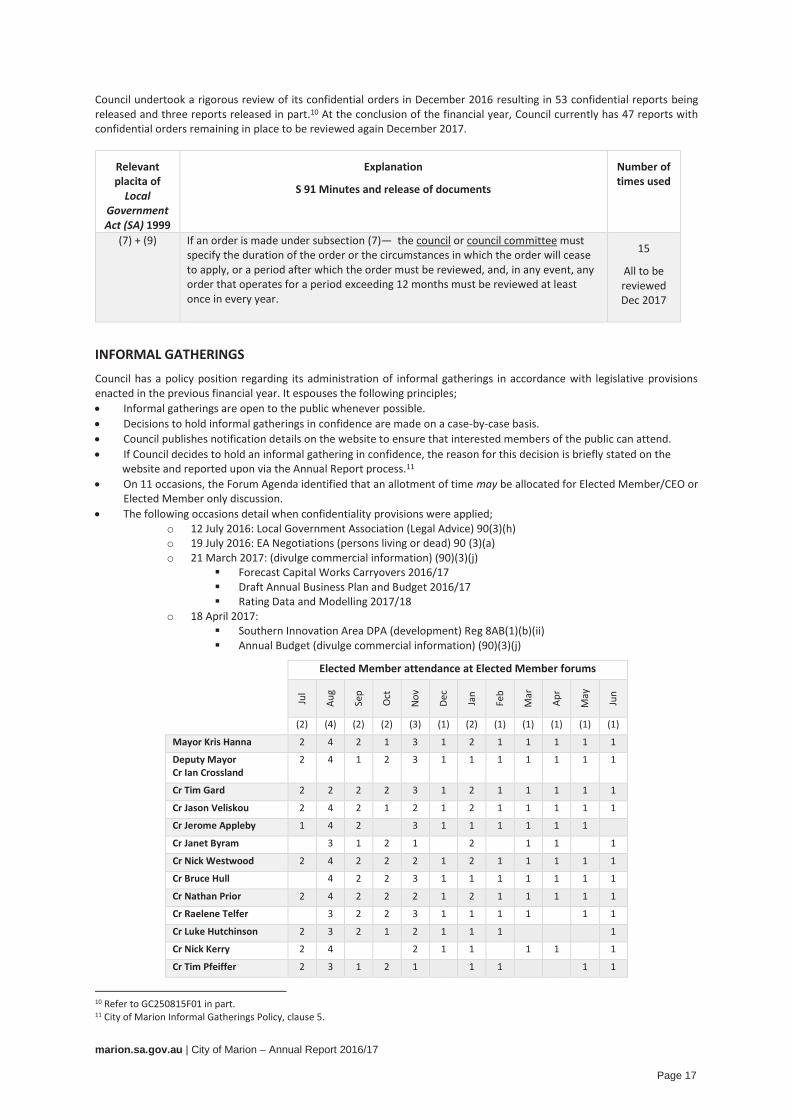
Council undertook a rigorous review of its confidential orders in December 2016 resulting in 53 confidential reports being released and three reports released in part.10 At the conclusion of the financial year, Council currently has 47 reports with confidential orders remaining in place to be reviewed again December 2017.
Relevant placita of
Local Government Act (SA) 1999
Explanation
S 91 Minutes and release of documents
Number of times used
(7) + (9) If an order is made under subsection (7)— the council or council committee must specify the duration of the order or the circumstances in which the order will cease to apply, or a period after which the order must be reviewed, and, in any event, any order that operates for a period exceeding 12 months must be reviewed at least once in every year.
15
All to be reviewed Dec 2017
INFORMAL GATHERINGS
Council has a policy position regarding its administration of informal gatherings in accordance with legislative provisions enacted in the previous financial year. It espouses the following principles; Informal gatherings are open to the public whenever possible. Decisions to hold informal gatherings in confidence are made on a case-by-case basis. Council publishes notification details on the website to ensure that interested members of the public can attend. If Council decides to hold an informal gathering in confidence, the reason for this decision is briefly stated on the website and reported upon via the Annual Report process.11 On 11 occasions, the Forum Agenda identified that an allotment of time may be allocated for Elected Member/CEO or
Elected Member only discussion. The following occasions detail when confidentiality provisions were applied;
o 12 July 2016: Local Government Association (Legal Advice) 90(3)(h) o 19 July 2016: EA Negotiations (persons living or dead) 90 (3)(a) o 21 March 2017: (divulge commercial information) (90)(3)(j)
Forecast Capital Works Carryovers 2016/17 Draft Annual Business Plan and Budget 2016/17 Rating Data and Modelling 2017/18
o 18 April 2017: Southern Innovation Area DPA (development) Reg 8AB(1)(b)(ii) Annual Budget (divulge commercial information) (90)(3)(j)
10 Refer to GC250815F01 in part. 11 City of Marion Informal Gatherings Policy, clause 5.
Elected Member attendance at Elected Member forums
Jul
Aug
Sep
Oct
Nov
Dec
Jan
Feb
Mar
Apr
May
Jun
(2) (4) (2) (2) (3) (1) (2) (1) (1) (1) (1) (1)
Mayor Kris Hanna 2 4 2 1 3 1 2 1 1 1 1 1
Deputy Mayor Cr Ian Crossland
2 4 1 2 3 1 1 1 1 1 1 1
Cr Tim Gard 2 2 2 2 3 1 2 1 1 1 1 1
Cr Jason Veliskou 2 4 2 1 2 1 2 1 1 1 1 1
Cr Jerome Appleby 1 4 2 3 1 1 1 1 1 1
Cr Janet Byram 3 1 2 1 2 1 1 1
Cr Nick Westwood 2 4 2 2 2 1 2 1 1 1 1 1
Cr Bruce Hull 4 2 2 3 1 1 1 1 1 1 1
Cr Nathan Prior 2 4 2 2 2 1 2 1 1 1 1 1
Cr Raelene Telfer 3 2 2 3 1 1 1 1 1 1
Cr Luke Hutchinson 2 3 2 1 2 1 1 1 1
Cr Nick Kerry 2 4 2 1 1 1 1 1
Cr Tim Pfeiffer 2 3 1 2 1 1 1 1 1
Page 17
marion.sa.gov.au | City of Marion – Annual Report 2016/17
COUNCIL COMMITTEES The Local Government Act 1999 (SA) allows the Council to form Committees to assist the decision making of Council. These committees do not make formal decisions as they are established to assist the Council in the performance of its functions (such as overseeing or providing advice).12
INFRASTRUCTURE AND STRATEGY COMMITTEE - FUNCTION Established as at 1 January 2017 for the purpose of;
Advising Council regarding the development, implementation and review of its strategic management plans. Ensuring that Council policy and strategies provide and promote Community ‘wellbeing’ through enhancing and
sustaining economic, environmental and community development of the City of Marion. Reviewing any topic specific strategies or plans (not included within any other Committees Terms of Reference)
prior to Council consideration and adoption. Development and implementation of Council policy relating to the management and utilisation of Council assets
and infrastructure. Monitoring and potential implementation strategies for the sporting facilities priorities of the City of Marion. Monitoring, development and implementation of Council’s Strategic Asset Management Plans in accordance with
Council’s Asset Management Policy. Opportunities to either acquire new assets or dispose of assets in accordance with Council’s Disposal of Land and
Assets Policy. Monitoring of major projects of the City of Marion or within the City of Marion. Opportunities to further develop strategic transport and integration of transport needs of the Community.
The committee has five (5) Elected Members – Elected Member Presiding. Meetings convened monthly on the first Tuesday of the month from February to November inclusive (10 Meetings). Sitting fees are set at $1000 per meeting for independent members.13
REVIEW AND SELECTION COMMITTEE - FUNCTION Established as at 1 January 2017 for the purpose of;
CEO Employment Agreement and Performance Review. Vacancy of the Office of the Chief Executive Officer. Process to source appointment of expert members to Section 41 Committees. Process to source appointment of expert members for the Development Assessment Panel (DAP). Review Committee’s Performance.
The committee has four (4) Elected Members – Mayor and three (3) Elected Members. Meetings convened as required.
FINANCE AND AUDIT COMMITTEE - FUNCTION Established as at 1 January 2017 for the purpose of;
External audit Internal audit and service reviews Financial Reporting and Prudential Requirements Internal controls and risk management
The committee has two (2) Elected Members (who are not the Mayor) and three (3) external expert members. Meetings are five times per year. Sitting fees per meeting include Committee chairperson $1,200 and Independent members $1000. URBAN PLANNING - FUNCTION Established as at 1 January 2017 for the purpose of;
Strategic planning and development policies. Developing a revised Development Plan for the City. Review Committee’s performance.
The committee has four (4) Elected Members – Mayor and three (3) Elected Members. Meetings convened bi-monthly basis on the first Tuesday of the month from February to November totaling five (5) meetings per year.
12 Local Government Act 1999 (SA) s 41. 13 Local Government Act 1999 (SA) s 131 and Schedule 4 s(1)f.
Page 18
marion.sa.gov.au | City of Marion – Annual Report 2016/17
COMMITTEE SITTING FEES14
Elected Members presiding over Committee meetings receive a 25% loading above their regular annual allowance. Sitting fees per session are $1000 for Independent Members and nil for Elected Members.15
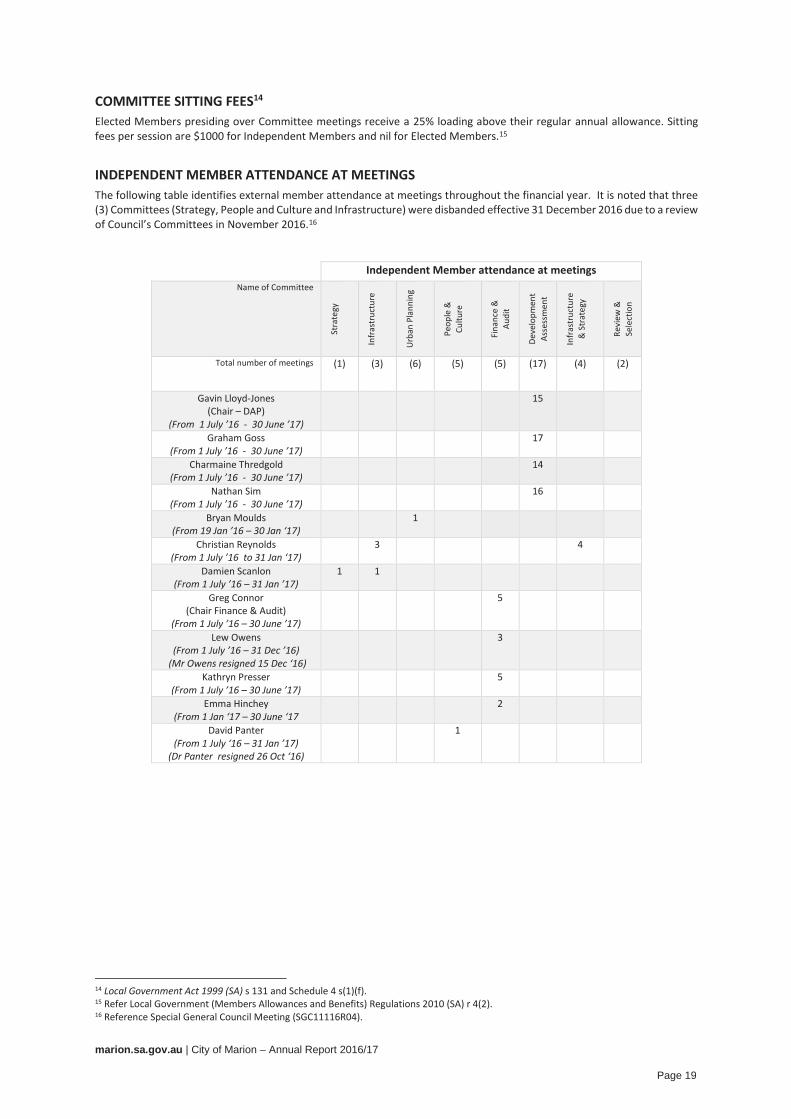
INDEPENDENT MEMBER ATTENDANCE AT MEETINGS The following table identifies external member attendance at meetings throughout the financial year. It is noted that three (3) Committees (Strategy, People and Culture and Infrastructure) were disbanded effective 31 December 2016 due to a review of Council’s Committees in November 2016.16
14 Local Government Act 1999 (SA) s 131 and Schedule 4 s(1)(f). 15 Refer Local Government (Members Allowances and Benefits) Regulations 2010 (SA) r 4(2). 16 Reference Special General Council Meeting (SGC11116R04).
Independent Member attendance at meetings Name of Committee
Stra
tegy
Infr
astr
uctu
re
Urb
an P
lann
ing
Peop
le &
Cu
lture
Fina
nce
&
Audi
t
Deve
lopm
ent
Asse
ssm
ent
Infr
astr
uctu
re
& S
trat
egy
Revi
ew &
Se
lect
ion
Total number of meetings (1) (3) (6) (5) (5) (17) (4) (2)
Gavin Lloyd-Jones (Chair – DAP)
(From 1 July ’16 - 30 June ’17)
15
Graham Goss (From 1 July ’16 - 30 June ’17)
17
Charmaine Thredgold (From 1 July ’16 - 30 June ’17)
14
Nathan Sim (From 1 July ’16 - 30 June ’17)
16
Bryan Moulds (From 19 Jan ’16 – 30 Jan ‘17)
1
Christian Reynolds (From 1 July ’16 to 31 Jan ‘17)
3 4
Damien Scanlon (From 1 July ’16 – 31 Jan ’17)
1 1
Greg Connor (Chair Finance & Audit)
(From 1 July ’16 – 30 June ’17)
5
Lew Owens (From 1 July ’16 – 31 Dec ’16)
(Mr Owens resigned 15 Dec ‘16)
3
Kathryn Presser (From 1 July ’16 – 30 June ’17)
5
Emma Hinchey (From 1 Jan ‘17 – 30 June ‘17
2
David Panter (From 1 July ‘16 – 31 Jan ’17)
(Dr Panter resigned 26 Oct ‘16)
1
Page 19

marion.sa.gov.au | City of Marion – Annual Report 2016/17
DEVELOPMENT ASSESSMENT PANEL The City of Marion’s Development Assessment Panel is constituted in accordance with the Development Act (SA) 1993. The task of the panel is to assess proposed development against the Development Plan, which sets out the planning policies applicable to the Council area.
FUNCTION In doing so, the Panel assesses the ‘pros and cons’ of an application. This involves judgment based on whether a development satisfies, or is at variance with the policies set out in the Development Plan. Council’s Development Assessment Panel comprises seven members appointed by Council. Three are members of the Council while the others are independent members with experience in development-related disciplines. The Panel met on 17 occasions during the financial year. The Panel comprises of seven members appointed by Council. Three are Elected Members whilst four are independent members with experience in development related disciplines. The Presiding Member receives $500 per meeting; Independent members receive $400 per meeting and Elected members $200 per meeting.17 ACHIEVEMENTS FOR 2016/17 FINANCIAL YEAR More than $180 million of building applications were granted – a decrease of approximately $1.6 million on the previous year. The two largest approvals were a $3.85 million development for the Coles Tenancy at Westfield Marion and a $2.4 million dollar development at 3 Casey Street Hallett Cove to construct two, two-storey residential flat buildings each comprising six dwellings (12 dwellings in total), with associated freestanding garages, common driveway, earthworks and retaining walls. The total number of applications granted was 1789. This included 757 new houses and 94 dwelling additions, along with 1523 combined approvals for class 10 structures, including sheds, pools and verandahs. Seven offices, 54 shops, 2 warehouses and 14 public buildings were also approved, while 342 demolitions were granted. NUMBER OF BUILDING CONSENTS AND VALUES18
2011/12 2012/13 2013/14 2014/15 2015/16 2016/17 1781 1689 1726 1751 1795 1789
$159.2m $152.2m $168.3m $195.5m $182.1 $180.5m CASTLE PLAZA ACTIVITY CENTRE DPA The aim of the DPA is to facilitate the redevelopment and expansion of the existing Castle Plaza Shopping Centre into a more vibrant, compact and intensely developed mixed use activity centre accommodating employment generating land uses and medium to high density residential development in close proximity to a high frequency public transport corridor. The scope of the retail component of the DPA has been reduced in size since the original proposal. The DPA was forwarded to the Minister in July 2017 seeking his approval for the document. HOUSING DIVERSTIY DPA The intention of the DPA is to support the development of a range of housing types and densities throughout the Council area and promote mixed use development in key strategic locations. The DPA will also involve protection of character areas and inner-suburb areas that demonstrate a high quality streetscape by promoting sensitive low density infill development within those areas. The DPA also investigates the introduction of mixed use areas within and adjacent to activity centres and along certain transit corridors. More vibrant activity centres will boost the local economy and create employment.
The DPA is currently on public consultation (until 14 November 2017), following which a report will be presented to Council regarding public comment received. Following which amendments will be made, if required, taking into account comments received. The DPA will then be forwarded to the Minister for authorisation.
17 Local Government Act 1999 (SA) s 131 and Schedule 4 s(1)(f). 18 These figures include development approvals granted by Council or private certification only. They do not include developments such as land divisions, tree applications or developments that do not require building rules consents. They do not reflect applications refused by Council or granted approval by the Development Assessment Commission.
Page 20
marion.sa.gov.au | City of Marion – Annual Report 2016/17
RECREATION/COMMUNITY DEVELOPMENT DPA The intention of the DPA is to rezone a number of existing major recreation/community complexes to a more appropriate zone which better reflects existing uses and facilitates the envisaged forms of development anticipated at these complexes. Council approved the DPA 26 September 2017 and the final document has been forwarded to the Minister for authorisation.
MORPHETTVILLE RACECOURSE The South Australian Jockey Club (SAJC) has recently finalised a concept for the development of surplus land at the Morphettville Racecourse (and surrounds). This concept proposes a mixed use development incorporating higher density residential, a neighbourhood level activity centre, offices, bulky goods and the renewal of core racing facilities, centered around an upgraded tram station. The proposed development is located in two Council areas (Marion and West Torrens) and includes the Department of Transport and Infrastructure (DPTI) controlled tram corridor.
COMMUNITY LAND19 During the financial year, Council expressed a desire to pursue opportunities for asset consolidation, to maximize use of community facilities and ensure public value is delivered through its assets. Through this process, it had been identified that several properties are surplus to Council’s requirements and do not contribute to Council’s strategic objectives. Toc H Hall at 30A De Laine Avenue Edwardstown was identified as surplus to council needs and was sold during the financial year. Luke Court Reserve, O’Halloran Hill is also available for sale. The net proceeds from both sales will be allocated to the Open Space Reserve Fund, for the development of other open space facilities. A recent example of this type of approach has been the award-winning Jervois Street Reserve which was purchased through funds allocated for the development of open space and with the assistance of the state Government.
REGIONAL SUBSIDIARIES Council has the ability to join another or more Councils to establish a regional subsidiary to provide a specified service or to manage/administer property or activities on behalf of the constituent Councils.20 The City of Marion has two such subsidiaries as described below.21
SOUTHERN REGION WASTE RESOURCE AUTHORITY
The Southern Region Waste Resource Authority (SRWRA) is a section 43 Regional Subsidiary of the Cities of Marion, Holdfast Bay and Onkaparinga. SRWRA is responsible for providing and operating waste management services on behalf of the Constituent Councils and ensuring that a long-term Waste Management Strategy exists in the southern region of Adelaide.
SRWRA is managed by a board of 10 people. Each council provides three representatives with the 10th being an independent expert in business or waste management. The board is chaired by the independent member whom only has a casting vote. The equitable interest of the constituent councils in the authority is agreed as follows; City of Holdfast Bay 15 per cent City of Marion 30 per cent City of Onkaparinga 55 per cent COUNCIL SOLUTIONS Council Solutions was established on 20 December 2012. It is owned in equal parts by the Cities of Adelaide, Charles Sturt, Marion, Onkaparinga, Salisbury and Tea Tree Gully. According to its Charter, Council Solutions is responsible for managing selected procurement and service delivery on behalf of the constituent councils. A key objective is to secure best value and value for money in these activities to improve the financial sustainability of the constituent councils for the benefit of their communities and ratepayers.
Council Solutions is managed by a board of seven members. Each council provides one representative, its chief executive officer, with the seventh being an independent member with expertise relevant to the activities of the authority. The board is chaired by the independent member whom only has a casting vote.
19 Local Government Act 1999 (SA) s 131 and Schedule 4, s(2)(e). 20 Local Government Act 1999 (SA) s 43. 21 Local Government Act 1999 (SA) s 131 and Schedule 4, s(1)(ha).
Page 21
marion.sa.gov.au | City of Marion – Annual Report 2016/17
GOVERNANCE The Local Government Act 1999 (SA) provides the legislative framework for legal and transparent decision. The term ‘governance’ incorporates practices and procedures that make for informed decision-making. The following pieces of information are legislatively required to be provided within an Annual Report. LIST OF REGISTERS AND CODES OF CONDUCT OR PRACTICES22 Following is a list of registers kept by council: Register of Interests – Elected Members Register of Interests – Staff Register of Elected Members’ allowances and benefits Register of staff salaries and benefits Register of campaign donations Register of Elected Members’ gifts and benefits Register of Fees and Charges Register of By Laws These documents can be downloaded from the City of Marion’s Website free of charge – alternatively a copy can be requested from customer service free of charge. CODE OF PRACTICE23 Following is a list of Council Codes of Conduct or Practice, adopted in accordance with the Local Government Act 1999 or the Local Government (Elections) Act 1999 and Local Government (Procedures at Meetings) Regulations 2000: Code of Conduct – Council Members Code of Conduct - Employees Code of Practice – Access to meetings and documents Code of Practice – Procedures at Meetings
The Code of Conduct for elected members continues to ensure that all activities of Council are conducted legally, ethically and with the strict observance of the highest standards of integrity and propriety.
The Code of Conduct is Council’s public declaration of the expected standards of behavior and the manner in which individual elected members will conduct themselves in carrying out their duties. The City of Marion also has a Staff Code of Conduct that sets out the expected standards of conduct for all employees.
SENIOR EXECUTIVE OFFICER INFORMATION24 Council had four senior executives whose salary packages include the use of a motor vehicle and allows for private use. Salary packages for the four senior executives including superannuation and the use of a motor vehicle, ranged from $205,460 to $290,020. HUMAN RESOURCES INFORMATION25 The City of Marion had 343.5 Fulltime equivalent staff as at the 30 June 2017. The following employment opportunity programs, and other human resource management or development programs, during the relevant financial year were achieved; Gap Year – Commencing in February 2017, Council employed two successful candidates who attended school and live
in Marion to provide young people with the skills and knowledge that will help them identify a career and increase their chances of finding future work.
Career Transition Program (CTP) – This program enables the City of Marion to put initiatives in place for those nearing or reaching retirement age to provide work/life balance and enhanced wellbeing. This provides 55+ aged staff with access to flexible working arrangements and ability to explore alternative role to transition out of fulltime work with dignity, respect and a plan for maintaining involvement in activities outside of the Organisation.
22 Local Government Act 1999 (SA) s 131 and Schedule 4, s(1)(b). 23 Local Government Act 1999 (SA) s 131 and Schedule 4, s(1)(c) and Local Government (Elections) Act 1999 (SA). 24 Local Government Act 1999 (SA) s 131 and Schedule 4 s(1)(g). 25 Local Government Act 1999 (SA) s 131 and Schedule 4, s(2)(d).
Page 22
marion.sa.gov.au | City of Marion – Annual Report 2016/17
NATIONAL COMPETITION POLICY Early 1990, Australia established a National Competition Policy (NCP) to support economic reform from practices that restrained Australian markets and industries as a result of federation. This policy identified various principles to encourage competitive markets that would enhance national productivity for the benefit of the community whilst eliminating any unfair advantages.26 In relation to government activities, it specified that government should not enjoy any competitive advantage simply as a result of their public ownership.1 An agreement was signed by all State Governments and Territories supporting and committing to the overarching policy and principles. By virtue of clause 7, local government is also bound. In doing so, the City of Marion is required to report any activities undertaken in the financial year in relation to competitive neutrality principles such as;
The commencement or cessation of significant business activities Any reviews or reformed By-Laws that restrict competition, including proposals for new By-laws Complaints received alleging a breach/es of the NCP or unfairly competitive practices Structural reform of public monopolies
For the 2016/17 financial year, Council has continued to maintain the following to comply with the NCP Procurement and Contractor Management Policy to;
Obtain value in the expenditure of public money; and Providing for ethical and fair treatment of participants; and Ensuring probity, accountability and transparency in procurement operations.
COMPETITIVE TENDERING The City of Marion will seek to provide open and effective competition by providing contractors with fair and reasonable access to opportunities to do business with Council according to relevant procurement procedures. In procuring goods, services and construction works, the City of Marion will seek to maximize value for money at an acceptable level of risk to support the delivery of infrastructure, facilities and services which maximize the benefit to the community. Public tendering was generally required for contracts valued more than $100,000 (an increase of $50,000 from 2015/16 financial year). The City of Marion is also part regional subsidiary for co-operative purchasing being Council solutions. This regional subsidiary comprising six large metro councils work together to source goods, services and works where a benefit can be obtained by aggregating the requirements of participants. Council Solution contracts are subject to public tender.27 REVIEW OF DECISIONS As required by the Local Government Act 1999 the Council has developed a procedure for the Review of Decisions, outlining how decisions of Council or other people acting on behalf of council are reviewed. Council’s internal review of a council decision policy and procedure is available from the City of Marion website. In 2016/17Council received eight formal requests to conduct an internal review of decisions of Council. All were completed within the financial year however one request was denied. The complaints related to the following: Expiation fine (September 2016) resulting in the fine being upheld. Request relating to seven development applications dating from 2009 – 2016 (October 2016) resulting in process
improvements being implemented. Dangerous Dog Attack (November 2016) resulting in an “Intention to Place a Destruction Order” being issued. Review of several development applications relating to a previous review (December 2016) – undertaken by an
external party with findings of the previous review upheld. Removal of Resolute Crescent Play equipment (December 2016) – resulting in a new report submitted to Council for
a decision in addition to process improvements being made. Bee complaint (December 2016) resulting in further investigations being explored. Development Application – removal of Tree (March 2017) resulting in the complainant being encouraged to submit a
final application. Review of several development applications relating to previous reviews undertaken (May 2017) - request denied.
26 Local Government Act 1999 (SA) s 131 and Schedule 4, s 1(j). 27 Local Government Act 1999 (SA) s 131 and Schedule 4, s 2(b).
Page 23

marion.sa.gov.au | City of Marion – Annual Report 2016/17
FREEDOM OF INFORMATION Council is required to publish statistical data for the relevant financial year in relation to the public and local community having access to official documents and records kept.28 These legislative requirements provide further transparency and therefore accountability of our management of various records. STATEMENT AND STATISTICS The City of Marion website provides a statement29 and information regarding the process to follow when requesting such documentation. The following provides a summary of the number of Freedom of Information (FOI) requests and resulting outcomes throughout the year; Number of applications 52 Processed 26 Withdrawn 8 Determined 18 Of the 18 applications determined: Full release 4 Partial release 2 Refused 12 AMENDMENT OF COUNCIL DOCUMENTS Should any member of the public consider that any document they have accessed is incorrect, incomplete, misleading or out of date, they may request an amendment by writing to; Freedom of Information Officer, City of Marion PO BOX 21 OAKLANDS PARK SA 5046
LOCAL NUISANCE AND LITTER CONTROL The Local Nuisance and Litter Control Act 2016 (SA) (the Act) came into operation in January and July 2017. The Act regulates Council’s management of nuisance and litter related complaints. In addition, Council is required to publish various details for the relevant financial year of such complaints received.30 STATISTICS The City of Marion is required to include various details of complaints received by the Community that is managed by legislation. This ensures consistency across Council boundaries in dealing with nuisance and litter control. Complaints received 0 Nature of complaints N/a Offences expiated 0 Offences prosecuted 0 Number of nuisance abatement notices issued 0 Number of litter abatement notices issued 0 Number of Civil penalties negotiated31 0
28 Freedom of Information Act 1991 (SA) s9 (1a) and 54AA. Local Government Act 1999 (SA) s 131 and Schedule 4, s(1)(gb). 29 Freedom of Information Act 1991 (SA) s54AA. 30 Local Nuisance and Litter Control Act 2016 (SA) s 8, Local Nuisance and Litter Control Regulations 2016 (SA) Reg 5. Local Government Act 1999 (SA) s 131 and Schedule 4 s(1)(gb). 31 Local Nuisance and Litter Control Act 2016 (SA) s 34, Local Nuisance and Litter Control Regulations 2016 (SA) Reg 5 (b)(v).
Page 24
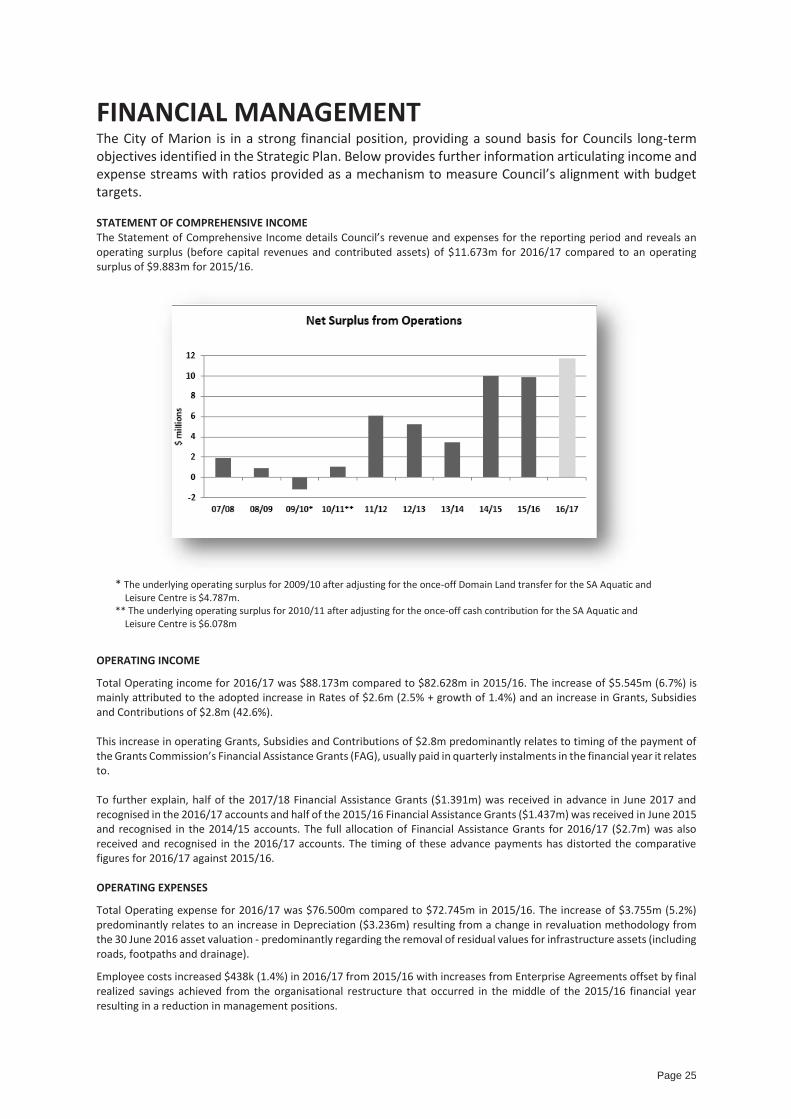
FINANCIAL MANAGEMENT The City of Marion is in a strong financial position, providing a sound basis for Councils long-term objectives identified in the Strategic Plan. Below provides further information articulating income and expense streams with ratios provided as a mechanism to measure Council’s alignment with budget targets. STATEMENT OF COMPREHENSIVE INCOME The Statement of Comprehensive Income details Council’s revenue and expenses for the reporting period and reveals an operating surplus (before capital revenues and contributed assets) of $11.673m for 2016/17 compared to an operating surplus of $9.883m for 2015/16.
* The underlying operating surplus for 2009/10 after adjusting for the once-off Domain Land transfer for the SA Aquatic and Leisure Centre is $4.787m.
** The underlying operating surplus for 2010/11 after adjusting for the once-off cash contribution for the SA Aquatic and Leisure Centre is $6.078m
OPERATING INCOME
Total Operating income for 2016/17 was $88.173m compared to $82.628m in 2015/16. The increase of $5.545m (6.7%) is mainly attributed to the adopted increase in Rates of $2.6m (2.5% + growth of 1.4%) and an increase in Grants, Subsidies and Contributions of $2.8m (42.6%). This increase in operating Grants, Subsidies and Contributions of $2.8m predominantly relates to timing of the payment of the Grants Commission’s Financial Assistance Grants (FAG), usually paid in quarterly instalments in the financial year it relates to. To further explain, half of the 2017/18 Financial Assistance Grants ($1.391m) was received in advance in June 2017 and recognised in the 2016/17 accounts and half of the 2015/16 Financial Assistance Grants ($1.437m) was received in June 2015 and recognised in the 2014/15 accounts. The full allocation of Financial Assistance Grants for 2016/17 ($2.7m) was also received and recognised in the 2016/17 accounts. The timing of these advance payments has distorted the comparative figures for 2016/17 against 2015/16. OPERATING EXPENSES
Total Operating expense for 2016/17 was $76.500m compared to $72.745m in 2015/16. The increase of $3.755m (5.2%) predominantly relates to an increase in Depreciation ($3.236m) resulting from a change in revaluation methodology from the 30 June 2016 asset valuation - predominantly regarding the removal of residual values for infrastructure assets (including roads, footpaths and drainage).
Employee costs increased $438k (1.4%) in 2016/17 from 2015/16 with increases from Enterprise Agreements offset by final realized savings achieved from the organisational restructure that occurred in the middle of the 2015/16 financial year resulting in a reduction in management positions.
Page 25

CAPITAL REVENUES AND CONTRIBUTED ASSETS
Other key variances reported on the Statement of Comprehensive Income are Amounts Received Specifically for New or Upgraded Assets (up $1.984m) predominantly relating to a State Government Grant received for the Sam Willoughby International BMX Track ($2.0m). There have also been significant increases in the valuation of Land and Infrastructure Assets ($29.324m).
CRUCIAL OPERATING/FINANCIAL RATIOS
The City of Marion utilises ‘ratios’ in order to measure Council’s alignment (or otherwise) with expected budget targets by expressing the difference between actual versus expected budget outcomes as a percentage.
OPERATING SURPLUS RATIO This ratio expresses the operating surplus/(deficit) as a percentage of total operating revenue. Council has set a target for this ratio of between 0 and 5% on a five year rolling average.1
2015 2016 2017 Operating Surplus Ratio 12% 12% 13%
RATE REVENUE RATIO This ratio expresses rate revenue as a percentage of operating revenue. Although this ratio is not a prescribed measure required by the ‘Model Set of Accounts’ it is a valuable indicator as it highlights Council’s reliance on rates as a revenue source and the need for Council to seek alternative sources of income.2
2015 2016 2017 Rate Revenue Ratio 82% 85% 82%
STATEMENT OF FINANCIAL POSITION The Statement of Financial Position provides details of Council's assets, liabilities and equity as at 30 June 2017. The majority of Council’s assets relate to community property and infrastructure assets (roads, paths, drainage, etc.). Council’s at 30 June 2017 is $1,169.5m, with the following graph illustrating the movement over the past 10 years. This identifies the continued increase in Council’s net assets which can mainly be attributed to revaluations of its Infrastructure assets as noted in the following table.
1 The Operating Surplus Ratio in the adopted budget for 2016/17 was 10.8% and has been significantly impacted by the advance payment of 2017/18 Financial Assistance Grant instalment, and increased Investment income, with variances in Operating Expenses netting out. With council’s focus is on maintaining a balanced or better cash funding position it is important that an operating surplus sufficient to meet Council’s capital expenditure requirements is achieved. 2 To address Council’s dependence on rate revenue, it has focused upon training and development of Officers to maximize grant opportunities and annual reviews of its Fees and Charges Schedule.
Page 26

2016 $’000
2017 $’000
Increase $’000
Infrastructure assets 663,385 677,069 13,684 Land assets 343,709 360,144 16,435
Infrastructure, Property, Plant & Equipment (IPP&E): Council’s IPP&E increased by $24.004m (2.16%) compared to 2015/16 with the majority of the increase relating to a net revaluation of $12.997m in infrastructure assets and $16.313m in land. WORKING CAPITAL RATIO This ratio focuses on the liquidity position of Council, adjusting for restricted assets (eg. unspent specific tied grants that would need to be excluded from Council’s current assets as Council would be restricted from using this cash to meet short term liabilities). It is calculated by dividing current assets (less restricted assets) by current liabilities (less liabilities associated with restricted assets). Council’s target for this ratio is between 1.0 and 1.1%.3
2015 2016 2017 Working Capital Ratio 1.0% 1.5% 2.1%
ASSET SUSTAINABILITY RATIO Net asset renewal expenditure is defined as net capital expenditures on the renewal and replacement of existing assets and excludes new capital expenditure on the acquisition of additional assets. It is calculated by dividing net asset renewal figures by depreciation expenses. This ratio indicates whether the Council is renewing or replacing existing assets at the rate of consumption. A long-term average ratio of 95-100% would indicate that Council is investing adequately in maintaining its asset base.4
2015 2016 2017 Asset Sustainability Ratio 76% 84% 75%
ASSET CONSUMPTION RATIO This ratio shows the consumption of the asset stock at a point in time (or the percentage of useful life remaining). Depreciation represents the reduction in value of the assets each year and therefore accumulated depreciation is the total reduction in the carrying value of the assets. It is calculated by dividing the carrying value of depreciable assets by the gross value of depreciable assets. Council’s target for this ratio is between 80-100%. A ratio higher than 80% indicates that Council’s overall asset base has on average a relatively high remaining useful life. A result between 40% and 80% is considered acceptable. The ratio reflected below indicate on average a relatively high remaining useful life for assets.
2015 2016 2017 Asset Consumption Ratio 80% 78% 78%
BORROWINGS In assessing Council’s financial position, it is appropriate to consider liabilities in relation to borrowings. Borrowings are required by Council from time to time to finance strategic long-term assets for the orderly development of the City. Council’s total borrowings at 30 June 2017 were $9.102m – a net decrease of $1.126m over the level of borrowings in June 2016.
3 Council’s cash flow is in a good position to undertake day to day operations, along with having sufficient cash to cover the balances in its Asset Sustainability Reserve. Council’s significant cash reserves quarantined for future major projects and long term asset management objectives have impacted on this ratio. 4 The 2016/17 Asset Sustainability Ratio was significantly impacted by the significant increase in Depreciation Expense due to the changes in revaluation methodology used in the prior year revaluation. Council’s Long Term Financial Plan (LTFP) is set to achieve an average Asset Sustainability Ratio of 95% over the next three years, but only 80% over the 10-year term of the LTFP. Continual review and monitoring of Council’s Asset Management Plans are to be incorporated into Council’s Long Term Financial Planning process in an effort to close this gap..
Page 27
KEY DEBT RATIOS
The following indicators are used to monitor Council’s performance in relation to its current level of debt;
NET FINANCIAL LIABILITIES RATIO This ratio indicates the extent to which net financial liabilities of the Council can be met by Councils’ total operating revenue and is calculated by dividing the former by the latter. This result is due to Council’s Financial Assets exceeding its Financial Liabilities predominantly as a result a substantial holding of cash and other financial assets allocated for unexpended grants and funding for capital projects carried over or retimed to 2017/18 and beyond totalling $13.698m. Without these holdings this ratio would be (-10%).5
2015 2016 2017 Net Financial Liabilities Ratio (2%) (8%) (25%)
INTEREST COVER RATIO Net interest costs are defined as total interest expenses less total interest revenues. This ratio indicates the extent to which Council’s commitment to interest expenses are met by total operating revenues. Negative ratios have been recorded for the past four years reflecting interest revenues being greater than interest expenses.
2015 2016 2017 Interest Cover Ratio (0.1%) (0.0%) (0.4%)
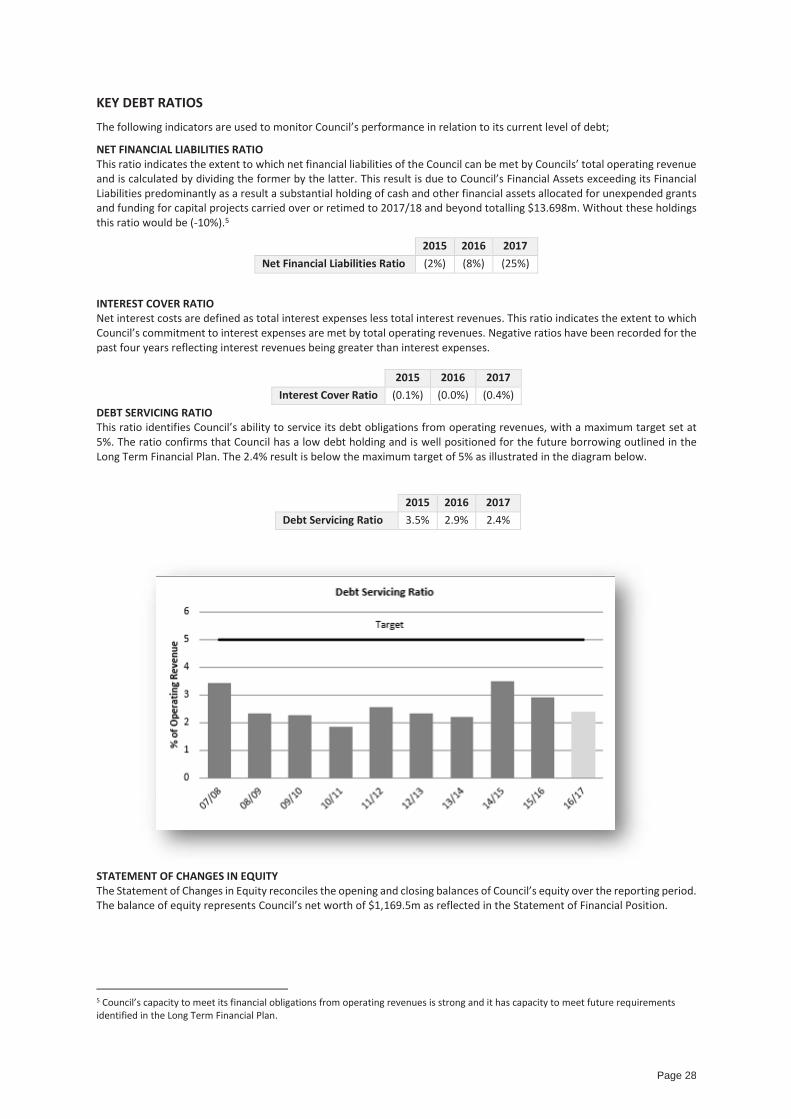
DEBT SERVICING RATIO This ratio identifies Council’s ability to service its debt obligations from operating revenues, with a maximum target set at 5%. The ratio confirms that Council has a low debt holding and is well positioned for the future borrowing outlined in the Long Term Financial Plan. The 2.4% result is below the maximum target of 5% as illustrated in the diagram below.
2015 2016 2017 Debt Servicing Ratio 3.5% 2.9% 2.4%
STATEMENT OF CHANGES IN EQUITY The Statement of Changes in Equity reconciles the opening and closing balances of Council’s equity over the reporting period. The balance of equity represents Council’s net worth of $1,169.5m as reflected in the Statement of Financial Position.
5 Council’s capacity to meet its financial obligations from operating revenues is strong and it has capacity to meet future requirements identified in the Long Term Financial Plan.
Page 28
CASH FLOW STATEMENTS
The Cash Flow Statement details the cash movements for the year ended and reconciles with Note 11 of the Annual Financial Statements. The Statement indicates a cash surplus of $29.9m compared with $16.3m in 2015/16. As previously mentioned a significant portion of the cash position is committed to unexpended grants, carryovers and retimed works ($13.7m).
OPERATING CASH FLOW COVERAGE RATIO
This ratio identifies Council’s ability to fund its operating and capital expenditure requirements (without the need for significant sudden rate increases or service reductions) whilst continuing to maintain intergenerational equity and both sustainable and responsible use of borrowings. It is calculated by dividing cash flow from operations (less loan principal repayments) by the average annual optimal level of expenditure per Councils’ Asset Management Plans. Council’s target for this ratio is between 100% and 105%.6
2015 2016 2017
Operating Cash Flow Coverage Ratio 134% 108% 147% RESERVE FUNDS A review of the balances of these reserves indicates that they are at a level sufficient to meet their purpose and intent as listed in Note 9 Reserves in Appendix 3. Council’s current reserve funds include the following: GRANTS AND CARRYOVERS RESERVE: $13.698m This consists of grant funded carryover projects and capital works carried over to 2017/18 or retimed to future years as required. It includes $3.778m that was retimed from prior years which is planned to be utilised in future years when related works are scheduled. OPEN SPACE RESERVE: $1.188m It is considered by management that the current balance of this fund is adequate to meet its intended purpose. ASSET SUSTAINABILITY RESERVE – GENERAL: $6.781m The current balance in this fund is considered by management to be adequate to provide Council with the funding capacity to not only respond to a major infrastructure failure ($2m is retained in this reserve for this specific purpose) but to also assist Council in managing its long term asset management objectives. ASSET SUSTAINABILITY RESERVE – COMMUNITY FACILITY PARTNERSHIP FUND (CFPP): $4.653m Funding has been specifically set aside in the Asset Sustainability Reserve for the renewal, upgrade and purchase of Council assets as specifically resolved by Council. It includes a balance set aside to encourage organisations leasing council facilities to seek partnership funding for the required renewal and upgrade of those facilities. ASSET SUSTAINABILITY RESERVE – MAJOR NEW PROJECTS: $4.197m Funding has also been specifically set aside in the Asset Sustainability Reserve for major new projects. Council has endorsed funding its $4.0m contribution to the Edwardstown Soldiers Memorial Recreation Ground redevelopment from this reserve. LONG TERM FINANCIAL PLAN (LTFP)
Council has a LTFP focused upon; Achieving the City of Marion’s Strategic Directions. Addressing issues arising and opportunities identified from internal audit reviews, service reviews and business
excellence assessments. Maintaining a breakeven or better cash funding position. Improving the maintenance of assets in accordance with Council’s Asset Management Plans, with a priority on
maintenance before renewal, and/or renewal before new (whichever is more cost effective). Reviewing existing services and assets to ensure they meet prioritised community needs. Approving new Major Projects where it has the identified funding capacity to do so. Maintaining Council’s position for an average residential rate that remains low (in comparison with other metropolitan
councils). Progressing ‘liveable cities’ strategies and funding opportunities within Marion.
6 Council’s operating cash flow coverage is sufficient to meet the asset renewal requirements included in its Long Term Financial Plan. This ratio has been impacted by the advance payment of 2017/18 operational FAG grants ($1.391m) in addition to higher than forecast investment returns with Council’s significant cash reserves quarantined for future major projects and managing its long term asset management objectives.
Page 29

LIVEABLE
LIVEABLE KEY ACHIEVEMENTS By 2040 our city will be well planned, safe and welcoming, with high quality and environmentally sensitive housing, and where cultural diversity, arts, heritage and healthy lifestyles are celebrated.
$8 MILLION EDWARDSTOWN OVAL REDEVELOPMENT The Federal Government committed $4 million towards the project, matching Council’s $4 million commitment. A design developed for the site will result in the removal of existing buildings and the development of a new two-story building. This $8 million rebuild will create new sports and community spaces, function rooms, viewing areas, upgrades to the velodrome and loop path, an upgrade to the Memorial Gardens and facilities for skills training providers. A World War One Honour Board will also be rehomed at the site.
MITCHELL PARK SPORTS AND COMMUNITY CENTRE Plans for the Mitchell Park Sports and Community Centre include a multi-purpose four court indoor facility for sports including basketball and netball, community and neighbourhood centre, gym, function area and new facilities for the existing football, cricket, rugby, tennis and the Dover Gardens Dog Club has been approved. Council committed to 50 per cent of the costs, subject to receiving matching funding from other partners.
MARION OUTDOOR POOL Approximately 79,000 attendances were recorded for the financial year. Several events were held including two open days with markets, interactive activities and games for all ages, along with a joint radio station and movie night to compliment the many carnivals, school excursions and parties. Council allocated $320,000 for the installation of a new speed slide, which is expected to be installed and operational prior to the next swim season opening. Plans for the site include detailed designs and costs for potential upgrades to the facility in future years. An extensive service review was commenced and completed within the financial year.
MARION CULTURAL CENTRE The centre has a café, art gallery, library and theatre with approximately 260,000 people visiting the centre. Over 5,800 ticket sales for the theatre were recorded, attracting an average attendance of 132 people per performance. New signage including a digital display to create further awareness of the centre and its events is expected to be installed and operational the following financial year to increase visitation and ticket sales.
OAKLANDS RECREATION PLAZA STAGE 2 DESIGN Consultation with the community was undertaken to develop a design for Stage 2 of the Oaklands Recreation Plaza. The Concept design, endorsed by Council includes the installation of a new rotunda to replace the old roundhouse, line marking for trike and bike riders, skate mounds, and picnic tables, benches and picnic shelter.
SAM WILLOUGHBY INTERNATIONAL BMX TRACK – O’HALLORAN HILL The cities of Marion and Onkaparinga each announced a $750,000 commitment and the State Government a $2 million share to build the Sam Willoughby International BMX Track. Whilst undertaking feasibility studies, the land was deemed to have expansive clay deposits that will effect the estimated project budget and timeframes. Council will continue to work with key stakeholders to deliver a facility to meet international standards and community expectations.
TENNIS AND NETBALL REVIEW A Tennis and Netball review was initiated in February 2017 and accompanying three year capital works program (along with a newly endorsed leasing and licencing policy). A program was endorsed whereby all tennis and netball clubs that lease facilities from Council are allocated fit-for-purpose amenities to operate and grow.
SERVICE REVIEWS The City of Marion embarked upon a rigorous service review program resulting in the production of a service review framework and program along with identifying and reviewing over 130 services with nine services reviewed at a very detailed level.
LIVING KAURNA CULTURAL CENTRE (LKCC) The LKCC is an Aboriginal education venue hosting cultural education workshops and has rooms available for hire for community or business meetings. During the year;
200 young people attended Youth andReconciliation week Celebrations
150 attended a NAIDOC celebration 12,790 visitors were recorded;
o 5058 cultural workshops and tours,o 3390 utilising venue hire,o 3442 utilising the park for events,o 900 drop in visits to the Gallery.
ASSET OPTIMISATION Council has expressed a desire to pursue opportunities for asset consolidation, to maximize use of community facilities and ensure public value is delivered through its assets. As a result, the Toc H Hall at 30A De Laine Avenue Edwardstown has been sold. The net proceeds from the sale will be used for the development of existing or new community facilities currently under Council’s consideration. Luke Court Reserve, O’Halloran Hill is currently on the market for sale. The net proceeds from the sale will be allocated to the Open Space Reserve Fund, for the development of other open space facilities. A recent example of this type of approach has been the award-winning Jervois Street Reserve which was purchased through funds allocated for the development of open space and with the assistance of the state Government.
Page 31

VALUING NATURE
VALUING NATURE KEY ACHIEVEMENTS By 2040 our city will be deeply connected with nature to enhance peoples’ lives, while minimizing the impact on the climate and protecting the natural environment. ENVIRONMENT MANAGEMENT SYSTEM An extensive review of the City of Marion’s certified (ISO 14001) Environmental Management System was conducted and as a result of the review, certification discontinued 30 June 2017 and a new internal environmental risk management framework commenced development. A new cloud-based management system – Skytrust was approved which will improve environmental incident reporting and hazard management /registering to ensure environmental risk and legal compliance matters are appropriately addressed, reported and recorded. GREEN EDUCATION – SOUTHERN REGION Council continued to host an Education Officer, funded by the Adelaide and Mt Lofty Ranges Natural Resources Management Board, to involve schools and pre-schools in sustainability projects. This program supported 139 teachers and 444 students through professional development sessions, monitoring of youth groups and hands on activities such as water testing and bird surveys. NEW WETLAND AT HALLETT COVE – GLADE CRESCENT Glade Crescent Reserve Wetland is the next stage in a long-term plan to transform 13 hectares high value Council land into a site that can be enjoyed by the community. The wetland forms part of the City of Marion Stormwater Management Plan which aims to reduce flooding and erosion along sections of Waterfall Creek. The total funding provided by the NRM Board to the City of Marion over the past five years is more than $3.9 million helping to deliver Oaklands Wetland river restoration and landscaping projects across the city. OAKLANDS RECREATION PLAZA WINS AWARD Oaklands Recreation Plaza won a Parks and Open Space category award at the Institute of Landscape and Architecture (SA) Awards. The $1 million skate park, including a mini basketball court, lawns and parkour exercise circuit was claimed as being ‘decisively transformed, not just by inclusion of a particular element, but with a rich mix of youth-based activities including BMX, skating, parkour and basketball’. CREATING A WATER SENSITIVE CITY Two detailed Stormwater Management Plans have been approved and another in development with an adjacent Council. The aims of a Stormwater Plan are; minimise flooding, harnessing the potential of stormwater and improving the health of waterways and landscaped areas. During the year Council:
Increased the number of reserves irrigated with water from Oaklands wetland from nine to twenty-five, and used over 70ML of treated storm water.
Completed a new wetland system to improve the quality of storm water at Glade Crescent Reserve, Hallett Cove
Council will continue with drainage upgrade projects at Heron Way (as part of the Hallett Cove Beach Redevelopment), Melanto, Farne and Maxwell Terrace, Keen and Hammersmith Avenue. ADAPTING TO A CHANGING CLIMATE The Cities of Marion, Mitcham, Holdfast Bay and Onkaparinga have been responding to climate change through actions from the Southern Region Local Government Implementation Plan. Regionally, Council has held a series of community workshops on topics such as water sensitive urban design and energy efficiency. GROWING A GREENER CITY Approximately 30,000 native plants were planted (increase of 20,000 on the previous year). This included 10,000 indigenous native shrubs at Oaklands Estate Reserve during a Planet Ark Tree day in July 2017 with support from the Friends of Sturt River and the local community. 20,000 native plants were planted at other sites throughout the year including Trott Park creek, Linear Park Reserve, Glade Crescent Reserve and Nari Reserve. To improve local amenity, attract native wildlife and reduce the impact of heat in urban areas, we planted 1400 street trees. ENCOURAGING RECYCLING Kitchen caddies for recycling food scraps continue to be popular in the community, with 839 residents collecting their free kitchen caddy and roll of compostable bags, (53% increase from last year). The number of households recycling food scraps by actively using their organics bin has grown to approx. 5,050 households. In addition;
50 presentations were delivered to schools, kindergartens and community groups regarding electrical waste and recycling.
Two tours of waste and recycling facilities. Residents participating in the Recycle Right Bin
Tagging Campaign achieved an 81% reduction of waste contamination.
$2567 from Keep Australia Beautiful Grant assisted with the installation of new recycling facilities at the Marion Outdoor pool with 5,016 cans, bottles and cartons recycled.
COASTAL MANAGEMENT PLAN Work began on the development of a Coastal Management Plan for Council including documenting key coastal values and risks associated with climate change
Page 33

ENGAGED
ENGAGED KEY ACHIEVEMENTS By 2040 our city will be a community where people are engaged, empowered to make decisions, and work together to build strong neighbourhoods.
NEIGHBOURHOOD AND COMMUNITY CENTRES The City of Marion’s four Neighbourhood and Community Centres; Cooinda, Mitchell Park, Trott Park and Glandore operate with an early interventionist approach with particular focus on positive outcomes for socially isolated members of the community.
Almost 40,000 people participated in events offered by the four centres during the financial year resulting in;
Collaborations with Flinders University for the“Inspiring Health” partnership, involving health and social science students to provide a health assessment for participants aged between 40 and 75 years. 174 City of Marion employees, volunteers and residents completed health assessments.
All four centres participated in the “Hang it UpPoverty Program” collecting unwanted clothing to provide to disadvantaged people.
University Placements were provided to sixstudents from both Flinders University and University SA.
The students from the school of Social WorkFlinders University participated in a range of programs including the continuation of the Chinese Grandparenting group and needs analysis on health and wellbeing for people aged 50-65 years.
GLANDORE COMMUNITY CENTRE 1200 people attended “Carols in the Park”. 250 Children attended the Family Halloween
Trick N Treat trail. New service ‘Friday Community Meals’
commenced providing 1,500 meals todisadvantaged residents.
Hosted International Women’s Day, with guestspeaker Rachel Sporn.
Still Births and Neonatal Deaths (SANDS) meetsonce a month.
Unity Housing Company providing a facilitatorfor a woodworking session for sociallyisolated/disadvantaged people once a week.
MITCHELL PARK NEIGHBOURHOOD CENTRE Playgroup for families was developed as a new
service to the community. BBQ Information session once a month for
residents to learn about the services Council has on offer.
Narcotics Anonymous began hosting weeklymeetings.
70 community members attended a freeChristmas family event offered in conjunction with Junction Australia held a with community stalls, family activities, free BBQ, Christmas
movie with free drinks, snacks and a goody bag for all children.
May 2017 the centre celebrated its 30Anniversary.
A repair café was introduced providingresidents with the opportunity to have clothing repairs done whilst learning the skills to undertake future repairs.
TROTT PARK NEIGHBOURHOOD CENTRE • An upgrade to the centre’s facilities to provide
greater accessibility for people with a disability. • Redevelopment of an outside open space
project joining the Community garden to rear of the Centre, by laying pavers to the rear of the Woodwork shed beautifying the area.
• Introduction of new courses including Men’sWellbeing and Mental Health programs, Mosaic classes, machine embroidery, chess and book club.
SQUARE EYES The Humans of Marion – Positive Ageing exhibit continued its public life at an exhibition at Cooinda Community Centre. The exhibition was the initiating factor for a ‘speed dating’ Every Generation Festival event with some of the participants who exemplify positive ageing and challenge the stereotypes of this demographic. Attendants were able to chat with the participants over lunch, hear their stories, secrets to ageing well and view the photographs and stories from the exhibition that capture their spirit
VOLUNTEERS A total of 367 City of Marion volunteers contributed 41,489 hours of service to the dollar value of $1,138,573, assisting with the delivery of various programs across Council including;
Community Bus and Community Care - SocialSupport/Home Maintenance
Crime Prevention – Grafitti Removal Libraries including Marion Heritage Research
Centre Neighbourhood Centres Youth Development Justice of the Peace Broadband for seniors.
A number of new initiatives have occurred including the development of four Volunteer WH&S Action Plans addressing:
Hazard Register Development. Training Needs Analysis and Induction Review. WH&S Consultation Committee Development. Pilot project of ‘Skilled Volunteer’ Program. Review of Child Safe Environments for
registered volunteers.
Page 35

PROSPEROUS
PROSPEROUS KEY ACHIEVEMENTS By 2040 our city will be a diverse and clean economy that attracts investment and jobs, and creates exports in sustainable business precincts while providing access to education and skills development.
DEVELOPING TONSLEY Council continued to work with key stakeholders, including the State Government, PEET Group and Flinders University, to develop the integrated employment, education and residential district at Tonsley. This redevelopment is expected to attract $1 billion of private investment.
Progress over the past year included; 1,000 people are now employed at Tonsley. The launch of the State Governments $32
million Drill Core Reference Library used bymineral exploration companies to pinpointdeposits.
The co-working space, Co-HAB, has extended its offices and increased the number of its tenants to 64.
The State Government plans to develop an 11hectare residential precinct and extend theTonsley rail line to Flinders Medical Centre andFlinders University increasing connectivitybetween the sites. The Tonsley ResidentialDevelopment will see around 850 dwellingswith 1200 residents over the next seven years.
The following companies have moved to theTonsley innovation district including:
o Radical Torque Solutionso Micro-X,o Azzo Automation,o HEGS,o Catalyst Cloud Solutions,o Australia’s Best Ideas,o Squash SAo Hydrix.
Looking forward, additional activation of the “Tonsley Pod” will build community within the site and attract more local and small businesses to the site. In addition, with the announcement of the Flinders Link project on the Tonsley rail line to Flinders Medical Centre and Flinders University, opportunities for rail station placement, upgrading and renaming of the Clovelly Park Station need to be considered.
More companies are also expected to move to Tonsley including SAGE Automation, and ZEISS (having commenced construction of their 4,000 square metre premises during the financial year).
GROWING SMALL BUSINESS The Tonsley Small Business Advisory Service provided support to 395 clients in its second year of operation. Launched in June 2015 as a partnership between the City of Marion, City of Onkaparinga and the Department of State Development (DSD), the advisory service delivered approximately 600 hours of face-to-face support to aspiring entrepreneurs and established operators.
The most popular subjects businesses sought advice on were planning, finance and marketing. Council will continue to work regionally through the Southern Adelaide Economic Development Board to reinvigorate the Southern Adelaide Small Business Advisory Service to support start-ups and businesses with strong growth potential.
DARLINGTON UPGRADE PROJECT Marion and Mitcham councils continue to work with the State Government and Gateway South (the construction consortium) through the design and build of the $620 million Darlington road upgrade. This financial year heralded an announcement of a further $85.5 million for the Flinders Link rail project, providing increased connectivity between the sites including Flinders University, Flinders Medical Centre, and Tonsley whilst driving jobs growth, improving local traffic access and promoting cycling and public transport. The $620 million and $85.5 million projects respectively are jointly funded by Australian and State governments. The project is anticipated to be completed by December 2018 and the Flinders Link Project is anticipated to be completed by March 2019.
Page 37
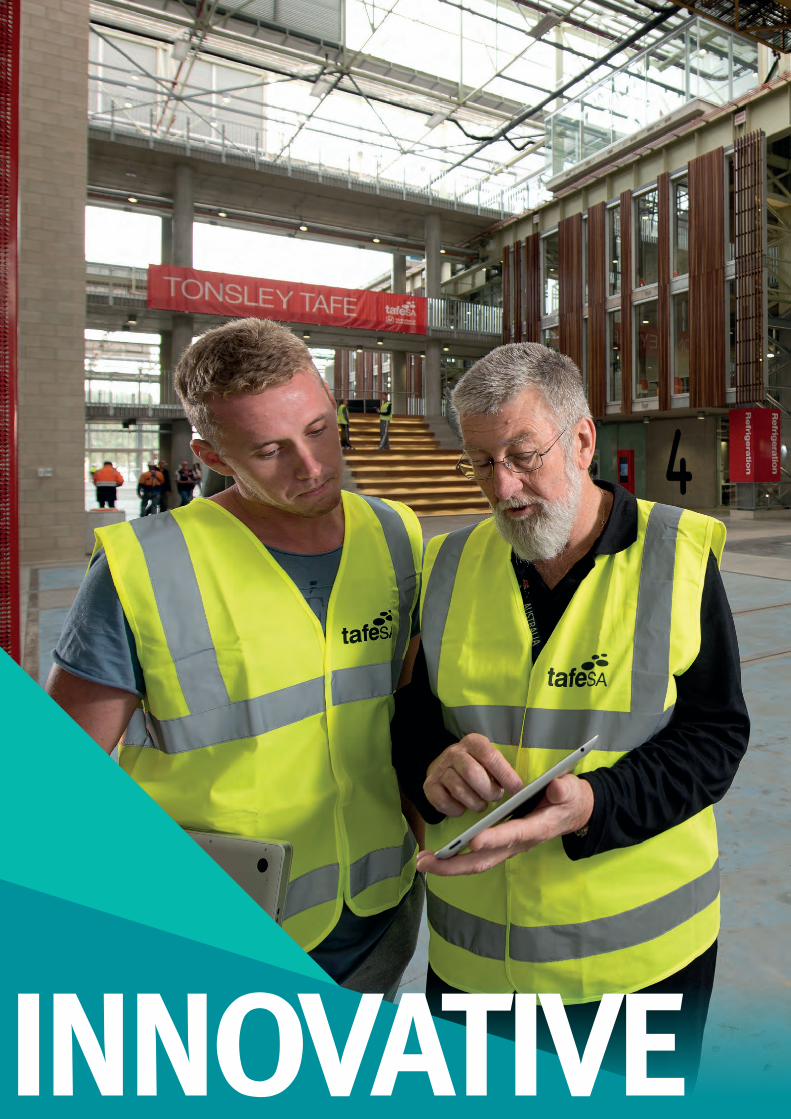
INNOVATIVE
INNOVATIVE KEY ACHIEVEMENTS By 2040 our city will be a leader in embracing and developing new ideas and technology to create a vibrant community with opportunities for all.
LEASING AND LICENSING POLICY A new Leasing & Licensing Policy was adopted at the 28 March 2017 Council meeting with a gradual implementation phase planned from 1 July 2017 to all leases and licences which are renewed or entered into. The purpose of the review and subsequent policy endorsement was to ensure a consistent and equitable approach for organisations/associations leasing council owned facilities. Key changes from the previous policy include;
Removal of peppercorn rent arrangements Building insurance will not be charged to clubs
Ultimately, the new policy will facilitate strategies/initiatives for clubs to increase their membership and attract other user groups whilst being eligible to access subsidies offered by Council.
SPORTING AND COMMUNITY CLUB SURVEY The City of Marion wants to work closely with community organisations and sporting clubs to ensure that they are well managed and the facilities are safe, suitable and encourage maximum community participation. This year a total of 66 participants viewed the survey on Council’s Making Marion Website, with 45 responses received. Maintenance issues are a major challenge to Council with many buildings in need of ongoing maintenance works due to their age. Council will continue to work with Sporting and Community Clubs to assist with capacity building and ongoing assistance where needed.
SOLAR PANELS Council decided to explore the opportunity of installing solar panels to 10 of our operating buildings. With a projected saving of approximately $70,000 annually of power costs. Solar panels across eight sites have been successfully installed with Solar panels and waiting for connection to the network through SA Power Networks.
SPORT LIGHTING UPGRADES Council was approached by Cove Soccer Club to install sports lighting to the Capella reserve to improve the facility so their juniors would be able to train. The Cove Soccer Club were successful in obtaining a grant and council agreed to match it. A slight re-design for the position of the lighting towers has increased the site’s capacity to accommodate two full sized pitches in the future.
ICEBREAKER16 Supported by the City of Marion and managed by Flinders University New Venture Institute and sponsored by Renewal SA, more than 1000 business people, researchers, students and executives pitched their services, exchanged ideas and swapped contact details at
Tonsley’s biggest networking event. This event was a Guinness World Record attempt attracting 1062 participants – falling short of the previous record set by JCI Limburg in Flanders, Belgium on 17 November 2014 of 1068 participants. Participants had three minutes to state their case before moving on to another networker with each person making 22 contacts.
OPEN FOR BUSINESS A new Council initiative ‘Open for Business’ aimed at creating jobs and boosting business investment was launched in early 2017. The initiative plans to reduce red tape and fast track development applications to create a more conducive and business friendly environment for all types of businesses in the City of Marion. In addition, Council’s payment terms have been reduced from up to 60 days to 30 days to improve cash flow, reduce costs and provide certainty for small companies that Council conducts business with.
COMMUNITY SATISFACTION SURVEY A survey distributed to 5000 homes across every suburb in the City of Marion in May 2017 received a 9% response rate. The survey aimed to seek information from the community regarding their satisfaction with Council Sporting and community facilities and events to support Council’s focus on innovation and improvement. Satisfaction rate results include;
Sport and Recreation Facilities – 87% Community and Cultural Facilities – 97%
OFFICE OF RECREATION AND SPORT FUNDING SUPPORT With the assistance and guidance from the City of Marion clubs have been made aware of the various funding opportunities through both internal & external providers that could facilitate capital upgrades and equipment purchases that could not be funded by the club alone. Support has been provided in establishing all required documentation to support these applications such as constitutions, business plans, strategic plans, volunteer management policies along with professional guidance in writing the applications to ensure strongest application is made. Council will continue to support clubs to have an established strategic plan that can be activated and aligned when funding becomes available.
Page 39

CONNECTED
CONNECTED KEY ACHIEVEMENTS By 2040 our city will be linked by a quality road, footpath and public transport network that brings people together socially and harnesses technology to enable them to access services and facilities.
OAKLANDS CROSSING Council remained steadfast in its commitment to fix Oaklands Crossing. As at June 2017, the cost to fix Oakland’s Crossing was estimated at $174.3 million ($95 million from Federal Government, $74.3 million from State Government and $5million from the City of Marion).The project proposes a rail underpass extending 400 metres east and west of the Oaklands Park level crossing and will include a new station with an extended 160-metre platform to cater for longer trains. Expressions of interest for design and construction are expected to be sought early next financial year and building to commence in 2018.
HALLETT COVE FORESHORE MASTERPLAN - STAGE 5 AMPHITHEATRE The detailed design for the amphitheatre at Grand Central Reserve was endorsed by Council. The design includes terraced irrigated lawns, retaining seating walls, pavements and landscaping which will enable community events to be hosted at this popular coastal public reserve. Construction of the Amphitheatre and the design of the playground and reserve stage will occur in 2017/18.
MARION LEISURE AND FITNESS CENTRE Council has provided the YMCA South Australia with a lease from 1 September 2016 to manage areas of the centre for four years and 10 months. The centre now offers a ‘wellness’ model for health and fitness programs with a focus on older adult fitness, disability, health, recreation and rehabilitation services.
GLANDORE LANEWAYS The Glandore Laneways were a network of interconnected private laneways running between Nottingham Crescent/Maude Street, and Pleasant Avenue/Maude Street. As a means of improving safety and traffic flow, Council took ownership of the laneways and acquired portions of land from six adjoining property owners to make vehicle turn paths and access/egress safer. The laneways have now been named ‘Frederick Lane’ and ‘Burmeister Lane’ in recognition of the previous land owners.
SOCIAL MEDIA COMMUNICATION AND ENGAGEMENT The City of Marion tracks its social media performance throughout the financial year achieving the following results;
513,963 website visitors 1,155,051 pages viewed on website 9,861 website Facebook referrals 334 website Twitter referrals 7,315 Making Marion visitors 104,875 Facebook likes 644,579 Facebook reach 37,967 Twitter followers 275,493 Twitter engagements 6,320 Instagram followers 11,958 E-talk newsletter subscriptions
INCLUSIVE PLAYGROUND – HENDRIE RESERVE Council endorsed a concept plan and staged approach to the delivery of an inclusive playground at Hendrie Street Reserve. This is a joint project between the City of Marion, the Touched by Olivia Foundation and the Department of Planning, Transport and Infrastructure (DPTI). DPTI have committed $250,000 matching the City of Marion’s contribution with the Touched by Olivia Foundation looking to raise $400,000 towards the project, with the Edwardstown Rotary donating $10,000 toward the project. Stage one will commence 2017/18 which will include landscaping, playground equipment, seating, BBQ and picnic areas.
OPEN SPACE POLICY The Open Space Policy was endorsed in January 2017 and applied the following principles that will guide the provision, development and management of an open space works plan
• Accessibility and amenity• Multi-functional and adaptability• Environment protection an sustainability• Placemaking and community involvement
Using these principles, along with strategic mapping, the next step is to develop an Open Space Plan. The plan, over a ten year period should deliver open spaces that contribute to neighbourhood character, provide opportunities for active living and community engagement, and protect and enhance natural environments
RESERVE STREET RESERVE DOG PARK Completion of Council’s first dog park at Reserve Street Reserve, Trott Park with an official opening in September 2016.
Page 41
City of Marion GENERAL PURPOSE FINANCIAL STATEMENTS for the year ended 30 June 2017
Page 42
City of Marion
General Purpose Financial Statements for the year ended 30 June 2017
Contents
1. Council Certificate
2. Primary Financial Statements:
- Statement of Comprehensive Income- Statement of Financial Position- Statement of Changes in Equity- Statement of Cash Flows
3. Notes to the Financial Statements
4. Independent Auditor's Report - Financial Statements
5. Independent Auditor's Report - Internal Controls
6. Certificates of Audit Independence
- Council Certificate of Audit Independence- Audit Certificate of Audit Independence 49
Page
45
3
6
7
48
2
44
46
Page 43
Page 44
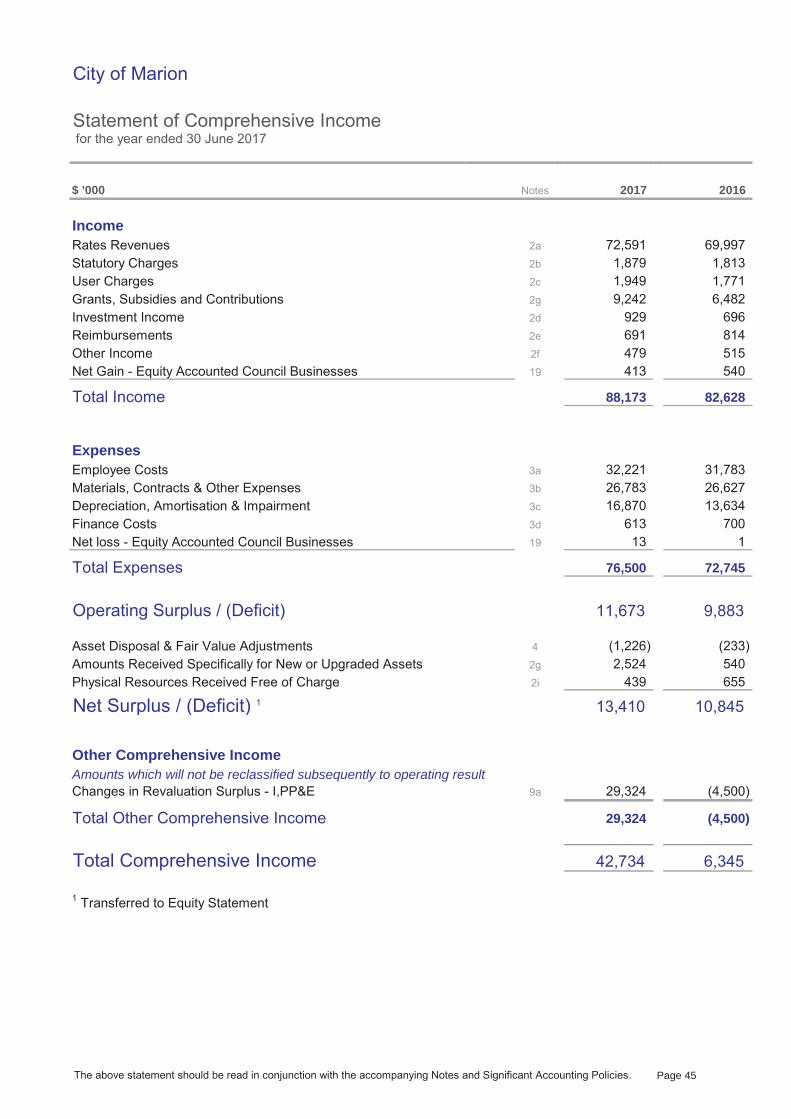
City of Marion
Statement of Comprehensive Income for the year ended 30 June 2017
$ '000
IncomeRates RevenuesStatutory ChargesUser ChargesGrants, Subsidies and ContributionsInvestment IncomeReimbursementsOther IncomeNet Gain - Equity Accounted Council Businesses
Total Income
ExpensesEmployee CostsMaterials, Contracts & Other ExpensesDepreciation, Amortisation & ImpairmentFinance CostsNet loss - Equity Accounted Council Businesses
Total Expenses
Operating Surplus / (Deficit)
Asset Disposal & Fair Value AdjustmentsAmounts Received Specifically for New or Upgraded AssetsPhysical Resources Received Free of Charge
Net Surplus / (Deficit) 1
Other Comprehensive IncomeAmounts which will not be reclassified subsequently to operating resultChanges in Revaluation Surplus - I,PP&E
Total Other Comprehensive Income
Total Comprehensive Income
1 Transferred to Equity Statement
3d
6,482
1,813
(1,226) (233)
72,745
515
82,628
9,883
700
814
613
88,173
540
26,627
1,771
929 696
(4,500) 29,324
11,673
10,845
76,500
42,734
4
6,345
439
13,410 2i
9a
2016
72,591 69,997
13 1
31,783 32,221
655 540
691
413
29,324 (4,500)
479
13,634
Notes
2a
2b
2c
2g
2f
2017
3c
2e
3a
26,783 3b
2d
19
1,879 1,949
16,870
9,242
19
2g 2,524
X3A0T
The above statement should be read in conjunction with the accompanying Notes and Significant Accounting Policies. Page 45
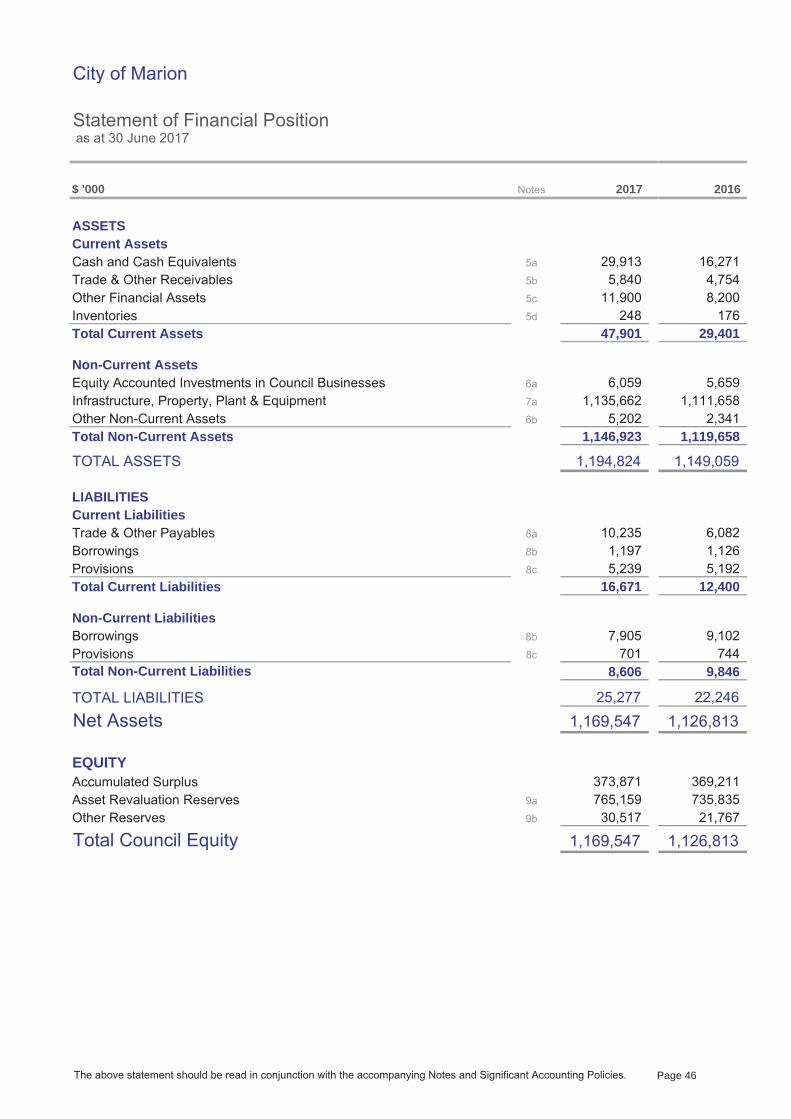
City of Marion
Statement of Financial Position as at 30 June 2017
$ '000
ASSETSCurrent AssetsCash and Cash EquivalentsTrade & Other ReceivablesOther Financial AssetsInventoriesTotal Current Assets
Non-Current AssetsEquity Accounted Investments in Council BusinessesInfrastructure, Property, Plant & EquipmentOther Non-Current AssetsTotal Non-Current Assets
TOTAL ASSETS
LIABILITIESCurrent LiabilitiesTrade & Other PayablesBorrowingsProvisionsTotal Current Liabilities
Non-Current LiabilitiesBorrowingsProvisionsTotal Non-Current Liabilities
TOTAL LIABILITIESNet Assets
EQUITYAccumulated SurplusAsset Revaluation ReservesOther Reserves
Total Council Equity
7,905
1,169,547
25,277
373,871
701 8,606
9b 30,517 765,159
1,169,547
6a
7a
8b
8c
Notes
11,900
10,235
5,659
5b
29,913 4,754 8,200
176
16,271
248
5,840
29,401
2016
5c
2017
1,126 5,192
735,835
744 9,102
9,846
22,246
1,126,813
369,211
1,111,658 2,341
1,149,059
1,119,658
9a
16,671
6,059
8c 5,239 1,197
8a
8b
1,135,662
5d
5a
1,146,923
1,194,824
6b 5,202
47,901
1,126,813 21,767
6,082
12,400
The above statement should be read in conjunction with the accompanying Notes and Significant Accounting Policies. Page 46
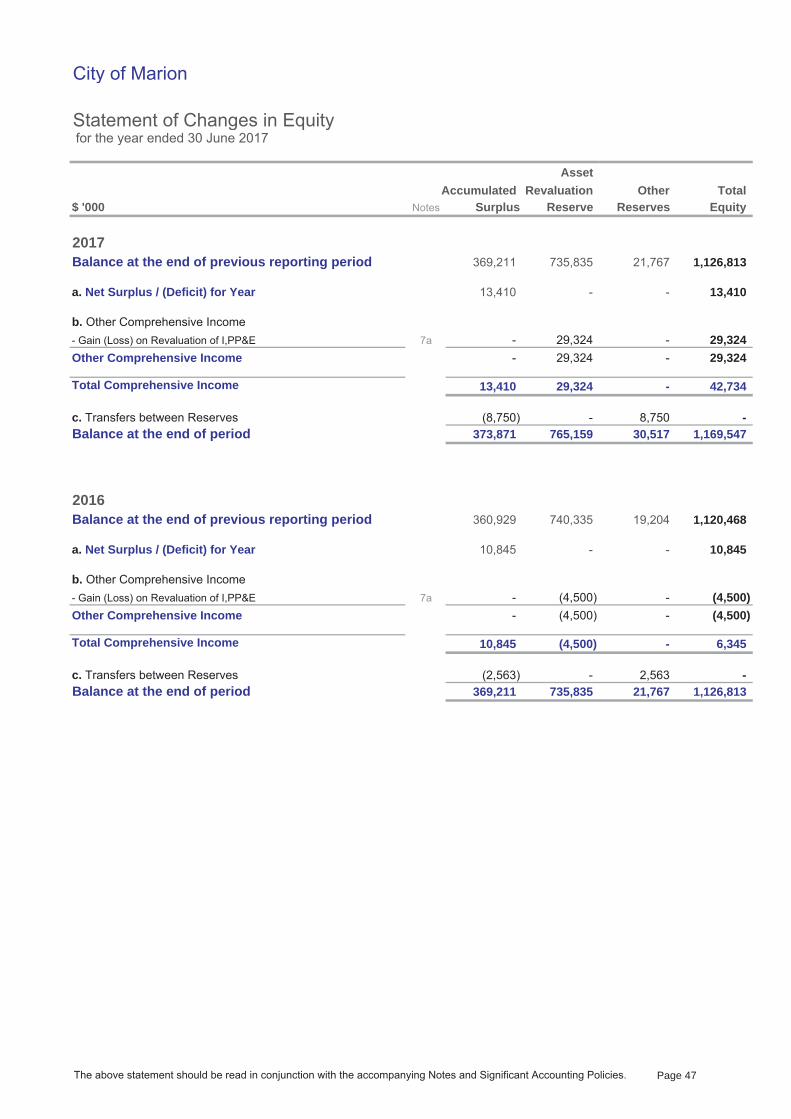
City of Marion
Statement of Changes in Equity for the year ended 30 June 2017
AssetAccumulated Revaluation Other Total
$ '000 Notes Surplus Reserve Reserves Equity
2017Balance at the end of previous reporting period 369,211 735,835 21,767 1,126,813
a. Net Surplus / (Deficit) for Year 13,410 - - 13,410
b. Other Comprehensive Income- Gain (Loss) on Revaluation of I,PP&E 7a - 29,324 - 29,324 Other Comprehensive Income - 29,324 - 29,324
Total Comprehensive Income 13,410 29,324 - 42,734
c. Transfers between Reserves (8,750) - 8,750 - Balance at the end of period 373,871 765,159 30,517 1,169,547
2016Balance at the end of previous reporting period 360,929 740,335 19,204 1,120,468
a. Net Surplus / (Deficit) for Year 10,845 - - 10,845
b. Other Comprehensive Income- Gain (Loss) on Revaluation of I,PP&E 7a - (4,500) - (4,500) Other Comprehensive Income - (4,500) - (4,500)
Total Comprehensive Income 10,845 (4,500) - 6,345
c. Transfers between Reserves (2,563) - 2,563 - Balance at the end of period 369,211 735,835 21,767 1,126,813
The above statement should be read in conjunction with the accompanying Notes and Significant Accounting Policies. Page 47
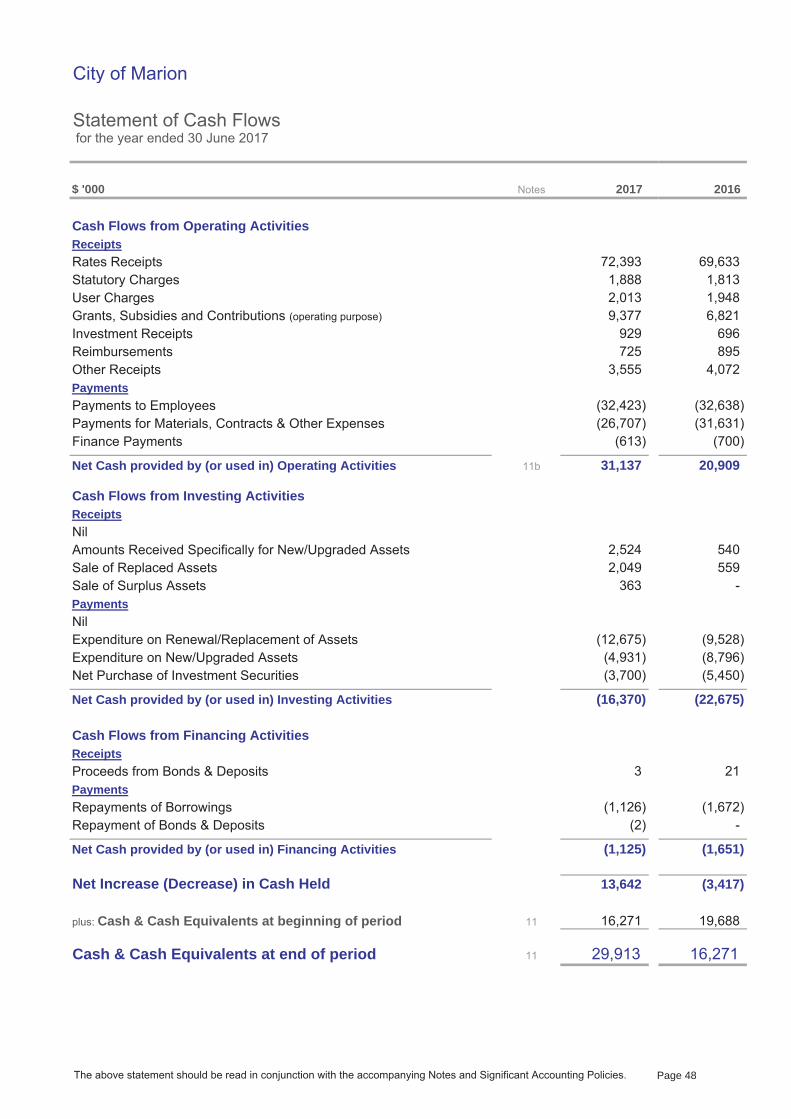
City of Marion
Statement of Cash Flows for the year ended 30 June 2017
$ '000
Cash Flows from Operating ActivitiesReceiptsRates ReceiptsStatutory ChargesUser ChargesGrants, Subsidies and Contributions (operating purpose)
Investment ReceiptsReimbursementsOther ReceiptsPaymentsPayments to EmployeesPayments for Materials, Contracts & Other ExpensesFinance Payments
Net Cash provided by (or used in) Operating Activities
Cash Flows from Investing ActivitiesReceiptsNilAmounts Received Specifically for New/Upgraded AssetsSale of Replaced AssetsSale of Surplus AssetsPaymentsNilExpenditure on Renewal/Replacement of AssetsExpenditure on New/Upgraded AssetsNet Purchase of Investment Securities
Net Cash provided by (or used in) Investing Activities
Cash Flows from Financing ActivitiesReceiptsProceeds from Bonds & DepositsPaymentsRepayments of BorrowingsRepayment of Bonds & Deposits
Net Cash provided by (or used in) Financing Activities
Net Increase (Decrease) in Cash Held
plus: Cash & Cash Equivalents at beginning of period
Cash & Cash Equivalents at end of period
Notes 2017 2016
72,393 69,633
9,377 6,821 929 696
1,888 1,813 2,013 1,948
(32,423) (32,638) (26,707) (31,631)
725 895 3,555 4,072
2,524 540 2,049 559
(613) (700)
11b 31,137 20,909
363 -
(12,675) (9,528) (4,931) (8,796) (3,700) (5,450)
(16,370) (22,675)
(1,126) (1,672)
3 21
(2) -
11 29,913 16,271
(1,125) (1,651)
13,642 (3,417)
11 16,271 19,688
The above statement should be read in conjunction with the accompanying Notes and Significant Accounting Policies. Page 48

City of Marion
Notes to and forming part of the Financial Statements for the year ended 30 June 2017
Contents of the Notes accompanying the Financial Statements
Details
Significant Accounting PoliciesIncomeExpensesAsset Disposal & Fair Value AdjustmentsCurrent AssetsCash & Cash EquivalentsTrade & Other ReceivablesOther Financial Assets (Investments)InventoriesNon-Current AssetsEquity Accounted Investments in Council's BusinessesOther Non-Current AssetsFixed AssetsInfrastructure, Property, Plant & EquipmentInvestment PropertyValuation of Infrastructure, Property, Plant & EquipmentLiabilitiesTrade & Other PayablesBorrowingsProvisionsReservesAsset Revaluation ReserveOther ReservesAssets Subject to RestrictionsReconciliation to Statement of CashflowsFunctionsComponents of FunctionsFinancial InstrumentsCommitments for ExpenditureFinancial IndicatorsUniform Presentation of FinancesOperating LeasesSuperannuationInterests in Other EntitiesNon Current Assets Held for Sale & Discontinued OperationsContingencies & Assets/Liabilities Not Recognised in the Balance SheetEvents After the Balance Sheet DateRelated Party Transactions23 43
5b 195c 195d 19
7a (ii) 20 n/a
7b 21
6a 196b
248b 248c
8a
1011
24
249b 259a
2627
16
40
38
28
36
32
12a
1514
17
1312b
1918
35
29
37
39
41 n/a
Page
1
Note
7a (i)
43
18
18
20
5a
8
19
2 1417
4243
202122
X6A0T
Page 49

_
City of Marion
Notes to and forming part of the Financial Statements for the year ended 30 June 2017 Note 1. Summary of Significant Accounting Policies
The principal accounting policies adopted by Council in the preparation of these consolidated financial statements are set out below. These policies have been consistently applied to all the years presented, unless otherwise stated. 1 Basis of Preparation 1.1 Compliance with Australian Accounting Standards This general purpose financial report has been prepared on a going concern basis using the historical cost convention in accordance with Australian Accounting Standards as they apply to not‐for‐profit entities, other authoritative pronouncements of the Australian Accounting Standards Board, Interpretations and relevant South Australian legislation. The financial report was authorised for issue by certificate under regulation 14 of the Local Government (Financial Management) Regulations 2011. 1.2 Historical Cost Convention Except as stated below, these financial statements have been prepared in accordance with the historical cost convention. 1.3 Critical Accounting Estimates The preparation of financial statements in conformity with Australian Accounting Standards requires the use of certain critical accounting estimates, and requires management to exercise its judgement in applying Council’s accounting policies. The areas involving a higher degree of judgement or complexity, or areas where assumptions and estimates are significant to the financial statements are specifically referred to in the relevant sections of these Notes. 1.4 Rounding All amounts in the financial statements have been rounded to the nearest thousand dollars ($’000).
2 The Local Government Reporting Entity City of Marion is incorporated under the South Australian Local Government Act 1999 and has its principal place of business at 245 Sturt Road, Sturt. These financial statements include the Council’s direct operations and all entities through which Council controls resources to carry on its functions. In the process of reporting on the Council as a single unit, all transactions and balances between activity areas and controlled entities have been eliminated. Other entities in which Council has an interest but does not control are reported in Note 19. 3 Income Recognition Income is measured at the fair value of the consideration received or receivable. Income is recognised when the Council obtains control over the assets comprising the income, or when the amount due constitutes an enforceable debt, whichever first occurs. Where grants, contributions and donations recognised as incomes during the reporting period were obtained on the condition that they be expended in a particular manner or used over a particular period, and those conditions were undischarged as at the reporting date, the amounts subject to those undischarged conditions are disclosed in these notes. Also disclosed is the amount of grants, contributions and receivables recognised as incomes in a previous reporting period which were obtained in respect of the Council's operations for the current reporting period. In recent years the payment of untied financial assistance grants has varied from the annual allocation as shown in the table below:
Cash
Payment Received
Annual Allocation Difference
2014/15 $4,173,716 $2,736,897 +$1,436,819 2015/16 $1,278,810 $2,715,629 -$1,436,819 2016/17 $4,091,214 $2,700,069 +$1,391,145
Page 50
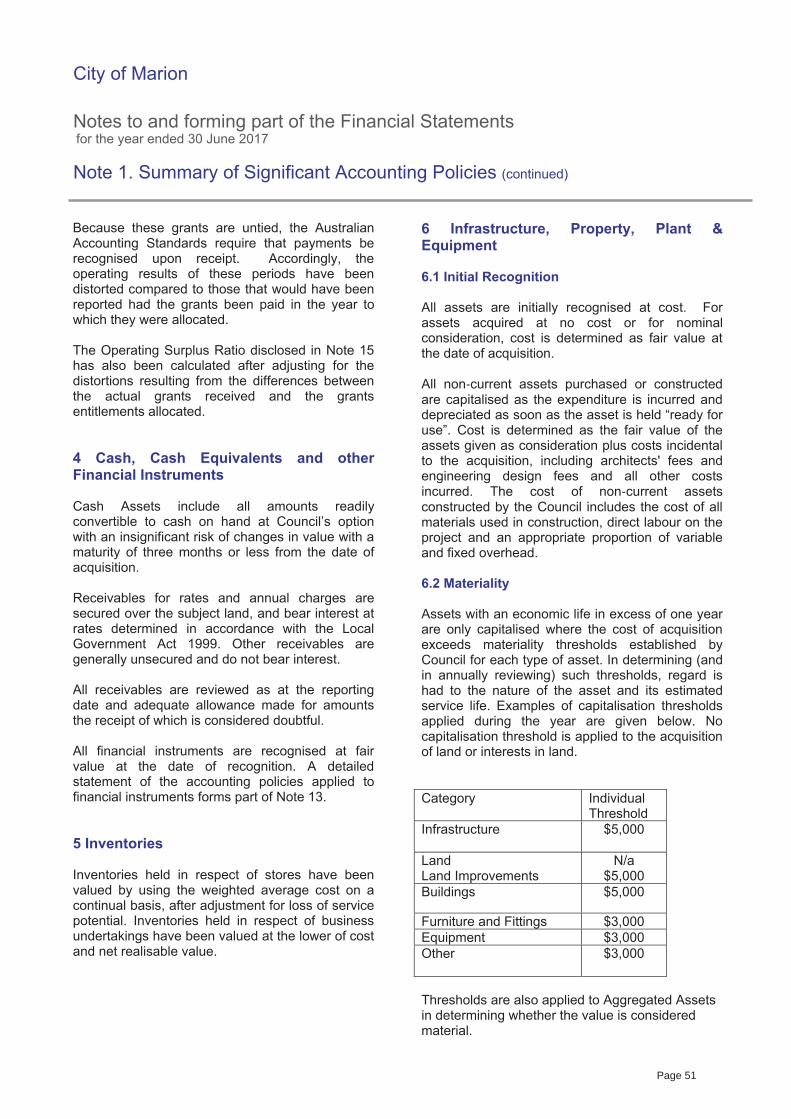
_
City of Marion
Notes to and forming part of the Financial Statements for the year ended 30 June 2017 Note 1. Summary of Significant Accounting Policies (continued)
Because these grants are untied, the Australian Accounting Standards require that payments be recognised upon receipt. Accordingly, the operating results of these periods have been distorted compared to those that would have been reported had the grants been paid in the year to which they were allocated. The Operating Surplus Ratio disclosed in Note 15 has also been calculated after adjusting for the distortions resulting from the differences between the actual grants received and the grants entitlements allocated. 4 Cash, Cash Equivalents and other Financial Instruments Cash Assets include all amounts readily convertible to cash on hand at Council’s option with an insignificant risk of changes in value with a maturity of three months or less from the date of acquisition. Receivables for rates and annual charges are secured over the subject land, and bear interest at rates determined in accordance with the Local Government Act 1999. Other receivables are generally unsecured and do not bear interest. All receivables are reviewed as at the reporting date and adequate allowance made for amounts the receipt of which is considered doubtful. All financial instruments are recognised at fair value at the date of recognition. A detailed statement of the accounting policies applied to financial instruments forms part of Note 13. 5 Inventories Inventories held in respect of stores have been valued by using the weighted average cost on a continual basis, after adjustment for loss of service potential. Inventories held in respect of business undertakings have been valued at the lower of cost and net realisable value.
6 Infrastructure, Property, Plant & Equipment 6.1 Initial Recognition All assets are initially recognised at cost. For assets acquired at no cost or for nominal consideration, cost is determined as fair value at the date of acquisition. All non‐current assets purchased or constructed are capitalised as the expenditure is incurred and depreciated as soon as the asset is held “ready for use”. Cost is determined as the fair value of the assets given as consideration plus costs incidental to the acquisition, including architects' fees and engineering design fees and all other costs incurred. The cost of non‐current assets constructed by the Council includes the cost of all materials used in construction, direct labour on the project and an appropriate proportion of variable and fixed overhead. 6.2 Materiality Assets with an economic life in excess of one year are only capitalised where the cost of acquisition exceeds materiality thresholds established by Council for each type of asset. In determining (and in annually reviewing) such thresholds, regard is had to the nature of the asset and its estimated service life. Examples of capitalisation thresholds applied during the year are given below. No capitalisation threshold is applied to the acquisition of land or interests in land. Category Individual
Threshold Infrastructure $5,000
Land Land Improvements
N/a $5,000
Buildings $5,000
Furniture and Fittings $3,000 Equipment $3,000 Other $3,000
Thresholds are also applied to Aggregated Assets in determining whether the value is considered material.
Page 51
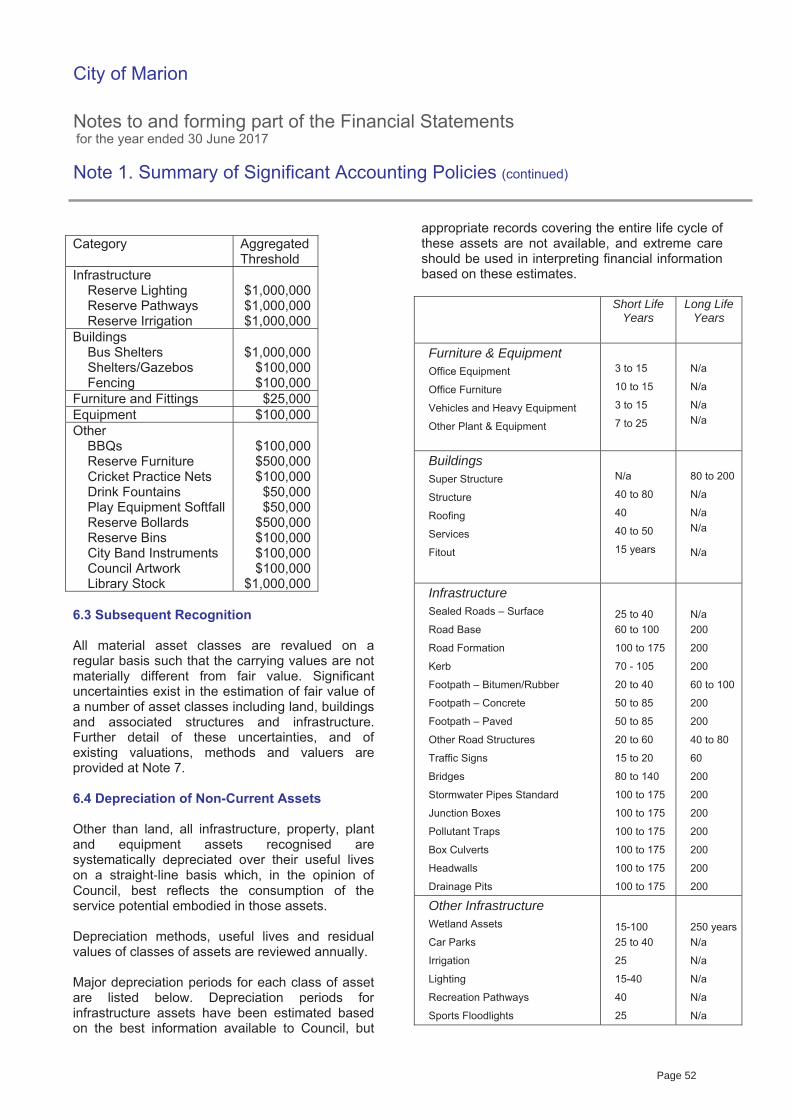
_
City of Marion
Notes to and forming part of the Financial Statements for the year ended 30 June 2017 Note 1. Summary of Significant Accounting Policies (continued)
Category Aggregated
Threshold Infrastructure Reserve Lighting Reserve Pathways Reserve Irrigation
$1,000,000 $1,000,000 $1,000,000
Buildings Bus Shelters Shelters/Gazebos Fencing
$1,000,000
$100,000 $100,000
Furniture and Fittings $25,000 Equipment $100,000 Other BBQs Reserve Furniture Cricket Practice Nets Drink Fountains Play Equipment Softfall Reserve Bollards Reserve Bins City Band Instruments Council Artwork Library Stock
$100,000 $500,000 $100,000
$50,000 $50,000
$500,000 $100,000 $100,000 $100,000
$1,000,000 6.3 Subsequent Recognition All material asset classes are revalued on a regular basis such that the carrying values are not materially different from fair value. Significant uncertainties exist in the estimation of fair value of a number of asset classes including land, buildings and associated structures and infrastructure. Further detail of these uncertainties, and of existing valuations, methods and valuers are provided at Note 7. 6.4 Depreciation of Non-Current Assets Other than land, all infrastructure, property, plant and equipment assets recognised are systematically depreciated over their useful lives on a straight‐line basis which, in the opinion of Council, best reflects the consumption of the service potential embodied in those assets. Depreciation methods, useful lives and residual values of classes of assets are reviewed annually. Major depreciation periods for each class of asset are listed below. Depreciation periods for infrastructure assets have been estimated based on the best information available to Council, but
appropriate records covering the entire life cycle of these assets are not available, and extreme care should be used in interpreting financial information based on these estimates.
Short Life Years
Long Life Years
Furniture & Equipment Office Equipment
Office Furniture
Vehicles and Heavy Equipment
Other Plant & Equipment
3 to 15
10 to 15
3 to 15
7 to 25
N/a
N/a
N/a N/a
BuildingsSuper Structure
Structure
Roofing
Services
Fitout
N/a
40 to 80
40
40 to 50
15 years
80 to 200
N/a
N/a N/a N/a
Infrastructure Sealed Roads – Surface
Road Base
Road Formation
Kerb
Footpath – Bitumen/Rubber
Footpath – Concrete
Footpath – Paved
Other Road Structures
Traffic Signs
Bridges
Stormwater Pipes Standard
Junction Boxes
Pollutant Traps
Box Culverts
Headwalls
Drainage Pits
25 to 40 60 to 100
100 to 175
70 - 105
20 to 40
50 to 85
50 to 85
20 to 60
15 to 20
80 to 140
100 to 175
100 to 175
100 to 175
100 to 175
100 to 175
100 to 175
N/a200
200
200
60 to 100
200
200
40 to 80
60
200
200
200
200
200
200
200
Other Infrastructure Wetland Assets
Car Parks
Irrigation
Lighting
Recreation Pathways
Sports Floodlights
15-100 25 to 40
25
15-40
40
25
250 yearsN/a
N/a
N/a
N/a
N/a
Page 52
_
City of Marion
Notes to and forming part of the Financial Statements for the year ended 30 June 2017 Note 1. Summary of Significant Accounting Policies (continued)
Other Assets Library Books - Paperbacks
Library Books - Hardcover
Other Library (CD’s, DVD’s, Toys)
Playground Equipment
Reserve Furniture
Band Instruments
Civic Art Structures
7
7
3 to 7
20
7 to 40
60
30 to 80
N/a
N/a
N/a
N/a
N/a
N/a
N/a
6.5 Impairment Assets whose future economic benefits are not dependent on the ability to generate cash flows, and where the future economic benefits would be replaced if Council were deprived thereof, are not subject to impairment testing. Other assets that are subject to depreciation are reviewed for impairment whenever events or changes in circumstances indicate that the carrying amount may not be recoverable. An impairment loss is recognised for the amount by which the asset’s carrying amount exceeds its recoverable amount (which is the higher of the present value of future cash inflows or value in use). Where an asset that has been revalued is subsequently impaired, the impairment is first offset against such amount as stands to the credit of that class of assets in Asset Revaluation Reserve, any excess being recognised as an expense. 6.6 Borrowing Costs Borrowing costs in relation to qualifying assets (net of offsetting investment revenue) have been capitalised in accordance with AASB 123 “Borrowing Costs”. The amounts of borrowing costs recognised as an expense or as part of the carrying amount of qualifying assets are disclosed in Note 3, and the amount (if any) of interest revenue offset against borrowing costs in Note 2.
7 Payables 7.1 Goods & Services Creditors are amounts due to external parties for the supply of goods and services and are recognised as liabilities when the goods and services are received. Creditors are normally paid 30 days after the month of invoice. No interest is payable on these amounts. 7.2 Payments Received in Advance & Deposits Amounts other than grants received from external parties in advance of service delivery, and security deposits held against possible damage to Council assets, are recognised as liabilities until the service is delivered or damage reinstated, or the amount is refunded as the case may be. 8 Borrowings Borrowings are carried at their principal amounts which represent the present value of future cash flows associated with servicing the debt. Interest is accrued over the period to which it relates, and is recorded as part of “Payables”. 9 Employee Benefits 9.1 Salaries, Wages & Compensated Absences Liabilities for employees’ entitlements to salaries, wages and compensated absences expected to be paid or settled within 12 months of reporting date are accrued at nominal amounts (including payroll based oncosts) measured in accordance with AASB 119. Liabilities for employee benefits not expected to be paid or settled within 12 months are measured as the present value of the estimated future cash outflows (including payroll based oncosts) to be made in respect of services provided by employees up to the reporting date. Present values are calculated using government guaranteed securities rates with similar maturity terms.
Page 53
_
City of Marion
Notes to and forming part of the Financial Statements for the year ended 30 June 2017 Note 1. Summary of Significant Accounting Policies (continued)
9.2 Superannuation The Council makes employer superannuation contributions in respect of its employees to the Statewide Superannuation Scheme. The Scheme has two types of membership, each of which is funded differently. No changes in accounting policy have occurred during either the current or previous reporting periods. Details of the accounting policies applied and Council’s involvement with the schemes are reported in Note 18. 10 Leases Lease arrangements have been accounted for in accordance with Australian Accounting Standard AASB 117. In respect of finance leases, where Council substantially carries all of the risks incident to ownership, the leased items are initially recognised as assets and liabilities equal in amount to the present value of the minimum lease payments. The assets are disclosed within the appropriate asset class, and are amortised to expense over the period during which the Council is expected to benefit from the use of the leased assets. Lease payments are allocated between interest expense and reduction of the lease liability, according to the interest rate implicit in the lease. In respect of operating leases, where the lessor substantially retains all of the risks and benefits incident to ownership of the leased items, lease payments are charged to expense over the lease term. 11 Equity Accounted Council Businesses Council participates in cooperative arrangements with other Councils for the provision of services and facilities. Council’s interests in cooperative arrangements, which are only recognised if material, are accounted for in accordance with AASB 128 and set out in detail in Note 19. 12 GST Implications In accordance with UIG Abstract 1031 “Accounting for the Goods & Services Tax”
Receivables and Creditors include GST receivable and payable.
Except in relation to input taxed activities, revenues and operating expenditures exclude GST receivable and payable.
Non-current assets and capital expenditures include GST net of any recoupment.
Amounts included in the Statement of Cash Flows are disclosed on a gross basis.
13 New accounting standards and interpretations In the current year, Council adopted all of the new and revised Standards and Interpretations issued by the Australian Accounting Standards Board (AASB) that are relevant to its operations and effective for the current reporting period. The adoption of the new and revised Standards and Interpretations has not resulted in any material changes to Council's accounting policies. City of Marion has not applied any Australian Accounting Standards and Interpretations that have been issued but are not yet effective. This year Council has applied AASB 124 Related Party Disclosures for the first time. As a result Council has disclosed more information about related parties and transactions with those related parties. This information is presented in Note 23. Other amended Australian Accounting Standards and Interpretations which were issued at the date of authorisation of the financial report, but have future commencement dates are not likely to have a material impact on the financial statements. As at the date of authorisation of the financial statements, the standards and interpretations listed below were in issue but not yet effective. Effective for annual reporting periods beginning on or after 1 January 2017 AASB 2014-5 Amendments to Australian
Accounting Standards arising from AASB 15
Page 54

_
City of Marion
Notes to and forming part of the Financial Statements for the year ended 30 June 2017 Note 1. Summary of Significant Accounting Policies (continued)
AASB 2015-8 Amendments to Australian Accounting Standards – Effective Date of AASB 15
AASB 2016-2 Amendments to Australian Accounting Standards – Disclosure Initiative: Amendments to AASB 107
Effective for annual reporting periods beginning on or after 1 January 2018 AASB 9 Financial Instruments (December
2009)
AASB 15 Revenue from Contracts with Customers
AASB 2010-7 Amendments to Australian
Accounting Standards arising from AASB 9 (December 2010)
AASB 2014-1 Amendments to Australian
Accounting Standards (Part E)
AASB 2014-7 Amendments to Australian Accounting Standards arising from AASB 9 (December 2014)
AASB 2016-3 Amendments to Australian
Accounting Standards – Clarifications to AASB 15
Effective for annual reporting periods beginning on or after 1 January 2019 AASB 16 Leases
14 Comparative Figures To ensure comparability with the curren t reporting period’s figures, some comparative period line items and amounts may have been reclassified or individually reported for t he first time within these financial statements and/or the notes.
15 Disclaimer Nothing contained within these statements may be taken to be an admission of any liability to any person under any circumstance.
Page 55
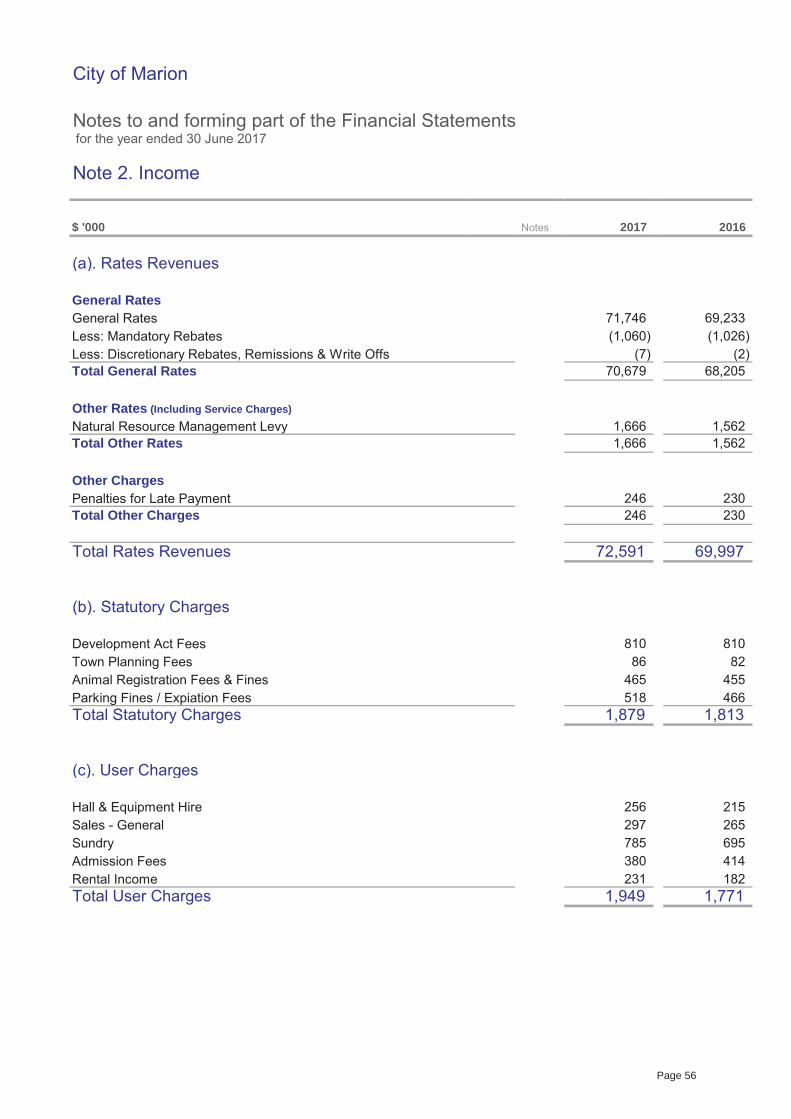
City of Marion
Notes to and forming part of the Financial Statements for the year ended 30 June 2017
Note 2. Income
$ '000
(a). Rates Revenues
General RatesGeneral RatesLess: Mandatory RebatesLess: Discretionary Rebates, Remissions & Write OffsTotal General Rates
Other Rates (Including Service Charges)Natural Resource Management LevyTotal Other Rates
Other ChargesPenalties for Late PaymentTotal Other Charges
Total Rates Revenues
(b). Statutory Charges
Development Act FeesTown Planning FeesAnimal Registration Fees & FinesParking Fines / Expiation FeesTotal Statutory Charges
(c). User Charges
Hall & Equipment HireSales - GeneralSundryAdmission FeesRental IncomeTotal User Charges
380
297 785
215
695
231 182
70,679
1,666
246
72,591
1,666
246
810
2016Notes
(1,026) (1,060)
68,205
1,562
71,746
2017
(2)
230
1,562
230
69,233
265
1,879
69,997
82 810
455 466
256
1,813
1,949 1,771
414
(7)
86
518 465
X8A0T
X8A1T
X8A2T
X8A20T
Page 56
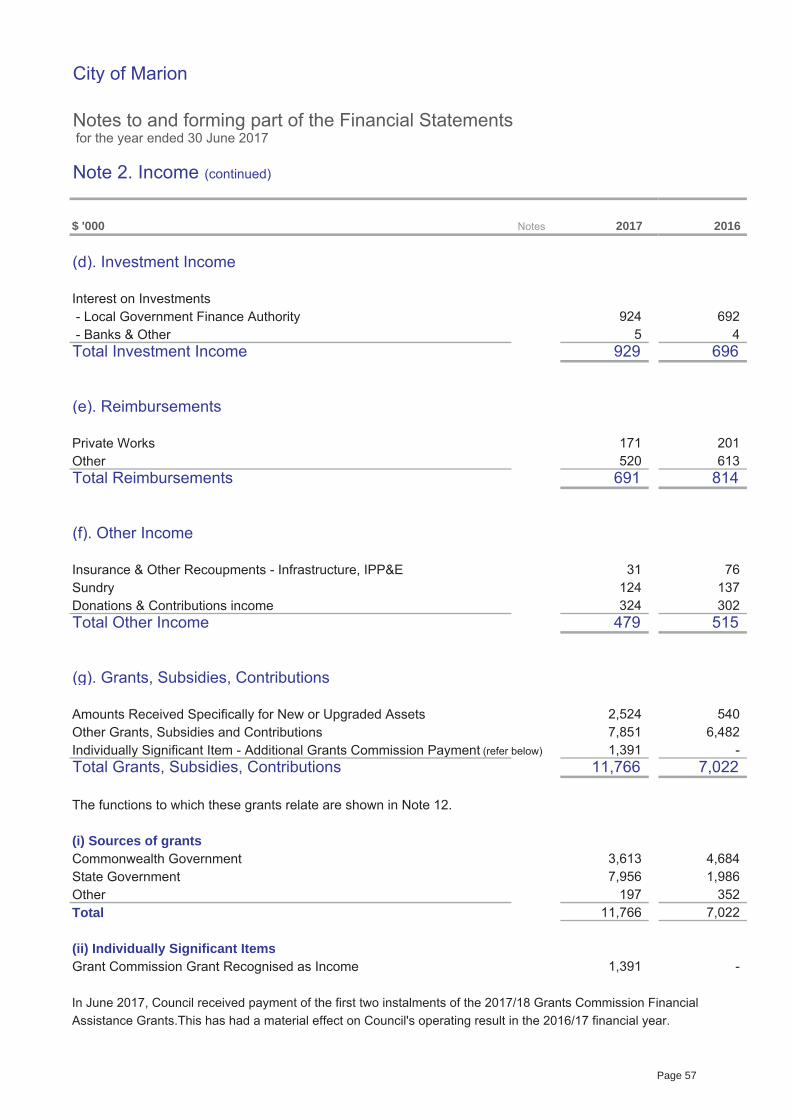
City of Marion
Notes to and forming part of the Financial Statements for the year ended 30 June 2017
Note 2. Income (continued)
$ '000
(d). Investment Income
Interest on Investments - Local Government Finance Authority - Banks & OtherTotal Investment Income
(e). Reimbursements
Private WorksOtherTotal Reimbursements
(f). Other Income
Insurance & Other Recoupments - Infrastructure, IPP&ESundryDonations & Contributions incomeTotal Other Income
(g). Grants, Subsidies, Contributions
Amounts Received Specifically for New or Upgraded AssetsOther Grants, Subsidies and ContributionsIndividually Significant Item - Additional Grants Commission Payment (refer below)Total Grants, Subsidies, Contributions
The functions to which these grants relate are shown in Note 12.
(i) Sources of grantsCommonwealth GovernmentState GovernmentOtherTotal
(ii) Individually Significant ItemsGrant Commission Grant Recognised as Income
In June 2017, Council received payment of the first two instalments of the 2017/18 Grants Commission Financial Assistance Grants.This has had a material effect on Council's operating result in the 2016/17 financial year.
171
31 76
520
124 137 324
3,613 4,684 7,956 1,986
7,851 1,391 -
6,482 2,524 540
479
691 814
7,022 11,766
197 352
-
302
613
11,766 7,022
1,391
515
201
- 692
5 4 929 696
924 -
Notes 2017 2016
Page 57
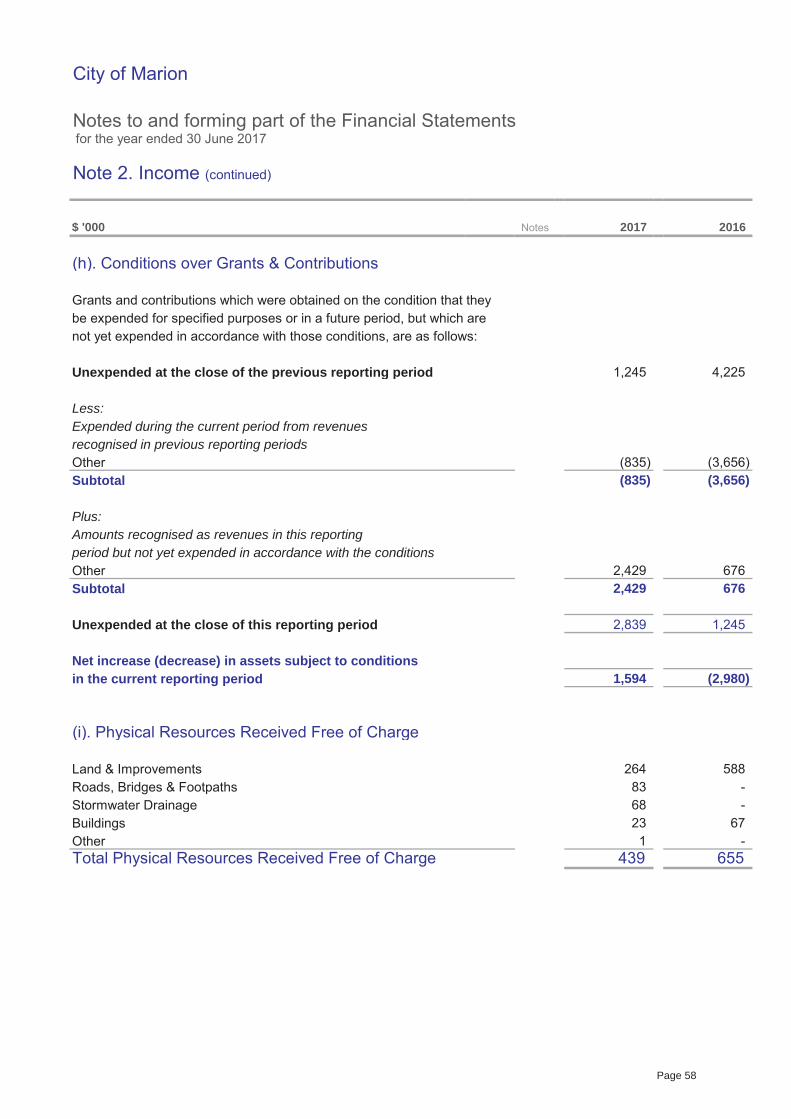
City of Marion
Notes to and forming part of the Financial Statements for the year ended 30 June 2017
Note 2. Income (continued)
$ '000
(h). Conditions over Grants & Contributions
Grants and contributions which were obtained on the condition that theybe expended for specified purposes or in a future period, but which arenot yet expended in accordance with those conditions, are as follows:
Unexpended at the close of the previous reporting period
Less:Expended during the current period from revenuesrecognised in previous reporting periodsOtherSubtotal
Plus:Amounts recognised as revenues in this reportingperiod but not yet expended in accordance with the conditionsOtherSubtotal
Unexpended at the close of this reporting period
Net increase (decrease) in assets subject to conditionsin the current reporting period
(i). Physical Resources Received Free of Charge
Land & ImprovementsRoads, Bridges & FootpathsStormwater DrainageBuildingsOtherTotal Physical Resources Received Free of Charge
1,245
23 67
439 655
Notes 2017 2016
(835) (3,656)
2,429 676
264 588 83
1,594 (2,980)
-
1 -
68
676 2,429
(835) (3,656)
-
4,225
2,839 1,245
X8A12T
Page 58
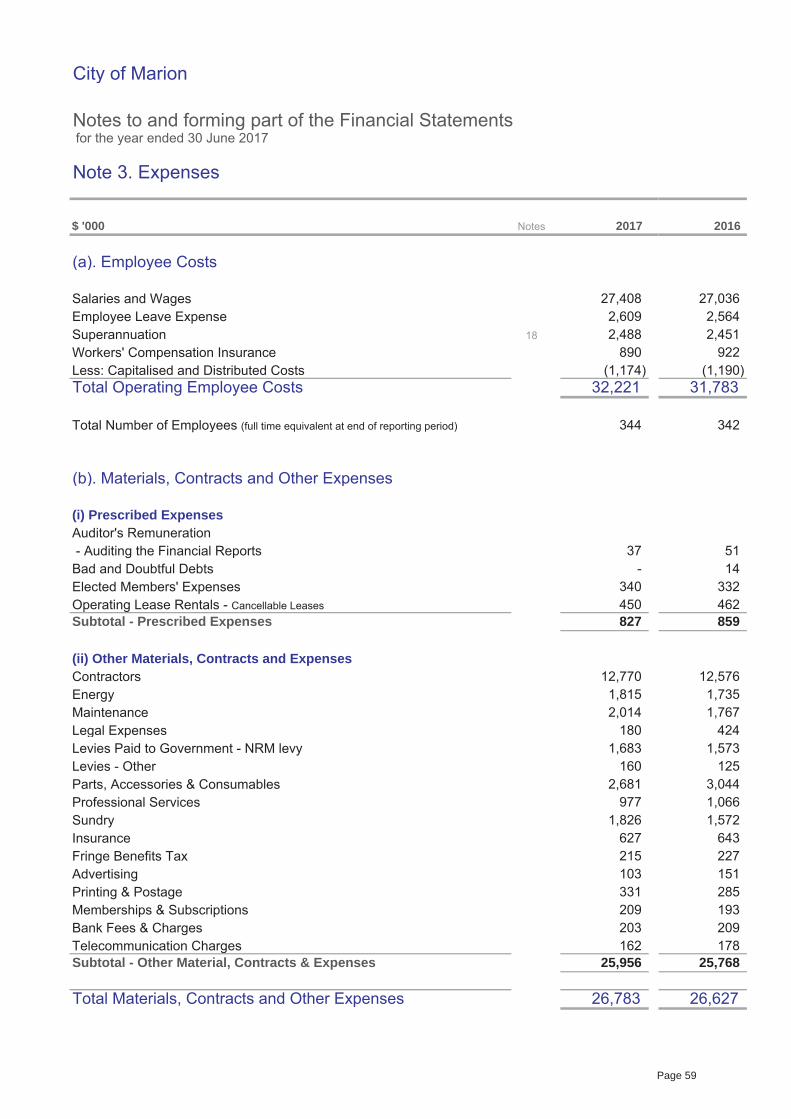
City of Marion
Notes to and forming part of the Financial Statements for the year ended 30 June 2017
Note 3. Expenses
$ '000
(a). Employee Costs
Salaries and WagesEmployee Leave ExpenseSuperannuationWorkers' Compensation InsuranceLess: Capitalised and Distributed CostsTotal Operating Employee Costs
Total Number of Employees (full time equivalent at end of reporting period)
(b). Materials, Contracts and Other Expenses
(i) Prescribed ExpensesAuditor's Remuneration - Auditing the Financial ReportsBad and Doubtful DebtsElected Members' ExpensesOperating Lease Rentals - Cancellable LeasesSubtotal - Prescribed Expenses
(ii) Other Materials, Contracts and ExpensesContractorsEnergyMaintenanceLegal ExpensesLevies Paid to Government - NRM levyLevies - OtherParts, Accessories & ConsumablesProfessional ServicesSundryInsuranceFringe Benefits TaxAdvertisingPrinting & PostageMemberships & SubscriptionsBank Fees & ChargesTelecommunication ChargesSubtotal - Other Material, Contracts & Expenses
Total Materials, Contracts and Other Expenses 26,627
2,609
Notes 2017 2016
2,564 27,036 27,408
2,488 2,451
1,573 180
31,783
344 342
51
32,221
2,014 1,767
890 922
193
12,770 12,576
424 1,683
1,815 1,735
340 332
25,956
1,826 1,572
450 462
(1,174) (1,190)
977 1,066
178 25,768
26,783
215
827 859
160 125
209
2,681
627 643
203
37 - 14
18
227 103 151 331 285 209
162
3,044
Page 59
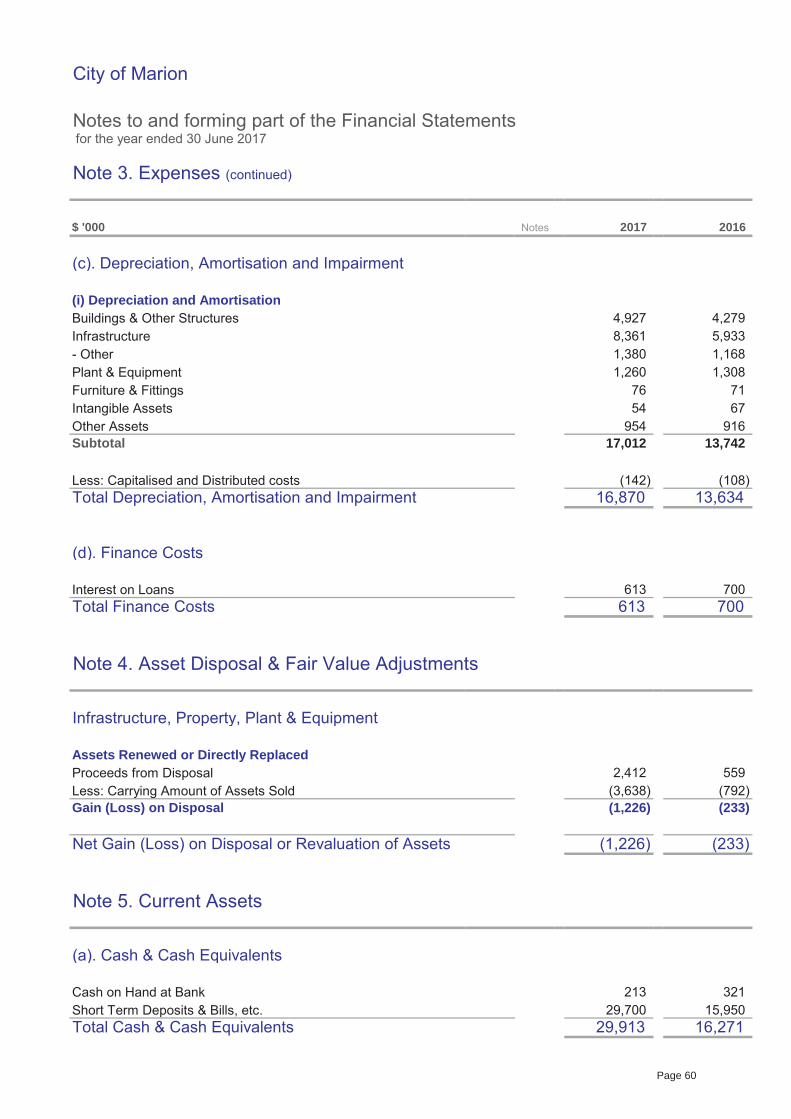
City of Marion
Notes to and forming part of the Financial Statements for the year ended 30 June 2017
Note 3. Expenses (continued)
$ '000
(c). Depreciation, Amortisation and Impairment
(i) Depreciation and AmortisationBuildings & Other StructuresInfrastructure- OtherPlant & EquipmentFurniture & FittingsIntangible AssetsOther AssetsSubtotal
Less: Capitalised and Distributed costsTotal Depreciation, Amortisation and Impairment
(d). Finance Costs
Interest on LoansTotal Finance Costs
Note 4. Asset Disposal & Fair Value Adjustments
Infrastructure, Property, Plant & Equipment
Assets Renewed or Directly ReplacedProceeds from DisposalLess: Carrying Amount of Assets SoldGain (Loss) on Disposal
Net Gain (Loss) on Disposal or Revaluation of Assets
Note 5. Current Assets
(a). Cash & Cash Equivalents
Cash on Hand at BankShort Term Deposits & Bills, etc.Total Cash & Cash Equivalents
Notes 2017 2016
213 321
29,913 16,271 29,700 15,950
(1,226) (233)
4,279 4,927
76 71
1,168
54 67
1,380 1,260 1,308
954
559 2,412 (3,638) (792)
16,870
5,933 8,361
17,012 13,742
(1,226) (233)
(142) (108) 13,634
613 700 613 700
916
X8A9T
X8A10T
X8A11T
X8A13T
X8A22T
Page 60

City of Marion
Notes to and forming part of the Financial Statements for the year ended 30 June 2017
Note 5. Current Assets (continued)
$ '000
(b). Trade & Other Receivables
Rates - General & OtherRates Postponed for State SeniorsAccrued RevenuesDebtors - GeneralGST RecoupmentPrepaymentsTotal Trade & Other Receivables
(c). Other Financial Assets (Investments)
Other Financial Assets (Term Deposits with over 90 days to maturity)Total Other Financial Assets (Investments)
Amounts included in other financial assets that are not expected to be received within
12 months of reporting date are disclosed in Note 13
(d). Inventories
Stores & MaterialsTotal Inventories
Note 6. Non-Current Assets
(a). Equity Accounted Investments in Council Businesses
Southern Region Waste Resource AuthorityCouncil SolutionsTotal Equity Accounted Investments in Council Businesses
(b). Other Non-Current Assets
Capital Works-in-ProgressComputer Software & LicencesLess Accumulated AmortisationTotal Other Non-Current Assets
4,978 2,121
(1,014) (960)
19 88 100
1,238 1,180
6,059 5,659
19 5,971 5,559
5,202 2,341
248 176
11,900 8,200
248 176
11,900 8,200
5,840 4,754
1,463 1,739
145 31
Notes 2017 2016
467 225
2,065 1,981
1,064 247 636 531
Page 61
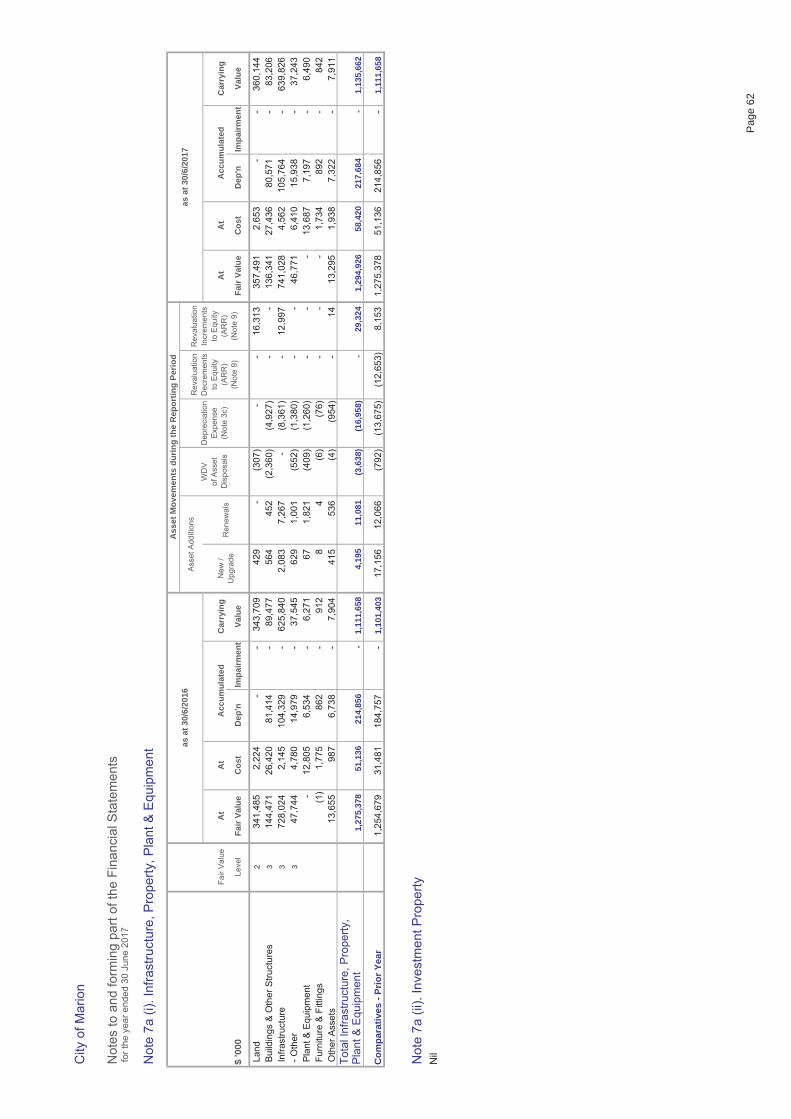
City
of M
ario
n
Not
es to
and
form
ing
part
of th
e Fi
nanc
ial S
tate
men
ts fo
r the
yea
r end
ed 3
0 Ju
ne 2
017
Not
e 7a
(i).
Infra
stru
ctur
e, P
rope
rty, P
lant
& E
quip
men
t
Fair
Val
ueA
tA
tC
arry
ing
At
At
Car
ryin
g
$ '0
00Le
vel
Fair
Valu
eC
ost
Dep
'nIm
pairm
ent
Valu
eFa
ir Va
lue
Cos
tD
ep'n
Impa
irmen
tVa
lue
Lan
d2
341,
485
2,22
4
-
-
34
3,70
9
429
-
(3
07)
-
-
16
,313
357,
491
2,65
3
-
-
36
0,14
4
B
uild
ings
& O
ther
Stru
ctur
es3
144,
471
26,4
20
81
,414
-
89,4
77
56
4
452
(2
,360
)
(4
,927
)
-
-
13
6,34
1
27
,436
80,5
71
-
83
,206
Infra
stru
ctur
e3
728,
024
2,14
5
10
4,32
9
-
62
5,84
0
2,08
3
7,
267
-
(8,3
61)
-
12,9
97
74
1,02
8
4,
562
105,
764
-
63
9,82
6
-
Oth
er3
47,7
44
4,
780
14,9
79
-
37
,545
629
1,
001
(552
)
(1,3
80)
-
-
46,7
71
6,
410
15,9
38
-
37
,243
Pla
nt &
Equ
ipm
ent
-
12
,805
6,53
4
-
6,27
1
67
1,82
1
(4
09)
(1
,260
)
-
-
-
13
,687
7,19
7
-
6,
490
F
urni
ture
& F
ittin
gs(1
)
1,77
5
86
2
-
91
2
8
4
(6)
(76)
-
-
-
1,73
4
89
2
-
842
Oth
er A
sset
s13
,655
987
6,
738
-
7,
904
415
53
6
(4)
(954
)
-
14
13
,295
1,93
8
7,
322
-
7,91
1
Tota
l Inf
rast
ruct
ure,
Pro
perty
,P
lant
& E
quip
men
t
Com
para
tives
- Pr
ior Y
ear
1,25
4,67
9
31,4
81
18
4,75
7
-
1,
101,
403
17,1
56
12
,066
(792
)
(13,
675)
(1
2,65
3)
8,15
3
1,
275,
378
51
,136
214,
856
-
1,
111,
658
Not
e 7a
(ii).
Inve
stm
ent P
rope
rtyN
il
214,
856
Rev
alua
tion
Incr
emen
tsto
Equ
ity
(AR
R)
(Not
e 9)
Rev
alua
tion
Dec
rem
ents
to E
quity
(A
RR
) (N
ote
9)A
ccum
ulat
edA
ccum
ulat
ed
as a
t 30/
6/20
16
1,11
1,65
8
4,19
5
(3,6
38)
11
,081
Ass
et A
dditi
ons
Ass
et M
ovem
ents
dur
ing
the
Rep
ortin
g Pe
riod
as a
t 30/
6/20
17
Dep
reci
atio
n E
xpen
se
(Not
e 3c
)
WD
Vof
Ass
et
Dis
posa
lsN
ew /
Upg
rade
Ren
ewal
s
29,3
24
1,13
5,66
2-
217,
684
-
58
,420
1,
275,
378
51,1
36
1,29
4,92
6-
(16,
958)
Pag
e 62

City of Marion
Notes to and forming part of the Financial Statements for the year ended 30 June 2017
Note 7b. Valuation of Infrastructure, Property, Plant & Equipment & Investment Property
$ '000
Valuation of Assets
The fair value of assets and liabilities must be estimated in accordance with various Accounting Standards for eitherrecognition and measurement requirements or for disclosure purposes.
AASB 13 Fair Value Measurement requires all assets and liabilities measured at fair value to be assigned to a "level"in the fair value hierarchy as follows:
Level 1: Unadjusted quoted prices in active markets for identical assets or liabilities that the entity can access at the measurement date.
Level 2: Inputs other than quoted prices included within Level 1 that are observable for the asset or liability, either directly or indirectly.
Level 3: Inputs for the asset or liability that are not based on observable market data (unobservable inputs).
Refer to Note 7a for the disclosure of the Fair Value Levels of Infrastructure, Property, Plant and Equipment Assets.
Information on Valuations
Accounting procedure : Upon revaluation, the current new replacement cost and accumulated depreciation arerestated such that the difference represents the fair value of the asset determined in accordance with AASB 13Fair Value Measurement: accumulated depreciation is taken to be the difference between current new replacementcost and fair value. In the case of land, fair value is taken to be the current replacement cost.
Certain land, and the buildings and structures thereon, are shown above as being based on fair value hierarchylevel 2 valuation inputs. They are based on prices for similar assets in an active market, with directly or indirectlyobservable adjustments for specific advantages or disadvantages attaching to the particular asset.
Valuations of Crown land, community land and land subject to other restrictions on use or disposal, shown above as being based on fair value hierarchy level 3 valuation inputs, are based on prices for similar assets in an active market, but include adjustments for specific advantages or disadvantages attaching to the particular asset that are not directly or indirectly observable in that market, or the number and / or amount of observable adjustments of which are so great that the valuation is more fairly described as being based on level 3 valuation inputs.
There is no known market for buildings, infrastructure and other assets. These assets are valued at depreciatedcurrent replacement cost. This method involves:
- The determination of the cost to construct the asset (or its modern engineering equivalent) using current prices for materials and labour, the quantities of each being estimated based on recent experience of this or similar Councils, or on industry construction guides where these are more appropriate.
- The calculation of the depreciation that would have accumulated since original construction using current estimates of residual value and useful life under the prime cost depreciation method adopted by Council.
This method has significant inherent uncertainties, relying on estimates of quantities of materials and labour, residual values and useful lives, and the possibility of changes in prices for materials and labour, and the potential for development of more efficient construction techniques.
X10A8T
Page 63
City of Marion
Notes to and forming part of the Financial Statements for the year ended 30 June 2017
Note 7b. Valuation of Infrastructure, Property, Plant & Equipment & Investment Property (continued)
$ '000
Valuation of Assets (continued)
Other Information
At 1 July 2004 upon the transition to AIFRS, Council elected pursuant to AASB 1.D5 to retain a previously establisheddeemed cost under GAAP as its deemed cost. With subsequent addition at cost, this remains as the basis ofrecognition of non-material asset classes.
Upon revaluation, the current new replacement cost and accumulated depreciation are re
‐
stated such that the difference represents the fair value of the asset deter
‐
mined in accordance with AASB 13 Fair Value Measurement: accumulated depreciation is taken to be the difference between current new replacement cost and fair value. In the case of land, current replacement cost is taken to be the fair value.
Highest and best use
All of Council's non financial assets are considered as being utilised for their highest and best use.
Transition to AASB 13 - Fair Value Measurement
The requirements of AASB 13 Fair Value Measurement have been applied to all valuations undertaken since 1 July 2013 as shown by the valuation dates by individual asset classes below.
Fair value hierarchy level 2 valuations: Land is shown above as being based on fair value hierarchy level 2 valuationinputs. They are based on prices for similar assets in an active market, with directly or indirectly observableadjustments for specific advantages or disadvantages attaching to the particular asset.
Fair value hierarchy level 3 valuations of valuations of buildings, infrastructure and other assets : There is no knownmarket for these assets and they are valued at depreciated current replacement cost. This method involves:
The determination of the cost to construct the asset (or its modern engineering equivalent) using current prices for materials and Iabour, the quantities of each being estimated based on recent experience of this or similar Councils, oron industry construction guides where these are more appropriate.
The calculation of the depreciation that would have accumulated since original construction using current estimates ofresidual value and useful life under the prime cost depreciation method adopted by Council.
This method has significant inherent uncertainties, relying on estimates of quantities of materials and Iabour, residualvalues and useful lives, and the possibility of changes in prices for materials and Iabour, and the potential for development of more efficient construction techniques.
Page 64
City of Marion
Notes to and forming part of the Financial Statements for the year ended 30 June 2017
Note 7b. Valuation of Infrastructure, Property, Plant & Equipment & Investment Property (continued)
$ '000
Valuation of Assets (continued)
Land & Land ImprovementsCouncil being of the opinion that it is not possible to attribute a value sufficiently reliably to qualify forrecognition, land under roads has not been recognised in these reports. A desktop revaluation wascarried out by independent valuation for the reporting period, 30 June 2017.
Freehold land and land over which Council has control, but does not have title, is recognised on the costbasis. No capitalisation threshold is applied to the acquisition of land or interests in land.
Land improvements, including bulk earthworks with an assessed unlimited useful life, are recognised on thecost basis. Additions are recognised at cost.
Estimated future costs of reinstatement of land, capitalised in accordance with AASB 116.16(c), are reviewedannually (see Note 1) and depreciated over the estimated remaining life of the relevant asset. Currentlythere are no assets that require this treatment.
Buildings & Other StructuresA desktop revaluation was carried out by independent valuation for this reporting period, 30 June 2017.
InfrastructureA desktop revaluation of infrastructure assets (roads, footpaths, kerbs, drains, bridges, traffic devices and traffic signs) was carried out by independent valuation for this reporting period, 30 June 2017.
A desktop revaluation was carried out by independent valuation for this reporting period, 30 June2017 for other infrastructure assets such as car parks, lighting, walking trails and reserve pathways
All acquisitions made after the respective dates of valuation are recorded at cost.
Plant, Furniture & EquipmentThese assets are recognised on the cost basis.
All other AssetsA desktop revaluation was carried out by independent valuation for this reporting period, 30 June2017, apart from Library Stock which is valued by Council Officers at written down replacement cost on anannual basis.
Page 65
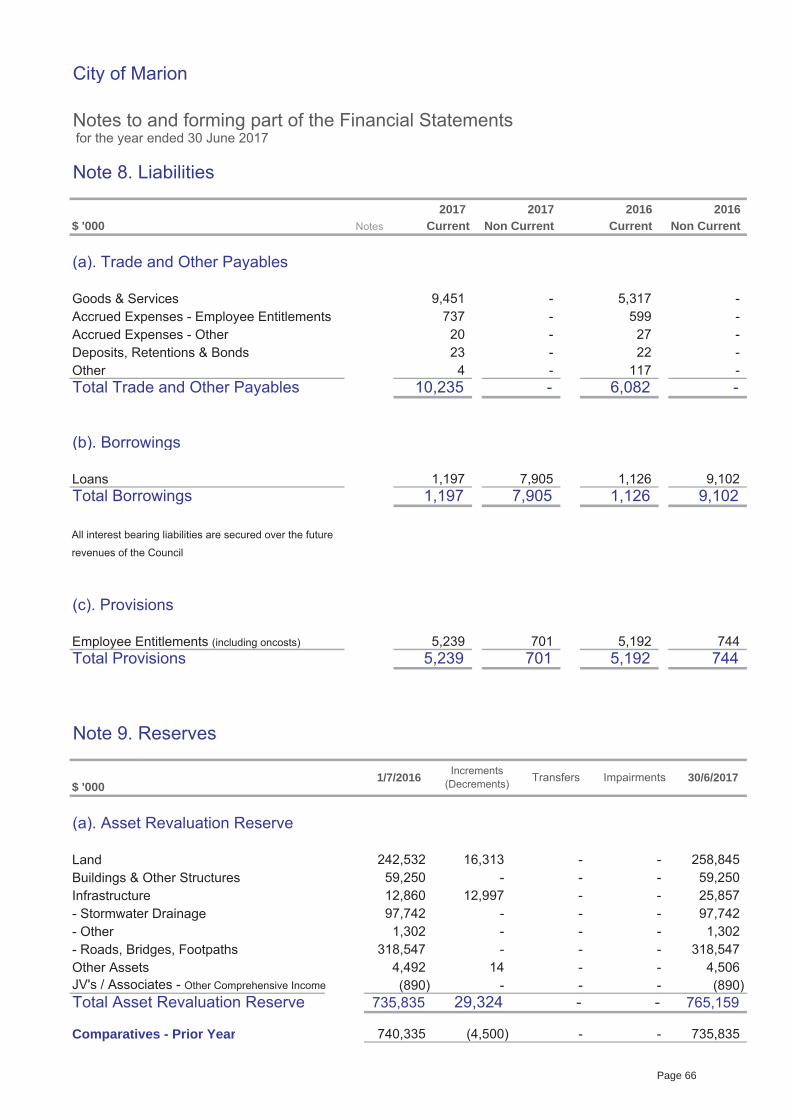
City of Marion
Notes to and forming part of the Financial Statements for the year ended 30 June 2017
Note 8. Liabilities
$ '000
(a). Trade and Other Payables
Goods & ServicesAccrued Expenses - Employee EntitlementsAccrued Expenses - OtherDeposits, Retentions & BondsOtherTotal Trade and Other Payables
(b). Borrowings
LoansTotal Borrowings
All interest bearing liabilities are secured over the future
revenues of the Council
(c). Provisions
Employee Entitlements (including oncosts)Total Provisions
Note 9. Reserves
$ '000
(a). Asset Revaluation Reserve
LandBuildings & Other StructuresInfrastructure- Stormwater Drainage- Other- Roads, Bridges, FootpathsOther AssetsJV's / Associates - Other Comprehensive Income
Total Asset Revaluation Reserve
Comparatives - Prior Year
-
-
1/7/2016 Increments (Decrements)
(890) - - 29,324
735,835
765,159
4,506
Non Current
-
-
744
-
-
25,857
1,197
5,239
7,905
30/6/2017
9,451
- 27
9,102
23 - 22 4 -
599 - 737
1,126
701 5,192 744
10,235
1,197 1,126 7,905
5,239 5,192
Notes2017
- 20
20162016Non Current Current
117 -
5,317 -
- 6,082
701
9,102
2017Current
59,250 - 12,997
-
-
-
- - (890)
-
740,335
12,860
(4,500) -
242,532 16,313
Transfers Impairments
4,492 14
- -
59,250
318,547 - - - 1,302 - - - 1,302
- - 97,742 97,742 -
Notes
- - 258,845
318,547
735,835
Page 66
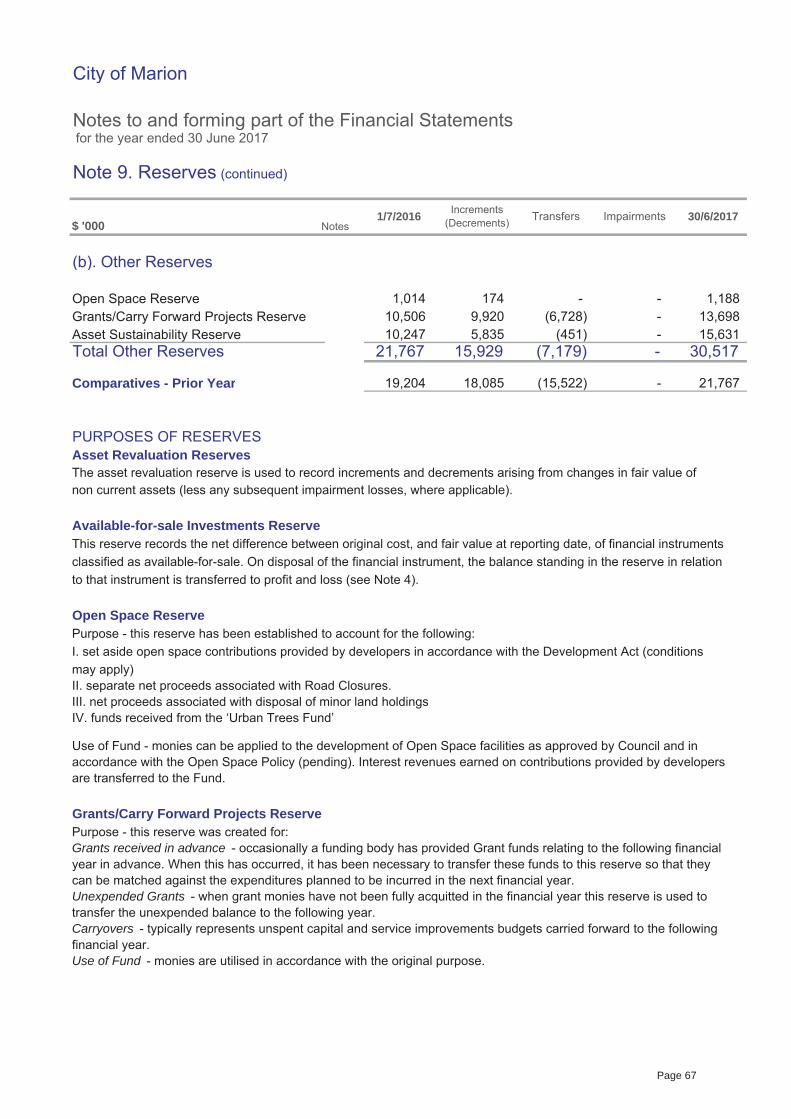
City of Marion
Notes to and forming part of the Financial Statements for the year ended 30 June 2017
Note 9. Reserves (continued)
$ '000
(b). Other Reserves
Open Space ReserveGrants/Carry Forward Projects ReserveAsset Sustainability ReserveTotal Other Reserves
Comparatives - Prior Year
PURPOSES OF RESERVESAsset Revaluation ReservesThe asset revaluation reserve is used to record increments and decrements arising from changes in fair value ofnon current assets (less any subsequent impairment losses, where applicable).
Available-for-sale Investments ReserveThis reserve records the net difference between original cost, and fair value at reporting date, of financial instrumentsclassified as available-for-sale. On disposal of the financial instrument, the balance standing in the reserve in relationto that instrument is transferred to profit and loss (see Note 4).
Open Space ReservePurpose - this reserve has been established to account for the following:I. set aside open space contributions provided by developers in accordance with the Development Act (conditionsmay apply)II. separate net proceeds associated with Road Closures.III. net proceeds associated with disposal of minor land holdingsIV. funds received from the ‘Urban Trees Fund’
Use of Fund - monies can be applied to the development of Open Space facilities as approved by Council and inaccordance with the Open Space Policy (pending). Interest revenues earned on contributions provided by developersare transferred to the Fund.
Grants/Carry Forward Projects ReservePurpose - this reserve was created for:Grants received in advance - occasionally a funding body has provided Grant funds relating to the following financialyear in advance. When this has occurred, it has been necessary to transfer these funds to this reserve so that theycan be matched against the expenditures planned to be incurred in the next financial year.Unexpended Grants - when grant monies have not been fully acquitted in the financial year this reserve is used totransfer the unexpended balance to the following year.Carryovers - typically represents unspent capital and service improvements budgets carried forward to the followingfinancial year.Use of Fund - monies are utilised in accordance with the original purpose.
- (6,728) - 13,698
(451) - 15,631 (7,179)
-
(15,522) -
-
21,767
1,188
19,204
21,767
18,085
15,929 30,517
1,014
1/7/2016 Increments (Decrements) Transfers Impairments 30/6/2017
Notes
174 10,506 9,920 10,247 5,835
Page 67

City of Marion
Notes to and forming part of the Financial Statements for the year ended 30 June 2017
Note 9. Reserves (continued)
$ '000
Asset Sustainability ReservePurpose - this is a reserve fund established to:I. Primary Purpose – Provide Council with the ability to access sufficient funds to enable it to respond to a majorinfrastructure failure or fund an infrastructure gap identified in periodic asset audits. A minimum balance of $2 millionwill be retained in the Asset Sustainability Reserve for this purpose.II. Assist Council fund its Long Term Asset Management objectives.III. Provide a means by which to spread the cost of intergenerational assets thereby reducing the need for borrowingsIV. Provide a means by which Council can strategically plan to maintain its asset base within a long term Financialframework.V. Quarantine funds specifically set aside in the Community Facilities Partnership Program (CFPP) for the purposeof funding the renewal, upgrade and purchase of Council assets as resolved by Council. This will include encouraging organisations leasing council facilities to seek partnership funding for required renewal and upgradeof those community facilities.The Asset Sustainability Reserve will be funded from planned surpluses identified in the Long TermFinancial Plan (LTFP) and from funds specifically set aside for the CFPP in the LTFP.Use of Fund - Reserve transfers will be controlled by specific Council resolutions or identified as part of theapproved annual Strategic Plan and Budget.
Note 10. Assets Subject to Restrictions
$ '000
The uses of the following assets are restricted, wholly or partially, by legislation or other externally imposed requirements. The assets are required to be utilised for the purposes for which control was transferred to Council, or for which the revenues were originally obtained.
Cash & Financial AssetsUnexpended amounts received from Federal GovernmentOtherTotal Cash & Financial AssetsTotal Assets Subject to Externally Imposed Restrictions
2,839 1,2452,839
2017 2016Notes
2,839 1,245
1,245
1/7/2016 Increments (Decrements) Transfers Impairments 30/6/2017
Notes
X10A10T
Page 68
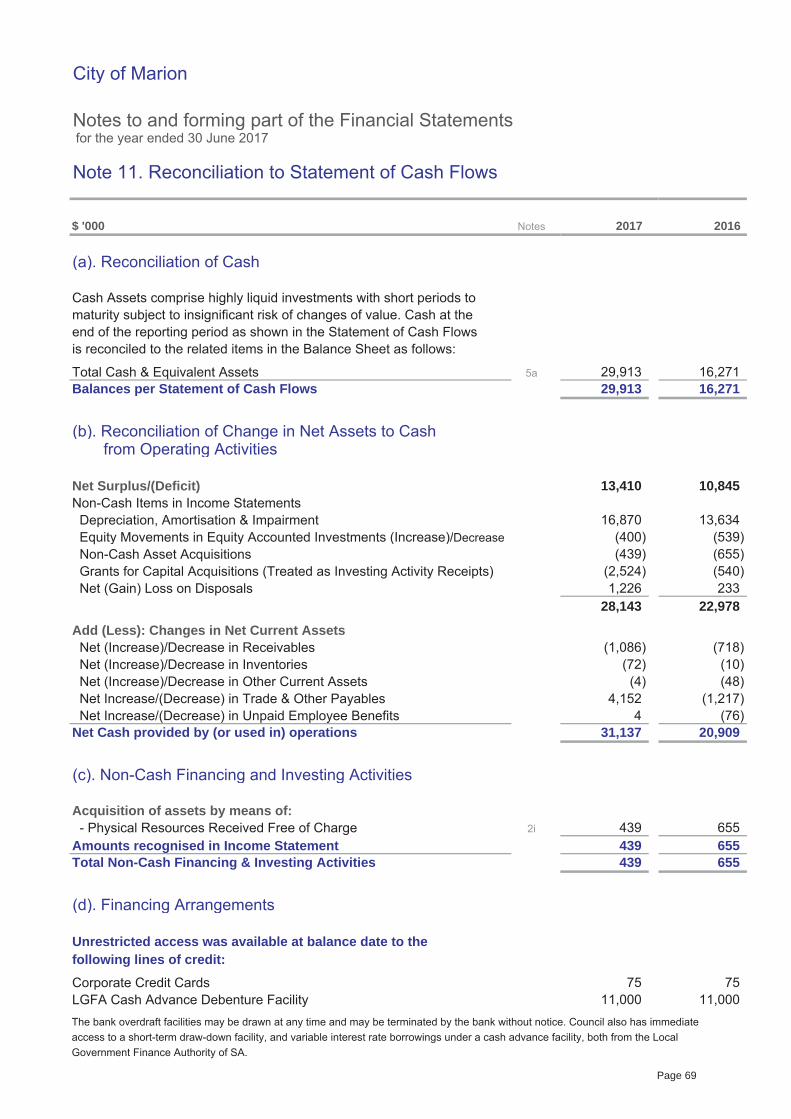
City of Marion
Notes to and forming part of the Financial Statements for the year ended 30 June 2017
Note 11. Reconciliation to Statement of Cash Flows
$ '000
(a). Reconciliation of Cash
Cash Assets comprise highly liquid investments with short periods tomaturity subject to insignificant risk of changes of value. Cash at theend of the reporting period as shown in the Statement of Cash Flowsis reconciled to the related items in the Balance Sheet as follows:
Total Cash & Equivalent AssetsBalances per Statement of Cash Flows
(b). Reconciliation of Change in Net Assets to Cash from Operating Activities
Net Surplus/(Deficit)Non-Cash Items in Income Statements Depreciation, Amortisation & Impairment Equity Movements in Equity Accounted Investments (Increase)/Decrease Non-Cash Asset Acquisitions Grants for Capital Acquisitions (Treated as Investing Activity Receipts) Net (Gain) Loss on Disposals
Add (Less): Changes in Net Current Assets Net (Increase)/Decrease in Receivables Net (Increase)/Decrease in Inventories Net (Increase)/Decrease in Other Current Assets Net Increase/(Decrease) in Trade & Other Payables Net Increase/(Decrease) in Unpaid Employee BenefitsNet Cash provided by (or used in) operations
(c). Non-Cash Financing and Investing Activities
Acquisition of assets by means of: - Physical Resources Received Free of ChargeAmounts recognised in Income StatementTotal Non-Cash Financing & Investing Activities
(d). Financing Arrangements
Unrestricted access was available at balance date to the following lines of credit:Corporate Credit CardsLGFA Cash Advance Debenture FacilityThe bank overdraft facilities may be drawn at any time and may be terminated by the bank without notice. Council also has immediate access to a short-term draw-down facility, and variable interest rate borrowings under a cash advance facility, both from the Local Government Finance Authority of SA.
11,000 11,000
(439)
75 75
439 655 439 655
31,137 20,909
5a
Notes
4,152 (1,217)
1,226 233 28,143 22,978
(1,086) (72) (10)
(4) (48)
4 (76)
(718)
2017 2016
16,271
(400) (539) (655)
(2,524) (540)
29,913
13,410 10,845
13,634
29,913 16,271
2i 439 655
16,870
Page 69

City
of M
ario
n
Not
es to
and
form
ing
part
of th
e Fi
nanc
ial S
tate
men
ts fo
r the
yea
r end
ed 3
0 Ju
ne 2
017
Not
e 12
a. F
unct
ions
Act
ual
Act
ual
Act
ual
Act
ual
Act
ual
Act
ual
Act
ual
Act
ual
Act
ual
Act
ual
$ '0
0020
1720
1620
1720
1620
1720
1620
1720
1620
1720
16Le
ader
in th
e D
eliv
ery
of th
e C
omm
unity
Vis
ion
--
-
-
--
-
-
--
D
evel
opm
ent A
sses
smen
t1,
086
1,07
7
3,
669
3,65
1
(2
,583
)(2
,574
)
3
6
--
C
rime
Pre
vent
ion
1-
39
038
0
(389
)(3
80)
-
--
C
omm
unity
Sup
port
& D
evel
opm
ent
3,40
43,
162
9,70
110
,072
(6,2
97)
(6,9
10)
1,99
91,
788
115,
560
118,
975
P
ublic
& E
nviro
nmen
t Hea
lth90
86
84
384
4
(753
)(7
58)
38
38
-
-
Gen
eral
Insp
ectio
n1,
011
950
1,
589
1,56
1
(5
78)
(611
)
12
-
-
Pub
lic In
frast
ruct
ure
3,71
32,
852
18,1
3215
,769
(14,
419)
(12,
917)
3,
319
2,34
4
70
7,14
469
1,03
2
Ope
n S
pace
260
591
12
,000
11,5
75
(1
1,74
0)(1
0,98
4)
5943
3
264,
162
263,
975
P
ublic
Con
veni
ence
s2
2
516
502
(5
14)
(500
)
--
3,
005
2,96
7
S
trate
gic
Pro
ject
s25
12
1,
276
1,18
6
(1
,251
)(1
,174
)
21
6
12
A
sset
Man
agem
ent
--
-
-
--
-
-
17,4
9217
,805
Nei
ghbo
urho
od C
entre
s64
059
0
2,48
02,
322
(1,8
40)
(1,7
32)
382
358
6,
882
6,90
1
C
ultu
ral D
evel
opm
ent
311
304
3,
371
2,96
2
(3
,060
)(2
,658
)
24
14
11
,129
11,5
00
Li
brar
ies
700
669
7,
518
7,42
7
(6
,818
)(6
,758
)
54
755
3
14,5
8116
,141
Was
te &
Rec
yclin
g 56
52
7,
525
7,19
5
(7
,469
)(7
,143
)
3
1
5,97
25,
019
Tree
s-
-
--
-
-
--
-
-
Eco
nom
ic D
evel
opm
ent
204
53
74
960
6
(545
)(5
53)
16
040
--
To
tal L
eade
r in
the
Del
iver
y of
the
Com
mun
ity V
isio
n11
,503
10,4
00
69
,759
66,0
52
(5
8,25
6)(5
5,65
2)
6,55
65,
583
1,14
5,92
81,
134,
317
Org
anis
atio
n of
Exc
elle
nce
-
--
-
-
--
-
-
Gov
erna
nce
8983
4,13
04,
074
(4,0
41)
(3,9
91)
1-
2
4
Ser
vice
Qua
lity
11
13
614
2
(135
)(1
41)
-
-
578
681
To
tal O
rgan
isat
ion
of E
xcel
lenc
e90
84
4,
266
4,21
6
(4
,176
)(4
,132
)
1
-
580
685
Tr
easu
ry76
,167
71,6
04
2,
462
2,47
6
73
,705
69,1
28
2,
685
899
48
,316
14,0
57
Tot
al F
unct
ions
/Act
iviti
es87
,760
82,0
8876
,487
72,7
4411
,273
9,34
49,
242
6,48
21,
194,
824
1,14
9,05
9
Rev
enue
s an
d ex
pens
es e
xclu
de n
et g
ain
(loss
) on
disp
osal
or r
eval
uatio
n of
ass
ets,
net
gai
n (lo
ss) f
rom
join
t ven
ture
s &
ass
ocia
ted
entit
ies,
am
ount
s re
ceiv
ed s
peci
fical
ly fo
r new
or u
pgra
ded
asse
ts a
nd
phys
ical
reso
urce
s re
ceiv
ed fr
ee o
f cha
rge.
Det
ails
of t
hese
Fun
ctio
ns/A
ctiv
ities
are
pro
vide
d in
Not
e 12
(b).
Func
tions
/Act
iviti
es
Inco
me,
Exp
ense
s an
d As
sets
hav
e be
en d
irect
ly a
ttrib
uted
to th
e fo
llow
ing
Func
tions
/ Ac
tiviti
es.
INC
OM
EEX
PEN
SES
OPE
RA
TIN
GSU
RPL
US
(DEF
ICIT
)
TOTA
L A
SSET
S H
ELD
(C
UR
REN
T &
NO
N-C
UR
REN
T)
GR
AN
TS IN
CLU
DED
IN IN
CO
ME
X11A0T
Pag
e 70
City of Marion
Notes to and forming part of the Financial Statements for the year ended 30 June 2017
Note 12b. Components of Functions
$ '000
The activities relating to Council functions are as follows:
Leader in the Delivery of the Community Vision – “Broad Horizons, Bright Future”
PUBLIC INFRASTRUCTURE
WASTE & RECYCLING
OPEN SPACE
LIBRARIES
ASSET MANAGEMENT
COMMUNITY SUPPORT & DEVELOPMENT
COMMUNITY DEVELOPMENT
DEVELOPMENT ASSESSMENT
CULTURAL DEVELOPMENTSupporting community involvement in arts and cultural activity and expression, celebrating diversity, indigenouspeople and those from culturally and linguistically diverse backgrounds. This includes the Marion CulturalCentre and Living Kaurna Cultural Centre providing cultural and artistic experiences for the community
Includes the design, development and maintenance of footpaths, streets, drainage and kerb and water table,as well as street signs, traffic control devices and line-marking ensuring that local neighbourhoods are safe andaccessible with good amenity
Services including domestic kerbside collection, hard rubbish collection, street sweeping and general littercollection to maintain cleanliness and amenity
Parks, reserves, ovals and streetscape development and maintenance providing well maintained public spacesfor use by all members of the community
Providing opportunities for learning and social activities for all ages and interests
Management and maintenance of Council properties enabling them to be utilised by members of thecommunity for various purposes such as meetings, social activities and programs
Services such as home and community care, youth services, support for volunteers and community transportproviding direct support to groups within the community
Recreation, sport and leisure facilities, services and activities that provide opportunities for communitymembers to socialise and undertake physical activity
Building and planning services which ensure that houses are safely constructed and designed and developedin a manner which is sympathetic to the local neighbourhood
X12A3T
Page 71

City of Marion
Notes to and forming part of the Financial Statements for the year ended 30 June 2017
Note 12b. Components of Functions (continued)
$ '000
The activities relating to Council functions are as follows: (continued)
TREES
NEIGHBOURHOOD CENTRES
PUBLIC & ENVIRONMENTAL HEALTH
ECONOMIC DEVELOPMENT
STRATEGIC PROJECTS
CRIME PREVENTION
GENERAL INSPECTION
PUBLIC CONVENIENCES
Organisation of Excellence
Provision of street trees and revegetation programs to improve amenity and promote, where possible, the useof indigenous plants
Services such as food safety and public health inspections, immunisation and enforcement of certainenvironmental regulations as well as Planning, information, advice and demonstration to promoteenvironmentally sensitive practices by both Council and the community
Planning and support for existing and potential businesses to assist businesses to adapt to changingcircumstance and provide an employment base for the Marion community
Major projects such as the Marion South Plan and State Aquatic Centre aimed at providing improved servicesand facilities for the Community
Services such as graffiti removal and working with other agencies to improve the safety and amenity of thecommunity
Services include dog and cat control, pest control, parking control and the enforcement of by-laws to ensurethat the community is safe and orderly
Services such as provision and maintenance of public toilets in close proximity to highly frequented reservesand other open space areas
To lead in the delivery of the Community Vision, the organisation must maintain its sustainability. Thisunderpins our Corporate Vision of “An Organisation of Excellence”. To achieve this, the following essentialsupport services are funded in the budget.
Providing opportunities for learning and social activities for all ages and interests
Page 72
City of Marion
Notes to and forming part of the Financial Statements for the year ended 30 June 2017
Note 12b. Components of Functions (continued)
$ '000
The activities relating to Council functions are as follows: (continued)
Excellence in Governance
Service Quality
Employer of ChoiceHuman ResourcesServices that provide support for staff to undertake their roles to deliver the Community Vision
Occupational Health & SafetyServices to ensure that work is undertaken in a manner that is safe for the staff and community
Elected Member SupportProvision of services which enable Elected Members to undertake their role in making decisions for the Counciland community, including Council meetings, elections, council receptions and Sister City activities
Strategic, corporate and sustainability planning and policy developmentTo ensure that Council is progressing towards achieving the Community Vision 2020 and its strategic social,cultural, and economic and environmental sustainability goals in a transparent and accountable manner,working with our Local, State, and Federal Government partners
Financial servicesIncluding budgeting, rating, accounts management and payroll, which ensure sound and transparent financialmanagement which enables Council to provide adequate services and facilities and appropriately addresscommunity needs
Risk management policy, development and internal auditActivities to ensure that Council is continuously improving its management systemsExternal relations, communication and community engagementEnables the community to be appropriately and adequately informed about the activities and decisions of theCouncil
Customer serviceIn particular the Customer Service Centre, which enables Council staff to liaise with the community to addressissues and concerns directly with Council, as well as provide the community with information and referral toother services provided in the region
Information technologyProvides support to Council staff for their technological needs to enable them to contribute towards delivery ofthe Community Vision as well as access by the community to Council information and services through theinternet and email
Information ManagementEnables Council to keep adequate and appropriate records of activities and decisions
Page 73
City of Marion
Notes to and forming part of the Financial Statements for the year ended 30 June 2017
Note 13. Financial Instruments
$ '000
Recognised Financial Instruments
Bank, Deposits at Call, Short Term Deposits Accounting Policy:Carried at lower of cost and net realisable value; Interest isrecognised when earned.
Terms & Conditions:Deposits are returning fixed interest rates between 1.85% and 2.40% (2016: 1.90% and 2.79%). Short term deposits have an average maturity of 95 days and an average interest rate of 2.42%(2016: 76 days and 2.79%).
Carrying Amount:Approximates fair value due to the short term to maturity.
Receivables Accounting Policy:Rates & Associated Charges Carried at nominal values less any allowance for doubtful debts.(including legals & penalties for late payment) An allowance for doubtful debts is recognised (and re-assessed
annually) when collection in full is no longer probable.Note: These receivables do not meet the definitionof "financial instruments" and have been excluded Terms & Conditions:from the following disclosures. Secured over the subject land, arrears attract interest of 2%
(2016: 2%). Council is not materially exposed to any individualdebtor, credit risk exposure is concentrated within the Council's boundaries in the State.
Carrying Amount:Approximates fair value (after deduction of any allowance).
Receivables Accounting Policy:Fees & Other Charges Carried at nominal values less any allowance for doubtful debts.
An allowance for doubtful debts is recognised (and re-assessed annually) when collection in full is no longer probable.
Terms & Conditions:Unsecured, and do not bear interest. Council is not materiallyexposed to any individual debtor, credit risk exposure isconcentrated within the Council's boundaries.
Carrying Amount:Approximates fair value (after deduction of any allowance).
X12A4T
Page 74
City of Marion
Notes to and forming part of the Financial Statements for the year ended 30 June 2017
Note 13. Financial Instruments (continued)
$ '000
Recognised Financial Instruments
Receivables Accounting Policy:Other Levels of Government Carried at nominal value.
Terms & Conditions:Amounts due have been calculated in accordance with theterms and conditions of the respective programs followingadvice of approvals, and do not bear interest. All amountsare due by Departments and Agencies of State and FederalGovernments.
Carrying Amount:Approximates fair value.
Liabilities Accounting Policy:Creditors and Accruals Liabilities are recognised for amounts to be paid in the future for
goods and services received, whether or not billed to the Council.
Terms & Conditions:Liabilities are normally settled on 30 day terms.
Carrying Amount:Approximates fair value.
Liabilities Accounting Policy:Interest Bearing Borrowings Carried at the principal amounts. Interest is charged as an
expense as it accrues.
Terms & Conditions:Secured over future revenues, borrowings are repayable over 10 to 15 years; interest is charged at fixed rates between 5.80% and 6.85% (2016: 5.80% and 6.85%).
Carrying Amount:Approximates fair value.
Liabilities Accounting Policy:Finance Leases Accounted for in accordance with AASB 117.
Page 75

City of Marion
Notes to and forming part of the Financial Statements for the year ended 30 June 2017
Note 13. Financial Instruments (continued)
$ '000
2017Financial AssetsCash & EquivalentsReceivablesOther Financial AssetsTotal Financial Assets
Financial LiabilitiesPayablesCurrent BorrowingsNon-Current BorrowingsTotal Financial Liabilities
$ '000
2016Financial AssetsCash & EquivalentsReceivablesOther Financial AssetsTotal Financial Assets
Financial LiabilitiesPayablesCurrent BorrowingsNon-Current BorrowingsTotal Financial Liabilities
The following interest rates were applicableto Council's Borrowings at balance date:
Fixed Interest Rates
Net Fair ValueAll carrying values approximate fair value for all recognised financial instruments . There is no recognised market forthe financial assets of the Council.
Total Contractual
Total Contractual
Weighted Avg Weighted Avg
Due> 5 years
10,235
1,964
1,930
Values
11,900 1,930
10,026 7,905
19,593
22,004 19,337
16,310
CarryingValue
1,743
29,913 29,913
43,743 43,743 11,900
11,768
4,235
5,316 9,102
1,964
- 26,435 26,435
-
9,102
-
-
> 5 years
30 June 2017
Interest RateCarrying
Interest RateValue
-
-
10,228
30 June 2016
Carrying
1,743 -
- 26,435 -
6,082
11,978
- 43,743
-
29,913 -
4,235
Due
-
16,271
1,743 6,082
-
Due > 1 year
- 16,271
Cash Flows< 1 year
- 8,200 8,200
Due > 1 yearDue& ≤ 5 years
-
7,825 6,452 - 6,452
< 1 year & ≤ 5 years
11,900
-
- 5,791 1,197
1,930 -
- -
5,316
10,235 - 1,743 -
1,964
10,235
1,126
Carrying
-
Cash Flows ValuesDue
6,082
5,791
8,200
16,271
6.17% 9,102 6.20% 10,228
Page 76
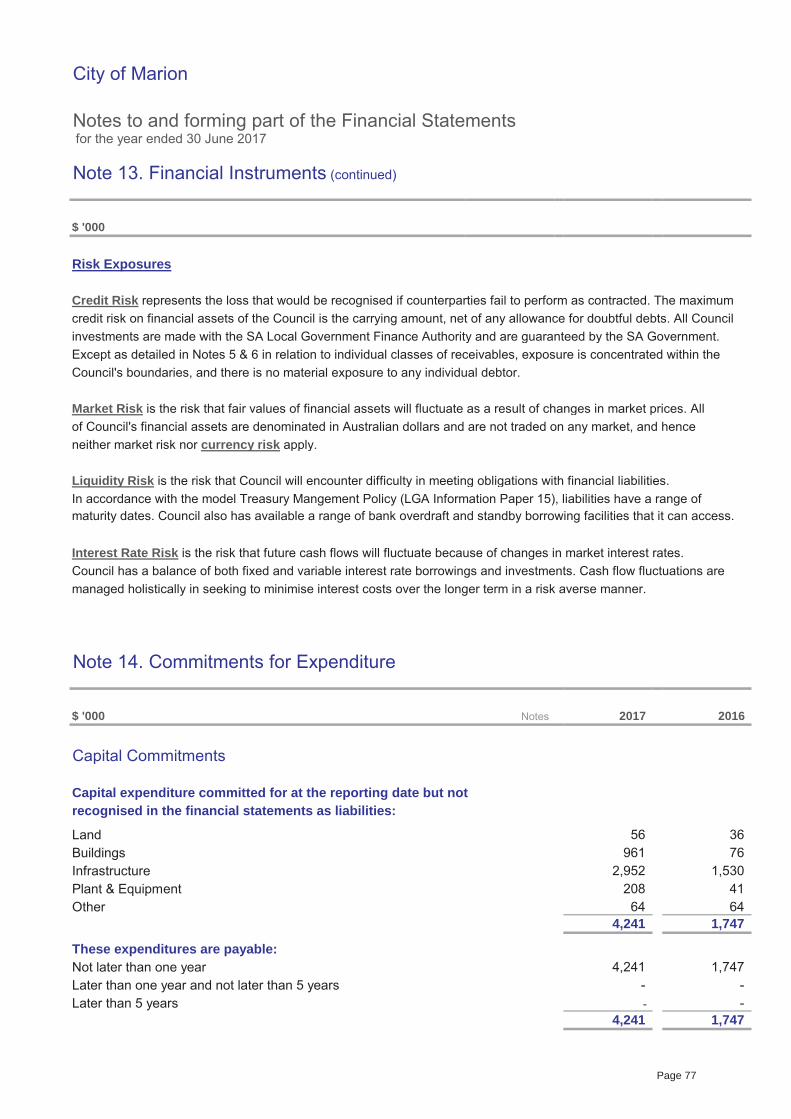
City of Marion
Notes to and forming part of the Financial Statements for the year ended 30 June 2017
Note 13. Financial Instruments (continued)
$ '000
Risk Exposures
Credit Risk represents the loss that would be recognised if counterparties fail to perform as contracted. The maximum credit risk on financial assets of the Council is the carrying amount, net of any allowance for doubtful debts. All Councilinvestments are made with the SA Local Government Finance Authority and are guaranteed by the SA Government.Except as detailed in Notes 5 & 6 in relation to individual classes of receivables, exposure is concentrated within theCouncil's boundaries, and there is no material exposure to any individual debtor.
Market Risk is the risk that fair values of financial assets will fluctuate as a result of changes in market prices. Allof Council's financial assets are denominated in Australian dollars and are not traded on any market, and henceneither market risk nor currency risk apply.
Liquidity Risk is the risk that Council will encounter difficulty in meeting obligations with financial liabilities. In accordance with the model Treasury Mangement Policy (LGA Information Paper 15), liabilities have a range ofmaturity dates. Council also has available a range of bank overdraft and standby borrowing facilities that it can access.
Interest Rate Risk is the risk that future cash flows will fluctuate because of changes in market interest rates.Council has a balance of both fixed and variable interest rate borrowings and investments. Cash flow fluctuations aremanaged holistically in seeking to minimise interest costs over the longer term in a risk averse manner.
Note 14. Commitments for Expenditure
$ '000
Capital Commitments
Capital expenditure committed for at the reporting date but notrecognised in the financial statements as liabilities:
LandBuildingsInfrastructurePlant & EquipmentOther
These expenditures are payable:Not later than one yearLater than one year and not later than 5 yearsLater than 5 years
76
4,241 1,747
4,241
961 2,952
1,747
2017 2016
208 41 64
-
64
- -
Notes
36
1,747
56
- 4,241
1,530
X12A5T
Page 77
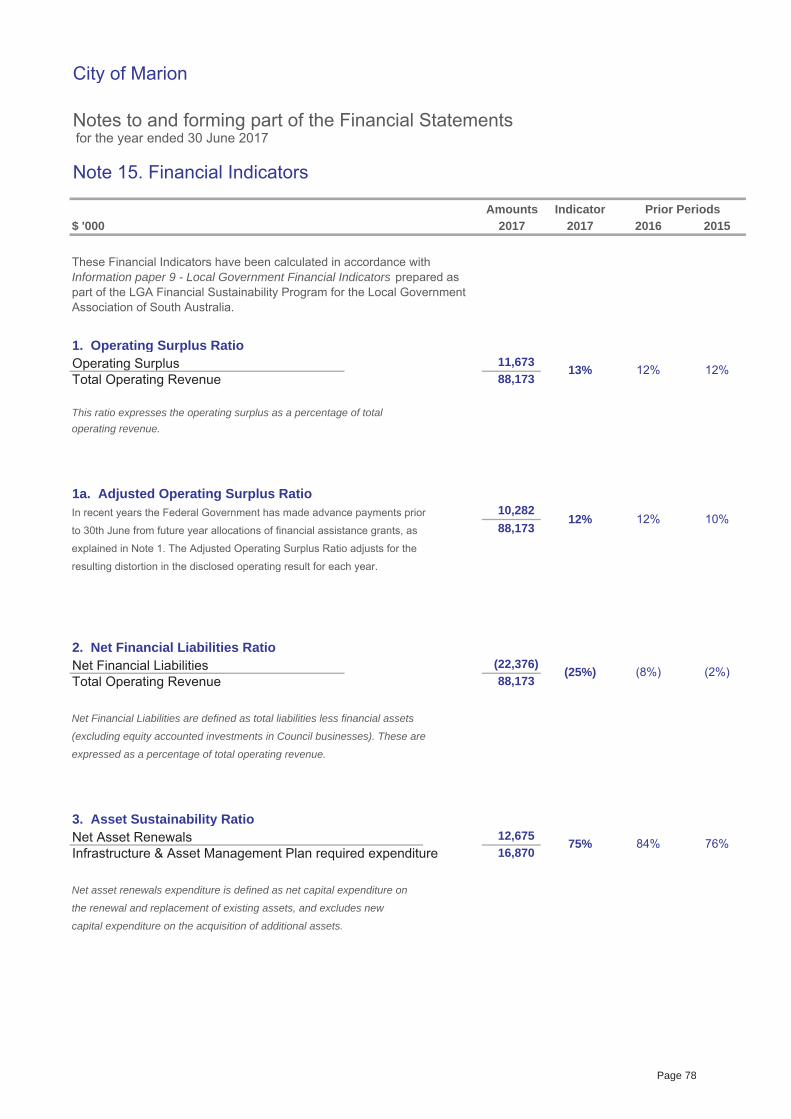
City of Marion
Notes to and forming part of the Financial Statements for the year ended 30 June 2017
Note 15. Financial Indicators
$ '000
1. Operating Surplus RatioOperating SurplusTotal Operating Revenue
This ratio expresses the operating surplus as a percentage of totaloperating revenue.
1a. Adjusted Operating Surplus RatioIn recent years the Federal Government has made advance payments prior
to 30th June from future year allocations of financial assistance grants, as
explained in Note 1. The Adjusted Operating Surplus Ratio adjusts for the
resulting distortion in the disclosed operating result for each year.
2. Net Financial Liabilities RatioNet Financial LiabilitiesTotal Operating Revenue
Net Financial Liabilities are defined as total liabilities less financial assets
(excluding equity accounted investments in Council businesses). These are
expressed as a percentage of total operating revenue.
3. Asset Sustainability RatioNet Asset RenewalsInfrastructure & Asset Management Plan required expenditure
Net asset renewals expenditure is defined as net capital expenditure on
the renewal and replacement of existing assets, and excludes new
capital expenditure on the acquisition of additional assets.
16,870
88,173 10,282
12% 12% 10%
(22,376) (25%) (8%) (2%)88,173
12,675 75% 84% 76%
13%11,673
Amounts2017 2017 2016 2015
Indicator Prior Periods
88,173
These Financial Indicators have been calculated in accordance with Information paper 9 - Local Government Financial Indicators prepared as part of the LGA Financial Sustainability Program for the Local Government Association of South Australia.
12%12%
Page 78
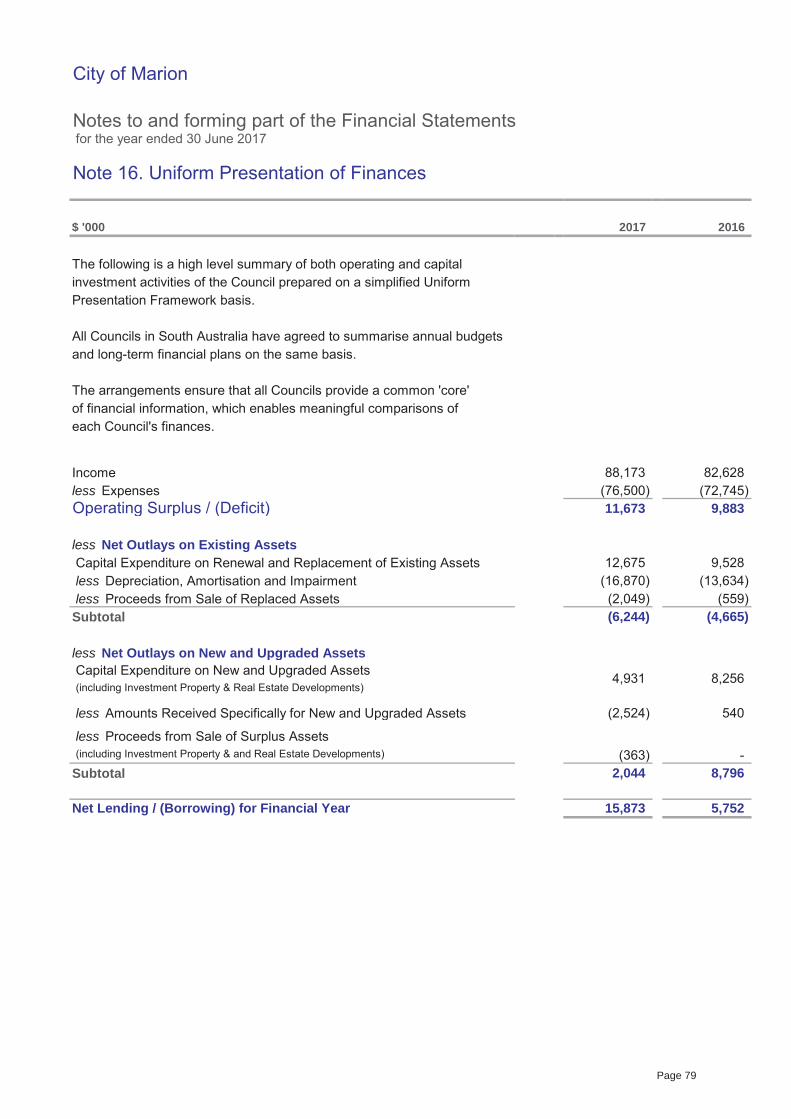
City of Marion
Notes to and forming part of the Financial Statements for the year ended 30 June 2017
Note 16. Uniform Presentation of Finances
$ '000
The following is a high level summary of both operating and capital investment activities of the Council prepared on a simplified Uniform Presentation Framework basis.
All Councils in South Australia have agreed to summarise annual budgets and long-term financial plans on the same basis.
The arrangements ensure that all Councils provide a common 'core' of financial information, which enables meaningful comparisons of each Council's finances.
Incomeless ExpensesOperating Surplus / (Deficit)
less Net Outlays on Existing Assets Capital Expenditure on Renewal and Replacement of Existing Assets less Depreciation, Amortisation and Impairment less Proceeds from Sale of Replaced AssetsSubtotal
less Net Outlays on New and Upgraded Assets
less Amounts Received Specifically for New and Upgraded Assets
Subtotal
Net Lending / (Borrowing) for Financial Year
Capital Expenditure on New and Upgraded Assets (including Investment Property & Real Estate Developments)
12,675
(559) (4,665)
(16,870)
15,873 5,752
(2,049)
4,931 8,256
2017
82,628 88,173 (76,500) (72,745)
9,88311,673
2016
less Proceeds from Sale of Surplus Assets (including Investment Property & and Real Estate Developments)
(6,244)
(2,524) 540
9,528
8,796(363) -
(13,634)
2,044
X12A7T
Page 79
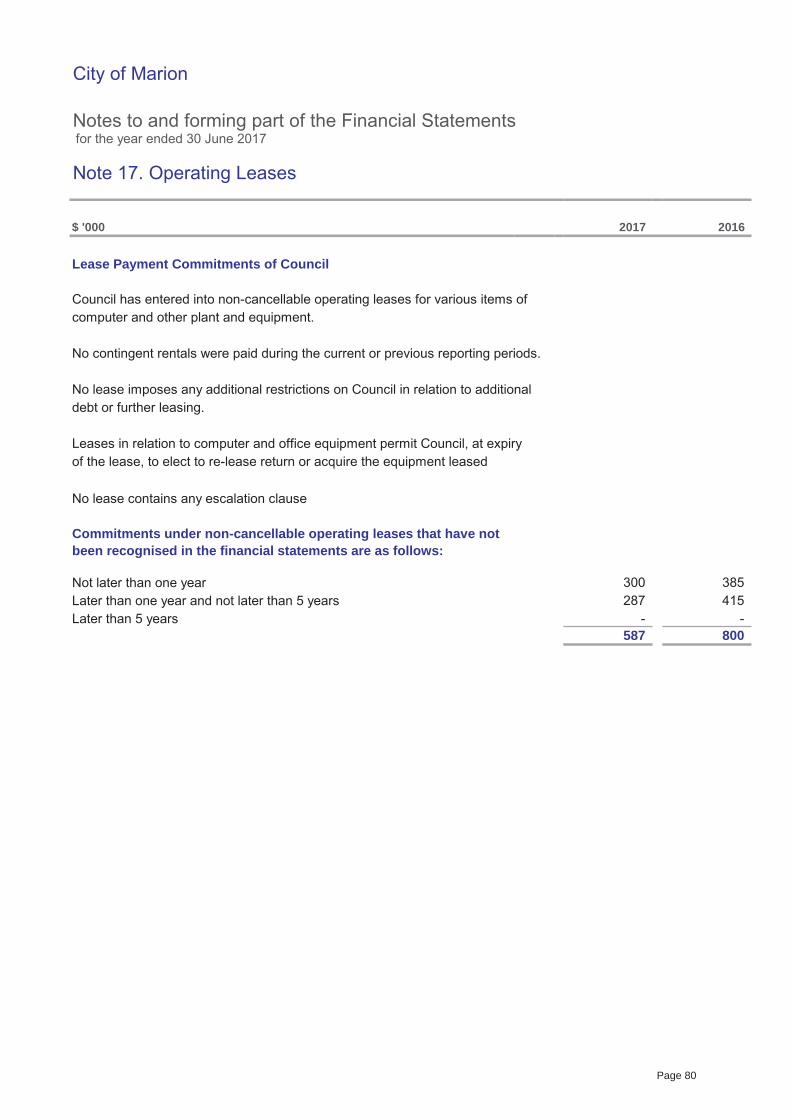
City of Marion
Notes to and forming part of the Financial Statements for the year ended 30 June 2017
Note 17. Operating Leases
$ '000
Lease Payment Commitments of Council
Council has entered into non-cancellable operating leases for various items of computer and other plant and equipment.
No contingent rentals were paid during the current or previous reporting periods.
No lease imposes any additional restrictions on Council in relation to additionaldebt or further leasing.
Leases in relation to computer and office equipment permit Council, at expiryof the lease, to elect to re-lease return or acquire the equipment leased
No lease contains any escalation clause
Not later than one yearLater than one year and not later than 5 yearsLater than 5 years
385
587
Commitments under non-cancellable operating leases that have not been recognised in the financial statements are as follows:
300
2017
415 -
287 -
2016
800
X12A8T
Page 80
City of Marion
Notes to and forming part of the Financial Statements for the year ended 30 June 2017
Note 18. Superannuation
$ '000
The Council makes employer superannuation contributions in respect of its employees to Statewide Super (formerly Local Government Superannuation Scheme). There are two types of membership, each of which is funded differently. Permanent and contract employees of the South Australian Local Government sector with Salarylink benefits prior to 24 November 2009 have the option to contribute to the Accumulation section and/or Salarylink. All other employees (including casuals) have all contributions allocated to the Accumulation section.
Accumulation only MembersAccumulation only members receive both employer and employee contributions on a progressive basis. Employer contributions are based on a fixed percentage of ordinary time earnings in accordance with superannuation guarantee legislation (9.50% in 2016/17; 9.50% in 2015/16). No further liability accrues to the Council as the superannuation benefits accruing to employees are represented by their share of the net assets of the Fund.
Salarylink (Defined Benefit Fund) MembersSalarylink is a defined benefit scheme where the benefit payable is based on a formula determined by the member’s contribution rate, number of years and level of contribution and final average salary. Council makes employer contributions to Salarylink as determined by the Fund’s Trustee based on advice from the appointed Actuary. The rate is currently 6.3% (6.3% in 2015/16) of “superannuation” salary.
In addition, Council makes a separate contribution of 3.2% of ordinary time earnings for Salarylink members to their Accumulation account. Employees also make member contributions to the Salarylink section of the Fund. As such, assets accumulate in the Salarylink section of the Fund to meet the member's benefits, as defined in the Trust Deed, as they accrue.
The Salarylink section is a multi-employer sponsored plan. As the Salarylink section's assets and liabilities are pooled and are not allocated by each employer, and employees may transfer to another employer within the local government sector and retain membership of the Fund, the Actuary is unable to allocate benefit liabilities, assets and costs between employers. As provided by AASB 119.32(b), Council does not use defined benefit accounting for these contributions.
The most recent actuarial investigation was conducted by the Fund's actuary, A C Miller, FIAA, of Russell Employee Benefits Pty Ltd as at 30 June 2014. The Trustee has determined that the current funding arrangements are adequate for the expected Salarylink liabilities. However, future financial and economic circumstances may require changes to Council’s contribution rates at some future time.
Contributions to Other Superannuation Schemes Council also makes contributions to other superannuation schemes selected by employees under the “choice of fund” legislation. All such schemes are of the accumulation type, where the superannuation benefits accruing to the employee are represented by their share of the net assets of the scheme, and no further liability attaches to the Council.
X12A9T
Page 81
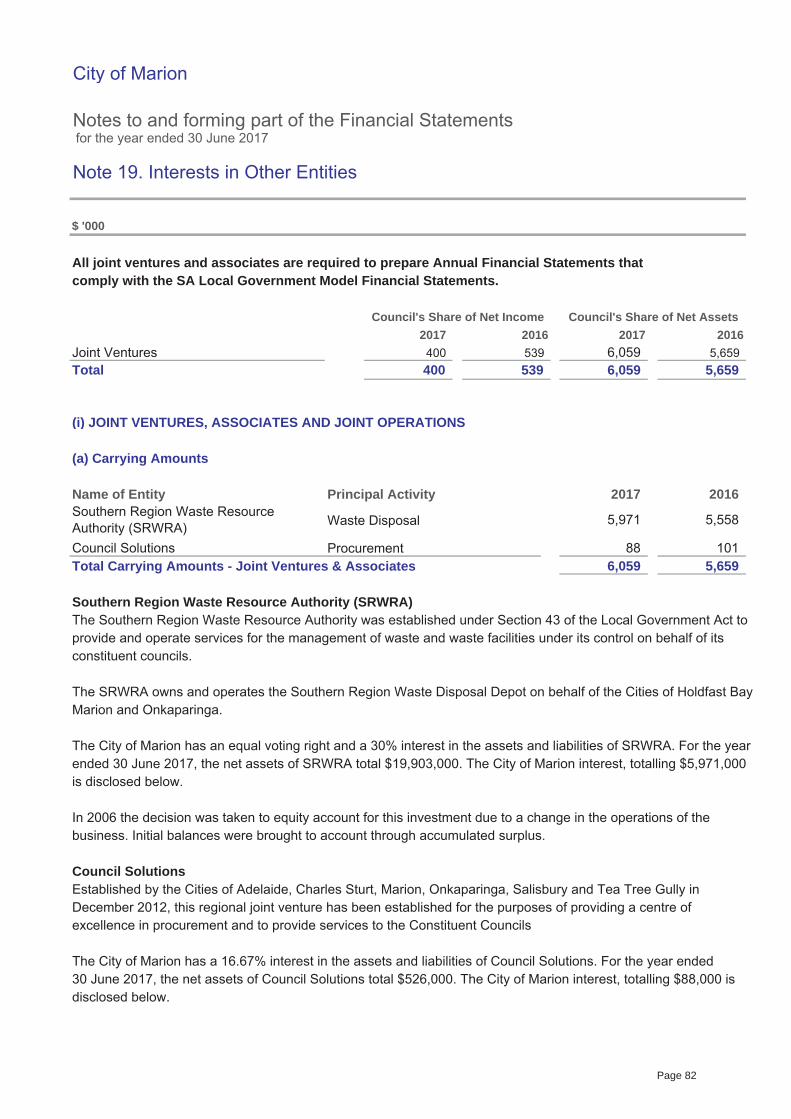
City of Marion
Notes to and forming part of the Financial Statements for the year ended 30 June 2017
Note 19. Interests in Other Entities
$ '000
All joint ventures and associates are required to prepare Annual Financial Statements thatcomply with the SA Local Government Model Financial Statements.
Joint VenturesTotal
(i) JOINT VENTURES, ASSOCIATES AND JOINT OPERATIONS
(a) Carrying Amounts
Name of Entity Principal Activity
Waste Disposal
ProcurementTotal Carrying Amounts - Joint Ventures & Associates
Southern Region Waste Resource Authority (SRWRA)The Southern Region Waste Resource Authority was established under Section 43 of the Local Government Act to provide and operate services for the management of waste and waste facilities under its control on behalf of its constituent councils.
The SRWRA owns and operates the Southern Region Waste Disposal Depot on behalf of the Cities of Holdfast Bay,Marion and Onkaparinga.
The City of Marion has an equal voting right and a 30% interest in the assets and liabilities of SRWRA. For the year ended 30 June 2017, the net assets of SRWRA total $19,903,000. The City of Marion interest, totalling $5,971,000is disclosed below.
In 2006 the decision was taken to equity account for this investment due to a change in the operations of thebusiness. Initial balances were brought to account through accumulated surplus.
Council SolutionsEstablished by the Cities of Adelaide, Charles Sturt, Marion, Onkaparinga, Salisbury and Tea Tree Gully inDecember 2012, this regional joint venture has been established for the purposes of providing a centre ofexcellence in procurement and to provide services to the Constituent Councils
The City of Marion has a 16.67% interest in the assets and liabilities of Council Solutions. For the year ended30 June 2017, the net assets of Council Solutions total $526,000. The City of Marion interest, totalling $88,000 is disclosed below.
5,659
2016
Council's Share of Net Assets
5,659 2017 2016 2017
539
6,059
Council's Share of Net Income
5,558
400 539 6,059 5,659
2017
400 2016
6,059
Southern Region Waste Resource Authority (SRWRA) 5,971
Council Solutions 88 101
Page 82
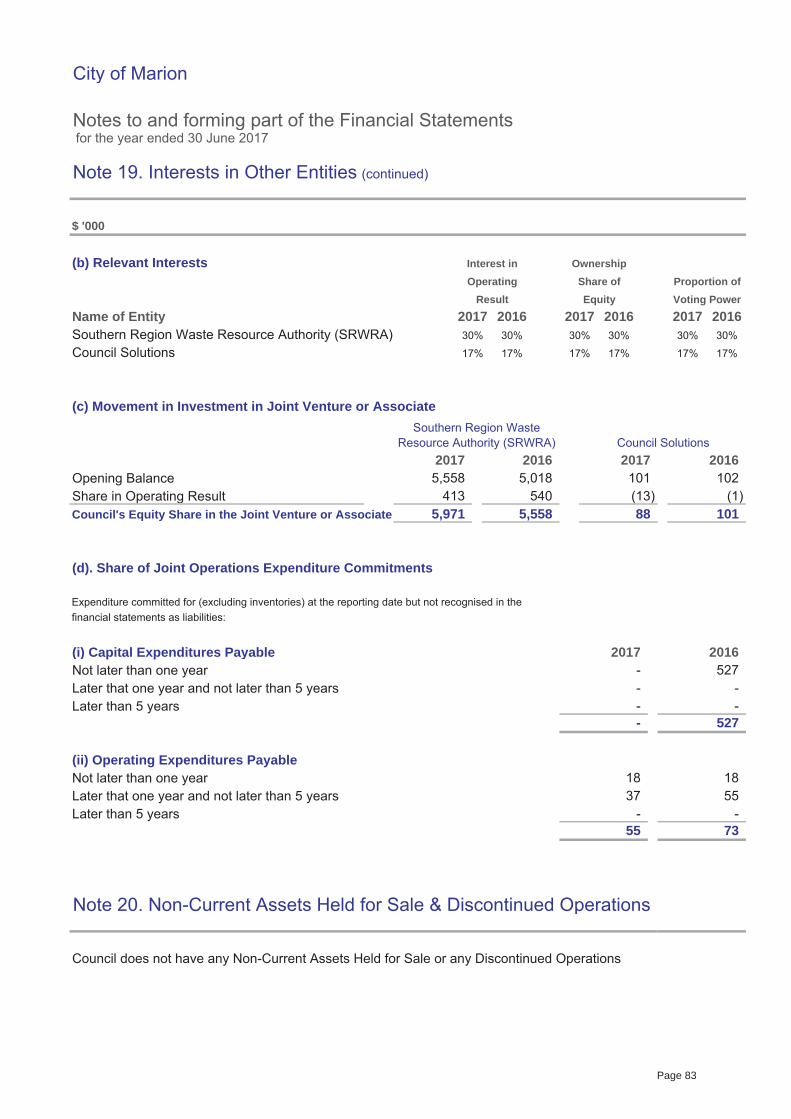
City of Marion
Notes to and forming part of the Financial Statements for the year ended 30 June 2017
Note 19. Interests in Other Entities (continued)
$ '000
(b) Relevant Interests
Name of EntitySouthern Region Waste Resource Authority (SRWRA)Council Solutions
(c) Movement in Investment in Joint Venture or Associate
Opening BalanceShare in Operating ResultCouncil's Equity Share in the Joint Venture or Associate
(d). Share of Joint Operations Expenditure Commitments
Expenditure committed for (excluding inventories) at the reporting date but not recognised in the financial statements as liabilities:
(i) Capital Expenditures PayableNot later than one yearLater that one year and not later than 5 yearsLater than 5 years
(ii) Operating Expenditures PayableNot later than one yearLater that one year and not later than 5 yearsLater than 5 years
Note 20. Non-Current Assets Held for Sale & Discontinued Operations
Council does not have any Non-Current Assets Held for Sale or any Discontinued Operations
2017 2016
18
- 527
527
17%
2017
Operating Share ofResult Equity Voting Power
-
30% 30%
17% 17% 17% 17% 17%
Interest in Ownership
Southern Region Waste Resource Authority (SRWRA) Council Solutions
55
- - -
55 73
-
18 37
-
2016 2017 2016 2017 201630% 30% 30% 30%
-
Proportion of
2017 2016 2017 20165,558 5,018 101 102
413 540 (13) (1) 5,971 5,558 88 101
Page 83
City of Marion
Notes to and forming part of the Financial Statements for the year ended 30 June 2017
Note 21. Contingencies & Assets/Liabilities Not Recognised in the Balance Sheet
The following assets and liabilities do not qualify for recognition in the Balance Sheet, but knowledge of those itemsis considered relevant to the user of the financial report in making and evaluating decisions about the allocation of scarce resources.
1. LAND UNDER ROADS
As reported in the Financial Statements, Council is of the opinion that it is not possible to attribute a value sufficiently reliably for these assets to qualify for recognition, and accordingly land under roads has not been recognised in the reports. Land acquired for road purposes during the year is initially recognised at cost, but transferred to fair value at reporting date, effectively writing off the expenditure.
2. POTENTIAL INSURANCE LOSSES
Council is a multi-purpose organisation providing a large range of building, parks infrastructure, playgrounds and other facilities accessible to the public. At any time, it is likely that claims will have been made against Council that remain unsettled.
Council insures against all known insurable risks using a range of insurance policies, each of which is subject to deductable "insurance excesses", the amount of which varies according to the class of insurance.
Council has recognised the potential losses arising from claims known at reporting date based on average historical net cost (including insurance excess) of similar types of claims. Other potential claims not reported to Council may have existed at reporting date.
3. BANK GUARANTEES
Council currently has no guaranteed loans or other banking facilities advanced to community organisations andsporting bodies at reporting date.
4. LEGAL MATTERS
Council is the planning consent authority for its area under the Development Act 1993 (as amended). Pursuant to that Act, certain persons aggrieved by a planning decision of the Council may appeal. It is normal practice that parties bear their own legal costs. At the date of these reports, Council had notice of 6 appeals against planning decisions made prior to reporting date. All known costs have been recognised, but the amount of further costs cannot be known until the appeals are determined.
Page 84
City of Marion
Notes to and forming part of the Financial Statements for the year ended 30 June 2017
Note 22. Events after the Balance Sheet Date
Events that occur after the reporting date of 30 June 2017, up to and including the date when the financialstatements are "authorised for issue" have been taken into account in preparing these statements.
Council has adopted the date of receipt of the Auditors' Report as the appropriate "authorised for issue" daterelating to these General Purpose Financial Statements.
Accordingly, the "authorised for issue" date is 24/10/17.
Council is unaware of any material or significant "non adjusting events" that should be disclosed.
Note 23. Related Party Transactions
$ '000
Key Management Personnel
Transactions with Key Management Personel
The Key Management Personnel of the Council include the Mayor, Councillors, CEO and certain prescribed officers under section 112 of the Local Government Act 1999 . In all, 17 persons were paid the following total compensation:
The compensation paid to Key Management Personnel comprises:
Salaries, Allowances & Other Short-Term Employee BenefitsPost-Employment BenefitsTotal
Amounts paid as direct reimbursement of expenses incurred on behalf of Council have not been included above.
Receipts from Key Management Personnel comprise:
Other than amounts paid as ratepayers or residents (e.g. rates, swimming pool entry fees, etc.), Council received no receipts from Key Management Personnel.
2017
1,241
1,167 74
Page 85
Page 86
Page 87
Page 88
Page 89
Page 90

Page 91
FINANCIAL REPORTFor the Financial Year Ended 30 June 2017
Page 92
SOUTHERN REGION WASTE RESOURCE AUTHORITY
TABLE OF CONTENTSPage
Authority Certificate
Principal Financial StatementsStatement of Comprehensive Income 1Statement of Financial Position 2
Statement of Changes in Equity 3Statement of Cash Flows 4
Notes to, and forming part of, the Principal Financial Statements
Note 1 - Significant Accounting Policies N1Note 2 - Income N5Note 3 - Expenses N5Note 4 - Gain or Loss on Disposal of Assets N6Note 5 - Current Assets N6Note 6 - Infrastructure, Property, Plant & Equipment & Investment Property
N7
Note 7 - Liabilities N9Note 8 - Reconciliation of Cash Flow Statement N10Note 9 - Financial Instruments N11Note 10 - Expenditure Commitments N13
N13
Note 12 - Events Occurring After Reporting Date N13Note 13 - Uniform Presentation of Finances N14Note 14 - Disclosures of Related Party Transactions N15Note 15 - Equity Accounted Joint Venture N16Note 16 - Fair Value Measurements N17
EO StatementAudit ReportCouncil Certificates of Audit Independence
Note 11 - Contingencies & Assets & Liabilities Not Recognised in the Statement of Financial Performance
Page 93
Page 94
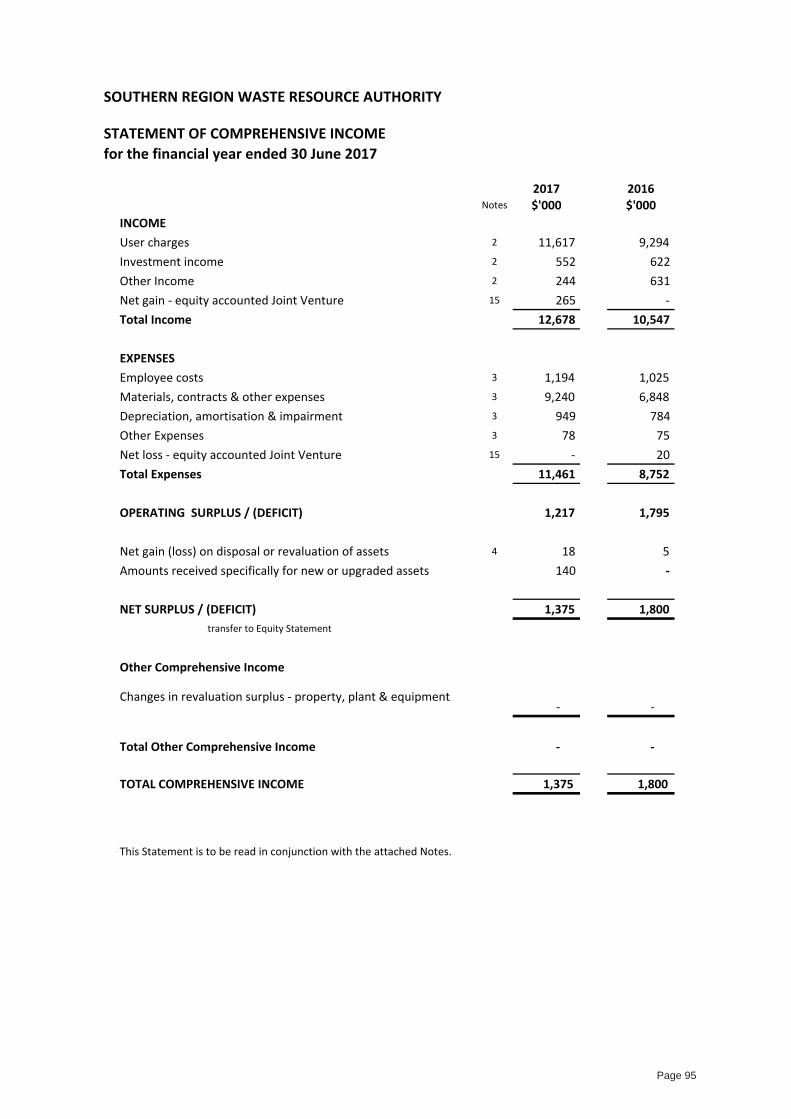
2017 2016Notes $'000 $'000
INCOMEUser charges 2 11,617 9,294 Investment income 2 552 622 Other Income 2 244 631 Net gain - equity accounted Joint Venture 15 265 - Total Income 12,678 10,547
EXPENSESEmployee costs 3 1,194 1,025 Materials, contracts & other expenses 3 9,240 6,848 Depreciation, amortisation & impairment 3 949 784 Other Expenses 3 78 75 Net loss - equity accounted Joint Venture 15 - 20 Total Expenses 11,461 8,752
OPERATING SURPLUS / (DEFICIT) 1,217 1,795
Net gain (loss) on disposal or revaluation of assets 4 18 5 Amounts received specifically for new or upgraded assets 140 -
NET SURPLUS / (DEFICIT) 1,375 1,800 transfer to Equity Statement
Other Comprehensive Income
Changes in revaluation surplus - property, plant & equipment- -
Total Other Comprehensive Income - -
TOTAL COMPREHENSIVE INCOME 1,375 1,800
This Statement is to be read in conjunction with the attached Notes.
SOUTHERN REGION WASTE RESOURCE AUTHORITY
STATEMENT OF COMPREHENSIVE INCOMEfor the financial year ended 30 June 2017
Page 95

2017 2016ASSETS Notes $'000 $'000Current AssetsCash and cash equivalents 5 19,940 19,069 Trade & other receivables 5 2,025 867 Inventories 5 - 48
21,965 19,984 Total Current Assets 21,965 19,984
Non-current AssetsEquity Accounted Joint Venture 14 709 164 Property, Plant & Equipment 6 15,081 14,461
Total Non-current Assets 15,790 14,625 Total Assets 37,755 34,609
LIABILITIESCurrent LiabilitiesTrade & Other Payables 7 2,529 1,365 Provisions 7 149 136
Total Current Liabilities 2,678 1,501
Non-current LiabilitiesProvisions 7 15,174 14,580
Total Non-current Liabilities 15,174 14,580 Total Liabilities 17,852 16,081
NET ASSETS 19,903 18,528
EQUITYAccumulated Surplus 19,903 18,528 TOTAL EQUITY 19,903 18,528
This Statement is to be read in conjunction with the attached Notes.
SOUTHERN REGION WASTE RESOURCE AUTHORITY
STATEMENT OF FINANCIAL POSITIONas at 30 June 2017
Page 96
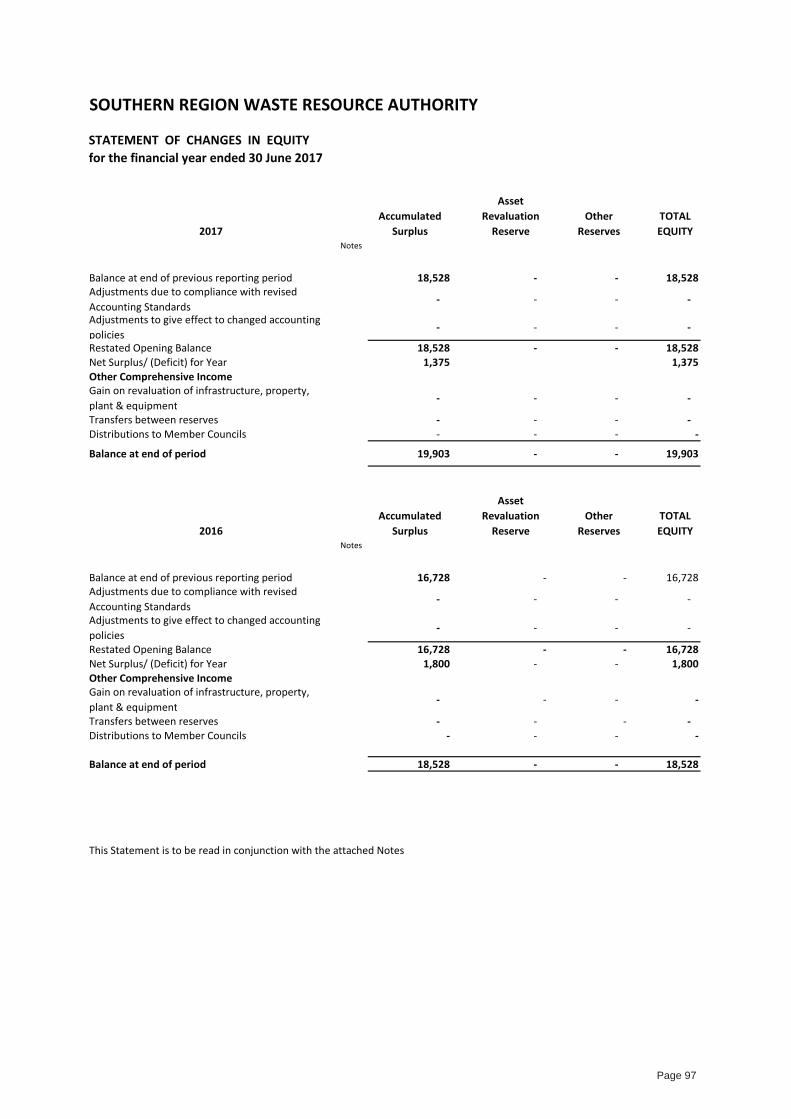
2017Accumulated
Surplus
Asset Revaluation
ReserveOther
ReservesTOTAL EQUITY
Notes
Balance at end of previous reporting period 18,528 - - 18,528 Adjustments due to compliance with revised Accounting Standards
- - - -
Adjustments to give effect to changed accounting policies
- - - -
Restated Opening Balance 18,528 - - 18,528 Net Surplus/ (Deficit) for Year 1,375 1,375 Other Comprehensive IncomeGain on revaluation of infrastructure, property, plant & equipment
- - - -
Transfers between reserves - - - - Distributions to Member Councils - - - -
Balance at end of period 19,903 - - 19,903
2016Accumulated
Surplus
Asset Revaluation
ReserveOther
ReservesTOTAL EQUITY
Notes
Balance at end of previous reporting period 16,728 - - 16,728 Adjustments due to compliance with revised Accounting Standards
- - - -
Adjustments to give effect to changed accounting policies
- - - -
Restated Opening Balance 16,728 - - 16,728 Net Surplus/ (Deficit) for Year 1,800 - - 1,800 Other Comprehensive IncomeGain on revaluation of infrastructure, property, plant & equipment
- - - -
Transfers between reserves - - - - Distributions to Member Councils - - - -
Balance at end of period 18,528 - - 18,528
This Statement is to be read in conjunction with the attached Notes
SOUTHERN REGION WASTE RESOURCE AUTHORITY
STATEMENT OF CHANGES IN EQUITYfor the financial year ended 30 June 2017
Page 97
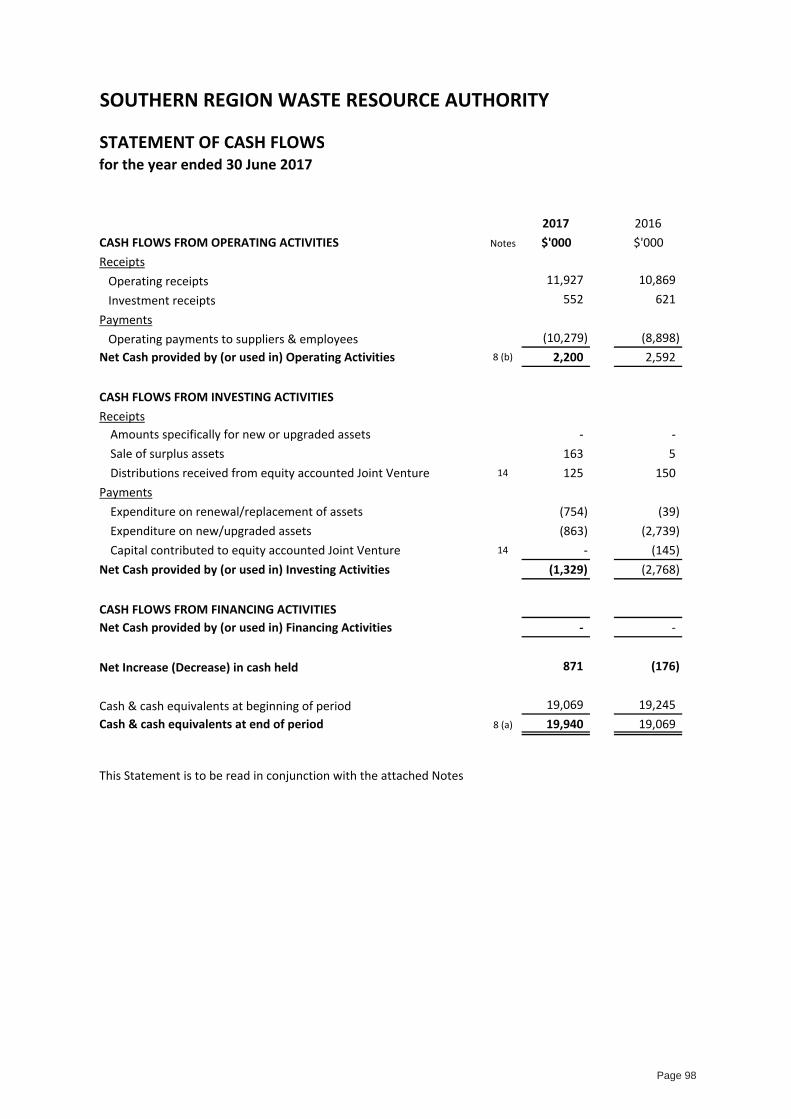
SOUTHERN REGION WASTE RESOURCE AUTHORITY
STATEMENT OF CASH FLOWSfor the year ended 30 June 2017
2017 2016CASH FLOWS FROM OPERATING ACTIVITIES Notes $'000 $'000Receipts Operating receipts 11,927 10,869 Investment receipts 552 621 Payments Operating payments to suppliers & employees (10,279) (8,898) Net Cash provided by (or used in) Operating Activities 8 (b) 2,200 2,592
CASH FLOWS FROM INVESTING ACTIVITIESReceipts
Amounts specifically for new or upgraded assets - - Sale of surplus assets 163 5 Distributions received from equity accounted Joint Venture 14 125 150
PaymentsExpenditure on renewal/replacement of assets (754) (39) Expenditure on new/upgraded assets (863) (2,739) Capital contributed to equity accounted Joint Venture 14 - (145)
Net Cash provided by (or used in) Investing Activities (1,329) (2,768)
CASH FLOWS FROM FINANCING ACTIVITIESNet Cash provided by (or used in) Financing Activities - -
Net Increase (Decrease) in cash held 871 (176)
Cash & cash equivalents at beginning of period 19,069 19,245 Cash & cash equivalents at end of period 8 (a) 19,940 19,069
This Statement is to be read in conjunction with the attached Notes
Page 98
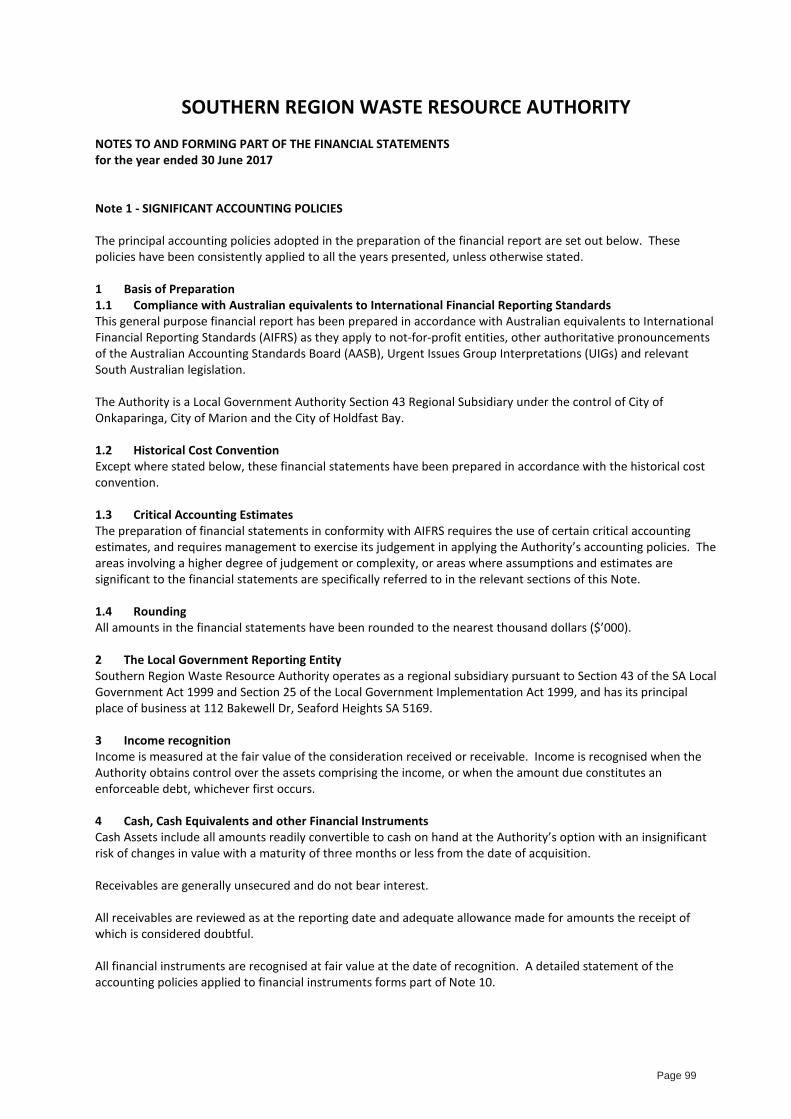
SOUTHERN REGION WASTE RESOURCE AUTHORITY NOTES TO AND FORMING PART OF THE FINANCIAL STATEMENTS for the year ended 30 June 2017 Note 1 - SIGNIFICANT ACCOUNTING POLICIES The principal accounting policies adopted in the preparation of the financial report are set out below. These policies have been consistently applied to all the years presented, unless otherwise stated. 1 Basis of Preparation 1.1 Compliance with Australian equivalents to International Financial Reporting Standards This general purpose financial report has been prepared in accordance with Australian equivalents to International Financial Reporting Standards (AIFRS) as they apply to not-for-profit entities, other authoritative pronouncements of the Australian Accounting Standards Board (AASB), Urgent Issues Group Interpretations (UIGs) and relevant South Australian legislation. The Authority is a Local Government Authority Section 43 Regional Subsidiary under the control of City of Onkaparinga, City of Marion and the City of Holdfast Bay. 1.2 Historical Cost Convention Except where stated below, these financial statements have been prepared in accordance with the historical cost convention. 1.3 Critical Accounting Estimates The preparation of financial statements in conformity with AIFRS requires the use of certain critical accounting estimates, and requires management to exercise its judgement in applying the Authority’s accounting policies. The areas involving a higher degree of judgement or complexity, or areas where assumptions and estimates are significant to the financial statements are specifically referred to in the relevant sections of this Note. 1.4 Rounding All amounts in the financial statements have been rounded to the nearest thousand dollars ($’000). 2 The Local Government Reporting Entity Southern Region Waste Resource Authority operates as a regional subsidiary pursuant to Section 43 of the SA Local Government Act 1999 and Section 25 of the Local Government Implementation Act 1999, and has its principal place of business at 112 Bakewell Dr, Seaford Heights SA 5169. 3 Income recognition Income is measured at the fair value of the consideration received or receivable. Income is recognised when the Authority obtains control over the assets comprising the income, or when the amount due constitutes an enforceable debt, whichever first occurs. 4 Cash, Cash Equivalents and other Financial Instruments Cash Assets include all amounts readily convertible to cash on hand at the Authority’s option with an insignificant risk of changes in value with a maturity of three months or less from the date of acquisition. Receivables are generally unsecured and do not bear interest. All receivables are reviewed as at the reporting date and adequate allowance made for amounts the receipt of which is considered doubtful. All financial instruments are recognised at fair value at the date of recognition. A detailed statement of the accounting policies applied to financial instruments forms part of Note 10.
Page 99
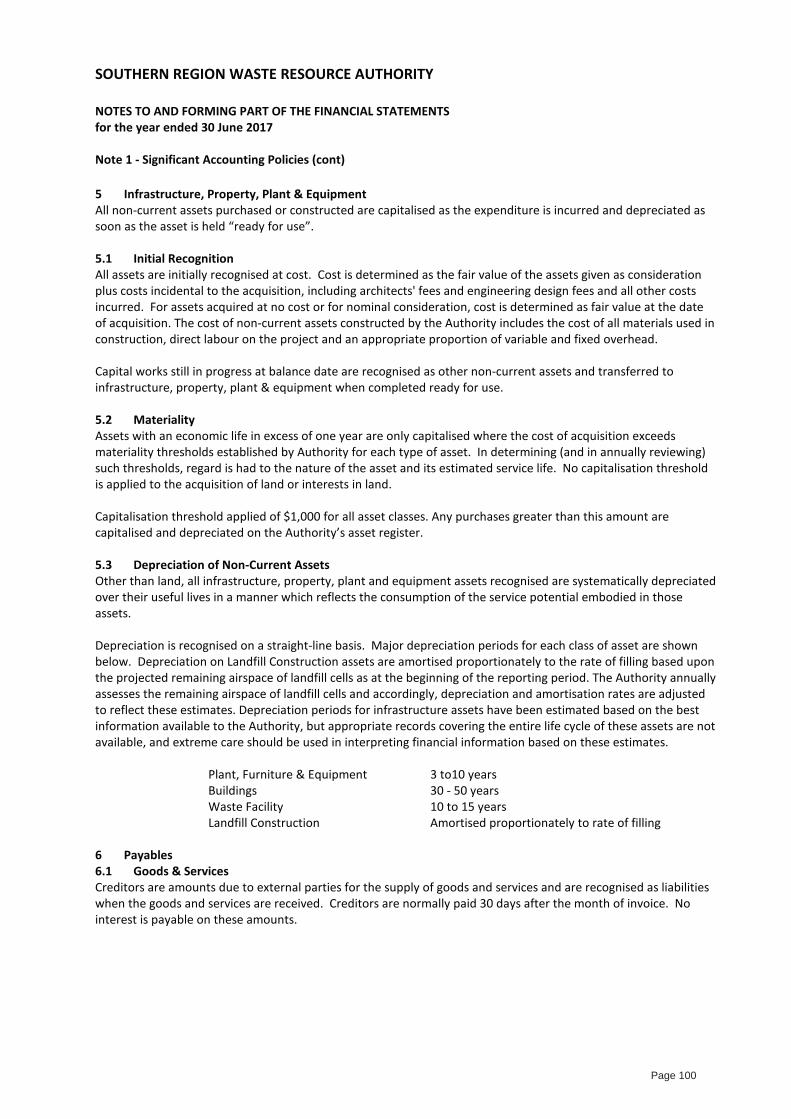
SOUTHERN REGION WASTE RESOURCE AUTHORITY NOTES TO AND FORMING PART OF THE FINANCIAL STATEMENTS for the year ended 30 June 2017 Note 1 - Significant Accounting Policies (cont)
5 Infrastructure, Property, Plant & Equipment All non-current assets purchased or constructed are capitalised as the expenditure is incurred and depreciated as soon as the asset is held “ready for use”. 5.1 Initial Recognition All assets are initially recognised at cost. Cost is determined as the fair value of the assets given as consideration plus costs incidental to the acquisition, including architects' fees and engineering design fees and all other costs incurred. For assets acquired at no cost or for nominal consideration, cost is determined as fair value at the date of acquisition. The cost of non-current assets constructed by the Authority includes the cost of all materials used in construction, direct labour on the project and an appropriate proportion of variable and fixed overhead. Capital works still in progress at balance date are recognised as other non-current assets and transferred to infrastructure, property, plant & equipment when completed ready for use. 5.2 Materiality Assets with an economic life in excess of one year are only capitalised where the cost of acquisition exceeds materiality thresholds established by Authority for each type of asset. In determining (and in annually reviewing) such thresholds, regard is had to the nature of the asset and its estimated service life. No capitalisation threshold is applied to the acquisition of land or interests in land. Capitalisation threshold applied of $1,000 for all asset classes. Any purchases greater than this amount are capitalised and depreciated on the Authority’s asset register. 5.3 Depreciation of Non-Current Assets Other than land, all infrastructure, property, plant and equipment assets recognised are systematically depreciated over their useful lives in a manner which reflects the consumption of the service potential embodied in those assets. Depreciation is recognised on a straight-line basis. Major depreciation periods for each class of asset are shown below. Depreciation on Landfill Construction assets are amortised proportionately to the rate of filling based upon the projected remaining airspace of landfill cells as at the beginning of the reporting period. The Authority annually assesses the remaining airspace of landfill cells and accordingly, depreciation and amortisation rates are adjusted to reflect these estimates. Depreciation periods for infrastructure assets have been estimated based on the best information available to the Authority, but appropriate records covering the entire life cycle of these assets are not available, and extreme care should be used in interpreting financial information based on these estimates. Plant, Furniture & Equipment 3 to10 years Buildings 30 - 50 years Waste Facility 10 to 15 years Landfill Construction Amortised proportionately to rate of filling 6 Payables 6.1 Goods & Services Creditors are amounts due to external parties for the supply of goods and services and are recognised as liabilities when the goods and services are received. Creditors are normally paid 30 days after the month of invoice. No interest is payable on these amounts.
Page 100

SOUTHERN REGION WASTE RESOURCE AUTHORITY NOTES TO AND FORMING PART OF THE FINANCIAL STATEMENTS for the year ended 30 June 2017 Note 1 - Significant Accounting Policies (cont)
7 Employee Benefits 7.1 Salaries, Wages & Compensated Absences Liabilities for employees’ entitlements to salaries, wages and compensated absences expected to be paid or settled within 12 months of reporting date are accrued at nominal amounts (including payroll based oncosts) measured in accordance with AASB 119. Liabilities for employee benefits not expected to be paid or settled within 12 months are measured as the present value of the estimated future cash outflows (including payroll based oncosts) to be made in respect of services provided by employees up to the reporting date. Present values are calculated using government guaranteed securities rates with similar maturity terms. The Authority recognises all presently entitled liabilities as current liabilities regardless of whether it is expected to be paid within the preceding 12 months of reporting date. 7.2 Superannuation The Authority makes employer superannuation contributions in respect of its employees to Statewide Super. The Scheme has two types of membership, each of which is funded differently. Accumulation Fund Members Accumulation fund members receive both employer and employee contributions on a progressive basis. Employer contributions are normally based on a fixed percentage of employee earnings in accordance with Superannuation Guarantee Legislation (9.5% in 2016/17; 9.5% in 2015/16). No further liability accrues to the employer as the superannuation benefits accruing to employees are represented by their share of the net assets of the Fund. Defined Benefit Members Defined benefit scheme is where the benefit payable is based on a formula determined by the member’s contribution rate, number of years of contribution and final average salary. The Authority makes employer contributions as determined by the scheme’s Trustee based on advice from the Scheme’s Actuarial. The most recent full actuarial investigation conducted by the Scheme’s actuary, A C Miller, FIAA, of Russell Employee Benefits Pty Ltd as at 30 June 2014.The Trustee has determined that the current funding arrangements are adequate for the expected Salarylink liabilities. However, future financial and economic circumstances may require changes to the Authority’s contribution rates at some future time. The Authority also makes contributions to other superannuation schemes selected by employees under the ‘choice of fund’ legislation. All such schemes are of the accumulation type, where the superannuation benefits accruing to the employee are represented by their share of the new assets of the scheme, and no further liability attaches to the Authority. 8 Rehabilitation Expenditures relating to ongoing rehabilitation and restoration reduce any provision previously established. The Authority annually monitors the liability recorded for landfill rehabilitation and restoration estimates and makes adjustments to the liability as required to ensure an accurate projected cost of the liability is showing in the balance sheet. The Authority will be undertaking further detailed reviews of all rehabilitation and restoration liability costs in future years with the assistance of external consultants to ensure all projected costs have been independently verified. 9 Inventory Inventory held by the Authority reflect materials stored on site which have either been purchased or gifted which will be used for future Cell and Capping construction works to be undertaken in future years.
Page 101
SOUTHERN REGION WASTE RESOURCE AUTHORITY NOTES TO AND FORMING PART OF THE FINANCIAL STATEMENTS for the year ended 30 June 2017 Note 1 - Significant Accounting Policies (cont)
10 GST Implications In accordance with UIG Abstract 1031 “Accounting for the Goods & Services Tax”. Receivables and Creditors include GST receivable and payable. Except in relation to input taxed activities, revenues and operating expenditures exclude GST receivable and payable. Non-current assets and capital expenditures include GST net of any recoupment. Amounts included in the Statement of Cash Flows are disclosed on a gross basis. 11 Comparative Information Comparative information has been reclassified to be consistent with the current year disclosure of equivalent information in accordance with AIFRS. 12 New Accounting Standards Certain new accounting standards and UIG interpretations have been published that are not mandatory for the 30 June 2017 reporting period and have not been used in preparing these reports. The Authority is of the view that none of the new standards or interpretations will affect any of the amounts recognised in the financial statements, but that they may impact certain information otherwise disclosed. 13 Valuation of Land and Building Assets Land and Building assets held by the Authority were valued by Opteon (South Australia) Pty Ltd with an effective valuation date of 30 June 2014 applied for financial reporting purposes. Assets were valued to their market value based on the current zoning of the Onkaparinga Council Development Plan and Environmental Protection Agency (EPA) constraints and assessed market values based on highest and best use. All purchases made post 30 June 2014 have been recorded at Cost. 14 Consolidation of Asset Classes During the 2016/17 financial year, the Authority undertook a consolidation of a number of asset classes in Note 6 of the Financial Statements. There was no impact to the financial performance or position of the Authority as a result of the consolidating asset classes. The Authority undertook a review of the recognition basis for each constructed landfill cell to determine the most appropriate and reliable method to measure the consumption of constructed landfill airspace and recognition of capital works for asset depreciation purposes. It was determined that consolidating all existing landfill sites into a single cell is the most reliable and accurate method of measuring landfill activities given that the site is now operated as one large single cell site. As a result, the WDV of all landfill cell assets was consolidated as at 1 July 2016 and renamed ‘Super Cell’ in Note 6. A review of the ongoing capping obligations for the site is being undertaken in the 2017/18 financial year. Any changes to key assumptions or estimates will be applied in the 2017/18 financial year once the review has been completed.
Page 102
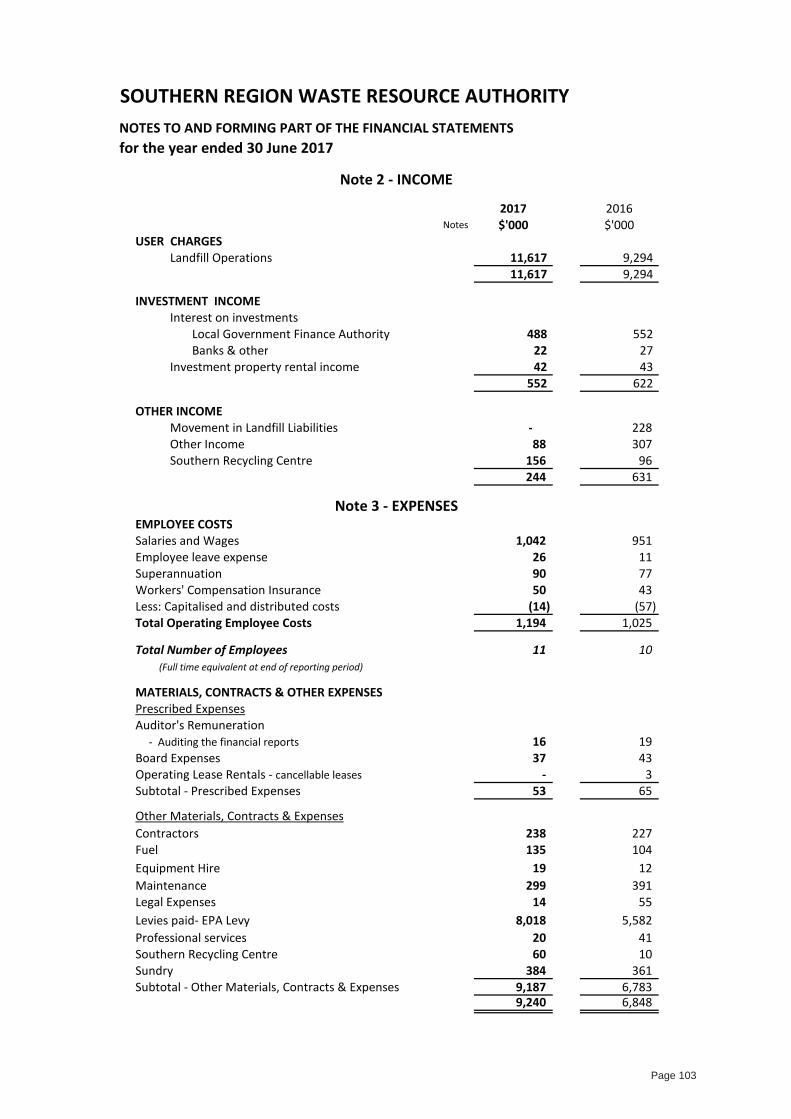
for the year ended 30 June 2017
2017 2016Notes $'000 $'000
USER CHARGESLandfill Operations 11,617 9,294
11,617 9,294
INVESTMENT INCOMEInterest on investments
Local Government Finance Authority 488 552Banks & other 22 27
Investment property rental income 42 43552 622
OTHER INCOMEMovement in Landfill Liabilities - 228 Other Income 88 307 Southern Recycling Centre 156 96
244 631
EMPLOYEE COSTSSalaries and Wages 1,042 951 Employee leave expense 26 11 Superannuation 90 77 Workers' Compensation Insurance 50 43 Less: Capitalised and distributed costs (14) (57) Total Operating Employee Costs 1,194 1,025
Total Number of Employees 11 10 (Full time equivalent at end of reporting period)
MATERIALS, CONTRACTS & OTHER EXPENSESPrescribed ExpensesAuditor's Remuneration - Auditing the financial reports 16 19 Board Expenses 37 43 Operating Lease Rentals - cancellable leases - 3 Subtotal - Prescribed Expenses 53 65
Other Materials, Contracts & ExpensesContractors 238 227 Fuel 135 104 Equipment Hire 19 12 Maintenance 299 391 Legal Expenses 14 55 Levies paid- EPA Levy 8,018 5,582 Professional services 20 41 Southern Recycling Centre 60 10 Sundry 384 361 Subtotal - Other Materials, Contracts & Expenses 9,187 6,783
9,240 6,848
Note 3 - EXPENSES
SOUTHERN REGION WASTE RESOURCE AUTHORITYNOTES TO AND FORMING PART OF THE FINANCIAL STATEMENTS
Note 2 - INCOME
Page 103
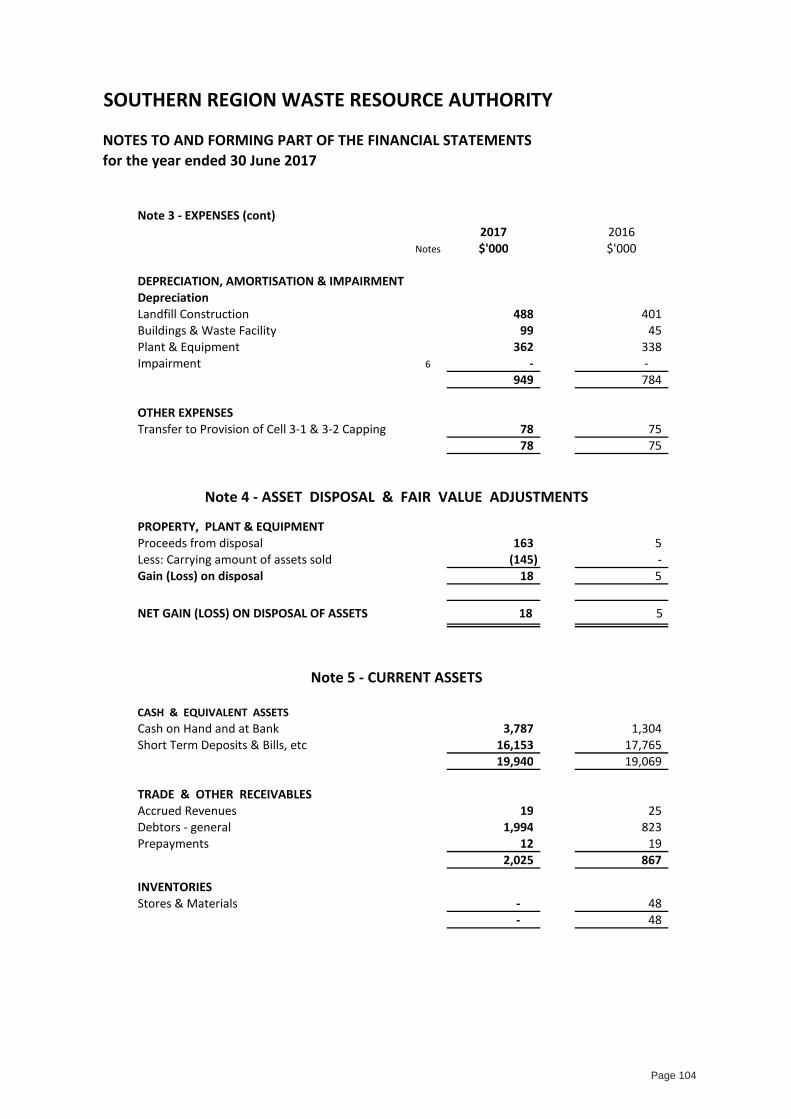
SOUTHERN REGION WASTE RESOURCE AUTHORITY
NOTES TO AND FORMING PART OF THE FINANCIAL STATEMENTSfor the year ended 30 June 2017
Note 3 - EXPENSES (cont)2017 2016
Notes $'000 $'000
DEPRECIATION, AMORTISATION & IMPAIRMENTDepreciationLandfill Construction 488 401 Buildings & Waste Facility 99 45 Plant & Equipment 362 338 Impairment 6 - -
949 784
OTHER EXPENSESTransfer to Provision of Cell 3-1 & 3-2 Capping 78 75
78 75
Note 4 - ASSET DISPOSAL & FAIR VALUE ADJUSTMENTS
PROPERTY, PLANT & EQUIPMENTProceeds from disposal 163 5 Less: Carrying amount of assets sold (145) - Gain (Loss) on disposal 18 5
NET GAIN (LOSS) ON DISPOSAL OF ASSETS 18 5
Note 5 - CURRENT ASSETS
CASH & EQUIVALENT ASSETSCash on Hand and at Bank 3,787 1,304 Short Term Deposits & Bills, etc 16,153 17,765
19,940 19,069
TRADE & OTHER RECEIVABLESAccrued Revenues 19 25 Debtors - general 1,994 823 Prepayments 12 19
2,025 867
INVENTORIESStores & Materials - 48
- 48
Page 104

SOUT
HERN
REG
ION
WAS
TE R
ESO
URCE
AUT
HORI
TY
NOTE
S TO
AND
FO
RMIN
G PA
RT O
F TH
E FI
NANC
IAL S
TATE
MEN
TSfo
r the
yea
r end
ed 3
0 Ju
ne 2
017
Note
6 -
PRO
PERT
Y, P
LANT
& E
QUI
PMEN
T
AT F
AIR
VA
LUE
AT C
OST
ACCU
M D
EP'N
CARR
YING
AM
OUNT
AT F
AIR
VA
LUE
AT C
OST
ACCU
M D
EP'N
CARR
YING
AM
OUNT
Land
1,42
7
40
0
-
1,82
7
1,
427
400
-
1,
827
Build
ings
560
78
0
(41)
1,
299
560
3,
825
(351
)
4,
034
Was
te F
acili
ty31
2
(211
)
10
1
-
-
-
-
Plan
t & E
quip
men
t-
4,
220
(2,7
20)
1,
500
-
4,15
0
(2
,358
)
1,79
2
M
otor
Veh
icles
-
74
(1
3)
61
-
-
-
-
Of
fice
Equi
pmen
t-
12
6
(113
)
13
-
132
(1
02)
30
La
ndfil
l Con
stru
ctio
n:La
ndfil
l Cel
l 3-1
& 3
-2-
5,
293
(5,2
93)
-
-
-
-
-
La
ndfil
l Cel
l's 3
-1 &
3-2
Cap
ping
-
828
(8
28)
-
-
-
-
-
Cell
3-3
& 3
-4 (L
ower
)-
3,
705
(3,2
64)
44
1
-
-
-
-
Cell
3-3
& 3
-4 (L
ower
) Cap
ping
-
2,75
5
(5
88)
2,16
7
-
-
-
-
Ce
ll 4
-
3,60
7
(1
,432
)
2,17
5
-
-
-
-
Ce
ll 4
(Cap
ping
)-
1,
727
(991
)
73
6
-
-
-
-
Supe
r Cel
l-
-
-
-
7,
436
(4,8
67)
2,
569
Supe
r Cel
l Cap
ping
-
-
-
-
4,73
7
(1
,777
)
2,96
0
Po
st C
lsour
e Re
habi
litat
ion
-
5,73
3
(5
,733
)
-
-
5,85
1
(5
,740
)
111
Fu
ture
Res
tora
tion
Cost
s-
4,
028
(2,3
84)
1,
644
-
4,15
9
(2
,495
)
1,66
4
W
ork
in P
rogr
ess
-
2,49
7
-
2,
497
-
94
-
94
TOTA
L PR
OPE
RTY,
PLA
NT &
EQ
UIPM
ENT
1
,987
3
6,08
5
(2
3,61
1)
1
4,46
1
1,9
87
30,
784
(17,
690)
15,
081
Com
para
tives
1
,987
3
3,32
0
(1
8,69
3)
1
6,61
4
1,9
87
33,
320
(18,
693)
16,
614
This
Note
cont
inue
s on
the
follo
win
g pa
ges.
2016
$'00
020
17$'
000
Pag
e 10
5
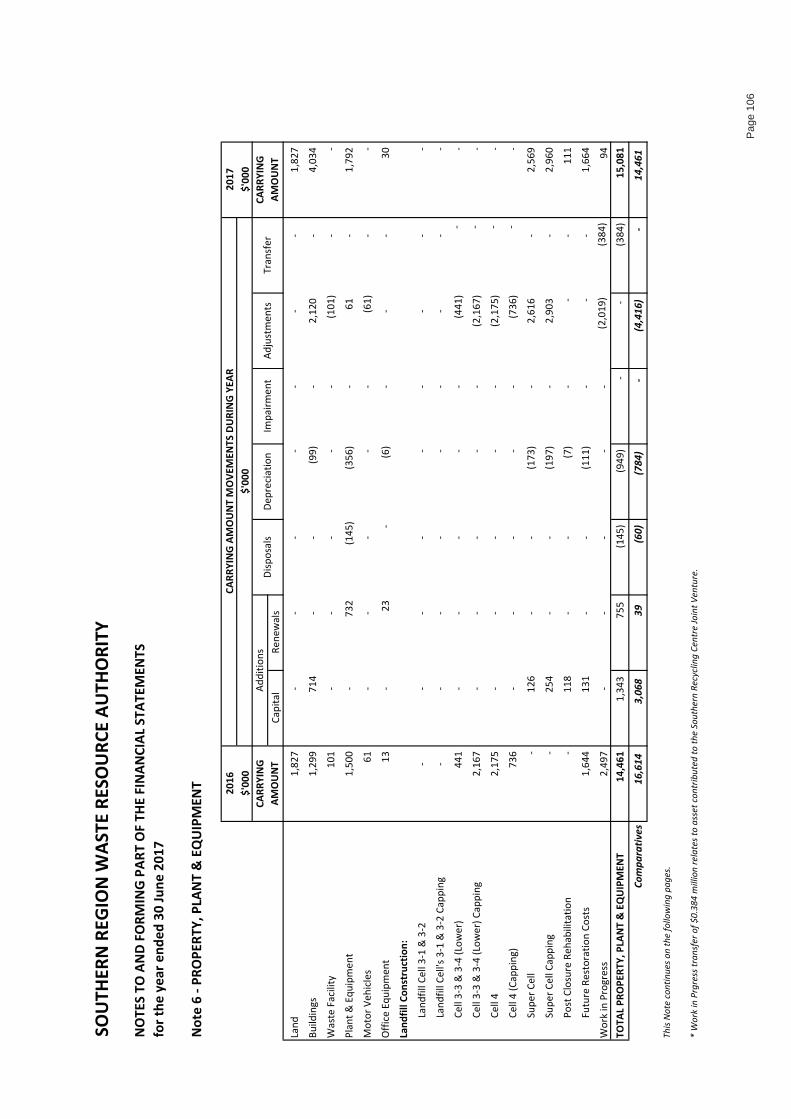
SOUT
HERN
REG
ION
WAS
TE R
ESO
URCE
AUT
HORI
TY
NOTE
S TO
AND
FO
RMIN
G PA
RT O
F TH
E FI
NANC
IAL S
TATE
MEN
TSfo
r the
yea
r end
ed 3
0 Ju
ne 2
017
2016
2017
$'00
0$'
000
Capi
tal
Rene
wal
s
Land
1,82
7
-
-
-
-
-
-
-
1,
827
Build
ings
1,29
9
71
4
-
-
(99)
-
2,
120
-
4,03
4
W
aste
Fac
ility
101
-
-
-
-
-
(1
01)
-
-
Plan
t & E
quip
men
t1,
500
-
732
(1
45)
(356
)
-
61
-
1,79
2
M
otor
Veh
icles
61
-
-
-
-
-
(6
1)
-
-
Offic
e Eq
uipm
ent
13
-
23
-
(6)
-
-
-
30
La
ndfil
l Con
stru
ctio
n:La
ndfil
l Cel
l 3-1
& 3
-2-
-
-
-
-
-
-
-
-
La
ndfil
l Cel
l's 3
-1 &
3-2
Cap
ping
-
-
-
-
-
-
-
-
-
Cell
3-3
& 3
-4 (L
ower
)44
1
-
-
-
-
-
(441
)
-
-
Cell
3-3
& 3
-4 (L
ower
) Cap
ping
2,16
7
-
-
-
-
-
(2
,167
)
- -
Ce
ll 4
2,17
5
-
-
-
-
-
(2
,175
)
- -
Ce
ll 4
(Cap
ping
)73
6
-
-
-
-
-
(736
)
-
-
Supe
r Cel
l-
12
6
-
-
(173
)
-
2,
616
-
2,56
9
Su
per C
ell C
appi
ng-
25
4
-
-
(197
)
-
2,
903
-
2,96
0
Po
st C
losu
re R
ehab
ilita
tion
-
118
-
-
(7
)
-
-
-
11
1
Futu
re R
esto
ratio
n Co
sts
1,64
4
13
1
-
-
(111
)
-
-
-
1,
664
Wor
k in
Pro
gres
s2,
497
-
-
-
-
-
(2
,019
)
(3
84)
94
TO
TAL P
ROPE
RTY,
PLA
NT &
EQ
UIPM
ENT
14
,461
1,3
43
755
(1
45)
(949
)
-
-
(3
84)
15
,081
Co
mpa
rativ
es
1
6,61
4
3,0
68
39
(
60)
(
784)
-
(
4,41
6)
-
14,
461
This
Note
cont
inue
s on
the
follo
win
g pa
ges.
* W
ork
in P
rgre
ss tr
ansf
er o
f $0.
384
mill
ion
rela
tes t
o as
set c
ontr
ibut
ed to
the
Sout
hern
Rec
yclin
g Ce
ntre
Join
t Ven
ture
.
Tran
sfer
CARR
YING
AM
OUN
T
Note
6 -
PRO
PERT
Y, P
LANT
& E
QUI
PMEN
T
CARR
YING
AM
OUN
TAd
ditio
nsDi
spos
als
Depr
ecia
tion
Impa
irmen
tAd
just
men
ts
CARR
YING
AM
OUN
T M
OVE
MEN
TS D
URIN
G YE
AR$'
000
Pag
e 10
6
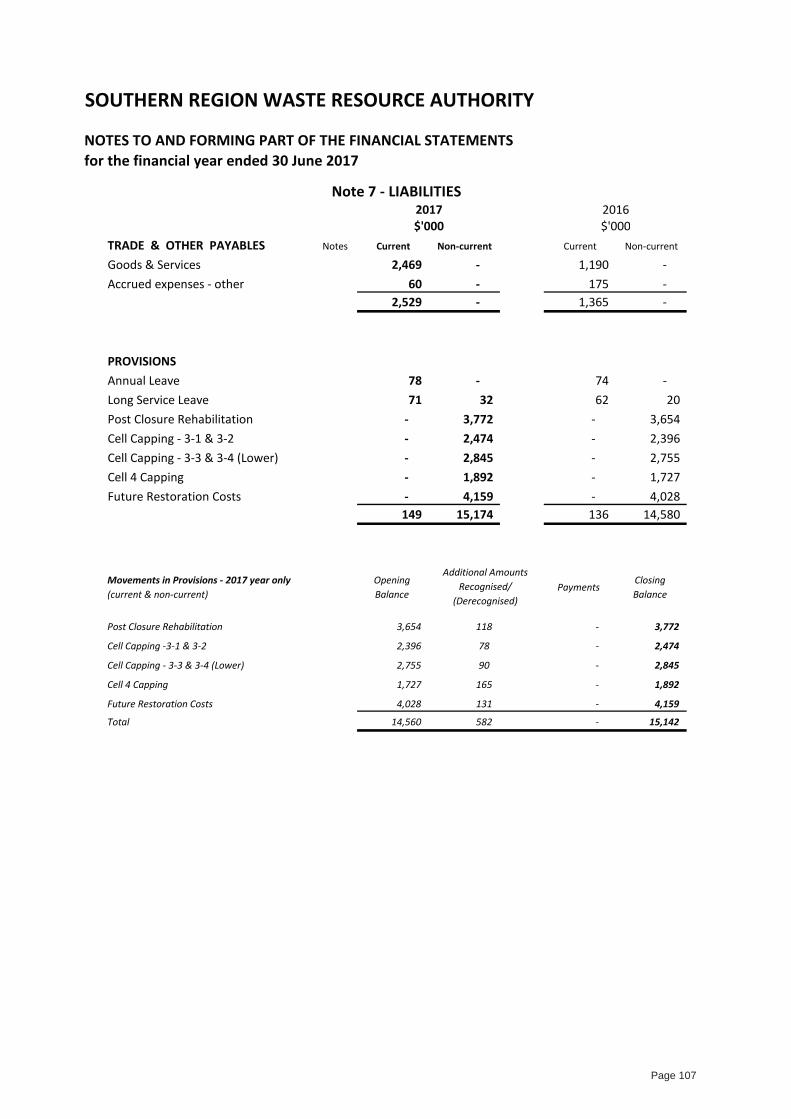
SOUTHERN REGION WASTE RESOURCE AUTHORITY
NOTES TO AND FORMING PART OF THE FINANCIAL STATEMENTSfor the financial year ended 30 June 2017
Note 7 - LIABILITIES2017 2016$'000 $'000
TRADE & OTHER PAYABLES Notes Current Non-current Current Non-current
Goods & Services 2,469 - 1,190 - Accrued expenses - other 60 - 175 -
2,529 - 1,365 -
PROVISIONSAnnual Leave 78 - 74 - Long Service Leave 71 32 62 20 Post Closure Rehabilitation - 3,772 - 3,654 Cell Capping - 3-1 & 3-2 - 2,474 - 2,396 Cell Capping - 3-3 & 3-4 (Lower) - 2,845 - 2,755 Cell 4 Capping - 1,892 - 1,727 Future Restoration Costs - 4,159 - 4,028
149 15,174 136 14,580
Movements in Provisions - 2017 year only(current & non-current)
Opening Balance
PaymentsClosing Balance
Post Closure Rehabilitation 3,654 - 3,772
Cell Capping -3-1 & 3-2 2,396 - 2,474
Cell Capping - 3-3 & 3-4 (Lower) 2,755 - 2,845
Cell 4 Capping 1,727 - 1,892
Future Restoration Costs 4,028 - 4,159
Total 14,560 - 15,142
165
Additional Amounts Recognised/
(Derecognised)
118
78
131
582
90
Page 107
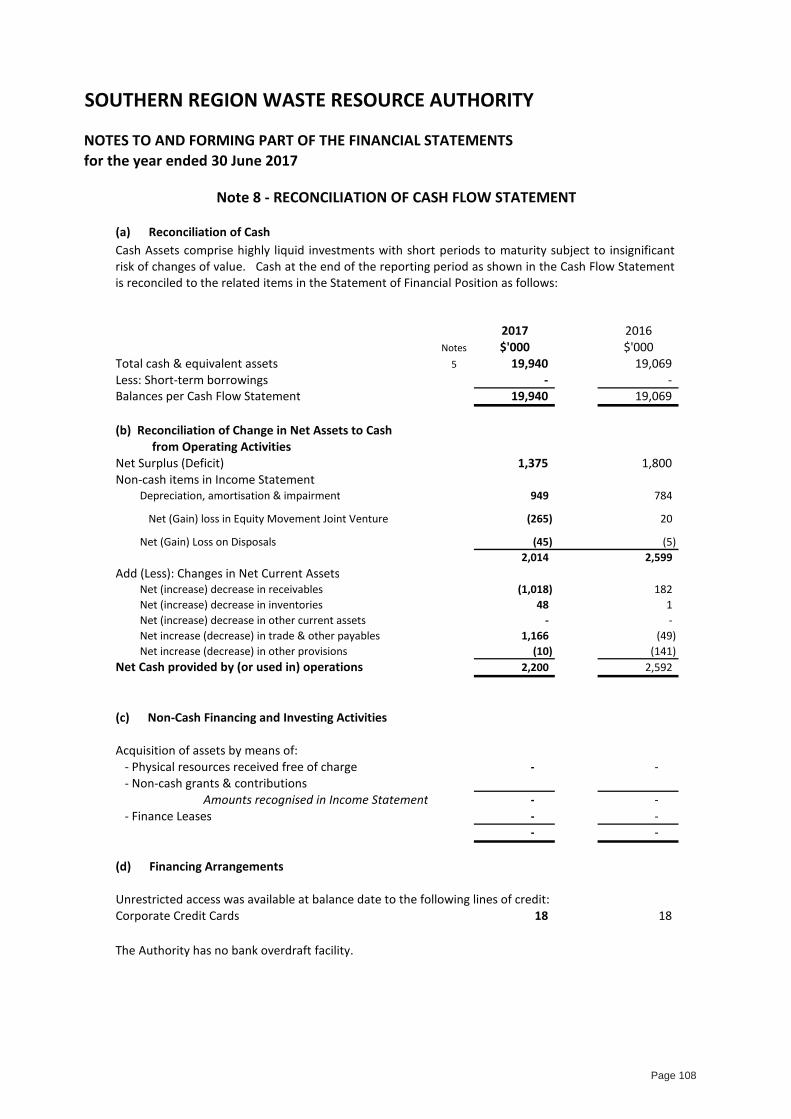
SOUTHERN REGION WASTE RESOURCE AUTHORITY
NOTES TO AND FORMING PART OF THE FINANCIAL STATEMENTSfor the year ended 30 June 2017
Note 8 - RECONCILIATION OF CASH FLOW STATEMENT
(a) Reconciliation of Cash
2017 2016Notes $'000 $'000
Total cash & equivalent assets 5 19,940 19,069 Less: Short-term borrowings - - Balances per Cash Flow Statement 19,940 19,069
(b) Reconciliation of Change in Net Assets to Cash from Operating ActivitiesNet Surplus (Deficit) 1,375 1,800 Non-cash items in Income Statement Depreciation, amortisation & impairment 949 784
Net (Gain) loss in Equity Movement Joint Venture (265) 20
Net (Gain) Loss on Disposals (45) (5) 2,014 2,599
Add (Less): Changes in Net Current Assets Net (increase) decrease in receivables (1,018) 182 Net (increase) decrease in inventories 48 1 Net (increase) decrease in other current assets - - Net increase (decrease) in trade & other payables 1,166 (49) Net increase (decrease) in other provisions (10) (141) Net Cash provided by (or used in) operations 2,200 2,592
(c) Non-Cash Financing and Investing Activities
Acquisition of assets by means of: - Physical resources received free of charge - - - Non-cash grants & contributions
Amounts recognised in Income Statement - - - Finance Leases - -
- -
(d) Financing Arrangements
Unrestricted access was available at balance date to the following lines of credit:Corporate Credit Cards 18 18
Cash Assets comprise highly liquid investments with short periods to maturity subject to insignificantrisk of changes of value. Cash at the end of the reporting period as shown in the Cash Flow Statementis reconciled to the related items in the Statement of Financial Position as follows:
The Authority has no bank overdraft facility.
Page 108

SOUTHERN REGION WASTE RESOURCE AUTHORITY
NOTES TO AND FORMING PART OF THE FINANCIAL STATEMENTSfor the year ended 30 June 2017
Recognised Financial Instruments
Net Fair Value
Receivables - Gate Fees & AssociatedCharges
Accounting Policy: Carried at nominal values less any allowance for doubtful debts. An allowance fordoubtful debts is recognised (and re-assessed annually) when collection in full is no longer probable.
Carrying amount: approximates fair value (after deduction of any allowance).
Carrying amount: approximates fair value.Terms & conditions: Liabilities are normally settled on 30 day terms.
Accounting Policy: Liabilities are recognised for amounts to be paid in the future for goods and servicesreceived, whether or not billed to the Authority.
Liabilities - Creditors and Accruals
Note 9 - FINANCIAL INSTRUMENTS
Terms & conditions: Deposits are returning fixed interest rates of 1.25 - 2.5% (2016: 1.5 - 2.8%). Shortterm deposits have an average maturity of 90 days (2016: 90 days).
Accounting Policy: Carried at lower of cost and net realisable value; Interest is recognised when earned.Bank, Deposits at Call, Short TermDeposits
Carrying amount: approximates fair value due to the short term to maturity.
All carrying values approximate fair value for all recognised financial instruments. There is no recognised market for the financialassets of the Authority.
Risk ExposuresCredit Risk represents the loss that would be recognised if counterparties fail to perform as contracted. The maximum credit risk onfinancial assets of the Authority is the carrying amount, net of any provision for doubtful debts. All investments are made with theSA Local Government Finance Authority and the ANZ Bank. There is no material exposure to any individual debtor.
Market Risk is the risk that fair values of financial assets will fluctuate as a result of changes in market prices. All of the Authority'sfinancial assets are denominated in Australian dollars and are not traded on any market, and hence neither market risk nor currencyrisk apply.
Liquidity Risk is the risk that the Authority will encounter difficulty in meeting obligations with financial liabilities. In accordancewith the model Treasury Policy (LGA Information Paper 15), liabilities have a range of maturity dates based on cash inflows.
Interest Rate Risk is the risk that future cash flows will fluctuate because of changes in market interest rates. Most of theAuthority's financial instruments are at fixed rates. Any such variations in future cash flows will not be material in effect on eitherthe Authority's incomes or expenditures.
Page 109
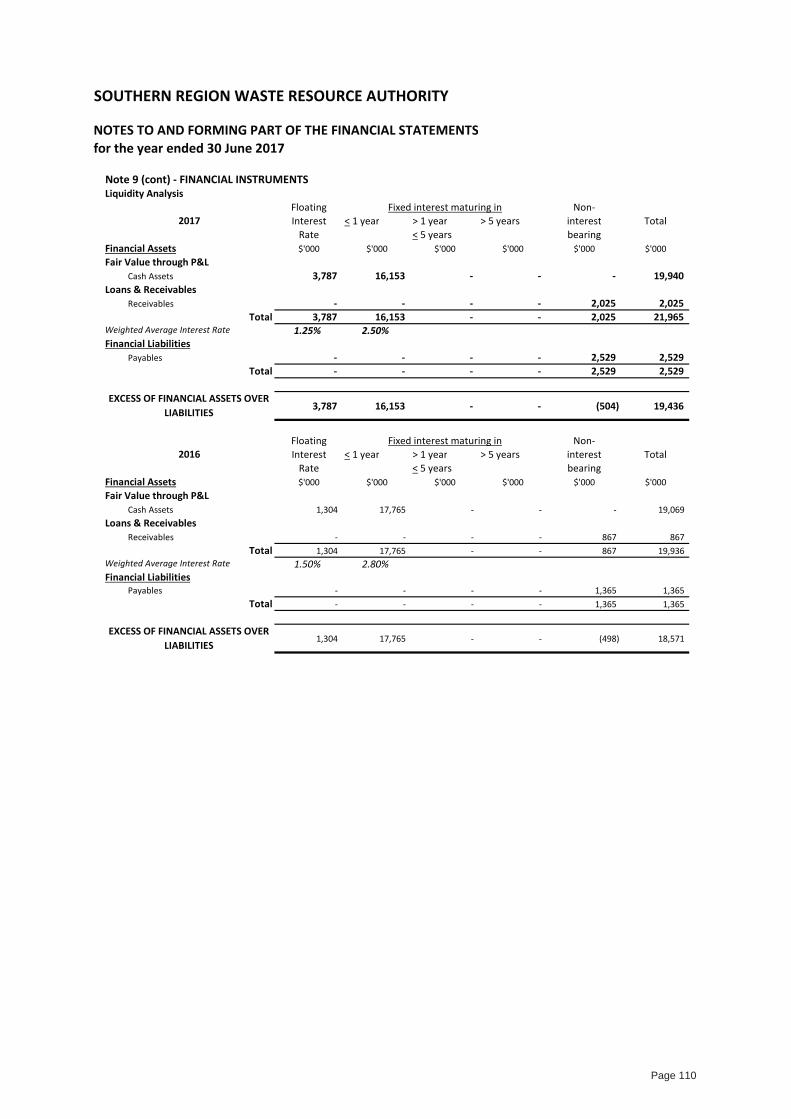
Note 9 (cont) - FINANCIAL INSTRUMENTSLiquidity Analysis
Floating Fixed interest maturing in Non-Interest < 1 year > 1 year > 5 years interest Total
Rate < 5 years bearingFinancial Assets $'000 $'000 $'000 $'000 $'000 $'000Fair Value through P&L
Cash Assets 3,787 16,153 - - - 19,940 Loans & Receivables
Receivables - - - - 2,025 2,025 Total 3,787 16,153 - - 2,025 21,965
1.25% 2.50%Financial Liabilities
Payables - - - - 2,529 2,529 Total - - - - 2,529 2,529
3,787 16,153 - - (504) 19,436
Floating Fixed interest maturing in Non-Interest < 1 year > 1 year > 5 years interest Total
Rate < 5 years bearingFinancial Assets $'000 $'000 $'000 $'000 $'000 $'000Fair Value through P&L
Cash Assets 1,304 17,765 - - - 19,069 Loans & Receivables
Receivables - - - - 867 867 Total 1,304 17,765 - - 867 19,936
1.50% 2.80%Financial Liabilities
Payables - - - - 1,365 1,365 Total - - - - 1,365 1,365
1,304 17,765 - - (498) 18,571
SOUTHERN REGION WASTE RESOURCE AUTHORITY
NOTES TO AND FORMING PART OF THE FINANCIAL STATEMENTSfor the year ended 30 June 2017
EXCESS OF FINANCIAL ASSETS OVER LIABILITIES
2016
Weighted Average Interest Rate
EXCESS OF FINANCIAL ASSETS OVER LIABILITIES
2017
Weighted Average Interest Rate
Page 110
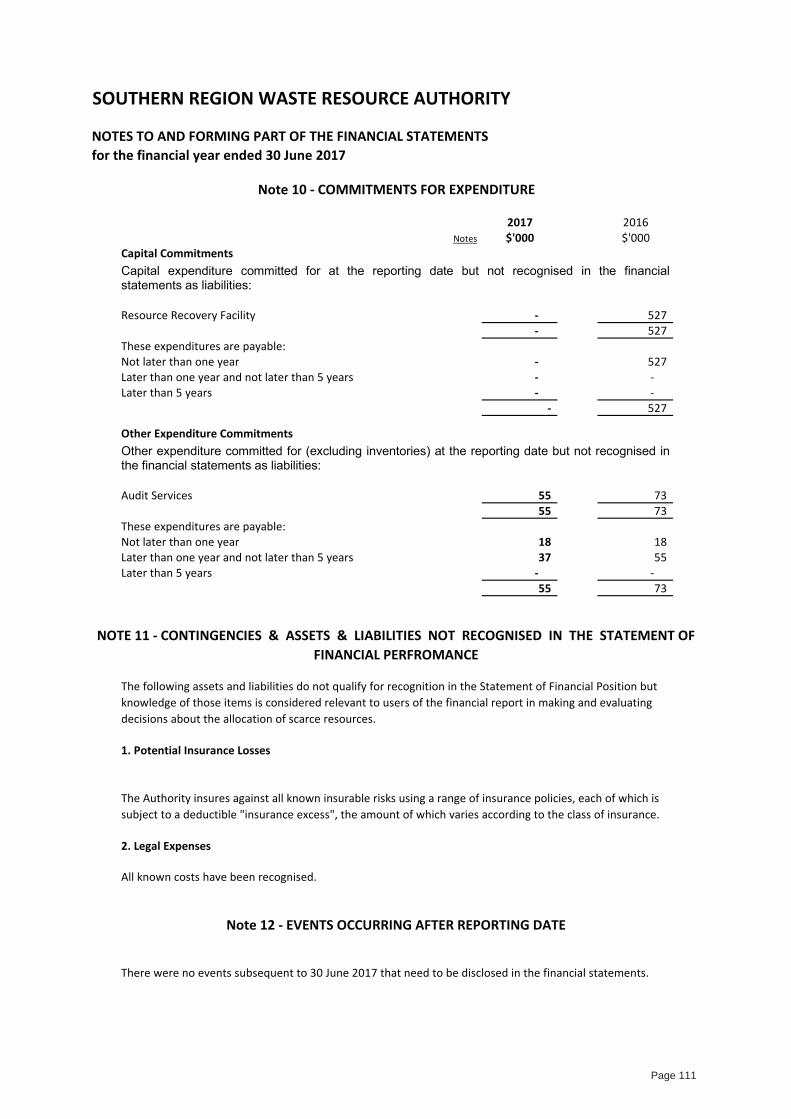
SOUTHERN REGION WASTE RESOURCE AUTHORITY
NOTES TO AND FORMING PART OF THE FINANCIAL STATEMENTSfor the financial year ended 30 June 2017
2017 2016Notes $'000 $'000
Capital Commitments
Resource Recovery Facility - 527 - 527
These expenditures are payable:Not later than one year - 527 Later than one year and not later than 5 years - - Later than 5 years - -
- 527
Other Expenditure Commitments
Audit Services 55 73 55 73
These expenditures are payable:Not later than one year 18 18 Later than one year and not later than 5 years 37 55 Later than 5 years - -
55 73
1. Potential Insurance Losses
2. Legal Expenses
All known costs have been recognised.
There were no events subsequent to 30 June 2017 that need to be disclosed in the financial statements.
Note 12 - EVENTS OCCURRING AFTER REPORTING DATE
Note 10 - COMMITMENTS FOR EXPENDITURE
NOTE 11 - CONTINGENCIES & ASSETS & LIABILITIES NOT RECOGNISED IN THE STATEMENT OF FINANCIAL PERFROMANCE
The following assets and liabilities do not qualify for recognition in the Statement of Financial Position but knowledge of those items is considered relevant to users of the financial report in making and evaluating decisions about the allocation of scarce resources.
The Authority insures against all known insurable risks using a range of insurance policies, each of which is subject to a deductible "insurance excess", the amount of which varies according to the class of insurance.
Capital expenditure committed for at the reporting date but not recognised in the financialstatements as liabilities:
Other expenditure committed for (excluding inventories) at the reporting date but not recognised inthe financial statements as liabilities:
Page 111
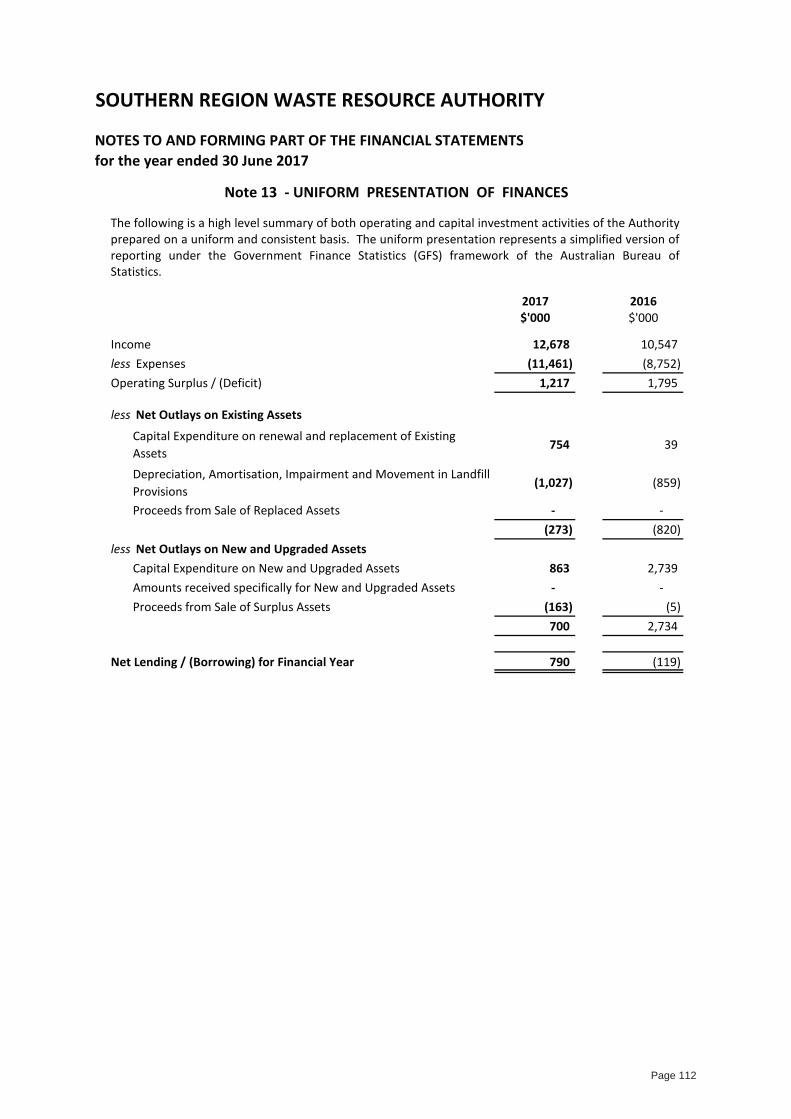
SOUTHERN REGION WASTE RESOURCE AUTHORITY
NOTES TO AND FORMING PART OF THE FINANCIAL STATEMENTSfor the year ended 30 June 2017
2017 2016$'000 $'000
Income 12,678 10,547less Expenses (11,461) (8,752)Operating Surplus / (Deficit) 1,217 1,795
less Net Outlays on Existing AssetsCapital Expenditure on renewal and replacement of Existing Assets 754 39
Depreciation, Amortisation, Impairment and Movement in Landfill Provisions (1,027) (859)
Proceeds from Sale of Replaced Assets - - (273) (820)
less Net Outlays on New and Upgraded Assets Capital Expenditure on New and Upgraded Assets 863 2,739
Amounts received specifically for New and Upgraded Assets - - Proceeds from Sale of Surplus Assets (163) (5)
700 2,734
Net Lending / (Borrowing) for Financial Year 790 (119)
Note 13 - UNIFORM PRESENTATION OF FINANCES
The following is a high level summary of both operating and capital investment activities of the Authorityprepared on a uniform and consistent basis. The uniform presentation represents a simplified version ofreporting under the Government Finance Statistics (GFS) framework of the Australian Bureau ofStatistics.
Page 112
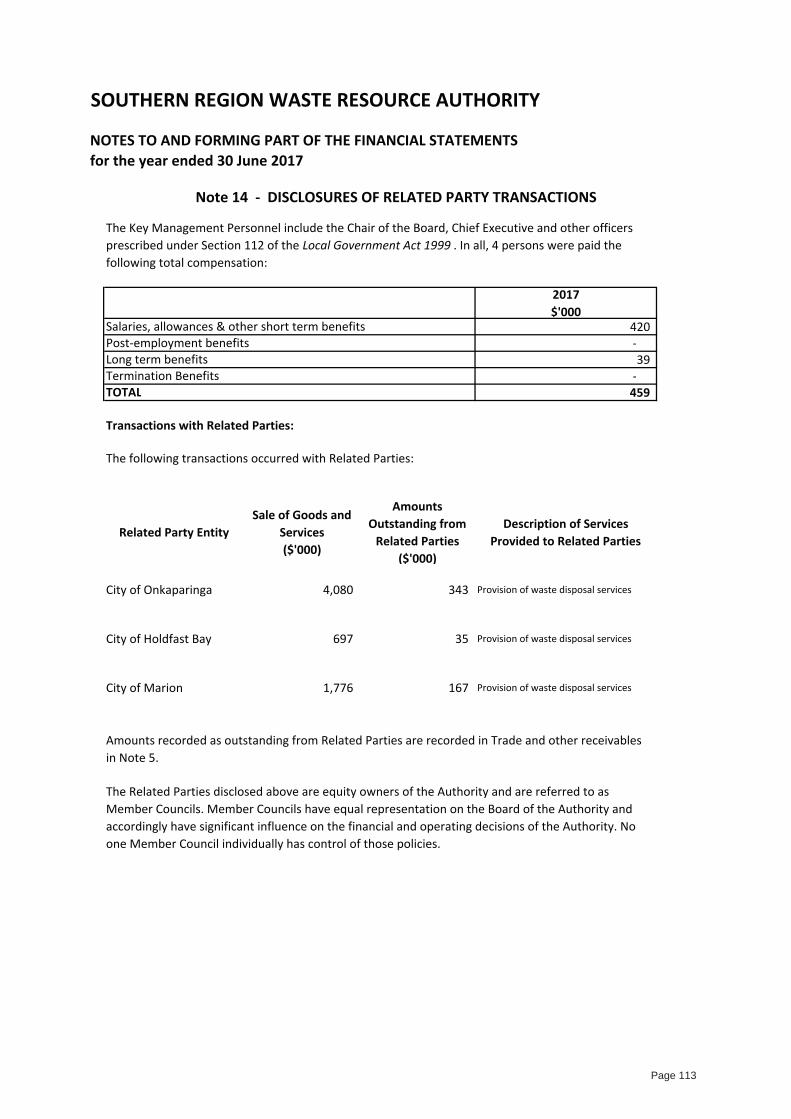
SOUTHERN REGION WASTE RESOURCE AUTHORITY
NOTES TO AND FORMING PART OF THE FINANCIAL STATEMENTSfor the year ended 30 June 2017
2017 $'000
420 - 39
- 459
Transactions with Related Parties:
The following transactions occurred with Related Parties:
Related Party EntitySale of Goods and
Services ($'000)
Amounts Outstanding from
Related Parties ($'000)
Description of Services Provided to Related Parties
City of Onkaparinga 4,080 343 Provision of waste disposal services
City of Holdfast Bay 697 35 Provision of waste disposal services
City of Marion 1,776 167 Provision of waste disposal services
Note 14 - DISCLOSURES OF RELATED PARTY TRANSACTIONS
Amounts recorded as outstanding from Related Parties are recorded in Trade and other receivables in Note 5.
Termination BenefitsTOTAL
The Key Management Personnel include the Chair of the Board, Chief Executive and other officers prescribed under Section 112 of the Local Government Act 1999 . In all, 4 persons were paid the following total compensation:
The Related Parties disclosed above are equity owners of the Authority and are referred to as Member Councils. Member Councils have equal representation on the Board of the Authority and accordingly have significant influence on the financial and operating decisions of the Authority. No one Member Council individually has control of those policies.
Salaries, allowances & other short term benefitsPost-employment benefitsLong term benefits
Page 113
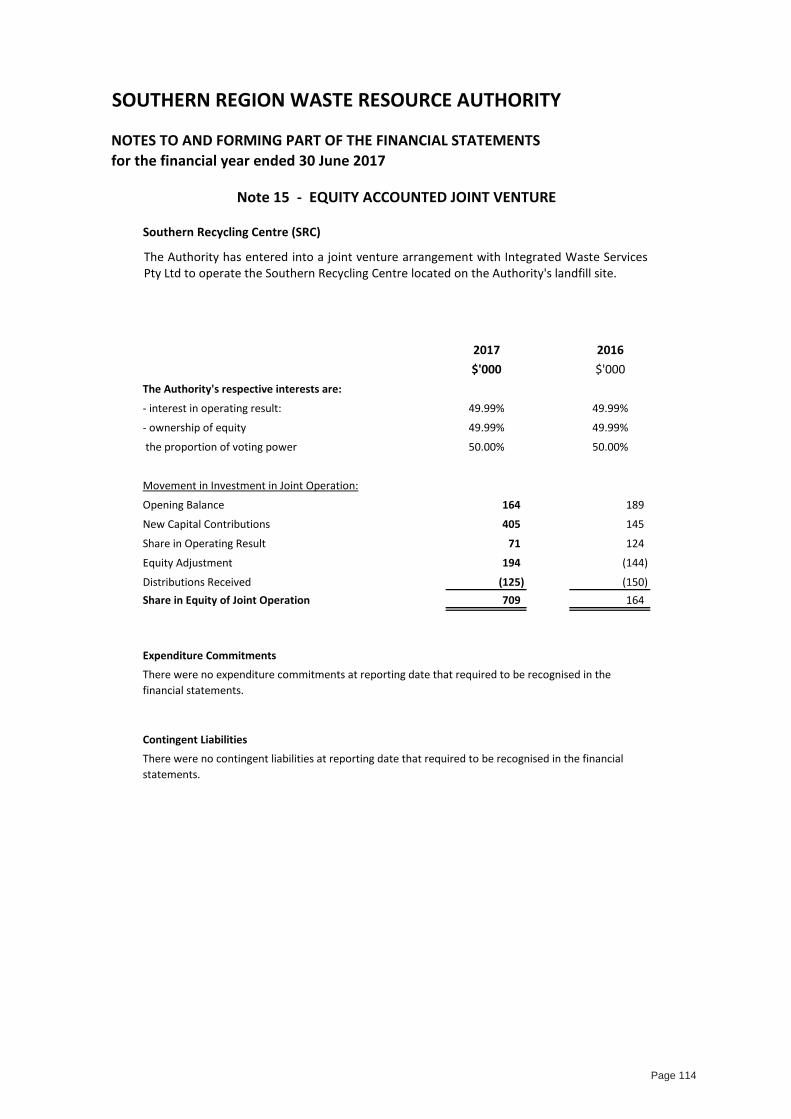
SOUTHERN REGION WASTE RESOURCE AUTHORITY
NOTES TO AND FORMING PART OF THE FINANCIAL STATEMENTSfor the financial year ended 30 June 2017
Southern Recycling Centre (SRC)
2017 2016$'000 $'000
The Authority's respective interests are:- interest in operating result: 49.99% 49.99%- ownership of equity 49.99% 49.99% the proportion of voting power 50.00% 50.00%
Movement in Investment in Joint Operation:Opening Balance 164 189 New Capital Contributions 405 145 Share in Operating Result 71 124 Equity Adjustment 194 (144) Distributions Received (125) (150) Share in Equity of Joint Operation 709 164
Expenditure Commitments
Contingent Liabilities
Note 15 - EQUITY ACCOUNTED JOINT VENTURE
There were no expenditure commitments at reporting date that required to be recognised in the financial statements.
There were no contingent liabilities at reporting date that required to be recognised in the financial statements.
The Authority has entered into a joint venture arrangement with Integrated Waste ServicesPty Ltd to operate the Southern Recycling Centre located on the Authority's landfill site.
Page 114

SOUTHERN REGION WASTE RESOURCE AUTHORITY NOTES TO AND FORMING PART OF THE FINANCIAL STATEMENTS for the year ended 30 June 2017
Note 16 - FAIR VALUE MEASUREMENTS The Authority measures and recognises the following assets at fair value on a recurring basis after initial recognition:
– Land assets.
The Authority does not subsequently measure any liabilities at fair value on a recurring basis, or any assets or liabilities at fair value on a non-recurring basis.
(a) Fair value hierarchy
AASB 13: Fair Value Measurement requires the disclosure of fair value information according to the relevant level in the fair value hierarchy. This hierarchy categorises fair value measurements into one of three possible levels based on the lowest level that a significant input can be categorised into. The levels are outlined below:
Level 1 Level 2 Level 3
Measurements based on quoted prices (unadjusted) in active markets for identical assets or liabilities that the entity can access at the measurement date.
Measurements based on inputs other than quoted prices included in Level 1 that are observable for the asset or liability, either directly or indirectly.
Measurements based on unobservable inputs for the asset or liability.
The fair value of assets and liabilities that are not traded in an active market is determined using one or more valuation techniques. These valuation techniques maximise, to the extent possible, the use of observable market data. If all significant inputs required to measure fair value are observable, the asset or liability is included in Level 2. If one or more significant inputs are not based on observable market data, the asset or liability is included in Level 3.
Valuation techniques
The Authority selects valuation techniques that are appropriate in the circumstances and for which sufficient data is available to measure fair value. The availability of sufficient and relevant data primarily depends on the specific characteristics of the asset or liability being measured. The valuation techniques selected by the association are consistent with one or more of the following valuation approaches:
– Market approach: uses prices and other relevant information generated by market transactions involving identical or similar assets or liabilities.
– Income approach: converts estimated future cash flows or income and expenses into a single current (i.e. discounted) value.
– Cost approach: reflects the current replacement cost of an asset at its current service capacity.
Each valuation technique requires inputs that reflect the assumptions that buyers and sellers would use when pricing the asset or liability, including assumptions about risks. When selecting a valuation technique, the Authority gives priority to those techniques that maximise the use of observable inputs and minimise the use of unobservable inputs. Inputs that are developed using market data (such as publicly available information on actual transactions) and reflect the assumptions that buyers and sellers would generally use when pricing the asset or liability are considered observable, whereas inputs for which market data are not available and therefore are developed using the best information available about such assumptions are considered unobservable.
Page 115
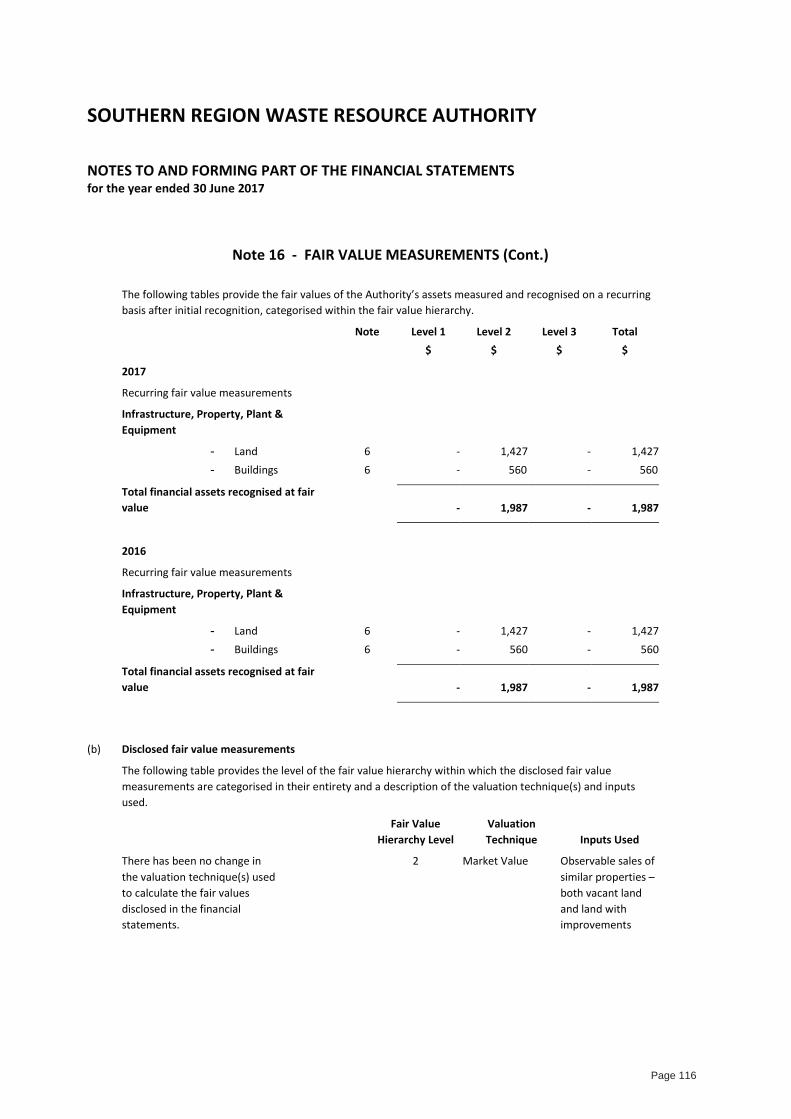
SOUTHERN REGION WASTE RESOURCE AUTHORITY NOTES TO AND FORMING PART OF THE FINANCIAL STATEMENTS for the year ended 30 June 2017
Note 16 - FAIR VALUE MEASUREMENTS (Cont.)
The following tables provide the fair values of the Authority’s assets measured and recognised on a recurring basis after initial recognition, categorised within the fair value hierarchy.
Note Level 1 $
Level 2 $
Level 3 $
Total $
2017
Recurring fair value measurements
Infrastructure, Property, Plant & Equipment
- Land - Buildings
6 6
--
1,427 560
- -
1,427560
Total financial assets recognised at fair value - 1,987 - 1,987
2016
Recurring fair value measurements
Infrastructure, Property, Plant & Equipment
- Land - Buildings
6 6
--
1,427 560
- -
1,427560
Total financial assets recognised at fair value - 1,987 - 1,987
(b) Disclosed fair value measurements
The following table provides the level of the fair value hierarchy within which the disclosed fair value measurements are categorised in their entirety and a description of the valuation technique(s) and inputs used.
Fair Value Hierarchy Level
Valuation Technique Inputs Used
There has been no change in the valuation technique(s) used to calculate the fair values disclosed in the financial statements.
2 Market Value Observable sales of similar properties – both vacant land and land with improvements
Page 116
SOUTHERN REGION WASTE RESOURCE AUTHORITY GENERAL PURPOSE FINANCIAL STATEMENTS For the year ended 30 June 2017 Statement by Auditor I confirm that, for the audit of the financial statements of the Southern Region Waste Resource Authority for the year ended 30 June 2017, I have maintained my independence in accordance with the requirements of APES 110 – Code of Ethics for Professional Accountants, Section 290, published by the Accounting Professional and Ethical Standards Board, in accordance with the Local Government Act 1999 and the Local Government (Financial Management) Regulations 2011 made under that Act. This statement is prepared in accordance with the requirements of Regulation 22 (5) Local Government (Financial Management) Regulation 2011. GALPINS ACCOUNTANTS, AUDITORS & BUSINESS CONSULTANTS Luke Williams CPA Registered Company Auditor Partner 31 / 08 / 2017
Page 117
INDEPENDENT AUDITOR'S REPORT To the members of the Southern Region Waste Resource Authority Report on the Audit of the Financial Report Opinion We have audited the accompanying financial report of the Southern Region Waste Resource Authority (“the Authority”), which comprises the balance sheet as at 30 June 2017, the statement of comprehensive income, statement of changes in equity and cash flow statement for the year then ended, notes comprising a summary of significant accounting policies and other explanatory information and the statement by the Executive Officer and the Chairman. In our opinion, the accompanying financial report presents fairly, in all material aspects, the financial position of the Authority as at 30 June 2017, and its financial performance and its cash flows for the year then ended in accordance with the Australian Accounting Standards, Local Government Act 1999 and Local Government (Financial Management) Regulations 2011. Basis for Opinion We conducted our audit in accordance with Australian Auditing Standards. Our responsibilities under those standards are further described in the Auditor’s Responsibilities for the Audit of the Financial Report section of our report. We are independent of the entity in accordance with the ethical requirements of the Accounting Professional and Ethical Standards Board’s APES 110 Code of Ethics for Professional Accountants (the Code) that are relevant to our audit of the financial report in Australia. We have also fulfilled our ethical responsibilities in accordance with the Code. We believe that the audit evidence we have obtained is sufficient and appropriate to provide a basis for our opinion. Responsibility for the Financial Report The Authority is responsible for the preparation and fair presentation of the financial report in accordance with Australian Accounting Standards (including the Australian Accounting Interpretations), the Local Government Act 1999 and the Local Government (Financial Management) Regulations 2011 and for such internal control as the Authority determines is necessary to enable the preparation of the financial report that is free from material misstatement, whether due to fraud or error. In preparing the financial report, the Authority is responsible for assessing the Authority’s ability to continue as a going concern, disclosing, as applicable, matters relating to going concern and using the going concern basis of accounting unless management either intends to liquidate the entity or to cease operations, or has no realistic alternative but to do so. Those charged with governance are responsible for overseeing the Authority’s financial reporting process.
Page 118
Auditor's Responsibility for the Audit of the Financial Report Our objectives are to obtain reasonable assurance about whether the financial report as a whole is free from material misstatement, whether due to fraud or error, and to issue an auditor’s report that includes our opinion. Reasonable assurance is a high level of assurance, but is not a guarantee that an audit conducted in accordance with Australian Auditing Standards will always detect a material misstatement when it exists. Misstatements can arise from fraud or error and are considered material if, individually or in the aggregate, they could reasonably be expected to influence the economic decisions of users taken on the basis of this financial report. As part of an audit in accordance with Australian Auditing Standards, we exercise professional judgement and maintain professional scepticism throughout the audit. We also:
Identify and assess the risks of material misstatement of the financial report, whether due to fraud or error, design and perform audit procedures responsive to those risks, and obtain audit evidence that is sufficient and appropriate to provide a basis for our opinion. The risk of not detecting a material misstatement resulting from fraud is higher than for one resulting from error, as fraud may involve collusion, forgery, intentional omissions, misrepresentations, or the override of internal control.
Obtain an understanding of internal control relevant to audit in order to design audit procedures that are appropriate in the circumstances, but not for the purpose of expressing an opinion on the effectiveness of the entity’s internal control.
Evaluate the appropriateness of accounting policies used and the reasonableness of accounting estimates and related disclosures made by management.
Conclude on the appropriateness of management’s use of the going concern basis of accounting and, based on the audit evidence obtained, whether a material uncertainty exists related to events or conditions that may cast significant doubt on the entity’s ability to continue as a going concern. If we conclude that a material uncertainty exists, we are required to draw attention in our auditor’s report to the related disclosures in the financial report or, if such disclosures are inadequate, to modify our opinion. Our conclusions are based on the audit evidence obtained up to the date of our auditor’s report. However, future events or conditions may cause the entity to cease to continue as a going concern.
We communicate with those charged with governance regarding, among other matters, the planned scope and timing of the audit and significant audit findings, including any significant deficiencies in internal control that we identify during our audit. GALPINS ACCOUNTANTS, AUDITORS & BUSINESS CONSULTANTS Luke Williams CPA Registered Company Auditor Partner 31 / 08 / 2017
Page 119

INDEPENDENT AUDITOR'S REPORT TO THE MEMBERS OF THE
SOUTHERN REGION WASTE RESOURCE AUTHORITY
INDEPENDENT ASSURANCE REPORT ON THE INTERNAL CONTROLS OF THE SOUTHERN REGION WASTE RESOURCE AUTHORITY We have audited the compliance of the Southern Region Waste Resource Authority (“the Authority”) with the requirements of Section 125 of the Local Government Act 1999 in relation only to the Internal Controls established by the Authority to ensure that financial transactions relating to the receipt, expenditure and investment of money, acquisition and disposal of property and incurring of liabilities for the period 1 July 2016 to 30 June 2017 have been conducted properly and in accordance with law. The Authority’s Responsibility for Internal controls The Authority is responsible for implementing and maintaining an adequate system of internal controls, in accordance with Section 125 of the Local Government Act 1999 to ensure that the receipt, expenditure and investment of money, with acquisition and disposal of property, and incurring of liabilities have been conducted properly and in accordance with law. Auditor’s responsibility Our responsibility is to express an opinion on the Authority’s compliance with Section 125 of the Local Government Act 1999 in relation only to the Internal Controls established by the Authority to ensure that financial transactions relating to the receipt, expenditure and investment of money, acquisition and disposal of property and incurring of liabilities have been conducted properly and in accordance with the law, based on our procedures. Our engagement has been conducted in accordance with applicable Australian Standards on Assurance Engagements ASAE 3100 Compliance Engagements, issued by the Australian Auditing and Assurance Standards Board, in order to state whether, in all material respects, the Authority has complied with Section 125 of the Local Government Act 1999 in relation only to the internal controls specified above for the period 1 July 2016 to 30 June 2017. ASAE 3100 also requires us to comply with the relevant ethical requirements of the Australian professional accounting bodies. Our procedures included obtaining an understanding of controls in relation to the receipt, expenditure and investment of money, the acquisition and disposal of property and the incurring of liabilities, evaluating management’s assessment of these controls, assessing the risk that a material weakness exists, and testing and evaluating the design of controls on a sample basis based on the assess risk. Limitation of Use This report has been prepared for the members of the Authority in Accordance with Section 129 of the Local Government Act 1999 in relation to the Internal Controls Specified above. We disclaim any assumption of responsibility for any reliance on this report to any persons or users other than the members of the Authority, or for any purpose other than which it was prepared.
Page 120
Inherent Limitation. Due to the inherent limitations of any compliance procedure, it is possible that fraud, error or non-compliance may occur and not to be detected. An assurance engagement on controls is not designed to detect all instances of controls operating ineffectively as it is not performed continuously throughout the period and the tests performed are on a sample basis. Any projection of the outcome of the evaluation of controls to future periods is subject to the risk that the controls may become inadequate because of changes in conditions, or that the degree of compliance with them may deteriorate.
Independence In conducting our engagement, we have complied with the independence requirements of the Australian professional accounting bodies. Opinion In our opinion, the Authority has complied, in all material respects, with Section 125 of the Local Government Act 1999 in relation to Internal controls established by the Authority relating to the receipt, expenditure and investment of money, acquisition and disposal of property and incurring of liabilities so as to provide reasonable assurance that the financial transactions of the authority have been conducted properly and in accordance with law for the year ended 30 June 2017. GALPINS ACCOUNTANTS, AUDITORS & BUSINESS CONSULTANTS Luke Williams CPA Registered Company Auditor Partner 31 / 08 / 2017
Page 121
Council Solutions Regional AuthorityGeneral Purpose Financial Reports
for the year ending 30 June 2017
TABLE OF CONTENTS
Page
Certification of Financial Statements 2
Principal Financial Statements
Statement of Comprehensive Income 3
Statement of Financial Position 4
Statement of Changes in Equity 5
Statement of Cash Flows 5
Notes to, and forming part of, the Principal Financial Statements
Note 1 - Significant Accounting Policies 6
Note 2 - Income 8
Note 3 - Expenses 8
Note 4 - Current Assets 9
Note 5 - Liabilities 9
Note 6 - Reconciliation to Cash Flow Statement 10
Note 7 - Financial Instruments 11
Note 8 - Related Party Disclosures 12
Council Solutions Regional Authority's Certificate of Audit Independence
Audit Certificate of Audit Independence
Audit Report
Page 122
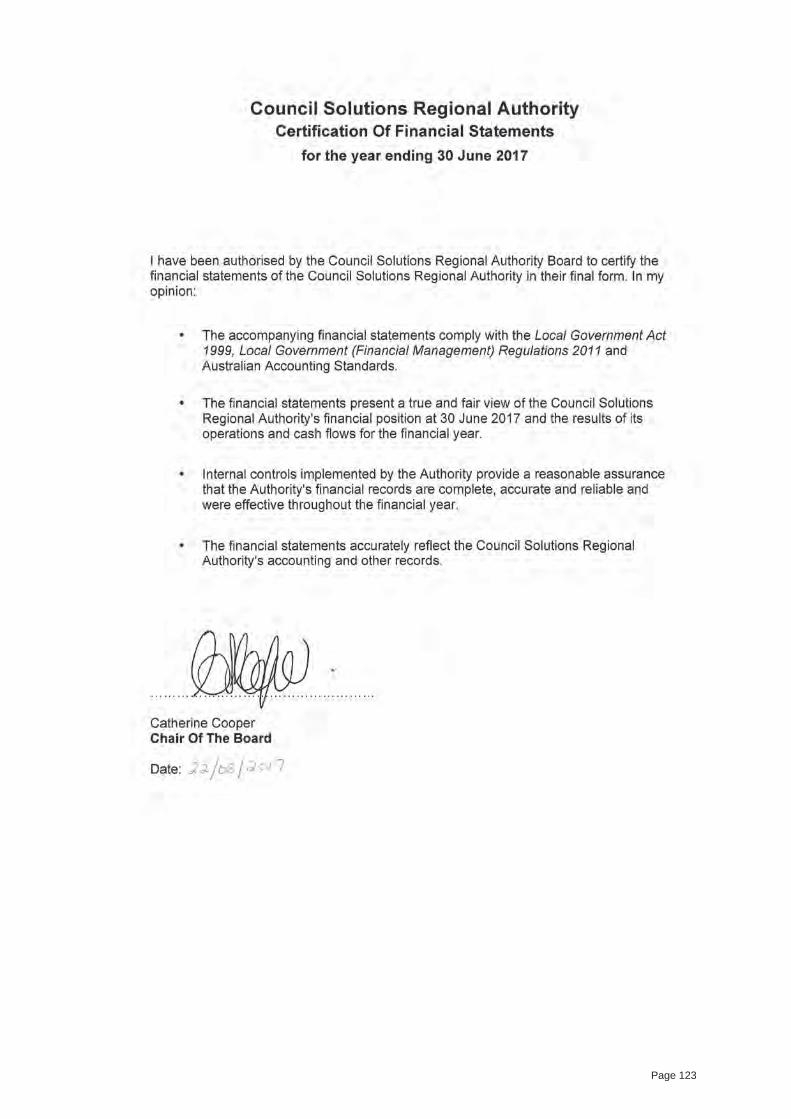
Page 123
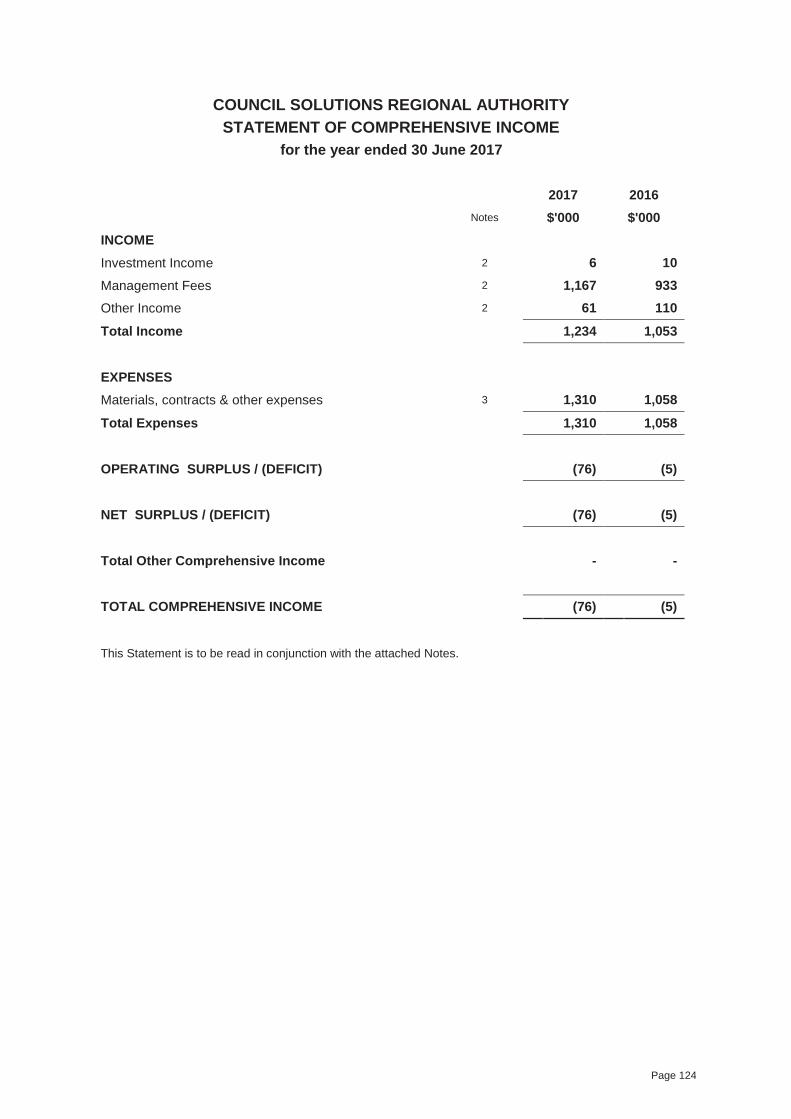
COUNCIL SOLUTIONS REGIONAL AUTHORITYSTATEMENT OF COMPREHENSIVE INCOME
for the year ended 30 June 2017
2017 2016
Notes $'000 $'000
INCOME
Investment Income 2 6 10
Management Fees 2 1,167 933
Other Income 2 61 110
Total Income 1,234 1,053
EXPENSES
Materials, contracts & other expenses 3 1,310 1,058
Total Expenses 1,310 1,058
OPERATING SURPLUS / (DEFICIT) (76) (5)
NET SURPLUS / (DEFICIT) (76) (5)
Total Other Comprehensive Income - -
TOTAL COMPREHENSIVE INCOME (76) (5)
This Statement is to be read in conjunction with the attached Notes.
Page 124
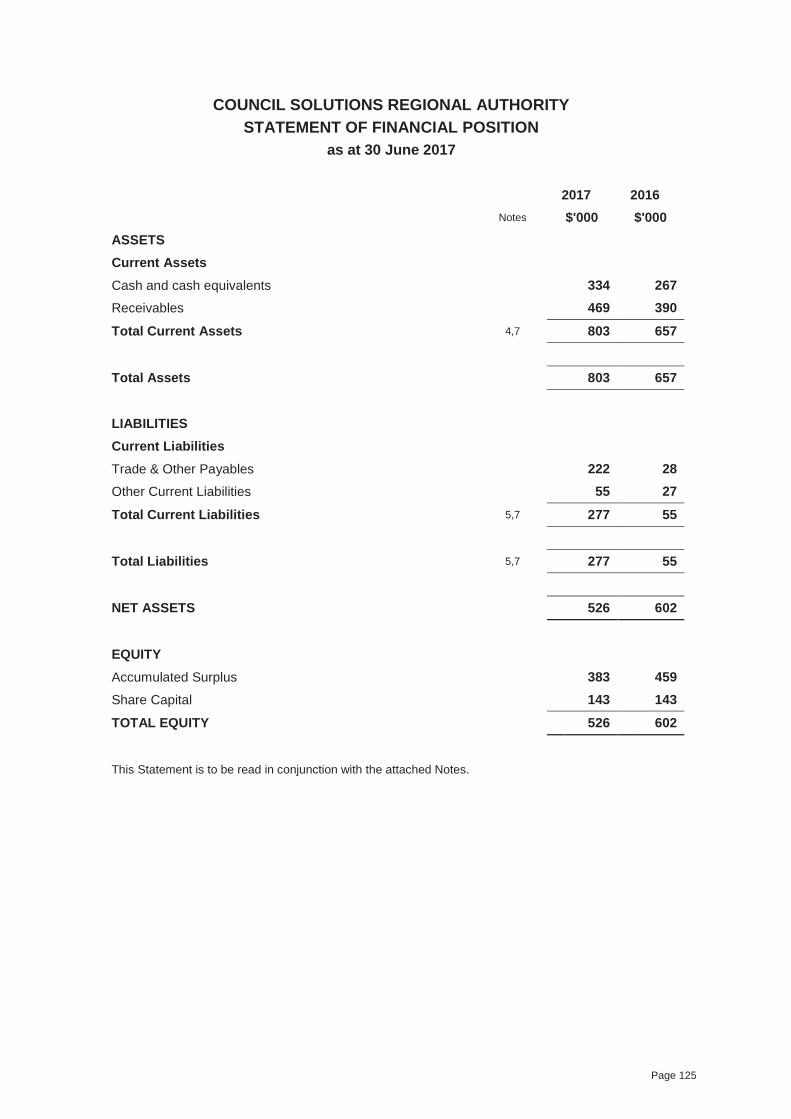
COUNCIL SOLUTIONS REGIONAL AUTHORITYSTATEMENT OF FINANCIAL POSITION
as at 30 June 2017
2017 2016
Notes $'000 $'000
ASSETS
Current Assets
Cash and cash equivalents 334 267
Receivables 469 390
Total Current Assets 4,7 803 657
Total Assets 803 657
LIABILITIES
Current Liabilities
Trade & Other Payables 222 28
Other Current Liabilities 55 27
Total Current Liabilities 5,7 277 55
Total Liabilities 5,7 277 55
NET ASSETS 526 602
EQUITY
Accumulated Surplus 383 459
Share Capital 143 143
TOTAL EQUITY 526 602
This Statement is to be read in conjunction with the attached Notes.
Page 125
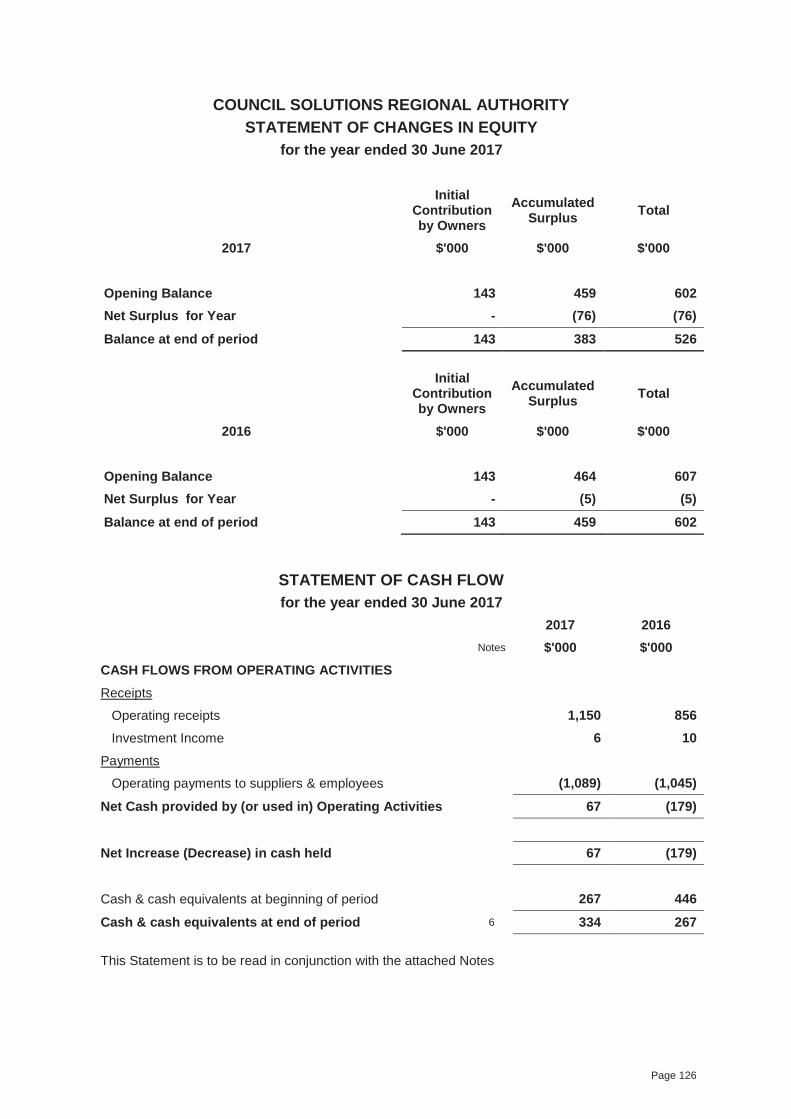
COUNCIL SOLUTIONS REGIONAL AUTHORITYSTATEMENT OF CHANGES IN EQUITY
for the year ended 30 June 2017
Initial Contribution by Owners
Accumulated Surplus Total
2017 $'000 $'000 $'000
Opening Balance 143 459 602
Net Surplus for Year - (76) (76)
Balance at end of period 143 383 526
Initial Contribution by Owners
Accumulated Surplus Total
2016 $'000 $'000 $'000
Opening Balance 143 464 607
Net Surplus for Year - (5) (5)
Balance at end of period 143 459 602
STATEMENT OF CASH FLOW for the year ended 30 June 2017
2017 2016
Notes $'000 $'000
CASH FLOWS FROM OPERATING ACTIVITIES
Receipts
Operating receipts 1,150 856
Investment Income 6 10
Payments
Operating payments to suppliers & employees (1,089) (1,045)
Net Cash provided by (or used in) Operating Activities 67 (179)
Net Increase (Decrease) in cash held 67 (179)
Cash & cash equivalents at beginning of period 267 446
Cash & cash equivalents at end of period 6 334 267
This Statement is to be read in conjunction with the attached Notes
Page 126
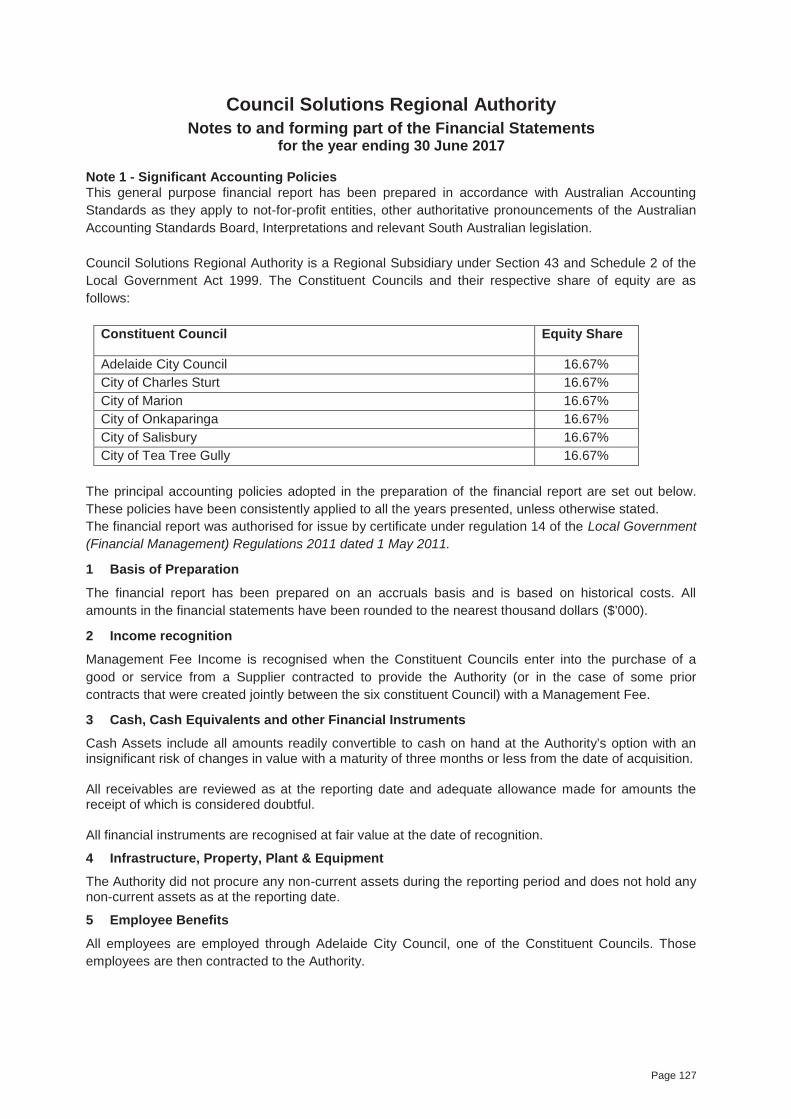
Council Solutions Regional Authority Notes to and forming part of the Financial Statements
for the year ending 30 June 2017
Note 1 - Significant Accounting Policies This general purpose financial report has been prepared in accordance with Australian Accounting Standards as they apply to not-for-profit entities, other authoritative pronouncements of the Australian Accounting Standards Board, Interpretations and relevant South Australian legislation. Council Solutions Regional Authority is a Regional Subsidiary under Section 43 and Schedule 2 of the Local Government Act 1999. The Constituent Councils and their respective share of equity are as follows:
Constituent Council Equity Share
Adelaide City Council 16.67% City of Charles Sturt 16.67% City of Marion 16.67% City of Onkaparinga 16.67% City of Salisbury 16.67% City of Tea Tree Gully 16.67%
The principal accounting policies adopted in the preparation of the financial report are set out below. These policies have been consistently applied to all the years presented, unless otherwise stated. The financial report was authorised for issue by certificate under regulation 14 of the Local Government (Financial Management) Regulations 2011 dated 1 May 2011.
1 Basis of Preparation
The financial report has been prepared on an accruals basis and is based on historical costs. All amounts in the financial statements have been rounded to the nearest thousand dollars ($’000).
2 Income recognition
Management Fee Income is recognised when the Constituent Councils enter into the purchase of a good or service from a Supplier contracted to provide the Authority (or in the case of some prior contracts that were created jointly between the six constituent Council) with a Management Fee.
3 Cash, Cash Equivalents and other Financial Instruments
Cash Assets include all amounts readily convertible to cash on hand at the Authority’s option with an insignificant risk of changes in value with a maturity of three months or less from the date of acquisition. All receivables are reviewed as at the reporting date and adequate allowance made for amounts the receipt of which is considered doubtful. All financial instruments are recognised at fair value at the date of recognition.
4 Infrastructure, Property, Plant & Equipment
The Authority did not procure any non-current assets during the reporting period and does not hold any non-current assets as at the reporting date.
5 Employee Benefits
All employees are employed through Adelaide City Council, one of the Constituent Councils. Those employees are then contracted to the Authority.
Page 127
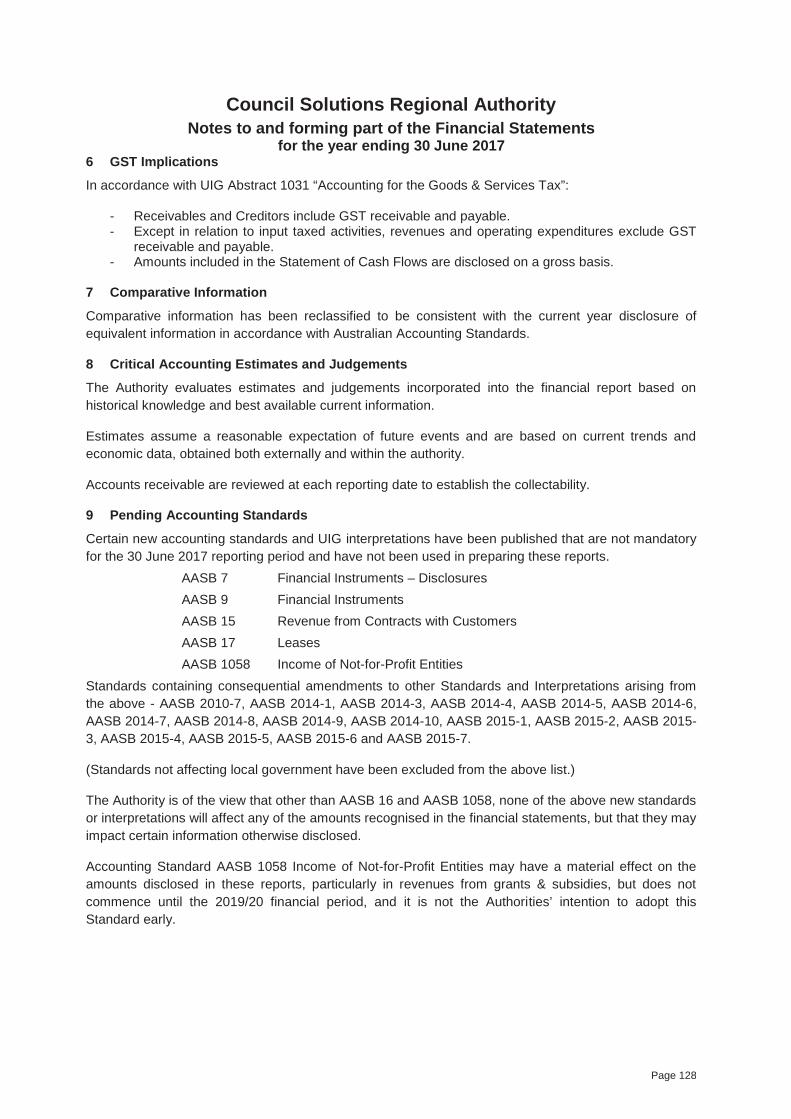
Council Solutions Regional Authority Notes to and forming part of the Financial Statements
for the year ending 30 June 2017 6 GST Implications
In accordance with UIG Abstract 1031 “Accounting for the Goods & Services Tax”:
- Receivables and Creditors include GST receivable and payable. - Except in relation to input taxed activities, revenues and operating expenditures exclude GST
receivable and payable. - Amounts included in the Statement of Cash Flows are disclosed on a gross basis.
7 Comparative Information
Comparative information has been reclassified to be consistent with the current year disclosure of equivalent information in accordance with Australian Accounting Standards.
8 Critical Accounting Estimates and Judgements
The Authority evaluates estimates and judgements incorporated into the financial report based on historical knowledge and best available current information.
Estimates assume a reasonable expectation of future events and are based on current trends and economic data, obtained both externally and within the authority.
Accounts receivable are reviewed at each reporting date to establish the collectability.
9 Pending Accounting Standards
Certain new accounting standards and UIG interpretations have been published that are not mandatory for the 30 June 2017 reporting period and have not been used in preparing these reports. AASB 7 Financial Instruments – Disclosures AASB 9 Financial Instruments AASB 15 Revenue from Contracts with Customers AASB 17 Leases AASB 1058 Income of Not-for-Profit Entities Standards containing consequential amendments to other Standards and Interpretations arising from the above - AASB 2010-7, AASB 2014-1, AASB 2014-3, AASB 2014-4, AASB 2014-5, AASB 2014-6, AASB 2014-7, AASB 2014-8, AASB 2014-9, AASB 2014-10, AASB 2015-1, AASB 2015-2, AASB 2015-3, AASB 2015-4, AASB 2015-5, AASB 2015-6 and AASB 2015-7.
(Standards not affecting local government have been excluded from the above list.)
The Authority is of the view that other than AASB 16 and AASB 1058, none of the above new standards or interpretations will affect any of the amounts recognised in the financial statements, but that they may impact certain information otherwise disclosed.
Accounting Standard AASB 1058 Income of Not-for-Profit Entities may have a material effect on the amounts disclosed in these reports, particularly in revenues from grants & subsidies, but does not commence until the 2019/20 financial period, and it is not the Authorities’ intention to adopt this Standard early.
Page 128
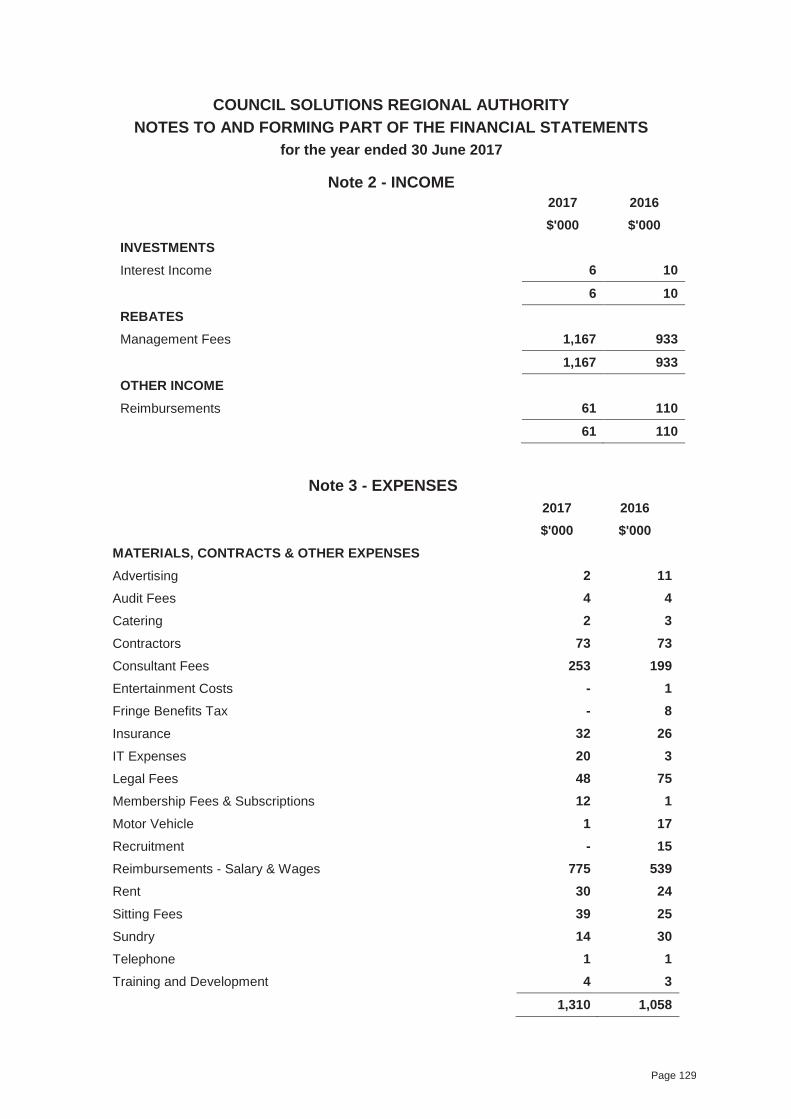
COUNCIL SOLUTIONS REGIONAL AUTHORITYNOTES TO AND FORMING PART OF THE FINANCIAL STATEMENTS
for the year ended 30 June 2017
Note 2 - INCOME
2017 2016
$'000 $'000
INVESTMENTS
Interest Income 6 10
6 10
REBATES
Management Fees 1,167 933
1,167 933
OTHER INCOME
Reimbursements 61 110
61 110
Note 3 - EXPENSES
2017 2016
$'000 $'000
MATERIALS, CONTRACTS & OTHER EXPENSES
Advertising 2 11
Audit Fees 4 4
Catering 2 3
Contractors 73 73
Consultant Fees 253 199
Entertainment Costs - 1
Fringe Benefits Tax - 8
Insurance 32 26
IT Expenses 20 3
Legal Fees 48 75
Membership Fees & Subscriptions 12 1
Motor Vehicle 1 17
Recruitment - 15
Reimbursements - Salary & Wages 775 539
Rent 30 24
Sitting Fees 39 25
Sundry 14 30
Telephone 1 1
Training and Development 4 3
1,310 1,058
Page 129
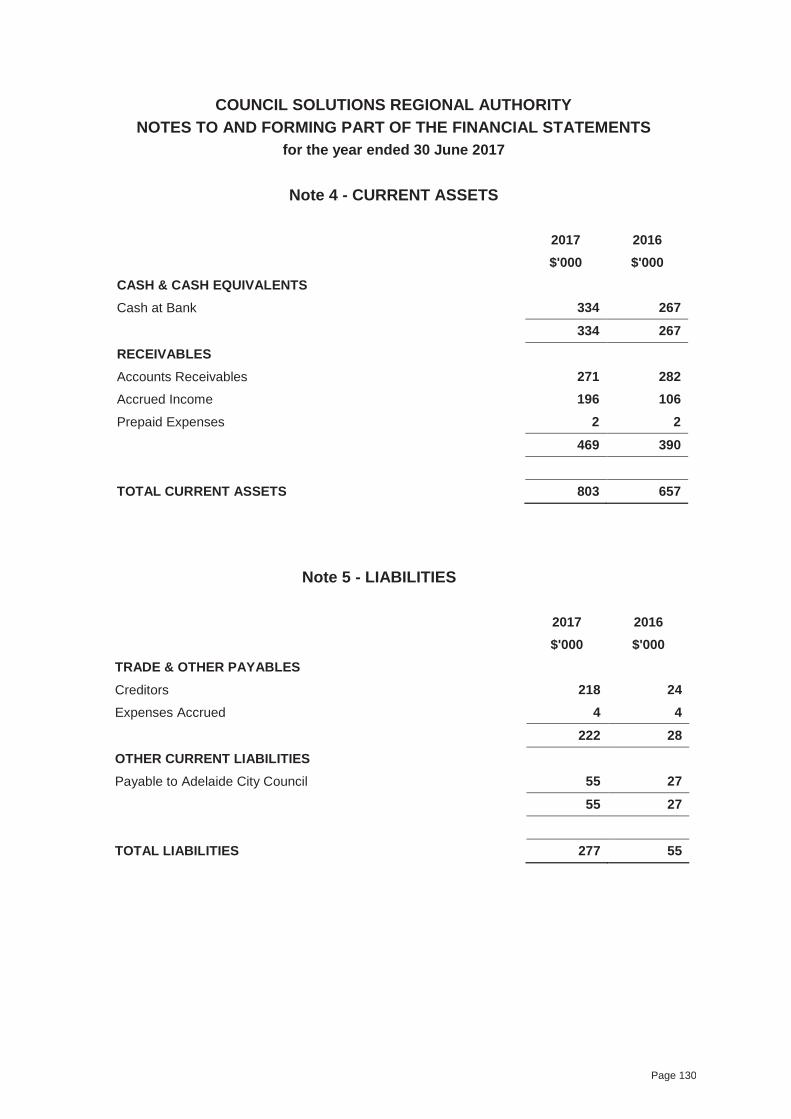
COUNCIL SOLUTIONS REGIONAL AUTHORITYNOTES TO AND FORMING PART OF THE FINANCIAL STATEMENTS
for the year ended 30 June 2017
Note 4 - CURRENT ASSETS
2017 2016
$'000 $'000
CASH & CASH EQUIVALENTS
Cash at Bank 334 267
334 267
RECEIVABLES
Accounts Receivables 271 282
Accrued Income 196 106
Prepaid Expenses 2 2
469 390
TOTAL CURRENT ASSETS 803 657
Note 5 - LIABILITIES
2017 2016
$'000 $'000
TRADE & OTHER PAYABLES
Creditors 218 24
Expenses Accrued 4 4
222 28
OTHER CURRENT LIABILITIES
Payable to Adelaide City Council 55 27
55 27
TOTAL LIABILITIES 277 55
Page 130
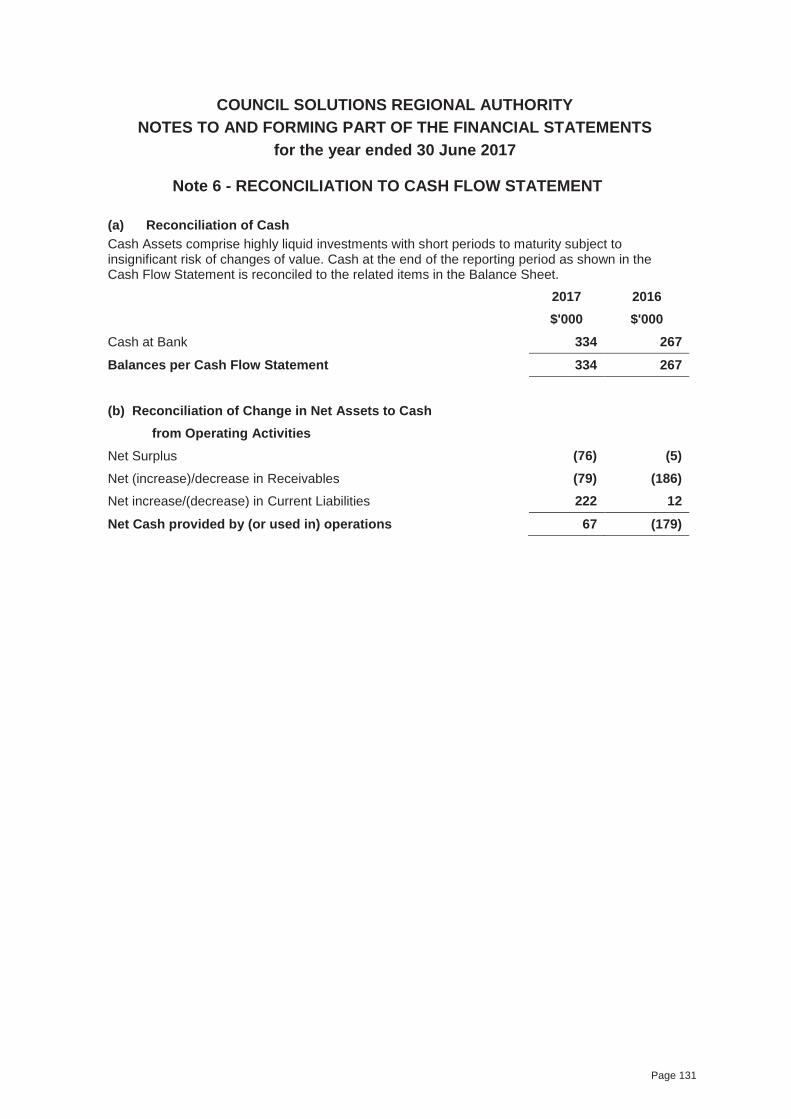
COUNCIL SOLUTIONS REGIONAL AUTHORITYNOTES TO AND FORMING PART OF THE FINANCIAL STATEMENTS
for the year ended 30 June 2017
Note 6 - RECONCILIATION TO CASH FLOW STATEMENT
(a) Reconciliation of Cash
Cash Assets comprise highly liquid investments with short periods to maturity subject to insignificant risk of changes of value. Cash at the end of the reporting period as shown in the Cash Flow Statement is reconciled to the related items in the Balance Sheet.
2017 2016
$'000 $'000
Cash at Bank 334 267
Balances per Cash Flow Statement 334 267
(b) Reconciliation of Change in Net Assets to Cash
from Operating Activities
Net Surplus (76) (5)
Net (increase)/decrease in Receivables (79) (186)
Net increase/(decrease) in Current Liabilities 222 12
Net Cash provided by (or used in) operations 67 (179)
Page 131
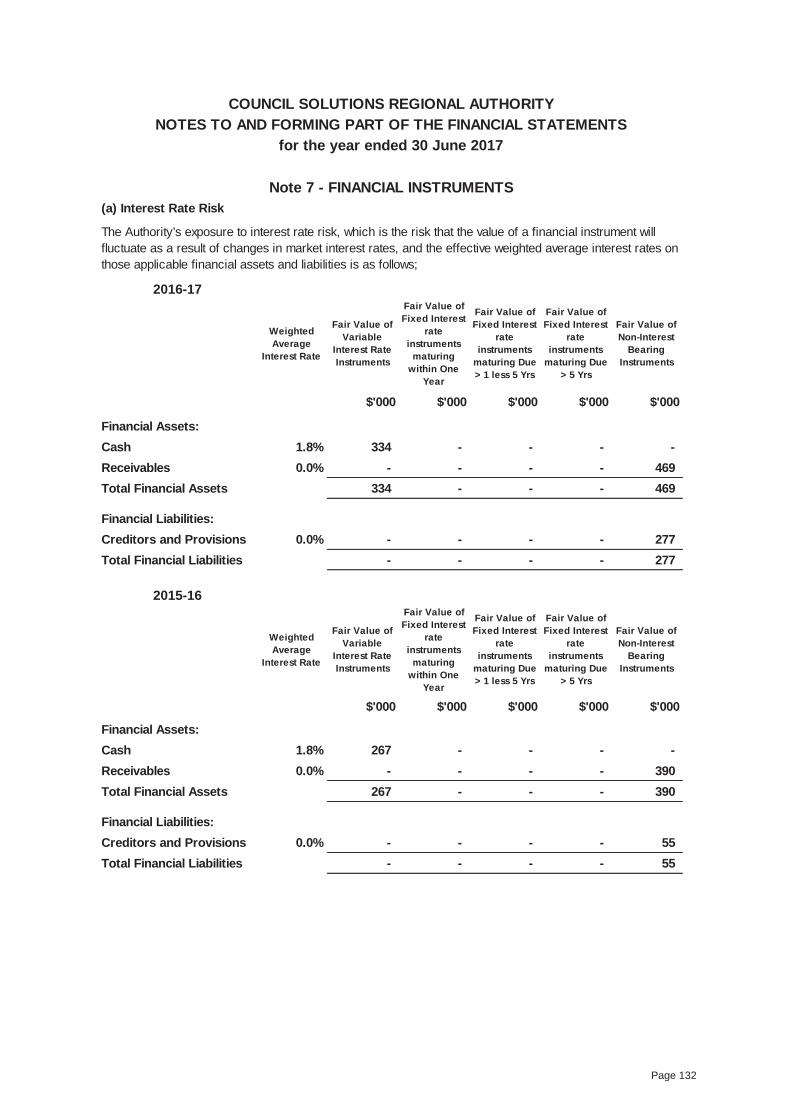
Note 7 - FINANCIAL INSTRUMENTS(a) Interest Rate Risk
2016-17
Weighted Average
Interest Rate
Fair Value of Variable
Interest Rate Instruments
Fair Value of Fixed Interest
rate instruments
maturing within One
Year
Fair Value of Fixed Interest
rate instruments
maturing Due > 1 less 5 Yrs
Fair Value of Fixed Interest
rate instruments
maturing Due > 5 Yrs
Fair Value of Non-Interest
Bearing Instruments
$'000 $'000 $'000 $'000 $'000
Financial Assets:Cash 1.8% 334 - - - -Receivables 0.0% - - - - 469Total Financial Assets 334 - - - 469
Financial Liabilities:Creditors and Provisions 0.0% - - - - 277Total Financial Liabilities - - - - 277
2015-16
Weighted Average
Interest Rate
Fair Value of Variable
Interest Rate Instruments
Fair Value of Fixed Interest
rate instruments
maturing within One
Year
Fair Value of Fixed Interest
rate instruments
maturing Due > 1 less 5 Yrs
Fair Value of Fixed Interest
rate instruments
maturing Due > 5 Yrs
Fair Value of Non-Interest
Bearing Instruments
$'000 $'000 $'000 $'000 $'000
Financial Assets:Cash 1.8% 267 - - - -Receivables 0.0% - - - - 390Total Financial Assets 267 - - - 390
Financial Liabilities:Creditors and Provisions 0.0% - - - - 55Total Financial Liabilities - - - - 55
COUNCIL SOLUTIONS REGIONAL AUTHORITYNOTES TO AND FORMING PART OF THE FINANCIAL STATEMENTS
for the year ended 30 June 2017
The Authority's exposure to interest rate risk, which is the risk that the value of a financial instrument will fluctuate as a result of changes in market interest rates, and the effective weighted average interest rates on those applicable financial assets and liabilities is as follows;
Page 132
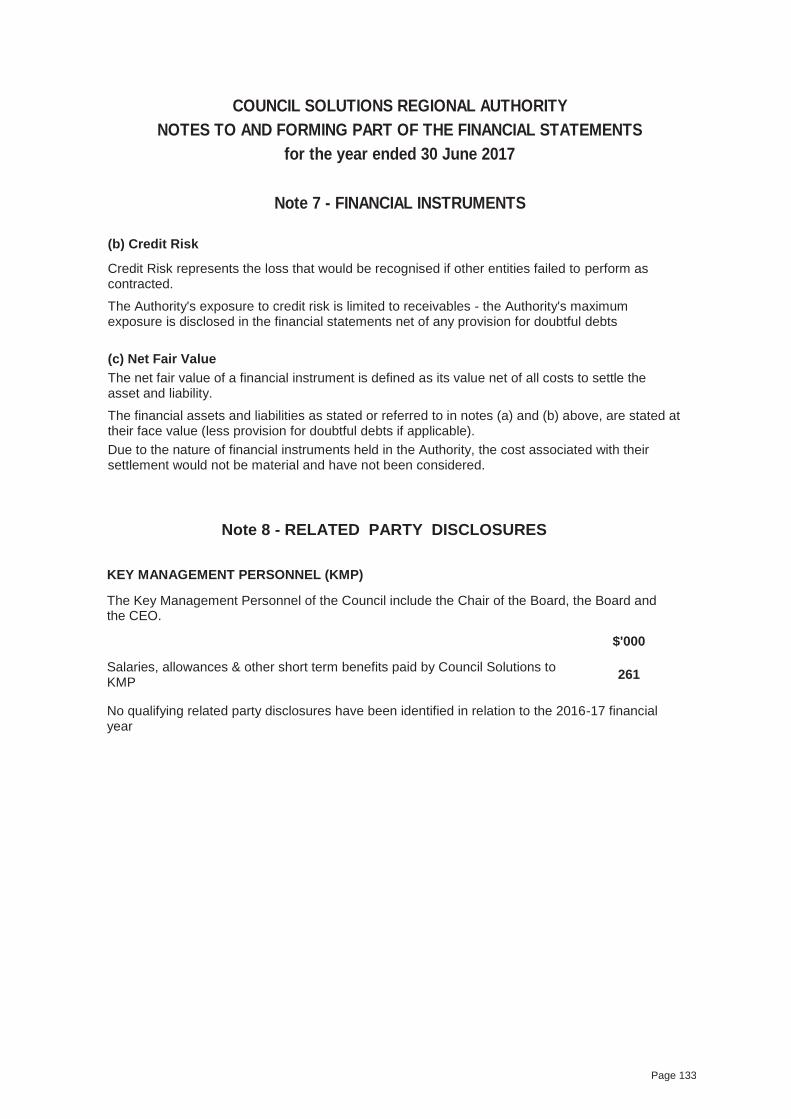
(b) Credit Risk
Credit Risk represents the loss that would be recognised if other entities failed to perform as contracted.
The Authority's exposure to credit risk is limited to receivables - the Authority's maximum exposure is disclosed in the financial statements net of any provision for doubtful debts
(c) Net Fair ValueThe net fair value of a financial instrument is defined as its value net of all costs to settle the asset and liability.
The financial assets and liabilities as stated or referred to in notes (a) and (b) above, are stated at their face value (less provision for doubtful debts if applicable). Due to the nature of financial instruments held in the Authority, the cost associated with their settlement would not be material and have not been considered.
Note 8 - RELATED PARTY DISCLOSURES
KEY MANAGEMENT PERSONNEL (KMP)
The Key Management Personnel of the Council include the Chair of the Board, the Board and the CEO.
$'000
Salaries, allowances & other short term benefits paid by Council Solutions to KMP 261
No qualifying related party disclosures have been identified in relation to the 2016-17 financial year
Note 7 - FINANCIAL INSTRUMENTS
COUNCIL SOLUTIONS REGIONAL AUTHORITYNOTES TO AND FORMING PART OF THE FINANCIAL STATEMENTS
for the year ended 30 June 2017
Page 133
Council Solutions Regional Authority Certification Of Auditor Independence
for the year ending 30 June 2017
To the best of our knowledge and belief, we confirm that, for the purpose of the audit of the Council Solutions Regional Authority for the year ended 30 June 2017, the Council's Auditor, Ian G McDonald, has maintained its independence in accordance with the requirements of the Local Government Act 1999 and the Local Government (Financial Management) Regulations 2011 made under that Act.
This statement is prepared in accordance with the requirements of Regulation 22(3) (b) Local Government (Financial Management) Regul��i_ons 2011.
--c�th�{i&� ........... .CHAIR
· Mark Dowd CHIEF EXECUTIVE OFFICERCity of Onkaparinga
Date: 31 { 8 } 2 o I 7
Darren Birbeck ACTING CHIEF EXECUTIVE OFFICERCity of Charles Sturt
Date: 2 2 / g j l o I 7
ohn Harry CHIEF EXECUTIVE OFFICERCity of Salisbury
Date: �+( t(io CJ
Date: 2 2 / S- / 2 o I 7
Mark Goldstone
F AUDIT COMMITTEE
CHIEF EXECUTIVE OFFICER! City of Adelaide
Date: .2 ( · f '6 I I 7
� . . . . . . ( I
. . · · · · · · · · · · · · . . . . . . . . . . . . . . . . .
Adri�Skull CHl�F EXECUTIVE OFFICERCity of Marion
JU1fl·······�V'lY··,·········........... : ...... .... . John Moyle CHIEF EXECUTIVE OFFICERTea Tree Gully
Date: I I I 'is'\ �o n
Page 134
Ian G McDonald FCA
www.creativeauditing.com.au
Ian 0419 620 906 PO Box 75, Henley Beach SA 5022 Nancy 0408 832 848 [email protected] ABN 13 550 494 869 [email protected]
Council Solutions Regional Authority
ANNUAL FINANCIAL STATEMENTS For the year ended 30 June 2017
STATEMENT BY AUDITOR
We confirm that, for the audit of the financial statements of the Council Solutions Regional Authority for the year ended 30 June 2017, we have maintained our independence in accordance with the requirements of APES 110 – Code of Ethics for Professional Accountants, Section 290, published by the Accounting Professional and Ethical Standards Board, in accordance with the Local Government Act 1999 and the Local Government (Financial Management) Regulations 2011 made under that Act.
This statement is prepared in accordance with the requirements of Regulation 22 (5) Local Government (Financial Management) Regulations 2011.
Ian G McDonald FCA
Dated this 11th day of August 2017
Page 135
Ian G McDonald FCA
www.creativeauditing.com.au
Ian 0419 620 906 PO Box 75, Henley Beach SA 5022 Nancy 0408 832 848 [email protected] ABN 13 550 494 869 [email protected]
Council Solutions Regional AuthorityIndependent Auditor’s Report
We have audited the attached financial statements, being a general purpose financial report, of Council Solutions Regional Authority for the year ended 30 June 2017.
Opinion In our opinion, the financial statements of the Authority are properly drawn up:
a) to present fairly the financial position of the Authority as at the 30 June 2017 and the results of its operations for the period then ended, and;
b) according to Australian Accounting Standards.
Basis for OpinionFor the audit of the Authority we have maintained our independence in accordance with the relevant ethical requirements of APES 110 Section 290. We believe that the audit evidence that we have obtained is sufficient and appropriate to provide a basis for our opinion.
Other Information – Basis of Accounting and Restriction on DistributionWithout modifying our opinion, we draw attention to Note 1 to the financial report, which describes the basis of accounting. The financial report is prepared to assist the authority to meet the requirements of Local Government Act 1999 together with the Local Government (Financial Management Regulations 2011. As a result, the financial report may not be suitable for another purpose. Our report is intended solely for the members.
Responsibilities of Management for the Financial Report The Board of Management is responsible for the preparation of the financial report in accordance with Local Government Act 1999 together with the Local Government (Financial Management Regulations 2011 and for such internal control as management determines is necessary to enable the preparation of a financial report that is free from material misstatement, whether due to fraud or error.
Auditor’s Responsibilities for the Audit of the Financial ReportOur responsibility is to express an opinion on the financial report based on our audit. We conducted our audit in accordance with Australian Auditing Standards. Those standards require that we comply with relevant ethical requirements and plan and perform the audit to obtain reasonable assurance about whether the schedule is free from material misstatement.
An audit involves performing procedures to obtain audit evidence about the amounts and disclosures in the financial report. The procedures selected depend on the auditor's judgment, including the assessment of the risks of material misstatement in the financial report, whether due to fraud or error. In making those risk assessments, the auditor considers internal control relevant to the association's preparation of the financial report in order to design auditprocedures that are appropriate in the circumstances, but not for the purpose of expressing an opinion on the effectiveness of the association's internal control. An audit also includes evaluating the appropriateness of accounting policies used and the reasonableness of accounting estimates made by management, as well as evaluating the overall presentation of the financial report.
We believe that the audit evidence we have obtained is sufficient and appropriate to provide a basis for our audit opinion.
Ian G McDonald FCARegistered Company Auditor
Dated at Grange this 18th day of September 2017
Page 136