cisco ons 15540 espx troubleshooting guide
TRANSCRIPT
Cisco ONS 15540 ESPx Troubleshooting GuideCisco IOS Release 12.2 SVFebruary 2006
Corporate HeadquartersCisco Systems, Inc.170 West Tasman DriveSan Jose, CA 95134-1706 USAhttp://www.cisco.comTel: 408 526-4000
800 553-NETS (6387)Fax: 408 526-4100
Text Part Number: OL-9545-01

THE SPECIFICATIONS AND INFORMATION REGARDING THE PRODUCTS IN THIS MANUAL ARE SUBJECT TO CHANGE WITHOUT NOTICE. ALL STATEMENTS, INFORMATION, AND RECOMMENDATIONS IN THIS MANUAL ARE BELIEVED TO BE ACCURATE BUT ARE PRESENTED WITHOUT WARRANTY OF ANY KIND, EXPRESS OR IMPLIED. USERS MUST TAKE FULL RESPONSIBILITY FOR THEIR APPLICATION OF ANY PRODUCTS.
THE SOFTWARE LICENSE AND LIMITED WARRANTY FOR THE ACCOMPANYING PRODUCT ARE SET FORTH IN THE INFORMATION PACKET THAT SHIPPED WITH THE PRODUCT AND ARE INCORPORATED HEREIN BY THIS REFERENCE. IF YOU ARE UNABLE TO LOCATE THE SOFTWARE LICENSE OR LIMITED WARRANTY, CONTACT YOUR CISCO REPRESENTATIVE FOR A COPY.
The following information is for FCC compliance of Class A devices: This equipment has been tested and found to comply with the limits for a Class A digital device, pursuant to part 15 of the FCC rules. These limits are designed to provide reasonable protection against harmful interference when the equipment is operated in a commercial environment. This equipment generates, uses, and can radiate radio-frequency energy and, if not installed and used in accordance with the instruction manual, may cause harmful interference to radio communications. Operation of this equipment in a residential area is likely to cause harmful interference, in which case users will be required to correct the interference at their own expense.
The following information is for FCC compliance of Class B devices: The equipment described in this manual generates and may radiate radio-frequency energy. If it is not installed in accordance with Cisco’s installation instructions, it may cause interference with radio and television reception. This equipment has been tested and found to comply with the limits for a Class B digital device in accordance with the specifications in part 15 of the FCC rules. These specifications are designed to provide reasonable protection against such interference in a residential installation. However, there is no guarantee that interference will not occur in a particular installation.
Modifying the equipment without Cisco’s written authorization may result in the equipment no longer complying with FCC requirements for Class A or Class B digital devices. In that event, your right to use the equipment may be limited by FCC regulations, and you may be required to correct any interference to radio or television communications at your own expense.
You can determine whether your equipment is causing interference by turning it off. If the interference stops, it was probably caused by the Cisco equipment or one of its peripheral devices. If the equipment causes interference to radio or television reception, try to correct the interference by using one or more of the following measures:
• Turn the television or radio antenna until the interference stops.
• Move the equipment to one side or the other of the television or radio.
• Move the equipment farther away from the television or radio.
• Plug the equipment into an outlet that is on a different circuit from the television or radio. (That is, make certain the equipment and the television or radio are on circuits controlled by different circuit breakers or fuses.)
Modifications to this product not authorized by Cisco Systems, Inc. could void the FCC approval and negate your authority to operate the product.
The Cisco implementation of TCP header compression is an adaptation of a program developed by the University of California, Berkeley (UCB) as part of UCB’s public domain version of the UNIX operating system. All rights reserved. Copyright © 1981, Regents of the University of California.
NOTWITHSTANDING ANY OTHER WARRANTY HEREIN, ALL DOCUMENT FILES AND SOFTWARE OF THESE SUPPLIERS ARE PROVIDED “AS IS” WITH ALL FAULTS. CISCO AND THE ABOVE-NAMED SUPPLIERS DISCLAIM ALL WARRANTIES, EXPRESSED OR IMPLIED, INCLUDING, WITHOUT LIMITATION, THOSE OF MERCHANTABILITY, FITNESS FOR A PARTICULAR PURPOSE AND NONINFRINGEMENT OR ARISING FROM A COURSE OF DEALING, USAGE, OR TRADE PRACTICE.
IN NO EVENT SHALL CISCO OR ITS SUPPLIERS BE LIABLE FOR ANY INDIRECT, SPECIAL, CONSEQUENTIAL, OR INCIDENTAL DAMAGES, INCLUDING, WITHOUT LIMITATION, LOST PROFITS OR LOSS OR DAMAGE TO DATA ARISING OUT OF THE USE OR INABILITY TO USE THIS MANUAL, EVEN IF CISCO OR ITS SUPPLIERS HAVE BEEN ADVISED OF THE POSSIBILITY OF SUCH DAMAGES.
Any Internet Protocol (IP) addresses used in this document are not intended to be actual addresses. Any examples, command display output, and figures included in the document are shown for illustrative purposes only. Any use of actual IP addresses in illustrative content is unintentional and coincidental.
Cisco ONS 15540 ESPx Troubleshooting Guide© 2006 Cisco Systems, Inc. All rights reserved.
CCSP, CCVP, the Cisco Square Bridge logo, Follow Me Browsing, and StackWise are trademarks of Cisco Systems, Inc.; Changing the Way We Work, Live, Play, and Learn, and iQuick Study are service marks of Cisco Systems, Inc.; and Access Registrar, Aironet, BPX, Catalyst, CCDA, CCDP, CCIE, CCIP, CCNA, CCNP, Cisco, the Cisco Certified Internetwork Expert logo, Cisco IOS, Cisco Press, Cisco Systems, Cisco Systems Capital, the Cisco Systems logo, Cisco Unity, Enterprise/Solver, EtherChannel, EtherFast, EtherSwitch, Fast Step, FormShare, GigaDrive, GigaStack, HomeLink, Internet Quotient, IOS, IP/TV, iQ Expertise, the iQ logo, iQ Net Readiness Scorecard, LightStream, Linksys, MeetingPlace, MGX, the Networkers logo, Networking Academy, Network Registrar, Packet, PIX, Post-Routing, Pre-Routing, ProConnect, RateMUX, ScriptShare, SlideCast, SMARTnet, The Fastest Way to Increase Your Internet Quotient, and TransPath are registered trademarks of Cisco Systems, Inc. and/or its affiliates in the United States and certain other countries.
All other trademarks mentioned in this document or Website are the property of their respective owners. The use of the word partner does not imply a partnership relationship between Cisco and any other company. (0601R)
February 2006
C O N T E N T S
Preface xiii
Document Objectives xiii
Audience xiii
Document Organization xiv
Related Documentation xiv
Document Conventions xv
Where to Find Safety and Warning Information xvi
Obtaining Documentation xvi
Cisco.com xvi
Product Documentation DVD xvii
Cisco Optical Networking Product Documentation CD-ROM xvii
Ordering Documentation xvii
Documentation Feedback xvii
Cisco Product Security Overview xviii
Reporting Security Problems in Cisco Products xviii
Obtaining Technical Assistance xix
Cisco Technical Support & Documentation Website xix
Submitting a Service Request xix
Definitions of Service Request Severity xx
Obtaining Additional Publications and Information xx
C H A P T E R 1 Troubleshooting Overview 1-1
1.1 Overview 1-1
1.2 General Model of Problem Solving 1-3
1.3 Maintaining Network Information 1-4
1.4 Network and System Management 1-4
1.4.1 CiscoView 1-4
1.4.2 CTM 1-5
1.4.3 DFM 1-5
1.5 Third-Party Troubleshooting Tools 1-5
1.6 Using General Diagnostic Commands 1-6
1.6.1 show Commands 1-6
1.6.2 debug Commands 1-7
iiiCisco ONS 15540 ESPx Troubleshooting Guide
Contents
1.6.3 ping Command 1-7
1.6.4 traceroute Command 1-8
1.7 Online Diagnostics 1-8
1.7.1 Accessibility Test 1-8
1.7.2 OIR Test 1-9
1.8 Configuring Online Diagnostics 1-9
1.8.1 Displaying the Online Diagnostics Configuration and Results 1-10
1.9 Checking Release Notes for Workarounds 1-12
1.9.1 Using Bug Navigator II 1-12
1.9.2 Checking Cisco IOS Release Notes 1-12
1.10 Initial Troubleshooting Checklist 1-13
C H A P T E R 2 Troubleshooting Processor Card Problems 2-1
2.1 Overview 2-1
2.2 Initial Troubleshooting Checklist 2-2
2.3 Verifying Processor Card Configuration 2-2
2.4 Recovering a Lost Password 2-4
2.5 Verifying NME Interface Configurations 2-5
2.6 Troubleshooting Processor Memory 2-8
2.7 Verifying Hardware and Software Versions 2-8
2.8 Verifying Hardware and Software Compatibility 2-10
2.9 Troubleshooting Redundant Processor Cards 2-13
2.9.1 Verifying Hardware and Software Versions of Redundant Processor Cards 2-14
2.9.2 Verifying Redundant Processor Card Functions 2-15
2.10 Troubleshooting Processor Cards 2-20
2.10.1 Active Processor Card Boot Failure 2-20
2.10.2 Standby Processor Card Boot Failure 2-20
2.10.3 Unable to Access Processor Card Console 2-21
2.10.4 Unable to Access Enable Mode on Active Processor Card 2-21
2.10.5 Unable to Access Enable Mode on Standby Processor Card 2-21
C H A P T E R 3 Troubleshooting Mux/Demux Module Problems 3-1
3.1 Overview 3-1
3.2 Initial Troubleshooting Checklist 3-2
3.3 Troubleshooting Mux/Demux Module Interface Problems 3-2
3.3.1 OSC Wave Interface Down 3-2
3-3
ivCisco ONS 15540 ESPx Troubleshooting Guide
February 2006
Contents
3.3.2 Mux/Demux Module Is Not Recognized 3-3
3.3.3 Mux/Demux Filter Interfaces Are Not Recognized After a Processor Card Switchover 3-3
3.3.4 Mux/Demux Traffic Degrades or Fails 3-4
C H A P T E R 4 Troubleshooting PSM Problems 4-1
4.1 Overview 4-1
4.2 Initial Troubleshooting Checklist 4-1
4.3 Troubleshooting PSM Interface Problems 4-1
4.3.1 Wdmsplit Interface Down 4-2
4-2
4.3.2 Wdmsplit Interface Power Level Indicates Loss of Light 4-2
4.3.3 Wdmsplit Interface Receives Light But End Wave Interface Shows Loss of Light 4-2
4.3.4 Wdm Interface Loses Topology Neighbor Learning Via CDP 4-3
4.3.5 Automatic CDP Learning Is Not Enabled on Wdmsplit Interface 4-3
C H A P T E R 5 Troubleshooting 2.5-Gbps Transponder Module Problems 5-1
5.1 Overview 5-1
5.2 Initial Troubleshooting Checklist 5-2
5.3 Cabling the 2.5-Gbps Transponder Module 5-2
5.3.1 Direct Cabling Using MTP-to-MTP Cables 5-2
5.3.2 Cross Connect Drawer Cabling Using MTP-to-8-MU Cables 5-3
5.4 Troubleshooting 2.5-Gbps Transponder Module Interface Problems 5-4
5.4.1 Transponder Module Not in show hardware Command Output 5-4
5.4.2 Wave Interface Is Down and Shows Loss of Light 5-4
5.4.3 Transparent Interface Is Down and Shows Loss of Light 5-4
5.4.4 Active Wavepatch Interfaces Down Due to Loss of Light 5-5
5-5
5.4.5 Wave Interface Shows Loss of Lock 5-5
5.4.6 Transparent Interface Shows Loss of Lock 5-6
5.4.7 Interface Shows Loss of Sync 5-6
5.4.8 Interface Shows Loss of Frame 5-6
5.4.9 Active Wavepatch Interfaces Down Due to Low Alarm 5-7
5.4.10 Unable to Configure Protocol Encapsulation or Clock Rate 5-7
5.5 Troubleshooting 2.5-Gbps Transponder Module Problems Using Loopbacks 5-7
5.5.1 Physical Fiber Loopbacks 5-8
5.5.2 Client Signal Software Loopbacks 5-8
Procedure: Create a Client Signal Software Loopback 5-9
5.5.3 Trunk Software Loopbacks 5-9
Procedure: Create a Trunk Software Loopback 5-10
vCisco ONS 15540 ESPx Troubleshooting Guide
February 2006
Contents
C H A P T E R 6 Troubleshooting 10-GE Transponder Module Problems 6-1
6.1 Overview 6-1
6.2 Initial Troubleshooting Checklist 6-2
6.3 Cabling the 10-GE Transponder Module 6-3
6.3.1 Direct Cabling Using MTP-to-MTP Cables 6-3
6.3.2 Direct Cabling Using MTP-to-2-MTP Cables 6-4
6.3.3 Cross Connect Drawer Cabling Using MTP-to-4-MU Cables 6-5
6.4 Troubleshooting 10-GE Transponder Module Interface Problems 6-6
6.4.1 Tengigethernetphy Interface Down and Shows Loss of Lock 6-7
6.4.2 Waveethernetphy Interface Down and Shows Loss of Lock 6-8
6.4.3 Waveethernetphy Interface Down and Shows Loss of Sync 6-9
6.4.4 Ethernetdcc Interface Down 6-9
6.4.5 Tengigethernetphy Interface Shows CVRD Errors 6-9
6.4.6 Waveethernetphy Interface Shows CVRD Errors 6-10
6.5 Troubleshooting 10-GE Transponder Module Problems Using Loopbacks 6-10
6.5.1 Physical Fiber Loopbacks 6-11
6.5.2 Client Signal Software Loopbacks 6-11
Procedure: Create a Client Signal Software Loopback 6-12
6.5.3 Trunk Software Loopbacks 6-12
Procedure: Create a Trunk Software Loopback 6-12
C H A P T E R 7 Troubleshooting Threshold Alarm Problems 7-1
7.1 Overview 7-1
7.2 Initial Troubleshooting Checklist 7-1
7.3 Troubleshooting Threshold Alarms 7-1
7.3.1 8b10b CVRD Alarm Indicates Signal Fail or Signal Degrade 7-1
7-2
7.3.2 CDL-HEC Alarm Indicates Signal Fail or Signal Degrade 7-2
7.3.3 64b66b CVRD Alarm Indicates Signal Fail or Signal Degrade 7-2
7.3.4 B1 CVRD Alarm Indicates Signal Fail or Signal Degrade 7-3
7.3.5 Threshold Exceeded Messages Continuously Hitting the Console 7-3
7.3.6 SNMP Traps Are Not Generated 7-3
C H A P T E R 8 Troubleshooting Performance History Counter Problems 8-1
8.1 Overview 8-1
8.2 Initial Troubleshooting Checklist 8-1
8.3 Interpreting Performance History Messages 8-2
8.4 Troubleshooting Performance History Counters 8-2
viCisco ONS 15540 ESPx Troubleshooting Guide
February 2006
Contents
8.4.1 Some Counters Are Not Displayed 8-2
8.4.2 Performance History Counters Are Not Preserved Across CPU Switch Module Switchovers 8-3
C H A P T E R 9 Troubleshooting APS Problems 9-1
9.1 Overview 9-1
9.2 Initial Troubleshooting Checklist 9-1
9.3 Troubleshooting Specific APS Problems 9-2
9.3.1 APS Group State Enabled But Not Associated 9-2
9.3.2 Bidirectional APS Configured But Remote Node Direction, Architecture, and Receive k1/k2 Are Unknown 9-3
9.3.3 Message Channel Interface Up But APS Msg-Channel Status Down 9-3
9.3.4 APS Does Not Switch to Protection Signal When the Working Signal Fails 9-4
9.3.5 Lockout from Protection Request Fails 9-4
9.3.6 Remote Switchover Does Not Occur After Local Switchover 9-5
9.3.7 Manual or Forced Switchover Fails 9-5
9.3.8 APS Group Transmitting k1k2 sf-lp to Peer APS Group 9-6
A P P E N D I X A Technical Support A-1
A.1 Gathering Information About Your Internetwork A-1
A.1.1 Getting the Data from Your System A-2
A.2 Providing Data to Customer Service A-2
IN D E X
viiCisco ONS 15540 ESPx Troubleshooting Guide
February 2006

Contents
viiiCisco ONS 15540 ESPx Troubleshooting Guide
February 2006
F I G U R E S
Figure 1-1 Cisco ONS 15540 ESPx Shelf Layout 1-2
Figure 1-2 General Model of Problem Solving 1-3
Figure 3-1 4- and 8-Channel Mux/Demux Modules with OSC 3-2
Figure 5-1 MTP-to-MTP Cabling Example 5-3
Figure 5-2 Cross Connect Drawer Cabling Using MTP-to-8-MU Cables 5-3
Figure 5-3 Physical Fiber Loopback Examples 5-8
Figure 5-4 Client Signal Loopback Example on a 2.5-Gbps Transponder Module 5-9
Figure 5-5 Trunk Side Loopback Example on a 2.5-Gbps Transponder Module 5-9
Figure 6-1 10-GE Transponder Module Architecture 6-2
Figure 6-2 10-GE Transponder Module and 10-Gbps Splitter Line Card Motherboard Interfaces 6-2
Figure 6-3 MTP-to-MTP Cabling Example 6-4
Figure 6-4 MTP-to-2-MTP Cabling Example 6-5
Figure 6-5 Connecting 10-Gbps Line Card Motherboard to the Cross Connect Drawer 6-6
Figure 6-6 Connecting to Native IEEE 802.3ae 10-GE Interfaces 6-7
Figure 6-7 Connecting to Cisco ONS 15530 Systems 6-7
Figure 6-8 Physical Fiber Loopback Examples 6-11
Figure 6-9 Client Signal Loopback Example on a 10-GE Transponder Module 6-11
Figure 6-10 Trunk Side Loopback Example on a 10-GE Transponder Module 6-12
ixCisco ONS 15540 ESPx Troubleshooting Guide
February 2006

Figures
xCisco ONS 15540 ESPx Troubleshooting Guide
February 2006
T A B L E S
Table 1-1 Useful Diagnostic Commands 1-6
Table 2-1 Active Processor Card Boot Failure 2-20
Table 2-2 Standby Processor Card Boot Failure 2-20
Table 2-3 Unable to Access Switch Module Console 2-21
Table 2-4 Unable to Access Enable Mode 2-21
Table 2-5 Unable to Access Enable Mode on Standby Processor Card 2-22
Table 3-1 OSC Wave Interface Is Down 3-3
Table 3-2 Mux/Demux Module Not Recognized 3-3
Table 3-3 Mux/Demux Channel Interfaces Not Recognized After Switchover 3-3
Table 3-4 Mux/Demux Traffic Degrades or Fails 3-4
Table 4-1 Wdmsplit Interface Is Down 4-2
Table 4-2 Wdmsplit Interface Power Level Indicates Loss of Light 4-2
Table 4-3 Wdmsplit Interface Receives Light But End Wave Interface Shows Loss of Light 4-3
Table 4-4 Wdm Interface Loses Topology Neighbor Learning Via CDP 4-3
Table 4-5 Automatic CDP Learning Is Not Enabled on Wdmsplit Interface 4-3
Table 5-1 Transponder Module Not in show hardware Command Output 5-4
Table 5-2 Wave Interface Is Down and Shows Loss of Light 5-4
Table 5-3 Transparent Interface Down and Shows Loss of Light 5-5
Table 5-4 Wavepatch Interfaces Down Due to Loss of Light 5-5
Table 5-5 Wave Interface Shows Loss of Lock 5-5
Table 5-6 Wave Interface Shows Loss of Lock 5-6
Table 5-7 Interface Shows Loss of Sync 5-6
Table 5-8 Interface Shows Loss of Frame 5-6
Table 5-9 Active and Standby Wavepatch Interfaces Down Due to Low Alarm 5-7
Table 5-10 Protocol Encapsulation or Clock Rate Not Configurable for the Wave Interface 5-7
Table 6-1 Waveethernetphy Interface Down and Shows Loss of Lock 6-8
Table 6-2 Waveethernetphy Interface Down and Shows Loss of Lock 6-8
Table 6-3 Waveethernetphy Interface Down and Shows Loss of Sync 6-9
Table 6-4 Ethernetdcc Interface Down 6-9
Table 6-5 Tengigethernetphy Interface Shows CVRD Errors 6-10
Table 6-6 Waveethernetphy Interface Shows CVRD Errors 6-10
xiCisco ONS 15540 ESPx Troubleshooting Guide
February 2006
Tables
Table 7-1 8b10b CVRD Alarm Indicates Signal Fail or Signal Degrade 7-2
Table 7-2 CDL-HEC Alarm Indicates Signal Fail or Signal Degrade 7-2
Table 7-3 64b66b CVRD Alarm Indicates Signal Fail or Signal Degrade 7-2
Table 7-4 B1 CVRD Alarm Indicates Signal Fail or Signal Degrade 7-3
Table 7-5 Threshold Exceeded Messages Continuously Hitting the Console 7-3
Table 7-6 SNMP Traps Are Not Generated 7-3
Table 8-1 Some Counters Are Not Displayed 8-3
Table 8-2 Performance History Counters Are Not Preserved Across CPU Switch Module Switchovers 8-3
Table 9-1 APS Group State Enabled But Not Associated 9-2
Table 9-2 Bidirectional APS Configured But Remote Node Direction, Architecture, and Receive k1/k2 Are Unknown 9-3
Table 9-3 Message Channel Interface Up But APS msg-channel Status Down 9-3
Table 9-4 APS Does Not Switch to Protection Signal When the Working Signal Fails 9-4
Table 9-5 Lockout from Protection Request Fails 9-5
Table 9-6 Remote Switchover Does Not Occur After Local Switchover 9-5
Table 9-7 Manual or Forced Switchover Fails 9-5
Table 9-8 APS Group Transmitting k1k2 sf-lp to Peer APS Group 9-6
xiiCisco ONS 15540 ESPx Troubleshooting Guide
February 2006
Preface
This section explains the objectives, intended audience, and organization of this publication and describes the conventions that convey instructions and other information.
This section provides the following information:
• Document Objectives
• Audience
• Document Organization
• Related Documentation
• Document Conventions
• Where to Find Safety and Warning Information
• Obtaining Documentation
• Documentation Feedback
• Cisco Product Security Overview
• Obtaining Technical Assistance
• Obtaining Additional Publications and Information
Document ObjectivesThis guide describes how to identify and resolve problems with your Cisco ONS 15540 ESPx. Use this guide in conjunction with the appropriate publications listed in the Related Documentation section.
AudienceTo use this publication, you should be familiar with Cisco or equivalent optical transmission hardware and cabling, telecommunications hardware and cabling, electronic circuitry and wiring practices, and preferably have experience as a telecommunications technician.
xiiiCisco ONS 15540 ESPx Troubleshooting Guide
February 2006
PrefaceDocument Organization
Document OrganizationThe Cisco ONS 15540 Troubleshooting Guide is organized into the following chapters:
• Chapter 1, “Troubleshooting Overview,” provides an overview of the troubleshooting features and functions.
• Chapter 2, “Troubleshooting Processor Card Problems,” describes the troubleshooting procedures used on the processor cards.
• Chapter 3, “Troubleshooting Mux/Demux Module Problems,” describes the troubleshooting procedures used for mux/demux module problems.
• Chapter 4, “Troubleshooting PSM Problems,” describes the troubleshooting procedures used for PSM problems.
• Chapter 5, “Troubleshooting 2.5-Gbps Transponder Module Problems,” describes the troubleshooting procedures used for 2.5-Gbps transponder module problems.
• Chapter 6, “Troubleshooting 10-GE Transponder Module Problems,” describes the troubleshooting procedures used for 10-GE transponder module problems.
• Chapter 7, “Troubleshooting Threshold Alarm Problems,” describes the troubleshooting procedures used for threshold alarm problems.
• Chapter 8, “Troubleshooting Performance History Counter Problems,” describes the troubleshooting procedures used for performance history counter problems.
• Chapter 9, “Troubleshooting APS Problems,” describes the troubleshooting procedures used for APS problems.
• Appendix A, “Technical Support,” describes the process used to contact and provide your technical support representative with the information to resolve your problem.
Related DocumentationUse the Cisco ONS 15540 ESPx Troubleshooting Guide in conjunction with the following referenced publications:
• Cisco ONS 15540 ESPx Planning Guide
Provides detailed information on the Cisco ONS 15540 ESPx architecture and functionality.
• Cisco ONS 15540 ESPx Hardware Installation Guide
Provides detailed information about installing the Cisco ONS 15540 ESPx.
• Cisco ONS 15540 ESPx Cleaning Procedures for Fiber Optic Connections
Provides processes and procedures for cleaning the fiber optic connectors and component interfaces of the Cisco ONS 15540 ESPx.
• Cisco ONS 15540 ESPx Configuration Guide
Provides detailed information about configuring the Cisco ONS 15540 ESPx.
• Cisco ONS 15540 ESPx Command Reference
Provides commands to configure and manage the Cisco ONS 15540 ESPx.
• Cisco ONS 15540 ESPx System Alarms and Error Messages
Describes the system alarms and error messages for the Cisco ONS 15540 ESPx.
xivCisco ONS 15540 ESPx Troubleshooting Guide
February 2006
PrefaceDocument Conventions
• Network Management for the Cisco ONS 15540 ESPx
Provides information on the network management systems that support the Cisco ONS 15540 ESPx.
• Cisco ONS 15540 ESPx TL1 Command Reference
Provides a full TL1 command and autonomous message set including parameters, AIDs, conditions and modifiers for the Cisco ONS 15540 ESPx.
• Regulatory Compliance and Safety Information for the Cisco ONS 15500 Series
Provides the regulatory compliance and safety information for the Cisco ONS 15500 Series.
• MIB Quick Reference for the Cisco ONS 15500 Series
Describes the Management Information Base (MIB) objects and explains how to access Cisco public MIBs for the Cisco ONS 15500 Series.
• Cisco ONS 15540 ESPx Software Upgrade Guide
Describes how to upgrade system images and functional images on the Cisco ONS 15540 ESPx.
• Introduction to DWDM Technology
Provides background information on the dense wavelength division multiplexing (DWDM) technology.
• Cisco IOS Configuration Fundamentals Configuration Guide
Provides useful information on the CLI (command-line interface) and basic shelf management.
Document ConventionsThis publication uses the following conventions:
Convention Application
boldface Commands and keywords in body text.
italic Command input that is supplied by the user.
[ ] Keywords or arguments that appear within square brackets are optional.
{ x | x | x } A choice of keywords (represented by x) appears in braces separated by vertical bars. The user must select one.
Ctrl The control key. For example, where Ctrl + D is written, hold down the Control key while pressing the D key.
screen font Examples of information displayed on the screen.
boldface screen font Examples of information that the user must enter.
< > Command parameters that must be replaced by module-specific codes.
xvCisco ONS 15540 ESPx Troubleshooting Guide
February 2006
PrefaceWhere to Find Safety and Warning Information
Note Means reader take note. Notes contain helpful suggestions or references to material not covered in the document.
Caution Means reader be careful. In this situation, the user might do something that could result in equipment damage or loss of data.
Where to Find Safety and Warning InformationFor safety and warning information, refer to the Cisco Optical Transport Products Safety and Compliance Information document that accompanied the product. This publication describes the international agency compliance and safety information for the Cisco ONS 15xxx systems. It also includes translations of the safety warnings that appear in the ONS 15xxx system documentation.
Obtaining DocumentationCisco documentation and additional literature are available on Cisco.com. Cisco also provides several ways to obtain technical assistance and other technical resources. These sections explain how to obtain technical information from Cisco Systems.
Cisco.comYou can access the most current Cisco documentation at this URL:
http://www.cisco.com/techsupport
You can access the Cisco website at this URL:
http://www.cisco.com
You can access international Cisco websites at this URL:
http://www.cisco.com/public/countries_languages.shtml
Warning IMPORTANT SAFETY INSTRUCTIONS
This warning symbol means danger. You are in a situation that could cause bodily injury. Before you work on any equipment, be aware of the hazards involved with electrical circuitry and be familiar with standard practices for preventing accidents. Use the statement number provided at the end of each warning to locate its translation in the translated safety warnings that accompanied this device. Statement 1071
SAVE THESE INSTRUCTIONS
xviCisco ONS 15540 ESPx Troubleshooting Guide
February 2006
PrefaceDocumentation Feedback
Product Documentation DVDThe Product Documentation DVD is a comprehensive library of technical product documentation on a portable medium. The DVD enables you to access multiple versions of installation, configuration, and command guides for Cisco hardware and software products. With the DVD, you have access to the same HTML documentation that is found on the Cisco website without being connected to the Internet. Certain products also have .PDF versions of the documentation available.
The Product Documentation DVD is available as a single unit or as a subscription. Registered Cisco.com users (Cisco direct customers) can order a Product Documentation DVD (product number DOC-DOCDVD= or DOC-DOCDVD=SUB) from Cisco Marketplace at this URL:
http://www.cisco.com/go/marketplace/
Cisco Optical Networking Product Documentation CD-ROMOptical networking-related documentation, including Cisco ONS 15xxx product documentation, is available in a CD-ROM package that ships with your product. The Optical Networking Product Documentation CD-ROM is updated periodically and may be more current than printed documentation.
Ordering DocumentationRegistered Cisco.com users may order Cisco documentation at the Product Documentation Store in the Cisco Marketplace at this URL:
http://www.cisco.com/go/marketplace/
Nonregistered Cisco.com users can order technical documentation from 8:00 a.m. to 5:00 p.m. (0800 to 1700) PDT by calling 1 866 463-3487 in the United States and Canada, or elsewhere by calling 011 408 519-5055. You can also order documentation by e-mail at [email protected] or by fax at 1 408 519-5001 in the United States and Canada, or elsewhere at 011 408 519-5001.
Documentation FeedbackYou can rate and provide feedback about Cisco technical documents by completing the online feedback form that appears with the technical documents on Cisco.com.
You can submit comments about Cisco documentation by using the response card (if present) behind the front cover of your document or by writing to the following address:
Cisco SystemsAttn: Customer Document Ordering170 West Tasman DriveSan Jose, CA 95134-9883
We appreciate your comments.
xviiCisco ONS 15540 ESPx Troubleshooting Guide
February 2006
PrefaceCisco Product Security Overview
Cisco Product Security OverviewCisco provides a free online Security Vulnerability Policy portal at this URL:
http://www.cisco.com/en/US/products/products_security_vulnerability_policy.html
From this site, you will find information about how to:
• Report security vulnerabilities in Cisco products.
• Obtain assistance with security incidents that involve Cisco products.
• Register to receive security information from Cisco.
A current list of security advisories, security notices, and security responses for Cisco products is available at this URL:
http://www.cisco.com/go/psirt
To see security advisories, security notices, and security responses as they are updated in real time, you can subscribe to the Product Security Incident Response Team Really Simple Syndication (PSIRT RSS) feed. Information about how to subscribe to the PSIRT RSS feed is found at this URL:
http://www.cisco.com/en/US/products/products_psirt_rss_feed.html
Reporting Security Problems in Cisco ProductsCisco is committed to delivering secure products. We test our products internally before we release them, and we strive to correct all vulnerabilities quickly. If you think that you have identified a vulnerability in a Cisco product, contact PSIRT:
• For Emergencies only —[email protected]
An emergency is either a condition in which a system is under active attack or a condition for which a severe and urgent security vulnerability should be reported. All other conditions are considered nonemergencies.
• For Nonemergencies — [email protected]
In an emergency, you can also reach PSIRT by telephone:
• 1 877 228-7302
• 1 408 525-6532
Tip We encourage you to use Pretty Good Privacy (PGP) or a compatible product (for example, GnuPG) to encrypt any sensitive information that you send to Cisco. PSIRT can work with information that has been encrypted with PGP versions 2.x through 9.x.
Never use a revoked or an expired encryption key. The correct public key to use in your correspondence with PSIRT is the one linked in the Contact Summary section of the Security Vulnerability Policy page at this URL:
http://www.cisco.com/en/US/products/products_security_vulnerability_policy.html
The link on this page has the current PGP key ID in use.
If you do not have or use PGP, contact PSIRT at the aforementioned e-mail addresses or phone numbers before sending any sensitive material to find other means of encrypting the data.
xviiiCisco ONS 15540 ESPx Troubleshooting Guide
February 2006
PrefaceObtaining Technical Assistance
Obtaining Technical AssistanceCisco Technical Support provides 24-hour-a-day award-winning technical assistance. The Cisco Technical Support & Documentation website on Cisco.com features extensive online support resources. In addition, if you have a valid Cisco service contract, Cisco Technical Assistance Center (TAC) engineers provide telephone support. If you do not have a valid Cisco service contract, contact your reseller.
Cisco Technical Support & Documentation WebsiteThe Cisco Technical Support & Documentation website provides online documents and tools for troubleshooting and resolving technical issues with Cisco products and technologies. The website is available 24 hours a day, at this URL:
http://www.cisco.com/techsupport
Access to all tools on the Cisco Technical Support & Documentation website requires a Cisco.com user ID and password. If you have a valid service contract but do not have a user ID or password, you can register at this URL:
http://tools.cisco.com/RPF/register/register.do
Note Use the Cisco Product Identification (CPI) tool to locate your product serial number before submitting a web or phone request for service. You can access the CPI tool from the Cisco Technical Support & Documentation website by clicking the Tools & Resources link under Documentation & Tools. Choose Cisco Product Identification Tool from the Alphabetical Index drop-down list, or click the Cisco Product Identification Tool link under Alerts & RMAs. The CPI tool offers three search options: by product ID or model name; by tree view; or for certain products, by copying and pasting show command output. Search results show an illustration of your product with the serial number label location highlighted. Locate the serial number label on your product and record the information before placing a service call.
Submitting a Service RequestUsing the online TAC Service Request Tool is the fastest way to open S3 and S4 service requests. (S3 and S4 service requests are those in which your network is minimally impaired or for which you require product information.) After you describe your situation, the TAC Service Request Tool provides recommended solutions. If your issue is not resolved using the recommended resources, your service request is assigned to a Cisco engineer. The TAC Service Request Tool is located at this URL:
http://www.cisco.com/techsupport/servicerequest
For S1 or S2 service requests, or if you do not have Internet access, contact the Cisco TAC by telephone. (S1 or S2 service requests are those in which your production network is down or severely degraded.) Cisco engineers are assigned immediately to S1 and S2 service requests to help keep your business operations running smoothly.
To open a service request by telephone, use one of the following numbers:
Asia-Pacific: +61 2 8446 7411 (Australia: 1 800 805 227)EMEA: +32 2 704 55 55USA: 1 800 553-2447
xixCisco ONS 15540 ESPx Troubleshooting Guide
February 2006
PrefaceObtaining Additional Publications and Information
For a complete list of Cisco TAC contacts, go to this URL:
http://www.cisco.com/techsupport/contacts
Definitions of Service Request SeverityTo ensure that all service requests are reported in a standard format, Cisco has established severity definitions.
Severity 1 (S1)—An existing network is down, or there is a critical impact to your business operations. You and Cisco will commit all necessary resources around the clock to resolve the situation.
Severity 2 (S2)—Operation of an existing network is severely degraded, or significant aspects of your business operations are negatively affected by inadequate performance of Cisco products. You and Cisco will commit full-time resources during normal business hours to resolve the situation.
Severity 3 (S3)—Operational performance of the network is impaired, while most business operations remain functional. You and Cisco will commit resources during normal business hours to restore service to satisfactory levels.
Severity 4 (S4)—You require information or assistance with Cisco product capabilities, installation, or configuration. There is little or no effect on your business operations.
Obtaining Additional Publications and InformationInformation about Cisco products, technologies, and network solutions is available from various online and printed sources.
• The Cisco Product Quick Reference Guide is a handy, compact reference tool that includes brief product overviews, key features, sample part numbers, and abbreviated technical specifications for many Cisco products that are sold through channel partners. It is updated twice a year and includes the latest Cisco offerings. To order and find out more about the Cisco Product Quick Reference Guide, go to this URL:
http://www.cisco.com/go/guide
• Cisco Marketplace provides a variety of Cisco books, reference guides, documentation, and logo merchandise. Visit Cisco Marketplace, the company store, at this URL:
http://www.cisco.com/go/marketplace/
• Cisco Press publishes a wide range of general networking, training and certification titles. Both new and experienced users will benefit from these publications. For current Cisco Press titles and other information, go to Cisco Press at this URL:
http://www.ciscopress.com
• Packet magazine is the Cisco Systems technical user magazine for maximizing Internet and networking investments. Each quarter, Packet delivers coverage of the latest industry trends, technology breakthroughs, and Cisco products and solutions, as well as network deployment and troubleshooting tips, configuration examples, customer case studies, certification and training information, and links to scores of in-depth online resources. You can access Packet magazine at this URL:
http://www.cisco.com/packet
xxCisco ONS 15540 ESPx Troubleshooting Guide
February 2006
PrefaceObtaining Additional Publications and Information
• iQ Magazine is the quarterly publication from Cisco Systems designed to help growing companies learn how they can use technology to increase revenue, streamline their business, and expand services. The publication identifies the challenges facing these companies and the technologies to help solve them, using real-world case studies and business strategies to help readers make sound technology investment decisions. You can access iQ Magazine at this URL:
http://www.cisco.com/go/iqmagazine
or view the digital edition at this URL:
http://ciscoiq.texterity.com/ciscoiq/sample/
• Internet Protocol Journal is a quarterly journal published by Cisco Systems for engineering professionals involved in designing, developing, and operating public and private internets and intranets. You can access the Internet Protocol Journal at this URL:
http://www.cisco.com/ipj
• Networking products offered by Cisco Systems, as well as customer support services, can be obtained at this URL:
http://www.cisco.com/en/US/products/index.html
• Networking Professionals Connection is an interactive website for networking professionals to share questions, suggestions, and information about networking products and technologies with Cisco experts and other networking professionals. Join a discussion at this URL:
http://www.cisco.com/discuss/networking
• World-class networking training is available from Cisco. You can view current offerings at this URL:
http://www.cisco.com/en/US/learning/index.html
xxiCisco ONS 15540 ESPx Troubleshooting Guide
February 2006

PrefaceObtaining Additional Publications and Information
xxiiCisco ONS 15540 ESPx Troubleshooting Guide
February 2006
CiscoFebruary 16, 2006
C H A P T E R 1
Troubleshooting OverviewThis chapter gives a brief overview of the Cisco ONS 15540 ESPx Troubleshooting Guide as well as a troubleshooting overview of the various areas that might require troubleshooting. This chapter includes the following sections:
• 1.1 Overview, page 1-1
• 1.2 General Model of Problem Solving, page 1-3
• 1.3 Maintaining Network Information, page 1-4
• 1.4 Network and System Management, page 1-4
• 1.5 Third-Party Troubleshooting Tools, page 1-5
• 1.6 Using General Diagnostic Commands, page 1-6
• 1.7 Online Diagnostics, page 1-8
• 1.8 Configuring Online Diagnostics, page 1-9
• 1.9 Checking Release Notes for Workarounds, page 1-12
• 1.10 Initial Troubleshooting Checklist, page 1-13
Basic troubleshooting processes, such as troubleshooting Ethernet connections, that are not specific to the Cisco ONS 15540 ESPx are not described in this document. This information is found online in other troubleshooting guides such as the Cisco IOS Internetwork Troubleshooting Guide.
1.1 OverviewThe Cisco ONS 15540 ESPx is an optical transport platform that employs DWDM (dense wavelength division multiplexing) technology. With the Cisco ONS 15540 ESPx, users can take advantage of the availability of dark fiber to build a common infrastructure that supports data networking (Ethernet based as well as SONET/SDH based) and storage networking.
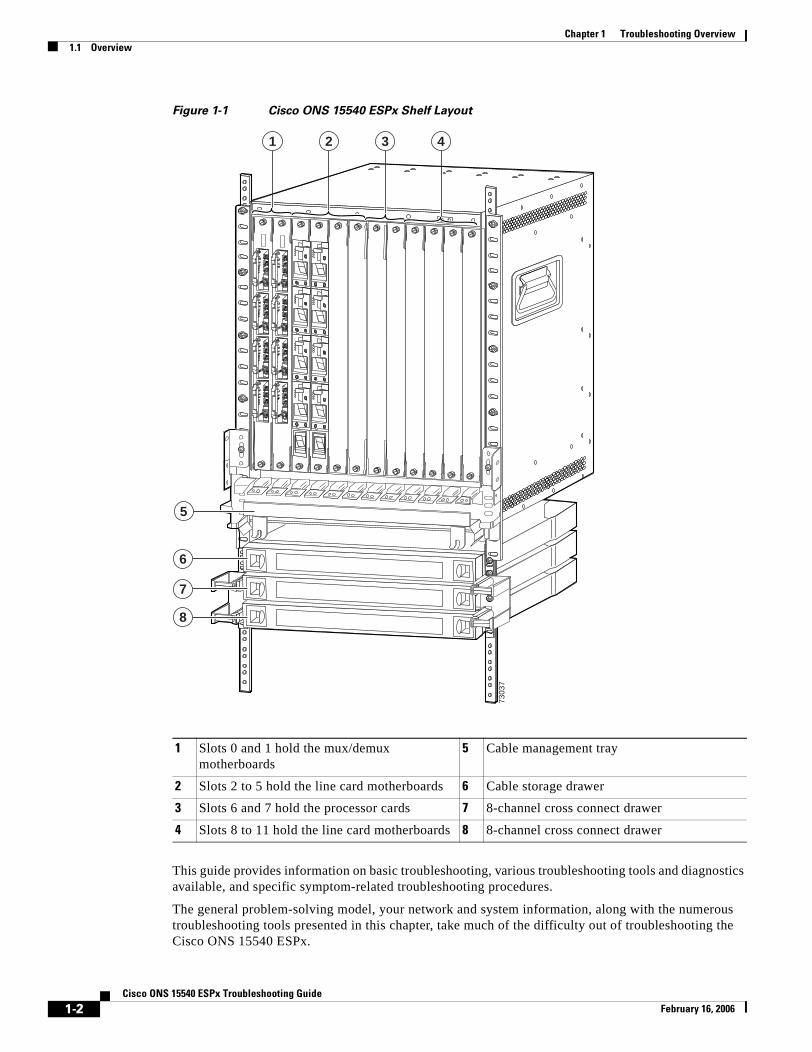
The Cisco ONS 15540 ESPx uses a 12-slot modular vertical chassis (see Figure 1-1). The system receives power through redundant –48 VDC inputs. A redundant external AC power supply is available, or DC power can be provided directly. As you face the chassis, the two leftmost slots (slots 0 and 1) hold the mux/demux motherboards. These slots, which are populated with optical mux/demux modules, correspond to the west and east directions, respectively. Slots 2–5 and 8–11 hold the line card motherboards, which are populated with transponder modules. Slots 6 and 7 hold the processor cards. Air inlet, fan tray, and cable management are located beneath the modular slots. The system has an electrical backplane for system control.
1-1ONS 15540 ESPx Troubleshooting Guide
Chapter 1 Troubleshooting Overview1.1 Overview
Figure 1-1 Cisco ONS 15540 ESPx Shelf Layout
This guide provides information on basic troubleshooting, various troubleshooting tools and diagnostics available, and specific symptom-related troubleshooting procedures.
The general problem-solving model, your network and system information, along with the numerous troubleshooting tools presented in this chapter, take much of the difficulty out of troubleshooting the Cisco ONS 15540 ESPx.
1 Slots 0 and 1 hold the mux/demux motherboards
5 Cable management tray
2 Slots 2 to 5 hold the line card motherboards 6 Cable storage drawer
3 Slots 6 and 7 hold the processor cards 7 8-channel cross connect drawer
4 Slots 8 to 11 hold the line card motherboards 8 8-channel cross connect drawer
7303
7
1 2 3 4
6
7
8
5
1-2Cisco ONS 15540 ESPx Troubleshooting Guide
February 16, 2006
Chapter 1 Troubleshooting Overview1.2 General Model of Problem Solving
1.2 General Model of Problem SolvingWhen troubleshooting the Cisco ONS 15540 ESPx in a network environment, define the specific symptoms, identify all potential problems that could be causing the symptoms, and then systematically eliminate each potential problem (from most likely to least likely) until the symptoms disappear.
Figure 1-2 illustrates the general problem-solving model. This process is not a rigid outline for troubleshooting. It is a foundation on which you can build a problem-solving process for your environment.
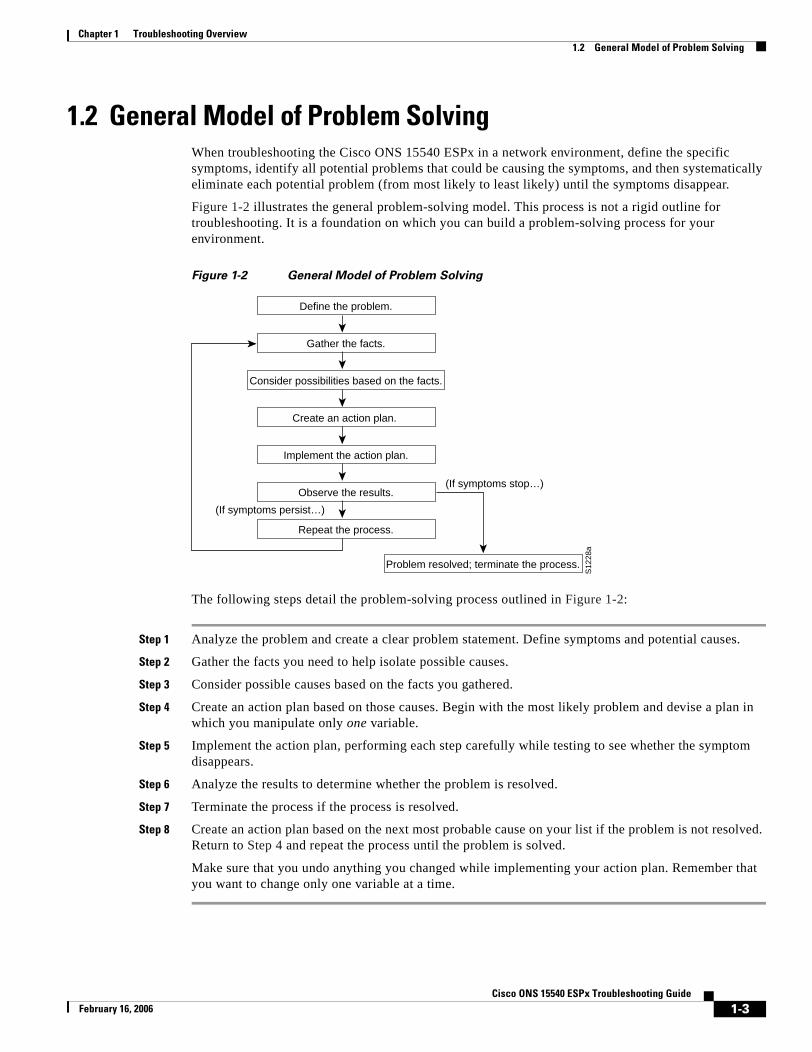
Figure 1-2 General Model of Problem Solving
The following steps detail the problem-solving process outlined in Figure 1-2:
Step 1 Analyze the problem and create a clear problem statement. Define symptoms and potential causes.
Step 2 Gather the facts you need to help isolate possible causes.
Step 3 Consider possible causes based on the facts you gathered.
Step 4 Create an action plan based on those causes. Begin with the most likely problem and devise a plan in which you manipulate only one variable.
Step 5 Implement the action plan, performing each step carefully while testing to see whether the symptom disappears.
Step 6 Analyze the results to determine whether the problem is resolved.
Step 7 Terminate the process if the process is resolved.
Step 8 Create an action plan based on the next most probable cause on your list if the problem is not resolved. Return to Step 4 and repeat the process until the problem is solved.
Make sure that you undo anything you changed while implementing your action plan. Remember that you want to change only one variable at a time.
Define the problem.
Gather the facts.
Consider possibilities based on the facts.
Create an action plan.
Implement the action plan.
Observe the results.
Repeat the process.
(If symptoms persist…)
(If symptoms stop…)
Problem resolved; terminate the process.
S12
28a
1-3Cisco ONS 15540 ESPx Troubleshooting Guide
February 16, 2006
Chapter 1 Troubleshooting Overview1.3 Maintaining Network Information
Note If you exhaust all the common causes and actions (either those outlined in this publication or others that you have identified in your environment), contact customer service. See Appendix A, “Technical Support,” for additional information.
1.3 Maintaining Network InformationMaintaining the following details about your system configuration and network helps with troubleshooting your system:
• Maintain an accurate physical and logical map of your internetwork that outlines the physical location of all of the devices on the network and how they are connected, as well as a logical map of network addresses, network numbers, and subnetworks.
• List all network protocols implemented in your network as well as a list of the network numbers, subnetworks, zones, and areas that are associated with them.
• Note which protocols are being routed and what the correct, up-to-date configuration information is for each protocol.
• Document all the points of contact to external networks, including any connections to the Internet. For each external network connection, note what routing protocol is being used.
• Document normal network behavior and performance so that you can compare current problems with a baseline.
1.4 Network and System Management This section describes the network management toolss available for the Cisco ONS 15540 ESPx. CiscoWorks 2000 supports a suit of network management applications of which the following are supported on the Cisco ONS 15540 ESPx:
• 1.4.1 CiscoView
• 1.4.2 CTM
• 1.4.3 DFM
1.4.1 CiscoViewCiscoView is a device management application providing dynamic status, monitoring, and configuration information for a range of Cisco internetworking products including the Cisco ONS 15540 ESPx. CiscoView displays a physical view of a device chassis, with color-coding of modules and ports for at-a-glance status. Monitoring capabilities display performance and other statistics. Configuration capabilities allow changes to devices if security privileges are granted.
Cisco ONS 15540 ESPx is supported by Embedded CiscoView and server based CiscoView. Online help for CiscoView is available for the server based CiscoView.
1-4Cisco ONS 15540 ESPx Troubleshooting Guide
February 16, 2006
Chapter 1 Troubleshooting Overview1.4.2 CTM
1.4.2 CTMCTM (Cisco Transport Manager) is the EMS (element management system) for the Cisco ONS 15540 ESPx. CTM provides standard fault, configuration, performance, and security management capabilities across the element and network management layers of the TMN (Telecommunications Management Network) reference architecture. The robust client/server-based platform easily scales to manage up to 100 simultaneous client (user) sessions and up to 1000 NEs (network elements).
1.4.3 DFMDFM (Device Fault Manager) reports faults that occur on Cisco devices, often identifying fault conditions before users of network services realize that the condition exists. DFM analysis technology differs from the traditional rules-based approach to event analysis. DFM analysis uses a top-down approach that starts by identifying the fault conditions that affect managed systems. Because the event information necessary to diagnose fault conditions is present in the analysis model, DFM monitors only the events necessary to diagnose the condition. DFM can operate as an independent management system or can integrate with existing management applications to add fault management to the functionality already in place.
1.5 Third-Party Troubleshooting ToolsIn many situations, third-party troubleshooting tools can be helpful. For example, attaching an optical analyzer to a network is less intrusive than using the debug commands, which are processor card intensive.
Here are some typical third-party tools used for troubleshooting internetworks:
• Optical cleaning kit—Keeps your optical cable connections clean. This should be in every tool kit that has anything to do with optical equipment. Several problems you encounter will typically be associated with dirty cables.
• Optical power meter—Measures the optical power coming from and going into a piece of equipment. This is the standard operating procedure for installing and troubleshooting optical equipment. Your optical power meter must be able to measure signals at 850 nm, 1310 nm, and 1550 nm.
Note Optical power meters need to be recalibrated once per year.
• TDR (time domain reflectometer)—Locates open circuits, short circuits, crimps, kinks, sharp bends, impedance mismatches, and other defects in metallic cables. A TDR reflects a signal off the end of the cable. Opens, shorts, and other problems reflect back the signal at different amplitudes, depending on the problem. A TDR measures the time it takes for the signal to reflect and calculates the distance to a fault in the cable. TDRs can also measure the length of a cable, and some TDRs can calculate the rate of propagation based on a configured cable length.
• OTDR (optical time domain reflector/reflectometer)—Checks end-to-end loss and detects fiber breaks, splice points in the optical fiber, and fiber attenuation. This tool is essential for initial network startup and later troubleshooting fiber breaks.
1-5Cisco ONS 15540 ESPx Troubleshooting Guide
February 16, 2006
Chapter 1 Troubleshooting Overview1.6 Using General Diagnostic Commands
• BERT (bit error rate tester)—Tests OC-3, OC-12, and OC-48 ports for end connectivity of the wavelength if the client equipment is not yet available. BERT usually has a built-in power meter to test optical power of the circuit.
• Fiber microscope—Checks the fiber interface for dirt or anything else that could degrade the optical connection.
• Patch cables— Loops back the trunk side. You should keep an assortment of multimode and single-mode patch cables with you, including 1550 nm SM trunk side cables with MU-to-SC interfaces and SC-to-SC coupler. Use attenuators as needed.
• Fixed attenuators—Adds fixed attenuation levels to connections. Five attenuators with 5 dB at1310 nm and five with 10 dB at 1310 nm, are a good start.
• Spectrum analyzer—Views the channel spectrum or analyzes light according to wavelength. It is useful when you suspect channel cross talk and for certifying equipment and performing periodic laser tests for stability.
• Network monitors—Tracks packets crossing a network, providing an accurate picture of network activity. Network monitors do not decode the contents of frames. They are useful for creating a baseline of normal performance. Monitors collect information such as packet sizes, the number of packets, error packets, overall usage of a connection, the number of hosts and their MAC addresses, and details about communications between hosts and other devices. This data can be used to create profiles of LAN traffic and assist in locating traffic overloads, planning for network expansion, detecting intruders, and distributing traffic more efficiently.
1.6 Using General Diagnostic CommandsYou can use the show, debug, ping, and traceroute commands to monitor and troubleshoot your internetwork.
1.6.1 show CommandsYou can use the show commands to perform many functions such as the following:
• Monitors the behavior of your Cisco ONS 15540 ESPx during initial installation
• Monitors normal network operation
• Isolates problem interfaces, nodes, media, or applications
• Determines when a network is congested
• Determines the status of servers, clients, or other neighbors
Table 1-1 lists some of the most commonly used show commands:
Table 1-1 Useful Diagnostic Commands
Command Purpose
show interfaces interface Displays statistics for the interfaces.
show controllers interface Displays statistics for processor card interface controllers.
show running-config Displays the currently running configuration.
show startup-config Displays the configuration stored in NVRAM (nonvolatile RAM).
1-6Cisco ONS 15540 ESPx Troubleshooting Guide
February 16, 2006
Chapter 1 Troubleshooting Overview1.6.2 debug Commands
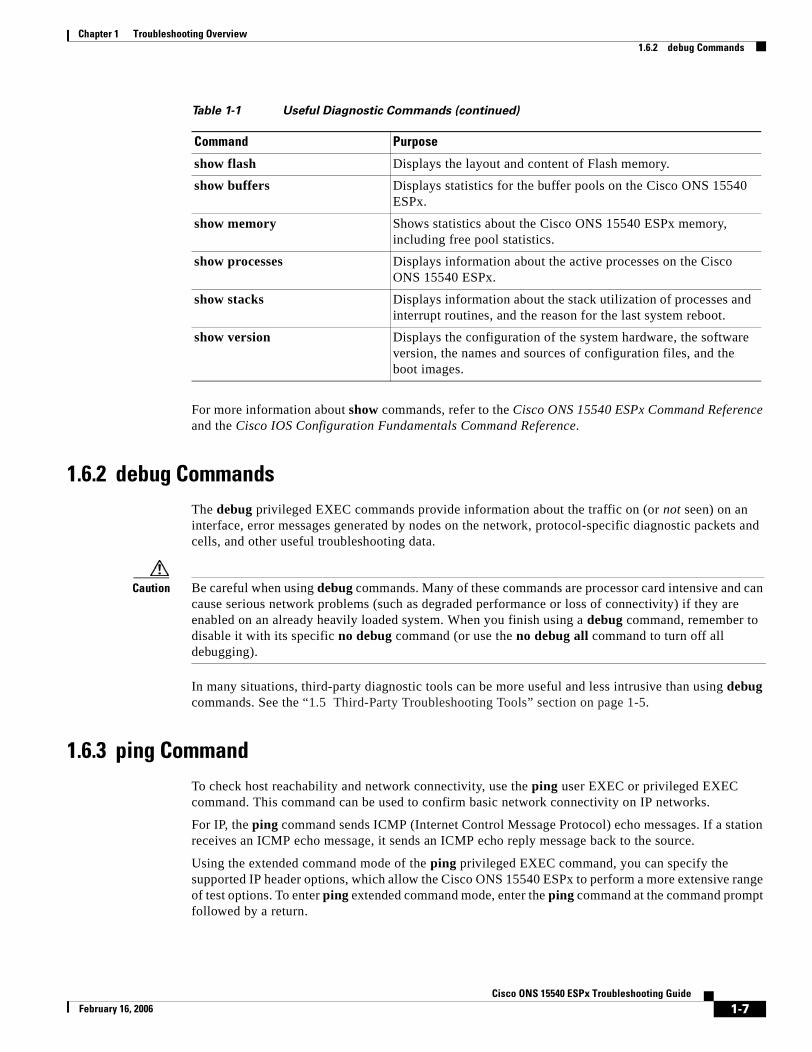
For more information about show commands, refer to the Cisco ONS 15540 ESPx Command Reference and the Cisco IOS Configuration Fundamentals Command Reference.
1.6.2 debug CommandsThe debug privileged EXEC commands provide information about the traffic on (or not seen) on an interface, error messages generated by nodes on the network, protocol-specific diagnostic packets and cells, and other useful troubleshooting data.
Caution Be careful when using debug commands. Many of these commands are processor card intensive and can cause serious network problems (such as degraded performance or loss of connectivity) if they are enabled on an already heavily loaded system. When you finish using a debug command, remember to disable it with its specific no debug command (or use the no debug all command to turn off all debugging).
In many situations, third-party diagnostic tools can be more useful and less intrusive than using debug commands. See the “1.5 Third-Party Troubleshooting Tools” section on page 1-5.
1.6.3 ping CommandTo check host reachability and network connectivity, use the ping user EXEC or privileged EXEC command. This command can be used to confirm basic network connectivity on IP networks.
For IP, the ping command sends ICMP (Internet Control Message Protocol) echo messages. If a station receives an ICMP echo message, it sends an ICMP echo reply message back to the source.
Using the extended command mode of the ping privileged EXEC command, you can specify the supported IP header options, which allow the Cisco ONS 15540 ESPx to perform a more extensive range of test options. To enter ping extended command mode, enter the ping command at the command prompt followed by a return.
show flash Displays the layout and content of Flash memory.
show buffers Displays statistics for the buffer pools on the Cisco ONS 15540 ESPx.
show memory Shows statistics about the Cisco ONS 15540 ESPx memory, including free pool statistics.
show processes Displays information about the active processes on the Cisco ONS 15540 ESPx.
show stacks Displays information about the stack utilization of processes and interrupt routines, and the reason for the last system reboot.
show version Displays the configuration of the system hardware, the software version, the names and sources of configuration files, and the boot images.
Table 1-1 Useful Diagnostic Commands (continued)
Command Purpose
1-7Cisco ONS 15540 ESPx Troubleshooting Guide
February 16, 2006
Chapter 1 Troubleshooting Overview1.6.4 traceroute Command
To see how the command works under normal conditions, use the ping command when the network is functioning properly. When you are troubleshooting, you can then see the difference between normal and abnormal operation.
For detailed information about using the ping and extended ping commands, refer to theCisco IOS Configuration Fundamentals Command Reference publication.
1.6.4 traceroute CommandThe traceroute user EXEC command discovers the routes packets follow when traveling to their destinations. With the traceroute privileged EXEC command, the supported IP header options are specified, and the Cisco ONS 15540 ESPx can perform a more extensive range of test options.
The traceroute command works by using the error message generated by a Cisco ONS 15540 ESPx when a datagram exceeds its TTL (Time-To-Live) value. First, probe datagrams are sent with a TTL value of one. This causes the first Cisco ONS 15540 ESPx to discard the probe datagrams and send back time exceeded error messages. The traceroute command then sends several probes, and displays the round-trip time for each. After every third probe, the TTL increases by one.
Each outgoing packet can result in one of two error messages. A time exceeded error message indicates that an intermediate Cisco ONS 15540 ESPx has seen and discarded the probe. A port unreachable error message indicates that the destination node has received the probe and discarded it because it could not deliver the packet to an application. If the timer goes off before a response comes in, the traceroute command displays an asterisk (*).
The traceroute command terminates when the destination responds, when the maximum TTL is exceeded, or when the user interrupts the traceroute command with the escape sequence.
To see how the command works under normal conditions, use the traceroute command when the network is functioning properly. When you are troubleshooting, you can then see the difference between normal and abnormal operation.
For detailed information about using the traceroute command, refer to the Cisco ONS 15540 ESPx Command Reference. For additional information on using debug commands refer to the Cisco IOS Debug Command Reference.
1.7 Online DiagnosticsThis section describes the online diagnostics available for troubleshooting your Cisco ONS 15540 ESPx. Online diagnostics provide the following types of tests:
• Accessibility tests between the processor card and the modules.
• OIR (online insertion and removal) diagnostic tests.
The Cisco ONS 15540 ESPx displays an error message on the console when it detects a hardware failure or problem.
Note Online diagnostic tests only run on the active processor card.
1.7.1 Accessibility TestThe accessibility tests ensure connectivity, at a configurable interval, between the following:
1-8Cisco ONS 15540 ESPx Troubleshooting Guide
February 16, 2006
Chapter 1 Troubleshooting Overview1.7.2 OIR Test
• OADM modules
• Mux/demux motherboards
• Transponder modules
• Line card motherboards
• Active processor card
• Standby processor card, if it is present
1.7.2 OIR TestOIR tests check the functioning of the processor card and interfaces on a per-port basis. The processor card performs these tests when the system boots up and when you insert a module or motherboard into a slot. The OIR test sends a packet to the interface loopback and expects to receive it within a certain time period. If the packet does not reach the port within the expected time period, or the received packet is corrupted, an error is registered and the port is changed to an administratively down state. Packets that are 1000 bytes in size are used in the test.
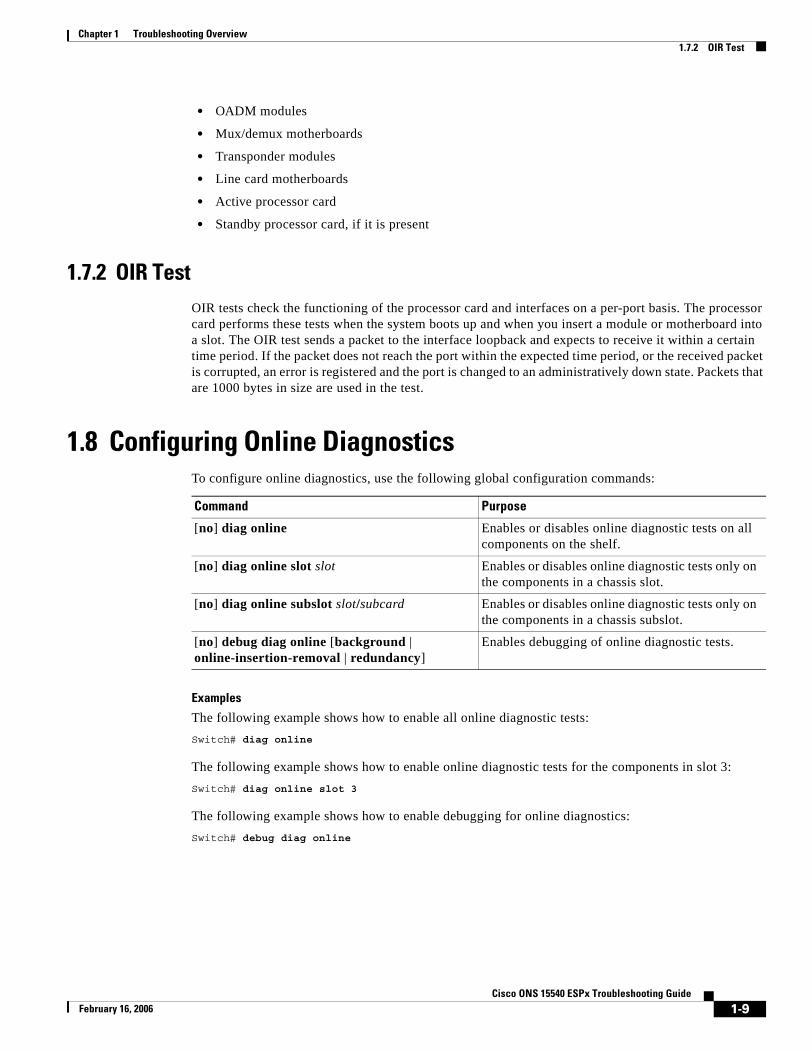
1.8 Configuring Online DiagnosticsTo configure online diagnostics, use the following global configuration commands:
Examples
The following example shows how to enable all online diagnostic tests:
Switch# diag online
The following example shows how to enable online diagnostic tests for the components in slot 3:
Switch# diag online slot 3
The following example shows how to enable debugging for online diagnostics:
Switch# debug diag online
Command Purpose
[no] diag online Enables or disables online diagnostic tests on all components on the shelf.
[no] diag online slot slot Enables or disables online diagnostic tests only on the components in a chassis slot.
[no] diag online subslot slot/subcard Enables or disables online diagnostic tests only on the components in a chassis subslot.
[no] debug diag online [background | online-insertion-removal | redundancy]
Enables debugging of online diagnostic tests.
1-9Cisco ONS 15540 ESPx Troubleshooting Guide
February 16, 2006
Chapter 1 Troubleshooting Overview1.8.1 Displaying the Online Diagnostics Configuration and Results
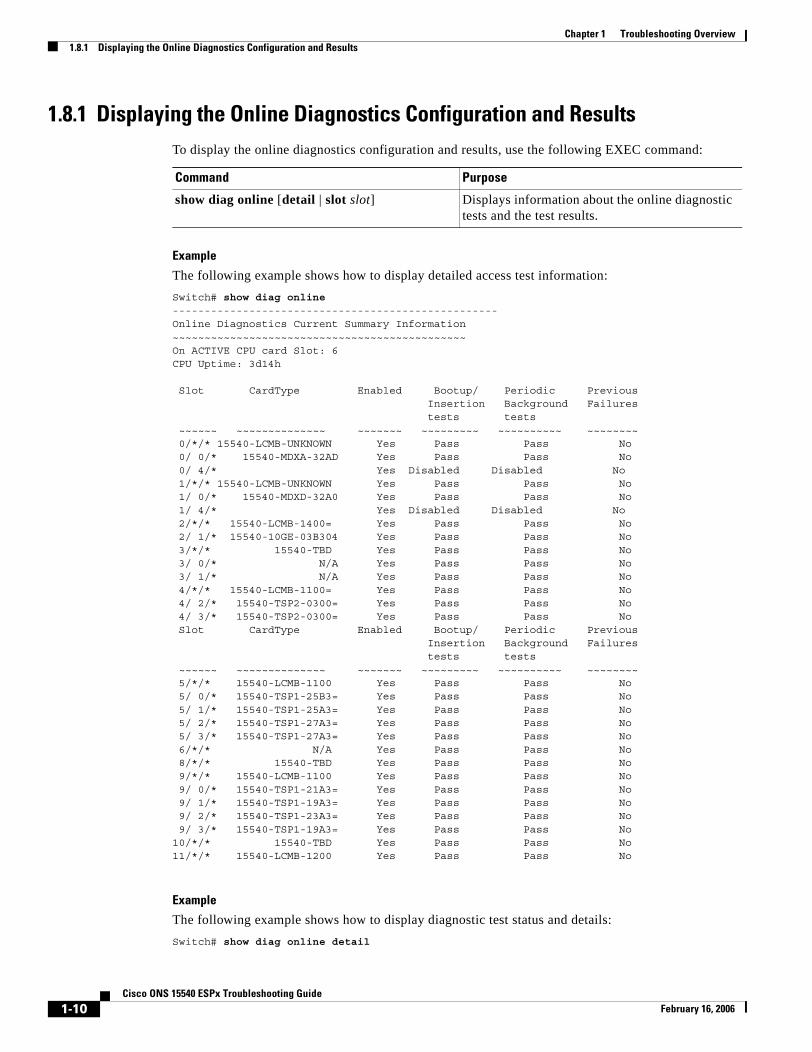
1.8.1 Displaying the Online Diagnostics Configuration and ResultsTo display the online diagnostics configuration and results, use the following EXEC command:
Example
The following example shows how to display detailed access test information:
Switch# show diag online ---------------------------------------------------Online Diagnostics Current Summary Information~~~~~~~~~~~~~~~~~~~~~~~~~~~~~~~~~~~~~~~~~~~~~~On ACTIVE CPU card Slot: 6CPU Uptime: 3d14h
Slot CardType Enabled Bootup/ Periodic Previous Insertion Background Failures tests tests ~~~~~~ ~~~~~~~~~~~~~~ ~~~~~~~ ~~~~~~~~~ ~~~~~~~~~~ ~~~~~~~~ 0/*/* 15540-LCMB-UNKNOWN Yes Pass Pass No 0/ 0/* 15540-MDXA-32AD Yes Pass Pass No 0/ 4/* Yes Disabled Disabled No 1/*/* 15540-LCMB-UNKNOWN Yes Pass Pass No 1/ 0/* 15540-MDXD-32A0 Yes Pass Pass No 1/ 4/* Yes Disabled Disabled No 2/*/* 15540-LCMB-1400= Yes Pass Pass No 2/ 1/* 15540-10GE-03B304 Yes Pass Pass No 3/*/* 15540-TBD Yes Pass Pass No 3/ 0/* N/A Yes Pass Pass No 3/ 1/* N/A Yes Pass Pass No 4/*/* 15540-LCMB-1100= Yes Pass Pass No 4/ 2/* 15540-TSP2-0300= Yes Pass Pass No 4/ 3/* 15540-TSP2-0300= Yes Pass Pass No Slot CardType Enabled Bootup/ Periodic Previous Insertion Background Failures tests tests ~~~~~~ ~~~~~~~~~~~~~~ ~~~~~~~ ~~~~~~~~~ ~~~~~~~~~~ ~~~~~~~~ 5/*/* 15540-LCMB-1100 Yes Pass Pass No 5/ 0/* 15540-TSP1-25B3= Yes Pass Pass No 5/ 1/* 15540-TSP1-25A3= Yes Pass Pass No 5/ 2/* 15540-TSP1-27A3= Yes Pass Pass No 5/ 3/* 15540-TSP1-27A3= Yes Pass Pass No 6/*/* N/A Yes Pass Pass No 8/*/* 15540-TBD Yes Pass Pass No 9/*/* 15540-LCMB-1100 Yes Pass Pass No 9/ 0/* 15540-TSP1-21A3= Yes Pass Pass No 9/ 1/* 15540-TSP1-19A3= Yes Pass Pass No 9/ 2/* 15540-TSP1-23A3= Yes Pass Pass No 9/ 3/* 15540-TSP1-19A3= Yes Pass Pass No10/*/* 15540-TBD Yes Pass Pass No11/*/* 15540-LCMB-1200 Yes Pass Pass No
Example
The following example shows how to display diagnostic test status and details:
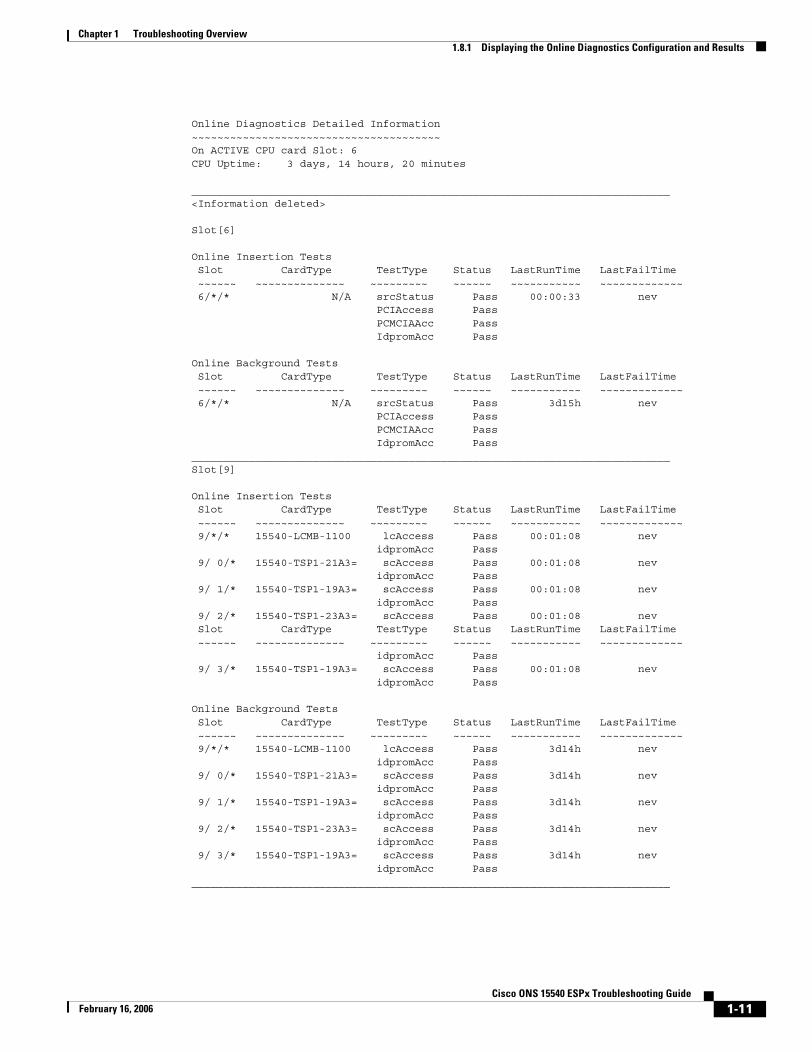
Switch# show diag online detail
Command Purpose
show diag online [detail | slot slot] Displays information about the online diagnostic tests and the test results.
1-10Cisco ONS 15540 ESPx Troubleshooting Guide
February 16, 2006
Chapter 1 Troubleshooting Overview1.8.1 Displaying the Online Diagnostics Configuration and Results
Online Diagnostics Detailed Information~~~~~~~~~~~~~~~~~~~~~~~~~~~~~~~~~~~~~~~On ACTIVE CPU card Slot: 6CPU Uptime: 3 days, 14 hours, 20 minutes
___________________________________________________________________________<Information deleted>
Slot[6]
Online Insertion Tests Slot CardType TestType Status LastRunTime LastFailTime ~~~~~~ ~~~~~~~~~~~~~~ ~~~~~~~~~ ~~~~~~ ~~~~~~~~~~~ ~~~~~~~~~~~~~ 6/*/* N/A srcStatus Pass 00:00:33 nev PCIAccess Pass PCMCIAAcc Pass IdpromAcc Pass
Online Background Tests Slot CardType TestType Status LastRunTime LastFailTime ~~~~~~ ~~~~~~~~~~~~~~ ~~~~~~~~~ ~~~~~~ ~~~~~~~~~~~ ~~~~~~~~~~~~~ 6/*/* N/A srcStatus Pass 3d15h nev PCIAccess Pass PCMCIAAcc Pass IdpromAcc Pass___________________________________________________________________________Slot[9]
Online Insertion Tests Slot CardType TestType Status LastRunTime LastFailTime ~~~~~~ ~~~~~~~~~~~~~~ ~~~~~~~~~ ~~~~~~ ~~~~~~~~~~~ ~~~~~~~~~~~~~ 9/*/* 15540-LCMB-1100 lcAccess Pass 00:01:08 nev idpromAcc Pass 9/ 0/* 15540-TSP1-21A3= scAccess Pass 00:01:08 nev idpromAcc Pass 9/ 1/* 15540-TSP1-19A3= scAccess Pass 00:01:08 nev idpromAcc Pass 9/ 2/* 15540-TSP1-23A3= scAccess Pass 00:01:08 nev Slot CardType TestType Status LastRunTime LastFailTime ~~~~~~ ~~~~~~~~~~~~~~ ~~~~~~~~~ ~~~~~~ ~~~~~~~~~~~ ~~~~~~~~~~~~~ idpromAcc Pass 9/ 3/* 15540-TSP1-19A3= scAccess Pass 00:01:08 nev idpromAcc Pass
Online Background Tests Slot CardType TestType Status LastRunTime LastFailTime ~~~~~~ ~~~~~~~~~~~~~~ ~~~~~~~~~ ~~~~~~ ~~~~~~~~~~~ ~~~~~~~~~~~~~ 9/*/* 15540-LCMB-1100 lcAccess Pass 3d14h nev idpromAcc Pass 9/ 0/* 15540-TSP1-21A3= scAccess Pass 3d14h nev idpromAcc Pass 9/ 1/* 15540-TSP1-19A3= scAccess Pass 3d14h nev idpromAcc Pass 9/ 2/* 15540-TSP1-23A3= scAccess Pass 3d14h nev idpromAcc Pass 9/ 3/* 15540-TSP1-19A3= scAccess Pass 3d14h nev idpromAcc Pass___________________________________________________________________________
1-11Cisco ONS 15540 ESPx Troubleshooting Guide
February 16, 2006
Chapter 1 Troubleshooting Overview1.9 Checking Release Notes for Workarounds
1.9 Checking Release Notes for Workarounds There are two methods you can use to check for Cisco IOS software bugs (defect tracking tool numbers [DDTS]) in your version of the Cisco IOS software. You can use the Bug Navigator II or check the release notes. Often, your problems with the Cisco ONS 15540 ESPx have been fixed or a workaround has been determined in a more recent version of software.
1.9.1 Using Bug Navigator IIBug Navigator II is a tool you can use to search the DDTS database and ask either of two types of questions:
• Symptom Diagnostics (for example, “What defect is causing my current symptoms?”)
• Upgrade Planning (for example, “What software release is best for the features I am interested in?”)
You can access Bug Navigator II on the World Wide Web at http://www.cisco.com/cgi-bin/Support/Bugtool/launch_bugtool.pl. Then follow these steps:
Step 1 Enter your user name and password at the login prompt if you are not already logged in to Cisco.com.
Step 2 Read the Bug Navigator II Help instructions.
Step 3 Select your hardware from the Cisco Hardware list. The Bug Navigator search tool replaces Bug Navigator II Help (in the right frame of the page).
Step 4 Select the following from the drop-down menus:
• Version
• Revision
• Severity
Note As an option, you can enter words or phrases (separated by commas) in the data entry field to limit your search.
Step 5 Click the Search button.
The entire window is replaced with a Bug Search Results window with a list of DDTS containing your search criteria. Look at the Bug reports listed in the titles column. An existing bug entry that describes the problem you are having may have been fixed in a more recent version of the Cisco IOS software. Look in the Fixed-in column for a later version of the Cisco IOS software. All you might have to do to solve your problem is upgrade your software.
If a software upgrade is not listed as a way to solve your problem, double-click on the bug title and read the DDTS details; a workaround might be listed there.
1.9.2 Checking Cisco IOS Release NotesRelease notes describe the features and caveats for Cisco IOS software releases. The release notes are listed by both product and Cisco IOS release number.
1-12Cisco ONS 15540 ESPx Troubleshooting Guide
February 16, 2006
Chapter 1 Troubleshooting Overview1.10 Initial Troubleshooting Checklist
The “Caveats” section of the release notes lists known caveats by tracking the DDTS number and the release number, and indicates whether the caveat has been corrected.
The “Caveat Symptoms and Workarounds” section summarizes caveat symptoms and suggested workarounds. You can also search through this section online, using either a word string or the DDTS number.
Note After you have determined the hardware and software versions on the Cisco ONS 15540 ESPx, check the release notes and DDTS database for symptoms resembling those you are observing. Often, the problem has already been discovered and a workaround has been provided.
1.10 Initial Troubleshooting ChecklistBefore you start the troubleshooting process, confirm that the network and client connections were designed correctly using the information in the Cisco ONS 15540 ESPx Planning Guide and the interfaces were configured correctly using the information in theCisco ONS 15540 ESPx Configuration Guide.
Next confirm the integrity of the hardware and its installation by performing the following:
• Reseat the cable.
• Clean the cable, connectors, couplers, and attenuators.
• Confirm that the Tx and Rx fiber optic connections are not mixed.
• Confirm all modules and motherboards are completely seated and the captive screws are tightened securely to completely mate the optical fiber connectors to the backplane.
• Check the signal level at each input and output to check for too much or too little attenuation.
• Verify that all line cards, modules, and carrier motherboards are properly seated in the slots.
1-13Cisco ONS 15540 ESPx Troubleshooting Guide
February 16, 2006

Chapter 1 Troubleshooting Overview1.10 Initial Troubleshooting Checklist
1-14Cisco ONS 15540 ESPx Troubleshooting Guide
February 16, 2006
CiscoFebruary 16, 2006
C H A P T E R 2
Troubleshooting Processor Card ProblemsThis chapter describes how to troubleshoot processor card problems. The chapter includes the following sections:
• 2.1 Overview, page 2-1
• 2.2 Initial Troubleshooting Checklist, page 2-2
• 2.3 Verifying Processor Card Configuration, page 2-2
• 2.4 Recovering a Lost Password, page 2-4
• 2.5 Verifying NME Interface Configurations, page 2-5
• 2.6 Troubleshooting Processor Memory, page 2-8
• 2.7 Verifying Hardware and Software Versions, page 2-8
• 2.8 Verifying Hardware and Software Compatibility, page 2-10
• 2.9 Troubleshooting Redundant Processor Cards, page 2-13
• 2.10 Troubleshooting Processor Cards, page 2-20
2.1 OverviewThe Cisco ONS 15540 ESPx includes two processor cards for redundancy. Each processor consists of a number of subsystems, including a CPU, a system clock, Ethernet switch for communicating between processors and with the LRC (line card redundancy controller) on the mux/demux motherboards and line card motherboards, and a processor redundancy controller. The active processor controls the node, and all cards in the system make use of the system clock and synchronization signals from the active processor.
The processor card is equipped with a console port, a Fast Ethernet interface for Telnet access and network management, and an auxiliary port. There are two slots for Flash PC Cards or Flash disks.
On the processor card front panel are LEDs that display the status of critical, major, and minor signals, as well as the status of alarm cutoff and history conditions. The alarm signals from the processor go to an alarm daughterboard on the backplane, which has a connector for central office alarm facilities.
Note For information on slot assignments, processor card LEDs, alarm condition clear and reset button, interrupt clear and reset button, NME LEDs, and cabling, refer to the Cisco ONS 15540 ESPx Hardware Installation Guide. For default configuration of the various modules, refer to the Cisco ONS 15540 ESPx Configuration Guide.
2-1ONS 15540 ESPx Troubleshooting Guide
Chapter 2 Troubleshooting Processor Card Problems2.2 Initial Troubleshooting Checklist
2.2 Initial Troubleshooting ChecklistFollow this initial checklist before proceeding with the troubleshooting procedures:
• Issue the show running-config command to check the running configuration.
• Ensure the LEDs on the processor cards show the proper state.
• Ensure the Ethernet and Console cables are connected properly.
• Issue the show facility-alarm status command to check for processor card, fan, or power supply alarms.
• Issue the show hardware detail command to verify the processor card functional image.
• Ensure online and power-on diagnostics do not report any alarms or failures for the processor card.
• Ensure the active and standby processor cards are compatible.
• Ensure the active and standby processor card have the same version of software installed.
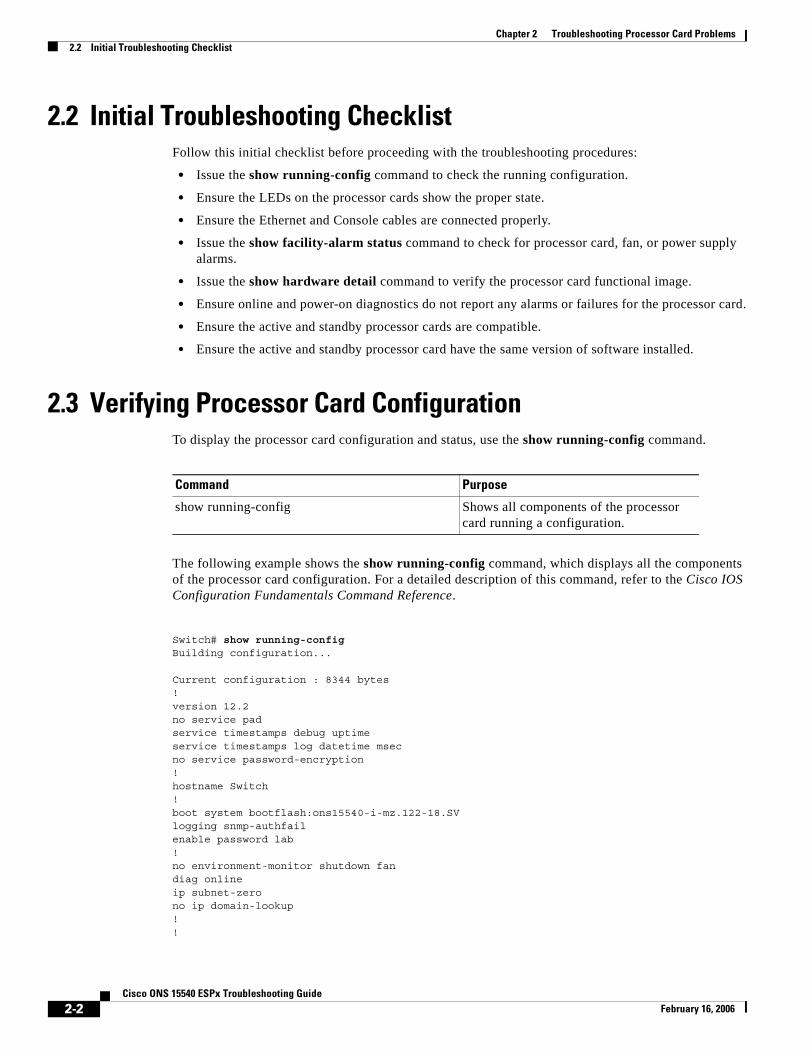
2.3 Verifying Processor Card ConfigurationTo display the processor card configuration and status, use the show running-config command.
The following example shows the show running-config command, which displays all the components of the processor card configuration. For a detailed description of this command, refer to the Cisco IOS Configuration Fundamentals Command Reference.
Switch# show running-configBuilding configuration...
Current configuration : 8344 bytes!version 12.2no service padservice timestamps debug uptimeservice timestamps log datetime msecno service password-encryption!hostname Switch!boot system bootflash:ons15540-i-mz.122-18.SVlogging snmp-authfailenable password lab!no environment-monitor shutdown fandiag onlineip subnet-zerono ip domain-lookup!!
Command Purpose
show running-config Shows all components of the processor card running a configuration.
2-2Cisco ONS 15540 ESPx Troubleshooting Guide
February 16, 2006
Chapter 2 Troubleshooting Processor Card Problems2.3 Verifying Processor Card Configuration
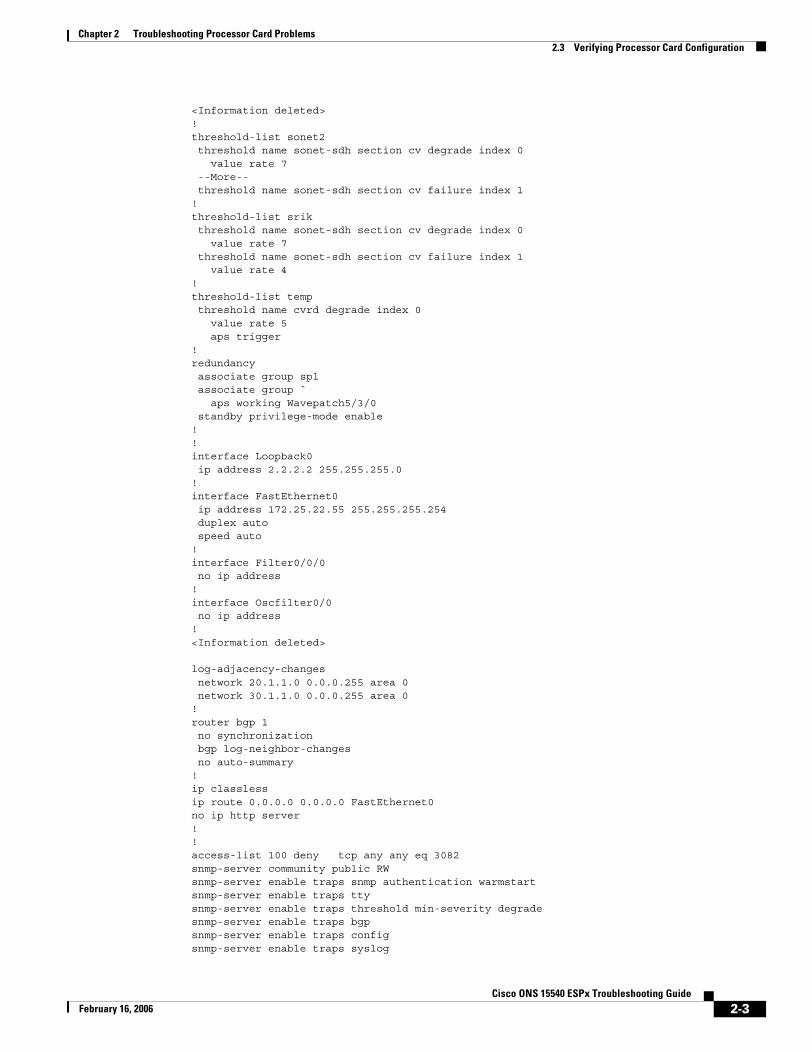
<Information deleted>!threshold-list sonet2 threshold name sonet-sdh section cv degrade index 0 value rate 7 --More-- threshold name sonet-sdh section cv failure index 1!threshold-list srik threshold name sonet-sdh section cv degrade index 0 value rate 7 threshold name sonet-sdh section cv failure index 1 value rate 4!threshold-list temp threshold name cvrd degrade index 0 value rate 5 aps trigger!redundancy associate group spl associate group ` aps working Wavepatch5/3/0 standby privilege-mode enable!!interface Loopback0 ip address 2.2.2.2 255.255.255.0!interface FastEthernet0 ip address 172.25.22.55 255.255.255.254 duplex auto speed auto!interface Filter0/0/0 no ip address!interface Oscfilter0/0 no ip address!<Information deleted>
log-adjacency-changes network 20.1.1.0 0.0.0.255 area 0 network 30.1.1.0 0.0.0.255 area 0!router bgp 1 no synchronization bgp log-neighbor-changes no auto-summary!ip classlessip route 0.0.0.0 0.0.0.0 FastEthernet0no ip http server!!access-list 100 deny tcp any any eq 3082snmp-server community public RWsnmp-server enable traps snmp authentication warmstartsnmp-server enable traps ttysnmp-server enable traps threshold min-severity degradesnmp-server enable traps bgpsnmp-server enable traps configsnmp-server enable traps syslog
2-3Cisco ONS 15540 ESPx Troubleshooting Guide
February 16, 2006
Chapter 2 Troubleshooting Processor Card Problems2.4 Recovering a Lost Password
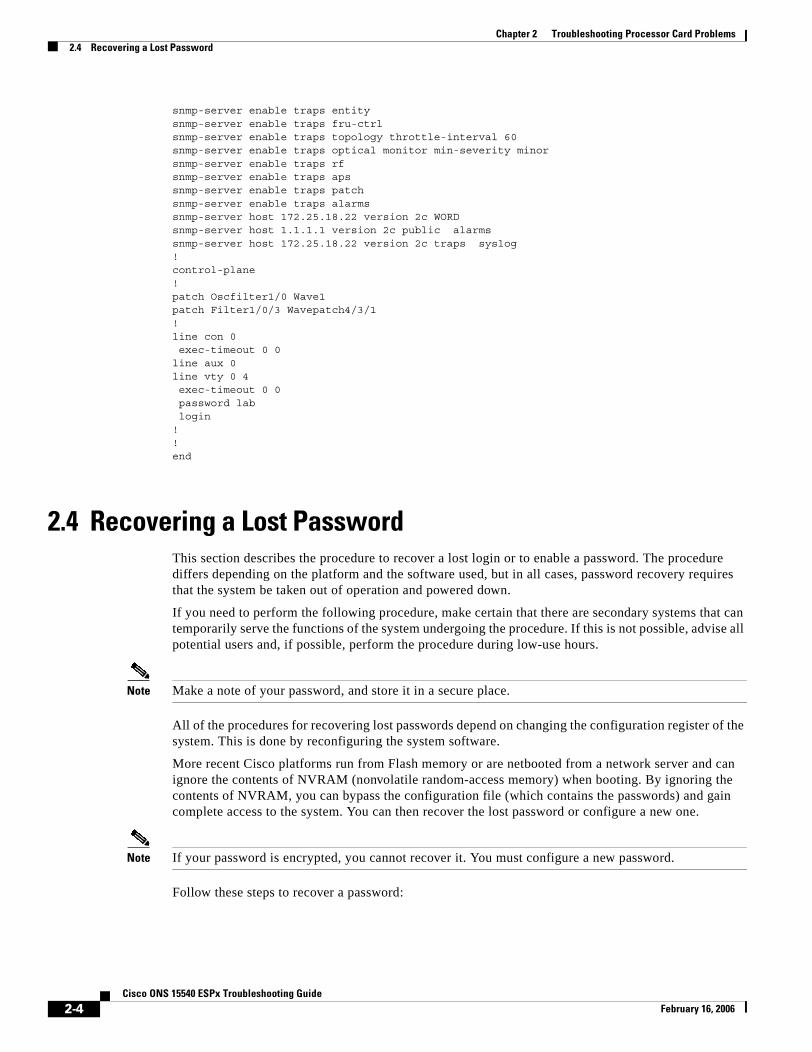
snmp-server enable traps entitysnmp-server enable traps fru-ctrlsnmp-server enable traps topology throttle-interval 60snmp-server enable traps optical monitor min-severity minorsnmp-server enable traps rfsnmp-server enable traps apssnmp-server enable traps patchsnmp-server enable traps alarmssnmp-server host 172.25.18.22 version 2c WORDsnmp-server host 1.1.1.1 version 2c public alarmssnmp-server host 172.25.18.22 version 2c traps syslog!control-plane!patch Oscfilter1/0 Wave1patch Filter1/0/3 Wavepatch4/3/1!line con 0 exec-timeout 0 0line aux 0line vty 0 4 exec-timeout 0 0 password lab login!!end
2.4 Recovering a Lost PasswordThis section describes the procedure to recover a lost login or to enable a password. The procedure differs depending on the platform and the software used, but in all cases, password recovery requires that the system be taken out of operation and powered down.
If you need to perform the following procedure, make certain that there are secondary systems that can temporarily serve the functions of the system undergoing the procedure. If this is not possible, advise all potential users and, if possible, perform the procedure during low-use hours.
Note Make a note of your password, and store it in a secure place.
All of the procedures for recovering lost passwords depend on changing the configuration register of the system. This is done by reconfiguring the system software.
More recent Cisco platforms run from Flash memory or are netbooted from a network server and can ignore the contents of NVRAM (nonvolatile random-access memory) when booting. By ignoring the contents of NVRAM, you can bypass the configuration file (which contains the passwords) and gain complete access to the system. You can then recover the lost password or configure a new one.
Note If your password is encrypted, you cannot recover it. You must configure a new password.
Follow these steps to recover a password:
2-4Cisco ONS 15540 ESPx Troubleshooting Guide
February 16, 2006
Chapter 2 Troubleshooting Processor Card Problems2.5 Verifying NME Interface Configurations
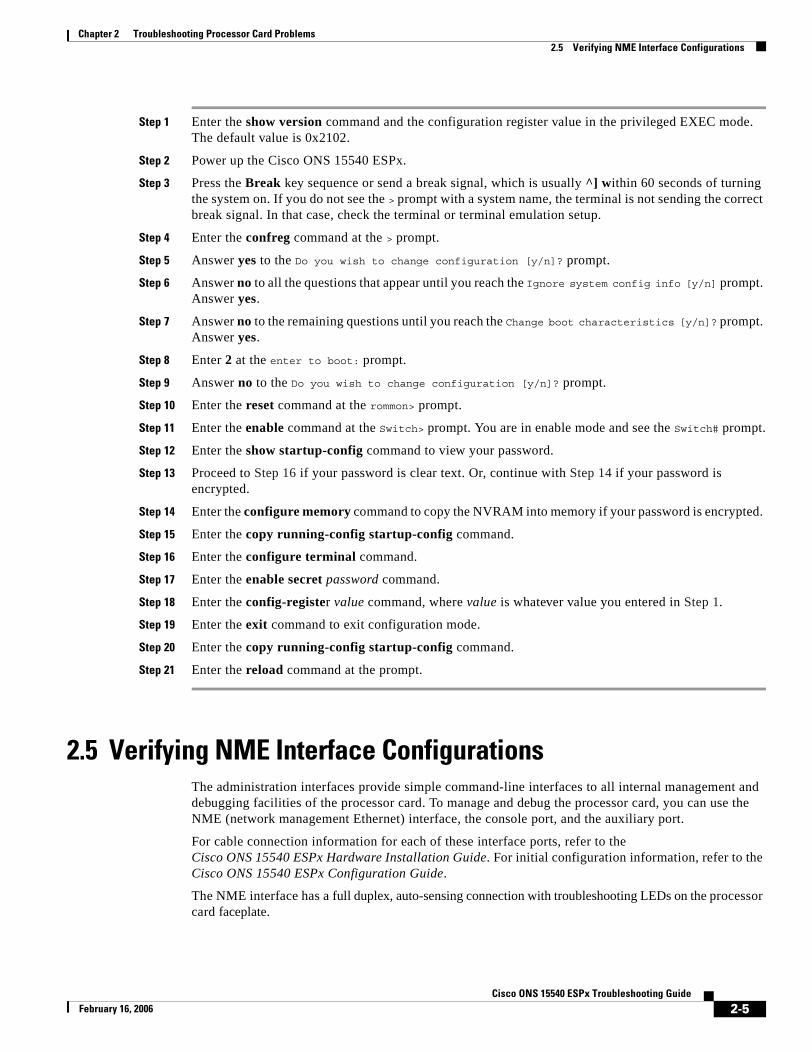
Step 1 Enter the show version command and the configuration register value in the privileged EXEC mode. The default value is 0x2102.
Step 2 Power up the Cisco ONS 15540 ESPx.
Step 3 Press the Break key sequence or send a break signal, which is usually ^] within 60 seconds of turning the system on. If you do not see the > prompt with a system name, the terminal is not sending the correct break signal. In that case, check the terminal or terminal emulation setup.
Step 4 Enter the confreg command at the > prompt.
Step 5 Answer yes to the Do you wish to change configuration [y/n]? prompt.
Step 6 Answer no to all the questions that appear until you reach the Ignore system config info [y/n] prompt. Answer yes.
Step 7 Answer no to the remaining questions until you reach the Change boot characteristics [y/n]? prompt. Answer yes.
Step 8 Enter 2 at the enter to boot: prompt.
Step 9 Answer no to the Do you wish to change configuration [y/n]? prompt.
Step 10 Enter the reset command at the rommon> prompt.
Step 11 Enter the enable command at the Switch> prompt. You are in enable mode and see the Switch# prompt.
Step 12 Enter the show startup-config command to view your password.
Step 13 Proceed to Step 16 if your password is clear text. Or, continue with Step 14 if your password is encrypted.
Step 14 Enter the configure memory command to copy the NVRAM into memory if your password is encrypted.
Step 15 Enter the copy running-config startup-config command.
Step 16 Enter the configure terminal command.
Step 17 Enter the enable secret password command.
Step 18 Enter the config-register value command, where value is whatever value you entered in Step 1.
Step 19 Enter the exit command to exit configuration mode.
Step 20 Enter the copy running-config startup-config command.
Step 21 Enter the reload command at the prompt.
2.5 Verifying NME Interface ConfigurationsThe administration interfaces provide simple command-line interfaces to all internal management and debugging facilities of the processor card. To manage and debug the processor card, you can use the NME (network management Ethernet) interface, the console port, and the auxiliary port.
For cable connection information for each of these interface ports, refer to the Cisco ONS 15540 ESPx Hardware Installation Guide. For initial configuration information, refer to the Cisco ONS 15540 ESPx Configuration Guide.
The NME interface has a full duplex, auto-sensing connection with troubleshooting LEDs on the processor card faceplate.
2-5Cisco ONS 15540 ESPx Troubleshooting Guide
February 16, 2006
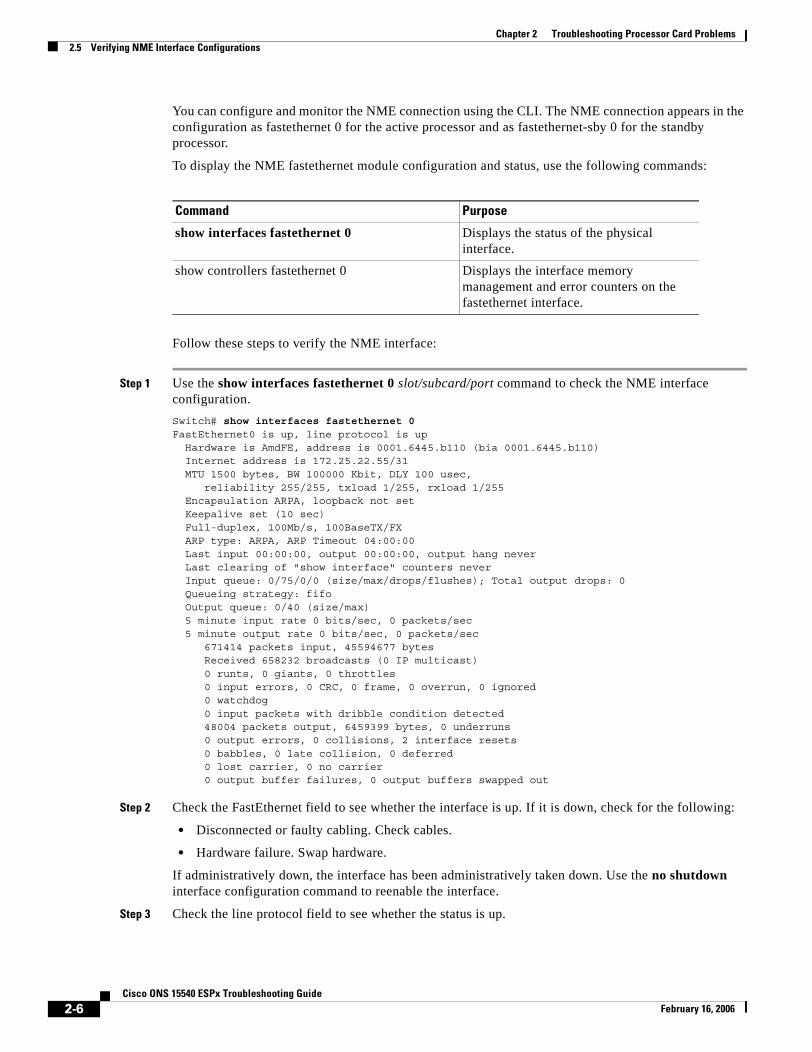
Chapter 2 Troubleshooting Processor Card Problems2.5 Verifying NME Interface Configurations
You can configure and monitor the NME connection using the CLI. The NME connection appears in the configuration as fastethernet 0 for the active processor and as fastethernet-sby 0 for the standby processor.
To display the NME fastethernet module configuration and status, use the following commands:
Follow these steps to verify the NME interface:
Step 1 Use the show interfaces fastethernet 0 slot/subcard/port command to check the NME interface configuration.
Switch# show interfaces fastethernet 0FastEthernet0 is up, line protocol is up Hardware is AmdFE, address is 0001.6445.b110 (bia 0001.6445.b110) Internet address is 172.25.22.55/31 MTU 1500 bytes, BW 100000 Kbit, DLY 100 usec, reliability 255/255, txload 1/255, rxload 1/255 Encapsulation ARPA, loopback not set Keepalive set (10 sec) Full-duplex, 100Mb/s, 100BaseTX/FX ARP type: ARPA, ARP Timeout 04:00:00 Last input 00:00:00, output 00:00:00, output hang never Last clearing of "show interface" counters never Input queue: 0/75/0/0 (size/max/drops/flushes); Total output drops: 0 Queueing strategy: fifo Output queue: 0/40 (size/max) 5 minute input rate 0 bits/sec, 0 packets/sec 5 minute output rate 0 bits/sec, 0 packets/sec 671414 packets input, 45594677 bytes Received 658232 broadcasts (0 IP multicast) 0 runts, 0 giants, 0 throttles 0 input errors, 0 CRC, 0 frame, 0 overrun, 0 ignored 0 watchdog 0 input packets with dribble condition detected 48004 packets output, 6459399 bytes, 0 underruns 0 output errors, 0 collisions, 2 interface resets 0 babbles, 0 late collision, 0 deferred 0 lost carrier, 0 no carrier 0 output buffer failures, 0 output buffers swapped out
Step 2 Check the FastEthernet field to see whether the interface is up. If it is down, check for the following:
• Disconnected or faulty cabling. Check cables.
• Hardware failure. Swap hardware.
If administratively down, the interface has been administratively taken down. Use the no shutdown interface configuration command to reenable the interface.
Step 3 Check the line protocol field to see whether the status is up.
Command Purpose
show interfaces fastethernet 0 Displays the status of the physical interface.
show controllers fastethernet 0 Displays the interface memory management and error counters on the fastethernet interface.
2-6Cisco ONS 15540 ESPx Troubleshooting Guide
February 16, 2006
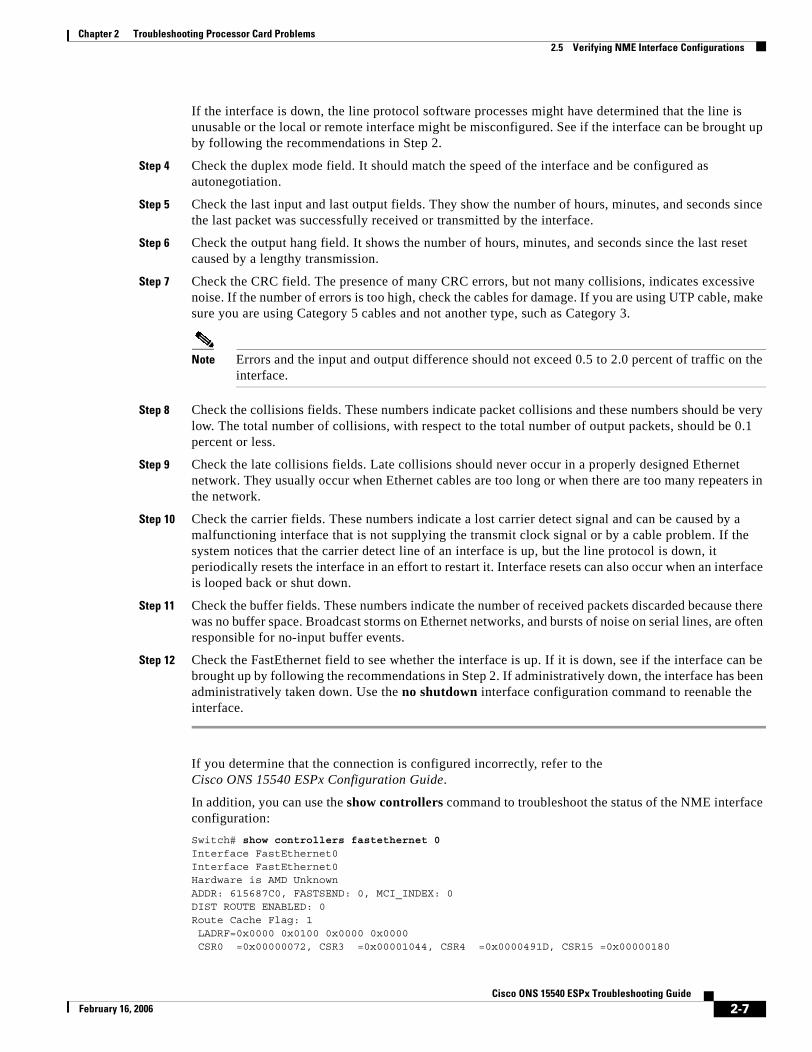
Chapter 2 Troubleshooting Processor Card Problems2.5 Verifying NME Interface Configurations
If the interface is down, the line protocol software processes might have determined that the line is unusable or the local or remote interface might be misconfigured. See if the interface can be brought up by following the recommendations in Step 2.
Step 4 Check the duplex mode field. It should match the speed of the interface and be configured as autonegotiation.
Step 5 Check the last input and last output fields. They show the number of hours, minutes, and seconds since the last packet was successfully received or transmitted by the interface.
Step 6 Check the output hang field. It shows the number of hours, minutes, and seconds since the last reset caused by a lengthy transmission.
Step 7 Check the CRC field. The presence of many CRC errors, but not many collisions, indicates excessive noise. If the number of errors is too high, check the cables for damage. If you are using UTP cable, make sure you are using Category 5 cables and not another type, such as Category 3.
Note Errors and the input and output difference should not exceed 0.5 to 2.0 percent of traffic on the interface.
Step 8 Check the collisions fields. These numbers indicate packet collisions and these numbers should be very low. The total number of collisions, with respect to the total number of output packets, should be 0.1 percent or less.
Step 9 Check the late collisions fields. Late collisions should never occur in a properly designed Ethernet network. They usually occur when Ethernet cables are too long or when there are too many repeaters in the network.
Step 10 Check the carrier fields. These numbers indicate a lost carrier detect signal and can be caused by a malfunctioning interface that is not supplying the transmit clock signal or by a cable problem. If the system notices that the carrier detect line of an interface is up, but the line protocol is down, it periodically resets the interface in an effort to restart it. Interface resets can also occur when an interface is looped back or shut down.
Step 11 Check the buffer fields. These numbers indicate the number of received packets discarded because there was no buffer space. Broadcast storms on Ethernet networks, and bursts of noise on serial lines, are often responsible for no-input buffer events.
Step 12 Check the FastEthernet field to see whether the interface is up. If it is down, see if the interface can be brought up by following the recommendations in Step 2. If administratively down, the interface has been administratively taken down. Use the no shutdown interface configuration command to reenable the interface.
If you determine that the connection is configured incorrectly, refer to theCisco ONS 15540 ESPx Configuration Guide.
In addition, you can use the show controllers command to troubleshoot the status of the NME interface configuration:
Switch# show controllers fastethernet 0Interface FastEthernet0Interface FastEthernet0Hardware is AMD UnknownADDR: 615687C0, FASTSEND: 0, MCI_INDEX: 0DIST ROUTE ENABLED: 0Route Cache Flag: 1 LADRF=0x0000 0x0100 0x0000 0x0000 CSR0 =0x00000072, CSR3 =0x00001044, CSR4 =0x0000491D, CSR15 =0x00000180
2-7Cisco ONS 15540 ESPx Troubleshooting Guide
February 16, 2006
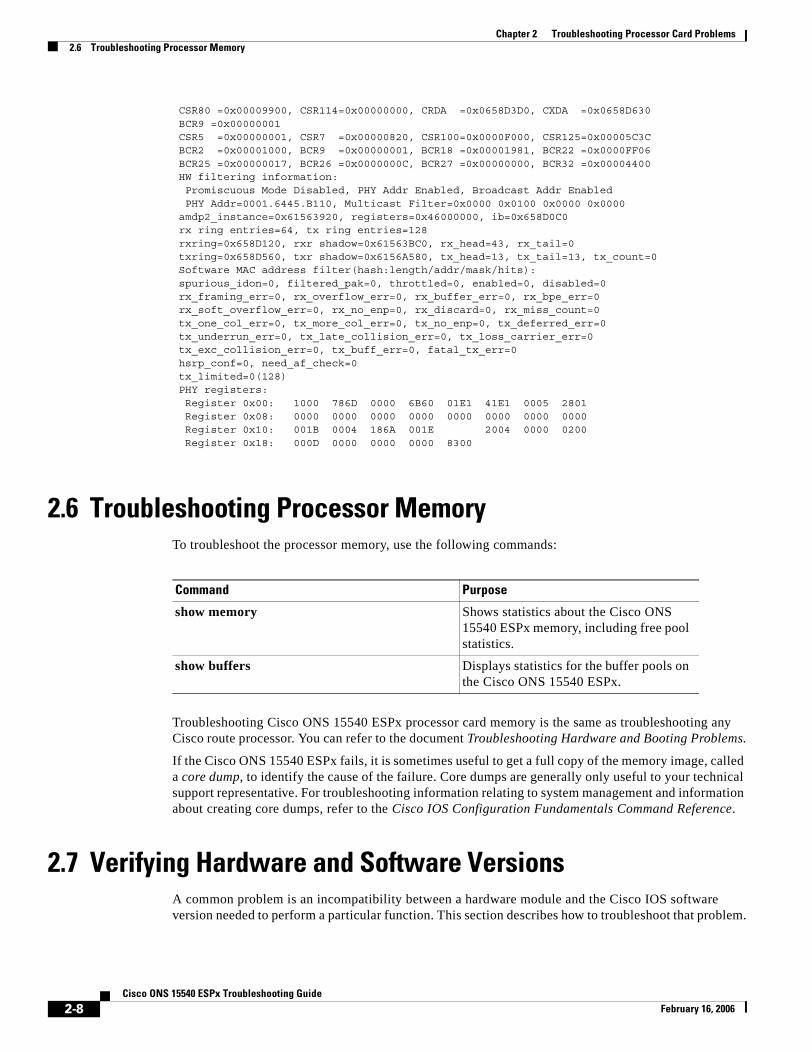
Chapter 2 Troubleshooting Processor Card Problems2.6 Troubleshooting Processor Memory
CSR80 =0x00009900, CSR114=0x00000000, CRDA =0x0658D3D0, CXDA =0x0658D630 BCR9 =0x00000001 CSR5 =0x00000001, CSR7 =0x00000820, CSR100=0x0000F000, CSR125=0x00005C3C BCR2 =0x00001000, BCR9 =0x00000001, BCR18 =0x00001981, BCR22 =0x0000FF06 BCR25 =0x00000017, BCR26 =0x0000000C, BCR27 =0x00000000, BCR32 =0x00004400 HW filtering information: Promiscuous Mode Disabled, PHY Addr Enabled, Broadcast Addr Enabled PHY Addr=0001.6445.B110, Multicast Filter=0x0000 0x0100 0x0000 0x0000 amdp2_instance=0x61563920, registers=0x46000000, ib=0x658D0C0 rx ring entries=64, tx ring entries=128 rxring=0x658D120, rxr shadow=0x61563BC0, rx_head=43, rx_tail=0 txring=0x658D560, txr shadow=0x6156A580, tx_head=13, tx_tail=13, tx_count=0 Software MAC address filter(hash:length/addr/mask/hits): spurious_idon=0, filtered_pak=0, throttled=0, enabled=0, disabled=0 rx_framing_err=0, rx_overflow_err=0, rx_buffer_err=0, rx_bpe_err=0 rx_soft_overflow_err=0, rx_no_enp=0, rx_discard=0, rx_miss_count=0 tx_one_col_err=0, tx_more_col_err=0, tx_no_enp=0, tx_deferred_err=0 tx_underrun_err=0, tx_late_collision_err=0, tx_loss_carrier_err=0 tx_exc_collision_err=0, tx_buff_err=0, fatal_tx_err=0 hsrp_conf=0, need_af_check=0 tx_limited=0(128) PHY registers: Register 0x00: 1000 786D 0000 6B60 01E1 41E1 0005 2801 Register 0x08: 0000 0000 0000 0000 0000 0000 0000 0000 Register 0x10: 001B 0004 186A 001E 2004 0000 0200 Register 0x18: 000D 0000 0000 0000 8300
2.6 Troubleshooting Processor MemoryTo troubleshoot the processor memory, use the following commands:
Troubleshooting Cisco ONS 15540 ESPx processor card memory is the same as troubleshooting any Cisco route processor. You can refer to the document Troubleshooting Hardware and Booting Problems.
If the Cisco ONS 15540 ESPx fails, it is sometimes useful to get a full copy of the memory image, called a core dump, to identify the cause of the failure. Core dumps are generally only useful to your technical support representative. For troubleshooting information relating to system management and information about creating core dumps, refer to the Cisco IOS Configuration Fundamentals Command Reference.
2.7 Verifying Hardware and Software VersionsA common problem is an incompatibility between a hardware module and the Cisco IOS software version needed to perform a particular function. This section describes how to troubleshoot that problem.
Command Purpose
show memory Shows statistics about the Cisco ONS 15540 ESPx memory, including free pool statistics.
show buffers Displays statistics for the buffer pools on the Cisco ONS 15540 ESPx.
2-8Cisco ONS 15540 ESPx Troubleshooting Guide
February 16, 2006
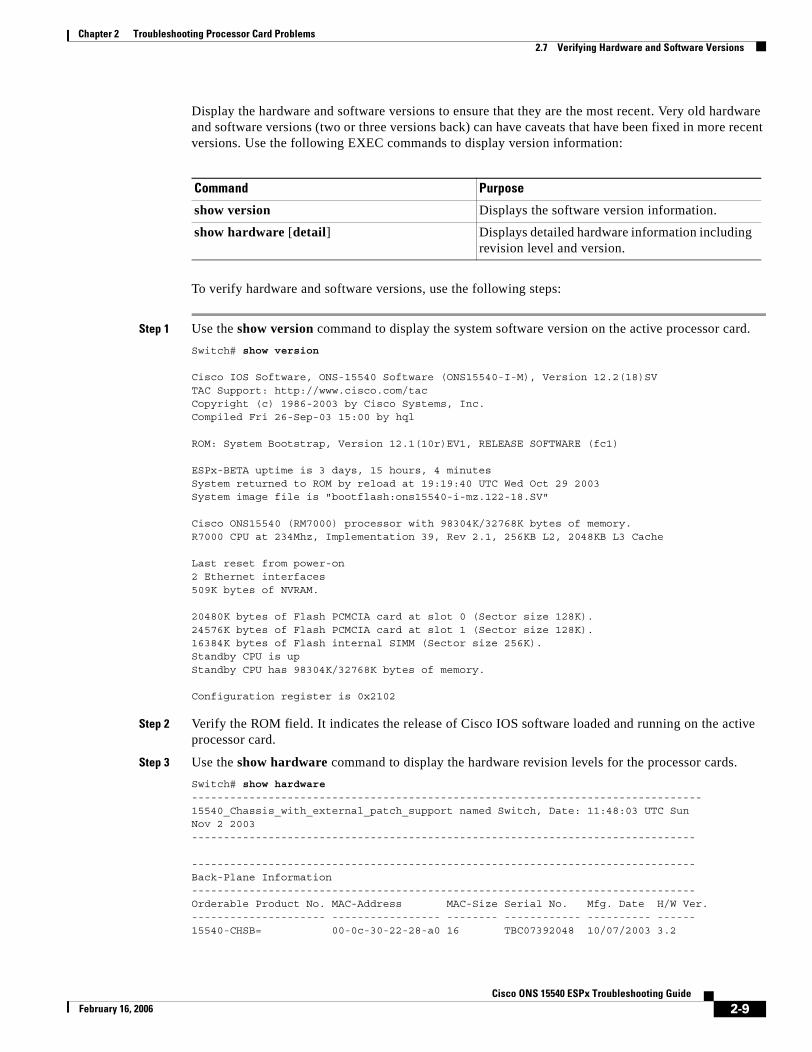
Chapter 2 Troubleshooting Processor Card Problems2.7 Verifying Hardware and Software Versions
Display the hardware and software versions to ensure that they are the most recent. Very old hardware and software versions (two or three versions back) can have caveats that have been fixed in more recent versions. Use the following EXEC commands to display version information:
To verify hardware and software versions, use the following steps:
Step 1 Use the show version command to display the system software version on the active processor card.
Switch# show version
Cisco IOS Software, ONS-15540 Software (ONS15540-I-M), Version 12.2(18)SVTAC Support: http://www.cisco.com/tacCopyright (c) 1986-2003 by Cisco Systems, Inc.Compiled Fri 26-Sep-03 15:00 by hql
ROM: System Bootstrap, Version 12.1(10r)EV1, RELEASE SOFTWARE (fc1)
ESPx-BETA uptime is 3 days, 15 hours, 4 minutesSystem returned to ROM by reload at 19:19:40 UTC Wed Oct 29 2003System image file is "bootflash:ons15540-i-mz.122-18.SV"
Cisco ONS15540 (RM7000) processor with 98304K/32768K bytes of memory.R7000 CPU at 234Mhz, Implementation 39, Rev 2.1, 256KB L2, 2048KB L3 Cache
Last reset from power-on2 Ethernet interfaces509K bytes of NVRAM.
20480K bytes of Flash PCMCIA card at slot 0 (Sector size 128K).24576K bytes of Flash PCMCIA card at slot 1 (Sector size 128K).16384K bytes of Flash internal SIMM (Sector size 256K).Standby CPU is upStandby CPU has 98304K/32768K bytes of memory.
Configuration register is 0x2102
Step 2 Verify the ROM field. It indicates the release of Cisco IOS software loaded and running on the active processor card.
Step 3 Use the show hardware command to display the hardware revision levels for the processor cards.
Switch# show hardware--------------------------------------------------------------------------------15540_Chassis_with_external_patch_support named Switch, Date: 11:48:03 UTC SunNov 2 2003-------------------------------------------------------------------------------
-------------------------------------------------------------------------------Back-Plane Information-------------------------------------------------------------------------------Orderable Product No. MAC-Address MAC-Size Serial No. Mfg. Date H/W Ver.--------------------- ----------------- -------- ------------ ---------- ------15540-CHSB= 00-0c-30-22-28-a0 16 TBC07392048 10/07/2003 3.2
Command Purpose
show version Displays the software version information.
show hardware [detail] Displays detailed hardware information including revision level and version.
2-9Cisco ONS 15540 ESPx Troubleshooting Guide
February 16, 2006
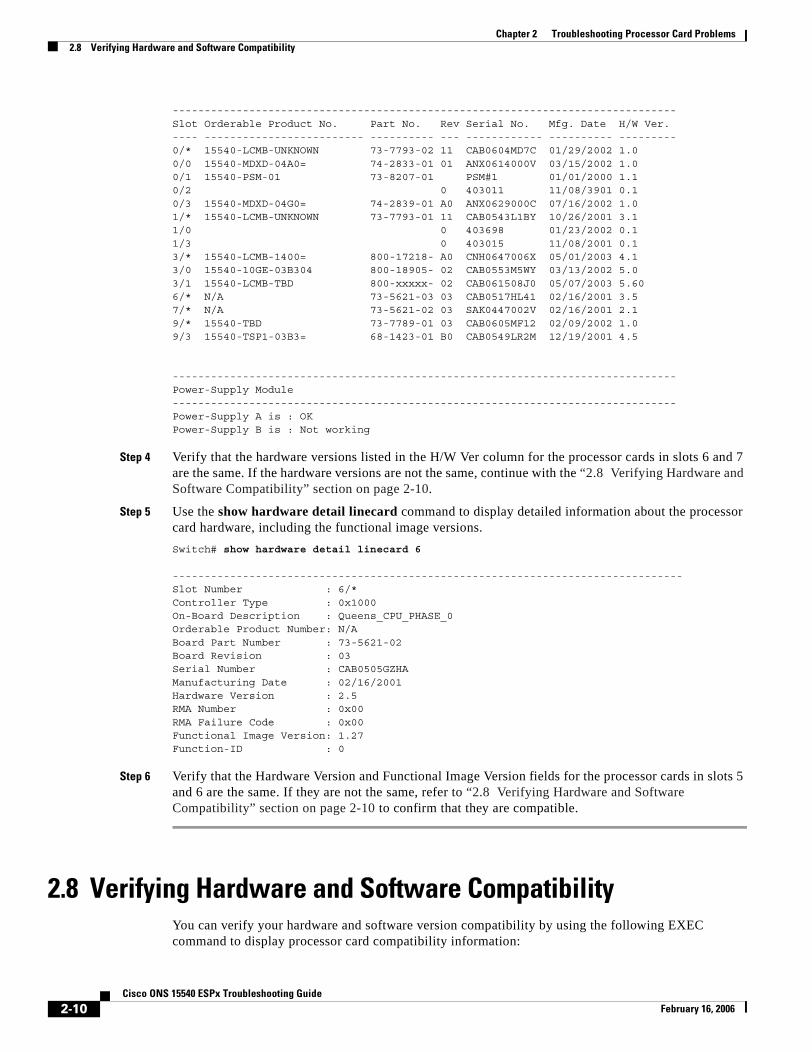
Chapter 2 Troubleshooting Processor Card Problems2.8 Verifying Hardware and Software Compatibility
-------------------------------------------------------------------------------Slot Orderable Product No. Part No. Rev Serial No. Mfg. Date H/W Ver.---- ------------------------- ---------- --- ------------ ---------- ---------0/* 15540-LCMB-UNKNOWN 73-7793-02 11 CAB0604MD7C 01/29/2002 1.00/0 15540-MDXD-04A0= 74-2833-01 01 ANX0614000V 03/15/2002 1.00/1 15540-PSM-01 73-8207-01 PSM#1 01/01/2000 1.10/2 0 403011 11/08/3901 0.10/3 15540-MDXD-04G0= 74-2839-01 A0 ANX0629000C 07/16/2002 1.01/* 15540-LCMB-UNKNOWN 73-7793-01 11 CAB0543L1BY 10/26/2001 3.11/0 0 403698 01/23/2002 0.11/3 0 403015 11/08/2001 0.13/* 15540-LCMB-1400= 800-17218- A0 CNH0647006X 05/01/2003 4.13/0 15540-10GE-03B304 800-18905- 02 CAB0553M5WY 03/13/2002 5.03/1 15540-LCMB-TBD 800-xxxxx- 02 CAB061508J0 05/07/2003 5.606/* N/A 73-5621-03 03 CAB0517HL41 02/16/2001 3.57/* N/A 73-5621-02 03 SAK0447002V 02/16/2001 2.19/* 15540-TBD 73-7789-01 03 CAB0605MF12 02/09/2002 1.09/3 15540-TSP1-03B3= 68-1423-01 B0 CAB0549LR2M 12/19/2001 4.5
-------------------------------------------------------------------------------Power-Supply Module-------------------------------------------------------------------------------Power-Supply A is : OKPower-Supply B is : Not working
Step 4 Verify that the hardware versions listed in the H/W Ver column for the processor cards in slots 6 and 7 are the same. If the hardware versions are not the same, continue with the “2.8 Verifying Hardware and Software Compatibility” section on page 2-10.
Step 5 Use the show hardware detail linecard command to display detailed information about the processor card hardware, including the functional image versions.
Switch# show hardware detail linecard 6
--------------------------------------------------------------------------------Slot Number : 6/*Controller Type : 0x1000On-Board Description : Queens_CPU_PHASE_0Orderable Product Number: N/ABoard Part Number : 73-5621-02Board Revision : 03Serial Number : CAB0505GZHAManufacturing Date : 02/16/2001Hardware Version : 2.5RMA Number : 0x00RMA Failure Code : 0x00Functional Image Version: 1.27Function-ID : 0
Step 6 Verify that the Hardware Version and Functional Image Version fields for the processor cards in slots 5 and 6 are the same. If they are not the same, refer to “2.8 Verifying Hardware and Software Compatibility” section on page 2-10 to confirm that they are compatible.
2.8 Verifying Hardware and Software CompatibilityYou can verify your hardware and software version compatibility by using the following EXEC command to display processor card compatibility information:
2-10Cisco ONS 15540 ESPx Troubleshooting Guide
February 16, 2006
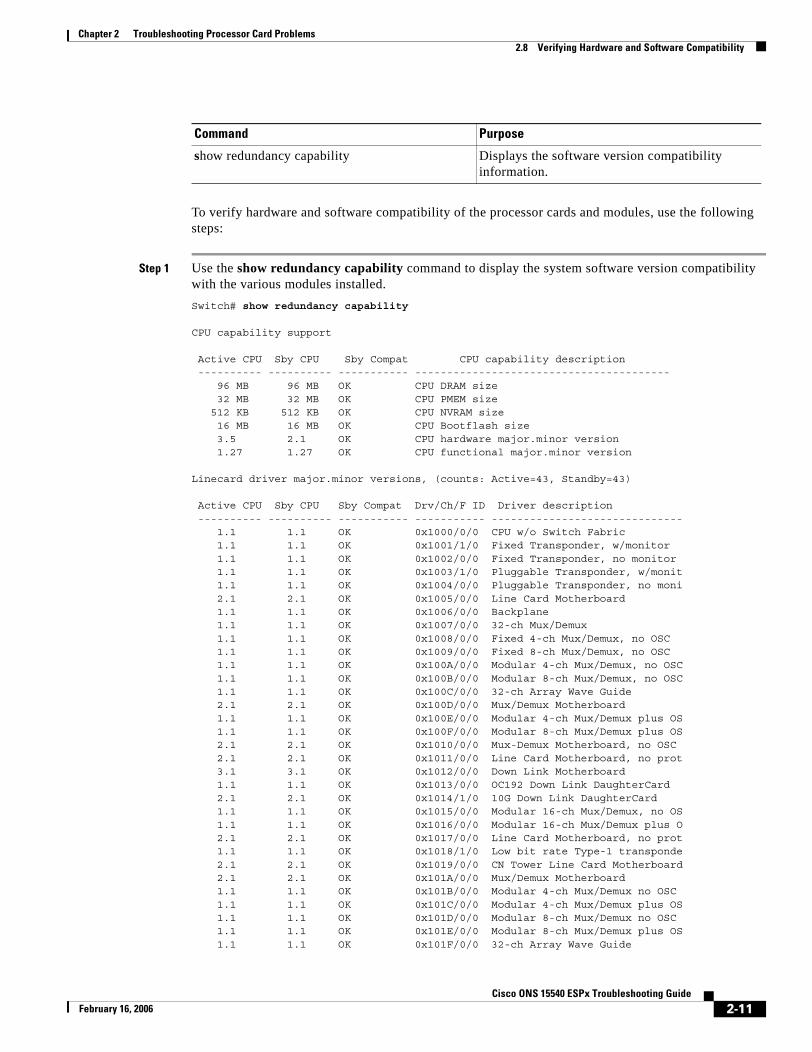
Chapter 2 Troubleshooting Processor Card Problems2.8 Verifying Hardware and Software Compatibility
To verify hardware and software compatibility of the processor cards and modules, use the following steps:
Step 1 Use the show redundancy capability command to display the system software version compatibility with the various modules installed.
Switch# show redundancy capability
CPU capability support
Active CPU Sby CPU Sby Compat CPU capability description ---------- ---------- ----------- ---------------------------------------- 96 MB 96 MB OK CPU DRAM size 32 MB 32 MB OK CPU PMEM size 512 KB 512 KB OK CPU NVRAM size 16 MB 16 MB OK CPU Bootflash size 3.5 2.1 OK CPU hardware major.minor version 1.27 1.27 OK CPU functional major.minor version
Linecard driver major.minor versions, (counts: Active=43, Standby=43)
Active CPU Sby CPU Sby Compat Drv/Ch/F ID Driver description ---------- ---------- ----------- ----------- ------------------------------ 1.1 1.1 OK 0x1000/0/0 CPU w/o Switch Fabric 1.1 1.1 OK 0x1001/1/0 Fixed Transponder, w/monitor 1.1 1.1 OK 0x1002/0/0 Fixed Transponder, no monitor 1.1 1.1 OK 0x1003/1/0 Pluggable Transponder, w/monit 1.1 1.1 OK 0x1004/0/0 Pluggable Transponder, no moni 2.1 2.1 OK 0x1005/0/0 Line Card Motherboard 1.1 1.1 OK 0x1006/0/0 Backplane 1.1 1.1 OK 0x1007/0/0 32-ch Mux/Demux 1.1 1.1 OK 0x1008/0/0 Fixed 4-ch Mux/Demux, no OSC 1.1 1.1 OK 0x1009/0/0 Fixed 8-ch Mux/Demux, no OSC 1.1 1.1 OK 0x100A/0/0 Modular 4-ch Mux/Demux, no OSC 1.1 1.1 OK 0x100B/0/0 Modular 8-ch Mux/Demux, no OSC 1.1 1.1 OK 0x100C/0/0 32-ch Array Wave Guide 2.1 2.1 OK 0x100D/0/0 Mux/Demux Motherboard 1.1 1.1 OK 0x100E/0/0 Modular 4-ch Mux/Demux plus OS 1.1 1.1 OK 0x100F/0/0 Modular 8-ch Mux/Demux plus OS 2.1 2.1 OK 0x1010/0/0 Mux-Demux Motherboard, no OSC 2.1 2.1 OK 0x1011/0/0 Line Card Motherboard, no prot 3.1 3.1 OK 0x1012/0/0 Down Link Motherboard 1.1 1.1 OK 0x1013/0/0 OC192 Down Link DaughterCard 2.1 2.1 OK 0x1014/1/0 10G Down Link DaughterCard 1.1 1.1 OK 0x1015/0/0 Modular 16-ch Mux/Demux, no OS 1.1 1.1 OK 0x1016/0/0 Modular 16-ch Mux/Demux plus O 2.1 2.1 OK 0x1017/0/0 Line Card Motherboard, no prot 1.1 1.1 OK 0x1018/1/0 Low bit rate Type-1 transponde 2.1 2.1 OK 0x1019/0/0 CN Tower Line Card Motherboard 2.1 2.1 OK 0x101A/0/0 Mux/Demux Motherboard 1.1 1.1 OK 0x101B/0/0 Modular 4-ch Mux/Demux no OSC 1.1 1.1 OK 0x101C/0/0 Modular 4-ch Mux/Demux plus OS 1.1 1.1 OK 0x101D/0/0 Modular 8-ch Mux/Demux no OSC 1.1 1.1 OK 0x101E/0/0 Modular 8-ch Mux/Demux plus OS 1.1 1.1 OK 0x101F/0/0 32-ch Array Wave Guide
Command Purpose
show redundancy capability Displays the software version compatibility information.
2-11Cisco ONS 15540 ESPx Troubleshooting Guide
February 16, 2006
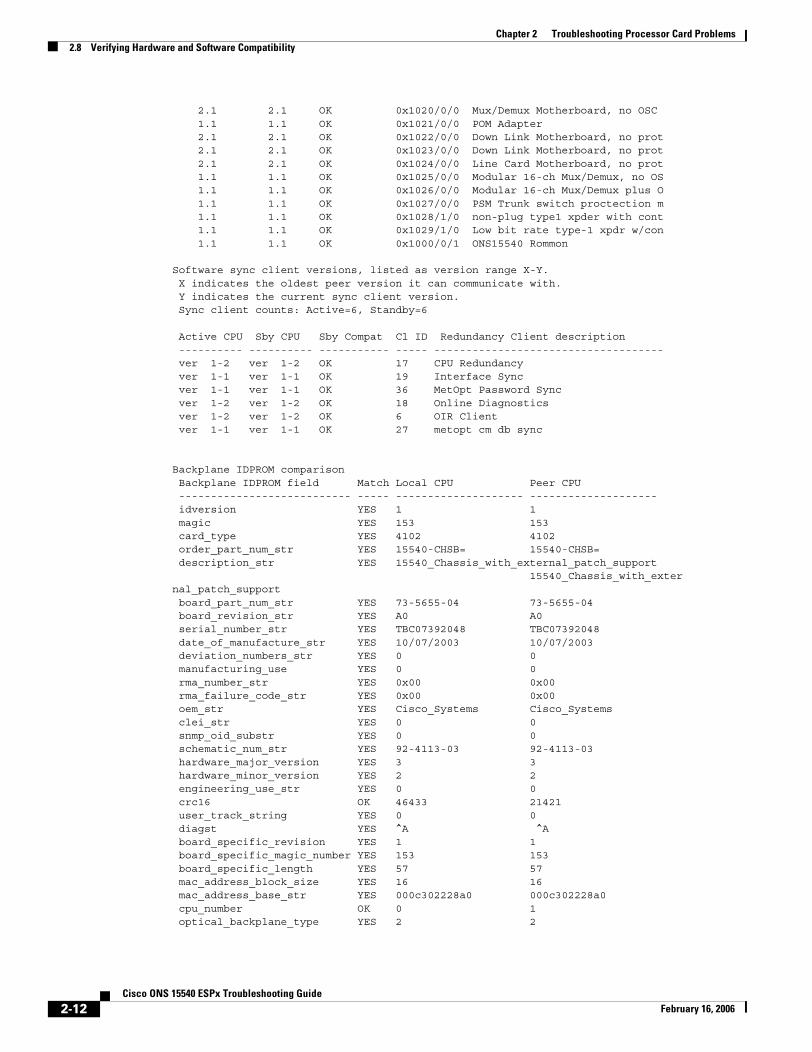
Chapter 2 Troubleshooting Processor Card Problems2.8 Verifying Hardware and Software Compatibility
2.1 2.1 OK 0x1020/0/0 Mux/Demux Motherboard, no OSC 1.1 1.1 OK 0x1021/0/0 POM Adapter 2.1 2.1 OK 0x1022/0/0 Down Link Motherboard, no prot 2.1 2.1 OK 0x1023/0/0 Down Link Motherboard, no prot 2.1 2.1 OK 0x1024/0/0 Line Card Motherboard, no prot 1.1 1.1 OK 0x1025/0/0 Modular 16-ch Mux/Demux, no OS 1.1 1.1 OK 0x1026/0/0 Modular 16-ch Mux/Demux plus O 1.1 1.1 OK 0x1027/0/0 PSM Trunk switch proctection m 1.1 1.1 OK 0x1028/1/0 non-plug type1 xpder with cont 1.1 1.1 OK 0x1029/1/0 Low bit rate type-1 xpdr w/con 1.1 1.1 OK 0x1000/0/1 ONS15540 Rommon
Software sync client versions, listed as version range X-Y. X indicates the oldest peer version it can communicate with. Y indicates the current sync client version. Sync client counts: Active=6, Standby=6
Active CPU Sby CPU Sby Compat Cl ID Redundancy Client description ---------- ---------- ----------- ----- ------------------------------------ ver 1-2 ver 1-2 OK 17 CPU Redundancy ver 1-1 ver 1-1 OK 19 Interface Sync ver 1-1 ver 1-1 OK 36 MetOpt Password Sync ver 1-2 ver 1-2 OK 18 Online Diagnostics ver 1-2 ver 1-2 OK 6 OIR Client ver 1-1 ver 1-1 OK 27 metopt cm db sync
Backplane IDPROM comparison Backplane IDPROM field Match Local CPU Peer CPU --------------------------- ----- -------------------- -------------------- idversion YES 1 1 magic YES 153 153 card_type YES 4102 4102 order_part_num_str YES 15540-CHSB= 15540-CHSB= description_str YES 15540_Chassis_with_external_patch_support 15540_Chassis_with_external_patch_support board_part_num_str YES 73-5655-04 73-5655-04 board_revision_str YES A0 A0 serial_number_str YES TBC07392048 TBC07392048 date_of_manufacture_str YES 10/07/2003 10/07/2003 deviation_numbers_str YES 0 0 manufacturing_use YES 0 0 rma_number_str YES 0x00 0x00 rma_failure_code_str YES 0x00 0x00 oem_str YES Cisco_Systems Cisco_Systems clei_str YES 0 0 snmp_oid_substr YES 0 0 schematic_num_str YES 92-4113-03 92-4113-03 hardware_major_version YES 3 3 hardware_minor_version YES 2 2 engineering_use_str YES 0 0 crc16 OK 46433 21421 user_track_string YES 0 0 diagst YES ^A ^A board_specific_revision YES 1 1 board_specific_magic_number YES 153 153 board_specific_length YES 57 57 mac_address_block_size YES 16 16 mac_address_base_str YES 000c302228a0 000c302228a0 cpu_number OK 0 1 optical_backplane_type YES 2 2
2-12Cisco ONS 15540 ESPx Troubleshooting Guide
February 16, 2006
Chapter 2 Troubleshooting Processor Card Problems2.9 Troubleshooting Redundant Processor Cards
Step 2 Check the processor memory sizes and versions in the CPU capability description column. The numbers in the Active CPU and Sby CPU (Standby CPU) columns should match. If not, check the Sby Compat (Standby Compatibility) column. If this column indicates the values are OK, then these values will function as compatible redundant processor cards. If not, swap the processor cards with versions that are compatible.
Step 3 Check the CPU hardware major.minor versions and CPU functional major.minor versions in the CPU capability description column. The numbers in the Active CPU and Sby CPU (Standby CPU) columns should match. If not, check the Sby Compat (Standby Compatibility) columns. If this column indicates the values are OK, then these values will function as compatible redundant processor cards. If not, swap the processor cards with versions that are compatible.
Step 4 Check the information in the Linecard driver section of the display. This section shows the compatibility of the software versions installed on the active and standby processor cards with the various modules installed in the system.
Step 5 Check the Sby Compat (Standby Compatibility) and the Driver description columns. An OK in the Sby Compat column indicates the software version installed on the processor cards supports the drivers on the modules listed.
Step 6 Check the Software sync client version section of the display. The Active CPU, Sby CPU, and Redundancy Client description columns indicate the software versions the two processor cards can use to synchronize their configurations. The version range in the display, shown as X-Y, indicates oldest-current peer client versions. For example, if the version lists 1-2, that indicates version 1 is the oldest version that the current version 2 could synchronize with its configuration.
Step 7 Check the Backplane IDPROM comparison section of the display. Check the Match column. This indicates which elements match, are acceptable, or fail. Some elements do not match but the range is acceptable. For example, the crc16 elements fields never match because the information in the IDPROMs of the two processor cards are different so the checksums never match. But they do appear as OK or compatible.
If any of the drivers are not supported or appear as OK, try updating the images installed on the processor cards. Use the information in the “1.9 Checking Release Notes for Workarounds” section on page 1-12 to upgrade to a more recent version. That should solve a processor card image compatibility problem.
2.9 Troubleshooting Redundant Processor CardsThe Cisco ONS 15540 ESPx supports fault tolerance by allowing a standby processor card to take over if the active processor card fails. This standby, or redundant, processor card runs in hot-standby mode. In hot-standby mode, the standby processor card is partially booted with the Cisco IOS software; however, no configuration is loaded.
At the time of a switchover, the standby processor card takes over as the active processor card and loads the configuration as follows:
• If the running configurations on the active and standby processor card match, the new active processor card uses the running configuration file.
• If the running configurations on the active and standby processor cards do not match, the new active processor card uses the last saved configuration file in its NVRAM (not the NVRAM of the former active processor card).
The former active processor card then becomes the standby processor card.
2-13Cisco ONS 15540 ESPx Troubleshooting Guide
February 16, 2006
Chapter 2 Troubleshooting Processor Card Problems2.9.1 Verifying Hardware and Software Versions of Redundant Processor Cards
Note If the standby processor card is unavailable, a major alarm is reported. Use the show facility-alarm status command to display the redundancy alarm status.
For redundant processor cards to function correctly, your Cisco ONS 15540 ESPx processor cards must meet the following requirements:
• Both processor cards must have compatible hardware configurations.
• ROMMON version 12.1(10r)EV.
• Both processor cards must have compatible releases of Cisco IOS software.
A common error you may encounter is the incompatibility of hardware modules and the Cisco IOS software version needed to perform a particular function.
2.9.1 Verifying Hardware and Software Versions of Redundant Processor CardsTo troubleshoot the processor card hardware and software versions for redundancy, use the following commands:
To troubleshoot the hardware and software versions on the redundant processor card, use the following steps:
Step 1 Use the show version command to display the system software version on the active processor card as described in the “2.7 Verifying Hardware and Software Versions” section on page 2-8.
Step 2 Use the show redundancy summary command to check the configuration and status of the active and standby processor card.
Switch# show redundancy summary
Redundant system information----------------------------Available Uptime: 3 days, 15 hours, 10 minutessysUpTime (switchover clears): 3 days, 15 hours, 10 minutesSwitchover Count: 0
Inter-CPU Communication State: UPLast Restart Reason: Normal boot
Last Running Config sync: 1 day, 16 hours, 56 minutesRunning Config sync status: In SyncLast Startup Config sync: 3 days, 15 hours, 9 minutesStartup Config sync status: In Sync
This CPU is the Active CPU.-------------------------------
Command Purpose
show version Displays the processor card software version information.
show redundancy Displays the hardware and software configurations of the active and standby processor cards.
2-14Cisco ONS 15540 ESPx Troubleshooting Guide
February 16, 2006
Chapter 2 Troubleshooting Processor Card Problems2.9.2 Verifying Redundant Processor Card Functions
Slot: 6Time since CPU Initialized: 3 days, 15 hours, 10 minutesImage Version: ONS-15540 Software (ONS15540-I-M), Version 12.2(18)SV, EARLY DEPLOYMENT RELEASE SOFTWARE (fc1)TAC Support: http://www.cisco.com/tacImage File: bootflash:ons15540-i-mz.122-18.SVSoftware Redundancy State: ACTIVEHardware State: ACTIVEHardware Severity: 0
Peer CPU is the Standby CPU.-------------------------------Slot: 7Time since CPU Initialized: 3 days, 14 hours, 46 minutesImage Version: ONS-15540 Software (ONS15540-I-M), Version 12.2(18)SV, EARLY DEPLOYMENT RELEASE SOFTWARE (fc1)TAC Support: http://www.cisco.com/tacImage File (on sby-CPU): bootflash:ons15540-i-mz.122-18.SVSoftware Redundancy State: STANDBY HOTHardware State: STANDBYHardware Severity: 0Privilege Mode: Enabled
Step 3 Verify the Last Running Config sync and Last Startup Config sync fields. They indicate the last time the running configuration and startup configuration were synchronized between the processor cards.
Step 4 Verify the active, standby, and Slot fields. They indicate in which slot the active processor card is configured.
2.9.2 Verifying Redundant Processor Card FunctionsTo troubleshoot the processor card function capabilities and redundancy, use the following commands:
Command Purpose
show redundancy capability Displays capabilities for the active and standby processor cards.
show redundancy clients Displays internal redundancy software client information, which can be used to debug redundancy software.
show redundancy counters Displays internal redundancy software counter information, which can be used to debug redundancy software.
show redundancy events Displays internal redundancy software event information, which can be used to debug redundancy software.
show redundancy history Displays the internal redundancy software history log, which can be useful for debugging redundancy software.
2-15Cisco ONS 15540 ESPx Troubleshooting Guide
February 16, 2006
Chapter 2 Troubleshooting Processor Card Problems2.9.2 Verifying Redundant Processor Card Functions
Follow these steps to troubleshoot processor card and redundancy capabilities on the system:
Step 1 Use the show redundancy capability command to display capabilities of the active or standby processor cards described in the “2.7 Verifying Hardware and Software Versions” section on page 2-8.
Step 2 Use the show redundancy clients command to display a list of internal redundancy clients.
Switch# show redundancy clients
clientID = 0 clientSeq = 0 RF_INTERNAL_MSG clientID = 6 clientSeq = 180 OIR Client clientID = 7 clientSeq = 190 APS clientID = 17 clientSeq = 230 CPU Redundancy clientID = 18 clientSeq = 280 Online Diagnostics clientID = 19 clientSeq = 300 Interface Sync clientID = 27 clientSeq = 330 metopt cm db sync clientID = 35 clientSeq = 360 History RF Client clientID = 36 clientSeq = 370 MetOpt Password Sync clientID = 65000 clientSeq = 65000 RF_LAST_CLIENT
Step 3 Use the show redundancy counters command to display internal redundancy software counters.
Switch# show redundancy counters
Redundancy Facility OMs comm link up = 0 comm link down down = 0
invalid client tx = 1 null tx by client = 0 tx failures = 0 tx msg length invalid = 0
client not rxing msgs = 0 rx peer msg routing errors = 0 null peer msg rx = 0 errored peer msg rx = 0
buffers tx = 1 tx buffers unavailable = 0 buffers rx = 1 buffer release errors = 0
duplicate client registers = 0 failed to register client = 0 Invalid client syncs = 0
Step 4 Use the show redundancy events command to display internal redundancy software events.
Switch# show redundancy eventsRedundancy Facility Events :
RF_PROG_INITIALIZATION (100)
show redundancy states Displays internal redundancy software state information.
show redundancy summary Displays a summary of internal redundancy software counter information.
Command Purpose
2-16Cisco ONS 15540 ESPx Troubleshooting Guide
February 16, 2006
Chapter 2 Troubleshooting Processor Card Problems2.9.2 Verifying Redundant Processor Card Functions
RF_PROG_STANDBY_COLD (101)RF_PROG_STANDBY_CONFIG (102)RF_PROG_STANDBY_FILESYS (103)RF_PROG_STANDBY_BULK (104)RF_PROG_STANDBY_HOT (105)RF_PROG_ACTIVE_FAST (200)RF_PROG_ACTIVE_DRAIN (201)RF_PROG_ACTIVE_PRECONFIG (202)RF_PROG_ACTIVE_POSTCONFIG (203)RF_PROG_ACTIVE (204)RF_PROG_PLATFORM_SYNC (300)RF_PROG_EXTRALOAD (301)RF_PROG_HANDBACK (302)RF_STATUS_PEER_PRESENCE (400)RF_STATUS_PEER_COMM (401)RF_STATUS_SWACT_INHIBIT (402)RF_STATUS_MAINTENANCE_ENABLE (403)RF_STATUS_MANUAL_SWACT (404)RF_STATUS_REDUNDANCY_MODE_CHANGE (405)RF_STATUS_OPER_REDUNDANCY_MODE_CHANGE (406)RF_REGISTRATION_STATUS (407)RF_EVENT_NEGOTIATE (500)RF_EVENT_START_PROGRESSION (501)RF_EVENT_STANDBY_PROGRESSION (502)RF_EVENT_CLIENT_PROGRESSION (503)RF_EVENT_CONTINUE_PROGRESSION (504)RF_EVENT_LOCAL_PROG_DONE (505)RF_EVENT_PEER_PROG_DONE (506)RF_EVENT_NOTIFICATION_TMO (507)RF_EVENT_SWACT_INHIBIT_TMO (508)RF_EVENT_KEEP_ALIVE (509)RF_EVENT_KEEP_ALIVE_TMO (510)RF_EVENT_GO_ACTIVE (511)RF_EVENT_GO_STANDBY (512)RF_EVENT_GO_ACTIVE_EXTRALOAD (513)RF_EVENT_GO_ACTIVE_HANDBACK (514)
Step 5 Use the show redundancy history command to display internal redundancy software history.
Switch# show redundancy history
4w5d client added: RF_INTERNAL_MSG(0) seq=04w5d client added: RF_LAST_CLIENT(65000) seq=6500000:00:00 client added: History RF Client(35) seq=36000:00:16 client added: CPU Redundancy(17) seq=23000:00:17 client added: Interface Sync(19) seq=30000:00:17 client added: MetOpt Password Sync(36) seq=37000:00:17 *my state = INITIALIZATION(2) *peer state = DISABLED(1)00:00:17 RF_PROG_INITIALIZATION(100) RF_INTERNAL_MSG(0) op=0 rc=1100:00:17 RF_PROG_INITIALIZATION(100) CPU Redundancy(17) op=0 rc=1100:00:17 RF_PROG_INITIALIZATION(100) Interface Sync(19) op=0 rc=1100:00:17 RF_PROG_INITIALIZATION(100) History RF Client(35) op=0 rc=1100:00:17 RF_PROG_INITIALIZATION(100) MetOpt Password Sync(36) op=0 rc=1100:00:17 RF_PROG_INITIALIZATION(100) RF_LAST_CLIENT(65000) op=0 rc=1100:00:17 *my state = NEGOTIATION(3) peer state = DISABLED(1)00:00:17 RF_EVENT_GO_ACTIVE(511) op=000:00:17 *my state = ACTIVE-FAST(9) peer state = DISABLED(1)00:00:17 RF_STATUS_MAINTENANCE_ENABLE(403) CPU Redundancy(17) op=000:00:17 RF_STATUS_MAINTENANCE_ENABLE(403) Interface Sync(19) op=000:00:17 RF_STATUS_MAINTENANCE_ENABLE(403) MetOpt Password Sync(36) op=000:00:17 RF_PROG_ACTIVE_FAST(200) RF_INTERNAL_MSG(0) op=0 rc=1100:00:18 client added: APS(7) seq=19000:00:18 client added: Online Diagnostics(18) seq=28000:00:18 client added: OIR Client(6) seq=180
2-17Cisco ONS 15540 ESPx Troubleshooting Guide
February 16, 2006
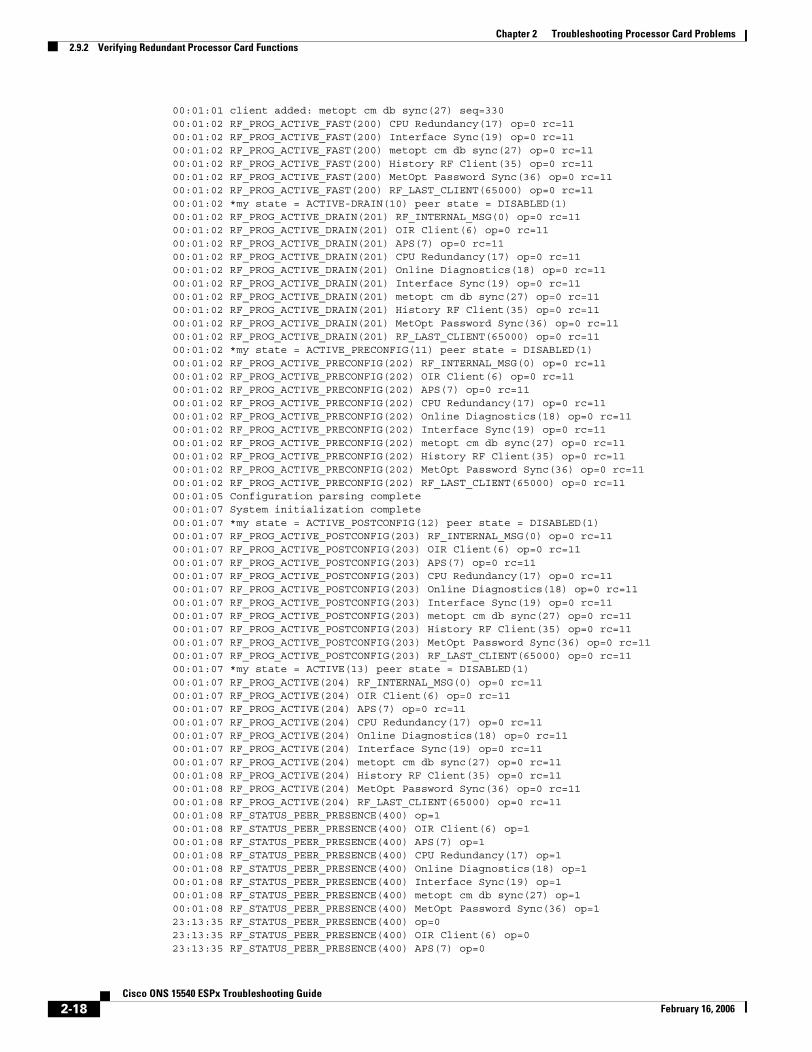
Chapter 2 Troubleshooting Processor Card Problems2.9.2 Verifying Redundant Processor Card Functions
00:01:01 client added: metopt cm db sync(27) seq=33000:01:02 RF_PROG_ACTIVE_FAST(200) CPU Redundancy(17) op=0 rc=1100:01:02 RF_PROG_ACTIVE_FAST(200) Interface Sync(19) op=0 rc=1100:01:02 RF_PROG_ACTIVE_FAST(200) metopt cm db sync(27) op=0 rc=1100:01:02 RF_PROG_ACTIVE_FAST(200) History RF Client(35) op=0 rc=1100:01:02 RF_PROG_ACTIVE_FAST(200) MetOpt Password Sync(36) op=0 rc=1100:01:02 RF_PROG_ACTIVE_FAST(200) RF_LAST_CLIENT(65000) op=0 rc=1100:01:02 *my state = ACTIVE-DRAIN(10) peer state = DISABLED(1)00:01:02 RF_PROG_ACTIVE_DRAIN(201) RF_INTERNAL_MSG(0) op=0 rc=1100:01:02 RF_PROG_ACTIVE_DRAIN(201) OIR Client(6) op=0 rc=1100:01:02 RF_PROG_ACTIVE_DRAIN(201) APS(7) op=0 rc=1100:01:02 RF_PROG_ACTIVE_DRAIN(201) CPU Redundancy(17) op=0 rc=1100:01:02 RF_PROG_ACTIVE_DRAIN(201) Online Diagnostics(18) op=0 rc=1100:01:02 RF_PROG_ACTIVE_DRAIN(201) Interface Sync(19) op=0 rc=1100:01:02 RF_PROG_ACTIVE_DRAIN(201) metopt cm db sync(27) op=0 rc=1100:01:02 RF_PROG_ACTIVE_DRAIN(201) History RF Client(35) op=0 rc=1100:01:02 RF_PROG_ACTIVE_DRAIN(201) MetOpt Password Sync(36) op=0 rc=1100:01:02 RF_PROG_ACTIVE_DRAIN(201) RF_LAST_CLIENT(65000) op=0 rc=1100:01:02 *my state = ACTIVE_PRECONFIG(11) peer state = DISABLED(1)00:01:02 RF_PROG_ACTIVE_PRECONFIG(202) RF_INTERNAL_MSG(0) op=0 rc=1100:01:02 RF_PROG_ACTIVE_PRECONFIG(202) OIR Client(6) op=0 rc=1100:01:02 RF_PROG_ACTIVE_PRECONFIG(202) APS(7) op=0 rc=1100:01:02 RF_PROG_ACTIVE_PRECONFIG(202) CPU Redundancy(17) op=0 rc=1100:01:02 RF_PROG_ACTIVE_PRECONFIG(202) Online Diagnostics(18) op=0 rc=1100:01:02 RF_PROG_ACTIVE_PRECONFIG(202) Interface Sync(19) op=0 rc=1100:01:02 RF_PROG_ACTIVE_PRECONFIG(202) metopt cm db sync(27) op=0 rc=1100:01:02 RF_PROG_ACTIVE_PRECONFIG(202) History RF Client(35) op=0 rc=1100:01:02 RF_PROG_ACTIVE_PRECONFIG(202) MetOpt Password Sync(36) op=0 rc=1100:01:02 RF_PROG_ACTIVE_PRECONFIG(202) RF_LAST_CLIENT(65000) op=0 rc=1100:01:05 Configuration parsing complete00:01:07 System initialization complete00:01:07 *my state = ACTIVE_POSTCONFIG(12) peer state = DISABLED(1)00:01:07 RF_PROG_ACTIVE_POSTCONFIG(203) RF_INTERNAL_MSG(0) op=0 rc=1100:01:07 RF_PROG_ACTIVE_POSTCONFIG(203) OIR Client(6) op=0 rc=1100:01:07 RF_PROG_ACTIVE_POSTCONFIG(203) APS(7) op=0 rc=1100:01:07 RF_PROG_ACTIVE_POSTCONFIG(203) CPU Redundancy(17) op=0 rc=1100:01:07 RF_PROG_ACTIVE_POSTCONFIG(203) Online Diagnostics(18) op=0 rc=1100:01:07 RF_PROG_ACTIVE_POSTCONFIG(203) Interface Sync(19) op=0 rc=1100:01:07 RF_PROG_ACTIVE_POSTCONFIG(203) metopt cm db sync(27) op=0 rc=1100:01:07 RF_PROG_ACTIVE_POSTCONFIG(203) History RF Client(35) op=0 rc=1100:01:07 RF_PROG_ACTIVE_POSTCONFIG(203) MetOpt Password Sync(36) op=0 rc=1100:01:07 RF_PROG_ACTIVE_POSTCONFIG(203) RF_LAST_CLIENT(65000) op=0 rc=1100:01:07 *my state = ACTIVE(13) peer state = DISABLED(1)00:01:07 RF_PROG_ACTIVE(204) RF_INTERNAL_MSG(0) op=0 rc=1100:01:07 RF_PROG_ACTIVE(204) OIR Client(6) op=0 rc=1100:01:07 RF_PROG_ACTIVE(204) APS(7) op=0 rc=1100:01:07 RF_PROG_ACTIVE(204) CPU Redundancy(17) op=0 rc=1100:01:07 RF_PROG_ACTIVE(204) Online Diagnostics(18) op=0 rc=1100:01:07 RF_PROG_ACTIVE(204) Interface Sync(19) op=0 rc=1100:01:07 RF_PROG_ACTIVE(204) metopt cm db sync(27) op=0 rc=1100:01:08 RF_PROG_ACTIVE(204) History RF Client(35) op=0 rc=1100:01:08 RF_PROG_ACTIVE(204) MetOpt Password Sync(36) op=0 rc=1100:01:08 RF_PROG_ACTIVE(204) RF_LAST_CLIENT(65000) op=0 rc=1100:01:08 RF_STATUS_PEER_PRESENCE(400) op=100:01:08 RF_STATUS_PEER_PRESENCE(400) OIR Client(6) op=100:01:08 RF_STATUS_PEER_PRESENCE(400) APS(7) op=100:01:08 RF_STATUS_PEER_PRESENCE(400) CPU Redundancy(17) op=100:01:08 RF_STATUS_PEER_PRESENCE(400) Online Diagnostics(18) op=100:01:08 RF_STATUS_PEER_PRESENCE(400) Interface Sync(19) op=100:01:08 RF_STATUS_PEER_PRESENCE(400) metopt cm db sync(27) op=100:01:08 RF_STATUS_PEER_PRESENCE(400) MetOpt Password Sync(36) op=123:13:35 RF_STATUS_PEER_PRESENCE(400) op=023:13:35 RF_STATUS_PEER_PRESENCE(400) OIR Client(6) op=023:13:35 RF_STATUS_PEER_PRESENCE(400) APS(7) op=0
2-18Cisco ONS 15540 ESPx Troubleshooting Guide
February 16, 2006
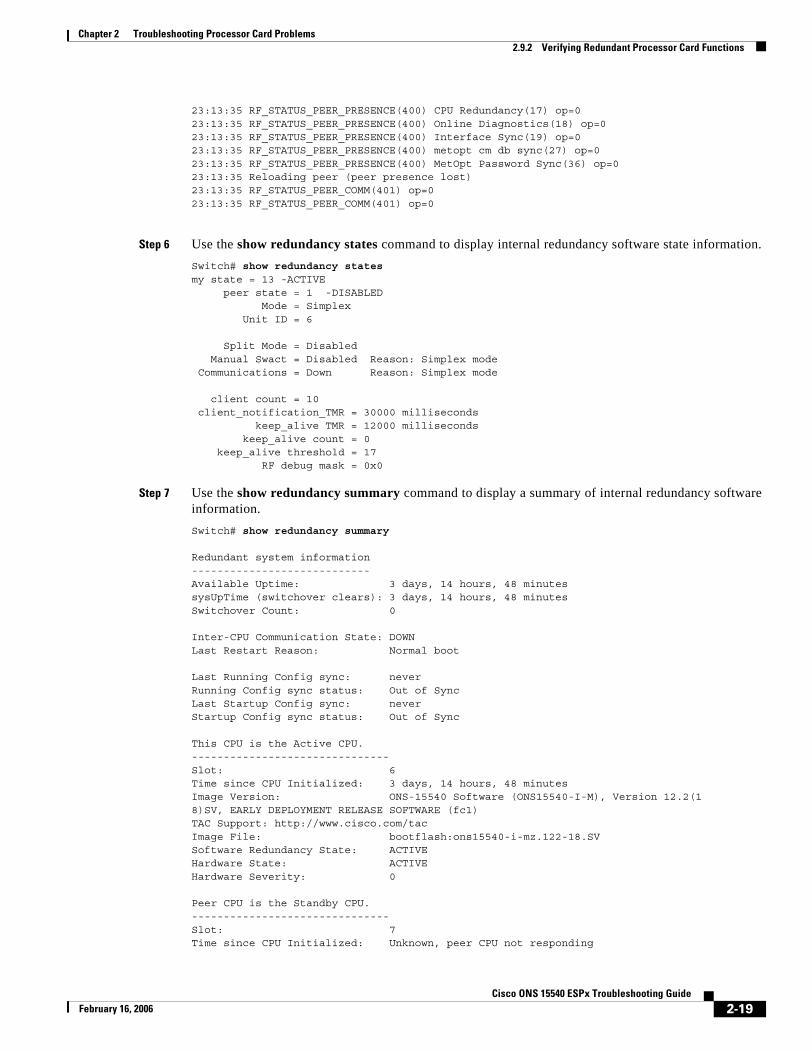
Chapter 2 Troubleshooting Processor Card Problems2.9.2 Verifying Redundant Processor Card Functions
23:13:35 RF_STATUS_PEER_PRESENCE(400) CPU Redundancy(17) op=023:13:35 RF_STATUS_PEER_PRESENCE(400) Online Diagnostics(18) op=023:13:35 RF_STATUS_PEER_PRESENCE(400) Interface Sync(19) op=023:13:35 RF_STATUS_PEER_PRESENCE(400) metopt cm db sync(27) op=023:13:35 RF_STATUS_PEER_PRESENCE(400) MetOpt Password Sync(36) op=023:13:35 Reloading peer (peer presence lost)23:13:35 RF_STATUS_PEER_COMM(401) op=023:13:35 RF_STATUS_PEER_COMM(401) op=0
Step 6 Use the show redundancy states command to display internal redundancy software state information.
Switch# show redundancy statesmy state = 13 -ACTIVE peer state = 1 -DISABLED Mode = Simplex Unit ID = 6
Split Mode = Disabled Manual Swact = Disabled Reason: Simplex mode Communications = Down Reason: Simplex mode
client count = 10 client_notification_TMR = 30000 milliseconds keep_alive TMR = 12000 milliseconds keep_alive count = 0 keep_alive threshold = 17 RF debug mask = 0x0
Step 7 Use the show redundancy summary command to display a summary of internal redundancy software information.
Switch# show redundancy summary
Redundant system information----------------------------Available Uptime: 3 days, 14 hours, 48 minutessysUpTime (switchover clears): 3 days, 14 hours, 48 minutesSwitchover Count: 0
Inter-CPU Communication State: DOWNLast Restart Reason: Normal boot
Last Running Config sync: neverRunning Config sync status: Out of SyncLast Startup Config sync: neverStartup Config sync status: Out of Sync
This CPU is the Active CPU.-------------------------------Slot: 6Time since CPU Initialized: 3 days, 14 hours, 48 minutesImage Version: ONS-15540 Software (ONS15540-I-M), Version 12.2(18)SV, EARLY DEPLOYMENT RELEASE SOFTWARE (fc1)TAC Support: http://www.cisco.com/tacImage File: bootflash:ons15540-i-mz.122-18.SVSoftware Redundancy State: ACTIVEHardware State: ACTIVEHardware Severity: 0
Peer CPU is the Standby CPU.-------------------------------Slot: 7Time since CPU Initialized: Unknown, peer CPU not responding
2-19Cisco ONS 15540 ESPx Troubleshooting Guide
February 16, 2006
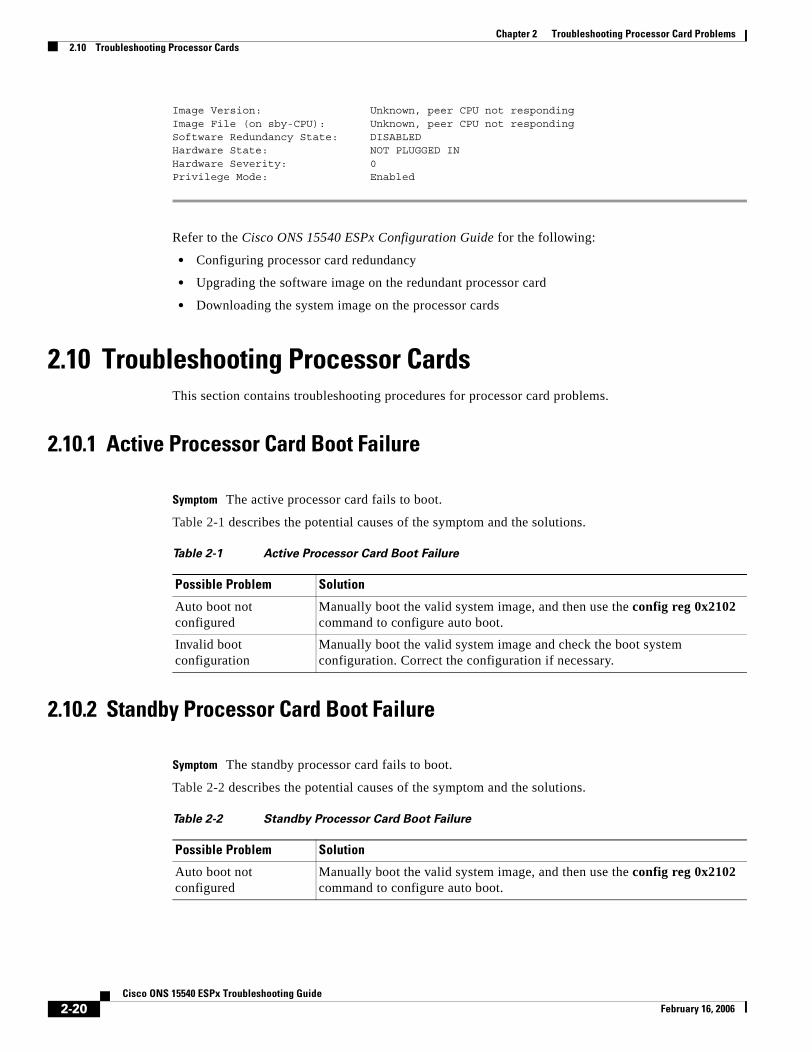
Chapter 2 Troubleshooting Processor Card Problems2.10 Troubleshooting Processor Cards
Image Version: Unknown, peer CPU not respondingImage File (on sby-CPU): Unknown, peer CPU not respondingSoftware Redundancy State: DISABLEDHardware State: NOT PLUGGED INHardware Severity: 0Privilege Mode: Enabled
Refer to the Cisco ONS 15540 ESPx Configuration Guide for the following:
• Configuring processor card redundancy
• Upgrading the software image on the redundant processor card
• Downloading the system image on the processor cards
2.10 Troubleshooting Processor CardsThis section contains troubleshooting procedures for processor card problems.
2.10.1 Active Processor Card Boot Failure
Symptom The active processor card fails to boot.
Table 2-1 describes the potential causes of the symptom and the solutions.
2.10.2 Standby Processor Card Boot Failure
Symptom The standby processor card fails to boot.
Table 2-2 describes the potential causes of the symptom and the solutions.
Table 2-1 Active Processor Card Boot Failure
Possible Problem Solution
Auto boot not configured
Manually boot the valid system image, and then use the config reg 0x2102 command to configure auto boot.
Invalid boot configuration
Manually boot the valid system image and check the boot system configuration. Correct the configuration if necessary.
Table 2-2 Standby Processor Card Boot Failure
Possible Problem Solution
Auto boot not configured
Manually boot the valid system image, and then use the config reg 0x2102 command to configure auto boot.
2-20Cisco ONS 15540 ESPx Troubleshooting Guide
February 16, 2006
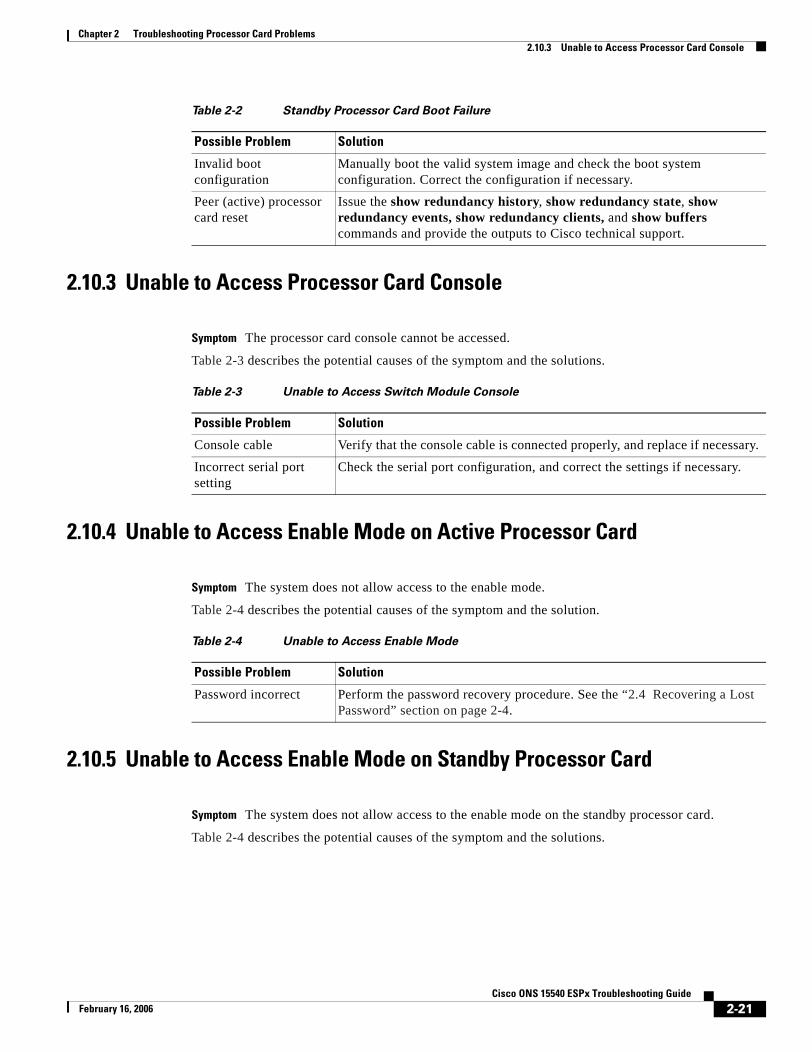
Chapter 2 Troubleshooting Processor Card Problems2.10.3 Unable to Access Processor Card Console
2.10.3 Unable to Access Processor Card Console
Symptom The processor card console cannot be accessed.
Table 2-3 describes the potential causes of the symptom and the solutions.
2.10.4 Unable to Access Enable Mode on Active Processor Card
Symptom The system does not allow access to the enable mode.
Table 2-4 describes the potential causes of the symptom and the solution.
2.10.5 Unable to Access Enable Mode on Standby Processor Card
Symptom The system does not allow access to the enable mode on the standby processor card.
Table 2-4 describes the potential causes of the symptom and the solutions.
Invalid boot configuration
Manually boot the valid system image and check the boot system configuration. Correct the configuration if necessary.
Peer (active) processor card reset
Issue the show redundancy history, show redundancy state, show redundancy events, show redundancy clients, and show buffers commands and provide the outputs to Cisco technical support.
Table 2-2 Standby Processor Card Boot Failure
Possible Problem Solution
Table 2-3 Unable to Access Switch Module Console
Possible Problem Solution
Console cable Verify that the console cable is connected properly, and replace if necessary.
Incorrect serial port setting
Check the serial port configuration, and correct the settings if necessary.
Table 2-4 Unable to Access Enable Mode
Possible Problem Solution
Password incorrect Perform the password recovery procedure. See the “2.4 Recovering a Lost Password” section on page 2-4.
2-21Cisco ONS 15540 ESPx Troubleshooting Guide
February 16, 2006

Chapter 2 Troubleshooting Processor Card Problems2.10.5 Unable to Access Enable Mode on Standby Processor Card
Table 2-5 Unable to Access Enable Mode on Standby Processor Card
Possible Problem Solution
Password incorrect Perform the password recovery procedure. See the “2.4 Recovering a Lost Password” section on page 2-4.
Password synchronization
Check the image on the active and standby processor cards, and update to the latest image if necessary. If the images are the same, issue the show tech and the show log commands and provide the outputs to Cisco technical support.
Standby privilege-mode not enabled
Enable the standby privilege-mode under redundancy configuration.
2-22Cisco ONS 15540 ESPx Troubleshooting Guide
February 16, 2006
CiscoFebruary 16, 2006
C H A P T E R 3
Troubleshooting Mux/Demux Module ProblemsThis chapter describes how to troubleshoot mux/demux module problems. This chapter contains the following sections:
• 3.1 Overview, page 3-1
• 3.2 Initial Troubleshooting Checklist, page 3-2
• 3.3 Troubleshooting Mux/Demux Module Interface Problems, page 3-2
3.1 OverviewThe optical mux/demux motherboards occupy slots 0 and 1 of the Cisco ONS 15540 ESPx chassis. The chassis uses one optical mux/demux motherboard for unprotected operation or two per system for protected operation. The chassis supports the following mux/demux motherboards:
• Cisco ONS 15540 ESPx mux/demux motherboard with OSC
• Cisco ONS 15540 ESPx mux/demux motherboard without OSC
Each Cisco ONS 15540 ESPx mux/demux motherboard can accept up to four 4-channel or 8-channel mux/demux modules or one 32-channel mux/demux module. The modular mux/demux motherboards are available with or without OSC (optical supervisory channel) and can be populated according to user needs.
There are three types of mux/demux modules available:
• 4 channels
• 8 channels
• 32 channels
Channels not filtered are passed on to the next mux/demux module. (See Figure 3-1.)
3-1ONS 15540 ESPx Troubleshooting Guide
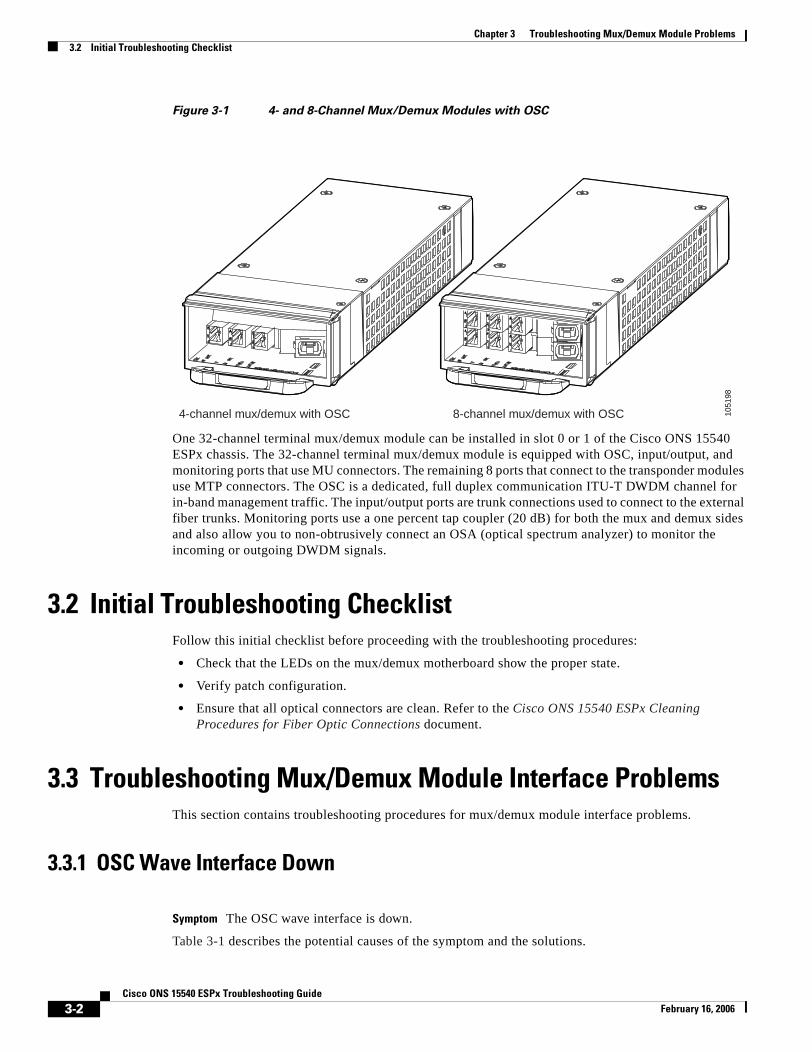
Chapter 3 Troubleshooting Mux/Demux Module Problems3.2 Initial Troubleshooting Checklist
Figure 3-1 4- and 8-Channel Mux/Demux Modules with OSC
One 32-channel terminal mux/demux module can be installed in slot 0 or 1 of the Cisco ONS 15540 ESPx chassis. The 32-channel terminal mux/demux module is equipped with OSC, input/output, and monitoring ports that use MU connectors. The remaining 8 ports that connect to the transponder modules use MTP connectors. The OSC is a dedicated, full duplex communication ITU-T DWDM channel for in-band management traffic. The input/output ports are trunk connections used to connect to the external fiber trunks. Monitoring ports use a one percent tap coupler (20 dB) for both the mux and demux sides and also allow you to non-obtrusively connect an OSA (optical spectrum analyzer) to monitor the incoming or outgoing DWDM signals.
3.2 Initial Troubleshooting ChecklistFollow this initial checklist before proceeding with the troubleshooting procedures:
• Check that the LEDs on the mux/demux motherboard show the proper state.
• Verify patch configuration.
• Ensure that all optical connectors are clean. Refer to the Cisco ONS 15540 ESPx Cleaning Procedures for Fiber Optic Connections document.
3.3 Troubleshooting Mux/Demux Module Interface ProblemsThis section contains troubleshooting procedures for mux/demux module interface problems.
3.3.1 OSC Wave Interface Down
Symptom The OSC wave interface is down.
Table 3-1 describes the potential causes of the symptom and the solutions.
1051
98
4-channel mux/demux with OSC 8-channel mux/demux with OSC
3-2Cisco ONS 15540 ESPx Troubleshooting Guide
February 16, 2006
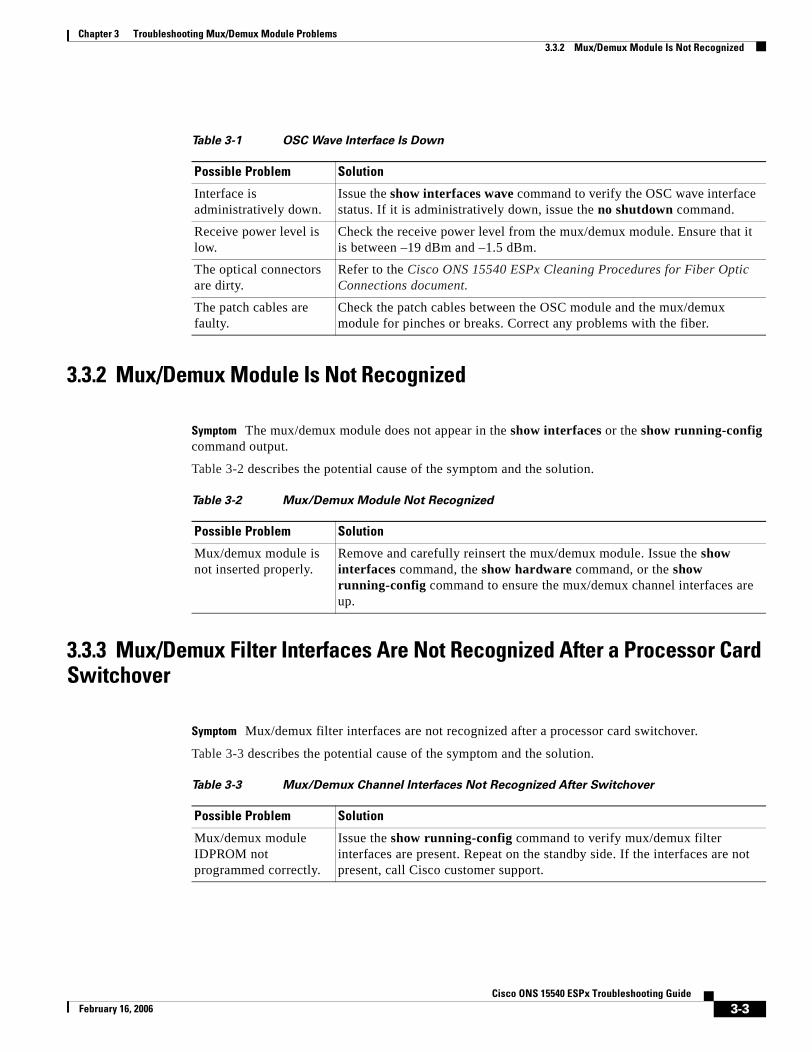
Chapter 3 Troubleshooting Mux/Demux Module Problems3.3.2 Mux/Demux Module Is Not Recognized
3.3.2 Mux/Demux Module Is Not Recognized
Symptom The mux/demux module does not appear in the show interfaces or the show running-config command output.
Table 3-2 describes the potential cause of the symptom and the solution.
3.3.3 Mux/Demux Filter Interfaces Are Not Recognized After a Processor Card Switchover
Symptom Mux/demux filter interfaces are not recognized after a processor card switchover.
Table 3-3 describes the potential cause of the symptom and the solution.
Table 3-1 OSC Wave Interface Is Down
Possible Problem Solution
Interface is administratively down.
Issue the show interfaces wave command to verify the OSC wave interface status. If it is administratively down, issue the no shutdown command.
Receive power level is low.
Check the receive power level from the mux/demux module. Ensure that it is between –19 dBm and –1.5 dBm.
The optical connectors are dirty.
Refer to the Cisco ONS 15540 ESPx Cleaning Procedures for Fiber Optic Connections document.
The patch cables are faulty.
Check the patch cables between the OSC module and the mux/demux module for pinches or breaks. Correct any problems with the fiber.
Table 3-2 Mux/Demux Module Not Recognized
Possible Problem Solution
Mux/demux module is not inserted properly.
Remove and carefully reinsert the mux/demux module. Issue the show interfaces command, the show hardware command, or the show running-config command to ensure the mux/demux channel interfaces are up.
Table 3-3 Mux/Demux Channel Interfaces Not Recognized After Switchover
Possible Problem Solution
Mux/demux module IDPROM not programmed correctly.
Issue the show running-config command to verify mux/demux filter interfaces are present. Repeat on the standby side. If the interfaces are not present, call Cisco customer support.
3-3Cisco ONS 15540 ESPx Troubleshooting Guide
February 16, 2006
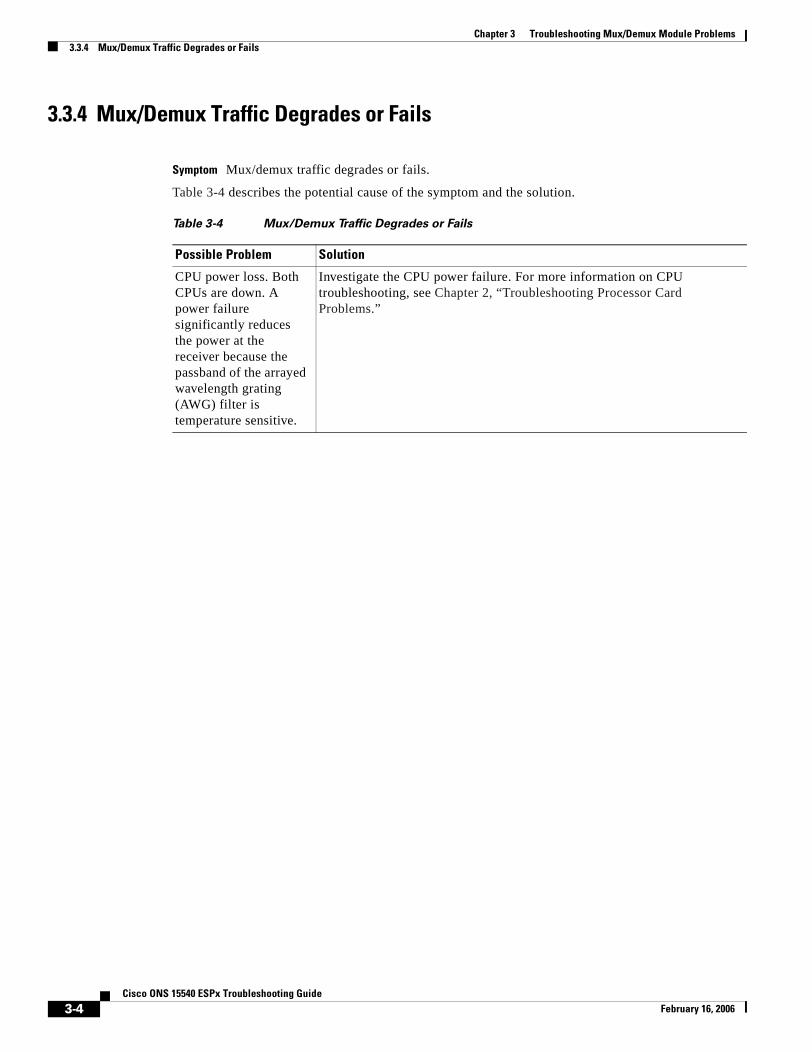
Chapter 3 Troubleshooting Mux/Demux Module Problems3.3.4 Mux/Demux Traffic Degrades or Fails
3.3.4 Mux/Demux Traffic Degrades or Fails
Symptom Mux/demux traffic degrades or fails.
Table 3-4 describes the potential cause of the symptom and the solution.
Table 3-4 Mux/Demux Traffic Degrades or Fails
Possible Problem Solution
CPU power loss. Both CPUs are down. A power failure significantly reduces the power at the receiver because the passband of the arrayed wavelength grating (AWG) filter is temperature sensitive.
Investigate the CPU power failure. For more information on CPU troubleshooting, see Chapter 2, “Troubleshooting Processor Card Problems.”
3-4Cisco ONS 15540 ESPx Troubleshooting Guide
February 16, 2006
CiscoFebruary 16, 2006
C H A P T E R 4
Troubleshooting PSM ProblemsThis chapter describes how to troubleshoot PSM problems. This chapter contains the following sections:
• 4.1 Overview, page 4-1
• 4.2 Initial Troubleshooting Checklist, page 4-1
• 4.3 Troubleshooting PSM Interface Problems, page 4-1
4.1 OverviewThe PSM (protection switch module) provides trunk fiber protection for Cisco ONS 15540 ESPx systems configured in point-to-point topologies. The PSM sends the signal from a mux/demux module or a transponder module to both the west and east directions. It receives both the west and east signals and selects one to send to the mux/demux module or the transponder module. When a trunk fiber cut occurs on the active path, the PSM switches the received signal to the standby path. The PSM can protect up to 32 data channels and the OSC.
The PSM also has an optical monitor port for testing the west and east receive signals. This port samples one percent of the receive signals that can be monitored with an optical power meter.
4.2 Initial Troubleshooting ChecklistFollow this initial checklist before proceeding with the troubleshooting procedures:
• Check that the LEDs on the cards show the proper state.
• Verify patch configuration.
• Ensure that all optical connectors are clean. Refer to the Cisco ONS 15540 ESPx Cleaning Procedures for Fiber Optic Connections document.
4.3 Troubleshooting PSM Interface ProblemsThis section contains troubleshooting procedures for PSM interface problems.
4-1ONS 15540 ESPx Troubleshooting Guide
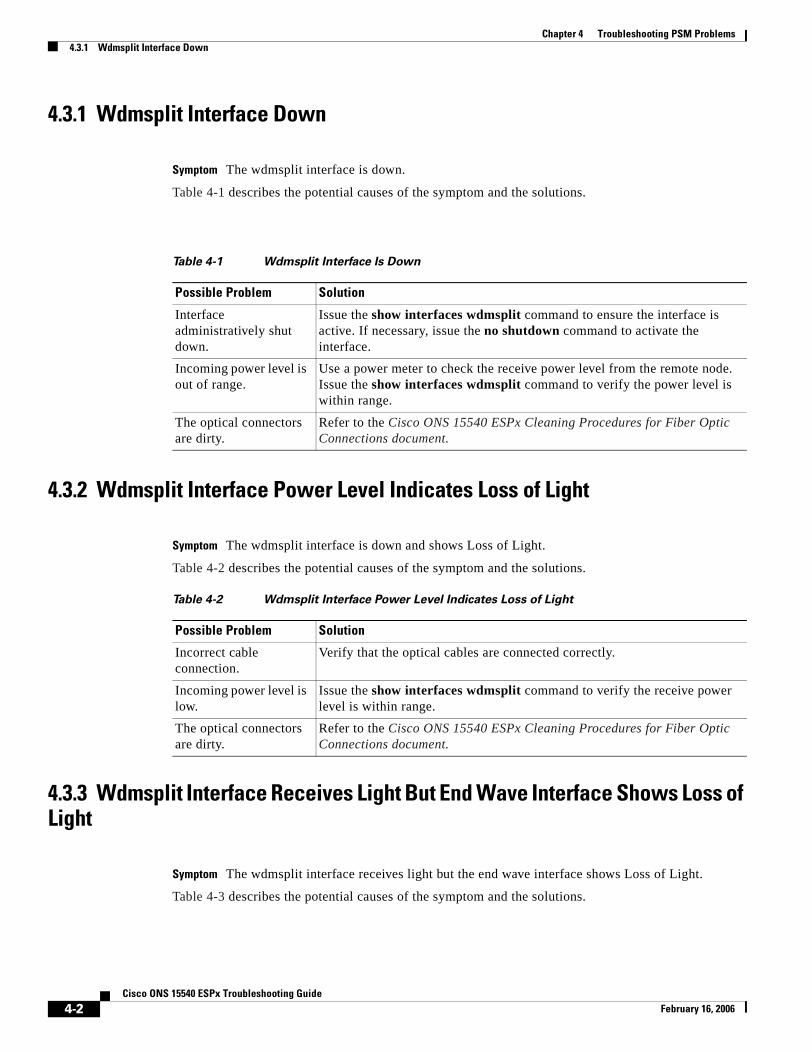
Chapter 4 Troubleshooting PSM Problems4.3.1 Wdmsplit Interface Down
4.3.1 Wdmsplit Interface Down
Symptom The wdmsplit interface is down.
Table 4-1 describes the potential causes of the symptom and the solutions.
4.3.2 Wdmsplit Interface Power Level Indicates Loss of Light
Symptom The wdmsplit interface is down and shows Loss of Light.
Table 4-2 describes the potential causes of the symptom and the solutions.
4.3.3 Wdmsplit Interface Receives Light But End Wave Interface Shows Loss of Light
Symptom The wdmsplit interface receives light but the end wave interface shows Loss of Light.
Table 4-3 describes the potential causes of the symptom and the solutions.
Table 4-1 Wdmsplit Interface Is Down
Possible Problem Solution
Interface administratively shut down.
Issue the show interfaces wdmsplit command to ensure the interface is active. If necessary, issue the no shutdown command to activate the interface.
Incoming power level is out of range.
Use a power meter to check the receive power level from the remote node. Issue the show interfaces wdmsplit command to verify the power level is within range.
The optical connectors are dirty.
Refer to the Cisco ONS 15540 ESPx Cleaning Procedures for Fiber Optic Connections document.
Table 4-2 Wdmsplit Interface Power Level Indicates Loss of Light
Possible Problem Solution
Incorrect cable connection.
Verify that the optical cables are connected correctly.
Incoming power level is low.
Issue the show interfaces wdmsplit command to verify the receive power level is within range.
The optical connectors are dirty.
Refer to the Cisco ONS 15540 ESPx Cleaning Procedures for Fiber Optic Connections document.
4-2Cisco ONS 15540 ESPx Troubleshooting Guide
February 16, 2006
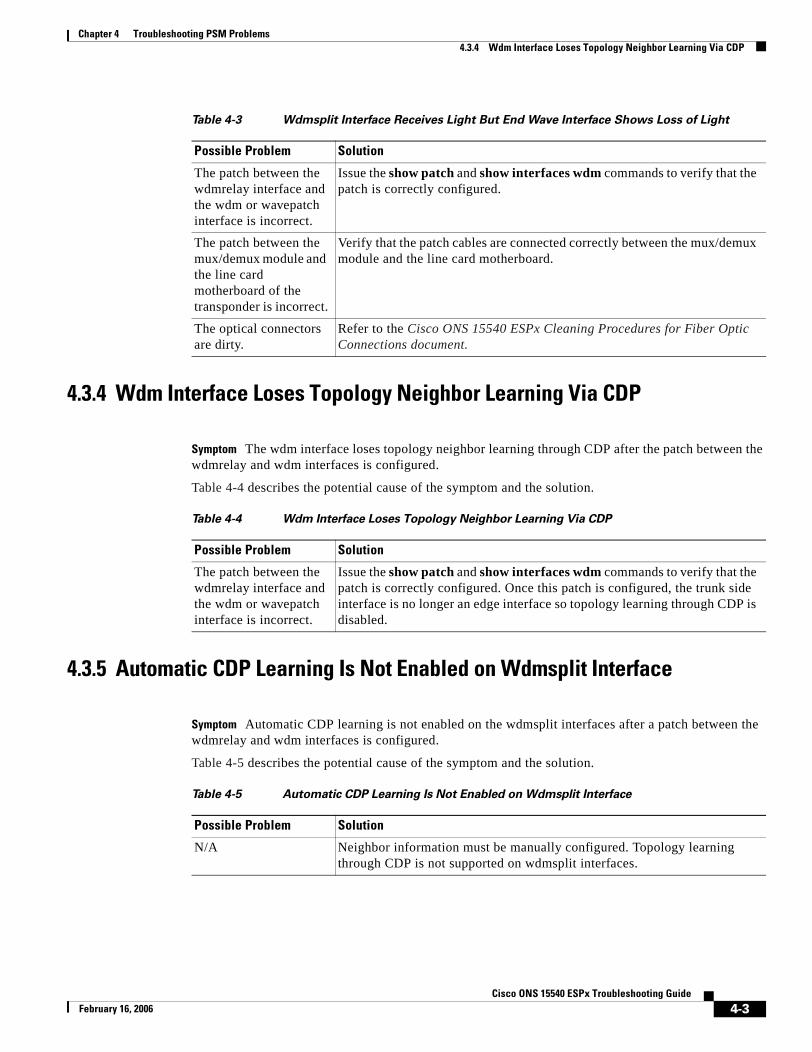
Chapter 4 Troubleshooting PSM Problems4.3.4 Wdm Interface Loses Topology Neighbor Learning Via CDP
4.3.4 Wdm Interface Loses Topology Neighbor Learning Via CDP
Symptom The wdm interface loses topology neighbor learning through CDP after the patch between the wdmrelay and wdm interfaces is configured.
Table 4-4 describes the potential cause of the symptom and the solution.
4.3.5 Automatic CDP Learning Is Not Enabled on Wdmsplit Interface
Symptom Automatic CDP learning is not enabled on the wdmsplit interfaces after a patch between the wdmrelay and wdm interfaces is configured.
Table 4-5 describes the potential cause of the symptom and the solution.
Table 4-3 Wdmsplit Interface Receives Light But End Wave Interface Shows Loss of Light
Possible Problem Solution
The patch between the wdmrelay interface and the wdm or wavepatch interface is incorrect.
Issue the show patch and show interfaces wdm commands to verify that the patch is correctly configured.
The patch between the mux/demux module and the line card motherboard of the transponder is incorrect.
Verify that the patch cables are connected correctly between the mux/demux module and the line card motherboard.
The optical connectors are dirty.
Refer to the Cisco ONS 15540 ESPx Cleaning Procedures for Fiber Optic Connections document.
Table 4-4 Wdm Interface Loses Topology Neighbor Learning Via CDP
Possible Problem Solution
The patch between the wdmrelay interface and the wdm or wavepatch interface is incorrect.
Issue the show patch and show interfaces wdm commands to verify that the patch is correctly configured. Once this patch is configured, the trunk side interface is no longer an edge interface so topology learning through CDP is disabled.
Table 4-5 Automatic CDP Learning Is Not Enabled on Wdmsplit Interface
Possible Problem Solution
N/A Neighbor information must be manually configured. Topology learning through CDP is not supported on wdmsplit interfaces.
4-3Cisco ONS 15540 ESPx Troubleshooting Guide
February 16, 2006

Chapter 4 Troubleshooting PSM Problems4.3.5 Automatic CDP Learning Is Not Enabled on Wdmsplit Interface
4-4Cisco ONS 15540 ESPx Troubleshooting Guide
February 16, 2006
CiscoFebruary 16, 2006
C H A P T E R 5
Troubleshooting 2.5-Gbps Transponder Module ProblemsThis chapter describes how to troubleshoot 2.5-Gbps transponder module problems. This document contains the following sections:
• 5.1 Overview, page 5-1
• 5.2 Initial Troubleshooting Checklist, page 5-2
• 5.3 Cabling the 2.5-Gbps Transponder Module, page 5-2
• 5.4 Troubleshooting 2.5-Gbps Transponder Module Interface Problems, page 5-4
• 5.5 Troubleshooting 2.5-Gbps Transponder Module Problems Using Loopbacks, page 5-7
5.1 OverviewThe 2.5-Gbps transponder module on the Cisco ONS 15540 ESPx converts the client signal to an ITU-compliant wavelength, which is cross-connected over the optical backplane to the mux/demux modules. A single system can hold up to eight 2.5-Gbps line card motherboards, each of which accepts four 2.5-Gbps transponder modules.
There are two types of 2.5-Gbps line card motherboards, splitter and nonsplitter.
The 2.5-Gbps line card motherboards support three types of transponder modules: SM (single-mode), MM (multimode), and Type 2 extended range with SFP optics.
The client interfaces on the SM transponder modules and MM transponder modules are protocol transparent and bit-rate transparent, and accept either single-mode or multimode client signals on the 1310-nm wavelength through SC connectors. The multimode transponder module supports 62.5 µm MM, 50 µm MM, and 9 or 10 µm SM fiber; the single-mode transponder module supports 50 µm MM fiber and 9 or 10 µm SM fiber.
The Type 2 extended range transponder module accepts two types of SFP optics:
• Fixed rate
• Variable rate
Fixed rate SFP optics modules support specific protocols. Variable rate SPF optics modules support a range of clock rates. For detailed information about interface configuration, refer to the Cisco ONS 15540 ESPx Configuration Guide. For information on transceiver specifications, refer to the Cisco ONS 15540 ESPx Hardware Installation Guide.
5-1ONS 15540 ESPx Troubleshooting Guide
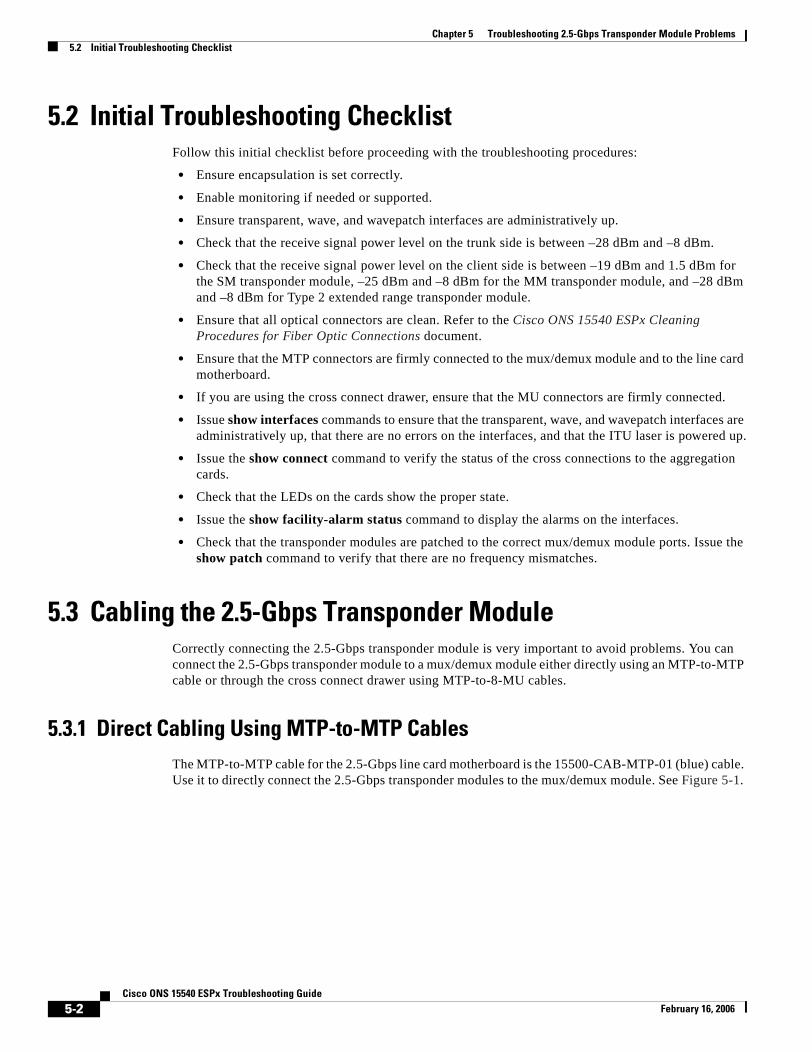
Chapter 5 Troubleshooting 2.5-Gbps Transponder Module Problems5.2 Initial Troubleshooting Checklist
5.2 Initial Troubleshooting ChecklistFollow this initial checklist before proceeding with the troubleshooting procedures:
• Ensure encapsulation is set correctly.
• Enable monitoring if needed or supported.
• Ensure transparent, wave, and wavepatch interfaces are administratively up.
• Check that the receive signal power level on the trunk side is between –28 dBm and –8 dBm.
• Check that the receive signal power level on the client side is between –19 dBm and 1.5 dBm for the SM transponder module, –25 dBm and –8 dBm for the MM transponder module, and –28 dBm and –8 dBm for Type 2 extended range transponder module.
• Ensure that all optical connectors are clean. Refer to the Cisco ONS 15540 ESPx Cleaning Procedures for Fiber Optic Connections document.
• Ensure that the MTP connectors are firmly connected to the mux/demux module and to the line card motherboard.
• If you are using the cross connect drawer, ensure that the MU connectors are firmly connected.
• Issue show interfaces commands to ensure that the transparent, wave, and wavepatch interfaces are administratively up, that there are no errors on the interfaces, and that the ITU laser is powered up.
• Issue the show connect command to verify the status of the cross connections to the aggregation cards.
• Check that the LEDs on the cards show the proper state.
• Issue the show facility-alarm status command to display the alarms on the interfaces.
• Check that the transponder modules are patched to the correct mux/demux module ports. Issue the show patch command to verify that there are no frequency mismatches.
5.3 Cabling the 2.5-Gbps Transponder ModuleCorrectly connecting the 2.5-Gbps transponder module is very important to avoid problems. You can connect the 2.5-Gbps transponder module to a mux/demux module either directly using an MTP-to-MTP cable or through the cross connect drawer using MTP-to-8-MU cables.
5.3.1 Direct Cabling Using MTP-to-MTP CablesThe MTP-to-MTP cable for the 2.5-Gbps line card motherboard is the 15500-CAB-MTP-01 (blue) cable. Use it to directly connect the 2.5-Gbps transponder modules to the mux/demux module. See Figure 5-1.
5-2Cisco ONS 15540 ESPx Troubleshooting Guide
February 16, 2006
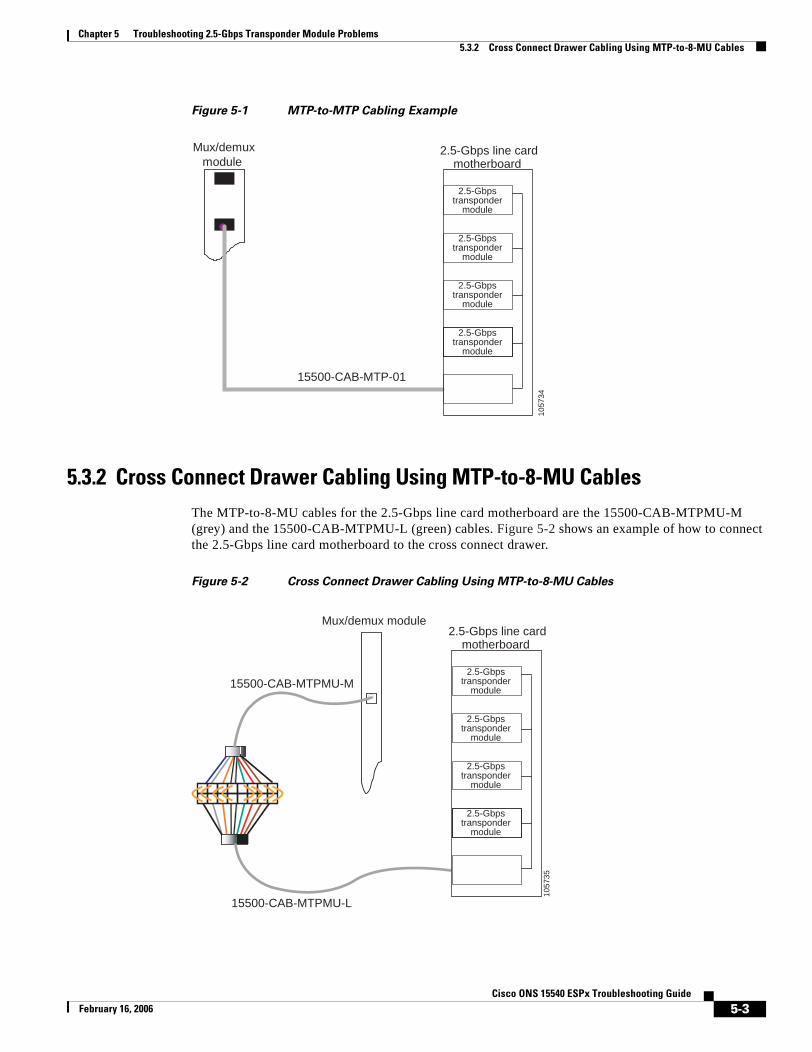
Chapter 5 Troubleshooting 2.5-Gbps Transponder Module Problems5.3.2 Cross Connect Drawer Cabling Using MTP-to-8-MU Cables
Figure 5-1 MTP-to-MTP Cabling Example
5.3.2 Cross Connect Drawer Cabling Using MTP-to-8-MU CablesThe MTP-to-8-MU cables for the 2.5-Gbps line card motherboard are the 15500-CAB-MTPMU-M (grey) and the 15500-CAB-MTPMU-L (green) cables. Figure 5-2 shows an example of how to connect the 2.5-Gbps line card motherboard to the cross connect drawer.
Figure 5-2 Cross Connect Drawer Cabling Using MTP-to-8-MU Cables
1057
34
15500-CAB-MTP-01
Mux/demuxmodule
2.5-Gbps line cardmotherboard
2.5-Gbpstransponder
module
2.5-Gbpstransponder
module
2.5-Gbpstransponder
module
2.5-Gbpstransponder
module
2.5-Gbps line cardmotherboard
Mux/demux module
1057
35
2.5-Gbpstransponder
module
2.5-Gbpstransponder
module
2.5-Gbpstransponder
module
2.5-Gbpstransponder
module
15500-CAB-MTPMU-M
15500-CAB-MTPMU-L
5-3Cisco ONS 15540 ESPx Troubleshooting Guide
February 16, 2006
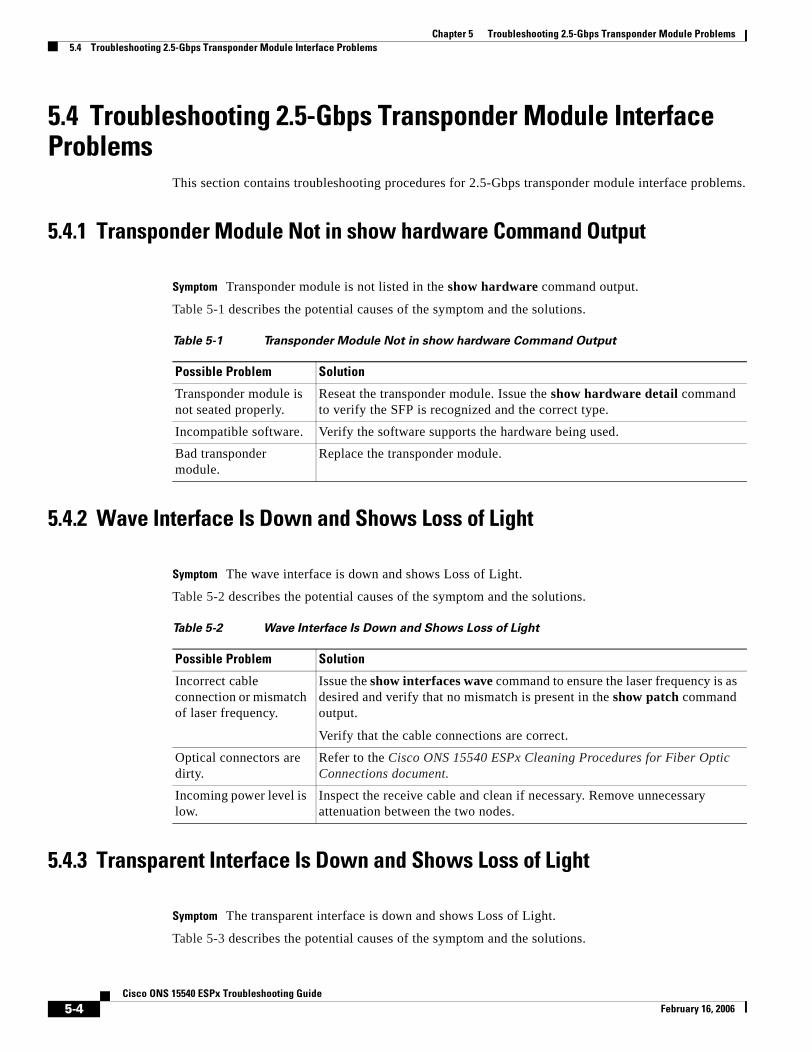
Chapter 5 Troubleshooting 2.5-Gbps Transponder Module Problems5.4 Troubleshooting 2.5-Gbps Transponder Module Interface Problems
5.4 Troubleshooting 2.5-Gbps Transponder Module Interface Problems
This section contains troubleshooting procedures for 2.5-Gbps transponder module interface problems.
5.4.1 Transponder Module Not in show hardware Command Output
Symptom Transponder module is not listed in the show hardware command output.
Table 5-1 describes the potential causes of the symptom and the solutions.
5.4.2 Wave Interface Is Down and Shows Loss of Light
Symptom The wave interface is down and shows Loss of Light.
Table 5-2 describes the potential causes of the symptom and the solutions.
5.4.3 Transparent Interface Is Down and Shows Loss of Light
Symptom The transparent interface is down and shows Loss of Light.
Table 5-3 describes the potential causes of the symptom and the solutions.
Table 5-1 Transponder Module Not in show hardware Command Output
Possible Problem Solution
Transponder module is not seated properly.
Reseat the transponder module. Issue the show hardware detail command to verify the SFP is recognized and the correct type.
Incompatible software. Verify the software supports the hardware being used.
Bad transponder module.
Replace the transponder module.
Table 5-2 Wave Interface Is Down and Shows Loss of Light
Possible Problem Solution
Incorrect cable connection or mismatch of laser frequency.
Issue the show interfaces wave command to ensure the laser frequency is as desired and verify that no mismatch is present in the show patch command output.
Verify that the cable connections are correct.
Optical connectors are dirty.
Refer to the Cisco ONS 15540 ESPx Cleaning Procedures for Fiber Optic Connections document.
Incoming power level is low.
Inspect the receive cable and clean if necessary. Remove unnecessary attenuation between the two nodes.
5-4Cisco ONS 15540 ESPx Troubleshooting Guide
February 16, 2006
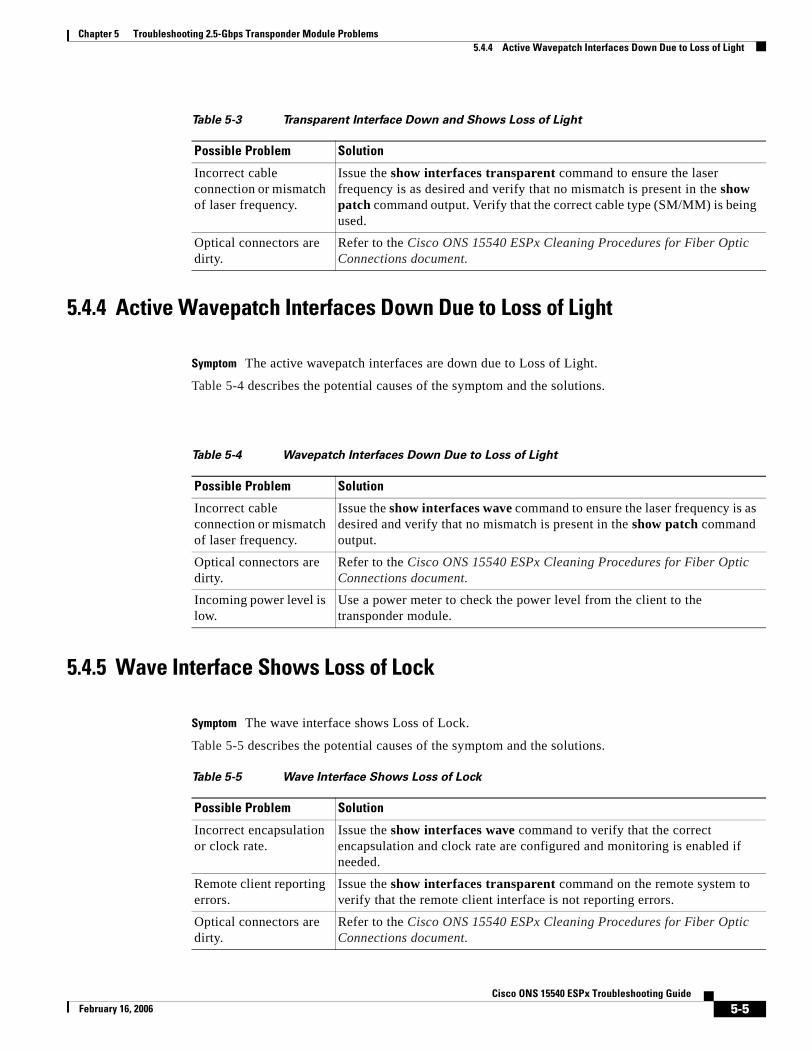
Chapter 5 Troubleshooting 2.5-Gbps Transponder Module Problems5.4.4 Active Wavepatch Interfaces Down Due to Loss of Light
5.4.4 Active Wavepatch Interfaces Down Due to Loss of Light
Symptom The active wavepatch interfaces are down due to Loss of Light.
Table 5-4 describes the potential causes of the symptom and the solutions.
5.4.5 Wave Interface Shows Loss of Lock
Symptom The wave interface shows Loss of Lock.
Table 5-5 describes the potential causes of the symptom and the solutions.
Table 5-3 Transparent Interface Down and Shows Loss of Light
Possible Problem Solution
Incorrect cable connection or mismatch of laser frequency.
Issue the show interfaces transparent command to ensure the laser frequency is as desired and verify that no mismatch is present in the show patch command output. Verify that the correct cable type (SM/MM) is being used.
Optical connectors are dirty.
Refer to the Cisco ONS 15540 ESPx Cleaning Procedures for Fiber Optic Connections document.
Table 5-4 Wavepatch Interfaces Down Due to Loss of Light
Possible Problem Solution
Incorrect cable connection or mismatch of laser frequency.
Issue the show interfaces wave command to ensure the laser frequency is as desired and verify that no mismatch is present in the show patch command output.
Optical connectors are dirty.
Refer to the Cisco ONS 15540 ESPx Cleaning Procedures for Fiber Optic Connections document.
Incoming power level is low.
Use a power meter to check the power level from the client to the transponder module.
Table 5-5 Wave Interface Shows Loss of Lock
Possible Problem Solution
Incorrect encapsulation or clock rate.
Issue the show interfaces wave command to verify that the correct encapsulation and clock rate are configured and monitoring is enabled if needed.
Remote client reporting errors.
Issue the show interfaces transparent command on the remote system to verify that the remote client interface is not reporting errors.
Optical connectors are dirty.
Refer to the Cisco ONS 15540 ESPx Cleaning Procedures for Fiber Optic Connections document.
5-5Cisco ONS 15540 ESPx Troubleshooting Guide
February 16, 2006
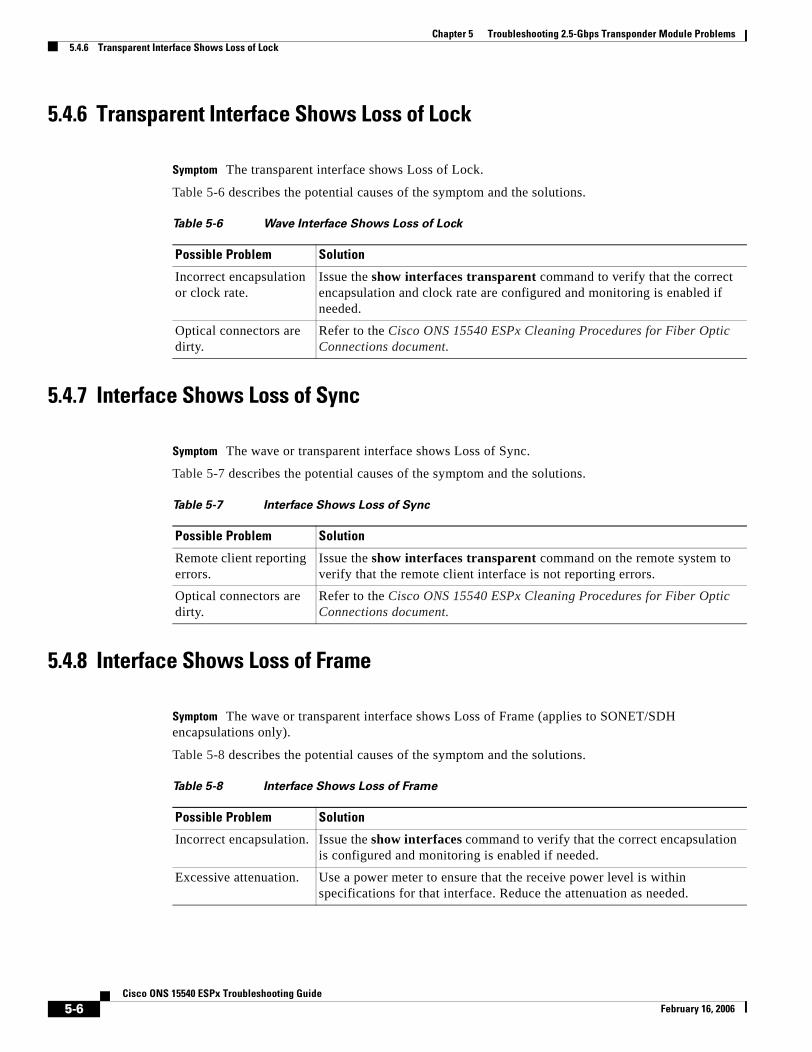
Chapter 5 Troubleshooting 2.5-Gbps Transponder Module Problems5.4.6 Transparent Interface Shows Loss of Lock
5.4.6 Transparent Interface Shows Loss of Lock
Symptom The transparent interface shows Loss of Lock.
Table 5-6 describes the potential causes of the symptom and the solutions.
5.4.7 Interface Shows Loss of Sync
Symptom The wave or transparent interface shows Loss of Sync.
Table 5-7 describes the potential causes of the symptom and the solutions.
5.4.8 Interface Shows Loss of Frame
Symptom The wave or transparent interface shows Loss of Frame (applies to SONET/SDH encapsulations only).
Table 5-8 describes the potential causes of the symptom and the solutions.
Table 5-6 Wave Interface Shows Loss of Lock
Possible Problem Solution
Incorrect encapsulation or clock rate.
Issue the show interfaces transparent command to verify that the correct encapsulation and clock rate are configured and monitoring is enabled if needed.
Optical connectors are dirty.
Refer to the Cisco ONS 15540 ESPx Cleaning Procedures for Fiber Optic Connections document.
Table 5-7 Interface Shows Loss of Sync
Possible Problem Solution
Remote client reporting errors.
Issue the show interfaces transparent command on the remote system to verify that the remote client interface is not reporting errors.
Optical connectors are dirty.
Refer to the Cisco ONS 15540 ESPx Cleaning Procedures for Fiber Optic Connections document.
Table 5-8 Interface Shows Loss of Frame
Possible Problem Solution
Incorrect encapsulation. Issue the show interfaces command to verify that the correct encapsulation is configured and monitoring is enabled if needed.
Excessive attenuation. Use a power meter to ensure that the receive power level is within specifications for that interface. Reduce the attenuation as needed.
5-6Cisco ONS 15540 ESPx Troubleshooting Guide
February 16, 2006
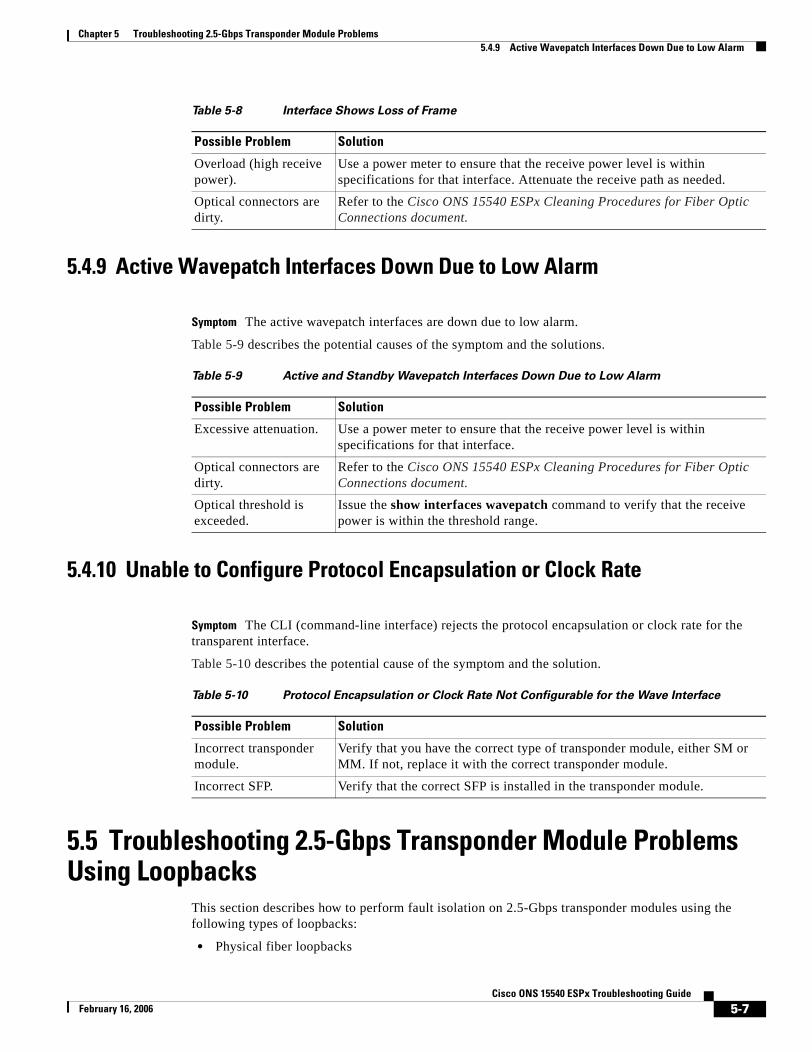
Chapter 5 Troubleshooting 2.5-Gbps Transponder Module Problems5.4.9 Active Wavepatch Interfaces Down Due to Low Alarm
5.4.9 Active Wavepatch Interfaces Down Due to Low Alarm
Symptom The active wavepatch interfaces are down due to low alarm.
Table 5-9 describes the potential causes of the symptom and the solutions.
5.4.10 Unable to Configure Protocol Encapsulation or Clock Rate
Symptom The CLI (command-line interface) rejects the protocol encapsulation or clock rate for the transparent interface.
Table 5-10 describes the potential cause of the symptom and the solution.
5.5 Troubleshooting 2.5-Gbps Transponder Module Problems Using Loopbacks
This section describes how to perform fault isolation on 2.5-Gbps transponder modules using the following types of loopbacks:
• Physical fiber loopbacks
Overload (high receive power).
Use a power meter to ensure that the receive power level is within specifications for that interface. Attenuate the receive path as needed.
Optical connectors are dirty.
Refer to the Cisco ONS 15540 ESPx Cleaning Procedures for Fiber Optic Connections document.
Table 5-8 Interface Shows Loss of Frame
Possible Problem Solution
Table 5-9 Active and Standby Wavepatch Interfaces Down Due to Low Alarm
Possible Problem Solution
Excessive attenuation. Use a power meter to ensure that the receive power level is within specifications for that interface.
Optical connectors are dirty.
Refer to the Cisco ONS 15540 ESPx Cleaning Procedures for Fiber Optic Connections document.
Optical threshold is exceeded.
Issue the show interfaces wavepatch command to verify that the receive power is within the threshold range.
Table 5-10 Protocol Encapsulation or Clock Rate Not Configurable for the Wave Interface
Possible Problem Solution
Incorrect transponder module.
Verify that you have the correct type of transponder module, either SM or MM. If not, replace it with the correct transponder module.
Incorrect SFP. Verify that the correct SFP is installed in the transponder module.
5-7Cisco ONS 15540 ESPx Troubleshooting Guide
February 16, 2006
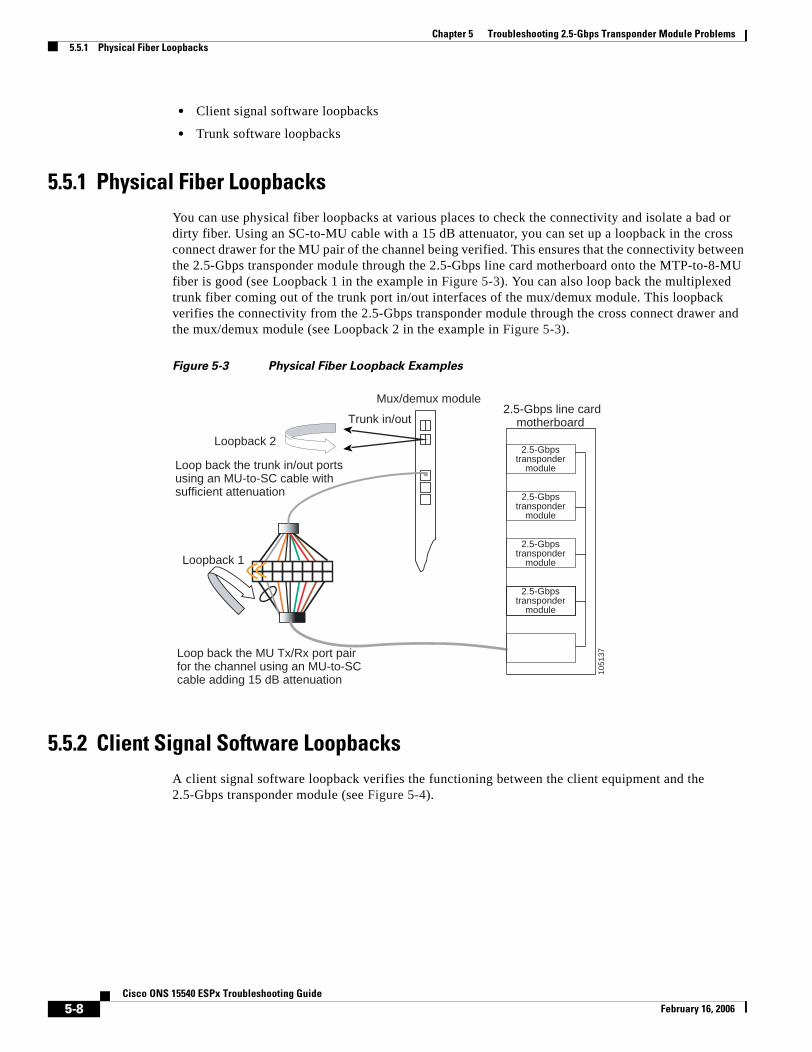
Chapter 5 Troubleshooting 2.5-Gbps Transponder Module Problems5.5.1 Physical Fiber Loopbacks
• Client signal software loopbacks
• Trunk software loopbacks
5.5.1 Physical Fiber LoopbacksYou can use physical fiber loopbacks at various places to check the connectivity and isolate a bad or dirty fiber. Using an SC-to-MU cable with a 15 dB attenuator, you can set up a loopback in the cross connect drawer for the MU pair of the channel being verified. This ensures that the connectivity between the 2.5-Gbps transponder module through the 2.5-Gbps line card motherboard onto the MTP-to-8-MU fiber is good (see Loopback 1 in the example in Figure 5-3). You can also loop back the multiplexed trunk fiber coming out of the trunk port in/out interfaces of the mux/demux module. This loopback verifies the connectivity from the 2.5-Gbps transponder module through the cross connect drawer and the mux/demux module (see Loopback 2 in the example in Figure 5-3).
Figure 5-3 Physical Fiber Loopback Examples
5.5.2 Client Signal Software LoopbacksA client signal software loopback verifies the functioning between the client equipment and the 2.5-Gbps transponder module (see Figure 5-4).
Loop back the MU Tx/Rx port pair for the channel using an MU-to-SC cable adding 15 dB attenuation
2.5-Gbps line cardmotherboard
Mux/demux module
Loop back the trunk in/out ports using an MU-to-SC cable with sufficient attenuation
Loopback 2
Loopback 1
Trunk in/out
1051
37
2.5-Gbpstransponder
module
2.5-Gbpstransponder
module
2.5-Gbpstransponder
module
2.5-Gbpstransponder
module
5-8Cisco ONS 15540 ESPx Troubleshooting Guide
February 16, 2006
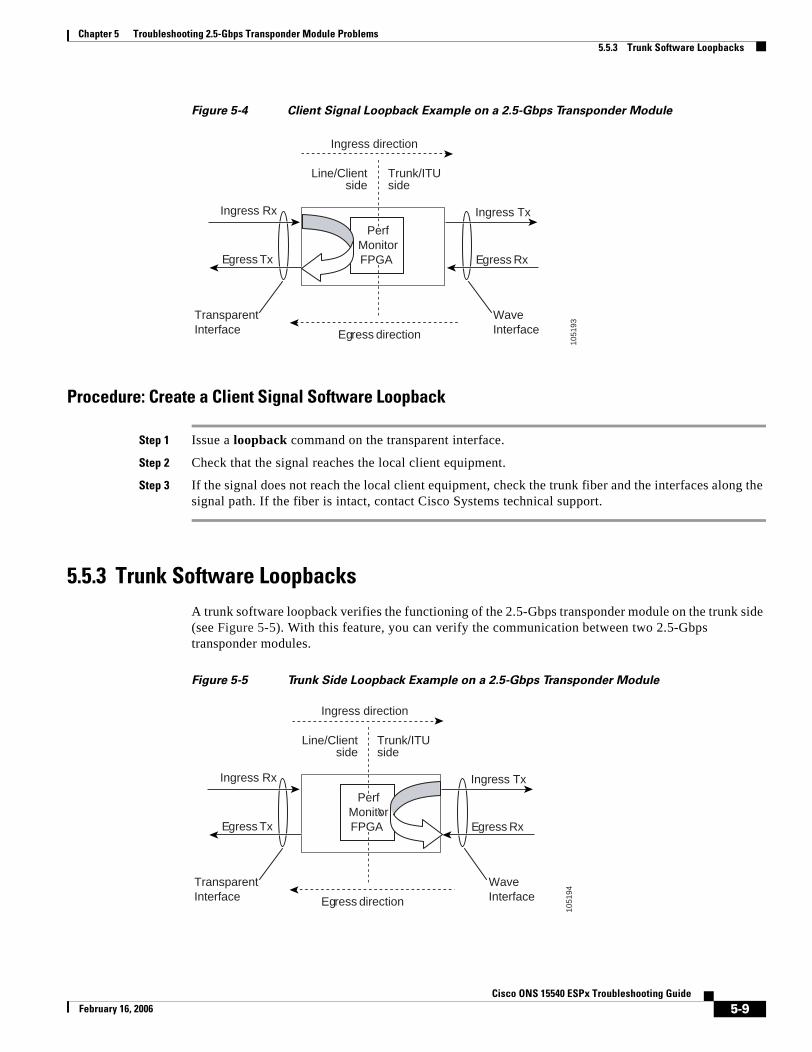
Chapter 5 Troubleshooting 2.5-Gbps Transponder Module Problems5.5.3 Trunk Software Loopbacks
Figure 5-4 Client Signal Loopback Example on a 2.5-Gbps Transponder Module
Procedure: Create a Client Signal Software Loopback
Step 1 Issue a loopback command on the transparent interface.
Step 2 Check that the signal reaches the local client equipment.
Step 3 If the signal does not reach the local client equipment, check the trunk fiber and the interfaces along the signal path. If the fiber is intact, contact Cisco Systems technical support.
5.5.3 Trunk Software LoopbacksA trunk software loopback verifies the functioning of the 2.5-Gbps transponder module on the trunk side (see Figure 5-5). With this feature, you can verify the communication between two 2.5-Gbps transponder modules.
Figure 5-5 Trunk Side Loopback Example on a 2.5-Gbps Transponder Module
Ingress direction
Egress direction
Ingress Tx
Egress Rx
Ingress Rx
Egress Tx
TransparentInterface
WaveInterface
Line/Clientside
Trunk/ITUside
PerfMonitorFPGA
1051
93
Ingress direction
Egress direction
Ingress Tx
Egress Rx
Ingress Rx
Egress Tx
TransparentInterface
WaveInterface
Line/Clientside
Trunk/ITUside
PerfMonitorFPGA
1051
94
5-9Cisco ONS 15540 ESPx Troubleshooting Guide
February 16, 2006

Chapter 5 Troubleshooting 2.5-Gbps Transponder Module Problems5.5.3 Trunk Software Loopbacks
Procedure: Create a Trunk Software Loopback
Step 1 Issue a loopback command on the wave interface.
Step 2 Check that the signal reaches the system at the far end.
Step 3 If the signal does not reach the far end, check the trunk fiber and the interfaces along the signal path. If the fiber is intact, contact Cisco Systems technical support.
5-10Cisco ONS 15540 ESPx Troubleshooting Guide
February 16, 2006

CiscoFebruary 16, 2006
C H A P T E R 6
Troubleshooting 10-GE Transponder Module ProblemsThis chapter describes how to troubleshoot 10-GE transponder module problems. This document contains the following sections:
• 6.1 Overview, page 6-1
• 6.2 Initial Troubleshooting Checklist, page 6-2
• 6.3 Cabling the 10-GE Transponder Module, page 6-3
• 6.4 Troubleshooting 10-GE Transponder Module Interface Problems, page 6-6
• 6.5 Troubleshooting 10-GE Transponder Module Problems Using Loopbacks, page 6-10
6.1 OverviewThe 10-GE transponder module on the Cisco ONS 15540 ESPx implements the 10GBASE-LR IEEE 802.3ae standard. It supports connections to a Cisco ONS 15530 1310-nm 10-Gbps uplink card acting as a downlink and connections to a native 10GBASE-LR or a 10GBASE-ER IEEE 802.3ae MAC implementation. The 10-GE transponder module has one short reach 1310-nm laser on the client side and an ITU DWDM 1550-nm laser at the trunk side.
The 10-Gbps line card motherboard has two half-sized subslots that can accommodate two 10-GE transponder modules. There are two types of 10-Gbps line card motherboards, splitter and nonsplitter.
Figure 6-1 shows the architecture of the 10-GE transponder module.
6-1ONS 15540 ESPx Troubleshooting Guide
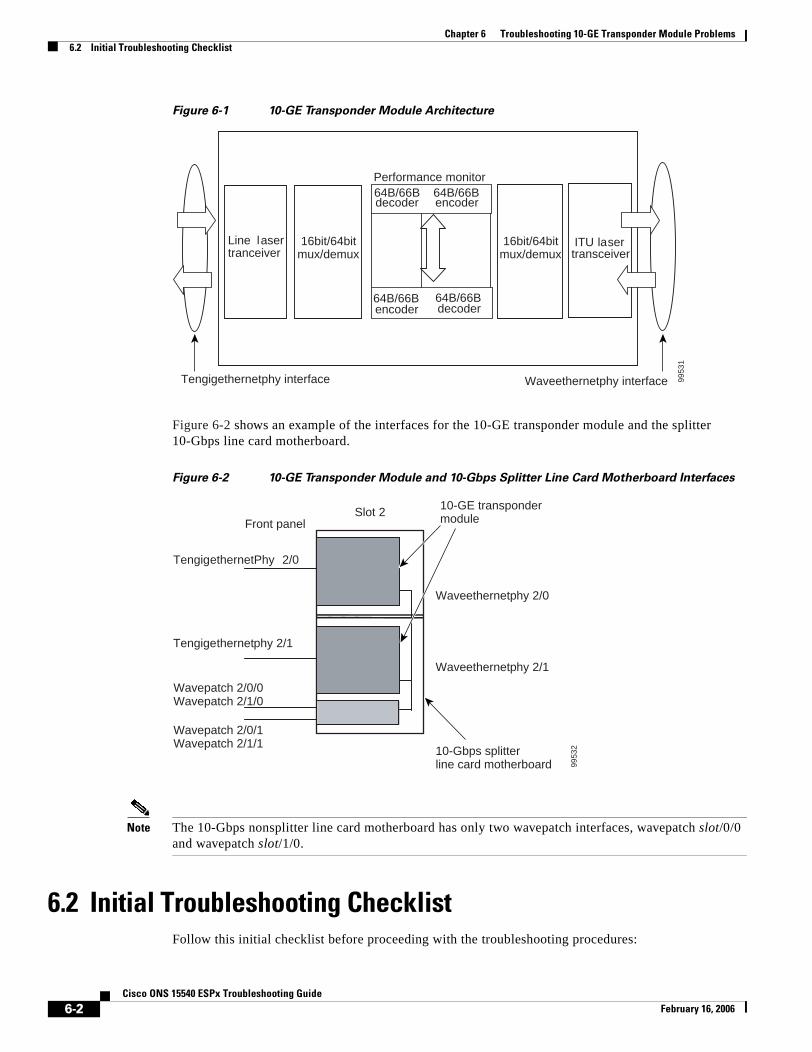
Chapter 6 Troubleshooting 10-GE Transponder Module Problems6.2 Initial Troubleshooting Checklist
Figure 6-1 10-GE Transponder Module Architecture
Figure 6-2 shows an example of the interfaces for the 10-GE transponder module and the splitter 10-Gbps line card motherboard.
Figure 6-2 10-GE Transponder Module and 10-Gbps Splitter Line Card Motherboard Interfaces
Note The 10-Gbps nonsplitter line card motherboard has only two wavepatch interfaces, wavepatch slot/0/0 and wavepatch slot/1/0.
6.2 Initial Troubleshooting ChecklistFollow this initial checklist before proceeding with the troubleshooting procedures:
ITU laser transceiver
16bit/64bit
Line laser tranceiver
Performance monitor
decoder encoder
64B/66Bencoder decoder
64B/66B
64B/66B64B/66B
mux/demux16bit/64bit
mux/demux
9953
1
Tengigethernetphy interface Waveethernetphy interface
Waveethernetphy 2/0
Slot 2
Waveethernetphy 2/1
TengigethernetPhy 2/0
Tengigethernetphy 2/1
Wavepatch 2/0/0 Wavepatch 2/1/0
Wavepatch 2/0/1 Wavepatch 2/1/1
10-Gbps splitter line card motherboard
Front panel
10-GE transpondermodule
9953
2
6-2Cisco ONS 15540 ESPx Troubleshooting Guide
February 16, 2006
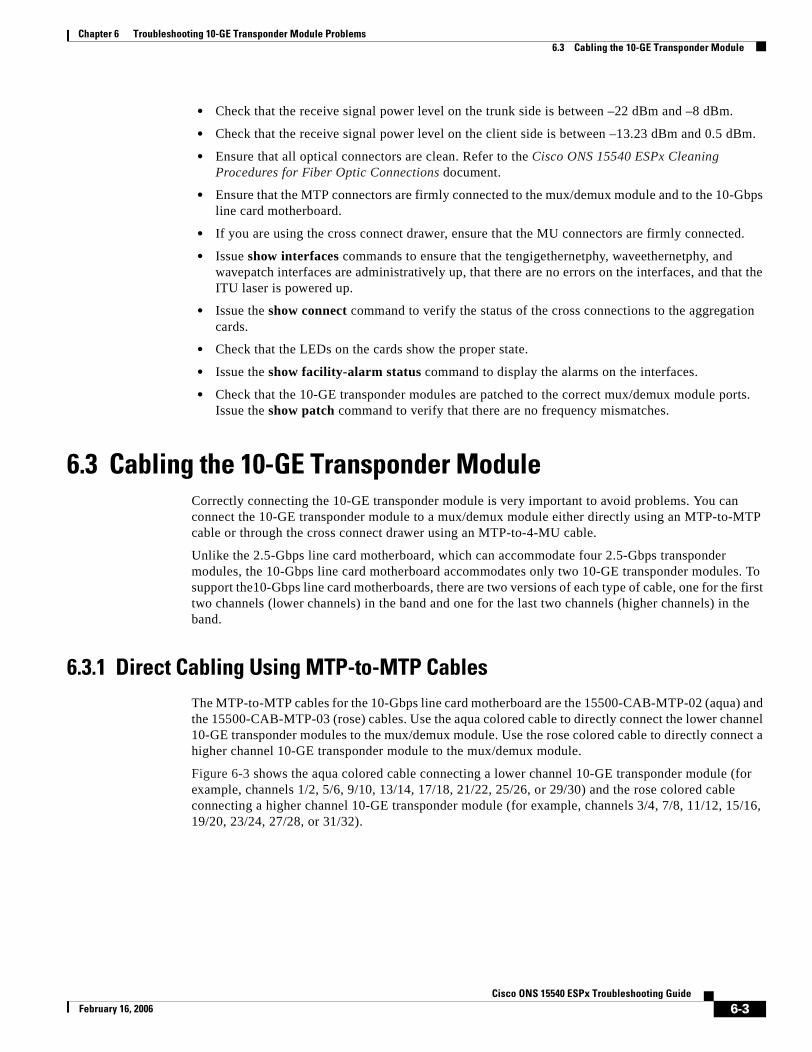
Chapter 6 Troubleshooting 10-GE Transponder Module Problems6.3 Cabling the 10-GE Transponder Module
• Check that the receive signal power level on the trunk side is between –22 dBm and –8 dBm.
• Check that the receive signal power level on the client side is between –13.23 dBm and 0.5 dBm.
• Ensure that all optical connectors are clean. Refer to the Cisco ONS 15540 ESPx Cleaning Procedures for Fiber Optic Connections document.
• Ensure that the MTP connectors are firmly connected to the mux/demux module and to the 10-Gbps line card motherboard.
• If you are using the cross connect drawer, ensure that the MU connectors are firmly connected.
• Issue show interfaces commands to ensure that the tengigethernetphy, waveethernetphy, and wavepatch interfaces are administratively up, that there are no errors on the interfaces, and that the ITU laser is powered up.
• Issue the show connect command to verify the status of the cross connections to the aggregation cards.
• Check that the LEDs on the cards show the proper state.
• Issue the show facility-alarm status command to display the alarms on the interfaces.
• Check that the 10-GE transponder modules are patched to the correct mux/demux module ports. Issue the show patch command to verify that there are no frequency mismatches.
6.3 Cabling the 10-GE Transponder ModuleCorrectly connecting the 10-GE transponder module is very important to avoid problems. You can connect the 10-GE transponder module to a mux/demux module either directly using an MTP-to-MTP cable or through the cross connect drawer using an MTP-to-4-MU cable.
Unlike the 2.5-Gbps line card motherboard, which can accommodate four 2.5-Gbps transponder modules, the 10-Gbps line card motherboard accommodates only two 10-GE transponder modules. To support the10-Gbps line card motherboards, there are two versions of each type of cable, one for the first two channels (lower channels) in the band and one for the last two channels (higher channels) in the band.
6.3.1 Direct Cabling Using MTP-to-MTP CablesThe MTP-to-MTP cables for the 10-Gbps line card motherboard are the 15500-CAB-MTP-02 (aqua) and the 15500-CAB-MTP-03 (rose) cables. Use the aqua colored cable to directly connect the lower channel 10-GE transponder modules to the mux/demux module. Use the rose colored cable to directly connect a higher channel 10-GE transponder module to the mux/demux module.
Figure 6-3 shows the aqua colored cable connecting a lower channel 10-GE transponder module (for example, channels 1/2, 5/6, 9/10, 13/14, 17/18, 21/22, 25/26, or 29/30) and the rose colored cable connecting a higher channel 10-GE transponder module (for example, channels 3/4, 7/8, 11/12, 15/16, 19/20, 23/24, 27/28, or 31/32).
6-3Cisco ONS 15540 ESPx Troubleshooting Guide
February 16, 2006
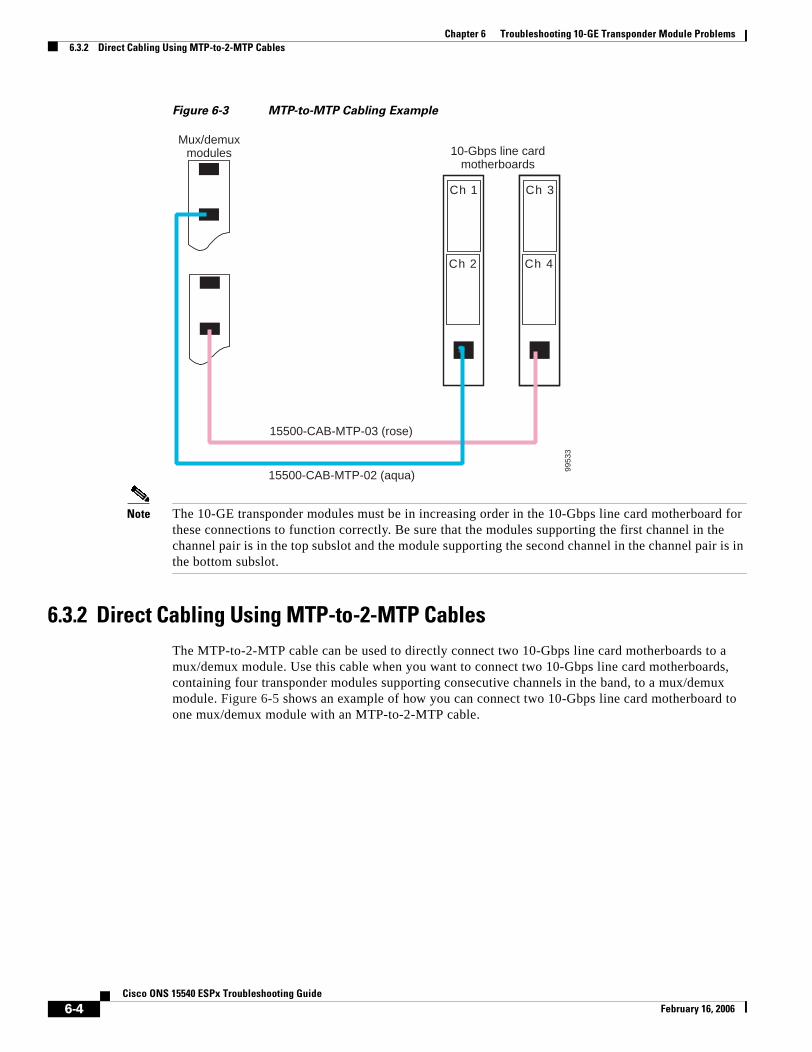
Chapter 6 Troubleshooting 10-GE Transponder Module Problems6.3.2 Direct Cabling Using MTP-to-2-MTP Cables
Figure 6-3 MTP-to-MTP Cabling Example
Note The 10-GE transponder modules must be in increasing order in the 10-Gbps line card motherboard for these connections to function correctly. Be sure that the modules supporting the first channel in the channel pair is in the top subslot and the module supporting the second channel in the channel pair is in the bottom subslot.
6.3.2 Direct Cabling Using MTP-to-2-MTP CablesThe MTP-to-2-MTP cable can be used to directly connect two 10-Gbps line card motherboards to a mux/demux module. Use this cable when you want to connect two 10-Gbps line card motherboards, containing four transponder modules supporting consecutive channels in the band, to a mux/demux module. Figure 6-5 shows an example of how you can connect two 10-Gbps line card motherboard to one mux/demux module with an MTP-to-2-MTP cable.
Ch 1
Ch 2
Ch 3
Ch 4
15500-CAB-MTP-02 (aqua)
15500-CAB-MTP-03 (rose)
10-Gbps line card motherboards
9953
3
Mux/demuxmodules
6-4Cisco ONS 15540 ESPx Troubleshooting Guide
February 16, 2006
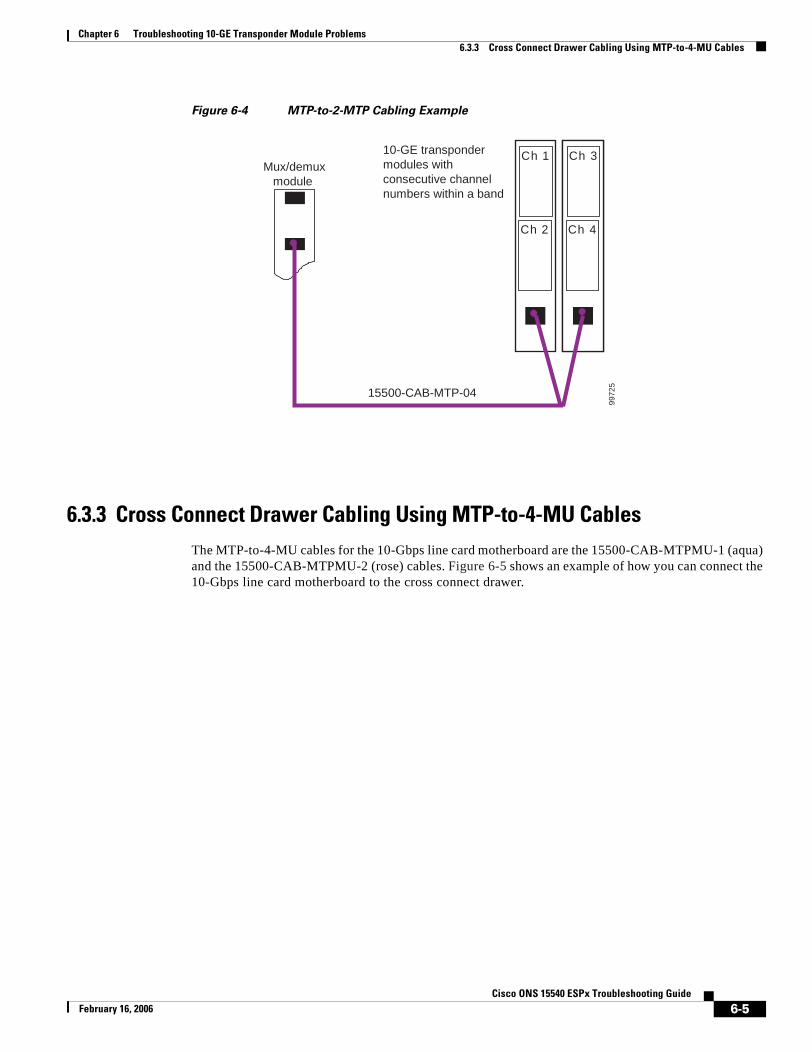
Chapter 6 Troubleshooting 10-GE Transponder Module Problems6.3.3 Cross Connect Drawer Cabling Using MTP-to-4-MU Cables
Figure 6-4 MTP-to-2-MTP Cabling Example
6.3.3 Cross Connect Drawer Cabling Using MTP-to-4-MU CablesThe MTP-to-4-MU cables for the 10-Gbps line card motherboard are the 15500-CAB-MTPMU-1 (aqua) and the 15500-CAB-MTPMU-2 (rose) cables. Figure 6-5 shows an example of how you can connect the 10-Gbps line card motherboard to the cross connect drawer.
Ch 1
Ch 2
Ch 3
Ch 4
9972
5
15500-CAB-MTP-04
10-GE transponder modules with consecutive channel numbers within a band
Mux/demuxmodule
6-5Cisco ONS 15540 ESPx Troubleshooting Guide
February 16, 2006
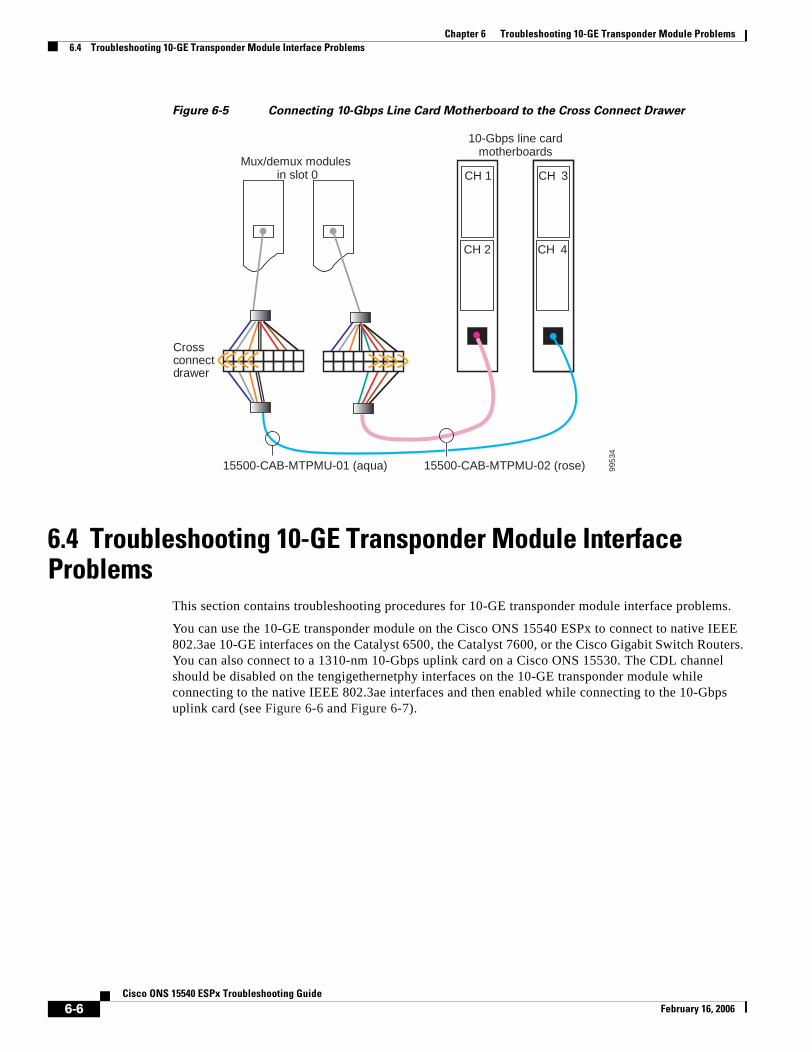
Chapter 6 Troubleshooting 10-GE Transponder Module Problems6.4 Troubleshooting 10-GE Transponder Module Interface Problems
Figure 6-5 Connecting 10-Gbps Line Card Motherboard to the Cross Connect Drawer
6.4 Troubleshooting 10-GE Transponder Module Interface Problems
This section contains troubleshooting procedures for 10-GE transponder module interface problems.
You can use the 10-GE transponder module on the Cisco ONS 15540 ESPx to connect to native IEEE 802.3ae 10-GE interfaces on the Catalyst 6500, the Catalyst 7600, or the Cisco Gigabit Switch Routers. You can also connect to a 1310-nm 10-Gbps uplink card on a Cisco ONS 15530. The CDL channel should be disabled on the tengigethernetphy interfaces on the 10-GE transponder module while connecting to the native IEEE 802.3ae interfaces and then enabled while connecting to the 10-Gbps uplink card (see Figure 6-6 and Figure 6-7).
CH 1
CH 2
CH 3
CH 4
Cross cdrawer
15500-CAB-MTPMU-01 (aqua) 15500-CAB-MTPMU-02 (rose)
10-Gbps line cardmotherboards
onnect
9953
4
Mux/demux modules in slot 0
6-6Cisco ONS 15540 ESPx Troubleshooting Guide
February 16, 2006
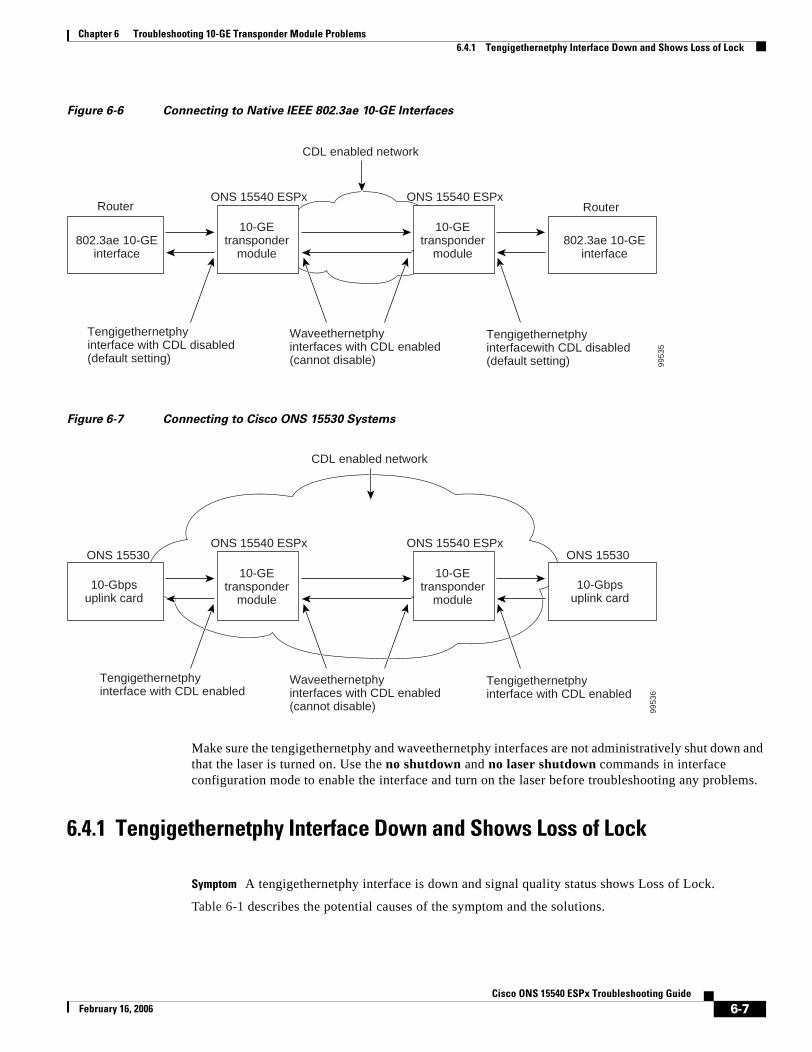
Chapter 6 Troubleshooting 10-GE Transponder Module Problems6.4.1 Tengigethernetphy Interface Down and Shows Loss of Lock
Figure 6-6 Connecting to Native IEEE 802.3ae 10-GE Interfaces
Figure 6-7 Connecting to Cisco ONS 15530 Systems
Make sure the tengigethernetphy and waveethernetphy interfaces are not administratively shut down and that the laser is turned on. Use the no shutdown and no laser shutdown commands in interface configuration mode to enable the interface and turn on the laser before troubleshooting any problems.
6.4.1 Tengigethernetphy Interface Down and Shows Loss of Lock
Symptom A tengigethernetphy interface is down and signal quality status shows Loss of Lock.
Table 6-1 describes the potential causes of the symptom and the solutions.
Router Router ONS 15540 ESPx ONS 15540 ESPx
CDL enabled network
Tengigethernetphy interface with CDL disabled (default setting)
Waveethernetphy interfaces with CDL enabled (cannot disable)
Tengigethernetphy interfacewith CDL disabled (default setting)
10-GEtransponder
module
10-GEtransponder
module802.3ae 10-GE
interface 802.3ae 10-GE
interface
9953
5
ONS 15530 ONS 15530 ONS 15540 ESPx ONS 15540 ESPx
CDL enabled network
Tengigethernetphy interface with CDL enabled
Waveethernetphy interfaces with CDL enabled (cannot disable)
Tengigethernetphy interface with CDL enabled
10-GEtransponder
module
10-GEtransponder
module10-Gbps
uplink card10-Gbps
uplink card
9953
6
6-7Cisco ONS 15540 ESPx Troubleshooting Guide
February 16, 2006
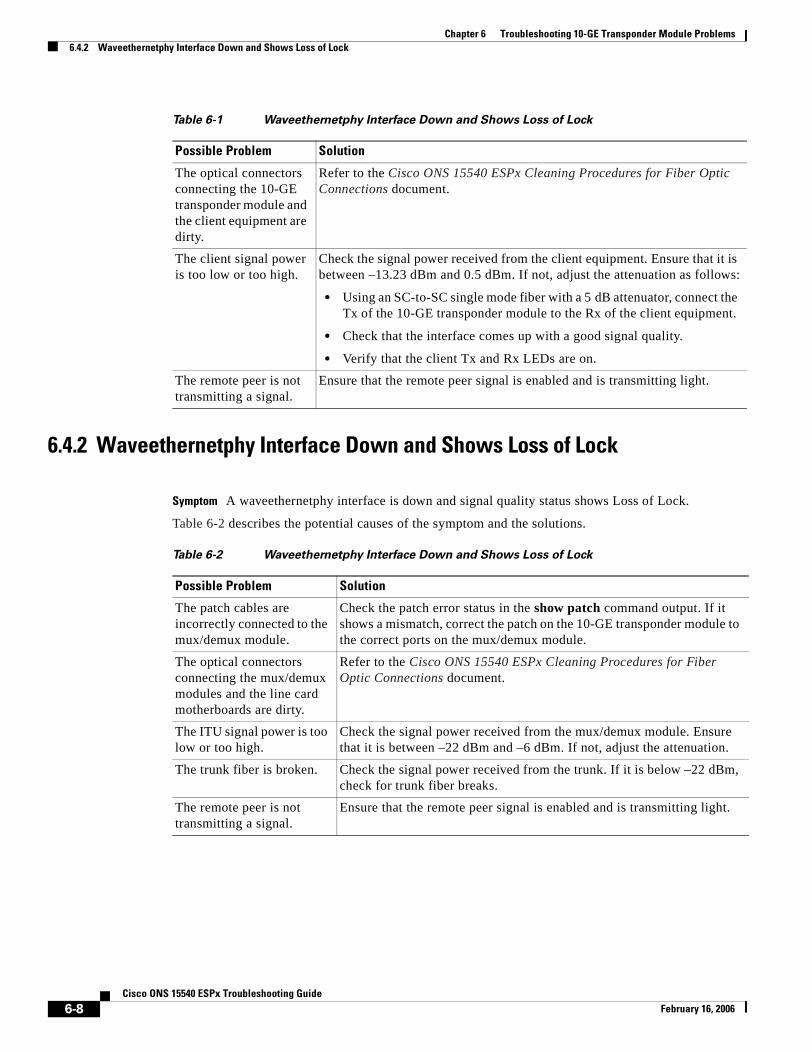
Chapter 6 Troubleshooting 10-GE Transponder Module Problems6.4.2 Waveethernetphy Interface Down and Shows Loss of Lock
6.4.2 Waveethernetphy Interface Down and Shows Loss of Lock
Symptom A waveethernetphy interface is down and signal quality status shows Loss of Lock.
Table 6-2 describes the potential causes of the symptom and the solutions.
Table 6-1 Waveethernetphy Interface Down and Shows Loss of Lock
Possible Problem Solution
The optical connectors connecting the 10-GE transponder module and the client equipment are dirty.
Refer to the Cisco ONS 15540 ESPx Cleaning Procedures for Fiber Optic Connections document.
The client signal power is too low or too high.
Check the signal power received from the client equipment. Ensure that it is between –13.23 dBm and 0.5 dBm. If not, adjust the attenuation as follows:
• Using an SC-to-SC single mode fiber with a 5 dB attenuator, connect the Tx of the 10-GE transponder module to the Rx of the client equipment.
• Check that the interface comes up with a good signal quality.
• Verify that the client Tx and Rx LEDs are on.
The remote peer is not transmitting a signal.
Ensure that the remote peer signal is enabled and is transmitting light.
Table 6-2 Waveethernetphy Interface Down and Shows Loss of Lock
Possible Problem Solution
The patch cables are incorrectly connected to the mux/demux module.
Check the patch error status in the show patch command output. If it shows a mismatch, correct the patch on the 10-GE transponder module to the correct ports on the mux/demux module.
The optical connectors connecting the mux/demux modules and the line card motherboards are dirty.
Refer to the Cisco ONS 15540 ESPx Cleaning Procedures for Fiber Optic Connections document.
The ITU signal power is too low or too high.
Check the signal power received from the mux/demux module. Ensure that it is between –22 dBm and –6 dBm. If not, adjust the attenuation.
The trunk fiber is broken. Check the signal power received from the trunk. If it is below –22 dBm, check for trunk fiber breaks.
The remote peer is not transmitting a signal.
Ensure that the remote peer signal is enabled and is transmitting light.
6-8Cisco ONS 15540 ESPx Troubleshooting Guide
February 16, 2006
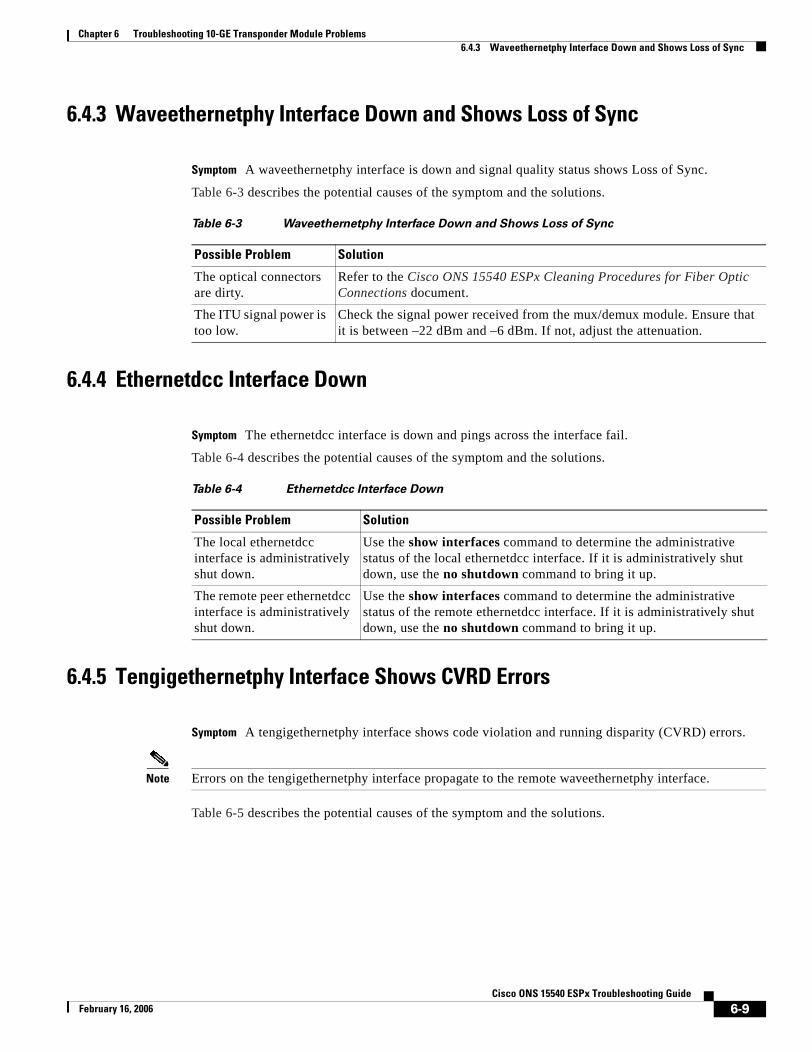
Chapter 6 Troubleshooting 10-GE Transponder Module Problems6.4.3 Waveethernetphy Interface Down and Shows Loss of Sync
6.4.3 Waveethernetphy Interface Down and Shows Loss of Sync
Symptom A waveethernetphy interface is down and signal quality status shows Loss of Sync.
Table 6-3 describes the potential causes of the symptom and the solutions.
6.4.4 Ethernetdcc Interface Down
Symptom The ethernetdcc interface is down and pings across the interface fail.
Table 6-4 describes the potential causes of the symptom and the solutions.
6.4.5 Tengigethernetphy Interface Shows CVRD Errors
Symptom A tengigethernetphy interface shows code violation and running disparity (CVRD) errors.
Note Errors on the tengigethernetphy interface propagate to the remote waveethernetphy interface.
Table 6-5 describes the potential causes of the symptom and the solutions.
Table 6-3 Waveethernetphy Interface Down and Shows Loss of Sync
Possible Problem Solution
The optical connectors are dirty.
Refer to the Cisco ONS 15540 ESPx Cleaning Procedures for Fiber Optic Connections document.
The ITU signal power is too low.
Check the signal power received from the mux/demux module. Ensure that it is between –22 dBm and –6 dBm. If not, adjust the attenuation.
Table 6-4 Ethernetdcc Interface Down
Possible Problem Solution
The local ethernetdcc interface is administratively shut down.
Use the show interfaces command to determine the administrative status of the local ethernetdcc interface. If it is administratively shut down, use the no shutdown command to bring it up.
The remote peer ethernetdcc interface is administratively shut down.
Use the show interfaces command to determine the administrative status of the remote ethernetdcc interface. If it is administratively shut down, use the no shutdown command to bring it up.
6-9Cisco ONS 15540 ESPx Troubleshooting Guide
February 16, 2006
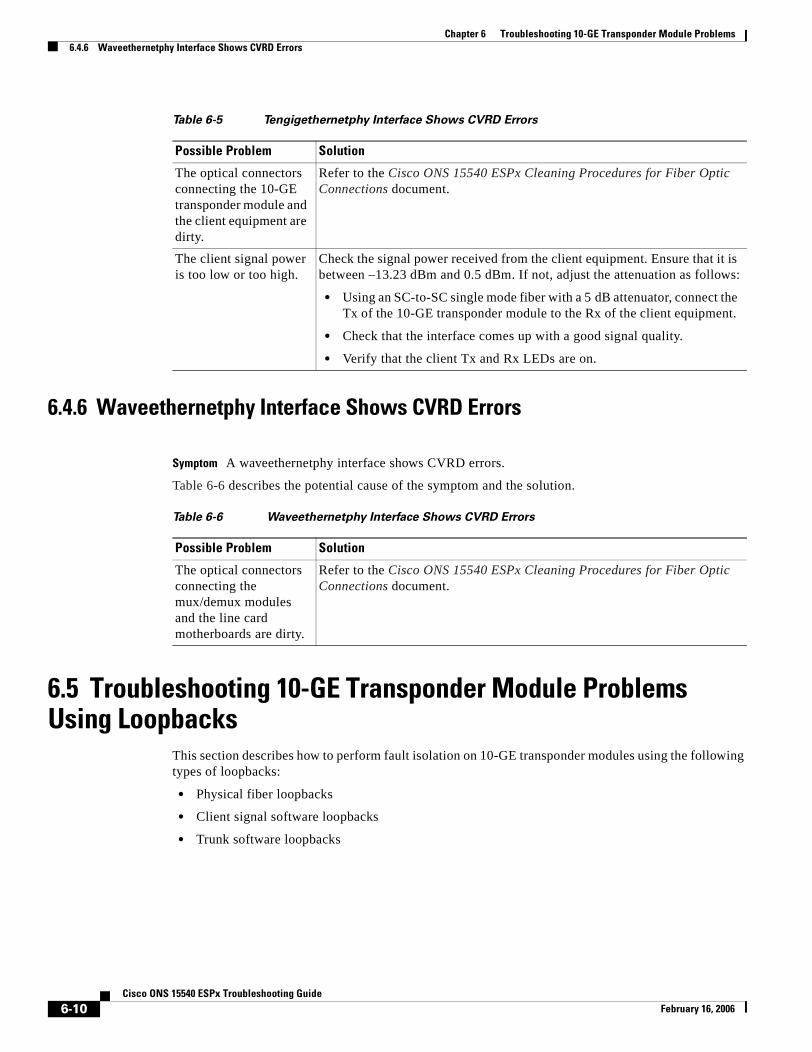
Chapter 6 Troubleshooting 10-GE Transponder Module Problems6.4.6 Waveethernetphy Interface Shows CVRD Errors
6.4.6 Waveethernetphy Interface Shows CVRD Errors
Symptom A waveethernetphy interface shows CVRD errors.
Table 6-6 describes the potential cause of the symptom and the solution.
6.5 Troubleshooting 10-GE Transponder Module Problems Using Loopbacks
This section describes how to perform fault isolation on 10-GE transponder modules using the following types of loopbacks:
• Physical fiber loopbacks
• Client signal software loopbacks
• Trunk software loopbacks
Table 6-5 Tengigethernetphy Interface Shows CVRD Errors
Possible Problem Solution
The optical connectors connecting the 10-GE transponder module and the client equipment are dirty.
Refer to the Cisco ONS 15540 ESPx Cleaning Procedures for Fiber Optic Connections document.
The client signal power is too low or too high.
Check the signal power received from the client equipment. Ensure that it is between –13.23 dBm and 0.5 dBm. If not, adjust the attenuation as follows:
• Using an SC-to-SC single mode fiber with a 5 dB attenuator, connect the Tx of the 10-GE transponder module to the Rx of the client equipment.
• Check that the interface comes up with a good signal quality.
• Verify that the client Tx and Rx LEDs are on.
Table 6-6 Waveethernetphy Interface Shows CVRD Errors
Possible Problem Solution
The optical connectors connecting the mux/demux modules and the line card motherboards are dirty.
Refer to the Cisco ONS 15540 ESPx Cleaning Procedures for Fiber Optic Connections document.
6-10Cisco ONS 15540 ESPx Troubleshooting Guide
February 16, 2006
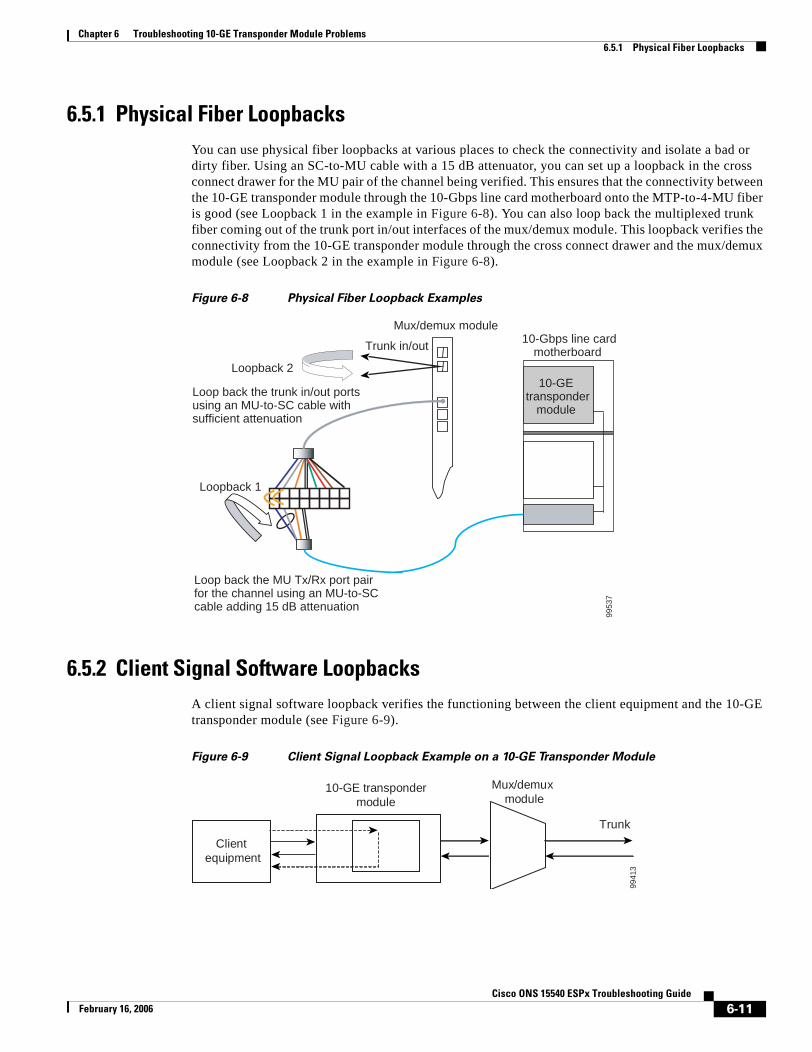
Chapter 6 Troubleshooting 10-GE Transponder Module Problems6.5.1 Physical Fiber Loopbacks
6.5.1 Physical Fiber LoopbacksYou can use physical fiber loopbacks at various places to check the connectivity and isolate a bad or dirty fiber. Using an SC-to-MU cable with a 15 dB attenuator, you can set up a loopback in the cross connect drawer for the MU pair of the channel being verified. This ensures that the connectivity between the 10-GE transponder module through the 10-Gbps line card motherboard onto the MTP-to-4-MU fiber is good (see Loopback 1 in the example in Figure 6-8). You can also loop back the multiplexed trunk fiber coming out of the trunk port in/out interfaces of the mux/demux module. This loopback verifies the connectivity from the 10-GE transponder module through the cross connect drawer and the mux/demux module (see Loopback 2 in the example in Figure 6-8).
Figure 6-8 Physical Fiber Loopback Examples
6.5.2 Client Signal Software LoopbacksA client signal software loopback verifies the functioning between the client equipment and the 10-GE transponder module (see Figure 6-9).
Figure 6-9 Client Signal Loopback Example on a 10-GE Transponder Module
Loop back the MU Tx/Rx port pair for the channel using an MU-to-SC cable adding 15 dB attenuation
10-GE transponder
module
10-Gbps line cardmotherboard
Mux/demux module
Loop back the trunk in/out ports using an MU-to-SC cable with sufficient attenuation
Loopback 2
Loopback 1
Trunk in/out
9953
7
Client equipment
10-GE transpondermodule
Mux/demuxmodule
Trunk
9941
3
6-11Cisco ONS 15540 ESPx Troubleshooting Guide
February 16, 2006
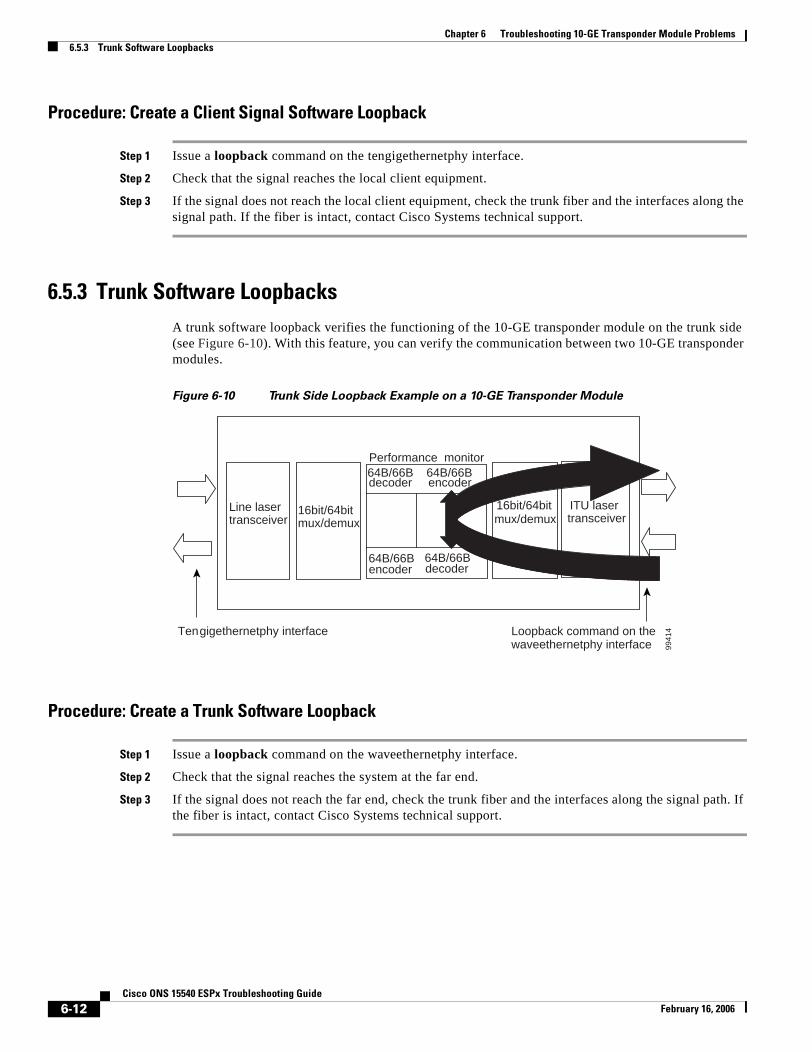
Chapter 6 Troubleshooting 10-GE Transponder Module Problems6.5.3 Trunk Software Loopbacks
Procedure: Create a Client Signal Software Loopback
Step 1 Issue a loopback command on the tengigethernetphy interface.
Step 2 Check that the signal reaches the local client equipment.
Step 3 If the signal does not reach the local client equipment, check the trunk fiber and the interfaces along the signal path. If the fiber is intact, contact Cisco Systems technical support.
6.5.3 Trunk Software LoopbacksA trunk software loopback verifies the functioning of the 10-GE transponder module on the trunk side (see Figure 6-10). With this feature, you can verify the communication between two 10-GE transponder modules.
Figure 6-10 Trunk Side Loopback Example on a 10-GE Transponder Module
Procedure: Create a Trunk Software Loopback
Step 1 Issue a loopback command on the waveethernetphy interface.
Step 2 Check that the signal reaches the system at the far end.
Step 3 If the signal does not reach the far end, check the trunk fiber and the interfaces along the signal path. If the fiber is intact, contact Cisco Systems technical support.
9941
4
16bit/64bit mux/demux
Line laser transceiver
Tengigethernetphy interface
ITU laser
16bit/64bit mux/demux
Performance monitor
decoder encoder
64B/66B encoder decoder
Loopback command on thewaveethernetphy interface
64B/66B
64B/66B64B/66B
transceiver
6-12Cisco ONS 15540 ESPx Troubleshooting Guide
February 16, 2006
CiscoFebruary 16, 2006
C H A P T E R 7
Troubleshooting Threshold Alarm ProblemsThis chapter describes how to troubleshoot threshold alarm problems. This chapter contains the following sections:
• 7.1 Overview, page 7-1
• 7.2 Initial Troubleshooting Checklist, page 7-1
• 7.3 Troubleshooting Threshold Alarms, page 7-1
7.1 OverviewThreshold alarms indicate that a configured range is exceeded.
7.2 Initial Troubleshooting ChecklistFollow this initial checklist before proceeding with the troubleshooting procedures:
• Issue show interfaces commands to ensure that all interfaces are administratively up and that there are no reported errors.
• Issue the show facility-alarm status command to display the alarms on the interfaces.
• Ensure that all optical connectors are clean. Refer to the Cisco ONS 15540 ESPx Cleaning Procedures for Fiber Optic Connections document.
7.3 Troubleshooting Threshold AlarmsThis section contains troubleshooting procedures for threshold alarm problems.
7.3.1 8b10b CVRD Alarm Indicates Signal Fail or Signal Degrade
Symptom An 8b10b CVRD alarm indicates signal fail or signal degrade.
Table 7-1 describes the potential causes of the symptom and the solutions.
7-1ONS 15540 ESPx Troubleshooting Guide
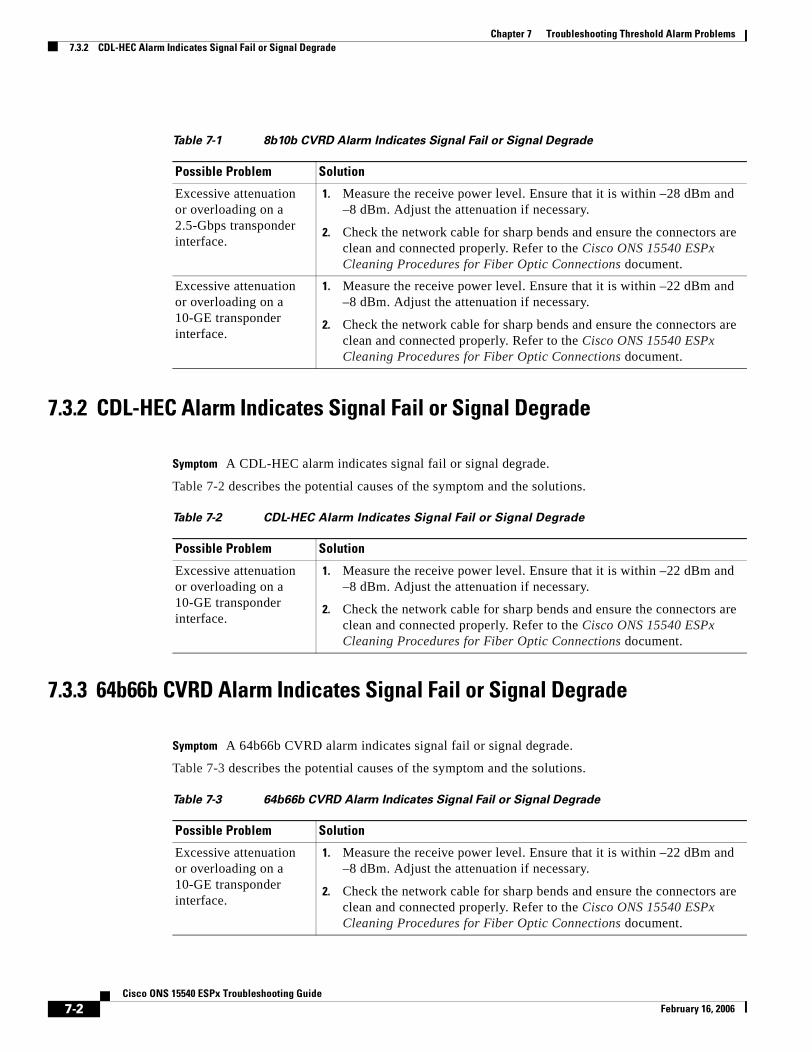
Chapter 7 Troubleshooting Threshold Alarm Problems7.3.2 CDL-HEC Alarm Indicates Signal Fail or Signal Degrade
7.3.2 CDL-HEC Alarm Indicates Signal Fail or Signal Degrade
Symptom A CDL-HEC alarm indicates signal fail or signal degrade.
Table 7-2 describes the potential causes of the symptom and the solutions.
7.3.3 64b66b CVRD Alarm Indicates Signal Fail or Signal Degrade
Symptom A 64b66b CVRD alarm indicates signal fail or signal degrade.
Table 7-3 describes the potential causes of the symptom and the solutions.
Table 7-1 8b10b CVRD Alarm Indicates Signal Fail or Signal Degrade
Possible Problem Solution
Excessive attenuation or overloading on a 2.5-Gbps transponder interface.
1. Measure the receive power level. Ensure that it is within –28 dBm and –8 dBm. Adjust the attenuation if necessary.
2. Check the network cable for sharp bends and ensure the connectors are clean and connected properly. Refer to the Cisco ONS 15540 ESPx Cleaning Procedures for Fiber Optic Connections document.
Excessive attenuation or overloading on a 10-GE transponder interface.
1. Measure the receive power level. Ensure that it is within –22 dBm and –8 dBm. Adjust the attenuation if necessary.
2. Check the network cable for sharp bends and ensure the connectors are clean and connected properly. Refer to the Cisco ONS 15540 ESPx Cleaning Procedures for Fiber Optic Connections document.
Table 7-2 CDL-HEC Alarm Indicates Signal Fail or Signal Degrade
Possible Problem Solution
Excessive attenuation or overloading on a 10-GE transponder interface.
1. Measure the receive power level. Ensure that it is within –22 dBm and –8 dBm. Adjust the attenuation if necessary.
2. Check the network cable for sharp bends and ensure the connectors are clean and connected properly. Refer to the Cisco ONS 15540 ESPx Cleaning Procedures for Fiber Optic Connections document.
Table 7-3 64b66b CVRD Alarm Indicates Signal Fail or Signal Degrade
Possible Problem Solution
Excessive attenuation or overloading on a 10-GE transponder interface.
1. Measure the receive power level. Ensure that it is within –22 dBm and –8 dBm. Adjust the attenuation if necessary.
2. Check the network cable for sharp bends and ensure the connectors are clean and connected properly. Refer to the Cisco ONS 15540 ESPx Cleaning Procedures for Fiber Optic Connections document.
7-2Cisco ONS 15540 ESPx Troubleshooting Guide
February 16, 2006
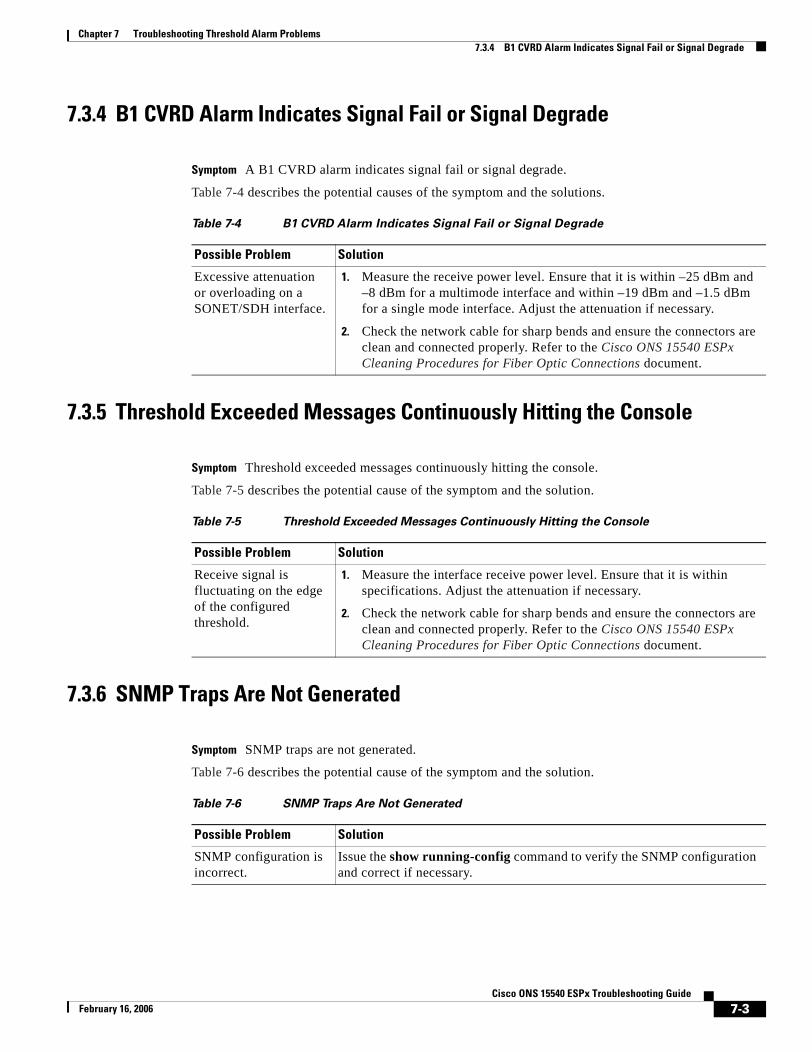
Chapter 7 Troubleshooting Threshold Alarm Problems7.3.4 B1 CVRD Alarm Indicates Signal Fail or Signal Degrade
7.3.4 B1 CVRD Alarm Indicates Signal Fail or Signal Degrade
Symptom A B1 CVRD alarm indicates signal fail or signal degrade.
Table 7-4 describes the potential causes of the symptom and the solutions.
7.3.5 Threshold Exceeded Messages Continuously Hitting the Console
Symptom Threshold exceeded messages continuously hitting the console.
Table 7-5 describes the potential cause of the symptom and the solution.
7.3.6 SNMP Traps Are Not Generated
Symptom SNMP traps are not generated.
Table 7-6 describes the potential cause of the symptom and the solution.
Table 7-4 B1 CVRD Alarm Indicates Signal Fail or Signal Degrade
Possible Problem Solution
Excessive attenuation or overloading on a SONET/SDH interface.
1. Measure the receive power level. Ensure that it is within –25 dBm and –8 dBm for a multimode interface and within –19 dBm and –1.5 dBm for a single mode interface. Adjust the attenuation if necessary.
2. Check the network cable for sharp bends and ensure the connectors are clean and connected properly. Refer to the Cisco ONS 15540 ESPx Cleaning Procedures for Fiber Optic Connections document.
Table 7-5 Threshold Exceeded Messages Continuously Hitting the Console
Possible Problem Solution
Receive signal is fluctuating on the edge of the configured threshold.
1. Measure the interface receive power level. Ensure that it is within specifications. Adjust the attenuation if necessary.
2. Check the network cable for sharp bends and ensure the connectors are clean and connected properly. Refer to the Cisco ONS 15540 ESPx Cleaning Procedures for Fiber Optic Connections document.
Table 7-6 SNMP Traps Are Not Generated
Possible Problem Solution
SNMP configuration is incorrect.
Issue the show running-config command to verify the SNMP configuration and correct if necessary.
7-3Cisco ONS 15540 ESPx Troubleshooting Guide
February 16, 2006

Chapter 7 Troubleshooting Threshold Alarm Problems7.3.6 SNMP Traps Are Not Generated
7-4Cisco ONS 15540 ESPx Troubleshooting Guide
February 16, 2006
CiscoFebruary 16, 2006
C H A P T E R 8
Troubleshooting Performance History Counter ProblemsThis chapter describes how to troubleshoot performance history counter problems. This chapter contains the following sections:
• 8.1 Overview, page 8-1
• 8.2 Initial Troubleshooting Checklist, page 8-1
• 8.3 Interpreting Performance History Messages, page 8-2
• 8.4 Troubleshooting Performance History Counters, page 8-2
8.1 OverviewCisco ONS 15540 ESPx supports 15 minute based performance history counters. You can use the performance history counters to track the performance of the Cisco ONS 15540 ESPx interfaces.
There are three types of performance history counters: current, 15-minute history, and 24-hour. Cisco ONS 15540 ESPx uses these counters to store the performance data for the following time periods:
• The current 15 minutes (using the current counter).
• The last 24 hours (using ninety six 15-minute history counters).
• The previous 1 day (using the 24-hour counter).
For more information on performance history counters, refer to the Cisco ONS 15540 ESPx Configuration Guide.
8.2 Initial Troubleshooting ChecklistFollow this initial checklist before proceeding with the troubleshooting procedures:
• Issue the show version command to ensure that the IOS version is 12.2(29)SV or later.
• Issue show interfaces commands to ensure that the interface for which the performance history counters are being monitored is administratively up.
• Ensure that the encapsulation configured on the interface supports performance history counters.
8-1ONS 15540 ESPx Troubleshooting Guide
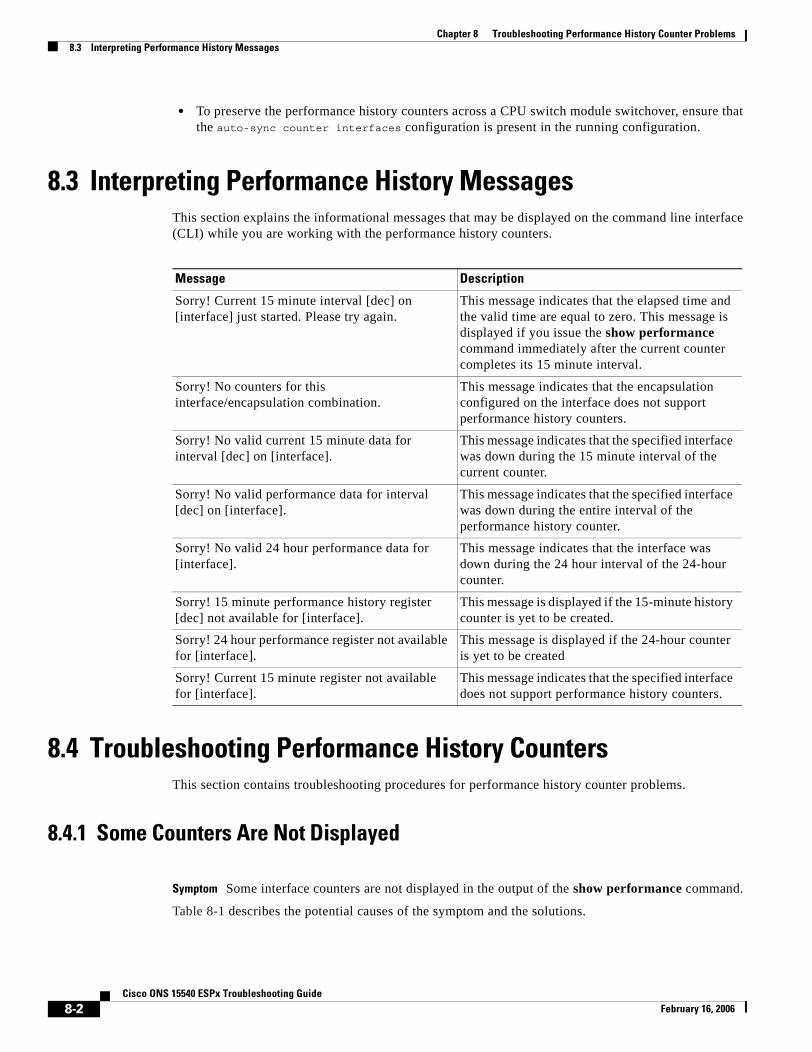
Chapter 8 Troubleshooting Performance History Counter Problems8.3 Interpreting Performance History Messages
• To preserve the performance history counters across a CPU switch module switchover, ensure that the auto-sync counter interfaces configuration is present in the running configuration.
8.3 Interpreting Performance History MessagesThis section explains the informational messages that may be displayed on the command line interface (CLI) while you are working with the performance history counters.
8.4 Troubleshooting Performance History CountersThis section contains troubleshooting procedures for performance history counter problems.
8.4.1 Some Counters Are Not Displayed
Symptom Some interface counters are not displayed in the output of the show performance command.
Table 8-1 describes the potential causes of the symptom and the solutions.
Message Description
Sorry! Current 15 minute interval [dec] on [interface] just started. Please try again.
This message indicates that the elapsed time and the valid time are equal to zero. This message is displayed if you issue the show performance command immediately after the current counter completes its 15 minute interval.
Sorry! No counters for this interface/encapsulation combination.
This message indicates that the encapsulation configured on the interface does not support performance history counters.
Sorry! No valid current 15 minute data for interval [dec] on [interface].
This message indicates that the specified interface was down during the 15 minute interval of the current counter.
Sorry! No valid performance data for interval [dec] on [interface].
This message indicates that the specified interface was down during the entire interval of the performance history counter.
Sorry! No valid 24 hour performance data for [interface].
This message indicates that the interface was down during the 24 hour interval of the 24-hour counter.
Sorry! 15 minute performance history register [dec] not available for [interface].
This message is displayed if the 15-minute history counter is yet to be created.
Sorry! 24 hour performance register not available for [interface].
This message is displayed if the 24-hour counter is yet to be created
Sorry! Current 15 minute register not available for [interface].
This message indicates that the specified interface does not support performance history counters.
8-2Cisco ONS 15540 ESPx Troubleshooting Guide
February 16, 2006
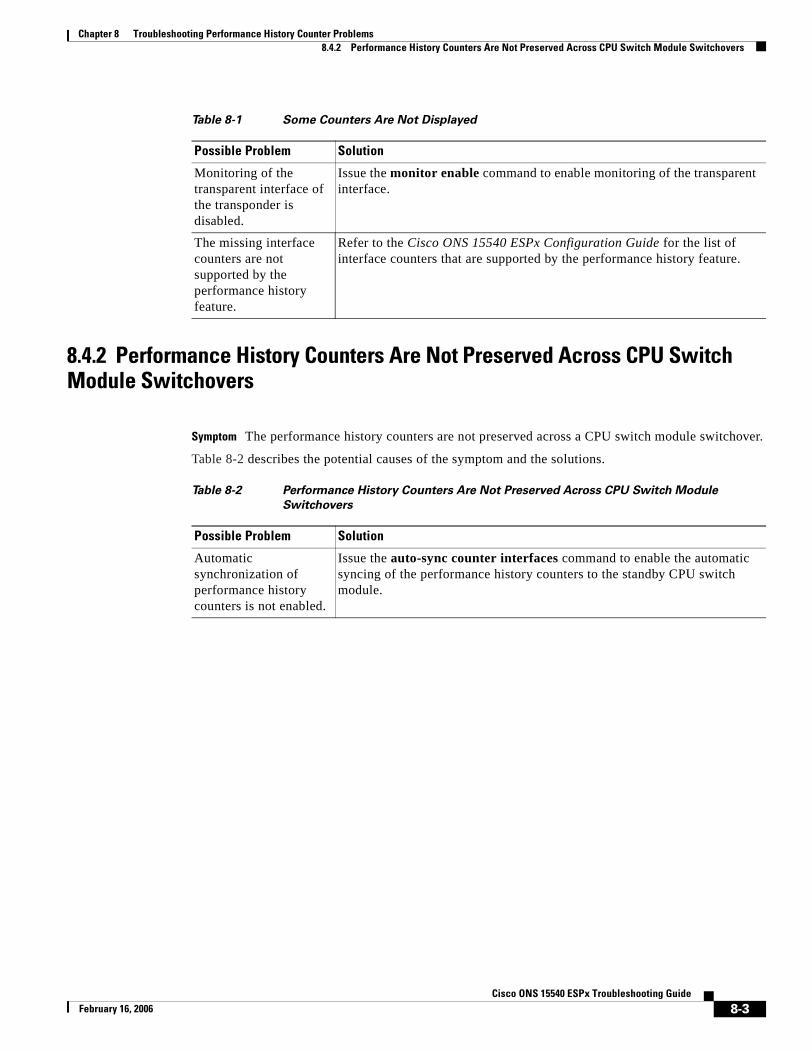
Chapter 8 Troubleshooting Performance History Counter Problems8.4.2 Performance History Counters Are Not Preserved Across CPU Switch Module Switchovers
8.4.2 Performance History Counters Are Not Preserved Across CPU Switch Module Switchovers
Symptom The performance history counters are not preserved across a CPU switch module switchover.
Table 8-2 describes the potential causes of the symptom and the solutions.
Table 8-1 Some Counters Are Not Displayed
Possible Problem Solution
Monitoring of the transparent interface of the transponder is disabled.
Issue the monitor enable command to enable monitoring of the transparent interface.
The missing interface counters are not supported by the performance history feature.
Refer to the Cisco ONS 15540 ESPx Configuration Guide for the list of interface counters that are supported by the performance history feature.
Table 8-2 Performance History Counters Are Not Preserved Across CPU Switch Module
Switchovers
Possible Problem Solution
Automatic synchronization of performance history counters is not enabled.
Issue the auto-sync counter interfaces command to enable the automatic syncing of the performance history counters to the standby CPU switch module.
8-3Cisco ONS 15540 ESPx Troubleshooting Guide
February 16, 2006

Chapter 8 Troubleshooting Performance History Counter Problems8.4.2 Performance History Counters Are Not Preserved Across CPU Switch Module Switchovers
8-4Cisco ONS 15540 ESPx Troubleshooting Guide
February 16, 2006
CiscoFebruary 16, 2006
C H A P T E R 9
Troubleshooting APS ProblemsThis chapter describes how to troubleshoot APS (Automatic Protection Switching) problems. This chapter contains the following sections:
• 9.1 Overview, page 9-1
• 9.2 Initial Troubleshooting Checklist, page 9-1
• 9.3 Troubleshooting Specific APS Problems, page 9-2
9.1 OverviewAPS provides protection against signal transmission failure. The Cisco ONS 15540 ESPx supports the following APS features:
• 1+1 path protection
• Splitter protection
• Line card protection
– Client based
– Y-cable based
– Switch fabric based
• Trunk fiber protection
• Redundant switch fabric protection
• Bidirectional and unidirectional path switching
For more information on APS support on the Cisco ONS 15540 ESPx, refer to the Cisco ONS 15540 ESPx Configuration Guide.
9.2 Initial Troubleshooting ChecklistFollow this initial checklist before proceeding with the troubleshooting procedures:
• Issue show interfaces commands to ensure that the interfaces along the signal paths are administratively up and that there are no errors on the interfaces.
• Issue the show connect command to verify the status of the cross connections.
• Issue the show aps detail command on both nodes to verify the following:
9-1ONS 15540 ESPx Troubleshooting Guide
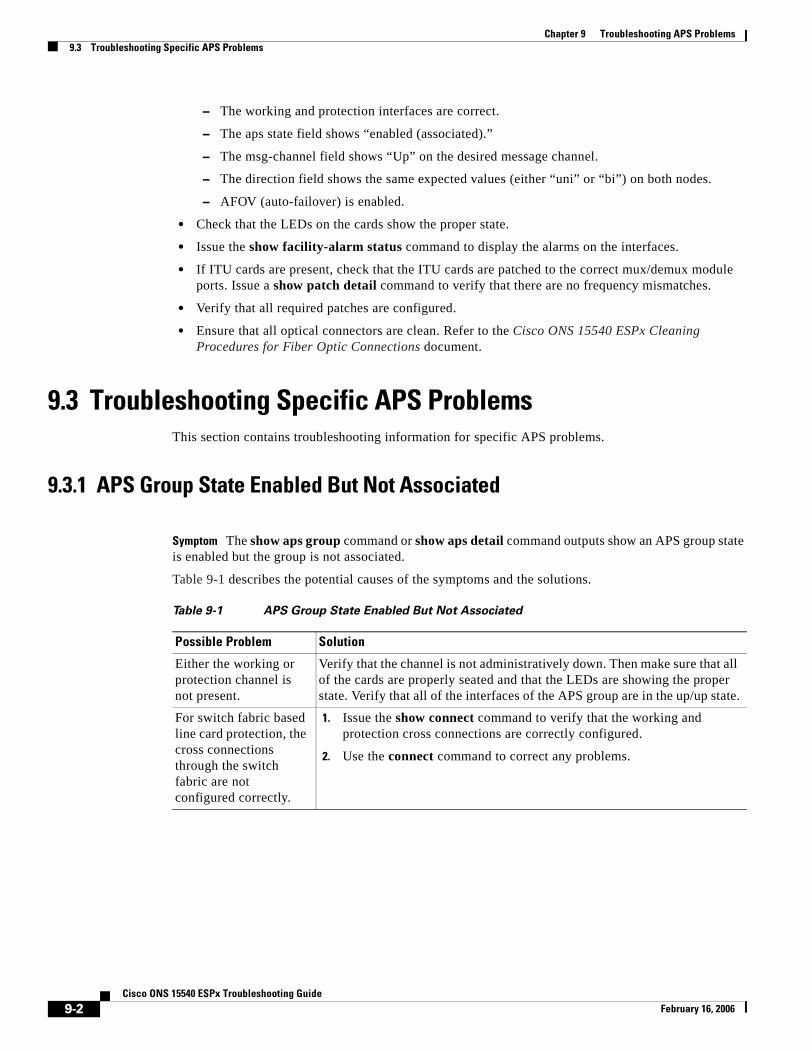
Chapter 9 Troubleshooting APS Problems9.3 Troubleshooting Specific APS Problems
– The working and protection interfaces are correct.
– The aps state field shows “enabled (associated).”
– The msg-channel field shows “Up” on the desired message channel.
– The direction field shows the same expected values (either “uni” or “bi”) on both nodes.
– AFOV (auto-failover) is enabled.
• Check that the LEDs on the cards show the proper state.
• Issue the show facility-alarm status command to display the alarms on the interfaces.
• If ITU cards are present, check that the ITU cards are patched to the correct mux/demux module ports. Issue a show patch detail command to verify that there are no frequency mismatches.
• Verify that all required patches are configured.
• Ensure that all optical connectors are clean. Refer to the Cisco ONS 15540 ESPx Cleaning Procedures for Fiber Optic Connections document.
9.3 Troubleshooting Specific APS ProblemsThis section contains troubleshooting information for specific APS problems.
9.3.1 APS Group State Enabled But Not Associated
Symptom The show aps group command or show aps detail command outputs show an APS group state is enabled but the group is not associated.
Table 9-1 describes the potential causes of the symptoms and the solutions.
Table 9-1 APS Group State Enabled But Not Associated
Possible Problem Solution
Either the working or protection channel is not present.
Verify that the channel is not administratively down. Then make sure that all of the cards are properly seated and that the LEDs are showing the proper state. Verify that all of the interfaces of the APS group are in the up/up state.
For switch fabric based line card protection, the cross connections through the switch fabric are not configured correctly.
1. Issue the show connect command to verify that the working and protection cross connections are correctly configured.
2. Use the connect command to correct any problems.
9-2Cisco ONS 15540 ESPx Troubleshooting Guide
February 16, 2006
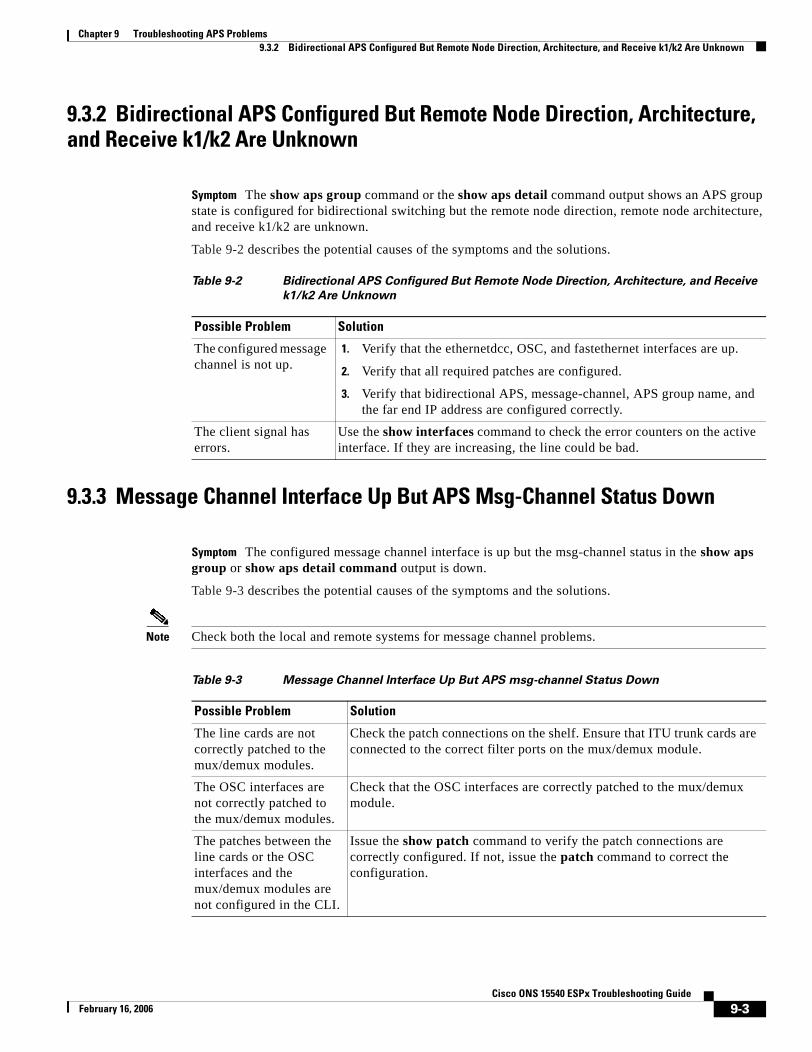
Chapter 9 Troubleshooting APS Problems9.3.2 Bidirectional APS Configured But Remote Node Direction, Architecture, and Receive k1/k2 Are Unknown
9.3.2 Bidirectional APS Configured But Remote Node Direction, Architecture, and Receive k1/k2 Are Unknown
Symptom The show aps group command or the show aps detail command output shows an APS group state is configured for bidirectional switching but the remote node direction, remote node architecture, and receive k1/k2 are unknown.
Table 9-2 describes the potential causes of the symptoms and the solutions.
9.3.3 Message Channel Interface Up But APS Msg-Channel Status Down
Symptom The configured message channel interface is up but the msg-channel status in the show aps group or show aps detail command output is down.
Table 9-3 describes the potential causes of the symptoms and the solutions.
Note Check both the local and remote systems for message channel problems.
Table 9-2 Bidirectional APS Configured But Remote Node Direction, Architecture, and Receive
k1/k2 Are Unknown
Possible Problem Solution
The configured message channel is not up.
1. Verify that the ethernetdcc, OSC, and fastethernet interfaces are up.
2. Verify that all required patches are configured.
3. Verify that bidirectional APS, message-channel, APS group name, and the far end IP address are configured correctly.
The client signal has errors.
Use the show interfaces command to check the error counters on the active interface. If they are increasing, the line could be bad.
Table 9-3 Message Channel Interface Up But APS msg-channel Status Down
Possible Problem Solution
The line cards are not correctly patched to the mux/demux modules.
Check the patch connections on the shelf. Ensure that ITU trunk cards are connected to the correct filter ports on the mux/demux module.
The OSC interfaces are not correctly patched to the mux/demux modules.
Check that the OSC interfaces are correctly patched to the mux/demux module.
The patches between the line cards or the OSC interfaces and the mux/demux modules are not configured in the CLI.
Issue the show patch command to verify the patch connections are correctly configured. If not, issue the patch command to correct the configuration.
9-3Cisco ONS 15540 ESPx Troubleshooting Guide
February 16, 2006
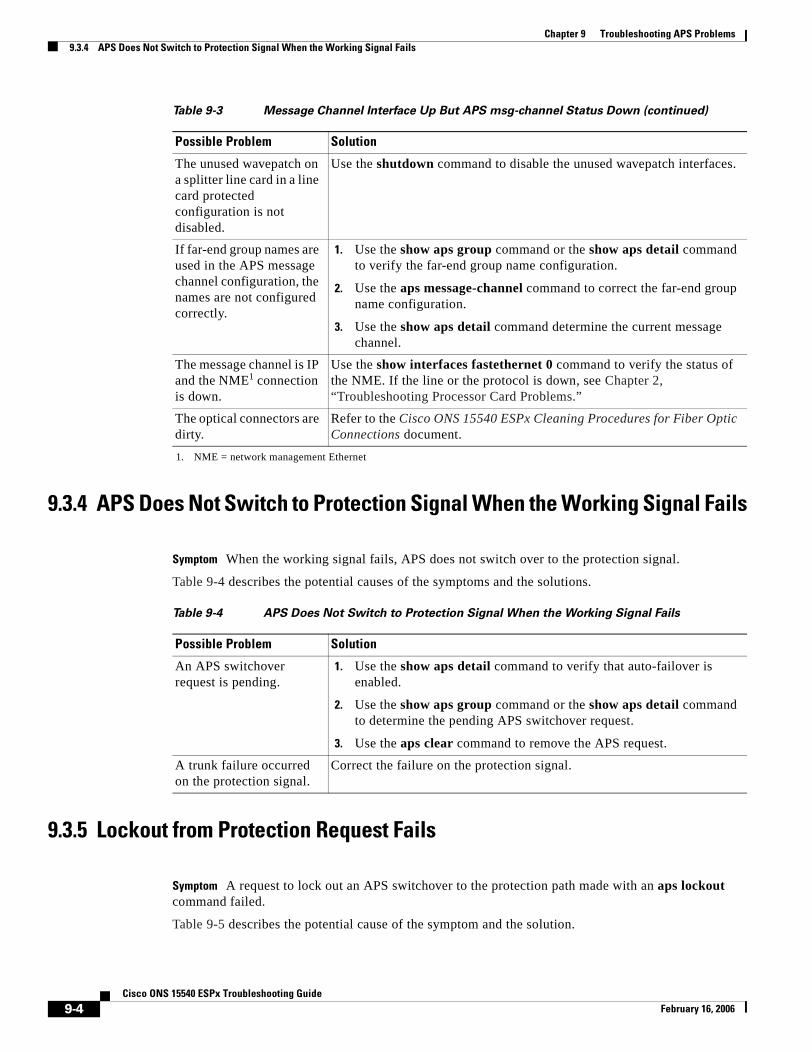
Chapter 9 Troubleshooting APS Problems9.3.4 APS Does Not Switch to Protection Signal When the Working Signal Fails
9.3.4 APS Does Not Switch to Protection Signal When the Working Signal Fails
Symptom When the working signal fails, APS does not switch over to the protection signal.
Table 9-4 describes the potential causes of the symptoms and the solutions.
9.3.5 Lockout from Protection Request Fails
Symptom A request to lock out an APS switchover to the protection path made with an aps lockout command failed.
Table 9-5 describes the potential cause of the symptom and the solution.
The unused wavepatch on a splitter line card in a line card protected configuration is not disabled.
Use the shutdown command to disable the unused wavepatch interfaces.
If far-end group names are used in the APS message channel configuration, the names are not configured correctly.
1. Use the show aps group command or the show aps detail command to verify the far-end group name configuration.
2. Use the aps message-channel command to correct the far-end group name configuration.
3. Use the show aps detail command determine the current message channel.
The message channel is IP and the NME1 connection is down.
Use the show interfaces fastethernet 0 command to verify the status of the NME. If the line or the protocol is down, see Chapter 2, “Troubleshooting Processor Card Problems.”
The optical connectors are dirty.
Refer to the Cisco ONS 15540 ESPx Cleaning Procedures for Fiber Optic Connections document.
1. NME = network management Ethernet
Table 9-3 Message Channel Interface Up But APS msg-channel Status Down (continued)
Possible Problem Solution
Table 9-4 APS Does Not Switch to Protection Signal When the Working Signal Fails
Possible Problem Solution
An APS switchover request is pending.
1. Use the show aps detail command to verify that auto-failover is enabled.
2. Use the show aps group command or the show aps detail command to determine the pending APS switchover request.
3. Use the aps clear command to remove the APS request.
A trunk failure occurred on the protection signal.
Correct the failure on the protection signal.
9-4Cisco ONS 15540 ESPx Troubleshooting Guide
February 16, 2006
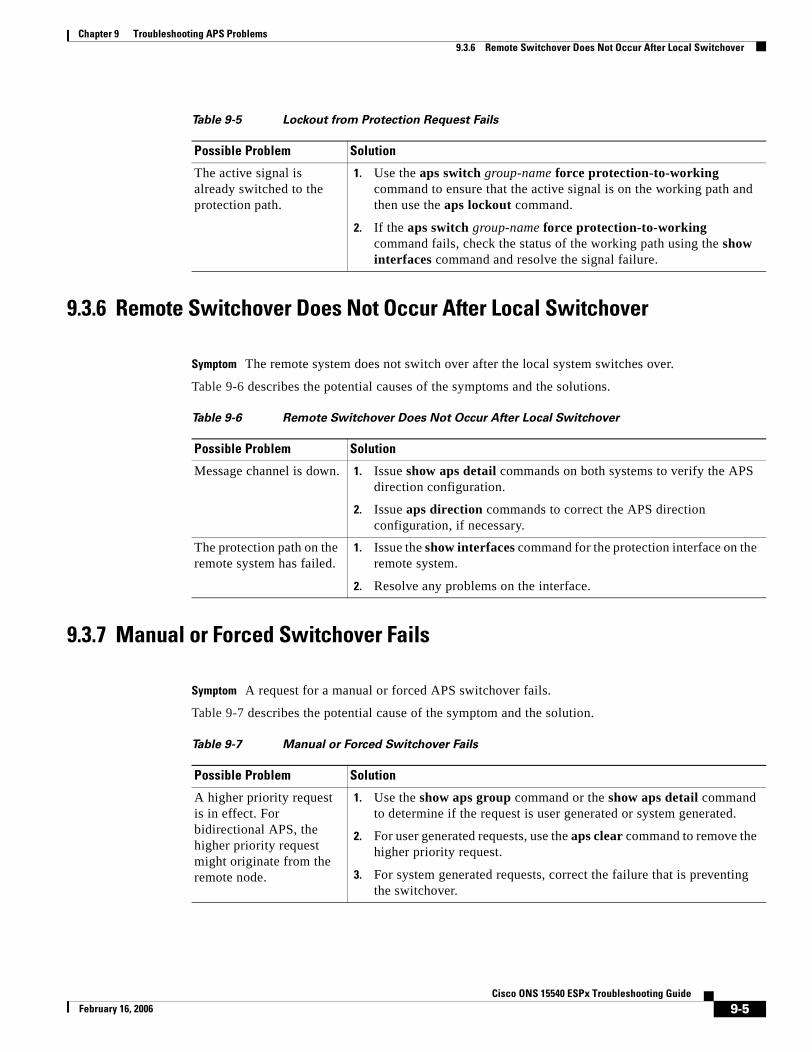
Chapter 9 Troubleshooting APS Problems9.3.6 Remote Switchover Does Not Occur After Local Switchover
9.3.6 Remote Switchover Does Not Occur After Local Switchover
Symptom The remote system does not switch over after the local system switches over.
Table 9-6 describes the potential causes of the symptoms and the solutions.
9.3.7 Manual or Forced Switchover Fails
Symptom A request for a manual or forced APS switchover fails.
Table 9-7 describes the potential cause of the symptom and the solution.
Table 9-5 Lockout from Protection Request Fails
Possible Problem Solution
The active signal is already switched to the protection path.
1. Use the aps switch group-name force protection-to-working command to ensure that the active signal is on the working path and then use the aps lockout command.
2. If the aps switch group-name force protection-to-working command fails, check the status of the working path using the show interfaces command and resolve the signal failure.
Table 9-6 Remote Switchover Does Not Occur After Local Switchover
Possible Problem Solution
Message channel is down. 1. Issue show aps detail commands on both systems to verify the APS direction configuration.
2. Issue aps direction commands to correct the APS direction configuration, if necessary.
The protection path on the remote system has failed.
1. Issue the show interfaces command for the protection interface on the remote system.
2. Resolve any problems on the interface.
Table 9-7 Manual or Forced Switchover Fails
Possible Problem Solution
A higher priority request is in effect. For bidirectional APS, the higher priority request might originate from the remote node.
1. Use the show aps group command or the show aps detail command to determine if the request is user generated or system generated.
2. For user generated requests, use the aps clear command to remove the higher priority request.
3. For system generated requests, correct the failure that is preventing the switchover.
9-5Cisco ONS 15540 ESPx Troubleshooting Guide
February 16, 2006
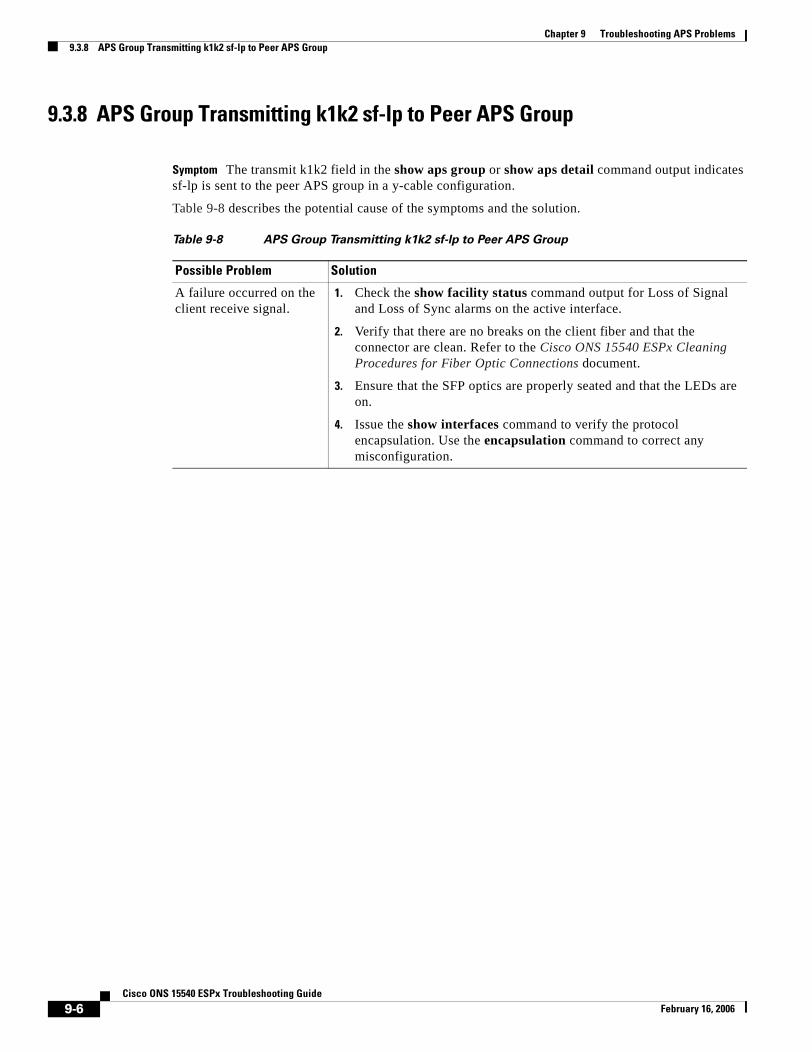
Chapter 9 Troubleshooting APS Problems9.3.8 APS Group Transmitting k1k2 sf-lp to Peer APS Group
9.3.8 APS Group Transmitting k1k2 sf-lp to Peer APS Group
Symptom The transmit k1k2 field in the show aps group or show aps detail command output indicates sf-lp is sent to the peer APS group in a y-cable configuration.
Table 9-8 describes the potential cause of the symptoms and the solution.
Table 9-8 APS Group Transmitting k1k2 sf-lp to Peer APS Group
Possible Problem Solution
A failure occurred on the client receive signal.
1. Check the show facility status command output for Loss of Signal and Loss of Sync alarms on the active interface.
2. Verify that there are no breaks on the client fiber and that the connector are clean. Refer to the Cisco ONS 15540 ESPx Cleaning Procedures for Fiber Optic Connections document.
3. Ensure that the SFP optics are properly seated and that the LEDs are on.
4. Issue the show interfaces command to verify the protocol encapsulation. Use the encapsulation command to correct any misconfiguration.
9-6Cisco ONS 15540 ESPx Troubleshooting Guide
February 16, 2006
CiscoFebruary 16, 2006
A P P E N D I X A
Technical SupportWhen you have a problem that you cannot resolve, contact customer service. To help resolve these problems, gather relevant information about your network prior to calling. This appendix includes the following sections:
• A.1 Gathering Information About Your Internetwork, page A-1
• A.2 Providing Data to Customer Service, page A-2
A.1 Gathering Information About Your InternetworkBefore gathering any specific data, compile a list of all symptoms users have reported on the internetwork (such as connections dropping or slow host response).
The next step is to gather specific information. Typical information needed to troubleshoot internetworking problems fall into two general categories: information required for any situation and information specific to the topology, technology, protocol, or problem.
Information that is always required by technical support engineers includes the following:
• Configuration listing of all systems involved
• Complete specifications of all systems involved
• Version numbers of software (obtained by using the show version command) and Flash code (obtained by using the show controllers command) on all relevant systems
• Network topology map
• List of hosts and servers (host and server type, number on network, description of host operating systems that are implemented)
• List of network layer protocols, versions, and vendors
To assist you in gathering this required data, the show tech-support EXEC command has been added in Cisco IOS Release 11.1(4) and later. This command provides general information about the system that you can provide to your technical support representative when you are reporting a problem.
The show tech-support command display includes outputs from the show version, show hardware, show diag power-on, show running-config, show controllers, show stacks, show interfaces, show buffers, show process memory, and show process EXEC commands.
Specific information that might be needed by technical support varies, depending on the situation, and include the following:
• Output from the following general show commands:
A-1ONS 15540 ESPx Troubleshooting Guide
Appendix A Technical SupportA.1.1 Getting the Data from Your System
show interfaces
show controllers [atm | serial | e1 | ethernet]
show processes [cpu | mem]
show buffers
show memory summary
• Output from the following protocol-specific show commands:
show protocol route
show protocol traffic
show protocol interface
show protocol arp
• Output from relevant debug privileged EXEC commands
• Output from protocol-specific ping and trace command diagnostic tests, as applicable
• Network analyzer traces, as applicable
• Core dumps obtained by using the exception dump switch configuration command, or by using the write core switch configuration command if the system is operational, as appropriate
A.1.1 Getting the Data from Your SystemWhen obtaining information from your system, tailor your method to the system that you are using to retrieve the information. Following are some hints for different platforms:
• PC and Macintosh—Connect a PC or Macintosh to the console port of the system and log all output to a disk file (using a terminal emulation program). The exact procedure varies depending on the communication package used with the system.
• Terminal connected to console port or remote terminal—The only way to get information with a terminal connected to the console port or with a remote terminal is to attach a printer to the Aux port on the terminal (if one exists) and to force all screen output to go to the printer. Using a terminal is undesirable because there is no way to capture the data to a file.
• UNIX workstation—At the UNIX prompt, enter the script filename command, then use Telnet to connect to the system. The UNIX script command captures all screen output to the specified filename. To stop capturing output and close the file, enter the end-of-file character (typically ^D) for your UNIX system.
Note To get your system to automatically log specific error messages or operational information to a UNIX syslog server, use the logging internet-address switch configuration command. For more information about using the logging command and setting up a syslog server, refer to the Cisco IOS configuration guides and command reference publications.
A.2 Providing Data to Customer ServiceIf you need technical assistance with a Cisco product that is under warranty or covered by a maintenance contract, contact TAC (Cisco’s Technical Assistance Center) to open a case. Refer to the “Obtaining Technical Assistance” section on page xix for information.
A-2Cisco ONS 15540 ESPx Troubleshooting Guide
February 16, 2006
Appendix A Technical SupportA.2 Providing Data to Customer Service
When submitting information to your technical support representative, electronic data is preferred. Electronic data significantly eases the transfer of information between technical support personnel and development staff. Common electronic formats include data sent via e-mail and files sent using FTP (File Transfer Protocol).
If you are submitting data to your technical support representative, use the following list to determine the preferred method for submission:
1. The preferred method of information submission is through FTP service over the Internet. If your environment supports FTP, you can place your file in the incoming directory on the host cco.cisco.com.
2. The next best method is to send data by electronic mail. Before using this method, be sure to contact your technical support representative, especially when transferring binary core dumps or other large files.
If you use e-mail, do not use encoding methods such as binhex or zip. Only MIME-compliant mail should be used.
3. Use a PC-based communications protocol, such as Kermit, to upload files to Cisco.com. Again, be sure to contact your technical support representative before attempting any transfer.
4. Transfer by disk or tape.
5. The least favorable method is hard-copy transfer by fax or physical mail.
A-3Cisco ONS 15540 ESPx Troubleshooting Guide
February 16, 2006

Appendix A Technical SupportA.2 Providing Data to Customer Service
A-4Cisco ONS 15540 ESPx Troubleshooting Guide
February 16, 2006
Cisco ONFebruary 2006
I N D E X
Numerics
10-GE transponder module
interface problems 6-6 to 6-9
interfaces (figures) 6-1, 6-2
loopbacks 6-10 to 6-12
troubleshooting checklist 6-2
2.5-Gbps transponder module
cabling 5-2
interface problems 5-4 to 5-7
loopbacks 5-7 to 5-10
troubleshooting checklist 5-2
A
accessibility tests 1-8
APS
bidirectional problems 9-3
group state not associated 9-2
group transmitting k1k2 sf-lp to peer 9-6
lockout fails 9-4
message channel problems 9-3
switchover fails 9-4, 9-5
troubleshooting checklist 9-1
Automatic Protection Switching. See APS
B
booting
redundant processor cards 2-13
Bug Navigator II 1-12
C
Cisco.com
uploading files to A-3
Cisco IOS images. See system images 1-12
Cisco TAC. See TAC
Cisco Transport Manager. See CTM 1-5
CiscoView 1-4
commands 1-7
configuring online diagnostics 1-9
CPUs. See processor cards
CTM 1-5
customer service and support. See TAC
D
DDTS database, searching 1-12
debug commands 1-7
debug diag online command 1-9
Device Fault Manager, See DFM 1-5
DFM 1-5
diagnostic commands 1-6 to 1-8
diag online command 1-9
diag online subslot command 1-9
documentation
related xiv
E
echo messages. See ICMP echo messages
error message logging. See message logging
IN-1S 15540 ESPx Troubleshooting Guide
Index
F
FTP files to TAC A-3
H
hardware
troubleshooting checklist 1-13
verifying versions 2-9 to 2-10
I
ICMP echo messages 1-7
Internet Control Message Protocol echo messages. See ICMP echo messages
internetwork maps. See network maps 1-4
K
Kermit protocol, providing data to TAC A-3
L
logging command A-2
M
Macintosh, logging system output from A-2
maintaining network information 1-4
memory, troubleshooting processor 2-8
message logging A-2
monitoring. See network monitoring 1-4
mux/demux modules
troubleshooting checklist 3-2
wave interface is down 3-2
mux/demux motherboards
description 3-1
IN-2Cisco ONS 15540 ESPx Troubleshooting Guide
N
network and system management 1-4
network management Ethernet ports. See NME
network maps, maintaining 1-4
network monitoring
CiscoView 1-4
CTM 1-5
DFM 1-5
network performance
debug commands (caution) 1-7
NME
displaying interface configurations 2-6
troubleshooting connections 2-5
no debug all command 1-7
no debug command 1-7
O
OIR tests 1-9
online diagnostics
accessibility tests 1-8
configuring 1-8, 1-9
displaying 1-10
displaying configuration 1-10
P
password recovery 2-4 to 2-5
PCs, logging system output A-2
performance. See network performance
performance history counters
description 8-1
interpreting messages 8-2
not preserved across CPU switchovers 8-3
some counters are not created 8-2
troubleshooting checklist 8-1
power supplies, redundant 1-1
problem solving steps 1-3
February 2006
Index
processor cards
active processor card boot failure 2-20
console cannot be accessed 2-21
overview 2-1
recovering passwords 2-4
standby processor card boot failure 2-20
troubleshooting checklist 2-2
troubleshooting memory 2-8
troubleshooting redundant 2-13
unable to access enable mode 2-21
verifying configurations 2-2
verifying hardware and software compatibility 2-10
verifying hardware and software versions 2-9
verifying NME interface configurations 2-5
Protection switch module. See PSM 4-1
PSM
interface problems 4-1
troubleshooting checklist 4-1
R
recovering passwords 2-4
redundant processor cards, troubleshooting 2-13 to 2-20
release notes
checking for workarounds 1-12
remote terminals
logging system output A-2
S
script command (UNIX) A-2
security
password recovery 2-4 to 2-5
show buffers command 1-7, 2-8, 2-21, A-1
show controllers command 1-6, 2-6, 2-7, A-2
show flash command 1-7
show interfaces command 1-6, 2-6, 3-3, 7-1, 9-1, 9-5, 9-6
show memory command 1-7, 2-8, A-2
February 2006
show processes command 1-7, A-2
show running-config command 1-6, 2-2, 7-3, A-1
show stacks command 1-7, A-1
show startup-config command 1-6, 2-5
show tech-support command A-1
show version command 1-7, 2-5, 2-9, 2-14, A-1
slot assignments, mux/demux motherboards 3-1
software
checking for Cisco IOS bug workarounds 1-12
compatibility with hardware 2-10
verifying versions 2-9
support, technical. See TAC
syslog servers
logging troubleshooting information A-2
system images
checking release notes 1-12
T
TAC
contacting A-2
gathering data for A-1 to A-2
show tech-support command A-1
Technical Assistance Center. See TAC
technical support. See TAC
terminals. See remote terminals
threshold alarms
64b66b CVRD alarm 7-2
8b10b CVRD alarm 7-1
B1 CVRD alarm 7-3
CDL-HEC alarm 7-2
continuous threshold exceeded messages 7-3
troubleshooting checklist 7-1
traceroute command 1-8
transponder modules
Loss of Frame 5-6
Loss of Light 5-4, 5-5
Loss of Lock 5-5, 5-6
Loss of Sync 5-6
IN-3Cisco ONS 15540 ESPx Troubleshooting Guide
Index
low alarm 5-7
not listed 5-4
rejects clock rate for transparent interface 5-7
rejects protocol encapsulation for transparent interface 5-7
troubleshooting checklists
10-GE transponder module 6-2
APS 9-1
mux/demux 3-2
processor cards 2-2
PSM 4-1
threshold alarms 7-1
troubleshooting overview
problem-solving models (figure) 1-3
problem-solving steps 1-3
tools 1-5 to 1-6
using internetwork maps 1-4
troubleshooting tools, third-party 1-6
U
UNIX
logging system output A-2
script command A-2
W
waveethernetphy interfaces
Loss of Lock 6-8
Loss of Sync 6-9
wave interfaces
5-6
Loss of Lock 5-5
Loss of Sync 5-6
wavepatch interfaces
Loss of Light 5-5
low alarm 5-7
workarounds in release notes 1-12
IN-4Cisco ONS 15540 ESPx Troubleshooting Guide
February 2006