chemometric characterization of three varietal olive oils (cvs. cobrançosa, madural and verdeal...
TRANSCRIPT
www.elsevier.com/locate/foodchem
Food Chemistry 102 (2007) 406–414
FoodChemistry
Analytical, Nutritional and Clinical Methods
Chemometric characterization of three varietal olive oils(Cvs. Cobrancosa, Madural and Verdeal Transmontana) extracted
from olives with different maturation indices
Luıs C. Matos a,b, Sara C. Cunha a,d, Joana S. Amaral a,b, Jose A. Pereira c,Paula B. Andrade b, Rosa M. Seabra b, Beatriz P.P. Oliveira a,*
a REQUIMTE, Servico de Bromatologia, Faculdade de Farmacia, Universidade do Porto, Rua Anıbal Cunha, 164, 4099-030 Porto, Portugalb Servico de Farmacognosia, Faculdade de Farmacia, Universidade do Porto, R. Anıbal Cunha, 164, 4099-030 Porto, Portugal
c Escola Superior Agraria, Instituto Politecnico de Braganca, Quinta de Sta. Apolonia, Apartado 134, 5301-857 Braganca, Portugald I.S.E.I.T-M. Av. 25 de Abril, 5370 Mirandela, Portugal
Received 11 July 2005; received in revised form 8 November 2005; accepted 29 December 2005
Abstract
This paper evaluates the usefulness of three chemical parameters (compositions on tocopherols, sterols and fatty acids) as a tool todiscriminate three varietal olive oils (Cvs. Cobrancosa, Madural and Verdeal Transmontana), which are permitted cultivars for the pro-duction of ‘‘Tras-os-Montes olive oil’’, a Portuguese protected designation of origin (PDO) product. The olives were collected during theyear crop 2000/2001 from the same orchard, in order to eliminate the geographical and climatic influences. Lots with different maturationindices were prepared to allow the evaluation of the ripening stage on the characteristics of varietal olive oils produced from each cul-tivar. Statistical methods such as multivariate analysis of variance (MANOVA), principal components analysis (PCA) and cluster anal-ysis were used to evaluate significant differences on the studied parameters. Regarding the results, the three cultivars were clearlydiscriminated.� 2006 Elsevier Ltd. All rights reserved.
Keywords: Portuguese virgin olive oil; Ripening; Chemometrics; PDO
1. Introduction
Olive oil is obtained from the fruit of olive trees (Olea
europaea L.) and is a genuine fruit juice with excellentnutritional, sensorial and functional quality. It representsa typical lipid source of the Mediterranean diet, which con-sumption has been associated with a low incidence of car-diovascular diseases, neurological disorders, breast andcolon cancers, as well as with hipolipidemic and antioxi-dant properties (Gimeno et al., 2002; Medeiros, 2001).These benefits have been related either to its well-balancedfatty acid composition, where oleic acid is the main compo-
0308-8146/$ - see front matter � 2006 Elsevier Ltd. All rights reserved.
doi:10.1016/j.foodchem.2005.12.031
* Corresponding author. Tel.: +351 22 207 8927; fax: +351 22 200 3977.E-mail address: [email protected] (B.P.P. Oliveira).
nent, or to the presence of minor biomolecules, such asvitamins and natural antioxidants (Medeiros, 2001). Thesecharacteristics, as a whole, make olive oil a premium foodand, therefore, a product of major economical importancein the Mediterranean area.
Olive oil quality is influenced by a great number of fac-tors among which the cultivar and the olive ripening stageare two of the most important ones (Garcia, Seller, &Perez-Camino, 1996; Kiritsakis, 1998; Rotondi et al.,2004; Zamora, Alaiz, & Hidalgo, 2001). Along the ripen-ing, several metabolic processes take place in olives withsubsequent variations on profiles of some compounds.These changes are reflected on the quality grade, sensorialcharacteristics, oxidative stability and/or nutritional valueof the obtained product. Polyphenols, tocopherols,chlorophyllic pigments and carotenoids are examples of
L.C. Matos et al. / Food Chemistry 102 (2007) 406–414 407
compounds involved in this phenomenon as well as thefatty acid and sterol compositions.
There are different cultivars of O. europaea, each onewith specific physical and biochemical characteristics, pro-viding olive oils with typical compositions and perfor-mances. The aim of this work was to evaluate, compareand characterize the performances of varietal olive oilsobtained from Cvs. Cobrancosa, Madural and VerdealTransmontana based on some of its most important com-ponents. These three cultivars account for more than 90%of olive cultivation area in Tras-Os-Montes (Portugal)and, together with cv. Cordovil, are the only permitted cul-tivars in the ‘‘Tras-Os-Montes olive oil’’ (protected desig-nation of origin, PDO). The trees used in this studybelong to the same orchard and, consequently, are sub-jected to the same climate conditions and agricultural prac-tices. The olives were collected during the year crop 2000/2001. Lots with different maturation indices were preparedto allow the evaluation of the ripening stage effect on thecharacteristics of olive oils produced from each cultivar.In this way, we can be sure that the only factors affectingthe differences among samples are the cultivar and the rip-ening stage, the only influences that are aimed to study. Atotal of 18 samples were analyzed: 7 from Cv. Cobrancosa(maturation indices 1–7), 5 from Cv. Madural (maturationindices 3–7) and 6 from Cv. Verdeal Transmontana (matu-ration indices 1–6). In all samples the chemical parametersevaluated were the compositions on tocopherols, sterolsand fatty acids. The results were subjected to statisticalanalysis in order to evaluate the influence of cultivar andripening stage on those parameters and to check if PCAof the evaluated parameters could be a tool for cultivarand ripening stage discrimination.
2. Materials and methods
2.1. Sampling
The studied cultivars were Cvs. Cobrancosa, Maduraland Verdeal Transmontana. The trees were identifiedand carefully marked, and five trees of each cultivar havebeen sampled. The olive fruits were handpicked in ‘‘Mas-carenhas-Paradela’’, an orchard 10 km North fromMirandela, in the Northeast of Portugal (U.T.M. 29PG5602). The orchard has 6 ha with a planting densityof 9 · 9 m; trees have more than 40 years; the prune ismade each three years; it is not irrigated and the soil ismobilized 2–3 times each year. This olive grove is keptunder Biological Agricultural system and did not haveany crop health control treatment in the last 10 years.Cv. Cobrancosa is the more representative cultivar (80%of the trees). The olives were harvested in the crop year2000/2001 in three different days (30/10, 22/11 and 5/12), in the four orientations of the trees, at the operatorheight. From each tree, only healthy fruits were picked.After harvest, olive fruits were immediately transportedto the laboratory, carefully blended and, in a hundred
olives randomly taken from each cultivar and harvestdate, the maturation indices (MI) were determined. Thisparameter is function of fruit colour in both skin andpulp and was determined according to the proposals ofthe Estacion de Olivicultura y Elaiotecnia, Jaen, Spain(Hermoso et al., 1991). Following this procedure 18 sam-ples were obtained: seven samples for Cv. Cobrancosa(MI 1–7), five for Cv. Madural (MI 3–7) and six forCv. Verdeal Transmontana (MI 1–6). From each group,a 1 kg of olives were randomly taken and submitted tooil extraction.
2.2. Oil extraction
An Abencor analyzer (Comercial Abengoa S.A., Sevilla,Spain) was used to process the olives in a pilot extractionplant. The unit consists of three essential elements: the mill,the thermo beater, and the pulp centrifuge. After beingprocessed in the mill, the oil was separated by decanting,transferred into dark glass bottles, and stored in the darkat 4 �C. Before the analytical procedures the samples weredehydrated with anhydrous sodium sulfate and subse-quently filtered through filter paper.
2.3. Standards
A mixture of 37 FAMEs (standard 47885-U) and theindividual fatty acid isomers cis-9-trans-12-octadecadieno-ate (C18:2ct), trans-9-cis-12-octadecadienoate (C18:2tc)were obtained from Supelco (Bellefonte, PA, USA). Cho-lestanol, cholesterol, campesterol, stigmasterol, b-sitos-terol, b-sitostanol and betulin were purchased fromSigma (St. Louis, USA). a-, b-, c- and d-tocopherols wereobtained from Calbiochem (La Jolla, CA, USA).
2.4. Tocopherol composition
Tocopherol composition was evaluated following themethod described in Gama, Casal, Oliveira, and Ferreira(2000). A 0.1 g of olive oil was blended with 10 ml of n-hex-ane and homogenized by stirring. Sample preparation wasconducted in dark and tubes containing the samples werealways wrapped in aluminium foil. The mixture was filteredby membrane (Schleicher and Shuell 0.2 lm; B 13 mm,pure polyamide) and analyzed by HPLC. The chromato-graphic separation of the compounds was achieved witha normal-phase LiChrosorb SI 60 (5 lm; 25 · 0.4 cm) col-umn from Merck (Darmstadt, Germany). The effluent usedwas a mixture of n-hexane and 2-propanol (99.7:0.3). Elu-tion was performed at a solvent flow rate of 1.7 ml/min.The effluent was monitored with diode array and fluorimet-ric (290 and 330 nm as excitation and emission wavelengthsrespectively) detectors connected in series. Data were ana-lyzed in the Borwin PDA Controller Software (JMBS,France). Tocopherols (a, b and c) were identified by chro-matographic comparisons with authentic standards, by co-elution and by their UV spectra.
408 L.C. Matos et al. / Food Chemistry 102 (2007) 406–414
2.5. Sterol composition
Sterol composition was evaluated by GLC/FID/capil-lary column following the NP EN ISO 12228. Briefly, afteraddition of 1.0 ml of internal standard solution (betulin1.0 mg/ml) ca. 250 mg of oil sample was saponified withan ethanolic potassium hydroxide solution; the unsaponifi-able fraction was isolated by solid phase extraction on analuminum oxide column and the steroid fraction wasobtained after TLC with n-hexane/diethyl ether 1:1 (v/v)as developing solvent and a methanol spray to visualizethe band. The trimethylsilylethers were obtained by theaddition of 1-methylimidazole and N-methyl-N-(trimethyl-silyl)-hepta-fluorobutyramide (MSHFBA). The sterol pro-file was analyzed on the same equipment used for fatty acidanalysis, with a 30 m · 0.25 mm i.d., 0.25 lm DB-5MS col-umn (J&W Scientific, Folsom, CA, USA) with a maximumoperating temperature of 325 �C. The temperature of theinjector and the detector were both 320 �C. The columntemperature was 250 �C and programmed to increase at arate of 2 �C/min to 300 �C and then held for 12 min. Thecarrier gas used was helium at an internal pressure of100 kPa. The split ratio was 1:50 and the injected volumewas 1.5 ll. The total sterol content was determined consid-ering all peaks of sterols eluted between cholesterol and D7-avenasterol. Identification was achieved by comparing therelative retention times from samples with those obtainedwith standards. Clerosterol, D5-avenasterol and D7-avenas-terol were tentatively identified by comparison with refer-ences (Firestone & Reina, 1996; Kamm, Dionisi,Hischenhuber, & Engel, 2001) and with samples of oliveand sunflower oils. b-Sitostanol and D5-avenasterol elutedvery close and therefore they were quantified as D5-avenasterol.
2.6. Fatty acid composition
Fatty acids were determined by GLC/FID/capillary col-umn using the same methodology described in Oliveira andFerreira (1996).
Fatty acids were measured as their methyl esters afterhydrolysis with an 11 g/l methanolic potassium hydroxidesolution, methyl esterification with BF3/MeOH and extrac-tion with n-heptane. The analysis was carried out on aChrompack CP 9001 chromatograph (Chrompack, Mid-delburg, The Netherlands) equipped with a split–splitlessinjector, a FID and a Chrompack CP-9050 auto sampler.The temperatures of the injector and detector were 230and 270 �C respectively. Separation was achieved on a50 m · 0.25 mm i.d. fused silica capillary column coatedwith a 0.19 lm film of CP-Sil 88 (Chrompack, Middelburg,The Netherlands). The column temperature was 160 �C,1 min hold, and then programmed to increase to 239 �Cat a rate of 4 �C/min and then 10 min hold. Helium wasused as carrier gas at an internal pressure of 120 kPa.The split ratio was 1:50 and the injected volume was1.2 ll. The results are expressed in relative percentage of
each fatty acid, calculated by internal normalization ofthe chromatographic peak area. Fatty acids were identifiedby comparing the relative retention times of FAME peaksfrom samples with those from standards.
2.7. Statistical analysis
Results were submitted to multivariate analysis of vari-ance (MANOVA) with the purpose of testing the signifi-cant differences between mean values of the evaluatedparameters by comparing variances. In other words wecompared the variance due to the between-groups withthe within-group variability. These latter were tested forstatistical significance and, if significant, we rejected thenull hypothesis of no differences between means, andaccepted the alternative hypothesis that the means were dif-ferent from each other. One-way MANOVA was usedbecause our design had one single categorical independentvariable (cultivar type) and multiple dependent variables(chemical parameters). Multivariate test of significancewas performed and Wilk’s lambda was observed. Alterna-tive t-test for independent samples was used with the pur-pose of comparing differences in means between twotypes of cultivars. All the combinations of cultivars pairswere tested. Principal components analysis (PCA) was per-formed to detect structure in the relationships betweenvariables, allowing its classification and the separation ofeach cultivar. Variables used in PCA were selected regard-ing to the MANOVA and t-test results. This procedureallowed the minimization of variables, and those that wereselected became the principal explanation to the variabilitybetween cultivars, improving the separation and makingeasier the understanding of what were the stronger factorsthat were the base of distinction. Eigenvalues were alsoobserved and, for each analysis, two factors were enoughto explain almost all the variability. Cluster analysis wasalso performed in order to attempt the grouping of samplesaccording to the similarities observed in some chemicalparameters. The vertical hierarchical tree plot was per-formed considering the Euclidian distances of data pro-jected in a multidimensional space. Besides, the clusterslinkage was made by the Ward’s method. Results areshown as figures and tables. One-way MANOVA, t-testfor independent groups, PCA and cluster analysis were per-formed with Statistica for Windows release 6.0.
3. Results and discussion
Vitamin E is a term used to refer a group of minor butubiquitous lipid-soluble compounds, comprising four toc-opherols (a-, b-, c- and d-T) and four tocotrienols (a-, b-,c- and d-TTR). These compounds are believed to beinvolved in a diversity of physiological and biochemicalfunctions, mainly due to its action as antioxidant, but alsoby its action as a membrane stabilizer (Azzi & Stocker,2000). In olive oil the compounds usually describedare those which were also detected in this work, that is:
V1
V2
V3V4V5V6
M3
M4
M5
M6
M7
C1
C2
C3
C4
C5
C6
C7
-3 -2 -1 0 1 2
Factor 1: 75.94%
-1
0
1
2
Fac
tor
2: 2
.11%
-tocopherol
-tocopherol
-tocopherol
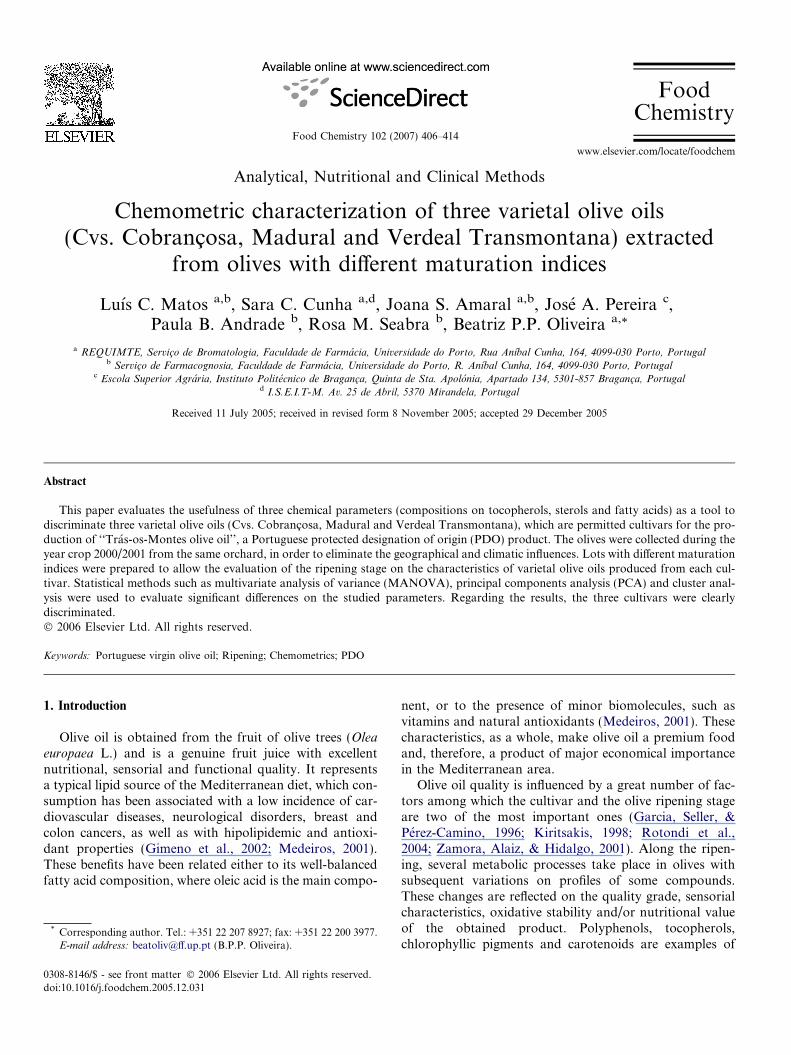
Fig. 1. Principal components analysis based on tocopherol profiles of Cvs.Cobrancosa, Madural and Verdeal Transmontana virgin olive oilsextracted from olives with different maturation indices.
L.C. Matos et al. / Food Chemistry 102 (2007) 406–414 409
a, b- and c-tocopherols (Aguilera et al., 2005; Beltran,Aguilera, Del Rio, Sanchez, & Martinez, 2005). Togetherwith phenolic compounds they are responsible by the oxi-dative stability of olive oil and, therefore, for its shelf lifewith special emphasis for a-tocopherol (Mateos, Domin-guez, Espartero, & Cert, 2003).
Table 1 reports the tocopherol composition of the stud-ied samples. In all samples, and as expected for olive oils(Aguilera et al., 2005; Beltran et al., 2005) a-tocopherol isby far the most abundant isoform of vitamin E. In anyof the cultivars, the content of a-tocopherol decreasesalong the ripening. The content of b-tocopherol showed agood stability while that of c isoform exhibited a slightincrease. This behaviour has already been found for othercultivars (Aguilera et al., 2005; Beltran et al., 2005; Gutier-rez, Jımenez, Ruız, & Albi, 1999). The three cultivars understudy can be clearly distinguished by the total amounts oftocopherols (189–139 mg/kg in Cv. Verdeal Transmon-tana, 226–209 mg/kg in Cv. Madural and 298–238 mg/kgin Cv. Cobrancosa) but also by the individual contents ofa- and c-tocopherols.
Tocopherol composition of the three cultivars showedhighly significant differences (p < 0.01) and Wilk’s lambdawas 0.018. The three homologous were used in PCA anal-ysis and two factors were selected justifying 96.05% of totalvariance (Factor 1: 75.94%; Factor 2: 20.11%). Regardingthese factors, the three cultivars could be discriminatedon the factor-plane (Fig. 1).
Table 1Tocopherols composition (mg/kg)a of Cvs. Cobrancosa, Madural andVerdeal Transmontana virgin olive oils extracted from olives with differentmaturation indices
Tocopherol contents (mg/kg)
a b c Total
Cv. CobrancosaMI 1 291.7 ± 2.4 0.9 ± 0.1 5.4 ± 0.1 298.0MI 2 252.9 ± 0.9 0.9 ± 0.0 8.0 ± 0.1 261.8MI 3 246.6 ± 1.6 1.0 ± 0.1 13.0 ± 0.0 260.6MI 4 222.6 ± 1.2 0.9 ± 0.0 12.0 ± 0.0 235.5MI 5 224.8 ± 3.6 1.0 ± 0.0 16.1 ± 0.1 241.9MI 6 234.8 ± 0.3 1.0 ± 0.1 15.9 ± 0.1 251.6MI 7 221.4 ± 1.7 1.0 ± 0.1 15.7 ± 0.0 238.1
Cv. MaduralMI 3 219.9 ± 0.8 0.9 ± 0.1 5.1 ± 0.1 225.8MI 4 212.1 ± 1.5 0.9 ± 0.1 7.6 ± 0.0 220.6MI 5 218.8 ± 2.1 0.9 ± 0.0 7.1 ± 0.1 226.8MI 6 209.1 ± 0.4 0.9 ± 0.1 6.3 ± 0.1 216.3MI 7 202.2 ± 0.6 0.8 ± 0.1 5.8 ± 0.0 208.8
Cv. Verdeal TransmontanaMI 1 188.5 ± 2.2 0.9 ± 0.1 0.0 ± 0.1 189.4MI 2 169.4 ± 2.8 0.9 ± 0.1 1.1 ± 0.0 171.3MI 3 135.4 ± 0.3 0.9 ± 0.1 3.1 ± 0.1 139.4MI 4 145.5 ± 0.8 0.9 ± 0.0 2.9 ± 0.1 149.3MI 5 146.1 ± 1.1 0.9 ± 0.1 3.7 ± 0.1 150.6MI 6 133.6 ± 1.4 0.9 ± 0.1 4.0 ± 0.1 138.5
a Mean and standard deviation for a confidence coefficient of 95%.
Sterols are major constituents of the unsaponifiablefraction and their content corresponds to around 20% ofthe unsaponifiable matter of olive oil. Research has shownthat each oily fruit has a characteristic sterol profile whichmakes it determination an important tool for checking thegenuineness of an oil (Gutierrez, Varona, & Albi, 2000;Salvador, Aranda, & Fregapane, 1998). They are impor-tant components for the stability of the oil since at hightemperature they act as inhibitors of polymerization reac-tions (Velasco & Dobarganes, 2002). In the present work,seven sterols were detected and quantified and the resultsobtained are displayed in Table 2. Generally, a decreasingtendency is observed along the ripeness in the values oftotal sterols, as already observed for Cvs. Cornicabra, Pic-ual and Hojiblanca (Gutierrez et al., 1999; Salvador, Ara-nda, & Fregapane, 2001). Contrarily to the described forthese same cultivars, the values for D5-avenasterol did notshow a clear tendency in any of the cultivars subjected tothe present study.
All of the analyzed samples exhibited total sterol farabove the 1000 mg/kg demanded by the EU legislationand all of them contain more the demanded thresholdvalue of 93% of apparent b-sitosterol (which in this caseis the sum of b-sitosterol, clerosterol and D5-avenasterol).
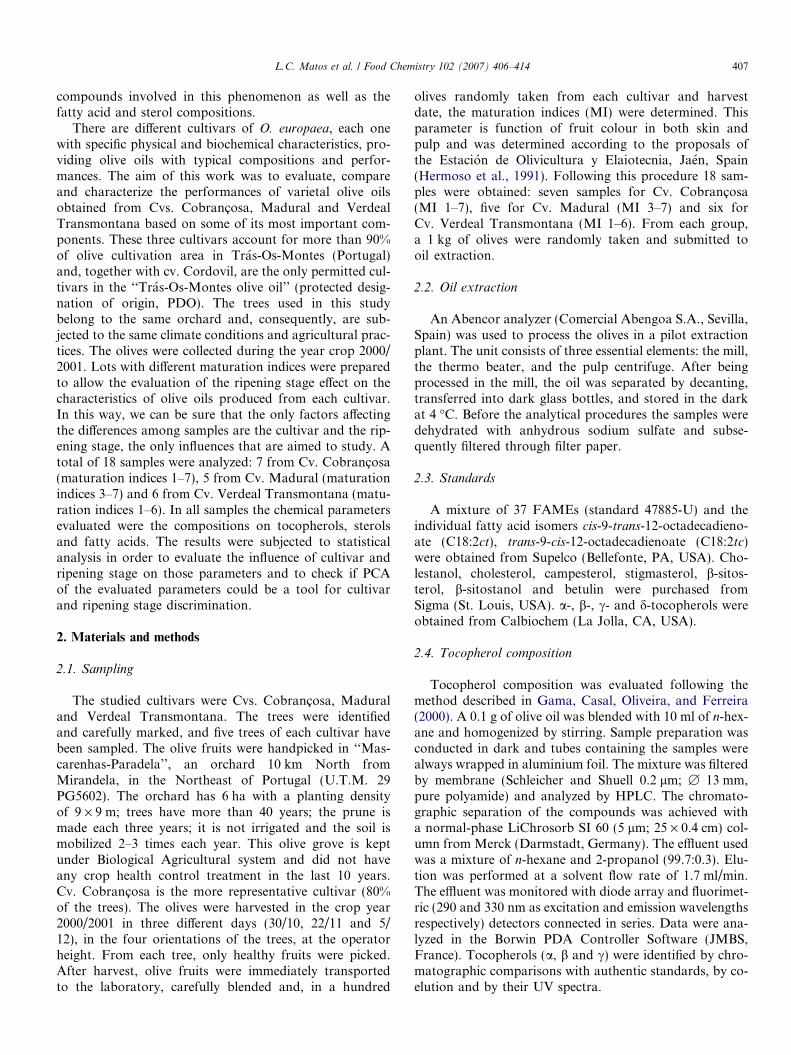
MANOVA results showed that cultivars presented sig-nificant differences regarding stigmasterol and D7-avenaste-nol contents (p < 0.05) and highly significant regarding D5-avenasterol (p < 0.01). Despite these results, the sterolschosen to PCA analysis were also selected by their abun-dance in the oils. These sterols stigmasterol, clerosterol,b-sitosterol and D5-avenasterol. Two factors were selectedjustifying 89.27% of total variance (Factor 1: 73.48%; Fac-tor 2: 15.78%). The values were plotted and the cultivarsdiscriminated (Fig. 2) although the separation was less evi-dent than that observed when PCA was performed with theother chemical parameters.
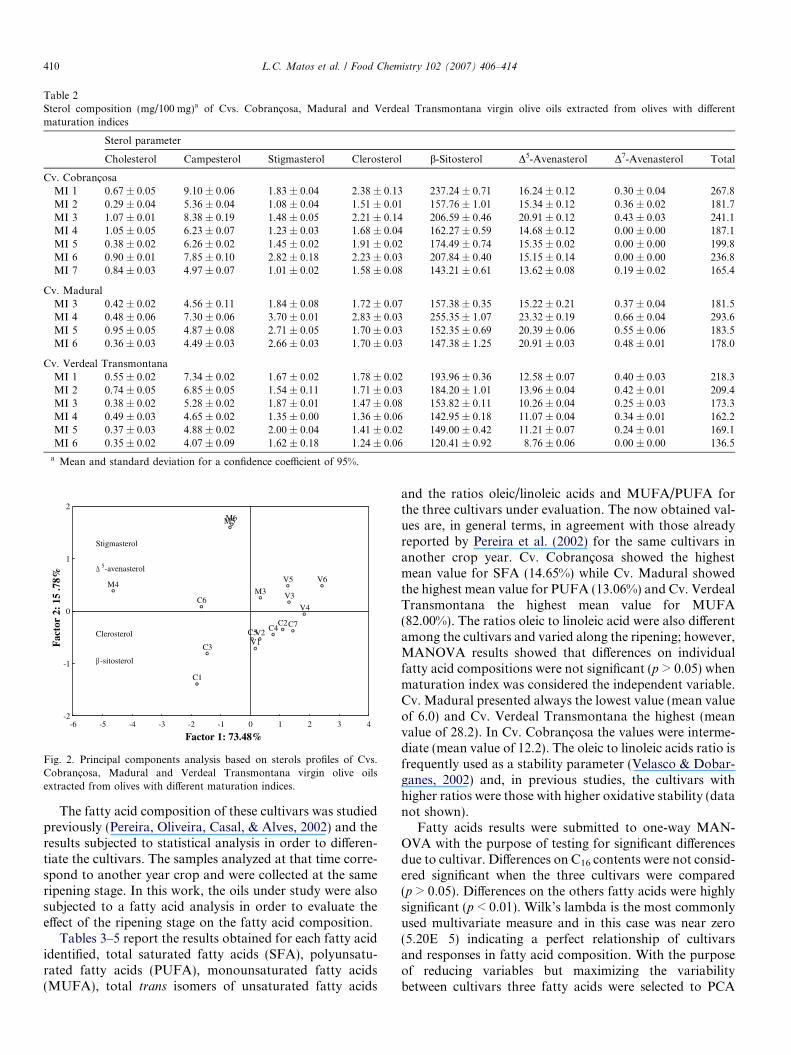
Table 2Sterol composition (mg/100 mg)a of Cvs. Cobrancosa, Madural and Verdeal Transmontana virgin olive oils extracted from olives with differentmaturation indices
Sterol parameter
Cholesterol Campesterol Stigmasterol Clerosterol b-Sitosterol D5-Avenasterol D7-Avenasterol Total
Cv. CobrancosaMI 1 0.67 ± 0.05 9.10 ± 0.06 1.83 ± 0.04 2.38 ± 0.13 237.24 ± 0.71 16.24 ± 0.12 0.30 ± 0.04 267.8MI 2 0.29 ± 0.04 5.36 ± 0.04 1.08 ± 0.04 1.51 ± 0.01 157.76 ± 1.01 15.34 ± 0.12 0.36 ± 0.02 181.7MI 3 1.07 ± 0.01 8.38 ± 0.19 1.48 ± 0.05 2.21 ± 0.14 206.59 ± 0.46 20.91 ± 0.12 0.43 ± 0.03 241.1MI 4 1.05 ± 0.05 6.23 ± 0.07 1.23 ± 0.03 1.68 ± 0.04 162.27 ± 0.59 14.68 ± 0.12 0.00 ± 0.00 187.1MI 5 0.38 ± 0.02 6.26 ± 0.02 1.45 ± 0.02 1.91 ± 0.02 174.49 ± 0.74 15.35 ± 0.02 0.00 ± 0.00 199.8MI 6 0.90 ± 0.01 7.85 ± 0.10 2.82 ± 0.18 2.23 ± 0.03 207.84 ± 0.40 15.15 ± 0.14 0.00 ± 0.00 236.8MI 7 0.84 ± 0.03 4.97 ± 0.07 1.01 ± 0.02 1.58 ± 0.08 143.21 ± 0.61 13.62 ± 0.08 0.19 ± 0.02 165.4
Cv. MaduralMI 3 0.42 ± 0.02 4.56 ± 0.11 1.84 ± 0.08 1.72 ± 0.07 157.38 ± 0.35 15.22 ± 0.21 0.37 ± 0.04 181.5MI 4 0.48 ± 0.06 7.30 ± 0.06 3.70 ± 0.01 2.83 ± 0.03 255.35 ± 1.07 23.32 ± 0.19 0.66 ± 0.04 293.6MI 5 0.95 ± 0.05 4.87 ± 0.08 2.71 ± 0.05 1.70 ± 0.03 152.35 ± 0.69 20.39 ± 0.06 0.55 ± 0.06 183.5MI 6 0.36 ± 0.03 4.49 ± 0.03 2.66 ± 0.03 1.70 ± 0.03 147.38 ± 1.25 20.91 ± 0.03 0.48 ± 0.01 178.0
Cv. Verdeal TransmontanaMI 1 0.55 ± 0.02 7.34 ± 0.02 1.67 ± 0.02 1.78 ± 0.02 193.96 ± 0.36 12.58 ± 0.07 0.40 ± 0.03 218.3MI 2 0.74 ± 0.05 6.85 ± 0.05 1.54 ± 0.11 1.71 ± 0.03 184.20 ± 1.01 13.96 ± 0.04 0.42 ± 0.01 209.4MI 3 0.38 ± 0.02 5.28 ± 0.02 1.87 ± 0.01 1.47 ± 0.08 153.82 ± 0.11 10.26 ± 0.04 0.25 ± 0.03 173.3MI 4 0.49 ± 0.03 4.65 ± 0.02 1.35 ± 0.00 1.36 ± 0.06 142.95 ± 0.18 11.07 ± 0.04 0.34 ± 0.01 162.2MI 5 0.37 ± 0.03 4.88 ± 0.02 2.00 ± 0.04 1.41 ± 0.02 149.00 ± 0.42 11.21 ± 0.07 0.24 ± 0.01 169.1MI 6 0.35 ± 0.02 4.07 ± 0.09 1.62 ± 0.18 1.24 ± 0.06 120.41 ± 0.92 8.76 ± 0.06 0.00 ± 0.00 136.5
a Mean and standard deviation for a confidence coefficient of 95%.
V1V2
V3
V4
V5 V6
C1
C2
C3
C4C5
C6
C7
M3M4
M5M6
-6 -5 -4 -3 -2 -1 0 1 2 3 4
Factor 1: 73.48%
-2
-1
0
1
2
Fac
tor
2: 1
5 .7
8%
Stigmasterol
-sitosterol
Clerosterol
5-avenasterol
Fig. 2. Principal components analysis based on sterols profiles of Cvs.Cobrancosa, Madural and Verdeal Transmontana virgin olive oilsextracted from olives with different maturation indices.
410 L.C. Matos et al. / Food Chemistry 102 (2007) 406–414
The fatty acid composition of these cultivars was studiedpreviously (Pereira, Oliveira, Casal, & Alves, 2002) and theresults subjected to statistical analysis in order to differen-tiate the cultivars. The samples analyzed at that time corre-spond to another year crop and were collected at the sameripening stage. In this work, the oils under study were alsosubjected to a fatty acid analysis in order to evaluate theeffect of the ripening stage on the fatty acid composition.
Tables 3–5 report the results obtained for each fatty acididentified, total saturated fatty acids (SFA), polyunsatu-rated fatty acids (PUFA), monounsaturated fatty acids(MUFA), total trans isomers of unsaturated fatty acids
and the ratios oleic/linoleic acids and MUFA/PUFA forthe three cultivars under evaluation. The now obtained val-ues are, in general terms, in agreement with those alreadyreported by Pereira et al. (2002) for the same cultivars inanother crop year. Cv. Cobrancosa showed the highestmean value for SFA (14.65%) while Cv. Madural showedthe highest mean value for PUFA (13.06%) and Cv. VerdealTransmontana the highest mean value for MUFA(82.00%). The ratios oleic to linoleic acid were also differentamong the cultivars and varied along the ripening; however,MANOVA results showed that differences on individualfatty acid compositions were not significant (p > 0.05) whenmaturation index was considered the independent variable.Cv. Madural presented always the lowest value (mean valueof 6.0) and Cv. Verdeal Transmontana the highest (meanvalue of 28.2). In Cv. Cobrancosa the values were interme-diate (mean value of 12.2). The oleic to linoleic acids ratio isfrequently used as a stability parameter (Velasco & Dobar-ganes, 2002) and, in previous studies, the cultivars withhigher ratios were those with higher oxidative stability (datanot shown).
Fatty acids results were submitted to one-way MAN-OVA with the purpose of testing for significant differencesdue to cultivar. Differences on C16 contents were not consid-ered significant when the three cultivars were compared(p > 0.05). Differences on the others fatty acids were highlysignificant (p < 0.01). Wilk’s lambda is the most commonlyused multivariate measure and in this case was near zero(5.20E�5) indicating a perfect relationship of cultivarsand responses in fatty acid composition. With the purposeof reducing variables but maximizing the variabilitybetween cultivars three fatty acids were selected to PCA
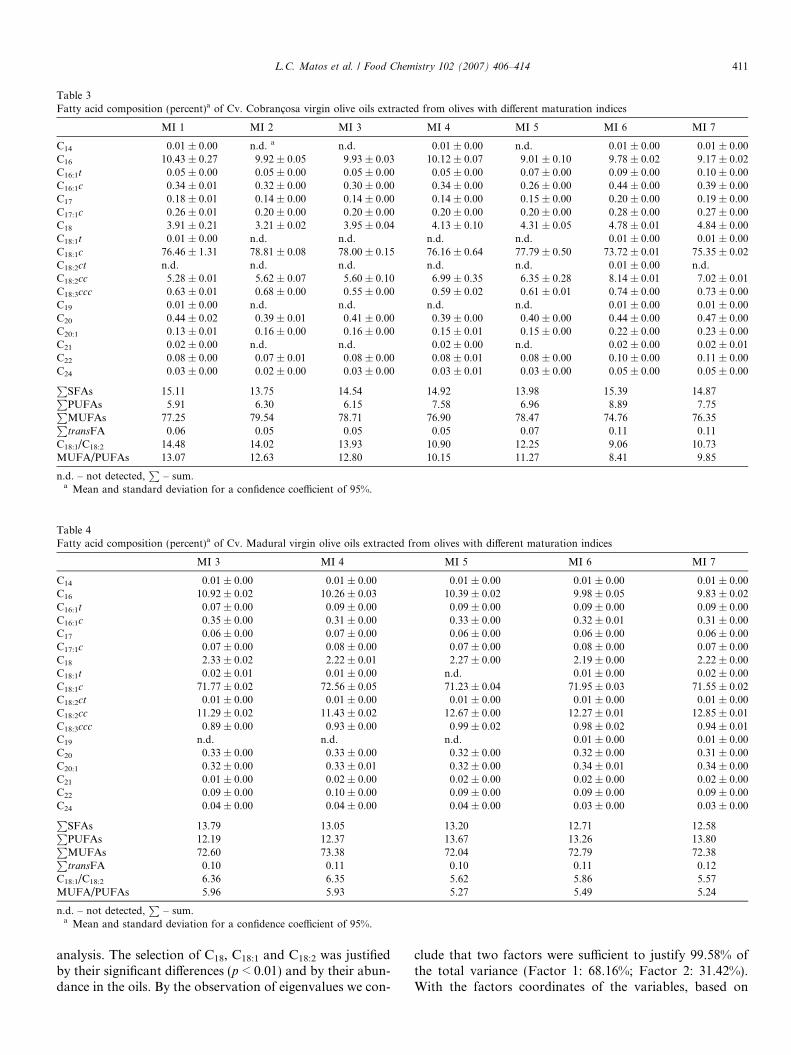
Table 3Fatty acid composition (percent)a of Cv. Cobrancosa virgin olive oils extracted from olives with different maturation indices
MI 1 MI 2 MI 3 MI 4 MI 5 MI 6 MI 7
C14 0.01 ± 0.00 n.d. a n.d. 0.01 ± 0.00 n.d. 0.01 ± 0.00 0.01 ± 0.00C16 10.43 ± 0.27 9.92 ± 0.05 9.93 ± 0.03 10.12 ± 0.07 9.01 ± 0.10 9.78 ± 0.02 9.17 ± 0.02C16:1t 0.05 ± 0.00 0.05 ± 0.00 0.05 ± 0.00 0.05 ± 0.00 0.07 ± 0.00 0.09 ± 0.00 0.10 ± 0.00C16:1c 0.34 ± 0.01 0.32 ± 0.00 0.30 ± 0.00 0.34 ± 0.00 0.26 ± 0.00 0.44 ± 0.00 0.39 ± 0.00C17 0.18 ± 0.01 0.14 ± 0.00 0.14 ± 0.00 0.14 ± 0.00 0.15 ± 0.00 0.20 ± 0.00 0.19 ± 0.00C17:1c 0.26 ± 0.01 0.20 ± 0.00 0.20 ± 0.00 0.20 ± 0.00 0.20 ± 0.00 0.28 ± 0.00 0.27 ± 0.00C18 3.91 ± 0.21 3.21 ± 0.02 3.95 ± 0.04 4.13 ± 0.10 4.31 ± 0.05 4.78 ± 0.01 4.84 ± 0.00C18:1t 0.01 ± 0.00 n.d. n.d. n.d. n.d. 0.01 ± 0.00 0.01 ± 0.00C18:1c 76.46 ± 1.31 78.81 ± 0.08 78.00 ± 0.15 76.16 ± 0.64 77.79 ± 0.50 73.72 ± 0.01 75.35 ± 0.02C18:2ct n.d. n.d. n.d. n.d. n.d. 0.01 ± 0.00 n.d.C18:2cc 5.28 ± 0.01 5.62 ± 0.07 5.60 ± 0.10 6.99 ± 0.35 6.35 ± 0.28 8.14 ± 0.01 7.02 ± 0.01C18:3ccc 0.63 ± 0.01 0.68 ± 0.00 0.55 ± 0.00 0.59 ± 0.02 0.61 ± 0.01 0.74 ± 0.00 0.73 ± 0.00C19 0.01 ± 0.00 n.d. n.d. n.d. n.d. 0.01 ± 0.00 0.01 ± 0.00C20 0.44 ± 0.02 0.39 ± 0.01 0.41 ± 0.00 0.39 ± 0.00 0.40 ± 0.00 0.44 ± 0.00 0.47 ± 0.00C20:1 0.13 ± 0.01 0.16 ± 0.00 0.16 ± 0.00 0.15 ± 0.01 0.15 ± 0.00 0.22 ± 0.00 0.23 ± 0.00C21 0.02 ± 0.00 n.d. n.d. 0.02 ± 0.00 n.d. 0.02 ± 0.00 0.02 ± 0.01C22 0.08 ± 0.00 0.07 ± 0.01 0.08 ± 0.00 0.08 ± 0.01 0.08 ± 0.00 0.10 ± 0.00 0.11 ± 0.00C24 0.03 ± 0.00 0.02 ± 0.00 0.03 ± 0.00 0.03 ± 0.01 0.03 ± 0.00 0.05 ± 0.00 0.05 ± 0.00P
SFAs 15.11 13.75 14.54 14.92 13.98 15.39 14.87PPUFAs 5.91 6.30 6.15 7.58 6.96 8.89 7.75PMUFAs 77.25 79.54 78.71 76.90 78.47 74.76 76.35
PtransFA 0.06 0.05 0.05 0.05 0.07 0.11 0.11
C18:1/C18:2 14.48 14.02 13.93 10.90 12.25 9.06 10.73MUFA/PUFAs 13.07 12.63 12.80 10.15 11.27 8.41 9.85
n.d. – not detected,P
– sum.a Mean and standard deviation for a confidence coefficient of 95%.
Table 4Fatty acid composition (percent)a of Cv. Madural virgin olive oils extracted from olives with different maturation indices
MI 3 MI 4 MI 5 MI 6 MI 7
C14 0.01 ± 0.00 0.01 ± 0.00 0.01 ± 0.00 0.01 ± 0.00 0.01 ± 0.00C16 10.92 ± 0.02 10.26 ± 0.03 10.39 ± 0.02 9.98 ± 0.05 9.83 ± 0.02C16:1t 0.07 ± 0.00 0.09 ± 0.00 0.09 ± 0.00 0.09 ± 0.00 0.09 ± 0.00C16:1c 0.35 ± 0.00 0.31 ± 0.00 0.33 ± 0.00 0.32 ± 0.01 0.31 ± 0.00C17 0.06 ± 0.00 0.07 ± 0.00 0.06 ± 0.00 0.06 ± 0.00 0.06 ± 0.00C17:1c 0.07 ± 0.00 0.08 ± 0.00 0.07 ± 0.00 0.08 ± 0.00 0.07 ± 0.00C18 2.33 ± 0.02 2.22 ± 0.01 2.27 ± 0.00 2.19 ± 0.00 2.22 ± 0.00C18:1t 0.02 ± 0.01 0.01 ± 0.00 n.d. 0.01 ± 0.00 0.02 ± 0.00C18:1c 71.77 ± 0.02 72.56 ± 0.05 71.23 ± 0.04 71.95 ± 0.03 71.55 ± 0.02C18:2ct 0.01 ± 0.00 0.01 ± 0.00 0.01 ± 0.00 0.01 ± 0.00 0.01 ± 0.00C18:2cc 11.29 ± 0.02 11.43 ± 0.02 12.67 ± 0.00 12.27 ± 0.01 12.85 ± 0.01C18:3ccc 0.89 ± 0.00 0.93 ± 0.00 0.99 ± 0.02 0.98 ± 0.02 0.94 ± 0.01C19 n.d. n.d. n.d. 0.01 ± 0.00 0.01 ± 0.00C20 0.33 ± 0.00 0.33 ± 0.00 0.32 ± 0.00 0.32 ± 0.00 0.31 ± 0.00C20:1 0.32 ± 0.00 0.33 ± 0.01 0.32 ± 0.00 0.34 ± 0.01 0.34 ± 0.00C21 0.01 ± 0.00 0.02 ± 0.00 0.02 ± 0.00 0.02 ± 0.00 0.02 ± 0.00C22 0.09 ± 0.00 0.10 ± 0.00 0.09 ± 0.00 0.09 ± 0.00 0.09 ± 0.00C24 0.04 ± 0.00 0.04 ± 0.00 0.04 ± 0.00 0.03 ± 0.00 0.03 ± 0.00P
SFAs 13.79 13.05 13.20 12.71 12.58PPUFAs 12.19 12.37 13.67 13.26 13.80
PMUFAs 72.60 73.38 72.04 72.79 72.38
PtransFA 0.10 0.11 0.10 0.11 0.12
C18:1/C18:2 6.36 6.35 5.62 5.86 5.57MUFA/PUFAs 5.96 5.93 5.27 5.49 5.24
n.d. – not detected,P
– sum.a Mean and standard deviation for a confidence coefficient of 95%.
L.C. Matos et al. / Food Chemistry 102 (2007) 406–414 411
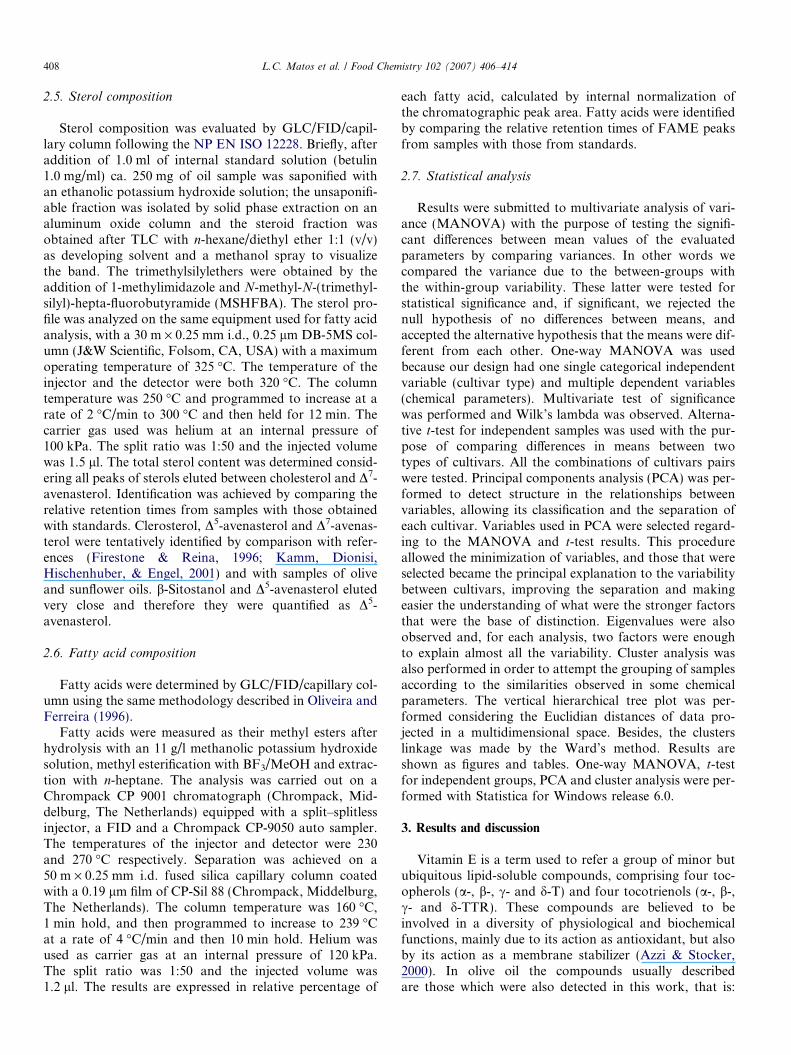
analysis. The selection of C18, C18:1 and C18:2 was justifiedby their significant differences (p < 0.01) and by their abun-dance in the oils. By the observation of eigenvalues we con-
clude that two factors were sufficient to justify 99.58% ofthe total variance (Factor 1: 68.16%; Factor 2: 31.42%).With the factors coordinates of the variables, based on
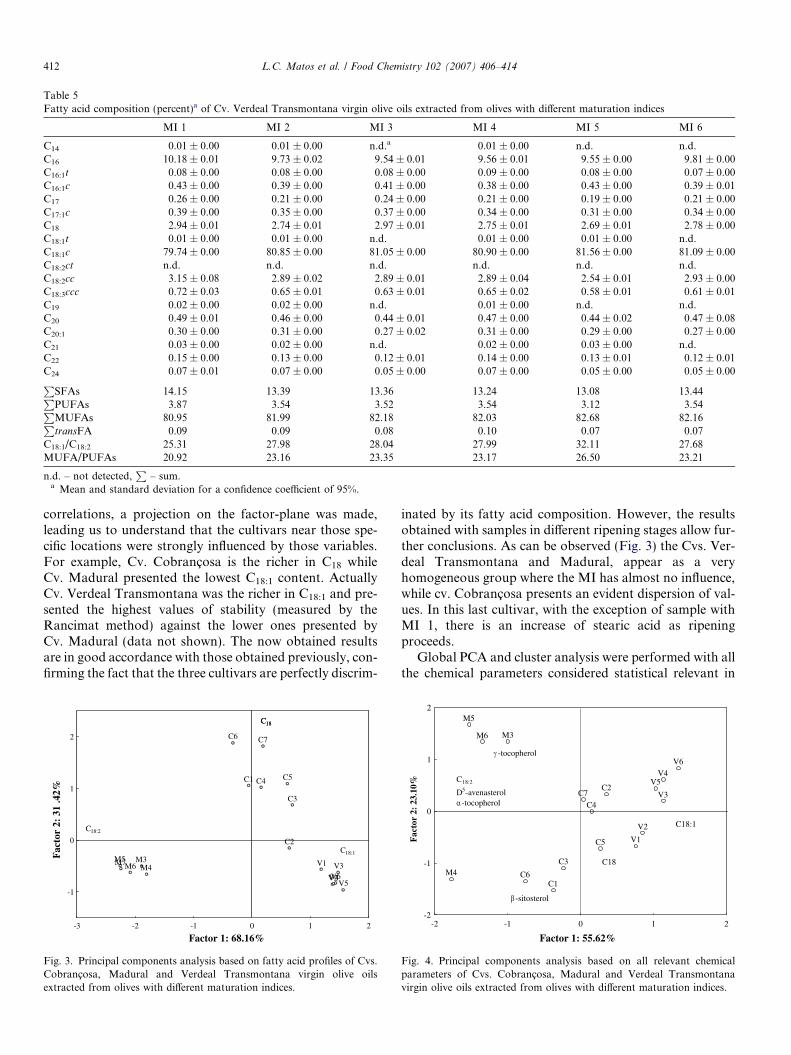
Table 5Fatty acid composition (percent)a of Cv. Verdeal Transmontana virgin olive oils extracted from olives with different maturation indices
MI 1 MI 2 MI 3 MI 4 MI 5 MI 6
C14 0.01 ± 0.00 0.01 ± 0.00 n.d.a 0.01 ± 0.00 n.d. n.d.C16 10.18 ± 0.01 9.73 ± 0.02 9.54 ± 0.01 9.56 ± 0.01 9.55 ± 0.00 9.81 ± 0.00C16:1t 0.08 ± 0.00 0.08 ± 0.00 0.08 ± 0.00 0.09 ± 0.00 0.08 ± 0.00 0.07 ± 0.00C16:1c 0.43 ± 0.00 0.39 ± 0.00 0.41 ± 0.00 0.38 ± 0.00 0.43 ± 0.00 0.39 ± 0.01C17 0.26 ± 0.00 0.21 ± 0.00 0.24 ± 0.00 0.21 ± 0.00 0.19 ± 0.00 0.21 ± 0.00C17:1c 0.39 ± 0.00 0.35 ± 0.00 0.37 ± 0.00 0.34 ± 0.00 0.31 ± 0.00 0.34 ± 0.00C18 2.94 ± 0.01 2.74 ± 0.01 2.97 ± 0.01 2.75 ± 0.01 2.69 ± 0.01 2.78 ± 0.00C18:1t 0.01 ± 0.00 0.01 ± 0.00 n.d. 0.01 ± 0.00 0.01 ± 0.00 n.d.C18:1c 79.74 ± 0.00 80.85 ± 0.00 81.05 ± 0.00 80.90 ± 0.00 81.56 ± 0.00 81.09 ± 0.00C18:2ct n.d. n.d. n.d. n.d. n.d. n.d.C18:2cc 3.15 ± 0.08 2.89 ± 0.02 2.89 ± 0.01 2.89 ± 0.04 2.54 ± 0.01 2.93 ± 0.00C18:3ccc 0.72 ± 0.03 0.65 ± 0.01 0.63 ± 0.01 0.65 ± 0.02 0.58 ± 0.01 0.61 ± 0.01C19 0.02 ± 0.00 0.02 ± 0.00 n.d. 0.01 ± 0.00 n.d. n.d.C20 0.49 ± 0.01 0.46 ± 0.00 0.44 ± 0.01 0.47 ± 0.00 0.44 ± 0.02 0.47 ± 0.08C20:1 0.30 ± 0.00 0.31 ± 0.00 0.27 ± 0.02 0.31 ± 0.00 0.29 ± 0.00 0.27 ± 0.00C21 0.03 ± 0.00 0.02 ± 0.00 n.d. 0.02 ± 0.00 0.03 ± 0.00 n.d.C22 0.15 ± 0.00 0.13 ± 0.00 0.12 ± 0.01 0.14 ± 0.00 0.13 ± 0.01 0.12 ± 0.01C24 0.07 ± 0.01 0.07 ± 0.00 0.05 ± 0.00 0.07 ± 0.00 0.05 ± 0.00 0.05 ± 0.00P
SFAs 14.15 13.39 13.36 13.24 13.08 13.44PPUFAs 3.87 3.54 3.52 3.54 3.12 3.54PMUFAs 80.95 81.99 82.18 82.03 82.68 82.16
PtransFA 0.09 0.09 0.08 0.10 0.07 0.07
C18:1/C18:2 25.31 27.98 28.04 27.99 32.11 27.68MUFA/PUFAs 20.92 23.16 23.35 23.17 26.50 23.21
n.d. – not detected,P
– sum.a Mean and standard deviation for a confidence coefficient of 95%.
412 L.C. Matos et al. / Food Chemistry 102 (2007) 406–414
correlations, a projection on the factor-plane was made,leading us to understand that the cultivars near those spe-cific locations were strongly influenced by those variables.For example, Cv. Cobrancosa is the richer in C18 whileCv. Madural presented the lowest C18:1 content. ActuallyCv. Verdeal Transmontana was the richer in C18:1 and pre-sented the highest values of stability (measured by theRancimat method) against the lower ones presented byCv. Madural (data not shown). The now obtained resultsare in good accordance with those obtained previously, con-firming the fact that the three cultivars are perfectly discrim-
V1
V2
V3
V4V5
V6
C1
C2
C3
C4 C5
C6 C7
M3M4
M5M6M7
-3 -2 -1 0 1 2
Factor 1: 68.16%
-1
0
1
2
Fac
tor
2: 3
1 .4
2%
C18C18
C18:1
C18:2
Fig. 3. Principal components analysis based on fatty acid profiles of Cvs.Cobrancosa, Madural and Verdeal Transmontana virgin olive oilsextracted from olives with different maturation indices.
inated by its fatty acid composition. However, the resultsobtained with samples in different ripening stages allow fur-ther conclusions. As can be observed (Fig. 3) the Cvs. Ver-deal Transmontana and Madural, appear as a veryhomogeneous group where the MI has almost no influence,while cv. Cobrancosa presents an evident dispersion of val-ues. In this last cultivar, with the exception of sample withMI 1, there is an increase of stearic acid as ripeningproceeds.
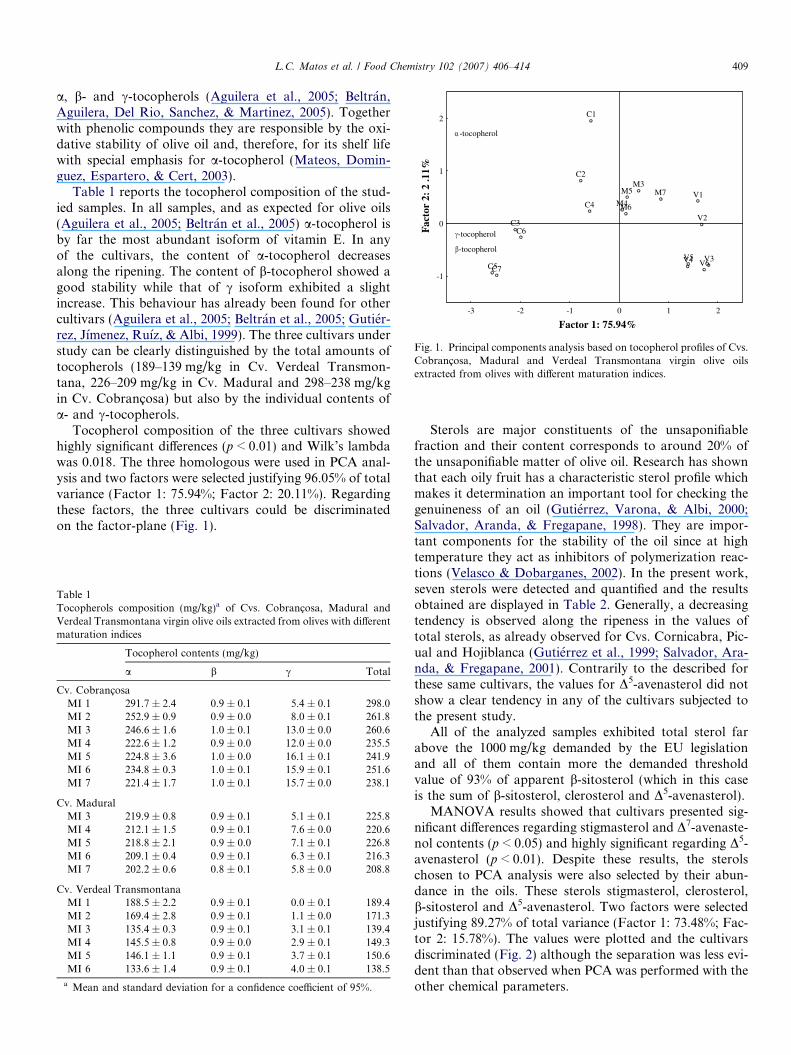
Global PCA and cluster analysis were performed with allthe chemical parameters considered statistical relevant in
V1
V2
V3
V4V5
V6
C1
C2
C3
C4
C5
C6
C7
M3
M4
M5
M6
-2 -1 0 1 2-2
-1
0
1
2
Fac
tor
2: 2
3.10
%
C18:1
C18:2
D5-avenasterol-tocopherol
C18
-sitosterol
-tocopherol
Factor 1: 55.62%
Fig. 4. Principal components analysis based on all relevant chemicalparameters of Cvs. Cobrancosa, Madural and Verdeal Transmontanavirgin olive oils extracted from olives with different maturation indices.
Cultivars SamplesV6 V5 V4 V3 C6 C3 M4 C1 M6 M5 M3 C7 C5 C4 C2 V2 V1
0
50
100
150
200
250
300
350
400
Lin
kage
Dis
tanc
e
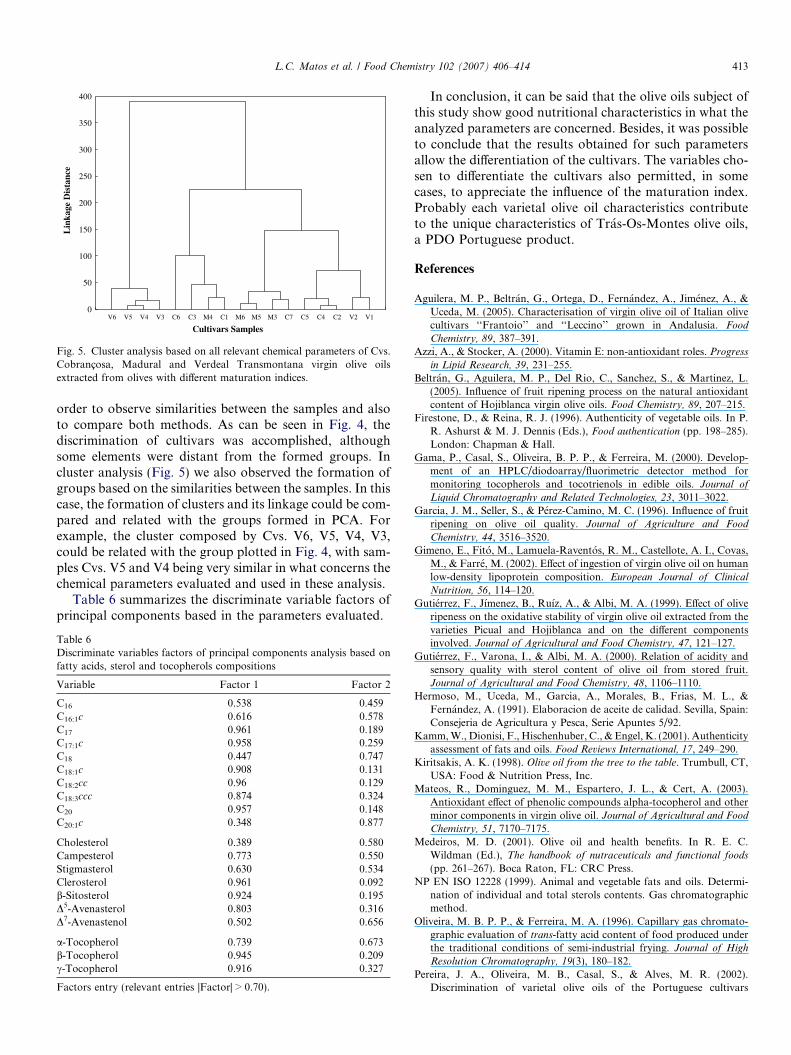
Fig. 5. Cluster analysis based on all relevant chemical parameters of Cvs.Cobrancosa, Madural and Verdeal Transmontana virgin olive oilsextracted from olives with different maturation indices.
L.C. Matos et al. / Food Chemistry 102 (2007) 406–414 413
order to observe similarities between the samples and alsoto compare both methods. As can be seen in Fig. 4, thediscrimination of cultivars was accomplished, althoughsome elements were distant from the formed groups. Incluster analysis (Fig. 5) we also observed the formation ofgroups based on the similarities between the samples. In thiscase, the formation of clusters and its linkage could be com-pared and related with the groups formed in PCA. Forexample, the cluster composed by Cvs. V6, V5, V4, V3,could be related with the group plotted in Fig. 4, with sam-ples Cvs. V5 and V4 being very similar in what concerns thechemical parameters evaluated and used in these analysis.
Table 6 summarizes the discriminate variable factors ofprincipal components based in the parameters evaluated.
Table 6Discriminate variables factors of principal components analysis based onfatty acids, sterol and tocopherols compositions
Variable Factor 1 Factor 2
C16 0.538 �0.459C16:1c �0.616 �0.578C17 �0.961 �0.189C17:1c �0.958 �0.259C18 �0.447 0.747C18:1c �0.908 �0.131C18:2cc 0.96 0.129C18:3ccc 0.874 �0.324C20 �0.957 �0.148C20:1c 0.348 �0.877
Cholesterol 0.389 �0.580Campesterol 0.773 �0.550Stigmasterol 0.630 0.534Clerosterol 0.961 �0.092b-Sitosterol 0.924 �0.195D5-Avenasterol 0.803 0.316D7-Avenastenol 0.502 0.656
a-Tocopherol �0.739 0.673b-Tocopherol �0.945 �0.209c-Tocopherol �0.916 �0.327
Factors entry (relevant entries |Factor| > 0.70).
In conclusion, it can be said that the olive oils subject ofthis study show good nutritional characteristics in what theanalyzed parameters are concerned. Besides, it was possibleto conclude that the results obtained for such parametersallow the differentiation of the cultivars. The variables cho-sen to differentiate the cultivars also permitted, in somecases, to appreciate the influence of the maturation index.Probably each varietal olive oil characteristics contributeto the unique characteristics of Tras-Os-Montes olive oils,a PDO Portuguese product.
References
Aguilera, M. P., Beltran, G., Ortega, D., Fernandez, A., Jimenez, A., &Uceda, M. (2005). Characterisation of virgin olive oil of Italian olivecultivars ‘‘Frantoio’’ and ‘‘Leccino’’ grown in Andalusia. Food
Chemistry, 89, 387–391.Azzi, A., & Stocker, A. (2000). Vitamin E: non-antioxidant roles. Progress
in Lipid Research, 39, 231–255.Beltran, G., Aguilera, M. P., Del Rio, C., Sanchez, S., & Martinez, L.
(2005). Influence of fruit ripening process on the natural antioxidantcontent of Hojiblanca virgin olive oils. Food Chemistry, 89, 207–215.
Firestone, D., & Reina, R. J. (1996). Authenticity of vegetable oils. In P.R. Ashurst & M. J. Dennis (Eds.), Food authentication (pp. 198–285).London: Chapman & Hall.
Gama, P., Casal, S., Oliveira, B. P. P., & Ferreira, M. (2000). Develop-ment of an HPLC/diodoarray/fluorimetric detector method formonitoring tocopherols and tocotrienols in edible oils. Journal of
Liquid Chromatography and Related Technologies, 23, 3011–3022.Garcia, J. M., Seller, S., & Perez-Camino, M. C. (1996). Influence of fruit
ripening on olive oil quality. Journal of Agriculture and Food
Chemistry, 44, 3516–3520.Gimeno, E., Fito, M., Lamuela-Raventos, R. M., Castellote, A. I., Covas,
M., & Farre, M. (2002). Effect of ingestion of virgin olive oil on humanlow-density lipoprotein composition. European Journal of Clinical
Nutrition, 56, 114–120.Gutierrez, F., Jımenez, B., Ruız, A., & Albi, M. A. (1999). Effect of olive
ripeness on the oxidative stability of virgin olive oil extracted from thevarieties Picual and Hojiblanca and on the different componentsinvolved. Journal of Agricultural and Food Chemistry, 47, 121–127.
Gutierrez, F., Varona, I., & Albi, M. A. (2000). Relation of acidity andsensory quality with sterol content of olive oil from stored fruit.Journal of Agricultural and Food Chemistry, 48, 1106–1110.
Hermoso, M., Uceda, M., Garcia, A., Morales, B., Frias, M. L., &Fernandez, A. (1991). Elaboracion de aceite de calidad. Sevilla, Spain:Consejeria de Agricultura y Pesca, Serie Apuntes 5/92.
Kamm, W., Dionisi, F., Hischenhuber, C., & Engel, K. (2001). Authenticityassessment of fats and oils. Food Reviews International, 17, 249–290.
Kiritsakis, A. K. (1998). Olive oil from the tree to the table. Trumbull, CT,USA: Food & Nutrition Press, Inc.
Mateos, R., Dominguez, M. M., Espartero, J. L., & Cert, A. (2003).Antioxidant effect of phenolic compounds alpha-tocopherol and otherminor components in virgin olive oil. Journal of Agricultural and Food
Chemistry, 51, 7170–7175.Medeiros, M. D. (2001). Olive oil and health benefits. In R. E. C.
Wildman (Ed.), The handbook of nutraceuticals and functional foods
(pp. 261–267). Boca Raton, FL: CRC Press.NP EN ISO 12228 (1999). Animal and vegetable fats and oils. Determi-
nation of individual and total sterols contents. Gas chromatographicmethod.
Oliveira, M. B. P. P., & Ferreira, M. A. (1996). Capillary gas chromato-graphic evaluation of trans-fatty acid content of food produced underthe traditional conditions of semi-industrial frying. Journal of High
Resolution Chromatography, 19(3), 180–182.Pereira, J. A., Oliveira, M. B., Casal, S., & Alves, M. R. (2002).
Discrimination of varietal olive oils of the Portuguese cultivars
414 L.C. Matos et al. / Food Chemistry 102 (2007) 406–414
Cobrancosa, Madural and Verdeal Transmontana based on their fattyacids composition. Acta Horticultura, 586, 591–594.
Rotondi, A., Bendini, A., Cerretani, L., Mari, M., Lercker, G., & Toschi,T. G. (2004). Effect of olive ripening degree on the oxidative stabilityand organoleptic properties of cv. Nostrana di Brisighella extra virginolive oil. Journal of Agricultural Food Chemistry, 52, 3649–3654.
Salvador, M. D., Aranda, F., & Fregapane, G. (1998). Chemicalcomposition of commercial Cornicabra virgin olive oil from 1995/96and 1996/97 crops. JAOCS, 75, 1305–1311.
Salvador, M. D., Aranda, F., & Fregapane, G. (2001). Influence of fruitripening on ‘‘Cornicabra’’ virgin olive oil quality. A study of foursuccessive crop seasons. Food Chemistry, 73, 45–53.
Velasco, J., & Dobarganes, C. (2002). Oxidative stability of virgin oliveoil. European Journal of Lipid Science and Technology, 104, 661–676.
Zamora, R., Alaiz, M., & Hidalgo, F. J. (2001). Influence of cultivar andfruit ripening on olive (Olea europaea) fruit protein content, compo-sition, and antioxidant activity. Journal of Agricultural and Food
Chemistry, 49, 4267–4270.